UNITED STATES
SECURITIES AND EXCHANGE COMMISSION
Washington, D.C. 20549
FORM N-CSRS
CERTIFIED SHAREHOLDER REPORT OF REGISTERED
MANAGEMENT INVESTMENT COMPANIES
Investment Company Act file number: 811-09253
Allspring Funds Trust
(Exact name of registrant as specified in charter)
1415 Vantage Park Drive, 3rd Floor, Charlotte, NC 28203
(Address of principal executive offices) (Zip code)
Matthew Prasse
Allspring Funds Management, LLC
1415 Vantage Park Drive, 3rd Floor, Charlotte, NC 28203
(Name and address of agent for service)
Registrant’s telephone number, including area code: 800-222-8222
Date of fiscal year end: October 31
Registrant is making a filing for 8 of its series: Allspring Emerging Markets Equity Fund, Allspring Emerging Markets Equity Income Fund, Allspring Global Long/Short Equity Fund, Allspring Special Global Small Cap Fund, Allspring International Equity Fund, Allspring Special International Small Cap Fund, Allspring Managed Accounts CoreBuilder® Shares – Series EM and Allspring U.S. Long/Short Equity Fund
Date of reporting period: April 30, 2023
ITEM 1. REPORT TO STOCKHOLDERS
Allspring Emerging Markets Equity Fund
Semi-Annual Report
April 30, 2023
The views expressed and any forward-looking statements are as of April 30, 2023, unless otherwise noted, and are those of the Fund’s portfolio managers and/or Allspring Global Investments. Discussions of individual securities or the markets generally are not intended as individual recommendations. Future events or results may vary significantly from those expressed in any forward-looking statements. The views expressed are subject to change at any time in response to changing circumstances in the market. Allspring Global Investments disclaims any obligation to publicly update or revise any views expressed or forward-looking statements.
Allspring Emerging Markets Equity Fund | 1
Letter to shareholders (unaudited)
Andrew Owen
President
Allspring Funds
Dear Shareholder:
We are pleased to offer you this semi-annual report for the Allspring Emerging Markets Equity Fund for the six-month period that ended April 30, 2023. Globally, stocks and bonds rebounded strongly despite ongoing volatility. While navigating persistently high inflation and the impact of ongoing aggressive central bank rate hikes, markets rallied on signs of declining inflation, anticipation of an end to the central bank monetary tightening cycle, and the stimulating impact of China removing its strict COVID-19 lockdowns in December. For the six-month period, domestic U.S. and global stocks and bonds had strong results. After suffering deep and broad losses through 2022, recent fixed income performance benefited from a base of higher yields that have the potential to generate higher income.
For the period, U.S. stocks, based on the S&P 500 Index,1 returned 8.63%. International stocks, as measured by the MSCI ACWI ex USA Index (Net),2 gained 20.65% while the MSCI EM Index (Net) (USD),3 returned 16.36%. Among bond indexes, the Bloomberg U.S. Aggregate Bond Index4 returned 6.91%, the Bloomberg Global Aggregate ex-USD Index (unhedged)5 gained 10.55%, the Bloomberg Municipal Bond Index6 gained 7.65%, and the ICE BofA U.S. High Yield Index7 returned 5.92%.
Despite high inflation and central bank rate hikes, markets rally.
Stocks and bonds rallied in November after earlier volatility. Economic news was encouraging, driven by U.S. labor market strength. Although central banks kept increasing rates, hopes rose for an easing in the pace of rate hikes and a possible end to central bank monetary tightening in 2023. Although inflation remained at record highs in the eurozone, we began to see signs of a possible decline in inflationary pressures as U.S. inflation moderated, with a 7.1% annual price rise in November and a monthly price increase of just 0.1%. China’s economic data remained weak, reflecting its zero-COVID-19 policy.
Financial markets cooled in December, with U.S. equities posting negative overall results in response to a weakening U.S. dollar. Fixed income securities ended one of their worst years ever, with flat overall monthly returns as markets weighed the hopes for an end to the monetary tightening cycle with the reality that central banks had not completed their jobs yet. U.S. Consumer Price Index (CPI)8 data showed a strong consistent trend downward, which brought down the 12-month CPI to 6.5% in December from 9.1% in June. Other countries and regions reported still-high but declining inflation rates as the year wound down.
1
The S&P 500 Index consists of 500 stocks chosen for market size, liquidity, and industry group representation. It is a market-value-weighted index with each stock’s weight in the index proportionate to its market value. You cannot invest directly in an index.
2
The Morgan Stanley Capital International (MSCI) All Country World Index (ACWI) ex USA Index (Net) is a free-float-adjusted market-capitalization-weighted index that is designed to measure the equity market performance of developed and emerging markets, excluding the U.S. Source: MSCI. MSCI makes no express or implied warranties or representations and shall have no liability whatsoever with respect to any MSCI data contained herein. The MSCI data may not be further redistributed or used as a basis for other indexes or any securities or financial products. This report is not approved, reviewed, or produced by MSCI. You cannot invest directly in an index.
3
The MSCI Emerging Markets (EM) Index (Net) (USD) is a free-float-adjusted market-capitalization-weighted index that is designed to measure the equity market performance of emerging markets. You cannot invest directly in an index.
4
The Bloomberg U.S. Aggregate Bond Index is a broad-based benchmark that measures the investment-grade, U.S.-dollar-denominated, fixed-rate taxable bond market, including Treasuries, government-related and corporate securities, mortgage-backed securities (agency fixed-rate and hybrid adjustable-rate mortgage pass-throughs), asset-backed securities, and commercial mortgage-backed securities. You cannot invest directly in an index.
5
The Bloomberg Global Aggregate ex-USD Index (unhedged) is an unmanaged index that provides a broad-based measure of the global investment-grade fixed-income markets excluding the U.S.-dollar-denominated debt market. You cannot invest directly in an index.
6
The Bloomberg Municipal Bond Index is an unmanaged index composed of long-term tax-exempt bonds with a minimum credit rating of Baa. You cannot invest directly in an index.
7
The ICE BofA U.S. High Yield Index is a market-capitalization-weighted index of domestic and Yankee high yield bonds. The index tracks the performance of high yield securities traded in the U.S. bond market. You cannot invest directly in an index. Copyright 2023. ICE Data Indices, LLC. All rights reserved.
8
The U.S. Consumer Price Index (CPI) is a measure of the average change over time in the prices paid by urban consumers for a market basket of consumer goods and services. You cannot invest directly in an index.
2 | Allspring Emerging Markets Equity Fund
Letter to shareholders (unaudited)
The year 2023 began with a rally across global equities and fixed income securities. Investor optimism rose in response to data indicating declining inflation rates and the reopening of China’s economy with the abrupt end to its zero-COVID-19 policy. The U.S. reported surprisingly strong job gains—employers added more than 500,000 jobs—and unemployment fell to 3.4%, the lowest level since 1969. Meanwhile, wage growth, seen as a potential contributor to ongoing high inflation, continued to moderate. All eyes remained fixed on the Federal Reserve (Fed) and on how many more rate hikes remain in this tightening cycle. The 0.25% federal funds rate hike announced in January was the Fed’s smallest rate increase since March 2022.
Financial markets declined in February as investors responded unfavorably to resilient economic data. The takeaway: Central banks will likely continue their monetary tightening cycle for longer than markets had priced in. In this environment—where strong economic data is seen as bad news—the resilient U.S. labor market was seen as a negative while the inflation rate has not been falling quickly enough for the Fed, which raised interest rates by 0.25% in early February. Meanwhile, the Bank of England and the European Central Bank both raised rates by 0.50%.
The collapse of Silicon Valley Bank in March, the second-largest banking failure in U.S. history, led to a classic bank run that spread to Europe where Switzerland’s Credit Suisse was taken over by its rival, UBS. The banking industry turmoil created an additional challenge for central banks in balancing inflationary concerns against potential economic weakening. Meanwhile, recent data pointed to economic strength in the U.S., Europe, and China. And China’s economy continued to rebound after the removal of its COVID-19 lockdown. Inflation rates in the U.S., the U.K., and Europe all remained higher than central bank targets, leading to additional rate hikes in March.
Economic data released in April pointed to global resilience, as Purchasing Managers Indexes1 in the U.S., U.K., and eurozone beat expectations and China reported first-quarter annualized economic growth of 4.5%. Despite banking industry stress, developed market stocks had monthly gains. The U.S. labor market remained strong, with a 3.5% jobless rate and monthly payroll gains above 200,000. However, uncertainty and inflationary concerns weighed on investors in the U.S. and abroad.
Don’t let short-term uncertainty derail long-term investment goals.
Periods of investment uncertainty can present challenges, but experience has taught us that maintaining long-term investment goals can be an effective way to plan for the future. To help you create a sound strategy based on your personal goals and risk tolerance, Allspring Funds offers more than 100 mutual funds spanning a wide range of asset classes and investment styles. Although diversification cannot guarantee an investment profit or prevent losses, we believe it can be an effective way to manage investment risk and potentially smooth out overall portfolio performance. We encourage investors to know their investments and to understand that appropriate levels of risk-taking may unlock opportunities.
Thank you for choosing to invest with Allspring Funds. We appreciate your confidence in us and remain committed to helping you meet your financial needs.
Sincerely,
Andrew Owen
President
Allspring Funds
“ The collapse of Silicon Valley Bank in March, the second-largest banking failure in U.S. history, led to a classic bank run that spread to Europe where Switzerland’s Credit Suisse was taken over by its rival, UBS. ”
For further information about your fund, contact your investment professional, visit our website at allspringglobal.com, or call us directly at 1-800-222-8222.
1
The Purchasing Managers Index (PMI) is an index of the prevailing direction of economic trends in the manufacturing and service sectors. You cannot invest directly in an index.
Allspring Emerging Markets Equity Fund | 3
Performance highlights (unaudited)
Performance highlights
| The Fund seeks long-term capital appreciation. |
| Allspring Funds Management, LLC |
| Allspring Global Investments, LLC |
| Derrick Irwin, CFA, Richard Peck, CFA, Yi (Jerry) Zhang, Ph.D., CFA |
Average annual total returns (%) as of April 30, 2023 |
| | | | |
| | | | | | | | | |
| | | | | | | | | |
| | | | | | | | | |
| | | | | | | | | |
Administrator Class (EMGYX) | | | | | | | | | |
Institutional Class (EMGNX) | | | | | | | | | |
MSCI EM Index (Net) (USD)4 | | | | | | | | | |
Figures quoted represent past performance, which is no guarantee of future results, and do not reflect taxes that a shareholder may pay on an investment in a fund. Investment return and principal value of an investment will fluctuate so that an investor’s shares, when redeemed, may be worth more or less than their original cost. Performance shown without sales charges would be lower if sales charges were reflected. Current performance may be lower or higher than the performance data quoted, which assumes the reinvestment of dividends and capital gains. Current month-end performance is available on the Fund’s website, allspringglobal.com.
Index returns do not include transaction costs associated with buying and selling securities, any mutual fund fees or expenses, or any taxes. It is not possible to invest directly in an index.
For Class A shares, the maximum front-end sales charge is 5.75%. For Class C shares, the maximum contingent deferred sales charge is 1.00%. Performance including a contingent deferred sales charge assumes the sales charge for the corresponding time period. Class R6, Administrator Class and Institutional Class shares are sold without a front-end sales charge or contingent deferred sales charge.
|
| Reflects the expense ratios as stated in the most recent prospectuses. The expense ratios shown are subject to change and may differ from the annualized expense ratios shown in the financial highlights of this report. |
| The manager has contractually committed through February 29, 2024, to waive fees and/or reimburse expenses to the extent necessary to cap total annual fund operating expenses after fee waivers at 1.44% for Class A, 2.19% for Class C, 1.01% for Class R6, 1.36% for Administrator Class and 1.11% for Institutional Class. Brokerage commissions, stamp duty fees, interest, taxes, acquired fund fees and expenses (if any), and extraordinary expenses are excluded from the expense caps. Prior to or after the commitment expiration date, the caps may be increased or the commitment to maintain the caps may be terminated only with the approval of the Board of Trustees. Without these caps, the Fund’s returns would have been lower. The expense ratio paid by an investor is the net expense ratio (the total annual fund operating expenses after fee waivers) as stated in the prospectuses. |
| Historical performance shown for the Class R6 shares prior to their inception reflects the performance of the Institutional Class shares, and includes the higher expenses applicable to the Institutional Class shares. If these expenses had not been included, returns for the Class R6 shares would be higher. |
| The Morgan Stanley Capital International (MSCI) Emerging Markets (EM) Index (Net) (USD) is a free-float-adjusted market-capitalization-weighted index that is designed to measure the equity market performance of emerging markets. Source: MSCI. MSCI makes no express or implied warranties or representations and shall have no liability whatsoever with respect to any MSCI data contained herein. The MSCI data may not be further redistributed or used as a basis for other indices or any securities or financial products. This report is not approved, reviewed, or produced by MSCI. You cannot invest directly in an index. |
CFA® and Chartered Financial Analyst® are trademarks owned by CFA Institute. |
4 | Allspring Emerging Markets Equity Fund
Performance highlights (unaudited)
Ten largest holdings (%) as of April 30, 20231 |
Samsung Electronics Co. Ltd. | |
Taiwan Semiconductor Manufacturing Co. Ltd. | |
| |
Reliance Industries Ltd. GDR | |
Fomento Economico Mexicano SAB de CV | |
Taiwan Semiconductor Manufacturing Co. Ltd. | |
| |
Uni-President Enterprises Corp. | |
| |
| |
| Figures represent the percentage of the Fund’s net assets. Holdings are subject to change and may have changed since the date specified. |
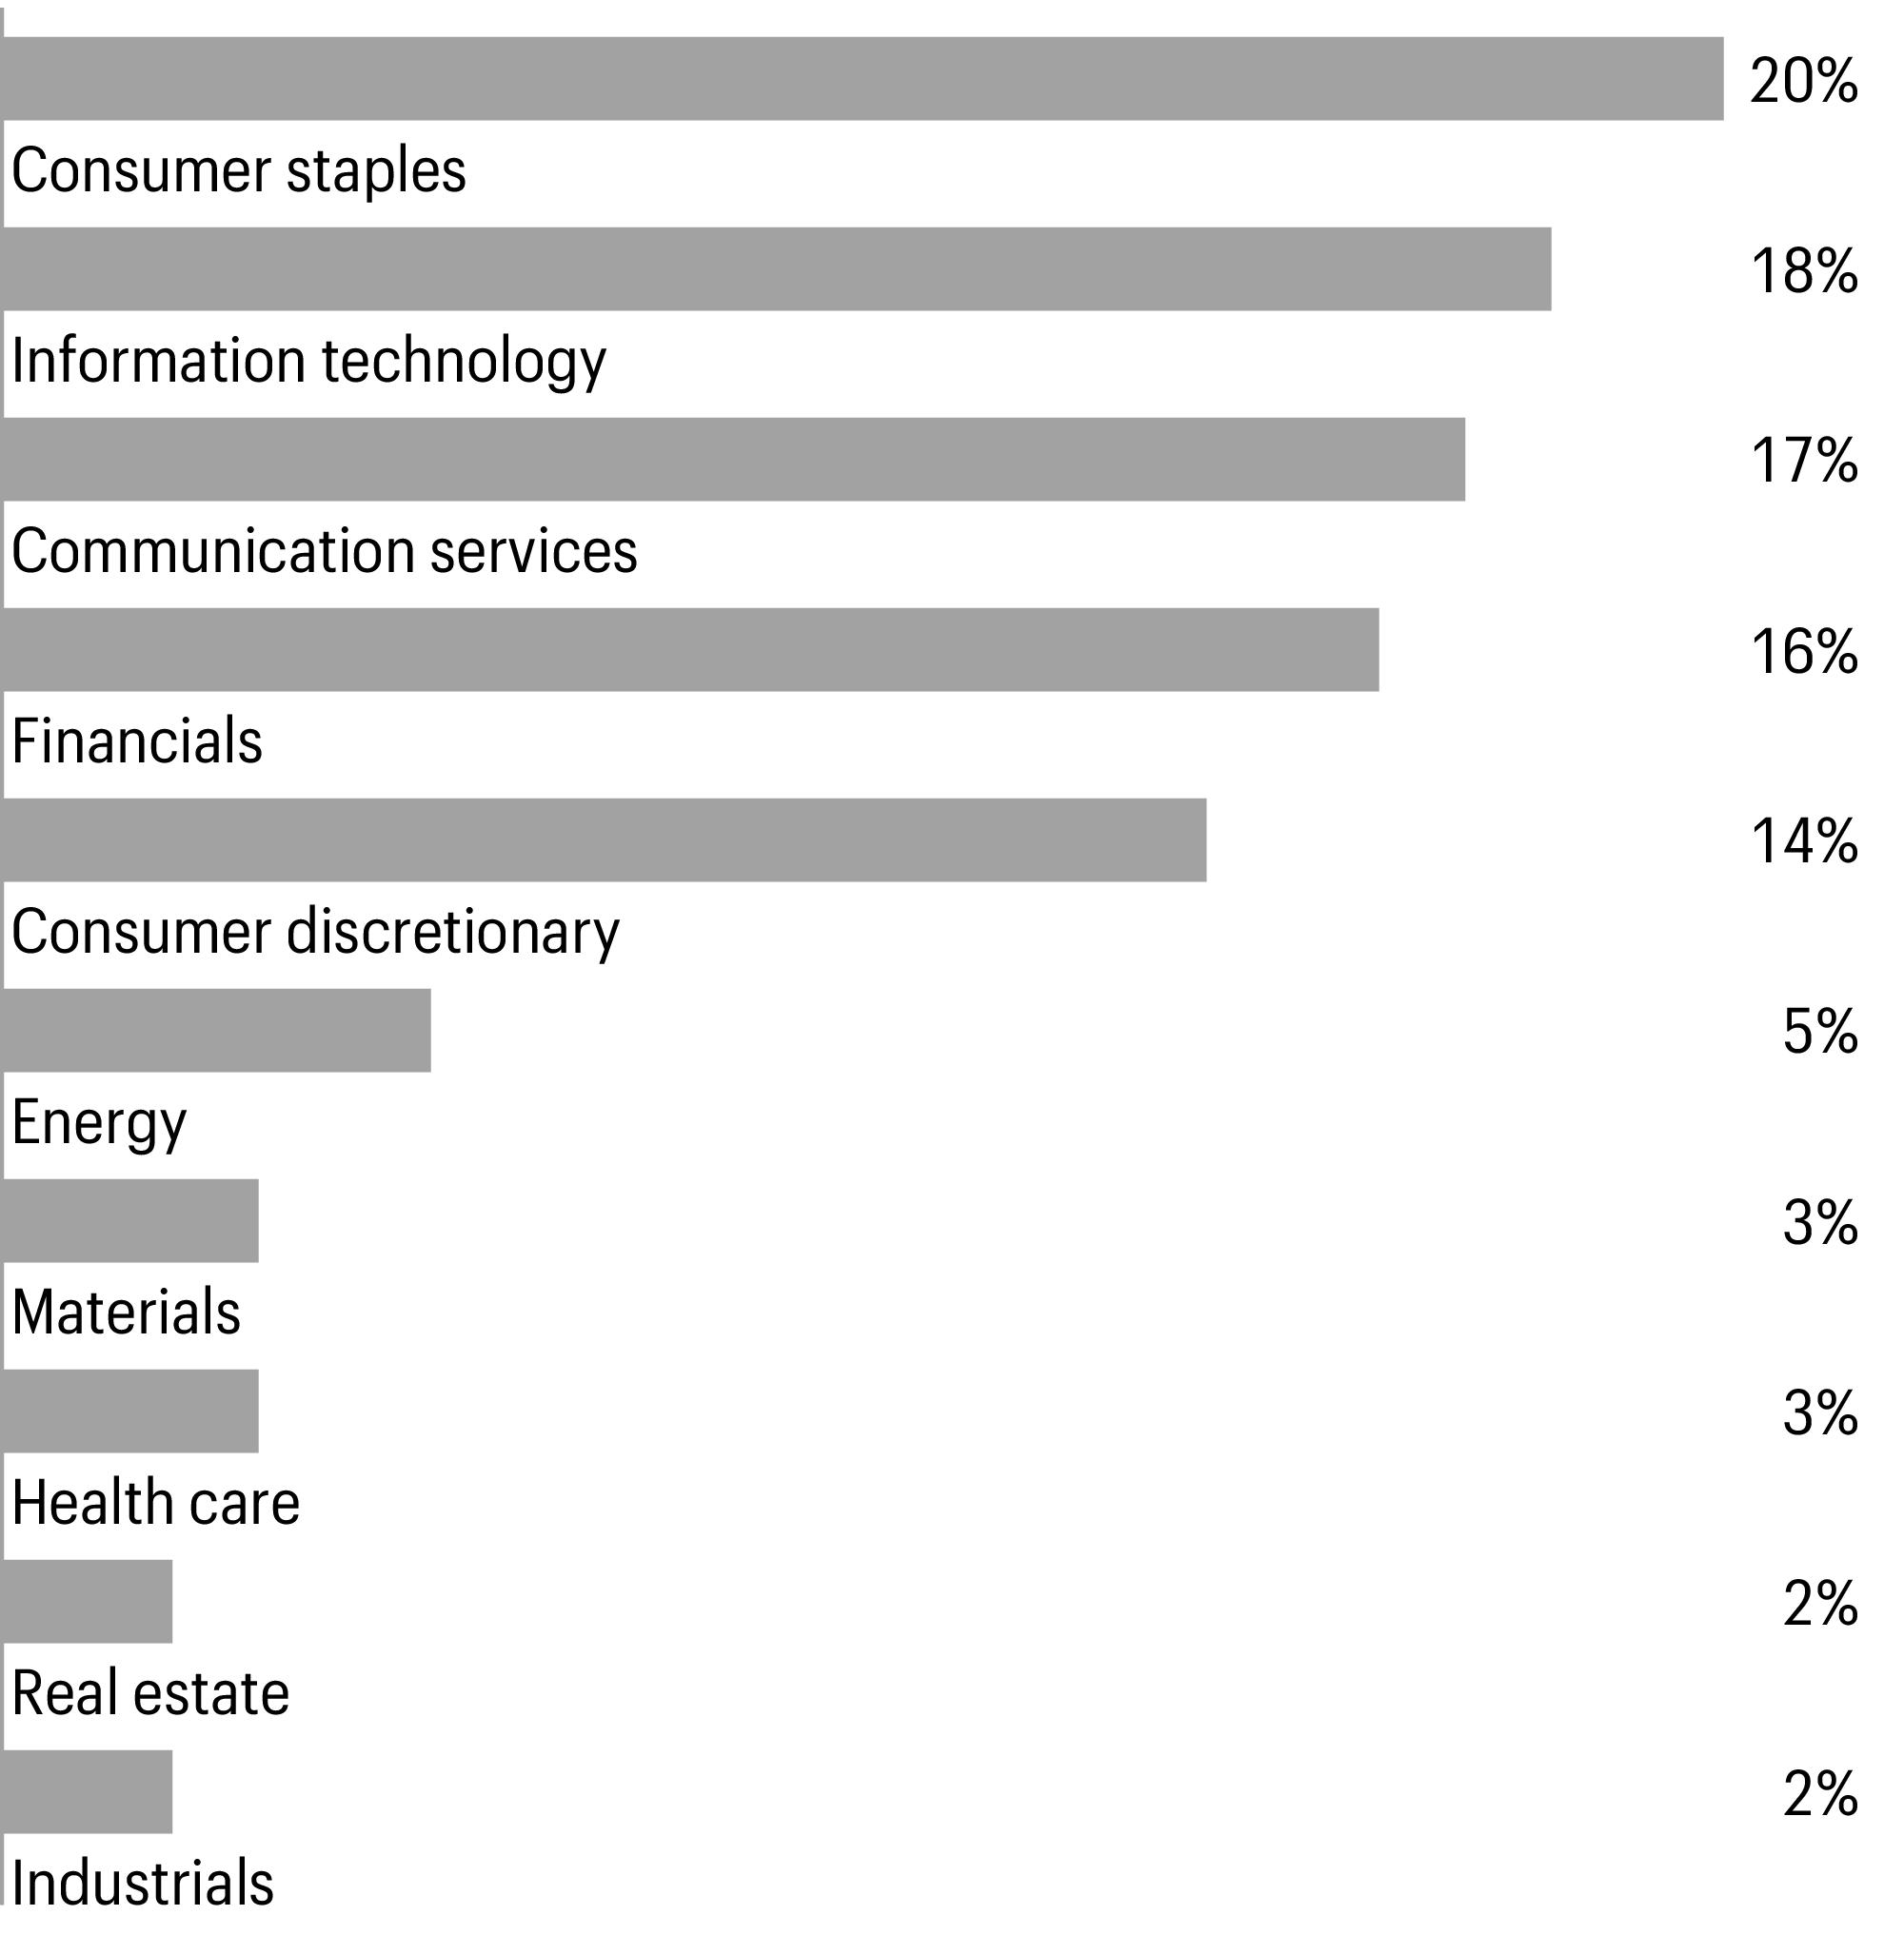
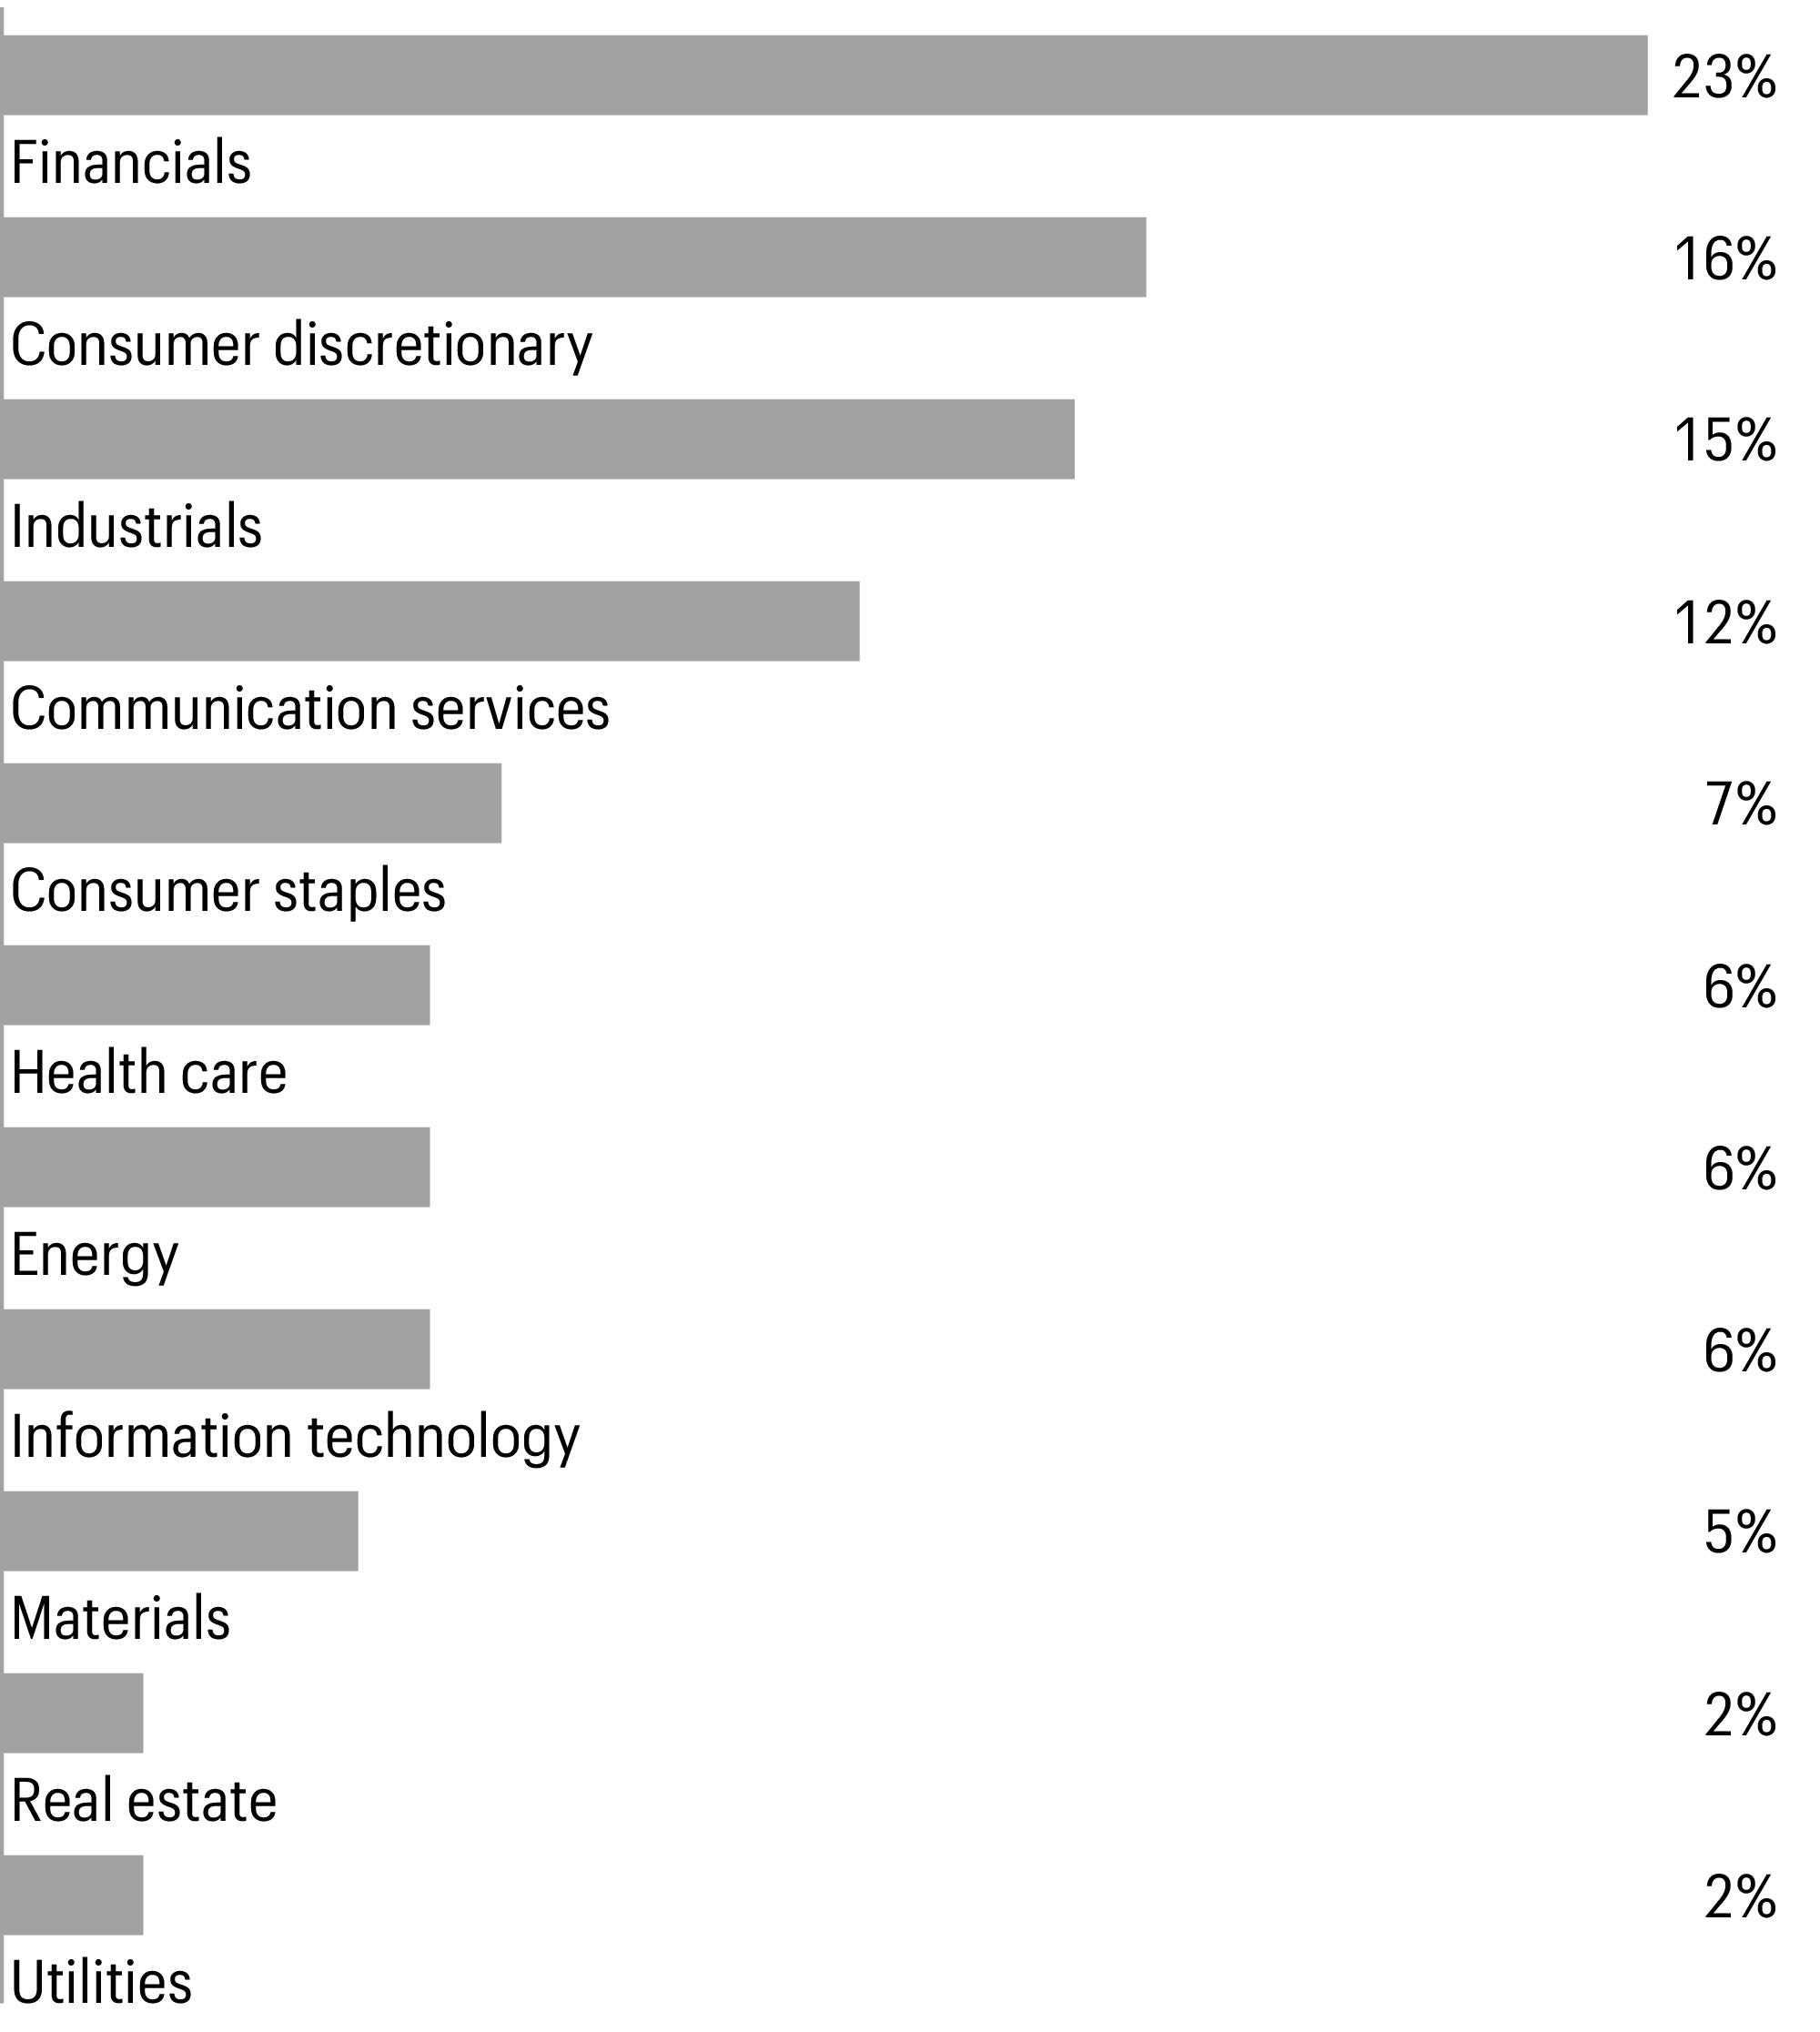
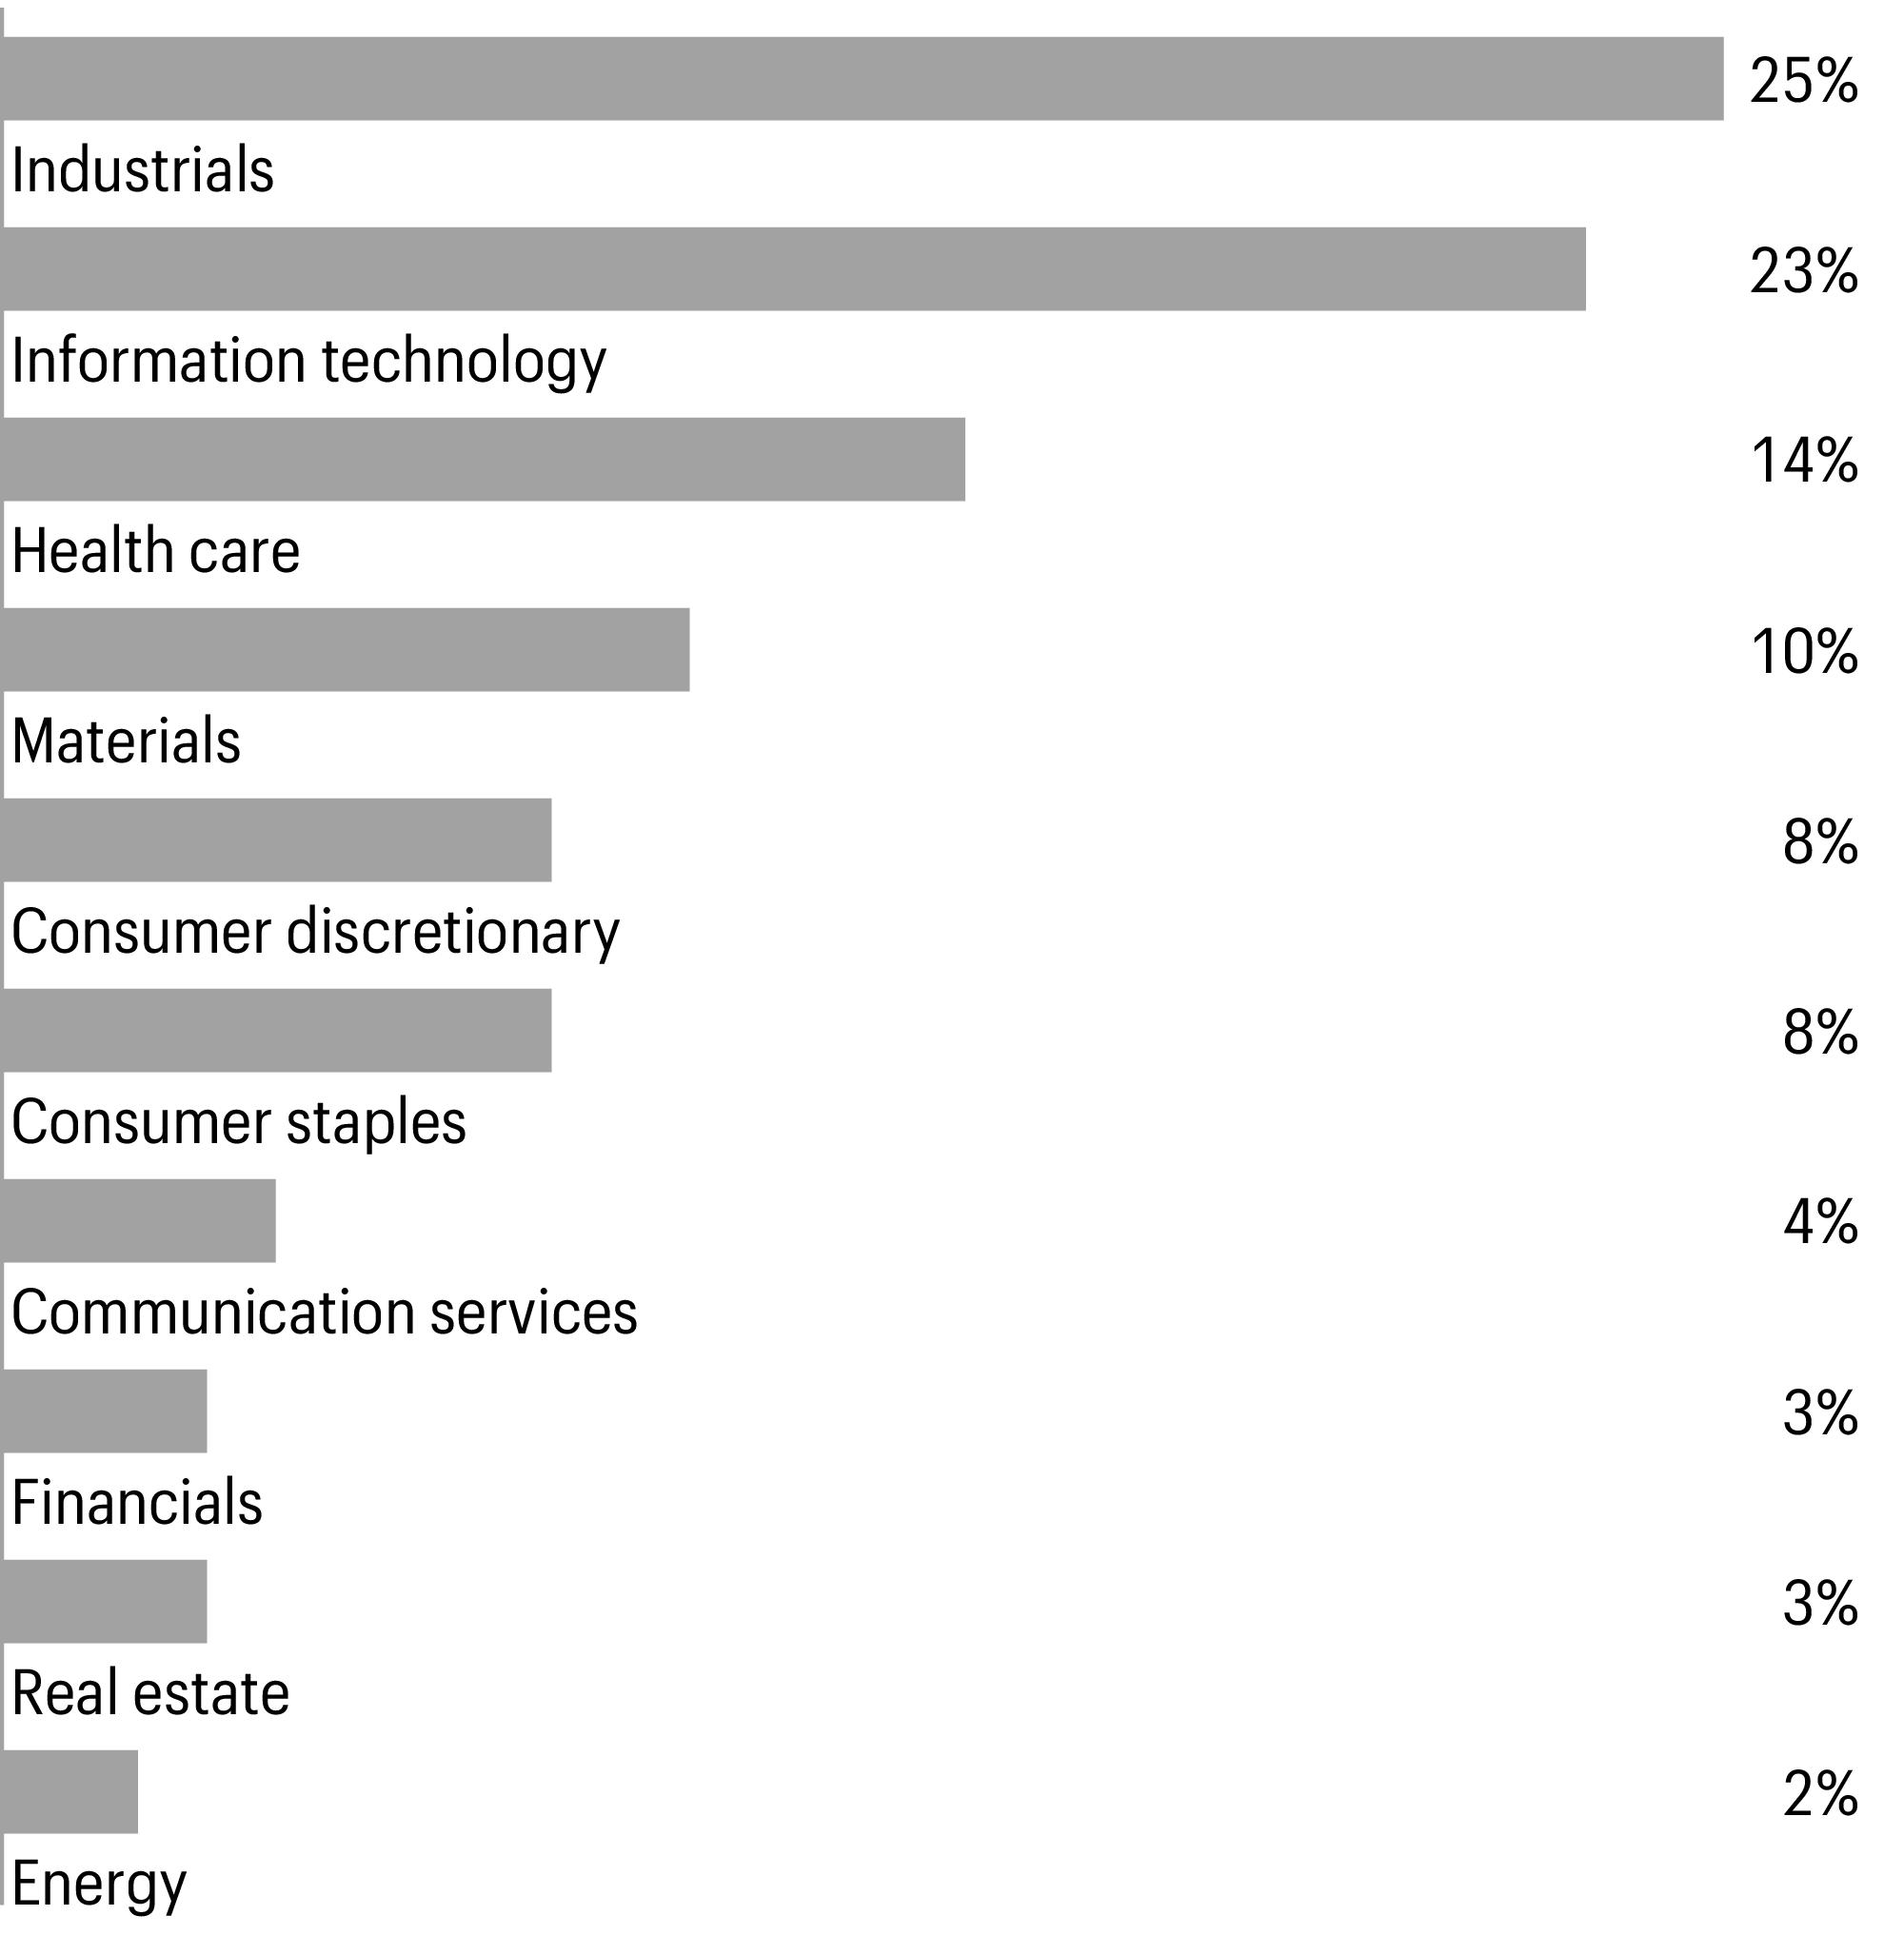
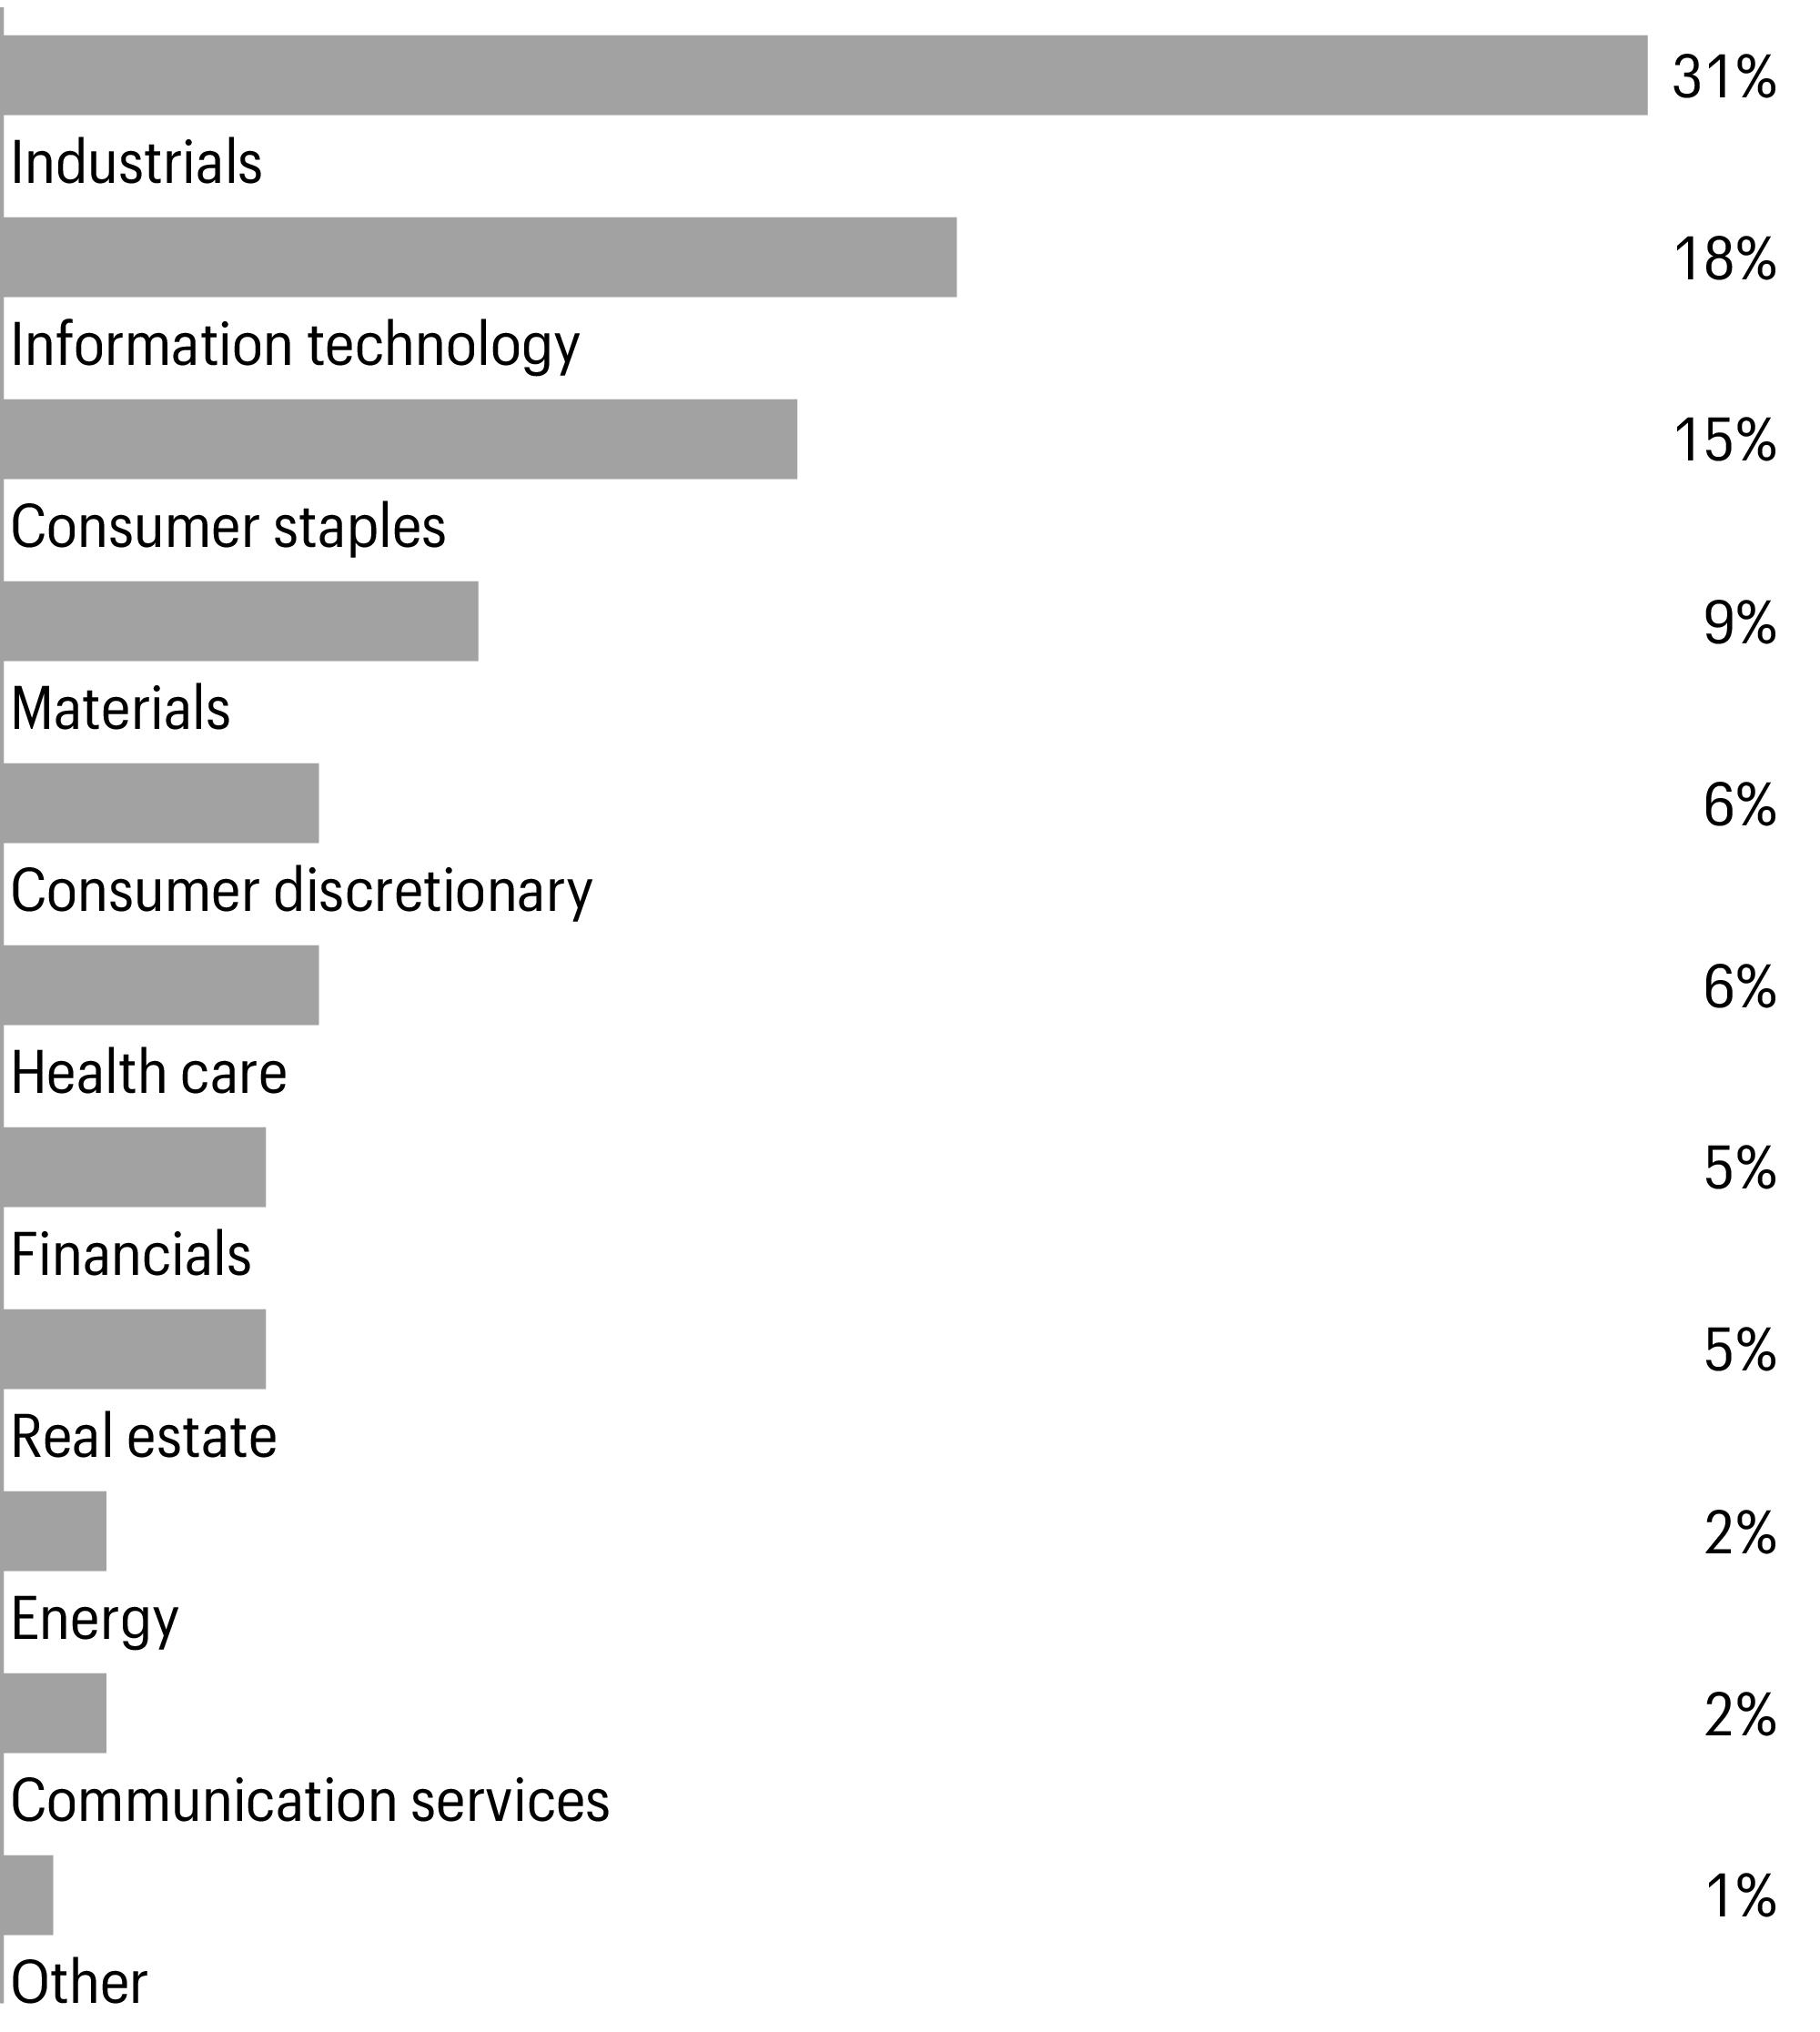
Sector allocation as of April 30, 20231 |
| Figures represent the percentage of the Fund’s long-term investments. Allocations are subject to change and may have changed since the date specified. |
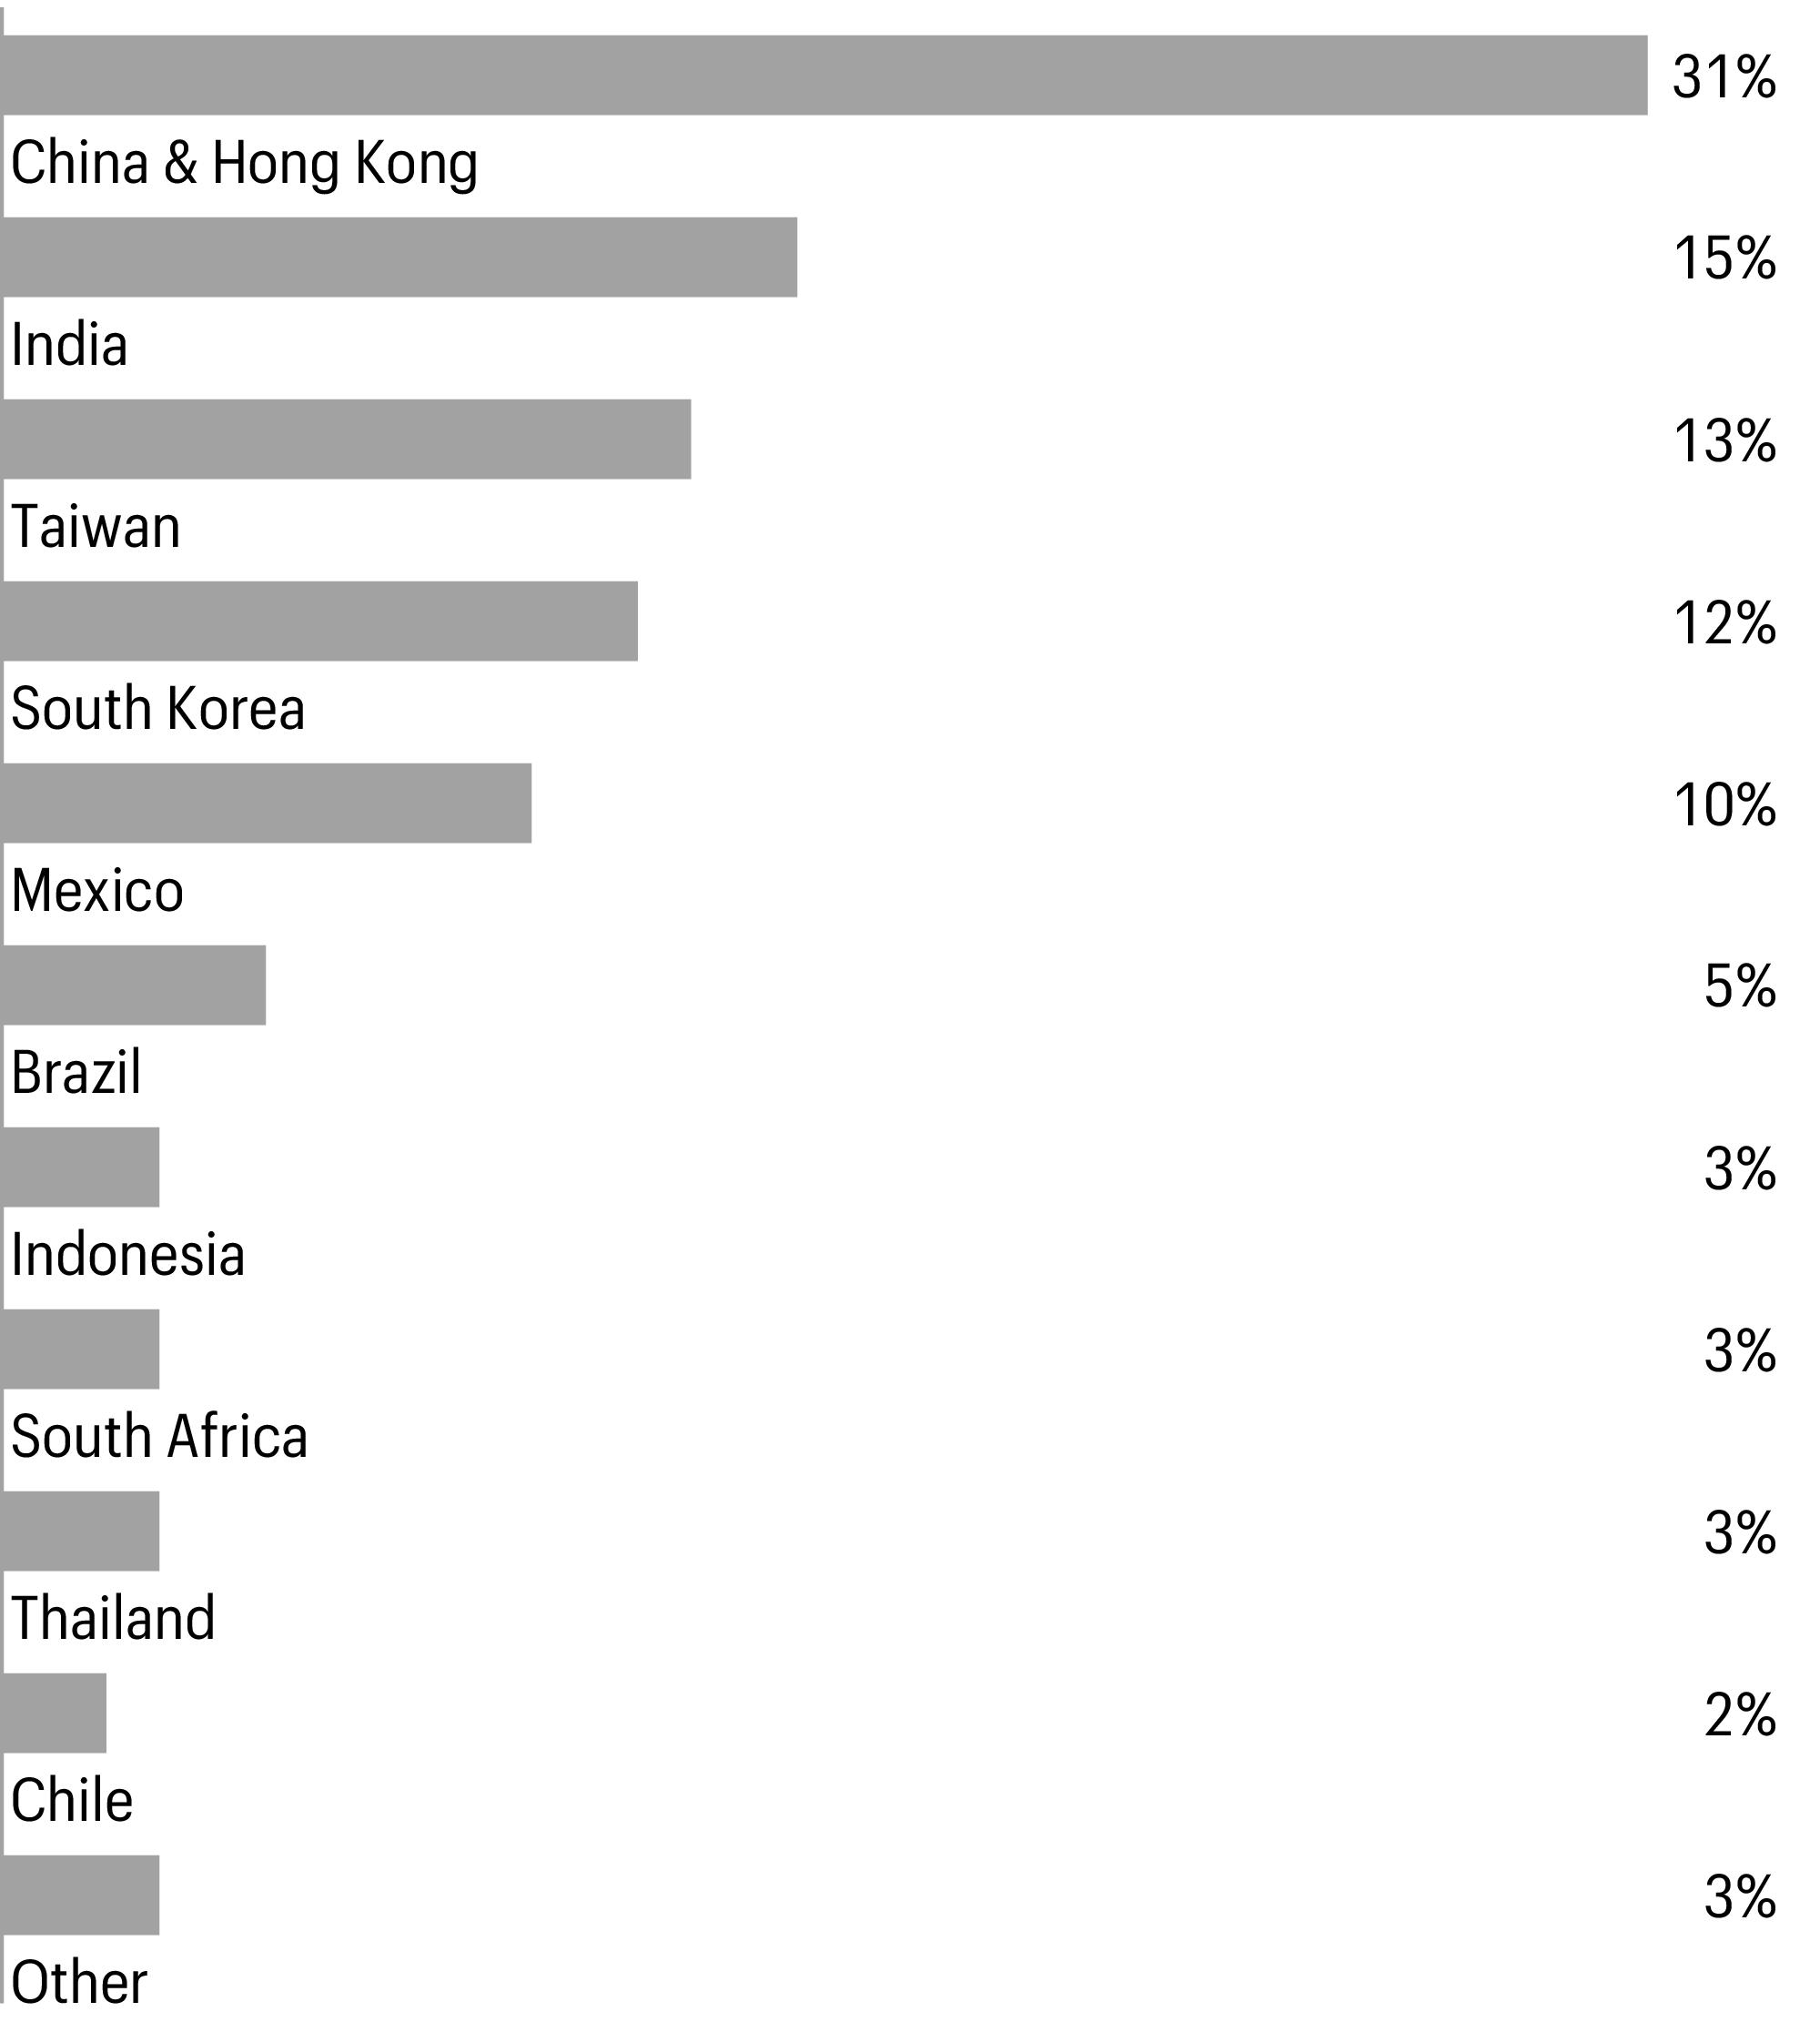
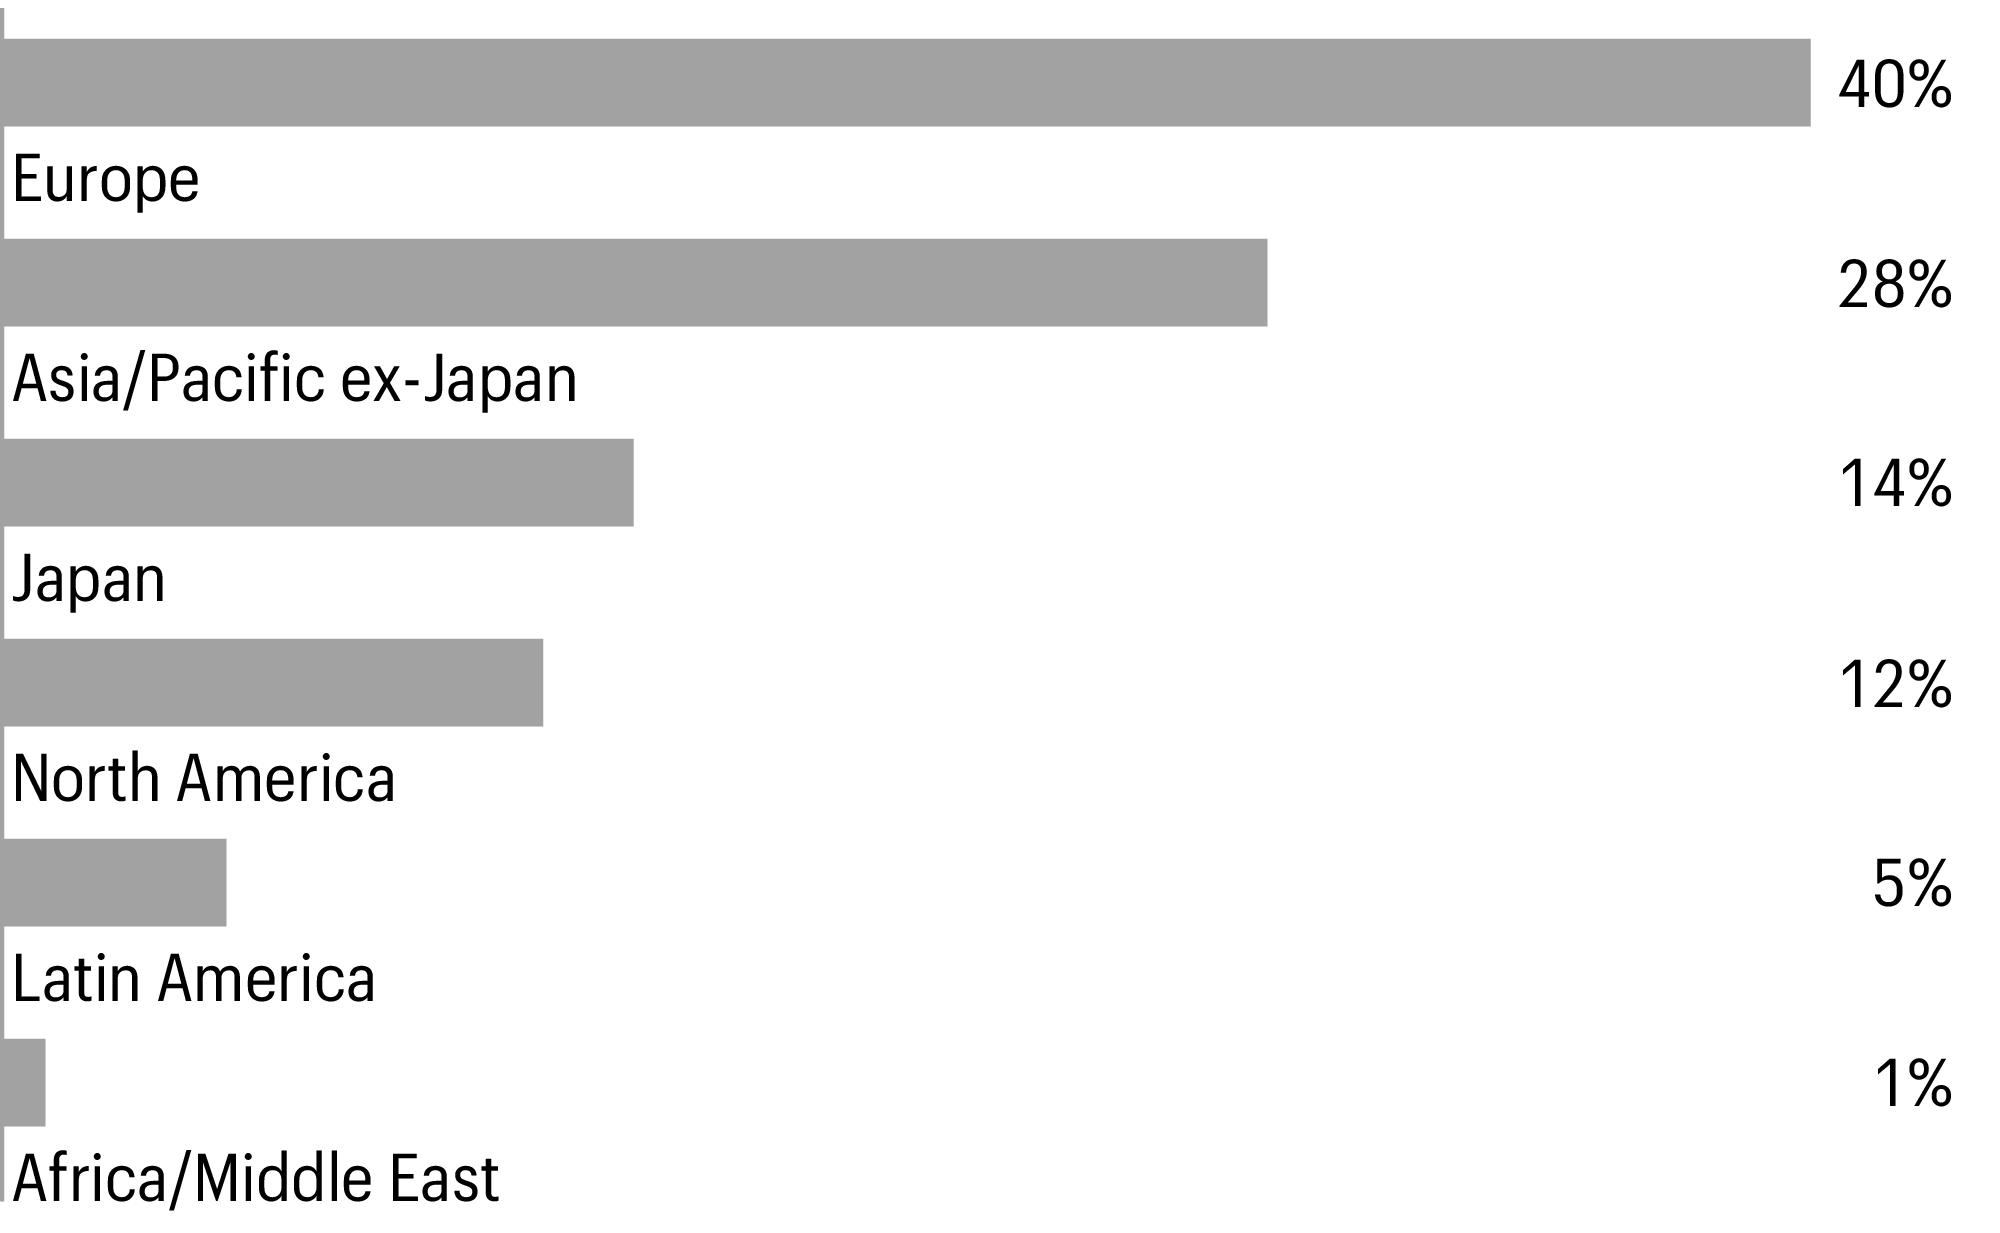
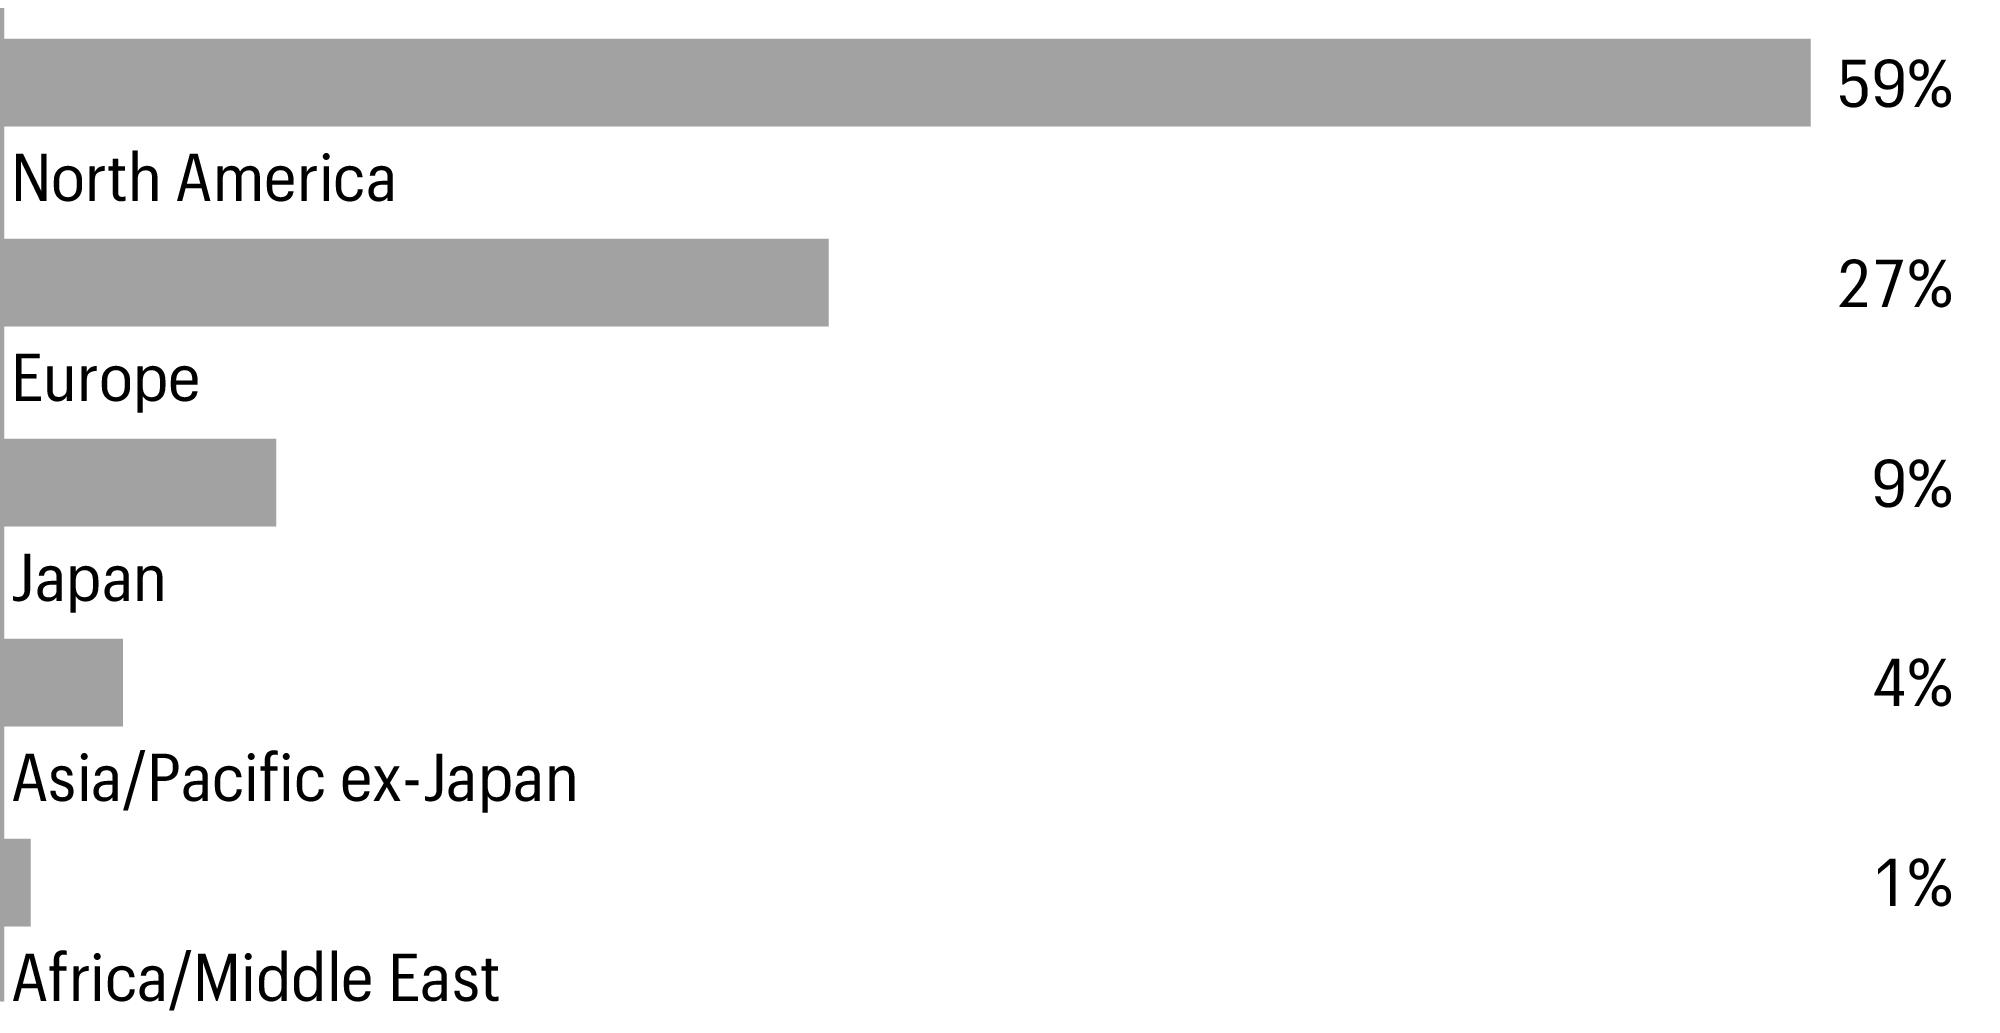
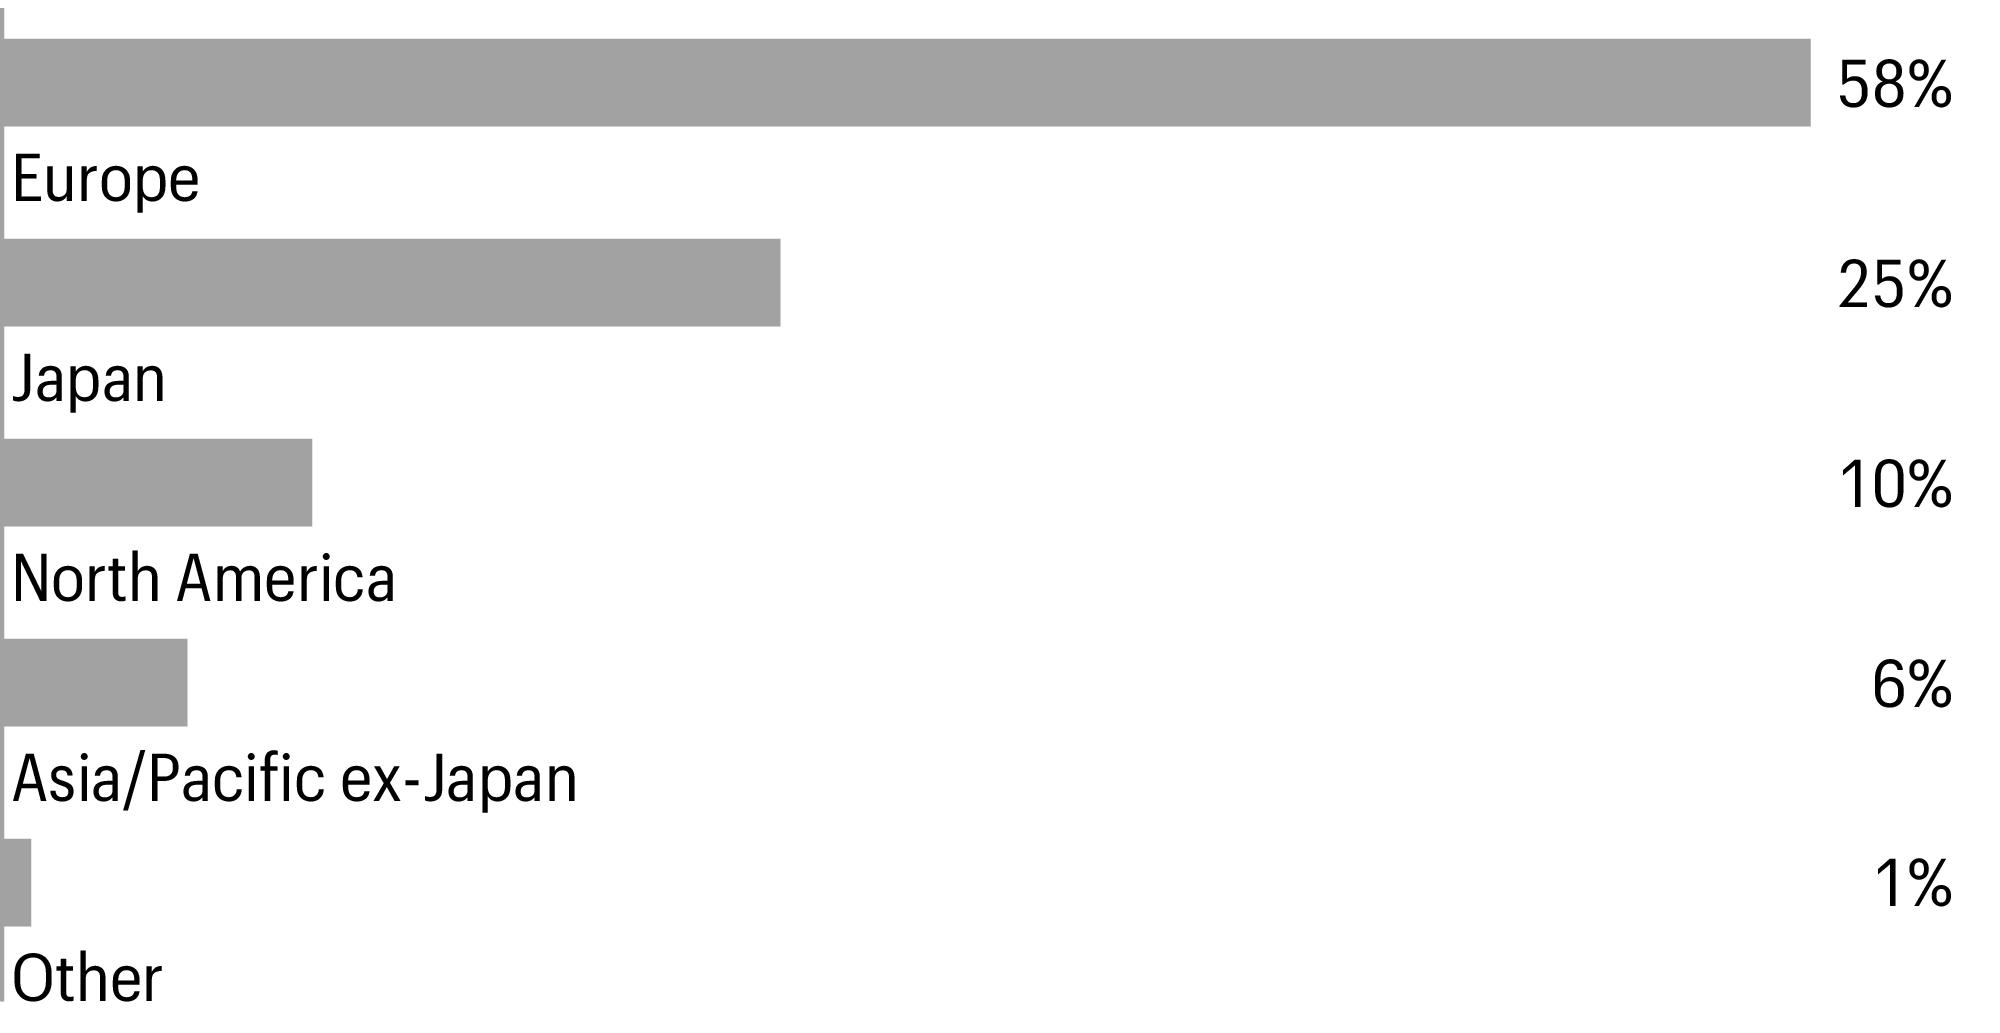
Country allocation as of April 30, 20231 |
| Figures represent the percentage of the Fund’s long-term investments. Allocations are subject to change and may have changed since the date specified. |
Allspring Emerging Markets Equity Fund | 5
Fund expenses (unaudited)
Fund expenses
As a shareholder of the Fund, you incur two types of costs: (1) transaction costs, including sales charges (loads) on purchase payments and contingent deferred sales charges (if any) on redemptions and (2) ongoing costs, including management fees, distribution (12b-1) and/or shareholder servicing fees, and other Fund expenses. This example is intended to help you understand your ongoing costs (in dollars) of investing in the Fund and to compare these costs with the ongoing costs of investing in other mutual funds.
The example is based on an investment of $1,000 invested at the beginning of the six-month period and held for the entire period from November 1, 2022 to April 30, 2023.
Actual expenses
The “Actual” line of the table below provides information about actual account values and actual expenses. You may use the information in this line, together with the amount you invested, to estimate the expenses that you paid over the period. Simply divide your account value by $1,000 (for example, an $8,600 account value divided by $1,000 = 8.6), then multiply the result by the number in the “Actual” line under the heading entitled “Expenses paid during period” for your applicable class of shares to estimate the expenses you paid on your account during this period.
Hypothetical example for comparison purposes
The “Hypothetical” line of the table below provides information about hypothetical account values and hypothetical expenses based on the Fund’s actual expense ratio and an assumed rate of return of 5% per year before expenses, which is not the Fund’s actual return. The hypothetical account values and expenses may not be used to estimate the actual ending account balance or expenses you paid for the period. You may use this information to compare the ongoing costs of investing in the Fund and other funds. To do so, compare this 5% hypothetical example with the 5% hypothetical examples that appear in the shareholder reports of the other funds.
Please note that the expenses shown in the table are meant to highlight your ongoing costs only and do not reflect any transactional costs, such as sales charges (loads) and contingent deferred sales charges. Therefore, the “Hypothetical” line of the table is useful in comparing ongoing costs only, and will not help you determine the relative total costs of owning different funds. In addition, if these transactional costs were included, your costs would have been higher.
| Beginning
account value
11-1-2022 | Ending
account value
4-30-2023 | | Annualized net
expense ratio |
| | | | |
| | | | |
Hypothetical (5% return before expenses) | | | | |
| | | | |
| | | | |
Hypothetical (5% return before expenses) | | | | |
| | | | |
| | | | |
Hypothetical (5% return before expenses) | | | | |
| | | | |
| | | | |
Hypothetical (5% return before expenses) | | | | |
| | | | |
| | | | |
Hypothetical (5% return before expenses) | | | | |
1 Expenses paid is equal to the annualized net expense ratio of each class multiplied by the average account value over the period, multiplied by 181 divided by 365 (to reflect the one-half-year period).
6 | Allspring Emerging Markets Equity Fund
Portfolio of investments—April 30, 2023 (unaudited)
| | | | | |
| | | | | | |
| | | | | | |
Atacadao SA (Consumer staples, Consumer staples distribution & retail) | | | | | | |
B3 SA - Brasil Bolsa Balcao (Financials, Capital markets) | | | | | | |
Banco Bradesco SA ADR (Financials, Banks) † | | | | | | |
BRF SA ADR (Consumer staples, Food products) † | | | | | | |
Cia Brasileira de Aluminio (Materials, Metals & mining) | | | | | | |
Diagnosticos da America SA (Health care, Health care providers & services) | | | | | | |
Hapvida Participacoes e Investimentos SA (Health care, Health care providers & services) 144A† | | | | | | |
Inter & Co., Inc. BDR (Financials, Banks) † | | | | | | |
Lojas Renner SA (Consumer discretionary, Specialty retail) | | | | | | |
Magazine Luiza SA (Consumer discretionary, Broadline retail) † | | | | | | |
Multiplan Empreendimentos Imobiliarios SA (Real estate, Real estate management & development) | | | | | | |
Raia Drogasil SA (Consumer staples, Consumer staples distribution & retail) | | | | | | |
Zamp SA (Consumer discretionary, Hotels, restaurants & leisure) † | | | | | | |
| | | | | | |
| | | | | | |
Banco Santander Chile ADR (Financials, Banks) | | | | | | |
Falabella SA (Consumer discretionary, Broadline retail) | | | | | | |
| | | | | | |
| | | | | | |
Agora, Inc. ADR (Information technology, Software) † | | | | | | |
Alibaba Group Holding Ltd. ADR (Consumer discretionary, Broadline retail) † | | | | | | |
Alibaba Group Holding Ltd. (Consumer discretionary, Broadline retail) † | | | | | | |
Bilibili, Inc. ADR (Communication services, Entertainment) † | | | | | | |
China Literature Ltd. (Communication services, Media) 144A† | | | | | | |
China Meidong Auto Holdings Ltd. (Consumer discretionary, Specialty retail) | | | | | | |
FinVolution Group ADR (Financials, Consumer finance) | | | | | | |
GreenTree Hospitality Group Ltd. ADR (Consumer discretionary, Hotels, restaurants & leisure) † | | | | | | |
Hua Medicine (Health care, Pharmaceuticals) 144A† | | | | | | |
Kingdee International Software Group Co. Ltd. (Information technology, Software) † | | | | | | |
Li Ning Co. Ltd. (Consumer discretionary, Textiles, apparel & luxury goods) † | | | | | | |
Meituan Class B (Consumer discretionary, Hotels, restaurants & leisure) 144A† | | | | | | |
Shandong Weigao Group Medical Polymer Co. Ltd. Class H (Health care, Health care equipment & supplies) | | | | | | |
The accompanying notes are an integral part of these financial statements.
Allspring Emerging Markets Equity Fund | 7
Portfolio of investments—April 30, 2023 (unaudited)
| | | | | |
| | | | | | |
Tencent Holdings Ltd. (Communication services, Interactive media & services) † | | | | | | |
Tencent Music Entertainment Group ADR (Communication services, Entertainment) † | | | | | | |
Tongdao Liepin Group (Communication services, Interactive media & services) † | | | | | | |
Trip.com Group Ltd. ADR (Consumer discretionary, Hotels, restaurants & leisure) † | | | | | | |
Tsingtao Brewery Co. Ltd. Class H (Consumer staples, Beverages) † | | | | | | |
Uxin Ltd. ADR (Consumer discretionary, Specialty retail) † | | | | | | |
Vipshop Holdings Ltd. ADR (Consumer discretionary, Broadline retail) † | | | | | | |
Want Want China Holdings Ltd. (Consumer staples, Food products) | | | | | | |
Weibo Corp. ADR (Communication services, Interactive media & services) † | | | | | | |
Wuxi Biologics Cayman, Inc. (Health care, Life sciences tools & services) 144A† | | | | | | |
Xiaomi Corp. Class B (Information technology, Technology hardware, storage & peripherals) 144A† | | | | | | |
Zepp Health Corp. ADR (Information technology, Electronic equipment, instruments & components) ♠† | | | | | | |
Zhou Hei Ya International Holdings Co. Ltd. (Consumer staples, Food products) 144A† | | | | | | |
| | | | | | |
| | | | | | |
Bancolombia SA ADR (Financials, Banks) | | | | | | |
| | | | | | |
AIA Group Ltd. (Financials, Insurance) | | | | | | |
Johnson Electric Holdings Ltd. (Consumer discretionary, Automobile components) | | | | | | |
Sun Art Retail Group Ltd. (Consumer staples, Consumer staples distribution & retail) | | | | | | |
WH Group Ltd. (Consumer staples, Food products) 144A | | | | | | |
| | | | | | |
| | | | | | |
Axis Bank Ltd. (Financials, Banks) † | | | | | | |
Bajaj Finance Ltd. (Financials, Consumer finance) | | | | | | |
Bandhan Bank Ltd. (Financials, Banks) 144A† | | | | | | |
Bharti Airtel Ltd. (Communication services, Wireless telecommunication services) | | | | | | |
Bharti Airtel Ltd. (Communication services, Wireless telecommunication services) | | | | | | |
Dalmia Bharat Ltd. (Materials, Construction materials) | | | | | | |
Fortis Healthcare Ltd. (Health care, Health care providers & services) † | | | | | | |
The accompanying notes are an integral part of these financial statements.
8 | Allspring Emerging Markets Equity Fund
Portfolio of investments—April 30, 2023 (unaudited)
| | | | | |
| | | | | | |
HDFC Bank Ltd. ADR (Financials, Banks) † | | | | | | |
HDFC Bank Ltd. (Financials, Banks) | | | | | | |
Housing Development Finance Corp. Ltd. (Financials, Financial services) | | | | | | |
Indus Towers Ltd. (Communication services, Diversified telecommunication services) | | | | | | |
ITC Ltd. (Consumer staples, Tobacco) | | | | | | |
JM Financial Ltd. (Financials, Capital markets) | | | | | | |
Kotak Mahindra Bank Ltd. (Financials, Banks) | | | | | | |
Max Financial Services Ltd. (Financials, Insurance) † | | | | | | |
Reliance Industries Ltd. (Energy, Oil, gas & consumable fuels) | | | | | | |
Reliance Industries Ltd. GDR (Energy, Oil, gas & consumable fuels) 144A | | | | | | |
SBI Life Insurance Co. Ltd. (Financials, Insurance) 144A | | | | | | |
SH Kelkar & Co. Ltd. (Materials, Chemicals) 144A | | | | | | |
Spandana Sphoorty Financial Ltd. (Financials, Consumer finance) † | | | | | | |
UltraTech Cement Ltd. (Materials, Construction materials) † | | | | | | |
| | | | | | |
| | | | | | |
Astra International Tbk PT (Consumer discretionary, Automobiles) | | | | | | |
Bank Central Asia Tbk PT (Financials, Banks) | | | | | | |
Telkom Indonesia Persero Tbk PT ADR (Communication services, Diversified telecommunication services) | | | | | | |
Telkom Indonesia Persero Tbk PT (Communication services, Diversified telecommunication services) | | | | | | |
| | | | | | |
| | | | | | |
InPost SA (Industrials, Air freight & logistics) † | | | | | | |
| | | | | | |
America Movil SAB de CV ADR (Communication services, Wireless telecommunication services) | | | | | | |
Becle SAB de CV (Consumer staples, Beverages) | | | | | | |
Cemex SAB de CV ADR (Materials, Construction materials) | | | | | | |
Fibra Uno Administracion SA de CV (Real estate, Diversified REITs) | | | | | | |
Fomento Economico Mexicano SAB de CV ADR (Consumer staples, Beverages) | | | | | | |
Grupo Financiero Banorte SAB de CV Class O (Financials, Banks) | | | | | | |
Sitios Latinoamerica SAB de CV (Communication services, Diversified telecommunication services) † | | | | | | |
Wal-Mart de Mexico SAB de CV (Consumer staples, Consumer staples distribution & retail) | | | | | | |
| | | | | | |
| | | | | | |
IHS Holding Ltd. (Communication services, Diversified telecommunication services) † | | | | | | |
The accompanying notes are an integral part of these financial statements.
Allspring Emerging Markets Equity Fund | 9
Portfolio of investments—April 30, 2023 (unaudited)
| | | | | |
| | | | | | |
Cia de Minas Buenaventura SAA ADR (Materials, Metals & mining) | | | | | | |
| | | | | | |
ACEN Corp. (Utilities, Independent power and renewable electricity producers) † | | | | | | |
Ayala Corp. (Industrials, Industrial conglomerates) | | | | | | |
San Miguel Food & Beverage, Inc. (Consumer staples, Food products) | | | | | | |
SM Investments Corp. (Industrials, Industrial conglomerates) † | | | | | | |
| | | | | | |
| | | | | | |
Fix Price Group PLC GDR (Acquired 3-5-2021, cost $2,142,036) (Consumer staples, Consumer staples distribution & retail) ♦†˃ | | | | | | |
LUKOIL PJSC (Acquired 4-9-2002, cost $16,145,227) (Energy, Oil, gas & consumable fuels) ♦†˃ | | | | | | |
Magnit PJSC (Acquired 4-29-2013, cost $32,870,256) (Consumer staples, Consumer staples distribution & retail) ♦†˃ | | | | | | |
Ozon Holdings PLC ADR (Acquired 11-24-2020, cost $2,412,000) (Consumer discretionary, Broadline retail) ♦†˃« | | | | | | |
Sberbank of Russia PJSC (Acquired 8-18-2011, cost $17,232,150) (Financials, Banks) ♦†˃ | | | | | | |
Yandex NV Class A (Acquired 11-30-2012, cost $13,875,426) (Communication services, Interactive media & services) ♦†˃ | | | | | | |
| | | | | | |
| | | | | | |
MTN Group Ltd. (Communication services, Wireless telecommunication services) | | | | | | |
Shoprite Holdings Ltd. (Consumer staples, Consumer staples distribution & retail) | | | | | | |
Standard Bank Group Ltd. (Financials, Banks) | | | | | | |
Tiger Brands Ltd. (Consumer staples, Food products) | | | | | | |
| | | | | | |
| | | | | | |
KT Corp. ADR (Communication services, Diversified telecommunication services) | | | | | | |
KT&G Corp. (Consumer staples, Tobacco) | | | | | | |
LG Chem Ltd. (Materials, Chemicals) | | | | | | |
NAVER Corp. (Communication services, Interactive media & services) | | | | | | |
Samsung Electronics Co. Ltd. (Information technology, Technology hardware, storage & peripherals) | | | | | | |
Samsung Life Insurance Co. Ltd. (Financials, Insurance) | | | | | | |
SK Hynix, Inc. (Information technology, Semiconductors & semiconductor equipment) | | | | | | |
SK Telecom Co. Ltd. (Communication services, Wireless telecommunication services) | | | | | | |
| | | | | | |
The accompanying notes are an integral part of these financial statements.
10 | Allspring Emerging Markets Equity Fund
Portfolio of investments—April 30, 2023 (unaudited)
| | | | | |
| | | | | | |
104 Corp. (Industrials, Professional services) † | | | | | | |
MediaTek, Inc. (Information technology, Semiconductors & semiconductor equipment) † | | | | | | |
President Chain Store Corp. (Consumer staples, Consumer staples distribution & retail) † | | | | | | |
Taiwan Semiconductor Manufacturing Co. Ltd. (Information technology, Semiconductors & semiconductor equipment) | | | | | | |
Taiwan Semiconductor Manufacturing Co. Ltd. ADR (Information technology, Semiconductors & semiconductor equipment) | | | | | | |
Uni-President Enterprises Corp. (Consumer staples, Food products) † | | | | | | |
| | | | | | |
| | | | | | |
PTT Exploration & Production PCL (Energy, Oil, gas & consumable fuels) | | | | | | |
PTT PCL (Energy, Oil, gas & consumable fuels) | | | | | | |
SCB X PCL (Financials, Banks) | | | | | | |
Thai Beverage PCL (Consumer staples, Beverages) | | | | | | |
| | | | | | |
| | | | | | |
MercadoLibre, Inc. (Consumer discretionary, Broadline retail) † | | | | | | |
Southern Copper Corp. (Materials, Metals & mining) | | | | | | |
Uxin Ltd. Class A (Consumer discretionary, Specialty retail) ♦ | | | | | | |
| | | | | | |
Total common stocks (Cost $3,206,478,417) | | | | | | |
| | | | | |
Convertible Debentures: 0.00% | | | | | | |
| | | | | | |
Lupatech SA Series 1 (Energy, Oil & gas services) ♦† | | | | | | |
Total convertible debentures (Cost $160,691) | | | | | | |
| | | | | |
| | | | | | |
| | | | | | |
Diagnosticos da America SA (Health care, Health care providers & services) ♦† | | | | | | |
| | | | | | |
The accompanying notes are an integral part of these financial statements.
Allspring Emerging Markets Equity Fund | 11
Portfolio of investments—April 30, 2023 (unaudited)
| | | | | |
Short-term investments: 3.75% | | | | | | |
Investment companies: 3.75% | | | | | | |
Allspring Government Money Market Fund Select Class ♠∞ | | | | | | |
Total short-term investments (Cost $147,970,359) | | | | | | |
Total investments in securities (Cost $3,354,609,467) | | | | | | |
Other assets and liabilities, net | | | | | | |
| | | | | | |
| Non-income-earning security |
| The security may be resold in transactions exempt from registration, normally to qualified institutional buyers, pursuant to Rule 144A under the Securities Act of 1933. |
| The issuer of the security is an affiliated person of the Fund as defined in the Investment Company Act of 1940. |
| The security is fair valued in accordance with Allspring Funds Management’s valuation procedures, as the Board-designated valuation designee. |
| Restricted security as to resale, excluding Rule 144A securities. The Fund held restricted securities with an aggregate current value of $0 (original aggregate cost of $84,677,095), representing 0.00% of its net assets as of period end. |
| This security is on loan pending return from the lending agent. |
| The rate represents the 7-day annualized yield at period end. |
|
| American depositary receipt |
| Brazilian depositary receipt |
| Global depositary receipt |
| Real estate investment trust |
Investments in affiliates
An affiliated investment is an investment in which the Fund owns at least 5% of the outstanding voting shares of the issuer or as a result of other relationships, such as the Fund and the issuer having the same investment manager. Transactions with issuers that were affiliates of the Fund at the end of the period were as follows:
| | | | | Net
change in
unrealized
gains
(losses) | | | Income
from
affiliated
securities |
| | | | | | | | |
| | | | | | | | |
| | | | | | | | |
Allspring Government Money Market Fund Select Class | | | | | | | | |
Investments in affiliates no longer held at end of period | | | | | | | | |
Securities Lending Cash Investments LLC | | | | | | | | |
| | | | | | | | |
| Non-income-earning security |
| Amount shown represents income before fees and rebates. |
The accompanying notes are an integral part of these financial statements.
12 | Allspring Emerging Markets Equity Fund
Statement of assets and liabilities—April 30, 2023 (unaudited)
Financial statements
Statement of assets and liabilities
| |
Investments in unaffiliated securities, at value (cost $3,181,620,195) | |
Investments in affiliated securities, at value (cost $172,989,272) | |
Foreign currency, at value (cost $9,083,902) | |
Cash collateral due to securities lending agent | |
Receivable for Fund shares sold | |
Receivable for investments sold | |
| |
Prepaid expenses and other assets | |
| |
| |
| |
Overdraft due to custodian bank | |
Payable for investments purchased | |
Payable for Fund shares redeemed | |
| |
Payable upon receipt of securities loaned | |
Administration fees payable | |
| |
Accrued expenses and other liabilities | |
| |
| |
| |
| |
Total distributable earnings | |
| |
The accompanying notes are an integral part of these financial statements.
Allspring Emerging Markets Equity Fund | 13
Statement of assets and liabilities—April 30, 2023 (unaudited)
Computation of net asset value and offering price per share | |
| |
Shares outstanding–Class A1 | |
Net asset value per share–Class A | |
Maximum offering price per share – Class A2 | |
| |
Shares outstanding–Class C1 | |
Net asset value per share–Class C | |
| |
Shares outstanding–Class R61 | |
Net asset value per share–Class R6 | |
Net assets–Administrator Class | |
Shares outstanding–Administrator Class1 | |
Net asset value per share–Administrator Class | |
Net assets–Institutional Class | |
Shares outstanding–Institutional Class1 | |
Net asset value per share–Institutional Class | |
| The Fund has an unlimited number of authorized shares. |
| Maximum offering price is computed as 100/94.25 of net asset value. On investments of $50,000 or more, the offering price is reduced. |
The accompanying notes are an integral part of these financial statements.
14 | Allspring Emerging Markets Equity Fund
Statement of operations—six months ended April 30, 2023 (unaudited)
Statement of operations
| |
Dividends (net of foreign withholdings taxes of $5,654,646) | |
Income from affiliated securities | |
Interest (net of foreign withholding taxes of $32) | |
| |
| |
| |
| |
| |
| |
| |
| |
| |
Shareholder servicing fees | |
| |
| |
| |
| |
| |
Custody and accounting fees | |
| |
| |
Shareholder report expenses | |
Trustees’ fees and expenses | |
| |
| |
Less: Fee waivers and/or expense reimbursements | |
| |
| |
| |
| |
| |
| |
Realized and unrealized gains (losses) on investments | |
Net realized gains (losses) on | |
| |
| |
Foreign currency and foreign currency translations | |
Net realized losses on investments | |
The accompanying notes are an integral part of these financial statements.
Allspring Emerging Markets Equity Fund | 15
Statement of operations—six months ended April 30, 2023 (unaudited)
Net change in unrealized gains (losses) on | |
Unaffiliated securities (net of deferred foreign capital gains tax refund of $(1,630,373)) | |
| |
Foreign currency and foreign currency translations | |
Net change in unrealized gains (losses) on investments | |
Net realized and unrealized gains (losses) on investments | |
Net increase in net assets resulting from operations | |
The accompanying notes are an integral part of these financial statements.
16 | Allspring Emerging Markets Equity Fund
Statement of changes in net assets
Statement of changes in net assets
| Six months ended
April 30, 2023
(unaudited) | Year ended
October 31, 2022 |
| | | | |
| | | | |
Net realized losses on investments | | | | |
Net change in unrealized gains (losses) on investments | | | | |
Net increase (decrease) in net assets resulting from operations | | | | |
Distributions to shareholders from | | | | |
Net investment income and net realized gains | | | | |
| | | | |
| | | | |
| | | | |
| | | | |
Total distributions to shareholders | | | | |
Capital share transactions | | | | |
Proceeds from shares sold | | | | |
| | | | |
| | | | |
| | | | |
| | | | |
| | | | |
| | | | |
Reinvestment of distributions | | | | |
| | | | |
| | | | |
| | | | |
| | | | |
| | | | |
Payment for shares redeemed | | | | |
| | | | |
| | | | |
| | | | |
| | | | |
| | | | |
| | | | |
Net decrease in net assets resulting from capital share transactions | | | | |
Total increase (decrease) in net assets | | | | |
| | | | |
| | | | |
| | | | |
The accompanying notes are an integral part of these financial statements.
Allspring Emerging Markets Equity Fund | 17
Financial highlights
(For a share outstanding throughout each period)
| Six months ended
April 30, 2023
(unaudited) | |
| | | | | |
Net asset value, beginning of period | | | | | | |
Net investment income (loss) | | | | | | |
| | | | | | |
Net realized and unrealized gains (losses) on investments | | | | | | |
Total from investment operations | | | | | | |
Distributions to shareholders from | | | | | | |
| | | | | | |
Net asset value, end of period | | | | | | |
| | | | | | |
Ratios to average net assets (annualized) | | | | | | |
| | | | | | |
| | | | | | |
Net investment income (loss) | | | | | | |
| | | | | | |
| | | | | | |
Net assets, end of period (000s omitted) | | | | | | |
| Calculated based upon average shares outstanding |
| Amount is less than $0.005. |
| Total return calculations do not include any sales charges. Returns for periods of less than one year are not annualized. |
| During the year ended October 31, 2020, the Fund received a payment from an affiliate that had an impact of less than 0.005% on total return. |
The accompanying notes are an integral part of these financial statements.
18 | Allspring Emerging Markets Equity Fund
(For a share outstanding throughout each period)
| Six months ended
April 30, 2023
(unaudited) | |
| | | | | |
Net asset value, beginning of period | | | | | | |
| | | | | | |
| | | | | | |
Net realized and unrealized gains (losses) on investments | | | | | | |
Total from investment operations | | | | | | |
Net asset value, end of period | | | | | | |
| | | | | | |
Ratios to average net assets (annualized) | | | | | | |
| | | | | | |
| | | | | | |
| | | | | | |
| | | | | | |
| | | | | | |
Net assets, end of period (000s omitted) | | | | | | |
| Calculated based upon average shares outstanding |
| Amount is more than $(0.005). |
| Total return calculations do not include any sales charges. Returns for periods of less than one year are not annualized. |
| During the year ended October 31, 2020, the Fund received a payment from an affiliate which had a 0.18% impact on the total return. |
The accompanying notes are an integral part of these financial statements.
Allspring Emerging Markets Equity Fund | 19
(For a share outstanding throughout each period)
| Six months ended
April 30, 2023
(unaudited) | |
| | | | | |
Net asset value, beginning of period | | | | | | |
| | | | | | |
Net realized and unrealized gains (losses) on investments | | | | | | |
Total from investment operations | | | | | | |
Distributions to shareholders from | | | | | | |
| | | | | | |
Net asset value, end of period | | | | | | |
| | | | | | |
Ratios to average net assets (annualized) | | | | | | |
| | | | | | |
| | | | | | |
| | | | | | |
| | | | | | |
| | | | | | |
Net assets, end of period (000s omitted) | | | | | | |
| Calculated based upon average shares outstanding |
| Returns for periods of less than one year are not annualized. |
The accompanying notes are an integral part of these financial statements.
20 | Allspring Emerging Markets Equity Fund
(For a share outstanding throughout each period)
| Six months ended
April 30, 2023
(unaudited) | |
| | | | | |
Net asset value, beginning of period | | | | | | |
Net investment income (loss) | | | | | | |
| | | | | | |
Net realized and unrealized gains (losses) on investments | | | | | | |
Total from investment operations | | | | | | |
Distributions to shareholders from | | | | | | |
| | | | | | |
Net asset value, end of period | | | | | | |
| | | | | | |
Ratios to average net assets (annualized) | | | | | | |
| | | | | | |
| | | | | | |
Net investment income (loss) | | | | | | |
| | | | | | |
| | | | | | |
Net assets, end of period (000s omitted) | | | | | | |
| Calculated based upon average shares outstanding |
| Returns for periods of less than one year are not annualized. |
| During the year ended October 31, 2022, the Fund received payments from a service provider which had a 0.04% impact on the total return. |
| During the year ended October 31, 2020, the Fund received a payment from an affiliate which had a 1.16% impact on the total return. |
The accompanying notes are an integral part of these financial statements.
Allspring Emerging Markets Equity Fund | 21
(For a share outstanding throughout each period)
| Six months ended
April 30, 2023
(unaudited) | |
| | | | | |
Net asset value, beginning of period | | | | | | |
| | | | | | |
Net realized and unrealized gains (losses) on investments | | | | | | |
Total from investment operations | | | | | | |
Distributions to shareholders from | | | | | | |
| | | | | | |
Net asset value, end of period | | | | | | |
| | | | | | |
Ratios to average net assets (annualized) | | | | | | |
| | | | | | |
| | | | | | |
| | | | | | |
| | | | | | |
| | | | | | |
Net assets, end of period (000s omitted) | | | | | | |
| Calculated based upon average shares outstanding |
| Returns for periods of less than one year are not annualized. |
The accompanying notes are an integral part of these financial statements.
22 | Allspring Emerging Markets Equity Fund
Notes to financial statements (unaudited)
Notes to financial statements
Allspring Funds Trust (the “Trust”), a Delaware statutory trust organized on March 10, 1999, is an open-end management investment company registered under the Investment Company Act of 1940, as amended (the “1940 Act”). As an investment company, the Trust follows the accounting and reporting guidance in Financial Accounting Standards Board (“FASB”) Accounting Standards Codification Topic 946, Financial Services – Investment Companies. These financial statements report on the Allspring Emerging Markets Equity Fund (the “Fund”) which is a diversified series of the Trust.
2.
SIGNIFICANT ACCOUNTING POLICIES
The following significant accounting policies, which are consistently followed in the preparation of the financial statements of the Fund, are in conformity with U.S. generally accepted accounting principles which require management to make estimates and assumptions that affect the reported amounts of assets and liabilities, disclosure of contingent assets and liabilities at the date of the financial statements, and the reported amounts of income and expenses during the reporting period. Actual results could differ from those estimates.
Securities valuation
All investments are valued each business day as of the close of regular trading on the New York Stock Exchange (generally 4 p.m. Eastern Time), although the Fund may deviate from this calculation time under unusual or unexpected circumstances.
Equity securities that are listed on a foreign or domestic exchange or market are valued at the official closing price or, if none, the last sales price.
The values of securities denominated in foreign currencies are translated into U.S. dollars at rates provided by an independent foreign currency pricing source at a time each business day specified by the Valuation Committee at Allspring Funds Management, LLC (“Allspring Funds Management”).
Many securities markets and exchanges outside the U.S. close prior to the close of the New York Stock Exchange and therefore may not fully reflect trading or events that occur after the close of the principal exchange in which the foreign securities are traded, but before the close of the New York Stock Exchange. If such trading or events are expected to materially affect the value of such securities, then fair value pricing procedures implemented by Allspring Funds Management are applied. These procedures take into account multiple factors including movements in U.S. securities markets after foreign exchanges close. Foreign securities that are fair valued under these procedures are categorized as Level 2 and the application of these procedures may result in transfers between Level 1 and Level 2. Depending on market activity, such fair valuations may be frequent. Such fair value pricing may result in net asset values that are higher or lower than net asset values based on the last reported sales price or latest quoted bid price. On April 30, 2023, such fair value pricing was used in pricing certain foreign securities.
Debt securities are valued at the evaluated bid price provided by an independent pricing service (e.g. taking into account various factors, including yields, maturities, or credit ratings) or, if a reliable price is not available, the quoted bid price from an independent broker-dealer.
Investments in registered open-end investment companies (other than those listed on a foreign or domestic exchange or market) are valued at net asset value.
Investments which are not valued using any of the methods discussed above are valued at their fair value, as determined in good faith by Allspring Funds Management, which was named the valuation designee by the Board of Trustees. As the valuation designee, Allspring Funds Management is responsible for day-to-day valuation activities for the Allspring Funds. In connection with these responsibilities, Allspring Funds Management has established a Valuation Committee and has delegated to it the authority to take any actions regarding the valuation of portfolio securities that the Valuation Committee deems necessary or appropriate, including determining the fair value of portfolio securities. On a quarterly basis, the Board of Trustees receives reports of valuation actions taken by the Valuation Committee. On at least an annual basis, the Board of Trustees receives an assessment of the adequacy and effectiveness of Allspring Funds Management’s process for determining the fair value of the portfolio of investments.
Foreign currency translation
The accounting records of the Fund are maintained in U.S. dollars. The values of other assets and liabilities denominated in foreign currencies are translated into U.S. dollars at rates provided by an independent foreign currency pricing source at a time each business day specified by the Valuation Committee. Purchases and sales of securities, and income and expenses are converted at the rate of exchange on the respective dates of such transactions. Net realized foreign exchange gains or losses arise from sales of foreign currencies, currency gains or losses realized between the trade and settlement dates on securities transactions, and the difference between the amounts of dividends, interest and foreign withholding taxes recorded and the U.S. dollar equivalent of the amounts actually paid or received. Net unrealized foreign exchange gains and losses arise from changes in the fair value of assets and liabilities other than investments in securities resulting from changes in exchange rates. The changes in net assets arising from changes in exchange rates of securities and the changes in net assets resulting from changes in market prices of securities are not separately presented. Such changes are included in net realized and unrealized gains or losses from investments.
Securities lending
During the period, the Fund participated in a program to lend its securities from time to time in order to earn additional income in the form of fees or interest on securities received as collateral or the investment of any cash received as collateral. When securities were on loan, the Fund received interest or dividends on those securities. Cash collateral received in connection with its securities lending transactions was invested in Securities Lending Cash
Allspring Emerging Markets Equity Fund | 23
Notes to financial statements (unaudited)
Investments, LLC (the “Securities Lending Fund”), an affiliated non-registered investment company. Interests in the non-registered investment company that were redeemable at net asset value were fair valued normally at net asset value. Effective at the close of business on March 29, 2023, the Fund is no longer participating in the securities lending program and the Securities Lending Fund was liquidated. Securities Lending Fund was managed by Allspring Funds Management and was subadvised by Allspring Global Investments, LLC (“Allspring Investments”), an affiliate of Allspring Funds Management and wholly owned subsidiary of Allspring Global Investments Holdings, LLC. Allspring Funds Management received an advisory fee starting at 0.05% and declining to 0.01% as the average daily net assets of the Securities Lending Fund increased. All of the fees received by Allspring Funds Management were paid to Allspring Investments for its services as subadviser.
Income earned from investment in the Securities Lending Fund (net of fees and rebates), if any, is included in income from affiliated securities on the Statement of Operations.
Security transactions and income recognition
Securities transactions are recorded on a trade date basis. Realized gains or losses are recorded on the basis of identified cost.
Dividend income is recognized on the ex-dividend date, except for certain dividends from foreign securities, which are recorded as soon as the custodian verifies the ex-dividend date.
Interest income is accrued daily and bond discounts are accreted and premiums are amortized daily. To the extent debt obligations are placed on non-accrual status, any related interest income may be reduced by writing off interest receivables when the collection of all or a portion of interest has been determined to be doubtful based on consistently applied procedures and the fair value has decreased. If the issuer subsequently resumes interest payments or when the collectability of interest is reasonably assured, the debt obligation is removed from non-accrual status.
Income is recorded net of foreign taxes withheld where recovery of such taxes is not assured.
Distributions to shareholders
Distributions to shareholders from net investment income and any net realized gains are recorded on the ex-dividend date and paid at least annually. Such distributions are determined in accordance with income tax regulations and may differ from U.S. generally accepted accounting principles. Dividend sources are estimated at the time of declaration. The tax character of distributions is determined as of the Fund’s fiscal year end. Therefore, a portion of the Fund’s distributions made prior to the Fund’s fiscal year end may be categorized as a tax return of capital at year end.
Federal and other taxes
The Fund intends to continue to qualify as a regulated investment company by distributing substantially all of its investment company taxable income and any net realized capital gains (after reduction for capital loss carryforwards) sufficient to relieve it from all, or substantially all, federal income taxes. Accordingly, no provision for federal income taxes was required.
The Fund’s income and federal excise tax returns and all financial records supporting those returns for the prior three fiscal years are subject to examination by the federal and Delaware revenue authorities. Management has analyzed the Fund’s tax positions taken on federal, state, and foreign tax returns, as applicable, for all open tax years and does not believe that there are any uncertain tax positions that require recognition of a tax liability.
As of April 30, 2023, the aggregate cost of all investments for federal income tax purposes was $3,404,110,188 and the unrealized gains (losses) consisted of:
As of October 31, 2022, the Fund had capital loss carryforwards which consisted of $75,756,203 in short-term capital losses and $79,352,659 in long-term capital losses.
Class allocations
The separate classes of shares offered by the Fund differ principally in applicable sales charges, distribution, shareholder servicing, and administration fees. Class specific expenses are charged directly to that share class. Investment income, common fund-level expenses, and realized and unrealized gains (losses) on investments are allocated daily to each class of shares based on the relative proportion of net assets of each class.
24 | Allspring Emerging Markets Equity Fund
Notes to financial statements (unaudited)
3.
FAIR VALUATION MEASUREMENTS
Fair value measurements of investments are determined within a framework that has established a fair value hierarchy based upon the various data inputs utilized in determining the value of the Fund’s investments. The three-level hierarchy gives the highest priority to unadjusted quoted prices in active markets for identical assets or liabilities (Level 1) and the lowest priority to unobservable inputs (Level 3). The Fund’s investments are classified within the fair value hierarchy based on the lowest level of input that is significant to the fair value measurement. The inputs are summarized into three broad levels as follows:
•Level 1—quoted prices in active markets for identical securities
•Level 2—other significant observable inputs (including quoted prices for similar securities, interest rates, prepayment speeds, credit risk, etc.)
•Level 3—significant unobservable inputs (including the Fund’s own assumptions in determining the fair value of investments)
The inputs or methodologies used for valuing investments in securities are not necessarily an indication of the risk associated with investing in those securities.
The following is a summary of the inputs used in valuing the Fund’s assets and liabilities as of April 30, 2023:
| | Other significant
observable inputs
(Level 2) | Significant
unobservable inputs
(Level 3) | |
| | | | |
| | | | |
| | | | |
| | | | |
| | | | |
| | | | |
| | | | |
| | | | |
| | | | |
| | | | |
| | | | |
| | | | |
| | | | |
| | | | |
| | | | |
| | | | |
| | | | |
| | | | |
| | | | |
| | | | |
| | | | |
| | | | |
| | | | |
| | | | |
| | | | |
| | | | |
| | | | |
Additional sector, industry or geographic detail, if any, is included in the Portfolio of Investments.
For the six months ended April 30, 2023, the Fund did not have any transfers into/out of Level 3.
4.
TRANSACTIONS WITH AFFILIATES
Management fee
Allspring Funds Management, a wholly owned subsidiary of Allspring Global Investments Holdings, LLC, a holding company indirectly owned by certain private funds of GTCR LLC and Reverence Capital Partners, L.P., is the manager of the Fund and provides advisory and fund-level administrative services under an investment management agreement. Under the investment management agreement, Allspring Funds Management is responsible for, among other services, implementing the investment objectives and strategies of the Fund, supervising the subadviser and providing fund-level administrative
Allspring Emerging Markets Equity Fund | 25
Notes to financial statements (unaudited)
services in connection with the Fund’s operations. As compensation for its services under the investment management agreement, Allspring Funds Management is entitled to receive a management fee at the following annual rate based on the Fund’s average daily net assets:
For the six months ended April 30, 2023, the management fee was equivalent to an annual rate of 1.02% of the Fund’s average daily net assets.
Allspring Funds Management has retained the services of a subadviser to provide daily portfolio management to the Fund. The fee for subadvisory services is borne by Allspring Funds Management. Allspring Investments is the subadviser to the Fund and is entitled to receive a fee from Allspring Funds Management at an annual rate starting at 0.65% and declining to 0.45% as the average daily net assets of the Fund increase.
Administration fees
Under a class-level administration agreement, Allspring Funds Management provides class-level administrative services to the Fund, which includes paying fees and expenses for services provided by the transfer agent, sub-transfer agents, omnibus account servicers and record-keepers. As compensation for its services under the class-level administration agreement, Allspring Funds Management receives an annual fee which is calculated based on the average daily net assets of each class as follows:
| Class-level
administration fee |
| |
| |
| |
| |
| |
Waivers and/or expense reimbursements
Allspring Funds Management has contractually committed to waive and/or reimburse management and administration fees to the extent necessary to maintain certain net operating expense ratios for the Fund. When each class of the Fund has exceeded its expense cap, Allspring Funds Management will waive fees and/or reimburse expenses from fund-level expenses on a proportionate basis and then from class specific expenses. When only certain classes exceed their expense caps, waivers and/or reimbursements are applied against class specific expenses before fund-level expenses. Allspring Funds Management has contractually committed through February 29, 2024 to waive fees and/or reimburse expenses to the extent necessary to cap expenses. Prior to or after the commitment expiration date, the caps may be increased or the commitment to maintain the caps may be terminated only with the approval of the Board of Trustees. As of April 30, 2023, the contractual expense caps are as follows:
Distribution fee
The Trust has adopted a distribution plan for Class C shares pursuant to Rule 12b-1 under the 1940 Act. A distribution fee is charged to Class C shares and paid to Allspring Funds Distributor, LLC (“Allspring Funds Distributor”), the principal underwriter, an affiliate of Allspring Funds Management, at an annual rate up to 0.75% of the average daily net assets of Class C shares.
In addition, Allspring Funds Distributor is entitled to receive the front-end sales charge from the purchase of Class A shares and a contingent deferred sales charge on the redemption of certain Class A shares. Allspring Funds Distributor is also entitled to receive the contingent deferred sales charges from redemptions of Class C shares. For the six months ended April 30, 2023, Allspring Funds Distributor received $878 from the sale of Class A shares. No contingent deferred sales charges were incurred by Class A and Class C shares for the six months ended April 30, 2023.
26 | Allspring Emerging Markets Equity Fund
Notes to financial statements (unaudited)
Shareholder servicing fees
The Trust has entered into contracts with one or more shareholder servicing agents, whereby Class A, Class C and Administrator Class are charged a fee at an annual rate up to 0.25% of the average daily net assets of each respective class. A portion of these total shareholder servicing fees were paid to affiliates of the Fund.
Interfund transactions
The Fund may purchase or sell portfolio investment securities to certain affiliates pursuant to Rule 17a-7 under the 1940 Act and under procedures adopted by the Board of Trustees. The procedures have been designed to ensure that these interfund transactions, which do not incur broker commissions, are effected at current market prices.
5.
INVESTMENT PORTFOLIO TRANSACTIONS
Purchases and sales of investments, excluding U.S. government obligations (if any) and short-term securities, for the six months ended April 30, 2023 were $41,359,457 and $233,283,393, respectively.
The Trust (excluding the money market funds), Allspring Master Trust and Allspring Variable Trust are parties to a $350,000,000 revolving credit agreement whereby the Fund is permitted to use bank borrowings for temporary or emergency purposes, such as to fund shareholder redemption requests. Interest under the credit agreement is charged to the Fund based on borrowing rate equal to the higher of the Federal Funds rate or the overnight bank funding rate in effect on that day plus a spread. In addition, an annual commitment fee based on the unused balance is allocated to each participating fund.
For the six months ended April 30, 2023, there were no borrowings by the Fund under the agreement.
As of the end of the period, the Fund concentrated its portfolio of investments in China and Hong Kong. A fund that invests a substantial portion of its assets in any country or geographic region will be more vulnerable than a fund that invests its assets more broadly to the economic, financial, political or other developments affecting that country or region. Such developments may have a significant impact on the Fund’s investment performance causing such performance to be more volatile than the investment performance of a more geographically diversified fund.
Russia launched a large-scale invasion of Ukraine on February 24, 2022. As a result of this military action, the United States and many other countries have instituted various economic sanctions against Russian and Belarus individuals and entities. The situation has led to increased financial market volatility and could have severe adverse effects on regional and global economic markets, including the markets for certain securities and commodities, such as oil and natural gas. The extent and duration of the military action, resulting sanctions imposed, other punitive action taken and the resulting market disruptions cannot be easily predicted. As of April 30, 2023, the Fund held 0.00% of its total net assets in Russian securities with unrealized losses in the amount of $84,677,095.
Under the Fund’s organizational documents, the officers and Trustees have been granted certain indemnification rights against certain liabilities that may arise out of performance of their duties to the Fund. The Fund has entered into a separate agreement with each Trustee that converts indemnification rights currently existing under the Fund’s organizational documents into contractual rights that cannot be changed in the future without the consent of the Trustee. Additionally, in the normal course of business, the Fund may enter into contracts with service providers that contain a variety of indemnification clauses. The Fund’s maximum exposure under these arrangements is dependent on future claims that may be made against the Fund and, therefore, cannot be estimated.
Allspring Emerging Markets Equity Fund | 27
Other information (unaudited)
Other information
Tax information
Pursuant to Section 853 of the Internal Revenue Code, the following amounts have been designated as foreign taxes paid for the fiscal year ended October 31, 2022. These amounts may be less than the actual foreign taxes paid for financial statement purposes. Foreign taxes paid or withheld should be included in taxable income with an offsetting deduction from gross income or as a credit for taxes paid to foreign governments. None of the income was derived from ineligible foreign sources as defined under Section 901(j) of the Internal Revenue Code.
Creditable
foreign taxes
paid | | Foreign
income as % of
ordinary income
distributions |
| | |
Proxy voting information
A description of the policies and procedures used to determine how to vote proxies relating to portfolio securities is available without charge, upon request, by calling 1-800-222-8222, visiting our website at allspringglobal.com, or visiting the SEC website at sec.gov. Information regarding how the proxies related to portfolio securities were voted during the most recent 12-month period ended June 30 is available on the website at allspringglobal.com or by visiting the SEC website at sec.gov.
Quarterly portfolio holdings information
The Fund files its complete schedule of portfolio holdings with the SEC for the first and third quarters of each fiscal year as an exhibit to its reports on Form N-PORT. Shareholders may view the filed Form N-PORT by visiting the SEC website at sec.gov.
28 | Allspring Emerging Markets Equity Fund
Other information (unaudited)
BOARD OF TRUSTEES AND OFFICERS
Each of the Trustees and Officers listed in the table below acts in identical capacities for each fund in the Allspring family of funds, which consists of 127 mutual funds comprising the Allspring Funds Trust, Allspring Variable Trust, Allspring Master Trust and four closed-end funds (collectively the “Fund Complex”). This table should be read in conjunction with the Prospectus and the Statement of Additional Information1. The mailing address of each Trustee and Officer is 1415 Vantage Park Drive, 3rd Floor, Charlotte, NC 28203. Each Trustee and Officer serves an indefinite term, however, each Trustee serves such term until reaching the mandatory retirement age established by the Trustees.
Independent Trustees
| | Principal occupations during past five years or longer | Current other
public company or
investment
company
directorships |
William R. Ebsworth
(Born 1957) | | Retired. From 1984 to 2013, equities analyst, portfolio manager, research director and chief investment officer at Fidelity Management and Research Company in Boston, Tokyo, and Hong Kong, and retired in 2013 as Chief Investment Officer of Fidelity Strategic Advisers, Inc. where he led a team of investment professionals managing client assets. Prior thereto, Board member of Hong Kong Securities Clearing Co., Hong Kong Options Clearing Corp., the Thailand International Fund, Ltd., Fidelity Investments Life Insurance Company, and Empire Fidelity Investments Life Insurance Company. Audit Committee Chair and Investment Committee Chair of the Vincent Memorial Hospital Foundation (non-profit organization). Mr. Ebsworth is a CFA charterholder. | |
Jane A. Freeman
(Born 1953) | Trustee,
since 2015;
Chair Liaison,
since 2018 | Retired. From 2012 to 2014 and 1999 to 2008, Chief Financial Officer of Scientific Learning Corporation. From 2008 to 2012, Ms. Freeman provided consulting services related to strategic business projects. Prior to 1999, Portfolio Manager at Rockefeller & Co. and Scudder, Stevens & Clark. Board member of the Harding Loevner Funds from 1996 to 2014, serving as both Lead Independent Director and chair of the Audit Committee. Board member of the Russell Exchange Traded Funds Trust from 2011 to 2012 and the chair of the Audit Committee. Ms. Freeman is also an inactive Chartered Financial Analyst. | |
Isaiah Harris, Jr.
(Born 1952) | Trustee,
since 2009;
Audit Committee Chair,
since 2019 | Retired. Member of the Advisory Board of CEF of East Central Florida. Chairman of the Board of CIGNA Corporation from 2009 to 2021, and Director from 2005 to 2008. From 2003 to 2011, Director of Deluxe Corporation. Prior thereto, President and CEO of BellSouth Advertising and Publishing Corp. from 2005 to 2007, President and CEO of BellSouth Enterprises from 2004 to 2005 and President of BellSouth Consumer Services from 2000 to 2003. Emeritus member of the Iowa State University Foundation Board of Governors. Emeritus Member of the Advisory Board of Iowa State University School of Business. Advisory Board Member, Palm Harbor Academy (private school). Advisory Board Member, Fellowship of Christian Athletes. Mr. Harris is a certified public accountant (inactive status). | |
David F. Larcker
(Born 1950) | | Distinguished Visiting Fellow at the Hoover Institution since 2022. James Irvin Miller Professor of Accounting at the Graduate School of Business (Emeritus), Stanford University, Director of the Corporate Governance Research Initiative and Senior Faculty of The Rock Center for Corporate Governance since 2006. From 2005 to 2008, Professor of Accounting at the Graduate School of Business, Stanford University. Prior thereto, Ernst & Young Professor of Accounting at The Wharton School, University of Pennsylvania from 1985 to 2005. | |
Olivia S. Mitchell
(Born 1953) | Trustee,
since 2006;
Nominating and Governance Committee Chair,
since 2018 | International Foundation of Employee Benefit Plans Professor since 1993, Wharton School of the University of Pennsylvania. Director of Wharton’s Pension Research Council and Boettner Center on Pensions & Retirement Research, and Research Associate at the National Bureau of Economic Research. Previously taught at Cornell University from 1978 to 1993. | |
Timothy J. Penny
(Born 1951) | Trustee,
since 1996;
Chair,
since 2018 | President and Chief Executive Officer of Southern Minnesota Initiative Foundation, a non-profit organization, since 2007. Vice Chair of the Economic Club of Minnesota, since 2007. Co-Chair of the Committee for a Responsible Federal Budget, since 1995. Member of the Board of Trustees of NorthStar Education Finance, Inc., a non-profit organization, from 2007-2022. Senior Fellow of the University of Minnesota Humphrey Institute from 1995 to 2017. | |
1
The Statement of Additional Information includes additional information about the Trustees and is available, without charge, upon request, by calling 1-800-222-8222 or by visiting the website at allspringglobal.com.
Allspring Emerging Markets Equity Fund | 29
Other information (unaudited)
| Position held and length of service* | Principal occupations during past five years or longer | Current other public company or investment company directorships |
James G. Polisson
(Born 1959) | | Retired. Chief Marketing Officer, Source (ETF) UK Services, Ltd, from 2015 to 2017. From 2012 to 2015, Principal of The Polisson Group, LLC, a management consulting, corporate advisory and principal investing company. Chief Executive Officer and Managing Director at Russell Investments, Global Exchange Traded Funds from 2010 to 2012. Managing Director of Barclays Global Investors from 1998 to 2010 and Global Chief Marketing Officer for iShares and Barclays Global Investors from 2000 to 2010. Trustee of the San Francisco Mechanics’ Institute, a non- profit organization, from 2013 to 2015. Board member of the Russell Exchange Traded Fund Trust from 2011 to 2012. Director of Barclays Global Investors Holdings Deutschland GmbH from 2006 to 2009. Mr. Polisson is an attorney and has a retired status with the Massachusetts and District of Columbia Bar Associations. | |
Pamela Wheelock
(Born 1959) | Trustee,
since January 2020;
previously Trustee from
January 2018 to
July 2019 | Retired. Executive and Senior Financial leadership positions in the public, private and nonprofit sectors. Interim President and CEO, McKnight Foundation, 2020. Interim Commissioner, Minnesota Department of Human Services, 2019. Chief Operating Officer, Twin Cities Habitat for Humanity, 2017-2019. Vice President for University Services, University of Minnesota, 2012- 2016. Interim President and CEO, Blue Cross and Blue Shield of Minnesota, 2011-2012. Executive Vice-President and Chief Financial Officer, Minnesota Wild, 2002-2008. Commissioner, Minnesota Department of Finance, 1999-2002. Chair of the Board of Directors of Destination Medical Center Corporation. Board member of the Minnesota Wild Foundation. | |
| Length of service dates reflect the Trustee’s commencement of service with the Trust’s predecessor entities, where applicable. |
30 | Allspring Emerging Markets Equity Fund
Other information (unaudited)
Officers1
| Position held and
length of service | Principal occupations during past five years or longer |
| | President and Chief Executive Officer of Allspring Funds Management, LLC since 2017 and Head of Global Fund Governance of Allspring Global Investments since 2022. Prior thereto, co-president of Galliard Capital Management, LLC, an affiliate of Allspring Funds Management, LLC, from 2019 to 2022 and Head of Affiliated Managers, Allspring Global Investments, from 2014 to 2019 and Executive Vice President responsible for marketing, investments and product development for Allspring Funds Management, LLC, from 2009 to 2014. |
Jeremy DePalma
(Born 1974) | Treasurer,
since 2012
(for certain funds in
the Fund Complex);
since 2021 (for
the remaining funds in the Fund Complex) | Senior Vice President of Allspring Funds Management, LLC since 2009. Senior Vice President of Evergreen Investment Management Company, LLC from 2008 to 2010 and head of the Fund Reporting and Control Team within Fund Administration from 2005 to 2010. |
Christopher Baker
(Born 1976) | Chief Compliance Officer,
since 2022 | Global Chief Compliance Officer for Allspring Global Investments since 2022. Prior thereto, Chief Compliance Officer for State Street Global Advisors from 2018 to 2021. Senior Compliance Officer for the State Street divisions of Alternative Investment Solutions, Sector Solutions, and Global Marketing from 2015 to 2018. From 2010 to 2015 Vice President, Global Head of Investment and Marketing Compliance for State Street Global Advisors. |
Matthew Prasse
(Born 1983) | Chief Legal Officer,
since 2022;
Secretary,
since 2021 | Senior Counsel of the Allspring Legal Department since 2021. Senior Counsel of the Wells Fargo Legal Department from 2018 to 2021. Previously, Counsel for Barings LLC from 2015 to 2018. Prior to joining Barings, Associate at Morgan, Lewis & Bockius LLP from 2008 to 2015. |
1 For those Officers with tenures at Allspring Global Investments and/or Allspring Funds Management, LLC that began prior to 2021, such tenures include years of service during which these businesses/entities were known as Wells Fargo Asset Management and Wells Fargo Funds Management, LLC, respectively.
Allspring Emerging Markets Equity Fund | 31
This page is intentionally left blank.
For more information
More information about Allspring Funds is available free upon request. To obtain literature, please write, visit the Fund’s website, or call:
Allspring Funds
P.O. Box 219967
Kansas City, MO 64121-9967
Website: allspringglobal.com
Individual investors: 1-800-222-8222
Retail investment professionals: 1-888-877-9275
Institutional investment professionals: 1-800-260-5969
This report and the financial statements contained herein are submitted for the general information of the shareholders of the Fund. If this report is used for promotional purposes, distribution of the report must be accompanied or preceded by a current prospectus. Before investing, please consider the investment objectives, risks, charges, and expenses of the investment. For a current prospectus and, if available, a summary prospectus, containing this information, call 1-800-222-8222 or visit the Fund’s website at allspringglobal.com. Read the prospectus carefully before you invest or send money.
Allspring Global InvestmentsTM is the trade name for the asset management firms of Allspring Global Investments Holdings, LLC, a holding company indirectly owned by certain private funds of GTCR LLC and Reverence Capital Partners, L.P. These firms include but are not limited to Allspring Global Investments, LLC, and Allspring Funds Management, LLC. Certain products managed by Allspring entities are distributed by Allspring Funds Distributor, LLC (a broker-dealer and Member FINRA/SIPC).
This material is for general informational and educational purposes only and is NOT intended to provide investment advice or a recommendation of any kind - including a recommendation for any specific investment, strategy, or plan.
© 2023 Allspring Global Investments Holdings, LLC. All rights reserved.
ALL-05052023-8egzfksk 06-23
SAR0663 04-23
Allspring Emerging Markets Equity Income Fund
Semi-Annual Report
April 30, 2023
The views expressed and any forward-looking statements are as of April 30, 2023, unless otherwise noted, and are those of the Fund’s portfolio managers and/or Allspring Global Investments. Discussions of individual securities or the markets generally are not intended as individual recommendations. Future events or results may vary significantly from those expressed in any forward-looking statements. The views expressed are subject to change at any time in response to changing circumstances in the market. Allspring Global Investments disclaims any obligation to publicly update or revise any views expressed or forward-looking statements.
Allspring Emerging Markets Equity Income Fund | 1
Letter to shareholders (unaudited)
Andrew Owen
President
Allspring Funds
Dear Shareholder:
We are pleased to offer you this semi-annual report for the Allspring Emerging Markets Equity Income Fund for the six-month period that ended April 30, 2023. Globally, stocks and bonds rebounded strongly despite ongoing volatility. While navigating persistently high inflation and the impact of ongoing aggressive central bank rate hikes, markets rallied on signs of declining inflation, anticipation of an end to the central bank monetary tightening cycle, and the stimulating impact of China removing its strict COVID-19 lockdowns in December. For the six-month period, domestic U.S. and global stocks and bonds had strong results. After suffering deep and broad losses through 2022, recent fixed income performance benefited from a base of higher yields that have the potential to generate higher income.
For the period, U.S. stocks, based on the S&P 500 Index,1 returned 8.63%. International stocks, as measured by the MSCI ACWI ex USA Index (Net),2 gained 20.65% while the MSCI EM Index (Net) (USD),3 returned 16.36%. Among bond indexes, the Bloomberg U.S. Aggregate Bond Index4 returned 6.91%, the Bloomberg Global Aggregate ex-USD Index (unhedged)5 gained 10.55%, the Bloomberg Municipal Bond Index6 gained 7.65%, and the ICE BofA U.S. High Yield Index7 returned 5.92%.
Despite high inflation and central bank rate hikes, markets rally.
Stocks and bonds rallied in November after earlier volatility. Economic news was encouraging, driven by U.S. labor market strength. Although central banks kept increasing rates, hopes rose for an easing in the pace of rate hikes and a possible end to central bank monetary tightening in 2023. Although inflation remained at record highs in the eurozone, we began to see signs of a possible decline in inflationary pressures as U.S. inflation moderated, with a 7.1% annual price rise in November and a monthly price increase of just 0.1%. China’s economic data remained weak, reflecting its zero-COVID-19 policy.
Financial markets cooled in December, with U.S. equities posting negative overall results in response to a weakening U.S. dollar. Fixed income securities ended one of their worst years ever, with flat overall monthly returns as markets weighed the hopes for an end to the monetary tightening cycle with the reality that central banks had not completed their jobs yet. U.S. Consumer Price Index (CPI)8 data showed a strong consistent trend downward, which brought down the 12-month CPI to 6.5% in December from 9.1% in June. Other countries and regions reported still-high but declining inflation rates as the year wound down.
1
The S&P 500 Index consists of 500 stocks chosen for market size, liquidity, and industry group representation. It is a market-value-weighted index with each stock’s weight in the index proportionate to its market value. You cannot invest directly in an index.
2
The Morgan Stanley Capital International (MSCI) All Country World Index (ACWI) ex USA Index (Net) is a free-float-adjusted market-capitalization-weighted index that is designed to measure the equity market performance of developed and emerging markets, excluding the U.S. Source: MSCI. MSCI makes no express or implied warranties or representations and shall have no liability whatsoever with respect to any MSCI data contained herein. The MSCI data may not be further redistributed or used as a basis for other indexes or any securities or financial products. This report is not approved, reviewed, or produced by MSCI. You cannot invest directly in an index.
3
The MSCI Emerging Markets (EM) Index (Net) (USD) is a free-float-adjusted market-capitalization-weighted index that is designed to measure the equity market performance of emerging markets. You cannot invest directly in an index.
4
The Bloomberg U.S. Aggregate Bond Index is a broad-based benchmark that measures the investment-grade, U.S.-dollar-denominated, fixed-rate taxable bond market, including Treasuries, government-related and corporate securities, mortgage-backed securities (agency fixed-rate and hybrid adjustable-rate mortgage pass-throughs), asset-backed securities, and commercial mortgage-backed securities. You cannot invest directly in an index.
5
The Bloomberg Global Aggregate ex-USD Index (unhedged) is an unmanaged index that provides a broad-based measure of the global investment-grade fixed-income markets excluding the U.S.-dollar-denominated debt market. You cannot invest directly in an index.
6
The Bloomberg Municipal Bond Index is an unmanaged index composed of long-term tax-exempt bonds with a minimum credit rating of Baa. You cannot invest directly in an index.
7
The ICE BofA U.S. High Yield Index is a market-capitalization-weighted index of domestic and Yankee high yield bonds. The index tracks the performance of high yield securities traded in the U.S. bond market. You cannot invest directly in an index. Copyright 2023. ICE Data Indices, LLC. All rights reserved.
8
The U.S. Consumer Price Index (CPI) is a measure of the average change over time in the prices paid by urban consumers for a market basket of consumer goods and services. You cannot invest directly in an index.
2 | Allspring Emerging Markets Equity Income Fund
Letter to shareholders (unaudited)
The year 2023 began with a rally across global equities and fixed income securities. Investor optimism rose in response to data indicating declining inflation rates and the reopening of China’s economy with the abrupt end to its zero-COVID-19 policy. The U.S. reported surprisingly strong job gains—employers added more than 500,000 jobs—and unemployment fell to 3.4%, the lowest level since 1969. Meanwhile, wage growth, seen as a potential contributor to ongoing high inflation, continued to moderate. All eyes remained fixed on the Federal Reserve (Fed) and on how many more rate hikes remain in this tightening cycle. The 0.25% federal funds rate hike announced in January was the Fed’s smallest rate increase since March 2022.
Financial markets declined in February as investors responded unfavorably to resilient economic data. The takeaway: Central banks will likely continue their monetary tightening cycle for longer than markets had priced in. In this environment—where strong economic data is seen as bad news—the resilient U.S. labor market was seen as a negative while the inflation rate has not been falling quickly enough for the Fed, which raised interest rates by 0.25% in early February. Meanwhile, the Bank of England and the European Central Bank both raised rates by 0.50%.
The collapse of Silicon Valley Bank in March, the second-largest banking failure in U.S. history, led to a classic bank run that spread to Europe where Switzerland’s Credit Suisse was taken over by its rival, UBS. The banking industry turmoil created an additional challenge for central banks in balancing inflationary concerns against potential economic weakening. Meanwhile, recent data pointed to economic strength in the U.S., Europe, and China. And China’s economy continued to rebound after the removal of its COVID-19 lockdown. Inflation rates in the U.S., the U.K., and Europe all remained higher than central bank targets, leading to additional rate hikes in March.
Economic data released in April pointed to global resilience, as Purchasing Managers Indexes1 in the U.S., U.K., and eurozone beat expectations and China reported first-quarter annualized economic growth of 4.5%. Despite banking industry stress, developed market stocks had monthly gains. The U.S. labor market remained strong, with a 3.5% jobless rate and monthly payroll gains above 200,000. However, uncertainty and inflationary concerns weighed on investors in the U.S. and abroad.
Don’t let short-term uncertainty derail long-term investment goals.
Periods of investment uncertainty can present challenges, but experience has taught us that maintaining long-term investment goals can be an effective way to plan for the future. To help you create a sound strategy based on your personal goals and risk tolerance, Allspring Funds offers more than 100 mutual funds spanning a wide range of asset classes and investment styles. Although diversification cannot guarantee an investment profit or prevent losses, we believe it can be an effective way to manage investment risk and potentially smooth out overall portfolio performance. We encourage investors to know their investments and to understand that appropriate levels of risk-taking may unlock opportunities.
Thank you for choosing to invest with Allspring Funds. We appreciate your confidence in us and remain committed to helping you meet your financial needs.
Sincerely,
Andrew Owen
President
Allspring Funds
“ The collapse of Silicon Valley Bank in March, the second-largest banking failure in U.S. history, led to a classic bank run that spread to Europe where Switzerland’s Credit Suisse was taken over by its rival, UBS. ”
For further information about your fund, contact your investment professional, visit our website at allspringglobal.com, or call us directly at 1-800-222-8222.
1
The Purchasing Managers Index (PMI) is an index of the prevailing direction of economic trends in the manufacturing and service sectors. You cannot invest directly in an index.
Allspring Emerging Markets Equity Income Fund | 3
Performance highlights (unaudited)
Performance highlights
| The Fund seeks to achieve long-term capital appreciation and current income. |
| Allspring Funds Management, LLC |
| Allspring Global Investments, LLC |
| Alison Shimada, Elaine Tse |
Average annual total returns (%) as of April 30, 2023 |
| | | | |
| | | | | | | | | |
| | | | | | | | | |
| | | | | | | | | |
| | | | | | | | | |
| | | | | | | | | |
Administrator Class (EQIDX) | | | | | | | | | |
Institutional Class (EQIIX) | | | | | | | | | |
MSCI EM Index (Net) (USD)5 | | | | | | | | | |
MSCI EM High Dividend Yield Index (Net) | | | | | | | | | |
Figures quoted represent past performance, which is no guarantee of future results, and do not reflect taxes that a shareholder may pay on an investment in a fund. Investment return and principal value of an investment will fluctuate so that an investor’s shares, when redeemed, may be worth more or less than their original cost. Performance shown without sales charges would be lower if sales charges were reflected. Current performance may be lower or higher than the performance data quoted, which assumes the reinvestment of dividends and capital gains. Current month-end performance is available on the Fund’s website, allspringglobal.com.
Index returns do not include transaction costs associated with buying and selling securities, any mutual fund fees or expenses, or any taxes. It is not possible to invest directly in an index.
For Class A shares, the maximum front-end sales charge is 5.75%. For Class C shares, the maximum contingent deferred sales charge is 1.00%. Performance including a contingent deferred sales charge assumes the sales charge for the corresponding time period. Class R, Class R6, Administrator Class and Institutional Class shares are sold without a front-end sales charge or contingent deferred sales charge.
|
| Reflects the expense ratios as stated in the most recent prospectuses. The expense ratios shown are subject to change and may differ from the annualized expense ratios shown in the financial highlights of this report. |
| The manager has contractually committed through February 29, 2024, to waive fees and/or reimburse expenses to the extent necessary to cap total annual fund operating expenses after fee waivers at 1.55% for Class A, 2.30% for Class C, 1.80% for Class R, 1.17% for Class R6, 1.45% for Administrator Class and 1.22% for Institutional Class. Brokerage commissions, stamp duty fees, interest, taxes, acquired fund fees and expenses (if any), and extraordinary expenses are excluded from the expense caps. Prior to or after the commitment expiration date, the caps may be increased or the commitment to maintain the caps may be terminated only with the approval of the Board of Trustees. Without these caps, the Fund’s returns would have been lower. The expense ratio paid by an investor is the net expense ratio (the total annual fund operating expenses after fee waivers) as stated in the prospectuses. |
| Historical performance shown for the Class R shares prior to their inception reflects the performance of the Administrator Class shares, adjusted to reflect the higher expenses applicable to the Class R shares. |
| Historical performance shown for the Class R6 shares prior to their inception reflects the performance of the Institutional Class shares, and includes the higher expenses applicable to the Institutional Class shares. If these expenses had not been included, returns for the Class R6 shares would be higher. |
| The Morgan Stanley Capital International (MSCI) Emerging Markets (EM) Index (Net) (USD) is a free-float-adjusted market-capitalization-weighted index that is designed to measure the equity market performance of emerging markets. Source: MSCI. MSCI makes no express or implied warranties or representations and shall have no liability whatsoever with respect to any MSCI data contained herein. The MSCI data may not be further redistributed or used as a basis for other indices or any securities or financial products. This report is not approved, reviewed, or produced by MSCI. You cannot invest directly in an index. |
| The MSCI EM High Dividend Yield Index (Net) (USD) is based on the MSCI EM Index (Net) (USD), its parent index, and includes large and mid-cap stocks. The index is designed to reflect the performance of equities in the parent index (excluding REITs) with higher dividend income and quality characteristics than average dividend yields that are both sustainable and persistent. The index also applies quality screens and reviews 12-month past performance to omit stocks with potentially deteriorating fundamentals that could force them to cut or reduce dividends. You cannot invest directly in an index. |
Stock values fluctuate in response to the activities of individual companies and general market and economic conditions. The Fund will indirectly be exposed to all of the risks of an investment in the underlying funds and will indirectly bear expenses of the underlying funds. The use of derivatives may reduce returns and/or increase volatility. Certain investment strategies tend to increase the total risk of an investment (relative to the broader market). This fund is exposed to alternative investment risk, foreign investment risk and smaller-company investment risk. Consult the Fund’s prospectus for additional information on these and other risks.
4 | Allspring Emerging Markets Equity Income Fund
Performance highlights (unaudited)
Ten largest holdings (%) as of April 30, 20231 |
Taiwan Semiconductor Manufacturing Co. Ltd. | |
| |
Alibaba Group Holding Ltd. | |
Samsung Electronics Co. Ltd. | |
Samsung Electronics Co. Ltd. | |
China Construction Bank Corp. Class H | |
| |
Midea Group Co. Ltd. Class A | |
| |
| |
| Figures represent the percentage of the Fund’s net assets. Holdings are subject to change and may have changed since the date specified. |
Sector allocation as of April 30, 20231 |
| Figures represent the percentage of the Fund’s long-term investments. These amounts are subject to change and may have changed since the date specified. |
Country allocation as of April 30, 20231 |
| Figures represent the percentage of the Fund’s long-term investments. These amounts are subject to change and may have changed since the date specified. |
Allspring Emerging Markets Equity Income Fund | 5
Fund expenses (unaudited)
Fund expenses
As a shareholder of the Fund, you incur two types of costs: (1) transaction costs, including sales charges (loads) on purchase payments and contingent deferred sales charges (if any) on redemptions and (2) ongoing costs, including management fees, distribution (12b-1) and/or shareholder servicing fees, and other Fund expenses. This example is intended to help you understand your ongoing costs (in dollars) of investing in the Fund and to compare these costs with the ongoing costs of investing in other mutual funds.
The example is based on an investment of $1,000 invested at the beginning of the six-month period and held for the entire period from November 1, 2022 to April 30, 2023.
Actual expenses
The “Actual” line of the table below provides information about actual account values and actual expenses. You may use the information in this line, together with the amount you invested, to estimate the expenses that you paid over the period. Simply divide your account value by $1,000 (for example, an $8,600 account value divided by $1,000 = 8.6), then multiply the result by the number in the “Actual” line under the heading entitled “Expenses paid during period” for your applicable class of shares to estimate the expenses you paid on your account during this period.
Hypothetical example for comparison purposes
The “Hypothetical” line of the table below provides information about hypothetical account values and hypothetical expenses based on the Fund’s actual expense ratio and an assumed rate of return of 5% per year before expenses, which is not the Fund’s actual return. The hypothetical account values and expenses may not be used to estimate the actual ending account balance or expenses you paid for the period. You may use this information to compare the ongoing costs of investing in the Fund and other funds. To do so, compare this 5% hypothetical example with the 5% hypothetical examples that appear in the shareholder reports of the other funds.
Please note that the expenses shown in the table are meant to highlight your ongoing costs only and do not reflect any transactional costs, such as sales charges (loads) and contingent deferred sales charges. Therefore, the “Hypothetical” line of the table is useful in comparing ongoing costs only, and will not help you determine the relative total costs of owning different funds. In addition, if these transactional costs were included, your costs would have been higher.
| Beginning
account value
11-1-2022 | Ending
account value
4-30-2023 | | Annualized net
expense ratio |
| | | | |
| | | | |
Hypothetical (5% return before expenses) | | | | |
| | | | |
| | | | |
Hypothetical (5% return before expenses) | | | | |
| | | | |
| | | | |
Hypothetical (5% return before expenses) | | | | |
| | | | |
| | | | |
Hypothetical (5% return before expenses) | | | | |
| | | | |
| | | | |
Hypothetical (5% return before expenses) | | | | |
| | | | |
| | | | |
Hypothetical (5% return before expenses) | | | | |
1 Expenses paid is equal to the annualized net expense ratio of each class multiplied by the average account value over the period, multiplied by 181 divided by 365 (to reflect the one-half-year period).
6 | Allspring Emerging Markets Equity Income Fund
Portfolio of investments—April 30, 2023 (unaudited)
| | | | | |
| | | | | | |
| | | | | | |
Ambev SA (Consumer staples, Beverages) | | | | | | |
B3 SA - Brasil Bolsa Balcao (Financials, Capital markets) | | | | | | |
Banco BTG Pactual SA (Financials, Capital markets) | | | | | | |
Cia Brasileira de Aluminio (Materials, Metals & mining) | | | | | | |
Embraer SA ADR (Industrials, Aerospace & defense) † | | | | | | |
Petroleo Brasileiro SA ADR (Energy, Oil, gas & consumable fuels) | | | | | | |
Vale SA (Materials, Metals & mining) | | | | | | |
| | | | | | |
| | | | | | |
Cencosud SA (Consumer staples, Consumer staples distribution & retail) † | | | | | | |
Sociedad Quimica y Minera de Chile SA ADR (Materials, Chemicals) | | | | | | |
| | | | | | |
| | | | | | |
Alibaba Group Holding Ltd. (Consumer discretionary, Broadline retail) † | | | | | | |
Baidu, Inc. Class A (Communication services, Interactive media & services) † | | | | | | |
Baoshan Iron & Steel Co. Ltd. Class A (Materials, Metals & mining) † | | | | | | |
China Communications Services Corp. Ltd. Class H (Industrials, Construction & engineering) † | | | | | | |
China Construction Bank Corp. Class H (Financials, Banks) † | | | | | | |
China Feihe Ltd. (Consumer staples, Food products) 144A | | | | | | |
China International Capital Corp. Ltd. Class H (Financials, Capital markets) 144A† | | | | | | |
China Resources Land Ltd. (Real estate, Real estate management & development) | | | | | | |
China State Construction International Holdings Ltd. (Industrials, Construction & engineering) | | | | | | |
China Tower Corp. Ltd. Class H (Communication services, Diversified telecommunication services) 144A† | | | | | | |
China Vanke Co. Ltd. Class H (Real estate, Real estate management & development) † | | | | | | |
China Yongda Automobiles Services Holdings Ltd. (Consumer discretionary, Specialty retail) † | | | | | | |
Chow Tai Fook Jewellery Group Ltd. (Consumer discretionary, Specialty retail) | | | | | | |
Country Garden Services Holdings Co. Ltd. (Real estate, Real estate management & development) † | | | | | | |
ENN Energy Holdings Ltd. (Utilities, Gas utilities) | | | | | | |
Ganfeng Lithium Group Co. Ltd. Class H (Materials, Chemicals) 144A† | | | | | | |
Hengli Petrochemical Co. Ltd. Class A (Materials, Chemicals) † | | | | | | |
Industrial & Commercial Bank of China Ltd. Class H (Financials, Banks) † | | | | | | |
Inner Mongolia Yili Industrial Group Co. Ltd. Class A (Consumer staples, Food products) † | | | | | | |
JD.com, Inc. Class A (Consumer discretionary, Broadline retail) | | | | | | |
Meituan Class B (Consumer discretionary, Hotels, restaurants & leisure) 144A† | | | | | | |
Midea Group Co. Ltd. Class A (Consumer discretionary, Household durables) | | | | | | |
Ping An Insurance Group Co. of China Ltd. Class H (Financials, Insurance) | | | | | | |
Qifu Technology, Inc. ADR (Financials, Consumer finance) | | | | | | |
Sinopharm Group Co. Ltd. Class H (Health care, Health care providers & services) † | | | | | | |
Tencent Holdings Ltd. (Communication services, Interactive media & services) † | | | | | | |
The accompanying notes are an integral part of these financial statements.
Allspring Emerging Markets Equity Income Fund | 7
Portfolio of investments—April 30, 2023 (unaudited)
| | | | | |
| | | | | | |
Tingyi Cayman Islands Holding Corp. (Consumer staples, Food products) † | | | | | | |
Zhejiang NHU Co. Ltd. Class A (Health care, Pharmaceuticals) † | | | | | | |
Zoomlion Heavy Industry Science & Technology Co. Ltd. Class H (Industrials, Machinery) † | | | | | | |
| | | | | | |
| | | | | | |
Ecopetrol SA ADR (Energy, Oil, gas & consumable fuels) | | | | | | |
| | | | | | |
National Bank of Greece SA (Financials, Banks) † | | | | | | |
| | | | | | |
ASMPT Ltd. (Information technology, Semiconductors & semiconductor equipment) | | | | | | |
CSPC Pharmaceutical Group Ltd. (Health care, Pharmaceuticals) | | | | | | |
| | | | | | |
| | | | | | |
Bajaj Auto Ltd. (Consumer discretionary, Automobiles) | | | | | | |
Embassy Office Parks REIT (Real estate, Office REITs) | | | | | | |
GAIL India Ltd. (Utilities, Gas utilities) | | | | | | |
Indus Towers Ltd. (Communication services, Diversified telecommunication services) | | | | | | |
Infosys Ltd. (Information technology, IT services) | | | | | | |
LIC Housing Finance Ltd. (Financials, Financial services) | | | | | | |
Mahanagar Gas Ltd. (Utilities, Gas utilities) | | | | | | |
NHPC Ltd. (Utilities, Independent power and renewable electricity producers) | | | | | | |
Power Grid Corp. of India Ltd. (Utilities, Electric utilities) | | | | | | |
| | | | | | |
| | | | | | |
Bank Mandiri Persero Tbk PT (Financials, Banks) | | | | | | |
Bank Negara Indonesia Persero Tbk PT (Financials, Banks) | | | | | | |
Telkom Indonesia Persero Tbk PT (Communication services, Diversified telecommunication services) | | | | | | |
| | | | | | |
| | | | | | |
PRADA SpA (Consumer discretionary, Textiles, apparel & luxury goods) † | | | | | | |
| | | | | | |
Petronas Chemicals Group Bhd (Materials, Chemicals) | | | | | | |
RHB Bank Bhd (Financials, Banks) | | | | | | |
| | | | | | |
| | | | | | |
America Movil SAB de CV ADR (Communication services, Wireless telecommunication services) | | | | | | |
Grupo Bimbo SAB de CV Class A (Consumer staples, Food products) | | | | | | |
The accompanying notes are an integral part of these financial statements.
8 | Allspring Emerging Markets Equity Income Fund
Portfolio of investments—April 30, 2023 (unaudited)
| | | | | |
| | | | | | |
Grupo Financiero Banorte SAB de CV Class O (Financials, Banks) | | | | | | |
Wal-Mart de Mexico SAB de CV (Consumer staples, Consumer staples distribution & retail) | | | | | | |
| | | | | | |
| | | | | | |
Copa Holdings SA Class A (Industrials, Passenger airlines) | | | | | | |
| | | | | | |
Credicorp Ltd. (Financials, Banks) | | | | | | |
| | | | | | |
Bank of the Philippine Islands (Financials, Banks) | | | | | | |
| | | | | | |
Bank Polska Kasa Opieki SA (Financials, Banks) † | | | | | | |
| | | | | | |
Industries Qatar QSC (Industrials, Industrial conglomerates) | | | | | | |
| | | | | | |
Alrosa PJSC (Acquired 5-6-2021, cost $1,726,284) (Materials, Metals & mining) ♦†˃ | | | | | | |
Magnit PJSC (Acquired 4-29-2013, cost $1,919,054) (Consumer staples, Consumer staples distribution & retail) ♦†˃ | | | | | | |
| | | | | | |
| | | | | | |
Al Rajhi Bank (Financials, Banks) | | | | | | |
Alinma Bank (Financials, Banks) | | | | | | |
Arabian Drilling Co. (Energy, Energy equipment & services) † | | | | | | |
Saudi Telecom Co. (Communication services, Diversified telecommunication services) | | | | | | |
| | | | | | |
| | | | | | |
BOC Aviation Ltd. (Industrials, Trading companies & distributors) 144A | | | | | | |
| | | | | | |
Absa Group Ltd. (Financials, Banks) | | | | | | |
Bidvest Group Ltd. (Industrials, Industrial conglomerates) | | | | | | |
Gold Fields Ltd. ADR (Materials, Metals & mining) | | | | | | |
Sanlam Ltd. (Financials, Insurance) | | | | | | |
Standard Bank Group Ltd. (Financials, Banks) | | | | | | |
| | | | | | |
| | | | | | |
Doosan Bobcat, Inc. (Industrials, Machinery) | | | | | | |
Hana Financial Group, Inc. (Financials, Banks) | | | | | | |
KB Financial Group, Inc. (Financials, Banks) | | | | | | |
Kia Corp. (Consumer discretionary, Automobiles) | | | | | | |
The accompanying notes are an integral part of these financial statements.
Allspring Emerging Markets Equity Income Fund | 9
Portfolio of investments—April 30, 2023 (unaudited)
| | | | | |
| | | | | | |
Samsung Electronics Co. Ltd. (Information technology, Technology hardware, storage & peripherals) | | | | | | |
SK Telecom Co. Ltd. (Communication services, Wireless telecommunication services) | | | | | | |
| | | | | | |
| | | | | | |
Advantech Co. Ltd. (Information technology, Technology hardware, storage & peripherals) † | | | | | | |
Cathay Financial Holding Co. Ltd. (Financials, Insurance) † | | | | | | |
Chroma ATE, Inc. (Information technology, Electronic equipment, instruments & components) † | | | | | | |
E Ink Holdings, Inc. (Information technology, Electronic equipment, instruments & components) † | | | | | | |
Formosa Plastics Corp. (Materials, Chemicals) † | | | | | | |
Hon Hai Precision Industry Co. Ltd. (Information technology, Electronic equipment, instruments & components) † | | | | | | |
MediaTek, Inc. (Information technology, Semiconductors & semiconductor equipment) † | | | | | | |
Poya International Co. Ltd. (Consumer discretionary, Broadline retail) † | | | | | | |
Realtek Semiconductor Corp. (Information technology, Semiconductors & semiconductor equipment) † | | | | | | |
Taiwan Semiconductor Manufacturing Co. Ltd. (Information technology, Semiconductors & semiconductor equipment) | | | | | | |
Vanguard International Semiconductor Corp. (Information technology, Semiconductors & semiconductor equipment) † | | | | | | |
| | | | | | |
| | | | | | |
Bangkok Bank PCL (Financials, Banks) | | | | | | |
Thai Beverage PCL (Consumer staples, Beverages) | | | | | | |
Tisco Financial Group PCL (Financials, Banks) | | | | | | |
| | | | | | |
United Arab Emirates: 0.82% | | | | | | |
Aldar Properties PJSC (Real estate, Real estate management & development) | | | | | | |
| | | | | | |
Anglo American PLC (Materials, Metals & mining) | | | | | | |
| | | | | | |
Southern Copper Corp. (Materials, Metals & mining) | | | | | | |
Yum China Holdings, Inc. (Consumer discretionary, Hotels, restaurants & leisure) | | | | | | |
| | | | | | |
Total common stocks (Cost $266,399,437) | | | | | | |
The accompanying notes are an integral part of these financial statements.
10 | Allspring Emerging Markets Equity Income Fund
Portfolio of investments—April 30, 2023 (unaudited)
| | | | | |
| | | | | | |
| | | | | | |
Itau Unibanco Holding SA (Financials, Banks) | | | | | | |
| | | | | | |
LG Chem Ltd. (Materials, Chemicals) | | | | | | |
Samsung Electronics Co. Ltd. (Information technology, Technology hardware, storage & peripherals) | | | | | | |
| | | | | | |
Total preferred stocks (Cost $16,089,445) | | | | | | |
| | | | | |
Short-term investments: 2.02% | | | | | | |
Investment companies: 2.02% | | | | | | |
Allspring Government Money Market Fund Select Class ♠∞ | | | | | | |
Total short-term investments (Cost $6,473,870) | | | | | | |
Total investments in securities (Cost $288,962,752) | | | | | | |
Other assets and liabilities, net | | | | | | |
| | | | | | |
| Non-income-earning security |
| The security may be resold in transactions exempt from registration, normally to qualified institutional buyers, pursuant to Rule 144A under the Securities Act of 1933. |
| The security is fair valued in accordance with Allspring Funds Management’s valuation procedures, as the Board-designated valuation designee. |
| Restricted security as to resale, excluding Rule 144A securities. The Fund held restricted securities with an aggregate current value of $0 (original aggregate cost of $3,645,338), representing 0.00% of its net assets as of period end. |
| The issuer of the security is an affiliated person of the Fund as defined in the Investment Company Act of 1940. |
| The rate represents the 7-day annualized yield at period end. |
|
| American depositary receipt |
| Real estate investment trust |
Investments in affiliates
An affiliated investment is an investment in which the Fund owns at least 5% of the outstanding voting shares of the issuer or as a result of other relationships, such as the Fund and the issuer having the same investment manager. Transactions with issuers that were affiliates of the Fund at the end of the period were as follows:
| | | | | Net
change in
unrealized
gains
(losses) | | | Income
from
affiliated
securities |
| | | | | | | | |
Allspring Government Money Market Fund Select Class | | | | | | | | |
The accompanying notes are an integral part of these financial statements.
Allspring Emerging Markets Equity Income Fund | 11
Statement of assets and liabilities—April 30, 2023 (unaudited)
Financial statements
Statement of assets and liabilities
| |
Investments in unaffiliated securities, at value (cost $282,488,882) | |
Investments in affiliated securities, at value (cost $6,473,870) | |
| |
Foreign currency, at value (cost $2,672,751) | |
Receivable for investments sold | |
| |
Receivable for Fund shares sold | |
Prepaid expenses and other assets | |
| |
| |
Payable for investments purchased | |
Payable for Fund shares redeemed | |
| |
Administration fees payable | |
Distribution fees payable | |
Trustees’ fees and expenses payable | |
Accrued expenses and other liabilities | |
| |
| |
| |
| |
| |
| |
The accompanying notes are an integral part of these financial statements.
12 | Allspring Emerging Markets Equity Income Fund
Statement of assets and liabilities—April 30, 2023 (unaudited)
Computation of net asset value and offering price per share | |
| |
Shares outstanding–Class A1 | |
Net asset value per share–Class A | |
Maximum offering price per share – Class A2 | |
| |
Shares outstanding–Class C1 | |
Net asset value per share–Class C | |
| |
Shares outstanding–Class R1 | |
Net asset value per share–Class R | |
| |
Shares outstanding–Class R61 | |
Net asset value per share–Class R6 | |
Net assets–Administrator Class | |
Shares outstanding–Administrator Class1 | |
Net asset value per share–Administrator Class | |
Net assets–Institutional Class | |
Shares outstanding–Institutional Class1 | |
Net asset value per share–Institutional Class | |
| The Fund has an unlimited number of authorized shares. |
| Maximum offering price is computed as 100/94.25 of net asset value. On investments of $50,000 or more, the offering price is reduced. |
The accompanying notes are an integral part of these financial statements.
Allspring Emerging Markets Equity Income Fund | 13
Statement of operations—six months ended April 30, 2023 (unaudited)
Statement of operations
| |
Dividends (net of foreign withholdings taxes of $568,197) | |
Income from non-cash dividends | |
Income from affiliated securities | |
Interest (net of foreign withholding taxes of $3) | |
| |
| |
| |
| |
| |
| |
| |
| |
| |
| |
Shareholder servicing fees | |
| |
| |
| |
| |
| |
| |
| |
Custody and accounting fees | |
| |
| |
Shareholder report expenses | |
Trustees’ fees and expenses | |
| |
| |
Less: Fee waivers and/or expense reimbursements | |
| |
| |
| |
| |
| |
| |
| |
| |
Realized and unrealized gains (losses) on investments | |
| |
| |
Foreign currency and foreign currency translations | |
Net realized losses on investments | |
The accompanying notes are an integral part of these financial statements.
14 | Allspring Emerging Markets Equity Income Fund
Statement of operations—six months ended April 30, 2023 (unaudited)
Net change in unrealized gains (losses) on | |
Unaffiliated securities (net of deferred foreign capital gains tax of $25,237) | |
Foreign currency and foreign currency translations | |
Net change in unrealized gains (losses) on investments | |
Net realized and unrealized gains (losses) on investments | |
Net increase in net assets resulting from operations | |
The accompanying notes are an integral part of these financial statements.
Allspring Emerging Markets Equity Income Fund | 15
Statement of changes in net assets
Statement of changes in net assets
| Six months ended
April 30, 2023
(unaudited) | Year ended
October 31, 2022 |
| | | | |
| | | | |
Net realized losses on investments | | | | |
Net change in unrealized gains (losses) on investments | | | | |
Net increase (decrease) in net assets resulting from operations | | | | |
Distributions to shareholders from | | | | |
Net investment income and net realized gains | | | | |
| | | | |
| | | | |
| | | | |
| | | | |
| | | | |
| | | | |
Total distributions to shareholders | | | | |
Capital share transactions | | | | |
Proceeds from shares sold | | | | |
| | | | |
| | | | |
| | | | |
| | | | |
| | | | |
| | | | |
| | | | |
Reinvestment of distributions | | | | |
| | | | |
| | | | |
| | | | |
| | | | |
| | | | |
| | | | |
| | | | |
Payment for shares redeemed | | | | |
| | | | |
| | | | |
| | | | |
| | | | |
| | | | |
| | | | |
| | | | |
Net increase (decrease) in net assets resulting from capital share transactions | | | | |
Total increase (decrease) in net assets | | | | |
| | | | |
| | | | |
| | | | |
The accompanying notes are an integral part of these financial statements.
16 | Allspring Emerging Markets Equity Income Fund
Financial highlights
(For a share outstanding throughout each period)
| Six months ended
April 30, 2023
(unaudited) | |
| | | | | |
Net asset value, beginning of period | | | | | | |
| | | | | | |
Net realized and unrealized gains (losses) on investments | | | | | | |
Total from investment operations | | | | | | |
Distributions to shareholders from | | | | | | |
| | | | | | |
Net asset value, end of period | | | | | | |
| | | | | | |
Ratios to average net assets (annualized) | | | | | | |
| | | | | | |
| | | | | | |
| | | | | | |
| | | | | | |
| | | | | | |
Net assets, end of period (000s omitted) | | | | | | |
| Calculated based upon average shares outstanding |
| Total return calculations do not include any sales charges. Returns for periods of less than one year are not annualized. |
The accompanying notes are an integral part of these financial statements.
Allspring Emerging Markets Equity Income Fund | 17
(For a share outstanding throughout each period)
| Six months ended
April 30, 2023
(unaudited) | |
| | | | | |
Net asset value, beginning of period | | | | | | |
| | | | | | |
Net realized and unrealized gains (losses) on investments | | | | | | |
Total from investment operations | | | | | | |
Distributions to shareholders from | | | | | | |
| | | | | | |
Net asset value, end of period | | | | | | |
| | | | | | |
Ratios to average net assets (annualized) | | | | | | |
| | | | | | |
| | | | | | |
| | | | | | |
| | | | | | |
| | | | | | |
Net assets, end of period (000s omitted) | | | | | | |
| Calculated based upon average shares outstanding |
| Total return calculations do not include any sales charges. Returns for periods of less than one year are not annualized. |
The accompanying notes are an integral part of these financial statements.
18 | Allspring Emerging Markets Equity Income Fund
(For a share outstanding throughout each period)
| Six months ended
April 30, 2023
(unaudited) | |
| | | | | |
Net asset value, beginning of period | | | | | | |
| | | | | | |
| | | | | | |
Net realized and unrealized gains (losses) on investments | | | | | | |
Total from investment operations | | | | | | |
Distributions to shareholders from | | | | | | |
| | | | | | |
Net asset value, end of period | | | | | | |
| | | | | | |
Ratios to average net assets (annualized) | | | | | | |
| | | | | | |
| | | | | | |
| | | | | | |
| | | | | | |
| | | | | | |
Net assets, end of period (000s omitted) | | | | | | |
| Calculated based upon average shares outstanding |
| Returns for periods of less than one year are not annualized. |
| During the year ended October 31, 2020, the Fund received a payment froman affiliate which had a 0.29% impact on the total return. |
The accompanying notes are an integral part of these financial statements.
Allspring Emerging Markets Equity Income Fund | 19
(For a share outstanding throughout each period)
| Six months ended
April 30, 2023
(unaudited) | |
| | | | | |
Net asset value, beginning of period | | | | | | |
| | | | | | |
Net realized and unrealized gains (losses) on investments | | | | | | |
Total from investment operations | | | | | | |
Distributions to shareholders from | | | | | | |
| | | | | | |
Net asset value, end of period | | | | | | |
| | | | | | |
Ratios to average net assets (annualized) | | | | | | |
| | | | | | |
| | | | | | |
| | | | | | |
| | | | | | |
| | | | | | |
Net assets, end of period (000s omitted) | | | | | | |
| Calculated based upon average shares outstanding |
| Returns for periods of less than one year are not annualized. |
The accompanying notes are an integral part of these financial statements.
20 | Allspring Emerging Markets Equity Income Fund
(For a share outstanding throughout each period)
| Six months ended
April 30, 2023
(unaudited) | |
| | | | | |
Net asset value, beginning of period | | | | | | |
| | | | | | |
Net realized and unrealized gains (losses) on investments | | | | | | |
Total from investment operations | | | | | | |
Distributions to shareholders from | | | | | | |
| | | | | | |
Net asset value, end of period | | | | | | |
| | | | | | |
Ratios to average net assets (annualized) | | | | | | |
| | | | | | |
| | | | | | |
| | | | | | |
| | | | | | |
| | | | | | |
Net assets, end of period (000s omitted) | | | | | | |
| Calculated based upon average shares outstanding |
| Returns for periods of less than one year are not annualized. |
The accompanying notes are an integral part of these financial statements.
Allspring Emerging Markets Equity Income Fund | 21
(For a share outstanding throughout each period)
| Six months ended
April 30, 2023
(unaudited) | |
| | | | | |
Net asset value, beginning of period | | | | | | |
| | | | | | |
Net realized and unrealized gains (losses) on investments | | | | | | |
Total from investment operations | | | | | | |
Distributions to shareholders from | | | | | | |
| | | | | | |
Net asset value, end of period | | | | | | |
| | | | | | |
Ratios to average net assets (annualized) | | | | | | |
| | | | | | |
| | | | | | |
| | | | | | |
| | | | | | |
| | | | | | |
Net assets, end of period (000s omitted) | | | | | | |
| Calculated based upon average shares outstanding |
| Returns for periods of less than one year are not annualized. |
The accompanying notes are an integral part of these financial statements.
22 | Allspring Emerging Markets Equity Income Fund
Notes to financial statements (unaudited)
Notes to financial statements
Allspring Funds Trust (the “Trust”), a Delaware statutory trust organized on March 10, 1999, is an open-end management investment company registered under the Investment Company Act of 1940, as amended (the “1940 Act”). As an investment company, the Trust follows the accounting and reporting guidance in Financial Accounting Standards Board (“FASB”) Accounting Standards Codification Topic 946, Financial Services – Investment Companies. These financial statements report on the Allspring Emerging Markets Equity Income Fund (the “Fund”) which is a diversified series of the Trust.
2.
SIGNIFICANT ACCOUNTING POLICIES
The following significant accounting policies, which are consistently followed in the preparation of the financial statements of the Fund, are in conformity with U.S. generally accepted accounting principles which require management to make estimates and assumptions that affect the reported amounts of assets and liabilities, disclosure of contingent assets and liabilities at the date of the financial statements, and the reported amounts of income and expenses during the reporting period. Actual results could differ from those estimates.
Securities valuation
All investments are valued each business day as of the close of regular trading on the New York Stock Exchange (generally 4 p.m. Eastern Time), although the Funds may deviate from this calculation time under unusual or unexpected circumstances.
Equity securities that are listed on a foreign or domestic exchange or market are valued at the official closing price or, if none, the last sales price.
The values of securities denominated in foreign currencies are translated into U.S. dollars at rates provided by an independent foreign currency pricing source at a time each business day specified by the Valuation Committee at Allspring Funds Management, LLC (“Allspring Funds Management”).
Many securities markets and exchanges outside the U.S. close prior to the close of the New York Stock Exchange and therefore may not fully reflect trading or events that occur after the close of the principal exchange in which the foreign securities are traded, but before the close of the New York Stock Exchange. If such trading or events are expected to materially affect the value of such securities, then fair value pricing procedures implemented by Allspring Funds Management are applied. These procedures take into account multiple factors including movements in U.S. securities markets after foreign exchanges close. Foreign securities that are fair valued under these procedures are categorized as Level 2 and the application of these procedures may result in transfers between Level 1 and Level 2. Depending on market activity, such fair valuations may be frequent. Such fair value pricing may result in net asset values that are higher or lower than net asset values based on the last reported sales price or latest quoted bid price. On April 30, 2023, such fair value pricing was used in pricing certain foreign securities.
Investments in registered open-end investment companies (other than those listed on a foreign or domestic exchange or market) are valued at net asset value.
Investments which are not valued using any of the methods discussed above are valued at their fair value, as determined in good faith by Allspring Funds Management, which was named the valuation designee by the Board of Trustees. As the valuation designee, Allspring Funds Management is responsible for day-to-day valuation activities for the Allspring Funds. In connection with these responsibilities, Allspring Funds Management has established a Valuation Committee and has delegated to it the authority to take any actions regarding the valuation of portfolio securities that the Valuation Committee deems necessary or appropriate, including determining the fair value of portfolio securities.On a quarterly basis, the Board of Trustees receives reports of valuation actions taken by the Valuation Committee. On at least an annual basis, the Board of Trustees receives an assessment of the adequacy and effectiveness of Allspring Funds Management’s process for determining the fair value of the portfolio of investments.
Foreign currency translation
The accounting records of the Fund are maintained in U.S. dollars. The values of other assets and liabilities denominated in foreign currencies are translated into U.S. dollars at rates provided by an independent foreign currency pricing source at a time each business day specified by the Valuation Committee. Purchases and sales of securities, and income and expenses are converted at the rate of exchange on the respective dates of such transactions. Net realized foreign exchange gains or losses arise from sales of foreign currencies, currency gains or losses realized between the trade and settlement dates on securities transactions, and the difference between the amounts of dividends, interest and foreign withholding taxes recorded and the U.S. dollar equivalent of the amounts actually paid or received. Net unrealized foreign exchange gains and losses arise from changes in the fair value of assets and liabilities other than investments in securities resulting from changes in exchange rates. The changes in net assets arising from changes in exchange rates of securities and the changes in net assets resulting from changes in market prices of securities are not separately presented. Such changes are included in net realized and unrealized gains or losses from investments.
Security transactions and income recognition
Securities transactions are recorded on a trade date basis. Realized gains or losses are recorded on the basis of identified cost.
Dividend income is recognized on the ex-dividend date, except for certain dividends from foreign securities, which are recorded as soon as the custodian verifies the ex-dividend date. Dividend income is recorded net of foreign taxes withheld where recovery of such taxes is not assured.
Allspring Emerging Markets Equity Income Fund | 23
Notes to financial statements (unaudited)
Distributions to shareholders
Distributions to shareholders are recorded on the ex-dividend date and paid from net investment income monthly and any net realized gains are paid at least annually. Such distributions are determined in accordance with income tax regulations and may differ from U.S. generally accepted accounting principles. Dividend sources are estimated at the time of declaration. The tax character of distributions is determined as of the Fund’s fiscal year end. Therefore, a portion of the Fund’s distributions made prior to the Fund’s fiscal year end may be categorized as a tax return of capital at year end.
Federal and other taxes
The Fund intends to continue to qualify as a regulated investment company by distributing substantially all of its investment company taxable income and any net realized capital gains (after reduction for capital loss carryforwards) sufficient to relieve it from all, or substantially all, federal income taxes. Accordingly, no provision for federal income taxes was required.
The Fund’s income and federal excise tax returns and all financial records supporting those returns for the prior three fiscal years are subject to examination by the federal and Delaware revenue authorities. Management has analyzed the Fund’s tax positions taken on federal, state, and foreign tax returns, as applicable, for all open tax years and does not believe that there are any uncertain tax positions that require recognition of a tax liability.
As of April 30, 2023, the aggregate cost of all investments for federal income tax purposes was $289,450,388 and the unrealized gains (losses) consisted of:
As of October 31, 2022, the Fund had capital loss carryforwards which consisted of $36,527,887 in short-term capital losses and $5,804,377 in long-term capital losses.
Class allocations
The separate classes of shares offered by the Fund differ principally in applicable sales charges, distribution, shareholder servicing, and administration fees. Class specific expenses are charged directly to that share class. Investment income, common fund-level expenses, and realized and unrealized gains (losses) on investments are allocated daily to each class of shares based on the relative proportion of net assets of each class.
3.
FAIR VALUATION MEASUREMENTS
Fair value measurements of investments are determined within a framework that has established a fair value hierarchy based upon the various data inputs utilized in determining the value of the Fund’s investments. The three-level hierarchy gives the highest priority to unadjusted quoted prices in active markets for identical assets or liabilities (Level 1) and the lowest priority to unobservable inputs (Level 3). The Fund’s investments are classified within the fair value hierarchy based on the lowest level of input that is significant to the fair value measurement. The inputs are summarized into three broad levels as follows:
•Level 1—quoted prices in active markets for identical securities
•Level 2—other significant observable inputs (including quoted prices for similar securities, interest rates, prepayment speeds, credit risk, etc.)
•Level 3—significant unobservable inputs (including the Fund’s own assumptions in determining the fair value of investments)
The inputs or methodologies used for valuing investments in securities are not necessarily an indication of the risk associated with investing in those securities.
24 | Allspring Emerging Markets Equity Income Fund
Notes to financial statements (unaudited)
The following is a summary of the inputs used in valuing the Fund’s assets and liabilities as of April 30, 2023:
| | Other significant
observable inputs
(Level 2) | Significant
unobservable inputs
(Level 3) | |
| | | | |
| | | | |
| | | | |
| | | | |
| | | | |
| | | | |
| | | | |
| | | | |
| | | | |
| | | | |
| | | | |
| | | | |
| | | | |
| | | | |
| | | | |
| | | | |
| | | | |
| | | | |
| | | | |
| | | | |
| | | | |
| | | | |
| | | | |
| | | | |
| | | | |
| | | | |
| | | | |
| | | | |
| | | | |
| | | | |
| | | | |
| | | | |
| | | | |
| | | | |
| | | | |
Additional sector, industry or geographic detail, if any, is included in the Portfolio of Investments.
For the six months ended April 30, 2023, the Fund did not have any transfers into/out of Level 3.
4.
TRANSACTIONS WITH AFFILIATES
Management fee
Allspring Funds Management, a wholly owned subsidiary of Allspring Global Investments Holdings, LLC, a holding company indirectly owned by certain private funds of GTCR LLC and Reverence Capital Partners, L.P., is the manager of the Fund and provides advisory and fund-level administrative services under an investment management agreement. Under the investment management agreement, Allspring Funds Management is responsible for, among other services, implementing the investment objectives and strategies of the Fund, supervising the subadviser and providing fund-level administrative
Allspring Emerging Markets Equity Income Fund | 25
Notes to financial statements (unaudited)
services in connection with the Fund’s operations. As compensation for its services under the investment management agreement, Allspring Funds Management is entitled to receive a management fee at the following annual rate based on the Fund’s average daily net assets:
For the six months ended April 30, 2023, the management fee was equivalent to an annual rate of 1.05% of the Fund’s average daily net assets.
Allspring Funds Management has retained the services of a subadviser to provide daily portfolio management to the Fund. The fee for subadvisory services is borne by Allspring Funds Management. Allspring Global Investments, LLC, an affiliate of Allspring Funds Management and a wholly owned subsidiary of Allspring Global Investments Holdings, LLC, is the subadviser to the Fund and is entitled to receive a fee from Allspring Funds Management at an annual rate starting at 0.65% and declining to 0.45% as the average daily net assets of the Fund increase.
Administration fees
Under a class-level administration agreement, Allspring Funds Management provides class-level administrative services to the Fund, which includes paying fees and expenses for services provided by the transfer agent, sub-transfer agents, omnibus account servicers and record-keepers. As compensation for its services under the class-level administration agreement, Allspring Funds Management receives an annual fee which is calculated based on the average daily net assets of each class as follows:
| Class-level
administration fee |
| |
| |
| |
| |
| |
| |
Waivers and/or expense reimbursements
Allspring Funds Management has contractually committed to waive and/or reimburse management and administration fees to the extent necessary to maintain certain net operating expense ratios for the Fund. When each class of the Fund has exceeded its expense cap, Allspring Funds Management will waive fees and/or reimburse expenses from fund-level expenses on a proportionate basis and then from class specific expenses. When only certain classes exceed their expense caps, waivers and/or reimbursements are applied against class specific expenses before fund-level expenses. Allspring Funds Management has contractually committed through February 29, 2024 to waive fees and/or reimburse expenses to the extent necessary to cap expenses. Prior to or after the commitment expiration date, the caps may be increased or the commitment to maintain the caps may be terminated only with the approval of the Board of Trustees. As of April 30, 2023, the contractual expense caps are as follows:
Distribution fees
The Trust has adopted a distribution plan for Class C and Class R shares pursuant to Rule 12b-1 under the 1940 Act. Distribution fees are charged to Class C and Class R shares and paid to Allspring Funds Distributor, LLC (“Allspring Funds Distributor”), the principal underwriter, an affiliate of Allspring Funds Management, at an annual rate up to 0.75% of the average daily net assets of Class C shares and up to 0.25% of the average daily net assets of Class R shares.
26 | Allspring Emerging Markets Equity Income Fund
Notes to financial statements (unaudited)
In addition, Allspring Funds Distributor is entitled to receive the front-end sales charge from the purchase of Class A shares and a contingent deferred sales charge on the redemption of certain Class A shares. Allspring Funds Distributor is also entitled to receive the contingent deferred sales charges from redemptions of Class C shares. For the six months ended April 30, 2023, Allspring Funds Distributor received $171 from the sale of Class A shares. No contingent deferred sales charges were incurred by Class A and Class C shares for the six months ended April 30, 2023.
Shareholder servicing fees
The Trust has entered into contracts with one or more shareholder servicing agents, whereby Class A, Class C, Class R, and Administrator Class are charged a fee at an annual rate up to 0.25% of the average daily net assets of each respective class. A portion of these total shareholder servicing fees were paid to affiliates of the Fund.
Interfund transactions
The Fund may purchase or sell portfolio investment securities to certain affiliates pursuant to Rule 17a-7 under the 1940 Act and under procedures adopted by the Board of Trustees. The procedures have been designed to ensure that these interfund transactions, which do not incur broker commissions, are effected at current market prices.
5.
INVESTMENT PORTFOLIO TRANSACTIONS
Purchases and sales of investments, excluding U.S. government obligations (if any) and short-term securities, for the six months ended April 30, 2023 were $111,786,008 and $119,966,629, respectively.
The Trust (excluding the money market funds), Allspring Master Trust and Allspring Variable Trust are parties to a $350,000,000 revolving credit agreement whereby the Fund is permitted to use bank borrowings for temporary or emergency purposes, such as to fund shareholder redemption requests. Interest under the credit agreement is charged to the Fund based on borrowing rate equal to the higher of the Federal Funds rate or the overnight bank funding rate in effect on that day plus a spread. In addition, an annual commitment fee based on the unused balance is allocated to each participating fund.
For the six months ended April 30, 2023, there were no borrowings by the Fund under the agreement.
As of the end of the period, the Fund concentrated its portfolio of investments in China and Hong Kong. A fund that invests a substantial portion of its assets in any country or geographic region will be more vulnerable than a fund that invests its assets more broadly to the economic, financial, political or other developments affecting that country or region. Such developments may have a significant impact on the Fund’s investment performance causing such performance to be more volatile than the investment performance of a more geographically diversified fund.
Russia launched a large-scale invasion of Ukraine on February 24, 2022. As a result of this military action, the United States and many other countries have instituted various economic sanctions against Russian and Belarus individuals and entities. The situation has led to increased financial market volatility and could have severe adverse effects on regional and global economic markets, including the markets for certain securities and commodities, such as oil and natural gas. The extent and duration of the military action, resulting sanctions imposed, other punitive action taken and the resulting market disruptions cannot be easily predicted. As of April 30, 2023, the Fund held 0.00% of its total net assets in Russian securities with unrealized losses in the amount of $3,645,338.
Under the Fund’s organizational documents, the officers and Trustees have been granted certain indemnification rights against certain liabilities that may arise out of performance of their duties to the Fund. The Fund has entered into a separate agreement with each Trustee that converts indemnification rights currently existing under the Fund’s organizational documents into contractual rights that cannot be changed in the future without the consent of the Trustee. Additionally, in the normal course of business, the Fund may enter into contracts with service providers that contain a variety of indemnification clauses. The Fund’s maximum exposure under these arrangements is dependent on future claims that may be made against the Fund and, therefore, cannot be estimated.
Allspring Emerging Markets Equity Income Fund | 27
Other information (unaudited)
Other information
Tax information
Pursuant to Section 853 of the Internal Revenue Code, the following amounts have been designated as foreign taxes paid for the fiscal year ended October 31, 2022. These amounts may be less than the actual foreign taxes paid for financial statement purposes. Foreign taxes paid or withheld should be included in taxable income with an offsetting deduction from gross income or as a credit for taxes paid to foreign governments. None of the income was derived from ineligible foreign sources as defined under Section 901(j) of the Internal Revenue Code.
Creditable
foreign taxes
paid | | Foreign
income as % of
ordinary income
distributions |
| | |
Proxy voting information
A description of the policies and procedures used to determine how to vote proxies relating to portfolio securities is available without charge, upon request, by calling 1-800-222-8222, visiting our website at allspringglobal.com, or visiting the SEC website at sec.gov. Information regarding how the proxies related to portfolio securities were voted during the most recent 12-month period ended June 30 is available on the website at allspringglobal.com or by visiting the SEC website at sec.gov.
Quarterly portfolio holdings information
The Fund files its complete schedule of portfolio holdings with the SEC for the first and third quarters of each fiscal year as an exhibit to its reports on Form N-PORT. Shareholders may view the filed Form N-PORT by visiting the SEC website at sec.gov.
28 | Allspring Emerging Markets Equity Income Fund
Other information (unaudited)
BOARD OF TRUSTEES AND OFFICERS
Each of the Trustees and Officers listed in the table below acts in identical capacities for each fund in the Allspring family of funds, which consists of 127 mutual funds comprising the Allspring Funds Trust, Allspring Variable Trust, Allspring Master Trust and four closed-end funds (collectively the “Fund Complex”). This table should be read in conjunction with the Prospectus and the Statement of Additional Information1. The mailing address of each Trustee and Officer is 1415 Vantage Park Drive, 3rd Floor, Charlotte, NC 28203. Each Trustee and Officer serves an indefinite term, however, each Trustee serves such term until reaching the mandatory retirement age established by the Trustees.
Independent Trustees
| | Principal occupations during past five years or longer | Current other
public company or
investment
company
directorships |
William R. Ebsworth
(Born 1957) | | Retired. From 1984 to 2013, equities analyst, portfolio manager, research director and chief investment officer at Fidelity Management and Research Company in Boston, Tokyo, and Hong Kong, and retired in 2013 as Chief Investment Officer of Fidelity Strategic Advisers, Inc. where he led a team of investment professionals managing client assets. Prior thereto, Board member of Hong Kong Securities Clearing Co., Hong Kong Options Clearing Corp., the Thailand International Fund, Ltd., Fidelity Investments Life Insurance Company, and Empire Fidelity Investments Life Insurance Company. Audit Committee Chair and Investment Committee Chair of the Vincent Memorial Hospital Foundation (non-profit organization). Mr. Ebsworth is a CFA charterholder. | |
Jane A. Freeman
(Born 1953) | Trustee,
since 2015;
Chair Liaison,
since 2018 | Retired. From 2012 to 2014 and 1999 to 2008, Chief Financial Officer of Scientific Learning Corporation. From 2008 to 2012, Ms. Freeman provided consulting services related to strategic business projects. Prior to 1999, Portfolio Manager at Rockefeller & Co. and Scudder, Stevens & Clark. Board member of the Harding Loevner Funds from 1996 to 2014, serving as both Lead Independent Director and chair of the Audit Committee. Board member of the Russell Exchange Traded Funds Trust from 2011 to 2012 and the chair of the Audit Committee. Ms. Freeman is also an inactive Chartered Financial Analyst. | |
Isaiah Harris, Jr.
(Born 1952) | Trustee,
since 2009;
Audit Committee Chair,
since 2019 | Retired. Member of the Advisory Board of CEF of East Central Florida. Chairman of the Board of CIGNA Corporation from 2009 to 2021, and Director from 2005 to 2008. From 2003 to 2011, Director of Deluxe Corporation. Prior thereto, President and CEO of BellSouth Advertising and Publishing Corp. from 2005 to 2007, President and CEO of BellSouth Enterprises from 2004 to 2005 and President of BellSouth Consumer Services from 2000 to 2003. Emeritus member of the Iowa State University Foundation Board of Governors. Emeritus Member of the Advisory Board of Iowa State University School of Business. Advisory Board Member, Palm Harbor Academy (private school). Advisory Board Member, Fellowship of Christian Athletes. Mr. Harris is a certified public accountant (inactive status). | |
David F. Larcker
(Born 1950) | | Distinguished Visiting Fellow at the Hoover Institution since 2022. James Irvin Miller Professor of Accounting at the Graduate School of Business (Emeritus), Stanford University, Director of the Corporate Governance Research Initiative and Senior Faculty of The Rock Center for Corporate Governance since 2006. From 2005 to 2008, Professor of Accounting at the Graduate School of Business, Stanford University. Prior thereto, Ernst & Young Professor of Accounting at The Wharton School, University of Pennsylvania from 1985 to 2005. | |
Olivia S. Mitchell
(Born 1953) | Trustee,
since 2006;
Nominating and Governance Committee Chair,
since 2018 | International Foundation of Employee Benefit Plans Professor since 1993, Wharton School of the University of Pennsylvania. Director of Wharton’s Pension Research Council and Boettner Center on Pensions & Retirement Research, and Research Associate at the National Bureau of Economic Research. Previously taught at Cornell University from 1978 to 1993. | |
Timothy J. Penny
(Born 1951) | Trustee,
since 1996;
Chair,
since 2018 | President and Chief Executive Officer of Southern Minnesota Initiative Foundation, a non-profit organization, since 2007. Vice Chair of the Economic Club of Minnesota, since 2007. Co-Chair of the Committee for a Responsible Federal Budget, since 1995. Member of the Board of Trustees of NorthStar Education Finance, Inc., a non-profit organization, from 2007-2022. Senior Fellow of the University of Minnesota Humphrey Institute from 1995 to 2017. | |
1
The Statement of Additional Information includes additional information about the Trustees and is available, without charge, upon request, by calling 1-800-222-8222 or by visiting the website at allspringglobal.com.
Allspring Emerging Markets Equity Income Fund | 29
Other information (unaudited)
| Position held and length of service* | Principal occupations during past five years or longer | Current other public company or investment company directorships |
James G. Polisson
(Born 1959) | | Retired. Chief Marketing Officer, Source (ETF) UK Services, Ltd, from 2015 to 2017. From 2012 to 2015, Principal of The Polisson Group, LLC, a management consulting, corporate advisory and principal investing company. Chief Executive Officer and Managing Director at Russell Investments, Global Exchange Traded Funds from 2010 to 2012. Managing Director of Barclays Global Investors from 1998 to 2010 and Global Chief Marketing Officer for iShares and Barclays Global Investors from 2000 to 2010. Trustee of the San Francisco Mechanics’ Institute, a non- profit organization, from 2013 to 2015. Board member of the Russell Exchange Traded Fund Trust from 2011 to 2012. Director of Barclays Global Investors Holdings Deutschland GmbH from 2006 to 2009. Mr. Polisson is an attorney and has a retired status with the Massachusetts and District of Columbia Bar Associations. | |
Pamela Wheelock
(Born 1959) | Trustee,
since January 2020;
previously Trustee from
January 2018 to
July 2019 | Retired. Executive and Senior Financial leadership positions in the public, private and nonprofit sectors. Interim President and CEO, McKnight Foundation, 2020. Interim Commissioner, Minnesota Department of Human Services, 2019. Chief Operating Officer, Twin Cities Habitat for Humanity, 2017-2019. Vice President for University Services, University of Minnesota, 2012- 2016. Interim President and CEO, Blue Cross and Blue Shield of Minnesota, 2011-2012. Executive Vice-President and Chief Financial Officer, Minnesota Wild, 2002-2008. Commissioner, Minnesota Department of Finance, 1999-2002. Chair of the Board of Directors of Destination Medical Center Corporation. Board member of the Minnesota Wild Foundation. | |
| Length of service dates reflect the Trustee’s commencement of service with the Trust’s predecessor entities, where applicable. |
30 | Allspring Emerging Markets Equity Income Fund
Other information (unaudited)
Officers1
| Position held and
length of service | Principal occupations during past five years or longer |
| | President and Chief Executive Officer of Allspring Funds Management, LLC since 2017 and Head of Global Fund Governance of Allspring Global Investments since 2022. Prior thereto, co-president of Galliard Capital Management, LLC, an affiliate of Allspring Funds Management, LLC, from 2019 to 2022 and Head of Affiliated Managers, Allspring Global Investments, from 2014 to 2019 and Executive Vice President responsible for marketing, investments and product development for Allspring Funds Management, LLC, from 2009 to 2014. |
Jeremy DePalma
(Born 1974) | Treasurer,
since 2012
(for certain funds in
the Fund Complex);
since 2021 (for
the remaining funds in the Fund Complex) | Senior Vice President of Allspring Funds Management, LLC since 2009. Senior Vice President of Evergreen Investment Management Company, LLC from 2008 to 2010 and head of the Fund Reporting and Control Team within Fund Administration from 2005 to 2010. |
Christopher Baker
(Born 1976) | Chief Compliance Officer,
since 2022 | Global Chief Compliance Officer for Allspring Global Investments since 2022. Prior thereto, Chief Compliance Officer for State Street Global Advisors from 2018 to 2021. Senior Compliance Officer for the State Street divisions of Alternative Investment Solutions, Sector Solutions, and Global Marketing from 2015 to 2018. From 2010 to 2015 Vice President, Global Head of Investment and Marketing Compliance for State Street Global Advisors. |
Matthew Prasse
(Born 1983) | Chief Legal Officer,
since 2022;
Secretary,
since 2021 | Senior Counsel of the Allspring Legal Department since 2021. Senior Counsel of the Wells Fargo Legal Department from 2018 to 2021. Previously, Counsel for Barings LLC from 2015 to 2018. Prior to joining Barings, Associate at Morgan, Lewis & Bockius LLP from 2008 to 2015. |
1 For those Officers with tenures at Allspring Global Investments and/or Allspring Funds Management, LLC that began prior to 2021, such tenures include years of service during which these businesses/entities were known as Wells Fargo Asset Management and Wells Fargo Funds Management, LLC, respectively.
Allspring Emerging Markets Equity Income Fund | 31
This page is intentionally left blank.
For more information
More information about Allspring Funds is available free upon request. To obtain literature, please write, visit the Fund’s website, or call:
Allspring Funds
P.O. Box 219967
Kansas City, MO 64121-9967
Website: allspringglobal.com
Individual investors: 1-800-222-8222
Retail investment professionals: 1-888-877-9275
Institutional investment professionals: 1-800-260-5969
This report and the financial statements contained herein are submitted for the general information of the shareholders of the Fund. If this report is used for promotional purposes, distribution of the report must be accompanied or preceded by a current prospectus. Before investing, please consider the investment objectives, risks, charges, and expenses of the investment. For a current prospectus and, if available, a summary prospectus, containing this information, call 1-800-222-8222 or visit the Fund’s website at allspringglobal.com. Read the prospectus carefully before you invest or send money.
Allspring Global InvestmentsTM is the trade name for the asset management firms of Allspring Global Investments Holdings, LLC, a holding company indirectly owned by certain private funds of GTCR LLC and Reverence Capital Partners, L.P. These firms include but are not limited to Allspring Global Investments, LLC, and Allspring Funds Management, LLC. Certain products managed by Allspring entities are distributed by Allspring Funds Distributor, LLC (a broker-dealer and Member FINRA/SIPC).
This material is for general informational and educational purposes only and is NOT intended to provide investment advice or a recommendation of any kind - including a recommendation for any specific investment, strategy, or plan.
© 2023 Allspring Global Investments Holdings, LLC. All rights reserved.
ALL-05052023-wga8qc15 06-23
SAR3356 04-23
Allspring Global Long/Short Equity Fund
Semi-Annual Report
April 30, 2023
The views expressed and any forward-looking statements are as of April 30, 2023, unless otherwise noted, and are those of the Fund’s portfolio managers and/or Allspring Global Investments. Discussions of individual securities or the markets generally are not intended as individual recommendations. Future events or results may vary significantly from those expressed in any forward-looking statements. The views expressed are subject to change at any time in response to changing circumstances in the market. Allspring Global Investments disclaims any obligation to publicly update or revise any views expressed or forward-looking statements.
˂Fund Legal Name - undefined˃ | 1
Letter to shareholders (unaudited)
Andrew Owen
President
Allspring Funds
Dear Shareholder:
We are pleased to offer you this semi-annual report for the Allspring Global Long/Short Equity Fund for the six-month period that ended April 30, 2023. Globally, stocks and bonds rebounded strongly despite ongoing volatility. While navigating persistently high inflation and the impact of ongoing aggressive central bank rate hikes, markets rallied on signs of declining inflation, anticipation of an end to the central bank monetary tightening cycle, and the stimulating impact of China removing its strict COVID-19 lockdowns in December. For the six-month period, domestic U.S. and global stocks and bonds had strong results. After suffering deep and broad losses through 2022, recent fixed income performance benefited from a base of higher yields that have the potential to generate higher income.
For the period, U.S. stocks, based on the S&P 500 Index,1 returned 8.63%. International stocks, as measured by the MSCI ACWI ex USA Index (Net),2 gained 20.65% while the MSCI EM Index (Net) (USD),3 returned 16.36%. Among bond indexes, the Bloomberg U.S. Aggregate Bond Index4 returned 6.91%, the Bloomberg Global Aggregate ex-USD Index (unhedged)5 gained 10.55%, the Bloomberg Municipal Bond Index6 gained 7.65%, and the ICE BofA U.S. High Yield Index7 returned 5.92%.
Despite high inflation and central bank rate hikes, markets rally.
Stocks and bonds rallied in November after earlier volatility. Economic news was encouraging, driven by U.S. labor market strength. Although central banks kept increasing rates, hopes rose for an easing in the pace of rate hikes and a possible end to central bank monetary tightening in 2023. Although inflation remained at record highs in the eurozone, we began to see signs of a possible decline in inflationary pressures as U.S. inflation moderated, with a 7.1% annual price rise in November and a monthly price increase of just 0.1%. China’s economic data remained weak, reflecting its zero-COVID-19 policy.
Financial markets cooled in December, with U.S. equities posting negative overall results in response to a weakening U.S. dollar. Fixed income securities ended one of their worst years ever, with flat overall monthly returns as markets weighed the hopes for an end to the monetary tightening cycle with the reality that central banks had not completed their jobs yet. U.S. Consumer Price Index (CPI)8 data showed a strong consistent trend downward, which brought down the 12-month CPI to 6.5% in December from 9.1% in June. Other countries and regions reported still-high but declining inflation rates as the year wound down.
1
The S&P 500 Index consists of 500 stocks chosen for market size, liquidity, and industry group representation. It is a market-value-weighted index with each stock’s weight in the index proportionate to its market value. You cannot invest directly in an index.
2
The Morgan Stanley Capital International (MSCI) All Country World Index (ACWI) ex USA Index (Net) is a free-float-adjusted market-capitalization-weighted index that is designed to measure the equity market performance of developed and emerging markets, excluding the U.S. Source: MSCI. MSCI makes no express or implied warranties or representations and shall have no liability whatsoever with respect to any MSCI data contained herein. The MSCI data may not be further redistributed or used as a basis for other indexes or any securities or financial products. This report is not approved, reviewed, or produced by MSCI. You cannot invest directly in an index.
3
The MSCI Emerging Markets (EM) Index (Net) (USD) is a free-float-adjusted market-capitalization-weighted index that is designed to measure the equity market performance of emerging markets. You cannot invest directly in an index.
4
The Bloomberg U.S. Aggregate Bond Index is a broad-based benchmark that measures the investment-grade, U.S.-dollar-denominated, fixed-rate taxable bond market, including Treasuries, government-related and corporate securities, mortgage-backed securities (agency fixed-rate and hybrid adjustable-rate mortgage pass-throughs), asset-backed securities, and commercial mortgage-backed securities. You cannot invest directly in an index.
5
The Bloomberg Global Aggregate ex-USD Index (unhedged) is an unmanaged index that provides a broad-based measure of the global investment-grade fixed-income markets excluding the U.S.-dollar-denominated debt market. You cannot invest directly in an index.
6
The Bloomberg Municipal Bond Index is an unmanaged index composed of long-term tax-exempt bonds with a minimum credit rating of Baa. You cannot invest directly in an index.
7
The ICE BofA U.S. High Yield Index is a market-capitalization-weighted index of domestic and Yankee high yield bonds. The index tracks the performance of high yield securities traded in the U.S. bond market. You cannot invest directly in an index. Copyright 2023. ICE Data Indices, LLC. All rights reserved.
8
The U.S. Consumer Price Index (CPI) is a measure of the average change over time in the prices paid by urban consumers for a market basket of consumer goods and services. You cannot invest directly in an index.
2 | Allspring Global Long/Short Equity Fund
Letter to shareholders (unaudited)
The year 2023 began with a rally across global equities and fixed income securities. Investor optimism rose in response to data indicating declining inflation rates and the reopening of China’s economy with the abrupt end to its zero-COVID-19 policy. The U.S. reported surprisingly strong job gains—employers added more than 500,000 jobs—and unemployment fell to 3.4%, the lowest level since 1969. Meanwhile, wage growth, seen as a potential contributor to ongoing high inflation, continued to moderate. All eyes remained fixed on the Federal Reserve (Fed) and on how many more rate hikes remain in this tightening cycle. The 0.25% federal funds rate hike announced in January was the Fed’s smallest rate increase since March 2022.
Financial markets declined in February as investors responded unfavorably to resilient economic data. The takeaway: Central banks will likely continue their monetary tightening cycle for longer than markets had priced in. In this environment—where strong economic data is seen as bad news—the resilient U.S. labor market was seen as a negative while the inflation rate has not been falling quickly enough for the Fed, which raised interest rates by 0.25% in early February. Meanwhile, the Bank of England and the European Central Bank both raised rates by 0.50%.
The collapse of Silicon Valley Bank in March, the second-largest banking failure in U.S. history, led to a classic bank run that spread to Europe where Switzerland’s Credit Suisse was taken over by its rival, UBS. The banking industry turmoil created an additional challenge for central banks in balancing inflationary concerns against potential economic weakening. Meanwhile, recent data pointed to economic strength in the U.S., Europe, and China. And China’s economy continued to rebound after the removal of its COVID-19 lockdown. Inflation rates in the U.S., the U.K., and Europe all remained higher than central bank targets, leading to additional rate hikes in March.
Economic data released in April pointed to global resilience, as Purchasing Managers Indexes1 in the U.S., U.K., and eurozone beat expectations and China reported first-quarter annualized economic growth of 4.5%. Despite banking industry stress, developed market stocks had monthly gains. The U.S. labor market remained strong, with a 3.5% jobless rate and monthly payroll gains above 200,000. However, uncertainty and inflationary concerns weighed on investors in the U.S. and abroad.
Don’t let short-term uncertainty derail long-term investment goals.
Periods of investment uncertainty can present challenges, but experience has taught us that maintaining long-term investment goals can be an effective way to plan for the future. To help you create a sound strategy based on your personal goals and risk tolerance, Allspring Funds offers more than 100 mutual funds spanning a wide range of asset classes and investment styles. Although diversification cannot guarantee an investment profit or prevent losses, we believe it can be an effective way to manage investment risk and potentially smooth out overall portfolio performance. We encourage investors to know their investments and to understand that appropriate levels of risk-taking may unlock opportunities.
Thank you for choosing to invest with Allspring Funds. We appreciate your confidence in us and remain committed to helping you meet your financial needs.
Sincerely,
Andrew Owen
President
Allspring Funds
“ The collapse of Silicon Valley Bank in March, the second-largest banking failure in U.S. history, led to a classic bank run that spread to Europe where Switzerland’s Credit Suisse was taken over by its rival, UBS. ”
For further information about your fund, contact your investment professional, visit our website at allspringglobal.com, or call us directly at 1-800-222-8222.
1
The Purchasing Managers Index (PMI) is an index of the prevailing direction of economic trends in the manufacturing and service sectors. You cannot invest directly in an index.
Allspring Global Long/Short Equity Fund | 3
Performance highlights (unaudited)
Performance highlights
| The Fund seeks long-term capital appreciation. |
| Allspring Funds Management, LLC |
| Allspring Global Investments, LLC |
| Harindra de Silva, Ph.D., CFA, David Krider, CFA |
Average annual total returns (%) as of April 30, 2023 |
| | | | |
| | | | | | | | | |
| | | | | | | | | |
| | | | | | | | | |
| | | | | | | | | |
Institutional Class (AGAZX)6 | | | | | | | | | |
| | | | | | | | | |
| | | | | | | | | |
ICE BofA 3-Month U.S. Treasury Bill Index9 | | | | | | | | | |
Figures quoted represent past performance, which is no guarantee of future results, and do not reflect taxes that a shareholder may pay on an investment in a fund. Investment return and principal value of an investment will fluctuate so that an investor’s shares, when redeemed, may be worth more or less than their original cost. Performance shown without sales charges would be lower if sales charges were reflected. Current performance may be lower or higher than the performance data quoted, which assumes the reinvestment of dividends and capital gains. Current month-end performance is available on the Fund’s website, allspringglobal.com.
Index returns do not include transaction costs associated with buying and selling securities, any mutual fund fees or expenses, or any taxes. It is not possible to invest directly in an index.
For Class A shares, the maximum front-end sales charge is 5.75%. For Class C shares, the maximum contingent deferred sales charge is 1.00%. Performance including a contingent deferred sales charge assumes the sales charge for the corresponding time period. Class R6 and Institutional Class shares are sold without a front-end sales charge or contingent deferred sales charge.
|
| Reflects the expense ratios as stated in the most recent prospectuses. The expense ratios shown are subject to change and may differ from the annualized expense ratios shown in the financial highlights of this report. |
| The manager has contractually committed through February 28, 2025, to waive fees and/or reimburse expenses to the extent necessary to cap total annual fund operating expenses after fee waivers at 1.73% for Class A, 2.48% for Class C, 1.30% for Class R6 and 1.40% for Institutional Class. Brokerage commissions, stamp duty fees, interest, taxes, acquired fund fees and expenses (if any), expenses from dividends and interest expense on securities sold short, and extraordinary expenses are excluded from the expense caps. Prior to or after the commitment expiration date, the caps may be increased or the commitment to maintain the caps may be terminated only with the approval of the Board of Trustees. Without these caps, the Fund’s returns would have been lower. The expense ratio paid by an investor is the net expense ratio (the total annual fund operating expenses after fee waivers) as stated in the prospectuses. |
| Historical performance shown for the Class A shares prior to 12-16-2022, is based on the performance of the Investor Class shares of the Fund’s predecessor, 361 Global Long/Short Equity Fund (the “Predecessor Fund”), and for the period prior to 12-12-2014, is based on the performance of a predecessor account, the Analytic Global Long/Short Equity Fund, L.P., a limited partnership that was reorganized into the Predecessor Fund on 12-12-2014 (the “Predecessor Account”). Performance of the Predecessor Account reflects the higher expenses applicable to it and returns would have been higher if adjusted to reflect Predecessor Fund expenses. The Predecessor Account was not registered under the Investment Company Act of 1940 (the “1940 Act”), and was not subject to certain restrictions imposed by the 1940 Act. If the Predecessor Account had been registered under the 1940 Act, performance may have been adversely affected. |
| Historical performance for the Class C shares prior to their inception reflects the performance of the Class A shares and is not adjusted to reflect the higher expenses applicable to the Class C shares. If these expenses had been included, returns would be lower. |
| Historical performance shown for the Class R6 shares prior to 12-16-2022 is based on the performance of Class Y shares of the Fund’s predecessor, 361 Global Long/Short Equity Fund (the “Predecessor Fund”), and for the period prior to 12-12-2014, is based on the performance of a predecessor account, the Analytic Global Long/Short Equity Fund, L.P., a limited partnership that was reorganized into the Predecessor Fund on 12-12-2014 (the “Predecessor Account”). Performance of the Predecessor Account reflects the higher expenses applicable to it and returns would have been higher if adjusted to reflect Predecessor Fund expenses. The Predecessor Account was not registered under the Investment Company Act of 1940 (the “1940 Act”), and was not subject to certain restrictions imposed by the 1940 Act. If the Predecessor Account had been registered under the 1940 Act, performance may have been adversely affected. |
CFA® and Chartered Financial Analyst® are trademarks owned by CFA Institute. |
4 | Allspring Global Long/Short Equity Fund
Performance highlights (unaudited)
Footnotes continued from previous page |
| Historical performance shown for the Institutional Class shares prior to 12-16-2022, is based on the performance of Class I shares of the Fund’s predecessor, 361 Global Long/Short Equity Fund (the “Predecessor Fund”), and for the period prior to 12-12-2014, is based on the performance of a predecessor account, the Analytic Global Long/Short Equity Fund, L.P., a limited partnership that was reorganized into the Predecessor Fund on 12-12-2014 (the “Predecessor Account”). Performance of the Predecessor Account reflects the higher expenses applicable to it and returns would have been higher if adjusted to reflect Predecessor Fund expenses. The Predecessor Account was not registered under the Investment Company Act of 1940 (the “1940 Act”) and was not subject to certain restrictions imposed by the 1940 Act. If the Predecessor Account had been registered under the 1940 Act, performance may have been adversely affected. |
| The Morgan Stanley Capital International (MSCI) World Index (Net) (USD) is a free-float-adjusted market-capitalization-weighted index that is designed to measure the equity market performance of developed markets. Source: MSCI. MSCI makes no express or implied warranties or representations and shall have no liability whatsoever with respect to any MSCI data contained herein. The MSCI data may not be further redistributed or used as a basis for other indices or any securities or financial products. This report is not approved, reviewed, or produced by MSCI. You cannot invest directly in an index. |
| Source: Allspring Funds Management, LLC. The Global Long/Short Equity Blended Index is composed 50% of the MSCI World Index (Net) (USD) and 50% of the ICE BofA 3-Month U.S. Treasury Bill Index. You cannot invest directly in an index. |
| The ICE BofA 3-Month U.S. Treasury Bill Index is an unmanaged index that is comprised of a single U.S. Treasury issue with approximately three months to final maturity, purchased at the beginning of each month and held for one full month. You cannot invest directly in an index. Copyright 2023. ICE Data Indices, LLC. All rights reserved. |
Investing involves risk, including the possible loss of principal. Stock values fluctuate in response to the activities of individual companies and general market and economic conditions. Foreign investments are especially volatile and can rise or fall dramatically due to differences in the political and economic conditions of the host country. Short selling is generally considered speculative, has the potential for unlimited loss, and may involve leverage. Consult the Fund’s prospectus for additional information on these and other risks.
Allspring Global Long/Short Equity Fund | 5
Performance highlights (unaudited)
Ten largest Long Positions holdings (%) as of April 30, 20231 |
Chubu Electric Power Co., Inc. | |
| |
Kansai Electric Power Co., Inc. | |
| |
| |
| |
| |
| |
| |
| |
| Figures represent the percentage of the Fund’s net assets. Holdings are subject to change and may have changed since the date specified. |
Five largest short positions holdings (%) as of April 30, 20231 |
| |
| |
| |
| |
| |
| Figures represent the percentage of the Fund’s net assets. Holdings are subject to change and may have changed since the date specified. |
Sector Allocation for Long and Short positions as of April 30, |
| | |
| | |
| | |
| | |
| | |
| | |
| | |
| | |
| | |
| | |
| | |
| | |
| Figures represent the percentage of the Fund’s long and short positions. Allocations are subject to change and may have changed since the date specified. |
Country Allocation for Long and Short positions as of April 30, |
| | |
| | |
| | |
| | |
| | |
| | |
| | |
| | |
| | |
| | |
| | |
| | |
| | |
| | |
| | |
| | |
| | |
| | |
| | |
| Figures represent the percentage of the Fund’s long and short positions. Allocations are subject to change and may have changed since the date specified. |
6 | Allspring Global Long/Short Equity Fund
Fund expenses (unaudited)
Fund expenses
As a shareholder of the Fund, you incur two types of costs: (1) transaction costs, including sales charges (loads) on purchase payments and contingent deferred sales charges (if any) on redemptions and (2) ongoing costs, including management fees, distribution (12b-1) and/or shareholder servicing fees, and other Fund expenses. This example is intended to help you understand your ongoing costs (in dollars) of investing in the Fund and to compare these costs with the ongoing costs of investing in other mutual funds.
The example is based on an investment of $1,000 invested at the beginning of the six-month period and held for the entire period from November 1, 2022 to April 30, 2023.
Actual expenses
The “Actual” line of the table below provides information about actual account values and actual expenses. You may use the information in this line, together with the amount you invested, to estimate the expenses that you paid over the period. Simply divide your account value by $1,000 (for example, an $8,600 account value divided by $1,000 = 8.6), then multiply the result by the number in the “Actual” line under the heading entitled “Expenses paid during period” for your applicable class of shares to estimate the expenses you paid on your account during this period.
Hypothetical example for comparison purposes
The “Hypothetical” line of the table below provides information about hypothetical account values and hypothetical expenses based on the Fund’s actual expense ratio and an assumed rate of return of 5% per year before expenses, which is not the Fund’s actual return. The hypothetical account values and expenses may not be used to estimate the actual ending account balance or expenses you paid for the period. You may use this information to compare the ongoing costs of investing in the Fund and other funds. To do so, compare this 5% hypothetical example with the 5% hypothetical examples that appear in the shareholder reports of the other funds.
Please note that the expenses shown in the table are meant to highlight your ongoing costs only and do not reflect any transactional costs, such as sales charges (loads) and contingent deferred sales charges. Therefore, the “Hypothetical” line of the table is useful in comparing ongoing costs only, and will not help you determine the relative total costs of owning different funds. In addition, if these transactional costs were included, your costs would have been higher.
| Beginning
account value
11-1-2022 | Ending
account value
4-30-2023 | | Annualized net
expense ratio |
| | | | |
| | | | |
Hypothetical (5% return before expenses) | | | | |
| | | | |
| | | | |
Hypothetical (5% return before expenses) | | | | |
| | | | |
| | | | |
Hypothetical (5% return before expenses) | | | | |
| | | | |
| | | | |
Hypothetical (5% return before expenses) | | | | |
1Expenses paid is equal to the annualized net expense ratio of each class multiplied by the average account value over the period, multiplied by 181 divided by 365 (to reflect the one-half-year period).
Allspring Global Long/Short Equity Fund | 7
Portfolio of investments—April 30, 2023 (unaudited)
| | | | | |
| | | | | | |
| | | | | | |
Pilbara Minerals Ltd. (Materials, Metals & mining) | | | | | | |
Rio Tinto Ltd. (Materials, Metals & mining) | | | | | | |
| | | | | | |
| | | | | | |
Elia Group SA/NV (Utilities, Electric utilities) † | | | | | | |
Solvay SA (Materials, Chemicals) | | | | | | |
| | | | | | |
| | | | | | |
ARC Resources Ltd. (Energy, Oil, gas & consumable fuels) | | | | | | |
Brookfield Renewable Corp. Class A (Utilities, Independent power and renewable electricity producers) | | | | | | |
Constellation Software, Inc. (Information technology, Software) | | | | | | |
Fairfax Financial Holdings Ltd. (Financials, Insurance) | | | | | | |
Ritchie Bros Auctioneers, Inc. (Industrials, Commercial services & supplies) | | | | | | |
| | | | | | |
| | | | | | |
AP Moller - Maersk AS Class A (Industrials, Marine transportation) | | | | | | |
Novo Nordisk AS Class B (Health care, Pharmaceuticals) | | | | | | |
| | | | | | |
| | | | | | |
Kesko Oyj Class B (Consumer staples, Consumer staples distribution & retail) | | | | | | |
| | | | | | |
Bollore SE (Communication services, Entertainment) | | | | | | |
Sartorius Stedim Biotech (Health care, Life sciences tools & services) | | | | | | |
| | | | | | |
| | | | | | |
Deutsche Lufthansa AG (Industrials, Passenger airlines) † | | | | | | |
| | | | | | |
Link (Real estate, Retail REITs) | | | | | | |
Swire Pacific Ltd. Class A (Real estate, Real estate management & development) | | | | | | |
WH Group Ltd. (Consumer staples, Food products) 144A | | | | | | |
| | | | | | |
| | | | | | |
Accenture PLC Class A (Information technology, IT services) # | | | | | | |
| | | | | | |
Saras SpA (Energy, Oil, gas & consumable fuels) † | | | | | | |
UniCredit SpA (Financials, Banks) | | | | | | |
| | | | | | |
The accompanying notes are an integral part of these financial statements.
8 | Allspring Global Long/Short Equity Fund
Portfolio of investments—April 30, 2023 (unaudited)
| | | | | |
| | | | | | |
BayCurrent Consulting, Inc. (Industrials, Professional services) | | | | | | |
Chubu Electric Power Co., Inc. (Utilities, Electric utilities) | | | | | | |
Kansai Electric Power Co., Inc. (Utilities, Electric utilities) | | | | | | |
Mazda Motor Corp. (Consumer discretionary, Automobiles) | | | | | | |
Mitsubishi Heavy Industries Ltd. (Industrials, Machinery) | | | | | | |
Nippon Shinyaku Co. Ltd. (Health care, Pharmaceuticals) | | | | | | |
Otsuka Holdings Co. Ltd. (Health care, Pharmaceuticals) | | | | | | |
Taisei Corp. (Industrials, Construction & engineering) | | | | | | |
Tokyo Gas Co. Ltd. (Utilities, Gas utilities) | | | | | | |
Tosoh Corp. (Materials, Chemicals) | | | | | | |
ZOZO, Inc. (Consumer discretionary, Specialty retail) | | | | | | |
| | | | | | |
| | | | | | |
ASML Holding NV (Information technology, Semiconductors & semiconductor equipment) | | | | | | |
| | | | | | |
Mowi ASA (Consumer staples, Food products) | | | | | | |
| | | | | | |
Jeronimo Martins SGPS SA (Consumer staples, Consumer staples distribution & retail) † | | | | | | |
| | | | | | |
Genting Singapore Ltd. (Consumer discretionary, Hotels, restaurants & leisure) | | | | | | |
| | | | | | |
ACS Actividades de Construccion y Servicios SA (Industrials, Construction & engineering) | | | | | | |
Naturgy Energy Group SA (Utilities, Gas utilities) | | | | | | |
| | | | | | |
| | | | | | |
Industrivarden AB Class C (Financials, Financial services) | | | | | | |
| | | | | | |
EMS-Chemie Holding AG (Materials, Chemicals) † | | | | | | |
Partners Group Holding AG (Financials, Capital markets) | | | | | | |
Roche Holding AG (Health care, Pharmaceuticals) | | | | | | |
| | | | | | |
| | | | | | |
CK Hutchison Holdings Ltd. (Industrials, Industrial conglomerates) | | | | | | |
Coca-Cola Europacific Partners PLC (Consumer staples, Beverages) # | | | | | | |
Hargreaves Lansdown PLC (Financials, Capital markets) | | | | | | |
TORM PLC Class A (Energy, Oil, gas & consumable fuels) | | | | | | |
| | | | | | |
The accompanying notes are an integral part of these financial statements.
Allspring Global Long/Short Equity Fund | 9
Portfolio of investments—April 30, 2023 (unaudited)
| | | | | |
| | | | | | |
AbbVie, Inc. (Health care, Biotechnology) # | | | | | | |
Adobe, Inc. (Information technology, Software) †# | | | | | | |
Albemarle Corp. (Materials, Chemicals) # | | | | | | |
Alphabet, Inc. Class A (Communication services, Interactive media & services) †# | | | | | | |
Alphabet, Inc. Class C (Communication services, Interactive media & services) †# | | | | | | |
American International Group, Inc. (Financials, Insurance) # | | | | | | |
Apple, Inc. (Information technology, Technology hardware, storage & peripherals) # | | | | | | |
Arcturus Therapeutics Holdings, Inc. (Health care, Biotechnology) †# | | | | | | |
Arhaus, Inc. (Consumer discretionary, Specialty retail) †# | | | | | | |
AutoZone, Inc. (Consumer discretionary, Specialty retail) †# | | | | | | |
Axcelis Technologies, Inc. (Information technology, Semiconductors & semiconductor equipment) †# | | | | | | |
Axon Enterprise, Inc. (Industrials, Aerospace & defense) †# | | | | | | |
Bandwidth, Inc. Class A (Communication services, Diversified telecommunication services) †# | | | | | | |
Booking Holdings, Inc. (Consumer discretionary, Hotels, restaurants & leisure) †# | | | | | | |
Bristol-Myers Squibb Co. (Health care, Pharmaceuticals) # | | | | | | |
Broadcom, Inc. (Information technology, Semiconductors & semiconductor equipment) # | | | | | | |
Cal-Maine Foods, Inc. (Consumer staples, Food products) # | | | | | | |
Catalyst Pharmaceuticals, Inc. (Health care, Biotechnology) †# | | | | | | |
Caterpillar, Inc. (Industrials, Machinery) # | | | | | | |
Centene Corp. (Health care, Health care providers & services) †# | | | | | | |
Cigna Group (Health care, Health care providers & services) # | | | | | | |
Clearway Energy, Inc. Class A (Utilities, Independent power and renewable electricity producers) # | | | | | | |
Clorox Co. (Consumer staples, Household products) # | | | | | | |
Conagra Brands, Inc. (Consumer staples, Food products) # | | | | | | |
Consolidated Edison, Inc. (Utilities, Multi-utilities) # | | | | | | |
CVS Health Corp. (Health care, Health care providers & services) # | | | | | | |
Domino’s Pizza, Inc. (Consumer discretionary, Hotels, restaurants & leisure) # | | | | | | |
Dropbox, Inc. Class A (Information technology, Software) †# | | | | | | |
Eagle Pharmaceuticals, Inc. (Health care, Biotechnology) †# | | | | | | |
Encore Wire Corp. (Industrials, Electrical equipment) # | | | | | | |
Fair Isaac Corp. (Information technology, Software) †# | | | | | | |
First Solar, Inc. (Information technology, Semiconductors & semiconductor equipment) †# | | | | | | |
Gilead Sciences, Inc. (Health care, Biotechnology) # | | | | | | |
Halozyme Therapeutics, Inc. (Health care, Biotechnology) †# | | | | | | |
Harmony Biosciences Holdings, Inc. (Health care, Pharmaceuticals) †# | | | | | | |
Hartford Financial Services Group, Inc. (Financials, Insurance) # | | | | | | |
HF Sinclair Corp. (Energy, Oil, gas & consumable fuels) # | | | | | | |
Holley, Inc. (Consumer discretionary, Automobile components) †# | | | | | | |
Hubbell, Inc. (Industrials, Electrical equipment) # | | | | | | |
IDEXX Laboratories, Inc. (Health care, Health care equipment & supplies) †# | | | | | | |
Incyte Corp. (Health care, Biotechnology) †# | | | | | | |
Kimberly-Clark Corp. (Consumer staples, Household products) # | | | | | | |
Kiniksa Pharmaceuticals Ltd. Class A (Health care, Biotechnology) †# | | | | | | |
The accompanying notes are an integral part of these financial statements.
10 | Allspring Global Long/Short Equity Fund
Portfolio of investments—April 30, 2023 (unaudited)
| | | | | |
United States (continued) | | | | | | |
Lattice Semiconductor Corp. (Information technology, Semiconductors & semiconductor equipment) †# | | | | | | |
Lennox International, Inc. (Industrials, Building products) | | | | | | |
Lockheed Martin Corp. (Industrials, Aerospace & defense) # | | | | | | |
Lululemon Athletica, Inc. (Consumer discretionary, Textiles, apparel & luxury goods) †# | | | | | | |
Marathon Petroleum Corp. (Energy, Oil, gas & consumable fuels) # | | | | | | |
Mastercard, Inc. Class A (Financials, Financial services) # | | | | | | |
MercadoLibre, Inc. (Consumer discretionary, Broadline retail) †# | | | | | | |
MetLife, Inc. (Financials, Insurance) # | | | | | | |
Microchip Technology, Inc. (Information technology, Semiconductors & semiconductor equipment) # | | | | | | |
Microsoft Corp. (Information technology, Software) # | | | | | | |
NetApp, Inc. (Information technology, Technology hardware, storage & peripherals) # | | | | | | |
Netflix, Inc. (Communication services, Entertainment) †# | | | | | | |
NRG Energy, Inc. (Utilities, Electric utilities) # | | | | | | |
NVIDIA Corp. (Information technology, Semiconductors & semiconductor equipment) # | | | | | | |
NVR, Inc. (Consumer discretionary, Household durables) † | | | | | | |
PACCAR, Inc. (Industrials, Machinery) # | | | | | | |
Packaging Corp. of America (Materials, Containers & packaging) | | | | | | |
Perdoceo Education Corp. (Consumer discretionary, Diversified consumer services) †# | | | | | | |
Phillips 66 (Energy, Oil, gas & consumable fuels) # | | | | | | |
Prudential Financial, Inc. (Financials, Insurance) # | | | | | | |
Public Storage (Real estate, Specialized REITs) # | | | | | | |
Rollins, Inc. (Industrials, Commercial services & supplies) # | | | | | | |
SIGA Technologies, Inc. (Health care, Pharmaceuticals) # | | | | | | |
Steel Dynamics, Inc. (Materials, Metals & mining) # | | | | | | |
Stryker Corp. (Health care, Health care equipment & supplies) # | | | | | | |
Texas Pacific Land Corp. (Energy, Oil, gas & consumable fuels) # | | | | | | |
Titan Machinery, Inc. (Industrials, Trading companies & distributors) †# | | | | | | |
United Parcel Service, Inc. Class B (Industrials, Air freight & logistics) # | | | | | | |
United Therapeutics Corp. (Health care, Biotechnology) †# | | | | | | |
Valero Energy Corp. (Energy, Oil, gas & consumable fuels) # | | | | | | |
VeriSign, Inc. (Information technology, IT services) # | | | | | | |
Vertex Pharmaceuticals, Inc. (Health care, Biotechnology) †# | | | | | | |
Vir Biotechnology, Inc. (Health care, Biotechnology) †# | | | | | | |
Visa, Inc. Class A (Financials, Financial services) # | | | | | | |
Wabash National Corp. (Industrials, Machinery) # | | | | | | |
Walgreens Boots Alliance, Inc. (Consumer staples, Consumer staples distribution & retail) # | | | | | | |
Zymeworks, Inc. (Health care, Biotechnology) †# | | | | | | |
| | | | | | |
Total common stocks (Cost $582,806,134) | | | | | | |
The accompanying notes are an integral part of these financial statements.
Allspring Global Long/Short Equity Fund | 11
Portfolio of investments—April 30, 2023 (unaudited)
| | | | | |
| | | | | | |
| | | | | | |
Bayerische Motoren Werke AG (Consumer discretionary, Automobiles) | | | | | | |
Total preferred stocks (Cost $907,244) | | | | | | |
| | | | | |
Short-term investments: 16.08% | | | | | | |
Investment companies: 16.08% | | | | | | |
Allspring Government Money Market Fund Select Class ♠∞ | | | | | | |
Total short-term investments (Cost $94,410,299) | | | | | | |
Total investments in securities (Cost $678,123,677) | | | | | | |
| | | | | |
Securities sold short: (29.69)% | | | | | | |
| | | | | | |
| | | | | | |
BrainChip Holdings Ltd. (Information technology, Software) † | | | | | | |
Leo Lithium Ltd. (Materials, Metals & mining) † | | | | | | |
Worley Ltd. (Industrials, Construction & engineering) | | | | | | |
| | | | | | |
| | | | | | |
Cameco Corp. (Energy, Oil, gas & consumable fuels) | | | | | | |
Denison Mines Corp. (Energy, Oil, gas & consumable fuels) † | | | | | | |
Energy Fuels, Inc. (Energy, Oil, gas & consumable fuels) † | | | | | | |
Filo Mining Corp. (Materials, Metals & mining) † | | | | | | |
NexGen Energy Ltd. (Energy, Oil, gas & consumable fuels) † | | | | | | |
| | | | | | |
| | | | | | |
Vestas Wind Systems AS (Industrials, Electrical equipment) † | | | | | | |
| | | | | | |
adidas AG (Consumer discretionary, Textiles, apparel & luxury goods) | | | | | | |
Delivery Hero SE (Consumer discretionary, Hotels, restaurants & leisure) 144A† | | | | | | |
| | | | | | |
| | | | | | |
Eisai Co. Ltd. (Health care, Pharmaceuticals) | | | | | | |
Euglena Co. Ltd. (Consumer staples, Personal care products) † | | | | | | |
JSR Corp. (Materials, Chemicals) | | | | | | |
Kagome Co. Ltd. (Consumer staples, Food products) | | | | | | |
Makita Corp. (Industrials, Machinery) | | | | | | |
| | | | | | |
The accompanying notes are an integral part of these financial statements.
12 | Allspring Global Long/Short Equity Fund
Portfolio of investments—April 30, 2023 (unaudited)
| | | | | |
| | | | | | |
Aroundtown SA (Real estate, Real estate management & development) † | | | | | | |
| | | | | | |
Aegon NV (Financials, Insurance) | | | | | | |
Airbus SE (Industrials, Aerospace & defense) | | | | | | |
Argenx SE (Health care, Biotechnology) † | | | | | | |
| | | | | | |
| | | | | | |
REC Silicon ASA (Information technology, Semiconductors & semiconductor equipment) † | | | | | | |
| | | | | | |
Carnival Corp. (Consumer discretionary, Hotels, restaurants & leisure) † | | | | | | |
| | | | | | |
Ferrovial SA (Industrials, Construction & engineering) | | | | | | |
| | | | | | |
Electrolux AB Class B (Consumer discretionary, Household durables) † | | | | | | |
Investment AB Latour Class B (Industrials, Industrial conglomerates) | | | | | | |
Kinnevik AB Class B (Financials, Financial services) † | | | | | | |
PowerCell Sweden AB (Industrials, Electrical equipment) † | | | | | | |
| | | | | | |
| | | | | | |
IWG PLC (Real estate, Real estate management & development) † | | | | | | |
| | | | | | |
Capricorn Energy PLC (Energy, Oil, gas & consumable fuels) † | | | | | | |
Hikma Pharmaceuticals PLC (Health care, Pharmaceuticals) | | | | | | |
ITM Power PLC (Industrials, Electrical equipment) † | | | | | | |
Petrofac Ltd. (Energy, Energy equipment & services) † | | | | | | |
Prudential PLC (Financials, Insurance) | | | | | | |
| | | | | | |
| | | | | | |
Alcoa Corp. (Materials, Metals & mining) | | | | | | |
Alnylam Pharmaceuticals, Inc. (Health care, Biotechnology) † | | | | | | |
Boeing Co. (Industrials, Aerospace & defense) † | | | | | | |
Cassava Sciences, Inc. (Health care, Pharmaceuticals) † | | | | | | |
Clean Energy Fuels Corp. (Energy, Oil, gas & consumable fuels) † | | | | | | |
DoorDash, Inc. Class A (Consumer discretionary, Hotels, restaurants & leisure) † | | | | | | |
Entegris, Inc. (Information technology, Semiconductors & semiconductor equipment) | | | | | | |
Gevo, Inc. (Energy, Oil, gas & consumable fuels) † | | | | | | |
Joby Aviation, Inc. (Industrials, Passenger airlines) † | | | | | | |
Kinetik Holdings, Inc. (Energy, Oil, gas & consumable fuels) | | | | | | |
Light & Wonder, Inc. (Consumer discretionary, Hotels, restaurants & leisure) † | | | | | | |
Lucid Group, Inc. (Consumer discretionary, Automobiles) † | | | | | | |
The accompanying notes are an integral part of these financial statements.
Allspring Global Long/Short Equity Fund | 13
Portfolio of investments—April 30, 2023 (unaudited)
| | | | | |
United States (continued) | | | | | | |
Micron Technology, Inc. (Information technology, Semiconductors & semiconductor equipment) | | | | | | |
NextDecade Corp. (Energy, Oil, gas & consumable fuels) † | | | | | | |
Novocure Ltd. (Health care, Health care equipment & supplies) † | | | | | | |
NuScale Power Corp. (Industrials, Electrical equipment) † | | | | | | |
Occidental Petroleum Corp. (Energy, Oil, gas & consumable fuels) | | | | | | |
Overstock.com, Inc. (Consumer discretionary, Specialty retail) † | | | | | | |
Plug Power Inc. (Industrials, Electrical equipment) † | | | | | | |
Rivian Automotive, Inc. Class A (Consumer discretionary, Automobiles) † | | | | | | |
Roblox Corp. Class A (Communication services, Entertainment) † | | | | | | |
Snap, Inc. Class A (Communication services, Interactive media & services) † | | | | | | |
Stanley Black & Decker, Inc. (Industrials, Machinery) | | | | | | |
Tellurian, Inc. (Energy, Oil, gas & consumable fuels) † | | | | | | |
Toast, Inc. Class A (Financials, Financial services) † | | | | | | |
Western Digital Corp. (Information technology, Technology hardware, storage & peripherals) † | | | | | | |
Wolfspeed, Inc. (Information technology, Semiconductors & semiconductor equipment) † | | | | | | |
| | | | | | |
Total securities sold short (Proceeds $(189,475,715)) | | | | | | |
Other assets and liabilities, net | | | | | | |
| | | | | | |
| Non-income-earning security |
| The security may be resold in transactions exempt from registration, normally to qualified institutional buyers, pursuant to Rule 144A under the Securities Act of 1933. |
| All or a portion of this security is segregated as collateral for securities sold short. |
| The issuer of the security is an affiliated person of the Fund as defined in the Investment Company Act of 1940. |
| The rate represents the 7-day annualized yield at period end. |
|
| Real estate investment trust |
Investments in affiliates
An affiliated investment is an investment in which the Fund owns at least 5% of the outstanding voting shares of the issuer or as a result of other relationships, such as the Fund and the issuer having the same investment manager. Transactions with issuers that were affiliates of the Fund at the end of the period were as follows:
| | | | | Net
change in
unrealized
gains
(losses) | | | Income
from
affiliated
securities |
| | | | | | | | |
Allspring Government Money Market Fund Select Class | | | | | | | | |
The accompanying notes are an integral part of these financial statements.
14 | Allspring Global Long/Short Equity Fund
Statement of assets and liabilities—April 30, 2023 (unaudited)
Financial statements
Statement of assets and liabilities
| |
Investments in unaffiliated securities, at value (cost $583,713,378) | |
Investments in affiliated securities, at value (cost $94,410,299) | |
Cash deposited with brokers for securities sold short | |
Foreign currency, at value (cost $547,878) | |
| |
Receivable for Fund shares sold | |
Prepaid expenses and other assets | |
| |
| |
Payable for securities sold short, at value (proceeds $189,475,715) | |
Payable for dividends and interest expense on securities sold short | |
| |
Payable for Fund shares redeemed | |
Payable for investments purchased | |
Administration fees payable | |
Distribution fees payable | |
Accrued expenses and other liabilities | |
| |
| |
| |
| |
Total distributable earnings | |
| |
Computation of net asset value and offering price per share | |
| |
Shares outstanding–Class A1 | |
Net asset value per share–Class A | |
Maximum offering price per share – Class A2 | |
| |
Shares outstanding–Class C1 | |
Net asset value per share–Class C | |
| |
Shares outstanding–Class R61 | |
Net asset value per share–Class R6 | |
Net assets–Institutional Class | |
Shares outstanding–Institutional Class1 | |
Net asset value per share–Institutional Class | |
| The Fund has an unlimited number of authorized shares. |
| Maximum offering price is computed as 100/94.25 of net asset value. On investments of $50,000 or more, the offering price is reduced. |
The accompanying notes are an integral part of these financial statements.
Allspring Global Long/Short Equity Fund | 15
Statement of operations—six months ended April 30, 2023 (unaudited)
Statement of operations
| |
Dividends (net of foreign withholdings taxes of $605,526) | |
Interest and rebate income | |
Income from affiliated securities | |
| |
| |
| |
| |
| |
| |
| |
| |
Shareholder servicing fees | |
| |
| |
| |
| |
| |
| |
Custody and accounting fees | |
| |
| |
Shareholder report expenses | |
Trustees’ fees and expenses | |
| |
| |
Dividends on securities sold short | |
| |
| |
Less: Fee waivers and/or expense reimbursements | |
| |
| |
| |
| |
| |
| |
Realized and unrealized gains (losses) on investments | |
Net realized gains (losses) on | |
| |
| |
Foreign currency and foreign currency translations | |
Net realized gains on investments | |
The accompanying notes are an integral part of these financial statements.
16 | Allspring Global Long/Short Equity Fund
Statement of operations—six months ended April 30, 2023 (unaudited)
Net change in unrealized gains (losses) on | |
| |
| |
Foreign currency and foreign currency translations | |
Net change in unrealized gains (losses) on investments | |
Net realized and unrealized gains (losses) on investments | |
Net increase in net assets resulting from operations | |
| After the close of business on December 16, 2022, the Fund acquired the net assets of 361 Global Long/Short Equity Fund which became the accounting and performance survivor in the transaction. The information for Class A, Class R6 and Institutional Class for the period prior to December 16, 2022 is that of 361 Global Long/Short Equity Fund Investor Class, Class Y and Class I shares, respectively. |
| For the period from December 16, 2022 (commencement of class operations) to April 30, 2023 |
The accompanying notes are an integral part of these financial statements.
Allspring Global Long/Short Equity Fund | 17
Statement of changes in net assets
Statement of changes in net assets
| Six months ended
April 30, 2023
(unaudited) | Year ended
October 31, 2022 |
| | | | |
| | | | |
Net realized gains (losses) on investments | | | | |
Net change in unrealized gains (losses) on investments | | | | |
Net increase (decrease) in net assets resulting from operations | | | | |
Distributions to shareholders from | | | | |
Net investment income and net realized gains | | | | |
| | | | |
| | | | |
| | | | |
| | | | |
Total distributions to shareholders | | | | |
Capital share transactions | | | | |
Proceeds from shares sold | | | | |
| | | | |
| | | | |
| | | | |
| | | | |
| | | | |
Reinvestment of distributions | | | | |
| | | | |
| | | | |
| | | | |
| | | | |
| | | | |
Payment for shares redeemed | | | | |
| | | | |
| | | | |
| | | | |
| | | | |
Net decrease in net assets resulting from capital share transactions | | | | |
Total decrease in net assets | | | | |
| | | | |
| | | | |
| | | | |
| After the close of business on December 16, 2022, the Fund acquired the net assets of 361 Global Long/Short Equity Fund which became the accounting and performance survivor in the transaction. The information for Class A, Class R6 and Institutional Class for the periods prior to December 16, 2022 is that of 361 Global Long/Short Equity Fund Investor Class, Class Y and Class I shares, respectively. |
| For the period from December 16, 2022 (commencement of class operations) to April 30, 2023. |
The accompanying notes are an integral part of these financial statements.
18 | Allspring Global Long/Short Equity Fund
Statement of cash flows—six months ended April 30, 2023 (unaudited)
Statement of cash flows
Cash flows from operating activities | |
Net increase in net assets resulting from operations | |
Adjustments to reconcile net decrease in net assets from operations to net cash provided by operating activities | |
Purchases of long-term securities | |
Proceeds from the sales of long-term securities | |
Proceeds from securities sold short | |
Purchases to cover short securities | |
Purchases and sales of short-term securities, net | |
Decrease in cash deposited with brokers for securities sold short | |
Increase in receivable for dividends | |
Increase in prepaid expenses and other assets | |
Increase in payable for investments purchased | |
Decrease in trustees’ fees and expenses payable | |
Decrease in management fee payable | |
Increase in administration fees payable | |
Decrease in distribution fees payable | |
Decrease in custody and accounting fees payable | |
Increase in payable for dividends and interest expense on securities sold short | |
Increase in accrued expenses and other liabilities | |
Proceeds from foreign currency transactions | |
Net realized gains on unaffiliated securities | |
Net realized losses on securities sold short | |
Net realized gains on foreign currency and foreign currency translations | |
Net change in unrealized gains (losses) on unaffiliated securities | |
Net change in unrealized gains (losses) on securities sold short | |
Net change in unrealized gain (losses) on foreign currency and foreign currency translations | |
Net cash provided by operating activities | |
Cash flows from financing activities | |
Proceeds from shares sold | |
Cost of shares repurchased | |
| |
Net cash used in financing activities | |
| |
Cash (including foreign currency) | |
| |
| |
Supplemental cash disclosure | |
Cash paid for dividends and interest expense on securities sold short | |
Supplemental non-cash financing disclosure | |
Reinvestment of dividends | |
The accompanying notes are an integral part of these financial statements.
Allspring Global Long/Short Equity Fund | 19
Financial highlights
(For a share outstanding throughout each period)
| Six months ended
April 30, 2023
| |
| | | | | |
Net asset value, beginning of period | | | | | | |
Net investment income (loss) | | | | | | |
Net realized and unrealized gains (losses) on investments | | | | | | |
Total from investment operations | | | | | | |
Distributions to shareholders from | | | | | | |
| | | | | | |
| | | | | | |
Total distributions to shareholders | | | | | | |
Net asset value, end of period | | | | | | |
| | | | | | |
Ratios to average net assets (annualized) | | | | | | |
| | | | | | |
| | | | | | |
Net investment income (loss)* | | | | | | |
| | | | | | |
| | | | | | |
Net assets, end of period (000s omitted) | | | | | | |
| Ratios include dividends and interest expense on securities sold short as follows: |
Six months ended April 30, 2023 (unaudited) | |
Year ended October 31, 2022 | |
Year ended October 31, 2021 | |
Year ended October 31, 2020 | |
Year ended October 31, 2019 | |
Year ended October 31, 2018 | |
| After the close of business on December 16, 2022, the Fund acquired the net assets of 361 Global Long/Short Equity Fund which became the accounting and performance survivor in the transaction. The information for the periods prior to December 16, 2022 is that of 361 Global Long/Short Equity Fund Investor Class. |
| Calculated based upon average shares outstanding |
| Total return calculations do not include any sales charges. Returns for periods of less than one year are not annualized. |
The accompanying notes are an integral part of these financial statements.
20 | Allspring Global Long/Short Equity Fund
(For a share outstanding throughout each period)
| |
Net asset value, beginning of period | |
| |
Net realized and unrealized gains (losses) on investments | |
Total from investment operations | |
Distributions to shareholders from | |
| |
Net asset value, end of period | |
| |
Ratios to average net assets (annualized) | |
| |
| |
| |
| |
| |
Net assets, end of period (000s omitted) | |
| Ratios include dividends and interest expense on securities sold short in the amount of 0.99%. |
| For the period from December 16, 2022 (commencement of class operations) to April 30, 2023. |
| Calculated based upon average shares outstanding |
| Total return calculations do not include any sales charges. Returns for periods of less than one year are not annualized. |
The accompanying notes are an integral part of these financial statements.
Allspring Global Long/Short Equity Fund | 21
(For a share outstanding throughout each period)
| Six months ended
April 30, 2023
| |
| | | | | |
Net asset value, beginning of period | | | | | | |
Net investment income (loss) | | | | | | |
Net realized and unrealized gains (losses) on investments | | | | | | |
Total from investment operations | | | | | | |
Distributions to shareholders from | | | | | | |
| | | | | | |
| | | | | | |
Total distributions to shareholders | | | | | | |
Net asset value, end of period | | | | | | |
| | | | | | |
Ratios to average net assets (annualized) | | | | | | |
| | | | | | |
| | | | | | |
Net investment income (loss)* | | | | | | |
| | | | | | |
| | | | | | |
Net assets, end of period (000s omitted) | | | | | | |
| Ratios include dividends and interest expense on securities sold short as follows: |
Six months ended April 30, 2023 (unaudited) | |
Year ended October 31, 2022 | |
Year ended October 31, 2021 | |
Year ended October 31, 2020 | |
Year ended October 31, 2019 | |
Year ended October 31, 2018 | |
| After the close of business on December 16, 2022, the Fund acquired the net assets of 361 Global Long/Short Equity Fund which became the accounting and performance survivor in the transaction. The information for the periods prior to December 16, 2022 is that of 361 Global Long/Short Equity Fund Class Y. |
| Calculated based upon average shares outstanding |
| Returns for periods of less than one year are not annualized. |
The accompanying notes are an integral part of these financial statements.
22 | Allspring Global Long/Short Equity Fund
(For a share outstanding throughout each period)
| Six months ended
April 30, 2023
| |
| | | | | |
Net asset value, beginning of period | | | | | | |
Net investment income (loss) | | | | | | |
Net realized and unrealized gains (losses) on investments | | | | | | |
Total from investment operations | | | | | | |
Distributions to shareholders from | | | | | | |
| | | | | | |
| | | | | | |
Total distributions to shareholders | | | | | | |
Net asset value, end of period | | | | | | |
| | | | | | |
Ratios to average net assets (annualized) | | | | | | |
| | | | | | |
| | | | | | |
Net investment income (loss)* | | | | | | |
| | | | | | |
| | | | | | |
Net assets, end of period (000s omitted) | | | | | | |
| Ratios include dividends and interest expense on securities sold short as follows: |
Six months ended April 30, 2023 (unaudited) | |
Year ended October 31, 2022 | |
Year ended October 31, 2021 | |
Year ended October 31, 2020 | |
Year ended October 31, 2019 | |
Year ended October 31, 2018 | |
| After the close of business on December 16, 2022, the Fund acquired the net assets of 361 Global Long/Short Equity Fund which became the accounting and performance survivor in the transaction. The information for the periods prior to December 16, 2022 is that of 361 Global Long/Short Equity Fund Class I. |
| Calculated based upon average shares outstanding |
| Returns for periods of less than one year are not annualized. |
The accompanying notes are an integral part of these financial statements.
Allspring Global Long/Short Equity Fund | 23
Notes to financial statements (unaudited)
Notes to financial statements
Allspring Funds Trust (the “Trust”), a Delaware statutory trust organized on December 12, 2014, is an open-end management investment company registered under the Investment Company Act of 1940, as amended (the “1940 Act”). As an investment company, the Trust follows the accounting and reporting guidance in Financial Accounting Standards Board (“FASB”) Accounting Standards Codification Topic 946, Financial Services – Investment Companies. These financial statements report on the Allspring Global Long/Short Equity Fund (the “Fund”) which is a diversified series of the Trust.
After the close of business on December 16, 2022, the net assets of 361 Global Long/Short Equity Fund were acquired by the Fund, which was created to receive the assets of 361 Global Long/Short Equity Fund, in an exchange for shares of the Fund. Investor Class, Class Y and Class I shares of 361 Global Long/Short Equity Fund received Class A, Class R6 and Institutional Class shares, respectively, of the Fund in the transaction. Since 361 Global Long/Short Equity Fund contributed all of the net assets and shareholders to the newly created Allspring fund, the accounting and performance history of 361 Global Long/Short Equity Fund has been carried forward in the financial statements contained herein.
2.
SIGNIFICANT ACCOUNTING POLICIES
The following significant accounting policies, which are consistently followed in the preparation of the financial statements of the Fund, are in conformity with U.S. generally accepted accounting principles which require management to make estimates and assumptions that affect the reported amounts of assets and liabilities, disclosure of contingent assets and liabilities at the date of the financial statements, and the reported amounts of income and expenses during the reporting period. Actual results could differ from those estimates.
Securities valuation
All investments are valued each business day as of the close of regular trading on the New York Stock Exchange (generally 4 p.m. Eastern Time), although the Funds may deviate from this calculation time under unusual or unexpected circumstances.
Equity securities that are listed on a foreign or domestic exchange or market are valued at the official closing price or, if none, the last sales price.
The values of securities denominated in foreign currencies are translated into U.S. dollars at rates provided by an independent foreign currency pricing source at a time each business day specified by the Valuation Committee at Allspring Funds Management, LLC (“Allspring Funds Management”).
Many securities markets and exchanges outside the U.S. close prior to the close of the New York Stock Exchange and therefore may not fully reflect trading or events that occur after the close of the principal exchange in which the foreign securities are traded, but before the close of the New York Stock Exchange. If such trading or events are expected to materially affect the value of such securities, then fair value pricing procedures implemented by Allspring Funds Management are applied. These procedures take into account multiple factors including movements in U.S. securities markets after foreign exchanges close. Foreign securities that are fair valued under these procedures are categorized as Level 2 and the application of these procedures may result in transfers between Level 1 and Level 2. Depending on market activity, such fair valuations may be frequent. Such fair value pricing may result in net asset values that are higher or lower than net asset values based on the last reported sales price or latest quoted bid price. On April 30, 2023, such fair value pricing was used in pricing certain foreign securities.
Investments in registered open-end investment companies (other than those listed on a foreign or domestic exchange or market) are valued at net asset value.
Investments which are not valued using any of the methods discussed above are valued at their fair value, as determined in good faith by Allspring Funds Management, which was named the valuation designee by the Board of Trustees. As the valuation designee, Allspring Funds Management is responsible for day-to-day valuation activities for the Allspring Funds. In connection with these responsibilities, Allspring Funds Management has established a Valuation Committee and has delegated to it the authority to take any actions regarding the valuation of portfolio securities that the Valuation Committee deems necessary or appropriate, including determining the fair value of portfolio securities. On a quarterly basis, the Board of Trustees receives reports of valuation actions taken by the Valuation Committee. On at least an annual basis, the Board of Trustees receives an assessment of the adequacy and effectiveness of Allspring Funds Management’s process for determining the fair value of the portfolio of investments.
Foreign currency translation
The accounting records of the Fund are maintained in U.S. dollars. The values of other assets and liabilities denominated in foreign currencies are translated into U.S. dollars at rates provided by an independent foreign currency pricing source at a time each business day specified by the Valuation Committee. Purchases and sales of securities, and income and expenses are converted at the rate of exchange on the respective dates of such transactions. Net realized foreign exchange gains or losses arise from sales of foreign currencies, currency gains or losses realized between the trade and settlement dates on securities transactions, and the difference between the amounts of dividends, interest and foreign withholding taxes recorded and the U.S. dollar equivalent of the amounts actually paid or received. Net unrealized foreign exchange gains and losses arise from changes in the fair value of assets and liabilities other than investments in securities resulting from changes in exchange rates. The changes in net assets arising from changes in exchange rates of securities and the changes in net assets resulting from changes in market prices of securities are not separately presented. Such changes are included in net realized and unrealized gains or losses from investments.
24 | Allspring Global Long/Short Equity Fund
Notes to financial statements (unaudited)
Short sales
The Fund may sell a security it does not own in anticipation of a decline in the market value of that security (short sale). When the Fund makes a short sale, it must borrow the security sold short and deliver it to the buyer. The Fund is then obligated to replace the security borrowed by purchasing the security at the market price at the time of replacement.
The Fund records the proceeds as a liability which is marked-to-market daily based upon quotations from an independent pricing service or an independent broker-dealer and any change in value is recorded as an unrealized gain or loss. Any interest or dividends accrued on such borrowed securities during the period of the loan are recorded as an expense on the Statement of Operations. To borrow the security, the Fund may be required to pay a premium, which would decrease the proceeds of the security sold. A gain, limited to the price at which the Fund sold the security short, or a loss, unlimited in size, will be recognized upon the closing of a short sale if the market price at the closing is less than or greater than, respectively, the proceeds originally received. Until the short sale is closed or the borrowed security is replaced, the Fund maintains a segregated account of cash or liquid securities, the dollar value of which is at least equal to the market value of the security at the time of the short sale.
Security transactions and income recognition
Securities transactions are recorded on a trade date basis. Realized gains or losses are recorded on the basis of identified cost.
Dividend income is recognized on the ex-dividend date, except for certain dividends from foreign securities, which are recorded as soon as the custodian verifies the ex-dividend date. Dividend income is recorded net of foreign taxes withheld where recovery of such taxes is not assured.
Distributions to shareholders
Distributions to shareholders from net investment income and any net realized gains are recorded on the ex-dividend date and paid at least annually. Such distributions are determined in accordance with income tax regulations and may differ from U.S. generally accepted accounting principles. Dividend sources are estimated at the time of declaration. The tax character of distributions is determined as of the Fund’s fiscal year end. Therefore, a portion of the Fund’s distributions made prior to the Fund’s fiscal year end may be categorized as a tax return of capital at year end.
Federal and other taxes
The Fund intends to continue to qualify as a regulated investment company by distributing substantially all of its investment company taxable income and any net realized capital gains (after reduction for capital loss carryforwards) sufficient to relieve it from all, or substantially all, federal income taxes. Accordingly, no provision for federal income taxes was required.
The Fund’s income and federal excise tax returns and all financial records supporting those returns for the prior three fiscal years are subject to examination by the federal and Delaware revenue authorities. Management has analyzed the Fund’s tax positions taken on federal, state, and foreign tax returns, as applicable, for all open tax years and does not believe that there are any uncertain tax positions that require recognition of a tax liability.
As of April 30, 2023, the aggregate cost of all investments for federal income tax purposes was $787,208,743 and the unrealized gains (losses) consisted of:
As of October 31, 2022, the Fund had capital loss carryforwards which consisted of $29,252,686 in short-term capital losses.
Class allocations
The separate classes of shares offered by the Fund differ principally in applicable sales charges, distribution, shareholder servicing, and administration fees. Class specific expenses are charged directly to that share class. Investment income, common fund-level expenses, and realized and unrealized gains (losses) on investments are allocated daily to each class of shares based on the relative proportion of net assets of each class.
Allspring Global Long/Short Equity Fund | 25
Notes to financial statements (unaudited)
3.
FAIR VALUATION MEASUREMENTS
Fair value measurements of investments are determined within a framework that has established a fair value hierarchy based upon the various data inputs utilized in determining the value of the Fund’s investments. The three-level hierarchy gives the highest priority to unadjusted quoted prices in active markets for identical assets or liabilities (Level 1) and the lowest priority to unobservable inputs (Level 3). The Fund’s investments are classified within the fair value hierarchy based on the lowest level of input that is significant to the fair value measurement. The inputs are summarized into three broad levels as follows:
•Level 1—quoted prices in active markets for identical securities
•Level 2—other significant observable inputs (including quoted prices for similar securities, interest rates, prepayment speeds, credit risk, etc.)
•Level 3—significant unobservable inputs (including the Fund’s own assumptions in determining the fair value of investments)
The inputs or methodologies used for valuing investments in securities are not necessarily an indication of the risk associated with investing in those securities.
26 | Allspring Global Long/Short Equity Fund
Notes to financial statements (unaudited)
The following is a summary of the inputs used in valuing the Fund’s assets and liabilities as of April 30, 2023:
| | Other significant
observable inputs
(Level 2) | Significant
unobservable inputs
(Level 3) | |
| | | | |
| | | | |
| | | | |
| | | | |
| | | | |
| | | | |
| | | | |
| | | | |
| | | | |
| | | | |
| | | | |
| | | | |
| | | | |
| | | | |
| | | | |
| | | | |
| | | | |
| | | | |
| | | | |
| | | | |
| | | | |
| | | | |
| | | | |
| | | | |
| | | | |
| | | | |
| | | | |
| | | | |
| | | | |
| | | | |
| | | | |
| | | | |
| | | | |
| | | | |
| | | | |
| | | | |
| | | | |
| | | | |
| | | | |
| | | | |
| | | | |
| | | | |
| | | | |
| | | | |
| | | | |
| | | | |
Additional sector, industry or geographic detail, if any, is included in the Portfolio of Investments.
For the six months ended April 30, 2023, the Portfolio did not have transfers into/out of Level 3.
Allspring Global Long/Short Equity Fund | 27
Notes to financial statements (unaudited)
4.
TRANSACTIONS WITH AFFILIATES
Management fee
Allspring Funds Management, a wholly owned subsidiary of Allspring Global Investments Holdings, LLC, a holding company indirectly owned by certain private funds of GTCR LLC and Reverence Capital Partners, L.P., is the manager of the Fund and provides advisory and fund-level administrative services under an investment management agreement. Under the investment management agreement, Allspring Funds Management is responsible for, among other services, implementing the investment objectives and strategies of the Fund, supervising the subadviser and providing fund-level administrative services in connection with the Fund’s operations. As compensation for its services under the investment management agreement, Allspring Funds Management is entitled to receive a management fee at the following annual rate based on the Fund’s average daily net assets:
Prior to December 19, 2022, the predecessor fund paid an advisory fee at an annual rate of 1.25% of its average daily net assets.
For the six months ended April 30, 2023, the management fee was equivalent to an annual rate of 1.25% of the Fund’s average daily net assets.
Administration fees
Under a class-level administration agreement, Allspring Funds Management provides class-level administrative services to the Fund, which includes paying fees and expenses for services provided by the transfer agent, sub-transfer agents, omnibus account servicers and record-keepers. As compensation for its services under the class-level administration agreement, Allspring Funds Management receives an annual fee which is calculated based on the average daily net assets of each class as follows:
| Class-level
administration fee |
| |
| |
| |
| |
Waivers and/or expense reimbursements
Allspring Funds Management has contractually committed to waive and/or reimburse management and administration fees to the extent necessary to maintain certain net operating expense ratios for the Fund. When each class of the Fund has exceeded its expense cap, Allspring Funds Management will waive fees and/or reimburse expenses from fund-level expenses on a proportionate basis and then from class specific expenses. When only certain classes exceed their expense caps, waivers and/or reimbursements are applied against class specific expenses before fund-level expenses. Allspring Funds Management has contractually committed through February 28, 2025 to waive fees and/or reimburse expenses to the extent necessary to cap expenses. Prior to or after the commitment expiration date, the caps may be increased or the commitment to maintain the caps may be terminated only with the approval of the Board of Trustees. As of April 30, 2023, excluding expenses from dividends and interest expense on securities sold short, the contractual expense caps are as follows:
Prior to December 19, 2022, the predecessor fund’s expenses were capped at 1.39% for Class A shares, 1.39% for Class R6 and 1.39% for Institutional Class shares. These expense caps did not include dividends and interest expense on securities sold short or any class-level expenses.
Distribution fees
The Trust has adopted a distribution plan for Class C shares pursuant to Rule 12b-1 under the 1940 Act. A distribution fee is charged to Class C shares and paid to Allspring Funds Distributor, LLC (“Allspring Funds Distributor”), the principal underwriter, an affiliate of Allspring Funds Management, at an annual rate up to 0.75% of the average daily net assets of Class C shares. Prior to December 19, 2022, Investor Class shares of the predecessor fund were charged a fee at an annual rate up to 0.25% of its average daily net assets.
28 | Allspring Global Long/Short Equity Fund
Notes to financial statements (unaudited)
In addition, Allspring Funds Distributor is entitled to receive the front-end sales charge from the purchase of Class A shares and a contingent deferred sales charge on the redemption of certain Class A shares. Allspring Funds Distributor is also entitled to receive the contingent deferred sales charges from redemptions of Class C shares. For the six months ended April 30, 2023, Allspring Funds Distributor received $790 from the sale of Class A shares. No contingent deferred sales charges were incurred by Class A and Class C shares for the six months ended April 30, 2023.
Shareholder servicing fees
The Trust has entered into contracts with one or more shareholder servicing agents, whereby Class A and Class C are charged a fee at an annual rate up to 0.25% of the average daily net assets of each respective class. Prior to December 19, 2022, Investor Class and Class I shares of the predecessor fund were each charged a fee at an annual rate up to 0.15% of its average daily net assets. A portion of these total shareholder servicing fees were paid to affiliates of the Fund.
Interfund transactions
The Fund may purchase or sell portfolio investment securities to certain affiliates pursuant to Rule 17a-7 under the 1940 Act and under procedures adopted by the Board of Trustees. The procedures have been designed to ensure that these interfund transactions, which do not incur broker commissions, are effected at current market prices.
5.
INVESTMENT PORTFOLIO TRANSACTIONS
Purchases and sales of investments, excluding U.S. government obligations (if any) and short-term securities, for the six months ended April 30, 2023 were $1,922,707,619 and $1,960,015,301, respectively.
In an agreement with a prime broker, the Fund purchased or borrowed securities on margin and was charged interest based on a borrowing rate equal to the Federal Funds rate plus a spread. During the six months ended April 30, 2023, the Fund had average borrowings outstanding of $101,203,779 (on an annualized basis) at a rate of 4.16% and recorded interest in the amount of $2,062,394, which represents 0.68% of its average daily net assets (on an annualized basis).
The Trust (excluding the money market funds), Allspring Master Trust and Allspring Variable Trust are parties to a $350,000,000 revolving credit agreement whereby the Fund is permitted to use bank borrowings for temporary or emergency purposes, such as to fund shareholder redemption requests. Interest under the credit agreement is charged to the Fund based on borrowing rate equal to the higher of the Federal Funds rate or the overnight bank funding rate in effect on that day plus a spread. In addition, an annual commitment fee based on the unused balance is allocated to each participating fund.
For the six months ended April 30, 2023, there were no borrowings by the Fund under the agreement.
Under the Fund’s organizational documents, the officers and Trustees have been granted certain indemnification rights against certain liabilities that may arise out of performance of their duties to the Fund. The Fund has entered into a separate agreement with each Trustee that converts indemnification rights currently existing under the Fund’s organizational documents into contractual rights that cannot be changed in the future without the consent of the Trustee. Additionally, in the normal course of business, the Fund may enter into contracts with service providers that contain a variety of indemnification clauses. The Fund’s maximum exposure under these arrangements is dependent on future claims that may be made against the Fund and, therefore, cannot be estimated.
Allspring Global Long/Short Equity Fund | 29
Other information (unaudited)
Other information
Proxy voting information
A description of the policies and procedures used to determine how to vote proxies relating to portfolio securities is available without charge, upon request, by calling 1-800-222-8222, visiting our website at allspringglobal.com, or visiting the SEC website at sec.gov. Information regarding how the proxies related to portfolio securities were voted during the most recent 12-month period ended June 30 is available on the website at allspringglobal.com or by visiting the SEC website at sec.gov.
Quarterly portfolio holdings information
The Fund files its complete schedule of portfolio holdings with the SEC for the first and third quarters of each fiscal year as an exhibit to its reports on Form N-PORT. Shareholders may view the filed Form N-PORT by visiting the SEC website at sec.gov.
30 | Allspring Global Long/Short Equity Fund
Other information (unaudited)
BOARD OF TRUSTEES AND OFFICERS
Each of the Trustees and Officers listed in the table below acts in identical capacities for each fund in the Allspring family of funds, which consists of 127 mutual funds comprising the Allspring Funds Trust, Allspring Variable Trust, Allspring Master Trust and four closed-end funds (collectively the “Fund Complex”). This table should be read in conjunction with the Prospectus and the Statement of Additional Information1. The mailing address of each Trustee and Officer is 1415 Vantage Park Drive, 3rd Floor, Charlotte, NC 28203. Each Trustee and Officer serves an indefinite term, however, each Trustee serves such term until reaching the mandatory retirement age established by the Trustees.
Independent Trustees
| | Principal occupations during past five years or longer | Current other
public company or
investment
company
directorships |
William R. Ebsworth
(Born 1957) | | Retired. From 1984 to 2013, equities analyst, portfolio manager, research director and chief investment officer at Fidelity Management and Research Company in Boston, Tokyo, and Hong Kong, and retired in 2013 as Chief Investment Officer of Fidelity Strategic Advisers, Inc. where he led a team of investment professionals managing client assets. Prior thereto, Board member of Hong Kong Securities Clearing Co., Hong Kong Options Clearing Corp., the Thailand International Fund, Ltd., Fidelity Investments Life Insurance Company, and Empire Fidelity Investments Life Insurance Company. Audit Committee Chair and Investment Committee Chair of the Vincent Memorial Hospital Foundation (non-profit organization). Mr. Ebsworth is a CFA charterholder. | |
Jane A. Freeman
(Born 1953) | Trustee,
since 2015;
Chair Liaison,
since 2018 | Retired. From 2012 to 2014 and 1999 to 2008, Chief Financial Officer of Scientific Learning Corporation. From 2008 to 2012, Ms. Freeman provided consulting services related to strategic business projects. Prior to 1999, Portfolio Manager at Rockefeller & Co. and Scudder, Stevens & Clark. Board member of the Harding Loevner Funds from 1996 to 2014, serving as both Lead Independent Director and chair of the Audit Committee. Board member of the Russell Exchange Traded Funds Trust from 2011 to 2012 and the chair of the Audit Committee. Ms. Freeman is also an inactive Chartered Financial Analyst. | |
Isaiah Harris, Jr.
(Born 1952) | Trustee,
since 2009;
Audit Committee Chair,
since 2019 | Retired. Member of the Advisory Board of CEF of East Central Florida. Chairman of the Board of CIGNA Corporation from 2009 to 2021, and Director from 2005 to 2008. From 2003 to 2011, Director of Deluxe Corporation. Prior thereto, President and CEO of BellSouth Advertising and Publishing Corp. from 2005 to 2007, President and CEO of BellSouth Enterprises from 2004 to 2005 and President of BellSouth Consumer Services from 2000 to 2003. Emeritus member of the Iowa State University Foundation Board of Governors. Emeritus Member of the Advisory Board of Iowa State University School of Business. Advisory Board Member, Palm Harbor Academy (private school). Advisory Board Member, Fellowship of Christian Athletes. Mr. Harris is a certified public accountant (inactive status). | |
David F. Larcker
(Born 1950) | | Distinguished Visiting Fellow at the Hoover Institution since 2022. James Irvin Miller Professor of Accounting at the Graduate School of Business (Emeritus), Stanford University, Director of the Corporate Governance Research Initiative and Senior Faculty of The Rock Center for Corporate Governance since 2006. From 2005 to 2008, Professor of Accounting at the Graduate School of Business, Stanford University. Prior thereto, Ernst & Young Professor of Accounting at The Wharton School, University of Pennsylvania from 1985 to 2005. | |
Olivia S. Mitchell
(Born 1953) | Trustee,
since 2006;
Nominating and Governance Committee Chair,
since 2018 | International Foundation of Employee Benefit Plans Professor since 1993, Wharton School of the University of Pennsylvania. Director of Wharton’s Pension Research Council and Boettner Center on Pensions & Retirement Research, and Research Associate at the National Bureau of Economic Research. Previously taught at Cornell University from 1978 to 1993. | |
Timothy J. Penny
(Born 1951) | Trustee,
since 1996;
Chair,
since 2018 | President and Chief Executive Officer of Southern Minnesota Initiative Foundation, a non-profit organization, since 2007. Vice Chair of the Economic Club of Minnesota, since 2007. Co-Chair of the Committee for a Responsible Federal Budget, since 1995. Member of the Board of Trustees of NorthStar Education Finance, Inc., a non-profit organization, from 2007-2022. Senior Fellow of the University of Minnesota Humphrey Institute from 1995 to 2017. | |
1
The Statement of Additional Information includes additional information about the Trustees and is available, without charge, upon request, by calling 1-800-222-8222 or by visiting the website at allspringglobal.com.
Allspring Global Long/Short Equity Fund | 31
Other information (unaudited)
| Position held and length of service* | Principal occupations during past five years or longer | Current other public company or investment company directorships |
James G. Polisson
(Born 1959) | | Retired. Chief Marketing Officer, Source (ETF) UK Services, Ltd, from 2015 to 2017. From 2012 to 2015, Principal of The Polisson Group, LLC, a management consulting, corporate advisory and principal investing company. Chief Executive Officer and Managing Director at Russell Investments, Global Exchange Traded Funds from 2010 to 2012. Managing Director of Barclays Global Investors from 1998 to 2010 and Global Chief Marketing Officer for iShares and Barclays Global Investors from 2000 to 2010. Trustee of the San Francisco Mechanics’ Institute, a non- profit organization, from 2013 to 2015. Board member of the Russell Exchange Traded Fund Trust from 2011 to 2012. Director of Barclays Global Investors Holdings Deutschland GmbH from 2006 to 2009. Mr. Polisson is an attorney and has a retired status with the Massachusetts and District of Columbia Bar Associations. | |
Pamela Wheelock
(Born 1959) | Trustee,
since January 2020;
previously Trustee from
January 2018 to
July 2019 | Retired. Executive and Senior Financial leadership positions in the public, private and nonprofit sectors. Interim President and CEO, McKnight Foundation, 2020. Interim Commissioner, Minnesota Department of Human Services, 2019. Chief Operating Officer, Twin Cities Habitat for Humanity, 2017-2019. Vice President for University Services, University of Minnesota, 2012- 2016. Interim President and CEO, Blue Cross and Blue Shield of Minnesota, 2011-2012. Executive Vice-President and Chief Financial Officer, Minnesota Wild, 2002-2008. Commissioner, Minnesota Department of Finance, 1999-2002. Chair of the Board of Directors of Destination Medical Center Corporation. Board member of the Minnesota Wild Foundation. | |
| Length of service dates reflect the Trustee’s commencement of service with the Trust’s predecessor entities, where applicable. |
32 | Allspring Global Long/Short Equity Fund
Other information (unaudited)
Officers1
| Position held and
length of service | Principal occupations during past five years or longer |
| | President and Chief Executive Officer of Allspring Funds Management, LLC since 2017 and Head of Global Fund Governance of Allspring Global Investments since 2022. Prior thereto, co-president of Galliard Capital Management, LLC, an affiliate of Allspring Funds Management, LLC, from 2019 to 2022 and Head of Affiliated Managers, Allspring Global Investments, from 2014 to 2019 and Executive Vice President responsible for marketing, investments and product development for Allspring Funds Management, LLC, from 2009 to 2014. |
Jeremy DePalma
(Born 1974) | Treasurer,
since 2012
(for certain funds in
the Fund Complex);
since 2021 (for
the remaining funds in the Fund Complex) | Senior Vice President of Allspring Funds Management, LLC since 2009. Senior Vice President of Evergreen Investment Management Company, LLC from 2008 to 2010 and head of the Fund Reporting and Control Team within Fund Administration from 2005 to 2010. |
Christopher Baker
(Born 1976) | Chief Compliance Officer,
since 2022 | Global Chief Compliance Officer for Allspring Global Investments since 2022. Prior thereto, Chief Compliance Officer for State Street Global Advisors from 2018 to 2021. Senior Compliance Officer for the State Street divisions of Alternative Investment Solutions, Sector Solutions, and Global Marketing from 2015 to 2018. From 2010 to 2015 Vice President, Global Head of Investment and Marketing Compliance for State Street Global Advisors. |
Matthew Prasse
(Born 1983) | Chief Legal Officer,
since 2022;
Secretary,
since 2021 | Senior Counsel of the Allspring Legal Department since 2021. Senior Counsel of the Wells Fargo Legal Department from 2018 to 2021. Previously, Counsel for Barings LLC from 2015 to 2018. Prior to joining Barings, Associate at Morgan, Lewis & Bockius LLP from 2008 to 2015. |
1 For those Officers with tenures at Allspring Global Investments and/or Allspring Funds Management, LLC that began prior to 2021, such tenures include years of service during which these businesses/entities were known as Wells Fargo Asset Management and Wells Fargo Funds Management, LLC, respectively.
Allspring Global Long/Short Equity Fund | 33
For more information
More information about Allspring Funds is available free upon request. To obtain literature, please write, visit the Fund’s website, or call:
Allspring Funds
P.O. Box 219967
Kansas City, MO 64121-9967
Website: allspringglobal.com
Individual investors: 1-800-222-8222
Retail investment professionals: 1-888-877-9275
Institutional investment professionals: 1-800-260-5969
This report and the financial statements contained herein are submitted for the general information of the shareholders of the Fund. If this report is used for promotional purposes, distribution of the report must be accompanied or preceded by a current prospectus. Before investing, please consider the investment objectives, risks, charges, and expenses of the investment. For a current prospectus and, if available, a summary prospectus, containing this information, call 1-800-222-8222 or visit the Fund’s website at allspringglobal.com. Read the prospectus carefully before you invest or send money.
Allspring Global InvestmentsTM is the trade name for the asset management firms of Allspring Global Investments Holdings, LLC, a holding company indirectly owned by certain private funds of GTCR LLC and Reverence Capital Partners, L.P. These firms include but are not limited to Allspring Global Investments, LLC, and Allspring Funds Management, LLC. Certain products managed by Allspring entities are distributed by Allspring Funds Distributor, LLC (a broker-dealer and Member FINRA/SIPC).
This material is for general informational and educational purposes only and is NOT intended to provide investment advice or a recommendation of any kind - including a recommendation for any specific investment, strategy, or plan.
© 2023 Allspring Global Investments Holdings, LLC. All rights reserved.
ALL-05052023-ijxdvwbe 06-23
SAR4340 04-23
Allspring International Equity Fund
Semi-Annual Report
April 30, 2023
The views expressed and any forward-looking statements are as of April 30, 2023, unless otherwise noted, and are those of the Fund’s portfolio managers and/or Allspring Global Investments. Discussions of individual securities or the markets generally are not intended as individual recommendations. Future events or results may vary significantly from those expressed in any forward-looking statements. The views expressed are subject to change at any time in response to changing circumstances in the market. Allspring Global Investments disclaims any obligation to publicly update or revise any views expressed or forward-looking statements.
Allspring International Equity Fund | 1
Letter to shareholders (unaudited)
Andrew Owen
President
Allspring Funds
Dear Shareholder:
We are pleased to offer you this semi-annual report for the Allspring International Equity Fund for the six-month period that ended April 30, 2023. Globally, stocks and bonds rebounded strongly despite ongoing volatility. While navigating persistently high inflation and the impact of ongoing aggressive central bank rate hikes, markets rallied on signs of declining inflation, anticipation of an end to the central bank monetary tightening cycle, and the stimulating impact of China removing its strict COVID-19 lockdowns in December. For the six-month period, domestic U.S. and global stocks and bonds had strong results. After suffering deep and broad losses through 2022, recent fixed income performance benefited from a base of higher yields that have the potential to generate higher income.
For the period, U.S. stocks, based on the S&P 500 Index,1 returned 8.63%. International stocks, as measured by the MSCI ACWI ex USA Index (Net),2 gained 20.65% while the MSCI EM Index (Net) (USD),3 returned 16.36%. Among bond indexes, the Bloomberg U.S. Aggregate Bond Index4 returned 6.91%, the Bloomberg Global Aggregate ex-USD Index (unhedged)5 gained 10.55%, the Bloomberg Municipal Bond Index6 gained 7.65%, and the ICE BofA U.S. High Yield Index7 returned 5.92%.
Despite high inflation and central bank rate hikes, markets rally.
Stocks and bonds rallied in November after earlier volatility. Economic news was encouraging, driven by U.S. labor market strength. Although central banks kept increasing rates, hopes rose for an easing in the pace of rate hikes and a possible end to central bank monetary tightening in 2023. Although inflation remained at record highs in the eurozone, we began to see signs of a possible decline in inflationary pressures as U.S. inflation moderated, with a 7.1% annual price rise in November and a monthly price increase of just 0.1%. China’s economic data remained weak, reflecting its zero-COVID-19 policy.
Financial markets cooled in December, with U.S. equities posting negative overall results in response to a weakening U.S. dollar. Fixed income securities ended one of their worst years ever, with flat overall monthly returns as markets weighed the hopes for an end to the monetary tightening cycle with the reality that central banks had not completed their jobs yet. U.S. Consumer Price Index (CPI)8 data showed a strong consistent trend downward, which brought down the 12-month CPI to 6.5% in December from 9.1% in June. Other countries and regions reported still-high but declining inflation rates as the year wound down.
1
The S&P 500 Index consists of 500 stocks chosen for market size, liquidity, and industry group representation. It is a market-value-weighted index with each stock’s weight in the index proportionate to its market value. You cannot invest directly in an index.
2
The Morgan Stanley Capital International (MSCI) All Country World Index (ACWI) ex USA Index (Net) is a free-float-adjusted market-capitalization-weighted index that is designed to measure the equity market performance of developed and emerging markets, excluding the U.S. Source: MSCI. MSCI makes no express or implied warranties or representations and shall have no liability whatsoever with respect to any MSCI data contained herein. The MSCI data may not be further redistributed or used as a basis for other indexes or any securities or financial products. This report is not approved, reviewed, or produced by MSCI. You cannot invest directly in an index.
3
The MSCI Emerging Markets (EM) Index (Net) (USD) is a free-float-adjusted market-capitalization-weighted index that is designed to measure the equity market performance of emerging markets. You cannot invest directly in an index.
4
The Bloomberg U.S. Aggregate Bond Index is a broad-based benchmark that measures the investment-grade, U.S.-dollar-denominated, fixed-rate taxable bond market, including Treasuries, government-related and corporate securities, mortgage-backed securities (agency fixed-rate and hybrid adjustable-rate mortgage pass-throughs), asset-backed securities, and commercial mortgage-backed securities. You cannot invest directly in an index.
5
The Bloomberg Global Aggregate ex-USD Index (unhedged) is an unmanaged index that provides a broad-based measure of the global investment-grade fixed-income markets excluding the U.S.-dollar-denominated debt market. You cannot invest directly in an index.
6
The Bloomberg Municipal Bond Index is an unmanaged index composed of long-term tax-exempt bonds with a minimum credit rating of Baa. You cannot invest directly in an index.
7
The ICE BofA U.S. High Yield Index is a market-capitalization-weighted index of domestic and Yankee high yield bonds. The index tracks the performance of high yield securities traded in the U.S. bond market. You cannot invest directly in an index. Copyright 2023. ICE Data Indices, LLC. All rights reserved.
8
The U.S. Consumer Price Index (CPI) is a measure of the average change over time in the prices paid by urban consumers for a market basket of consumer goods and services. You cannot invest directly in an index.
2 | Allspring International Equity Fund
Letter to shareholders (unaudited)
The year 2023 began with a rally across global equities and fixed income securities. Investor optimism rose in response to data indicating declining inflation rates and the reopening of China’s economy with the abrupt end to its zero-COVID-19 policy. The U.S. reported surprisingly strong job gains—employers added more than 500,000 jobs—and unemployment fell to 3.4%, the lowest level since 1969. Meanwhile, wage growth, seen as a potential contributor to ongoing high inflation, continued to moderate. All eyes remained fixed on the Federal Reserve (Fed) and on how many more rate hikes remain in this tightening cycle. The 0.25% federal funds rate hike announced in January was the Fed’s smallest rate increase since March 2022.
Financial markets declined in February as investors responded unfavorably to resilient economic data. The takeaway: Central banks will likely continue their monetary tightening cycle for longer than markets had priced in. In this environment—where strong economic data is seen as bad news—the resilient U.S. labor market was seen as a negative while the inflation rate has not been falling quickly enough for the Fed, which raised interest rates by 0.25% in early February. Meanwhile, the Bank of England and the European Central Bank both raised rates by 0.50%.
The collapse of Silicon Valley Bank in March, the second-largest banking failure in U.S. history, led to a classic bank run that spread to Europe where Switzerland’s Credit Suisse was taken over by its rival, UBS. The banking industry turmoil created an additional challenge for central banks in balancing inflationary concerns against potential economic weakening. Meanwhile, recent data pointed to economic strength in the U.S., Europe, and China. And China’s economy continued to rebound after the removal of its COVID-19 lockdown. Inflation rates in the U.S., the U.K., and Europe all remained higher than central bank targets, leading to additional rate hikes in March.
Economic data released in April pointed to global resilience, as Purchasing Managers Indexes1 in the U.S., U.K., and eurozone beat expectations and China reported first-quarter annualized economic growth of 4.5%. Despite banking industry stress, developed market stocks had monthly gains. The U.S. labor market remained strong, with a 3.5% jobless rate and monthly payroll gains above 200,000. However, uncertainty and inflationary concerns weighed on investors in the U.S. and abroad.
Don’t let short-term uncertainty derail long-term investment goals.
Periods of investment uncertainty can present challenges, but experience has taught us that maintaining long-term investment goals can be an effective way to plan for the future. To help you create a sound strategy based on your personal goals and risk tolerance, Allspring Funds offers more than 100 mutual funds spanning a wide range of asset classes and investment styles. Although diversification cannot guarantee an investment profit or prevent losses, we believe it can be an effective way to manage investment risk and potentially smooth out overall portfolio performance. We encourage investors to know their investments and to understand that appropriate levels of risk-taking may unlock opportunities.
Thank you for choosing to invest with Allspring Funds. We appreciate your confidence in us and remain committed to helping you meet your financial needs.
Sincerely,
Andrew Owen
President
Allspring Funds
“ The collapse of Silicon Valley Bank in March, the second-largest banking failure in U.S. history, led to a classic bank run that spread to Europe where Switzerland’s Credit Suisse was taken over by its rival, UBS. ”
For further information about your fund, contact your investment professional, visit our website at allspringglobal.com, or call us directly at 1-800-222-8222.
1
The Purchasing Managers Index (PMI) is an index of the prevailing direction of economic trends in the manufacturing and service sectors. You cannot invest directly in an index.
Allspring International Equity Fund | 3
Performance highlights (unaudited)
Performance highlights
| The Fund seeks long-term capital appreciation. |
| Allspring Funds Management, LLC |
| Allspring Global Investments, LLC |
| Venkateshwar (Venk) Lal, Dale A. Winner, CFA |
Average annual total returns (%) as of April 30, 2023 |
| | | | |
| | | | | | | | | |
| | | | | | | | | |
| | | | | | | | | |
| | | | | | | | | |
| | | | | | | | | |
Administrator Class (WFEDX) | | | | | | | | | |
Institutional Class (WFENX) | | | | | | | | | |
MSCI ACWI ex USA Index (Net)4 | | | | | | | | | |
MSCI ACWI ex USA Value Index (Net)5 | | | | | | | | | |
Figures quoted represent past performance, which is no guarantee of future results, and do not reflect taxes that a shareholder may pay on an investment in a fund. Investment return and principal value of an investment will fluctuate so that an investor’s shares, when redeemed, may be worth more or less than their original cost. Performance shown without sales charges would be lower if sales charges were reflected. Current performance may be lower or higher than the performance data quoted, which assumes the reinvestment of dividends and capital gains. Current month-end performance is available on the Fund’s website, allspringglobal.com.
Index returns do not include transaction costs associated with buying and selling securities, any mutual fund fees or expenses, or any taxes. It is not possible to invest directly in an index.
For Class A shares, the maximum front-end sales charge is 5.75%. For Class C shares, the maximum contingent deferred sales charge is 1.00%. Performance including a contingent deferred sales charge assumes the sales charge for the corresponding time period. Class R, Class R6, Administrator Class and Institutional Class shares are sold without a front-end sales charge or contingent deferred sales charge.
|
| Reflects the expense ratios as stated in the most recent prospectuses. The expense ratios shown are subject to change and may differ from the annualized expense ratios shown in the financial highlights of this report. |
| The manager has contractually committed through February 29, 2024, to waive fees and/or reimburse expenses to the extent necessary to cap total annual fund operating expenses after fee waivers at 1.14% for Class A, 1.89% for Class C, 1.39% for Class R, 0.79% for Class R6, 1.14% for Administrator Class and 0.84% for Institutional Class. Brokerage commissions, stamp duty fees, interest, taxes, acquired fund fees and expenses (if any), and extraordinary expenses are excluded from the expense caps. Prior to or after the commitment expiration date, the caps may be increased or the commitment to maintain the caps may be terminated only with the approval of the Board of Trustees. Without these caps, the Fund’s returns would have been lower. The expense ratio paid by an investor is the net expense ratio (the total annual fund operating expenses after fee waivers) as stated in the prospectuses. |
| Historical performance shown for the Class R6 shares prior to their inception reflects the performance of the Institutional Class shares, and includes the higher expenses applicable to the Institutional Class shares. If these expenses had not been included, returns for the Class R6 shares would be higher. |
| The Morgan Stanley Capital International (MSCI) All Country World Index (ACWI) ex USA Index (Net) is a free-float-adjusted market capitalization-weighted index that is designed to measure the equity market performance of developed and emerging markets, excluding the U.S. Source: MSCI. MSCI makes no express or implied warranties or representations and shall have no liability whatsoever with respect to any MSCI data contained herein. The MSCI data may not be further redistributed or used as a basis for other indexes or any securities or financial products. This report is not approved, reviewed, or produced by MSCI. You cannot invest directly in an index. |
| The MSCI ACWI ex USA Value Index (Net) captures large and mid-cap securities exhibiting overall value style characteristics across developed and emerging markets countries excluding the U.S. The value investment style characteristics for index construction are defined using three variables: book value to price, 12-month forward earnings to price, and dividend yield. You cannot invest directly in an index. |
Stock values fluctuate in response to the activities of individual companies and general market and economic conditions. Foreign investments are especially volatile and can rise or fall dramatically due to differences in the political and economic conditions of the host country. These risks are generally intensified in emerging markets. The use of derivatives may reduce returns and/or increase volatility. Certain investment strategies tend to increase the total risk of an investment (relative to the broader market). This fund is exposed to smaller-company securities risk. Consult the Fund’s prospectus for additional information on these and other risks.
CFA® and Chartered Financial Analyst® are trademarks owned by CFA Institute. |
4 | Allspring International Equity Fund
Performance highlights (unaudited)
Ten largest holdings (%) as of April 30, 20231 |
| |
Asahi Group Holdings Ltd. | |
| |
| |
Samsonite International SA | |
| |
| |
Samsung Electronics Co. Ltd. | |
| |
Mitsubishi UFJ Financial Group, Inc. | |
| Figures represent the percentage of the Fund’s net assets. Holdings are subject to change and may have changed since the date specified. |
Sector allocation as of April 30, 20231 |
| Figures represent the percentage of the Fund’s long-term investments. Allocations are subject to change and may have changed since the date specified. |
Geographic allocation as of April 30, 20231 |
| Figures represent the percentage of the Fund’s long-term investments. Allocations are subject to change and may have changed since the date specified. |
Allspring International Equity Fund | 5
Fund expenses (unaudited)
Fund expenses
As a shareholder of the Fund, you incur two types of costs: (1) transaction costs, including sales charges (loads) on purchase payments and contingent deferred sales charges (if any) on redemptions and (2) ongoing costs, including management fees, distribution (12b-1) and/or shareholder servicing fees, and other Fund expenses. This example is intended to help you understand your ongoing costs (in dollars) of investing in the Fund and to compare these costs with the ongoing costs of investing in other mutual funds.
The example is based on an investment of $1,000 invested at the beginning of the six-month period and held for the entire period from November 1, 2022 to April 30, 2023.
Actual expenses
The “Actual” line of the table below provides information about actual account values and actual expenses. You may use the information in this line, together with the amount you invested, to estimate the expenses that you paid over the period. Simply divide your account value by $1,000 (for example, an $8,600 account value divided by $1,000 = 8.6), then multiply the result by the number in the “Actual” line under the heading entitled “Expenses paid during period” for your applicable class of shares to estimate the expenses you paid on your account during this period.
Hypothetical example for comparison purposes
The “Hypothetical” line of the table below provides information about hypothetical account values and hypothetical expenses based on the Fund’s actual expense ratio and an assumed rate of return of 5% per year before expenses, which is not the Fund’s actual return. The hypothetical account values and expenses may not be used to estimate the actual ending account balance or expenses you paid for the period. You may use this information to compare the ongoing costs of investing in the Fund and other funds. To do so, compare this 5% hypothetical example with the 5% hypothetical examples that appear in the shareholder reports of the other funds.
Please note that the expenses shown in the table are meant to highlight your ongoing costs only and do not reflect any transactional costs, such as sales charges (loads) and contingent deferred sales charges. Therefore, the “Hypothetical” line of the table is useful in comparing ongoing costs only, and will not help you determine the relative total costs of owning different funds. In addition, if these transactional costs were included, your costs would have been higher.
| Beginning
account value
11-1-2022 | Ending
account value
4-30-2023 | | Annualized net
expense ratio |
| | | | |
| | | | |
Hypothetical (5% return before expenses) | | | | |
| | | | |
| | | | |
Hypothetical (5% return before expenses) | | | | |
| | | | |
| | | | |
Hypothetical (5% return before expenses) | | | | |
| | | | |
| | | | |
Hypothetical (5% return before expenses) | | | | |
| | | | |
| | | | |
Hypothetical (5% return before expenses) | | | | |
| | | | |
| | | | |
Hypothetical (5% return before expenses) | | | | |
1 Expenses paid is equal to the annualized net expense ratio of each class multiplied by the average account value over the period, multiplied by 181 divided by 365 (to reflect the one-half-year period).
6 | Allspring International Equity Fund
Portfolio of investments—April 30, 2023 (unaudited)
| | | | | |
| | | | | | |
| | | | | | |
Qantas Airways Ltd. (Industrials, Passenger airlines) † | | | | | | |
| | | | | | |
3R Petroleum Oleo E Gas SA (Energy, Oil, gas & consumable fuels) † | | | | | | |
CPFL Energia SA (Utilities, Electric utilities) † | | | | | | |
| | | | | | |
| | | | | | |
Quebecor, Inc. Class B (Communication services, Media) | | | | | | |
SNC-Lavalin Group, Inc. (Industrials, Construction & engineering) | | | | | | |
| | | | | | |
| | | | | | |
China Resources Land Ltd. (Real estate, Real estate management & development) | | | | | | |
Inner Mongolia Yili Industrial Group Co. Ltd. Class A (Consumer staples, Food products) † | | | | | | |
LONGi Green Energy Technology Co. Ltd. Class A (Information technology, Semiconductors & semiconductor equipment) † | | | | | | |
Midea Group Co. Ltd. Class A (Consumer discretionary, Household durables) | | | | | | |
Oppein Home Group, Inc. Class A (Consumer discretionary, Household durables) † | | | | | | |
Topsports International Holdings Ltd. (Consumer discretionary, Specialty retail) 144A | | | | | | |
Xinyi Glass Holdings Ltd. (Industrials, Building products) | | | | | | |
| | | | | | |
| | | | | | |
Danske Bank AS (Financials, Banks) † | | | | | | |
| | | | | | |
CIE de Saint-Gobain (Industrials, Building products) † | | | | | | |
Orange SA (Communication services, Diversified telecommunication services) | | | | | | |
Sanofi (Health care, Pharmaceuticals) † | | | | | | |
Sodexo SA (Consumer discretionary, Hotels, restaurants & leisure) † | | | | | | |
Worldline SA (Financials, Financial services) 144A† | | | | | | |
| | | | | | |
| | | | | | |
ING Groep NV (Financials, Banks) † | | | | | | |
Rheinmetall AG (Industrials, Aerospace & defense) | | | | | | |
Siemens AG (Industrials, Industrial conglomerates) | | | | | | |
| | | | | | |
| | | | | | |
Tech Mahindra Ltd. (Information technology, IT services) | | | | | | |
The accompanying notes are an integral part of these financial statements.
Allspring International Equity Fund | 7
Portfolio of investments—April 30, 2023 (unaudited)
| | | | | |
| | | | | | |
Greencore Group PLC (Consumer staples, Food products) † | | | | | | |
ICON PLC (Health care, Life sciences tools & services) † | | | | | | |
| | | | | | |
Isle of Man (U.K.): 1.51% | | | | | | |
Entain PLC (Consumer discretionary, Hotels, restaurants & leisure) | | | | | | |
| | | | | | |
Check Point Software Technologies Ltd. (Information technology, Software) † | | | | | | |
| | | | | | |
Prysmian SpA (Industrials, Electrical equipment) | | | | | | |
UniCredit SpA (Financials, Banks) | | | | | | |
| | | | | | |
| | | | | | |
Asahi Group Holdings Ltd. (Consumer staples, Beverages) | | | | | | |
Hitachi Ltd. (Industrials, Industrial conglomerates) | | | | | | |
Mitsubishi UFJ Financial Group, Inc. (Financials, Banks) | | | | | | |
ORIX Corp. (Financials, Financial services) | | | | | | |
Resonac Holdings Corp. (Materials, Chemicals) | | | | | | |
| | | | | | |
| | | | | | |
Samsonite International SA (Consumer discretionary, Textiles, apparel & luxury goods) 144A† | | | | | | |
| | | | | | |
America Movil SAB de CV Series B (Communication services, Wireless telecommunication services) | | | | | | |
| | | | | | |
CNH Industrial NV (Industrials, Machinery) | | | | | | |
NN Group NV (Financials, Insurance) | | | | | | |
| | | | | | |
| | | | | | |
DNB Bank ASA (Financials, Banks) | | | | | | |
| | | | | | |
Hana Financial Group, Inc. (Financials, Banks) | | | | | | |
Samsung Electronics Co. Ltd. GDR (Information technology, Technology hardware, storage & peripherals) | | | | | | |
SK Telecom Co. Ltd. (Communication services, Wireless telecommunication services) | | | | | | |
| | | | | | |
| | | | | | |
Siemens Energy AG (Industrials, Electrical equipment) † | | | | | | |
The accompanying notes are an integral part of these financial statements.
8 | Allspring International Equity Fund
Portfolio of investments—April 30, 2023 (unaudited)
| | | | | |
| | | | | | |
Minor International PCL (Consumer discretionary, Hotels, restaurants & leisure) | | | | | | |
SCB X PCL (Financials, Banks) | | | | | | |
| | | | | | |
| | | | | | |
ConvaTec Group PLC (Health care, Health care equipment & supplies) 144A | | | | | | |
Informa PLC (Communication services, Media) | | | | | | |
NatWest Group PLC (Financials, Banks) | | | | | | |
Nomad Foods Ltd. (Consumer staples, Food products) † | | | | | | |
Shell PLC (Energy, Oil, gas & consumable fuels) | | | | | | |
| | | | | | |
| | | | | | |
Axalta Coating Systems Ltd. (Materials, Chemicals) † | | | | | | |
Baker Hughes Co. (Energy, Energy equipment & services) | | | | | | |
Gentex Corp. (Consumer discretionary, Automobile components) | | | | | | |
| | | | | | |
Total common stocks (Cost $278,667,383) | | | | | | |
| | | | | |
Short-term investments: 3.26% | | | | | | |
Investment companies: 3.26% | | | | | | |
Allspring Government Money Market Fund Select Class ♠∞ | | | | | | |
Total short-term investments (Cost $10,797,364) | | | | | | |
Total investments in securities (Cost $289,464,747) | | | | | | |
Other assets and liabilities, net | | | | | | |
| | | | | | |
| Non-income-earning security |
| The security may be resold in transactions exempt from registration, normally to qualified institutional buyers, pursuant to Rule 144A under the Securities Act of 1933. |
| The issuer of the security is an affiliated person of the Fund as defined in the Investment Company Act of 1940. |
| The rate represents the 7-day annualized yield at period end. |
|
| Global depositary receipt |
The accompanying notes are an integral part of these financial statements.
Allspring International Equity Fund | 9
Portfolio of investments—April 30, 2023 (unaudited)
Investments in affiliates
An affiliated investment is an investment in which the Fund owns at least 5% of the outstanding voting shares of the issuer or as a result of other relationships, such as the Fund and the issuer having the same investment manager. Transactions with issuers that were affiliates of the Fund at the end of the period were as follows:
| | | | | Net
change in
unrealized
gains
(losses) | | | Income
from
affiliated
securities |
| | | | | | | | |
Allspring Government Money Market Fund Select Class | | | | | | | | |
Investments in affiliates no longer held at end of period | | | | | | | | |
Securities Lending Cash Investments LLC | | | | | | | | |
| | | | | | | | |
| Amount shown represents income before fees and rebates. |
The accompanying notes are an integral part of these financial statements.
10 | Allspring International Equity Fund
Statement of assets and liabilities—April 30, 2023 (unaudited)
Financial statements
Statement of assets and liabilities
| |
Investments in unaffiliated securities, at value (cost $278,667,383) | |
Investments in affiliated securities, at value (cost $10,797,364) | |
Foreign currency, at value (cost $611,994) | |
| |
Receivable for investments sold | |
Receivable for Fund shares sold | |
Prepaid expenses and other assets | |
| |
| |
Payable for investments purchased | |
Payable for Fund shares redeemed | |
| |
Administration fees payable | |
Distribution fees payable | |
Accrued expenses and other liabilities | |
| |
| |
| |
| |
| |
| |
The accompanying notes are an integral part of these financial statements.
Allspring International Equity Fund | 11
Statement of assets and liabilities—April 30, 2023 (unaudited)
Computation of net asset value and offering price per share | |
| |
Shares outstanding–Class A1 | |
Net asset value per share–Class A | |
Maximum offering price per share – Class A2 | |
| |
Shares outstanding–Class C1 | |
Net asset value per share–Class C | |
| |
Shares outstanding–Class R1 | |
Net asset value per share–Class R | |
| |
Shares outstanding–Class R61 | |
Net asset value per share–Class R6 | |
Net assets–Administrator Class | |
Shares outstanding–Administrator Class1 | |
Net asset value per share–Administrator Class | |
Net assets–Institutional Class | |
Shares outstanding–Institutional Class1 | |
Net asset value per share–Institutional Class | |
| The Fund has an unlimited number of authorized shares. |
| Maximum offering price is computed as 100/94.25 of net asset value. On investments of $50,000 or more, the offering price is reduced. |
The accompanying notes are an integral part of these financial statements.
12 | Allspring International Equity Fund
Statement of operations—six months ended April 30, 2023 (unaudited)
Statement of operations
| |
Dividends (net of foreign withholdings taxes of $442,546) | |
Income from affiliated securities | |
| |
| |
| |
| |
| |
| |
| |
| |
| |
| |
Shareholder servicing fees | |
| |
| |
| |
| |
| |
| |
| |
Custody and accounting fees | |
| |
| |
Shareholder report expenses | |
Trustees’ fees and expenses | |
| |
| |
Less: Fee waivers and/or expense reimbursements | |
| |
| |
| |
| |
| |
| |
| |
Realized and unrealized gains (losses) on investments | |
Net realized gains (losses) on | |
| |
| |
Foreign currency and foreign currency translations | |
Net realized losses on investments | |
The accompanying notes are an integral part of these financial statements.
Allspring International Equity Fund | 13
Statement of operations—six months ended April 30, 2023 (unaudited)
Net change in unrealized gains (losses) on | |
| |
Foreign currency and foreign currency translations | |
Net change in unrealized gains (losses) on investments | |
Net realized and unrealized gains (losses) on investments | |
Net increase in net assets resulting from operations | |
The accompanying notes are an integral part of these financial statements.
14 | Allspring International Equity Fund
Statement of changes in net assets
Statement of changes in net assets
| Six months ended
April 30, 2023
(unaudited) | Year ended
October 31, 2022 |
| | | | |
| | | | |
Net realized losses on investments | | | | |
Net change in unrealized gains (losses) on investments | | | | |
Net increase (decrease) in net assets resulting from operations | | | | |
Distributions to shareholders from | | | | |
Net investment income and net realized gains | | | | |
| | | | |
| | | | |
| | | | |
| | | | |
| | | | |
| | | | |
Tax basis return of capital | | | | |
| | | | |
| | | | |
| | | | |
| | | | |
| | | | |
| | | | |
Total distributions to shareholders | | | | |
Capital share transactions | | | | |
Proceeds from shares sold | | | | |
| | | | |
| | | | |
| | | | |
| | | | |
| | | | |
| | | | |
| | | | |
Reinvestment of distributions | | | | |
| | | | |
| | | | |
| | | | |
| | | | |
| | | | |
| | | | |
| | | | |
Payment for shares redeemed | | | | |
| | | | |
| | | | |
| | | | |
| | | | |
| | | | |
| | | | |
| | | | |
Net decrease in net assets resulting from capital share transactions | | | | |
Total increase (decrease) in net assets | | | | |
| | | | |
| | | | |
| | | | |
The accompanying notes are an integral part of these financial statements.
Allspring International Equity Fund | 15
Financial highlights
(For a share outstanding throughout each period)
| Six months ended
April 30, 2023
(unaudited) | |
| | | | | |
Net asset value, beginning of period | | | | | | |
| | | | | | |
Net realized and unrealized gains (losses) on investments | | | | | | |
Total from investment operations | | | | | | |
Distributions to shareholders from | | | | | | |
| | | | | | |
Tax basis return of capital | | | | | | |
Total distributions to shareholders | | | | | | |
Net asset value, end of period | | | | | | |
| | | | | | |
Ratios to average net assets (annualized) | | | | | | |
| | | | | | |
| | | | | | |
| | | | | | |
| | | | | | |
| | | | | | |
Net assets, end of period (000s omitted) | | | | | | |
| Calculated based upon average shares outstanding |
| Total return calculations do not include any sales charges. Returns for periods of less than one year are not annualized. |
The accompanying notes are an integral part of these financial statements.
16 | Allspring International Equity Fund
(For a share outstanding throughout each period)
| Six months ended
April 30, 2023
(unaudited) | |
| | | | | |
Net asset value, beginning of period | | | | | | |
| | | | | | |
Net realized and unrealized gains (losses) on investments | | | | | | |
Total from investment operations | | | | | | |
Distributions to shareholders from | | | | | | |
| | | | | | |
Tax basis return of capital | | | | | | |
Total distributions to shareholders | | | | | | |
Net asset value, end of period | | | | | | |
| | | | | | |
Ratios to average net assets (annualized) | | | | | | |
| | | | | | |
| | | | | | |
| | | | | | |
| | | | | | |
| | | | | | |
Net assets, end of period (000s omitted) | | | | | | |
| Calculated based upon average shares outstanding |
| Total return calculations do not include any sales charges. Returns for periods of less than one year are not annualized. |
The accompanying notes are an integral part of these financial statements.
Allspring International Equity Fund | 17
(For a share outstanding throughout each period)
| Six months ended
April 30, 2023
(unaudited) | |
| | | | | |
Net asset value, beginning of period | | | | | | |
| | | | | | |
Net realized and unrealized gains (losses) on investments | | | | | | |
Total from investment operations | | | | | | |
Distributions to shareholders from | | | | | | |
| | | | | | |
Tax basis return of capital | | | | | | |
Total distributions to shareholders | | | | | | |
Net asset value, end of period | | | | | | |
| | | | | | |
Ratios to average net assets (annualized) | | | | | | |
| | | | | | |
| | | | | | |
| | | | | | |
| | | | | | |
| | | | | | |
Net assets, end of period (000s omitted) | | | | | | |
| Calculated based upon average shares outstanding |
| Returns for periods of less than one year are not annualized. |
The accompanying notes are an integral part of these financial statements.
18 | Allspring International Equity Fund
(For a share outstanding throughout each period)
| Six months ended
April 30, 2023
(unaudited) | |
| | | | | |
Net asset value, beginning of period | | | | | | |
| | | | | | |
Net realized and unrealized gains (losses) on investments | | | | | | |
Total from investment operations | | | | | | |
Distributions to shareholders from | | | | | | |
| | | | | | |
Tax basis return of capital | | | | | | |
Total distributions to shareholders | | | | | | |
Net asset value, end of period | | | | | | |
| | | | | | |
Ratios to average net assets (annualized) | | | | | | |
| | | | | | |
| | | | | | |
| | | | | | |
| | | | | | |
| | | | | | |
Net assets, end of period (000s omitted) | | | | | | |
| Calculated based upon average shares outstanding |
| Returns for periods of less than one year are not annualized. |
The accompanying notes are an integral part of these financial statements.
Allspring International Equity Fund | 19
(For a share outstanding throughout each period)
| Six months ended
April 30, 2023
(unaudited) | |
| | | | | |
Net asset value, beginning of period | | | | | | |
| | | | | | |
Net realized and unrealized gains (losses) on investments | | | | | | |
Total from investment operations | | | | | | |
Distributions to shareholders from | | | | | | |
| | | | | | |
Tax basis return of capital | | | | | | |
Total distributions to shareholders | | | | | | |
Net asset value, end of period | | | | | | |
| | | | | | |
Ratios to average net assets (annualized) | | | | | | |
| | | | | | |
| | | | | | |
| | | | | | |
| | | | | | |
| | | | | | |
Net assets, end of period (000s omitted) | | | | | | |
| Calculated based upon average shares outstanding |
| Returns for periods of less than one year are not annualized. |
The accompanying notes are an integral part of these financial statements.
20 | Allspring International Equity Fund
(For a share outstanding throughout each period)
| Six months ended
April 30, 2023
(unaudited) | |
| | | | | |
Net asset value, beginning of period | | | | | | |
| | | | | | |
Net realized and unrealized gains (losses) on investments | | | | | | |
Total from investment operations | | | | | | |
Distributions to shareholders from | | | | | | |
| | | | | | |
Tax basis return of capital | | | | | | |
Total distributions to shareholders | | | | | | |
Net asset value, end of period | | | | | | |
| | | | | | |
Ratios to average net assets (annualized) | | | | | | |
| | | | | | |
| | | | | | |
| | | | | | |
| | | | | | |
| | | | | | |
Net assets, end of period (000s omitted) | | | | | | |
| Calculated based upon average shares outstanding |
| Returns for periods of less than one year are not annualized. |
The accompanying notes are an integral part of these financial statements.
Allspring International Equity Fund | 21
Notes to financial statements (unaudited)
Notes to financial statements
Allspring Funds Trust (the “Trust”), a Delaware statutory trust organized on March 10, 1999, is an open-end management investment company registered under the Investment Company Act of 1940, as amended (the “1940 Act”). As an investment company, the Trust follows the accounting and reporting guidance in Financial Accounting Standards Board (“FASB”) Accounting Standards Codification Topic 946, Financial Services – Investment Companies. These financial statements report on the Allspring International Equity Fund (the “Fund”) which is a diversified series of the Trust.
2.
SIGNIFICANT ACCOUNTING POLICIES
The following significant accounting policies, which are consistently followed in the preparation of the financial statements of the Fund, are in conformity with U.S. generally accepted accounting principles which require management to make estimates and assumptions that affect the reported amounts of assets and liabilities, disclosure of contingent assets and liabilities at the date of the financial statements, and the reported amounts of income and expenses during the reporting period. Actual results could differ from those estimates.
Securities valuation
All investments are valued each business day as of the close of regular trading on the New York Stock Exchange (generally 4 p.m. Eastern Time), although the Fund may deviate from this calculation time under unusual or unexpected circumstances.
Equity securities and exchange-traded funds that are listed on a foreign or domestic exchange or market are valued at the official closing price or, if none, the last sales price.
The values of securities denominated in foreign currencies are translated into U.S. dollars at rates provided by an independent foreign currency pricing source at a time each business day specified by the Valuation Committee at Allspring Funds Management, LLC (“Allspring Funds Management”).
Many securities markets and exchanges outside the U.S. close prior to the close of the New York Stock Exchange and therefore may not fully reflect trading or events that occur after the close of the principal exchange in which the foreign securities are traded, but before the close of the New York Stock Exchange. If such trading or events are expected to materially affect the value of such securities, then fair value pricing procedures implemented by Allspring Funds Management are applied. These procedures take into account multiple factors including movements in U.S. securities markets after foreign exchanges close. Foreign securities that are fair valued under these procedures are categorized as Level 2 and the application of these procedures may result in transfers between Level 1 and Level 2. Depending on market activity, such fair valuations may be frequent. Such fair value pricing may result in net asset values that are higher or lower than net asset values based on the last reported sales price or latest quoted bid price. On April 30, 2023, such fair value pricing was used in pricing certain foreign securities.
Investments in registered open-end investment companies (other than those listed on a foreign or domestic exchange or market) are valued at net asset value.
Investments which are not valued using any of the methods discussed above are valued at their fair value, as determined in good faith by Allspring Funds Management, which was named the valuation designee by the Board of Trustees. As the valuation designee, Allspring Funds Management is responsible for day-to-day valuation activities for the Allspring Funds. In connection with these responsibilities, Allspring Funds Management has established a Valuation Committee and has delegated to it the authority to take any actions regarding the valuation of portfolio securities that the Valuation Committee deems necessary or appropriate, including determining the fair value of portfolio securities.On a quarterly basis, the Board of Trustees receives reports of valuation actions taken by the Valuation Committee. On at least an annual basis, the Board of Trustees receives an assessment of the adequacy and effectiveness of Allspring Funds Management’s process for determining the fair value of the portfolio of investments.
Foreign currency translation
The accounting records of the Fund are maintained in U.S. dollars. The values of other assets and liabilities denominated in foreign currencies are translated into U.S. dollars at rates provided by an independent foreign currency pricing source at a time each business day specified by the Valuation Committee. Purchases and sales of securities, and income and expenses are converted at the rate of exchange on the respective dates of such transactions. Net realized foreign exchange gains or losses arise from sales of foreign currencies, currency gains or losses realized between the trade and settlement dates on securities transactions, and the difference between the amounts of dividends, interest and foreign withholding taxes recorded and the U.S. dollar equivalent of the amounts actually paid or received. Net unrealized foreign exchange gains and losses arise from changes in the fair value of assets and liabilities other than investments in securities resulting from changes in exchange rates. The changes in net assets arising from changes in exchange rates of securities and the changes in net assets resulting from changes in market prices of securities are not separately presented. Such changes are included in net realized and unrealized gains or losses from investments.
Securities lending
During the period, the Fund participated in a program to lend its securities from time to time in order to earn additional income in the form of fees or interest on securities received as collateral or the investment of any cash received as collateral. When securities were on loan, the Fund received interest or dividends on those securities. Cash collateral received in connection with its securities lending transactions was invested in Securities Lending Cash Investments, LLC (the “Securities Lending Fund”), an affiliated non-registered investment company. Interests in the non-registered investment company
22 | Allspring International Equity Fund
Notes to financial statements (unaudited)
that were redeemable at net asset value were fair valued normally at net asset value. Effective at the close of business on March 29, 2023, the Fund is no longer participating in the securities lending program and the Securities Lending Fund was liquidated. Securities Lending Fund was managed by Allspring Funds Management and was subadvised by Allspring Global Investments, LLC (“Allspring Investments”), an affiliate of Allspring Funds Management and wholly owned subsidiary of Allspring Global Investments Holdings, LLC. Allspring Funds Management received an advisory fee starting at 0.05% and declining to 0.01% as the average daily net assets of the Securities Lending Fund increased. All of the fees received by Allspring Funds Management were paid to Allspring Investments for its services as subadviser.
Income earned from investment in the Securities Lending Fund (net of fees and rebates), if any, is included in income from affiliated securities on the Statement of Operations.
Security transactions and income recognition
Securities transactions are recorded on a trade date basis. Realized gains or losses are recorded on the basis of identified cost.
Dividend income is recognized on the ex-dividend date, except for certain dividends from foreign securities, which are recorded as soon as the custodian verifies the ex-dividend date. Dividend income is recorded net of foreign taxes withheld where recovery of such taxes is not assured.
Distributions to shareholders
Distributions to shareholders are recorded on the ex-dividend date and paid from net investment income quarterly and any net realized gains are paid at least annually. Such distributions are determined in accordance with income tax regulations and may differ from U.S. generally accepted accounting principles. Dividend sources are estimated at the time of declaration. The tax character of distributions is determined as of the Fund’s fiscal year end. Therefore, a portion of the Fund’s distributions made prior to the Fund’s fiscal year end may be categorized as a tax return of capital at year end.
Federal and other taxes
The Fund intends to continue to qualify as a regulated investment company by distributing substantially all of its investment company taxable income and any net realized capital gains (after reduction for capital loss carryforwards) sufficient to relieve it from all, or substantially all, federal income taxes. Accordingly, no provision for federal income taxes was required.
The Fund’s income and federal excise tax returns and all financial records supporting those returns for the prior three fiscal years are subject to examination by the federal and Delaware revenue authorities. Management has analyzed the Fund’s tax positions taken on federal, state, and foreign tax returns, as applicable, for all open tax years and does not believe that there are any uncertain tax positions that require recognition of a tax liability.
As of April 30, 2023, the aggregate cost of all investments for federal income tax purposes was $294,710,077 and the unrealized gains (losses) consisted of:
As of October 31, 2022, the Fund had capital loss carryforwards which consisted of $23,814,729 in short-term capital losses and $70,497,743 in long-term capital losses. Losses may be subject to certain limitations under Sections 382-384 of the Internal Revenue Code.
Class allocations
The separate classes of shares offered by the Fund differ principally in applicable sales charges, distribution, shareholder servicing, and administration fees. Class specific expenses are charged directly to that share class. Investment income, common fund-level expenses, and realized and unrealized gains (losses) on investments are allocated daily to each class of shares based on the relative proportion of net assets of each class.
3.
FAIR VALUATION MEASUREMENTS
Fair value measurements of investments are determined within a framework that has established a fair value hierarchy based upon the various data inputs utilized in determining the value of the Fund’s investments. The three-level hierarchy gives the highest priority to unadjusted quoted prices in active markets for identical assets or liabilities (Level 1) and the lowest priority to unobservable inputs (Level 3). The Fund’s investments are classified within the fair value hierarchy based on the lowest level of input that is significant to the fair value measurement. The inputs are summarized into three broad levels as follows:
•Level 1—quoted prices in active markets for identical securities
•Level 2—other significant observable inputs (including quoted prices for similar securities, interest rates, prepayment speeds, credit risk, etc.)
•Level 3—significant unobservable inputs (including the Fund’s own assumptions in determining the fair value of investments)
The inputs or methodologies used for valuing investments in securities are not necessarily an indication of the risk associated with investing in those securities.
Allspring International Equity Fund | 23
Notes to financial statements (unaudited)
The following is a summary of the inputs used in valuing the Fund’s assets and liabilities as of April 30, 2023:
| | Other significant
observable inputs
(Level 2) | Significant
unobservable inputs
(Level 3) | |
| | | | |
| | | | |
| | | | |
| | | | |
| | | | |
| | | | |
| | | | |
| | | | |
| | | | |
| | | | |
| | | | |
| | | | |
| | | | |
| | | | |
| | | | |
| | | | |
| | | | |
| | | | |
| | | | |
| | | | |
| | | | |
| | | | |
| | | | |
| | | | |
| | | | |
| | | | |
| | | | |
| | | | |
Additional sector, industry or geographic detail, if any, is included in the Portfolio of Investments.
For the six months ended April 30, 2023, the Fund did not have any transfers into/out of Level 3.
4.
TRANSACTIONS WITH AFFILIATES
Management fee
Allspring Funds Management, a wholly owned subsidiary of Allspring Global Investments Holdings, LLC, a holding company indirectly owned by certain private funds of GTCR LLC and Reverence Capital Partners, L.P., is the manager of the Fund and provides advisory and fund-level administrative services under an investment management agreement. Under the investment management agreement, Allspring Funds Management is responsible for, among other services, implementing the investment objectives and strategies of the Fund, supervising the subadviser and providing fund-level administrative services in connection with the Fund’s operations. As compensation for its services under the investment management agreement, Allspring Funds Management is entitled to receive a management fee at the following annual rate based on the Fund’s average daily net assets:
For the six months ended April 30, 2023, the management fee was equivalent to an annual rate of 0.80% of the Fund’s average daily net assets.
24 | Allspring International Equity Fund
Notes to financial statements (unaudited)
Allspring Funds Management has retained the services of a subadviser to provide daily portfolio management to the Fund. The fee for subadvisory services is borne by Allspring Funds Management. Allspring Investments is the subadviser to the Fund and is entitled to receive a fee from Allspring Funds Management at an annual rate starting at 0.45% and declining to 0.40% as the average daily net assets of the Fund increase.
Administration fees
Under a class-level administration agreement, Allspring Funds Management provides class-level administrative services to the Fund, which includes paying fees and expenses for services provided by the transfer agent, sub-transfer agents, omnibus account servicers and record-keepers. As compensation for its services under the class-level administration agreement, Allspring Funds Management receives an annual fee which is calculated based on the average daily net assets of each class as follows:
| Class-level
administration fee |
| |
| |
| |
| |
| |
| |
Waivers and/or expense reimbursements
Allspring Funds Management has contractually committed to waive and/or reimburse management and administration fees to the extent necessary to maintain certain net operating expense ratios for the Fund. When each class of the Fund has exceeded its expense cap, Allspring Funds Management will waive fees and/or reimburse expenses from fund-level expenses on a proportionate basis and then from class specific expenses. When only certain classes exceed their expense caps, waivers and/or reimbursements are applied against class specific expenses before fund-level expenses. Allspring Funds Management has contractually committed through February 29, 2024 to waive fees and/or reimburse expenses to the extent necessary to cap expenses. Prior to or after the commitment expiration date, the caps may be increased or the commitment to maintain the caps may be terminated only with the approval of the Board of Trustees. As of April 30, 2023, the contractual expense caps are as follows:
Distribution fees
The Trust has adopted a distribution plan for Class C and Class R shares pursuant to Rule 12b-1 under the 1940 Act. Distribution fees are charged to Class C and Class R shares and paid to Allspring Funds Distributor, LLC (“Allspring Funds Distributor”), the principal underwriter, an affiliate of Allspring Funds Management, at an annual rate up to 0.75% of the average daily net assets of Class C shares and up to 0.25% of the average daily net assets of Class R shares.
In addition, Allspring Funds Distributor is entitled to receive the front-end sales charge from the purchase of Class A shares and a contingent deferred sales charge on the redemption of certain Class A shares. Allspring Funds Distributor is also entitled to receive the contingent deferred sales charges from redemptions of Class C shares. For the six months ended April 30, 2023, Allspring Funds Distributor received $241 from the sale of Class A shares. No contingent deferred sales charges were incurred by Class A and Class C shares for the six months ended April 30, 2023.
Shareholder servicing fees
The Trust has entered into contracts with one or more shareholder servicing agents, whereby Class A, Class C, Class R, and Administrator Class are charged a fee at an annual rate up to 0.25% of the average daily net assets of each respective class. A portion of these total shareholder servicing fees were paid to affiliates of the Fund.
Interfund transactions
The Fund may purchase or sell portfolio investment securities to certain affiliates pursuant to Rule 17a-7 under the 1940 Act and under procedures adopted by the Board of Trustees. The procedures have been designed to ensure that these interfund transactions, which do not incur broker commissions, are effected at current market prices.
Allspring International Equity Fund | 25
Notes to financial statements (unaudited)
5.
INVESTMENT PORTFOLIO TRANSACTIONS
Purchases and sales of investments, excluding U.S. government obligations (if any) and short-term securities, for the six months ended April 30, 2023 were $104,210,184 and $135,467,967, respectively.
The Trust (excluding the money market funds), Allspring Master Trust and Allspring Variable Trust are parties to a $350,000,000 revolving credit agreement whereby the Fund is permitted to use bank borrowings for temporary or emergency purposes, such as to fund shareholder redemption requests. Interest under the credit agreement is charged to the Fund based on borrowing rate equal to the higher of the Federal Funds rate or the overnight bank funding rate in effect on that day plus a spread. In addition, an annual commitment fee based on the unused balance is allocated to each participating fund.
For the six months ended April 30, 2023, there were no borrowings by the Fund under the agreement.
As of the end of the period, the Fund concentrated its portfolio of investments in Europe and Asia/Pacific ex-Japan. A fund that invests a substantial portion of its assets in any country or geographic region will be more vulnerable than a fund that invests its assets more broadly to the economic, financial, political or other developments affecting that country or region. Such developments may have a significant impact on the Fund’s investment performance causing such performance to be more volatile than the investment performance of a more geographically diversified fund.
Under the Fund’s organizational documents, the officers and Trustees have been granted certain indemnification rights against certain liabilities that may arise out of performance of their duties to the Fund. The Fund has entered into a separate agreement with each Trustee that converts indemnification rights currently existing under the Fund’s organizational documents into contractual rights that cannot be changed in the future without the consent of the Trustee. Additionally, in the normal course of business, the Fund may enter into contracts with service providers that contain a variety of indemnification clauses. The Fund’s maximum exposure under these arrangements is dependent on future claims that may be made against the Fund and, therefore, cannot be estimated.
26 | Allspring International Equity Fund
Other information (unaudited)
Other information
Tax information
Pursuant to Section 853 of the Internal Revenue Code, the following amounts have been designated as foreign taxes paid for the fiscal year ended October 31, 2022. These amounts may be less than the actual foreign taxes paid for financial statement purposes. Foreign taxes paid or withheld should be included in taxable income with an offsetting deduction from gross income or as a credit for taxes paid to foreign governments. None of the income was derived from ineligible foreign sources as defined under Section 901(j) of the Internal Revenue Code.
Creditable
foreign taxes
paid | | Foreign
income as % of
ordinary income
distributions |
| | |
Proxy voting information
A description of the policies and procedures used to determine how to vote proxies relating to portfolio securities is available without charge, upon request, by calling 1-800-222-8222, visiting our website at allspringglobal.com, or visiting the SEC website at sec.gov. Information regarding how the proxies related to portfolio securities were voted during the most recent 12-month period ended June 30 is available on the website at allspringglobal.com or by visiting the SEC website at sec.gov.
Quarterly portfolio holdings information
The Fund files its complete schedule of portfolio holdings with the SEC for the first and third quarters of each fiscal year as an exhibit to its reports on Form N-PORT. Shareholders may view the filed Form N-PORT by visiting the SEC website at sec.gov.
Allspring International Equity Fund | 27
Other information (unaudited)
BOARD OF TRUSTEES AND OFFICERS
Each of the Trustees and Officers listed in the table below acts in identical capacities for each fund in the Allspring family of funds, which consists of 127 mutual funds comprising the Allspring Funds Trust, Allspring Variable Trust, Allspring Master Trust and four closed-end funds (collectively the “Fund Complex”). This table should be read in conjunction with the Prospectus and the Statement of Additional Information1. The mailing address of each Trustee and Officer is 1415 Vantage Park Drive, 3rd Floor, Charlotte, NC 28203. Each Trustee and Officer serves an indefinite term, however, each Trustee serves such term until reaching the mandatory retirement age established by the Trustees.
Independent Trustees
| | Principal occupations during past five years or longer | Current other
public company or
investment
company
directorships |
William R. Ebsworth
(Born 1957) | | Retired. From 1984 to 2013, equities analyst, portfolio manager, research director and chief investment officer at Fidelity Management and Research Company in Boston, Tokyo, and Hong Kong, and retired in 2013 as Chief Investment Officer of Fidelity Strategic Advisers, Inc. where he led a team of investment professionals managing client assets. Prior thereto, Board member of Hong Kong Securities Clearing Co., Hong Kong Options Clearing Corp., the Thailand International Fund, Ltd., Fidelity Investments Life Insurance Company, and Empire Fidelity Investments Life Insurance Company. Audit Committee Chair and Investment Committee Chair of the Vincent Memorial Hospital Foundation (non-profit organization). Mr. Ebsworth is a CFA charterholder. | |
Jane A. Freeman
(Born 1953) | Trustee,
since 2015;
Chair Liaison,
since 2018 | Retired. From 2012 to 2014 and 1999 to 2008, Chief Financial Officer of Scientific Learning Corporation. From 2008 to 2012, Ms. Freeman provided consulting services related to strategic business projects. Prior to 1999, Portfolio Manager at Rockefeller & Co. and Scudder, Stevens & Clark. Board member of the Harding Loevner Funds from 1996 to 2014, serving as both Lead Independent Director and chair of the Audit Committee. Board member of the Russell Exchange Traded Funds Trust from 2011 to 2012 and the chair of the Audit Committee. Ms. Freeman is also an inactive Chartered Financial Analyst. | |
Isaiah Harris, Jr.
(Born 1952) | Trustee,
since 2009;
Audit Committee Chair,
since 2019 | Retired. Member of the Advisory Board of CEF of East Central Florida. Chairman of the Board of CIGNA Corporation from 2009 to 2021, and Director from 2005 to 2008. From 2003 to 2011, Director of Deluxe Corporation. Prior thereto, President and CEO of BellSouth Advertising and Publishing Corp. from 2005 to 2007, President and CEO of BellSouth Enterprises from 2004 to 2005 and President of BellSouth Consumer Services from 2000 to 2003. Emeritus member of the Iowa State University Foundation Board of Governors. Emeritus Member of the Advisory Board of Iowa State University School of Business. Advisory Board Member, Palm Harbor Academy (private school). Advisory Board Member, Fellowship of Christian Athletes. Mr. Harris is a certified public accountant (inactive status). | |
David F. Larcker
(Born 1950) | | Distinguished Visiting Fellow at the Hoover Institution since 2022. James Irvin Miller Professor of Accounting at the Graduate School of Business (Emeritus), Stanford University, Director of the Corporate Governance Research Initiative and Senior Faculty of The Rock Center for Corporate Governance since 2006. From 2005 to 2008, Professor of Accounting at the Graduate School of Business, Stanford University. Prior thereto, Ernst & Young Professor of Accounting at The Wharton School, University of Pennsylvania from 1985 to 2005. | |
Olivia S. Mitchell
(Born 1953) | Trustee,
since 2006;
Nominating and Governance Committee Chair,
since 2018 | International Foundation of Employee Benefit Plans Professor since 1993, Wharton School of the University of Pennsylvania. Director of Wharton’s Pension Research Council and Boettner Center on Pensions & Retirement Research, and Research Associate at the National Bureau of Economic Research. Previously taught at Cornell University from 1978 to 1993. | |
Timothy J. Penny
(Born 1951) | Trustee,
since 1996;
Chair,
since 2018 | President and Chief Executive Officer of Southern Minnesota Initiative Foundation, a non-profit organization, since 2007. Vice Chair of the Economic Club of Minnesota, since 2007. Co-Chair of the Committee for a Responsible Federal Budget, since 1995. Member of the Board of Trustees of NorthStar Education Finance, Inc., a non-profit organization, from 2007-2022. Senior Fellow of the University of Minnesota Humphrey Institute from 1995 to 2017. | |
1
The Statement of Additional Information includes additional information about the Trustees and is available, without charge, upon request, by calling 1-800-222-8222 or by visiting the website at allspringglobal.com.
28 | Allspring International Equity Fund
Other information (unaudited)
| Position held and length of service* | Principal occupations during past five years or longer | Current other public company or investment company directorships |
James G. Polisson
(Born 1959) | | Retired. Chief Marketing Officer, Source (ETF) UK Services, Ltd, from 2015 to 2017. From 2012 to 2015, Principal of The Polisson Group, LLC, a management consulting, corporate advisory and principal investing company. Chief Executive Officer and Managing Director at Russell Investments, Global Exchange Traded Funds from 2010 to 2012. Managing Director of Barclays Global Investors from 1998 to 2010 and Global Chief Marketing Officer for iShares and Barclays Global Investors from 2000 to 2010. Trustee of the San Francisco Mechanics’ Institute, a non- profit organization, from 2013 to 2015. Board member of the Russell Exchange Traded Fund Trust from 2011 to 2012. Director of Barclays Global Investors Holdings Deutschland GmbH from 2006 to 2009. Mr. Polisson is an attorney and has a retired status with the Massachusetts and District of Columbia Bar Associations. | |
Pamela Wheelock
(Born 1959) | Trustee,
since January 2020;
previously Trustee from
January 2018 to
July 2019 | Retired. Executive and Senior Financial leadership positions in the public, private and nonprofit sectors. Interim President and CEO, McKnight Foundation, 2020. Interim Commissioner, Minnesota Department of Human Services, 2019. Chief Operating Officer, Twin Cities Habitat for Humanity, 2017-2019. Vice President for University Services, University of Minnesota, 2012- 2016. Interim President and CEO, Blue Cross and Blue Shield of Minnesota, 2011-2012. Executive Vice-President and Chief Financial Officer, Minnesota Wild, 2002-2008. Commissioner, Minnesota Department of Finance, 1999-2002. Chair of the Board of Directors of Destination Medical Center Corporation. Board member of the Minnesota Wild Foundation. | |
| Length of service dates reflect the Trustee’s commencement of service with the Trust’s predecessor entities, where applicable. |
Allspring International Equity Fund | 29
Other information (unaudited)
Officers1
| Position held and
length of service | Principal occupations during past five years or longer |
| | President and Chief Executive Officer of Allspring Funds Management, LLC since 2017 and Head of Global Fund Governance of Allspring Global Investments since 2022. Prior thereto, co-president of Galliard Capital Management, LLC, an affiliate of Allspring Funds Management, LLC, from 2019 to 2022 and Head of Affiliated Managers, Allspring Global Investments, from 2014 to 2019 and Executive Vice President responsible for marketing, investments and product development for Allspring Funds Management, LLC, from 2009 to 2014. |
Jeremy DePalma
(Born 1974) | Treasurer,
since 2012
(for certain funds in
the Fund Complex);
since 2021 (for
the remaining funds in the Fund Complex) | Senior Vice President of Allspring Funds Management, LLC since 2009. Senior Vice President of Evergreen Investment Management Company, LLC from 2008 to 2010 and head of the Fund Reporting and Control Team within Fund Administration from 2005 to 2010. |
Christopher Baker
(Born 1976) | Chief Compliance Officer,
since 2022 | Global Chief Compliance Officer for Allspring Global Investments since 2022. Prior thereto, Chief Compliance Officer for State Street Global Advisors from 2018 to 2021. Senior Compliance Officer for the State Street divisions of Alternative Investment Solutions, Sector Solutions, and Global Marketing from 2015 to 2018. From 2010 to 2015 Vice President, Global Head of Investment and Marketing Compliance for State Street Global Advisors. |
Matthew Prasse
(Born 1983) | Chief Legal Officer,
since 2022;
Secretary,
since 2021 | Senior Counsel of the Allspring Legal Department since 2021. Senior Counsel of the Wells Fargo Legal Department from 2018 to 2021. Previously, Counsel for Barings LLC from 2015 to 2018. Prior to joining Barings, Associate at Morgan, Lewis & Bockius LLP from 2008 to 2015. |
1 For those Officers with tenures at Allspring Global Investments and/or Allspring Funds Management, LLC that began prior to 2021, such tenures include years of service during which these businesses/entities were known as Wells Fargo Asset Management and Wells Fargo Funds Management, LLC, respectively.
30 | Allspring International Equity Fund
This page is intentionally left blank.
This page is intentionally left blank.
For more information
More information about Allspring Funds is available free upon request. To obtain literature, please write, visit the Fund’s website, or call:
Allspring Funds
P.O. Box 219967
Kansas City, MO 64121-9967
Website: allspringglobal.com
Individual investors: 1-800-222-8222
Retail investment professionals: 1-888-877-9275
Institutional investment professionals: 1-800-260-5969
This report and the financial statements contained herein are submitted for the general information of the shareholders of the Fund. If this report is used for promotional purposes, distribution of the report must be accompanied or preceded by a current prospectus. Before investing, please consider the investment objectives, risks, charges, and expenses of the investment. For a current prospectus and, if available, a summary prospectus, containing this information, call 1-800-222-8222 or visit the Fund’s website at allspringglobal.com. Read the prospectus carefully before you invest or send money.
Allspring Global InvestmentsTM is the trade name for the asset management firms of Allspring Global Investments Holdings, LLC, a holding company indirectly owned by certain private funds of GTCR LLC and Reverence Capital Partners, L.P. These firms include but are not limited to Allspring Global Investments, LLC, and Allspring Funds Management, LLC. Certain products managed by Allspring entities are distributed by Allspring Funds Distributor, LLC (a broker-dealer and Member FINRA/SIPC).
This material is for general informational and educational purposes only and is NOT intended to provide investment advice or a recommendation of any kind - including a recommendation for any specific investment, strategy, or plan.
© 2023 Allspring Global Investments Holdings, LLC. All rights reserved.
ALL-05052023-sjkkmjef 06-23
SAR3311 04-23
Allspring Managed Account
Allspring Managed Account CoreBuilder® Shares – Series EM |
Semi-Annual Report
April 30, 2023
Allspring Managed Account | 1
Performance highlights (unaudited)
Performance highlights
| The Fund seeks to achieve long-term capital appreciation and current income. |
| Allspring Funds Management, LLC |
| Allspring Global Investments, LLC |
| Alison Shimada, Elaine Tse |
Average annual total returns (%) as of April 30, 2023 |
| | | |
| | | | |
Allspring Managed Account CoreBuilder® Shares - Series EM (ACBEX) | | | | |
MSCI EM Index (Net) (USD)3 | | | | |
Figures quoted represent past performance, which is no guarantee of future results, and do not reflect taxes that a shareholder may pay on an investment in a fund. Investment return and principal value of an investment will fluctuate so that an investor’s shares, when redeemed, may be worth more or less than their original cost. Current performance may be lower or higher than the performance data quoted, which assumes the reinvestment of dividends and capital gains. Current month-end performance is available by calling 1-888-877-9275.
Index returns do not include transaction costs associated with buying and selling securities, any mutual fund fees or expenses, or any taxes. It is not possible to invest directly in an index.
Shares are sold without a front-end sales charge or contingent deferred sales charge.
|
| Based on the Fund’s inception date. |
| Reflects the expense ratios as stated in the most recent prospectus. The expense ratios shown are subject to change and may differ from the annualized expense ratios shown in the financial highlights of this report. |
| Generally, no ordinary fees or expenses are charged to the Fund. Allspring Funds Management, LLC has contractually committed to irrevocably absorb and pay or reimburse all ordinary operating expenses of the Fund, except portfolio transactions or other investment related costs (e.g., commissions), fees payable for services provided by the Fund’s securities lending agent (if any), interest, taxes, leverage expenses and other expenses not incurred in the ordinary course of the Fund’s business. This commitment has an indefinite term. |
| The Morgan Stanley Capital International (MSCI) Emerging Markets (EM) Index (Net) (USD) is a free-float-adjusted market-capitalization-weighted index that is designed to measure the equity market performance of emerging markets. Source: MSCI. MSCI makes no express or implied warranties or representations and shall have no liability whatsoever with respect to any MSCI data contained herein. The MSCI data may not be further redistributed or used as a basis for other indices or any securities or financial products. This report is not approved, reviewed, or produced by MSCI. You cannot invest directly in an index. |
Investing involves risk, including the possible loss of principal. Stock values fluctuate in response to the activities of individual companies and general market and economic conditions. Foreign investments are especially volatile and can rise or fall dramatically due to differences in the political and economic conditions of the host country. These risks are generally intensified in emerging markets. The use of derivatives may reduce returns and/or increase volatility. Certain investment strategies tend to increase the total risk of an investment (relative to the broader market). This fund is exposed to smaller-company securities risk. Consult the Fund’s prospectus for additional information on these and other risks.
CoreBuilder Shares are a series of investment options within the separately managed accounts advised or subadvised by Allspring Funds Management, LLC. The shares are fee-waived mutual funds that enable certain separately managed account investors to achieve greater diversification than smaller managed accounts might otherwise achieve.
Please remember that shares of the Fund may be purchased only by or on behalf of separately managed account clients where Allspring Funds Management, LLC has an agreement to serve as investment adviser or subadviser to the account with the separately managed account sponsor (typically a registered investment adviser or broker/dealer) or directly with the client.
2 | Allspring Managed Account
Performance highlights (unaudited)
Ten largest holdings (%) as of April 30, 20231 |
Samsung Electronics Co. Ltd. | |
| |
Reliance Industries Ltd. GDR | |
| |
| |
iShares MSCI Saudi Arabia ETF | |
| |
Midea Group Co. Ltd. Class A | |
Dr. Reddy’s Laboratories Ltd. | |
| |
| Figures represent the percentage of the Fund’s net assets. Holdings are subject to change and may have changed since the date specified. |
Sector allocation as of April 30, 20231 |
| Figures represent the percentage of the Fund’s long-term investments. Allocations are subject to change and may have changed since the date specified. |
Geographic allocation as of April 30, 20231 |
| Figures represent the percentage of the Fund’s long-term investments. Allocations are subject to change and may have changed since the date specified. |
Allspring Managed Account | 3
Fund expenses (unaudited)
Fund expenses
As a shareholder of the Fund, you incur ongoing costs and other Fund expenses. This example is intended to help you understand your ongoing costs (in dollars) of investing in the Fund and to compare these costs with the ongoing costs of investing in other mutual funds.
The example is based on an investment of $1,000 invested at the beginning of the six-month period and held for the entire period from November 1, 2022 to April 30, 2023.
Actual expenses
The “Actual” line of the table below provides information about actual account values and actual expenses. You may use the information in this line, together with the amount you invested, to estimate the expenses that you paid over the period. Simply divide your account value by $1,000 (for example, an $8,600 account value divided by $1,000 = 8.6), then multiply the result by the number in the “Actual” line under the heading entitled “Expenses paid during period” for your applicable class of shares to estimate the expenses you paid on your account during this period.
Hypothetical example for comparison purposes
The “Hypothetical” line of the table below provides information about hypothetical account values and hypothetical expenses based on the Fund’s actual expense ratio and an assumed rate of return of 5% per year before expenses, which is not the Fund’s actual return. The hypothetical account values and expenses may not be used to estimate the actual ending account balance or expenses you paid for the period. You may use this information to compare the ongoing costs of investing in the Fund and other funds. To do so, compare this 5% hypothetical example with the 5% hypothetical examples that appear in the shareholder reports of the other funds.
Please note that the expenses shown in the table are meant to highlight your ongoing costs only. Therefore, the “Hypothetical” line of the table is useful in comparing ongoing costs only, and will not help you determine the relative total costs of owning different funds.
| Beginning
account value
11-1-2022 | Ending
account value
4-30-2023 | | Annualized net
expense ratio |
| | | | |
Hypothetical (5% return before expenses) | | | | |
1 Expenses paid is equal to the annualized net expense ratio multiplied by the average account value over the period, multiplied by 181 divided by 365 (to reflect the one-half-year period).
2 Generally, no ordinary fees or expenses are charged to the Fund. Allspring Funds Management, LLC has contractually committed to irrevocably absorb and pay or reimburse all ordinary operating expenses of the Fund, except portfolio transactions or other investment related costs (e.g., commissions), fees payable for services provided by the Fund’s securities lending agent (if any), interest, taxes, leverage expenses and other expenses not incurred in the ordinary course of the Fund’s business. This commitment has an indefinite term.
4 | Allspring Managed Account
Portfolio of investments—April 30, 2023 (unaudited)
| | | | | |
| | | | | | |
| | | | | | |
B3 SA - Brasil Bolsa Balcao (Financials, Capital markets) | | | | | | |
Banco BTG Pactual SA (Financials, Capital markets) | | | | | | |
Cia Brasileira de Aluminio (Materials, Metals & mining) | | | | | | |
| | | | | | |
| | | | | | |
Cencosud SA (Consumer staples, Consumer staples distribution & retail) † | | | | | | |
| | | | | | |
Baoshan Iron & Steel Co. Ltd. Class A (Materials, Metals & mining) † | | | | | | |
China Communications Services Corp. Ltd. Class H (Industrials, Construction & engineering) † | | | | | | |
China Feihe Ltd. (Consumer staples, Food products) 144A | | | | | | |
China International Capital Corp. Ltd. Class H (Financials, Capital markets) 144A† | | | | | | |
China Resources Land Ltd. (Real estate, Real estate management & development) | | | | | | |
China State Construction International Holdings Ltd. (Industrials, Construction & engineering) | | | | | | |
China Tower Corp. Ltd. Class H (Communication services, Diversified telecommunication services) 144A† | | | | | | |
China Vanke Co. Ltd. Class H (Real estate, Real estate management & development) † | | | | | | |
China Yongda Automobiles Services Holdings Ltd. (Consumer discretionary, Specialty retail) † | | | | | | |
Ganfeng Lithium Group Co. Ltd. Class H (Materials, Chemicals) 144A† | | | | | | |
Hengli Petrochemical Co. Ltd. Class A (Materials, Chemicals) † | | | | | | |
Industrial & Commercial Bank of China Ltd. Class H (Financials, Banks) † | | | | | | |
Inner Mongolia Yili Industrial Group Co. Ltd. Class A (Consumer staples, Food products) † | | | | | | |
Midea Group Co. Ltd. Class A (Consumer discretionary, Household durables) | | | | | | |
Zhejiang NHU Co. Ltd. Class A (Health care, Pharmaceuticals) † | | | | | | |
Zoomlion Heavy Industry Science & Technology Co. Ltd. Class H (Industrials, Machinery) † | | | | | | |
| | | | | | |
| | | | | | |
National Bank of Greece SA ADR (Financials, Banks) † | | | | | | |
| | | | | | |
ASMPT Ltd. (Information technology, Semiconductors & semiconductor equipment) | | | | | | |
CSPC Pharmaceutical Group Ltd. (Health care, Pharmaceuticals) | | | | | | |
| | | | | | |
| | | | | | |
Dr. Reddy’s Laboratories Ltd. ADR (Health care, Pharmaceuticals) | | | | | | |
HDFC Bank Ltd. ADR (Financials, Banks) † | | | | | | |
ICICI Bank Ltd. ADR (Financials, Banks) | | | | | | |
Mahindra & Mahindra Ltd. GDR (Consumer discretionary, Automobiles) | | | | | | |
Reliance Industries Ltd. GDR (Energy, Oil, gas & consumable fuels) 144A | | | | | | |
| | | | | | |
Allspring Managed Account | 5
Portfolio of investments—April 30, 2023 (unaudited)
| | | | | |
| | | | | | |
Bank Negara Indonesia Persero Tbk PT (Financials, Banks) | | | | | | |
| | | | | | |
PRADA SpA (Consumer discretionary, Textiles, apparel & luxury goods) † | | | | | | |
| | | | | | |
Petronas Chemicals Group Bhd (Materials, Chemicals) | | | | | | |
RHB Bank Bhd (Financials, Banks) | | | | | | |
| | | | | | |
| | | | | | |
Grupo Bimbo SAB de CV Class A (Consumer staples, Food products) | | | | | | |
| | | | | | |
Bank of the Philippine Islands (Financials, Banks) | | | | | | |
| | | | | | |
Bank Polska Kasa Opieki SA (Financials, Banks) † | | | | | | |
| | | | | | |
Industries Qatar QSC (Industrials, Industrial conglomerates) | | | | | | |
| | | | | | |
BOC Aviation Ltd. (Industrials, Trading companies & distributors) 144A | | | | | | |
| | | | | | |
Absa Group Ltd. (Financials, Banks) | | | | | | |
| | | | | | |
Doosan Bobcat, Inc. (Industrials, Machinery) | | | | | | |
Kia Corp. (Consumer discretionary, Automobiles) | | | | | | |
Samsung Electronics Co. Ltd. (Information technology, Technology hardware, storage & peripherals) | | | | | | |
| | | | | | |
| | | | | | |
Advantech Co. Ltd. (Information technology, Technology hardware, storage & peripherals) † | | | | | | |
Cathay Financial Holding Co. Ltd. (Financials, Insurance) † | | | | | | |
Chroma ATE, Inc. (Information technology, Electronic equipment, instruments & components) † | | | | | | |
E Ink Holdings, Inc. (Information technology, Electronic equipment, instruments & components) † | | | | | | |
Formosa Plastics Corp. (Materials, Chemicals) † | | | | | | |
Hon Hai Precision Industry Co. Ltd. (Information technology, Electronic equipment, instruments & components) † | | | | | | |
MediaTek, Inc. (Information technology, Semiconductors & semiconductor equipment) † | | | | | | |
Poya International Co. Ltd. (Consumer discretionary, Broadline retail) † | | | | | | |
Realtek Semiconductor Corp. (Information technology, Semiconductors & semiconductor equipment) † | | | | | | |
| | | | | | |
6 | Allspring Managed Account
Portfolio of investments—April 30, 2023 (unaudited)
| | | | | |
| | | | | | |
Thai Beverage PCL (Consumer staples, Beverages) | | | | | | |
United Arab Emirates: 1.61% | | | | | | |
Aldar Properties PJSC (Real estate, Real estate management & development) | | | | | | |
Total common stocks (Cost $4,088,787) | | | | | | |
Investment companies: 3.21% | | | | | | |
| | | | | | |
iShares MSCI Saudi Arabia ETF | | | | | | |
Total investment companies (Cost $144,749) | | | | | | |
| | | | | |
| | | | | | |
| | | | | | |
LG Chem Ltd. (Materials, Chemicals) | | | | | | |
Total preferred stocks (Cost $132,053) | | | | | | |
| | | | | |
Short-term investments: 2.83% | | | | | | |
Investment companies: 2.83% | | | | | | |
Allspring Government Money Market Fund Select Class ♠∞ | | | | | | |
Total short-term investments (Cost $135,450) | | | | | | |
Total investments in securities (Cost $4,501,039) | | | | | | |
Other assets and liabilities, net | | | | | | |
| | | | | | |
| Non-income-earning security |
| The security may be resold in transactions exempt from registration, normally to qualified institutional buyers, pursuant to Rule 144A under the Securities Act of 1933. |
| The issuer of the security is an affiliated person of the Fund as defined in the Investment Company Act of 1940. |
| The rate represents the 7-day annualized yield at period end. |
|
| American depositary receipt |
| Global depositary receipt |
Allspring Managed Account | 7
Portfolio of investments—April 30, 2023 (unaudited)
Investments in affiliates
An affiliated investment is an investment in which the Fund owns at least 5% of the outstanding voting shares of the issuer or as a result of other relationships, such as the Fund and the issuer having the same investment manager. Transactions with issuers that were affiliates of the Fund at the end of the period were as follows:
| | | | | Net
change in
unrealized
gains
(losses) | | | Income
from
affiliated
securities |
| | | | | | | | |
Allspring Government Money Market Fund Select Class | | | | | | | | |
8 | Allspring Managed Account
Statement of assets and liabilities—April 30, 2023 (unaudited)
Financial statements
Statement of assets and liabilities
| |
Investments in unaffiliated securities, at value (cost $4,365,589) | |
Investments in affiliated securities, at value (cost $135,450) | |
Foreign currency, at value (cost $12,930) | |
Receivable for investments sold | |
| |
| |
Prepaid expenses and other assets | |
| |
| |
Payable for investments purchased | |
| |
| |
| |
| |
Total distributable earnings | |
| |
Computation of net asset value per share | |
| |
| |
Net asset value per share | |
| The Fund has an unlimited number of authorized shares. |
The accompanying notes are an integral part of these financial statements.
Allspring Managed Account | 9
Statement of operations—period ended April 30, 20231 (unaudited)
Statement of operations
| |
Dividends (net of foreign withholdings taxes of $5,611) | |
Income from affiliated securities | |
| |
| |
| |
Custody and accounting fees | |
| |
| |
Shareholder report expenses | |
Trustees’ fees and expenses | |
| |
| |
Less: Fee waivers and/or expense reimbursements | |
| |
| |
Realized and unrealized gains (losses) on investments | |
Net realized gains (losses) on | |
| |
Foreign currency and foreign currency translations | |
Net realized gains on investments | |
Net change in unrealized gains (losses) on | |
| |
Foreign currency and foreign currency translations | |
Net change in unrealized gains (losses) on investments | |
Net realized and unrealized gains (losses) on investments | |
Net increase in net assets resulting from operations | |
| For the period from November 16, 2022 (commencement of operations) to April 30, 2023 |
The accompanying notes are an integral part of these financial statements.
10 | Allspring Managed Account
Statement of changes in net assets
Statement of changes in net assets
| |
| | |
| | |
Net realized gains on investments | | |
Net change in unrealized gains (losses) on investments | | |
Net increase in net assets resulting from operations | | |
Distributions to shareholders from | | |
Net investment income and net realized gains | | |
Capital share transactions | | |
Proceeds from shares sold | | |
Reinvestment of distributions | | |
Net increase in net assets resulting from capital share transactions | | |
Total increase in net assets | | |
| | |
| | |
| | |
| For the period from November 16, 2022 (commencement of operations) to April 30, 2023 |
The accompanying notes are an integral part of these financial statements.
Allspring Managed Account | 11
Financial highlights
(For a share outstanding throughout each period)
| |
Net asset value, beginning of period | |
| |
Net realized and unrealized gains (losses) on investments | |
Total from investment operations | |
Distributions to shareholders from | |
| |
Net asset value, end of period | |
| |
Ratios to average net assets (annualized) | |
| |
| |
| |
| |
| |
Net assets, end of period (000s omitted) | |
| For the period from November 16, 2022 (commencement of operations) to April 30, 2023 |
| Calculated based upon average shares outstanding |
| Returns for periods of less than one year are not annualized. |
| The manager has contractually committed to irrevocably absorb and pay or reimburse all ordinary operating expenses of the Fund, except portfolio transactions or other investment-related costs (e.g., commissions), fees payable for services provided by the Fund’s securities lending agent (if any), interest, taxes, leverage expenses, and other expenses not incurred in the ordinary course of the Fund’s business. This commitment has an indefinite term. |
The accompanying notes are an integral part of these financial statements.
12 | Allspring Managed Account
Notes to financial statements (unaudited)
Notes to financial statements
Allspring Funds Trust (the “Trust”), a Delaware statutory trust organized on March 10, 1999, is an open-end management investment company registered under the Investment Company Act of 1940, as amended (the “1940 Act”). As an investment company, the Trust follows the accounting and reporting guidance in Financial Accounting Standards Board (“FASB”) Accounting Standards Codification Topic 946, Financial Services – Investment Companies. These financial statements report on the Allspring Managed Account CoreBuilder Shares - Series EM (the “Fund”) which is a diversified series of the Trust.
The Fund is a special purpose fund invested primarily in foreign equity securities and is intended to be used in combination with selected individual securities to effectively model institutional-level investment strategies. The Fund is intended to help enable certain separately managed account investors to achieve greater diversification than smaller managed accounts might otherwise achieve.
2.
SIGNIFICANT ACCOUNTING POLICIES
The following significant accounting policies, which are consistently followed in the preparation of the financial statements of the Fund, are in conformity with U.S. generally accepted accounting principles which require management to make estimates and assumptions that affect the reported amounts of assets and liabilities, disclosure of contingent assets and liabilities at the date of the financial statements, and the reported amounts of income and expenses during the reporting period. Actual results could differ from those estimates.
Securities valuation
All investments are valued each business day as of the close of regular trading on the New York Stock Exchange (generally 4 p.m. Eastern Time), although the Funds may deviate from this calculation time under unusual or unexpected circumstances.
Equity securities and exchange-traded funds that are listed on a foreign or domestic exchange or market are valued at the official closing price or, if none, the last sales price.
The values of securities denominated in foreign currencies are translated into U.S. dollars at rates provided by an independent foreign currency pricing source at a time each business day specified by the Valuation Committee at Allspring Funds Management, LLC (“Allspring Funds Management”).
Many securities markets and exchanges outside the U.S. close prior to the close of the New York Stock Exchange and therefore may not fully reflect trading or events that occur after the close of the principal exchange in which the foreign securities are traded, but before the close of the New York Stock Exchange. If such trading or events are expected to materially affect the value of such securities, then fair value pricing procedures implemented by Allspring Funds Management are applied. These procedures take into account multiple factors including movements in U.S. securities markets after foreign exchanges close. Foreign securities that are fair valued under these procedures are categorized as Level 2 and the application of these procedures may result in transfers between Level 1 and Level 2. Depending on market activity, such fair valuations may be frequent. Such fair value pricing may result in net asset values that are higher or lower than net asset values based on the last reported sales price or latest quoted bid price. On April 30, 2023, such fair value pricing was used in pricing certain foreign securities.
Investments in registered open-end investment companies (other than those listed on a foreign or domestic exchange or market) are valued at net asset value.
Investments which are not valued using any of the methods discussed above are valued at their fair value, as determined in good faith by Allspring Funds Management, which was named the valuation designee by the Board of Trustees. As the valuation designee, Allspring Funds Management is responsible for day-to-day valuation activities for the Allspring Funds. In connection with these responsibilities, Allspring Funds Management has established a Valuation Committee and has delegated to it the authority to take any actions regarding the valuation of portfolio securities that the Valuation Committee deems necessary or appropriate, including determining the fair value of portfolio securities. On a quarterly basis, the Board of Trustees receives reports of valuation actions taken by the Valuation Committee. On at least an annual basis, the Board of Trustees receives an assessment of the adequacy and effectiveness of Allspring Funds Management’s process for determining the fair value of the portfolio of investments.
Foreign currency translation
The accounting records of the Fund are maintained in U.S. dollars. The values of other assets and liabilities denominated in foreign currencies are translated into U.S. dollars at rates provided by an independent foreign currency pricing source at a time each business day specified by the Valuation Committee. Purchases and sales of securities, and income and expenses are converted at the rate of exchange on the respective dates of such transactions. Net realized foreign exchange gains or losses arise from sales of foreign currencies, currency gains or losses realized between the trade and settlement dates on securities transactions, and the difference between the amounts of dividends, interest and foreign withholding taxes recorded and the U.S. dollar equivalent of the amounts actually paid or received. Net unrealized foreign exchange gains and losses arise from changes in the fair value of assets and liabilities other than investments in securities resulting from changes in exchange rates. The changes in net assets arising from changes in exchange rates of securities and the changes in net assets resulting from changes in market prices of securities are not separately presented. Such changes are included in net realized and unrealized gains or losses from investments.
Security transactions and income recognition
Securities transactions are recorded on a trade date basis. Realized gains or losses are recorded on the basis of identified cost.
Allspring Managed Account | 13
Notes to financial statements (unaudited)
Dividend income is recognized on the ex-dividend date, except for certain dividends from foreign securities, which are recorded as soon as the custodian verifies the ex-dividend date. Dividend income is recorded net of foreign taxes withheld where recovery of such taxes is not assured.
Distributions to shareholders
Distributions to shareholders are recorded on the ex-dividend date and paid from net investment income monthly and any net realized gains are paid at least annually. Such distributions are determined in accordance with income tax regulations and may differ from U.S.generally accepted accounting principles. Dividend sources are estimated at the time of declaration. The tax character of distributions is determined as of the Fund’s fiscal year end. Therefore, a portion of the Fund’s distributions made prior to the Fund’s fiscal year end may be categorized as a tax return of capital at year end.
Federal and other taxes
The Fund intends to qualify as a regulated investment company by distributing substantially all of its investment company taxable income and any net realized capital gains (after reduction for capital loss carryforwards) sufficient to relieve it from all, or substantially all, federal income taxes. Accordingly, no provision for federal income taxes was required.
The Fund’s income and federal excise tax returns and all financial records supporting those returns for the fiscal years since commencement of operations are subject to examination by the federal and Delaware revenue authorities.
As of April 30, 2023, the aggregate cost of all investments for federal income tax purposes was $4,496,364 and the unrealized gains (losses) consisted of:
3.
FAIR VALUATION MEASUREMENTS
Fair value measurements of investments are determined within a framework that has established a fair value hierarchy based upon the various data inputs utilized in determining the value of the Fund’s investments. The three-level hierarchy gives the highest priority to unadjusted quoted prices in active markets for identical assets or liabilities (Level 1) and the lowest priority to unobservable inputs (Level 3). The Fund’s investments are classified within the fair value hierarchy based on the lowest level of input that is significant to the fair value measurement. The inputs are summarized into three broad levels as follows:
•Level 1—quoted prices in active markets for identical securities
•Level 2—other significant observable inputs (including quoted prices for similar securities, interest rates, prepayment speeds, credit risk, etc.)
•Level 3—significant unobservable inputs (including the Fund’s own assumptions in determining the fair value of investments)
The inputs or methodologies used for valuing investments in securities are not necessarily an indication of the risk associated with investing in those securities.
14 | Allspring Managed Account
Notes to financial statements (unaudited)
The following is a summary of the inputs used in valuing the Fund’s assets and liabilities as of April 30, 2023:
| | Other significant
observable inputs
(Level 2) | Significant
unobservable inputs
(Level 3) | |
| | | | |
| | | | |
| | | | |
| | | | |
| | | | |
| | | | |
| | | | |
| | | | |
| | | | |
| | | | |
| | | | |
| | | | |
| | | | |
| | | | |
| | | | |
| | | | |
| | | | |
| | | | |
| | | | |
| | | | |
| | | | |
| | | | |
| | | | |
| | | | |
| | | | |
| | | | |
| | | | |
| | | | |
Additional sector, industry or geographic detail, if any, is included in the Portfolio of Investments.
For the period from November 16, 2022 (commencement of operations) to April 30, 2023, the Fund did not have any transfers into/out of Level 3.
4.
TRANSACTIONS WITH AFFILIATES
The Trust has entered into an investment management contract with Allspring Funds Management, a wholly owned subsidiary of Allspring Global Investments Holdings, LLC, a holding company indirectly owned by certain private funds of GTCR LLC and Reverence Capital Partners, L.P. The manager is responsible for implementing investment policies and guidelines and for supervising the subadviser, who is responsible for day-to-day portfolio management of the Fund. For providing these services, Allspring Funds Management does not receive a fee from the Fund but is entitled to receive fees from separately managed account sponsors of the wrap-fee programs. Out of these fees, Allspring Funds Management pays Allspring Global Investments, LLC, an affiliate of Allspring Funds Management and a wholly owned subsidiary of Allspring Global Investments Holdings, LLC, for its services as the subadviser to the Fund.
Generally, no ordinary operating fees or expenses are charged to the Fund. Allspring Funds Management has contractually committed to irrevocably absorb and pay or reimburse all ordinary operating expenses of the Fund, except portfolio transactions or other investment-related costs (e.g., commissions), fees payable for services provided by the Fund’s securities lending agent (if any), interest, taxes, leverage expenses, and other expenses not incurred in the ordinary course of the Fund’s business. This commitment has an indefinite term.
Interfund transactions
The Fund may purchase or sell portfolio investment securities to certain affiliates pursuant to Rule 17a-7 under the 1940 Act and under procedures adopted by the Board of Trustees. The procedures have been designed to ensure that these interfund transactions, which do not incur broker commissions, are effected at current market prices.
5.
INVESTMENT PORTFOLIO TRANSACTIONS
Purchases and sales of investments, excluding U.S. government obligations (if any) and short-term securities, for the period from November 16, 2022 (commencement of operations) to April 30, 2023 were $6,107,599 and $1,760,131, respectively.
Allspring Managed Account | 15
Notes to financial statements (unaudited)
The Trust (excluding the money market funds), Allspring Master Trust and Allspring Variable Trust are parties to a $350,000,000 revolving credit agreement whereby the Fund is permitted to use bank borrowings for temporary or emergency purposes, such as to fund shareholder redemption requests. Interest under the credit agreement is charged to the Fund based on borrowing rate equal to the higher of the Federal Funds rate or the overnight bank funding rate in effect on that day plus a spread. In addition, an annual commitment fee based on the unused balance is allocated to each participating fund.
For the period from November 16, 2022 (commencement of operations) to April 30, 2023, there were no borrowings by the Fund under the agreement.
Concentration risk exists when a shareholder owns a large amount of shares of the Fund. A fund with a concentration of ownership may be more affected by the investment activity of those shareholders than would be a fund that does not have any ownership concentration. As of April 30, 2023, Allspring Funds Management or one of its affiliates owned 100% of the Fund.
Under the Fund’s organizational documents, the officers and Trustees have been granted certain indemnification rights against certain liabilities that may arise out of performance of their duties to the Fund. The Fund has entered into a separate agreement with each Trustee that converts indemnification rights currently existing under the Fund’s organizational documents into contractual rights that cannot be changed in the future without the consent of the Trustee. Additionally, in the normal course of business, the Fund may enter into contracts with service providers that contain a variety of indemnification clauses. The Fund’s maximum exposure under these arrangements is dependent on future claims that may be made against the Fund and, therefore, cannot be estimated.
16 | Allspring Managed Account
Other information (unaudited)
Other information
Proxy voting information
A description of the policies and procedures used to determine how to vote proxies relating to portfolio securities is available without charge, upon request, by calling 1-800-222-8222, visiting our website at allspringglobal.com, or visiting the SEC website at sec.gov. Information regarding how the proxies related to portfolio securities were voted during the most recent 12-month period ended June 30 is available on the website at allspringglobal.com or by visiting the SEC website at sec.gov.
Quarterly portfolio holdings information
The Fund files its complete schedule of portfolio holdings with the SEC for the first and third quarters of each fiscal year as an exhibit to its reports on Form N-PORT. Shareholders may view the filed Form N-PORT by visiting the SEC website at sec.gov.
Allspring Managed Account | 17
Other information (unaudited)
BOARD OF TRUSTEES AND OFFICERS
Each of the Trustees and Officers listed in the table below acts in identical capacities for each fund in the Allspring family of funds, which consists of 127 mutual funds comprising the Allspring Funds Trust, Allspring Variable Trust, Allspring Master Trust and four closed-end funds (collectively the “Fund Complex”). This table should be read in conjunction with the Prospectus and the Statement of Additional Information1. The mailing address of each Trustee and Officer is 1415 Vantage Park Drive, 3rd Floor, Charlotte, NC 28203. Each Trustee and Officer serves an indefinite term, however, each Trustee serves such term until reaching the mandatory retirement age established by the Trustees.
Independent Trustees
| | Principal occupations during past five years or longer | Current other
public company or
investment
company
directorships |
William R. Ebsworth
(Born 1957) | | Retired. From 1984 to 2013, equities analyst, portfolio manager, research director and chief investment officer at Fidelity Management and Research Company in Boston, Tokyo, and Hong Kong, and retired in 2013 as Chief Investment Officer of Fidelity Strategic Advisers, Inc. where he led a team of investment professionals managing client assets. Prior thereto, Board member of Hong Kong Securities Clearing Co., Hong Kong Options Clearing Corp., the Thailand International Fund, Ltd., Fidelity Investments Life Insurance Company, and Empire Fidelity Investments Life Insurance Company. Audit Committee Chair and Investment Committee Chair of the Vincent Memorial Hospital Foundation (non-profit organization). Mr. Ebsworth is a CFA charterholder. | |
Jane A. Freeman
(Born 1953) | Trustee,
since 2015;
Chair Liaison,
since 2018 | Retired. From 2012 to 2014 and 1999 to 2008, Chief Financial Officer of Scientific Learning Corporation. From 2008 to 2012, Ms. Freeman provided consulting services related to strategic business projects. Prior to 1999, Portfolio Manager at Rockefeller & Co. and Scudder, Stevens & Clark. Board member of the Harding Loevner Funds from 1996 to 2014, serving as both Lead Independent Director and chair of the Audit Committee. Board member of the Russell Exchange Traded Funds Trust from 2011 to 2012 and the chair of the Audit Committee. Ms. Freeman is also an inactive Chartered Financial Analyst. | |
Isaiah Harris, Jr.
(Born 1952) | Trustee,
since 2009;
Audit Committee Chair,
since 2019 | Retired. Member of the Advisory Board of CEF of East Central Florida. Chairman of the Board of CIGNA Corporation from 2009 to 2021, and Director from 2005 to 2008. From 2003 to 2011, Director of Deluxe Corporation. Prior thereto, President and CEO of BellSouth Advertising and Publishing Corp. from 2005 to 2007, President and CEO of BellSouth Enterprises from 2004 to 2005 and President of BellSouth Consumer Services from 2000 to 2003. Emeritus member of the Iowa State University Foundation Board of Governors. Emeritus Member of the Advisory Board of Iowa State University School of Business. Advisory Board Member, Palm Harbor Academy (private school). Advisory Board Member, Fellowship of Christian Athletes. Mr. Harris is a certified public accountant (inactive status). | |
David F. Larcker
(Born 1950) | | Distinguished Visiting Fellow at the Hoover Institution since 2022. James Irvin Miller Professor of Accounting at the Graduate School of Business (Emeritus), Stanford University, Director of the Corporate Governance Research Initiative and Senior Faculty of The Rock Center for Corporate Governance since 2006. From 2005 to 2008, Professor of Accounting at the Graduate School of Business, Stanford University. Prior thereto, Ernst & Young Professor of Accounting at The Wharton School, University of Pennsylvania from 1985 to 2005. | |
Olivia S. Mitchell
(Born 1953) | Trustee,
since 2006;
Nominating and Governance Committee Chair,
since 2018 | International Foundation of Employee Benefit Plans Professor since 1993, Wharton School of the University of Pennsylvania. Director of Wharton’s Pension Research Council and Boettner Center on Pensions & Retirement Research, and Research Associate at the National Bureau of Economic Research. Previously taught at Cornell University from 1978 to 1993. | |
Timothy J. Penny
(Born 1951) | Trustee,
since 1996;
Chair,
since 2018 | President and Chief Executive Officer of Southern Minnesota Initiative Foundation, a non-profit organization, since 2007. Vice Chair of the Economic Club of Minnesota, since 2007. Co-Chair of the Committee for a Responsible Federal Budget, since 1995. Member of the Board of Trustees of NorthStar Education Finance, Inc., a non-profit organization, from 2007-2022. Senior Fellow of the University of Minnesota Humphrey Institute from 1995 to 2017. | |
1
The Statement of Additional Information includes additional information about the Trustees and is available, without charge, upon request, by calling 1-800-222-8222 or by visiting the website at allspringglobal.com.
18 | Allspring Managed Account
Other information (unaudited)
| Position held and length of service* | Principal occupations during past five years or longer | Current other public company or investment company directorships |
James G. Polisson
(Born 1959) | | Retired. Chief Marketing Officer, Source (ETF) UK Services, Ltd, from 2015 to 2017. From 2012 to 2015, Principal of The Polisson Group, LLC, a management consulting, corporate advisory and principal investing company. Chief Executive Officer and Managing Director at Russell Investments, Global Exchange Traded Funds from 2010 to 2012. Managing Director of Barclays Global Investors from 1998 to 2010 and Global Chief Marketing Officer for iShares and Barclays Global Investors from 2000 to 2010. Trustee of the San Francisco Mechanics’ Institute, a non- profit organization, from 2013 to 2015. Board member of the Russell Exchange Traded Fund Trust from 2011 to 2012. Director of Barclays Global Investors Holdings Deutschland GmbH from 2006 to 2009. Mr. Polisson is an attorney and has a retired status with the Massachusetts and District of Columbia Bar Associations. | |
Pamela Wheelock
(Born 1959) | Trustee,
since January 2020;
previously Trustee from
January 2018 to
July 2019 | Retired. Executive and Senior Financial leadership positions in the public, private and nonprofit sectors. Interim President and CEO, McKnight Foundation, 2020. Interim Commissioner, Minnesota Department of Human Services, 2019. Chief Operating Officer, Twin Cities Habitat for Humanity, 2017-2019. Vice President for University Services, University of Minnesota, 2012- 2016. Interim President and CEO, Blue Cross and Blue Shield of Minnesota, 2011-2012. Executive Vice-President and Chief Financial Officer, Minnesota Wild, 2002-2008. Commissioner, Minnesota Department of Finance, 1999-2002. Chair of the Board of Directors of Destination Medical Center Corporation. Board member of the Minnesota Wild Foundation. | |
| Length of service dates reflect the Trustee’s commencement of service with the Trust’s predecessor entities, where applicable. |
Allspring Managed Account | 19
Other information (unaudited)
Officers1
| Position held and
length of service | Principal occupations during past five years or longer |
| | President and Chief Executive Officer of Allspring Funds Management, LLC since 2017 and Head of Global Fund Governance of Allspring Global Investments since 2022. Prior thereto, co-president of Galliard Capital Management, LLC, an affiliate of Allspring Funds Management, LLC, from 2019 to 2022 and Head of Affiliated Managers, Allspring Global Investments, from 2014 to 2019 and Executive Vice President responsible for marketing, investments and product development for Allspring Funds Management, LLC, from 2009 to 2014. |
Jeremy DePalma
(Born 1974) | Treasurer,
since 2012
(for certain funds in
the Fund Complex);
since 2021 (for
the remaining funds in the Fund Complex) | Senior Vice President of Allspring Funds Management, LLC since 2009. Senior Vice President of Evergreen Investment Management Company, LLC from 2008 to 2010 and head of the Fund Reporting and Control Team within Fund Administration from 2005 to 2010. |
Christopher Baker
(Born 1976) | Chief Compliance Officer,
since 2022 | Global Chief Compliance Officer for Allspring Global Investments since 2022. Prior thereto, Chief Compliance Officer for State Street Global Advisors from 2018 to 2021. Senior Compliance Officer for the State Street divisions of Alternative Investment Solutions, Sector Solutions, and Global Marketing from 2015 to 2018. From 2010 to 2015 Vice President, Global Head of Investment and Marketing Compliance for State Street Global Advisors. |
Matthew Prasse
(Born 1983) | Chief Legal Officer,
since 2022;
Secretary,
since 2021 | Senior Counsel of the Allspring Legal Department since 2021. Senior Counsel of the Wells Fargo Legal Department from 2018 to 2021. Previously, Counsel for Barings LLC from 2015 to 2018. Prior to joining Barings, Associate at Morgan, Lewis & Bockius LLP from 2008 to 2015. |
1 For those Officers with tenures at Allspring Global Investments and/or Allspring Funds Management, LLC that began prior to 2021, such tenures include years of service during which these businesses/entities were known as Wells Fargo Asset Management and Wells Fargo Funds Management, LLC, respectively.
20 | Allspring Managed Account
For more information
More information about Allspring Funds is available free upon request. To obtain literature, please write, visit the Fund’s website, or call:
Allspring Funds
Attn: Managed Account Services
P.O. Box 1450
Milwaukee, WI 53201
Website: allspringglobal.com
Telephone: 1-888-877-9275
This report and the financial statements contained herein are submitted for the general information of the shareholders of the Fund. If this report is used for promotional purposes, distribution of the report must be accompanied or preceded by a current prospectus. Before investing, please consider the investment objectives, risks, charges, and expenses of the investment. For a current prospectus and, if available, a summary prospectus, containing this information, call 1-888-877-9275 or visit the Fund’s website at allspringglobal.com. Read the prospectus carefully before you invest or send money.
Allspring Global InvestmentsTM is the trade name for the asset management firms of Allspring Global Investments Holdings, LLC, a holding company indirectly owned by certain private funds of GTCR LLC and Reverence Capital Partners, L.P. These firms include but are not limited to Allspring Global Investments, LLC, and Allspring Funds Management, LLC. Certain products managed by Allspring entities are distributed by Allspring Funds Distributor, LLC (a broker-dealer and Member FINRA/SIPC).
This material is for general informational and educational purposes only and is NOT intended to provide investment advice or a recommendation of any kind - including a recommendation for any specific investment, strategy, or plan.
© 2023 Allspring Global Investments Holdings, LLC. All rights reserved.
ALL-05052023-khoxlbh1 06-23
SAR4904 04-23
Allspring Special Global Small Cap Fund
Semi-Annual Report
April 30, 2023
The views expressed and any forward-looking statements are as of April 30, 2023, unless otherwise noted, and are those of the Fund’s portfolio managers and/or Allspring Global Investments. Discussions of individual securities or the markets generally are not intended as individual recommendations. Future events or results may vary significantly from those expressed in any forward-looking statements. The views expressed are subject to change at any time in response to changing circumstances in the market. Allspring Global Investments disclaims any obligation to publicly update or revise any views expressed or forward-looking statements.
Allspring Special Global Small Cap Fund | 1
Letter to shareholders (unaudited)
Andrew Owen
President
Allspring Funds
Dear Shareholder:
We are pleased to offer you this semi-annual report for the Allspring Special Global Small Cap Fund for the six-month period that ended April 30, 2023. Globally, stocks and bonds rebounded strongly despite ongoing volatility. While navigating persistently high inflation and the impact of ongoing aggressive central bank rate hikes, markets rallied on signs of declining inflation, anticipation of an end to the central bank monetary tightening cycle, and the stimulating impact of China removing its strict COVID-19 lockdowns in December. For the six-month period, domestic U.S. and global stocks and bonds had strong results. After suffering deep and broad losses through 2022, recent fixed income performance benefited from a base of higher yields that have the potential to generate higher income.
For the period, U.S. stocks, based on the S&P 500 Index,1 returned 8.63%. International stocks, as measured by the MSCI ACWI ex USA Index (Net),2 gained 20.65% while the MSCI EM Index (Net) (USD),3 returned 16.36%. Among bond indexes, the Bloomberg U.S. Aggregate Bond Index4 returned 6.91%, the Bloomberg Global Aggregate ex-USD Index (unhedged)5 gained 10.55%, the Bloomberg Municipal Bond Index6 gained 7.65%, and the ICE BofA U.S. High Yield Index7 returned 5.92%.
Despite high inflation and central bank rate hikes, markets rally.
Stocks and bonds rallied in November after earlier volatility. Economic news was encouraging, driven by U.S. labor market strength. Although central banks kept increasing rates, hopes rose for an easing in the pace of rate hikes and a possible end to central bank monetary tightening in 2023. Although inflation remained at record highs in the eurozone, we began to see signs of a possible decline in inflationary pressures as U.S. inflation moderated, with a 7.1% annual price rise in November and a monthly price increase of just 0.1%. China’s economic data remained weak, reflecting its zero-COVID-19 policy.
Financial markets cooled in December, with U.S. equities posting negative overall results in response to a weakening U.S. dollar. Fixed income securities ended one of their worst years ever, with flat overall monthly returns as markets weighed the hopes for an end to the monetary tightening cycle with the reality that central banks had not completed their jobs yet. U.S. Consumer Price Index (CPI)8 data showed a strong consistent trend downward, which brought down the 12-month CPI to 6.5% in December from 9.1% in June. Other countries and regions reported still-high but declining inflation rates as the year wound down.
1
The S&P 500 Index consists of 500 stocks chosen for market size, liquidity, and industry group representation. It is a market-value-weighted index with each stock’s weight in the index proportionate to its market value. You cannot invest directly in an index.
2
The Morgan Stanley Capital International (MSCI) All Country World Index (ACWI) ex USA Index (Net) is a free-float-adjusted market-capitalization-weighted index that is designed to measure the equity market performance of developed and emerging markets, excluding the U.S. Source: MSCI. MSCI makes no express or implied warranties or representations and shall have no liability whatsoever with respect to any MSCI data contained herein. The MSCI data may not be further redistributed or used as a basis for other indexes or any securities or financial products. This report is not approved, reviewed, or produced by MSCI. You cannot invest directly in an index.
3
The MSCI Emerging Markets (EM) Index (Net) (USD) is a free-float-adjusted market-capitalization-weighted index that is designed to measure the equity market performance of emerging markets. You cannot invest directly in an index.
4
The Bloomberg U.S. Aggregate Bond Index is a broad-based benchmark that measures the investment-grade, U.S.-dollar-denominated, fixed-rate taxable bond market, including Treasuries, government-related and corporate securities, mortgage-backed securities (agency fixed-rate and hybrid adjustable-rate mortgage pass-throughs), asset-backed securities, and commercial mortgage-backed securities. You cannot invest directly in an index.
5
The Bloomberg Global Aggregate ex-USD Index (unhedged) is an unmanaged index that provides a broad-based measure of the global investment-grade fixed-income markets excluding the U.S.-dollar-denominated debt market. You cannot invest directly in an index.
6
The Bloomberg Municipal Bond Index is an unmanaged index composed of long-term tax-exempt bonds with a minimum credit rating of Baa. You cannot invest directly in an index.
7
The ICE BofA U.S. High Yield Index is a market-capitalization-weighted index of domestic and Yankee high yield bonds. The index tracks the performance of high yield securities traded in the U.S. bond market. You cannot invest directly in an index. Copyright 2023. ICE Data Indices, LLC. All rights reserved.
8
The U.S. Consumer Price Index (CPI) is a measure of the average change over time in the prices paid by urban consumers for a market basket of consumer goods and services. You cannot invest directly in an index.
2 | Allspring Special Global Small Cap Fund
Letter to shareholders (unaudited)
The year 2023 began with a rally across global equities and fixed income securities. Investor optimism rose in response to data indicating declining inflation rates and the reopening of China’s economy with the abrupt end to its zero-COVID-19 policy. The U.S. reported surprisingly strong job gains—employers added more than 500,000 jobs—and unemployment fell to 3.4%, the lowest level since 1969. Meanwhile, wage growth, seen as a potential contributor to ongoing high inflation, continued to moderate. All eyes remained fixed on the Federal Reserve (Fed) and on how many more rate hikes remain in this tightening cycle. The 0.25% federal funds rate hike announced in January was the Fed’s smallest rate increase since March 2022.
Financial markets declined in February as investors responded unfavorably to resilient economic data. The takeaway: Central banks will likely continue their monetary tightening cycle for longer than markets had priced in. In this environment—where strong economic data is seen as bad news—the resilient U.S. labor market was seen as a negative while the inflation rate has not been falling quickly enough for the Fed, which raised interest rates by 0.25% in early February. Meanwhile, the Bank of England and the European Central Bank both raised rates by 0.50%.
The collapse of Silicon Valley Bank in March, the second-largest banking failure in U.S. history, led to a classic bank run that spread to Europe where Switzerland’s Credit Suisse was taken over by its rival, UBS. The banking industry turmoil created an additional challenge for central banks in balancing inflationary concerns against potential economic weakening. Meanwhile, recent data pointed to economic strength in the U.S., Europe, and China. And China’s economy continued to rebound after the removal of its COVID-19 lockdown. Inflation rates in the U.S., the U.K., and Europe all remained higher than central bank targets, leading to additional rate hikes in March.
Economic data released in April pointed to global resilience, as Purchasing Managers Indexes1 in the U.S., U.K., and eurozone beat expectations and China reported first-quarter annualized economic growth of 4.5%. Despite banking industry stress, developed market stocks had monthly gains. The U.S. labor market remained strong, with a 3.5% jobless rate and monthly payroll gains above 200,000. However, uncertainty and inflationary concerns weighed on investors in the U.S. and abroad.
Don’t let short-term uncertainty derail long-term investment goals.
Periods of investment uncertainty can present challenges, but experience has taught us that maintaining long-term investment goals can be an effective way to plan for the future. To help you create a sound strategy based on your personal goals and risk tolerance, Allspring Funds offers more than 100 mutual funds spanning a wide range of asset classes and investment styles. Although diversification cannot guarantee an investment profit or prevent losses, we believe it can be an effective way to manage investment risk and potentially smooth out overall portfolio performance. We encourage investors to know their investments and to understand that appropriate levels of risk-taking may unlock opportunities.
Thank you for choosing to invest with Allspring Funds. We appreciate your confidence in us and remain committed to helping you meet your financial needs.
Sincerely,
Andrew Owen
President
Allspring Funds
“ The collapse of Silicon Valley Bank in March, the second-largest banking failure in U.S. history, led to a classic bank run that spread to Europe where Switzerland’s Credit Suisse was taken over by its rival, UBS. ”
For further information about your fund, contact your investment professional, visit our website at allspringglobal.com, or call us directly at 1-800-222-8222.
1
The Purchasing Managers Index (PMI) is an index of the prevailing direction of economic trends in the manufacturing and service sectors. You cannot invest directly in an index.
Allspring Special Global Small Cap Fund | 3
Performance highlights (unaudited)
Performance highlights
| The Fund seeks long-term capital appreciation. |
| Allspring Funds Management, LLC |
| Allspring Global Investments, LLC |
| Stephen Giggie, CFA, Oleg Makhorine, Brian Martin, CFA, James M. Tringas, CFA, Bryant VanCronkhite, CFA, CPA |
Average annual total returns (%) as of April 30, 2023 |
| | | | |
| | | | | | | | | |
| | | | | | | | | |
| | | | | | | | | |
Administrator Class (EKGYX) | | | | | | | | | |
Institutional Class (EKGIX) | | | | | | | | | |
MSCI World Small Cap Index (Net)3 | | | | | | | | | |
S&P Developed SmallCap Index4 | | | | | | | | | |
Figures quoted represent past performance, which is no guarantee of future results, and do not reflect taxes that a shareholder may pay on an investment in a fund. Investment return and principal value of an investment will fluctuate so that an investor’s shares, when redeemed, may be worth more or less than their original cost. Performance shown without sales charges would be lower if sales charges were reflected. Current performance may be lower or higher than the performance data quoted, which assumes the reinvestment of dividends and capital gains. Current month-end performance is available on the Fund’s website, allspringglobal.com.
Index returns do not include transaction costs associated with buying and selling securities, any mutual fund fees or expenses, or any taxes. It is not possible to invest directly in an index.
For Class A shares, the maximum front-end sales charge is 5.75%. For Class C shares, the maximum contingent deferred sales charge is 1.00%. Performance including a contingent deferred sales charge assumes the sales charge for the corresponding time period. Administrator Class and Institutional Class shares are sold without a front-end sales charge or contingent deferred sales charge.
|
| Reflects the expense ratios as stated in the most recent prospectuses. The expense ratios shown are subject to change and may differ from the annualized expense ratios shown in the financial highlights of this report. |
| The manager has contractually committed through February 29, 2024, to waive fees and/or reimburse expenses to the extent necessary to cap total annual fund operating expenses after fee waivers at 1.50% for Class A, 2.25% for Class C, 1.40% for Administrator Class and 1.15% for Institutional Class. Brokerage commissions, stamp duty fees, interest, taxes, acquired fund fees and expenses (if any), and extraordinary expenses are excluded from the expense caps. Prior to or after the commitment expiration date, the caps may be increased or the commitment to maintain the caps may be terminated only with the approval of the Board of Trustees. Without these caps, the Fund’s returns would have been lower. The expense ratio paid by an investor is the net expense ratio (the total annual fund operating expenses after fee waivers) as stated in the prospectuses. |
| The Morgan Stanley Capital International (MSCI) World Small Cap Index (Net) captures small cap representation across 23 developed markets countries. The index covers approximately 14% of the free float-adjusted market capitalization in each country. You cannot invest directly in an index. |
| The S&P Developed SmallCap Index is a free-float-adjusted market-capitalization-weighted index designed to measure the equity market performance of small- capitalization companies located in developed markets. The index is composed of companies within the bottom 15% of the cumulative market capitalization in developed markets. The index covers all publicly listed equities with float-adjusted market values of U.S. $100 million or more and annual dollar value traded of at least U.S. $50 million in all included countries. You cannot invest directly in an index. |
Stock values fluctuate in response to the activities of individual companies and general market and economic conditions. Foreign investments are especially volatile and can rise or fall dramatically due to differences in the political and economic conditions of the host country. These risks are generally intensified in emerging markets. The use of derivatives may reduce returns and/or increase volatility. Certain investment strategies tend to increase the total risk of an investment (relative to the broader market). This fund is exposed to geographic risk and smaller-company securities risk. Consult the Fund’s prospectus for additional information on these and other risks.
CFA® and Chartered Financial Analyst® are trademarks owned by CFA Institute. |
4 | Allspring Special Global Small Cap Fund
Performance highlights (unaudited)
Ten largest holdings (%) as of April 30, 20231 |
| |
| |
Gibraltar Industries, Inc. | |
| |
| |
| |
| |
| |
Globus Medical, Inc. Class A | |
| |
| Figures represent the percentage of the Fund’s net assets. Holdings are subject to change and may have changed since the date specified. |
Sector allocation as of April 30, 20231 |
| Figures represent the percentage of the Fund’s long-term investments. Allocations are subject to change and may have changed since the date specified. |
Geographic allocation as of April 30, 20231 |
| Figures represent the percentage of the Fund’s long-term investments. Allocations are subject to change and may have changed since the date specified. |
Allspring Special Global Small Cap Fund | 5
Fund expenses (unaudited)
Fund expenses
As a shareholder of the Fund, you incur two types of costs: (1) transaction costs, including sales charges (loads) on purchase payments and contingent deferred sales charges (if any) on redemptions and (2) ongoing costs, including management fees, distribution (12b-1) and/or shareholder servicing fees, and other Fund expenses. This example is intended to help you understand your ongoing costs (in dollars) of investing in the Fund and to compare these costs with the ongoing costs of investing in other mutual funds.
The example is based on an investment of $1,000 invested at the beginning of the six-month period and held for the entire period from November 1, 2022 to April 30, 2023.
Actual expenses
The “Actual” line of the table below provides information about actual account values and actual expenses. You may use the information in this line, together with the amount you invested, to estimate the expenses that you paid over the period. Simply divide your account value by $1,000 (for example, an $8,600 account value divided by $1,000 = 8.6), then multiply the result by the number in the “Actual” line under the heading entitled “Expenses paid during period” for your applicable class of shares to estimate the expenses you paid on your account during this period.
Hypothetical example for comparison purposes
The “Hypothetical” line of the table below provides information about hypothetical account values and hypothetical expenses based on the Fund’s actual expense ratio and an assumed rate of return of 5% per year before expenses, which is not the Fund’s actual return. The hypothetical account values and expenses may not be used to estimate the actual ending account balance or expenses you paid for the period. You may use this information to compare the ongoing costs of investing in the Fund and other funds. To do so, compare this 5% hypothetical example with the 5% hypothetical examples that appear in the shareholder reports of the other funds.
Please note that the expenses shown in the table are meant to highlight your ongoing costs only and do not reflect any transactional costs, such as sales charges (loads) and contingent deferred sales charges. Therefore, the “Hypothetical” line of the table is useful in comparing ongoing costs only, and will not help you determine the relative total costs of owning different funds. In addition, if these transactional costs were included, your costs would have been higher.
| Beginning
account value
11-1-2022 | Ending
account value
4-30-2023 | | Annualized net
expense ratio |
| | | | |
| | | | |
Hypothetical (5% return before expenses) | | | | |
| | | | |
| | | | |
Hypothetical (5% return before expenses) | | | | |
| | | | |
| | | | |
Hypothetical (5% return before expenses) | | | | |
| | | | |
| | | | |
Hypothetical (5% return before expenses) | | | | |
1 Expenses paid is equal to the annualized net expense ratio of each class multiplied by the average account value over the period, multiplied by 181 divided by 365 (to reflect the one-half-year period).
6 | Allspring Special Global Small Cap Fund
Portfolio of investments—April 30, 2023 (unaudited)
| | | | | |
| | | | | | |
| | | | | | |
Ansell Ltd. (Health care, Health care equipment & supplies) | | | | | | |
Cettire Ltd. (Consumer discretionary, Specialty retail) † | | | | | | |
Inghams Group Ltd. (Consumer staples, Food products) | | | | | | |
| | | | | | |
| | | | | | |
Barco NV (Information technology, Electronic equipment, instruments & components) † | | | | | | |
| | | | | | |
ATS Corp. (Industrials, Machinery) † | | | | | | |
Canadian Western Bank (Financials, Banks) | | | | | | |
Novanta, Inc. (Information technology, Electronic equipment, instruments & components) † | | | | | | |
Primo Water Corp. (Consumer staples, Beverages) | | | | | | |
| | | | | | |
| | | | | | |
SimCorp AS (Information technology, Software) | | | | | | |
| | | | | | |
Alten SA (Information technology, IT services) † | | | | | | |
Metropole Television SA (Communication services, Media) † | | | | | | |
| | | | | | |
| | | | | | |
Cancom SE (Information technology, IT services) | | | | | | |
Gerresheimer AG (Health care, Life sciences tools & services) | | | | | | |
Krones AG (Industrials, Machinery) | | | | | | |
TAG Immobilien AG (Real estate, Real estate management & development) † | | | | | | |
| | | | | | |
| | | | | | |
Irish Residential Properties REIT PLC (Real estate, Residential REITs) | | | | | | |
| | | | | | |
CyberArk Software Ltd. (Information technology, Software) † | | | | | | |
| | | | | | |
De’ Longhi SpA (Consumer discretionary, Household durables) † | | | | | | |
GVS SpA (Industrials, Machinery) 144A† | | | | | | |
Interpump Group SpA (Industrials, Machinery) † | | | | | | |
| | | | | | |
| | | | | | |
Aeon Delight Co. Ltd. (Industrials, Commercial services & supplies) | | | | | | |
Daiseki Co. Ltd. (Industrials, Commercial services & supplies) | | | | | | |
DTS Corp. (Information technology, IT services) | | | | | | |
Fuji Seal International, Inc. (Materials, Containers & packaging) | | | | | | |
The accompanying notes are an integral part of these financial statements.
Allspring Special Global Small Cap Fund | 7
Portfolio of investments—April 30, 2023 (unaudited)
| | | | | |
| | | | | | |
Horiba Ltd. (Information technology, Electronic equipment, instruments & components) | | | | | | |
Meitec Corp. (Industrials, Professional services) | | | | | | |
Nihon Parkerizing Co. Ltd. (Materials, Chemicals) | | | | | | |
Orix JREIT, Inc. (Real estate, Office REITs) | | | | | | |
Taikisha Ltd. (Industrials, Construction & engineering) | | | | | | |
| | | | | | |
| | | | | | |
MYT Netherlands Parent BV ADR (Consumer discretionary, Specialty retail) † | | | | | | |
TKH Group NV (Industrials, Electrical equipment) | | | | | | |
| | | | | | |
| | | | | | |
Atea ASA (Information technology, IT services) | | | | | | |
Elopak ASA (Materials, Containers & packaging) † | | | | | | |
| | | | | | |
| | | | | | |
Vidrala SA (Materials, Containers & packaging) | | | | | | |
Viscofan SA (Consumer staples, Food products) | | | | | | |
| | | | | | |
| | | | | | |
Hexpol AB (Materials, Chemicals) † | | | | | | |
Loomis AB (Industrials, Commercial services & supplies) † | | | | | | |
| | | | | | |
| | | | | | |
Bossard Holding AG Class A (Industrials, Trading companies & distributors) | | | | | | |
Bucher Industries AG (Industrials, Machinery) | | | | | | |
| | | | | | |
| | | | | | |
Britvic PLC (Consumer staples, Beverages) | | | | | | |
Domino’s Pizza Group PLC (Consumer discretionary, Hotels, restaurants & leisure) | | | | | | |
Elementis PLC (Materials, Chemicals) † | | | | | | |
Lancashire Holdings Ltd. (Financials, Insurance) | | | | | | |
Morgan Advanced Materials PLC (Industrials, Machinery) | | | | | | |
Nomad Foods Ltd. (Consumer staples, Food products) † | | | | | | |
S4 Capital PLC (Communication services, Media) † | | | | | | |
Samarkand Group PLC (Consumer discretionary, Broadline retail) † | | | | | | |
Spectris PLC (Information technology, Electronic equipment, instruments & components) | | | | | | |
| | | | | | |
| | | | | | |
Ambarella, Inc. (Information technology, Semiconductors & semiconductor equipment) † | | | | | | |
The accompanying notes are an integral part of these financial statements.
8 | Allspring Special Global Small Cap Fund
Portfolio of investments—April 30, 2023 (unaudited)
| | | | | |
United States (continued) | | | | | | |
Aris Water Solutions, Inc. Class A (Industrials, Commercial services & supplies) | | | | | | |
AZEK Co., Inc. (Industrials, Building products) † | | | | | | |
Azenta, Inc. (Health care, Life sciences tools & services) † | | | | | | |
Balchem Corp. (Materials, Chemicals) | | | | | | |
Blackbaud, Inc. (Information technology, Software) † | | | | | | |
Brady Corp. Class A (Industrials, Commercial services & supplies) | | | | | | |
Cactus, Inc. Class A (Energy, Energy equipment & services) | | | | | | |
CBIZ, Inc. (Industrials, Professional services) † | | | | | | |
CSW Industrials, Inc. (Industrials, Building products) | | | | | | |
Denny’s Corp. (Consumer discretionary, Hotels, restaurants & leisure) † | | | | | | |
E2open Parent Holdings, Inc. (Information technology, Software) † | | | | | | |
Enovis Corp. (Health care, Health care equipment & supplies) † | | | | | | |
EnPro Industries, Inc. (Industrials, Machinery) | | | | | | |
FARO Technologies, Inc. (Information technology, Electronic equipment, instruments & components) † | | | | | | |
FormFactor, Inc. (Information technology, Semiconductors & semiconductor equipment) † | | | | | | |
Gibraltar Industries, Inc. (Industrials, Building products) † | | | | | | |
Global Blue Group Holding AG (Information technology, IT services) | | | | | | |
Globus Medical, Inc. Class A (Health care, Health care equipment & supplies) † | | | | | | |
Hanover Insurance Group, Inc. (Financials, Insurance) | | | | | | |
Helen of Troy Ltd. (Consumer discretionary, Household durables) † | | | | | | |
Holley, Inc. (Consumer discretionary, Automobile components) † | | | | | | |
Horace Mann Educators Corp. (Financials, Insurance) | | | | | | |
ICU Medical, Inc. (Health care, Health care equipment & supplies) † | | | | | | |
Innospec, Inc. (Materials, Chemicals) | | | | | | |
J & J Snack Foods Corp. (Consumer staples, Food products) | | | | | | |
Mayville Engineering Co., Inc. (Industrials, Machinery) † | | | | | | |
Progress Software Corp. (Information technology, Software) | | | | | | |
Quanex Building Products Corp. (Industrials, Building products) | | | | | | |
QuidelOrtho Corp. (Health care, Health care equipment & supplies) † | | | | | | |
Southwestern Energy Co. (Energy, Oil, gas & consumable fuels) † | | | | | | |
Spectrum Brands Holdings, Inc. (Consumer staples, Household products) | | | | | | |
Standex International Corp. (Industrials, Machinery) | | | | | | |
Stepan Co. (Materials, Chemicals) | | | | | | |
Varex Imaging Corp. (Health care, Health care equipment & supplies) † | | | | | | |
Vivid Seats, Inc. Class A (Communication services, Entertainment) † | | | | | | |
Wendy’s Co. (Consumer discretionary, Hotels, restaurants & leisure) | | | | | | |
Ziff Davis, Inc. (Communication services, Interactive media & services) † | | | | | | |
| | | | | | |
Total common stocks (Cost $133,002,544) | | | | | | |
The accompanying notes are an integral part of these financial statements.
Allspring Special Global Small Cap Fund | 9
Portfolio of investments—April 30, 2023 (unaudited)
| | | | | |
Short-term investments: 1.64% | | | | | | |
Investment companies: 1.64% | | | | | | |
Allspring Government Money Market Fund Select Class ♠∞ | | | | | | |
Total short-term investments (Cost $2,499,215) | | | | | | |
Total investments in securities (Cost $135,501,759) | | | | | | |
Other assets and liabilities, net | | | | | | |
| | | | | | |
| Non-income-earning security |
| The security may be resold in transactions exempt from registration, normally to qualified institutional buyers, pursuant to Rule 144A under the Securities Act of 1933. |
| The issuer of the security is an affiliated person of the Fund as defined in the Investment Company Act of 1940. |
| The rate represents the 7-day annualized yield at period end. |
|
| American depositary receipt |
| Real estate investment trust |
Investments in affiliates
An affiliated investment is an investment in which the Fund owns at least 5% of the outstanding voting shares of the issuer or as a result of other relationships, such as the Fund and the issuer having the same investment manager. Transactions with issuers that were affiliates of the Fund at the end of the period were as follows:
| | | | | Net
change in
unrealized
gains
(losses) | | | Income
from
affiliated
securities |
| | | | | | | | |
Allspring Government Money Market Fund Select Class | | | | | | | | |
Investments in affiliates no longer held at end of period | | | | | | | | |
Securities Lending Cash Investments LLC | | | | | | | | |
| | | | | | | | |
| Amount shown represents income before fees and rebates. |
The accompanying notes are an integral part of these financial statements.
10 | Allspring Special Global Small Cap Fund
Statement of assets and liabilities—April 30, 2023 (unaudited)
Financial statements
Statement of assets and liabilities
| |
Investments in unaffiliated securities, at value (cost $133,002,544) | |
Investments in affiliated securities, at value (cost $2,499,215) | |
Foreign currency, at value (cost $40,198) | |
Receivable for investments sold | |
| |
Receivable for Fund shares sold | |
Prepaid expenses and other assets | |
| |
| |
Payable for Fund shares redeemed | |
Payable for investments purchased | |
| |
Shareholder report expenses payable | |
Administration fees payable | |
Shareholder servicing fee payable | |
| |
Accrued expenses and other liabilities | |
| |
| |
| |
| |
Total distributable earnings | |
| |
Computation of net asset value and offering price per share | |
| |
Shares outstanding–Class A1 | |
Net asset value per share–Class A | |
Maximum offering price per share – Class A2 | |
| |
Shares outstanding–Class C1 | |
Net asset value per share–Class C | |
Net assets–Administrator Class | |
Shares outstanding–Administrator Class1 | |
Net asset value per share–Administrator Class | |
Net assets–Institutional Class | |
Shares outstanding–Institutional Class1 | |
Net asset value per share–Institutional Class | |
| The Fund has an unlimited number of authorized shares. |
| Maximum offering price is computed as 100/94.25 of net asset value. On investments of $50,000 or more, the offering price is reduced. |
The accompanying notes are an integral part of these financial statements.
Allspring Special Global Small Cap Fund | 11
Statement of operations—six months ended April 30, 2023 (unaudited)
Statement of operations
| |
Dividends (net of foreign withholdings taxes of $56,824) | |
Income from affiliated securities | |
| |
| |
| |
| |
| |
| |
| |
| |
| |
Shareholder servicing fees | |
| |
| |
| |
| |
| |
Custody and accounting fees | |
| |
| |
Shareholder report expenses | |
Trustees’ fees and expenses | |
| |
| |
Less: Fee waivers and/or expense reimbursements | |
| |
| |
| |
| |
| |
| |
Realized and unrealized gains (losses) on investments | |
Net realized gains (losses) on | |
| |
| |
Foreign currency and foreign currency translations | |
Net realized losses on investments | |
Net change in unrealized gains (losses) on | |
| |
Foreign currency and foreign currency translations | |
Net change in unrealized gains (losses) on investments | |
Net realized and unrealized gains (losses) on investments | |
Net increase in net assets resulting from operations | |
The accompanying notes are an integral part of these financial statements.
12 | Allspring Special Global Small Cap Fund
Statement of changes in net assets
Statement of changes in net assets
| Six months ended
April 30, 2023
(unaudited) | Year ended
October 31, 2022 |
| | | | |
| | | | |
Net realized gains (losses) on investments | | | | |
Net change in unrealized gains (losses) on investments | | | | |
Net increase (decrease) in net assets resulting from operations | | | | |
Distributions to shareholders from | | | | |
Net investment income and net realized gains | | | | |
| | | | |
| | | | |
| | | | |
| | | | |
Total distributions to shareholders | | | | |
Capital share transactions | | | | |
Proceeds from shares sold | | | | |
| | | | |
| | | | |
| | | | |
| | | | |
| | | | |
Reinvestment of distributions | | | | |
| | | | |
| | | | |
| | | | |
| | | | |
| | | | |
Payment for shares redeemed | | | | |
| | | | |
| | | | |
| | | | |
| | | | |
| | | | |
Net decrease in net assets resulting from capital share transactions | | | | |
Total increase (decrease) in net assets | | | | |
| | | | |
| | | | |
| | | | |
The accompanying notes are an integral part of these financial statements.
Allspring Special Global Small Cap Fund | 13
Financial highlights
(For a share outstanding throughout each period)
| Six months ended
April 30, 2023
(unaudited) | |
| | | | | |
Net asset value, beginning of period | | | | | | |
Net investment income (loss) | | | | | | |
Net realized and unrealized gains (losses) on investments | | | | | | |
Total from investment operations | | | | | | |
Distributions to shareholders from | | | | | | |
| | | | | | |
| | | | | | |
Total distributions to shareholders | | | | | | |
Net asset value, end of period | | | | | | |
| | | | | | |
Ratios to average net assets (annualized) | | | | | | |
| | | | | | |
| | | | | | |
Net investment income (loss) | | | | | | |
| | | | | | |
| | | | | | |
Net assets, end of period (000s omitted) | | | | | | |
| Calculated based upon average shares outstanding |
| Total return calculations do not include any sales charges. Returns for periods of less than one year are not annualized. |
The accompanying notes are an integral part of these financial statements.
14 | Allspring Special Global Small Cap Fund
(For a share outstanding throughout each period)
| Six months ended
April 30, 2023
(unaudited) | |
| | | | | |
Net asset value, beginning of period | | | | | | |
| | | | | | |
| | | | | | |
Net realized and unrealized gains (losses) on investments | | | | | | |
Total from investment operations | | | | | | |
Distributions to shareholders from | | | | | | |
| | | | | | |
Net asset value, end of period | | | | | | |
| | | | | | |
Ratios to average net assets (annualized) | | | | | | |
| | | | | | |
| | | | | | |
| | | | | | |
| | | | | | |
| | | | | | |
Net assets, end of period (000s omitted) | | | | | | |
| Calculated based upon average shares outstanding |
| Total return calculations do not include any sales charges. Returns for periods of less than one year are not annualized. |
| During the year ended October 31, 2020, the Fund received a payment from an affiliate which had a 0.28% impact on the total return. |
The accompanying notes are an integral part of these financial statements.
Allspring Special Global Small Cap Fund | 15
(For a share outstanding throughout each period)
| Six months ended
April 30, 2023
(unaudited) | |
| | | | | |
Net asset value, beginning of period | | | | | | |
Net investment income (loss) | | | | | | |
| | | | | | |
Net realized and unrealized gains (losses) on investments | | | | | | |
Total from investment operations | | | | | | |
Distributions to shareholders from | | | | | | |
| | | | | | |
| | | | | | |
Total distributions to shareholders | | | | | | |
Net asset value, end of period | | | | | | |
| | | | | | |
Ratios to average net assets (annualized) | | | | | | |
| | | | | | |
| | | | | | |
Net investment income (loss) | | | | | | |
| | | | | | |
| | | | | | |
Net assets, end of period (000s omitted) | | | | | | |
| Calculated based upon average shares outstanding |
| Returns for periods of less than one year are not annualized. |
| During the year ended October 31, 2020, the Fund received a payment from an affiliate which had a 0.08% impact on the total return. |
The accompanying notes are an integral part of these financial statements.
16 | Allspring Special Global Small Cap Fund
(For a share outstanding throughout each period)
| Six months ended
April 30, 2023
(unaudited) | |
| | | | | |
Net asset value, beginning of period | | | | | | |
Net investment income (loss) | | | | | | |
Net realized and unrealized gains (losses) on investments | | | | | | |
Total from investment operations | | | | | | |
Distributions to shareholders from | | | | | | |
| | | | | | |
| | | | | | |
Total distributions to shareholders | | | | | | |
Net asset value, end of period | | | | | | |
| | | | | | |
Ratios to average net assets (annualized) | | | | | | |
| | | | | | |
| | | | | | |
Net investment income (loss) | | | | | | |
| | | | | | |
| | | | | | |
Net assets, end of period (000s omitted) | | | | | | |
| Calculated based upon average shares outstanding |
| Returns for periods of less than one year are not annualized. |
The accompanying notes are an integral part of these financial statements.
Allspring Special Global Small Cap Fund | 17
Notes to financial statements (unaudited)
Notes to financial statements
Allspring Funds Trust (the “Trust”), a Delaware statutory trust organized on March 10, 1999, is an open-end management investment company registered under the Investment Company Act of 1940, as amended (the “1940 Act”). As an investment company, the Trust follows the accounting and reporting guidance in Financial Accounting Standards Board (“FASB”) Accounting Standards Codification Topic 946, Financial Services – Investment Companies. These financial statements report on the Allspring Special Global Small Cap Fund (the “Fund”) which is a diversified series of the Trust.
2.
SIGNIFICANT ACCOUNTING POLICIES
The following significant accounting policies, which are consistently followed in the preparation of the financial statements of the Fund, are in conformity with U.S. generally accepted accounting principles which require management to make estimates and assumptions that affect the reported amounts of assets and liabilities, disclosure of contingent assets and liabilities at the date of the financial statements, and the reported amounts of income and expenses during the reporting period. Actual results could differ from those estimates.
Securities valuation
All investments are valued each business day as of the close of regular trading on the New York Stock Exchange (generally 4 p.m. Eastern Time), although the Fund may deviate from this calculation time under unusual or unexpected circumstances.
Equity securities and exchange-traded funds that are listed on a foreign or domestic exchange or market are valued at the official closing price or, if none, the last sales price.
The values of securities denominated in foreign currencies are translated into U.S. dollars at rates provided by an independent foreign currency pricing source at a time each business day specified by the Valuation Committee at Allspring Funds Management, LLC (“Allspring Funds Management”).
Many securities markets and exchanges outside the U.S. close prior to the close of the New York Stock Exchange and therefore may not fully reflect trading or events that occur after the close of the principal exchange in which the foreign securities are traded, but before the close of the New York Stock Exchange. If such trading or events are expected to materially affect the value of such securities, then fair value pricing procedures implemented by Allspring Funds Management are applied. These procedures take into account multiple factors including movements in U.S. securities markets after foreign exchanges close. Foreign securities that are fair valued under these procedures are categorized as Level 2 and the application of these procedures may result in transfers between Level 1 and Level 2. Depending on market activity, such fair valuations may be frequent. Such fair value pricing may result in net asset values that are higher or lower than net asset values based on the last reported sales price or latest quoted bid price. On April 30, 2023, such fair value pricing was used in pricing certain foreign securities.
Investments in registered open-end investment companies (other than those listed on a foreign or domestic exchange or market) are valued at net asset value.
Investments which are not valued using any of the methods discussed above are valued at their fair value, as determined in good faith by Allspring Funds Management, which was named the valuation designee by the Board of Trustees. As the valuation designee, Allspring Funds Management is responsible for day-to-day valuation activities for the Allspring Funds. In connection with these responsibilities, Allspring Funds Management has established a Valuation Committee and has delegated to it the authority to take any actions regarding the valuation of portfolio securities that the Valuation Committee deems necessary or appropriate, including determining the fair value of portfolio securities. On a quarterly basis, the Board of Trustees receives reports of valuation actions taken by the Valuation Committee. On at least an annual basis, the Board of Trustees receives an assessment of the adequacy and effectiveness of Allspring Funds Management’s process for determining the fair value of the portfolio of investments.
Foreign currency translation
The accounting records of the Fund are maintained in U.S. dollars. The values of other assets and liabilities denominated in foreign currencies are translated into U.S. dollars at rates provided by an independent foreign currency pricing source at a time each business day specified by the Valuation Committee. Purchases and sales of securities, and income and expenses are converted at the rate of exchange on the respective dates of such transactions. Net realized foreign exchange gains or losses arise from sales of foreign currencies, currency gains or losses realized between the trade and settlement dates on securities transactions, and the difference between the amounts of dividends, interest and foreign withholding taxes recorded and the U.S. dollar equivalent of the amounts actually paid or received. Net unrealized foreign exchange gains and losses arise from changes in the fair value of assets and liabilities other than investments in securities resulting from changes in exchange rates. The changes in net assets arising from changes in exchange rates of securities and the changes in net assets resulting from changes in market prices of securities are not separately presented. Such changes are included in net realized and unrealized gains or losses from investments.
Securities lending
During the period, the Fund participated in a program to lend its securities from time to time in order to earn additional income in the form of fees or interest on securities received as collateral or the investment of any cash received as collateral. When securities were on loan, the Fund received interest or dividends on those securities. Cash collateral received in connection with its securities lending transactions was invested in Securities Lending Cash Investments, LLC (the “Securities Lending Fund”), an affiliated non-registered investment company. Interests in the non-registered investment company
18 | Allspring Special Global Small Cap Fund
Notes to financial statements (unaudited)
that were redeemable at net asset value were fair valued normally at net asset value. Effective at the close of business on March 29, 2023, the Fund is no longer participating in the securities lending program and the Securities Lending Fund was liquidated. Securities Lending Fund was managed by Allspring Funds Management and was subadvised by Allspring Global Investments, LLC (“Allspring Investments”), an affiliate of Allspring Funds Management and wholly owned subsidiary of Allspring Global Investments Holdings, LLC. Allspring Funds Management received an advisory fee starting at 0.05% and declining to 0.01% as the average daily net assets of the Securities Lending Fund increased. All of the fees received by Allspring Funds Management were paid to Allspring Investments for its services as subadviser.
Income earned from investment in the Securities Lending Fund (net of fees and rebates), if any, is included in income from affiliated securities on the Statement of Operations.
Security transactions and income recognition
Securities transactions are recorded on a trade date basis. Realized gains or losses are recorded on the basis of identified cost.
Dividend income is recognized on the ex-dividend date, except for certain dividends from foreign securities, which are recorded as soon as the custodian verifies the ex-dividend date. Dividend income is recorded net of foreign taxes withheld where recovery of such taxes is not assured.
Distributions to shareholders
Distributions to shareholders from net investment income and any net realized gains are recorded on the ex-dividend date and paid at least annually. Such distributions are determined in accordance with income tax regulations and may differ from U.S. generally accepted accounting principles. Dividend sources are estimated at the time of declaration. The tax character of distributions is determined as of the Fund’s fiscal year end. Therefore, a portion of the Fund’s distributions made prior to the Fund’s fiscal year end may be categorized as a tax return of capital at year end.
Federal and other taxes
The Fund intends to continue to qualify as a regulated investment company by distributing substantially all of its investment company taxable income and any net realized capital gains (after reduction for capital loss carryforwards) sufficient to relieve it from all, or substantially all, federal income taxes. Accordingly, no provision for federal income taxes was required.
The Fund’s income and federal excise tax returns and all financial records supporting those returns for the prior three fiscal years are subject to examination by the federal and Delaware revenue authorities. Management has analyzed the Fund’s tax positions taken on federal, state, and foreign tax returns, as applicable, for all open tax years and does not believe that there are any uncertain tax positions that require recognition of a tax liability.
As of April 30, 2023, the aggregate cost of all investments for federal income tax purposes was $136,131,700 and the unrealized gains (losses) consisted of:
Class allocations
The separate classes of shares offered by the Fund differ principally in applicable sales charges, distribution, shareholder servicing, and administration fees. Class specific expenses are charged directly to that share class. Investment income, common fund-level expenses, and realized and unrealized gains (losses) on investments are allocated daily to each class of shares based on the relative proportion of net assets of each class.
3.
FAIR VALUATION MEASUREMENTS
Fair value measurements of investments are determined within a framework that has established a fair value hierarchy based upon the various data inputs utilized in determining the value of the Fund’s investments. The three-level hierarchy gives the highest priority to unadjusted quoted prices in active markets for identical assets or liabilities (Level 1) and the lowest priority to unobservable inputs (Level 3). The Fund’s investments are classified within the fair value hierarchy based on the lowest level of input that is significant to the fair value measurement. The inputs are summarized into three broad levels as follows:
•Level 1—quoted prices in active markets for identical securities
•Level 2—other significant observable inputs (including quoted prices for similar securities, interest rates, prepayment speeds, credit risk, etc.)
•Level 3—significant unobservable inputs (including the Fund’s own assumptions in determining the fair value of investments)
The inputs or methodologies used for valuing investments in securities are not necessarily an indication of the risk associated with investing in those securities.
Allspring Special Global Small Cap Fund | 19
Notes to financial statements (unaudited)
The following is a summary of the inputs used in valuing the Fund’s assets and liabilities as of April 30, 2023:
| | Other significant
observable inputs
(Level 2) | Significant
unobservable inputs
(Level 3) | |
| | | | |
| | | | |
| | | | |
| | | | |
| | | | |
| | | | |
| | | | |
| | | | |
| | | | |
| | | | |
| | | | |
| | | | |
| | | | |
| | | | |
| | | | |
| | | | |
| | | | |
| | | | |
| | | | |
| | | | |
| | | | |
| | | | |
| | | | |
Additional sector, industry or geographic detail, if any, is included in the Portfolio of Investments.
For the six months ended April 30, 2023, the Portfolio did not have transfers into/out of Level 3.
4.
TRANSACTIONS WITH AFFILIATES
Management fee
Allspring Funds Management, a wholly owned subsidiary of Allspring Global Investments Holdings, LLC, a holding company indirectly owned by certain private funds of GTCR LLC and Reverence Capital Partners, L.P., is the manager of the Fund and provides advisory and fund-level administrative services under an investment management agreement. Under the investment management agreement, Allspring Funds Management is responsible for, among other services, implementing the investment objectives and strategies of the Fund, supervising the subadviser and providing fund-level administrative services in connection with the Fund’s operations. As compensation for its services under the investment management agreement, Allspring Funds Management is entitled to receive a management fee at the following annual rate based on the Fund’s average daily net assets:
For the six months ended April 30, 2023, the management fee was equivalent to an annual rate of 0.95% of the Fund’s average daily net assets.
Allspring Funds Management has retained the services of a subadviser to provide daily portfolio management to the Fund. The fee for subadvisory services is borne by Allspring Funds Management. Allspring Investments is the subadviser to the Fund and is entitled to receive a fee from Allspring Funds Management at an annual rate starting at 0.55% and declining to 0.40% as the average daily net assets of the Fund increase.
20 | Allspring Special Global Small Cap Fund
Notes to financial statements (unaudited)
Administration fees
Under a class-level administration agreement, Allspring Funds Management provides class-level administrative services to the Fund, which includes paying fees and expenses for services provided by the transfer agent, sub-transfer agents, omnibus account servicers and record-keepers. As compensation for its services under the class-level administration agreement, Allspring Funds Management receives an annual fee which is calculated based on the average daily net assets of each class as follows:
| Class-level
administration fee |
| |
| |
| |
| |
Waivers and/or expense reimbursements
Allspring Funds Management has contractually committed to waive and/or reimburse management and administration fees to the extent necessary to maintain certain net operating expense ratios for the Fund. When each class of the Fund has exceeded its expense cap, Allspring Funds Management will waive fees and/or reimburse expenses from fund-level expenses on a proportionate basis and then from class specific expenses. When only certain classes exceed their expense caps, waivers and/or reimbursements are applied against class specific expenses before fund-level expenses. Allspring Funds Management has contractually committed through February 29, 2024 to waive fees and/or reimburse expenses to the extent necessary to cap expenses. Prior to or after the commitment expiration date, the caps may be increased or the commitment to maintain the caps may be terminated only with the approval of the Board of Trustees. As of April 30, 2023, the contractual expense caps are as follows:
Distribution fee
The Trust has adopted a distribution plan for Class C shares pursuant to Rule 12b-1 under the 1940 Act. A distribution fee is charged to Class C shares and paid to Allspring Funds Distributor, LLC (“Allspring Funds Distributor”), the principal underwriter, an affiliate of Allspring Funds Management, at an annual rate up to 0.75% of the average daily net assets of Class C shares.
In addition, Allspring Funds Distributor is entitled to receive the front-end sales charge from the purchase of Class A shares and a contingent deferred sales charge on the redemption of certain Class A shares. Allspring Funds Distributor is also entitled to receive the contingent deferred sales charges from redemptions of Class C shares. For the six months ended April 30, 2023, Allspring Funds Distributor received $2 from the sale of Class A shares. No contingent deferred sales charges were incurred by Class A and Class C shares for the six months ended April 30, 2023.
Shareholder servicing fees
The Trust has entered into contracts with one or more shareholder servicing agents, whereby Class A, Class C, and Administrator Class are charged a fee at an annual rate up to 0.25% of the average daily net assets of each respective class. A portion of these total shareholder servicing fees were paid to affiliates of the Fund.
Interfund transactions
The Fund may purchase or sell portfolio investment securities to certain affiliates pursuant to Rule 17a-7 under the 1940 Act and under procedures adopted by the Board of Trustees. The procedures have been designed to ensure that these interfund transactions, which do not incur broker commissions, are effected at current market prices.
5.
INVESTMENT PORTFOLIO TRANSACTIONS
Purchases and sales of investments, excluding U.S. government obligations (if any) and short-term securities, for the six months ended April 30, 2023 were $11,241,119 and $24,423,906, respectively.
The Trust (excluding the money market funds), Allspring Master Trust and Allspring Variable Trust are parties to a $350,000,000 revolving credit agreement whereby the Fund is permitted to use bank borrowings for temporary or emergency purposes, such as to fund shareholder redemption
Allspring Special Global Small Cap Fund | 21
Notes to financial statements (unaudited)
requests. Interest under the credit agreement is charged to the Fund based on borrowing rate equal to the higher of the Federal Funds rate or the overnight bank funding rate in effect on that day plus a spread. In addition, an annual commitment fee based on the unused balance is allocated to each participating fund.
For the six months ended April 30, 2023, there were no borrowings by the Fund under the agreement.
As of the end of the period, the Fund concentrated its portfolio of investments in the industrials sector and in North America and Europe. A fund that invests a substantial portion of its assets in any sector or geographic region may be more affected by changes in that sector or geographic region than would be a fund whose investments are not heavily weighted in any sector or geographic region.
Under the Fund’s organizational documents, the officers and Trustees have been granted certain indemnification rights against certain liabilities that may arise out of performance of their duties to the Fund. The Fund has entered into a separate agreement with each Trustee that converts indemnification rights currently existing under the Fund’s organizational documents into contractual rights that cannot be changed in the future without the consent of the Trustee. Additionally, in the normal course of business, the Fund may enter into contracts with service providers that contain a variety of indemnification clauses. The Fund’s maximum exposure under these arrangements is dependent on future claims that may be made against the Fund and, therefore, cannot be estimated.
22 | Allspring Special Global Small Cap Fund
Other information (unaudited)
Other information
Proxy voting information
A description of the policies and procedures used to determine how to vote proxies relating to portfolio securities is available without charge, upon request, by calling 1-800-222-8222, visiting our website at allspringglobal.com, or visiting the SEC website at sec.gov. Information regarding how the proxies related to portfolio securities were voted during the most recent 12-month period ended June 30 is available on the website at allspringglobal.com or by visiting the SEC website at sec.gov.
Quarterly portfolio holdings information
The Fund files its complete schedule of portfolio holdings with the SEC for the first and third quarters of each fiscal year as an exhibit to its reports on Form N-PORT. Shareholders may view the filed Form N-PORT by visiting the SEC website at sec.gov.
Allspring Special Global Small Cap Fund | 23
Other information (unaudited)
BOARD OF TRUSTEES AND OFFICERS
Each of the Trustees and Officers listed in the table below acts in identical capacities for each fund in the Allspring family of funds, which consists of 127 mutual funds comprising the Allspring Funds Trust, Allspring Variable Trust, Allspring Master Trust and four closed-end funds (collectively the “Fund Complex”). This table should be read in conjunction with the Prospectus and the Statement of Additional Information1. The mailing address of each Trustee and Officer is 1415 Vantage Park Drive, 3rd Floor, Charlotte, NC 28203. Each Trustee and Officer serves an indefinite term, however, each Trustee serves such term until reaching the mandatory retirement age established by the Trustees.
Independent Trustees
| | Principal occupations during past five years or longer | Current other
public company or
investment
company
directorships |
William R. Ebsworth
(Born 1957) | | Retired. From 1984 to 2013, equities analyst, portfolio manager, research director and chief investment officer at Fidelity Management and Research Company in Boston, Tokyo, and Hong Kong, and retired in 2013 as Chief Investment Officer of Fidelity Strategic Advisers, Inc. where he led a team of investment professionals managing client assets. Prior thereto, Board member of Hong Kong Securities Clearing Co., Hong Kong Options Clearing Corp., the Thailand International Fund, Ltd., Fidelity Investments Life Insurance Company, and Empire Fidelity Investments Life Insurance Company. Audit Committee Chair and Investment Committee Chair of the Vincent Memorial Hospital Foundation (non-profit organization). Mr. Ebsworth is a CFA charterholder. | |
Jane A. Freeman
(Born 1953) | Trustee,
since 2015;
Chair Liaison,
since 2018 | Retired. From 2012 to 2014 and 1999 to 2008, Chief Financial Officer of Scientific Learning Corporation. From 2008 to 2012, Ms. Freeman provided consulting services related to strategic business projects. Prior to 1999, Portfolio Manager at Rockefeller & Co. and Scudder, Stevens & Clark. Board member of the Harding Loevner Funds from 1996 to 2014, serving as both Lead Independent Director and chair of the Audit Committee. Board member of the Russell Exchange Traded Funds Trust from 2011 to 2012 and the chair of the Audit Committee. Ms. Freeman is also an inactive Chartered Financial Analyst. | |
Isaiah Harris, Jr.
(Born 1952) | Trustee,
since 2009;
Audit Committee Chair,
since 2019 | Retired. Member of the Advisory Board of CEF of East Central Florida. Chairman of the Board of CIGNA Corporation from 2009 to 2021, and Director from 2005 to 2008. From 2003 to 2011, Director of Deluxe Corporation. Prior thereto, President and CEO of BellSouth Advertising and Publishing Corp. from 2005 to 2007, President and CEO of BellSouth Enterprises from 2004 to 2005 and President of BellSouth Consumer Services from 2000 to 2003. Emeritus member of the Iowa State University Foundation Board of Governors. Emeritus Member of the Advisory Board of Iowa State University School of Business. Advisory Board Member, Palm Harbor Academy (private school). Advisory Board Member, Fellowship of Christian Athletes. Mr. Harris is a certified public accountant (inactive status). | |
David F. Larcker
(Born 1950) | | Distinguished Visiting Fellow at the Hoover Institution since 2022. James Irvin Miller Professor of Accounting at the Graduate School of Business (Emeritus), Stanford University, Director of the Corporate Governance Research Initiative and Senior Faculty of The Rock Center for Corporate Governance since 2006. From 2005 to 2008, Professor of Accounting at the Graduate School of Business, Stanford University. Prior thereto, Ernst & Young Professor of Accounting at The Wharton School, University of Pennsylvania from 1985 to 2005. | |
Olivia S. Mitchell
(Born 1953) | Trustee,
since 2006;
Nominating and Governance Committee Chair,
since 2018 | International Foundation of Employee Benefit Plans Professor since 1993, Wharton School of the University of Pennsylvania. Director of Wharton’s Pension Research Council and Boettner Center on Pensions & Retirement Research, and Research Associate at the National Bureau of Economic Research. Previously taught at Cornell University from 1978 to 1993. | |
Timothy J. Penny
(Born 1951) | Trustee,
since 1996;
Chair,
since 2018 | President and Chief Executive Officer of Southern Minnesota Initiative Foundation, a non-profit organization, since 2007. Vice Chair of the Economic Club of Minnesota, since 2007. Co-Chair of the Committee for a Responsible Federal Budget, since 1995. Member of the Board of Trustees of NorthStar Education Finance, Inc., a non-profit organization, from 2007-2022. Senior Fellow of the University of Minnesota Humphrey Institute from 1995 to 2017. | |
1
The Statement of Additional Information includes additional information about the Trustees and is available, without charge, upon request, by calling 1-800-222-8222 or by visiting the website at allspringglobal.com.
24 | Allspring Special Global Small Cap Fund
Other information (unaudited)
| Position held and length of service* | Principal occupations during past five years or longer | Current other public company or investment company directorships |
James G. Polisson
(Born 1959) | | Retired. Chief Marketing Officer, Source (ETF) UK Services, Ltd, from 2015 to 2017. From 2012 to 2015, Principal of The Polisson Group, LLC, a management consulting, corporate advisory and principal investing company. Chief Executive Officer and Managing Director at Russell Investments, Global Exchange Traded Funds from 2010 to 2012. Managing Director of Barclays Global Investors from 1998 to 2010 and Global Chief Marketing Officer for iShares and Barclays Global Investors from 2000 to 2010. Trustee of the San Francisco Mechanics’ Institute, a non- profit organization, from 2013 to 2015. Board member of the Russell Exchange Traded Fund Trust from 2011 to 2012. Director of Barclays Global Investors Holdings Deutschland GmbH from 2006 to 2009. Mr. Polisson is an attorney and has a retired status with the Massachusetts and District of Columbia Bar Associations. | |
Pamela Wheelock
(Born 1959) | Trustee,
since January 2020;
previously Trustee from
January 2018 to
July 2019 | Retired. Executive and Senior Financial leadership positions in the public, private and nonprofit sectors. Interim President and CEO, McKnight Foundation, 2020. Interim Commissioner, Minnesota Department of Human Services, 2019. Chief Operating Officer, Twin Cities Habitat for Humanity, 2017-2019. Vice President for University Services, University of Minnesota, 2012- 2016. Interim President and CEO, Blue Cross and Blue Shield of Minnesota, 2011-2012. Executive Vice-President and Chief Financial Officer, Minnesota Wild, 2002-2008. Commissioner, Minnesota Department of Finance, 1999-2002. Chair of the Board of Directors of Destination Medical Center Corporation. Board member of the Minnesota Wild Foundation. | |
| Length of service dates reflect the Trustee’s commencement of service with the Trust’s predecessor entities, where applicable. |
Allspring Special Global Small Cap Fund | 25
Other information (unaudited)
Officers1
| Position held and
length of service | Principal occupations during past five years or longer |
| | President and Chief Executive Officer of Allspring Funds Management, LLC since 2017 and Head of Global Fund Governance of Allspring Global Investments since 2022. Prior thereto, co-president of Galliard Capital Management, LLC, an affiliate of Allspring Funds Management, LLC, from 2019 to 2022 and Head of Affiliated Managers, Allspring Global Investments, from 2014 to 2019 and Executive Vice President responsible for marketing, investments and product development for Allspring Funds Management, LLC, from 2009 to 2014. |
Jeremy DePalma
(Born 1974) | Treasurer,
since 2012
(for certain funds in
the Fund Complex);
since 2021 (for
the remaining funds in the Fund Complex) | Senior Vice President of Allspring Funds Management, LLC since 2009. Senior Vice President of Evergreen Investment Management Company, LLC from 2008 to 2010 and head of the Fund Reporting and Control Team within Fund Administration from 2005 to 2010. |
Christopher Baker
(Born 1976) | Chief Compliance Officer,
since 2022 | Global Chief Compliance Officer for Allspring Global Investments since 2022. Prior thereto, Chief Compliance Officer for State Street Global Advisors from 2018 to 2021. Senior Compliance Officer for the State Street divisions of Alternative Investment Solutions, Sector Solutions, and Global Marketing from 2015 to 2018. From 2010 to 2015 Vice President, Global Head of Investment and Marketing Compliance for State Street Global Advisors. |
Matthew Prasse
(Born 1983) | Chief Legal Officer,
since 2022;
Secretary,
since 2021 | Senior Counsel of the Allspring Legal Department since 2021. Senior Counsel of the Wells Fargo Legal Department from 2018 to 2021. Previously, Counsel for Barings LLC from 2015 to 2018. Prior to joining Barings, Associate at Morgan, Lewis & Bockius LLP from 2008 to 2015. |
1 For those Officers with tenures at Allspring Global Investments and/or Allspring Funds Management, LLC that began prior to 2021, such tenures include years of service during which these businesses/entities were known as Wells Fargo Asset Management and Wells Fargo Funds Management, LLC, respectively.
26 | Allspring Special Global Small Cap Fund
This page is intentionally left blank.
This page is intentionally left blank.
For more information
More information about Allspring Funds is available free upon request. To obtain literature, please write, visit the Fund’s website, or call:
Allspring Funds
P.O. Box 219967
Kansas City, MO 64121-9967
Website: allspringglobal.com
Individual investors: 1-800-222-8222
Retail investment professionals: 1-888-877-9275
Institutional investment professionals: 1-800-260-5969
This report and the financial statements contained herein are submitted for the general information of the shareholders of the Fund. If this report is used for promotional purposes, distribution of the report must be accompanied or preceded by a current prospectus. Before investing, please consider the investment objectives, risks, charges, and expenses of the investment. For a current prospectus and, if available, a summary prospectus, containing this information, call 1-800-222-8222 or visit the Fund’s website at allspringglobal.com. Read the prospectus carefully before you invest or send money.
Allspring Global InvestmentsTM is the trade name for the asset management firms of Allspring Global Investments Holdings, LLC, a holding company indirectly owned by certain private funds of GTCR LLC and Reverence Capital Partners, L.P. These firms include but are not limited to Allspring Global Investments, LLC, and Allspring Funds Management, LLC. Certain products managed by Allspring entities are distributed by Allspring Funds Distributor, LLC (a broker-dealer and Member FINRA/SIPC).
This material is for general informational and educational purposes only and is NOT intended to provide investment advice or a recommendation of any kind - including a recommendation for any specific investment, strategy, or plan.
© 2023 Allspring Global Investments Holdings, LLC. All rights reserved.
ALL-05052023-bekvxqei 06-23
SAR4305 04-23
Allspring Special International Small Cap Fund
Semi-Annual Report
April 30, 2023
The views expressed and any forward-looking statements are as of April 30, 2023, unless otherwise noted, and are those of the Fund’s portfolio managers and/or Allspring Global Investments. Discussions of individual securities or the markets generally are not intended as individual recommendations. Future events or results may vary significantly from those expressed in any forward-looking statements. The views expressed are subject to change at any time in response to changing circumstances in the market. Allspring Global Investments disclaims any obligation to publicly update or revise any views expressed or forward-looking statements.
Allspring Special International Small Cap Fund | 1
Letter to shareholders (unaudited)
Andrew Owen
President
Allspring Funds
Dear Shareholder:
We are pleased to offer you this semi-annual report for the Allspring Special International Small Cap Fund for the six-month period that ended April 30, 2023. Globally, stocks and bonds rebounded strongly despite ongoing volatility. While navigating persistently high inflation and the impact of ongoing aggressive central bank rate hikes, markets rallied on signs of declining inflation, anticipation of an end to the central bank monetary tightening cycle, and the stimulating impact of China removing its strict COVID-19 lockdowns in December. For the six-month period, domestic U.S. and global stocks and bonds had strong results. After suffering deep and broad losses through 2022, recent fixed income performance benefited from a base of higher yields that have the potential to generate higher income.
For the period, U.S. stocks, based on the S&P 500 Index,1 returned 8.63%. International stocks, as measured by the MSCI ACWI ex USA Index (Net),2 gained 20.65% while the MSCI EM Index (Net) (USD),3 returned 16.36%. Among bond indexes, the Bloomberg U.S. Aggregate Bond Index4 returned 6.91%, the Bloomberg Global Aggregate ex-USD Index (unhedged)5 gained 10.55%, the Bloomberg Municipal Bond Index6 gained 7.65%, and the ICE BofA U.S. High Yield Index7 returned 5.92%.
Despite high inflation and central bank rate hikes, markets rally.
Stocks and bonds rallied in November after earlier volatility. Economic news was encouraging, driven by U.S. labor market strength. Although central banks kept increasing rates, hopes rose for an easing in the pace of rate hikes and a possible end to central bank monetary tightening in 2023. Although inflation remained at record highs in the eurozone, we began to see signs of a possible decline in inflationary pressures as U.S. inflation moderated, with a 7.1% annual price rise in November and a monthly price increase of just 0.1%. China’s economic data remained weak, reflecting its zero-COVID-19 policy.
Financial markets cooled in December, with U.S. equities posting negative overall results in response to a weakening U.S. dollar. Fixed income securities ended one of their worst years ever, with flat overall monthly returns as markets weighed the hopes for an end to the monetary tightening cycle with the reality that central banks had not completed their jobs yet. U.S. Consumer Price Index (CPI)8 data showed a strong consistent trend downward, which brought down the 12-month CPI to 6.5% in December from 9.1% in June. Other countries and regions reported still-high but declining inflation rates as the year wound down.
1
The S&P 500 Index consists of 500 stocks chosen for market size, liquidity, and industry group representation. It is a market-value-weighted index with each stock’s weight in the index proportionate to its market value. You cannot invest directly in an index.
2
The Morgan Stanley Capital International (MSCI) All Country World Index (ACWI) ex USA Index (Net) is a free-float-adjusted market-capitalization-weighted index that is designed to measure the equity market performance of developed and emerging markets, excluding the U.S. Source: MSCI. MSCI makes no express or implied warranties or representations and shall have no liability whatsoever with respect to any MSCI data contained herein. The MSCI data may not be further redistributed or used as a basis for other indexes or any securities or financial products. This report is not approved, reviewed, or produced by MSCI. You cannot invest directly in an index.
3
The MSCI Emerging Markets (EM) Index (Net) (USD) is a free-float-adjusted market-capitalization-weighted index that is designed to measure the equity market performance of emerging markets. You cannot invest directly in an index.
4
The Bloomberg U.S. Aggregate Bond Index is a broad-based benchmark that measures the investment-grade, U.S.-dollar-denominated, fixed-rate taxable bond market, including Treasuries, government-related and corporate securities, mortgage-backed securities (agency fixed-rate and hybrid adjustable-rate mortgage pass-throughs), asset-backed securities, and commercial mortgage-backed securities. You cannot invest directly in an index.
5
The Bloomberg Global Aggregate ex-USD Index (unhedged) is an unmanaged index that provides a broad-based measure of the global investment-grade fixed-income markets excluding the U.S.-dollar-denominated debt market. You cannot invest directly in an index.
6
The Bloomberg Municipal Bond Index is an unmanaged index composed of long-term tax-exempt bonds with a minimum credit rating of Baa. You cannot invest directly in an index.
7
The ICE BofA U.S. High Yield Index is a market-capitalization-weighted index of domestic and Yankee high yield bonds. The index tracks the performance of high yield securities traded in the U.S. bond market. You cannot invest directly in an index. Copyright 2023. ICE Data Indices, LLC. All rights reserved.
8
The U.S. Consumer Price Index (CPI) is a measure of the average change over time in the prices paid by urban consumers for a market basket of consumer goods and services. You cannot invest directly in an index.
2 | Allspring Special International Small Cap Fund
Letter to shareholders (unaudited)
The year 2023 began with a rally across global equities and fixed income securities. Investor optimism rose in response to data indicating declining inflation rates and the reopening of China’s economy with the abrupt end to its zero-COVID-19 policy. The U.S. reported surprisingly strong job gains—employers added more than 500,000 jobs—and unemployment fell to 3.4%, the lowest level since 1969. Meanwhile, wage growth, seen as a potential contributor to ongoing high inflation, continued to moderate. All eyes remained fixed on the Federal Reserve (Fed) and on how many more rate hikes remain in this tightening cycle. The 0.25% federal funds rate hike announced in January was the Fed’s smallest rate increase since March 2022.
Financial markets declined in February as investors responded unfavorably to resilient economic data. The takeaway: Central banks will likely continue their monetary tightening cycle for longer than markets had priced in. In this environment—where strong economic data is seen as bad news—the resilient U.S. labor market was seen as a negative while the inflation rate has not been falling quickly enough for the Fed, which raised interest rates by 0.25% in early February. Meanwhile, the Bank of England and the European Central Bank both raised rates by 0.50%.
The collapse of Silicon Valley Bank in March, the second-largest banking failure in U.S. history, led to a classic bank run that spread to Europe where Switzerland’s Credit Suisse was taken over by its rival, UBS. The banking industry turmoil created an additional challenge for central banks in balancing inflationary concerns against potential economic weakening. Meanwhile, recent data pointed to economic strength in the U.S., Europe, and China. And China’s economy continued to rebound after the removal of its COVID-19 lockdown. Inflation rates in the U.S., the U.K., and Europe all remained higher than central bank targets, leading to additional rate hikes in March.
Economic data released in April pointed to global resilience, as Purchasing Managers Indexes1 in the U.S., U.K., and eurozone beat expectations and China reported first-quarter annualized economic growth of 4.5%. Despite banking industry stress, developed market stocks had monthly gains. The U.S. labor market remained strong, with a 3.5% jobless rate and monthly payroll gains above 200,000. However, uncertainty and inflationary concerns weighed on investors in the U.S. and abroad.
Don’t let short-term uncertainty derail long-term investment goals.
Periods of investment uncertainty can present challenges, but experience has taught us that maintaining long-term investment goals can be an effective way to plan for the future. To help you create a sound strategy based on your personal goals and risk tolerance, Allspring Funds offers more than 100 mutual funds spanning a wide range of asset classes and investment styles. Although diversification cannot guarantee an investment profit or prevent losses, we believe it can be an effective way to manage investment risk and potentially smooth out overall portfolio performance. We encourage investors to know their investments and to understand that appropriate levels of risk-taking may unlock opportunities.
Thank you for choosing to invest with Allspring Funds. We appreciate your confidence in us and remain committed to helping you meet your financial needs.
Sincerely,
Andrew Owen
President
Allspring Funds
“ The collapse of Silicon Valley Bank in March, the second-largest banking failure in U.S. history, led to a classic bank run that spread to Europe where Switzerland’s Credit Suisse was taken over by its rival, UBS. ”
For further information about your fund, contact your investment professional, visit our website at allspringglobal.com, or call us directly at 1-800-222-8222.
1
The Purchasing Managers Index (PMI) is an index of the prevailing direction of economic trends in the manufacturing and service sectors. You cannot invest directly in an index.
Allspring Special International Small Cap Fund | 3
Performance highlights (unaudited)
Performance highlights
| The Fund seeks long-term capital appreciation. |
| Allspring Funds Management, LLC |
| Allspring Global Investments, LLC |
| Stephen Giggie, CFA, Oleg Makhorine, James Tringas, CFA, Bryant VanCronkhite, CFA, CPA |
Average annual total returns (%) as of April 30, 2023 |
| | | | |
| | | | | | | |
| | | | | | | |
| | | | | | | |
| | | | | | | |
Institutional Class (WICIX) | | | | | | | |
MSCI World ex U.S. Small Cap Index (Net)5 | | | | | | | |
Figures quoted represent past performance, which is no guarantee of future results, and do not reflect taxes that a shareholder may pay on an investment in a fund. Investment return and principal value of an investment will fluctuate so that an investor’s shares, when redeemed, may be worth more or less than their original cost. Performance shown without sales charges would be lower if sales charges were reflected. Current performance may be lower or higher than the performance data quoted, which assumes the reinvestment of dividends and capital gains. Current month-end performance is available on the Fund’s website, allspringglobal.com.
Index returns do not include transaction costs associated with buying and selling securities, any mutual fund fees or expenses, or any taxes. It is not possible to invest directly in an index.
For Class A shares, the maximum front-end sales charge is 5.75%. For Class C shares, the maximum contingent deferred sales charge is 1.00%. Performance including a contingent deferred sales charge assumes the sales charge for the corresponding time period. Class R6 and Institutional Class shares are sold without a front-end sales charge or contingent deferred sales charge.
|
| Based on the inception date of the oldest Fund class. |
| Reflects the expense ratios as stated in the most recent prospectuses, which include the impact of 0.01% in acquired fund fees and expenses. The expense ratios shown are subject to change and may differ from the annualized expense ratios shown in the financial highlights of this report, which do not include acquired fund fees and expenses. |
| The manager has contractually committed through February 29, 2024, to waive fees and/or reimburse expenses to the extent necessary to cap total annual fund operating expenses after fee waivers at 1.38% for Class A, 2.13% for Class C, 0.95% for Class R6 and 1.05% for Institutional Class. Brokerage commissions, stamp duty fees, interest, taxes, acquired fund fees and expenses (if any), and extraordinary expenses are excluded from the expense caps. Prior to or after the commitment expiration date, the caps may be increased or the commitment to maintain the caps may be terminated only with the approval of the Board of Trustees. Without these caps, the Fund’s returns would have been lower. The expense ratio paid by an investor is the net expense ratio (the total annual fund operating expenses after fee waivers) as stated in the prospectuses. |
| Historical performance shown for the Class A shares prior to their inception reflects the performance of the Institutional Class shares and includes the higher expenses applicable to the Class A shares. |
| Historical performance shown for the Class C shares prior to their inception reflects the performance of the Institutional Class shares and includes the higher expenses applicable to the Class C shares. |
| The Morgan Stanley Capital International (MSCI) World ex U.S. Small Cap Index (Net) is a free-float-adjusted market-capitalization-weighted index that is designed to measure the equity market performance of developed markets excluding the U.S. Source: MSCI. MSCI makes no express or implied warranties or representations and shall have no liability whatsoever with respect to any MSCI data contained herein. The MSCI data may not be further redistributed or used as a basis for other indices or any securities or financial products. This report is not approved, reviewed, or produced by MSCI. You cannot invest directly in an index. |
Stock values fluctuate in response to the activities of individual companies and general market and economic conditions. Foreign investments are especially volatile and can rise or fall dramatically due to differences in the political and economic conditions of the host country. These risks are generally intensified in emerging markets. The use of derivatives may reduce returns and/or increase volatility. Certain investment strategies tend to increase the total risk of an investment (relative to the broader market). This fund is exposed to geographic risk and smaller-company securities risk. Consult the Fund’s prospectus for additional information on these and other risks.
CFA® and Chartered Financial Analyst® are trademarks owned by CFA Institute. |
4 | Allspring Special International Small Cap Fund
Performance highlights (unaudited)
Ten largest holdings (%) as of April 30, 20231 |
| |
| |
| |
| |
| |
| |
| |
| |
| |
| |
| Figures represent the percentage of the Fund’s net assets. Holdings are subject to change and may have changed since the date specified. |
Sector allocation as of April 30, 20231 |
| Figures represent the percentage of the Fund’s long-term investments. Allocations are subject to change and may have changed since the date specified. |
Geographic allocation as of April 30, 20231 |
| Figures represent the percentage of the Fund’s long-term investments. Allocations are subject to change and may have changed since the date specified. |
Allspring Special International Small Cap Fund | 5
Fund expenses (unaudited)
Fund expenses
As a shareholder of the Fund, you incur two types of costs: (1) transaction costs, including sales charges (loads) on purchase payments and contingent deferred sales charges (if any) on redemptions and (2) ongoing costs, including management fees, distribution (12b-1) and/or shareholder servicing fees, and other Fund expenses. This example is intended to help you understand your ongoing costs (in dollars) of investing in the Fund and to compare these costs with the ongoing costs of investing in other mutual funds.
The example is based on an investment of $1,000 invested at the beginning of the six-month period and held for the entire period from November 1, 2022 to April 30, 2023.
Actual expenses
The “Actual” line of the table below provides information about actual account values and actual expenses. You may use the information in this line, together with the amount you invested, to estimate the expenses that you paid over the period. Simply divide your account value by $1,000 (for example, an $8,600 account value divided by $1,000 = 8.6), then multiply the result by the number in the “Actual” line under the heading entitled “Expenses paid during period” for your applicable class of shares to estimate the expenses you paid on your account during this period.
Hypothetical example for comparison purposes
The “Hypothetical” line of the table below provides information about hypothetical account values and hypothetical expenses based on the Fund’s actual expense ratio and an assumed rate of return of 5% per year before expenses, which is not the Fund’s actual return. The hypothetical account values and expenses may not be used to estimate the actual ending account balance or expenses you paid for the period. You may use this information to compare the ongoing costs of investing in the Fund and other funds. To do so, compare this 5% hypothetical example with the 5% hypothetical examples that appear in the shareholder reports of the other funds.
Please note that the expenses shown in the table are meant to highlight your ongoing costs only and do not reflect any transactional costs, such as sales charges (loads) and contingent deferred sales charges. Therefore, the “Hypothetical” line of the table is useful in comparing ongoing costs only, and will not help you determine the relative total costs of owning different funds. In addition, if these transactional costs were included, your costs would have been higher.
| Beginning
account value
11-1-2022 | Ending
account value
4-30-2023 | | Annualized net
expense ratio |
| | | | |
| | | | |
Hypothetical (5% return before expenses) | | | | |
| | | | |
| | | | |
Hypothetical (5% return before expenses) | | | | |
| | | | |
| | | | |
Hypothetical (5% return before expenses) | | | | |
| | | | |
| | | | |
Hypothetical (5% return before expenses) | | | | |
1 Expenses paid is equal to the annualized net expense ratio of each class multiplied by the average account value over the period, multiplied by 181 divided by 365 (to reflect the one-half-year period).
6 | Allspring Special International Small Cap Fund
Portfolio of investments—April 30, 2023 (unaudited)
| | | | | |
| | | | | | |
| | | | | | |
Ansell Ltd. (Health care, Health care equipment & supplies) | | | | | | |
Inghams Group Ltd. (Consumer staples, Food products) | | | | | | |
Orora Ltd. (Materials, Containers & packaging) | | | | | | |
| | | | | | |
| | | | | | |
Mayr Melnhof Karton AG (Materials, Containers & packaging) † | | | | | | |
| | | | | | |
Azelis Group NV (Industrials, Trading companies & distributors) † | | | | | | |
Barco NV (Information technology, Electronic equipment, instruments & components) † | | | | | | |
| | | | | | |
| | | | | | |
ATS Corp. (Industrials, Machinery) † | | | | | | |
Canadian Western Bank (Financials, Banks) | | | | | | |
Finning International, Inc. (Industrials, Trading companies & distributors) | | | | | | |
Gildan Activewear, Inc. (Consumer discretionary, Textiles, apparel & luxury goods) | | | | | | |
PrairieSky Royalty Ltd. (Energy, Oil, gas & consumable fuels) | | | | | | |
Primo Water Corp. (Consumer staples, Beverages) | | | | | | |
| | | | | | |
| | | | | | |
SimCorp AS (Information technology, Software) | | | | | | |
| | | | | | |
Alten SA (Information technology, IT services) † | | | | | | |
Metropole Television SA (Communication services, Media) † | | | | | | |
| | | | | | |
| | | | | | |
Cancom SE (Information technology, IT services) | | | | | | |
Gerresheimer AG (Health care, Life sciences tools & services) | | | | | | |
Krones AG (Industrials, Machinery) | | | | | | |
Stabilus SE (Industrials, Machinery) | | | | | | |
TAG Immobilien AG (Real estate, Real estate management & development) † | | | | | | |
| | | | | | |
| | | | | | |
Irish Residential Properties REIT PLC (Real estate, Residential REITs) | | | | | | |
| | | | | | |
Azimut Holding SpA (Financials, Capital markets) † | | | | | | |
Buzzi Unicem SpA (Materials, Construction materials) † | | | | | | |
De’ Longhi SpA (Consumer discretionary, Household durables) † | | | | | | |
The accompanying notes are an integral part of these financial statements.
Allspring Special International Small Cap Fund | 7
Portfolio of investments—April 30, 2023 (unaudited)
| | | | | |
| | | | | | |
GVS SpA (Industrials, Machinery) 144A† | | | | | | |
Interpump Group SpA (Industrials, Machinery) † | | | | | | |
| | | | | | |
| | | | | | |
Aeon Delight Co. Ltd. (Industrials, Commercial services & supplies) | | | | | | |
Daiseki Co. Ltd. (Industrials, Commercial services & supplies) | | | | | | |
DTS Corp. (Information technology, IT services) | | | | | | |
Ezaki Glico Co. Ltd. (Consumer staples, Food products) | | | | | | |
Fuji Seal International, Inc. (Materials, Containers & packaging) | | | | | | |
Horiba Ltd. (Information technology, Electronic equipment, instruments & components) | | | | | | |
Kamigumi Co. Ltd. (Industrials, Transportation infrastructure) | | | | | | |
Meitec Corp. (Industrials, Professional services) | | | | | | |
Nihon Parkerizing Co. Ltd. (Materials, Chemicals) | | | | | | |
Orix JREIT, Inc. (Real estate, Office REITs) | | | | | | |
PHC Holdings Corp. (Health care, Health care equipment & supplies) | | | | | | |
San-A Co. Ltd. (Consumer staples, Consumer staples distribution & retail) | | | | | | |
Sohgo Security Services Co. Ltd. (Industrials, Commercial services & supplies) | | | | | | |
Stanley Electric Co. Ltd. (Consumer discretionary, Automobile components) | | | | | | |
Sumitomo Warehouse Co. Ltd. (Industrials, Transportation infrastructure) | | | | | | |
Taikisha Ltd. (Industrials, Construction & engineering) | | | | | | |
| | | | | | |
| | | | | | |
Novem Group SA (Consumer discretionary, Automobile components) | | | | | | |
| | | | | | |
MYT Netherlands Parent BV ADR (Consumer discretionary, Specialty retail) † | | | | | | |
TKH Group NV (Industrials, Electrical equipment) | | | | | | |
| | | | | | |
| | | | | | |
Atea ASA (Information technology, IT services) | | | | | | |
Elopak ASA (Materials, Containers & packaging) † | | | | | | |
SpareBank 1 SMN (Financials, Banks) | | | | | | |
| | | | | | |
| | | | | | |
Vidrala SA (Materials, Containers & packaging) | | | | | | |
Viscofan SA (Consumer staples, Food products) | | | | | | |
| | | | | | |
| | | | | | |
Hexpol AB (Materials, Chemicals) † | | | | | | |
Loomis AB (Industrials, Commercial services & supplies) † | | | | | | |
| | | | | | |
The accompanying notes are an integral part of these financial statements.
8 | Allspring Special International Small Cap Fund
Portfolio of investments—April 30, 2023 (unaudited)
| | | | | |
| | | | | | |
Arbonia AG (Industrials, Building products) | | | | | | |
Bossard Holding AG Class A (Industrials, Trading companies & distributors) | | | | | | |
Bucher Industries AG (Industrials, Machinery) | | | | | | |
Montana Aerospace AG (Industrials, Aerospace & defense) 144A† | | | | | | |
| | | | | | |
| | | | | | |
Britvic PLC (Consumer staples, Beverages) | | | | | | |
Domino’s Pizza Group PLC (Consumer discretionary, Hotels, restaurants & leisure) | | | | | | |
Elementis PLC (Materials, Chemicals) † | | | | | | |
IMI PLC (Industrials, Machinery) | | | | | | |
Lancashire Holdings Ltd. (Financials, Insurance) | | | | | | |
Morgan Advanced Materials PLC (Industrials, Machinery) | | | | | | |
Nomad Foods Ltd. (Consumer staples, Food products) † | | | | | | |
S4 Capital PLC (Communication services, Media) † | | | | | | |
Spectris PLC (Information technology, Electronic equipment, instruments & components) | | | | | | |
SSP Group PLC (Consumer discretionary, Hotels, restaurants & leisure) † | | | | | | |
Tate & Lyle PLC (Consumer staples, Food products) | | | | | | |
| | | | | | |
Total common stocks (Cost $166,240,520) | | | | | | |
Investment companies: 1.01% | | | | | | |
| | | | | | |
iShares MSCI EAFE Small-Cap ETF | | | | | | |
Total investment companies (Cost $1,860,102) | | | | | | |
| | | | | |
Short-term investments: 2.93% | | | | | | |
Investment companies: 2.93% | | | | | | |
Allspring Government Money Market Fund Select Class ♠∞ | | | | | | |
Total short-term investments (Cost $5,396,755) | | | | | | |
Total investments in securities (Cost $173,497,377) | | | | | | |
Other assets and liabilities, net | | | | | | |
| | | | | | |
| Non-income-earning security |
| The security may be resold in transactions exempt from registration, normally to qualified institutional buyers, pursuant to Rule 144A under the Securities Act of 1933. |
| The issuer of the security is an affiliated person of the Fund as defined in the Investment Company Act of 1940. |
| The rate represents the 7-day annualized yield at period end. |
|
| American depositary receipt |
| Real estate investment trust |
The accompanying notes are an integral part of these financial statements.
Allspring Special International Small Cap Fund | 9
Portfolio of investments—April 30, 2023 (unaudited)
Investments in affiliates
An affiliated investment is an investment in which the Fund owns at least 5% of the outstanding voting shares of the issuer or as a result of other relationships, such as the Fund and the issuer having the same investment manager. Transactions with issuers that were affiliates of the Fund at the end of the period were as follows:
| | | | | Net
change in
unrealized
gains
(losses) | | | Income
from
affiliated
securities |
| | | | | | | | |
Allspring Government Money Market Fund Select Class | | | | | | | | |
Investments in affiliates no longer held at end of period | | | | | | | | |
Securities Lending Cash Investments LLC | | | | | | | | |
| | | | | | | | |
| Amount shown represents income before fees and rebates. |
The accompanying notes are an integral part of these financial statements.
10 | Allspring Special International Small Cap Fund
Statement of assets and liabilities—April 30, 2023 (unaudited)
Financial statements
Statement of assets and liabilities
| |
Investments in unaffiliated securities, at value (cost $168,100,622) | |
Investments in affiliated securities, at value (cost $5,396,755) | |
| |
Foreign currency, at value (cost $137,374) | |
Receivable for investments sold | |
| |
Receivable for Fund shares sold | |
Prepaid expenses and other assets | |
| |
| |
Payable for investments purchased | |
| |
Payable for Fund shares redeemed | |
Administration fees payable | |
Trustees’ fees and expenses payable | |
| |
Accrued expenses and other liabilities | |
| |
| |
| |
| |
Total distributable earnings | |
| |
Computation of net asset value and offering price per share | |
| |
Shares outstanding–Class A | |
Net asset value per share–Class A | |
Maximum offering price per share – Class A2 | |
| |
Shares outstanding–Class C | |
Net asset value per share–Class C | |
| |
Shares outstanding–Class R6 | |
Net asset value per share–Class R6 | |
Net assets–Institutional Class1 | |
Shares outstanding–Institutional Class | |
Net asset value per share–Institutional Class | |
| The Fund has an unlimited number of authorized shares. |
| Maximum offering price is computed as 100/94.25 of net asset value. On investments of $50,000 or more, the offering price is reduced. |
The accompanying notes are an integral part of these financial statements.
Allspring Special International Small Cap Fund | 11
Statement of operations—six months ended April 30, 2023 (unaudited)
Statement of operations
| |
Dividends (net of foreign withholdings taxes of $220,497) | |
Income from affiliated securities | |
| |
| |
| |
| |
| |
| |
| |
| |
Shareholder servicing fees | |
| |
| |
| |
| |
Custody and accounting fees | |
| |
| |
Shareholder report expenses | |
Trustees’ fees and expenses | |
| |
| |
Less: Fee waivers and/or expense reimbursements | |
| |
| |
| |
Realized and unrealized gains (losses) on investments | |
Net realized gains (losses) on | |
| |
| |
Foreign currency and foreign currency translations | |
Net realized losses on investments | |
Net change in unrealized gains (losses) on | |
| |
| |
Foreign currency and foreign currency translations | |
Net change in unrealized gains (losses) on investments | |
Net realized and unrealized gains (losses) on investments | |
Net increase in net assets resulting from operations | |
The accompanying notes are an integral part of these financial statements.
12 | Allspring Special International Small Cap Fund
Statement of changes in net assets
Statement of changes in net assets
| Six months ended
April 30, 2023
(unaudited) | Year ended
October 31, 2022 |
| | | | |
| | | | |
Net realized losses on investments | | | | |
Net change in unrealized gains (losses) on investments | | | | |
Net increase (decrease) in net assets resulting from operations | | | | |
Distributions to shareholders from | | | | |
Net investment income and net realized gains | | | | |
| | | | |
| | | | |
| | | | |
| | | | |
Total distributions to shareholders | | | | |
Capital share transactions | | | | |
Proceeds from shares sold | | | | |
| | | | |
| | | | |
| | | | |
| | | | |
| | | | |
Reinvestment of distributions | | | | |
| | | | |
| | | | |
| | | | |
| | | | |
| | | | |
Payment for shares redeemed | | | | |
| | | | |
| | | | |
| | | | |
Net increase (decrease) in net assets resulting from capital share transactions | | | | |
Total increase in net assets | | | | |
| | | | |
| | | | |
| | | | |
| For the period from June 1, 2022 (commencement of class operations) to October 31, 2022. |
The accompanying notes are an integral part of these financial statements.
Allspring Special International Small Cap Fund | 13
Financial highlights
(For a share outstanding throughout each period)
| Six months ended
April 30, 2023
(unaudited) | |
|
Net asset value, beginning of period | | |
| | |
Net realized and unrealized gains (losses) on investments | | |
Total from investment operations | | |
Distributions to shareholders from | | |
| | |
Net asset value, end of period | | |
| | |
Ratios to average net assets (annualized) | | |
| | |
| | |
| | |
| | |
| | |
Net assets, end of period (000s omitted) | | |
| For the period from June 1, 2022 (commencement of class operations) to October 31, 2022. |
| Total return calculations do not include any sales charges. Returns for periods of less than one year are not annualized. |
The accompanying notes are an integral part of these financial statements.
14 | Allspring Special International Small Cap Fund
(For a share outstanding throughout each period)
| Six months ended
April 30, 2023
(unaudited) | |
|
Net asset value, beginning of period | | |
| | |
Net realized and unrealized gains (losses) on investments | | |
Total from investment operations | | |
Distributions to shareholders from | | |
| | |
Net asset value, end of period | | |
| | |
Ratios to average net assets (annualized) | | |
| | |
| | |
| | |
| | |
| | |
Net assets, end of period (000s omitted) | | |
| For the period from June 1, 2022 (commencement of class operations) to October 31, 2022. |
| Amount is less than $0.005. |
| Total return calculations do not include any sales charges. Returns for periods of less than one year are not annualized. |
The accompanying notes are an integral part of these financial statements.
Allspring Special International Small Cap Fund | 15
(For a share outstanding throughout each period)
| Six months ended
April 30, 2023
(unaudited) | |
| | | | |
Net asset value, beginning of period | | | | | |
| | | | | |
Net realized and unrealized gains (losses) on investments | | | | | |
Total from investment operations | | | | | |
Distributions to shareholders from | | | | | |
| | | | | |
| | | | | |
Total distributions to shareholders | | | | | |
Net asset value, end of period | | | | | |
| | | | | |
Ratios to average net assets (annualized) | | | | | |
| | | | | |
| | | | | |
| | | | | |
| | | | | |
| | | | | |
Net assets, end of period (000s omitted) | | | | | |
| For the period from May 31, 2019 (commencement of class operations) to October 31, 2019. |
| Calculated based upon average shares outstanding |
| Returns for periods of less than one year are not annualized. |
The accompanying notes are an integral part of these financial statements.
16 | Allspring Special International Small Cap Fund
(For a share outstanding throughout each period)
| Six months ended
April 30, 2023
(unaudited) | |
| | | | |
Net asset value, beginning of period | | | | | |
| | | | | |
Net realized and unrealized gains (losses) on investments | | | | | |
Total from investment operations | | | | | |
Distributions to shareholders from | | | | | |
| | | | | |
| | | | | |
Total distributions to shareholders | | | | | |
Net asset value, end of period | | | | | |
| | | | | |
Ratios to average net assets (annualized) | | | | | |
| | | | | |
| | | | | |
| | | | | |
| | | | | |
| | | | | |
Net assets, end of period (000s omitted) | | | | | |
| For the period from May 31, 2019 (commencement of class operations) to October 31, 2019. |
| Calculated based upon average shares outstanding |
| Returns for periods of less than one year are not annualized. |
The accompanying notes are an integral part of these financial statements.
Allspring Special International Small Cap Fund | 17
Notes to financial statements (unaudited)
Notes to financial statements
Allspring Funds Trust (the “Trust”), a Delaware statutory trust organized on March 10, 1999, is an open-end management investment company registered under the Investment Company Act of 1940, as amended (the “1940 Act”). As an investment company, the Trust follows the accounting and reporting guidance in Financial Accounting Standards Board (“FASB”) Accounting Standards Codification Topic 946, Financial Services – Investment Companies. These financial statements report on the Allspring Special International Small Cap Fund (the “Fund”) which is a diversified series of the Trust.
2.
SIGNIFICANT ACCOUNTING POLICIES
The following significant accounting policies, which are consistently followed in the preparation of the financial statements of the Fund, are in conformity with U.S. generally accepted accounting principles which require management to make estimates and assumptions that affect the reported amounts of assets and liabilities, disclosure of contingent assets and liabilities at the date of the financial statements, and the reported amounts of income and expenses during the reporting period. Actual results could differ from those estimates.
Securities valuation
All investments are valued each business day as of the close of regular trading on the New York Stock Exchange (generally 4 p.m. Eastern Time), although the Funds may deviate from this calculation time under unusual or unexpected circumstances.
Equity securities and exchange-traded funds that are listed on a foreign or domestic exchange or market are valued at the official closing price or, if none, the last sales price.
The values of securities denominated in foreign currencies are translated into U.S. dollars at rates provided by an independent foreign currency pricing source at a time each business day specified by the Valuation Committee at Allspring Funds Management, LLC (“Allspring Funds Management”).
Many securities markets and exchanges outside the U.S. close prior to the close of the New York Stock Exchange and therefore may not fully reflect trading or events that occur after the close of the principal exchange in which the foreign securities are traded, but before the close of the New York Stock Exchange. If such trading or events are expected to materially affect the value of such securities, then fair value pricing procedures implemented by Allspring Funds Management are applied. These procedures take into account multiple factors including movements in U.S. securities markets after foreign exchanges close. Foreign securities that are fair valued under these procedures are categorized as Level 2 and the application of these procedures may result in transfers between Level 1 and Level 2. Depending on market activity, such fair valuations may be frequent. Such fair value pricing may result in net asset values that are higher or lower than net asset values based on the last reported sales price or latest quoted bid price. On April 30, 2023, such fair value pricing was used in pricing certain foreign securities.
Investments in registered open-end investment companies (other than those listed on a foreign or domestic exchange or market) are valued at net asset value.
Investments which are not valued using any of the methods discussed above are valued at their fair value, as determined in good faith by Allspring Funds Management, which was named the valuation designee by the Board of Trustees. As the valuation designee, Allspring Funds Management is responsible for day-to-day valuation activities for the Allspring Funds. In connection with these responsibilities, Allspring Funds Management has established a Valuation Committee and has delegated to it the authority to take any actions regarding the valuation of portfolio securities that the Valuation Committee deems necessary or appropriate, including determining the fair value of portfolio securities.On a quarterly basis, the Board of Trustees receives reports of valuation actions taken by the Valuation Committee. On at least an annual basis, the Board of Trustees receives an assessment of the adequacy and effectiveness of Allspring Funds Management’s process for determining the fair value of the portfolio of investments.
Foreign currency translation
The accounting records of the Fund are maintained in U.S. dollars. The values of other assets and liabilities denominated in foreign currencies are translated into U.S. dollars at rates provided by an independent foreign currency pricing source at a time each business day specified by the Valuation Committee. Purchases and sales of securities, and income and expenses are converted at the rate of exchange on the respective dates of such transactions. Net realized foreign exchange gains or losses arise from sales of foreign currencies, currency gains or losses realized between the trade and settlement dates on securities transactions, and the difference between the amounts of dividends, interest and foreign withholding taxes recorded and the U.S. dollar equivalent of the amounts actually paid or received. Net unrealized foreign exchange gains and losses arise from changes in the fair value of assets and liabilities other than investments in securities resulting from changes in exchange rates. The changes in net assets arising from changes in exchange rates of securities and the changes in net assets resulting from changes in market prices of securities are not separately presented. Such changes are included in net realized and unrealized gains or losses from investments.
Securities lending
During the period, the Fund participated in a program to lend its securities from time to time in order to earn additional income in the form of fees or interest on securities received as collateral or the investment of any cash received as collateral. When securities were on loan, the Fund received interest or dividends on those securities. Cash collateral received in connection with its securities lending transactions was invested in Securities Lending Cash Investments, LLC (the “Securities Lending Fund”), an affiliated non-registered investment company. Interests in the non-registered investment company
18 | Allspring Special International Small Cap Fund
Notes to financial statements (unaudited)
that were redeemable at net asset value were fair valued normally at net asset value. Effective at the close of business on March 29, 2023, the Fund is no longer participating in the securities lending program and the Securities Lending Fund was liquidated. Securities Lending Fund was managed by Allspring Funds Management and was subadvised by Allspring Global Investments, LLC (“Allspring Investments”), an affiliate of Allspring Funds Management and wholly owned subsidiary of Allspring Global Investments Holdings, LLC. Allspring Funds Management received an advisory fee starting at 0.05% and declining to 0.01% as the average daily net assets of the Securities Lending Fund increased. All of the fees received by Allspring Funds Management were paid to Allspring Investments for its services as subadviser.
Income earned from investment in the Securities Lending Fund (net of fees and rebates), if any, is included in income from affiliated securities on the Statement of Operations.
Security transactions and income recognition
Securities transactions are recorded on a trade date basis. Realized gains or losses are recorded on the basis of identified cost.
Dividend income is recognized on the ex-dividend date, except for certain dividends from foreign securities, which are recorded as soon as the custodian verifies the ex-dividend date. Dividend income is recorded net of foreign taxes withheld where recovery of such taxes is not assured.
Distributions to shareholders
Distributions to shareholders from net investment income and any net realized gains are recorded on the ex-dividend date and paid at least annually. Such distributions are determined in accordance with income tax regulations and may differ from U.S. generally accepted accounting principles. Dividend sources are estimated at the time of declaration. The tax character of distributions is determined as of the Fund’s fiscal year end. Therefore, a portion of the Fund’s distributions made prior to the Fund’s fiscal year end may be categorized as a tax return of capital at year end.
Federal and other taxes
The Fund intends to continue to qualify as a regulated investment company by distributing substantially all of its investment company taxable income and any net realized capital gains (after reduction for capital loss carryforwards) sufficient to relieve it from all, or substantially all, federal income taxes. Accordingly, no provision for federal income taxes was required.
The Fund’s income and federal excise tax returns and all financial records supporting those returns for the period since commencement of operations are subject to examination by the federal and Delaware revenue authorities. Management has analyzed the Fund’s tax positions taken on federal, state, and foreign tax returns, as applicable, for all open tax years and does not believe that there are any uncertain tax positions that require recognition of a tax liability.
As of April 30, 2023, the aggregate cost of all investments for federal income tax purposes was $173,853,119 and the unrealized gains (losses) consisted of:
As of October 31, 2022, the Fund had capital loss carryforwards which consisted of $122,207 in short-term capital losses and $269,039 in long-term capital losses.
Class allocations
The separate classes of shares offered by the Fund differ principally in applicable sales charges, distribution, shareholder servicing, and administration fees. Class specific expenses are charged directly to that share class. Investment income, common fund-level expenses, and realized and unrealized gains (losses) on investments are allocated daily to each class of shares based on the relative proportion of net assets of each class.
3.
FAIR VALUATION MEASUREMENTS
Fair value measurements of investments are determined within a framework that has established a fair value hierarchy based upon the various data inputs utilized in determining the value of the Fund’s investments. The three-level hierarchy gives the highest priority to unadjusted quoted prices in active markets for identical assets or liabilities (Level 1) and the lowest priority to unobservable inputs (Level 3). The Fund’s investments are classified within the fair value hierarchy based on the lowest level of input that is significant to the fair value measurement. The inputs are summarized into three broad levels as follows:
•Level 1—quoted prices in active markets for identical securities
•Level 2—other significant observable inputs (including quoted prices for similar securities, interest rates, prepayment speeds, credit risk, etc.)
•Level 3—significant unobservable inputs (including the Fund’s own assumptions in determining the fair value of investments)
The inputs or methodologies used for valuing investments in securities are not necessarily an indication of the risk associated with investing in those securities.
Allspring Special International Small Cap Fund | 19
Notes to financial statements (unaudited)
The following is a summary of the inputs used in valuing the Fund’s assets and liabilities as of April 30, 2023:
| | Other significant
observable inputs
(Level 2) | Significant
unobservable inputs
(Level 3) | |
| | | | |
| | | | |
| | | | |
| | | | |
| | | | |
| | | | |
| | | | |
| | | | |
| | | | |
| | | | |
| | | | |
| | | | |
| | | | |
| | | | |
| | | | |
| | | | |
| | | | |
| | | | |
| | | | |
| | | | |
| | | | |
| | | | |
| | | | |
| | | | |
Additional sector, industry or geographic detail, if any, is included in the Portfolio of Investments.
For the six months ended April 30, 2023, the Portfolio did not have transfers into/out of Level 3.
4.
TRANSACTIONS WITH AFFILIATES
Management fee
Allspring Funds Management, a wholly owned subsidiary of Allspring Global Investments Holdings, LLC, a holding company indirectly owned by certain private funds of GTCR LLC and Reverence Capital Partners, L.P., is the manager of the Fund and provides advisory and fund-level administrative services under an investment management agreement. Under the investment management agreement, Allspring Funds Management is responsible for, among other services, implementing the investment objectives and strategies of the Fund, supervising the subadviser and providing fund-level administrative services in connection with the Fund’s operations. As compensation for its services under the investment management agreement, Allspring Funds Management is entitled to receive a management fee at the following annual rate based on the Fund’s average daily net assets:
For the six months ended April 30, 2023, the management fee was equivalent to an annual rate of 0.95% of the Fund’s average daily net assets.
Allspring Funds Management has retained the services of a subadviser to provide daily portfolio management to the Fund. The fee for subadvisory services is borne by Allspring Funds Management. Allspring Investments is the subadviser to the Fund and is entitled to receive a fee from Allspring Funds Management at an annual rate starting at 0.55% and declining to 0.40% as the average daily net assets of the Fund increase.
20 | Allspring Special International Small Cap Fund
Notes to financial statements (unaudited)
Administration fees
Under a class-level administration agreement, Allspring Funds Management provides class-level administrative services to the Fund, which includes paying fees and expenses for services provided by the transfer agent, sub-transfer agents, omnibus account servicers and record-keepers. As compensation for its services under the class-level administration agreement, Allspring Funds Management receives an annual fee which is calculated based on the average daily net assets of each class as follows:
| Class-level
administration fee |
| |
| |
| |
| |
Waivers and/or expense reimbursements
Allspring Funds Management has contractually committed to waive and/or reimburse management and administration fees to the extent necessary to maintain certain net operating expense ratios for the Fund. When each class of the Fund has exceeded its expense cap, Allspring Funds Management will waive fees and/or reimburse expenses from fund-level expenses on a proportionate basis and then from class specific expenses. When only certain classes exceed their expense caps, waivers and/or reimbursements are applied against class specific expenses before fund-level expenses. Allspring Funds Management has contractually committed through February 29, 2024 to waive fees and/or reimburse expenses to the extent necessary to cap expenses. Prior to or after the commitment expiration date, the caps may be increased or the commitment to maintain the caps may be terminated only with the approval of the Board of Trustees. As of April 30, 2023, the contractual expense caps are as follows:
Distribution fee
The Trust has adopted a distribution plan for Class C shares pursuant to Rule 12b-1 under the 1940 Act. A distribution fee is charged to Class C shares and paid to Allspring Funds Distributor, LLC (“Allspring Funds Distributor”), the principal underwriter, an affiliate of Allspring Funds Management, at an annual rate up to 0.75% of the average daily net assets of Class C shares.
In addition, Allspring Funds Distributor is entitled to receive the front-end sales charge from the purchase of Class A shares and a contingent deferred sales charge on the redemption of certain Class A shares. Allspring Funds Distributor is also entitled to receive the contingent deferred sales charges from redemptions of Class C shares. Allspring Funds Distributor did not receive any front-end or contingent deferred sales charges from Class A or Class C shares for the six months ended April 30, 2023.
Shareholder servicing fees
The Trust has entered into contracts with one or more shareholder servicing agents, whereby Class A and Class C are charged a fee at an annual rate up to 0.25% of the average daily net assets of each respective class. A portion of these total shareholder servicing fees were paid to affiliates of the Fund.
Interfund transactions
The Fund may purchase or sell portfolio investment securities to certain affiliates pursuant to Rule 17a-7 under the 1940 Act and under procedures adopted by the Board of Trustees. The procedures have been designed to ensure that these interfund transactions, which do not incur broker commissions, are effected at current market prices.
5.
INVESTMENT PORTFOLIO TRANSACTIONS
Purchases and sales of investments, excluding U.S. government obligations (if any) and short-term securities, for the six months ended April 30, 2023 were $22,855,452 and $37,855,564, respectively.
The Trust (excluding the money market funds), Allspring Master Trust and Allspring Variable Trust are parties to a $350,000,000 revolving credit agreement whereby the Fund is permitted to use bank borrowings for temporary or emergency purposes, such as to fund shareholder redemption
Allspring Special International Small Cap Fund | 21
Notes to financial statements (unaudited)
requests. Interest under the credit agreement is charged to the Fund based on borrowing rate equal to the higher of the Federal Funds rate or the overnight bank funding rate in effect on that day plus a spread. In addition, an annual commitment fee based on the unused balance is allocated to each participating fund.
For the six months ended April 30, 2023, there were no borrowings by the Fund under the agreement.
As of the end of the period, the Fund concentrated its portfolio of investments in Europe and Japan and the industrials sector. A fund that invests a substantial portion of its assets in any geographic region or sector may be more affected by changes in that geographic region or sector than would be a fund whose investments are not heavily weighted in any geographic region or sector.
A fund with a concentration of ownership may be more affected by the investment activity of those shareholders than would be a fund that does not have any ownership concentration. As of April 30, 2023, Allspring Funds Management or one of its affiliates owned 18% of the Fund.
Under the Fund’s organizational documents, the officers and Trustees have been granted certain indemnification rights against certain liabilities that may arise out of performance of their duties to the Fund. The Fund has entered into a separate agreement with each Trustee that converts indemnification rights currently existing under the Fund’s organizational documents into contractual rights that cannot be changed in the future without the consent of the Trustee. Additionally, in the normal course of business, the Fund may enter into contracts with service providers that contain a variety of indemnification clauses. The Fund’s maximum exposure under these arrangements is dependent on future claims that may be made against the Fund and, therefore, cannot be estimated.
22 | Allspring Special International Small Cap Fund
Other information (unaudited)
Other information
Tax information
Pursuant to Section 853 of the Internal Revenue Code, the following amounts have been designated as foreign taxes paid for the fiscal year ended October 31, 2022. These amounts may be less than the actual foreign taxes paid for financial statement purposes. Foreign taxes paid or withheld should be included in taxable income with an offsetting deduction from gross income or as a credit for taxes paid to foreign governments. None of the income was derived from ineligible foreign sources as defined under Section 901(j) of the Internal Revenue Code.
Creditable
foreign taxes
paid | | Foreign
income as % of
ordinary income
distributions |
| | |
Proxy voting information
A description of the policies and procedures used to determine how to vote proxies relating to portfolio securities is available without charge, upon request, by calling 1-800-222-8222, visiting our website at allspringglobal.com, or visiting the SEC website at sec.gov. Information regarding how the proxies related to portfolio securities were voted during the most recent 12-month period ended June 30 is available on the website at allspringglobal.com or by visiting the SEC website at sec.gov.
Quarterly portfolio holdings information
The Fund files its complete schedule of portfolio holdings with the SEC for the first and third quarters of each fiscal year as an exhibit to its reports on Form N-PORT. Shareholders may view the filed Form N-PORT by visiting the SEC website at sec.gov.
Allspring Special International Small Cap Fund | 23
Other information (unaudited)
BOARD OF TRUSTEES AND OFFICERS
Each of the Trustees and Officers listed in the table below acts in identical capacities for each fund in the Allspring family of funds, which consists of 127 mutual funds comprising the Allspring Funds Trust, Allspring Variable Trust, Allspring Master Trust and four closed-end funds (collectively the “Fund Complex”). This table should be read in conjunction with the Prospectus and the Statement of Additional Information1. The mailing address of each Trustee and Officer is 1415 Vantage Park Drive, 3rd Floor, Charlotte, NC 28203. Each Trustee and Officer serves an indefinite term, however, each Trustee serves such term until reaching the mandatory retirement age established by the Trustees.
Independent Trustees
| | Principal occupations during past five years or longer | Current other
public company or
investment
company
directorships |
William R. Ebsworth
(Born 1957) | | Retired. From 1984 to 2013, equities analyst, portfolio manager, research director and chief investment officer at Fidelity Management and Research Company in Boston, Tokyo, and Hong Kong, and retired in 2013 as Chief Investment Officer of Fidelity Strategic Advisers, Inc. where he led a team of investment professionals managing client assets. Prior thereto, Board member of Hong Kong Securities Clearing Co., Hong Kong Options Clearing Corp., the Thailand International Fund, Ltd., Fidelity Investments Life Insurance Company, and Empire Fidelity Investments Life Insurance Company. Audit Committee Chair and Investment Committee Chair of the Vincent Memorial Hospital Foundation (non-profit organization). Mr. Ebsworth is a CFA charterholder. | |
Jane A. Freeman
(Born 1953) | Trustee,
since 2015;
Chair Liaison,
since 2018 | Retired. From 2012 to 2014 and 1999 to 2008, Chief Financial Officer of Scientific Learning Corporation. From 2008 to 2012, Ms. Freeman provided consulting services related to strategic business projects. Prior to 1999, Portfolio Manager at Rockefeller & Co. and Scudder, Stevens & Clark. Board member of the Harding Loevner Funds from 1996 to 2014, serving as both Lead Independent Director and chair of the Audit Committee. Board member of the Russell Exchange Traded Funds Trust from 2011 to 2012 and the chair of the Audit Committee. Ms. Freeman is also an inactive Chartered Financial Analyst. | |
Isaiah Harris, Jr.
(Born 1952) | Trustee,
since 2009;
Audit Committee Chair,
since 2019 | Retired. Member of the Advisory Board of CEF of East Central Florida. Chairman of the Board of CIGNA Corporation from 2009 to 2021, and Director from 2005 to 2008. From 2003 to 2011, Director of Deluxe Corporation. Prior thereto, President and CEO of BellSouth Advertising and Publishing Corp. from 2005 to 2007, President and CEO of BellSouth Enterprises from 2004 to 2005 and President of BellSouth Consumer Services from 2000 to 2003. Emeritus member of the Iowa State University Foundation Board of Governors. Emeritus Member of the Advisory Board of Iowa State University School of Business. Advisory Board Member, Palm Harbor Academy (private school). Advisory Board Member, Fellowship of Christian Athletes. Mr. Harris is a certified public accountant (inactive status). | |
David F. Larcker
(Born 1950) | | Distinguished Visiting Fellow at the Hoover Institution since 2022. James Irvin Miller Professor of Accounting at the Graduate School of Business (Emeritus), Stanford University, Director of the Corporate Governance Research Initiative and Senior Faculty of The Rock Center for Corporate Governance since 2006. From 2005 to 2008, Professor of Accounting at the Graduate School of Business, Stanford University. Prior thereto, Ernst & Young Professor of Accounting at The Wharton School, University of Pennsylvania from 1985 to 2005. | |
Olivia S. Mitchell
(Born 1953) | Trustee,
since 2006;
Nominating and Governance Committee Chair,
since 2018 | International Foundation of Employee Benefit Plans Professor since 1993, Wharton School of the University of Pennsylvania. Director of Wharton’s Pension Research Council and Boettner Center on Pensions & Retirement Research, and Research Associate at the National Bureau of Economic Research. Previously taught at Cornell University from 1978 to 1993. | |
Timothy J. Penny
(Born 1951) | Trustee,
since 1996;
Chair,
since 2018 | President and Chief Executive Officer of Southern Minnesota Initiative Foundation, a non-profit organization, since 2007. Vice Chair of the Economic Club of Minnesota, since 2007. Co-Chair of the Committee for a Responsible Federal Budget, since 1995. Member of the Board of Trustees of NorthStar Education Finance, Inc., a non-profit organization, from 2007-2022. Senior Fellow of the University of Minnesota Humphrey Institute from 1995 to 2017. | |
1
The Statement of Additional Information includes additional information about the Trustees and is available, without charge, upon request, by calling 1-800-222-8222 or by visiting the website at allspringglobal.com.
24 | Allspring Special International Small Cap Fund
Other information (unaudited)
| Position held and length of service* | Principal occupations during past five years or longer | Current other public company or investment company directorships |
James G. Polisson
(Born 1959) | | Retired. Chief Marketing Officer, Source (ETF) UK Services, Ltd, from 2015 to 2017. From 2012 to 2015, Principal of The Polisson Group, LLC, a management consulting, corporate advisory and principal investing company. Chief Executive Officer and Managing Director at Russell Investments, Global Exchange Traded Funds from 2010 to 2012. Managing Director of Barclays Global Investors from 1998 to 2010 and Global Chief Marketing Officer for iShares and Barclays Global Investors from 2000 to 2010. Trustee of the San Francisco Mechanics’ Institute, a non- profit organization, from 2013 to 2015. Board member of the Russell Exchange Traded Fund Trust from 2011 to 2012. Director of Barclays Global Investors Holdings Deutschland GmbH from 2006 to 2009. Mr. Polisson is an attorney and has a retired status with the Massachusetts and District of Columbia Bar Associations. | |
Pamela Wheelock
(Born 1959) | Trustee,
since January 2020;
previously Trustee from
January 2018 to
July 2019 | Retired. Executive and Senior Financial leadership positions in the public, private and nonprofit sectors. Interim President and CEO, McKnight Foundation, 2020. Interim Commissioner, Minnesota Department of Human Services, 2019. Chief Operating Officer, Twin Cities Habitat for Humanity, 2017-2019. Vice President for University Services, University of Minnesota, 2012- 2016. Interim President and CEO, Blue Cross and Blue Shield of Minnesota, 2011-2012. Executive Vice-President and Chief Financial Officer, Minnesota Wild, 2002-2008. Commissioner, Minnesota Department of Finance, 1999-2002. Chair of the Board of Directors of Destination Medical Center Corporation. Board member of the Minnesota Wild Foundation. | |
| Length of service dates reflect the Trustee’s commencement of service with the Trust’s predecessor entities, where applicable. |
Allspring Special International Small Cap Fund | 25
Other information (unaudited)
Officers1
| Position held and
length of service | Principal occupations during past five years or longer |
| | President and Chief Executive Officer of Allspring Funds Management, LLC since 2017 and Head of Global Fund Governance of Allspring Global Investments since 2022. Prior thereto, co-president of Galliard Capital Management, LLC, an affiliate of Allspring Funds Management, LLC, from 2019 to 2022 and Head of Affiliated Managers, Allspring Global Investments, from 2014 to 2019 and Executive Vice President responsible for marketing, investments and product development for Allspring Funds Management, LLC, from 2009 to 2014. |
Jeremy DePalma
(Born 1974) | Treasurer,
since 2012
(for certain funds in
the Fund Complex);
since 2021 (for
the remaining funds in the Fund Complex) | Senior Vice President of Allspring Funds Management, LLC since 2009. Senior Vice President of Evergreen Investment Management Company, LLC from 2008 to 2010 and head of the Fund Reporting and Control Team within Fund Administration from 2005 to 2010. |
Christopher Baker
(Born 1976) | Chief Compliance Officer,
since 2022 | Global Chief Compliance Officer for Allspring Global Investments since 2022. Prior thereto, Chief Compliance Officer for State Street Global Advisors from 2018 to 2021. Senior Compliance Officer for the State Street divisions of Alternative Investment Solutions, Sector Solutions, and Global Marketing from 2015 to 2018. From 2010 to 2015 Vice President, Global Head of Investment and Marketing Compliance for State Street Global Advisors. |
Matthew Prasse
(Born 1983) | Chief Legal Officer,
since 2022;
Secretary,
since 2021 | Senior Counsel of the Allspring Legal Department since 2021. Senior Counsel of the Wells Fargo Legal Department from 2018 to 2021. Previously, Counsel for Barings LLC from 2015 to 2018. Prior to joining Barings, Associate at Morgan, Lewis & Bockius LLP from 2008 to 2015. |
1 For those Officers with tenures at Allspring Global Investments and/or Allspring Funds Management, LLC that began prior to 2021, such tenures include years of service during which these businesses/entities were known as Wells Fargo Asset Management and Wells Fargo Funds Management, LLC, respectively.
26 | Allspring Special International Small Cap Fund
This page is intentionally left blank.
This page is intentionally left blank.
For more information
More information about Allspring Funds is available free upon request. To obtain literature, please write, visit the Fund’s website, or call:
Allspring Funds
P.O. Box 219967
Kansas City, MO 64121-9967
Website: allspringglobal.com
Individual investors: 1-800-222-8222
Retail investment professionals: 1-888-877-9275
Institutional investment professionals: 1-800-260-5969
This report and the financial statements contained herein are submitted for the general information of the shareholders of the Fund. If this report is used for promotional purposes, distribution of the report must be accompanied or preceded by a current prospectus. Before investing, please consider the investment objectives, risks, charges, and expenses of the investment. For a current prospectus and, if available, a summary prospectus, containing this information, call 1-800-222-8222 or visit the Fund’s website at allspringglobal.com. Read the prospectus carefully before you invest or send money.
Allspring Global InvestmentsTM is the trade name for the asset management firms of Allspring Global Investments Holdings, LLC, a holding company indirectly owned by certain private funds of GTCR LLC and Reverence Capital Partners, L.P. These firms include but are not limited to Allspring Global Investments, LLC, and Allspring Funds Management, LLC. Certain products managed by Allspring entities are distributed by Allspring Funds Distributor, LLC (a broker-dealer and Member FINRA/SIPC).
This material is for general informational and educational purposes only and is NOT intended to provide investment advice or a recommendation of any kind - including a recommendation for any specific investment, strategy, or plan.
© 2023 Allspring Global Investments Holdings, LLC. All rights reserved.
ALL-05052023-8w9rahde 06-23
SAR4338 04-23
Allspring U.S. Long/Short Equity Fund
Semi-Annual Report
April 30, 2023
The views expressed and any forward-looking statements are as of April 30, 2023, unless otherwise noted, and are those of the Fund’s portfolio managers and/or Allspring Global Investments. Discussions of individual securities or the markets generally are not intended as individual recommendations. Future events or results may vary significantly from those expressed in any forward-looking statements. The views expressed are subject to change at any time in response to changing circumstances in the market. Allspring Global Investments disclaims any obligation to publicly update or revise any views expressed or forward-looking statements.
Allspring U.S. Long/Short Equity Fund | 1
Letter to shareholders (unaudited)
Andrew Owen
President
Allspring Funds
Dear Shareholder:
We are pleased to offer you this semi-annual report for the Allspring U.S. Long/Short Equity Fund for the six-month period that ended April 30, 2023. Globally, stocks and bonds rebounded strongly despite ongoing volatility. While navigating persistently high inflation and the impact of ongoing aggressive central bank rate hikes, markets rallied on signs of declining inflation, anticipation of an end to the central bank monetary tightening cycle, and the stimulating impact of China removing its strict COVID-19 lockdowns in December. For the six-month period, domestic U.S. and global stocks and bonds had strong results. After suffering deep and broad losses through 2022, recent fixed income performance benefited from a base of higher yields that have the potential to generate higher income.
For the period, U.S. stocks, based on the S&P 500 Index,1 returned 8.63%. International stocks, as measured by the MSCI ACWI ex USA Index (Net),2 gained 20.65% while the MSCI EM Index (Net) (USD),3 returned 16.36%. Among bond indexes, the Bloomberg U.S. Aggregate Bond Index4 returned 6.91%, the Bloomberg Global Aggregate ex-USD Index (unhedged)5 gained 10.55%, the Bloomberg Municipal Bond Index6 gained 7.65%, and the ICE BofA U.S. High Yield Index7 returned 5.92%.
Despite high inflation and central bank rate hikes, markets rally.
Stocks and bonds rallied in November after earlier volatility. Economic news was encouraging, driven by U.S. labor market strength. Although central banks kept increasing rates, hopes rose for an easing in the pace of rate hikes and a possible end to central bank monetary tightening in 2023. Although inflation remained at record highs in the eurozone, we began to see signs of a possible decline in inflationary pressures as U.S. inflation moderated, with a 7.1% annual price rise in November and a monthly price increase of just 0.1%. China’s economic data remained weak, reflecting its zero-COVID-19 policy.
Financial markets cooled in December, with U.S. equities posting negative overall results in response to a weakening U.S. dollar. Fixed income securities ended one of their worst years ever, with flat overall monthly returns as markets weighed the hopes for an end to the monetary tightening cycle with the reality that central banks had not completed their jobs yet. U.S. Consumer Price Index (CPI)8 data showed a strong consistent trend downward, which brought down the 12-month CPI to 6.5% in December from 9.1% in June. Other countries and regions reported still-high but declining inflation rates as the year wound down.
1
The S&P 500 Index consists of 500 stocks chosen for market size, liquidity, and industry group representation. It is a market-value-weighted index with each stock’s weight in the index proportionate to its market value. You cannot invest directly in an index.
2
The Morgan Stanley Capital International (MSCI) All Country World Index (ACWI) ex USA Index (Net) is a free-float-adjusted market-capitalization-weighted index that is designed to measure the equity market performance of developed and emerging markets, excluding the U.S. Source: MSCI. MSCI makes no express or implied warranties or representations and shall have no liability whatsoever with respect to any MSCI data contained herein. The MSCI data may not be further redistributed or used as a basis for other indexes or any securities or financial products. This report is not approved, reviewed, or produced by MSCI. You cannot invest directly in an index.
3
The MSCI Emerging Markets (EM) Index (Net) (USD) is a free-float-adjusted market-capitalization-weighted index that is designed to measure the equity market performance of emerging markets. You cannot invest directly in an index.
4
The Bloomberg U.S. Aggregate Bond Index is a broad-based benchmark that measures the investment-grade, U.S.-dollar-denominated, fixed-rate taxable bond market, including Treasuries, government-related and corporate securities, mortgage-backed securities (agency fixed-rate and hybrid adjustable-rate mortgage pass-throughs), asset-backed securities, and commercial mortgage-backed securities. You cannot invest directly in an index.
5
The Bloomberg Global Aggregate ex-USD Index (unhedged) is an unmanaged index that provides a broad-based measure of the global investment-grade fixed-income markets excluding the U.S.-dollar-denominated debt market. You cannot invest directly in an index.
6
The Bloomberg Municipal Bond Index is an unmanaged index composed of long-term tax-exempt bonds with a minimum credit rating of Baa. You cannot invest directly in an index.
7
The ICE BofA U.S. High Yield Index is a market-capitalization-weighted index of domestic and Yankee high yield bonds. The index tracks the performance of high yield securities traded in the U.S. bond market. You cannot invest directly in an index. Copyright 2023. ICE Data Indices, LLC. All rights reserved.
8
The U.S. Consumer Price Index (CPI) is a measure of the average change over time in the prices paid by urban consumers for a market basket of consumer goods and services. You cannot invest directly in an index.
2 | Allspring U.S. Long/Short Equity Fund
Letter to shareholders (unaudited)
The year 2023 began with a rally across global equities and fixed income securities. Investor optimism rose in response to data indicating declining inflation rates and the reopening of China’s economy with the abrupt end to its zero-COVID-19 policy. The U.S. reported surprisingly strong job gains—employers added more than 500,000 jobs—and unemployment fell to 3.4%, the lowest level since 1969. Meanwhile, wage growth, seen as a potential contributor to ongoing high inflation, continued to moderate. All eyes remained fixed on the Federal Reserve (Fed) and on how many more rate hikes remain in this tightening cycle. The 0.25% federal funds rate hike announced in January was the Fed’s smallest rate increase since March 2022.
Financial markets declined in February as investors responded unfavorably to resilient economic data. The takeaway: Central banks will likely continue their monetary tightening cycle for longer than markets had priced in. In this environment—where strong economic data is seen as bad news—the resilient U.S. labor market was seen as a negative while the inflation rate has not been falling quickly enough for the Fed, which raised interest rates by 0.25% in early February. Meanwhile, the Bank of England and the European Central Bank both raised rates by 0.50%.
The collapse of Silicon Valley Bank in March, the second-largest banking failure in U.S. history, led to a classic bank run that spread to Europe where Switzerland’s Credit Suisse was taken over by its rival, UBS. The banking industry turmoil created an additional challenge for central banks in balancing inflationary concerns against potential economic weakening. Meanwhile, recent data pointed to economic strength in the U.S., Europe, and China. And China’s economy continued to rebound after the removal of its COVID-19 lockdown. Inflation rates in the U.S., the U.K., and Europe all remained higher than central bank targets, leading to additional rate hikes in March.
Economic data released in April pointed to global resilience, as Purchasing Managers Indexes1 in the U.S., U.K., and eurozone beat expectations and China reported first-quarter annualized economic growth of 4.5%. Despite banking industry stress, developed market stocks had monthly gains. The U.S. labor market remained strong, with a 3.5% jobless rate and monthly payroll gains above 200,000. However, uncertainty and inflationary concerns weighed on investors in the U.S. and abroad.
Don’t let short-term uncertainty derail long-term investment goals.
Periods of investment uncertainty can present challenges, but experience has taught us that maintaining long-term investment goals can be an effective way to plan for the future. To help you create a sound strategy based on your personal goals and risk tolerance, Allspring Funds offers more than 100 mutual funds spanning a wide range of asset classes and investment styles. Although diversification cannot guarantee an investment profit or prevent losses, we believe it can be an effective way to manage investment risk and potentially smooth out overall portfolio performance. We encourage investors to know their investments and to understand that appropriate levels of risk-taking may unlock opportunities.
Thank you for choosing to invest with Allspring Funds. We appreciate your confidence in us and remain committed to helping you meet your financial needs.
Sincerely,
Andrew Owen
President
Allspring Funds
“ The collapse of Silicon Valley Bank in March, the second-largest banking failure in U.S. history, led to a classic bank run that spread to Europe where Switzerland’s Credit Suisse was taken over by its rival, UBS. ”
For further information about your fund, contact your investment professional, visit our website at allspringglobal.com, or call us directly at 1-800-222-8222.
1
The Purchasing Managers Index (PMI) is an index of the prevailing direction of economic trends in the manufacturing and service sectors. You cannot invest directly in an index.
Allspring U.S. Long/Short Equity Fund | 3
Performance highlights (unaudited)
Performance highlights
| The Fund seeks long-term capital appreciation. |
| Allspring Funds Management, LLC |
| Allspring Global Investments, LLC |
| Ryan Brown, CFA, Harindra de Silva, Ph.D., CFA |
Average annual total returns (%) as of April 30, 2023 |
| | | | |
| | | | | | | | | |
| | | | | | | | | |
| | | | | | | | | |
| | | | | | | | | |
| | | | | | | | | |
| | | | | | | | | |
ICE BofA 3-Month U.S. Treasury Bill Index8 | | | | | | | | | |
| | | | | | | | | |
Figures quoted represent past performance, which is no guarantee of future results, and do not reflect taxes that a shareholder may pay on an investment in a fund. Investment return and principal value of an investment will fluctuate so that an investor’s shares, when redeemed, may be worth more or less than their original cost. Performance shown without sales charges would be lower if sales charges were reflected. Current performance may be lower or higher than the performance data quoted, which assumes the reinvestment of dividends and capital gains. Current month-end performance is available on the Fund’s website, allspringglobal.com.
Index returns do not include transaction costs associated with buying and selling securities, any mutual fund fees or expenses, or any taxes. It is not possible to invest directly in an index.
For Class A shares, the maximum front-end sales charge is 5.75%. For Class C shares, the maximum contingent deferred sales charge is 1.00%. Performance including a contingent deferred sales charge assumes the sales charge for the corresponding time period. Class R6 and Institutional Class shares are sold without a front-end sales charge or contingent deferred sales charge.
|
| Based on the inception date of the oldest Fund class. |
| Reflects the expense ratios as stated in the most recent prospectuses. The expense ratios shown are subject to change and may differ from the annualized expense ratios shown in the financial highlights of this report. |
| The manager has contractually committed through February 28, 2025, to waive fees and/or reimburse expenses to the extent necessary to cap total annual fund operating expenses after fee waivers at 1.58% for Class A, 2.33% for Class C, 1.15% for Class R6 and 1.25% for Institutional Class. Brokerage commissions, stamp duty fees, interest, taxes, acquired fund fees and expenses (if any), expenses from dividends and interest expense on securities sold short, and extraordinary expenses are excluded from the expense caps. Prior to or after the commitment expiration date, the caps may be increased or the commitment to maintain the caps may be terminated only with the approval of the Board of Trustees. Without these caps, the Fund’s returns would have been lower. The expense ratio paid by an investor is the net expense ratio (the total annual fund operating expenses after fee waivers) as stated in the prospectuses. |
| Historical performance shown for the Class A shares prior to 12-16-2022 is based on the performance of the Investor Class shares of the Fund’s predecessor, 361 Domestic Long/Short Equity Fund. |
| Historical performance for the Class C shares prior to their inception reflects the performance of the Class A shares and is not adjusted to reflect the higher expenses applicable to the Class C shares. If these expenses had been included, returns would be lower. |
| Historical performance shown for the Class R6 shares prior to their inception reflects the performance of the Institutional Class shares, and includes the higher expenses applicable to the Institutional Class shares. If these expenses had not been included, returns for the Class R6 shares would be higher. Historical performance prior to
12-16-2022 is based on the performance of the Fund’s predecessor, 361 Domestic Long/Short Equity Fund. |
| Historical performance shown for the Institutional Class shares prior to 12-16-2022 is based on the performance of Class I shares of the Fund’s predecessor, 361 Domestic Long/Short Equity Fund. |
| The Morgan Stanley Capital International (MSCI) USA Index (Net) (USD) is a free-float-adjusted market-capitalization-weighted index that is designed to measure large- and mid-cap U.S. equity market performance. Source: MSCI. MSCI makes no express or implied warranties or representations and shall have no liability whatsoever with respect to any MSCI data contained herein. The MSCI data may not be further redistributed or used as a basis for other indices or any securities or financial products. This report is not approved, reviewed, or produced by MSCI. You cannot invest directly in an index. |
CFA® and Chartered Financial Analyst® are trademarks owned by CFA Institute. |
4 | Allspring U.S. Long/Short Equity Fund
Performance highlights (unaudited)
Footnotes continued from previous page |
| The ICE BofA 3-Month U.S. Treasury Bill Index is an unmanaged index that is comprised of a single U.S. Treasury issue with approximately three months to final maturity, purchased at the beginning of each month and held for one full month. You cannot invest directly in an index. Copyright 2023. ICE Data Indices, LLC. All rights reserved. |
| Source: Allspring Funds Management, LLC. The U.S. Long/Short Equity Blended Index is composed 50% of the MSCI USA Index (Net) (USD) and 50% of the ICE BofA 3-Month U.S. Treasury Bill Index. You cannot invest directly in an index. |
Investing involves risk, including the possible loss of principal. Stock values fluctuate in response to the activities of individual companies and general market and economic conditions. Foreign investments are especially volatile and can rise or fall dramatically due to differences in the political and economic conditions of the host country. Short selling is generally considered speculative, has the potential for unlimited loss, and may involve leverage. Consult the Fund’s prospectus for additional information on these and other risks.
Allspring U.S. Long/Short Equity Fund | 5
Performance highlights (unaudited)
Ten largest Long Positions holdings (%) as of April 30, 20231 |
| |
| |
Madison Square Garden Sports Corp. | |
Lennox International, Inc. | |
Huntington Ingalls Industries, Inc. | |
| |
| |
| |
| |
| |
| Figures represent the percentage of the Fund’s net assets. Holdings are subject to change and may have changed since the date specified. |
Five largest short positions holdings (%) as of April 30, 20231 |
| |
International Flavors & Fragrances, Inc. | |
| |
Palantir Technologies, Inc. Class A | |
| |
| Figures represent the percentage of the Fund’s net assets. Holdings are subject to change and may have changed since the date specified. |
Sector Allocation for Long and Short positions as of April 30, |
| | |
| | |
| | |
| | |
| | |
| | |
| | |
| | |
| | |
| | |
| | |
| | |
| Figures represent the percentage of the Fund’s long and short positions. Allocations are subject to change and may have changed since the date specified. |
6 | Allspring U.S. Long/Short Equity Fund
Fund expenses (unaudited)
Fund expenses
As a shareholder of the Fund, you incur two types of costs: (1) transaction costs, including sales charges (loads) on purchase payments and contingent deferred sales charges (if any) on redemptions and (2) ongoing costs, including management fees, distribution (12b-1) and/or shareholder servicing fees, and other Fund expenses. This example is intended to help you understand your ongoing costs (in dollars) of investing in the Fund and to compare these costs with the ongoing costs of investing in other mutual funds.
The example is based on an investment of $1,000 invested at the beginning of the six-month period and held for the entire period from November 1, 2022 to April 30, 2023.
Actual expenses
The “Actual” line of the table below provides information about actual account values and actual expenses. You may use the information in this line, together with the amount you invested, to estimate the expenses that you paid over the period. Simply divide your account value by $1,000 (for example, an $8,600 account value divided by $1,000 = 8.6), then multiply the result by the number in the “Actual” line under the heading entitled “Expenses paid during period” for your applicable class of shares to estimate the expenses you paid on your account during this period.
Hypothetical example for comparison purposes
The “Hypothetical” line of the table below provides information about hypothetical account values and hypothetical expenses based on the Fund’s actual expense ratio and an assumed rate of return of 5% per year before expenses, which is not the Fund’s actual return. The hypothetical account values and expenses may not be used to estimate the actual ending account balance or expenses you paid for the period. You may use this information to compare the ongoing costs of investing in the Fund and other funds. To do so, compare this 5% hypothetical example with the 5% hypothetical examples that appear in the shareholder reports of the other funds.
Please note that the expenses shown in the table are meant to highlight your ongoing costs only and do not reflect any transactional costs, such as sales charges (loads) and contingent deferred sales charges. Therefore, the “Hypothetical” line of the table is useful in comparing ongoing costs only, and will not help you determine the relative total costs of owning different funds. In addition, if these transactional costs were included, your costs would have been higher.
| Beginning
account value
11-1-2022 | Ending
account value
4-30-2023 | | Annualized net
expense ratio |
| | | | |
| | | | |
Hypothetical (5% return before expenses) | | | | |
| | | | |
| | | | |
Hypothetical (5% return before expenses) | | | | |
| | | | |
| | | | |
Hypothetical (5% return before expenses) | | | | |
| | | | |
| | | | |
Hypothetical (5% return before expenses) | | | | |
1 Expenses paid is equal to the annualized net expense ratio of each class multiplied by the average account value over the period, multiplied by 181 divided by 365 (to reflect the one-half-year period).
Allspring U.S. Long/Short Equity Fund | 7
Portfolio of investments—April 30, 2023 (unaudited)
| | | | | |
| | | | | | |
Communication services: 6.48% | | | | | | |
Diversified telecommunication services: 0.27% | | | | | | |
Bandwidth, Inc. Class A †# | | | | | | |
| | | | | | |
Madison Square Garden Sports Corp. # | | | | | | |
Playtika Holding Corp. †# | | | | | | |
| | | | | | |
| | | | | | |
Interactive media & services: 0.73% | | | | | | |
Alphabet, Inc. Class A †# | | | | | | |
Alphabet, Inc. Class C †# | | | | | | |
Meta Platforms, Inc. Class A †# | | | | | | |
| | | | | | |
| | | | | | |
Altice USA, Inc. Class A †# | | | | | | |
New York Times Co. Class A # | | | | | | |
Sirius XM Holdings, Inc. # | | | | | | |
| | | | | | |
Consumer discretionary: 7.98% | | | | | | |
Automobile components: 0.82% | | | | | | |
| | | | | | |
| | | | | | |
| | | | | | |
Motorcar Parts of America, Inc. †# | | | | | | |
| | | | | | |
| | | | | | |
| | | | | | |
| | | | | | |
| | | | | | |
Diversified consumer services: 1.15% | | | | | | |
Grand Canyon Education, Inc. †# | | | | | | |
Hotels, restaurants & leisure: 2.40% | | | | | | |
| | | | | | |
Inspired Entertainment, Inc. †# | | | | | | |
Marriott International, Inc. Class A # | | | | | | |
| | | | | | |
| | | | | | |
| | | | | | |
| | | | | | |
The accompanying notes are an integral part of these financial statements.
8 | Allspring U.S. Long/Short Equity Fund
Portfolio of investments—April 30, 2023 (unaudited)
| | | | | |
Household durables: 0.19% | | | | | | |
Beazer Homes USA, Inc. †# | | | | | | |
| | | | | | |
| | | | | | |
| | | | | | |
O’Reilly Automotive, Inc. †# | | | | | | |
| | | | | | |
| | | | | | |
| | | | | | |
| | | | | | |
| | | | | | |
| | | | | | |
Boston Beer Co., Inc. Class A †# | | | | | | |
Brown-Forman Corp. Class B # | | | | | | |
Monster Beverage Corp. †# | | | | | | |
| | | | | | |
| | | | | | |
Consumer staples distribution & retail: 2.57% | | | | | | |
BJ’s Wholesale Club Holdings, Inc. †# | | | | | | |
| | | | | | |
Grocery Outlet Holding Corp. †# | | | | | | |
| | | | | | |
| | | | | | |
| | | | | | |
| | | | | | |
| | | | | | |
| | | | | | |
| | | | | | |
| | | | | | |
Tyson Foods, Inc. Class A # | | | | | | |
| | | | | | |
Household products: 0.63% | | | | | | |
| | | | | | |
| | | | | | |
| | | | | | |
| | | | | | |
Personal care products: 0.42% | | | | | | |
Herbalife Nutrition Ltd. †# | | | | | | |
| | | | | | |
| | | | | | |
Philip Morris International, Inc. # | | | | | | |
| | | | | | |
The accompanying notes are an integral part of these financial statements.
Allspring U.S. Long/Short Equity Fund | 9
Portfolio of investments—April 30, 2023 (unaudited)
| | | | | |
| | | | | | |
Oil, gas & consumable fuels: 1.39% | | | | | | |
Centrus Energy Corp. Class A †# | | | | | | |
| | | | | | |
| | | | | | |
New Fortress Energy, Inc. # | | | | | | |
Southwestern Energy Co. †# | | | | | | |
| | | | | | |
| | | | | | |
| | | | | | |
Bank of NT Butterfield & Son Ltd. # | | | | | | |
| | | | | | |
| | | | | | |
| | | | | | |
East West Bancorp, Inc. # | | | | | | |
OceanFirst Financial Corp. # | | | | | | |
| | | | | | |
| | | | | | |
Affiliated Managers Group, Inc. # | | | | | | |
| | | | | | |
Jefferies Financial Group, Inc. # | | | | | | |
MarketAxess Holdings, Inc. # | | | | | | |
| | | | | | |
Virtu Financial, Inc. Class A # | | | | | | |
| | | | | | |
| | | | | | |
| | | | | | |
Financial services: 3.96% | | | | | | |
Corebridge Financial, Inc. # | | | | | | |
| | | | | | |
Jack Henry & Associates, Inc. # | | | | | | |
| | | | | | |
| | | | | | |
| | | | | | |
| | | | | | |
| | | | | | |
Erie Indemnity Co. Class A # | | | | | | |
Hanover Insurance Group, Inc. # | | | | | | |
| | | | | | |
Marsh & McLennan Cos., Inc. # | | | | | | |
Reinsurance Group of America, Inc. # | | | | | | |
| | | | | | |
| | | | | | |
Willis Towers Watson PLC # | | | | | | |
| | | | | | |
The accompanying notes are an integral part of these financial statements.
10 | Allspring U.S. Long/Short Equity Fund
Portfolio of investments—April 30, 2023 (unaudited)
| | | | | |
Mortgage real estate investment trusts (REITs): 0.34% | | | | | | |
Chicago Atlantic Real Estate Finance, Inc. # | | | | | | |
| | | | | | |
| | | | | | |
| | | | | | |
| | | | | | |
| | | | | | |
Catalyst Pharmaceuticals, Inc. †# | | | | | | |
Eagle Pharmaceuticals, Inc. †# | | | | | | |
| | | | | | |
Kiniksa Pharmaceuticals Ltd. Class A †# | | | | | | |
Neurocrine Biosciences, Inc. †# | | | | | | |
Vanda Pharmaceuticals, Inc. †# | | | | | | |
| | | | | | |
Health care equipment & supplies: 3.11% | | | | | | |
| | | | | | |
| | | | | | |
| | | | | | |
| | | | | | |
OraSure Technologies, Inc. †# | | | | | | |
| | | | | | |
| | | | | | |
| | | | | | |
Health care providers & services: 2.10% | | | | | | |
| | | | | | |
| | | | | | |
| | | | | | |
| | | | | | |
Life sciences tools & services: 3.71% | | | | | | |
Agilent Technologies, Inc. # | | | | | | |
| | | | | | |
| | | | | | |
Medpace Holdings, Inc. †# | | | | | | |
Mettler-Toledo International, Inc. †# | | | | | | |
| | | | | | |
| | | | | | |
West Pharmaceutical Services, Inc. # | | | | | | |
| | | | | | |
| | | | | | |
Elanco Animal Health, Inc. †# | | | | | | |
Harmony Biosciences Holdings, Inc. †# | | | | | | |
Jazz Pharmaceuticals PLC †# | | | | | | |
Phibro Animal Health Corp. Class A # | | | | | | |
SIGA Technologies, Inc. # | | | | | | |
| | | | | | |
The accompanying notes are an integral part of these financial statements.
Allspring U.S. Long/Short Equity Fund | 11
Portfolio of investments—April 30, 2023 (unaudited)
| | | | | |
| | | | | | |
Aerospace & defense: 3.74% | | | | | | |
| | | | | | |
Huntington Ingalls Industries, Inc. # | | | | | | |
| | | | | | |
| | | | | | |
| | | | | | |
| | | | | | |
| | | | | | |
Lennox International, Inc. | | | | | | |
| | | | | | |
Commercial services & supplies: 1.41% | | | | | | |
| | | | | | |
| | | | | | |
| | | | | | |
| | | | | | |
Construction & engineering: 1.00% | | | | | | |
| | | | | | |
Electrical equipment: 1.44% | | | | | | |
| | | | | | |
| | | | | | |
| | | | | | |
| | | | | | |
| | | | | | |
Allison Transmission Holdings, Inc. # | | | | | | |
| | | | | | |
| | | | | | |
| | | | | | |
Titan International, Inc. †# | | | | | | |
| | | | | | |
Marine transportation: 0.09% | | | | | | |
Golden Ocean Group Ltd. # | | | | | | |
| | | | | | |
| | | | | | |
Professional services: 0.05% | | | | | | |
Booz Allen Hamilton Holding Corp. # | | | | | | |
| | | | | | |
| | | | | | |
Trading companies & distributors: 0.95% | | | | | | |
MSC Industrial Direct Co., Inc. Class A # | | | | | | |
The accompanying notes are an integral part of these financial statements.
12 | Allspring U.S. Long/Short Equity Fund
Portfolio of investments—April 30, 2023 (unaudited)
| | | | | |
Information technology: 16.50% | | | | | | |
Communications equipment: 0.39% | | | | | | |
Comtech Telecommunications Corp. # | | | | | | |
Motorola Solutions, Inc. # | | | | | | |
| | | | | | |
| | | | | | |
Electronic equipment, instruments & components: 2.25% | | | | | | |
Keysight Technologies, Inc. †# | | | | | | |
Vishay Precision Group, Inc. †# | | | | | | |
| | | | | | |
| | | | | | |
| | | | | | |
| | | | | | |
| | | | | | |
| | | | | | |
| | | | | | |
Semiconductors & semiconductor equipment: 1.37% | | | | | | |
| | | | | | |
| | | | | | |
Lattice Semiconductor Corp. †# | | | | | | |
| | | | | | |
Skyworks Solutions, Inc. # | | | | | | |
| | | | | | |
| | | | | | |
| | | | | | |
| | | | | | |
Dolby Laboratories, Inc. Class A # | | | | | | |
| | | | | | |
| | | | | | |
| | | | | | |
| | | | | | |
| | | | | | |
LiveRamp Holdings, Inc. †# | | | | | | |
| | | | | | |
| | | | | | |
RingCentral, Inc. Class A †# | | | | | | |
| | | | | | |
| | | | | | |
| | | | | | |
Technology hardware, storage & peripherals: 2.95% | | | | | | |
| | | | | | |
| | | | | | |
| | | | | | |
Element Solutions, Inc. # | | | | | | |
The accompanying notes are an integral part of these financial statements.
Allspring U.S. Long/Short Equity Fund | 13
Portfolio of investments—April 30, 2023 (unaudited)
| | | | | |
Construction materials: 1.00% | | | | | | |
| | | | | | |
Containers & packaging: 2.41% | | | | | | |
Berry Global Group, Inc. # | | | | | | |
Graphic Packaging Holding Co. # | | | | | | |
| | | | | | |
| | | | | | |
| | | | | | |
| | | | | | |
| | | | | | |
| | | | | | |
| | | | | | |
Reliance Steel & Aluminum Co. # | | | | | | |
| | | | | | |
| | | | | | |
| | | | | | |
| | | | | | |
Highwoods Properties, Inc. # | | | | | | |
Residential REITs : 1.40% | | | | | | |
Apartment Income REIT Corp. # | | | | | | |
Specialized REITs : 4.14% | | | | | | |
| | | | | | |
| | | | | | |
Lamar Advertising Co. Class A # | | | | | | |
SBA Communications Corp. # | | | | | | |
| | | | | | |
| | | | | | |
| | | | | | |
Electric utilities: 2.01% | | | | | | |
Constellation Energy Corp. # | | | | | | |
| | | | | | |
| | | | | | |
| | | | | | |
| | | | | | |
| | | | | | |
| | | | | | |
| | | | | | |
| | | | | | |
| | | | | | |
| | | | | | |
Total common stocks (Cost $23,373,918) | | | | | | |
The accompanying notes are an integral part of these financial statements.
14 | Allspring U.S. Long/Short Equity Fund
Portfolio of investments—April 30, 2023 (unaudited)
| | | | | |
Short-term investments: 1.31% | | | | | | |
Investment companies: 1.31% | | | | | | |
Allspring Government Money Market Fund Select Class ♠∞ | | | | | | |
Total short-term investments (Cost $304,897) | | | | | | |
Total investments in securities (Cost $23,678,815) | | | | | | |
| | | | | |
Securities sold short: (30.06)% | | | | | | |
| | | | | | |
Communication services: (0.61)% | | | | | | |
| | | | | | |
| | | | | | |
Interactive media & services: (0.45)% | | | | | | |
| | | | | | |
| | | | | | |
| | | | | | |
Consumer discretionary: (6.21)% | | | | | | |
Automobile components: (0.02)% | | | | | | |
| | | | | | |
| | | | | | |
| | | | | | |
| | | | | | |
Rivian Automotive, Inc. Class A † | | | | | | |
| | | | | | |
Broadline retail: (0.02)% | | | | | | |
| | | | | | |
Diversified consumer services: (0.07)% | | | | | | |
| | | | | | |
Hotels, restaurants & leisure: (1.38)% | | | | | | |
| | | | | | |
| | | | | | |
Kura Sushi USA, Inc. Class A † | | | | | | |
| | | | | | |
Planet Fitness, Inc. Class A † | | | | | | |
| | | | | | |
| | | | | | |
Household durables: (1.92)% | | | | | | |
| | | | | | |
| | | | | | |
| | | | | | |
| | | | | | |
The accompanying notes are an integral part of these financial statements.
Allspring U.S. Long/Short Equity Fund | 15
Portfolio of investments—April 30, 2023 (unaudited)
| | | | | |
Specialty retail: (0.11)% | | | | | | |
| | | | | | |
| | | | | | |
| | | | | | |
Textiles, apparel & luxury goods: (1.20)% | | | | | | |
| | | | | | |
| | | | | | |
| | | | | | |
Consumer staples: (1.20)% | | | | | | |
Consumer staples distribution & retail : (0.23)% | | | | | | |
| | | | | | |
| | | | | | |
| | | | | | |
| | | | | | |
Energy equipment & services: (0.96)% | | | | | | |
| | | | | | |
Helix Energy Solutions Group, Inc. † | | | | | | |
| | | | | | |
Oil, gas & consumable fuels: (0.86)% | | | | | | |
| | | | | | |
| | | | | | |
| | | | | | |
| | | | | | |
| | | | | | |
| | | | | | |
| | | | | | |
Coinbase Global, Inc. Class A † | | | | | | |
Robinhood Markets Class A † | | | | | | |
| | | | | | |
Consumer finance: (0.25)% | | | | | | |
SoFi Technologies, Inc. † | | | | | | |
| | | | | | |
| | | | | | |
Financial services: (1.05)% | | | | | | |
| | | | | | |
AvidXchange Holdings, Inc. † | | | | | | |
| | | | | | |
| | | | | | |
| | | | | | |
| | | | | | |
| | | | | | |
The accompanying notes are an integral part of these financial statements.
16 | Allspring U.S. Long/Short Equity Fund
Portfolio of investments—April 30, 2023 (unaudited)
| | | | | |
| | | | | | |
Brighthouse Financial, Inc. † | | | | | | |
Prudential Financial, Inc. | | | | | | |
| | | | | | |
Mortgage real estate investment trusts (REITs): (0.39)% | | | | | | |
| | | | | | |
| | | | | | |
| | | | | | |
Akero Therapeutics, Inc. † | | | | | | |
Apellis Pharmaceuticals, Inc. † | | | | | | |
Intellia Therapeutics, Inc. † | | | | | | |
| | | | | | |
| | | | | | |
| | | | | | |
SpringWorks Therapeutics, Inc. † | | | | | | |
| | | | | | |
Health care equipment & supplies: (0.56)% | | | | | | |
| | | | | | |
Vicarious Surgical, Inc. † | | | | | | |
| | | | | | |
Health care providers & services: (1.01)% | | | | | | |
| | | | | | |
| | | | | | |
| | | | | | |
| | | | | | |
Health care technology: (0.26)% | | | | | | |
| | | | | | |
Life sciences tools & services: (1.05)% | | | | | | |
| | | | | | |
| | | | | | |
| | | | | | |
| | | | | | |
Axsome Therapeutics, Inc. † | | | | | | |
| | | | | | |
DICE Therapeutics, Inc. † | | | | | | |
Phathom Pharmaceuticals, Inc. † | | | | | | |
Ventyx Biosciences, Inc. † | | | | | | |
| | | | | | |
| | | | | | |
Building products: (0.04)% | | | | | | |
| | | | | | |
The accompanying notes are an integral part of these financial statements.
Allspring U.S. Long/Short Equity Fund | 17
Portfolio of investments—April 30, 2023 (unaudited)
| | | | | |
Commercial services & supplies: (0.39)% | | | | | | |
ACV Auctions, Inc. Class A † | | | | | | |
Li-Cycle Holdings Corp. † | | | | | | |
| | | | | | |
Electrical equipment: (0.68)% | | | | | | |
Bloom Energy Corp. Class A † | | | | | | |
| | | | | | |
| | | | | | |
| | | | | | |
| | | | | | |
Ground transportation: (0.40)% | | | | | | |
Hertz Global Holdings, Inc. † | | | | | | |
| | | | | | |
| | | | | | |
| | | | | | |
| | | | | | |
Stanley Black & Decker, Inc. | | | | | | |
| | | | | | |
Professional services: (1.07)% | | | | | | |
| | | | | | |
| | | | | | |
| | | | | | |
Trading companies & distributors: (0.57)% | | | | | | |
Distribution Solutions Group, Inc. † | | | | | | |
| | | | | | |
| | | | | | |
Information technology: (4.28)% | | | | | | |
Electronic equipment, instruments & components: (0.74)% | | | | | | |
| | | | | | |
Mirion Technologies, Inc. † | | | | | | |
| | | | | | |
| | | | | | |
Cloudflare, Inc. Class A † | | | | | | |
Semiconductors & semiconductor equipment: (0.85)% | | | | | | |
Credo Technology Group Holding Ltd. † | | | | | | |
| | | | | | |
| | | | | | |
| | | | | | |
| | | | | | |
Marathon Digital Holdings, Inc. † | | | | | | |
| | | | | | |
The accompanying notes are an integral part of these financial statements.
18 | Allspring U.S. Long/Short Equity Fund
Portfolio of investments—April 30, 2023 (unaudited)
| | | | | |
| | | | | | |
Palantir Technologies, Inc. Class A † | | | | | | |
| | | | | | |
| | | | | | |
| | | | | | |
| | | | | | |
International Flavors & Fragrances, Inc. | | | | | | |
PureCycle Technologies, Inc. † | | | | | | |
| | | | | | |
Construction materials: (0.18)% | | | | | | |
Martin Marietta Materials, Inc. | | | | | | |
| | | | | | |
5E Advanced Materials, Inc. † | | | | | | |
| | | | | | |
| | | | | | |
| | | | | | |
Real estate management & development: (0.36)% | | | | | | |
Anywhere Real Estate, Inc. † | | | | | | |
Zillow Group, Inc. Class A † | | | | | | |
Zillow Group, Inc. Class C † | | | | | | |
| | | | | | |
| | | | | | |
| | | | | | |
| | | | | | |
Electric utilities: (0.01)% | | | | | | |
| | | | | | |
| | | | | | |
| | | | | | |
Total common stocks - Securities Sold Short (Proceeds $(7,150,889)) | | | | | | |
Total securities sold short (Proceeds $(7,150,889)) | | | | | | |
Other assets and liabilities, net | | | | | | |
| | | | | | |
| Non-income-earning security |
| All or a portion of this security is segregated as collateral for securities sold short. |
| The issuer of the security is an affiliated person of the Fund as defined in the Investment Company Act of 1940. |
| The rate represents the 7-day annualized yield at period end. |
|
| Real estate investment trust |
The accompanying notes are an integral part of these financial statements.
Allspring U.S. Long/Short Equity Fund | 19
Portfolio of investments—April 30, 2023 (unaudited)
Investments in affiliates
An affiliated investment is an investment in which the Fund owns at least 5% of the outstanding voting shares of the issuer or as a result of other relationships, such as the Fund and the issuer having the same investment manager. Transactions with issuers that were affiliates of the Fund at the end of the period were as follows:
| | | | | Net
change in
unrealized
gains
(losses) | | | Income
from
affiliated
securities |
| | | | | | | | |
Allspring Government Money Market Fund Select Class | | | | | | | | |
The accompanying notes are an integral part of these financial statements.
20 | Allspring U.S. Long/Short Equity Fund
Statement of assets and liabilities—April 30, 2023 (unaudited)
Financial statements
Statement of assets and liabilities
| |
Investments in unaffiliated securities, at value (cost $23,373,918) | |
Investments in affiliated securities, at value (cost $304,897) | |
Cash deposited with brokers for securities sold short | |
| |
Receivable for Fund shares sold | |
Prepaid expenses and other assets | |
| |
| |
Payable for securities sold short, at value (proceeds $7,150,889) | |
Payable for dividends and interest expense on securities sold short | |
| |
Administration fees payable | |
Payable for Fund shares redeemed | |
Distribution fees payable | |
Accrued expenses and other liabilities | |
| |
| |
| |
| |
Total distributable earnings | |
| |
Computation of net asset value and offering price per share | |
| |
Shares outstanding–Class A1 | |
Net asset value per share–Class A | |
Maximum offering price per share – Class A2 | |
| |
Shares outstanding–Class C1 | |
Net asset value per share–Class C | |
| |
Shares outstanding–Class R61 | |
Net asset value per share–Class R6 | |
Net assets–Institutional Class | |
Shares outstanding–Institutional Class1 | |
Net asset value per share–Institutional Class | |
| The Fund has an unlimited number of authorized shares. |
| Maximum offering price is computed as 100/94.25 of net asset value. On investments of $50,000 or more, the offering price is reduced. |
The accompanying notes are an integral part of these financial statements.
Allspring U.S. Long/Short Equity Fund | 21
Statement of operations—six months ended April 30, 2023 (unaudited)
Statement of operations
| |
Dividends (net of foreign withholdings taxes of $80) | |
Interest and rebate income | |
Income from affiliated securities | |
| |
| |
| |
| |
| |
| |
| |
| |
Shareholder servicing fees | |
| |
| |
| |
| |
| |
| |
Custody and accounting fees | |
| |
| |
Shareholder report expenses | |
Trustees’ fees and expenses | |
| |
| |
Dividends on securities sold short | |
| |
| |
Less: Fee waivers and/or expense reimbursements | |
| |
| |
| |
| |
| |
| |
Realized and unrealized gains (losses) on investments | |
Net realized gains (losses) on | |
| |
| |
Net realized losses on investments | |
The accompanying notes are an integral part of these financial statements.
22 | Allspring U.S. Long/Short Equity Fund
Statement of operations—six months ended April 30, 2023 (unaudited)
Net change in unrealized gains (losses) on | |
| |
| |
Net change in unrealized gains (losses) on investments | |
Net realized and unrealized gains (losses) on investments | |
Net increase in net assets resulting from operations | |
| After the close of business on December 16, 2022, the Fund acquired the net assets of 361 Domestic Long/Short Equity Fund which became the accounting and performance survivor in the transaction. The information for Class A and Institutional Class for the period prior to December 16, 2022 is that of 361 Domestic Long/Short Equity Fund Investor Class and Class I shares, respectively. |
| For the period from December 16, 2022 (commencement of class operations) to April 30, 2023 |
The accompanying notes are an integral part of these financial statements.
Allspring U.S. Long/Short Equity Fund | 23
Statement of changes in net assets
Statement of changes in net assets
| Six months ended
April 30, 2023
(unaudited) | Year ended
October 31, 2022 |
| | | | |
Net investment income (loss) | | | | |
Net realized gains (losses) on investments | | | | |
Net change in unrealized gains (losses) on investments | | | | |
Net increase in net assets resulting from operations | | | | |
Distributions to shareholders from | | | | |
Net investment income and net realized gains | | | | |
| | | | |
| | | | |
Total distributions to shareholders | | | | |
Capital share transactions | | | | |
Proceeds from shares sold | | | | |
| | | | |
| | | | |
| | | | |
| | | | |
| | | | |
Reinvestment of distributions | | | | |
| | | | |
| | | | |
| | | | |
Payment for shares redeemed | | | | |
| | | | |
| | | | |
| | | | |
Net increase (decrease) in net assets resulting from capital share transactions | | | | |
Total increase (decrease) in net assets | | | | |
| | | | |
| | | | |
| | | | |
| After the close of business on December 16, 2022, the Fund acquired the net assets of 361 Domestic Long/Short Equity Fund which became the accounting and performance survivor in the transaction. The information for Class A and Institutional Class for the periods prior to December 16, 2022 is that of 361 Domestic Long/Short Equity Fund Investor Class and Class I shares, respectively. |
| For the period from December 16, 2022 (commencement of class operations) to April 30, 2023. |
The accompanying notes are an integral part of these financial statements.
24 | Allspring U.S. Long/Short Equity Fund
Statement of cash flows—six months ended April 30, 2023 (unaudited)
Statement of cash flows
Cash flows from operating activities | |
Net increase in net assets resulting from operations | |
Adjustments to reconcile net increase in net assets from operations to net cash used in operating activities | |
Purchases of long-term securities | |
Proceeds from the sales of long-term securities | |
Proceeds from securities sold short | |
Purchases to cover short securities | |
Purchases and sales of short-term securities, net | |
Increase in cash deposited with brokers for securities sold short | |
Decrease in receivable for dividends | |
Increase in prepaid expenses and other assets | |
Decrease in trustees’ fees and expenses payable | |
Increase in management fee payable | |
Decrease in administration fees payable | |
Decrease in distribution fees payable | |
Decrease in custody and accounting fees payable | |
Decrease in shareholder servicing fees payable | |
Increase in payable for dividends and interest expense on securities sold short | |
Decrease in accrued expenses and other liabilities | |
Net realized gains on unaffiliated securities | |
Net realized losses on securities sold short | |
Net change in unrealized gains (losses) on unaffiliated securities | |
Net change in unrealized gains (losses) on securities sold short | |
Net cash used in operating activities | |
Cash flows from financing activities | |
Proceeds from shares sold | |
Cost of shares repurchased | |
| |
Net cash provided in financing activities | |
| |
| |
| |
| |
Supplemental cash disclosure | |
Cash paid for dividends and interest expense on securities sold short | |
Supplemental non-cash financing disclosure | |
Reinvestment of dividends | |
The accompanying notes are an integral part of these financial statements.
Allspring U.S. Long/Short Equity Fund | 25
Financial highlights
(For a share outstanding throughout each period)
| Six months ended
April 30, 2023
| |
| | | | | |
Net asset value, beginning of period | | | | | | |
Net investment income (loss) | | | | | | |
Net realized and unrealized gains (losses) on investments | | | | | | |
Total from investment operations | | | | | | |
Distributions to shareholders from | | | | | | |
| | | | | | |
Net asset value, end of period | | | | | | |
| | | | | | |
Ratios to average net assets (annualized) | | | | | | |
| | | | | | |
| | | | | | |
Net investment income (loss)* | | | | | | |
| | | | | | |
| | | | | | |
Net assets, end of period (000s omitted) | | | | | | |
| Ratios include dividends and interest expense on securities sold short as follows: |
Six months ended April 30, 2023 (unaudited) | |
Year ended October 31, 2022 | |
Year ended October 31, 2021 | |
Year ended October 31, 2020 | |
Year ended October 31, 2019 | |
Year ended October 31, 2018 | |
| After the close of business on December 16, 2022, the Fund acquired the net assets of 361 Domestic Long/Short Equity Fund which became the accounting and performance survivor in the transaction. The information for the periods prior to December 16, 2022 is that of 361 Domestic Long/Short Equity Fund Investor Class. |
| Calculated based upon average shares outstanding |
| Total return calculations do not include any sales charges. Returns for periods of less than one year are not annualized. |
The accompanying notes are an integral part of these financial statements.
26 | Allspring U.S. Long/Short Equity Fund
(For a share outstanding throughout each period)
| |
Net asset value, beginning of period | |
| |
Net realized and unrealized gains (losses) on investments | |
Total from investment operations | |
Net asset value, end of period | |
| |
Ratios to average net assets (annualized) | |
| |
| |
| |
| |
| |
Net assets, end of period (000s omitted) | |
| Ratios include dividends and interest expense on securities sold short in the amount of 0.71%. |
| For the period from December 16, 2022 (commencement of class operations) to April 30, 2023. |
| Calculated based upon average shares outstanding |
| Total return calculations do not include any sales charges. Returns for periods of less than one year are not annualized. |
The accompanying notes are an integral part of these financial statements.
Allspring U.S. Long/Short Equity Fund | 27
(For a share outstanding throughout each period)
| |
Net asset value, beginning of period | |
| |
Net realized and unrealized gains (losses) on investments | |
Total from investment operations | |
Net asset value, end of period | |
| |
Ratios to average net assets (annualized) | |
| |
| |
| |
| |
| |
Net assets, end of period (000s omitted) | |
| Ratios include dividends and interest expense on securities sold short in the amount of 0.71%. |
| For the period from December 16, 2022 (commencement of class operations) to April 30, 2023. |
| Calculated based upon average shares outstanding |
| Returns for periods of less than one year are not annualized. |
The accompanying notes are an integral part of these financial statements.
28 | Allspring U.S. Long/Short Equity Fund
(For a share outstanding throughout each period)
| Six months ended
April 30, 2023
| |
| | | | | |
Net asset value, beginning of period | | | | | | |
Net investment income (loss) | | | | | | |
Net realized and unrealized gains (losses) on investments | | | | | | |
Total from investment operations | | | | | | |
Distributions to shareholders from | | | | | | |
| | | | | | |
| | | | | | |
Total distributions to shareholders | | | | | | |
Net asset value, end of period | | | | | | |
| | | | | | |
Ratios to average net assets (annualized) | | | | | | |
| | | | | | |
| | | | | | |
Net investment income (loss)* | | | | | | |
| | | | | | |
| | | | | | |
Net assets, end of period (000s omitted) | | | | | | |
| Ratios include dividends and interest expense on securities sold short as follows: |
Six months ended April 30, 2023 (unaudited) | |
Year ended October 31, 2022 | |
Year ended October 31, 2021 | |
Year ended October 31, 2020 | |
Year ended October 31, 2019 | |
Year ended October 31, 2018 | |
| After the close of business on December 16, 2022, the Fund acquired the net assets of 361 Domestic Long/Short Equity Fund which became the accounting and performance survivor in the transaction. The information for the periods prior to December 16, 2022 is that of 361 Domestic Long/Short Equity Fund Class I. |
| Calculated based upon average shares outstanding |
| Amount is less than $0.005. |
| Returns for periods of less than one year are not annualized. |
The accompanying notes are an integral part of these financial statements.
Allspring U.S. Long/Short Equity Fund | 29
Notes to financial statements (unaudited)
Notes to financial statements
Allspring Funds Trust (the “Trust”), a Delaware statutory trust organized on March 31, 2016, is an open-end management investment company registered under the Investment Company Act of 1940, as amended (the “1940 Act”). As an investment company, the Trust follows the accounting and reporting guidance in Financial Accounting Standards Board (“FASB”) Accounting Standards Codification Topic 946, Financial Services – Investment Companies. These financial statements report on the Allspring U.S. Long/Short Equity Fund (the “Fund”) which is a diversified series of the Trust.
After the close of business on December 16, 2022, the net assets of 361 Domestic Long/Short Equity Fund were acquired by the Fund, which was created to receive the assets of 361 Domestic Long/Short Equity Fund, in an exchange for shares of the Fund. Investor Class and Class I shares of 361 Domestic Long/Short Equity Fund received Class A and Institutional Class shares, respectively, of the Fund in the transaction. Since 361 Domestic Long/Short Equity Fund contributed all of the net assets and shareholders to the newly created Allspring fund, the accounting and performance history of 361 Domestic Long/Short Equity Fund has been carried forward in the financial statements contained herein.
2.
SIGNIFICANT ACCOUNTING POLICIES
The following significant accounting policies, which are consistently followed in the preparation of the financial statements of the Fund, are in conformity with U.S. generally accepted accounting principles which require management to make estimates and assumptions that affect the reported amounts of assets and liabilities, disclosure of contingent assets and liabilities at the date of the financial statements, and the reported amounts of income and expenses during the reporting period. Actual results could differ from those estimates.
Securities valuation
All investments are valued each business day as of the close of regular trading on the New York Stock Exchange (generally 4 p.m. Eastern Time), although the Funds may deviate from this calculation time under unusual or unexpected circumstances.
Equity securities that are listed on a foreign or domestic exchange or market are valued at the official closing price or, if none, the last sales price.
Investments in registered open-end investment companies (other than those listed on a foreign or domestic exchange or market) are valued at net asset value.
Investments which are not valued using any of the methods discussed above are valued at their fair value, as determined in good faith by Allspring Funds Management, LLC (“Allspring Funds Management”), which was named the valuation designee by the Board of Trustees. As the valuation designee, Allspring Funds Management is responsible for day-to-day valuation activities for the Allspring Funds. In connection with these responsibilities, Allspring Funds Management has established a Valuation Committee and has delegated to it the authority to take any actions regarding the valuation of portfolio securities that the Valuation Committee deems necessary or appropriate, including determining the fair value of portfolio securities. On a quarterly basis, the Board of Trustees receives reports of valuation actions taken by the Valuation Committee. On at least an annual basis, the Board of Trustees receives an assessment of the adequacy and effectiveness of Allspring Funds Management’s process for determining the fair value of the portfolio of investments.
Short sales
The Fund may sell a security it does not own in anticipation of a decline in the market value of that security (short sale). When the Fund makes a short sale, it must borrow the security sold short and deliver it to the buyer. The Fund is then obligated to replace the security borrowed by purchasing the security at the market price at the time of replacement.
The Fund records the proceeds as a liability which is marked-to-market daily based upon quotations from an independent pricing service or an independent broker-dealer and any change in value is recorded as an unrealized gain or loss. Any interest or dividends accrued on such borrowed securities during the period of the loan are recorded as an expense on the Statement of Operations. To borrow the security, the Fund may be required to pay a premium, which would decrease the proceeds of the security sold. A gain, limited to the price at which the Fund sold the security short, or a loss, unlimited in size, will be recognized upon the closing of a short sale if the market price at the closing is less than or greater than, respectively, the proceeds originally received. Until the short sale is closed or the borrowed security is replaced, the Fund maintains a segregated account of cash or liquid securities, the dollar value of which is at least equal to the market value of the security at the time of the short sale.
Security transactions and income recognition
Securities transactions are recorded on a trade date basis. Realized gains or losses are recorded on the basis of identified cost.
Dividend income is recognized on the ex-dividend date. Dividend income is recorded net of foreign taxes withheld where recovery of such taxes is not assured.
Distributions to shareholders
Distributions to shareholders from net investment income and any net realized gains are recorded on the ex-dividend date and paid at least annually. Such distributions are determined in accordance with income tax regulations and may differ from U.S. generally accepted accounting principles. Dividend sources are estimated at the time of declaration. The tax character of distributions is determined as of the Fund’s fiscal year end. Therefore, a portion of the Fund’s distributions made prior to the Fund’s fiscal year end may be categorized as a tax return of capital at year end.
30 | Allspring U.S. Long/Short Equity Fund
Notes to financial statements (unaudited)
Federal and other taxes
The Fund intends to continue to qualify as a regulated investment company by distributing substantially all of its investment company taxable income and any net realized capital gains (after reduction for capital loss carryforwards) sufficient to relieve it from all, or substantially all, federal income taxes. Accordingly, no provision for federal income taxes was required.
The Fund’s income and federal excise tax returns and all financial records supporting those returns for the prior three fiscal years are subject to examination by the federal and Delaware revenue authorities. Management has analyzed the Fund’s tax positions taken on federal, state, and foreign tax returns, as applicable, for all open tax years and does not believe that there are any uncertain tax positions that require recognition of a tax liability.
As of April 30, 2023, the aggregate cost of all investments for federal income tax purposes was $16,483,655 and the unrealized gains (losses) consisted of:
Class allocations
The separate classes of shares offered by the Fund differ principally in applicable sales charges, distribution, shareholder servicing, and administration fees. Class specific expenses are charged directly to that share class. Investment income, common fund-level expenses, and realized and unrealized gains (losses) on investments are allocated daily to each class of shares based on the relative proportion of net assets of each class.
3.
FAIR VALUATION MEASUREMENTS
Fair value measurements of investments are determined within a framework that has established a fair value hierarchy based upon the various data inputs utilized in determining the value of the Fund’s investments. The three-level hierarchy gives the highest priority to unadjusted quoted prices in active markets for identical assets or liabilities (Level 1) and the lowest priority to unobservable inputs (Level 3). The Fund’s investments are classified within the fair value hierarchy based on the lowest level of input that is significant to the fair value measurement. The inputs are summarized into three broad levels as follows:
•Level 1—quoted prices in active markets for identical securities
•Level 2—other significant observable inputs (including quoted prices for similar securities, interest rates, prepayment speeds, credit risk, etc.)
•Level 3—significant unobservable inputs (including the Fund’s own assumptions in determining the fair value of investments)
The inputs or methodologies used for valuing investments in securities are not necessarily an indication of the risk associated with investing in those securities.
Allspring U.S. Long/Short Equity Fund | 31
Notes to financial statements (unaudited)
The following is a summary of the inputs used in valuing the Fund’s assets and liabilities as of April 30, 2023:
| | Other significant
observable inputs
(Level 2) | Significant
unobservable inputs
(Level 3) | |
| | | | |
| | | | |
| | | | |
| | | | |
| | | | |
| | | | |
| | | | |
| | | | |
| | | | |
| | | | |
| | | | |
| | | | |
| | | | |
| | | | |
| | | | |
| | | | |
| | | | |
| | | | |
| | | | |
| | | | |
| | | | |
| | | | |
| | | | |
| | | | |
| | | | |
| | | | |
| | | | |
| | | | |
| | | | |
| | | | |
| | | | |
| | | | |
Additional sector, industry or geographic detail, if any, is included in the Portfolio of Investments.
For the six months ended April 30, 2023, the Fund did not have any transfers into/out of Level 3.
4.
TRANSACTIONS WITH AFFILIATES
Management fee
Allspring Funds Management, a wholly owned subsidiary of Allspring Global Investments Holdings, LLC, a holding company indirectly owned by certain private funds of GTCR LLC and Reverence Capital Partners, L.P., is the manager of the Fund and provides advisory and fund-level administrative services under an investment management agreement. Under the investment management agreement, Allspring Funds Management is responsible for, among other services, implementing the investment objectives and strategies of the Fund, supervising the subadviser and providing fund-level administrative services in connection with the Fund’s operations. As compensation for its services under the investment management agreement, Allspring Funds Management is entitled to receive a management fee at the following annual rate based on the Fund’s average daily net assets:
Prior to December 19, 2022, the predecessor fund paid an advisory fee at an annual rate of 1.10% of its average daily net assets.
32 | Allspring U.S. Long/Short Equity Fund
Notes to financial statements (unaudited)
For the six months ended April 30, 2023, the management fee was equivalent to an annual rate of 1.10% of the Fund’s average daily net assets.
Administration fees
Under a class-level administration agreement, Allspring Funds Management provides class-level administrative services to the Fund, which includes paying fees and expenses for services provided by the transfer agent, sub-transfer agents, omnibus account servicers and record-keepers. As compensation for its services under the class-level administration agreement, Allspring Funds Management receives an annual fee which is calculated based on the average daily net assets of each class as follows:
| Class-level
administration fee |
| |
| |
| |
| |
Waivers and/or expense reimbursements
Allspring Funds Management has contractually committed to waive and/or reimburse management and administration fees to the extent necessary to maintain certain net operating expense ratios for the Fund. When each class of the Fund has exceeded its expense cap, Allspring Funds Management will waive fees and/or reimburse expenses from fund-level expenses on a proportionate basis and then from class specific expenses. When only certain classes exceed their expense caps, waivers and/or reimbursements are applied against class specific expenses before fund-level expenses. Allspring Funds Management has contractually committed through February 28, 2025 to waive fees and/or reimburse expenses to the extent necessary to cap expenses. Prior to or after the commitment expiration date, the caps may be increased or the commitment to maintain the caps may be terminated only with the approval of the Board of Trustees. As of April 30, 2023, excluding expenses from dividends and interest expense on securities sold short, the contractual expense caps are as follows:
Prior to December 19, 2022, the predecessor fund’s expenses were capped at 1.39% for Class A shares and 1.39% for Institutional Class shares. These expense caps did not include dividends and interest expense on securities sold short or any class-level expenses.
Distribution fees
The Trust has adopted a distribution plan for Class C shares pursuant to Rule 12b-1 under the 1940 Act. A distribution fee is charged to Class C shares and paid to Allspring Funds Distributor, LLC (“Allspring Funds Distributor”), the principal underwriter, an affiliate of Allspring Funds Management, at an annual rate up to 0.75% of the average daily net assets of Class C shares. Prior to December 19, 2022, Investor Class shares of the predecessor fund were charged a fee at an annual rate up to 0.25% of its average daily net assets.
In addition, Allspring Funds Distributor is entitled to receive the front-end sales charge from the purchase of Class A shares and a contingent deferred sales charge on the redemption of certain Class A shares. Allspring Funds Distributor is also entitled to receive the contingent deferred sales charges from redemptions of Class C shares. Allspring Funds Distributor did not receive any front-end or contingent deferred sales charges from Class A or Class C shares for the six months ended April 30, 2023.
Shareholder servicing fees
The Trust has entered into contracts with one or more shareholder servicing agents, whereby Class A and Class C are charged a fee at an annual rate up to 0.25% of the average daily net assets of each respective class. Prior to December 19, 2022, Investor Class and Class I shares of the predecessor fund were each charged a fee at an annual rate up to 0.15% of its average daily net assets. A portion of these total shareholder servicing fees were paid to affiliates of the Fund.
Interfund transactions
The Fund may purchase or sell portfolio investment securities to certain affiliates pursuant to Rule 17a-7 under the 1940 Act and under procedures adopted by the Board of Trustees. The procedures have been designed to ensure that these interfund transactions, which do not incur broker commissions, are effected at current market prices.
Allspring U.S. Long/Short Equity Fund | 33
Notes to financial statements (unaudited)
5.
INVESTMENT PORTFOLIO TRANSACTIONS
Purchases and sales of investments, excluding U.S. government obligations (if any) and short-term securities, for the six months ended April 30, 2023 were $31,480,218 and $19,094,487, respectively.
In an agreement with a prime broker, the Fund purchased or borrowed securities on margin and was charged interest based on a borrowing rate equal to the Federal Funds rate plus a spread. During the six months ended April 30, 2023, the Fund had average borrowings outstanding of $682,271 (on an annualized basis) at a rate of 5.20% and recorded interest in the amount of $17,370, which represents 0.50% of its average daily net assets (on an annualized basis).
The Trust (excluding the money market funds), Allspring Master Trust and Allspring Variable Trust are parties to a $350,000,000 revolving credit agreement whereby the Fund is permitted to use bank borrowings for temporary or emergency purposes, such as to fund shareholder redemption requests. Interest under the credit agreement is charged to the Fund based on borrowing rate equal to the higher of the Federal Funds rate or the overnight bank funding rate in effect on that day plus a spread. In addition, an annual commitment fee based on the unused balance is allocated to each participating fund.
For the six months ended April 30, 2023, there were no borrowings by the Fund under the agreement.
Under the Fund’s organizational documents, the officers and Trustees have been granted certain indemnification rights against certain liabilities that may arise out of performance of their duties to the Fund. The Fund has entered into a separate agreement with each Trustee that converts indemnification rights currently existing under the Fund’s organizational documents into contractual rights that cannot be changed in the future without the consent of the Trustee. Additionally, in the normal course of business, the Fund may enter into contracts with service providers that contain a variety of indemnification clauses. The Fund’s maximum exposure under these arrangements is dependent on future claims that may be made against the Fund and, therefore, cannot be estimated.
34 | Allspring U.S. Long/Short Equity Fund
Other information (unaudited)
Other information
Proxy voting information
A description of the policies and procedures used to determine how to vote proxies relating to portfolio securities is available without charge, upon request, by calling 1-800-222-8222, visiting our website at allspringglobal.com, or visiting the SEC website at sec.gov. Information regarding how the proxies related to portfolio securities were voted during the most recent 12-month period ended June 30 is available on the website at allspringglobal.com or by visiting the SEC website at sec.gov.
Quarterly portfolio holdings information
The Fund files its complete schedule of portfolio holdings with the SEC for the first and third quarters of each fiscal year as an exhibit to its reports on Form N-PORT. Shareholders may view the filed Form N-PORT by visiting the SEC website at sec.gov.
Allspring U.S. Long/Short Equity Fund | 35
Other information (unaudited)
BOARD OF TRUSTEES AND OFFICERS
Each of the Trustees and Officers listed in the table below acts in identical capacities for each fund in the Allspring family of funds, which consists of 127 mutual funds comprising the Allspring Funds Trust, Allspring Variable Trust, Allspring Master Trust and four closed-end funds (collectively the “Fund Complex”). This table should be read in conjunction with the Prospectus and the Statement of Additional Information1. The mailing address of each Trustee and Officer is 1415 Vantage Park Drive, 3rd Floor, Charlotte, NC 28203. Each Trustee and Officer serves an indefinite term, however, each Trustee serves such term until reaching the mandatory retirement age established by the Trustees.
Independent Trustees
| | Principal occupations during past five years or longer | Current other
public company or
investment
company
directorships |
William R. Ebsworth
(Born 1957) | | Retired. From 1984 to 2013, equities analyst, portfolio manager, research director and chief investment officer at Fidelity Management and Research Company in Boston, Tokyo, and Hong Kong, and retired in 2013 as Chief Investment Officer of Fidelity Strategic Advisers, Inc. where he led a team of investment professionals managing client assets. Prior thereto, Board member of Hong Kong Securities Clearing Co., Hong Kong Options Clearing Corp., the Thailand International Fund, Ltd., Fidelity Investments Life Insurance Company, and Empire Fidelity Investments Life Insurance Company. Audit Committee Chair and Investment Committee Chair of the Vincent Memorial Hospital Foundation (non-profit organization). Mr. Ebsworth is a CFA charterholder. | |
Jane A. Freeman
(Born 1953) | Trustee,
since 2015;
Chair Liaison,
since 2018 | Retired. From 2012 to 2014 and 1999 to 2008, Chief Financial Officer of Scientific Learning Corporation. From 2008 to 2012, Ms. Freeman provided consulting services related to strategic business projects. Prior to 1999, Portfolio Manager at Rockefeller & Co. and Scudder, Stevens & Clark. Board member of the Harding Loevner Funds from 1996 to 2014, serving as both Lead Independent Director and chair of the Audit Committee. Board member of the Russell Exchange Traded Funds Trust from 2011 to 2012 and the chair of the Audit Committee. Ms. Freeman is also an inactive Chartered Financial Analyst. | |
Isaiah Harris, Jr.
(Born 1952) | Trustee,
since 2009;
Audit Committee Chair,
since 2019 | Retired. Member of the Advisory Board of CEF of East Central Florida. Chairman of the Board of CIGNA Corporation from 2009 to 2021, and Director from 2005 to 2008. From 2003 to 2011, Director of Deluxe Corporation. Prior thereto, President and CEO of BellSouth Advertising and Publishing Corp. from 2005 to 2007, President and CEO of BellSouth Enterprises from 2004 to 2005 and President of BellSouth Consumer Services from 2000 to 2003. Emeritus member of the Iowa State University Foundation Board of Governors. Emeritus Member of the Advisory Board of Iowa State University School of Business. Advisory Board Member, Palm Harbor Academy (private school). Advisory Board Member, Fellowship of Christian Athletes. Mr. Harris is a certified public accountant (inactive status). | |
David F. Larcker
(Born 1950) | | Distinguished Visiting Fellow at the Hoover Institution since 2022. James Irvin Miller Professor of Accounting at the Graduate School of Business (Emeritus), Stanford University, Director of the Corporate Governance Research Initiative and Senior Faculty of The Rock Center for Corporate Governance since 2006. From 2005 to 2008, Professor of Accounting at the Graduate School of Business, Stanford University. Prior thereto, Ernst & Young Professor of Accounting at The Wharton School, University of Pennsylvania from 1985 to 2005. | |
Olivia S. Mitchell
(Born 1953) | Trustee,
since 2006;
Nominating and Governance Committee Chair,
since 2018 | International Foundation of Employee Benefit Plans Professor since 1993, Wharton School of the University of Pennsylvania. Director of Wharton’s Pension Research Council and Boettner Center on Pensions & Retirement Research, and Research Associate at the National Bureau of Economic Research. Previously taught at Cornell University from 1978 to 1993. | |
Timothy J. Penny
(Born 1951) | Trustee,
since 1996;
Chair,
since 2018 | President and Chief Executive Officer of Southern Minnesota Initiative Foundation, a non-profit organization, since 2007. Vice Chair of the Economic Club of Minnesota, since 2007. Co-Chair of the Committee for a Responsible Federal Budget, since 1995. Member of the Board of Trustees of NorthStar Education Finance, Inc., a non-profit organization, from 2007-2022. Senior Fellow of the University of Minnesota Humphrey Institute from 1995 to 2017. | |
1
The Statement of Additional Information includes additional information about the Trustees and is available, without charge, upon request, by calling 1-800-222-8222 or by visiting the website at allspringglobal.com.
36 | Allspring U.S. Long/Short Equity Fund
Other information (unaudited)
| Position held and length of service* | Principal occupations during past five years or longer | Current other public company or investment company directorships |
James G. Polisson
(Born 1959) | | Retired. Chief Marketing Officer, Source (ETF) UK Services, Ltd, from 2015 to 2017. From 2012 to 2015, Principal of The Polisson Group, LLC, a management consulting, corporate advisory and principal investing company. Chief Executive Officer and Managing Director at Russell Investments, Global Exchange Traded Funds from 2010 to 2012. Managing Director of Barclays Global Investors from 1998 to 2010 and Global Chief Marketing Officer for iShares and Barclays Global Investors from 2000 to 2010. Trustee of the San Francisco Mechanics’ Institute, a non- profit organization, from 2013 to 2015. Board member of the Russell Exchange Traded Fund Trust from 2011 to 2012. Director of Barclays Global Investors Holdings Deutschland GmbH from 2006 to 2009. Mr. Polisson is an attorney and has a retired status with the Massachusetts and District of Columbia Bar Associations. | |
Pamela Wheelock
(Born 1959) | Trustee,
since January 2020;
previously Trustee from
January 2018 to
July 2019 | Retired. Executive and Senior Financial leadership positions in the public, private and nonprofit sectors. Interim President and CEO, McKnight Foundation, 2020. Interim Commissioner, Minnesota Department of Human Services, 2019. Chief Operating Officer, Twin Cities Habitat for Humanity, 2017-2019. Vice President for University Services, University of Minnesota, 2012- 2016. Interim President and CEO, Blue Cross and Blue Shield of Minnesota, 2011-2012. Executive Vice-President and Chief Financial Officer, Minnesota Wild, 2002-2008. Commissioner, Minnesota Department of Finance, 1999-2002. Chair of the Board of Directors of Destination Medical Center Corporation. Board member of the Minnesota Wild Foundation. | |
| Length of service dates reflect the Trustee’s commencement of service with the Trust’s predecessor entities, where applicable. |
Allspring U.S. Long/Short Equity Fund | 37
Other information (unaudited)
Officers1
| Position held and
length of service | Principal occupations during past five years or longer |
| | President and Chief Executive Officer of Allspring Funds Management, LLC since 2017 and Head of Global Fund Governance of Allspring Global Investments since 2022. Prior thereto, co-president of Galliard Capital Management, LLC, an affiliate of Allspring Funds Management, LLC, from 2019 to 2022 and Head of Affiliated Managers, Allspring Global Investments, from 2014 to 2019 and Executive Vice President responsible for marketing, investments and product development for Allspring Funds Management, LLC, from 2009 to 2014. |
Jeremy DePalma
(Born 1974) | Treasurer,
since 2012
(for certain funds in
the Fund Complex);
since 2021 (for
the remaining funds in the Fund Complex) | Senior Vice President of Allspring Funds Management, LLC since 2009. Senior Vice President of Evergreen Investment Management Company, LLC from 2008 to 2010 and head of the Fund Reporting and Control Team within Fund Administration from 2005 to 2010. |
Christopher Baker
(Born 1976) | Chief Compliance Officer,
since 2022 | Global Chief Compliance Officer for Allspring Global Investments since 2022. Prior thereto, Chief Compliance Officer for State Street Global Advisors from 2018 to 2021. Senior Compliance Officer for the State Street divisions of Alternative Investment Solutions, Sector Solutions, and Global Marketing from 2015 to 2018. From 2010 to 2015 Vice President, Global Head of Investment and Marketing Compliance for State Street Global Advisors. |
Matthew Prasse
(Born 1983) | Chief Legal Officer,
since 2022;
Secretary,
since 2021 | Senior Counsel of the Allspring Legal Department since 2021. Senior Counsel of the Wells Fargo Legal Department from 2018 to 2021. Previously, Counsel for Barings LLC from 2015 to 2018. Prior to joining Barings, Associate at Morgan, Lewis & Bockius LLP from 2008 to 2015. |
1 For those Officers with tenures at Allspring Global Investments and/or Allspring Funds Management, LLC that began prior to 2021, such tenures include years of service during which these businesses/entities were known as Wells Fargo Asset Management and Wells Fargo Funds Management, LLC, respectively.
38 | Allspring U.S. Long/Short Equity Fund
This page is intentionally left blank.
This page is intentionally left blank.
For more information
More information about Allspring Funds is available free upon request. To obtain literature, please write, visit the Fund’s website, or call:
Allspring Funds
P.O. Box 219967
Kansas City, MO 64121-9967
Website: allspringglobal.com
Individual investors: 1-800-222-8222
Retail investment professionals: 1-888-877-9275
Institutional investment professionals: 1-800-260-5969
This report and the financial statements contained herein are submitted for the general information of the shareholders of the Fund. If this report is used for promotional purposes, distribution of the report must be accompanied or preceded by a current prospectus. Before investing, please consider the investment objectives, risks, charges, and expenses of the investment. For a current prospectus and, if available, a summary prospectus, containing this information, call 1-800-222-8222 or visit the Fund’s website at allspringglobal.com. Read the prospectus carefully before you invest or send money.
Allspring Global InvestmentsTM is the trade name for the asset management firms of Allspring Global Investments Holdings, LLC, a holding company indirectly owned by certain private funds of GTCR LLC and Reverence Capital Partners, L.P. These firms include but are not limited to Allspring Global Investments, LLC, and Allspring Funds Management, LLC. Certain products managed by Allspring entities are distributed by Allspring Funds Distributor, LLC (a broker-dealer and Member FINRA/SIPC).
This material is for general informational and educational purposes only and is NOT intended to provide investment advice or a recommendation of any kind - including a recommendation for any specific investment, strategy, or plan.
© 2023 Allspring Global Investments Holdings, LLC. All rights reserved.
ALL-05052023-fcgxxvi2 06-23
SAR4341 04-23
ITEM 2. CODE OF ETHICS
Not applicable.
ITEM 3. AUDIT COMMITTEE FINANCIAL EXPERT
Not applicable.
ITEM 4. PRINCIPAL ACCOUNTANT FEES AND SERVICES
Not applicable.
ITEM 5. AUDIT COMMITTEE OF LISTED REGISTRANTS
Not applicable.
ITEM 6. INVESTMENTS
A Portfolio of Investments for the series of Allspring Funds Trust is included as part of the report to shareholders filed under Item 1 of this Form.
ITEM 7. DISCLOSURE OF PROXY VOTING POLICIES AND PROCEDURES FOR CLOSED-END MANAGEMENT INVESTMENT COMPANIES
Not applicable.
ITEM 8. PORTFOLIO MANAGERS OF CLOSED-END MANAGEMENT INVESTMENT COMPANIES
Not applicable.
ITEM 9. PURCHASES OF EQUITY SECURITIES BY CLOSED-END MANAGEMEENT INVESTMENT COMPANY AND AFFILIATED PURCHASERS
Not applicable.
ITEM 10. SUBMISSION OF MATTERS TO A VOTE OF SECURITY HOLDERS
There have been no material changes to the procedures by which shareholders may recommend nominees to the registrant’s Board of Trustees that have been implemented since the registrant’s last provided disclosure in response to the requirements of this Item.
ITEM 11. CONTROLS AND PROCEDURES
(a) The President and Treasurer have concluded that the Allspring Funds Trust disclosure controls and procedures (as defined in Rule 30a-3(c) under the Investment Company Act of 1940) provide reasonable assurances that material information relating to the registrant is made known to them by the appropriate persons, based on their evaluation of these controls and procedures as of a date within 90 days of the filing of this report.
(b) There were no significant changes in the registrant’s internal controls over financial reporting (as defined in Rule 30a-3(d) under the Investment Company Act of 1940) that occurred during the most recent fiscal half-year of the period covered by this report that materially affected, or is reasonably likely to materially affect, the registrant’s internal control over financial reporting.
ITEM 12. DISCLOSURES OF SECURITIES LENDING ACTIVITES FOR CLOSED-END MANAGEMENT INVESTMENT COMPANIES
Not applicable.
ITEM 13. EXHIBITS
(a)(1) Not applicable.
(a)(2) Certifications pursuant to Section 302 of the Sarbanes-Oxley Act of 2002.
(a)(3) Not applicable.
(a)(4) Not applicable.
(b) Certifications pursuant to Section 906 of the Sarbanes-Oxley Act of 2002.
SIGNATURES
Pursuant to the requirements of the Securities Exchange Act of 1934 and the Investment Company Act of 1940, the registrant has duly caused this report to be signed on its behalf by the undersigned, thereunto duly authorized.
| | |
| Allspring Funds Trust |
| |
| By: | | /s/ Andrew Owen |
| | Andrew Owen |
| | President |
|
| Date: June 27, 2023 |
Pursuant to the requirements of the Securities Exchange Act of 1934 and the Investment Company Act of 1940, this report has been signed below by the following persons on behalf of the registrant and in the capacities and on the date indicated.
| | |
| Allspring Funds Trust |
| |
| By: | | /s/ Andrew Owen |
| | Andrew Owen |
| | President |
|
| Date: June 27, 2023 |
| |
| By: | | /s/ Jeremy DePalma |
| | Jeremy DePalma |
| | Treasurer |
|
| Date: June 27, 2023 |