UNITED STATES
SECURITIES AND EXCHANGE COMMISSION
Washington, D.C. 20549
FORM N-CSRS
CERTIFIED SHAREHOLDER REPORT OF REGISTERED
MANAGEMENT INVESTMENT COMPANIES
Investment Company Act file number: 811-09253
Allspring Funds Trust
(Exact name of registrant as specified in charter)
1415 Vantage Park Drive, 3rd Floor, Charlotte, NC 28203
(Address of principal executive offices) (Zip code)
Matthew Prasse
Allspring Funds Management, LLC
1415 Vantage Park Drive, 3rd Floor, Charlotte, NC 28203
(Address of principal executive offices) (Zip code)
Registrant’s telephone number, including area code: 800-222-8222
Date of fiscal year end: August 31
Registrant is making a filing for 10 of its series:
Allspring Managed Account CoreBuilder® Shares - Series CP, Allspring Adjustable Rate Government Fund, Allspring Conservative Income Fund, Allspring Government Securities Fund, Allspring High Yield Bond Fund, Allspring Core Plus Bond Fund, Allspring Short Duration Government Bond Fund, Allspring Short-Term Bond Plus Fund, Allspring Short-Term High Income Fund, and Allspring Ultra Short-Term Income Fund.
Date of reporting period: February 28, 2023
ITEM 1. REPORT TO STOCKHOLDERS
===============================================
Semi-Annual Report
February 28, 2023
Allspring
Adjustable Rate Government Fund
The views expressed and any forward-looking statements are as of February 28, 2023, unless otherwise noted, and are those of the Fund's portfolio managers and/or Allspring Global Investments. Discussions of individual securities or the markets generally are not intended as individual recommendations. Future events or results may vary significantly from those expressed in any forward-looking statements. The views expressed are subject to change at any time in response to changing circumstances in the market. Allspring Global Investments disclaims any obligation to publicly update or revise any views expressed or forward-looking statements.
Letter to shareholders (unaudited)
Andrew Owen
President
Allspring Funds
Dear Shareholder:
We are pleased to offer you this semi-annual report for the Allspring Adjustable Rate Government Fund for the six-month period that ended February 28, 2023. Globally, stocks and bonds experienced heightened volatility through the challenging period. Earlier tailwinds provided by global stimulus programs, vaccination rollouts, and recovering consumer and corporate sentiment were wiped away by the highest rate of inflation in four decades as well as the impact of ongoing aggressive central bank rate hikes and the prospect of more rate hikes. Compounding these concerns were the global reverberations of the Russia-Ukraine war and the impact of China’s strict COVID-19 lockdowns.
For the six-month period, stocks and bonds had mixed results, with non-U.S. equities––both developed market and emerging market––outperforming U.S. stocks overall. Bonds––both U.S. and non-U.S.––began to recover from sustained aggressive interest rate increases. After suffering deep and broad losses over the past year, recent fixed income performance benefited from a base of higher yields that can now generate higher income. For the period, U.S. stocks, based on the S&P 500 Index,1 returned 1.26%. International stocks, as measured by the MSCI ACWI ex USA Index (Net),2 returned 7.30%, while the MSCI EM Index (Net) (USD)3 lost 2.29%. Among bond indexes, the Bloomberg U.S. Aggregate Bond Index4 returned -2.13%, the Bloomberg Global Aggregate ex-USD Index (unhedged)5 returned -0.11%, the Bloomberg Municipal Bond Index6 gained 0.66%, and the ICE BofA U.S. High Yield Index7 returned 2.41%.
The Russia-Ukraine war, high inflation, and central bank rate hikes rocked markets
A challenging calendar year for investors continued in September as all asset classes suffered major losses. Central banks kept up their battle against rapidly rising prices with more rate hikes. The strength of the U.S. dollar weighed on results for investors holding non-U.S.-dollar assets. U.S. mortgage rates jumped to near 7% on 30-year fixed-rate mortgages; the decreased housing affordability began to cool demand somewhat. The U.K. experienced a sharp sell-off of government bonds and the British pound in September as investors panicked in response to a new government budget that was seen as financially unsound. The Bank of England (BoE) then stepped in and bought long-dated government bonds.
“ A challenging calendar year for investors continued in September as all asset classes suffered major losses.”
| 1 | The S&P 500 Index consists of 500 stocks chosen for market size, liquidity, and industry group representation. It is a market-value-weighted index with each stock's weight in the index proportionate to its market value. You cannot invest directly in an index. |
| 2 | The Morgan Stanley Capital International (MSCI) All Country World Index (ACWI) ex USA Index (Net) is a free-float-adjusted market-capitalization-weighted index that is designed to measure the equity market performance of developed and emerging markets, excluding the U.S. Source: MSCI. MSCI makes no express or implied warranties or representations and shall have no liability whatsoever with respect to any MSCI data contained herein. The MSCI data may not be further redistributed or used as a basis for other indexes or any securities or financial products. This report is not approved, reviewed, or produced by MSCI. You cannot invest directly in an index. |
| 3 | The MSCI Emerging Markets (EM) Index (Net) (USD) is a free-float-adjusted market-capitalization-weighted index that is designed to measure equity market performance of emerging markets. You cannot invest directly in an index. |
| 4 | The Bloomberg U.S. Aggregate Bond Index is a broad-based benchmark that measures the investment-grade, U.S.-dollar-denominated, fixed-rate taxable bond market, including Treasuries, government-related and corporate securities, mortgage-backed securities (agency fixed-rate and hybrid adjustable-rate mortgage pass-throughs), asset-backed securities, and commercial mortgage-backed securities. You cannot invest directly in an index. |
| 5 | The Bloomberg Global Aggregate ex-USD Index (unhedged) is an unmanaged index that provides a broad-based measure of the global investment-grade fixed-income markets excluding the U.S.-dollar-denominated debt market. You cannot invest directly in an index. |
| 6 | The Bloomberg Municipal Bond Index is an unmanaged index composed of long-term tax-exempt bonds with a minimum credit rating of Baa. You cannot invest directly in an index. |
| 7 | The ICE BofA U.S. High Yield Index is a market-capitalization-weighted index of domestic and Yankee high-yield bonds. The index tracks the performance of high-yield securities traded in the U.S. bond market. You cannot invest directly in an index. Copyright 2023. ICE Data Indices, LLC. All rights reserved. |
2 | Allspring Adjustable Rate Government Fund
Letter to shareholders (unaudited)
Equities had a reprieve in October. Value stocks and small caps fared best. Globally, developed markets outpaced emerging market equities, which were hurt by weakness among Chinese stocks. Central banks continued to try to curtail high inflation with aggressive interest rate hikes. Geopolitical risks persisted, including the ongoing Russia-Ukraine war and economic, financial market, and political turmoil in the U.K. Concerns over Europe’s energy crisis eased thanks to unseasonably warm weather and plentiful gas on hand. The U.S. labor market continued its resilience against rising prices as unemployment remained near a record low.
Stocks and bonds rallied in November. Economic news was encouraging, driven by U.S. labor market strength. Although central banks kept raising rates, hopes rose for an easing in the pace of rate hikes and a possible end to central bank monetary tightening in 2023. Although inflation remained at record highs in the eurozone, we began to see signs of a possible decline in inflationary pressures as U.S. inflation moderated, with a 7.1% annual price rise in November and a monthly price increase of just 0.1%. China’s economic data remained weak, reflecting its zero-COVID-19 policy.
Financial markets cooled in December, with U.S. equities posting negative overall results in response to a weakening U.S. dollar. Fixed income securities ended one of their worst years ever with flat overall monthly returns as markets weighed the hopes for an end to the monetary tightening cycle with the reality that central banks had not completed their jobs yet. U.S. Consumer Price Index (CPI)1 data showed a strong consistent trend downward, which brought down the 12-month CPI to 6.5% in December from 9.1% in June. Other countries and regions reported still-high but declining inflation rates as the year winded down.
The year 2023 began with a rally across global equities and fixed income securities. Investor optimism rose in response to data indicating declining inflation rates and the reopening of China’s economy with the abrupt end to its zero-COVID-19 policy. The U.S. reported surprisingly strong job gains––employers added more than 500,000 jobs––and unemployment fell to 3.4%, the lowest level since 1969. Meanwhile, wage growth, seen as a potential contributor to ongoing high inflation, continued to moderate. All eyes remained fixed on the Federal Reserve (Fed) and on how many more rate hikes remain in this tightening cycle. The 0.25% federal funds rate hike announced in January was the Fed’s smallest rate increase since March 2022.
Financial markets declined in February as investors responded unfavorably to resilient economic data. The takeaway: Central banks will likely continue their monetary tightening cycle for longer than markets had priced in. In this environment—where strong economic data is seen as bad news—the resilient U.S. labor market was seen as a negative while the inflation rate has not been falling quickly enough for the Fed, which raised interest rates by 0.25% in early February. Meanwhile, the BoE and the European Central Bank both raised rates by 0.50%. At this stage in the economic cycle, the overriding question remained: “What will central banks do?” In February, the answer appeared to be: “Move rates higher for longer.”
| 1 | The Consumer Price Index (CPI) is a measure of the average change over time in the prices paid by urban consumers for a market basket of consumer goods and services. You cannot invest directly in an index. |
Allspring Adjustable Rate Government Fund | 3
Letter to shareholders (unaudited)
Don’t let short-term uncertainty derail long-term investment goals.
Periods of investment uncertainty can present challenges, but experience has taught us that maintaining long-term investment goals can be an effective way to plan for the future. To help you create a sound strategy based on your personal goals and risk tolerance, Allspring Funds offers more than 100 mutual funds spanning a wide range of asset classes and investment styles. Although diversification cannot guarantee an investment profit or prevent losses, we believe it can be an effective way to manage investment risk and potentially smooth out overall portfolio performance. We encourage investors to know their investments and to understand that appropriate levels of risk-taking may unlock opportunities.
Thank you for choosing to invest with Allspring Funds. We appreciate your confidence in us and remain committed to helping you meet your financial needs.
Sincerely,
Andrew Owen
President
Allspring Funds
For further information about your fund, contact your investment professional, visit our website at allspringglobal.com, or call us directly at 1-800-222-8222.
4 | Allspring Adjustable Rate Government Fund
This page is intentionally left blank.
Performance highlights (unaudited)
| Investment objective | The Fund seeks current income consistent with capital preservation. |
| Manager | Allspring Funds Management, LLC |
| Subadviser | Allspring Global Investments, LLC |
| Portfolio managers | Christopher Y. Kauffman, CFA®‡, Michal Stanczyk |
| Average annual total returns (%) as of February 28, 2023 |
| | | Including sales charge | | Excluding sales charge | | Expense ratios1 (%) |
| | Inception date | 1 year | 5 year | 10 year | | 1 year | 5 year | 10 year | | Gross | Net 2 |
| Class A (ESAAX) | 6-30-2000 | -1.16 | 0.86 | 0.57 | | 0.84 | 1.26 | 0.78 | | 0.82 | 0.74 |
| Class C (ESACX) | 6-30-2000 | -0.74 | 0.60 | 0.15 | | 0.26 | 0.60 | 0.15 | | 1.57 | 1.49 |
| Administrator Class (ESADX) | 7-30-2010 | – | – | – | | 0.98 | 1.38 | 0.92 | | 0.76 | 0.60 |
| Institutional Class (EKIZX) | 10-1-1991 | – | – | – | | 1.23 | 1.52 | 1.05 | | 0.49 | 0.46 |
| Bloomberg 6-Month Treasury Bill Index3 | – | – | – | – | | 2.03 | 1.47 | 0.97 | | – | – |
Figures quoted represent past performance, which is no guarantee of future results, and do not reflect taxes that a shareholder may pay on an investment in a fund. Investment return and principal value of an investment will fluctuate so that an investor’s shares, when redeemed, may be worth more or less than their original cost. Performance shown without sales charges would be lower if sales charges were reflected. Current performance may be lower or higher than the performance data quoted, which assumes the reinvestment of dividends and capital gains. Current month-end performance is available on the Fund’s website, allspringglobal.com.
Index returns do not include transaction costs associated with buying and selling securities, any mutual fund fees or expenses, or any taxes. It is not possible to invest directly in an index.
For Class A shares, the maximum front-end sales charge is 2.00%. For Class C shares, the maximum contingent deferred sales charge is 1.00%. Performance including a contingent deferred sales charge assumes the sales charge for the corresponding time period. Administrator Class and Institutional Class shares are sold without a front-end sales charge or contingent deferred sales charge.
| 1 | Reflects the expense ratios as stated in the most recent prospectuses. The expense ratios shown are subject to change and may differ from the annualized expense ratios shown in the financial highlights of this report. |
| 2 | The manager has contractually committed through December 31, 2023, to waive fees and/or reimburse expenses to the extent necessary to cap total annual fund operating expenses after fee waivers at 0.74% for Class A, 1.49% for Class C, 0.60% for Administrator Class, and 0.46% for Institutional Class. Brokerage commissions, stamp duty fees, interest, taxes, acquired fund fees and expenses (if any), and extraordinary expenses are excluded from the expense caps. Prior to or after the commitment expiration date, the caps may be increased or the commitment to maintain the caps may be terminated only with the approval of the Board of Trustees. Without these caps, the Fund’s returns would have been lower. The expense ratio paid by an investor is the net expense ratio (the total annual fund operating expenses after fee waivers) as stated in the prospectuses. |
| 3 | The Bloomberg 6-Month Treasury Bill Index tracks the performance and attributes of recently issued 6-Month U.S. Treasury bills. The index follows Bloomberg monthly rebalancing conventions. You cannot invest directly in an index. |
Bond values fluctuate in response to the financial condition of individual issuers, general market and economic conditions, and changes in interest rates. Changes in market conditions and government policies may lead to periods of heightened volatility in the bond market and reduced liquidity for certain bonds held by the Fund. In general, when interest rates rise, bond values fall and investors may lose principal value. Interest rate changes and their impact on the Fund and its share price can be sudden and unpredictable. The use of derivatives may reduce returns and/or increase volatility. Securities issued by U.S. government agencies or government-sponsored entities may not be guaranteed by the U.S. Treasury. Certain investment strategies tend to increase the total risk of an investment (relative to the broader market). This fund is exposed to mortgage- and asset-backed securities risk. The U.S. government guarantee applies to certain underlying securities and not to shares of the Fund. Consult the Fund’s prospectus for additional information on these and other risks.
| ‡ | CFA® and Chartered Financial Analyst® are trademarks owned by CFA Institute. |
6 | Allspring Adjustable Rate Government Fund
Performance highlights (unaudited)
| Ten largest holdings (%) as of February 28, 20231 |
| FHLMC Series 350 Class F2, 3.34%, 9-15-2040 | 1.58 |
| FRESB Mortgage Trust Series 2022-SB94 Class A5H, 1.72%, 11-25-2041 | 1.56 |
| FHLMC, 3.82%, 9-1-2036 | 1.55 |
| FHLMC, 4.05%, 7-1-2038 | 1.53 |
| FNMA Series 2017-M9 Class F, 5.10%, 5-25-2029 | 1.31 |
| FNMA Series 2016-40 Class AF, 3.71%, 7-25-2046 | 1.20 |
| FHLMC Series 4915 Class FE, 3.83%, 2-15-2038 | 1.09 |
| FNMA Series 2002-66 Class A3, 3.97%, 4-25-2042 | 1.07 |
| FNMA Series 2021-85 Class EF, 4.23%, 12-25-2051 | 1.06 |
| Navient Student Loan Trust Series 2018-4A Class A2, 5.30%, 6-27-2067 | 1.02 |
| 1 | Figures represent the percentage of the Fund's net assets. Holdings are subject to change and may have changed since the date specified. |
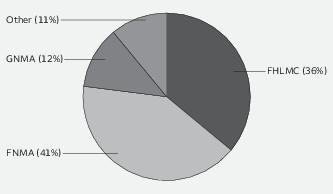
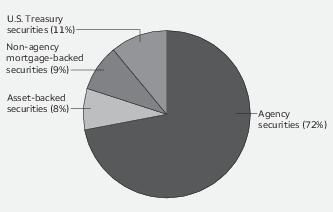
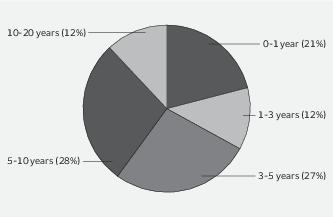
| Portfolio composition as of February 28, 20231 |
| 1 | Figures represent the percentage of the Fund's long-term investments. Allocations are subject to change and may have changed since the date specified. |
Allspring Adjustable Rate Government Fund | 7
Fund expenses (unaudited)
As a shareholder of the Fund, you incur two types of costs: (1) transaction costs, including sales charges (loads) on purchase payments and contingent deferred sales charges (if any) on redemptions and (2) ongoing costs, including management fees, distribution (12b-1) and/or shareholder servicing fees, and other Fund expenses. This example is intended to help you understand your ongoing costs (in dollars) of investing in the Fund and to compare these costs with the ongoing costs of investing in other mutual funds.
The example is based on an investment of $1,000 invested at the beginning of the six-month period and held for the entire period from September 1, 2022 to February 28, 2023.
Actual expenses
The “Actual” line of the table below provides information about actual account values and actual expenses. You may use the information in this line, together with the amount you invested, to estimate the expenses that you paid over the period. Simply divide your account value by $1,000 (for example, an $8,600 account value divided by $1,000 = 8.6), then multiply the result by the number in the “Actual” line under the heading entitled “Expenses paid during period” for your applicable class of shares to estimate the expenses you paid on your account during this period.
Hypothetical example for comparison purposes
The “Hypothetical” line of the table below provides information about hypothetical account values and hypothetical expenses based on the Fund’s actual expense ratio and an assumed rate of return of 5% per year before expenses, which is not the Fund’s actual return. The hypothetical account values and expenses may not be used to estimate the actual ending account balance or expenses you paid for the period. You may use this information to compare the ongoing costs of investing in the Fund and other funds. To do so, compare this 5% hypothetical example with the 5% hypothetical examples that appear in the shareholder reports of the other funds.
Please note that the expenses shown in the table are meant to highlight your ongoing costs only and do not reflect any transactional costs, such as sales charges (loads) and contingent deferred sales charges. Therefore, the “Hypothetical” line of the table is useful in comparing ongoing costs only, and will not help you determine the relative total costs of owning different funds. In addition, if these transactional costs were included, your costs would have been higher.
| | Beginning
account value
9-1-2022 | Ending
account value
2-28-2023 | Expenses
paid during
the period1 | Annualized net
expense ratio |
| Class A | | | | |
| Actual | $1,000.00 | $1,014.70 | $3.70 | 0.74% |
| Hypothetical (5% return before expenses) | $1,000.00 | $1,021.12 | $3.71 | 0.74% |
| Class C | | | | |
| Actual | $1,000.00 | $1,010.95 | $7.43 | 1.49% |
| Hypothetical (5% return before expenses) | $1,000.00 | $1,017.41 | $7.45 | 1.49% |
| Administrator Class | | | | |
| Actual | $1,000.00 | $1,015.41 | $3.00 | 0.60% |
| Hypothetical (5% return before expenses) | $1,000.00 | $1,021.82 | $3.01 | 0.60% |
| Institutional Class | | | | |
| Actual | $1,000.00 | $1,017.26 | $2.30 | 0.46% |
| Hypothetical (5% return before expenses) | $1,000.00 | $1,022.51 | $2.31 | 0.46% |
1 Expenses paid is equal to the annualized net expense ratio of each class multiplied by the average account value over the period, multiplied by 181 divided by 365 (to reflect the one-half-year period).
8 | Allspring Adjustable Rate Government Fund
Portfolio of investments—February 28, 2023 (unaudited)
| | | Interest
rate | Maturity
date | Principal | Value |
| Agency securities: 88.02% | | | | | |
| FHLMC (12 Month LIBOR +1.67%) ± | | 2.17% | 8-1-2035 | $ 111,954 | $ 109,441 |
| FHLMC (12 Month LIBOR +1.81%) ± | | 2.43 | 4-1-2035 | 457,543 | 450,876 |
| FHLMC (1 Year Treasury Constant Maturity +0.85%) ± | | 2.46 | 4-1-2030 | 10,769 | 10,532 |
| FHLMC (12 Month Treasury Average +1.90%) ± | | 2.51 | 5-1-2028 | 65,812 | 64,333 |
| FHLMC (2 Year Treasury Constant Maturity +2.44%) ± | | 2.57 | 8-1-2029 | 2,807 | 2,777 |
| FHLMC (11th District COFI +1.25%) ± | | 2.60 | 1-1-2030 | 1,508 | 1,456 |
| FHLMC (11th District COFI +1.25%) ± | | 2.60 | 1-1-2030 | 351 | 339 |
| FHLMC (11th District COFI +1.25%) ± | | 2.60 | 7-1-2030 | 76,078 | 73,341 |
| FHLMC (3 Year Treasury Constant Maturity +2.44%) ± | | 2.61 | 5-1-2032 | 67,382 | 66,273 |
| FHLMC (12 Month LIBOR +1.86%) ± | | 2.61 | 4-1-2037 | 130,112 | 128,442 |
| FHLMC (1 Year Treasury Constant Maturity +0.00%) | | 2.63 | 4-1-2023 | 1,856 | 1,843 |
| FHLMC (12 Month LIBOR +1.91%) ± | | 2.64 | 3-1-2032 | 104,036 | 101,909 |
| FHLMC (12 Month LIBOR +1.64%) ± | | 2.64 | 6-1-2050 | 2,544,408 | 2,302,787 |
| FHLMC (12 Month LIBOR +2.06%) ± | | 2.72 | 3-1-2038 | 465,167 | 472,671 |
| FHLMC (1 Year Treasury Constant Maturity +2.48%) ± | | 2.73 | 10-1-2024 | 11,048 | 10,926 |
| FHLMC (1 Year Treasury Constant Maturity +2.48%) ± | | 2.73 | 2-1-2030 | 19,842 | 19,530 |
| FHLMC (1 Year Treasury Constant Maturity +2.44%) ± | | 2.82 | 4-1-2029 | 16,502 | 16,134 |
| FHLMC (1 Year Treasury Constant Maturity +2.23%) ± | | 2.82 | 4-1-2034 | 74,977 | 73,359 |
| FHLMC (11th District COFI +1.28%) ± | | 2.86 | 2-1-2035 | 22,726 | 22,376 |
| FHLMC (1 Year Treasury Constant Maturity +2.52%) ± | | 2.87 | 11-1-2029 | 41,156 | 39,473 |
| FHLMC (12 Month LIBOR +1.62%) ± | | 2.88 | 11-1-2047 | 2,395,968 | 2,295,229 |
| FHLMC (12 Month LIBOR +1.75%) ± | | 2.91 | 5-1-2033 | 45,917 | 44,858 |
| FHLMC (1 Year Treasury Constant Maturity +2.03%) ± | | 2.92 | 3-1-2025 | 6,321 | 6,187 |
| FHLMC (1 Year Treasury Constant Maturity +2.48%) ± | | 2.93 | 6-1-2030 | 52,395 | 50,988 |
| FHLMC (1 Year Treasury Constant Maturity +2.44%) ± | | 2.93 | 4-1-2034 | 79,776 | 77,604 |
| FHLMC (1 Year Treasury Constant Maturity +2.29%) ± | | 2.94 | 9-1-2033 | 138,614 | 135,688 |
| FHLMC (1 Year Treasury Constant Maturity +2.61%) ± | | 2.99 | 9-1-2030 | 25,060 | 23,876 |
| FHLMC (12 Month Treasury Average +2.46%) ± | | 3.02 | 10-1-2029 | 53,784 | 52,749 |
| FHLMC (12 Month LIBOR +1.75%) ± | | 3.02 | 4-1-2035 | 77,220 | 76,161 |
| FHLMC (1 Year Treasury Constant Maturity +2.25%) ± | | 3.10 | 4-1-2038 | 314,310 | 317,470 |
| FHLMC (1 Year Treasury Constant Maturity +2.24%) ± | | 3.15 | 8-1-2027 | 2,396 | 2,350 |
| FHLMC (12 Month LIBOR +1.73%) ± | | 3.16 | 5-1-2037 | 487,806 | 490,871 |
| FHLMC (12 Month LIBOR +1.83%) ± | | 3.21 | 4-1-2037 | 44,568 | 43,977 |
| FHLMC (1 Year Treasury Constant Maturity +2.23%) ± | | 3.23 | 4-1-2034 | 59,694 | 58,920 |
| FHLMC (1 Year Treasury Constant Maturity +2.17%) ± | | 3.23 | 5-1-2037 | 19,980 | 19,782 |
| FHLMC (1 Year Treasury Constant Maturity +2.24%) ± | | 3.24 | 3-1-2027 | 20,707 | 20,388 |
| FHLMC (1 Year Treasury Constant Maturity +2.25%) ± | | 3.25 | 5-1-2034 | 100,336 | 99,035 |
| FHLMC (12 Month LIBOR +1.62%) ± | | 3.25 | 7-1-2045 | 486,057 | 487,314 |
| FHLMC (1 Year Treasury Constant Maturity +2.36%) ± | | 3.36 | 4-1-2038 | 586,182 | 580,939 |
| FHLMC (12 Month LIBOR +1.87%) ± | | 3.37 | 5-1-2035 | 18,171 | 17,847 |
| FHLMC (12 Month LIBOR +1.77%) ± | | 3.40 | 10-1-2036 | 155,260 | 157,225 |
| FHLMC (11th District COFI +2.57%) ± | | 3.43 | 12-1-2025 | 36,435 | 36,015 |
| FHLMC (1 Year Treasury Constant Maturity +2.40%) ± | | 3.46 | 7-1-2029 | 16,055 | 15,844 |
| FHLMC (6 Month LIBOR +1.68%) ± | | 3.49 | 1-1-2037 | 390,536 | 391,252 |
| FHLMC (1 Year Treasury Constant Maturity +2.33%) ± | | 3.51 | 7-1-2031 | 66,107 | 64,233 |
| FHLMC (1 Year Treasury Constant Maturity +1.87%) ± | | 3.51 | 5-1-2035 | 223,210 | 219,002 |
| FHLMC (1 Year Treasury Constant Maturity +2.40%) ± | | 3.53 | 11-1-2029 | 52,347 | 51,338 |
| FHLMC (12 Month LIBOR +1.80%) ± | | 3.56 | 8-1-2037 | 683,736 | 691,339 |
| FHLMC (5 Year Treasury Constant Maturity +2.44%) ± | | 3.57 | 8-1-2027 | 17,947 | 17,360 |
| FHLMC (12 Month LIBOR +1.77%) ± | | 3.59 | 10-1-2035 | 378,595 | 374,235 |
| FHLMC (1 Year Treasury Constant Maturity +2.60%) ± | | 3.60 | 6-1-2032 | 117,156 | 115,624 |
| FHLMC (1 Year Treasury Constant Maturity +2.49%) ± | | 3.61 | 6-1-2035 | 141,785 | 139,968 |
| FHLMC (1 Year Treasury Constant Maturity +2.26%) ± | | 3.62 | 2-1-2036 | 2,032,659 | 2,055,539 |
| FHLMC (3 Year Treasury Constant Maturity +2.83%) ± | | 3.63 | 6-1-2035 | 196,390 | 192,647 |
The accompanying notes are an integral part of these financial statements.
Allspring Adjustable Rate Government Fund | 9
Portfolio of investments—February 28, 2023 (unaudited)
| | | Interest
rate | Maturity
date | Principal | Value |
| Agency securities (continued) | | | | | |
| FHLMC (1 Year Treasury Constant Maturity +2.25%) ± | | 3.63% | 6-1-2035 | $ 28,709 | $ 29,102 |
| FHLMC (1 Year Treasury Constant Maturity +2.00%) ± | | 3.66 | 8-1-2033 | 380,179 | 372,344 |
| FHLMC (6 Month LIBOR +1.42%) ± | | 3.67 | 2-1-2037 | 1,546 | 1,541 |
| FHLMC (12 Month LIBOR +1.77%) ± | | 3.69 | 9-1-2039 | 688,819 | 695,970 |
| FHLMC (12 Month LIBOR +1.75%) ± | | 3.70 | 6-1-2033 | 159,242 | 158,060 |
| FHLMC (12 Month LIBOR +1.77%) ± | | 3.71 | 9-1-2037 | 141,629 | 143,000 |
| FHLMC (12 Month LIBOR +1.61%) ± | | 3.75 | 7-1-2044 | 89,365 | 89,879 |
| FHLMC (12 Month LIBOR +1.51%) ± | | 3.76 | 2-1-2037 | 42,669 | 41,665 |
| FHLMC (12 Month Treasury Average +2.52%) ± | | 3.77 | 6-1-2028 | 18,880 | 18,467 |
| FHLMC (1 Year Treasury Constant Maturity +2.23%) ± | | 3.77 | 5-1-2038 | 244,914 | 241,165 |
| FHLMC (1 Year Treasury Constant Maturity +2.04%) ± | | 3.78 | 12-1-2035 | 221,050 | 216,759 |
| FHLMC (12 Month LIBOR +1.80%) ± | | 3.78 | 10-1-2043 | 2,539,154 | 2,562,689 |
| FHLMC (1 Year Treasury Constant Maturity +2.19%) ± | | 3.79 | 1-1-2037 | 303,573 | 296,794 |
| FHLMC (1 Year Treasury Constant Maturity +2.16%) ± | | 3.80 | 6-1-2033 | 256,941 | 250,398 |
| FHLMC (6 Month LIBOR +1.83%) ± | | 3.81 | 6-1-2037 | 126,054 | 123,028 |
| FHLMC (12 Month LIBOR +1.82%) ± | | 3.81 | 5-1-2039 | 213,134 | 209,477 |
| FHLMC (1 Year Treasury Constant Maturity +2.19%) ± | | 3.82 | 6-1-2036 | 265,978 | 268,797 |
| FHLMC (1 Year Treasury Constant Maturity +2.26%) ± | | 3.82 | 9-1-2036 | 5,220,276 | 5,314,616 |
| FHLMC (12 Month LIBOR +1.85%) ± | | 3.82 | 7-1-2038 | 554,723 | 559,560 |
| FHLMC (1 Year Treasury Constant Maturity +2.26%) ± | | 3.83 | 4-1-2037 | 1,059,833 | 1,076,321 |
| FHLMC (12 Month LIBOR +1.83%) ± | | 3.89 | 6-1-2043 | 2,842,443 | 2,892,570 |
| FHLMC (1 Year Treasury Constant Maturity +2.34%) ± | | 3.91 | 4-1-2032 | 836,030 | 834,231 |
| FHLMC (6 Month LIBOR +2.12%) ± | | 3.91 | 5-1-2037 | 20,128 | 19,648 |
| FHLMC (1 Year Treasury Constant Maturity +2.43%) ± | | 3.93 | 6-1-2025 | 16,754 | 16,420 |
| FHLMC (1 Year Treasury Constant Maturity +2.40%) ± | | 3.94 | 1-1-2037 | 524,987 | 534,013 |
| FHLMC (1 Year Treasury Constant Maturity +2.37%) ± | | 3.96 | 2-1-2034 | 1,440,695 | 1,447,403 |
| FHLMC (12 Month LIBOR +1.85%) ± | | 3.96 | 9-1-2036 | 202,075 | 199,723 |
| FHLMC (12 Month LIBOR +1.80%) ± | | 3.96 | 9-1-2037 | 135,159 | 136,862 |
| FHLMC (1 Year Treasury Constant Maturity +2.10%) ± | | 3.97 | 10-1-2037 | 317,122 | 316,595 |
| FHLMC (12 Month LIBOR +1.79%) ± | | 3.97 | 1-1-2040 | 1,018,970 | 1,033,477 |
| FHLMC (6 Month LIBOR +1.73%) ± | | 3.98 | 6-1-2024 | 1,149 | 1,135 |
| FHLMC (12 Month LIBOR +1.73%) ± | | 3.98 | 1-1-2035 | 148,456 | 145,620 |
| FHLMC (12 Month LIBOR +1.74%) ± | | 3.99 | 12-1-2036 | 111,692 | 112,795 |
| FHLMC (1 Year Treasury Constant Maturity +2.26%) ± | | 3.99 | 9-1-2038 | 1,720,433 | 1,743,768 |
| FHLMC (1 Year Treasury Constant Maturity +2.34%) ± | | 4.02 | 10-1-2033 | 321,456 | 315,275 |
| FHLMC (12 Month LIBOR +1.77%) ± | | 4.02 | 6-1-2035 | 123,292 | 121,526 |
| FHLMC (12 Month LIBOR +1.78%) ± | | 4.03 | 11-1-2035 | 98,235 | 98,616 |
| FHLMC (1 Year Treasury Constant Maturity +2.26%) ± | | 4.05 | 7-1-2038 | 5,192,229 | 5,255,303 |
| FHLMC (1 Year Treasury Constant Maturity +2.39%) ± | | 4.06 | 6-1-2035 | 256,757 | 257,418 |
| FHLMC (1 Year Treasury Constant Maturity +2.76%) ± | | 4.08 | 9-1-2030 | 16,180 | 15,945 |
| FHLMC (1 Year Treasury Constant Maturity +2.32%) ± | | 4.09 | 7-1-2027 | 116,244 | 115,198 |
| FHLMC (1 Year Treasury Constant Maturity +1.99%) ± | | 4.11 | 11-1-2034 | 151,091 | 147,500 |
| FHLMC (1 Year Treasury Constant Maturity +2.28%) ± | | 4.14 | 7-1-2034 | 104,476 | 101,939 |
| FHLMC (6 Month LIBOR +2.16%) ± | | 4.17 | 6-1-2026 | 153,809 | 151,211 |
| FHLMC (U.S. Treasury H15 Treasury Bill 6 Month Auction High Discount +1.94%) ± | | 4.19 | 7-1-2024 | 3,356 | 3,327 |
| FHLMC (1 Year Treasury Constant Maturity +2.36%) ± | | 4.19 | 1-1-2028 | 886 | 871 |
| FHLMC (12 Month LIBOR +1.93%) ± | | 4.20 | 4-1-2035 | 476,739 | 469,186 |
| FHLMC (1 Year Treasury Constant Maturity +2.48%) ± | | 4.21 | 6-1-2030 | 137,947 | 135,940 |
| FHLMC (1 Year Treasury Constant Maturity +2.22%) ± | | 4.22 | 8-1-2033 | 14,093 | 13,856 |
| FHLMC (1 Year Treasury Constant Maturity +2.47%) ± | | 4.22 | 7-1-2034 | 93,143 | 91,535 |
| FHLMC (1 Year Treasury Constant Maturity +2.23%) ± | | 4.23 | 11-1-2026 | 32,235 | 31,717 |
| FHLMC (12 Month LIBOR +1.99%) ± | | 4.24 | 7-1-2036 | 187,020 | 183,517 |
| FHLMC (1 Year Treasury Constant Maturity +2.25%) ± | | 4.27 | 9-1-2033 | 43,530 | 44,520 |
| FHLMC (11th District COFI +2.29%) ± | | 4.29 | 12-1-2025 | 1,354 | 1,346 |
The accompanying notes are an integral part of these financial statements.
10 | Allspring Adjustable Rate Government Fund
Portfolio of investments—February 28, 2023 (unaudited)
| | | Interest
rate | Maturity
date | Principal | Value |
| Agency securities (continued) | | | | | |
| FHLMC (1 Year Treasury Constant Maturity +2.24%) ± | | 4.31% | 4-1-2036 | $ 112,321 | $ 111,035 |
| FHLMC (1 Year Treasury Constant Maturity +2.22%) ± | | 4.34 | 12-1-2033 | 278,301 | 271,730 |
| FHLMC (1 Year Treasury Constant Maturity +2.23%) ± | | 4.35 | 2-1-2034 | 229,974 | 224,672 |
| FHLMC (1 Year Treasury Constant Maturity +2.28%) ± | | 4.35 | 10-1-2036 | 109,096 | 107,195 |
| FHLMC (1 Year Treasury Constant Maturity +2.35%) ± | | 4.35 | 7-1-2038 | 136,455 | 134,687 |
| FHLMC (1 Year Treasury Constant Maturity +2.23%) ± | | 4.36 | 2-1-2034 | 34,302 | 33,387 |
| FHLMC (1 Year Treasury Constant Maturity +2.25%) ± | | 4.36 | 1-1-2037 | 25,362 | 25,792 |
| FHLMC (1 Year Treasury Constant Maturity +2.29%) ± | | 4.37 | 11-1-2027 | 152,550 | 150,139 |
| FHLMC (1 Year Treasury Constant Maturity +2.25%) ± | | 4.37 | 12-1-2034 | 104,756 | 102,803 |
| FHLMC (1 Year Treasury Constant Maturity +2.25%) ± | | 4.38 | 5-1-2034 | 27,449 | 27,520 |
| FHLMC (1 Year Treasury Constant Maturity +2.25%) ± | | 4.38 | 2-1-2036 | 135,628 | 133,774 |
| FHLMC (1 Year Treasury Constant Maturity +2.27%) ± | | 4.40 | 11-1-2029 | 26,094 | 25,584 |
| FHLMC (1 Year Treasury Constant Maturity +2.40%) ± | | 4.40 | 7-1-2031 | 34,359 | 33,811 |
| FHLMC (1 Year Treasury Constant Maturity +2.40%) ± | | 4.40 | 9-1-2031 | 27,882 | 27,401 |
| FHLMC (1 Year Treasury Constant Maturity +2.36%) ± | | 4.41 | 1-1-2028 | 4,800 | 4,729 |
| FHLMC (1 Year Treasury Constant Maturity +2.28%) ± | | 4.41 | 1-1-2035 | 117,364 | 114,448 |
| FHLMC (1 Year Treasury Constant Maturity +2.36%) ± | | 4.46 | 2-1-2035 | 253,823 | 248,321 |
| FHLMC (11th District COFI +1.25%) ± | | 4.47 | 11-1-2030 | 7,564 | 7,338 |
| FHLMC (5 Year Treasury Constant Maturity +2.13%) ± | | 4.50 | 8-1-2029 | 5,859 | 5,845 |
| FHLMC (1 Year Treasury Constant Maturity +2.69%) ± | | 4.53 | 5-1-2028 | 61,815 | 60,485 |
| FHLMC (30 Day Average U.S. SOFR +0.26%) ± | | 4.56 | 7-1-2031 | 3,500,000 | 3,462,358 |
| FHLMC (1 Year Treasury Constant Maturity +2.48%) ± | | 4.60 | 6-1-2030 | 16,904 | 16,535 |
| FHLMC (1 Year Treasury Constant Maturity +2.49%) ± | | 4.60 | 12-1-2032 | 53,907 | 52,851 |
| FHLMC (1 Year Treasury Constant Maturity +2.55%) ± | | 4.67 | 9-1-2029 | 18,037 | 17,607 |
| FHLMC (12 Month LIBOR +1.77%) ± | | 5.04 | 8-1-2042 | 110,897 | 113,765 |
| FHLMC (3 Year Treasury Constant Maturity +2.40%) ± | | 5.16 | 5-1-2031 | 57,144 | 55,981 |
| FHLMC (6 Month LIBOR +3.83%) ± | | 5.21 | 11-1-2026 | 11,104 | 10,914 |
| FHLMC Multifamily Structured Pass-Through Certificates Series KF46 Class A (1 Month LIBOR +0.22%) ± | | 4.79 | 3-25-2028 | 107,238 | 105,500 |
| FHLMC Multifamily Structured Pass-Through Certificates Series KF85 Class AL (1 Month LIBOR +0.30%) ± | | 4.87 | 8-25-2030 | 241,347 | 237,817 |
| FHLMC Multifamily Structured Pass-Through Certificates Series KX04 Class AFL (1 Month LIBOR +0.33%) ± | | 4.90 | 3-25-2030 | 1,808,827 | 1,789,879 |
| FHLMC Multifamily Structured Pass-Through Certificates Series Q016 Class APT2 ±± | | 1.48 | 5-25-2051 | 3,689,590 | 3,233,997 |
| FHLMC Series 1671 Class QA (Enterprise 11th District COFI Institutional Replacement +0.95%) ± | | 2.79 | 2-15-2024 | 92,202 | 92,341 |
| FHLMC Series 1686 Class FE (Enterprise 11th District COFI Institutional Replacement +1.10%) ± | | 2.94 | 2-15-2024 | 746 | 748 |
| FHLMC Series 1709 Class FA (10 Year Treasury Constant Maturity -0.85%) ± | | 2.59 | 3-15-2024 | 14,750 | 14,642 |
| FHLMC Series 1730 Class FA (10 Year Treasury Constant Maturity -0.60%) ± | | 2.84 | 5-15-2024 | 10,941 | 10,885 |
| FHLMC Series 20 Class F ±± | | 2.54 | 7-1-2029 | 1,395 | 1,398 |
| FHLMC Series 2315 Class FW (1 Month LIBOR +0.55%) ± | | 5.14 | 4-15-2027 | 18,609 | 18,621 |
| FHLMC Series 2391 Class EF (1 Month LIBOR +0.50%) ± | | 5.09 | 6-15-2031 | 25,051 | 25,009 |
| FHLMC Series 2454 Class SL (-1 Month LIBOR +8.00%) ♀± | | 3.41 | 3-15-2032 | 54,525 | 5,410 |
| FHLMC Series 2461 Class FI (1 Month LIBOR +0.50%) ± | | 5.09 | 4-15-2028 | 31,207 | 31,201 |
| FHLMC Series 2464 Class FE (1 Month LIBOR +1.00%) ± | | 5.59 | 3-15-2032 | 35,538 | 36,077 |
| FHLMC Series 2466 Class FV (1 Month LIBOR +0.55%) ± | | 5.14 | 3-15-2032 | 68,276 | 68,461 |
| FHLMC Series 2538 Class F (1 Month LIBOR +0.60%) ± | | 5.19 | 12-15-2032 | 144,969 | 144,310 |
| FHLMC Series 264 Class F1 (1 Month LIBOR +0.55%) ± | | 5.14 | 7-15-2042 | 584,933 | 577,469 |
| FHLMC Series 2682 Class FK (1 Month LIBOR +1.47%) ± | | 6.06 | 1-15-2033 | 2,898,679 | 2,999,107 |
| FHLMC Series 3067 Class FA (1 Month LIBOR +0.35%) ± | | 4.94 | 11-15-2035 | 518,043 | 513,055 |
| FHLMC Series 3114 Class FT (1 Month LIBOR +0.35%) ± | | 4.94 | 9-15-2030 | 198,105 | 197,577 |
| FHLMC Series 3140 Class GF (1 Month LIBOR +0.35%) ± | | 4.94 | 3-15-2036 | 404,752 | 400,677 |
The accompanying notes are an integral part of these financial statements.
Allspring Adjustable Rate Government Fund | 11
Portfolio of investments—February 28, 2023 (unaudited)
| | | Interest
rate | Maturity
date | Principal | Value |
| Agency securities (continued) | | | | | |
| FHLMC Series 3146 Class FP (1 Month LIBOR +0.35%) ± | | 4.94% | 4-15-2036 | $ 370,120 | $ 366,642 |
| FHLMC Series 3149 Class FB (1 Month LIBOR +0.35%) ± | | 4.94 | 5-15-2036 | 661,001 | 656,873 |
| FHLMC Series 319 Class F1 (1 Month LIBOR +0.45%) ± | | 5.04 | 11-15-2043 | 859,249 | 843,805 |
| FHLMC Series 3240 Class FM (1 Month LIBOR +0.35%) ± | | 4.94 | 11-15-2036 | 671,593 | 664,329 |
| FHLMC Series 3284 Class CF (1 Month LIBOR +0.37%) ± | | 4.96 | 3-15-2037 | 452,636 | 445,190 |
| FHLMC Series 3286 Class FA (1 Month LIBOR +0.40%) ± | | 4.99 | 3-15-2037 | 50,657 | 49,784 |
| FHLMC Series 3311 Class KF (1 Month LIBOR +0.34%) ± | | 4.93 | 5-15-2037 | 775,691 | 763,401 |
| FHLMC Series 3312 Class FN (1 Month LIBOR +0.22%) ± | | 4.81 | 7-15-2036 | 657,892 | 647,355 |
| FHLMC Series 3436 Class A ±± | | 4.09 | 11-15-2036 | 234,864 | 236,817 |
| FHLMC Series 350 Class F2 (1 Month LIBOR +0.35%) ± | | 3.34 | 9-15-2040 | 5,563,182 | 5,418,784 |
| FHLMC Series 3684 Class FM (1 Month LIBOR +0.35%) ± | | 3.98 | 11-15-2036 | 960,644 | 947,075 |
| FHLMC Series 3753 Class FA (1 Month LIBOR +0.50%) ± | | 5.09 | 11-15-2040 | 1,063,550 | 1,049,983 |
| FHLMC Series 3757 Class PF (1 Month LIBOR +0.50%) ± | | 5.09 | 8-15-2040 | 242,082 | 241,818 |
| FHLMC Series 3822 Class FY (1 Month LIBOR +0.40%) ± | | 4.99 | 2-15-2033 | 469,238 | 468,235 |
| FHLMC Series 3827 Class DF (1 Month LIBOR +0.45%) ± | | 5.04 | 3-15-2041 | 236,703 | 234,491 |
| FHLMC Series 3925 Class FL (1 Month LIBOR +0.45%) ± | | 5.04 | 1-15-2041 | 50,053 | 49,930 |
| FHLMC Series 3997 Class FQ (1 Month LIBOR +0.50%) ± | | 5.09 | 2-15-2042 | 458,458 | 451,813 |
| FHLMC Series 4013 Class QF (1 Month LIBOR +0.55%) ± | | 5.14 | 3-15-2041 | 213,999 | 213,625 |
| FHLMC Series 4039 Class FA (1 Month LIBOR +0.50%) ± | | 5.09 | 5-15-2042 | 721,178 | 716,724 |
| FHLMC Series 4136 Class DF (1 Month LIBOR +0.30%) ± | | 4.89 | 11-15-2042 | 456,452 | 444,371 |
| FHLMC Series 4143 Class KF (1 Month LIBOR +0.35%) ± | | 3.65 | 9-15-2037 | 1,360,490 | 1,337,937 |
| FHLMC Series 4248 Class FL (1 Month LIBOR +0.45%) ± | | 5.04 | 5-15-2041 | 187,075 | 185,219 |
| FHLMC Series 4316 Class JF (1 Month LIBOR +0.40%) ± | | 4.99 | 1-15-2044 | 644,946 | 634,909 |
| FHLMC Series 4474 Class WF (1 Month LIBOR +0.35%) ± | | 3.58 | 12-15-2036 | 1,072,175 | 1,042,997 |
| FHLMC Series 4477 Class FG (1 Month LIBOR +0.30%) ± | | 3.47 | 10-15-2040 | 995,299 | 973,520 |
| FHLMC Series 4503 Class FA (1 Month LIBOR +0.35%) ± | | 3.63 | 2-15-2042 | 1,226,236 | 1,204,808 |
| FHLMC Series 4515 Class FA (1 Month LIBOR +0.37%) ± | | 3.83 | 8-15-2038 | 181,978 | 179,079 |
| FHLMC Series 4604 Class PA | | 3.00 | 1-15-2044 | 134,032 | 131,659 |
| FHLMC Series 4624 Class FA (1 Month LIBOR +0.45%) ± | | 3.64 | 12-15-2038 | 2,088,006 | 2,062,314 |
| FHLMC Series 4628 Class KF (1 Month LIBOR +0.50%) ± | | 5.09 | 1-15-2055 | 1,198,590 | 1,167,965 |
| FHLMC Series 4678 Class AF (1 Month LIBOR +0.40%) ± | | 3.61 | 12-15-2042 | 903,945 | 895,480 |
| FHLMC Series 4691 Class FA (1 Month LIBOR +0.35%) ± | | 4.94 | 6-15-2047 | 450,210 | 425,756 |
| FHLMC Series 4707 Class FD (1 Month LIBOR +0.35%) ± | | 3.76 | 9-15-2044 | 2,642,838 | 2,632,761 |
| FHLMC Series 4754 Class FM (1 Month LIBOR +0.30%) ± | | 4.89 | 2-15-2048 | 1,146,237 | 1,109,522 |
| FHLMC Series 4779 Class WF (1 Month LIBOR +0.35%) ± | | 3.56 | 7-15-2044 | 1,288,309 | 1,267,501 |
| FHLMC Series 4821 Class FA (1 Month LIBOR +0.30%) ± | | 4.89 | 7-15-2048 | 342,105 | 331,865 |
| FHLMC Series 4831 Class FD (1 Month LIBOR +0.30%) ± | | 4.89 | 10-15-2048 | 1,133,161 | 1,098,069 |
| FHLMC Series 4842 Class FA (1 Month LIBOR +0.35%) ± | | 4.94 | 11-15-2048 | 837,935 | 815,625 |
| FHLMC Series 4906 Class WF (1 Month LIBOR +0.40%) ± | | 3.81 | 12-15-2038 | 1,523,489 | 1,507,737 |
| FHLMC Series 4908 Class FA (1 Month LIBOR +0.44%) ± | | 3.66 | 12-15-2042 | 1,499,839 | 1,484,111 |
| FHLMC Series 4915 Class FE (1 Month LIBOR +0.40%) ± | | 3.83 | 2-15-2038 | 3,713,439 | 3,742,803 |
| FHLMC Series 4921 Class FN (1 Month LIBOR +0.45%) ± | | 5.07 | 10-25-2049 | 884,464 | 865,068 |
| FHLMC Series 4925 Class FY (1 Month LIBOR +0.45%) ± | | 5.07 | 10-25-2049 | 342,118 | 334,036 |
| FHLMC Series 4925 Class WF (1 Month LIBOR +0.40%) ± | | 3.92 | 8-15-2038 | 3,360,446 | 3,346,496 |
| FHLMC Series 4927 Class FG (1 Month LIBOR +0.50%) ± | | 5.12 | 11-25-2049 | 1,327,987 | 1,300,618 |
| FHLMC Series 4933 Class FA (1 Month LIBOR +0.50%) ± | | 5.12 | 12-25-2049 | 951,099 | 931,951 |
| FHLMC Series 5062 Class FC (30 Day Average U.S. SOFR +0.20%) ± | | 4.68 | 1-25-2051 | 1,290,518 | 1,230,276 |
| FHLMC Series T-15 Class A6 (1 Month LIBOR +0.40%) ± | | 5.02 | 11-25-2028 | 194,029 | 193,590 |
| FHLMC Series T-16 Class A (1 Month LIBOR +0.35%) ± | | 4.97 | 6-25-2029 | 780,977 | 762,642 |
| FHLMC Series T-20 Class A7 (1 Month LIBOR +0.30%) ± | | 4.92 | 12-25-2029 | 1,872,028 | 1,843,728 |
| FHLMC Series T-21 Class A (1 Month LIBOR +0.36%) ± | | 4.98 | 10-25-2029 | 582,107 | 581,288 |
| FHLMC Series T-24 Class A (1 Month LIBOR +0.30%) ± | | 4.92 | 6-25-2030 | 196,760 | 195,168 |
| FHLMC Series T-27 Class A (1 Month LIBOR +0.30%) ± | | 4.92 | 10-25-2030 | 721,852 | 717,672 |
| FHLMC Series T-30 Class A7 (1 Month LIBOR +0.24%) ± | | 4.86 | 12-25-2030 | 574,556 | 554,473 |
The accompanying notes are an integral part of these financial statements.
12 | Allspring Adjustable Rate Government Fund
Portfolio of investments—February 28, 2023 (unaudited)
| | | Interest
rate | Maturity
date | Principal | Value |
| Agency securities (continued) | | | | | |
| FHLMC Series T-35 Class A (1 Month LIBOR +0.28%) ± | | 4.90% | 9-25-2031 | $1,133,064 | $ 1,126,988 |
| FHLMC Series T-48 Class 2A ±± | | 3.82 | 7-25-2033 | 1,007,178 | 933,281 |
| FHLMC Series T-54 Class 4A ±± | | 3.93 | 2-25-2043 | 579,156 | 530,207 |
| FHLMC Series T-55 Class 1A1 | | 6.50 | 3-25-2043 | 32,176 | 32,519 |
| FHLMC Series T-56 Class 3AF (1 Month LIBOR +1.00%) ± | | 5.62 | 5-25-2043 | 783,338 | 778,103 |
| FHLMC Series T-62 Class 1A1 (12 Month Treasury Average +1.20%) ± | | 3.99 | 10-25-2044 | 1,462,318 | 1,380,884 |
| FHLMC Series T-63 Class 1A1 (12 Month Treasury Average +1.20%) ± | | 3.42 | 2-25-2045 | 1,295,377 | 1,291,054 |
| FHLMC Series T-66 Class 2A1 ±± | | 4.21 | 1-25-2036 | 851,988 | 829,300 |
| FHLMC Series T-67 Class 1A1C ±± | | 3.68 | 3-25-2036 | 1,937,047 | 1,882,100 |
| FHLMC Series T-67 Class 2A1C ±± | | 3.74 | 3-25-2036 | 1,989,973 | 1,944,507 |
| FNMA (Enterprise 11th District COFI Institutional Replacement +1.40%) ± | | 2.17 | 4-1-2024 | 120,329 | 119,299 |
| FNMA (12 Month LIBOR +1.60%) ± | | 2.23 | 8-1-2050 | 2,216,681 | 1,988,742 |
| FNMA (12 Month LIBOR +1.62%) ± | | 2.39 | 8-1-2050 | 2,731,312 | 2,448,407 |
| FNMA (3 Year Treasury Constant Maturity +2.15%) ± | | 2.40 | 10-1-2024 | 5,375 | 5,332 |
| FNMA (12 Month LIBOR +1.62%) ± | | 2.53 | 4-1-2050 | 1,313,664 | 1,227,401 |
| FNMA (11th District COFI +1.92%) ± | | 2.59 | 9-1-2030 | 118,411 | 115,994 |
| FNMA (11th District COFI +1.82%) ± | | 2.60 | 5-1-2028 | 20,536 | 20,075 |
| FNMA (11th District COFI +1.08%) ± | | 2.67 | 10-1-2034 | 4,896 | 4,872 |
| FNMA (11th District COFI +1.27%) ± | | 2.86 | 3-1-2033 | 37,629 | 36,221 |
| FNMA (12 Month LIBOR +1.75%) ± | | 2.88 | 4-1-2034 | 147,985 | 144,711 |
| FNMA (12 Month LIBOR +1.65%) ± | | 2.88 | 11-1-2038 | 82,839 | 81,830 |
| FNMA (3 Year Treasury Constant Maturity +2.15%) ± | | 2.90 | 8-1-2031 | 21,275 | 20,720 |
| FNMA (12 Month LIBOR +1.75%) ± | | 2.93 | 5-1-2035 | 295,169 | 291,623 |
| FNMA (1 Year Treasury Constant Maturity +2.21%) ± | | 3.01 | 5-1-2037 | 282,099 | 277,368 |
| FNMA (1 Year Treasury Constant Maturity +1.96%) ± | | 3.08 | 3-1-2032 | 12,972 | 12,813 |
| FNMA (11th District COFI +1.26%) ± | | 3.09 | 1-1-2035 | 132,447 | 128,217 |
| FNMA (11th District COFI +1.29%) ± | | 3.09 | 9-1-2037 | 709,228 | 683,944 |
| FNMA (12 Month LIBOR +1.75%) ± | | 3.10 | 4-1-2033 | 258,389 | 253,344 |
| FNMA (1 Year Treasury Constant Maturity +2.10%) ± | | 3.10 | 7-1-2035 | 37,003 | 36,361 |
| FNMA (11th District COFI +1.25%) ± | | 3.11 | 11-1-2023 | 1,851 | 1,839 |
| FNMA (1 Year Treasury Constant Maturity +2.12%) ± | | 3.12 | 3-1-2031 | 15,622 | 15,411 |
| FNMA (11th District COFI +1.25%) ± | | 3.13 | 11-1-2024 | 39 | 38 |
| FNMA (6 Month LIBOR +1.03%) ± | | 3.15 | 2-1-2033 | 90,890 | 88,975 |
| FNMA (1 Year Treasury Constant Maturity +1.50%) ± | | 3.16 | 8-1-2030 | 260,542 | 257,005 |
| FNMA (6 Month LIBOR +1.31%) ± | | 3.18 | 10-1-2037 | 279,143 | 277,771 |
| FNMA (1 Year Treasury Constant Maturity +2.10%) ± | | 3.19 | 9-1-2036 | 158,193 | 155,492 |
| FNMA (1 Year Treasury Constant Maturity +1.58%) ± | | 3.24 | 3-1-2034 | 172,625 | 168,449 |
| FNMA (11th District COFI +1.26%) ± | | 3.33 | 1-1-2038 | 7,597 | 7,473 |
| FNMA (12 Month LIBOR +1.59%) ± | | 3.34 | 6-1-2044 | 426,398 | 431,433 |
| FNMA (6 Month LIBOR +1.51%) ± | | 3.35 | 11-1-2034 | 266,102 | 261,128 |
| FNMA (1 Year Treasury Constant Maturity +2.22%) ± | | 3.35 | 6-1-2035 | 173,583 | 172,760 |
| FNMA (1 Year Treasury Constant Maturity +2.35%) ± | | 3.37 | 6-1-2027 | 21,105 | 20,773 |
| FNMA (12 Month LIBOR +1.56%) ± | | 3.40 | 1-1-2040 | 59,477 | 58,720 |
| FNMA (12 Month LIBOR +1.56%) ± | | 3.40 | 6-1-2043 | 3,032,011 | 3,048,552 |
| FNMA (1 Year Treasury Constant Maturity +2.24%) ± | | 3.43 | 7-1-2028 | 43 | 42 |
| FNMA (12 Month LIBOR +1.60%) ± | | 3.44 | 3-1-2046 | 689,097 | 689,019 |
| FNMA (1 Year Treasury Constant Maturity +2.23%) ± | | 3.45 | 8-1-2026 | 10,716 | 10,569 |
| FNMA (1 Year Treasury Constant Maturity +2.19%) ± | | 3.47 | 6-1-2027 | 26,799 | 26,439 |
| FNMA (1 Year Treasury Constant Maturity +2.22%) ± | | 3.48 | 7-1-2029 | 121,645 | 117,464 |
| FNMA (6 Month LIBOR +1.74%) ± | | 3.49 | 10-1-2024 | 11,257 | 11,084 |
| FNMA (1 Year Treasury Constant Maturity +2.12%) ± | | 3.49 | 8-1-2026 | 7,800 | 7,675 |
| FNMA (5 Year Treasury Constant Maturity +1.90%) ± | | 3.49 | 9-1-2031 | 90,831 | 88,153 |
The accompanying notes are an integral part of these financial statements.
Allspring Adjustable Rate Government Fund | 13
Portfolio of investments—February 28, 2023 (unaudited)
| | | Interest
rate | Maturity
date | Principal | Value |
| Agency securities (continued) | | | | | |
| FNMA (6 Month LIBOR +1.16%) ± | | 3.50% | 8-1-2033 | $ 2,585 | $ 2,531 |
| FNMA (12 Month LIBOR +1.59%) ± | | 3.50 | 9-1-2044 | 657,303 | 664,768 |
| FNMA (1 Year Treasury Constant Maturity +1.76%) ± | | 3.51 | 8-1-2032 | 27,791 | 27,416 |
| FNMA (1 Year Treasury Constant Maturity +2.11%) ± | | 3.51 | 7-1-2035 | 77,626 | 76,759 |
| FNMA (1 Year Treasury Constant Maturity +2.37%) ± | | 3.52 | 9-1-2030 | 215,868 | 206,732 |
| FNMA (1 Year Treasury Constant Maturity +1.52%) ± | | 3.52 | 8-1-2033 | 361,902 | 357,116 |
| FNMA (1 Year Treasury Constant Maturity +2.32%) ± | | 3.55 | 4-1-2028 | 50,344 | 49,265 |
| FNMA (12 Month LIBOR +1.72%) ± | | 3.55 | 4-1-2034 | 233,850 | 236,065 |
| FNMA (Federal COFI +2.45%) ± | | 3.56 | 2-1-2029 | 233,392 | 231,655 |
| FNMA (1 Year Treasury Constant Maturity +2.50%) ± | | 3.57 | 9-1-2030 | 217,456 | 209,264 |
| FNMA (11th District COFI +1.25%) ± | | 3.61 | 4-1-2034 | 165,733 | 161,259 |
| FNMA (1 Year Treasury Constant Maturity +2.49%) ± | | 3.61 | 7-1-2037 | 73,566 | 72,940 |
| FNMA (12 Month LIBOR +1.74%) ± | | 3.62 | 6-1-2036 | 47,008 | 47,852 |
| FNMA (1 Year Treasury Constant Maturity +2.58%) ± | | 3.63 | 8-1-2035 | 152,111 | 148,412 |
| FNMA (12 Month Treasury Average +2.48%) ± | | 3.63 | 6-1-2040 | 397,357 | 390,373 |
| FNMA (1 Year Treasury Constant Maturity +2.64%) ± | | 3.64 | 3-1-2030 | 3,103 | 3,048 |
| FNMA (1 Year Treasury Constant Maturity +2.18%) ± | | 3.65 | 6-1-2035 | 46,398 | 45,824 |
| FNMA (1 Year Treasury Constant Maturity +2.41%) ± | | 3.67 | 5-1-2027 | 21,822 | 21,427 |
| FNMA (1 Year Treasury Constant Maturity +1.88%) ± | | 3.67 | 8-1-2031 | 29,634 | 29,266 |
| FNMA (1 Year Treasury Constant Maturity +2.20%) ± | | 3.68 | 10-1-2034 | 490,042 | 498,301 |
| FNMA (12 Month LIBOR +1.93%) ± | | 3.68 | 5-1-2037 | 506,559 | 501,218 |
| FNMA (12 Month LIBOR +1.75%) ± | | 3.69 | 7-1-2035 | 204,840 | 207,298 |
| FNMA (1 Year Treasury Constant Maturity +2.44%) ± | | 3.69 | 7-1-2037 | 680,955 | 685,670 |
| FNMA (12 Month LIBOR +1.75%) ± | | 3.69 | 9-1-2042 | 143,649 | 145,516 |
| FNMA (1 Year Treasury Constant Maturity +1.66%) ± | | 3.69 | 7-1-2048 | 387,377 | 388,649 |
| FNMA (11th District COFI +1.86%) ± | | 3.71 | 10-1-2027 | 76,774 | 76,025 |
| FNMA (6 Month LIBOR +1.96%) ± | | 3.73 | 10-1-2024 | 1,869 | 1,854 |
| FNMA (1 Year Treasury Constant Maturity +2.03%) ± | | 3.73 | 12-1-2032 | 162,555 | 159,741 |
| FNMA (11th District COFI +1.66%) ± | | 3.73 | 1-1-2036 | 103,846 | 101,113 |
| FNMA (11th District COFI +1.70%) ± | | 3.76 | 4-1-2030 | 317 | 311 |
| FNMA (11th District COFI +1.90%) ± | | 3.76 | 3-1-2033 | 117,794 | 115,316 |
| FNMA (1 Year Treasury Constant Maturity +2.70%) ± | | 3.76 | 5-1-2035 | 462,701 | 456,783 |
| FNMA (1 Year Treasury Constant Maturity +2.20%) ± | | 3.76 | 12-1-2040 | 3,096,037 | 3,143,042 |
| FNMA (12 Month LIBOR +1.68%) ± | | 3.76 | 6-1-2041 | 730,777 | 738,901 |
| FNMA (12 Month LIBOR +1.72%) ± | | 3.77 | 6-1-2035 | 42,799 | 43,667 |
| FNMA (12 Month LIBOR +1.53%) ± | | 3.78 | 9-1-2035 | 289,427 | 292,770 |
| FNMA (12 Month LIBOR +1.54%) ± | | 3.79 | 9-1-2036 | 176,753 | 174,584 |
| FNMA (12 Month LIBOR +1.67%) ± | | 3.80 | 7-1-2035 | 313,910 | 319,996 |
| FNMA (1 Year Treasury Constant Maturity +1.70%) ± | | 3.82 | 2-1-2033 | 168,892 | 165,841 |
| FNMA (12 Month LIBOR +1.57%) ± | | 3.82 | 11-1-2044 | 64,680 | 64,123 |
| FNMA (1 Year Treasury Constant Maturity +2.07%) ± | | 3.85 | 12-1-2033 | 151,086 | 148,656 |
| FNMA (1 Year Treasury Constant Maturity +2.21%) ± | | 3.85 | 9-1-2035 | 814,830 | 828,944 |
| FNMA (12 Month LIBOR +1.60%) ± | | 3.85 | 9-1-2037 | 342,144 | 338,432 |
| FNMA (1 Year Treasury Constant Maturity +2.23%) ± | | 3.85 | 4-1-2038 | 244,055 | 240,777 |
| FNMA (6 Month LIBOR +1.74%) ± | | 3.87 | 12-1-2024 | 11,804 | 11,637 |
| FNMA (12 Month LIBOR +1.90%) ± | | 3.87 | 5-1-2038 | 246,391 | 252,996 |
| FNMA (1 Year Treasury Constant Maturity +2.35%) ± | | 3.88 | 9-1-2037 | 30,027 | 29,545 |
| FNMA (1 Year Treasury Constant Maturity +2.29%) ± | | 3.89 | 5-1-2034 | 96,681 | 95,145 |
| FNMA (11th District COFI +1.83%) ± | | 3.89 | 6-1-2034 | 33,566 | 33,113 |
| FNMA (1 Year Treasury Constant Maturity +2.29%) ± | | 3.90 | 6-1-2037 | 571,276 | 578,815 |
| FNMA (11th District COFI +1.85%) ± | | 3.92 | 1-1-2036 | 8,453 | 8,247 |
| FNMA (12 Month LIBOR +1.72%) ± | | 3.92 | 7-1-2043 | 1,063,607 | 1,078,309 |
| FNMA (12 Month LIBOR +1.77%) ± | | 3.92 | 7-1-2044 | 1,421,952 | 1,451,569 |
| FNMA (1 Year Treasury Constant Maturity +2.21%) ± | | 3.94 | 1-1-2027 | 21,365 | 21,227 |
| FNMA (1 Year Treasury Constant Maturity +2.24%) ± | | 3.94 | 1-1-2037 | 307,539 | 304,869 |
The accompanying notes are an integral part of these financial statements.
14 | Allspring Adjustable Rate Government Fund
Portfolio of investments—February 28, 2023 (unaudited)
| | | Interest
rate | Maturity
date | Principal | Value |
| Agency securities (continued) | | | | | |
| FNMA (1 Year Treasury Constant Maturity +2.10%) ± | | 3.95% | 4-1-2040 | $ 58,490 | $ 59,184 |
| FNMA (1 Year Treasury Constant Maturity +2.22%) ± | | 3.97 | 7-1-2035 | 29,001 | 28,882 |
| FNMA (12 Month Treasury Average +1.18%) ± | | 3.97 | 10-1-2044 | 185,088 | 178,938 |
| FNMA (U.S. Treasury H15 Treasury Bill 6 Month Auction High Discount +2.23%) ± | | 3.98 | 7-1-2025 | 8 | 8 |
| FNMA (1 Year Treasury Constant Maturity +2.17%) ± | | 3.98 | 9-1-2030 | 18,804 | 18,582 |
| FNMA (1 Year Treasury Constant Maturity +2.18%) ± | | 3.98 | 1-1-2036 | 149,756 | 148,126 |
| FNMA (1 Year Treasury Constant Maturity +2.24%) ± | | 3.98 | 7-1-2038 | 1,422,300 | 1,450,048 |
| FNMA (12 Month LIBOR +1.59%) ± | | 3.98 | 8-1-2045 | 247,565 | 251,698 |
| FNMA (12 Month LIBOR +1.78%) ± | | 3.99 | 1-1-2042 | 1,063,055 | 1,082,698 |
| FNMA (12 Month LIBOR +1.56%) ± | | 3.99 | 2-1-2044 | 35,862 | 35,869 |
| FNMA (1 Year Treasury Constant Maturity +2.31%) ± | | 4.00 | 12-1-2030 | 181,354 | 178,967 |
| FNMA (12 Month LIBOR +1.75%) ± | | 4.00 | 1-1-2035 | 159,101 | 158,040 |
| FNMA (1 Year Treasury Constant Maturity +2.23%) ± | | 4.00 | 7-1-2037 | 102,127 | 104,176 |
| FNMA (1 Year Treasury Constant Maturity +2.20%) ± | | 4.00 | 12-1-2040 | 1,391,600 | 1,414,272 |
| FNMA (1 Year Treasury Constant Maturity +2.21%) ± | | 4.01 | 8-1-2035 | 205,953 | 206,158 |
| FNMA (12 Month Treasury Average +1.21%) ± | | 4.01 | 4-1-2042 | 543,482 | 517,808 |
| FNMA (1 Year Treasury Constant Maturity +2.16%) ± | | 4.03 | 5-1-2034 | 246,232 | 240,255 |
| FNMA (1 Year Treasury Constant Maturity +1.93%) ± | | 4.03 | 7-1-2038 | 389,980 | 384,072 |
| FNMA (1 Year Treasury Constant Maturity +2.28%) ± | | 4.04 | 4-1-2024 | 382 | 380 |
| FNMA (1 Year Treasury Constant Maturity +2.30%) ± | | 4.04 | 7-1-2030 | 91,481 | 90,102 |
| FNMA (1 Year Treasury Constant Maturity +2.23%) ± | | 4.04 | 11-1-2038 | 1,555,535 | 1,584,684 |
| FNMA (6 Month LIBOR +1.93%) ± | | 4.05 | 6-1-2032 | 50,602 | 49,909 |
| FNMA (6 Month LIBOR +2.31%) ± | | 4.06 | 4-1-2033 | 144,838 | 141,764 |
| FNMA (1 Year Treasury Constant Maturity +2.22%) ± | | 4.06 | 12-1-2040 | 1,169,901 | 1,188,791 |
| FNMA (12 Month LIBOR +1.82%) ± | | 4.07 | 12-1-2046 | 59,026 | 57,840 |
| FNMA (12 Month LIBOR +1.83%) ± | | 4.08 | 1-1-2033 | 50,963 | 50,122 |
| FNMA (1 Year Treasury Constant Maturity +2.64%) ± | | 4.09 | 7-1-2028 | 26,210 | 25,850 |
| FNMA (1 Year Treasury Constant Maturity +2.19%) ± | | 4.11 | 1-1-2033 | 235,164 | 233,624 |
| FNMA (1 Year Treasury Constant Maturity +2.20%) ± | | 4.11 | 9-1-2033 | 121,515 | 119,530 |
| FNMA (1 Year Treasury Constant Maturity +2.26%) ± | | 4.11 | 10-1-2036 | 218,193 | 222,191 |
| FNMA (1 Year Treasury Constant Maturity +2.21%) ± | | 4.12 | 5-1-2036 | 764,161 | 766,619 |
| FNMA (6 Month LIBOR +2.50%) ± | | 4.13 | 4-1-2033 | 131,411 | 128,389 |
| FNMA (1 Year Treasury Constant Maturity +2.28%) ± | | 4.15 | 5-1-2033 | 185,885 | 182,861 |
| FNMA (12 Month LIBOR +1.90%) ± | | 4.15 | 10-1-2034 | 220,332 | 217,599 |
| FNMA (11th District COFI +1.93%) ± | | 4.15 | 12-1-2036 | 12,962 | 12,874 |
| FNMA (1 Year Treasury Constant Maturity +2.15%) ± | | 4.16 | 2-1-2033 | 35,300 | 34,912 |
| FNMA (1 Year Treasury Constant Maturity +2.22%) ± | | 4.16 | 7-1-2035 | 174,135 | 176,152 |
| FNMA (6 Month LIBOR +1.42%) ± | | 4.17 | 12-1-2031 | 102,581 | 102,832 |
| FNMA (12 Month Treasury Average +1.40%) ± | | 4.19 | 12-1-2030 | 18,548 | 17,903 |
| FNMA (1 Year Treasury Constant Maturity +2.19%) ± | | 4.19 | 8-1-2033 | 203,905 | 201,224 |
| FNMA (1 Year Treasury Constant Maturity +2.50%) ± | | 4.22 | 10-1-2029 | 177,551 | 174,759 |
| FNMA (1 Year Treasury Constant Maturity +2.18%) ± | | 4.22 | 9-1-2035 | 411,838 | 419,755 |
| FNMA (6 Month LIBOR +1.98%) ± | | 4.23 | 9-1-2033 | 42,216 | 41,220 |
| FNMA (1 Year Treasury Constant Maturity +2.13%) ± | | 4.25 | 10-1-2025 | 10,514 | 10,362 |
| FNMA (Federal COFI +2.00%) ± | | 4.25 | 8-1-2029 | 18,695 | 18,607 |
| FNMA (12 Month LIBOR +2.00%) ± | | 4.25 | 9-1-2035 | 160,922 | 164,992 |
| FNMA (1 Year Treasury Constant Maturity +2.28%) ± | | 4.28 | 9-1-2026 | 9,654 | 9,520 |
| FNMA (6 Month LIBOR +1.96%) ± | | 4.28 | 1-1-2033 | 45,973 | 45,019 |
| FNMA (1 Year Treasury Constant Maturity +2.29%) ± | | 4.29 | 12-1-2030 | 14,206 | 14,041 |
| FNMA (1 Year Treasury Constant Maturity +2.17%) ± | | 4.29 | 12-1-2039 | 84,840 | 83,616 |
| FNMA (1 Year Treasury Constant Maturity +2.18%) ± | | 4.30 | 12-1-2024 | 7,592 | 7,500 |
| FNMA (1 Year Treasury Constant Maturity +2.30%) ± | | 4.30 | 1-1-2026 | 32,775 | 32,326 |
| FNMA (1 Year Treasury Constant Maturity +2.40%) ± | | 4.32 | 5-1-2033 | 40,425 | 39,708 |
| FNMA (1 Year Treasury Constant Maturity +2.33%) ± | | 4.35 | 11-1-2024 | 11,926 | 11,808 |
The accompanying notes are an integral part of these financial statements.
Allspring Adjustable Rate Government Fund | 15
Portfolio of investments—February 28, 2023 (unaudited)
| | | Interest
rate | Maturity
date | Principal | Value |
| Agency securities (continued) | | | | | |
| FNMA (1 Year Treasury Constant Maturity +2.22%) ± | | 4.35% | 8-1-2031 | $ 74,263 | $ 72,388 |
| FNMA (1 Year Treasury Constant Maturity +2.22%) ± | | 4.35 | 10-1-2034 | 89,699 | 88,062 |
| FNMA (1 Year Treasury Constant Maturity +2.38%) ± | | 4.38 | 7-1-2027 | 38,457 | 37,986 |
| FNMA (1 Year Treasury Constant Maturity +2.18%) ± | | 4.39 | 1-1-2036 | 205,236 | 204,529 |
| FNMA (1 Year Treasury Constant Maturity +2.28%) ± | | 4.40 | 7-1-2024 | 1,746 | 1,730 |
| FNMA (1 Year Treasury Constant Maturity +2.36%) ± | | 4.40 | 11-1-2034 | 125,283 | 128,004 |
| FNMA (1 Year Treasury Constant Maturity +2.31%) ± | | 4.41 | 12-1-2034 | 216,467 | 214,802 |
| FNMA (1 Year Treasury Constant Maturity +2.32%) ± | | 4.44 | 5-1-2025 | 8,524 | 8,419 |
| FNMA (1 Year Treasury Constant Maturity +2.19%) ± | | 4.44 | 3-1-2035 | 175,250 | 170,959 |
| FNMA (5 Year Treasury Constant Maturity +2.42%) ± | | 4.45 | 6-1-2028 | 10,944 | 11,032 |
| FNMA (1 Year Treasury Constant Maturity +2.29%) ± | | 4.45 | 1-1-2031 | 98,646 | 96,837 |
| FNMA (1 Year Treasury Constant Maturity +2.47%) ± | | 4.47 | 9-1-2028 | 23,487 | 23,172 |
| FNMA (1 Year Treasury Constant Maturity +2.50%) ± | | 4.50 | 3-1-2027 | 9,634 | 9,511 |
| FNMA (1 Year Treasury Constant Maturity +2.37%) ± | | 4.50 | 7-1-2027 | 9,578 | 9,407 |
| FNMA (1 Year Treasury Constant Maturity +2.40%) ± | | 4.53 | 6-1-2024 | 7,078 | 7,014 |
| FNMA (1 Year Treasury Constant Maturity +2.54%) ± | | 4.53 | 7-1-2028 | 93,648 | 92,149 |
| FNMA (1 Year Treasury Constant Maturity +2.40%) ± | | 4.53 | 9-1-2033 | 256,263 | 252,777 |
| FNMA (6 Month LIBOR +2.25%) ± | | 4.54 | 3-1-2034 | 367,280 | 362,814 |
| FNMA (6 Month LIBOR +1.18%) ± | | 4.55 | 8-1-2033 | 37,684 | 37,679 |
| FNMA (12 Month Treasury Average +1.73%) ± | | 4.55 | 6-1-2035 | 197,522 | 194,246 |
| FNMA (12 Month Treasury Average +1.74%) ± | | 4.58 | 10-1-2035 | 265,316 | 258,385 |
| FNMA (12 Month Treasury Average +1.80%) ± | | 4.60 | 11-1-2035 | 35,215 | 34,380 |
| FNMA (1 Year Treasury Constant Maturity +2.49%) ± | | 4.61 | 5-1-2035 | 291,492 | 292,893 |
| FNMA (1 Year Treasury Constant Maturity +1.63%) ± | | 4.63 | 11-1-2029 | 4,532 | 4,440 |
| FNMA (1 Year Treasury Constant Maturity +2.50%) ± | | 4.63 | 6-1-2032 | 63,895 | 62,464 |
| FNMA (1 Year Treasury Constant Maturity +2.52%) ± | | 4.64 | 11-1-2024 | 6,765 | 6,682 |
| FNMA (12 Month Treasury Average +1.85%) ± | | 4.65 | 11-1-2035 | 250,900 | 244,053 |
| FNMA (1 Year Treasury Constant Maturity +2.89%) ± | | 4.70 | 9-1-2030 | 82,302 | 81,199 |
| FNMA (12 Month Treasury Average +1.85%) ± | | 4.70 | 7-1-2035 | 279,342 | 272,656 |
| FNMA (1 Year Treasury Constant Maturity +2.60%) ± | | 4.72 | 10-1-2025 | 2,881 | 2,842 |
| FNMA (12 Month Treasury Average +1.91%) ± | | 4.72 | 7-1-2035 | 162,104 | 158,306 |
| FNMA (6 Month LIBOR +2.48%) ± | | 4.73 | 7-1-2033 | 24,814 | 24,311 |
| FNMA (12 Month Treasury Average +1.94%) ± | | 4.73 | 11-1-2035 | 11,830 | 11,623 |
| FNMA (1 Year Treasury Constant Maturity +2.49%) ± | | 4.74 | 4-1-2038 | 145,589 | 141,718 |
| FNMA (12 Month Treasury Average +1.96%) ± | | 4.75 | 11-1-2035 | 256,735 | 249,900 |
| FNMA (6 Month LIBOR +2.66%) ± | | 4.79 | 4-1-2024 | 13,602 | 13,448 |
| FNMA (1 Year Treasury Constant Maturity +3.02%) ± | | 4.79 | 1-1-2029 | 25,120 | 24,715 |
| FNMA (6 Month LIBOR +2.37%) ± | | 4.80 | 5-1-2033 | 438,858 | 432,696 |
| FNMA (12 Month Treasury Average +2.07%) ± | | 4.82 | 1-1-2035 | 214,320 | 210,595 |
| FNMA (1 Year Treasury Constant Maturity +2.64%) ± | | 4.83 | 10-1-2028 | 29,618 | 29,017 |
| FNMA (12 Month Treasury Average +2.05%) ± | | 4.84 | 10-1-2035 | 117,457 | 115,473 |
| FNMA (12 Month Treasury Average +2.11%) ± | | 4.91 | 8-1-2035 | 100,236 | 98,831 |
| FNMA (6 Month LIBOR +1.55%) ± | | 5.00 | 3-1-2034 | 77,860 | 77,914 |
| FNMA (6 Month LIBOR +3.36%) ± | | 5.07 | 12-1-2032 | 79,237 | 77,553 |
| FNMA (12 Month Treasury Average +2.36%) ± | | 5.15 | 8-1-2040 | 270,341 | 267,505 |
| FNMA (11th District COFI +1.90%) ± | | 5.25 | 5-1-2034 | 41,013 | 41,266 |
| FNMA (6 Month LIBOR +1.55%) ± | | 5.37 | 6-1-2037 | 415,804 | 422,589 |
| FNMA (12 Month LIBOR +1.64%) ± | | 5.37 | 9-1-2042 | 114,561 | 115,776 |
| FNMA (6 Month LIBOR +1.53%) ± | | 5.46 | 1-1-2035 | 379,614 | 383,435 |
| FNMA (1 Month LIBOR +1.17%) ± | | 5.55 | 5-1-2029 | 27,550 | 27,765 |
| FNMA (6 Month LIBOR +3.57%) ± | | 5.57 | 11-1-2031 | 664 | 653 |
| FNMA | | 6.50 | 8-1-2028 | 21,588 | 21,538 |
| FNMA | | 6.50 | 5-1-2031 | 21,429 | 21,969 |
| FNMA (6 Month LIBOR +1.38%) ± | | 6.50 | 8-1-2031 | 90,435 | 90,579 |
| FNMA (6 Month LIBOR +1.38%) ± | | 6.50 | 12-1-2031 | 13,257 | 13,227 |
The accompanying notes are an integral part of these financial statements.
16 | Allspring Adjustable Rate Government Fund
Portfolio of investments—February 28, 2023 (unaudited)
| | | Interest
rate | Maturity
date | Principal | Value |
| Agency securities (continued) | | | | | |
| FNMA (6 Month LIBOR +1.37%) ± | | 6.62% | 1-1-2032 | $ 102,943 | $ 103,060 |
| FNMA (12 Month LIBOR +1.59%) ± | | 6.80 | 2-1-2043 | 334,281 | 341,214 |
| FNMA | | 7.06 | 12-1-2024 | 7,321 | 7,302 |
| FNMA | | 7.06 | 1-1-2027 | 8,861 | 8,833 |
| FNMA | | 7.50 | 1-1-2031 | 15,126 | 15,131 |
| FNMA | | 7.50 | 1-1-2033 | 37,573 | 37,588 |
| FNMA | | 7.50 | 5-1-2033 | 37,546 | 37,559 |
| FNMA | | 7.50 | 5-1-2033 | 40,870 | 40,994 |
| FNMA | | 7.50 | 7-1-2033 | 18,518 | 18,490 |
| FNMA | | 7.50 | 8-1-2033 | 37,442 | 37,418 |
| FNMA | | 8.00 | 12-1-2026 | 16,145 | 16,168 |
| FNMA | | 8.00 | 3-1-2030 | 52 | 51 |
| FNMA | | 8.00 | 5-1-2033 | 30,559 | 30,491 |
| FNMA | | 8.50 | 8-15-2024 | 1,325 | 1,325 |
| FNMA Series 1993-113 Class FA (10 Year Treasury Constant Maturity -0.65%) ± | | 3.15 | 7-25-2023 | 1,004 | 1,004 |
| FNMA Series 1993-247 Class FM (12 Month LIBOR +1.20%) ± | | 6.64 | 12-25-2023 | 13,796 | 13,787 |
| FNMA Series 1994-14 Class F (12 Month LIBOR +1.60%) ± | | 7.04 | 10-25-2023 | 6,717 | 6,718 |
| FNMA Series 2001-50 Class BA | | 7.00 | 10-25-2041 | 55,212 | 56,400 |
| FNMA Series 2001-63 Class FD (1 Month LIBOR +0.60%) ± | | 5.20 | 12-18-2031 | 40,886 | 41,047 |
| FNMA Series 2001-81 Class F (1 Month LIBOR +0.55%) ± | | 5.17 | 1-25-2032 | 19,930 | 19,924 |
| FNMA Series 2001-T08 Class A1 | | 7.50 | 7-25-2041 | 57,817 | 57,731 |
| FNMA Series 2001-T10 Class A2 | | 7.50 | 12-25-2041 | 955,808 | 971,643 |
| FNMA Series 2001-T12 Class A2 | | 7.50 | 8-25-2041 | 73,547 | 75,281 |
| FNMA Series 2001-T12 Class A4 ±± | | 4.28 | 8-25-2041 | 1,729,205 | 1,727,479 |
| FNMA Series 2001-W01 Class AV1 (1 Month LIBOR +0.12%) ± | | 4.75 | 8-25-2031 | 16,826 | 16,025 |
| FNMA Series 2001-W03 Class A ±± | | 7.00 | 9-25-2041 | 212,194 | 206,686 |
| FNMA Series 2002-05 Class FD (1 Month LIBOR +0.90%) ± | | 5.52 | 2-25-2032 | 32,291 | 32,527 |
| FNMA Series 2002-59 Class F (1 Month LIBOR +0.40%) ± | | 5.02 | 9-25-2032 | 84,541 | 84,371 |
| FNMA Series 2002-66 Class A3 ±± | | 3.97 | 4-25-2042 | 3,766,715 | 3,689,580 |
| FNMA Series 2002-T12 Class A3 | | 7.50 | 5-25-2042 | 781,105 | 820,352 |
| FNMA Series 2002-T12 Class A5 ±± | | 4.60 | 10-25-2041 | 862,211 | 808,750 |
| FNMA Series 2002-T18 Class A5 ±± | | 4.38 | 5-25-2042 | 1,770,955 | 1,656,466 |
| FNMA Series 2002-T19 Class A4 ±± | | 4.51 | 3-25-2042 | 98,504 | 95,032 |
| FNMA Series 2002-W01 Class 3A ±± | | 3.55 | 4-25-2042 | 438,573 | 406,247 |
| FNMA Series 2002-W04 Class A6 ±± | | 3.86 | 5-25-2042 | 779,750 | 745,705 |
| FNMA Series 2003-07 Class A2 ±± | | 4.00 | 5-25-2042 | 300,820 | 296,968 |
| FNMA Series 2003-63 Class A8 ±± | | 3.68 | 1-25-2043 | 561,266 | 546,316 |
| FNMA Series 2003-T2 Class A1 (1 Month LIBOR +0.28%) ± | | 4.35 | 3-25-2033 | 715,282 | 707,367 |
| FNMA Series 2003-W02 Class 1A3 | | 7.50 | 7-25-2042 | 194,770 | 205,100 |
| FNMA Series 2003-W04 Class 5A ±± | | 3.73 | 10-25-2042 | 432,975 | 389,230 |
| FNMA Series 2003-W08 Class 4A ±± | | 4.02 | 11-25-2042 | 605,144 | 561,126 |
| FNMA Series 2003-W09 Class A (1 Month LIBOR +0.12%) ± | | 4.75 | 6-25-2033 | 901,351 | 870,752 |
| FNMA Series 2003-W10 Class 2A ±± | | 3.51 | 6-25-2043 | 1,162,434 | 1,054,872 |
| FNMA Series 2003-W18 Class 2A ±± | | 3.89 | 6-25-2043 | 1,449,061 | 1,364,944 |
| FNMA Series 2003-W6 Class 6A ±± | | 3.74 | 8-25-2042 | 503,039 | 481,522 |
| FNMA Series 2004-17 Class FT (1 Month LIBOR +0.40%) ± | | 5.02 | 4-25-2034 | 415,556 | 414,263 |
| FNMA Series 2004-T03 Class 1A3 | | 7.00 | 2-25-2044 | 235,457 | 244,887 |
| FNMA Series 2004-T03 Class 2A ±± | | 3.90 | 8-25-2043 | 604,341 | 591,457 |
| FNMA Series 2004-T1 Class 2A ±± | | 3.40 | 8-25-2043 | 731,897 | 671,973 |
| FNMA Series 2004-W01 Class 2A2 | | 7.00 | 12-25-2033 | 121,762 | 127,182 |
| FNMA Series 2004-W01 Class 3A ±± | | 4.16 | 1-25-2043 | 33,105 | 31,128 |
| FNMA Series 2004-W02 Class 5A | | 7.50 | 3-25-2044 | 39,316 | 40,959 |
| FNMA Series 2004-W12 Class 2A ±± | | 3.88 | 6-25-2044 | 1,835,708 | 1,710,751 |
| FNMA Series 2004-W15 Class 3A ±± | | 3.82 | 6-25-2044 | 2,559,111 | 2,412,963 |
The accompanying notes are an integral part of these financial statements.
Allspring Adjustable Rate Government Fund | 17
Portfolio of investments—February 28, 2023 (unaudited)
| | | Interest
rate | Maturity
date | Principal | Value |
| Agency securities (continued) | | | | | |
| FNMA Series 2005-25 Class PF (1 Month LIBOR +0.35%) ± | | 4.97% | 4-25-2035 | $ 547,058 | $ 540,370 |
| FNMA Series 2005-W03 Class 3A ±± | | 3.73 | 4-25-2045 | 472,668 | 452,885 |
| FNMA Series 2006-112 Class LF (1 Month LIBOR +0.55%) ± | | 5.17 | 11-25-2036 | 902,784 | 894,721 |
| FNMA Series 2006-16 Class FA (1 Month LIBOR +0.30%) ± | | 4.92 | 3-25-2036 | 367,626 | 363,838 |
| FNMA Series 2006-44 Class FY (1 Month LIBOR +0.57%) ± | | 5.19 | 6-25-2036 | 692,325 | 692,363 |
| FNMA Series 2006-5 Class 1-A ±± | | 3.19 | 8-25-2034 | 1,853,092 | 1,873,760 |
| FNMA Series 2006-50 Class FE (1 Month LIBOR +0.40%) ± | | 5.02 | 6-25-2036 | 1,171,146 | 1,164,429 |
| FNMA Series 2006-W01 Class 3A ±± | | 3.26 | 10-25-2045 | 1,649,809 | 1,608,037 |
| FNMA Series 2007-109 Class PF (1 Month LIBOR +0.65%) ± | | 5.27 | 12-25-2037 | 319,169 | 319,440 |
| FNMA Series 2007-4 Class DF (1 Month LIBOR +0.45%) ± | | 5.06 | 2-25-2037 | 535,682 | 521,435 |
| FNMA Series 2007-86 Class FA (1 Month LIBOR +0.45%) ± | | 5.07 | 9-25-2037 | 945,033 | 940,658 |
| FNMA Series 2007-95 Class A2 (1 Month LIBOR +0.25%) ± | | 4.25 | 8-27-2036 | 95,469 | 92,564 |
| FNMA Series 2008-67 Class FG (1 Month LIBOR +1.00%) ± | | 5.62 | 7-25-2038 | 498,343 | 508,190 |
| FNMA Series 2009-106 Class FA (1 Month LIBOR +0.75%) ± | | 5.37 | 1-25-2040 | 776,781 | 782,369 |
| FNMA Series 2009-11 Class FU (1 Month LIBOR +1.00%) ± | | 5.62 | 3-25-2049 | 156,273 | 156,993 |
| FNMA Series 2010-27 Class BF (1 Month LIBOR +0.55%) ± | | 5.17 | 4-25-2040 | 1,559,615 | 1,556,453 |
| FNMA Series 2010-54 Class AF (1 Month LIBOR +0.56%) ± | | 5.18 | 4-25-2037 | 213,381 | 213,112 |
| FNMA Series 2010-54 Class FT (1 Month LIBOR +0.76%) ± | | 5.38 | 4-25-2037 | 3,189,457 | 3,225,055 |
| FNMA Series 2010-8 Class FE (1 Month LIBOR +0.79%) ± | | 5.41 | 2-25-2040 | 2,543,500 | 2,567,276 |
| FNMA Series 2011-21 Class PF (1 Month LIBOR +0.35%) ± | | 4.97 | 12-25-2041 | 196,095 | 193,182 |
| FNMA Series 2011-71 Class FA (1 Month LIBOR +0.62%) ± | | 5.24 | 12-25-2036 | 1,504,671 | 1,507,222 |
| FNMA Series 2012-122 Class FM (1 Month LIBOR +0.40%) ± | | 5.02 | 11-25-2042 | 898,516 | 879,982 |
| FNMA Series 2012-17 Class EF (1 Month LIBOR +0.45%) ± | | 5.07 | 3-25-2041 | 1,162,022 | 1,161,481 |
| FNMA Series 2012-47 Class FW (1 Month LIBOR +1.70%) ± | | 6.32 | 5-25-2027 | 80,156 | 81,733 |
| FNMA Series 2013-130 Class CF (1 Month LIBOR +0.25%) ± | | 4.87 | 6-25-2043 | 301,989 | 298,933 |
| FNMA Series 2013-23 Class LF (1 Month LIBOR +0.35%) ± | | 3.92 | 3-25-2043 | 2,788,388 | 2,744,148 |
| FNMA Series 2014-10 Class CF (1 Month LIBOR +0.30%) ± | | 3.98 | 3-25-2044 | 582,833 | 570,664 |
| FNMA Series 2014-49 Class AF (1 Month LIBOR +0.32%) ± | | 3.67 | 8-25-2044 | 113,095 | 111,264 |
| FNMA Series 2015-38 Class DF (1 Month LIBOR +0.31%) ± | | 3.83 | 6-25-2055 | 1,443,867 | 1,428,468 |
| FNMA Series 2015-4 Class FA (1 Month LIBOR +0.35%) ± | | 3.81 | 2-25-2045 | 881,292 | 868,137 |
| FNMA Series 2016-40 Class AF (1 Month LIBOR +0.45%) ± | | 3.71 | 7-25-2046 | 4,181,243 | 4,121,774 |
| FNMA Series 2016-58 Class FA (1 Month LIBOR +0.48%) ± | | 3.91 | 8-25-2046 | 414,467 | 404,689 |
| FNMA Series 2016-62 Class AF (1 Month LIBOR +0.45%) ± | | 3.66 | 9-25-2046 | 536,439 | 532,174 |
| FNMA Series 2016-64 Class KF (1 Month LIBOR +0.47%) ± | | 3.82 | 9-25-2046 | 1,083,719 | 1,072,476 |
| FNMA Series 2016-76 Class CF (1 Month LIBOR +0.45%) ± | | 3.89 | 10-25-2046 | 649,781 | 640,966 |
| FNMA Series 2016-82 Class FM (1 Month LIBOR +0.40%) ± | | 3.82 | 11-25-2046 | 1,314,229 | 1,294,090 |
| FNMA Series 2016-87 Class AF (1 Month LIBOR +0.40%) ± | | 3.61 | 11-25-2046 | 286,198 | 281,046 |
| FNMA Series 2017-45 Class FA (1 Month LIBOR +0.32%) ± | | 3.75 | 6-25-2047 | 3,366,480 | 3,309,051 |
| FNMA Series 2017-M9 Class F (1 Month LIBOR +0.48%) ± | | 5.10 | 5-25-2029 | 4,593,248 | 4,513,453 |
| FNMA Series 2018-39 Class WF (1 Month LIBOR +0.30%) ± | | 3.60 | 6-25-2048 | 3,047,917 | 3,005,877 |
| FNMA Series 2018-47 Class PC | | 3.50 | 9-25-2047 | 160,052 | 150,658 |
| FNMA Series 2019-25 Class FA (1 Month LIBOR +0.45%) ± | | 5.07 | 6-25-2049 | 263,261 | 257,798 |
| FNMA Series 2019-38 Class AF (1 Month LIBOR +0.40%) ± | | 3.79 | 7-25-2049 | 3,454,267 | 3,460,113 |
| FNMA Series 2019-41 Class F (1 Month LIBOR +0.50%) ± | | 5.12 | 8-25-2059 | 2,317,658 | 2,279,995 |
| FNMA Series 2019-42 Class MF (1 Month LIBOR +0.40%) ± | | 3.75 | 8-25-2059 | 1,812,176 | 1,773,043 |
| FNMA Series 2019-5 Class FE (1 Month LIBOR +0.45%) ± | | 5.07 | 3-25-2049 | 373,481 | 365,669 |
| FNMA Series 2019-53 Class FA (1 Month LIBOR +0.40%) ± | | 3.61 | 9-25-2049 | 1,416,186 | 1,387,381 |
| FNMA Series 2020-10 Class Q | | 3.00 | 3-25-2050 | 2,714,434 | 2,418,211 |
| FNMA Series 2020-29 Class FA (1 Month LIBOR +0.65%) ± | | 3.68 | 5-25-2050 | 935,260 | 927,957 |
| FNMA Series 2021-85 Class EF (30 Day Average U.S. SOFR +0.18%) ± | | 4.23 | 12-25-2051 | 3,547,588 | 3,657,829 |
| GNMA (1 Year Treasury Constant Maturity +1.50%) ± | | 2.63 | 1-20-2034 | 812,960 | 795,833 |
| GNMA (1 Year Treasury Constant Maturity +2.00%) ± | | 3.13 | 1-20-2041 | 22,595 | 22,496 |
| GNMA (1 Year Treasury Constant Maturity +2.00%) ± | | 3.38 | 4-20-2041 | 26,082 | 25,877 |
| GNMA (1 Month LIBOR +0.62%) ± | | 5.01 | 5-20-2058 | 127,283 | 127,358 |
The accompanying notes are an integral part of these financial statements.
18 | Allspring Adjustable Rate Government Fund
Portfolio of investments—February 28, 2023 (unaudited)
| | | Interest
rate | Maturity
date | Principal | Value |
| Agency securities (continued) | | | | | |
| GNMA (1 Year Treasury Constant Maturity +1.40%) ± | | 6.04% | 6-20-2058 | $ 26,005 | $ 26,104 |
| GNMA | | 6.45 | 4-20-2025 | 11,369 | 11,461 |
| GNMA | | 6.45 | 9-20-2025 | 14,355 | 15,017 |
| GNMA | | 6.50 | 8-20-2034 | 114,585 | 111,723 |
| GNMA | | 9.00 | 9-20-2024 | 244 | 244 |
| GNMA | | 9.00 | 11-20-2024 | 28 | 28 |
| GNMA | | 9.00 | 1-20-2025 | 325 | 325 |
| GNMA | | 9.00 | 2-20-2025 | 1,442 | 1,445 |
| GNMA Series 2004-80 Class FA (1 Month LIBOR +0.40%) ± | | 5.00 | 10-20-2034 | 361,465 | 360,982 |
| GNMA Series 2006-16 Class DF (1 Month LIBOR +0.11%) ± | | 4.71 | 4-20-2036 | 1,826,508 | 1,810,865 |
| GNMA Series 2008-65 Class FG (1 Month LIBOR +0.75%) ± | | 5.35 | 8-20-2038 | 628,791 | 633,361 |
| GNMA Series 2008-68 Class FA (1 Month LIBOR +0.95%) ± | | 5.55 | 8-20-2038 | 775,537 | 785,018 |
| GNMA Series 2009-12 Class FA (1 Month LIBOR +0.95%) ± | | 5.55 | 3-20-2039 | 1,000,093 | 1,010,224 |
| GNMA Series 2009-15 Class FL (1 Month LIBOR +0.95%) ± | | 5.55 | 3-20-2039 | 1,000,093 | 1,008,809 |
| GNMA Series 2009-29 Class FL (1 Month LIBOR +0.65%) ± | | 5.24 | 5-16-2039 | 1,074,214 | 1,079,732 |
| GNMA Series 2009-36 Class FE (1 Month LIBOR +0.80%) ± | | 5.40 | 9-20-2038 | 1,009,353 | 1,017,138 |
| GNMA Series 2009-50 Class FW (1 Month LIBOR +1.00%) ± | | 5.60 | 7-20-2039 | 757,311 | 768,796 |
| GNMA Series 2009-52 Class FD (1 Month LIBOR +0.95%) ± | | 5.54 | 7-16-2039 | 376,870 | 381,286 |
| GNMA Series 2010-25 Class FH (1 Month LIBOR +0.72%) ± | | 5.31 | 2-16-2040 | 527,126 | 528,598 |
| GNMA Series 2010-79 Class YF (1 Month LIBOR +0.35%) ± | | 4.95 | 5-20-2035 | 1,747,207 | 1,735,662 |
| GNMA Series 2011-117 Class FJ (1 Month LIBOR +0.87%) ± | | 5.47 | 8-20-2041 | 976,661 | 990,756 |
| GNMA Series 2011-H12 Class FA (1 Month LIBOR +0.49%) ± | | 4.88 | 2-20-2061 | 402,299 | 400,595 |
| GNMA Series 2011-H17 Class FA (1 Month LIBOR +0.53%) ± | | 4.92 | 6-20-2061 | 344,363 | 343,214 |
| GNMA Series 2012-124 Class GF (1 Month LIBOR +0.25%) ± | | 4.85 | 10-20-2042 | 1,090,679 | 1,076,130 |
| GNMA Series 2014-44 Class IA ♀ | | 3.50 | 5-20-2028 | 1,711,144 | 70,518 |
| GNMA Series 2014-H16 Class FL (1 Month LIBOR +0.47%) ± | | 4.65 | 7-20-2064 | 713,281 | 704,137 |
| GNMA Series 2014-H22 Class FC (1 Month LIBOR +0.48%) ± | | 4.87 | 11-20-2064 | 1,478,511 | 1,470,503 |
| GNMA Series 2015-H23 Class TA (1 Month LIBOR +0.47%) ± | | 4.86 | 9-20-2065 | 1,437,464 | 1,428,686 |
| GNMA Series 2016-H24 Class FD (12 Month LIBOR +0.30%) ± | | 4.43 | 11-20-2066 | 349,140 | 345,583 |
| GNMA Series 2017-130 Class FH (1 Month LIBOR +0.30%) ± | | 4.90 | 8-20-2047 | 1,673,500 | 1,631,487 |
| GNMA Series 2017-H11 Class FE (12 Month LIBOR +0.18%) ± | | 2.35 | 5-20-2067 | 2,663,452 | 2,625,333 |
| GNMA Series 2018-120 Class FL (1 Month LIBOR +0.30%) ± | | 4.90 | 9-20-2048 | 244,689 | 238,729 |
| GNMA Series 2018-49 Class FM (1 Month LIBOR +0.25%) ± | | 4.85 | 4-20-2048 | 1,164,091 | 1,134,578 |
| GNMA Series 2018-H07 Class FD (1 Month LIBOR +0.30%) ± | | 4.69 | 5-20-2068 | 339,672 | 339,034 |
| GNMA Series 2018-H13 Class FC (1 Month LIBOR +0.30%) ± | | 4.69 | 7-20-2068 | 271,574 | 269,045 |
| GNMA Series 2019-103 Class FG (1 Month LIBOR +0.45%) ± | | 5.05 | 4-20-2049 | 1,030,716 | 1,013,607 |
| GNMA Series 2019-129 Class WF (1 Month LIBOR +0.40%) ± | | 4.97 | 2-20-2046 | 1,285,587 | 1,244,572 |
| GNMA Series 2019-H06 Class FD (1 Month LIBOR +0.72%) ± | | 5.11 | 1-20-2069 | 607,874 | 592,433 |
| GNMA Series 2019-H09 Class FE (1 Month LIBOR +0.50%) ± | | 4.89 | 4-20-2069 | 945,946 | 935,585 |
| GNMA Series 2019-H10 Class FB (1 Month LIBOR +0.60%) ± | | 2.97 | 6-20-2069 | 2,863,374 | 2,783,598 |
| GNMA Series 2019-H15 Class FE (1 Month LIBOR +0.63%) ± | | 5.02 | 9-20-2069 | 1,936,158 | 1,906,596 |
| GNMA Series 2020-H12 Class F (1 Month LIBOR +0.50%) ± | | 4.89 | 7-20-2070 | 742,706 | 724,088 |
| GNMA Series 2020-H19 Class FB (1 Month LIBOR +0.45%) ± | | 4.84 | 11-20-2070 | 2,330,209 | 2,273,219 |
| GNMA Series 2021-H01 Class FC (1 Month LIBOR +0.40%) ± | | 3.90 | 11-20-2070 | 1,449,895 | 1,406,845 |
| GNMA Series 2021-H14 Class FA (30 Day Average U.S. SOFR +0.30%) ± | | 2.78 | 4-20-2070 | 3,613,027 | 3,470,718 |
| Total Agency securities (Cost $310,950,419) | | | | | 302,660,940 |
| Asset-backed securities: 4.85% | | | | | |
| Brazos Education Funding Series 2015-1 Class A (1 Month LIBOR +1.00%) 144A± | | 5.62 | 10-25-2056 | 1,490,633 | 1,478,331 |
| Cal Dive I Title XI Incorporated | | 4.93 | 2-1-2027 | 2,318,125 | 2,284,398 |
| EFS Volunteer LLC Series 2010-1 Class A2 (3 Month LIBOR +0.85%) 144A± | | 5.67 | 10-25-2035 | 298,095 | 296,789 |
The accompanying notes are an integral part of these financial statements.
Allspring Adjustable Rate Government Fund | 19
Portfolio of investments—February 28, 2023 (unaudited)
| | | Interest
rate | Maturity
date | Principal | Value |
| Asset-backed securities (continued) | | | | | |
| Navient Student Loan Trust Series 2018-3A Class A2 (1 Month LIBOR +0.42%) 144A± | | 5.04% | 3-25-2067 | $ 308,123 | $ 307,892 |
| Navient Student Loan Trust Series 2018-4A Class A2 (1 Month LIBOR +0.68%) 144A± | | 5.30 | 6-27-2067 | 3,589,899 | 3,513,393 |
| Navient Student Loan Trust Series 2020-GA Class A 144A | | 1.17 | 9-16-2069 | 1,102,422 | 979,268 |
| Navient Student Loan Trust Series 2021-1A Class A1B (1 Month LIBOR +0.60%) 144A± | | 5.22 | 12-26-2069 | 828,297 | 811,521 |
| Nelnet Student Loan Trust Series 2019-2A Class A (1 Month LIBOR +0.90%) 144A± | | 5.52 | 6-27-2067 | 2,840,169 | 2,801,163 |
| Nelnet Student Loan Trust Series 2019-4A Class A (1 Month LIBOR +0.87%) 144A± | | 5.49 | 9-26-2067 | 592,394 | 584,234 |
| Nelnet Student Loan Trust Series 2019-7A Class A1 (1 Month LIBOR +0.50%) 144A± | | 5.12 | 1-25-2068 | 106,231 | 106,154 |
| SLM Student Loan Trust Series 2003-10A Class A4 (3 Month LIBOR +0.67%) 144A± | | 5.44 | 12-17-2068 | 3,362,811 | 3,294,723 |
| SLM Student Loan Trust Series 2004-10 Class A7B (3 Month LIBOR +0.60%) 144A± | | 5.42 | 10-25-2029 | 207,247 | 205,194 |
| Total Asset-backed securities (Cost $17,104,653) | | | | | 16,663,060 |
| Non-agency mortgage-backed securities: 5.46% | | | | | |
| Angel Oak Mortgage Trust I LLC Series 2020-R1 Class A1 144A±± | | 0.99 | 4-25-2053 | 662,497 | 609,771 |
| Cascade Funding Mortgage Trust Series 2020-HB4 Class A 144A±± | | 0.95 | 12-26-2030 | 759,598 | 737,966 |
| Credit Suisse Mortgage Trust Series 2022-NQM1 Class A1 144A±± | | 2.27 | 11-25-2066 | 2,747,377 | 2,373,664 |
| FRESB Mortgage Trust Series 2022-SB94 Class A5H ±± | | 1.72 | 11-25-2041 | 5,929,205 | 5,373,325 |
| Goldman Sachs Mortgage-Backed Securities Trust Series 2020-PJ4 Class A2 144A±± | | 3.00 | 1-25-2051 | 653,955 | 551,373 |
| Imperial Fund Mortgage Trust Series 2021-NQM2 Class A2 144A±± | | 1.36 | 9-25-2056 | 637,021 | 500,229 |
| Imperial Fund Mortgage Trust Series 2022-NQM1 Class A1 144A±± | | 2.49 | 2-25-2067 | 2,435,878 | 2,133,762 |
| JPMorgan Mortgage Trust Series 2016-5 Class A1 144A±± | | 5.79 | 12-25-2046 | 534,431 | 512,980 |
| MFRA Trust Series 2020-NQM3 Class A1 144A±± | | 1.01 | 1-26-2065 | 299,790 | 274,490 |
| New Residential Mortgage Loan Trust Series 2018-4A Class A1M (1 Month LIBOR +0.90%) 144A± | | 5.52 | 1-25-2048 | 1,028,113 | 1,006,614 |
| New Residential Mortgage Loan Trust Series 2020-RPL1 Class A1 144A±± | | 2.75 | 11-25-2059 | 202,424 | 187,950 |
| Onslow Bay Financial LLC Series 2022-NQM1 Class A1 144A±± | | 2.31 | 11-25-2061 | 2,871,042 | 2,390,442 |
| Starwood Commercial Mortgage Trust Series 2022-FL3 Class A (30 Day Average U.S. SOFR +1.35%) 144A± | | 5.75 | 11-15-2038 | 960,000 | 928,026 |
| Starwood Mortgage Residential Trust Series 2021-2 Class A1 144A±± | | 0.94 | 5-25-2065 | 807,338 | 743,310 |
| Towd Point Mortgage Trust Series 2017-5 Class A1 (1 Month LIBOR +0.60%) 144A± | | 4.20 | 2-25-2057 | 451,313 | 449,718 |
| Total Non-agency mortgage-backed securities (Cost $20,996,895) | | | | | 18,773,620 |
The accompanying notes are an integral part of these financial statements.
20 | Allspring Adjustable Rate Government Fund
Portfolio of investments—February 28, 2023 (unaudited)
| | | Yield | | Shares | Value |
| Short-term investments: 0.88% | | | | | |
| Investment companies: 0.88% | | | | | |
| Allspring Government Money Market Fund Select Class ♠∞ | | 4.39% | | 3,030,873 | $ 3,030,873 |
| Total Short-term investments (Cost $3,030,873) | | | | | 3,030,873 |
| Total investments in securities (Cost $352,082,840) | 99.21% | | | | 341,128,493 |
| Other assets and liabilities, net | 0.79 | | | | 2,707,338 |
| Total net assets | 100.00% | | | | $343,835,831 |
| ± | Variable rate investment. The rate shown is the rate in effect at period end. |
| ±± | The coupon of the security is adjusted based on the principal and/or interest payments received from the underlying pool of mortgages as well as the credit quality and the actual prepayment speed of the underlying mortgages. The rate shown is the rate in effect at period end. |
| ♀ | Investment in an interest-only security that entitles holders to receive only the interest payments on the underlying mortgages. The principal amount shown is the notional amount of the underlying mortgages. The rate represents the coupon rate. |
| 144A | The security may be resold in transactions exempt from registration, normally to qualified institutional buyers, pursuant to Rule 144A under the Securities Act of 1933. |
| ♠ | The issuer of the security is an affiliated person of the Fund as defined in the Investment Company Act of 1940. |
| ∞ | The rate represents the 7-day annualized yield at period end. |
| Abbreviations: |
| COFI | Cost of Funds Index |
| FHLMC | Federal Home Loan Mortgage Corporation |
| FNMA | Federal National Mortgage Association |
| GNMA | Government National Mortgage Association |
| LIBOR | London Interbank Offered Rate |
| SOFR | Secured Overnight Financing Rate |
Investments in affiliates
An affiliated investment is an investment in which the Fund owns at least 5% of the outstanding voting shares of the issuer or as a result of other relationships, such as the Fund and the issuer having the same investment manager. Transactions with issuers that were affiliates of the Fund at the end of the period were as follows:
| | Value,
beginning of
period | Purchases | Sales
proceeds | Net
realized
gains
(losses) | Net
change in
unrealized
gains
(losses) | Value,
end of
period | Shares,
end
of period | Income
from
affiliated
securities |
| Short-term investments | | | | | | | |
| Allspring Government Money Market Fund Select Class | $1,904,979 | $92,123,631 | $(90,997,737) | $0 | $0 | $3,030,873 | 3,030,873 | $48,234 |
Futures contracts
| Description | Number of
contracts | Expiration
date | Notional
cost | Notional
value | Unrealized
gains | | Unrealized
losses |
| Short | | | | | | | |
| 10-Year U.S. Treasury Notes | (56) | 6-21-2023 | $ (6,263,212) | $ (6,252,750) | $ 10,462 | | $0 |
| 2-Year U.S. Treasury Notes | (543) | 6-30-2023 | (110,894,103) | (110,623,523) | 270,580 | | 0 |
| 5-Year U.S. Treasury Notes | (261) | 6-30-2023 | (28,009,815) | (27,941,273) | 68,542 | | 0 |
| | | | | | $349,584 | | $0 |
The accompanying notes are an integral part of these financial statements.
Allspring Adjustable Rate Government Fund | 21
Statement of assets and liabilities—February 28, 2023 (unaudited)
| | |
| Assets | |
Investments in unaffiliated securities, at value (cost $349,051,967)
| $ 338,097,620 |
Investments in affiliated securities, at value (cost $3,030,873)
| 3,030,873 |
Cash
| 104,177 |
Cash at broker segregated for futures contracts
| 1,146,000 |
Principal paydown receivable
| 1,149,489 |
Receivable for interest
| 1,091,293 |
Receivable for Fund shares sold
| 57,654 |
Receivable for daily variation margin on open futures contracts
| 12,142 |
Receivable for investments sold
| 2,947 |
Prepaid expenses and other assets
| 71,861 |
Total assets
| 344,764,056 |
| Liabilities | |
Payable for Fund shares redeemed
| 696,968 |
Dividends payable
| 96,258 |
Management fee payable
| 76,324 |
Administration fees payable
| 26,624 |
Distribution fee payable
| 1,753 |
Accrued expenses and other liabilities
| 30,298 |
Total liabilities
| 928,225 |
Total net assets
| $343,835,831 |
| Net assets consist of | |
Paid-in capital
| $ 351,469,006 |
Total distributable loss
| (7,633,175) |
Total net assets
| $343,835,831 |
| Computation of net asset value and offering price per share | |
Net assets – Class A
| $ 76,685,238 |
Shares outstanding – Class A1
| 8,797,224 |
Net asset value per share – Class A
| $8.72 |
Maximum offering price per share – Class A2
| $8.90 |
Net assets – Class C
| $ 2,996,019 |
Shares outstanding – Class C1
| 344,336 |
Net asset value per share – Class C
| $8.70 |
Net assets – Administrator Class
| $ 4,964,285 |
Shares outstanding – Administrator Class1
| 569,269 |
Net asset value per share – Administrator Class
| $8.72 |
Net assets – Institutional Class
| $ 259,190,289 |
Shares outstanding – Institutional Class1
| 29,735,409 |
Net asset value per share – Institutional Class
| $8.72 |
| 1 | The Fund has an unlimited number of authorized shares. |
| 2 | Maximum offering price is computed as 100/98 of net asset value. On investments of $100,000 or more, the offering price is reduced. |
The accompanying notes are an integral part of these financial statements.
22 | Allspring Adjustable Rate Government Fund
Statement of operations—six months ended February 28, 2023 (unaudited)
| | |
| Investment income | |
Interest
| $ 5,686,082 |
Income from affiliated securities
| 48,234 |
Total investment income
| 5,734,316 |
| Expenses | |
Management fee
| 678,148 |
| Administration fees | |
Class A
| 62,277 |
Class C
| 2,487 |
Administrator Class
| 2,865 |
Institutional Class
| 120,331 |
| Shareholder servicing fees | |
Class A
| 96,954 |
Class C
| 3,886 |
Administrator Class
| 7,131 |
| Distribution fee | |
Class C
| 11,658 |
Custody and accounting fees
| 19,253 |
Professional fees
| 44,016 |
Registration fees
| 29,969 |
Shareholder report expenses
| 11,887 |
Trustees’ fees and expenses
| 10,625 |
Other fees and expenses
| 33,464 |
Total expenses
| 1,134,951 |
| Less: Fee waivers and/or expense reimbursements | |
Fund-level
| (91,896) |
Class A
| (18,473) |
Class C
| (749) |
Administrator Class
| (3,622) |
Net expenses
| 1,020,211 |
Net investment income
| 4,714,105 |
| Realized and unrealized gains (losses) on investments | |
| Net realized gains (losses) on | |
Unaffiliated securities
| (957,696) |
Futures contracts
| 3,986,698 |
Net realized gains on investments
| 3,029,002 |
| Net change in unrealized gains (losses) on | |
Unaffiliated securities
| (2,294,135) |
Futures contracts
| 243,719 |
Net change in unrealized gains (losses) on investments
| (2,050,416) |
Net realized and unrealized gains (losses) on investments
| 978,586 |
Net increase in net assets resulting from operations
| $ 5,692,691 |
The accompanying notes are an integral part of these financial statements.
Allspring Adjustable Rate Government Fund | 23
Statement of changes in net assets
| | | | | |
| | Six months ended
February 28, 2023
(unaudited) | Year ended
August 31, 2022 |
| Operations | | | | |
Net investment income
| | $ 4,714,105 | | $ 2,748,623 |
Net realized gains on investments
| | 3,029,002 | | 6,184,988 |
Net change in unrealized gains (losses) on investments
| | (2,050,416) | | (12,024,183) |
Net increase (decrease) in net assets resulting from operations
| | 5,692,691 | | (3,090,572) |
| Distributions to shareholders from | | | | |
| Net investment income and net realized gains | | | | |
Class A
| | (2,098,313) | | (692,300) |
Class C
| | (69,695) | | (14,135) |
Administrator Class
| | (155,834) | | (71,924) |
Institutional Class
| | (8,453,964) | | (4,255,890) |
Total distributions to shareholders
| | (10,777,806) | | (5,034,249) |
| Capital share transactions | Shares | | Shares | |
| Proceeds from shares sold | | | | |
Class A
| 278,147 | 2,421,635 | 593,643 | 5,293,269 |
Class C
| 115,025 | 1,007,868 | 123,328 | 1,091,402 |
Administrator Class
| 27,047 | 238,640 | 804,889 | 7,188,561 |
Institutional Class
| 4,888,477 | 42,976,447 | 43,022,173 | 383,515,387 |
| | | 46,644,590 | | 397,088,619 |
| Reinvestment of distributions | | | | |
Class A
| 209,616 | 1,816,390 | 66,182 | 589,152 |
Class C
| 7,942 | 68,590 | 1,573 | 14,008 |
Administrator Class
| 17,715 | 153,565 | 7,992 | 71,176 |
Institutional Class
| 871,988 | 7,558,244 | 415,798 | 3,699,149 |
| | | 9,596,789 | | 4,373,485 |
| Payment for shares redeemed | | | | |
Class A
| (1,014,890) | (8,865,622) | (2,188,993) | (19,473,541) |
Class C
| (131,012) | (1,144,507) | (141,789) | (1,259,441) |
Administrator Class
| (196,689) | (1,718,407) | (1,017,358) | (9,065,328) |
Institutional Class
| (16,093,078) | (140,895,012) | (52,928,850) | (471,262,780) |
| | | (152,623,548) | | (501,061,090) |
Net decrease in net assets resulting from capital share transactions
| | (96,382,169) | | (99,598,986) |
Total decrease in net assets
| | (101,467,284) | | (107,723,807) |
| Net assets | | | | |
Beginning of period
| | 445,303,115 | | 553,026,922 |
End of period
| | $ 343,835,831 | | $ 445,303,115 |
The accompanying notes are an integral part of these financial statements.
24 | Allspring Adjustable Rate Government Fund
Financial highlights
(For a share outstanding throughout each period)
| | | Year ended August 31 |
| Class A | Six months ended
February 28, 2023
(unaudited) | 2022 | 2021 | 2020 | 2019 | 2018 |
Net asset value, beginning of period
| $8.82 | $8.96 | $8.92 | $8.98 | $8.93 | $8.96 |
Net investment income
| 0.09 | 0.02 | 0.04 | 0.17 | 0.18 1 | 0.10 |
Net realized and unrealized gains (losses) on investments
| 0.04 | (0.09) | 0.05 | (0.06) | 0.05 | (0.01) |
Total from investment operations
| 0.13 | (0.07) | 0.09 | 0.11 | 0.23 | 0.09 |
| Distributions to shareholders from | | | | | | |
Net investment income
| (0.09) | (0.03) | (0.05) | (0.17) | (0.18) | (0.12) |
Net realized gains
| (0.14) | (0.04) | 0.00 | (0.00) 2 | 0.00 | 0.00 |
Total distributions to shareholders
| (0.23) | (0.07) | (0.05) | (0.17) | (0.18) | (0.12) |
Net asset value, end of period
| $8.72 | $8.82 | $8.96 | $8.92 | $8.98 | $8.93 |
Total return3
| 1.47% | (0.81)% | 0.99% | 1.25% | 2.64% | 0.98% |
| Ratios to average net assets (annualized) | | | | | | |
Gross expenses
| 0.84% | 0.82% | 0.82% | 0.88% | 0.88% | 0.83% |
Net expenses
| 0.74% | 0.74% | 0.74% | 0.74% | 0.74% | 0.74% |
Net investment income
| 2.25% | 0.30% | 0.49% | 1.92% | 2.04% | 1.28% |
| Supplemental data | | | | | | |
Portfolio turnover rate
| 3% | 36% | 53% | 9% | 5% | 3% |
Net assets, end of period (000s omitted)
| $76,685 | $82,283 | $97,274 | $111,538 | $118,675 | $103,963 |
| 1 | Calculated based upon average shares outstanding |
| 2 | Amount is less than $0.005. |
| 3 | Total return calculations do not include any sales charges. Returns for periods of less than one year are not annualized. |
The accompanying notes are an integral part of these financial statements.
Allspring Adjustable Rate Government Fund | 25
Financial highlights
(For a share outstanding throughout each period)
| | | Year ended August 31 |
| Class C | Six months ended
February 28, 2023
(unaudited) | 2022 | 2021 | 2020 | 2019 | 2018 |
Net asset value, beginning of period
| $8.81 | $8.95 | $8.91 | $8.97 | $8.93 | $8.96 |
Net investment income (loss)
| 0.06 1 | 0.00 1,2 | (0.00) 1,3 | 0.10 1 | 0.10 1 | 0.05 1 |
Net realized and unrealized gains (losses) on investments
| 0.03 | (0.10) | 0.04 | (0.06) | 0.06 | (0.03) |
Total from investment operations
| 0.09 | (0.10) | 0.04 | 0.04 | 0.16 | 0.02 |
| Distributions to shareholders from | | | | | | |
Net investment income
| (0.06) | (0.00) 2 | (0.00) 2 | (0.10) | (0.12) | (0.05) |
Net realized gains
| (0.14) | (0.04) | 0.00 | (0.00) 2 | 0.00 | 0.00 |
Total distributions to shareholders
| (0.20) | (0.04) | (0.00) 2 | (0.10) | (0.12) | (0.05) |
Net asset value, end of period
| $8.70 | $8.81 | $8.95 | $8.91 | $8.97 | $8.93 |
Total return4
| 1.10% | (1.08)% | 0.48% | 0.50% | 1.76% | 0.23% |
| Ratios to average net assets (annualized) | | | | | | |
Gross expenses
| 1.59% | 1.57% | 1.57% | 1.63% | 1.62% | 1.55% |
Net expenses
| 1.49% | 1.02% * | 1.27% * | 1.49% | 1.49% | 1.49% |
Net investment income (loss)
| 1.49% | 0.04% | (0.02)% | 1.17% | 1.13% | 0.54% |
| Supplemental data | | | | | | |
Portfolio turnover rate
| 3% | 36% | 53% | 9% | 5% | 3% |
Net assets, end of period (000s omitted)
| $2,996 | $3,104 | $3,304 | $4,702 | $6,594 | $45,693 |
| * | Ratio includes class-level expenses which were voluntarily waived by the investment manager. Without this voluntary waiver, the net expense ratio would be increased by the following amounts: |
| Year ended August 31, 2022 | 0.47% |
| Year ended August 31, 2021 | 0.22% |
| 1 | Calculated based upon average shares outstanding |
| 2 | Amount is less than $0.005. |
| 3 | Amount is more than $(0.005) |
| 4 | Total return calculations do not include any sales charges. Returns for periods of less than one year are not annualized. |
The accompanying notes are an integral part of these financial statements.
26 | Allspring Adjustable Rate Government Fund
Financial highlights
(For a share outstanding throughout each period)
| | | Year ended August 31 |
| Administrator Class | Six months ended
February 28, 2023
(unaudited) | 2022 | 2021 | 2020 | 2019 | 2018 |
Net asset value, beginning of period
| $8.83 | $8.97 | $8.92 | $8.98 | $8.93 | $8.96 |
Net investment income
| 0.10 1 | 0.04 1 | 0.06 1 | 0.18 1 | 0.19 1 | 0.13 1 |
Net realized and unrealized gains (losses) on investments
| 0.03 | (0.10) | 0.05 | (0.06) | 0.06 | (0.03) |
Total from investment operations
| 0.13 | (0.06) | 0.11 | 0.12 | 0.25 | 0.10 |
| Distributions to shareholders from | | | | | | |
Net investment income
| (0.10) | (0.04) | (0.06) | (0.18) | (0.20) | (0.13) |
Net realized gains
| (0.14) | (0.04) | 0.00 | (0.00) 2 | 0.00 | 0.00 |
Total distributions to shareholders
| (0.24) | (0.08) | (0.06) | (0.18) | (0.20) | (0.13) |
Net asset value, end of period
| $8.72 | $8.83 | $8.97 | $8.92 | $8.98 | $8.93 |
Total return3
| 1.54% | (0.67)% | 1.24% | 1.40% | 2.78% | 1.12% |
| Ratios to average net assets (annualized) | | | | | | |
Gross expenses
| 0.78% | 0.76% | 0.76% | 0.81% | 0.81% | 0.77% |
Net expenses
| 0.60% | 0.60% | 0.60% | 0.60% | 0.60% | 0.60% |
Net investment income
| 2.35% | 0.43% | 0.64% | 1.98% | 2.12% | 1.42% |
| Supplemental data | | | | | | |
Portfolio turnover rate
| 3% | 36% | 53% | 9% | 5% | 3% |
Net assets, end of period (000s omitted)
| $4,964 | $6,367 | $8,299 | $8,076 | $5,337 | $9,140 |
| 1 | Calculated based upon average shares outstanding |
| 2 | Amount is less than $0.005. |
| 3 | Returns for periods of less than one year are not annualized. |
The accompanying notes are an integral part of these financial statements.
Allspring Adjustable Rate Government Fund | 27
Financial highlights
(For a share outstanding throughout each period)
| | | Year ended August 31 |
| Institutional Class | Six months ended
February 28, 2023
(unaudited) | 2022 | 2021 | 2020 | 2019 | 2018 |
Net asset value, beginning of period
| $8.82 | $8.96 | $8.92 | $8.98 | $8.93 | $8.96 |
Net investment income
| 0.11 1 | 0.05 1 | 0.07 1 | 0.19 1 | 0.22 | 0.16 |
Net realized and unrealized gains (losses) on investments
| 0.03 | (0.10) | 0.04 | (0.06) | 0.04 | (0.05) |
Total from investment operations
| 0.14 | (0.05) | 0.11 | 0.13 | 0.26 | 0.11 |
| Distributions to shareholders from | | | | | | |
Net investment income
| (0.10) | (0.05) | (0.07) | (0.19) | (0.21) | (0.14) |
Net realized gains
| (0.14) | (0.04) | 0.00 | (0.00) 2 | 0.00 | 0.00 |
Total distributions to shareholders
| (0.24) | (0.09) | (0.07) | (0.19) | (0.21) | (0.14) |
Net asset value, end of period
| $8.72 | $8.82 | $8.96 | $8.92 | $8.98 | $8.93 |
Total return3
| 1.73% | (0.53)% | 1.27% | 1.54% | 2.93% | 1.26% |
| Ratios to average net assets (annualized) | | | | | | |
Gross expenses
| 0.51% | 0.49% | 0.49% | 0.54% | 0.54% | 0.50% |
Net expenses
| 0.46% | 0.46% | 0.46% | 0.46% | 0.46% | 0.46% |
Net investment income
| 2.49% | 0.59% | 0.74% | 2.12% | 2.27% | 1.55% |
| Supplemental data | | | | | | |
Portfolio turnover rate
| 3% | 36% | 53% | 9% | 5% | 3% |
Net assets, end of period (000s omitted)
| $259,190 | $353,549 | $444,150 | $288,045 | $158,147 | $235,078 |
| 1 | Calculated based upon average shares outstanding |
| 2 | Amount is less than $0.005. |
| 3 | Returns for periods of less than one year are not annualized. |
The accompanying notes are an integral part of these financial statements.
28 | Allspring Adjustable Rate Government Fund
Notes to financial statements (unaudited)
1. ORGANIZATION
Allspring Funds Trust (the "Trust"), a Delaware statutory trust organized on March 10, 1999, is an open-end management investment company registered under the Investment Company Act of 1940, as amended (the "1940 Act"). As an investment company, the Trust follows the accounting and reporting guidance in Financial Accounting Standards Board ("FASB") Accounting Standards Codification Topic 946, Financial Services – Investment Companies. These financial statements report on the Allspring Adjustable Rate Government Fund (the "Fund") which is a diversified series of the Trust.
2. SIGNIFICANT ACCOUNTING POLICIES
The following significant accounting policies, which are consistently followed in the preparation of the financial statements of the Fund, are in conformity with U.S. generally accepted accounting principles which require management to make estimates and assumptions that affect the reported amounts of assets and liabilities, disclosure of contingent assets and liabilities at the date of the financial statements, and the reported amounts of income and expenses during the reporting period. Actual results could differ from those estimates.
Securities valuation
All investments are valued each business day as of the close of regular trading on the New York Stock Exchange (generally 4 p.m. Eastern Time), although the Fund may deviate from this calculation time under unusual or unexpected circumstances.
Debt securities are valued at the evaluated bid price provided by an independent pricing service (e.g. taking into account various factors, including yields, maturities, or credit ratings) or, if a reliable price is not available, the quoted bid price from an independent broker-dealer.
Futures contracts that are listed on a foreign or domestic exchange or market are valued at the official closing price or, if none, the last sales price.
Investments in registered open-end investment companies (other than those listed on a foreign or domestic exchange or market) are valued at net asset value.
Investments which are not valued using the methods discussed above are valued at their fair value, as determined in good faith by Allspring Funds Management, LLC ("Allspring Funds Management"), which was named the valuation designee by the Board of Trustees. As the valuation designee, Allspring Funds Management is responsible for day-to-day valuation activities for the Allspring Funds. In connection with these responsibilities, Allspring Funds Management has established a Valuation Committee and has delegated to it the authority to take any actions regarding the valuation of portfolio securities that the Valuation Committee deems necessary or appropriate, including determining the fair value of portfolio securities. On a quarterly basis, the Board of Trustees receives reports of valuation actions taken by the Valuation Committee. On at least an annual basis, the Board of Trustees receives an assessment of the adequacy and effectiveness of Allspring Funds Management's process for determining the fair value of the portfolio of investments.
When-issued transactions
The Fund may purchase securities on a forward commitment or when-issued basis. The Fund records a when-issued transaction on the trade date and will segregate assets in an amount at least equal in value to the Fund's commitment to purchase when-issued securities. Securities purchased on a when-issued basis are marked-to-market daily and the Fund begins earning interest on the settlement date. Losses may arise due to changes in the market value of the underlying securities or if the counterparty does not perform under the contract.
Futures contracts
Futures contracts are agreements between the Fund and a counterparty to buy or sell a specific amount of a commodity, financial instrument or currency at a specified price on a specified date. The Fund may buy and sell futures contracts in order to gain exposure to, or protect against, changes in interest rates and is subject to interest rate risk. The primary risks associated with the use of futures contracts are the imperfect correlation between changes in market values of securities held by the Fund and the prices of futures contracts, and the possibility of an illiquid market. Futures contracts are generally entered into on a regulated futures exchange and cleared through a clearinghouse associated with the exchange. With futures contracts, there is minimal counterparty risk to the Fund since futures contracts are exchange-traded and the exchange’s clearinghouse, as the counterparty to all exchange-traded futures, guarantees the futures contracts against default.
Upon entering into a futures contract, the Fund is required to deposit either cash or securities (initial margin) with the broker in an amount equal to a certain percentage of the contract value. Subsequent payments (variation margin) are paid to or from the broker each day equal to the daily changes in the contract value. Such payments are recorded as unrealized gains or losses and, if any, shown as variation margin receivable (payable) in the Statement of Assets and Liabilities. Should the Fund fail to make
Allspring Adjustable Rate Government Fund | 29
Notes to financial statements (unaudited)
requested variation margin payments, the broker can gain access to the initial margin to satisfy the Fund’s payment obligations. When the contracts are closed, a realized gain or loss is recorded in the Statement of Operations.
Mortgage dollar roll transactions
The Fund may engage in mortgage dollar roll transactions through TBA mortgage-backed securities issued by Government National Mortgage Association (GNMA), Federal National Mortgage Association (FNMA) and Federal Home Loan Mortgage Corporation (FHLMC). In a mortgage dollar roll transaction, the Fund sells a mortgage-backed security to a financial institution, such as a bank or broker-dealer and simultaneously agrees to repurchase a substantially similar security from the institution at a later date at an agreed upon price. The mortgage-backed securities that are repurchased will bear the same interest rate as those sold, but generally will be collateralized by different pools of mortgages with different pre-payment histories. During the roll period, the Fund foregoes principal and interest paid on the securities. The Fund is compensated by the difference between the current sales price and the forward price for the future purchase as well as by the earnings on the cash proceeds of the initial sale. Mortgage dollar rolls may be renewed without physical delivery of the securities subject to the contract. The Fund accounts for TBA dollar roll transactions as purchases and sales which, as a result, may increase its portfolio turnover rate.
Security transactions and income recognition
Securities transactions are recorded on a trade date basis. Realized gains or losses are recorded on the basis of identified cost.
Interest income is accrued daily and bond discounts are accreted and premiums are amortized daily. To the extent debt obligations are placed on non-accrual status, any related interest income may be reduced by writing off interest receivables when the collection of all or a portion of interest has been determined to be doubtful based on consistently applied procedures and the fair value has decreased. If the issuer subsequently resumes interest payments or when the collectability of interest is reasonably assured, the debt obligation is removed from non-accrual status. Paydown gains and losses are included in interest income.
Distributions to shareholders
Distributions to shareholders from net investment income are declared daily and paid monthly. Distributions from net realized gains, if any, are recorded on the ex-dividend date and paid at least annually. Such distributions are determined in accordance with income tax regulations and may differ from U.S. generally accepted accounting principles. Dividend sources are estimated at the time of declaration. The tax character of distributions is determined as of the Fund's fiscal year end. Therefore, a portion of the Fund's distributions made prior to the Fund’s fiscal year end may be categorized as a tax return of capital at year end.
Federal and other taxes
The Fund intends to continue to qualify as a regulated investment company by distributing substantially all of its investment company taxable income and any net realized capital gains (after reduction for capital loss carryforwards) sufficient to relieve it from all, or substantially all, federal income taxes. Accordingly, no provision for federal income taxes was required.
The Fund’s income and federal excise tax returns and all financial records supporting those returns for the prior three fiscal years are subject to examination by the federal and Delaware revenue authorities. Management has analyzed the Fund's tax positions taken on federal, state, and foreign tax returns, as applicable, for all open tax years and does not believe that there are any uncertain tax positions that require recognition of a tax liability.
As of February 28, 2023, the aggregate cost of all investments for federal income tax purposes was $352,329,187 and the unrealized gains (losses) consisted of:
| Gross unrealized gains | $ 786,672 |
| Gross unrealized losses | (11,637,782) |
| Net unrealized losses | $(10,851,110) |
Class allocations
The separate classes of shares offered by the Fund differ principally in applicable sales charges, distribution, shareholder servicing, and administration fees. Class specific expenses are charged directly to that share class. Investment income, common fund-level expenses, and realized and unrealized gains (losses) on investments are allocated daily to each class of shares based on the relative proportion of net assets of each class.
30 | Allspring Adjustable Rate Government Fund
Notes to financial statements (unaudited)
3. FAIR VALUATION MEASUREMENTS
Fair value measurements of investments are determined within a framework that has established a fair value hierarchy based upon the various data inputs utilized in determining the value of the Fund’s investments. The three-level hierarchy gives the highest priority to unadjusted quoted prices in active markets for identical assets or liabilities (Level 1) and the lowest priority to unobservable inputs (Level 3). The Fund’s investments are classified within the fair value hierarchy based on the lowest level of input that is significant to the fair value measurement. The inputs are summarized into three broad levels as follows:
| ■ | Level 1 – quoted prices in active markets for identical securities |
| ■ | Level 2 – other significant observable inputs (including quoted prices for similar securities, interest rates, prepayment speeds, credit risk, etc.) |
| ■ | Level 3 – significant unobservable inputs (including the Fund’s own assumptions in determining the fair value of investments) |
The inputs or methodologies used for valuing investments in securities are not necessarily an indication of the risk associated with investing in those securities.
The following is a summary of the inputs used in valuing the Fund’s assets and liabilities as of February 28, 2023:
| | Quoted prices
(Level 1) | Other significant
observable inputs
(Level 2) | Significant
unobservable inputs
(Level 3) | Total |
| Assets | | | | |
| Investments in: | | | | |
| Agency securities | $ 0 | $ 302,660,940 | $0 | $ 302,660,940 |
| Asset-backed securities | 0 | 16,663,060 | 0 | 16,663,060 |
| Non-agency mortgage-backed securities | 0 | 18,773,620 | 0 | 18,773,620 |
| Short-term investments | | | | |
| Investment companies | 3,030,873 | 0 | 0 | 3,030,873 |
| | 3,030,873 | 338,097,620 | 0 | 341,128,493 |
| Futures contracts | 349,584 | 0 | 0 | 349,584 |
| Total assets | $3,380,457 | $338,097,620 | $0 | $341,478,077 |
Futures contracts are reported at their cumulative unrealized gains (losses) at measurement date as reported in the table following the Portfolio of Investments. For futures contracts, the current day’s variation margin is reported on the Statement of Assets and Liabilities. All other assets and liabilities are reported at their market value at measurement date.
Additional sector, industry or geographic detail, if any, is included in the Portfolio of Investments.
For the six months ended February 28, 2023, the Fund did not have any transfers into/out of Level 3.
4. TRANSACTIONS WITH AFFILIATES
Management fee
Allspring Funds Management, a wholly owned subsidiary of Allspring Global Investments Holdings, LLC, a holding company indirectly owned by certain private funds of GTCR LLC and Reverence Capital Partners, L.P., is the manager of the Fund and provides advisory and fund-level administrative services under an investment management agreement. Under the investment management agreement, Allspring Funds Management is responsible for, among other services, implementing the investment objectives and strategies of the Fund, supervising the subadviser and providing fund-level administrative services in connection with the Fund’s operations. As compensation for its services under the investment management agreement, Allspring Funds Management is entitled to receive a management fee at the following annual rate based on the Fund’s average daily net assets:
Allspring Adjustable Rate Government Fund | 31
Notes to financial statements (unaudited)
| Average daily net assets | Management fee |
| First $1 billion | 0.350% |
| Next $4 billion | 0.325 |
| Next $3 billion | 0.290 |
| Next $2 billion | 0.265 |
| Over $10 billion | 0.255 |
For the six months ended February 28, 2023, the management fee was equivalent to an annual rate of 0.35% of the Fund’s average daily net assets.
Allspring Funds Management has retained the services of a subadviser to provide daily portfolio management to the Fund. The fee for subadvisory services is borne by Allspring Funds Management. Allspring Global Investments, LLC, an affiliate of Allspring Funds Management and a wholly owned subsidiary of Allspring Global Investments Holdings, LLC, is the subadviser to the Fund and is entitled to receive a fee from Allspring Funds Management at an annual rate starting at 0.20% and declining to 0.10% as the average daily net assets of the Fund increase.
Administration fees
Under a class-level administration agreement, Allspring Funds Management provides class-level administrative services to the Fund, which includes paying fees and expenses for services provided by the transfer agent, sub-transfer agents, omnibus account servicers and record-keepers. As compensation for its services under the class-level administration agreement, Allspring Funds Management receives an annual fee which is calculated based on the average daily net assets of each class as follows:
| | Class-level
administration fee |
| Class A | 0.16% |
| Class C | 0.16 |
| Administrator Class | 0.10 |
| Institutional Class | 0.08 |
Waivers and/or expense reimbursements
Allspring Funds Management has contractually committed to waive and/or reimburse management and administration fees to the extent necessary to maintain certain net operating expense ratios for the Fund. When each class of the Fund has exceeded its expense cap, Allspring Funds Management will waive fees and/or reimburse expenses from fund-level expenses on a proportionate basis and then from class specific expenses. When only certain classes exceed their expense caps, waivers and/or reimbursements are applied against class specific expenses before fund-level expenses. Allspring Funds Management has contractually committed through December 31, 2023 to waive fees and/or reimburse expenses to the extent necessary to cap expenses. Prior to or after the commitment expiration date, the caps may be increased or the commitment to maintain the caps may be terminated only with the approval of the Board of Trustees. In addition to the contractual waivers and/or reimbursements, Allspring Funds Management also voluntarily waived certain class-level expenses during the six months ended February 28, 2023. These voluntary class-level waivers may be discontinued at any time. As of February 28, 2023, the contractual expense caps are as follows:
| | Expense ratio caps |
| Class A | 0.74% |
| Class C | 1.49 |
| Administrator Class | 0.60 |
| Institutional Class | 0.46 |
32 | Allspring Adjustable Rate Government Fund
Notes to financial statements (unaudited)
Distribution fee
The Trust has adopted a distribution plan for Class C shares pursuant to Rule 12b-1 under the 1940 Act. A distribution fee is charged to Class C shares and paid to Allspring Funds Distributor, LLC ("Allspring Funds Distributor"), the principal underwriter, an affiliate of Allspring Funds Management, at an annual rate up to 0.75% of the average daily net assets of Class C shares.
In addition, Allspring Funds Distributor is entitled to receive the front-end sales charge from the purchase of Class A shares and a contingent deferred sales charge on the redemption of certain Class A shares. Allspring Funds Distributor is also entitled to receive the contingent deferred sales charges from redemptions of Class C shares. For the six months ended February 28, 2023, Allspring Funds Distributor received $10 from the sale of Class A shares. No contingent deferred sales charges were incurred by Class A and Class C shares for the six months ended February 28, 2023.
Shareholder servicing fees
The Trust has entered into contracts with one or more shareholder servicing agents, whereby Class A, Class C and Administrator Class are charged a fee at an annual rate up to 0.25% of the average daily net assets of each respective class. A portion of these total shareholder servicing fees were paid to affiliates of the Fund.
Interfund transactions
The Fund may purchase or sell portfolio investment securities to certain affiliates pursuant to Rule 17a-7 under the 1940 Act and under procedures adopted by the Board of Trustees. The procedures have been designed to ensure that these interfund transactions, which do not incur broker commissions, are effected at current market prices.
5. INVESTMENT PORTFOLIO TRANSACTIONS
Purchases and sales of investments, excluding short-term securities, for the six months ended February 28, 2023 were as follows:
| Purchases at cost | | Sales proceeds |
U.S.
government | Non-U.S.
government | | U.S.
government | Non-U.S.
government |
| $76,940 | $10,666,377 | | $36,306,950 | $32,693,985 |
6. DERIVATIVE TRANSACTIONS
During the six months ended February 28, 2023, the Fund entered into futures contracts for duration and curve management. The Fund had an average notional amount of $138,643,789 in short futures contracts during the six months ended February 28, 2023.
The fair value, realized gains or losses and change in unrealized gains or losses, if any, on derivative instruments are reflected in the corresponding financial statement captions.
7. BANK BORROWINGS
The Trust (excluding the money market funds), Allspring Master Trust and Allspring Variable Trust are parties to a $350,000,000 revolving credit agreement whereby the Fund is permitted to use bank borrowings for temporary or emergency purposes, such as to fund shareholder redemption requests. Interest under the credit agreement is charged to the Fund based on a borrowing rate equal to the higher of the Federal Funds rate or the overnight bank funding rate in effect on that day plus a spread. In addition, an annual commitment fee equal based on the unused balance is allocated to each participating fund.
For the six months ended February 28, 2023, there were no borrowings by the Fund under the agreement.
8. MARKET RISKS
On March 11, 2020, the World Health Organization announced that it had made the assessment that coronavirus disease 2019 (“COVID-19”) is a pandemic. The impacts of COVID-19 are affecting the entire global economy, individual companies and investment products, the funds, and the market in general. There is significant uncertainty around the extent and duration of business disruptions related to COVID-19 and the impacts may last for an extended period of time. COVID-19 has led to significant uncertainty and volatility in the financial markets.
Allspring Adjustable Rate Government Fund | 33
Notes to financial statements (unaudited)
9. INDEMNIFICATION
Under the Fund's organizational documents, the officers and Trustees have been granted certain indemnification rights against certain liabilities that may arise out of performance of their duties to the Fund. The Fund has entered into a separate agreement with each Trustee that converts indemnification rights currently existing under the Fund’s organizational documents into contractual rights that cannot be changed in the future without the consent of the Trustee. Additionally, in the normal course of business, the Fund may enter into contracts with service providers that contain a variety of indemnification clauses. The Fund’s maximum exposure under these arrangements is dependent on future claims that may be made against the Fund and, therefore, cannot be estimated.
34 | Allspring Adjustable Rate Government Fund
Other information (unaudited)
PROXY VOTING INFORMATION
A description of the policies and procedures used to determine how to vote proxies relating to portfolio securities is available without charge, upon request, by calling 1-800-222-8222, visiting our website at allspringglobal.com, or visiting the SEC website at sec.gov. Information regarding how the proxies related to portfolio securities were voted during the most recent 12-month period ended June 30 is available on the website at allspringglobal.com or by visiting the SEC website at sec.gov.
QUARTERLY PORTFOLIO HOLDINGS INFORMATION
The Fund files its complete schedule of portfolio holdings with the SEC for the first and third quarters of each fiscal year as an exhibit to its reports on Form N-PORT. Shareholders may view the filed Form N-PORT by visiting the SEC website at sec.gov.
Allspring Adjustable Rate Government Fund | 35
Other information (unaudited)
BOARD OF TRUSTEES AND OFFICERS
Each of the Trustees and Officers listed in the table below acts in identical capacities for each fund in the Allspring family of funds, which consists of 127 mutual funds comprising the Allspring Funds Trust, Allspring Variable Trust, Allspring Master Trust and four closed-end funds (collectively the “Fund Complex”). This table should be read in conjunction with the Prospectus and the Statement of Additional Information1. The mailing address of each Trustee and Officer is 1415 Vantage Park Drive, 3rd Floor, Charlotte, NC 28203. Each Trustee and Officer serves an indefinite term, however, each Trustee serves such term until reaching the mandatory retirement age established by the Trustees.
Independent Trustees
Name and
year of birth | Position held and
length of service* | Principal occupations during past five years or longer | Current other
public company or
investment
company
directorships |
William R. Ebsworth
(Born 1957) | Trustee,
since 2015 | Retired. From 1984 to 2013, equities analyst, portfolio manager, research director and chief investment officer at Fidelity Management and Research Company in Boston, Tokyo, and Hong Kong, and retired in 2013 as Chief Investment Officer of Fidelity Strategic Advisers, Inc. where he led a team of investment professionals managing client assets. Prior thereto, Board member of Hong Kong Securities Clearing Co., Hong Kong Options Clearing Corp., the Thailand International Fund, Ltd., Fidelity Investments Life Insurance Company, and Empire Fidelity Investments Life Insurance Company. Audit Committee Chair and Investment Committee Chair of the Vincent Memorial Hospital Foundation (non-profit organization). Mr. Ebsworth is a CFA® charterholder. | N/A |
Jane A. Freeman
(Born 1953) | Trustee,
since 2015;
Chair Liaison,
since 2018 | Retired. From 2012 to 2014 and 1999 to 2008, Chief Financial Officer of Scientific Learning Corporation. From 2008 to 2012, Ms. Freeman provided consulting services related to strategic business projects. Prior to 1999, Portfolio Manager at Rockefeller & Co. and Scudder, Stevens & Clark. Board member of the Harding Loevner Funds from 1996 to 2014, serving as both Lead Independent Director and chair of the Audit Committee. Board member of the Russell Exchange Traded Funds Trust from 2011 to 2012 and the chair of the Audit Committee. Ms. Freeman is also an inactive Chartered Financial Analyst. | N/A |
Isaiah Harris, Jr.
(Born 1952) | Trustee,
since 2009; Audit
Committee
Chair,
since 2019 | Retired. Member of the Advisory Board of CEF of East Central Florida. Chairman of the Board of CIGNA Corporation from 2009 to 2021, and Director from 2005 to 2008. From 2003 to 2011, Director of Deluxe Corporation. Prior thereto, President and CEO of BellSouth Advertising and Publishing Corp. from 2005 to 2007, President and CEO of BellSouth Enterprises from 2004 to 2005 and President of BellSouth Consumer Services from 2000 to 2003. Emeritus member of the Iowa State University Foundation Board of Governors. Emeritus Member of the Advisory Board of Iowa State University School of Business. Advisory Board Member, Palm Harbor Academy (private school). Advisory Board Member, Fellowship of Christian Athletes. Mr. Harris is a certified public accountant (inactive status). | N/A |
David F. Larcker
(Born 1950) | Trustee,
since 2009 | Distinguished Visiting Fellow at the Hoover Institution since 2022. James Irvin Miller Professor of Accounting at the Graduate School of Business (Emeritus), Stanford University, Director of the Corporate Governance Research Initiative and Senior Faculty of The Rock Center for Corporate Governance since 2006. From 2005 to 2008, Professor of Accounting at the Graduate School of Business, Stanford University. Prior thereto, Ernst & Young Professor of Accounting at The Wharton School, University of Pennsylvania from 1985 to 2005. | N/A |
36 | Allspring Adjustable Rate Government Fund
Other information (unaudited)
Name and
year of birth | Position held and
length of service* | Principal occupations during past five years or longer | Current other
public company or
investment
company
directorships |
Olivia S. Mitchell
(Born 1953) | Trustee,
since 2006;
Nominating and
Governance
Committee Chair,
since 2018 | International Foundation of Employee Benefit Plans Professor since 1993, Wharton School of the University of Pennsylvania. Director of Wharton’s Pension Research Council and Boettner Center on Pensions & Retirement Research, and Research Associate at the National Bureau of Economic Research. Previously taught at Cornell University from 1978 to 1993. | N/A |
Timothy J. Penny
(Born 1951) | Trustee,
since 1996;
Chair,
since 2018 | President and Chief Executive Officer of Southern Minnesota Initiative Foundation, a non-profit organization, since 2007. Vice Chair of the Economic Club of Minnesota, since 2007. Co-Chair of the Committee for a Responsible Federal Budget, since 1995. Member of the Board of Trustees of NorthStar Education Finance, Inc., a non-profit organization, from 2007-2022. Senior Fellow of the University of Minnesota Humphrey Institute from 1995 to 2017. | N/A |
James G. Polisson
(Born 1959) | Trustee,
since 2018 | Retired. Chief Marketing Officer, Source (ETF) UK Services, Ltd, from 2015 to 2017. From 2012 to 2015, Principal of The Polisson Group, LLC, a management consulting, corporate advisory and principal investing company. Chief Executive Officer and Managing Director at Russell Investments, Global Exchange Traded Funds from 2010 to 2012. Managing Director of Barclays Global Investors from 1998 to 2010 and Global Chief Marketing Officer for iShares and Barclays Global Investors from 2000 to 2010. Trustee of the San Francisco Mechanics’ Institute, a non-profit organization, from 2013 to 2015. Board member of the Russell Exchange Traded Fund Trust from 2011 to 2012. Director of Barclays Global Investors Holdings Deutschland GmbH from 2006 to 2009. Mr. Polisson is an attorney and has a retired status with the Massachusetts and District of Columbia Bar Associations. | N/A |
Pamela Wheelock
(Born 1959) | Trustee,
since January
2020; previously
Trustee from
January 2018 to
July 2019 | Retired. Executive and Senior Financial leadership positions in the public, private and nonprofit sectors. Interim President and CEO, McKnight Foundation, 2020. Interim Commissioner, Minnesota Department of Human Services, 2019. Chief Operating Officer, Twin Cities Habitat for Humanity, 2017-2019. Vice President for University Services, University of Minnesota, 2012-2016. Interim President and CEO, Blue Cross and Blue Shield of Minnesota, 2011-2012. Executive Vice-President and Chief Financial Officer, Minnesota Wild, 2002-2008. Commissioner, Minnesota Department of Finance, 1999-2002. Chair of the Board of Directors of Destination Medical Center Corporation. Board member of the Minnesota Wild Foundation. | N/A |
* Length of service dates reflect the Trustee’s commencement of service with the Trust’s predecessor entities, where applicable.
Allspring Adjustable Rate Government Fund | 37
Other information (unaudited)
Officers2
Name and
year of birth | Position held and
length of service | Principal occupations during past five years or longer |
Andrew Owen
(Born 1960) | President,
since 2017 | President and Chief Executive Officer of Allspring Funds Management, LLC since 2017 and Head of Global Fund Governance of Allspring Global Investments since 2022. Prior thereto, co-president of Galliard Capital Management, LLC, an affiliate of Allspring Funds Management, LLC, from 2019 to 2022 and Head of Affiliated Managers, Allspring Global Investments, from 2014 to 2019 and Executive Vice President responsible for marketing, investments and product development for Allspring Funds Management, LLC, from 2009 to 2014. |
Jeremy DePalma
(Born 1974) | Treasurer,
since 2012
(for certain funds in
the Fund Complex);
since 2021 (for
the remaining funds in the
Fund Complex) | Senior Vice President of Allspring Funds Management, LLC since 2009. Senior Vice President of Evergreen Investment Management Company, LLC from 2008 to 2010 and head of the Fund Reporting and Control Team within Fund Administration from 2005 to 2010. |
Christopher Baker
(Born 1976) | Chief Compliance Officer, since 2022 | Global Chief Compliance Officer for Allspring Global Investments since 2022. Prior thereto, Chief Compliance Officer for State Street Global Advisors from 2018 to 2021. Senior Compliance Officer for the State Street divisions of Alternative Investment Solutions, Sector Solutions, and Global Marketing from 2015 to 2018. From 2010 to 2015 Vice President, Global Head of Investment and Marketing Compliance for State Street Global Advisors. |
Matthew Prasse
(Born 1983) | Chief Legal Officer, since 2022; Secretary, since 2021 | Senior Counsel of the Allspring Legal Department since 2021. Senior Counsel of the Wells Fargo Legal Department from 2018 to 2021. Previously, Counsel for Barings LLC from 2015 to 2018. Prior to joining Barings, Associate at Morgan, Lewis & Bockius LLP from 2008 to 2015. |
1 The Statement of Additional Information includes additional information about the Trustees and is available, without charge, upon request, by calling 1-800-222-8222 or by visiting the website at allspringglobal.com.
2 For those Officers with tenures at Allspring Global Investments and/or Allspring Funds Management, LLC that began prior to 2021, such tenures include years of service during which these businesses/entities were known as Wells Fargo Asset Management and Wells Fargo Funds Management, LLC, respectively.
38 | Allspring Adjustable Rate Government Fund
For more information
More information about Allspring Funds is available free upon request. To obtain literature, please write, visit the Fund's website, or call:
Allspring Funds
P.O. Box 219967
Kansas City, MO 64121-9967
Website: allspringglobal.com
Individual investors: 1-800-222-8222
Retail investment professionals: 1-888-877-9275
Institutional investment professionals: 1-800-260-5969
This report and the financial statements contained herein are submitted for the general information of the shareholders of the Fund. If this report is used for promotional purposes, distribution of the report must be accompanied or preceded by a current prospectus. Before investing, please consider the investment objectives, risks, charges, and expenses of the investment. For a current prospectus and, if available, a summary prospectus, containing this information, call
1-800-222-8222 or visit the Fund's website at allspringglobal.com. Read the prospectus carefully before you invest or send money.
Allspring Global InvestmentsTM is the trade name for the asset management firms of Allspring Global Investments Holdings, LLC, a holding company indirectly owned by certain private funds of GTCR LLC and Reverence Capital Partners, L.P. These firms include but are not limited to Allspring Global Investments, LLC, and Allspring Funds Management, LLC. Certain products managed by Allspring entities are distributed by Allspring Funds Distributor, LLC (a broker-dealer and Member FINRA/SIPC).
This material is for general informational and educational purposes only and is NOT intended to provide investment advice or a recommendation of any kind - including a recommendation for any specific investment, strategy, or plan.
© 2023 Allspring Global Investments Holdings, LLC. All rights reserved.
ALL-03102023-sktwx263 04-23
SAR0356 02-23
Semi-Annual Report
February 28, 2023
Allspring
Conservative Income Fund
The views expressed and any forward-looking statements are as of February 28, 2023, unless otherwise noted, and are those of the Fund's portfolio managers and/or Allspring Global Investments. Discussions of individual securities or the markets generally are not intended as individual recommendations. Future events or results may vary significantly from those expressed in any forward-looking statements. The views expressed are subject to change at any time in response to changing circumstances in the market. Allspring Global Investments disclaims any obligation to publicly update or revise any views expressed or forward-looking statements.
Allspring Conservative Income Fund | 1
Letter to shareholders (unaudited)
Andrew Owen
President
Allspring Funds
Dear Shareholder:
We are pleased to offer you this semi-annual report for the Allspring Conservative Income Fund for the six-month period that ended February 28, 2023. Globally, stocks and bonds experienced heightened volatility through the challenging period. Earlier tailwinds provided by global stimulus programs, vaccination rollouts, and recovering consumer and corporate sentiment were wiped away by the highest rate of inflation in four decades as well as the impact of ongoing aggressive central bank rate hikes and the prospect of more rate hikes. Compounding these concerns were the global reverberations of the Russia-Ukraine war and the impact of China’s strict COVID-19 lockdowns.
For the six-month period, stocks and bonds had mixed results, with non-U.S. equities––both developed market and emerging market––outperforming U.S. stocks overall. Bonds––both U.S. and non-U.S.––began to recover from sustained aggressive interest rate increases. After suffering deep and broad losses over the past year, recent fixed income performance benefited from a base of higher yields that can now generate higher income. For the period, U.S. stocks, based on the S&P 500 Index,1 returned 1.26%. International stocks, as measured by the MSCI ACWI ex USA Index (Net),2 returned 7.30%, while the MSCI EM Index (Net) (USD)3 lost 2.29%. Among bond indexes, the Bloomberg U.S. Aggregate Bond Index4 returned -2.13%, the Bloomberg Global Aggregate ex-USD Index (unhedged)5 returned -0.11%, the Bloomberg Municipal Bond Index6 gained 0.66%, and the ICE BofA U.S. High Yield Index7 returned 2.41%.
The Russia-Ukraine war, high inflation, and central bank rate hikes rocked markets
A challenging calendar year for investors continued in September as all asset classes suffered major losses. Central banks kept up their battle against rapidly rising prices with more rate hikes. The strength of the U.S. dollar weighed on results for investors holding non-U.S.-dollar assets. U.S. mortgage rates jumped to near 7% on 30-year fixed-rate mortgages; the decreased housing affordability began to cool demand somewhat. The U.K. experienced a sharp sell-off of government bonds and the British pound in September as investors panicked in response to a new government budget that was seen as financially unsound. The Bank of England (BoE) then stepped in and bought long-dated government bonds.
“ A challenging calendar year for investors continued in September as all asset classes suffered major losses.”
| 1 | The S&P 500 Index consists of 500 stocks chosen for market size, liquidity, and industry group representation. It is a market-value-weighted index with each stock's weight in the index proportionate to its market value. You cannot invest directly in an index. |
| 2 | The Morgan Stanley Capital International (MSCI) All Country World Index (ACWI) ex USA Index (Net) is a free-float-adjusted market-capitalization-weighted index that is designed to measure the equity market performance of developed and emerging markets, excluding the U.S. Source: MSCI. MSCI makes no express or implied warranties or representations and shall have no liability whatsoever with respect to any MSCI data contained herein. The MSCI data may not be further redistributed or used as a basis for other indexes or any securities or financial products. This report is not approved, reviewed, or produced by MSCI. You cannot invest directly in an index. |
| 3 | The MSCI Emerging Markets (EM) Index (Net) (USD) is a free-float-adjusted market-capitalization-weighted index that is designed to measure equity market performance of emerging markets. You cannot invest directly in an index. |
| 4 | The Bloomberg U.S. Aggregate Bond Index is a broad-based benchmark that measures the investment-grade, U.S.-dollar-denominated, fixed-rate taxable bond market, including Treasuries, government-related and corporate securities, mortgage-backed securities (agency fixed-rate and hybrid adjustable-rate mortgage pass-throughs), asset-backed securities, and commercial mortgage-backed securities. You cannot invest directly in an index. |
| 5 | The Bloomberg Global Aggregate ex-USD Index (unhedged) is an unmanaged index that provides a broad-based measure of the global investment-grade fixed-income markets excluding the U.S.-dollar-denominated debt market. You cannot invest directly in an index. |
| 6 | The Bloomberg Municipal Bond Index is an unmanaged index composed of long-term tax-exempt bonds with a minimum credit rating of Baa. You cannot invest directly in an index. |
| 7 | The ICE BofA U.S. High Yield Index is a market-capitalization-weighted index of domestic and Yankee high-yield bonds. The index tracks the performance of high-yield securities traded in the U.S. bond market. You cannot invest directly in an index. Copyright 2023. ICE Data Indices, LLC. All rights reserved. |
2 | Allspring Conservative Income Fund
Letter to shareholders (unaudited)
Equities had a reprieve in October. Value stocks and small caps fared best. Globally, developed markets outpaced emerging market equities, which were hurt by weakness among Chinese stocks. Central banks continued to try to curtail high inflation with aggressive interest rate hikes. Geopolitical risks persisted, including the ongoing Russia-Ukraine war and economic, financial market, and political turmoil in the U.K. Concerns over Europe’s energy crisis eased thanks to unseasonably warm weather and plentiful gas on hand. The U.S. labor market continued its resilience against rising prices as unemployment remained near a record low.
Stocks and bonds rallied in November. Economic news was encouraging, driven by U.S. labor market strength. Although central banks kept raising rates, hopes rose for an easing in the pace of rate hikes and a possible end to central bank monetary tightening in 2023. Although inflation remained at record highs in the eurozone, we began to see signs of a possible decline in inflationary pressures as U.S. inflation moderated, with a 7.1% annual price rise in November and a monthly price increase of just 0.1%. China’s economic data remained weak, reflecting its zero-COVID-19 policy.
Financial markets cooled in December, with U.S. equities posting negative overall results in response to a weakening U.S. dollar. Fixed income securities ended one of their worst years ever with flat overall monthly returns as markets weighed the hopes for an end to the monetary tightening cycle with the reality that central banks had not completed their jobs yet. U.S. Consumer Price Index (CPI)1 data showed a strong consistent trend downward, which brought down the 12-month CPI to 6.5% in December from 9.1% in June. Other countries and regions reported still-high but declining inflation rates as the year winded down.
The year 2023 began with a rally across global equities and fixed income securities. Investor optimism rose in response to data indicating declining inflation rates and the reopening of China’s economy with the abrupt end to its zero-COVID-19 policy. The U.S. reported surprisingly strong job gains––employers added more than 500,000 jobs––and unemployment fell to 3.4%, the lowest level since 1969. Meanwhile, wage growth, seen as a potential contributor to ongoing high inflation, continued to moderate. All eyes remained fixed on the Federal Reserve (Fed) and on how many more rate hikes remain in this tightening cycle. The 0.25% federal funds rate hike announced in January was the Fed’s smallest rate increase since March 2022.
Financial markets declined in February as investors responded unfavorably to resilient economic data. The takeaway: Central banks will likely continue their monetary tightening cycle for longer than markets had priced in. In this environment—where strong economic data is seen as bad news—the resilient U.S. labor market was seen as a negative while the inflation rate has not been falling quickly enough for the Fed, which raised interest rates by 0.25% in early February. Meanwhile, the BoE and the European Central Bank both raised rates by 0.50%. At this stage in the economic cycle, the overriding question remained: “What will central banks do?” In February, the answer appeared to be: “Move rates higher for longer.”
| 1 | The Consumer Price Index (CPI) is a measure of the average change over time in the prices paid by urban consumers for a market basket of consumer goods and services. You cannot invest directly in an index. |
Allspring Conservative Income Fund | 3
Letter to shareholders (unaudited)
Don’t let short-term uncertainty derail long-term investment goals.
Periods of investment uncertainty can present challenges, but experience has taught us that maintaining long-term investment goals can be an effective way to plan for the future. To help you create a sound strategy based on your personal goals and risk tolerance, Allspring Funds offers more than 100 mutual funds spanning a wide range of asset classes and investment styles. Although diversification cannot guarantee an investment profit or prevent losses, we believe it can be an effective way to manage investment risk and potentially smooth out overall portfolio performance. We encourage investors to know their investments and to understand that appropriate levels of risk-taking may unlock opportunities.
Thank you for choosing to invest with Allspring Funds. We appreciate your confidence in us and remain committed to helping you meet your financial needs.
Sincerely,
Andrew Owen
President
Allspring Funds
For further information about your fund, contact your investment professional, visit our website at allspringglobal.com, or call us directly at 1-800-222-8222.
4 | Allspring Conservative Income Fund
This page is intentionally left blank.
Performance highlights (unaudited)
| Investment objective | The Fund seeks current income consistent with capital preservation. |
| Manager | Allspring Funds Management, LLC |
| Subadviser | Allspring Global Investments, LLC |
| Portfolio managers | Andrew M. Greenberg, CFA®‡, Anthony J. Melville, CFA®‡, Jeffrey L. Weaver, CFA®‡ |
| Average annual total returns (%) as of February 28, 2023 |
| | | | | | Expense ratios1 (%) |
| | Inception date | 1 year | 5 year | Since
inception | Gross | Net 2 |
| Class A2 (WCIAX)3 | 5-29-2020 | 1.18 | 1.24 | 0.89 | 0.62 | 0.40 |
| Institutional Class (WCIIX) | 5-31-2013 | 1.25 | 1.45 | 1.11 | 0.39 | 0.25 |
| Bloomberg 6-9 Month Treasury Bill Index4 | – | 0.89 | 1.24 | 0.80 * | – | – |
Figures quoted represent past performance, which is no guarantee of future results, and do not reflect taxes that a shareholder may pay on an investment in a fund. Investment return and principal value of an investment will fluctuate so that an investor’s shares, when redeemed, may be worth more or less than their original cost. Current performance may be lower or higher than the performance data quoted, which assumes the reinvestment of dividends and capital gains. Current month-end performance is available on the Fund's website, allspringglobal.com.
Index returns do not include transaction costs associated with buying and selling securities, any mutual fund fees or expenses, or any taxes. It is not possible to invest directly in an index.
Class A2 and Institutional Class shares are sold without a front-end sales charge or contingent deferred sales charge.
| * | Based on the inception date of the oldest Fund class. |
| 1 | Reflects the expense ratios as stated in the most recent prospectuses. The expense ratios shown are subject to change and may differ from the annualized expense ratios shown in the financial highlights of this report. |
| 2 | The manager has contractually committed through December 31, 2023, to waive fees and/or reimburse expenses to the extent necessary to cap total annual fund operating expenses after fee waivers at 0.40% for Class A2, and 0.25% for Institutional Class. Brokerage commissions, stamp duty fees, interest, taxes, acquired fund fees and expenses (if any), and extraordinary expenses are excluded from the expense caps. Prior to or after the commitment expiration date, the caps may be increased or the commitment to maintain the caps may be terminated only with the approval of the Board of Trustees. Without these caps, the Fund’s returns would have been lower. The expense ratio paid by an investor is the net expense ratio (the total annual fund operating expenses after fee waivers) as stated in the prospectuses. |
| 3 | Historical performance shown for the Class A2 shares prior to their inception reflects the performance of the Institutional Class shares, adjusted to reflect the higher expenses applicable to the Class A2 shares. |
| 4 | The Bloomberg 6-9 Month Treasury Bill Index includes all publicly issued zero-coupon U.S. Treasury bills that have a remaining maturity of less than nine months and more than six, are rated investment-grade, and have $250 million or more of outstanding face value. You cannot invest directly in an index. |
Bond values fluctuate in response to the financial condition of individual issuers, general market and economic conditions, and changes in interest rates. Changes in market conditions and government policies may lead to periods of heightened volatility in the bond market and reduced liquidity for certain bonds held by the Fund. In general, when interest rates rise, bond values fall and investors may lose principal value. Interest rate changes and their impact on the Fund and its share price can be sudden and unpredictable. The use of derivatives may reduce returns and/or increase volatility. Certain investment strategies tend to increase the total risk of an investment (relative to the broader market). This fund is exposed to foreign investment risk, mortgage- and asset-backed securities risk, and municipal securities risk. Consult the Fund’s prospectus for additional information on these and other risks.
| ‡ | CFA® and Chartered Financial Analyst® are trademarks owned by CFA Institute. |
6 | Allspring Conservative Income Fund
Performance highlights (unaudited)
| Ten largest holdings (%) as of February 28, 20231 |
| Capital One Prime Auto Receivables Trust Series 2023-1 Class A2, 5.20%, 5-15-2026 | 2.20 |
| State Street Corporation, 3.10%, 5-15-2023 | 1.81 |
| Southern California Edison's First Mortgage, 5.06%, 4-3-2023 | 1.79 |
| JPMorgan Chase & Company, 4.98%, 3-16-2024 | 1.69 |
| Morgan Stanley, 4.96%, 1-25-2024 | 1.69 |
| Toyota Motor Credit Corporation, 0.45%, 1-11-2024 | 1.62 |
| Royal Bank of Canada, 3.97%, 7-26-2024 | 1.54 |
| Deutsche Bank AG, 5.06%, 11-8-2023 | 1.48 |
| Banque Federative du Credit Mutuel SA, 3.75%, 7-20-2023 | 1.47 |
| Oklahoma Gas & Electric Company, 0.55%, 5-26-2023 | 1.46 |
| 1 | Figures represent the percentage of the Fund's net assets. Holdings are subject to change and may have changed since the date specified. |
| Portfolio composition as of February 28, 20231 |
| 1 | Figures represent the percentage of the Fund's long-term investments. Allocations are subject to change and may have changed since the date specified. |
Allspring Conservative Income Fund | 7
Fund expenses (unaudited)
As a shareholder of the Fund, you incur ongoing costs including management fees, shareholder servicing fees, and other Fund expenses. This example is intended to help you understand your ongoing costs (in dollars) of investing in the Fund and to compare these costs with the ongoing costs of investing in other mutual funds.
The example is based on an investment of $1,000 invested at the beginning of the six-month period and held for the entire period from September 1, 2022 to February 28, 2023.
Actual expenses
The “Actual” line of the table below provides information about actual account values and actual expenses. You may use the information in this line, together with the amount you invested, to estimate the expenses that you paid over the period. Simply divide your account value by $1,000 (for example, an $8,600 account value divided by $1,000 = 8.6), then multiply the result by the number in the “Actual” line under the heading entitled “Expenses paid during period” for your applicable class of shares to estimate the expenses you paid on your account during this period.
Hypothetical example for comparison purposes
The “Hypothetical” line of the table below provides information about hypothetical account values and hypothetical expenses based on the Fund’s actual expense ratio and an assumed rate of return of 5% per year before expenses, which is not the Fund’s actual return. The hypothetical account values and expenses may not be used to estimate the actual ending account balance or expenses you paid for the period. You may use this information to compare the ongoing costs of investing in the Fund and other funds. To do so, compare this 5% hypothetical example with the 5% hypothetical examples that appear in the shareholder reports of the other funds.
Please note that the expenses shown in the table are meant to highlight your ongoing costs only. Therefore, the “Hypothetical” line of the table is useful in comparing ongoing costs only, and will not help you determine the relative total costs of owning different funds.
| | Beginning
account value
9-1-2022 | Ending
account value
2-28-2023 | Expenses
paid during
the period1 | Annualized net
expense ratio |
| Class A2 | | | | |
| Actual | $1,000.00 | $1,015.52 | $2.00 | 0.40% |
| Hypothetical (5% return before expenses) | $1,000.00 | $1,022.81 | $2.01 | 0.40% |
| Institutional Class | | | | |
| Actual | $1,000.00 | $1,015.22 | $1.25 | 0.25% |
| Hypothetical (5% return before expenses) | $1,000.00 | $1,023.55 | $1.25 | 0.25% |
1 Expenses paid is equal to the annualized net expense ratio of each class multiplied by the average account value over the period, multiplied by 181 divided by 365 (to reflect the one-half-year period).
8 | Allspring Conservative Income Fund
Portfolio of investments—February 28, 2023 (unaudited)
| | | Interest
rate | Maturity
date | Principal | Value |
| Agency securities: 0.81% | | | | | |
| GNMA ±± | | 4.58% | 8-20-2070 | $1,938,445 | $ 1,911,629 |
| Total Agency securities (Cost $2,052,759) | | | | | 1,911,629 |
| Asset-backed securities: 25.55% | | | | | |
| AmeriCredit Automobile Receivables Trust Series 2022-2 Class A2A | | 4.20 | 12-18-2025 | 436,029 | 432,849 |
| BMW Vehicle Lease Trust Series 2021-1 Class A3 | | 0.29 | 1-25-2024 | 1,308,505 | 1,301,721 |
| BMW Vehicle Lease Trust Series 2023-1 Class A2 | | 5.27 | 2-25-2025 | 1,500,000 | 1,499,392 |
| BMW Vehicle Lease Trust Series 2023-1 Class A3 | | 5.16 | 11-25-2025 | 885,000 | 883,900 |
| Capital One Prime Auto Receivables Trust Series 2023-1 Class A2 | | 5.20 | 5-15-2026 | 5,200,000 | 5,195,071 |
| CarMax Auto Owner Trust Series 2020-4 Class A3 | | 0.50 | 8-15-2025 | 1,288,241 | 1,255,537 |
| CarMax Auto Owner Trust Series 2021-4 Class A2A | | 0.24 | 11-15-2024 | 191,536 | 190,500 |
| CarMax Auto Owner Trust Series 2021-4 Class A3 | | 0.56 | 9-15-2026 | 2,599,000 | 2,460,035 |
| Carvana Auto Receivables Trust 2022-P3 Class A2 | | 4.42 | 12-10-2025 | 1,164,519 | 1,157,213 |
| CCG Receivables Trust Series 2020-1 Class A2 144A | | 0.54 | 12-14-2027 | 425,425 | 417,879 |
| Chase Auto Owner Trust Series 2022-AA Class A2 144A | | 3.86 | 10-27-2025 | 1,129,105 | 1,119,514 |
| Chesapeake Funding II LLC Series 2020-1A Class A1 144A | | 0.87 | 8-15-2032 | 612,606 | 606,779 |
| Daimler Trucks Retail Trust Series 2022-1 Class A2 | | 5.07 | 9-16-2024 | 3,100,000 | 3,097,238 |
| DLLAD LLC Series 2021-1 144A | | 0.35 | 9-20-2024 | 208,598 | 206,291 |
| Donlen Fleet Lease Funding Series 2021-2 Class A1 (1 Month LIBOR +0.33%) 144A± | | 4.73 | 12-11-2034 | 1,104,061 | 1,099,264 |
| Enterprise Fleet Financing LLC Series 2020-1 Class A2 144A | | 1.78 | 12-22-2025 | 576,445 | 574,504 |
| Evergreen Credit Card Trust 2022 CRT-1 Class B 144A | | 5.61 | 7-15-2026 | 2,000,000 | 1,963,622 |
| Evergreen Credit Card Trust 2022 CRT-2 Class B 144A | | 6.56 | 11-15-2026 | 1,000,000 | 994,313 |
| Ford Credit Auto Lease Trust Series 2022-A Class A2A | | 2.78 | 10-15-2024 | 590,383 | 585,647 |
| Ford Credit Auto Owner Trust Series 2018-2 Class A 144A | | 3.47 | 1-15-2030 | 2,000,000 | 1,986,571 |
| Ford Credit Auto Owner Trust Series 2022- B Class A2A | | 3.44 | 2-15-2025 | 1,160,453 | 1,152,364 |
| Ford Credit Auto Owner Trust Series 2022-C Class A2A | | 4.52 | 4-15-2025 | 705,000 | 701,974 |
| Foursight Capital Automobile Receivables Trust Series 2022-1 Class A2 144A | | 1.15 | 9-15-2025 | 345,200 | 340,313 |
| General Motors Financial Securitized Term 2021-2 Class A3 | | 0.51 | 4-16-2026 | 1,719,969 | 1,659,155 |
| GM Financial Auto Lease Trust Series 2021-2 Class A3 | | 0.34 | 5-20-2024 | 792,612 | 783,438 |
| GM Financial Auto Lease Trust Series 2023-1 Class A3A | | 5.27 | 6-20-2025 | 1,300,000 | 1,299,736 |
| Honda Auto Receivables Owner Trust Series 2021-3 Class A3 | | 0.41 | 11-18-2025 | 2,480,000 | 2,374,869 |
| Honda Auto Receivables Owner Trust Series 2023-1 Class A2 | | 5.22 | 10-21-2025 | 1,500,000 | 1,498,663 |
| Hyundai Auto Lease Securitization Series 2022-A Class A3 144A | | 1.16 | 1-15-2025 | 3,000,000 | 2,908,931 |
| John Deere Owner Trust Series 2022-B Class A2 | | 3.73 | 6-16-2025 | 935,000 | 925,929 |
| John Deere Owner Trust Series 2022-C Class A2 | | 4.98 | 8-15-2025 | 1,450,000 | 1,445,130 |
| Mercedes-Benz Auto Receivables Series 2022-1 Class A2 | | 5.26 | 10-15-2025 | 1,460,000 | 1,459,653 |
| Nissan Auto Lease Trust Series 2022-A Class A3 | | 3.81 | 5-15-2025 | 1,069,000 | 1,054,194 |
| Oscar US Funding Trust Series 2021-2A Class A2 144A | | 0.39 | 8-12-2024 | 353,368 | 350,237 |
| Santander Drive Auto Receivable Trust Series 2021-4 A3 | | 0.51 | 8-15-2025 | 196,365 | 196,029 |
| Santander Drive Auto Receivable Trust Series 2022-5 Class A3 | | 4.11 | 8-17-2026 | 1,250,000 | 1,234,648 |
| SoFi Consumer Loan Program Trust Series 2021-1 Class A 144A | | 0.49 | 9-25-2030 | 581,378 | 568,159 |
| Tesla Auto Lease Trust Series 2021-A Class A2 144A | | 0.36 | 3-20-2025 | 105,173 | 104,644 |
| Toyota Auto Receivables Series 2023-A Class A2 | | 5.05 | 1-15-2026 | 2,850,000 | 2,843,532 |
| Venture CDO Limited Series 16-25A Class AR (3 Month LIBOR +1.02%) 144A± | | 5.83 | 4-20-2029 | 1,867,864 | 1,856,468 |
| Verizon Master Trust Series 2022-5 Class A1A | | 3.72 | 7-20-2027 | 2,050,000 | 2,021,885 |
The accompanying notes are an integral part of these financial statements.
Allspring Conservative Income Fund | 9
Portfolio of investments—February 28, 2023 (unaudited)
| | | Interest
rate | Maturity
date | Principal | Value |
| Asset-backed securities (continued) | | | | | |
| Volkswagen Group of America Auto Lease Trust Series 2022-A Class A2 | | 3.02% | 10-21-2024 | $2,000,627 | $ 1,975,245 |
| Wheels SPV LLC Series 2020-1A Class A2 144A | | 0.51 | 8-20-2029 | 153,787 | 152,462 |
| World Omni Auto Lease Trust Series 2021-A Class A3 | | 0.42 | 8-15-2024 | 2,901,911 | 2,829,184 |
| World Omni Auto Lease Trust Series 2022-A Class A | | 2.63 | 10-15-2024 | 1,598,309 | 1,578,888 |
| Total Asset-backed securities (Cost $60,687,185) | | | | | 60,343,570 |
| Corporate bonds and notes: 45.67% | | | | | |
| Communication services: 0.99% | | | | | |
| Entertainment: 0.99% | | | | | |
| Take-Two Interactive Software Incorporated | | 3.30 | 3-28-2024 | 2,400,000 | 2,344,445 |
| Consumer discretionary: 1.34% | | | | | |
| Food products: 0.69% | | | | | |
| Cargill Incorporated 144A | | 3.25 | 3-1-2023 | 1,637,000 | 1,637,000 |
| Multiline retail: 0.65% | | | | | |
| Dollar General Corporation | | 4.25 | 9-20-2024 | 1,560,000 | 1,532,573 |
| Consumer staples: 0.81% | | | | | |
| Tobacco: 0.81% | | | | | |
| BAT Capital Corporation | | 2.79 | 9-6-2024 | 2,000,000 | 1,916,786 |
| Energy: 1.39% | | | | | |
| Oil, gas & consumable fuels: 1.39% | | | | | |
| Chevron Corporation | | 1.14 | 5-11-2023 | 3,300,000 | 3,274,953 |
| Financials: 26.93% | | | | | |
| Banks: 5.89% | | | | | |
| Bank of America Corporation (3 Month LIBOR +0.78%) ± | | 3.55 | 3-5-2024 | 2,000,000 | 1,999,739 |
| Bank of America Corporation | | 4.13 | 1-22-2024 | 2,000,000 | 1,979,566 |
| Fifth Third Bancorp | | 4.30 | 1-16-2024 | 2,000,000 | 1,977,354 |
| JPMorgan Chase & Company (U.S. SOFR +0.58%) ± | | 4.98 | 3-16-2024 | 4,000,000 | 4,000,315 |
| PNC Financial Services Group Incorporated | | 3.50 | 1-23-2024 | 2,000,000 | 1,968,604 |
| Truist Bank (3 Month LIBOR +0.74%) ±## | | 3.69 | 8-2-2024 | 2,000,000 | 1,984,280 |
| | | | | | 13,909,858 |
| Capital markets: 5.27% | | | | | |
| Bank of New York Mellon Corporation | | 0.85 | 10-25-2024 | 3,442,000 | 3,210,217 |
| Goldman Sachs Group Incorporated | | 1.22 | 12-6-2023 | 1,000,000 | 969,593 |
| Morgan Stanley (U.S. SOFR +0.46%) ± | | 4.96 | 1-25-2024 | 4,000,000 | 3,997,508 |
| State Street Corporation | | 3.10 | 5-15-2023 | 4,290,000 | 4,270,356 |
| | | | | | 12,447,674 |
| Consumer finance: 4.62% | | | | | |
| American Express Company | | 3.70 | 8-3-2023 | 1,140,000 | 1,132,388 |
| BMW US Capital LLC 144A | | 3.45 | 4-12-2023 | 1,150,000 | 1,147,652 |
| Daimler Finance North America LLC (3 Month LIBOR +0.84%) 144A± | | 5.65 | 5-4-2023 | 2,000,000 | 2,001,368 |
| Daimler Truck Financial North America Company 144A | | 5.20 | 1-17-2025 | 800,000 | 794,856 |
The accompanying notes are an integral part of these financial statements.
10 | Allspring Conservative Income Fund
Portfolio of investments—February 28, 2023 (unaudited)
| | | Interest
rate | Maturity
date | Principal | Value |
| Consumer finance (continued) | | | | | |
| John Deere Capital Corporation (U.S. SOFR +0.12%) ± | | 4.54% | 7-10-2023 | $2,000,000 | $ 1,999,406 |
| Toyota Motor Credit Corporation | | 0.45 | 1-11-2024 | 4,000,000 | 3,838,245 |
| | | | | | 10,913,915 |
| Diversified financial services: 1.32% | | | | | |
| National Rural Utilities Cooperative Finance | | 0.35 | 2-8-2024 | 3,255,000 | 3,104,057 |
| Insurance: 9.83% | | | | | |
| AIG Global Funding 144A | | 0.45 | 12-8-2023 | 2,000,000 | 1,926,493 |
| Athene Global Funding 144A | | 0.95 | 1-8-2024 | 1,000,000 | 961,048 |
| Athene Global Funding (U.S. SOFR +0.70%) 144A± | | 5.25 | 5-24-2024 | 2,500,000 | 2,484,625 |
| Brighthouse Financial Global Funding 144A | | 1.20 | 12-15-2023 | 2,000,000 | 1,932,529 |
| Brighthouse Financial Global Funding Series 2021-1 (U.S. SOFR +0.76%) 144A± | | 5.20 | 4-12-2024 | 1,200,000 | 1,198,308 |
| Equitable Financial Life Insurance Company of America (U.S. SOFR +0.39%) 144A± | | 4.82 | 4-6-2023 | 2,250,000 | 2,249,210 |
| GA Global Funding Trust (U.S. SOFR +1.36%) 144A± | | 5.80 | 4-11-2025 | 2,000,000 | 1,986,160 |
| MassMutual Global Funding 144A« | | 0.48 | 8-28-2023 | 3,000,000 | 2,928,800 |
| New York Life Global Funding (U.S. SOFR +0.31%) 144A± | | 4.80 | 4-26-2024 | 3,000,000 | 3,001,428 |
| Principal Life Global Funding II 144A | | 0.50 | 1-8-2024 | 3,000,000 | 2,878,546 |
| Principal Life Global Funding II (U.S. SOFR +0.38%) 144A± | | 4.93 | 8-23-2024 | 670,000 | 667,586 |
| Protective Life Global Funding 144A | | 1.08 | 6-9-2023 | 1,000,000 | 988,886 |
| | | | | | 23,203,619 |
| Health care: 0.82% | | | | | |
| Life sciences tools & services: 0.82% | | | | | |
| Thermo Fisher Scientific | | 0.80 | 10-18-2023 | 2,000,000 | 1,943,678 |
| Industrials: 1.91% | | | | | |
| Road & rail: 0.85% | | | | | |
| Ryder System Incorporated | | 3.40 | 3-1-2023 | 2,000,000 | 2,000,000 |
| Transportation infrastructure: 1.06% | | | | | |
| Penske Truck Leasing Company LP 144A | | 2.70 | 3-14-2023 | 2,500,000 | 2,497,200 |
| Information technology: 0.83% | | | | | |
| Semiconductors & semiconductor equipment: 0.83% | | | | | |
| Microchip Technology Incorporated | | 2.67 | 9-1-2023 | 2,000,000 | 1,969,453 |
| Materials: 0.83% | | | | | |
| Metals & mining: 0.83% | | | | | |
| Glencore Funding LLC Company 144A | | 4.13 | 3-12-2024 | 2,000,000 | 1,969,208 |
| Real estate: 0.51% | | | | | |
| Equity REITs: 0.51% | | | | | |
| Public Storage (U.S. SOFR +0.47%) ± | | 4.93 | 4-23-2024 | 1,195,000 | 1,195,121 |
| Utilities: 9.31% | | | | | |
| Electric utilities: 6.57% | | | | | |
| Florida Power & Light Company (U.S. SOFR +0.25%) ± | | 4.80 | 5-10-2023 | 2,000,000 | 1,999,382 |
| NextEra Energy Capital Company | | 4.26 | 9-1-2024 | 2,000,000 | 1,961,983 |
| NextEra Energy Capital Company %% | | 6.05 | 3-1-2025 | 250,000 | 251,522 |
| Oklahoma Gas & Electric Company | | 0.55 | 5-26-2023 | 3,493,000 | 3,454,825 |
The accompanying notes are an integral part of these financial statements.
Allspring Conservative Income Fund | 11
Portfolio of investments—February 28, 2023 (unaudited)
| | | Interest
rate | Maturity
date | Principal | Value |
| Electric utilities (continued) | | | | | |
| Southern California Edison's First Mortgage (U.S. SOFR +0.64%) ± | | 5.06% | 4-3-2023 | $4,220,000 | $ 4,219,378 |
| Southern Company (U.S. SOFR +0.37%) ± | | 4.92 | 5-10-2023 | 2,000,000 | 1,999,200 |
| Tampa Electric Company | | 3.88 | 7-12-2024 | 1,670,000 | 1,631,317 |
| | | | | | 15,517,607 |
| Gas utilities: 1.41% | | | | | |
| Atmos Energy Corporation (3 Month LIBOR +0.38%) ± | | 5.10 | 3-9-2023 | 3,320,000 | 3,320,141 |
| Multi-utilities: 1.33% | | | | | |
| CenterPoint Energy Incorporated (U.S. SOFR +0.65%) ± | | 5.21 | 5-13-2024 | 1,445,000 | 1,438,066 |
| CenterPoint Energy Incorporated (3 Month LIBOR +0.50%) ± | | 5.28 | 3-2-2023 | 1,705,000 | 1,705,000 |
| | | | | | 3,143,066 |
| Total Corporate bonds and notes (Cost $108,173,236) | | | | | 107,840,354 |
| Municipal obligations: 3.30% | | | | | |
| California: 1.89% | | | | | |
| Miscellaneous revenue: 1.89% | | | | | |
| California State Earthquake Authority | | 5.39 | 7-1-2023 | 2,000,000 | 2,000,248 |
| Pomona CA Pension Obligation Series BJ | | 4.00 | 8-1-2023 | 1,000,000 | 994,267 |
| Torrance CA Joint Powers Financing Authority | | 1.43 | 10-1-2023 | 1,500,000 | 1,467,186 |
| | | | | | 4,461,701 |
| Colorado: 1.23% | | | | | |
| Transportation revenue: 1.23% | | | | | |
| Colorado Bridge Enterprise Senior Project Infrastructure | | 0.92 | 12-31-2023 | 3,000,000 | 2,895,712 |
| New York: 0.18% | | | | | |
| Utilities revenue: 0.18% | | | | | |
| Long Island NY Power Authority Electric System Series C | | 0.76 | 3-1-2023 | 430,000 | 430,000 |
| Total Municipal obligations (Cost $7,943,094) | | | | | 7,787,413 |
| Yankee corporate bonds and notes: 24.64% | | | | | |
| Energy: 1.25% | | | | | |
| Oil, gas & consumable fuels: 1.25% | | | | | |
| Total Capital International SA | | 3.70 | 1-15-2024 | 3,000,000 | 2,956,743 |
| Financials: 23.39% | | | | | |
| Banks: 19.10% | | | | | |
| Bank of Montreal | | 0.40 | 9-15-2023 | 2,000,000 | 1,948,445 |
| Bank of Montreal (U.S. SOFR +0.27%) ± | | 4.66 | 9-15-2023 | 2,000,000 | 2,000,182 |
| Bank of Nova Scotia « | | 0.40 | 9-15-2023 | 2,000,000 | 1,948,067 |
| Bank of Nova Scotia | | 0.70 | 4-15-2024 | 2,000,000 | 1,896,725 |
| Banque Federative du Credit Mutuel SA 144A | | 3.75 | 7-20-2023 | 3,500,000 | 3,479,610 |
| Cooperatieve Rabobank UA (U.S. SOFR +0.30%) ± | | 4.74 | 1-12-2024 | 2,000,000 | 1,998,994 |
| Credit Suisse AG New York | | 1.00 | 5-5-2023 | 3,000,000 | 2,969,132 |
| Mitsubishi UFJ Financial Group Incorporated | | 3.41 | 3-7-2024 | 2,000,000 | 1,958,865 |
| National Bank of Canada | | 5.25 | 1-17-2025 | 2,000,000 | 1,993,485 |
| NatWest Markets plc (U.S. SOFR +0.53%) 144A± | | 5.08 | 8-12-2024 | 1,250,000 | 1,236,540 |
| Nordea Bank AB 144A | | 1.00 | 6-9-2023 | 2,000,000 | 1,977,625 |
The accompanying notes are an integral part of these financial statements.
12 | Allspring Conservative Income Fund
Portfolio of investments—February 28, 2023 (unaudited)
| | | Interest
rate | Maturity
date | Principal | Value |
| Banks (continued) | | | | | |
| Royal Bank of Canada | | 3.97% | 7-26-2024 | $3,700,000 | $ 3,627,980 |
| Skandinaviska Enskilda Banken (3 Month LIBOR +0.32%) 144A± | | 5.08 | 9-1-2023 | 3,000,000 | 2,997,697 |
| Sumitomo Mitsui Financial Group | | 2.70 | 7-16-2024 | 1,750,000 | 1,684,432 |
| Sumitomo Mitsui Trust Bank Limited 144A | | 0.80 | 9-12-2023 | 1,250,000 | 1,220,063 |
| Sumitomo Mitsui Trust Bank Limited 144A | | 0.85 | 3-25-2024 | 1,000,000 | 951,748 |
| Sumitomo Mitsui Trust Bank Limited (U.S. SOFR +0.44%) 144A± | | 4.81 | 9-16-2024 | 1,200,000 | 1,196,064 |
| Svenska Handelsbanken AB 144A | | 0.63 | 6-30-2023 | 3,500,000 | 3,447,069 |
| Swedbank AB 144A | | 0.60 | 9-25-2023 | 2,000,000 | 1,942,656 |
| Toronto Dominion Bank | | 3.25 | 3-11-2024 | 665,000 | 650,657 |
| Toronto Dominion Bank | | 4.29 | 9-13-2024 | 2,000,000 | 1,969,100 |
| Westpac Banking Corporation (U.S. SOFR +0.30%) ± | | 4.85 | 11-18-2024 | 2,000,000 | 1,996,780 |
| | | | | | 45,091,916 |
| Capital markets: 2.75% | | | | | |
| Deutsche Bank AG (U.S. SOFR +0.50%) ± | | 5.06 | 11-8-2023 | 3,500,000 | 3,496,546 |
| UBS AG (U.S. SOFR +0.45%) 144A± | | 5.01 | 8-9-2024 | 3,000,000 | 3,001,778 |
| | | | | | 6,498,324 |
| Diversified financial services: 1.54% | | | | | |
| BNZ International Funding Limited 144A | | 3.38 | 3-1-2023 | 1,585,000 | 1,585,000 |
| Federation des caisses Desjardins (U.S. SOFR +0.43%) 144A± | | 4.98 | 5-21-2024 | 2,050,000 | 2,043,510 |
| | | | | | 3,628,510 |
| Total Yankee corporate bonds and notes (Cost $58,337,215) | | | | | 58,175,493 |
| Short-term investments: 1.71% | | | | | |
| Commercial paper: 1.27% | | | | | |
| Evergy Missouri ☼ | | 0.00 | 3-1-2023 | 751,000 | 750,901 |
| FISERV Incorporated ☼ | | 0.00 | 3-1-2023 | 2,250,000 | 2,249,702 |
| | | | | | 3,000,603 |
| | | Yield | | Shares | |
| Investment companies: 0.44% | | | | | |
| Allspring Government Money Market Fund Select Class ♠∞## | | 4.39 | | 788,699 | 788,699 |
| Securities Lending Cash Investments LLC ♠∩∞ | | 4.54 | | 254,000 | 254,000 |
| | | | | | 1,042,699 |
| Total Short-term investments (Cost $4,043,699) | | | | | 4,043,302 |
| Total investments in securities (Cost $241,237,188) | 101.68% | | | | 240,101,761 |
| Other assets and liabilities, net | (1.68) | | | | (3,964,787) |
| Total net assets | 100.00% | | | | $236,136,974 |
The accompanying notes are an integral part of these financial statements.
Allspring Conservative Income Fund | 13
Portfolio of investments—February 28, 2023 (unaudited)
| ±± | The coupon of the security is adjusted based on the principal and/or interest payments received from the underlying pool of mortgages as well as the credit quality and the actual prepayment speed of the underlying mortgages. The rate shown is the rate in effect at period end. |
| 144A | The security may be resold in transactions exempt from registration, normally to qualified institutional buyers, pursuant to Rule 144A under the Securities Act of 1933. |
| ± | Variable rate investment. The rate shown is the rate in effect at period end. |
| ## | All or a portion of this security is segregated for when-issued securities. |
| « | All or a portion of this security is on loan. |
| ♠ | The issuer of the security is an affiliated person of the Fund as defined in the Investment Company Act of 1940. |
| ∩ | The investment is a non-registered investment company purchased with cash collateral received from securities on loan. |
| ☼ | Zero coupon security. The rate represents the current yield to maturity. |
| ∞ | The rate represents the 7-day annualized yield at period end. |
| %% | The security is purchased on a when-issued basis. |
| Abbreviations: |
| GNMA | Government National Mortgage Association |
| LIBOR | London Interbank Offered Rate |
| SOFR | Secured Overnight Financing Rate |
Investments in affiliates
An affiliated investment is an investment in which the Fund owns at least 5% of the outstanding voting shares of the issuer or as a result of other relationships, such as the Fund and the issuer having the same investment manager. Transactions with issuers that were affiliates of the Fund at the end of the period were as follows:
| | Value,
beginning of
period | Purchases | Sales
proceeds | Net
realized
gains
(losses) | | Net
change in
unrealized
gains
(losses) | | Value,
end of
period | Shares,
end
of period | Income
from
affiliated
securities |
| Short-term investments | | | | | | | | | |
| Allspring Government Money Market Fund Select Class | $637,978 | $65,058,853 | $(64,908,132) | $0 | | $0 | | $ 788,699 | 788,699 | $ 23,622 |
| Securities Lending Cash Investments LLC | 0 | 4,649,303 | (4,395,303) | 0 | | 0 | | 254,000 | 254,000 | 4,032 # |
| | | | | $0 | | $0 | | $1,042,699 | | $27,654 |
| # | Amount shown represents income before fees and rebates. |
The accompanying notes are an integral part of these financial statements.
14 | Allspring Conservative Income Fund
Statement of assets and liabilities—February 28, 2023 (unaudited)
| | |
| Assets | |
Investments in unaffiliated securities (including $248,533 of securities loaned), at value (cost $240,194,489)
| $ 239,059,062 |
Investments in affiliated securities, at value (cost $1,042,699)
| 1,042,699 |
Cash
| 23,080 |
Receivable for interest
| 1,190,929 |
Receivable for securities lending income, net
| 575 |
Prepaid expenses and other assets
| 38,784 |
Total assets
| 241,355,129 |
| Liabilities | |
Payable for investments purchased
| 4,128,937 |
Dividends payable
| 415,747 |
Payable upon receipt of securities loaned
| 254,000 |
Payable for when-issued transactions
| 250,625 |
Payable for Fund shares redeemed
| 107,795 |
Management fee payable
| 17,602 |
Administration fees payable
| 14,725 |
Accrued expenses and other liabilities
| 28,724 |
Total liabilities
| 5,218,155 |
Total net assets
| $236,136,974 |
| Net assets consist of | |
Paid-in capital
| $ 243,574,459 |
Total distributable loss
| (7,437,485) |
Total net assets
| $236,136,974 |
| Computation of net asset value per share | |
Net assets – Class A2
| $ 371,408 |
Shares outstanding – Class A21
| 37,635 |
Net asset value per share – Class A2
| $9.87 |
Net assets – Institutional Class
| $ 235,765,566 |
Shares outstanding – Institutional Class1
| 23,900,796 |
Net asset value per share – Institutional Class
| $9.86 |
| 1 | The Fund has an unlimited number of authorized shares. |
The accompanying notes are an integral part of these financial statements.
Allspring Conservative Income Fund | 15
Statement of operations—six months ended February 28, 2023 (unaudited)
| | |
| Investment income | |
Interest (net of foreign withholding taxes of $23,614)
| $ 4,459,265 |
Income from affiliated securities
| 25,163 |
Total investment income
| 4,484,428 |
| Expenses | |
Management fee
| 326,911 |
| Administration fees | |
Class A2
| 261 |
Institutional Class
| 104,481 |
| Shareholder servicing fees | |
Class A2
| 245 |
Custody and accounting fees
| 11,678 |
Professional fees
| 32,708 |
Registration fees
| 18,256 |
Shareholder report expenses
| 11,323 |
Trustees’ fees and expenses
| 10,624 |
Other fees and expenses
| 3,439 |
Total expenses
| 519,926 |
| Less: Fee waivers and/or expense reimbursements | |
Fund-level
| (192,645) |
Class A2
| (131) |
Net expenses
| 327,150 |
Net investment income
| 4,157,278 |
| Realized and unrealized gains (losses) on investments | |
Net realized losses on investments
| (2,171,393) |
Net change in unrealized gains (losses) on investments
| 2,019,350 |
Net realized and unrealized gains (losses) on investments
| (152,043) |
Net increase in net assets resulting from operations
| $ 4,005,235 |
The accompanying notes are an integral part of these financial statements.
16 | Allspring Conservative Income Fund
Statement of changes in net assets
| | | | | |
| | Six months ended
February 28, 2023
(unaudited) | Year ended
August 31, 2022 |
| Operations | | | | |
Net investment income
| | $ 4,157,278 | | $ 2,684,857 |
Net realized losses on investments
| | (2,171,393) | | (1,298,652) |
Net change in unrealized gains (losses) on investments
| | 2,019,350 | | (4,047,704) |
Net increase (decrease) in net assets resulting from operations
| | 4,005,235 | | (2,661,499) |
| Distributions to shareholders from | | | | |
| Net investment income and net realized gains | | | | |
Class A2
| | (5,146) | | (1,263) |
Institutional Class
| | (4,192,848) | | (2,494,224) |
Total distributions to shareholders
| | (4,197,994) | | (2,495,487) |
| Capital share transactions | Shares | | Shares | |
| Proceeds from shares sold | | | | |
Class A2
| 16,246 | 160,394 | 6,012 | 60,186 |
Institutional Class
| 625,217 | 6,157,434 | 13,115,815 | 130,901,840 |
| | | 6,317,828 | | 130,962,026 |
| Reinvestment of distributions | | | | |
Class A2
| 519 | 5,114 | 127 | 1,257 |
Institutional Class
| 221,545 | 2,180,952 | 153,634 | 1,523,254 |
| | | 2,186,066 | | 1,524,511 |
| Payment for shares redeemed | | | | |
Class A2
| (1,011) | (9,949) | (1,498) | (14,987) |
Institutional Class
| (6,114,503) | (60,185,294) | (21,174,036) | (211,050,695) |
| | | (60,195,243) | | (211,065,682) |
Net decrease in net assets resulting from capital share transactions
| | (51,691,349) | | (78,579,145) |
Total decrease in net assets
| | (51,884,108) | | (83,736,131) |
| Net assets | | | | |
Beginning of period
| | 288,021,082 | | 371,757,213 |
End of period
| | $236,136,974 | | $ 288,021,082 |
The accompanying notes are an integral part of these financial statements.
Allspring Conservative Income Fund | 17
Financial highlights
(For a share outstanding throughout each period)
| | | Year ended August 31 |
| Class A2 | Six months ended
February 28, 2023
(unaudited) | 2022 | 2021 | 2020 1 |
Net asset value, beginning of period
| $9.87 | $10.02 | $10.05 | $10.02 |
Net investment income
| 0.15 | 0.07 | 0.04 | 0.02 |
Net realized and unrealized gains (losses) on investments
| 0.00 2 | (0.16) | (0.03) | 0.03 |
Total from investment operations
| 0.15 | (0.09) | 0.01 | 0.05 |
| Distributions to shareholders from | | | | |
Net investment income
| (0.15) | (0.06) | (0.04) | (0.02) |
Tax basis return of capital
| 0.00 | 0.00 | (0.00) 2 | 0.00 |
Total distributions to shareholders
| (0.15) | (0.06) | (0.04) | (0.02) |
Net asset value, end of period
| $9.87 | $9.87 | $10.02 | $10.05 |
Total return3
| 1.55% | (0.92)% | 0.11% | 0.53% |
| Ratios to average net assets (annualized) | | | | |
Gross expenses
| 0.63% | 0.68% | 0.70% | 0.70% |
Net expenses
| 0.40% | 0.43% | 0.49% | 0.50% |
Net investment income
| 3.12% | 0.70% | 0.35% | 0.78% |
| Supplemental data | | | | |
Portfolio turnover rate
| 59% | 112% | 111% | 102% |
Net assets, end of period (000s omitted)
| $371 | $216 | $173 | $71 |
| 1 | For the period from May 29, 2020 (commencement of class operations) to August 31, 2020 |
| 2 | Amount is less than $0.005. |
| 3 | Returns for periods of less than one year are not annualized. |
The accompanying notes are an integral part of these financial statements.
18 | Allspring Conservative Income Fund
Financial highlights
(For a share outstanding throughout each period)
| | | Year ended August 31 |
| Institutional Class | Six months ended
February 28, 2023
(unaudited) | 2022 | 2021 | 2020 | 2019 | 2018 |
Net asset value, beginning of period
| $9.87 | $10.02 | $10.05 | $10.00 | $9.99 | $10.01 |
Net investment income
| 0.16 | 0.09 | 0.06 | 0.17 | 0.26 | 0.18 |
Net realized and unrealized gains (losses) on investments
| (0.01) | (0.16) | (0.02) | 0.06 | 0.01 | (0.02) |
Total from investment operations
| 0.15 | (0.07) | 0.04 | 0.23 | 0.27 | 0.16 |
| Distributions to shareholders from | | | | | | |
Net investment income
| (0.16) | (0.08) | (0.07) | (0.18) | (0.26) | (0.18) |
Tax basis return of capital
| 0.00 | 0.00 | (0.00) 1 | 0.00 | 0.00 | 0.00 |
Total distributions to shareholders
| (0.16) | (0.08) | (0.07) | (0.18) | (0.26) | (0.18) |
Net asset value, end of period
| $9.86 | $9.87 | $10.02 | $10.05 | $10.00 | $9.99 |
Total return2
| 1.52% | (0.69)% | 0.35% | 2.30% | 2.71% | 1.65% |
| Ratios to average net assets (annualized) | | | | | | |
Gross expenses
| 0.40% | 0.39% | 0.37% | 0.38% | 0.37% | 0.37% |
Net expenses
| 0.25% | 0.25% | 0.26% | 0.27% | 0.27% | 0.27% |
Net investment income
| 3.18% | 0.81% | 0.61% | 1.74% | 2.54% | 1.79% |
| Supplemental data | | | | | | |
Portfolio turnover rate
| 59% | 112% | 111% | 102% | 171% | 197% |
Net assets, end of period (000s omitted)
| $235,766 | $287,805 | $371,584 | $384,253 | $332,551 | $400,002 |
| 1 | Amount is less than $0.005. |
| 2 | Returns for periods of less than one year are not annualized. |
The accompanying notes are an integral part of these financial statements.
Allspring Conservative Income Fund | 19
Notes to financial statements (unaudited)
1. ORGANIZATION
Allspring Funds Trust (the "Trust"), a Delaware statutory trust organized on March 10, 1999, is an open-end management investment company registered under the Investment Company Act of 1940, as amended (the "1940 Act"). As an investment company, the Trust follows the accounting and reporting guidance in Financial Accounting Standards Board ("FASB") Accounting Standards Codification Topic 946, Financial Services – Investment Companies. These financial statements report on the Allspring Conservative Income Fund (the "Fund") which is a diversified series of the Trust.
2. SIGNIFICANT ACCOUNTING POLICIES
The following significant accounting policies, which are consistently followed in the preparation of the financial statements of the Fund, are in conformity with U.S. generally accepted accounting principles which require management to make estimates and assumptions that affect the reported amounts of assets and liabilities, disclosure of contingent assets and liabilities at the date of the financial statements, and the reported amounts of income and expenses during the reporting period. Actual results could differ from those estimates.
Securities valuation
All investments are valued each business day as of the close of regular trading on the New York Stock Exchange (generally 4 p.m. Eastern Time), although the Fund may deviate from this calculation time under unusual or unexpected circumstances.
Debt securities are valued at the evaluated bid price provided by an independent pricing service (e.g. taking into account various factors, including yields, maturities, or credit ratings) or, if a reliable price is not available, the quoted bid price from an independent broker-dealer.
Investments in registered open-end investment companies (other than those listed on a foreign or domestic exchange or market) are valued at net asset value. Interests in non-registered investment companies that are redeemable at net asset value are fair valued normally at net asset value.
Investments which are not valued using the methods discussed above are valued at their fair value, as determined in good faith by Allspring Funds Management, LLC ("Allspring Funds Management"), which was named the valuation designee by the Board of Trustees. As the valuation designee, Allspring Funds Management is responsible for day-to-day valuation activities for the Allspring Funds. In connection with these responsibilities, Allspring Funds Management has established a Valuation Committee and has delegated to it the authority to take any actions regarding the valuation of portfolio securities that the Valuation Committee deems necessary or appropriate, including determining the fair value of portfolio securities. On a quarterly basis, the Board of Trustees receives reports of valuation actions taken by the Valuation Committee. On at least an annual basis, the Board of Trustees receives an assessment of the adequacy and effectiveness of Allspring Funds Management's process for determining the fair value of the portfolio of investments.
Securities lending
The Fund may lend its securities from time to time in order to earn additional income in the form of fees or interest on securities received as collateral or the investment of any cash received as collateral. When securities are on loan, the Fund receives interest or dividends on those securities. Cash collateral received in connection with its securities lending transactions is invested in Securities Lending Cash Investments, LLC (the "Securities Lending Fund"), an affiliated non-registered investment company. Investments in Securities Lending Fund are valued at the evaluated bid price provided by an independent pricing service. Income earned from investment in the Securities Lending Fund (net of fees and rebates), if any, is included in income from affiliated securities on the Statement of Operations.
In a securities lending transaction, the net asset value of the Fund is affected by an increase or decrease in the value of the securities loaned and by an increase or decrease in the value of the instrument in which collateral is invested. The amount of securities lending activity undertaken by the Fund fluctuates from time to time. The Fund has the right under the lending agreement to recover the securities from the borrower on demand. In the event of default or bankruptcy by the borrower, the Fund may be prevented from recovering the loaned securities or gaining access to the collateral or may experience delays or costs in doing so. In such an event, the terms of the agreement allow the unaffiliated securities lending agent to use the collateral to purchase replacement securities on behalf of the Fund or pay the Fund the market value of the loaned securities. The Fund bears the risk of loss with respect to depreciation of its investment of the cash collateral.
When-issued transactions
The Fund may purchase securities on a forward commitment or when-issued basis. The Fund records a when-issued transaction on the trade date and will segregate assets in an amount at least equal in value to the Fund's commitment to purchase when-
20 | Allspring Conservative Income Fund
Notes to financial statements (unaudited)
issued securities. Securities purchased on a when-issued basis are marked-to-market daily and the Fund begins earning interest on the settlement date. Losses may arise due to changes in the market value of the underlying securities or if the counterparty does not perform under the contract.
Security transactions and income recognition
Securities transactions are recorded on a trade date basis. Realized gains or losses are recorded on the basis of identified cost.
Interest income is accrued daily and bond discounts are accreted and premiums are amortized daily. To the extent debt obligations are placed on non-accrual status, any related interest income may be reduced by writing off interest receivables when the collection of all or a portion of interest has been determined to be doubtful based on consistently applied procedures and the fair value has decreased. If the issuer subsequently resumes interest payments or when the collectability of interest is reasonably assured, the debt obligation is removed from non-accrual status. Interest income is recorded net of foreign taxes withheld where recovery of such taxes is not assured. Paydown gains and losses are included in interest income.
Distributions to shareholders
Distributions to shareholders from net investment income are declared daily and paid monthly. Distributions from net realized gains, if any, are recorded on the ex-dividend date and paid at least annually. Such distributions are determined in accordance with income tax regulations and may differ from U.S. generally accepted accounting principles. Dividend sources are estimated at the time of declaration. The tax character of distributions is determined as of the Fund's fiscal year end. Therefore, a portion of the Fund's distributions made prior to the Fund’s fiscal year end may be categorized as a tax return of capital at year end.
Federal and other taxes
The Fund intends to continue to qualify as a regulated investment company by distributing substantially all of its investment company taxable income and any net realized capital gains (after reduction for capital loss carryforwards) sufficient to relieve it from all, or substantially all, federal income taxes. Accordingly, no provision for federal income taxes was required.
The Fund’s income and federal excise tax returns and all financial records supporting those returns for the prior three fiscal years are subject to examination by the federal and Delaware revenue authorities. Management has analyzed the Fund's tax positions taken on federal, state, and foreign tax returns, as applicable, for all open tax years and does not believe that there are any uncertain tax positions that require recognition of a tax liability.
As of February 28, 2023, the aggregate cost of all investments for federal income tax purposes was $244,352,888 and the unrealized gains (losses) consisted of:
| Gross unrealized gains | $ 41,610 |
| Gross unrealized losses | (4,292,737) |
| Net unrealized losses | $(4,251,127) |
As of August 31, 2022, the Fund had capital loss carryforwards which consisted of $3,862,944 in short-term capital losses and $379,673 in long-term capital losses.
3. FAIR VALUATION MEASUREMENTS
Fair value measurements of investments are determined within a framework that has established a fair value hierarchy based upon the various data inputs utilized in determining the value of the Fund’s investments. The three-level hierarchy gives the highest priority to unadjusted quoted prices in active markets for identical assets or liabilities (Level 1) and the lowest priority to unobservable inputs (Level 3). The Fund’s investments are classified within the fair value hierarchy based on the lowest level of input that is significant to the fair value measurement. The inputs are summarized into three broad levels as follows:
| ■ | Level 1 – quoted prices in active markets for identical securities |
| ■ | Level 2 – other significant observable inputs (including quoted prices for similar securities, interest rates, prepayment speeds, credit risk, etc.) |
| ■ | Level 3 – significant unobservable inputs (including the Fund’s own assumptions in determining the fair value of investments) |
The inputs or methodologies used for valuing investments in securities are not necessarily an indication of the risk associated with investing in those securities.
Allspring Conservative Income Fund | 21
Notes to financial statements (unaudited)
The following is a summary of the inputs used in valuing the Fund’s assets and liabilities as of February 28, 2023:
| | Quoted prices
(Level 1) | Other significant
observable inputs
(Level 2) | Significant
unobservable inputs
(Level 3) | Total |
| Assets | | | | |
| Investments in: | | | | |
| Agency securities | $ 0 | $ 1,911,629 | $0 | $ 1,911,629 |
| Asset-backed securities | 0 | 60,343,570 | 0 | 60,343,570 |
| Corporate bonds and notes | 0 | 107,840,354 | 0 | 107,840,354 |
| Municipal obligations | 0 | 7,787,413 | 0 | 7,787,413 |
| Yankee corporate bonds and notes | 0 | 58,175,493 | 0 | 58,175,493 |
| Short-term investments | | | | |
| Commercial paper | 0 | 3,000,603 | 0 | 3,000,603 |
| Investment companies | 1,042,699 | 0 | 0 | 1,042,699 |
| Total assets | $1,042,699 | $239,059,062 | $0 | $240,101,761 |
Additional sector, industry or geographic detail, if any, is included in the Portfolio of Investments.
For the six months ended February 28, 2023, the Fund did not have any transfers into/out of Level 3.
4. TRANSACTIONS WITH AFFILIATES
Management fee
Allspring Funds Management, a wholly owned subsidiary of Allspring Global Investments Holdings, LLC, a holding company indirectly owned by certain private funds of GTCR LLC and Reverence Capital Partners, L.P., is the manager of the Fund and provides advisory and fund-level administrative services under an investment management agreement. Under the investment management agreement, Allspring Funds Management is responsible for, among other services, implementing the investment objectives and strategies of the Fund, supervising the subadviser and providing fund-level administrative services in connection with the Fund’s operations. As compensation for its services under the investment management agreement, Allspring Funds Management is entitled to receive a management fee at the following annual rate based on the Fund’s average daily net assets:
| Average daily net assets | Management fee |
| First $1 billion | 0.250% |
| Next $4 billion | 0.225 |
| Next $5 billion | 0.190 |
| Over $10 billion | 0.180 |
For the six months ended February 28, 2023, the management fee was equivalent to an annual rate of 0.25% of the Fund’s average daily net assets.
Allspring Funds Management has retained the services of a subadviser to provide daily portfolio management to the Fund. The fee for subadvisory services is borne by Allspring Funds Management. Allspring Global Investments, LLC ("Allspring Investments"), an affiliate of Allspring Funds Management and a wholly owned subsidiary of Allspring Global Investments Holdings, LLC, is the subadviser to the Fund and is entitled to receive a fee from Allspring Funds Management at an annual rate starting at 0.10% and declining to 0.05% as the average daily net assets of the Fund increase.
Administration fees
Under a class-level administration agreement, Allspring Funds Management provides class-level administrative services to the Fund, which includes paying fees and expenses for services provided by the transfer agent, sub-transfer agents, omnibus account servicers and record-keepers. As compensation for its services under the class-level administration agreement, Allspring Funds Management receives an annual fee which is calculated based on the average daily net assets of each class as follows:
22 | Allspring Conservative Income Fund
Notes to financial statements (unaudited)
| | Class-level
administration fee |
| Class A2 | 0.16% |
| Institutional Class | 0.08 |
Waivers and/or expense reimbursements
Allspring Funds Management has contractually committed to waive and/or reimburse management and administration fees to the extent necessary to maintain certain net operating expense ratios for the Fund. When each class of the Fund has exceeded its expense cap, Allspring Funds Management will waive fees and/or reimburse expenses from fund-level expenses on a proportionate basis and then from class specific expenses. When only certain classes exceed their expense caps, waivers and/or reimbursements are applied against class specific expenses before fund-level expenses. Allspring Funds Management has contractually committed through December 31, 2023 to waive fees and/or reimburse expenses to the extent necessary to cap expenses. Prior to or after the commitment expiration date, the caps may be increased or the commitment to maintain the caps may be terminated only with the approval of the Board of Trustees. As of February 28, 2023, the contractual expense caps are as follows:
| | Expense ratio caps |
| Class A2 | 0.40% |
| Institutional Class | 0.25 |
Shareholder servicing fees
The Trust has entered into contracts with one or more shareholder servicing agents, whereby Class A2 shares is charged a fee at an annual rate up to 0.15% of its average daily net assets. A portion of these total shareholder servicing fees were paid to affiliates of the Fund.
Interfund transactions
The Fund may purchase or sell portfolio investment securities to certain affiliates pursuant to Rule 17a-7 under the 1940 Act and under procedures adopted by the Board of Trustees. The procedures have been designed to ensure that these interfund transactions, which do not incur broker commissions, are effected at current market prices.
5. INVESTMENT PORTFOLIO TRANSACTIONS
Purchases and sales of investments, excluding U.S. government obligations (if any) and short-term securities, for the six months ended February 28, 2023 were $153,648,291 and $185,894,759, respectively.
6. SECURITIES LENDING TRANSACTIONS
The Fund lends its securities through an unaffiliated securities lending agent and receives collateral in the form of cash or securities with a value at least equal to the value of the securities on loan. The value of the loaned securities is determined at the close of each business day and any increases or decreases in the required collateral are exchanged between the Fund and the counterparty on the next business day. Cash collateral received is invested in the Securities Lending Fund which seeks to provide a positive return compared to the daily Federal Funds Open Rate by investing in high-quality, U.S. dollar-denominated short-term money market instruments and is exempt from registration under Section 3(c)(7) of the 1940 Act. Securities Lending Fund is managed by Allspring Funds Management and is subadvised by Allspring Investments. Allspring Funds Management receives an advisory fee starting at 0.05% and declining to 0.01% as the average daily net assets of the Securities Lending Fund increase. All of the fees received by Allspring Funds Management are paid to Allspring Investments for its services as subadviser.
In the event of counterparty default or the failure of a borrower to return a loaned security, the Fund has the right to use the collateral to offset any losses incurred. As of February 28, 2023, the Fund had securities lending transactions with the following counterparties which are subject to offset:
Allspring Conservative Income Fund | 23
Notes to financial statements (unaudited)
| Counterparty | Value of
securities on
loan | Collateral
received 1 | Net amount |
| Barclays Capital Incorporated | $215,261 | $(215,261) | $0 |
| JPMorgan Securities LLC | 33,272 | (33,272) | 0 |
1 Collateral disclosed within this table is limited to the net transaction with the counterparty.
7. BANK BORROWINGS
The Trust (excluding the money market funds), Allspring Master Trust and Allspring Variable Trust are parties to a $350,000,000 revolving credit agreement whereby the Fund is permitted to use bank borrowings for temporary or emergency purposes, such as to fund shareholder redemption requests. Interest under the credit agreement is charged to the Fund based on a borrowing rate equal to the higher of the Federal Funds rate or the overnight bank funding rate in effect on that day plus a spread. In addition, an annual commitment fee equal based on the unused balance is allocated to each participating fund.
For the six months ended February 28, 2023, there were no borrowings by the Fund under the agreement.
8. MARKET RISKS
On March 11, 2020, the World Health Organization announced that it had made the assessment that coronavirus disease 2019 (“COVID-19”) is a pandemic. The impacts of COVID-19 are affecting the entire global economy, individual companies and investment products, the funds, and the market in general. There is significant uncertainty around the extent and duration of business disruptions related to COVID-19 and the impacts may last for an extended period of time. COVID-19 has led to significant uncertainty and volatility in the financial markets.
9. INDEMNIFICATION
Under the Fund's organizational documents, the officers and Trustees have been granted certain indemnification rights against certain liabilities that may arise out of performance of their duties to the Fund. The Fund has entered into a separate agreement with each Trustee that converts indemnification rights currently existing under the Fund’s organizational documents into contractual rights that cannot be changed in the future without the consent of the Trustee. Additionally, in the normal course of business, the Fund may enter into contracts with service providers that contain a variety of indemnification clauses. The Fund’s maximum exposure under these arrangements is dependent on future claims that may be made against the Fund and, therefore, cannot be estimated.
24 | Allspring Conservative Income Fund
Other information (unaudited)
PROXY VOTING INFORMATION
A description of the policies and procedures used to determine how to vote proxies relating to portfolio securities is available without charge, upon request, by calling 1-800-222-8222, visiting our website at allspringglobal.com, or visiting the SEC website at sec.gov. Information regarding how the proxies related to portfolio securities were voted during the most recent 12-month period ended June 30 is available on the website at allspringglobal.com or by visiting the SEC website at sec.gov.
QUARTERLY PORTFOLIO HOLDINGS INFORMATION
The Fund files its complete schedule of portfolio holdings with the SEC for the first and third quarters of each fiscal year as an exhibit to its reports on Form N-PORT. Shareholders may view the filed Form N-PORT by visiting the SEC website at sec.gov.
Allspring Conservative Income Fund | 25
Other information (unaudited)
BOARD OF TRUSTEES AND OFFICERS
Each of the Trustees and Officers listed in the table below acts in identical capacities for each fund in the Allspring family of funds, which consists of 127 mutual funds comprising the Allspring Funds Trust, Allspring Variable Trust, Allspring Master Trust and four closed-end funds (collectively the “Fund Complex”). This table should be read in conjunction with the Prospectus and the Statement of Additional Information1. The mailing address of each Trustee and Officer is 1415 Vantage Park Drive, 3rd Floor, Charlotte, NC 28203. Each Trustee and Officer serves an indefinite term, however, each Trustee serves such term until reaching the mandatory retirement age established by the Trustees.
Independent Trustees
Name and
year of birth | Position held and
length of service* | Principal occupations during past five years or longer | Current other
public company or
investment
company
directorships |
William R. Ebsworth
(Born 1957) | Trustee,
since 2015 | Retired. From 1984 to 2013, equities analyst, portfolio manager, research director and chief investment officer at Fidelity Management and Research Company in Boston, Tokyo, and Hong Kong, and retired in 2013 as Chief Investment Officer of Fidelity Strategic Advisers, Inc. where he led a team of investment professionals managing client assets. Prior thereto, Board member of Hong Kong Securities Clearing Co., Hong Kong Options Clearing Corp., the Thailand International Fund, Ltd., Fidelity Investments Life Insurance Company, and Empire Fidelity Investments Life Insurance Company. Audit Committee Chair and Investment Committee Chair of the Vincent Memorial Hospital Foundation (non-profit organization). Mr. Ebsworth is a CFA® charterholder. | N/A |
Jane A. Freeman
(Born 1953) | Trustee,
since 2015;
Chair Liaison,
since 2018 | Retired. From 2012 to 2014 and 1999 to 2008, Chief Financial Officer of Scientific Learning Corporation. From 2008 to 2012, Ms. Freeman provided consulting services related to strategic business projects. Prior to 1999, Portfolio Manager at Rockefeller & Co. and Scudder, Stevens & Clark. Board member of the Harding Loevner Funds from 1996 to 2014, serving as both Lead Independent Director and chair of the Audit Committee. Board member of the Russell Exchange Traded Funds Trust from 2011 to 2012 and the chair of the Audit Committee. Ms. Freeman is also an inactive Chartered Financial Analyst. | N/A |
Isaiah Harris, Jr.
(Born 1952) | Trustee,
since 2009; Audit
Committee
Chair,
since 2019 | Retired. Member of the Advisory Board of CEF of East Central Florida. Chairman of the Board of CIGNA Corporation from 2009 to 2021, and Director from 2005 to 2008. From 2003 to 2011, Director of Deluxe Corporation. Prior thereto, President and CEO of BellSouth Advertising and Publishing Corp. from 2005 to 2007, President and CEO of BellSouth Enterprises from 2004 to 2005 and President of BellSouth Consumer Services from 2000 to 2003. Emeritus member of the Iowa State University Foundation Board of Governors. Emeritus Member of the Advisory Board of Iowa State University School of Business. Advisory Board Member, Palm Harbor Academy (private school). Advisory Board Member, Fellowship of Christian Athletes. Mr. Harris is a certified public accountant (inactive status). | N/A |
David F. Larcker
(Born 1950) | Trustee,
since 2009 | Distinguished Visiting Fellow at the Hoover Institution since 2022. James Irvin Miller Professor of Accounting at the Graduate School of Business (Emeritus), Stanford University, Director of the Corporate Governance Research Initiative and Senior Faculty of The Rock Center for Corporate Governance since 2006. From 2005 to 2008, Professor of Accounting at the Graduate School of Business, Stanford University. Prior thereto, Ernst & Young Professor of Accounting at The Wharton School, University of Pennsylvania from 1985 to 2005. | N/A |
26 | Allspring Conservative Income Fund
Other information (unaudited)
Name and
year of birth | Position held and
length of service* | Principal occupations during past five years or longer | Current other
public company or
investment
company
directorships |
Olivia S. Mitchell
(Born 1953) | Trustee,
since 2006;
Nominating and
Governance
Committee Chair,
since 2018 | International Foundation of Employee Benefit Plans Professor since 1993, Wharton School of the University of Pennsylvania. Director of Wharton’s Pension Research Council and Boettner Center on Pensions & Retirement Research, and Research Associate at the National Bureau of Economic Research. Previously taught at Cornell University from 1978 to 1993. | N/A |
Timothy J. Penny
(Born 1951) | Trustee,
since 1996;
Chair,
since 2018 | President and Chief Executive Officer of Southern Minnesota Initiative Foundation, a non-profit organization, since 2007. Vice Chair of the Economic Club of Minnesota, since 2007. Co-Chair of the Committee for a Responsible Federal Budget, since 1995. Member of the Board of Trustees of NorthStar Education Finance, Inc., a non-profit organization, from 2007-2022. Senior Fellow of the University of Minnesota Humphrey Institute from 1995 to 2017. | N/A |
James G. Polisson
(Born 1959) | Trustee,
since 2018 | Retired. Chief Marketing Officer, Source (ETF) UK Services, Ltd, from 2015 to 2017. From 2012 to 2015, Principal of The Polisson Group, LLC, a management consulting, corporate advisory and principal investing company. Chief Executive Officer and Managing Director at Russell Investments, Global Exchange Traded Funds from 2010 to 2012. Managing Director of Barclays Global Investors from 1998 to 2010 and Global Chief Marketing Officer for iShares and Barclays Global Investors from 2000 to 2010. Trustee of the San Francisco Mechanics’ Institute, a non-profit organization, from 2013 to 2015. Board member of the Russell Exchange Traded Fund Trust from 2011 to 2012. Director of Barclays Global Investors Holdings Deutschland GmbH from 2006 to 2009. Mr. Polisson is an attorney and has a retired status with the Massachusetts and District of Columbia Bar Associations. | N/A |
Pamela Wheelock
(Born 1959) | Trustee,
since January
2020; previously
Trustee from
January 2018 to
July 2019 | Retired. Executive and Senior Financial leadership positions in the public, private and nonprofit sectors. Interim President and CEO, McKnight Foundation, 2020. Interim Commissioner, Minnesota Department of Human Services, 2019. Chief Operating Officer, Twin Cities Habitat for Humanity, 2017-2019. Vice President for University Services, University of Minnesota, 2012-2016. Interim President and CEO, Blue Cross and Blue Shield of Minnesota, 2011-2012. Executive Vice-President and Chief Financial Officer, Minnesota Wild, 2002-2008. Commissioner, Minnesota Department of Finance, 1999-2002. Chair of the Board of Directors of Destination Medical Center Corporation. Board member of the Minnesota Wild Foundation. | N/A |
* Length of service dates reflect the Trustee’s commencement of service with the Trust’s predecessor entities, where applicable.
Allspring Conservative Income Fund | 27
Other information (unaudited)
Officers2
Name and
year of birth | Position held and
length of service | Principal occupations during past five years or longer |
Andrew Owen
(Born 1960) | President,
since 2017 | President and Chief Executive Officer of Allspring Funds Management, LLC since 2017 and Head of Global Fund Governance of Allspring Global Investments since 2022. Prior thereto, co-president of Galliard Capital Management, LLC, an affiliate of Allspring Funds Management, LLC, from 2019 to 2022 and Head of Affiliated Managers, Allspring Global Investments, from 2014 to 2019 and Executive Vice President responsible for marketing, investments and product development for Allspring Funds Management, LLC, from 2009 to 2014. |
Jeremy DePalma
(Born 1974) | Treasurer,
since 2012
(for certain funds in
the Fund Complex);
since 2021 (for
the remaining funds in the
Fund Complex) | Senior Vice President of Allspring Funds Management, LLC since 2009. Senior Vice President of Evergreen Investment Management Company, LLC from 2008 to 2010 and head of the Fund Reporting and Control Team within Fund Administration from 2005 to 2010. |
Christopher Baker
(Born 1976) | Chief Compliance Officer, since 2022 | Global Chief Compliance Officer for Allspring Global Investments since 2022. Prior thereto, Chief Compliance Officer for State Street Global Advisors from 2018 to 2021. Senior Compliance Officer for the State Street divisions of Alternative Investment Solutions, Sector Solutions, and Global Marketing from 2015 to 2018. From 2010 to 2015 Vice President, Global Head of Investment and Marketing Compliance for State Street Global Advisors. |
Matthew Prasse
(Born 1983) | Chief Legal Officer, since 2022; Secretary, since 2021 | Senior Counsel of the Allspring Legal Department since 2021. Senior Counsel of the Wells Fargo Legal Department from 2018 to 2021. Previously, Counsel for Barings LLC from 2015 to 2018. Prior to joining Barings, Associate at Morgan, Lewis & Bockius LLP from 2008 to 2015. |
1 The Statement of Additional Information includes additional information about the Trustees and is available, without charge, upon request, by calling 1-800-222-8222 or by visiting the website at allspringglobal.com.
2 For those Officers with tenures at Allspring Global Investments and/or Allspring Funds Management, LLC that began prior to 2021, such tenures include years of service during which these businesses/entities were known as Wells Fargo Asset Management and Wells Fargo Funds Management, LLC, respectively.
28 | Allspring Conservative Income Fund
For more information
More information about Allspring Funds is available free upon request. To obtain literature, please write, visit the Fund's website, or call:
Allspring Funds
P.O. Box 219967
Kansas City, MO 64121-9967
Website: allspringglobal.com
Individual investors: 1-800-222-8222
Retail investment professionals: 1-888-877-9275
Institutional investment professionals: 1-800-260-5969
This report and the financial statements contained herein are submitted for the general information of the shareholders of the Fund. If this report is used for promotional purposes, distribution of the report must be accompanied or preceded by a current prospectus. Before investing, please consider the investment objectives, risks, charges, and expenses of the investment. For a current prospectus and, if available, a summary prospectus, containing this information, call
1-800-222-8222 or visit the Fund's website at allspringglobal.com. Read the prospectus carefully before you invest or send money.
Allspring Global InvestmentsTM is the trade name for the asset management firms of Allspring Global Investments Holdings, LLC, a holding company indirectly owned by certain private funds of GTCR LLC and Reverence Capital Partners, L.P. These firms include but are not limited to Allspring Global Investments, LLC, and Allspring Funds Management, LLC. Certain products managed by Allspring entities are distributed by Allspring Funds Distributor, LLC (a broker-dealer and Member FINRA/SIPC).
This material is for general informational and educational purposes only and is NOT intended to provide investment advice or a recommendation of any kind - including a recommendation for any specific investment, strategy, or plan.
© 2023 Allspring Global Investments Holdings, LLC. All rights reserved.
ALL-03102023-fxze1e6x 04-23
SAR3174 02-23
Semi-Annual Report
February 28, 2023
Allspring Core Plus Bond Fund
The views expressed and any forward-looking statements are as of February 28, 2023, unless otherwise noted, and are those of the Fund's portfolio managers and/or Allspring Global Investments. Discussions of individual securities or the markets generally are not intended as individual recommendations. Future events or results may vary significantly from those expressed in any forward-looking statements. The views expressed are subject to change at any time in response to changing circumstances in the market. Allspring Global Investments disclaims any obligation to publicly update or revise any views expressed or forward-looking statements.
Allspring Core Plus Bond Fund | 1
Letter to shareholders (unaudited)
Andrew Owen
President
Allspring Funds
Dear Shareholder:
We are pleased to offer you this semi annual report for the Allspring Core Plus Bond Fund for the six-month period that ended February 28, 2023. Globally, stocks and bonds experienced heightened volatility through the challenging period. Earlier tailwinds provided by global stimulus programs, vaccination rollouts, and recovering consumer and corporate sentiment were wiped away by the highest rate of inflation in four decades as well as the impact of ongoing aggressive central bank rate hikes and the prospect of more rate hikes. Compounding these concerns were the global reverberations of the Russia-Ukraine war and the impact of China’s strict COVID-19 lockdowns.
For the six-month period, stocks and bonds had mixed results, with non-U.S. developed market equities outperforming U.S. stocks but emerging market stocks trailing overall. Bonds––both U.S. and non-U.S.––began to recover from sustained aggressive interest rate increases. After suffering deep and broad losses over the past year, recent fixed income performance benefited from a base of higher yields that can now generate higher income. For the period, U.S. stocks, based on the S&P 500 Index,1 returned 1.26%. International stocks, as measured by the MSCI ACWI ex USA Index (Net),2 returned 7.30%, while the MSCI EM Index (Net) (USD)3 lost 2.29%. Among bond indexes, the Bloomberg U.S. Aggregate Bond Index4 returned -2.13%, the Bloomberg Global Aggregate ex-USD Index (unhedged)5 returned -0.11%, the Bloomberg Municipal Bond Index6 gained 0.66%, and the ICE BofA U.S. High Yield Index7 returned 2.41%.
The Russia-Ukraine war, high inflation, and central bank rate hikes rocked markets.
A challenging calendar year for investors continued in September as all asset classes suffered major losses. Central banks kept up their battle against rapidly rising prices with more rate hikes. The strength of the U.S. dollar weighed on results for investors holding non-U.S.-dollar assets. U.S. mortgage rates jumped to near 7% on 30-year fixed-rate mortgages; the decreased housing affordability began to cool demand somewhat. The U.K. experienced a sharp sell-off of government bonds and the British pound in September as investors panicked in response to a new government budget that was seen as financially unsound. The Bank of England (BoE) then stepped in and bought long-dated government bonds.
“ A challenging calendar year for investors continued in September as all asset classes suffered major losses.”
| 1 | The S&P 500 Index consists of 500 stocks chosen for market size, liquidity, and industry group representation. It is a market-value-weighted index with each stock's weight in the index proportionate to its market value. You cannot invest directly in an index. |
| 2 | The Morgan Stanley Capital International (MSCI) All Country World Index (ACWI) ex USA Index (Net) is a free-float-adjusted market-capitalization-weighted index that is designed to measure the equity market performance of developed and emerging markets, excluding the U.S. Source: MSCI. MSCI makes no express or implied warranties or representations and shall have no liability whatsoever with respect to any MSCI data contained herein. The MSCI data may not be further redistributed or used as a basis for other indices or any securities or financial products. This report is not approved, reviewed, or produced by MSCI. You cannot invest directly in an index. |
| 3 | The MSCI Emerging Markets (EM) Index (Net) (USD) is a free-float-adjusted market-capitalization-weighted index that is designed to measure equity market performance of emerging markets. You cannot invest directly in an index. |
| 4 | The Bloomberg U.S. Aggregate Bond Index is a broad-based benchmark that measures the investment-grade, U.S. dollar-denominated, fixed-rate taxable bond market, including Treasuries, government-related and corporate securities, mortgage-backed securities (agency fixed-rate and hybrid adjustable-rate mortgage pass-throughs), asset-backed securities, and commercial mortgage-backed securities. You cannot invest directly in an index. |
| 5 | The Bloomberg Global Aggregate ex-USD Index (unhedged) is an unmanaged index that provides a broad-based measure of the global investment-grade fixed-income markets excluding the U.S. dollar-denominated debt market. You cannot invest directly in an index. |
| 6 | The Bloomberg Municipal Bond Index is an unmanaged index composed of long-term tax-exempt bonds with a minimum credit rating of Baa. You cannot invest directly in an index. |
| 7 | The ICE BofA U.S. High Yield Index is a market-capitalization-weighted index of domestic and Yankee high-yield bonds. The index tracks the performance of high-yield securities traded in the U.S. bond market. You cannot invest directly in an index. Copyright 2023. ICE Data Indices, LLC. All rights reserved. |
2 | Allspring Core Plus Bond Fund
Letter to shareholders (unaudited)
Equities had a reprieve in October. Value stocks and small caps fared best. Globally, developed markets outpaced emerging market equities, which were hurt by weakness among Chinese stocks. Central banks continued to try to curtail high inflation with aggressive interest rate hikes. Geopolitical risks persisted, including the ongoing Russia-Ukraine war and economic, financial market, and political turmoil in the U.K. Concerns over Europe’s energy crisis eased thanks to unseasonably warm weather and plentiful gas on hand. The U.S. labor market continued its resilience against rising prices as unemployment remained near a record low.
Stocks and bonds rallied in November. Economic news was encouraging, driven by U.S. labor market strength. Although central banks kept raising rates, hopes rose for an easing in the pace of rate hikes and a possible end to central bank monetary tightening in 2023. Although inflation remained at record highs in the eurozone, we began to see signs of a possible decline in inflationary pressures as U.S. inflation moderated, with a 7.1% annual price rise in November and a monthly price increase of just 0.1%. China’s economic data remained weak, reflecting its zero-COVID-19 policy.
Financial markets cooled in December, with U.S. equities posting negative overall results in response to a weakening U.S. dollar. Fixed income securities ended one of their worst years ever, with flat overall monthly returns as markets weighed the hopes for an end to the monetary tightening cycle with the reality that central banks had not completed their jobs yet. U.S. Consumer Price Index (CPI)1 data showed a strong consistent trend downward, which brought down the 12-month CPI to 6.5% in December from 9.1% in June. Other countries and regions reported still-high but declining inflation rates as the year wound down.
The year 2023 began with a rally across global equities and fixed income securities. Investor optimism rose in response to data indicating declining inflation rates and the reopening of China’s economy with the abrupt end to its zero-COVID-19 policy. The U.S. reported surprisingly strong job gains––employers added more than 500,000 jobs––and unemployment fell to 3.4%, the lowest level since 1969. Meanwhile, wage growth, seen as a potential contributor to ongoing high inflation, continued to moderate. All eyes remained fixed on the Federal Reserve (Fed) and on how many more rate hikes remain in this tightening cycle. The 0.25% federal funds rate hike announced in January was the Fed’s smallest rate increase since March 2022.
Financial markets declined in February as investors responded unfavorably to resilient economic data. The takeaway: Central banks will likely continue their monetary tightening cycle for longer than markets had priced in. In this environment—where strong economic data is seen as bad news—the resilient U.S. labor market was seen as a negative while the inflation rate has not been falling quickly enough for the Fed, which raised interest rates by 0.25% in early February. Meanwhile, the BoE and the European Central Bank both raised rates by 0.50%. At this stage in the economic cycle, the overriding question remained: “What will central banks do?” In February, the answer appeared to be: “Move rates higher for longer.”
| 1 | The Consumer Price Index (CPI) is a measure of the average change over time in the prices paid by urban consumers for a market basket of consumer goods and services. You cannot invest directly in an index. |
Allspring Core Plus Bond Fund | 3
Letter to shareholders (unaudited)
Don’t let short-term uncertainty derail long-term investment goals.
Periods of investment uncertainty can present challenges, but experience has taught us that maintaining long-term investment goals can be an effective way to plan for the future. Although diversification cannot guarantee an investment profit or prevent losses, we believe it can be an effective way to manage investment risk and potentially smooth out overall portfolio performance. We encourage investors to know their investments and to understand that appropriate levels of risk-taking may unlock opportunities.
Thank you for choosing to invest with Allspring Funds. We appreciate your confidence in us and remain committed to helping you meet your financial needs.
Sincerely,
Andrew Owen
President
Allspring Funds
For further information about your fund, contact your investment professional, visit our website at allspringglobal.com, or call us directly at 1-800-222-8222.
4 | Allspring Core Plus Bond Fund
This page is intentionally left blank.
Performance highlights (unaudited)
| Investment objective | The Fund seeks total return, consisting of current income and capital appreciation. |
| Manager | Allspring Funds Management, LLC |
| Subadviser | Allspring Global Investments, LLC |
| Portfolio managers | Christopher Y. Kauffman, CFA®‡, Janet S. Rilling, CFA®‡, CPA, Michael J. Schueller, CFA®‡, Michal Stanczyk, Noah M. Wise, CFA®‡ |
| Average annual total returns (%) as of February 28, 2023 |
| | | Including sales charge | | Excluding sales charge | | Expense ratios1 (%) |
| | Inception date | 1 year | 5 year | 10 year | | 1 year | 5 year | 10 year | | Gross | Net 2 |
| Class A (STYAX) | 7-13-1998 | -14.01 | 0.40 | 1.60 | | -9.98 | 1.33 | 2.07 | | 0.85 | 0.68 |
| Class C (WFIPX) | 7-13-1998 | -11.71 | 0.55 | 1.46 | | -10.71 | 0.55 | 1.46 | | 1.60 | 1.43 |
| Class R6 (STYJX)3 | 10-31-2016 | – | – | – | | -9.62 | 1.70 | 2.41 | | 0.47 | 0.30 |
| Administrator Class (WIPDX) | 7-30-2010 | – | – | – | | -9.86 | 1.43 | 2.18 | | 0.79 | 0.60 |
| Institutional Class (WIPIX) | 7-18-2008 | – | – | – | | -9.68 | 1.64 | 2.37 | | 0.52 | 0.35 |
| Bloomberg U.S. Aggregate Bond Index4 | – | – | – | – | | -9.72 | 0.53 | 1.12 | | – | – |
Figures quoted represent past performance, which is no guarantee of future results, and do not reflect taxes that a shareholder may pay on an investment in a fund. Investment return and principal value of an investment will fluctuate so that an investor’s shares, when redeemed, may be worth more or less than their original cost. Performance shown without sales charges would be lower if sales charges were reflected. Current performance may be lower or higher than the performance data quoted, which assumes the reinvestment of dividends and capital gains. Current month-end performance is available on the Fund’s website, allspringglobal.com.
Index returns do not include transaction costs associated with buying and selling securities, any mutual fund fees or expenses, or any taxes. It is not possible to invest directly in an index.
For Class A shares, the maximum front-end sales charge is 4.50%. For Class C shares, the maximum contingent deferred sales charge is 1.00%. Performance including a contingent deferred sales charge assumes the sales charge for the corresponding time period. Class R6, Administrator Class and Institutional Class shares are sold without a front-end sales charge or contingent deferred sales charge.
| 1 | Reflects the expense ratios as stated in the most recent prospectuses. The expense ratios shown are subject to change and may differ from the annualized expense ratios shown in the financial highlights of this report. |
| 2 | The manager has contractually committed through December 31, 2023, to waive fees and/or reimburse expenses to the extent necessary to cap total annual fund operating expenses after fee waivers at 0.68% for Class A, 1.43% for Class C, 0.30% for Class R6, 0.60% for Administrator Class, and 0.35% for Institutional Class. Brokerage commissions, stamp duty fees, interest, taxes, acquired fund fees and expenses (if any), and extraordinary expenses are excluded from the expense caps. Prior to or after the commitment expiration date, the caps may be increased or the commitment to maintain the caps may be terminated only with the approval of the Board of Trustees. Without these caps, the Fund’s returns would have been lower. The expense ratio paid by an investor is the net expense ratio (the total annual fund operating expenses after fee waivers) as stated in the prospectuses. |
| 3 | Historical performance shown for the Class R6 shares prior to their inception reflects the performance of the Institutional Class shares, and includes the higher expenses applicable to the Institutional Class shares. If these expenses had not been included, returns for the Class R6 shares would be higher. |
| 4 | The Bloomberg U.S. Aggregate Bond Index is a broad-based benchmark that measures the investment-grade, U.S. dollar–denominated, fixed-rate taxable bond market, including Treasuries, government-related and corporate securities, mortgage-backed securities (agency fixed-rate and hybrid adjustable-rate mortgage pass-throughs), asset-backed securities, and commercial mortgage-backed securities. You cannot invest directly in an index. |
| ‡ | CFA® and Chartered Financial Analyst® are trademarks owned by CFA Institute. |
6 | Allspring Core Plus Bond Fund
Performance highlights (unaudited)
Bond values fluctuate in response to the financial condition of individual issuers, general market and economic conditions, and changes in interest rates. Changes in market conditions and government policies may lead to periods of heightened volatility in the bond market and reduced liquidity for certain bonds held by the Fund. In general, when interest rates rise, bond values fall and investors may lose principal value. Interest rate changes and their impact on the Fund and its share price can be sudden and unpredictable. Loans are subject to risks similar to those associated with other below-investment-grade bond investments, such as risk of greater volatility in value, credit risk (for example, risk of issuer default), and risk that the loan may become illiquid or difficult to price. The use of derivatives may reduce returns and/or increase volatility. Certain investment strategies tend to increase the total risk of an investment (relative to the broader market). This fund is exposed to foreign investment risk, high-yield securities risk, and mortgage- and asset-backed securities risk. High-yield securities have a greater risk of default and tend to be more volatile than higher-rated debt securities. Consult the Fund’s prospectus for additional information on these and other risks.
Allspring Core Plus Bond Fund | 7
Performance highlights (unaudited)
| Ten largest holdings (%) as of February 28, 20231 |
| U.S. Treasury Note, 3.25%, 8-31-2024 | 4.77 |
| U.S. Treasury Note, 4.13%, 11-15-2032 | 3.32 |
| FNMA, 5.50%, 3-13-2053 | 2.99 |
| FNMA, 2.50%, 3-13-2053 | 2.79 |
| Germany, 1.30%, 10-15-2027 | 2.08 |
| France, 0.75%, 2-25-2028 | 2.06 |
| U.S. Treasury Note, 3.50%, 2-15-2033 | 1.80 |
| U.S. Treasury Bond, 3.13%, 5-15-2048 | 1.75 |
| FNMA, 2.00%, 10-1-2051 | 1.66 |
| U.S. Treasury Note, 3.50%, 1-31-2028 | 1.65 |
| 1 | Figures represent the percentage of the Fund's net assets. Holdings are subject to change and may have changed since the date specified. |
| Portfolio composition as of February 28, 20231 |
| 1 | Figures represent the percentage of the Fund's long-term investments. Allocations are subject to change and may have changed since the date specified. |
8 | Allspring Core Plus Bond Fund
Fund expenses (unaudited)
As a shareholder of the Fund, you incur two types of costs: (1) transaction costs, including sales charges (loads) on purchase payments and contingent deferred sales charges (if any) on redemptions and (2) ongoing costs, including management fees, distribution (12b-1) and/or shareholder servicing fees, and other Fund expenses. This example is intended to help you understand your ongoing costs (in dollars) of investing in the Fund and to compare these costs with the ongoing costs of investing in other mutual funds.
The example is based on an investment of $1,000 invested at the beginning of the six-month period and held for the entire period from September 1, 2022 to February 28, 2023.
Actual expenses
The “Actual” line of the table below provides information about actual account values and actual expenses. You may use the information in this line, together with the amount you invested, to estimate the expenses that you paid over the period. Simply divide your account value by $1,000 (for example, an $8,600 account value divided by $1,000 = 8.6), then multiply the result by the number in the “Actual” line under the heading entitled “Expenses paid during period” for your applicable class of shares to estimate the expenses you paid on your account during this period.
Hypothetical example for comparison purposes
The “Hypothetical” line of the table below provides information about hypothetical account values and hypothetical expenses based on the Fund’s actual expense ratio and an assumed rate of return of 5% per year before expenses, which is not the Fund’s actual return. The hypothetical account values and expenses may not be used to estimate the actual ending account balance or expenses you paid for the period. You may use this information to compare the ongoing costs of investing in the Fund and other funds. To do so, compare this 5% hypothetical example with the 5% hypothetical examples that appear in the shareholder reports of the other funds.
Please note that the expenses shown in the table are meant to highlight your ongoing costs only and do not reflect any transactional costs, such as sales charges (loads) and contingent deferred sales charges. Therefore, the “Hypothetical” line of the table is useful in comparing ongoing costs only, and will not help you determine the relative total costs of owning different funds. In addition, if these transactional costs were included, your costs would have been higher.
| | Beginning
account value
9-1-2022 | Ending
account value
2-28-2023 | Expenses
paid during
the period1 | Annualized net
expense ratio |
| Class A | | | | |
| Actual | $1,000.00 | $ 984.51 | $3.35 | 0.68% |
| Hypothetical (5% return before expenses) | $1,000.00 | $1,021.42 | $3.41 | 0.68% |
| Class C | | | | |
| Actual | $1,000.00 | $ 980.43 | $7.02 | 1.43% |
| Hypothetical (5% return before expenses) | $1,000.00 | $1,017.70 | $7.15 | 1.43% |
| Class R6 | | | | |
| Actual | $1,000.00 | $ 987.26 | $1.48 | 0.30% |
| Hypothetical (5% return before expenses) | $1,000.00 | $1,023.31 | $1.51 | 0.30% |
| Administrator Class | | | | |
| Actual | $1,000.00 | $ 985.68 | $2.95 | 0.60% |
| Hypothetical (5% return before expenses) | $1,000.00 | $1,021.82 | $3.01 | 0.60% |
| Institutional Class | | | | |
| Actual | $1,000.00 | $ 986.14 | $1.72 | 0.35% |
| Hypothetical (5% return before expenses) | $1,000.00 | $1,023.06 | $1.76 | 0.35% |
1 Expenses paid is equal to the annualized net expense ratio of each class multiplied by the average account value over the period, multiplied by 181 divided by 365 (to reflect the one-half-year period).
Allspring Core Plus Bond Fund | 9
Portfolio of investments—February 28, 2023 (unaudited)
| | | Interest
rate | Maturity
date | Principal | Value |
| Agency securities: 27.93% | | | | | | |
| FHLB | | 3.00% | 9-1-2034 | $ | 340,441 | $ 318,204 |
| FHLB | | 5.50 | 7-15-2036 | | 9,750,000 | 10,895,555 |
| FHLB | | 5.63 | 3-14-2036 | | 1,310,000 | 1,451,038 |
| FHLMC | | 2.50 | 11-1-2051 | | 11,150,366 | 9,507,431 |
| FHLMC | | 3.00 | 6-1-2050 | | 645,862 | 578,946 |
| FHLMC | | 3.00 | 7-1-2050 | | 1,635,491 | 1,466,050 |
| FHLMC | | 3.00 | 8-1-2050 | | 792,631 | 710,500 |
| FHLMC | | 3.00 | 8-1-2050 | | 1,562,356 | 1,384,953 |
| FHLMC | | 3.00 | 3-1-2052 | | 280,179 | 246,954 |
| FHLMC | | 3.50 | 12-1-2045 | | 794,603 | 740,329 |
| FHLMC | | 3.50 | 12-1-2045 | | 236,611 | 220,854 |
| FHLMC | | 3.50 | 5-1-2052 | | 110,036 | 100,271 |
| FHLMC (12 Month LIBOR +1.33%) ± | | 3.61 | 1-1-2036 | | 5,348 | 5,260 |
| FHLMC | | 4.00 | 6-1-2044 | | 634,995 | 602,973 |
| FHLMC | | 4.00 | 5-1-2049 | | 1,087,004 | 1,036,796 |
| FHLMC | | 5.00 | 6-1-2036 | | 87,630 | 88,401 |
| FHLMC | | 5.00 | 8-1-2040 | | 88,707 | 89,490 |
| FHLMC | | 5.00 | 7-1-2052 | | 24,928,477 | 24,565,585 |
| FHLMC | | 5.50 | 8-1-2038 | | 21,956 | 22,579 |
| FHLMC | | 5.50 | 12-1-2038 | | 179,777 | 184,881 |
| FHLMC | | 5.50 | 6-1-2040 | | 366,897 | 375,240 |
| FHLMC | | 5.50 | 11-1-2052 | | 121,131 | 121,082 |
| FHLMC | | 8.00 | 2-1-2030 | | 81 | 83 |
| FHLMC Series 2015-SC01 Class 1A | | 3.50 | 5-25-2045 | | 120,746 | 111,046 |
| FHLMC Series T-42 Class A5 | | 7.50 | 2-25-2042 | | 908,064 | 924,855 |
| FHLMC Series T-57 Class 2A1 ±± | | 3.69 | 7-25-2043 | | 28,457 | 26,382 |
| FHLMC Series T-59 Class 2A1 ±± | | 3.57 | 10-25-2043 | | 130,659 | 98,013 |
| FNMA ¤ | | 0.00 | 7-15-2037 | | 1,690,000 | 875,820 |
| FNMA ¤ | | 0.00 | 8-6-2038 | | 14,105,000 | 7,124,653 |
| FNMA | | 2.00 | 5-1-2051 | | 31,160,508 | 25,450,482 |
| FNMA | | 2.00 | 8-1-2051 | | 12,206,360 | 9,964,680 |
| FNMA | | 2.00 | 10-1-2051 | | 65,045,456 | 53,008,036 |
| FNMA | | 2.00 | 12-1-2051 | | 10,917,495 | 8,913,797 |
| FNMA %% | | 2.00 | 3-13-2053 | | 50,035,000 | 40,746,276 |
| FNMA | | 2.50 | 1-1-2052 | | 11,263,720 | 9,551,423 |
| FNMA %% | | 2.50 | 3-13-2053 | | 104,965,000 | 88,904,534 |
| FNMA (12 Month LIBOR +1.61%) ± | | 2.52 | 5-1-2046 | | 190,358 | 195,494 |
| FNMA | | 3.00 | 11-1-2045 | | 552,885 | 498,543 |
| FNMA | | 3.00 | 12-1-2045 | | 1,437,626 | 1,296,923 |
| FNMA | | 3.00 | 12-1-2046 | | 737,936 | 665,481 |
| FNMA | | 3.00 | 8-1-2050 | | 1,785,911 | 1,581,507 |
| FNMA | | 3.00 | 2-1-2052 | | 8,738,485 | 7,702,267 |
| FNMA (12 Month LIBOR +1.61%) ± | | 3.25 | 3-1-2046 | | 406,259 | 419,261 |
| FNMA | | 3.48 | 3-1-2029 | | 939,519 | 888,083 |
| FNMA | | 3.50 | 12-1-2037 | | 18,226,880 | 17,380,318 |
| FNMA | | 3.50 | 10-1-2043 | | 510,794 | 477,599 |
| FNMA | | 3.50 | 4-1-2045 | | 80,829 | 75,412 |
| FNMA | | 3.50 | 8-1-2045 | | 1,248,417 | 1,163,467 |
| FNMA | | 3.50 | 3-1-2048 | | 2,616,240 | 2,414,427 |
| FNMA %% | | 3.50 | 3-13-2053 | | 37,770,000 | 34,379,552 |
| FNMA | | 3.62 | 3-1-2029 | | 437,586 | 416,496 |
| FNMA | | 3.77 | 3-1-2029 | | 1,025,462 | 984,130 |
| FNMA (12 Month LIBOR +1.73%) ± | | 3.98 | 9-1-2036 | | 5,878 | 5,934 |
The accompanying notes are an integral part of these financial statements.
10 | Allspring Core Plus Bond Fund
Portfolio of investments—February 28, 2023 (unaudited)
| | | Interest
rate | Maturity
date | Principal | Value |
| Agency securities (continued) | | | | | | |
| FNMA (1 Year Treasury Constant Maturity +2.27%) ± | | 4.00% | 8-1-2036 | $ | 259,189 | $ 263,974 |
| FNMA %% | | 4.00 | 3-16-2038 | | 21,865,000 | 21,318,375 |
| FNMA | | 4.00 | 2-1-2046 | | 155,651 | 149,171 |
| FNMA | | 4.00 | 4-1-2046 | | 801,074 | 768,224 |
| FNMA | | 4.00 | 6-1-2048 | | 882,763 | 843,957 |
| FNMA | | 4.00 | 2-1-2050 | | 1,195,531 | 1,132,907 |
| FNMA %% | | 4.00 | 3-13-2053 | | 44,775,000 | 42,025,535 |
| FNMA (12 Month LIBOR +1.78%) ± | | 4.03 | 8-1-2036 | | 17,095 | 17,476 |
| FNMA (1 Year Treasury Constant Maturity +2.23%) ± | | 4.04 | 11-1-2038 | | 12,198 | 12,427 |
| FNMA | | 4.50 | 11-1-2048 | | 866,630 | 848,067 |
| FNMA | | 4.50 | 9-1-2052 | | 43,023,207 | 41,575,665 |
| FNMA %% | | 4.50 | 3-13-2053 | | 40,200,000 | 38,730,188 |
| FNMA | | 5.00 | 1-1-2024 | | 2,449 | 2,445 |
| FNMA | | 5.00 | 2-1-2036 | | 10,299 | 10,377 |
| FNMA | | 5.00 | 6-1-2040 | | 27,477 | 27,686 |
| FNMA | | 5.00 | 8-1-2040 | | 599,401 | 600,184 |
| FNMA | | 5.50 | 11-1-2023 | | 1,636 | 1,632 |
| FNMA | | 5.50 | 8-1-2034 | | 39,194 | 40,058 |
| FNMA | | 5.50 | 2-1-2035 | | 11,645 | 11,890 |
| FNMA | | 5.50 | 8-1-2038 | | 83,864 | 83,770 |
| FNMA | | 5.50 | 8-1-2038 | | 158,828 | 158,742 |
| FNMA %% | | 5.50 | 3-13-2053 | | 95,595,000 | 95,430,696 |
| FNMA | | 6.00 | 10-1-2037 | | 223,044 | 231,037 |
| FNMA | | 6.00 | 11-1-2037 | | 15,027 | 15,562 |
| FNMA | | 6.21 | 8-6-2038 | | 11,421,000 | 13,436,984 |
| FNMA | | 6.50 | 7-1-2036 | | 9,499 | 10,029 |
| FNMA | | 6.50 | 7-1-2036 | | 1,811 | 1,857 |
| FNMA | | 6.50 | 11-1-2036 | | 1,998 | 2,049 |
| FNMA | | 7.00 | 7-1-2036 | | 5,004 | 4,923 |
| FNMA | | 7.00 | 11-1-2037 | | 2,788 | 2,850 |
| FNMA | | 3.00 | 10-1-2051 | | 25,872,473 | 22,879,615 |
| FNMA | | 3.00 | 11-1-2051 | | 40,290,775 | 35,540,406 |
| FNMA | | 3.50 | 5-1-2052 | | 11,388,847 | 10,373,806 |
| FNMA Series 2002-T12 Class A3 | | 7.50 | 5-25-2042 | | 3,985 | 4,185 |
| FNMA Series 2003-W08 Class 4A ±± | | 4.02 | 11-25-2042 | | 70,828 | 65,676 |
| FNMA Series 2003-W14 Class 2A ±± | | 3.28 | 6-25-2045 | | 35,305 | 33,991 |
| FNMA Series 2003-W14 Class 2A ±± | | 4.12 | 1-25-2043 | | 115,543 | 108,422 |
| FNMA Series 2004-W11 Class 1A3 | | 7.00 | 5-25-2044 | | 663,729 | 665,240 |
| FNMA Series 2004-W15 Class 1A3 | | 7.00 | 8-25-2044 | | 248,414 | 259,732 |
| GNMA %% | | 2.00 | 3-21-2053 | | 18,340,000 | 15,370,854 |
| GNMA | | 2.50 | 3-20-2052 | | 16,484,857 | 14,259,915 |
| GNMA | | 2.50 | 4-20-2052 | | 22,371,444 | 19,351,958 |
| GNMA | | 3.00 | 11-20-2045 | | 1,159,627 | 1,057,856 |
| GNMA | | 3.00 | 4-20-2051 | | 5,311,636 | 4,764,759 |
| GNMA %% | | 3.00 | 3-21-2053 | | 49,020,000 | 43,755,137 |
| GNMA | | 3.50 | 9-20-2047 | | 656,769 | 614,359 |
| GNMA | | 3.50 | 12-20-2047 | | 1,416,170 | 1,321,337 |
| GNMA | | 4.00 | 12-20-2047 | | 763,648 | 732,197 |
| GNMA | | 4.50 | 8-20-2049 | | 262,459 | 256,018 |
| GNMA | | 4.50 | 7-20-2052 | | 12,166,018 | 11,806,222 |
| GNMA %% | | 4.50 | 3-21-2053 | | 8,000,000 | 7,756,562 |
| GNMA | | 5.00 | 7-20-2040 | | 208,389 | 210,646 |
| GNMA | | 5.00 | 9-20-2052 | | 9,688,995 | 9,586,636 |
The accompanying notes are an integral part of these financial statements.
Allspring Core Plus Bond Fund | 11
Portfolio of investments—February 28, 2023 (unaudited)
| | | Interest
rate | Maturity
date | Principal | Value |
| Agency securities (continued) | | | | | | |
| GNMA %% | | 5.00% | 3-21-2053 | $ | 9,240,000 | $ 9,128,831 |
| GNMA | �� | 7.50 | 12-15-2029 | | 298 | 299 |
| GNMA Series 2008-22 Class XM ♀±± | | 1.28 | 2-16-2050 | | 454,563 | 9,083 |
| Resolution Funding Corporation STRIPS ¤ | | 0.00 | 4-15-2030 | | 19,410,000 | 14,152,242 |
| STRIPS ¤ | | 0.00 | 5-15-2040 | | 27,955,000 | 13,636,387 |
| STRIPS ¤ | | 0.00 | 5-15-2044 | | 9,270,000 | 3,803,063 |
| TVA | | 5.88 | 4-1-2036 | | 9,420,000 | 10,507,277 |
| TVA Principal STRIPS ¤ | | 0.00 | 4-1-2056 | | 42,270,000 | 8,373,659 |
| U.S. International Development Finance Corporation | | 2.12 | 3-20-2024 | | 2,317,500 | 2,283,727 |
| Total Agency securities (Cost $942,793,931) | | | | | | 891,387,180 |
| Asset-backed securities: 6.06% | | | | | | |
| ACHV ABS Trust Series2023-1PL Class A 144A | | 6.42 | 3-18-2030 | | 1,965,000 | 1,967,712 |
| ACM Auto Trust Series 2022-1A Class A 144A | | 3.23 | 4-20-2029 | | 299,299 | 298,921 |
| ACM Auto Trust Series 2022-1A Class C 144A | | 5.48 | 4-20-2029 | | 7,315,000 | 7,231,689 |
| ACM Auto Trust Series 2023-1A Class A 144A | | 6.61 | 1-22-2030 | | 5,881,442 | 5,879,596 |
| American Credit Acceptance Receivables Trust Series 2019-4 Class D 144A | | 2.97 | 12-12-2025 | | 3,805,277 | 3,774,160 |
| American Credit Acceptance Receivables Trust Series 2022-1 Class B 144A | | 1.68 | 9-14-2026 | | 4,398,000 | 4,318,836 |
| Arbys Funding LLC Series 2020-1A Class A2 144A | | 3.24 | 7-30-2050 | | 6,532,500 | 5,670,648 |
| AVIS Budget Rental Car Funding Series 2020-1A Class B 144A | | 2.68 | 8-20-2026 | | 8,700,000 | 8,001,277 |
| Cajun Global LLC Series 2021-1 Class A2 144A | | 3.93 | 11-20-2051 | | 3,925,000 | 3,324,051 |
| CPS Auto Receivables Trust 2021-A Class D 144A | | 1.16 | 12-15-2026 | | 1,205,000 | 1,146,806 |
| Dominos Pizza Master Issuer LLC Series 2015-1A Class A2 144A | | 4.47 | 10-25-2045 | | 12,187,500 | 11,729,262 |
| Drive Auto Receivables Trust Series 2019-1 Class D | | 4.09 | 6-15-2026 | | 1,011,020 | 1,009,512 |
| DT Auto Owner Trust Series 2021-1A Class C 144A | | 0.84 | 10-15-2026 | | 5,182,000 | 5,012,266 |
| DT Auto Owner Trust Series 2021-3A Class B 144A | | 0.58 | 11-17-2025 | | 10,000,000 | 9,750,604 |
| ECMC Group Student Loan Trust Series 2020-3A Class A1B (1 Month LIBOR +1.00%) 144A± | | 5.62 | 1-27-2070 | | 3,107,886 | 3,025,761 |
| Exeter Automobile Receivables Series 2019-2A Class D 144A | | 3.71 | 3-17-2025 | | 2,918,355 | 2,893,151 |
| First Investors Auto Owner Trust Series 2019-2A Class D 144A | | 2.80 | 12-15-2025 | | 3,060,000 | 2,991,189 |
| Five Guys Funding LLC Series 17-1A Class A2 144A | | 4.60 | 7-25-2047 | | 1,585,850 | 1,530,415 |
| Flagship Credit Auto Trust Series 2020-2 Class C 144A | | 3.80 | 4-15-2026 | | 3,224,149 | 3,207,933 |
| Freedom Financial Trust Series 2021-1CP Class B 144A | | 1.41 | 3-20-2028 | | 325,854 | 324,719 |
| GLS Auto Receivables Trust Series 2A Class B 144A | | 3.16 | 6-16-2025 | | 2,284,469 | 2,278,115 |
| GLS Auto Receivables Trust Series 4A Class B 144A | | 1.53 | 4-15-2026 | | 1,765,000 | 1,691,848 |
| Hertz Vehicle Financing LLC Series 1A Class B 144A | | 1.56 | 12-26-2025 | | 4,700,000 | 4,352,556 |
| Mission Lane Master Trust Series 2021 Class A 144A | | 1.59 | 9-15-2026 | | 4,100,000 | 4,011,820 |
| Neighborly Issuer LLC Series 2021-1 144A | | 3.58 | 4-30-2051 | | 7,860,000 | 6,459,505 |
| Oak Street Investment Grade Net Lease Fund Series 2021-1A Class A3 144A | | 2.80 | 1-20-2051 | | 4,925,000 | 4,436,618 |
| Octane Receivables Trust Series 2020-1A Class A 144A | | 1.71 | 2-20-2025 | | 1,029,506 | 1,020,478 |
| Octane Receivables Trust Series 2021-1A Class A 144A | | 0.93 | 3-22-2027 | | 375,089 | 361,978 |
| Octane Receivables Trust Series 2021-1A Class B 144A | | 1.53 | 4-20-2027 | | 3,000,000 | 2,758,081 |
The accompanying notes are an integral part of these financial statements.
12 | Allspring Core Plus Bond Fund
Portfolio of investments—February 28, 2023 (unaudited)
| | | Interest
rate | Maturity
date | Principal | Value |
| Asset-backed securities (continued) | | | | | | |
| Ondeck Asset Securitization Trust Series 2021-1A Class A 144A | | 1.59% | 5-17-2027 | $ | 12,621,944 | $ 11,740,891 |
| Pagaya AI Debt Selection Trust Series 2021-1 Class A 144A | | 1.18 | 11-15-2027 | | 1,729,321 | 1,712,826 |
| Pagaya AI Debt Selection Trust Series 2021-HG1 Class A 144A | | 1.22 | 1-16-2029 | | 6,586,506 | 6,279,350 |
| PFS Financing Corporation Series 2021-A Class A 144A | | 0.71 | 4-15-2026 | | 7,290,000 | 6,901,133 |
| Santander Drive Auto Receivables Trust Series 2020-2 Class C | | 1.46 | 9-15-2025 | | 594,409 | 593,393 |
| Santander Drive Auto Receivables Trust Series 2020-2 Class D | | 2.22 | 9-15-2026 | | 2,355,000 | 2,300,518 |
| Santander Drive Auto Receivables Trust Series 2021-1 Class C | | 0.75 | 2-17-2026 | | 10,037,202 | 9,909,041 |
| Service Experts Issuer Series 2021-1A Class A 144A | | 2.67 | 2-2-2032 | | 6,694,023 | 6,076,025 |
| ServiceMaster Brands Series 2020-1 Class A2I 144A | | 2.84 | 1-30-2051 | | 3,626,000 | 2,982,943 |
| SLM Student Loan Trust Series 2003-10A Class A4 (3 Month LIBOR +0.67%) 144A± | | 5.44 | 12-17-2068 | | 4,203,514 | 4,118,403 |
| SpringCastle America Funding LLC 144A | | 1.97 | 9-25-2037 | | 2,724,010 | 2,456,482 |
| Taco Bell Funding LLC Series 2021 Class A2 144A | | 1.95 | 8-25-2051 | | 10,813,125 | 9,331,694 |
| Taco Bell Funding LLC Series 2021-1A Class A23 144A | | 2.54 | 8-25-2051 | | 493,750 | 390,097 |
| Towd Point Asset Trust Series 2018-SL1 Class A (1 Month LIBOR +0.60%) 144A± | | 5.11 | 1-25-2046 | | 550,400 | 547,232 |
| Wendy's Funding LLC Series 2021-1A Class A2II 144A | | 2.78 | 6-15-2051 | | 541,750 | 440,220 |
| Westlake Automobile Receivable Series 2020-1A Class C 144A | | 2.52 | 4-15-2025 | | 463,161 | 462,334 |
| Westlake Automobile Receivable Series 2020-1A Class D 144A | | 2.80 | 6-16-2025 | | 4,748,000 | 4,679,858 |
| Westlake Automobile Receivable Series 2020-3A Class C 144A | | 1.24 | 11-17-2025 | | 5,000,000 | 4,903,694 |
| Wingstop Funding LLC Series 2020-1A Class A2 144A | | 2.84 | 12-5-2050 | | 3,602,610 | 3,116,604 |
| Zaxby's Funding LLC Series 2021-1A Class A2 144A | | 3.24 | 7-30-2051 | | 4,846,200 | 4,010,240 |
| Total Asset-backed securities (Cost $205,820,522) | | | | | | 193,412,485 |
| Corporate bonds and notes: 17.65% | | | | | | |
| Communication services: 1.45% | | | | | | |
| Diversified telecommunication services: 0.16% | | | | | | |
| AT&T Incorporated | | 3.55 | 9-15-2055 | | 7,330,000 | 4,965,367 |
| Interactive media & services: 0.24% | | | | | | |
| Meta Platforms Incorporated | | 3.85 | 8-15-2032 | | 8,555,000 | 7,687,107 |
| Media: 0.59% | | | | | | |
| CCO Holdings LLC 144A | | 4.25 | 1-15-2034 | | 5,000,000 | 3,742,763 |
| Charter Communications Operating LLC | | 4.40 | 12-1-2061 | | 6,000,000 | 3,909,105 |
| Charter Communications Operating LLC | | 6.48 | 10-23-2045 | | 655,000 | 592,610 |
| Cinemark USA Incorporated 144A« | | 5.25 | 7-15-2028 | | 1,500,000 | 1,260,375 |
| CSC Holdings LLC 144A | | 4.63 | 12-1-2030 | | 2,000,000 | 1,076,750 |
| Magallanes Incorporated 144A | | 5.14 | 3-15-2052 | | 5,135,000 | 4,025,346 |
The accompanying notes are an integral part of these financial statements.
Allspring Core Plus Bond Fund | 13
Portfolio of investments—February 28, 2023 (unaudited)
| | | Interest
rate | Maturity
date | Principal | Value |
| Media (continued) | | | | | | |
| QVC Incorporated | | 4.38% | 9-1-2028 | $ | 2,175,000 | $ 1,211,888 |
| Time Warner Cable Incorporated | | 5.50 | 9-1-2041 | | 3,605,000 | 3,034,927 |
| | | | | | | 18,853,764 |
| Wireless telecommunication services: 0.46% | | | | | | |
| SBA Tower Trust 144A | | 1.63 | 5-15-2051 | | 6,595,000 | 5,630,183 |
| Sprint Spectrum Company 144A | | 4.74 | 3-20-2025 | | 2,210,625 | 2,185,132 |
| Sprint Spectrum Company 144A | | 5.15 | 9-20-2029 | | 6,900,000 | 6,823,402 |
| | | | | | | 14,638,717 |
| Consumer discretionary: 0.95% | | | | | | |
| Diversified consumer services: 0.07% | | | | | | |
| Howard University | | 5.21 | 10-1-2052 | | 2,565,000 | 2,095,814 |
| Hotels, restaurants & leisure: 0.32% | | | | | | |
| Genting New York LLC 144A | | 3.30 | 2-15-2026 | | 3,920,000 | 3,428,666 |
| Royal Caribbean Cruises Limited | | 4.25 | 6-15-2023 | | 3,400,000 | 3,647,616 |
| Royal Caribbean Cruises Limited 144A | | 11.63 | 8-15-2027 | | 3,000,000 | 3,195,120 |
| | | | | | | 10,271,402 |
| Household durables: 0.13% | | | | | | |
| KB Home Company | | 4.00 | 6-15-2031 | | 3,000,000 | 2,450,183 |
| KB Home Company | | 4.80 | 11-15-2029 | | 2,000,000 | 1,745,000 |
| | | | | | | 4,195,183 |
| Multiline retail: 0.14% | | | | | | |
| LSF9 Atlantis Holdings LLC 144A | | 7.75 | 2-15-2026 | | 5,000,000 | 4,396,543 |
| Specialty retail: 0.09% | | | | | | |
| Michaels Companies Incorporated 144A | | 7.88 | 5-1-2029 | | 1,500,000 | 1,128,750 |
| Rent-A-Center Incorporated 144A« | | 6.38 | 2-15-2029 | | 2,000,000 | 1,715,740 |
| | | | | | | 2,844,490 |
| Textiles, apparel & luxury goods: 0.20% | | | | | | |
| Michael Kors USA Incorporated 144A | | 4.25 | 11-1-2024 | | 6,753,000 | 6,474,439 |
| Consumer staples: 0.20% | | | | | | |
| Food products: 0.18% | | | | | | |
| Smithfield Foods Incorporated 144A | | 2.63 | 9-13-2031 | | 8,000,000 | 5,866,076 |
| Tobacco: 0.02% | | | | | | |
| Reynolds American Incorporated | | 7.00 | 8-4-2041 | | 450,000 | 447,348 |
| Energy: 1.01% | | | | | | |
| Oil, gas & consumable fuels: 1.01% | | | | | | |
| Aethon United 144A | | 8.25 | 2-15-2026 | | 3,000,000 | 2,885,495 |
| Devon Energy Corporation | | 5.25 | 10-15-2027 | | 4,482,000 | 4,430,072 |
| Encino Acquisition Partners Company 144A | | 8.50 | 5-1-2028 | | 2,255,000 | 1,969,720 |
| Energy Transfer Partners LP | | 5.00 | 5-15-2050 | | 5,965,000 | 4,887,960 |
| Harvest Midstream LP 144A | | 7.50 | 9-1-2028 | | 2,275,000 | 2,193,919 |
| Kinder Morgan Incorporated | | 5.20 | 6-1-2033 | | 6,500,000 | 6,189,276 |
| Occidental Petroleum Corporation | | 4.30 | 8-15-2039 | | 3,000,000 | 2,347,500 |
| Plains All American Pipeline LP | | 3.55 | 12-15-2029 | | 5,420,000 | 4,699,541 |
The accompanying notes are an integral part of these financial statements.
14 | Allspring Core Plus Bond Fund
Portfolio of investments—February 28, 2023 (unaudited)
| | | Interest
rate | Maturity
date | Principal | Value |
| Oil, gas & consumable fuels (continued) | | | | | | |
| Rockies Express Pipeline LLC 144A | | 4.95% | 7-15-2029 | $ | 1,975,000 | $ 1,718,053 |
| Rockies Express Pipeline LLC 144A | | 6.88 | 4-15-2040 | | 1,000,000 | 818,867 |
| | | | | | | 32,140,403 |
| Financials: 7.39% | | | | | | |
| Banks: 2.39% | | | | | | |
| Bank of America Corporation (3 Month LIBOR +0.64%) ± | | 2.02 | 2-13-2026 | | 5,000,000 | 4,651,995 |
| Bank of America Corporation (U.S. SOFR +1.22%) ± | | 2.65 | 3-11-2032 | | 7,655,000 | 6,218,344 |
| Bank of America Corporation (3 Month LIBOR +1.58%) ± | | 3.82 | 1-20-2028 | | 6,000,000 | 5,631,289 |
| Bank of America Corporation (3 Month LIBOR +3.90%) ± | | 6.10 | 12-29-2049 | | 2,590,000 | 2,564,100 |
| Bank of America Corporation (5 Year Treasury Constant Maturity +2.76%) ʊ± | | 4.38 | 1-27-2027 | | 2,500,000 | 2,166,000 |
| Citigroup Incorporated (5 Year Treasury Constant Maturity +3.60%) ʊ± | | 4.00 | 12-10-2025 | | 5,000,000 | 4,575,000 |
| Citigroup Incorporated (U.S. SOFR +2.09%) ± | | 4.91 | 5-24-2033 | | 7,765,000 | 7,358,762 |
| Citigroup Incorporated (U.S. SOFR 3 Month +4.78%) ± | | 6.25 | 12-29-2049 | | 1,030,000 | 1,026,179 |
| JPMorgan Chase & Company (U.S. SOFR 3 Month +0.70%) ± | | 1.04 | 2-4-2027 | | 3,165,000 | 2,779,271 |
| JPMorgan Chase & Company (U.S. SOFR +1.02%) ± | | 2.07 | 6-1-2029 | | 7,000,000 | 5,902,164 |
| JPMorgan Chase & Company (5 Year Treasury Constant Maturity +2.85%) ʊ± | | 3.65 | 6-1-2026 | | 4,000,000 | 3,472,075 |
| JPMorgan Chase & Company (U.S. SOFR +1.75%) ± | | 4.57 | 6-14-2030 | | 4,040,000 | 3,842,375 |
| JPMorgan Chase & Company (3 Month LIBOR +3.25%) ± | | 5.15 | 12-29-2049 | | 3,625,000 | 3,620,469 |
| JPMorgan Chase & Company (U.S. SOFR +2.58%) ± | | 5.72 | 9-14-2033 | | 2,260,000 | 2,245,741 |
| M&T Bank Corporation (U.S. SOFR +1.85%) ± | | 5.05 | 1-27-2034 | | 10,080,000 | 9,619,045 |
| PNC Financial Services (3 Month LIBOR +3.30%) ± | | 5.00 | 12-29-2049 | | 565,000 | 526,580 |
| PNC Financial Services (5 Year Treasury Constant Maturity +3.00%) ʊ± | | 6.00 | 5-15-2027 | | 1,850,000 | 1,788,950 |
| PNC Financial Services (7 Year Treasury Constant Maturity +2.81%) ± | | 6.25 | 12-31-2049 | | 2,750,000 | 2,660,625 |
| Wells Fargo & Company (U.S. SOFR +1.32%) ± | | 3.91 | 4-25-2026 | | 5,700,000 | 5,497,979 |
| | | | | | | 76,146,943 |
| Capital markets: 1.53% | | | | | | |
| Ares Capital Corporation | | 2.88 | 6-15-2028 | | 1,980,000 | 1,626,352 |
| Athene Global Funding 144A | | 1.99 | 8-19-2028 | | 2,860,000 | 2,336,773 |
| BAT Capital Corporation | | 5.65 | 3-16-2052 | | 2,845,000 | 2,399,782 |
| Blackstone Holdings Finance Company LLC 144A | | 5.00 | 6-15-2044 | | 1,015,000 | 890,977 |
| Blackstone Private Equity Funds 144A | | 6.20 | 4-22-2033 | | 9,485,000 | 9,732,607 |
| Charles Schwab Corporation (5 Year Treasury Constant Maturity +3.17%) ʊ± | | 4.00 | 6-1-2026 | | 4,000,000 | 3,639,653 |
| Goldman Sachs Group Incorporated (U.S. SOFR +1.25%) ± | | 2.38 | 7-21-2032 | | 5,535,000 | 4,347,300 |
| Goldman Sachs Group Incorporated | | 3.63 | 2-20-2024 | | 7,000,000 | 6,874,332 |
| Morgan Stanley (U.S. SOFR +1.20%) ± | | 2.51 | 10-20-2032 | | 4,850,000 | 3,838,695 |
| Morgan Stanley (U.S. SOFR +1.73%) ± | | 5.12 | 2-1-2029 | | 8,930,000 | 8,769,343 |
| Morgan Stanley (U.S. SOFR +2.62%) ± | | 5.30 | 4-20-2037 | | 4,850,000 | 4,519,233 |
| | | | | | | 48,975,047 |
The accompanying notes are an integral part of these financial statements.
Allspring Core Plus Bond Fund | 15
Portfolio of investments—February 28, 2023 (unaudited)
| | | Interest
rate | Maturity
date | Principal | Value |
| Consumer finance: 1.45% | | | | | | |
| Daimler Truck Financial NA Company 144A | | 5.13% | 1-19-2028 | $ | 13,825,000 | $ 13,616,250 |
| Hyundai Capital America Company 144A | | 1.30 | 1-8-2026 | | 4,205,000 | 3,723,963 |
| PECF USS Intermediate Holding III Corporation 144A | | 8.00 | 11-15-2029 | | 1,500,000 | 1,054,404 |
| Private Export Funding Corporation 144A | | 0.55 | 7-30-2024 | | 29,766,000 | 27,823,169 |
| | | | | | | 46,217,786 |
| Diversified financial services: 0.80% | | | | | | |
| Bankers Healthcare Group BHG Series 2021 Class A-B 144A | | 2.79 | 11-17-2033 | | 4,940,000 | 4,263,832 |
| Camelot Return Merger Sub Incorporated 144A | | 8.75 | 8-1-2028 | | 5,000,000 | 4,750,000 |
| KKR Group Finance Company LLC 144A | | 3.50 | 8-25-2050 | | 1,910,000 | 1,290,261 |
| National Rural Utilities Cooperative Finance Corporation | | 5.80 | 1-15-2033 | | 8,015,000 | 8,251,537 |
| Sammons Financial Group 144A | | 4.75 | 4-8-2032 | | 6,500,000 | 5,490,526 |
| Sammons Financial Group 144A | | 3.35 | 4-16-2031 | | 1,875,000 | 1,459,517 |
| | | | | | | 25,505,673 |
| Insurance: 1.06% | | | | | | |
| Athene Global Funding 144A | | 2.55 | 11-19-2030 | | 3,000,000 | 2,363,704 |
| Guardian Life Insurance Company 144A | | 4.85 | 1-24-2077 | | 1,045,000 | 873,482 |
| Hill City Funding Trust 144A | | 4.05 | 8-15-2041 | | 6,955,000 | 4,934,483 |
| Maple Grove Funding Trust 144A | | 4.16 | 8-15-2051 | | 4,000,000 | 2,857,757 |
| Metlife Incorporated (5 Year Treasury Constant Maturity +3.58%) ʊ± | | 3.85 | 9-15-2025 | | 7,000,000 | 6,573,350 |
| MetLife Incorporated | | 5.00 | 7-15-2052 | | 4,430,000 | 4,244,392 |
| National Life Global Insurance Company (3 Month LIBOR +3.31%) 144A± | | 5.25 | 7-19-2068 | | 1,668,000 | 1,531,323 |
| Northwestern Mutual Life 144A | | 3.63 | 9-30-2059 | | 1,500,000 | 1,060,923 |
| OneAmerica Financial Partners Incorporated 144A | | 4.25 | 10-15-2050 | | 570,000 | 414,707 |
| Prudential Financial Incorporated (5 Year Treasury Constant Maturity +3.16%) ± | | 5.13 | 3-1-2052 | | 3,600,000 | 3,289,860 |
| Security Benefit Company 144A | | 1.25 | 5-17-2024 | | 3,000,000 | 2,823,322 |
| Transatlantic Holdings Incorporated | | 8.00 | 11-30-2039 | | 2,329,000 | 2,905,991 |
| | | | | | | 33,873,294 |
| Thrifts & mortgage finance: 0.16% | | | | | | |
| Enact Holdings Incorporated 144A | | 6.50 | 8-15-2025 | | 3,600,000 | 3,537,900 |
| Ladder Capital Finance Holdings LP 144A | | 5.25 | 10-1-2025 | | 1,820,000 | 1,700,629 |
| | | | | | | 5,238,529 |
| Health care: 0.24% | | | | | | |
| Biotechnology: 0.05% | | | | | | |
| Amgen Incorporated %% | | 5.65 | 3-2-2053 | | 910,000 | 902,509 |
| Amgen Incorporated %% | | 5.75 | 3-2-2063 | | 650,000 | 641,032 |
| | | | | | | 1,543,541 |
| Health care providers & services: 0.19% | | | | | | |
| UnitedHealth Group Incorporated | | 5.88 | 2-15-2053 | | 3,595,000 | 3,877,967 |
| UnitedHealth Group Incorporated | | 6.05 | 2-15-2063 | | 2,125,000 | 2,325,710 |
| | | | | | | 6,203,677 |
The accompanying notes are an integral part of these financial statements.
16 | Allspring Core Plus Bond Fund
Portfolio of investments—February 28, 2023 (unaudited)
| | | Interest
rate | Maturity
date | Principal | Value |
| Industrials: 1.17% | | | | | | |
| Aerospace & defense: 0.21% | | | | | | |
| Spirit AeroSystems Incorporated 144A | | 9.38% | 11-30-2029 | $ | 2,000,000 | $ 2,112,500 |
| The Boeing Company | | 5.81 | 5-1-2050 | | 4,820,000 | 4,584,911 |
| | | | | | | 6,697,411 |
| Airlines: 0.56% | | | | | | |
| Delta Air Lines Incorporated | | 2.00 | 12-10-2029 | | 3,168,169 | 2,773,630 |
| Delta Air Lines Incorporated 144A | | 4.75 | 10-20-2028 | | 2,850,000 | 2,706,691 |
| Delta Air Lines Pass-Through Certificates Series 2015-B | | 4.25 | 1-30-2025 | | 4,331,498 | 4,294,358 |
| Mileage Plus Holdings LLC 144A | | 6.50 | 6-20-2027 | | 8,212,500 | 8,212,500 |
| | | | | | | 17,987,179 |
| Commercial services & supplies: 0.04% | | | | | | |
| Allied Universal Holdco LLC 144A | | 6.00 | 6-1-2029 | | 1,750,000 | 1,303,704 |
| Industrial conglomerates: 0.04% | | | | | | |
| General Electric Company (3 Month LIBOR +3.33%) ± | | 8.10 | 12-29-2049 | | 1,166,000 | 1,164,461 |
| Trading companies & distributors: 0.13% | | | | | | |
| Fortress Transportation & Infrastructure Investors LLC 144A | | 5.50 | 5-1-2028 | | 1,640,000 | 1,464,621 |
| Fortress Transportation & Infrastructure Investors LLC 144A | | 6.50 | 10-1-2025 | | 1,659,000 | 1,618,144 |
| Fortress Transportation & Infrastructure Investors LLC 144A | | 9.75 | 8-1-2027 | | 1,110,000 | 1,140,444 |
| | | | | | | 4,223,209 |
| Transportation infrastructure: 0.19% | | | | | | |
| Toll Road Investors Partnership II LP 144A¤ | | 0.00 | 2-15-2026 | | 5,630,000 | 4,496,244 |
| Toll Road Investors Partnership II LP 144A¤ | | 0.00 | 2-15-2027 | | 1,050,000 | 778,386 |
| Toll Road Investors Partnership II LP 144A¤ | | 0.00 | 2-15-2028 | | 1,150,000 | 787,926 |
| | | | | | | 6,062,556 |
| Information technology: 2.53% | | | | | | |
| Communications equipment: 0.17% | | | | | | |
| Motorola Solutions Incorporated | | 5.60 | 6-1-2032 | | 5,476,000 | 5,360,293 |
Electronic equipment, instruments &
components: 0.01% | | | | | | |
| Dell International LLC | | 8.35 | 7-15-2046 | | 291,000 | 330,343 |
| IT services: 0.50% | | | | | | |
| Fidelity National Information Services Incorporated | | 5.63 | 7-15-2052 | | 1,485,000 | 1,387,213 |
| Global Payments Incorporated | | 5.95 | 8-15-2052 | | 3,295,000 | 3,046,413 |
| Kyndryl Holdings Incorporated | | 2.05 | 10-15-2026 | | 7,700,000 | 6,618,380 |
| Sabre GLBL Incorporated 144A | | 11.25 | 12-15-2027 | | 5,000,000 | 4,996,850 |
| | | | | | | 16,048,856 |
| Semiconductors & semiconductor equipment: 1.02% | | | | | | |
| Intel Corporation | | 5.70 | 2-10-2053 | | 9,550,000 | 9,332,027 |
| KLA Corporation | | 4.95 | 7-15-2052 | | 3,280,000 | 3,101,870 |
The accompanying notes are an integral part of these financial statements.
Allspring Core Plus Bond Fund | 17
Portfolio of investments—February 28, 2023 (unaudited)
| | | Interest
rate | Maturity
date | Principal | Value |
Semiconductors & semiconductor equipment
(continued) | | | | | | |
| Marvell Technology Incorporated | | 4.88% | 6-22-2028 | $ | 10,775,000 | $ 10,418,979 |
| Micron Technology Incorporated | | 5.88 | 2-9-2033 | | 10,120,000 | 9,804,420 |
| | | | | | | 32,657,296 |
| Software: 0.83% | | | | | | |
| Fortinet Incorporated | | 2.20 | 3-15-2031 | | 13,000,000 | 10,366,819 |
| Oracle Corporation | | 3.95 | 3-25-2051 | | 9,180,000 | 6,593,839 |
| Oracle Corporation | | 4.90 | 2-6-2033 | | 10,000,000 | 9,444,913 |
| | | | | | | 26,405,571 |
| Materials: 0.06% | | | | | | |
| Containers & packaging: 0.06% | | | | | | |
| Clydesdale Acquisition Holdings Incorporated 144A | | 8.75 | 4-15-2030 | | 2,000,000 | 1,806,760 |
| Real estate: 1.44% | | | | | | |
| Equity REITs: 1.44% | | | | | | |
| Brandywine Operating Partnership Series 3 | | 7.55 | 3-15-2028 | | 5,370,000 | 5,264,899 |
| EPR Properties | | 3.60 | 11-15-2031 | | 2,060,000 | 1,550,239 |
| EPR Properties | | 3.75 | 8-15-2029 | | 3,870,000 | 3,154,169 |
| EQUINIX Incorporated | | 3.90 | 4-15-2032 | | 7,000,000 | 6,185,528 |
| GLP Capital LP | | 3.25 | 1-15-2032 | | 5,000,000 | 3,971,688 |
| MPT Operating Partnership LP | | 3.50 | 3-15-2031 | | 5,000,000 | 3,427,300 |
| National Health Investor Company | | 3.00 | 2-1-2031 | | 2,000,000 | 1,500,183 |
| Omega Healthcare Investors Incorporated | | 3.38 | 2-1-2031 | | 2,930,000 | 2,308,888 |
| Omega Healthcare Investors Incorporated | | 3.63 | 10-1-2029 | | 4,495,000 | 3,727,613 |
| Omega Healthcare Investors Incorporated | | 4.75 | 1-15-2028 | | 840,000 | 787,867 |
| Sabra Health Care LP / Sabra Capital Corporation | | 5.13 | 8-15-2026 | | 8,140,000 | 7,699,435 |
| Service Properties Trust Company | | 4.35 | 10-1-2024 | | 3,000,000 | 2,871,600 |
| Service Properties Trust Company | | 4.75 | 10-1-2026 | | 2,000,000 | 1,735,000 |
| WEA Finance LLC 144A | | 4.75 | 9-17-2044 | | 2,610,000 | 1,843,407 |
| | | | | | | 46,027,816 |
| Utilities: 1.21% | | | | | | |
| Electric utilities: 0.99% | | | | | | |
| Basin Electric Power Cooperative 144A | | 4.75 | 4-26-2047 | | 2,315,000 | 1,940,654 |
| NRG Energy Incorporated 144A | | 4.45 | 6-15-2029 | | 6,415,000 | 5,708,267 |
| Oglethorpe Power Corporation | | 5.05 | 10-1-2048 | | 1,060,000 | 927,954 |
| Oklahoma Gas & Electric Company | | 5.40 | 1-15-2033 | | 3,600,000 | 3,612,428 |
| Oncor Electric Delivery Company | | 2.95 | 4-1-2025 | | 9,369,000 | 8,921,755 |
| Southern California Edison Company | | 3.65 | 2-1-2050 | | 1,600,000 | 1,175,382 |
| Vistra Operations Company LLC 144A | | 3.70 | 1-30-2027 | | 10,325,000 | 9,453,691 |
| | | | | | | 31,740,131 |
| Multi-utilities: 0.22% | | | | | | |
| CenterPoint Energy Incorporated | | 0.70 | 3-2-2023 | | 2,865,000 | 2,865,000 |
The accompanying notes are an integral part of these financial statements.
18 | Allspring Core Plus Bond Fund
Portfolio of investments—February 28, 2023 (unaudited)
| | | Interest
rate | Maturity
date | Principal | Value |
| Multi-utilities (continued) | | | | | | |
| CenterPoint Energy Incorporated (U.S. SOFR +0.65%) ± | | 5.21% | 5-13-2024 | $ | 2,480,000 | $ 2,468,099 |
| CenterPoint Energy Incorporated (3 Month LIBOR +0.50%) ± | | 5.28 | 3-2-2023 | | 1,647,000 | 1,647,000 |
| | | | | | | 6,980,099 |
| Total Corporate bonds and notes (Cost $616,014,528) | | | | | | 563,376,828 |
| Foreign corporate bonds and notes : 2.33% | | | | | | |
| Communication services: 0.41% | | | | | | |
| Diversified telecommunication services: 0.10% | | | | | | |
| Infrastrutture Wireless Italiane SpA | | 1.75 | 4-19-2031 | EUR | 3,800,000 | 3,175,954 |
| Media: 0.17% | | | | | | |
| SES SA | | 2.88 | 12-31-2049 | EUR | 1,800,000 | 1,601,717 |
| Tele Columbus AG 144A | | 3.88 | 5-2-2025 | EUR | 2,320,000 | 1,957,029 |
| Ziggo Bond Company BV 144A | | 3.38 | 2-28-2030 | EUR | 2,500,000 | 2,003,019 |
| | | | | | | 5,561,765 |
| Wireless telecommunication services: 0.14% | | | | | | |
| Tele2 AB Company | | 0.75 | 3-23-2031 | EUR | 5,400,000 | 4,355,649 |
| Consumer discretionary: 0.30% | | | | | | |
| Auto components: 0.07% | | | | | | |
| Adler Pelzer Holding GmbH 144A | | 4.13 | 4-1-2024 | EUR | 2,480,000 | 2,147,271 |
| Automobiles: 0.23% | | | | | | |
| Jaguar Land Rover Automobiles Company 144A | | 6.88 | 11-15-2026 | EUR | 5,700,000 | 5,712,974 |
| Peugeot SA Company | | 2.00 | 3-20-2025 | EUR | 1,800,000 | 1,832,712 |
| | | | | | | 7,545,686 |
| Consumer staples: 0.25% | | | | | | |
| Food products: 0.04% | | | | | | |
| Sigma Holdings Company BV 144A | | 5.75 | 5-15-2026 | EUR | 1,500,000 | 1,270,303 |
| Tobacco: 0.21% | | | | | | |
| Altria Group Incorporated | | 1.70 | 6-15-2025 | EUR | 2,000,000 | 2,006,964 |
| BAT International Finance plc | | 2.25 | 1-16-2030 | EUR | 5,250,000 | 4,513,616 |
| | | | | | | 6,520,580 |
| Energy: 0.09% | | | | | | |
| Oil, gas & consumable fuels: 0.09% | | | | | | |
| Eni SpA | | 1.13 | 9-19-2028 | EUR | 3,200,000 | 2,898,043 |
| Financials: 0.80% | | | | | | |
| Banks: 0.51% | | | | | | |
| ABN AMRO Bank NV (EUR Swap Annual (vs. 6 Month EURIBOR) 5 Year +3.90%) ʊ± | | 4.75 | 9-22-2027 | EUR | 3,300,000 | 3,010,478 |
| Deutsche Bank (3 Month EURIBOR +2.95%) ± | | 5.00 | 9-5-2030 | EUR | 7,000,000 | 7,184,076 |
| Nordea Bank (EUR Swap Annual (vs. 6 Month EURIBOR) 5 Year +3.00%) ʊ«± | | 3.50 | 3-12-2025 | EUR | 6,000,000 | 5,937,503 |
| | | | | | | 16,132,057 |
The accompanying notes are an integral part of these financial statements.
Allspring Core Plus Bond Fund | 19
Portfolio of investments—February 28, 2023 (unaudited)
| | | Interest
rate | Maturity
date | Principal | Value |
| Consumer finance: 0.29% | | | | | | |
| Abertis Finance BV Company | | 2.63% | 1-26-2027 | EUR | 2,900,000 | $ 2,530,546 |
| Cellnex Finance Company SA | | 2.00 | 9-15-2032 | EUR | 3,400,000 | 2,709,958 |
| Repsol International Finance Company (EUR Swap Annual (vs. 6 Month EURIBOR) 5 Year +2.77%) ± | | 2.50 | 12-31-2049 | EUR | 4,500,000 | 4,081,398 |
| | | | | | | 9,321,902 |
| Industrials: 0.19% | | | | | | |
| Containers & packaging: 0.15% | | | | | | |
| Can-Pack SA 144A | | 2.38 | 11-1-2027 | EUR | 5,500,000 | 4,616,706 |
| Electrical equipment: 0.04% | | | | | | |
| Gamma Bidco SpA 144A | | 6.25 | 7-15-2025 | EUR | 1,300,000 | 1,383,565 |
| Real estate: 0.04% | | | | | | |
| Real estate management & development: 0.04% | | | | | | |
| Akelius Residential Property AB (EURIBOR ICE Swap Rate 11:00am +3.49%) ± | | 3.88 | 10-5-2078 | EUR | 1,254,000 | 1,279,906 |
| Utilities: 0.25% | | | | | | |
Independent power & renewable electricity
producers: 0.25% | | | | | | |
| RWE AG | | 2.75 | 5-24-2030 | EUR | 8,330,000 | 8,034,526 |
| Total Foreign corporate bonds and notes (Cost $84,527,128) | | | | | | 74,243,913 |
| Foreign government bonds : 6.10% | | | | | | |
| Bonos y Obligaciones del Estado ¤ | | 0.00 | 1-31-2028 | EUR | 27,435,000 | 24,676,898 |
| Brazil ¤ | | 0.00 | 1-1-2024 | BRL | 57,000,000 | 9,808,351 |
| Brazil ¤ | | 0.00 | 7-1-2024 | BRL | 60,000,000 | 9,743,644 |
| Brazil | | 10.00 | 1-1-2025 | BRL | 8,600,000 | 1,574,298 |
| Brazil | | 10.00 | 1-1-2029 | BRL | 8,000,000 | 1,336,054 |
| France | | 0.75 | 2-25-2028 | EUR | 69,285,000 | 65,653,402 |
| Germany | | 1.30 | 10-15-2027 | EUR | 66,770,000 | 66,287,648 |
| Malaysia | | 3.88 | 3-14-2025 | MYR | 64,915,000 | 14,612,800 |
| Mexico | | 3.75 | 2-21-2024 | EUR | 1,000,000 | 1,032,442 |
| Total Foreign government bonds (Cost $204,029,265) | | | | | | 194,725,537 |
| Loans: 0.59% | | | | | | |
| Communication services: 0.11% | | | | | | |
| Media: 0.11% | | | | | | |
| DIRECTV Financing LLC (1 Month LIBOR +5.00%) ± | | 9.63 | 8-2-2027 | $ | 3,550,000 | 3,448,754 |
| Energy: 0.10% | | | | | | |
| Oil, gas & consumable fuels: 0.10% | | | | | | |
| GIP II Blue Holdings LP (1 Month LIBOR +4.50%) ± | | 9.23 | 9-29-2028 | | 3,099,970 | 3,086,671 |
| Health care: 0.01% | | | | | | |
| Health care equipment & supplies: 0.01% | | | | | | |
| Surgery Center Holdings Incorporated (1 Month LIBOR +3.75%) ± | | 8.36 | 8-31-2026 | | 404,670 | 401,356 |
The accompanying notes are an integral part of these financial statements.
20 | Allspring Core Plus Bond Fund
Portfolio of investments—February 28, 2023 (unaudited)
| | | Interest
rate | Maturity
date | Principal | Value |
| Industrials: 0.29% | | | | | | |
| Airlines: 0.12% | | | | | | |
| AAdvantage Loyalty IP Limited (1 Month LIBOR +4.75%) ± | | 9.56% | 4-20-2028 | $ | 1,583,000 | $ 1,620,058 |
| Mileage Plus Holdings LLC (1 Month LIBOR +5.25%) ± | | 10.00 | 6-21-2027 | | 2,227,500 | 2,317,157 |
| | | | | | | 3,937,215 |
| Commercial services & supplies: 0.11% | | | | | | |
| The Geo Group Incorporated (1 Month LIBOR +7.13%) ± | | 11.74 | 3-23-2027 | | 3,609,933 | 3,634,444 |
| Machinery: 0.06% | | | | | | |
| Vertical US Newco Incorporated (1 Month LIBOR +3.50%) ± | | 8.60 | 7-30-2027 | | 878,115 | 857,672 |
| Werner FinCo LP (3 Month LIBOR +4.00%) ± | | 8.73 | 7-24-2024 | | 1,012,092 | 941,246 |
| | | | | | | 1,798,918 |
| Information technology: 0.05% | | | | | | |
| Software: 0.05% | | | | | | |
| MPH Acquisition Holdings LLC (1 Month LIBOR +4.25%) ± | | 9.20 | 9-1-2028 | | 1,979,950 | 1,660,188 |
| Materials: 0.03% | | | | | | |
| Construction materials: 0.03% | | | | | | |
| Standard Industries Incorporated (3 Month LIBOR +2.25%) ± | | 6.43 | 9-22-2028 | | 876,048 | 872,964 |
| Total Loans (Cost $18,968,747) | | | | | | 18,840,510 |
| Municipal obligations: 0.23% | | | | | | |
| California: 0.05% | | | | | | |
| Transportation revenue: 0.05% | | | | | | |
| Alameda CA Corridor Transportation Authority CAB Refunding Bond Subordinated Series B (Ambac Insured)¤ | | 0.00 | 10-1-2028 | | 2,115,000 | 1,563,556 |
| Illinois: 0.11% | | | | | | |
| GO revenue: 0.05% | | | | | | |
| Will County IL Lincoln-Way Community High School District #210 Unrefunded Bond CAB (AGM Insured)¤ | | 0.00 | 1-1-2025 | | 1,820,000 | 1,691,861 |
| Tax revenue: 0.06% | | | | | | |
| Metropolitan Pier & Exposition Authority Illinois CAB McCormick Place Expansion Project Series 2010-B1 (AGM Insured)¤ | | 0.00 | 6-15-2026 | | 1,975,000 | 1,740,191 |
| Metropolitan Pier & Exposition Authority Illinois CAB McCormick Place Expansion Project Series 2012-B ¤ | | 0.00 | 12-15-2051 | | 765,000 | 156,425 |
| | | | | | | 1,896,616 |
The accompanying notes are an integral part of these financial statements.
Allspring Core Plus Bond Fund | 21
Portfolio of investments—February 28, 2023 (unaudited)
| | | Interest
rate | Maturity
date | Principal | Value |
| Kansas: 0.00% | | | | | | |
| Health revenue: 0.00% | | | | | | |
| Kansas Development Finance Authority Village Shalom Project Series 2018-B | | 4.00% | 11-15-2025 | $ | 90,000 | $ 84,392 |
| Maryland: 0.01% | | | | | | |
| Education revenue: 0.01% | | | | | | |
| Maryland Health & HEFAR Green Street Academy Series B 144A | | 6.75 | 7-1-2023 | | 195,000 | 193,973 |
| Pennsylvania: 0.06% | | | | | | |
| Education revenue: 0.06% | | | | | | |
| Commonwealth of Pennsylvania Financing Authority Series A | | 4.14 | 6-1-2038 | | 1,995,000 | 1,819,755 |
| Total Municipal obligations (Cost $7,328,986) | | | | | | 7,250,153 |
| Non-agency mortgage-backed securities: 11.74% | | | | | | |
| Achieve Mortgage Series 2022-HE1 Class A 144A±± | | 7.00 | 10-25-2037 | | 11,218,352 | 11,226,326 |
| Agate Bay Mortgage Loan Trust Series 2015-3 Class B3 144A±± | | 3.54 | 4-25-2045 | | 876,860 | 776,692 |
| American Money Management Corporation Series 2014-14A Class A1R2 (3 Month LIBOR +1.02%) 144A± | | 5.84 | 7-25-2029 | | 4,321,752 | 4,306,388 |
| American Money Management Corporation Series 2015-16A Class AR2 (3 Month LIBOR +0.98%) 144A± | | 5.77 | 4-14-2029 | | 1,352,416 | 1,349,082 |
| Angel Oak Mortgage Trust I LLC Series 2019-4 Class A1 144A±± | | 2.99 | 7-26-2049 | | 187,991 | 187,072 |
| Angel Oak Mortgage Trust I LLC Series 2020-4 Class A1 144A±± | | 1.47 | 6-25-2065 | | 1,074,316 | 962,908 |
| APEX Credit CLO LLC Series 2017 Class 2A (3 Month LIBOR +1.60%) 144A± | | 6.35 | 9-20-2029 | | 10,000,000 | 9,718,370 |
| Apidos CLO Series 2019 Class 3-1-A (3 Month LIBOR +3.10%) 144A± | | 7.89 | 4-15-2031 | | 3,000,000 | 2,824,749 |
| Bain Capital Create CLO Limited Series 2017 Class 1 (3 Month LIBOR +1.95%) 144A± | | 6.76 | 7-20-2030 | | 3,725,000 | 3,590,170 |
| BDS Limited Series 2021-FL9 Class B (1 Month LIBOR +1.70%) 144A± | | 6.29 | 11-16-2038 | | 5,475,000 | 5,240,010 |
| Bojangles Issuer LLC Series 2020-1A Class A2 144A | | 3.83 | 10-20-2050 | | 7,370,550 | 6,682,472 |
| Brightspire Capital Incorporated Series 2021-FL1 Class A (1 Month LIBOR +1.15%) 144A± | | 5.74 | 8-19-2038 | | 5,775,000 | 5,607,721 |
| Bunker Hill Loan Depositary Trust Series 2019-3 Class A1 144A | | 2.72 | 11-25-2059 | | 819,627 | 791,089 |
| BX Trust Series 2019-OC11 Class A 144A | | 3.20 | 12-9-2041 | | 4,975,000 | 4,286,381 |
| BX Trust Series 2021-ARIA Class D (1 Month LIBOR +1.90%) 144A± | | 6.48 | 10-15-2036 | | 8,035,000 | 7,657,493 |
| BX Trust Series 2022 Class A (1 Month LIBOR +0.90%) 144A± | | 5.49 | 10-15-2036 | | 3,680,000 | 3,590,148 |
| BX Trust Series 2022 Class C 144A | | 6.79 | 10-13-2027 | | 1,000,000 | 974,483 |
| Carlyle Global Market Series 2016-1A Class R2 (3 Month LIBOR +3.35%) 144A± | | 8.16 | 4-20-2034 | | 1,500,000 | 1,360,938 |
| Cascade Funding Mortgage Trust Series 2018-RM2 Class A 144A±± | | 4.00 | 10-25-2068 | | 366,244 | 353,937 |
| Cascade Funding Mortgage Trust Series 2021-HB7 Class M2 144A±± | | 2.68 | 10-27-2031 | | 5,750,000 | 5,244,124 |
The accompanying notes are an integral part of these financial statements.
22 | Allspring Core Plus Bond Fund
Portfolio of investments—February 28, 2023 (unaudited)
| | | Interest
rate | Maturity
date | Principal | Value |
| Non-agency mortgage-backed securities (continued) | | | | | | |
| CD Commercial Mortgage Trust Series 2017-6 Class A5 | | 3.46% | 11-13-2050 | $ | 1,035,000 | $ 956,590 |
| Change Mortgage Trust Series 2022-1 Class A1 144A±± | | 3.01 | 1-25-2067 | | 6,775,507 | 6,045,132 |
| CIFC Funding Limited Series 2012-2RA Class A1 (3 Month LIBOR +0.80%) 144A± | | 5.61 | 1-20-2028 | | 963,232 | 958,944 |
| Colt Funding LLC Series 2022-7 Class A1 144A | | 5.16 | 4-25-2067 | | 6,370,583 | 6,237,862 |
| Credit Suisse Mortgage Trust Series 2013-IVR2 Class B4 144A±± | | 3.39 | 4-25-2043 | | 766,012 | 679,389 |
| Credit Suisse Mortgage Trust Series 2021-AFC1 Class A2 144A±± | | 1.07 | 3-25-2056 | | 5,492,678 | 4,322,790 |
| CSMLT Trust Series 2015-1 Class B4 144A±± | | 3.79 | 5-25-2045 | | 2,435,960 | 2,204,334 |
| DBWF Mortgage Trust Series 2018-GLKS Class A (1 Month LIBOR +1.13%) 144A± | | 5.73 | 12-19-2030 | | 582,684 | 576,106 |
| Dryden Senior Loan Fund Series 2013-28A Class A2LR (3 Month LIBOR +1.65%) 144A± | | 6.51 | 8-15-2030 | | 4,000,000 | 3,953,060 |
| Dryden Senior Loan Fund Series 2019-72A (3 Month LIBOR +1.85%) 144A± | | 6.71 | 5-15-2032 | | 3,550,000 | 3,361,949 |
| Educational Services of America Series 2015-1 Class A (1 Month LIBOR +0.80%) 144A± | | 5.42 | 10-25-2056 | | 474,581 | 467,429 |
| Financial Asset Securitization Incorporated Series 1997-NAM2 Class B2 † | | 8.00 | 7-25-2027 | | 15,908 | 2 |
| FirstKey Homes Trust Series 2021 Class A 144A | | 1.54 | 8-17-2038 | | 1,382,380 | 1,207,577 |
| FirstKey Homes Trust Series 2021 Class B 144A | | 1.61 | 9-17-2038 | | 8,675,000 | 7,563,435 |
| FirstKey Homes Trust Series 2021 Class C 144A | | 1.89 | 8-17-2038 | | 6,770,000 | 5,873,420 |
| FREMF Mortgage Trust Series 2020-KF76 Class B (1 Month LIBOR +2.75%) 144A± | | 7.32 | 1-25-2030 | | 2,166,996 | 2,075,729 |
| FS Rialto Issuer Limited Series 2021-FL3 Class B (1 Month LIBOR +1.80%) 144A± | | 6.39 | 11-16-2036 | | 3,000,000 | 2,838,901 |
| GCAT Series 2019-RPl1 Class A1 144A±± | | 2.65 | 10-25-2068 | | 2,051,483 | 1,922,798 |
| Gilbert Park CLO Series 2017-1A Class B (3 Month LIBOR +1.60%) 144A± | | 6.39 | 10-15-2030 | | 3,000,000 | 2,954,529 |
| Goldman Sachs Mortgage Securities Trust Series 2019-GSA1 Class C ±± | | 3.81 | 11-10-2052 | | 500,000 | 405,907 |
| Goldman Sachs Mortgage Securities Trust Series 2019-PJ2 Class A4 144A±± | | 4.00 | 11-25-2049 | | 206,165 | 191,935 |
| Gracie Point International Funding Series 2022-1A Class A (30 Day Average U.S. SOFR +2.25%) 144A± | | 6.77 | 4-1-2024 | | 11,999,887 | 11,957,988 |
| Gracie Point International Funding Series 2022-2A Class A (30 Day Average U.S. SOFR +2.75%) 144A± | | 7.27 | 7-1-2024 | | 9,405,000 | 9,416,467 |
| GS Mortgage Securities Trust Series 2017-GS7 Class A3 | | 3.17 | 8-10-2050 | | 990,000 | 910,397 |
| Homeward Opportunities Fund Trust Series 2020-2 Class A2 144A±± | | 2.64 | 5-25-2065 | | 715,000 | 692,978 |
| Hospitality Mortgage Trust Series 2019 Class A (1 Month LIBOR +1.00%) 144A± | | 5.59 | 11-15-2036 | | 2,274,077 | 2,254,319 |
| Imperial Fund Mortgage Trust Series 2020-NQM1 Class A1 144A±± | | 1.38 | 10-25-2055 | | 875,492 | 769,855 |
| Imperial Fund Mortgage Trust Series 2021-NQM1 Class A1 144A±± | | 1.07 | 6-25-2056 | | 1,608,431 | 1,324,464 |
| Imperial Fund Mortgage Trust Series 2022-NQM3 Class A3 144A±± | | 4.45 | 5-25-2067 | | 17,223,000 | 14,580,778 |
| Jonah Energy LLC Series 2022-1 Class A1 144A | | 7.20 | 12-10-2037 | | 10,919,882 | 10,822,081 |
The accompanying notes are an integral part of these financial statements.
Allspring Core Plus Bond Fund | 23
Portfolio of investments—February 28, 2023 (unaudited)
| | | Interest
rate | Maturity
date | Principal | Value |
| Non-agency mortgage-backed securities (continued) | | | | | | |
| JPMorgan Chase Commercial Mortgage Securities Trust Series 2013-3 Class B4 144A±± | | 3.35% | 7-25-2043 | $ | 3,616,907 | $ 2,618,368 |
| JPMorgan Chase Commercial Mortgage Securities Trust Series 2019-MFP Class A (1 Month LIBOR +0.96%) 144A± | | 5.55 | 7-15-2036 | | 2,299,009 | 2,273,836 |
| JPMorgan Mortgage Trust Series 2014-2 Class B4 144A±± | | 3.41 | 6-25-2029 | | 1,215,000 | 1,001,711 |
| JPMorgan Mortgage Trust Series 2020-1 Class A15 144A±± | | 3.50 | 6-25-2050 | | 1,249,723 | 1,100,354 |
| Marlette Funding Trust Series 2019-2A Class C 144A | | 4.11 | 7-16-2029 | | 1,011,778 | 1,008,716 |
| Marlette Funding Trust Series 2021-2A Class B 144A | | 1.06 | 9-15-2031 | | 3,803,430 | 3,722,836 |
| MED Trust Series 2021-MDLN Class B (1 Month LIBOR +1.45%) 144A± | | 6.04 | 11-15-2038 | | 8,973,342 | 8,771,513 |
| MF1 Multifamily Housing Mortgage Loan Trust Series 2021-FL5 Class A (U.S. SOFR 1 Month +0.96%) 144A± | | 5.53 | 7-15-2036 | | 5,177,095 | 5,040,483 |
| MF1 Multifamily Housing Mortgage Loan Trust Series 2022-FL8 Class C (30 Day Average U.S. SOFR +2.20%) 144A± | | 6.63 | 2-19-2037 | | 8,750,000 | 8,214,124 |
| MFRA Trust Series 2020-NQM3 Class A1 144A±± | | 1.01 | 1-26-2065 | | 1,038,601 | 950,954 |
| MFRA Trust Series 2020-NQM3 Class M1 144A±± | | 2.65 | 1-26-2065 | | 2,650,000 | 2,123,957 |
| MFRA Trust Series 2021-NQM1 Class A2 144A±± | | 1.38 | 4-25-2065 | | 3,252,485 | 2,878,495 |
| Mill City Mortgage Trust Series 2019 Class M2 144A±± | | 3.25 | 7-25-2059 | | 4,592,000 | 3,758,983 |
| Morgan Stanley Bank of America Merrill Lynch Trust Series 2016-C30 Class B ±± | | 3.31 | 9-15-2049 | | 610,000 | 532,996 |
| Morgan Stanley Capital I Trust 2014-150E Class A 144A | | 3.91 | 9-9-2032 | | 3,695,000 | 3,253,528 |
| New Residential Mortgage Loan Trust Series 2019-RPL3 Class M1 144A±± | | 3.25 | 7-25-2059 | | 5,000,000 | 4,166,637 |
| Octagon Investment Partners Series 2017-1A Class A2R (3 Month LIBOR +1.45%) 144A± | | 6.26 | 3-17-2030 | | 8,205,000 | 8,033,163 |
| Octane Receivables Trust 2023-1 Class A 144A | | 5.87 | 5-21-2029 | | 3,740,000 | 3,737,663 |
| Octane Receivables Trust 2023-1 Class B 144A | | 5.96 | 7-20-2029 | | 3,045,000 | 3,036,740 |
| Octane Receivables Trust Series 2022-2A Class A 144A | | 5.11 | 2-22-2028 | | 5,804,498 | 5,747,729 |
| Ondeck Asset Securitization Trust Series 2021-1A Class B 144A | | 2.28 | 5-17-2027 | | 3,994,286 | 3,588,780 |
| OneMain Financial Issuance Trust Series 2020-1A Class A 144A | | 3.84 | 5-14-2032 | | 1,483,130 | 1,474,825 |
| Onslow Bay Financial LLC Series 2020 Class A21 144A±± | | 3.50 | 12-25-2049 | | 790,005 | 698,794 |
| Onslow Bay Financial LLC Series 2022 Class A1 144A | | 5.11 | 8-25-2062 | | 5,140,478 | 5,032,039 |
| Pagaya AI Debt Selection Trust 2023-1 144A | | 7.56 | 7-15-2030 | | 5,885,000 | 5,898,770 |
| Palmer Square Loan Funding Limited Series 2021-3A Class A2 (3 Month LIBOR +1.40%) 144A± | | 6.21 | 7-20-2029 | | 12,060,000 | 11,886,638 |
| Parallel Limited Series 2021-1A Class D (3 Month LIBOR +3.45%) 144A± | | 8.24 | 7-15-2034 | | 8,500,000 | 7,593,577 |
| Pawnee Equipment Receivables Series 2021-1 Class A2 144A | | 1.10 | 7-15-2027 | | 1,369,990 | 1,312,753 |
| Residential Mortgage Loan Trust Series 2020-1 Class M1 144A±± | | 3.24 | 1-26-2060 | | 5,000,000 | 4,173,163 |
The accompanying notes are an integral part of these financial statements.
24 | Allspring Core Plus Bond Fund
Portfolio of investments—February 28, 2023 (unaudited)
| | | Interest
rate | Maturity
date | Principal | Value |
| Non-agency mortgage-backed securities (continued) | | | | | | |
| Residential Mortgage Loan Trust Series 2021-1R Class A2 144A±± | | 1.10% | 1-25-2065 | $ | 1,050,076 | $ 964,737 |
| SFAVE Commercial Mortgage Securities Trust Series 2015-5AVE Class D 144A±± | | 4.39 | 1-5-2043 | | 1,927,000 | 1,037,547 |
| Shellpoint Company Originator Trust Series 2016-1 Class B2 144A±± | | 3.56 | 11-25-2046 | | 4,913,188 | 4,264,902 |
| Sierra Receivables Funding Series 2018-3A Class C 144A | | 4.17 | 9-20-2035 | | 341,379 | 331,777 |
| Sound Point CLO Limited Series 2013-2RA Class A1 (3 Month LIBOR +0.95%) 144A± | | 5.74 | 4-15-2029 | | 1,829,802 | 1,812,534 |
| Sound Point CLO Limited Series 2015-1RA Class BR (3 Month LIBOR +1.55%) 144A± | | 6.34 | 4-15-2030 | | 10,340,000 | 10,004,726 |
| Starwood Commercial Mortgage Trust Series 2022-FL3 Class A (30 Day Average U.S. SOFR +1.35%) 144A± | | 5.75 | 11-15-2038 | | 1,100,000 | 1,063,363 |
| Starwood Mortgage Residential Trust Series 2021-6 Class A1 144A±± | | 1.92 | 11-25-2066 | | 2,208,119 | 1,829,388 |
| Towd Point Mortgage Trust Series 2015-2 Class 1M2 144A±± | | 3.50 | 11-25-2060 | | 3,575,610 | 3,492,575 |
| Towd Point Mortgage Trust Series 2017-4 Class A1 144A±± | | 2.75 | 6-25-2057 | | 790,752 | 748,975 |
| Towd Point Mortgage Trust Series 2019-4 Class M1 144A±± | | 3.50 | 10-25-2059 | | 4,000,000 | 3,404,663 |
| Towd Point Mortgage Trust Series 2019-4 Class M2 144A±± | | 3.75 | 10-25-2059 | | 3,680,000 | 2,935,560 |
| Towd Point Mortgage Trust Series 2019-MH1 Class A1 144A±± | | 3.00 | 11-25-2058 | | 367,828 | 361,219 |
| Towd Point Mortgage Trust Series 2023-2 Class A 144A | | 6.88 | 2-25-2063 | | 10,560,000 | 10,568,744 |
| UBS Commercial Mortgage Trust Series 2017-C5 Class A5 | | 3.47 | 11-15-2050 | | 1,140,000 | 1,053,123 |
| UBS Commercial Mortgage Trust Series 2018-NYCH Class A (1 Month LIBOR +0.85%) 144A± | | 5.44 | 2-15-2032 | | 2,545,036 | 2,487,906 |
| Verus Securitization Trust Series 2021-R3 Class A1 144A±± | | 1.02 | 4-25-2064 | | 2,091,775 | 1,862,702 |
| Verus Securitization Trust Series 2022-4 Class A1 144A | | 4.47 | 4-25-2067 | | 4,342,647 | 4,120,276 |
| Voya CLO Limited Series 2017-1A (3 Month LIBOR +1.90%) 144A± | | 6.69 | 4-17-2030 | | 4,500,000 | 4,241,241 |
| Westgate Resorts Series 2022-1A Class C 144A | | 2.49 | 8-20-2036 | | 12,010,992 | 11,274,980 |
| Zais CLO Limited Series 2017-1A (3 Month LIBOR +2.65%) 144A± | | 7.44 | 7-15-2029 | | 7,450,000 | 7,209,656 |
| Zais Matrix CDO Series 2020-14A Class A1AR (3 Month LIBOR +1.20%) 144A± | | 5.99 | 4-15-2032 | | 1,770,963 | 1,758,094 |
| Total Non-agency mortgage-backed securities (Cost $399,645,769) | | | | | | 374,718,511 |
| U.S. Treasury securities: 18.99% | | | | | | |
| U.S. Treasury Bond | | 3.00 | 2-15-2048 | | 2,075,000 | 1,729,545 |
| U.S. Treasury Bond | | 3.00 | 2-15-2049 | | 32,945,000 | 27,565,699 |
| U.S. Treasury Bond ## | | 3.00 | 8-15-2052 | | 51,060,000 | 42,922,313 |
| U.S. Treasury Bond | | 3.13 | 5-15-2048 | | 65,580,000 | 55,981,240 |
| U.S. Treasury Note | | 2.00 | 11-15-2041 | | 43,175,000 | 31,205,743 |
| U.S. Treasury Note ## | | 3.25 | 8-31-2024 | | 156,250,000 | 152,227,783 |
| U.S. Treasury Note | | 3.25 | 5-15-2042 | | 3,410,000 | 3,013,987 |
The accompanying notes are an integral part of these financial statements.
Allspring Core Plus Bond Fund | 25
Portfolio of investments—February 28, 2023 (unaudited)
| | | Interest
rate | Maturity
date | Principal | Value |
| U.S. Treasury securities (continued) | | | | | | |
| U.S. Treasury Note | | 3.38% | 8-15-2042 | $ | 5,635,000 | $ 5,073,261 |
| U.S. Treasury Note | | 3.50 | 1-31-2028 | | 54,255,000 | 52,606,157 |
| U.S. Treasury Note | | 3.50 | 2-15-2033 | | 59,335,000 | 57,378,799 |
| U.S. Treasury Note ## | | 4.00 | 11-15-2042 | | 48,360,000 | 47,672,381 |
| U.S. Treasury Note | | 4.00 | 11-15-2052 | | 19,485,000 | 19,832,077 |
| U.S. Treasury Note | | 4.13 | 10-31-2027 | | 3,025,000 | 3,009,875 |
| U.S. Treasury Note | | 4.13 | 11-15-2032 | | 104,295,000 | 105,957,202 |
| Total U.S. Treasury securities (Cost $628,747,169) | | | | | | 606,176,062 |
| Yankee corporate bonds and notes: 10.52% | | | | | | |
| Communication services: 0.37% | | | | | | |
| Diversified telecommunication services: 0.09% | | | | | | |
| Telefonica Emisiones SAU | | 5.21 | 3-8-2047 | | 3,485,000 | 2,929,480 |
| Interactive media & services: 0.08% | | | | | | |
| Tencent Holdings Limited 144A | | 3.68 | 4-22-2041 | | 3,250,000 | 2,435,672 |
| Wireless telecommunication services: 0.20% | | | | | | |
| Rogers Communications Incorporated 144A | | 4.55 | 3-15-2052 | | 7,975,000 | 6,360,410 |
| Consumer discretionary: 0.83% | | | | | | |
| Auto components: 0.15% | | | | | | |
| Faurecia SE | | 7.25 | 6-15-2026 | | 4,350,000 | 4,725,505 |
| Hotels, restaurants & leisure: 0.26% | | | | | | |
| GENM Capital Labuan Limited 144A | | 3.88 | 4-19-2031 | | 8,900,000 | 6,910,468 |
| International Game Technology 144A | | 3.50 | 6-15-2026 | | 1,500,000 | 1,518,201 |
| | | | | | | 8,428,669 |
| Internet & direct marketing retail: 0.42% | | | | | | |
| Alibaba Group Holding | | 3.15 | 2-9-2051 | | 4,135,000 | 2,657,294 |
| MercadoLibre Incorporated | | 3.13 | 1-14-2031 | | 7,250,000 | 5,589,750 |
| Prosus NV 144A | | 3.83 | 2-8-2051 | | 3,000,000 | 1,817,054 |
| Prosus NV 144A | | 4.03 | 8-3-2050 | | 1,565,000 | 989,844 |
| Prosus NV 144A | | 4.99 | 1-19-2052 | | 3,000,000 | 2,164,875 |
| | | | | | | 13,218,817 |
| Consumer staples: 0.28% | | | | | | |
| Food products: 0.28% | | | | | | |
| Agrospuer SA 144A | | 4.60 | 1-20-2032 | | 2,050,000 | 1,747,420 |
| Viterra Finance BV 144A | | 4.90 | 4-21-2027 | | 7,615,000 | 7,213,950 |
| | | | | | | 8,961,370 |
| Energy: 0.47% | | | | | | |
| Oil, gas & consumable fuels: 0.47% | | | | | | |
| BP Capital Markets plc (5 Year Treasury Constant Maturity +4.40%) ʊ± | | 4.88 | 3-22-2030 | | 4,950,000 | 4,535,908 |
| Galaxy Pipeline Assets Company 144A | | 2.16 | 3-31-2034 | | 4,618,677 | 3,897,995 |
| Petroleos Mexicanos | | 6.70 | 2-16-2032 | | 2,650,000 | 2,106,449 |
| Qatar Petroleum 144A | | 3.13 | 7-12-2041 | | 6,000,000 | 4,559,400 |
| | | | | | | 15,099,752 |
The accompanying notes are an integral part of these financial statements.
26 | Allspring Core Plus Bond Fund
Portfolio of investments—February 28, 2023 (unaudited)
| | | Interest
rate | Maturity
date | Principal | Value |
| Financials: 6.24% | | | | | | |
| Banks: 3.19% | | | | | | |
| ABN AMRO Bank NV 144A | | 4.75% | 7-28-2025 | $ | 1,800,000 | $ 1,749,420 |
| African Export Import Bank 144A | | 3.80 | 5-17-2031 | | 2,600,000 | 2,141,173 |
| Banco del Estado de Chile 144A | | 2.70 | 1-9-2025 | | 3,145,000 | 2,986,001 |
| Banco do Brasil SA 144A | | 4.63 | 1-15-2025 | | 2,415,000 | 2,331,154 |
| Banco do Brasil SA 144A | | 4.88 | 1-11-2029 | | 3,425,000 | 3,184,223 |
| Banco Industrial SA (5 Year Treasury Constant Maturity +4.44%) 144A± | | 4.88 | 1-29-2031 | | 1,500,000 | 1,400,711 |
| Banco Mercantil del Norte SA (5 Year Treasury Constant Maturity +4.64%) 144Aʊ± | | 5.88 | 1-24-2027 | | 4,250,000 | 3,767,625 |
| Banco Mercantil del Norte SA (5 Year Treasury Constant Maturity +4.97%) 144Aʊ± | | 6.75 | 9-27-2024 | | 1,565,000 | 1,502,635 |
| Banco Santander (1 Year Treasury Constant Maturity +0.45%) ʊ± | | 0.70 | 6-30-2024 | | 9,000,000 | 8,826,570 |
| Banco Santander (5 Year Treasury Constant Maturity +3.00%) 144A± | | 5.95 | 10-1-2028 | | 1,700,000 | 1,695,425 |
| Bank of Montreal | | 4.70 | 9-14-2027 | | 11,975,000 | 11,710,133 |
| Banque Ouest Africaine de Developpement 144A | | 5.00 | 7-27-2027 | | 960,000 | 896,448 |
| Danske Bank (1 Year Treasury Constant Maturity +1.75%) 144A± | | 4.30 | 4-1-2028 | | 10,000,000 | 9,422,313 |
| Danske Bank 144A | | 5.38 | 1-12-2024 | | 3,205,000 | 3,195,428 |
| Deutsche Bank AG (USD ICE Swap Rate 11:00am NY 5 Year +2.55%) ± | | 4.88 | 12-1-2032 | | 1,750,000 | 1,537,362 |
| HSBC Holdings plc (U.S. SOFR +0.71%) ± | | 0.98 | 5-24-2025 | | 4,200,000 | 3,950,883 |
| HSBC Holdings plc (3 Month LIBOR +1.61%) ± | | 3.97 | 5-22-2030 | | 4,670,000 | 4,184,290 |
| Itau Unibanco Holding SA 144A | | 3.25 | 1-24-2025 | | 3,510,000 | 3,335,378 |
| Macquire Bank Limited (5 Year Treasury Constant Maturity +1.70%) 144A± | | 3.05 | 3-3-2036 | | 8,875,000 | 6,743,940 |
| Mitsubishi UFJ Financial Group Incorporated (1 Year Treasury Constant Maturity +1.63%) ± | | 5.44 | 2-22-2034 | | 13,485,000 | 13,254,476 |
| National Australia Bank (5 Year Treasury Constant Maturity +1.70%) 144A± | | 3.35 | 1-12-2037 | | 8,835,000 | 7,056,060 |
| NatWest Markets plc 144A | | 1.60 | 9-29-2026 | | 4,000,000 | 3,469,793 |
| Perrigo Finance plc | | 4.90 | 12-15-2044 | | 1,500,000 | 1,042,500 |
| Unicredit SpA (5 Year Treasury Constant Maturity +4.75%) 144A± | | 5.46 | 6-30-2035 | | 3,000,000 | 2,545,059 |
| | | | | | | 101,929,000 |
| Capital markets: 0.99% | | | | | | |
| CI Financial Corporation | | 4.10 | 6-15-2051 | | 10,490,000 | 6,300,765 |
| Credit Suisse Group AG (U.S. SOFR +1.73%) 144A± | | 3.09 | 5-14-2032 | | 4,695,000 | 3,303,569 |
| Credit Suisse Group AG (U.S. SOFR +0.98%) 144A± | | 1.31 | 2-2-2027 | | 8,405,000 | 6,773,078 |
| Credit Suisse Group AG (5 Year Treasury Constant Maturity +4.89%) 144Aʊ± | | 5.25 | 2-11-2027 | | 3,500,000 | 2,411,146 |
| UBS Group AG (1 Year Treasury Constant Maturity +0.85%) 144A± | | 1.49 | 8-10-2027 | | 5,800,000 | 5,026,536 |
| UBS Group AG (1 Year Treasury Constant Maturity +2.05%) 144A± | | 4.70 | 8-5-2027 | | 4,480,000 | 4,336,867 |
| UBS Group AG (5 Year Treasury Constant Maturity +3.40%) 144Aʊ± | | 4.88 | 2-12-2027 | | 3,940,000 | 3,451,440 |
| | | | | | | 31,603,401 |
The accompanying notes are an integral part of these financial statements.
Allspring Core Plus Bond Fund | 27
Portfolio of investments—February 28, 2023 (unaudited)
| | | Interest
rate | Maturity
date | Principal | Value |
| Consumer finance: 0.24% | | | | | | |
| Unifin Financiera SAB de CV 144A† | | 9.88% | 1-28-2029 | $ | 2,350,000 | $ 88,125 |
| Volkswagen Financial Services AG | | 3.38 | 4-6-2028 | | 7,350,000 | 7,419,656 |
| | | | | | | 7,507,781 |
| Diversified financial services: 0.83% | | | | | | |
| AerCap Ireland Capital Designated Activity Company / AerCap Global Aviation Trust | | 2.45 | 10-29-2026 | | 11,015,000 | 9,710,514 |
| Avolon Holdings Funding Limited 144A | | 2.75 | 2-21-2028 | | 2,000,000 | 1,669,933 |
| Avolon Holdings Funding Limited 144A | | 5.50 | 1-15-2026 | | 2,515,000 | 2,433,728 |
| Brookfield Finance Incorporated | | 3.50 | 3-30-2051 | | 7,365,000 | 4,968,456 |
| Cellnex Finance Company 144A | | 3.88 | 7-7-2041 | | 4,120,000 | 2,947,710 |
| Cirsa Finance International 144A | | 10.38 | 11-30-2027 | | 3,150,000 | 3,528,327 |
| Corporacion Financiera de Desarrollo SA (3 Month LIBOR +5.61%) 144A± | | 5.25 | 7-15-2029 | | 1,185,000 | 1,137,600 |
| | | | | | | 26,396,268 |
| Insurance: 0.63% | | | | | | |
| Athene Global Funding | | 0.37 | 9-10-2026 | | 5,600,000 | 5,047,361 |
| Nippon Life Insurance (5 Year Treasury Constant Maturity +2.65%) 144A± | | 2.75 | 1-21-2051 | | 1,195,000 | 979,900 |
| Nippon Life Insurance (5 Year Treasury Constant Maturity +2.60%) 144A± | | 2.90 | 9-16-2051 | | 2,000,000 | 1,637,093 |
| Sompo International Holdings Limited | | 7.00 | 7-15-2034 | | 1,330,000 | 1,393,979 |
| Swiss Re Finance (Luxembourg) SA (5 Year Treasury Constant Maturity +3.58%) 144A± | | 5.00 | 4-2-2049 | | 11,700,000 | 11,115,000 |
| | | | | | | 20,173,333 |
| Thrifts & mortgage finance: 0.36% | | | | | | |
| Nationwide Building Society 144A | | 4.85 | 7-27-2027 | | 11,630,000 | 11,336,854 |
| Health care: 0.45% | | | | | | |
| Life sciences tools & services: 0.45% | | | | | | |
| Danaher Corporation | | 2.50 | 3-30-2030 | | 15,000,000 | 14,422,686 |
| Industrials: 0.30% | | | | | | |
| Airlines: 0.14% | | | | | | |
| Air Canada Pass-Through Trust Series 2020-1 Class C 144A | | 10.50 | 7-15-2026 | | 4,000,000 | 4,260,000 |
| Commercial services & supplies: 0.05% | | | | | | |
| Verisure Holding AB 144A | | 9.25 | 10-15-2027 | | 1,525,000 | 1,705,836 |
| Trading companies & distributors: 0.10% | | | | | | |
| Fly Leasing Limited 144A | | 7.00 | 10-15-2024 | | 3,600,000 | 3,123,319 |
| Transportation infrastructure: 0.01% | | | | | | |
| Mexico City Airport Trust 144A | | 5.50 | 7-31-2047 | | 570,000 | 422,820 |
| Information technology: 0.49% | | | | | | |
| IT services: 0.18% | | | | | | |
| Computershare US Incorporated | | 1.13 | 10-7-2031 | | 7,450,000 | 5,845,597 |
| Semiconductors & semiconductor equipment: 0.31% | | | | | | |
| Renesas Electronics Corporation 144A | | 2.17 | 11-25-2026 | | 11,455,000 | 9,890,193 |
The accompanying notes are an integral part of these financial statements.
28 | Allspring Core Plus Bond Fund
Portfolio of investments—February 28, 2023 (unaudited)
| | | Interest
rate | Maturity
date | Principal | Value |
| Materials: 0.66% | | | | | | |
| Chemicals: 0.66% | | | | | | |
| Braskem Netherlands BV 144A | | 7.25% | 2-13-2033 | $ | 7,175,000 | $ 7,000,504 |
| Syngenta Finance NV 144A | | 4.44 | 4-24-2023 | | 8,000,000 | 7,979,308 |
| Westlake Chemical Corporation | | 1.63 | 7-17-2029 | | 2,750,000 | 2,361,523 |
| Yara International 144A | | 7.38 | 11-14-2032 | | 3,500,000 | 3,765,327 |
| | | | | | | 21,106,662 |
| Utilities: 0.43% | | | | | | |
| Electric utilities: 0.43% | | | | | | |
| Comision Federal de Electricidad SA de CV 144A« | | 3.35 | 2-9-2031 | | 4,815,000 | 3,806,797 |
| Comision Federal de Electricidad SA de CV 144A | | 3.88 | 7-26-2033 | | 2,985,000 | 2,261,349 |
| Duke Energy Corporation | | 3.10 | 6-15-2028 | | 2,600,000 | 2,585,309 |
| Duke Energy Corporation | | 3.85 | 6-15-2034 | | 4,400,000 | 4,205,254 |
| Electricite de France SA 144A | | 4.95 | 10-13-2045 | | 1,130,000 | 948,151 |
| | | | | | | 13,806,860 |
| Total Yankee corporate bonds and notes (Cost $376,523,409) | | | | | | 335,690,285 |
| Yankee government bonds: 1.09% | | | | | | |
| Bermuda 144A | | 3.38 | 8-20-2050 | | 1,080,000 | 745,205 |
| Dominican Republic 144A | | 4.50 | 1-30-2030 | | 1,000,000 | 858,690 |
| Dominican Republic 144A | | 4.88 | 9-23-2032 | | 1,800,000 | 1,504,492 |
| Dominican Republic 144A | | 5.50 | 2-22-2029 | | 800,000 | 741,268 |
| Government of Bermuda 144A | | 5.00 | 7-15-2032 | | 4,320,000 | 4,200,270 |
| Mexico | | 6.35 | 2-9-2035 | | 8,700,000 | 8,926,058 |
| Nota Do Tesouro Nacional | | 10.00 | 1-1-2027 | | 28,600,000 | 4,998,307 |
| Panama | | 4.50 | 1-19-2063 | | 8,000,000 | 5,698,120 |
| Provincia de Cordoba 144Aøø | | 6.88 | 12-10-2025 | | 1,781,310 | 1,541,785 |
| Republic of Argentina | | 1.00 | 7-9-2029 | | 206,310 | 63,998 |
| Republic of Argentina øø | | 1.50 | 7-9-2035 | | 1,817,118 | 516,603 |
| Republic of Argentina øø | | 1.75 | 7-9-2030 | | 1,703,981 | 551,753 |
| Republic of Kenya 144A | | 8.25 | 2-28-2048 | | 750,000 | 578,595 |
| Republic of Paraguay 144A | | 5.40 | 3-30-2050 | | 1,750,000 | 1,465,362 |
| Republic of Senegal 144A« | | 6.25 | 5-23-2033 | | 750,000 | 620,775 |
| Sultanate of Oman 144A | | 6.25 | 1-25-2031 | | 1,700,000 | 1,717,517 |
| Ukraine 144A | | 7.38 | 9-25-2034 | | 1,200,000 | 164,798 |
| Total Yankee government bonds (Cost $40,377,557) | | | | | | 34,893,596 |
| | | | | | |
| Short-term investments: 10.19% | | | | | | |
| Commercial paper: 0.63% | | | | | | |
| Walgreens Boots Alliance Incorporated ¤ | | 0.00 | 3-1-2023 | | 20,000,000 | 19,997,327 |
| | | Yield | | Shares | |
| Investment companies: 6.81% | | | | | | |
| Allspring Government Money Market Fund Select Class ♠∞## | | 4.39 | | | 212,063,688 | 212,063,688 |
| Securities Lending Cash Investments LLC ♠∩∞ | | 4.54 | | | 5,240,515 | 5,240,515 |
| | | | | | | 217,304,203 |
The accompanying notes are an integral part of these financial statements.
Allspring Core Plus Bond Fund | 29
Portfolio of investments—February 28, 2023 (unaudited)
| | | Interest
rate | Maturity
date | Principal | Value |
| U.S. Treasury securities: 2.75% | | | | | | |
| U.S. Treasury Bill ☼ | | 4.28% | 3-21-2023 | $ | 65,000,000 | $ 64,837,852 |
| U.S. Treasury Bill ☼ | | 4.54 | 6-15-2023 | | 23,430,000 | 23,106,772 |
| | | | | | | 87,944,624 |
| Total Short-term investments (Cost $325,260,156) | | | | | | 325,246,154 |
| Total investments in securities (Cost $3,850,037,167) | 113.42% | | | | | 3,619,961,214 |
| Other assets and liabilities, net | (13.42) | | | | | (428,240,353) |
| Total net assets | 100.00% | | | | | $3,191,720,861 |
| ± | Variable rate investment. The rate shown is the rate in effect at period end. |
| ±± | The coupon of the security is adjusted based on the principal and/or interest payments received from the underlying pool of mortgages as well as the credit quality and the actual prepayment speed of the underlying mortgages. The rate shown is the rate in effect at period end. |
| ¤ | The security is issued in zero coupon form with no periodic interest payments. |
| ♀ | Investment in an interest-only security that entitles holders to receive only the interest payments on the underlying mortgages. The principal amount shown is the notional amount of the underlying mortgages. The rate represents the coupon rate. |
| 144A | The security may be resold in transactions exempt from registration, normally to qualified institutional buyers, pursuant to Rule 144A under the Securities Act of 1933. |
| † | Non-income-earning security |
| ## | All or a portion of this security is segregated for when-issued securities. |
| øø | The interest rate is determined and reset by the issuer periodically depending upon the terms of the security. The rate shown is the rate in effect at period end. |
| « | All or a portion of this security is on loan. |
| ♠ | The issuer of the security is an affiliated person of the Fund as defined in the Investment Company Act of 1940. |
| ∩ | The investment is a non-registered investment company purchased with cash collateral received from securities on loan. |
| ∞ | The rate represents the 7-day annualized yield at period end. |
| ☼ | Zero coupon security. The rate represents the current yield to maturity. |
| %% | The security is purchased on a when-issued basis. |
| ʊ | Security is perpetual in nature and has no stated maturity date. The date shown reflects the next call date. |
| Abbreviations: |
| AGM | Assured Guaranty Municipal |
| Ambac | Ambac Financial Group Incorporated |
| BRL | Brazilian real |
| CAB | Capital appreciation bond |
| EUR | Euro |
| EURIBOR | Euro Interbank Offered Rate |
| FHLB | Federal Home Loan Bank |
| FHLMC | Federal Home Loan Mortgage Corporation |
| FNMA | Federal National Mortgage Association |
| GNMA | Government National Mortgage Association |
| GO | General obligation |
| HEFAR | Higher Education Facilities Authority Revenue |
| LIBOR | London Interbank Offered Rate |
| MYR | Malaysian ringgit |
| REIT | Real estate investment trust |
| SOFR | Secured Overnight Financing Rate |
| STRIPS | Separate trading of registered interest and principal securities |
| TVA | Tennessee Valley Authority |
The accompanying notes are an integral part of these financial statements.
30 | Allspring Core Plus Bond Fund
Portfolio of investments—February 28, 2023 (unaudited)
Investments in affiliates
An affiliated investment is an investment in which the Fund owns at least 5% of the outstanding voting shares of the issuer or as a result of other relationships, such as the Fund and the issuer having the same investment manager. Transactions with issuers that were affiliates of the Fund at the end of the period were as follows:
| | Value,
beginning of
period | Purchases | Sales
proceeds | Net
realized
gains
(losses) | | Net
change in
unrealized
gains
(losses) | | Value,
end of
period | Shares,
end
of period | Income
from
affiliated
securities |
| Short-term investments | | | | | | | | | |
| Allspring Government Money Market Fund Select Class | $124,106,379 | $853,073,029 | $(765,115,720) | $ 0 | | $ 0 | | $ 212,063,688 | 212,063,688 | $ 1,739,059 |
| Securities Lending Cash Investments LLC | 58,279,333 | 383,060,951 | (436,099,484) | (701) | | 416 | | 5,240,515 | 5,240,515 | 466,441 # |
| | | | | $ (701) | | $416 | | $217,304,203 | | $2,205,500 |
| # | Amount shown represents income before fees and rebates. |
Forward foreign currency contracts
Currency to be
received | Currency to be
delivered | Counterparty | Settlement
date | Unrealized
gains | | Unrealized
losses |
| 130,838,834 USD | 122,821,236 EUR | Citibank NA | 3-31-2023 | $ 705,187 | | $ 0 |
| 7,440,446 USD | 6,900,000 EUR | Citibank NA | 3-31-2023 | 129,641 | | 0 |
| 28,872,310 USD | 26,800,000 EUR | Citibank NA | 3-31-2023 | 476,718 | | 0 |
| 19,463,040 USD | 18,000,000 EUR | Citibank NA | 3-31-2023 | 391,374 | | 0 |
| 3,884,040 USD | 3,600,000 EUR | Citibank NA | 3-31-2023 | 69,707 | | 0 |
| 10,485,351 USD | 9,650,000 EUR | Citibank NA | 3-31-2023 | 260,819 | | 0 |
| 3,517,907 USD | 3,230,000 EUR | Citibank NA | 3-31-2023 | 95,602 | | 0 |
| 982,483,600 JPY | 7,000,000 EUR | Citibank NA | 3-31-2023 | 0 | | (171,513) |
| 7,800,000 EUR | 8,541,686 USD | Citibank NA | 3-31-2023 | 0 | | (277,298) |
| 4,459,660 USD | 4,100,000 EUR | Citibank NA | 3-31-2023 | 115,558 | | 0 |
| 8,024,828 USD | 7,335,000 EUR | Citibank NA | 3-31-2023 | 253,124 | | 0 |
| 15,939,282 USD | 14,900,000 EUR | Citibank NA | 3-31-2023 | 152,181 | | 0 |
| 15,544,380 USD | 14,500,000 EUR | Citibank NA | 3-31-2023 | 181,093 | | 0 |
| 56,348,663 USD | 52,650,000 EUR | Citibank NA | 3-31-2023 | 564,038 | | 0 |
| | | | | $3,395,042 | | $(448,811) |
The accompanying notes are an integral part of these financial statements.
Allspring Core Plus Bond Fund | 31
Portfolio of investments—February 28, 2023 (unaudited)
Futures contracts
| Description | Number of
contracts | Expiration
date | Notional
cost | Notional
value | Unrealized
gains | | Unrealized
losses |
| Long | | | | | | | |
| U.S. Long Term Bonds | 67 | 6-21-2023 | $ 8,423,273 | $ 8,389,656 | $ 0 | | $ (33,617) |
| U.S. Ultra Treasury Bonds | 26 | 6-21-2023 | 3,530,290 | 3,511,625 | 0 | | (18,665) |
| 2-Year U.S. Treasury Notes | 2,100 | 6-30-2023 | 428,797,936 | 427,825,780 | 0 | | (972,156) |
| 5-Year U.S. Treasury Notes | 1,857 | 6-30-2023 | 199,205,819 | 198,800,556 | 0 | | (405,263) |
| Short | | | | | | | |
| Euro-BOBL Futures | (204) | 3-8-2023 | (25,743,303) | (24,852,472) | 890,831 | | 0 |
| Euro-Bund Futures | (215) | 3-8-2023 | (32,125,245) | (30,224,454) | 1,900,791 | | 0 |
| Euro-Schatz Futures | (67) | 3-8-2023 | (7,549,597) | (7,439,500) | 110,097 | | 0 |
| 10-Year U.S. Ultra Treasury Notes | (147) | 6-21-2023 | (17,152,813) | (17,226,563) | 0 | | (73,750) |
| | | | | | $2,901,719 | | $(1,503,451) |
Centrally cleared credit default swap contracts
| Reference index | Fixed rate
received | Payment
frequency | Maturity
date | Notional
amount | Value | Premiums
paid
(received) | Unrealized
gains | Unrealized
losses |
| Sell protection | | | | | | | | | |
| Markit iTraxx Europe Crossover | 5.00% | Quarterly | 6-20-2026 | EUR | 4,000,000 | $201,529 | $390,663 | $0 | $(189,134) |
The accompanying notes are an integral part of these financial statements.
32 | Allspring Core Plus Bond Fund
Statement of assets and liabilities—February 28, 2023 (unaudited)
| | |
| Assets | |
Investments in unaffiliated securities (including $5,106,307 of securities loaned), at value (cost $3,632,733,380)
| $ 3,402,657,011 |
Investments in affiliated securities, at value (cost $217,303,787)
| 217,304,203 |
Cash
| 356,055 |
Cash collateral due from broker
| 7,469,346 |
Cash at broker segregated for futures contracts
| 7,054,000 |
Segregated cash for swap contracts
| 280,459 |
Foreign currency, at value (cost $2,389,952)
| 2,259,363 |
Receivable for investments sold
| 64,806,160 |
Receivable for interest
| 21,571,303 |
Receivable for Fund shares sold
| 12,694,167 |
Unrealized gains on forward foreign currency contracts
| 3,395,042 |
Receivable for daily variation margin on open futures contracts
| 128,518 |
Receivable for securities lending income, net
| 9,317 |
Principal paydown receivable
| 28 |
Prepaid expenses and other assets
| 254,538 |
Total assets
| 3,740,239,510 |
| Liabilities | |
Payable for when-issued transactions
| 492,230,395 |
Payable for investments purchased
| 42,983,704 |
Payable upon receipt of securities loaned
| 5,240,515 |
Payable for Fund shares redeemed
| 4,335,195 |
Cash collateral due to broker for forward foreign currency contracts
| 2,446,256 |
Management fee payable
| 606,024 |
Unrealized losses on forward foreign currency contracts
| 448,811 |
Administration fees payable
| 207,308 |
Distribution fee payable
| 19,901 |
Payable for daily variation margin on centrally cleared swap contracts
| 540 |
Total liabilities
| 548,518,649 |
Total net assets
| $3,191,720,861 |
| Net assets consist of | |
Paid-in capital
| $ 3,606,412,747 |
Total distributable loss
| (414,691,886) |
Total net assets
| $3,191,720,861 |
| Computation of net asset value and offering price per share | |
Net assets – Class A
| $ 239,738,275 |
Shares outstanding – Class A1
| 21,445,579 |
Net asset value per share – Class A
| $11.18 |
Maximum offering price per share – Class A2
| $11.71 |
Net assets – Class C
| $ 34,944,282 |
Shares outstanding – Class C1
| 3,127,287 |
Net asset value per share – Class C
| $11.17 |
Net assets – Class R6
| $ 173,423,374 |
Shares outstanding – Class R61
| 15,489,679 |
Net asset value per share – Class R6
| $11.20 |
Net assets – Administrator Class
| $ 132,908,509 |
Shares outstanding – Administrator Class1
| 11,912,293 |
Net asset value per share – Administrator Class
| $11.16 |
Net assets – Institutional Class
| $ 2,610,706,421 |
Shares outstanding – Institutional Class1
| 233,262,422 |
Net asset value per share – Institutional Class
| $11.19 |
| 1 | The Fund has an unlimited number of authorized shares. |
| 2 | Maximum offering price is computed as 100/95.50 of net asset value. On investments of $50,000 or more, the offering price is reduced. |
The accompanying notes are an integral part of these financial statements.
Allspring Core Plus Bond Fund | 33
Statement of operations—six months ended February 28, 2023 (unaudited)
| | |
| Investment income | |
Interest
| $ 57,966,262 |
Income from affiliated securities
| 1,923,026 |
Total investment income
| 59,889,288 |
| Expenses | |
Management fee
| 5,757,834 |
| Administration fees | |
Class A
| 189,453 |
Class C
| 25,982 |
Class R6
| 22,517 |
Administrator Class
| 66,328 |
Institutional Class
| 894,311 |
| Shareholder servicing fees | |
Class A
| 295,595 |
Class C
| 40,598 |
Administrator Class
| 165,820 |
| Distribution fee | |
Class C
| 121,793 |
Custody and accounting fees
| 84,026 |
Professional fees
| 47,333 |
Registration fees
| 93,167 |
Shareholder report expenses
| 62,409 |
Trustees’ fees and expenses
| 10,624 |
Other fees and expenses
| 20,608 |
Total expenses
| 7,898,398 |
| Less: Fee waivers and/or expense reimbursements | |
Fund-level
| (2,184,446) |
Class C
| (1,624) |
Class R6
| (7,506) |
Administrator Class
| (19,898) |
Institutional Class
| (111,789) |
Net expenses
| 5,573,135 |
Net investment income
| 54,316,153 |
| Realized and unrealized gains (losses) on investments | |
| Net realized gains (losses) on | |
Unaffiliated securities
| (68,815,612) |
Affiliated securities
| (701) |
Forward foreign currency contracts
| (1,291,533) |
Futures contracts
| (9,443,744) |
Swap contracts
| 22,122 |
Net realized losses on investments
| (79,529,468) |
| Net change in unrealized gains (losses) on | |
Unaffiliated securities
| (14,365,773) |
Affiliated securities
| 416 |
Forward foreign currency contracts
| (1,599,458) |
Futures contracts
| 1,143,291 |
Swap contracts
| 298,733 |
Net change in unrealized gains (losses) on investments
| (14,522,791) |
Net realized and unrealized gains (losses) on investments
| (94,052,259) |
Net decrease in net assets resulting from operations
| $(39,736,106) |
The accompanying notes are an integral part of these financial statements.
34 | Allspring Core Plus Bond Fund
Statement of changes in net assets
| | | | | |
| | Six months ended
February 28, 2023
(unaudited) | Year ended
August 31, 2022 |
| Operations | | | | |
Net investment income
| | $ 54,316,153 | | $ 57,223,283 |
Net realized losses on investments
| | (79,529,468) | | (111,529,190) |
Net change in unrealized gains (losses) on investments
| | (14,522,791) | | (263,597,439) |
Net decrease in net assets resulting from operations
| | (39,736,106) | | (317,903,346) |
| Distributions to shareholders from | | | | |
| Net investment income and net realized gains | | | | |
Class A
| | (4,422,251) | | (7,044,171) |
Class C
| | (476,176) | | (680,832) |
Class R6
| | (3,109,493) | | (3,489,902) |
Administrator Class
| | (2,538,624) | | (4,436,318) |
Institutional Class
| | (46,056,890) | | (53,511,044) |
Total distributions to shareholders
| | (56,603,434) | | (69,162,267) |
| Capital share transactions | Shares | | Shares | |
| Proceeds from shares sold | | | | |
Class A
| 2,765,264 | 30,895,428 | 4,397,137 | 54,439,448 |
Class C
| 605,924 | 6,797,002 | 958,213 | 12,136,398 |
Class R6
| 4,548,325 | 51,144,464 | 7,732,999 | 97,935,749 |
Administrator Class
| 1,711,212 | 18,990,696 | 6,536,979 | 83,956,872 |
Institutional Class
| 111,705,401 | 1,261,935,484 | 130,624,519 | 1,626,306,890 |
| | | 1,369,763,074 | | 1,874,775,357 |
| Reinvestment of distributions | | | | |
Class A
| 348,637 | 3,881,014 | 503,593 | 6,387,680 |
Class C
| 39,827 | 443,931 | 47,708 | 607,468 |
Class R6
| 249,575 | 2,784,434 | 267,538 | 3,364,456 |
Administrator Class
| 228,283 | 2,536,721 | 349,602 | 4,432,909 |
Institutional Class
| 3,782,828 | 42,202,763 | 3,954,554 | 49,922,919 |
| | | 51,848,863 | | 64,715,432 |
| Payment for shares redeemed | | | | |
Class A
| (3,330,474) | (37,241,783) | (6,041,415) | (76,500,372) |
Class C
| (364,398) | (4,068,377) | (1,093,929) | (13,588,305) |
Class R6
| (1,552,297) | (17,435,116) | (2,333,786) | (29,040,415) |
Administrator Class
| (2,222,607) | (24,552,475) | (15,318,377) | (199,468,087) |
Institutional Class
| (51,943,540) | (581,610,062) | (95,979,266) | (1,192,329,620) |
| | | (664,907,813) | | (1,510,926,799) |
Net increase in net assets resulting from capital share transactions
| | 756,704,124 | | 428,563,990 |
Total increase in net assets
| | 660,364,584 | | 41,498,377 |
| Net assets | | | | |
Beginning of period
| | 2,531,356,277 | | 2,489,857,900 |
End of period
| | $3,191,720,861 | | $ 2,531,356,277 |
The accompanying notes are an integral part of these financial statements.
Allspring Core Plus Bond Fund | 35
Financial highlights
(For a share outstanding throughout each period)
| | | Year ended August 31 |
| Class A | Six months ended
February 28, 2023
(unaudited) | 2022 | 2021 | 2020 | 2019 | 2018 |
Net asset value, beginning of period
| $11.57 | $13.52 | $13.77 | $13.09 | $12.27 | $12.71 |
Net investment income
| 0.20 | 0.26 | 0.24 | 0.34 | 0.37 | 0.34 |
Net realized and unrealized gains (losses) on investments
| (0.38) | (1.88) | 0.16 | 0.77 | 0.80 | (0.45) |
Total from investment operations
| (0.18) | (1.62) | 0.40 | 1.11 | 1.17 | (0.11) |
| Distributions to shareholders from | | | | | | |
Net investment income
| (0.21) | (0.22) | (0.27) | (0.36) | (0.35) | (0.33) |
Net realized gains
| 0.00 | (0.11) | (0.38) | (0.07) | 0.00 | 0.00 |
Total distributions to shareholders
| (0.21) | (0.33) | (0.65) | (0.43) | (0.35) | (0.33) |
Net asset value, end of period
| $11.18 | $11.57 | $13.52 | $13.77 | $13.09 | $12.27 |
Total return1
| (1.55)% | (12.21)% | 3.00% | 8.72% | 9.74% | (0.84)% |
| Ratios to average net assets (annualized) | | | | | | |
Gross expenses
| 0.84% | 0.85% | 0.85% | 0.88% | 0.91% | 0.92% |
Net expenses
| 0.68% | 0.69% | 0.72% | 0.72% | 0.73% | 0.73% |
Net investment income
| 3.60% | 2.03% | 1.90% | 2.60% | 2.99% | 2.63% |
| Supplemental data | | | | | | |
Portfolio turnover rate
| 107% | 288% | 194% | 130% | 89% | 148% |
Net assets, end of period (000s omitted)
| $239,738 | $250,553 | $308,270 | $264,366 | $245,879 | $229,688 |
| 1 | Total return calculations do not include any sales charges. Returns for periods of less than one year are not annualized. |
The accompanying notes are an integral part of these financial statements.
36 | Allspring Core Plus Bond Fund
Financial highlights
(For a share outstanding throughout each period)
| | | Year ended August 31 |
| Class C | Six months ended
February 28, 2023
(unaudited) | 2022 | 2021 | 2020 | 2019 | 2018 |
Net asset value, beginning of period
| $11.56 | $13.51 | $13.77 | $13.09 | $12.26 | $12.71 |
Net investment income
| 0.15 | 0.16 | 0.14 | 0.23 | 0.28 | 0.23 |
Net realized and unrealized gains (losses) on investments
| (0.38) | (1.88) | 0.15 | 0.78 | 0.81 | (0.44) |
Total from investment operations
| (0.23) | (1.72) | 0.29 | 1.01 | 1.09 | (0.21) |
| Distributions to shareholders from | | | | | | |
Net investment income
| (0.16) | (0.12) | (0.17) | (0.26) | (0.26) | (0.24) |
Net realized gains
| 0.00 | (0.11) | (0.38) | (0.07) | 0.00 | 0.00 |
Total distributions to shareholders
| (0.16) | (0.23) | (0.55) | (0.33) | (0.26) | (0.24) |
Net asset value, end of period
| $11.17 | $11.56 | $13.51 | $13.77 | $13.09 | $12.26 |
Total return1
| (1.96)% | (12.89)% | 2.16% | 7.85% | 8.91% | (1.66)% |
| Ratios to average net assets (annualized) | | | | | | |
Gross expenses
| 1.60% | 1.60% | 1.60% | 1.63% | 1.66% | 1.67% |
Net expenses
| 1.43% | 1.45% | 1.48% | 1.48% | 1.48% | 1.48% |
Net investment income
| 2.86% | 1.28% | 1.13% | 1.85% | 2.25% | 1.89% |
| Supplemental data | | | | | | |
Portfolio turnover rate
| 107% | 288% | 194% | 130% | 89% | 148% |
Net assets, end of period (000s omitted)
| $34,944 | $32,889 | $39,628 | $28,342 | $18,195 | $20,550 |
| 1 | Total return calculations do not include any sales charges. Returns for periods of less than one year are not annualized. |
The accompanying notes are an integral part of these financial statements.
Allspring Core Plus Bond Fund | 37
Financial highlights
(For a share outstanding throughout each period)
| | | Year ended August 31 |
| Class R6 | Six months ended
February 28, 2023
(unaudited) | 2022 | 2021 | 2020 | 2019 | 2018 |
Net asset value, beginning of period
| $11.58 | $13.54 | $13.79 | $13.11 | $12.28 | $12.73 |
Net investment income
| 0.22 1 | 0.30 | 0.30 | 0.39 1 | 0.41 | 0.39 |
Net realized and unrealized gains (losses) on investments
| (0.37) | (1.89) | 0.15 | 0.77 | 0.82 | (0.46) |
Total from investment operations
| (0.15) | (1.59) | 0.45 | 1.16 | 1.23 | (0.07) |
| Distributions to shareholders from | | | | | | |
Net investment income
| (0.23) | (0.26) | (0.32) | (0.41) | (0.40) | (0.38) |
Net realized gains
| 0.00 | (0.11) | (0.38) | (0.07) | 0.00 | 0.00 |
Total distributions to shareholders
| (0.23) | (0.37) | (0.70) | (0.48) | (0.40) | (0.38) |
Net asset value, end of period
| $11.20 | $11.58 | $13.54 | $13.79 | $13.11 | $12.28 |
Total return2
| (1.27)% | (11.95)% | 3.37% | 9.10% | 10.14% | (0.55)% |
| Ratios to average net assets (annualized) | | | | | | |
Gross expenses
| 0.47% | 0.47% | 0.47% | 0.50% | 0.53% | 0.54% |
Net expenses
| 0.30% | 0.31% | 0.35% | 0.35% | 0.35% | 0.35% |
Net investment income
| 4.00% | 2.50% | 2.28% | 2.98% | 3.36% | 3.05% |
| Supplemental data | | | | | | |
Portfolio turnover rate
| 107% | 288% | 194% | 130% | 89% | 148% |
Net assets, end of period (000s omitted)
| $173,423 | $141,833 | $89,048 | $83,260 | $62,522 | $45,159 |
| 1 | Calculated based upon average shares outstanding |
| 2 | Returns for periods of less than one year are not annualized. |
The accompanying notes are an integral part of these financial statements.
38 | Allspring Core Plus Bond Fund
Financial highlights
(For a share outstanding throughout each period)
| | | Year ended August 31 |
| Administrator Class | Six months ended
February 28, 2023
(unaudited) | 2022 | 2021 | 2020 | 2019 | 2018 |
Net asset value, beginning of period
| $11.54 | $13.49 | $13.75 | $13.07 | $12.25 | $12.69 |
Net investment income
| 0.21 | 0.26 | 0.26 | 0.35 | 0.38 | 0.35 |
Net realized and unrealized gains (losses) on investments
| (0.38) | (1.87) | 0.14 | 0.77 | 0.81 | (0.44) |
Total from investment operations
| (0.17) | (1.61) | 0.40 | 1.12 | 1.19 | (0.09) |
| Distributions to shareholders from | | | | | | |
Net investment income
| (0.21) | (0.23) | (0.28) | (0.37) | (0.37) | (0.35) |
Net realized gains
| 0.00 | (0.11) | (0.38) | (0.07) | 0.00 | 0.00 |
Total distributions to shareholders
| (0.21) | (0.34) | (0.66) | (0.44) | (0.37) | (0.35) |
Net asset value, end of period
| $11.16 | $11.54 | $13.49 | $13.75 | $13.07 | $12.25 |
Total return1
| (1.43)% | (12.18)% | 3.04% | 8.85% | 9.88% | (0.74)% |
| Ratios to average net assets (annualized) | | | | | | |
Gross expenses
| 0.79% | 0.79% | 0.79% | 0.82% | 0.85% | 0.86% |
Net expenses
| 0.60% | 0.61% | 0.62% | 0.62% | 0.62% | 0.62% |
Net investment income
| 3.68% | 2.09% | 1.95% | 2.71% | 3.07% | 2.74% |
| Supplemental data | | | | | | |
Portfolio turnover rate
| 107% | 288% | 194% | 130% | 89% | 148% |
Net assets, end of period (000s omitted)
| $132,909 | $140,779 | $278,294 | $80,099 | $57,316 | $32,241 |
| 1 | Returns for periods of less than one year are not annualized. |
The accompanying notes are an integral part of these financial statements.
Allspring Core Plus Bond Fund | 39
Financial highlights
(For a share outstanding throughout each period)
| | | Year ended August 31 |
| Institutional Class | Six months ended
February 28, 2023
(unaudited) | 2022 | 2021 | 2020 | 2019 | 2018 |
Net asset value, beginning of period
| $11.58 | $13.53 | $13.79 | $13.11 | $12.28 | $12.72 |
Net investment income
| 0.22 1 | 0.29 | 0.29 | 0.38 | 0.39 | 0.37 1 |
Net realized and unrealized gains (losses) on investments
| (0.38) | (1.87) | 0.14 | 0.77 | 0.83 | (0.44) |
Total from investment operations
| (0.16) | (1.58) | 0.43 | 1.15 | 1.22 | (0.07) |
| Distributions to shareholders from | | | | | | |
Net investment income
| (0.23) | (0.26) | (0.31) | (0.40) | (0.39) | (0.37) |
Net realized gains
| 0.00 | (0.11) | (0.38) | (0.07) | 0.00 | 0.00 |
Total distributions to shareholders
| (0.23) | (0.37) | (0.69) | (0.47) | (0.39) | (0.37) |
Net asset value, end of period
| $11.19 | $11.58 | $13.53 | $13.79 | $13.11 | $12.28 |
Total return2
| (1.39)% | (11.92)% | 3.24% | 9.05% | 10.17% | (0.52)% |
| Ratios to average net assets (annualized) | | | | | | |
Gross expenses
| 0.52% | 0.52% | 0.52% | 0.55% | 0.58% | 0.59% |
Net expenses
| 0.35% | 0.37% | 0.40% | 0.40% | 0.40% | 0.40% |
Net investment income
| 3.95% | 2.40% | 2.19% | 2.92% | 3.29% | 3.00% |
| Supplemental data | | | | | | |
Portfolio turnover rate
| 107% | 288% | 194% | 130% | 89% | 148% |
Net assets, end of period (000s omitted)
| $2,610,706 | $1,965,302 | $1,774,619 | $836,162 | $524,743 | $264,292 |
| 1 | Calculated based upon average shares outstanding |
| 2 | Returns for periods of less than one year are not annualized. |
The accompanying notes are an integral part of these financial statements.
40 | Allspring Core Plus Bond Fund
Notes to financial statements (unaudited)
1. ORGANIZATION
Allspring Funds Trust (the "Trust"), a Delaware statutory trust organized on March 10, 1999, is an open-end management investment company registered under the Investment Company Act of 1940, as amended (the "1940 Act"). As an investment company, the Trust follows the accounting and reporting guidance in Financial Accounting Standards Board ("FASB") Accounting Standards Codification Topic 946, Financial Services – Investment Companies. These financial statements report on the Allspring Core Plus Bond Fund (the "Fund") which is a diversified series of the Trust.
2. SIGNIFICANT ACCOUNTING POLICIES
The following significant accounting policies, which are consistently followed in the preparation of the financial statements of the Fund, are in conformity with U.S. generally accepted accounting principles which require management to make estimates and assumptions that affect the reported amounts of assets and liabilities, disclosure of contingent assets and liabilities at the date of the financial statements, and the reported amounts of income and expenses during the reporting period. Actual results could differ from those estimates.
Securities valuation
All investments are valued each business day as of the close of regular trading on the New York Stock Exchange (generally 4 p.m. Eastern Time), although the Fund may deviate from this calculation time under unusual or unexpected circumstances.
Debt securities are valued at the evaluated bid price provided by an independent pricing service (e.g. taking into account various factors, including yields, maturities, or credit ratings) or, if a reliable price is not available, the quoted bid price from an independent broker-dealer.
Equity securities and futures contracts that are listed on a foreign or domestic exchange or market are valued at the official closing price or, if none, the last sales price.
The values of securities denominated in foreign currencies are translated into U.S. dollars at rates provided by an independent foreign currency pricing source at a time each business day specified by the Valuation Committee established by Allspring Funds Management, LLC ("Allspring Funds Management").
Forward foreign currency contracts are recorded at the forward rate provided by an independent foreign currency pricing source at a time each business day specified by the Valuation Committee.
Swap contracts are valued at the evaluated price provided by an independent pricing service or, if a reliable price is not available, the quoted bid price from an independent broker-dealer.
Investments in registered open-end investment companies (other than those listed on a foreign or domestic exchange or market) are valued at net asset value. Interests in non-registered investment companies that are redeemable at net asset value are fair valued normally at net asset value.
Investments which are not valued using the methods discussed above are valued at their fair value, as determined in good faith by Allspring Funds Management, which was named the valuation designee by the Board of Trustees. As the valuation designee, Allspring Funds Management is responsible for day-to-day valuation activities for the Allspring Funds. In connection with these responsibilities, Allspring Funds Management has established a Valuation Committee and has delegated to it the authority to take any actions regarding the valuation of portfolio securities that the Valuation Committee deems necessary or appropriate, including determining the fair value of portfolio securities. On a quarterly basis, the Board of Trustees receives reports of valuation actions taken by the Valuation Committee. On at least an annual basis, the Board of Trustees receives an assessment of the adequacy and effectiveness of Allspring Funds Management's process for determining the fair value of the portfolio of investments.
Foreign currency translation
The accounting records of the Fund are maintained in U.S. dollars. The values of other assets and liabilities denominated in foreign currencies are translated into U.S. dollars at rates provided by an independent foreign currency pricing source at a time each business day specified by the Valuation Committee. Purchases and sales of securities, and income and expenses are converted at the rate of exchange on the respective dates of such transactions. Net realized foreign exchange gains or losses arise from sales of foreign currencies, currency gains or losses realized between the trade and settlement dates on securities transactions, and the difference between the amounts of dividends, interest and foreign withholding taxes recorded and the U.S. dollar equivalent of the amounts actually paid or received. Net unrealized foreign exchange gains and losses arise from changes in the fair value of assets and liabilities other than investments in securities resulting from changes in exchange rates.
Allspring Core Plus Bond Fund | 41
Notes to financial statements (unaudited)
The changes in net assets arising from changes in exchange rates of securities and the changes in net assets resulting from changes in market prices of securities are not separately presented. Such changes are included in net realized and unrealized gains or losses from investments.
Securities lending
The Fund may lend its securities from time to time in order to earn additional income in the form of fees or interest on securities received as collateral or the investment of any cash received as collateral. When securities are on loan, the Fund receives interest or dividends on those securities. Cash collateral received in connection with its securities lending transactions is invested in Securities Lending Cash Investments, LLC (the "Securities Lending Fund"), an affiliated non-registered investment company. Investments in Securities Lending Fund are valued at the evaluated bid price provided by an independent pricing service. Income earned from investment in the Securities Lending Fund (net of fees and rebates), if any, is included in income from affiliated securities on the Statement of Operations.
In a securities lending transaction, the net asset value of the Fund is affected by an increase or decrease in the value of the securities loaned and by an increase or decrease in the value of the instrument in which collateral is invested. The amount of securities lending activity undertaken by the Fund fluctuates from time to time. The Fund has the right under the lending agreement to recover the securities from the borrower on demand. In the event of default or bankruptcy by the borrower, the Fund may be prevented from recovering the loaned securities or gaining access to the collateral or may experience delays or costs in doing so. In such an event, the terms of the agreement allow the unaffiliated securities lending agent to use the collateral to purchase replacement securities on behalf of the Fund or pay the Fund the market value of the loaned securities. The Fund bears the risk of loss with respect to depreciation of its investment of the cash collateral.
When-issued transactions
The Fund may purchase securities on a forward commitment or when-issued basis. The Fund records a when-issued transaction on the trade date and will segregate assets in an amount at least equal in value to the Fund's commitment to purchase when-issued securities. Securities purchased on a when-issued basis are marked-to-market daily and the Fund begins earning interest on the settlement date. Losses may arise due to changes in the market value of the underlying securities or if the counterparty does not perform under the contract.
Loans
The Fund may invest in direct debt instruments which are interests in amounts owed to lenders by corporate or other borrowers. The loans pay interest at rates which are periodically reset by reference to a base lending rate plus a spread. Investments in loans may be in the form of participations in loans or assignments of all or a portion of loans from third parties. When the Fund purchases participations, it generally has no rights to enforce compliance with the terms of the loan agreement with the borrower. As a result, the Fund assumes the credit risk of both the borrower and the lender that is selling the participation. When the Fund purchases assignments from lenders, it acquires direct rights against the borrower on the loan and may enforce compliance by the borrower with the terms of the loan agreement. Loans may include fully funded term loans or unfunded loan commitments, which are contractual obligations for future funding.
Forward foreign currency contracts
A forward foreign currency contract is an agreement between two parties to purchase or sell a specific currency for an agreed-upon price at a future date. The Fund enters into forward foreign currency contracts to facilitate transactions in foreign-denominated securities and to attempt to minimize the risk to the Fund from adverse changes in the relationship between currencies. Forward foreign currency contracts are recorded at the forward rate and marked-to-market daily. When the contracts are closed, realized gains and losses arising from such transactions are recorded as realized gains or losses on forward foreign currency contracts. The Fund is subject to foreign currency risk and may be exposed to risks if the counterparties to the contracts are unable to meet the terms of their contracts or if the value of the foreign currency changes unfavorably. The Fund's maximum risk of loss from counterparty credit risk is the unrealized gains on the contracts. This risk may be mitigated if there is a master netting arrangement between the Fund and the counterparty.
Futures contracts
Futures contracts are agreements between the Fund and a counterparty to buy or sell a specific amount of a commodity, financial instrument or currency at a specified price on a specified date. The Fund may buy and sell futures contracts in order to gain exposure to, or protect against, changes in interest rates and is subject to interest rate risk. The primary risks associated with the use of futures contracts are the imperfect correlation between changes in market values of securities held by the Fund and the prices of futures contracts, and the possibility of an illiquid market. Futures contracts are generally entered into on a regulated futures exchange and cleared through a clearinghouse associated with the exchange. With futures contracts, there is
42 | Allspring Core Plus Bond Fund
Notes to financial statements (unaudited)
minimal counterparty risk to the Fund since futures contracts are exchange-traded and the exchange’s clearinghouse, as the counterparty to all exchange-traded futures, guarantees the futures contracts against default.
Upon entering into a futures contract, the Fund is required to deposit either cash or securities (initial margin) with the broker in an amount equal to a certain percentage of the contract value. Subsequent payments (variation margin) are paid to or from the broker each day equal to the daily changes in the contract value. Such payments are recorded as unrealized gains or losses and, if any, shown as variation margin receivable (payable) in the Statement of Assets and Liabilities. Should the Fund fail to make requested variation margin payments, the broker can gain access to the initial margin to satisfy the Fund’s payment obligations. When the contracts are closed, a realized gain or loss is recorded in the Statement of Operations.
Swap contracts
Swap contracts are agreements between the Fund and a counterparty to exchange a series of cash flows over a specified period. Swap agreements are privately negotiated contracts between the Fund that are entered into as bilateral contracts in the over-the-counter market or centrally cleared (“centrally cleared swaps”) with a central clearinghouse.
The Fund entered into centrally cleared swaps. In a centrally cleared swap, immediately following execution of the swap contract, the swap contract is novated to a central counterparty (the “CCP”) and the counterparty on the swap agreement becomes the CCP. Upon entering into a centrally cleared swap, the Fund is required to deposit an initial margin with the broker in the form of cash or securities. Securities deposited as initial margin are designated in the Portfolio of Investments and cash deposited is shown as cash segregated for centrally cleared swaps in the Statement of Assets and Liabilities. Pursuant to the contract, the Fund agrees to receive from or pay to the broker an amount of cash equal to the daily fluctuation in market value of the contract (“variation margin”). The variation margin is recorded as an unrealized gain (or loss) and shown as daily variation margin receivable (or payable) on centrally cleared swaps in the Statement of Assets and Liabilities. Payments received from (paid to) the counterparty are recorded as realized gains (losses) in the Statement of Operations when the contract is closed.
Credit default swaps
The Fund may enter into credit default swaps for hedging or speculative purposes to provide or receive a measure of protection against default on a referenced entity, obligation or index or a basket of single-name issuers or traded indexes. An index credit default swap references all the names in the index, and if a credit event is triggered, the credit event is settled based on that name’s weight in the index. Credit default swaps are agreements in which the protection buyer pays fixed periodic payments to the protection seller in consideration for a promise from the protection seller to make a specific payment should a negative credit event take place with respect to the referenced entity (e.g., bankruptcy, failure to pay, obligation acceleration, repudiation, moratorium or restructuring).
The Fund may enter into credit default swaps as either the seller of protection or the buyer of protection. If the Fund is the buyer of protection and a credit event occurs, the Fund will either receive from the seller an amount equal to the notional amount of the swap and deliver the referenced security or underlying securities comprising the index, or receive a net settlement of cash equal to the notional amount of the swap less the recovery value of the security or underlying securities comprising the index. If the Fund is the seller of protection and a credit event occurs, the Fund will either pay the buyer an amount equal to the notional amount of the swap and take delivery of the referenced security or underlying securities comprising the index or pay a net settlement of cash equal to the notional amount of the swap less the recovery value of the security or underlying securities comprising the index.
As the seller of protection, the Fund is subject to investment exposure on the notional amount of the swap and has assumed the risk of default of the underlying security or index. As the buyer of protection, the Fund could be exposed to risks if the seller of the protection defaults on its obligation to perform, or if there are unfavorable changes in the fluctuation of interest rates.
By entering into credit default swap contracts, the Fund is exposed to credit risk. In addition, certain credit default swap contracts entered into by the Fund provide for conditions that result in events of default or termination that enable the counterparty to the agreement to cause an early termination of the transactions under those agreements.
Mortgage dollar roll transactions
The Fund may engage in mortgage dollar roll transactions through TBA mortgage-backed securities issued by Government National Mortgage Association (GNMA), Federal National Mortgage Association (FNMA) and Federal Home Loan Mortgage Corporation (FHLMC). In a mortgage dollar roll transaction, the Fund sells a mortgage-backed security to a financial institution, such as a bank or broker-dealer and simultaneously agrees to repurchase a substantially similar security from the institution at a later date at an agreed upon price. The mortgage-backed securities that are repurchased will bear the same interest rate as those sold, but generally will be collateralized by different pools of mortgages with different pre-payment histories. During the roll period, the Fund foregoes principal and interest paid on the securities. The Fund is compensated by the difference between
Allspring Core Plus Bond Fund | 43
Notes to financial statements (unaudited)
the current sales price and the forward price for the future purchase as well as by the earnings on the cash proceeds of the initial sale. Mortgage dollar rolls may be renewed without physical delivery of the securities subject to the contract. The Fund accounts for TBA dollar roll transactions as purchases and sales which, as a result, may increase its portfolio turnover rate.
Security transactions and income recognition
Securities transactions are recorded on a trade date basis. Realized gains or losses are recorded on the basis of identified cost.
Interest income is accrued daily and bond discounts are accreted and premiums are amortized daily. To the extent debt obligations are placed on non-accrual status, any related interest income may be reduced by writing off interest receivables when the collection of all or a portion of interest has been determined to be doubtful based on consistently applied procedures and the fair value has decreased. If the issuer subsequently resumes interest payments or when the collectability of interest is reasonably assured, the debt obligation is removed from non-accrual status. Paydown gains and losses are included in interest income.
Distributions to shareholders
Distributions to shareholders are recorded on the ex-dividend date and paid from net investment income monthly and any net realized gains are paid at least annually. Such distributions are determined in accordance with income tax regulations and may differ from U.S. generally accepted accounting principles. Dividend sources are estimated at the time of declaration. The tax character of distributions is determined as of the Fund's fiscal year end. Therefore, a portion of the Fund's distributions made prior to the Fund’s fiscal year end may be categorized as a tax return of capital at year end.
Federal and other taxes
The Fund intends to continue to qualify as a regulated investment company by distributing substantially all of its investment company taxable income and any net realized capital gains (after reduction for capital loss carryforwards) sufficient to relieve it from all, or substantially all, federal income taxes. Accordingly, no provision for federal income taxes was required.
The Fund’s income and federal excise tax returns and all financial records supporting those returns for the prior three fiscal years are subject to examination by the federal and Delaware revenue authorities. Management has analyzed the Fund's tax positions taken on federal, state, and foreign tax returns, as applicable, for all open tax years and does not believe that there are any uncertain tax positions that require recognition of a tax liability.
As of February 28, 2023, the aggregate cost of all investments for federal income tax purposes was $3,838,951,163 and the unrealized gains (losses) consisted of:
| Gross unrealized gains | $ 28,769,708 |
| Gross unrealized losses | (243,604,292) |
| Net unrealized losses | $(214,834,584) |
As of August 31, 2022, the Fund had current year deferred post-October capital losses consisting of $105,532,047 in short-term capital losses and $10,938,987 in long-term capital losses which was recognized in the first day of the current fiscal year.
Class allocations
The separate classes of shares offered by the Fund differ principally in applicable sales charges, distribution, shareholder servicing, and administration fees. Class specific expenses are charged directly to that share class. Investment income, common fund-level expenses, and realized and unrealized gains (losses) on investments are allocated daily to each class of shares based on the relative proportion of net assets of each class.
44 | Allspring Core Plus Bond Fund
Notes to financial statements (unaudited)
3. FAIR VALUATION MEASUREMENTS
Fair value measurements of investments are determined within a framework that has established a fair value hierarchy based upon the various data inputs utilized in determining the value of the Fund’s investments. The three-level hierarchy gives the highest priority to unadjusted quoted prices in active markets for identical assets or liabilities (Level 1) and the lowest priority to unobservable inputs (Level 3). The Fund’s investments are classified within the fair value hierarchy based on the lowest level of input that is significant to the fair value measurement. The inputs are summarized into three broad levels as follows:
| ■ | Level 1 – quoted prices in active markets for identical securities |
| ■ | Level 2 – other significant observable inputs (including quoted prices for similar securities, interest rates, prepayment speeds, credit risk, etc.) |
| ■ | Level 3 – significant unobservable inputs (including the Fund’s own assumptions in determining the fair value of investments) |
The inputs or methodologies used for valuing investments in securities are not necessarily an indication of the risk associated with investing in those securities.
The following is a summary of the inputs used in valuing the Fund’s assets and liabilities as of February 28, 2023:
| | Quoted prices
(Level 1) | Other significant
observable inputs
(Level 2) | Significant
unobservable inputs
(Level 3) | Total |
| Assets | | | | |
| Investments in: | | | | |
| Agency securities | $ 0 | $ 891,387,180 | $ 0 | $ 891,387,180 |
| Asset-backed securities | 0 | 193,412,485 | 0 | 193,412,485 |
| Corporate bonds and notes | 0 | 563,376,828 | 0 | 563,376,828 |
| Foreign corporate bonds and notes | 0 | 74,243,913 | 0 | 74,243,913 |
| Foreign government bonds | 0 | 194,725,537 | 0 | 194,725,537 |
| Loans | 0 | 17,899,264 | 941,246 | 18,840,510 |
| Municipal obligations | 0 | 7,250,153 | 0 | 7,250,153 |
| Non-agency mortgage-backed securities | 0 | 374,718,511 | 0 | 374,718,511 |
| U.S. Treasury securities | 606,176,062 | 0 | 0 | 606,176,062 |
| Yankee corporate bonds and notes | 0 | 335,690,285 | 0 | 335,690,285 |
| Yankee government bonds | 0 | 34,893,596 | 0 | 34,893,596 |
| Short-term investments | | | | |
| Commercial paper | 0 | 19,997,327 | 0 | 19,997,327 |
| Investment companies | 217,304,203 | 0 | 0 | 217,304,203 |
| U.S. Treasury securities | 87,944,624 | 0 | 0 | 87,944,624 |
| | 911,424,889 | 2,707,595,079 | 941,246 | 3,619,961,214 |
| Forward foreign currency contracts | 0 | 3,395,042 | 0 | 3,395,042 |
| Futures contracts | 2,901,719 | 0 | 0 | 2,901,719 |
| Total assets | $914,326,608 | $2,710,990,121 | $941,246 | $3,626,257,975 |
| Liabilities | | | | |
| Forward foreign currency contracts | $ 0 | $ 448,811 | $ 0 | $ 448,811 |
| Futures contracts | 1,503,451 | 0 | 0 | 1,503,451 |
| Swap contracts | 0 | 189,134 | 0 | 189,134 |
| Total liabilities | $ 1,503,451 | $ 637,945 | $ 0 | $ 2,141,396 |
Futures contracts, forward foreign currency contracts and swap contracts are reported at their cumulative unrealized gains (losses) at measurement date as reported in the tables following the Portfolio of Investments. For futures contracts and centrally cleared swap contracts, the current day’s variation margin is reported on the Statement of Assets and Liabilities. All other assets and liabilities are reported at their market value at measurement date.
Additional sector, industry or geographic detail, if any, is included in the Portfolio of Investments.
For the six months ended February 28, 2023, the Fund did not have any transfers into/out of Level 3.
Allspring Core Plus Bond Fund | 45
Notes to financial statements (unaudited)
4. TRANSACTIONS WITH AFFILIATES
Management fee
Allspring Funds Management, a wholly owned subsidiary of Allspring Global Investments Holdings, LLC, a holding company indirectly owned by certain private funds of GTCR LLC and Reverence Capital Partners, L.P., is the manager of the Fund and provides advisory and fund-level administrative services under an investment management agreement. Under the investment management agreement, Allspring Funds Management is responsible for, among other services, implementing the investment objectives and strategies of the Fund, supervising the subadviser and providing fund-level administrative services in connection with the Fund’s operations. As compensation for its services under the investment management agreement, Allspring Funds Management is entitled to receive a management fee at the following annual rate based on the Fund’s average daily net assets:
| Average daily net assets | Management fee |
| First $500 million | 0.450% |
| Next $500 million | 0.425 |
| Next $2 billion | 0.400 |
| Next $2 billion | 0.375 |
| Next $5 billion | 0.340 |
| Over $10 billion | 0.320 |
For the six months ended February 28, 2023, the management fee was equivalent to an annual rate of 0.41% of the Fund’s average daily net assets.
Allspring Funds Management has retained the services of a subadviser to provide daily portfolio management to the Fund. The fee for subadvisory services is borne by Allspring Funds Management. Allspring Global Investments, LLC ("Allspring Investments"), an affiliate of Allspring Funds Management and a wholly owned subsidiary of Allspring Global Investments Holdings, LLC, is the subadviser to the Fund and is entitled to receive a fee from Allspring Funds Management at an annual rate starting at 0.20% and declining to 0.10% as the average daily net assets of the Fund increase.
Administration fees
Under a class-level administration agreement, Allspring Funds Management provides class-level administrative services to the Fund, which includes paying fees and expenses for services provided by the transfer agent, sub-transfer agents, omnibus account servicers and record-keepers. As compensation for its services under the class-level administration agreement, Allspring Funds Management receives an annual fee which is calculated based on the average daily net assets of each class as follows:
| | Class-level
administration fee |
| Class A | 0.16% |
| Class C | 0.16 |
| Class R6 | 0.03 |
| Administrator Class | 0.10 |
| Institutional Class | 0.08 |
Waivers and/or expense reimbursements
Allspring Funds Management has contractually committed to waive and/or reimburse management and administration fees to the extent necessary to maintain certain net operating expense ratios for the Fund. When each class of the Fund has exceeded its expense cap, Allspring Funds Management will waive fees and/or reimburse expenses from fund-level expenses on a proportionate basis and then from class specific expenses. When only certain classes exceed their expense caps, waivers and/or reimbursements are applied against class specific expenses before fund-level expenses. Allspring Funds Management has contractually committed through December 31, 2023 to waive fees and/or reimburse expenses to the extent necessary to cap expenses. Prior to or after the commitment expiration date, the caps may be increased or the commitment to maintain the
46 | Allspring Core Plus Bond Fund
Notes to financial statements (unaudited)
caps may be terminated only with the approval of the Board of Trustees. As of February 28, 2023, the contractual expense caps are as follows:
| | Expense ratio caps |
| Class A | 0.68% |
| Class C | 1.43 |
| Class R6 | 0.30 |
| Administrator Class | 0.60 |
| Institutional Class | 0.35 |
Distribution fee
The Trust has adopted a distribution plan for Class C shares pursuant to Rule 12b-1 under the 1940 Act. A distribution fee is charged to Class C shares and paid to Allspring Funds Distributor, LLC ("Allspring Funds Distributor"), the principal underwriter, an affiliate of Allspring Funds Management, at an annual rate up to 0.75% of the average daily net assets of Class C shares.
In addition, Allspring Funds Distributor is entitled to receive the front-end sales charge from the purchase of Class A shares and a contingent deferred sales charge on the redemption of certain Class A shares. Allspring Funds Distributor is also entitled to receive the contingent deferred sales charges from redemptions of Class C shares. For the six months ended February 28, 2023, Allspring Funds Distributor received $3,651 from the sale of Class A shares and $50 in contingent deferred sales charges from redemptions of Class C shares. No contingent deferred sales charges were incurred by Class A shares for the six months ended February 28, 2023.
Shareholder servicing fees
The Trust has entered into contracts with one or more shareholder servicing agents, whereby Class A, Class C and Administrator Class are charged a fee at an annual rate up to 0.25% of the average daily net assets of each respective class. A portion of these total shareholder servicing fees were paid to affiliates of the Fund.
Interfund transactions
The Fund may purchase or sell portfolio investment securities to certain affiliates pursuant to Rule 17a-7 under the 1940 Act and under procedures adopted by the Board of Trustees. The procedures have been designed to ensure that these interfund transactions, which do not incur broker commissions, are effected at current market prices.
5. INVESTMENT PORTFOLIO TRANSACTIONS
Purchases and sales of investments, excluding short-term securities, for the six months ended February 28, 2023 were as follows:
| Purchases at cost | | Sales proceeds |
U.S.
government | Non-U.S.
government | | U.S.
government | Non-U.S.
government |
| $1,964,953,216 | $1,952,528,942 | | $1,766,670,550 | $1,381,788,758 |
6. SECURITIES LENDING TRANSACTIONS
The Fund lends its securities through an unaffiliated securities lending agent and receives collateral in the form of cash or securities with a value at least equal to the value of the securities on loan. The value of the loaned securities is determined at the close of each business day and any increases or decreases in the required collateral are exchanged between the Fund and the counterparty on the next business day. Cash collateral received is invested in the Securities Lending Fund which seeks to provide a positive return compared to the daily Federal Funds Open Rate by investing in high-quality, U.S. dollar-denominated short-term money market instruments and is exempt from registration under Section 3(c)(7) of the 1940 Act. Securities Lending Fund is managed by Allspring Funds Management and is subadvised by Allspring Investments. Allspring Funds Management receives an advisory fee starting at 0.05% and declining to 0.01% as the average daily net assets of the Securities Lending Fund increase. All of the fees received by Allspring Funds Management are paid to Allspring Investments for its services as subadviser.
Allspring Core Plus Bond Fund | 47
Notes to financial statements (unaudited)
In the event of counterparty default or the failure of a borrower to return a loaned security, the Fund has the right to use the collateral to offset any losses incurred. As of February 28, 2023, the Fund had securities lending transactions with the following counterparties which are subject to offset:
| Counterparty | Value of
securities on
loan | Collateral
received1 | Net amount |
| Bank of America Securities Incorporated | $2,457,689 | $(2,457,689) | $0 |
| Barclays Capital Incorporated | 798,284 | (798,284) | 0 |
| Credit Suisse Securities (USA) LLC | 1,850,334 | (1,850,334) | 0 |
1 Collateral disclosed within this table is limited to the net transaction with the counterparty.
7. DERIVATIVE TRANSACTIONS
During the six months ended February 28, 2023, the Fund entered into futures contracts to speculate on interest rates and to help manage the duration of the portfolio. The Fund also entered into forward foreign currency contracts for economic hedging purposes and entered into swap contracts to hedge risks and/or enhance total returns.
The volume of the Fund's derivative activity during the six months ended February 28, 2023 was as follows:
| Futures contracts | |
| Average notional balance on long futures | $355,531,351 |
| Average notional balance on short futures | 73,858,178 |
| Forward foreign currency contracts | |
| Average contract amounts to buy | $ 17,763,470 |
| Average contract amounts to sell | 153,149,184 |
| Swap contracts | |
| Average notional balance | $ 5,204,319 |
The swap transactions may contain provisions for early termination in the event the net assets of the Fund declines below specific levels identified by the counterparty. If these levels are triggered, the counterparty may terminate the transaction and seek payment or request full collateralization of the derivative transactions in net liability positions.
A summary of the location of derivative instruments on the financial statements by primary risk exposure is outlined in the following tables.
The fair value of derivative instruments as of February 28, 2023 by primary risk type was as follows for the Fund:
| | Asset derivatives | | Liability derivatives |
| | Statement of
Assets and Liabilities location | Fair value | | Statement of
Assets and Liabilities location | Fair value |
| Interest rate risk | Unrealized gains on futures contracts | $ 2,901,719* | | Unrealized losses on futures contracts | $ 1,503,451* |
| Foreign currency risk | Unrealized gains on forward foreign currency contracts | 3,395,042 | | Unrealized losses on forward foreign currency contracts | 448,811 |
| Credit risk | Net unrealized gains on swap contracts | 0* | | Net unrealized losses on swap contracts | 189,134* |
| | | $6,296,761 | | | $2,141,396 |
* Amount represents the cumulative unrealized gains (losses) as reported in the table following the Portfolio of Investments. For futures contracts and centrally cleared swap contracts, only the current day's variation margin as of February 28, 2023 is reported separately on the Statement of Assets and Liabilities.
48 | Allspring Core Plus Bond Fund
Notes to financial statements (unaudited)
The effect of derivative instruments on the Statement of Operations for the six months ended February 28, 2023 was as follows:
| | Net realized gains (losses) on derivatives |
| | Forward
foreign
currency
contracts | Futures
contracts | Swap
contracts | Total |
| Interest rate risk | $ 0 | $ (9,443,744) | $ 0 | $ (9,443,744) |
| Foreign currency risk | (1,291,533) | 0 | 0 | (1,291,533) |
| Credit risk | 0 | 0 | 22,122 | 22,122 |
| | $(1,291,533) | $(9,443,744) | $22,122 | $(10,713,155) |
| | Net change in unrealized gains (losses) on derivatives |
| | Forward
foreign
currency
contracts | Futures
contracts | Swap
contracts | Total |
| Interest rate risk | $ 0 | $ 1,143,291 | $ 0 | $ 1,143,291 |
| Foreign currency risk | (1,599,458) | 0 | 0 | (1,599,458) |
| Credit risk | 0 | 0 | 298,733 | 298,733 |
| | $(1,599,458) | $1,143,291 | $298,733 | $ (157,434) |
For certain types of derivative transactions, the Fund has entered into International Swaps and Derivatives Association, Inc. master agreements (“ISDA Master Agreements”) or similar agreements with approved counterparties. The ISDA Master Agreements or similar agreements may have requirements to deliver/deposit securities or cash to/with an exchange or broker-dealer as collateral and allows the Fund to offset, with each counterparty, certain derivative financial instrument’s assets and/or liabilities with collateral held or pledged. Collateral requirements differ by type of derivative. Collateral or margin requirements are set by the broker or exchange clearinghouse for exchange traded derivatives while collateral terms are contract specific for over-the-counter traded derivatives. Cash collateral that has been pledged to cover obligations of the Fund under ISDA Master Agreements or similar agreements, if any, are reported separately in the Statement of Assets and Liabilities. Securities pledged as collateral, if any, are noted in the Portfolio of Investments. With respect to balance sheet offsetting, absent an event of default by the counterparty or a termination of the agreement, the reported amounts of financial assets and financial liabilities in the Statement of Assets and Liabilities are not offset across transactions between the Fund and the applicable counterparty. A reconciliation of the gross amounts on the Statement of Assets and Liabilities to the net amounts by counterparty, including any collateral exposure, for OTC derivatives is as follows:
| Counterparty | Gross amounts
of assets in the
Statement of
Assets and
Liabilities | Amounts
subject to
netting
agreements | Collateral
received | Net amount
of assets |
| Citibank NA | $3,395,042 | $(448,811) | $(2,446,256) | $499,975 |
| Counterparty | Gross amounts
of liabilities in the
Statement of
Assets and
Liabilities | Amounts
subject to
netting
agreements | Collateral
pledged | Net amount
of liabilities |
| Citibank NA | $448,811 | $(448,811) | $0 | $0 |
8. BANK BORROWINGS
The Trust (excluding the money market funds), Allspring Master Trust and Allspring Variable Trust are parties to a $350,000,000 revolving credit agreement whereby the Fund is permitted to use bank borrowings for temporary or emergency purposes, such as to fund shareholder redemption requests. Interest under the credit agreement is charged to the Fund based
Allspring Core Plus Bond Fund | 49
Notes to financial statements (unaudited)
on a borrowing rate equal to the higher of the Federal Funds rate or the overnight bank funding rate in effect on that day plus a spread. In addition, an annual commitment fee equal based on the unused balance is allocated to each participating fund.
For the six months ended February 28, 2023, there were no borrowings by the Fund under the agreement.
9. MARKET RISKS
On March 11, 2020, the World Health Organization announced that it had made the assessment that coronavirus disease 2019 (“COVID-19”) is a pandemic. The impacts of COVID-19 are affecting the entire global economy, individual companies and investment products, the funds, and the market in general. There is significant uncertainty around the extent and duration of business disruptions related to COVID-19 and the impacts may last for an extended period of time. COVID-19 has led to significant uncertainty and volatility in the financial markets.
10. INDEMNIFICATION
Under the Fund's organizational documents, the officers and Trustees have been granted certain indemnification rights against certain liabilities that may arise out of performance of their duties to the Fund. The Fund has entered into a separate agreement with each Trustee that converts indemnification rights currently existing under the Fund’s organizational documents into contractual rights that cannot be changed in the future without the consent of the Trustee. Additionally, in the normal course of business, the Fund may enter into contracts with service providers that contain a variety of indemnification clauses. The Fund’s maximum exposure under these arrangements is dependent on future claims that may be made against the Fund and, therefore, cannot be estimated.
50 | Allspring Core Plus Bond Fund
Other information (unaudited)
PROXY VOTING INFORMATION
A description of the policies and procedures used to determine how to vote proxies relating to portfolio securities is available without charge, upon request, by calling 1-800-222-8222, visiting our website at allspringglobal.com, or visiting the SEC website at sec.gov. Information regarding how the proxies related to portfolio securities were voted during the most recent 12-month period ended June 30 is available on the website at allspringglobal.com or by visiting the SEC website at sec.gov.
QUARTERLY PORTFOLIO HOLDINGS INFORMATION
The Fund files its complete schedule of portfolio holdings with the SEC for the first and third quarters of each fiscal year as an exhibit to its reports on Form N-PORT. Shareholders may view the filed Form N-PORT by visiting the SEC website at sec.gov.
Allspring Core Plus Bond Fund | 51
Other information (unaudited)
BOARD OF TRUSTEES AND OFFICERS
Each of the Trustees and Officers listed in the table below acts in identical capacities for each fund in the Allspring family of funds, which consists of 127 mutual funds comprising the Allspring Funds Trust, Allspring Variable Trust, Allspring Master Trust and four closed-end funds (collectively the “Fund Complex”). This table should be read in conjunction with the Prospectus and the Statement of Additional Information1. The mailing address of each Trustee and Officer is 1415 Vantage Park Drive, 3rd Floor, Charlotte, NC 28203. Each Trustee and Officer serves an indefinite term, however, each Trustee serves such term until reaching the mandatory retirement age established by the Trustees.
Independent Trustees
Name and
year of birth | Position held and
length of service* | Principal occupations during past five years or longer | Current other
public company or
investment
company
directorships |
William R. Ebsworth
(Born 1957) | Trustee,
since 2015 | Retired. From 1984 to 2013, equities analyst, portfolio manager, research director and chief investment officer at Fidelity Management and Research Company in Boston, Tokyo, and Hong Kong, and retired in 2013 as Chief Investment Officer of Fidelity Strategic Advisers, Inc. where he led a team of investment professionals managing client assets. Prior thereto, Board member of Hong Kong Securities Clearing Co., Hong Kong Options Clearing Corp., the Thailand International Fund, Ltd., Fidelity Investments Life Insurance Company, and Empire Fidelity Investments Life Insurance Company. Audit Committee Chair and Investment Committee Chair of the Vincent Memorial Hospital Foundation (non-profit organization). Mr. Ebsworth is a CFA® charterholder. | N/A |
Jane A. Freeman
(Born 1953) | Trustee,
since 2015;
Chair Liaison,
since 2018 | Retired. From 2012 to 2014 and 1999 to 2008, Chief Financial Officer of Scientific Learning Corporation. From 2008 to 2012, Ms. Freeman provided consulting services related to strategic business projects. Prior to 1999, Portfolio Manager at Rockefeller & Co. and Scudder, Stevens & Clark. Board member of the Harding Loevner Funds from 1996 to 2014, serving as both Lead Independent Director and chair of the Audit Committee. Board member of the Russell Exchange Traded Funds Trust from 2011 to 2012 and the chair of the Audit Committee. Ms. Freeman is also an inactive Chartered Financial Analyst. | N/A |
Isaiah Harris, Jr.
(Born 1952) | Trustee,
since 2009; Audit
Committee
Chair,
since 2019 | Retired. Member of the Advisory Board of CEF of East Central Florida. Chairman of the Board of CIGNA Corporation from 2009 to 2021, and Director from 2005 to 2008. From 2003 to 2011, Director of Deluxe Corporation. Prior thereto, President and CEO of BellSouth Advertising and Publishing Corp. from 2005 to 2007, President and CEO of BellSouth Enterprises from 2004 to 2005 and President of BellSouth Consumer Services from 2000 to 2003. Emeritus member of the Iowa State University Foundation Board of Governors. Emeritus Member of the Advisory Board of Iowa State University School of Business. Advisory Board Member, Palm Harbor Academy (private school). Advisory Board Member, Fellowship of Christian Athletes. Mr. Harris is a certified public accountant (inactive status). | N/A |
David F. Larcker
(Born 1950) | Trustee,
since 2009 | Distinguished Visiting Fellow at the Hoover Institution since 2022. James Irvin Miller Professor of Accounting at the Graduate School of Business (Emeritus), Stanford University, Director of the Corporate Governance Research Initiative and Senior Faculty of The Rock Center for Corporate Governance since 2006. From 2005 to 2008, Professor of Accounting at the Graduate School of Business, Stanford University. Prior thereto, Ernst & Young Professor of Accounting at The Wharton School, University of Pennsylvania from 1985 to 2005. | N/A |
52 | Allspring Core Plus Bond Fund
Other information (unaudited)
Name and
year of birth | Position held and
length of service* | Principal occupations during past five years or longer | Current other
public company or
investment
company
directorships |
Olivia S. Mitchell
(Born 1953) | Trustee,
since 2006;
Nominating and
Governance
Committee Chair,
since 2018 | International Foundation of Employee Benefit Plans Professor since 1993, Wharton School of the University of Pennsylvania. Director of Wharton’s Pension Research Council and Boettner Center on Pensions & Retirement Research, and Research Associate at the National Bureau of Economic Research. Previously taught at Cornell University from 1978 to 1993. | N/A |
Timothy J. Penny
(Born 1951) | Trustee,
since 1996;
Chair,
since 2018 | President and Chief Executive Officer of Southern Minnesota Initiative Foundation, a non-profit organization, since 2007. Vice Chair of the Economic Club of Minnesota, since 2007. Co-Chair of the Committee for a Responsible Federal Budget, since 1995. Member of the Board of Trustees of NorthStar Education Finance, Inc., a non-profit organization, from 2007-2022. Senior Fellow of the University of Minnesota Humphrey Institute from 1995 to 2017. | N/A |
James G. Polisson
(Born 1959) | Trustee,
since 2018 | Retired. Chief Marketing Officer, Source (ETF) UK Services, Ltd, from 2015 to 2017. From 2012 to 2015, Principal of The Polisson Group, LLC, a management consulting, corporate advisory and principal investing company. Chief Executive Officer and Managing Director at Russell Investments, Global Exchange Traded Funds from 2010 to 2012. Managing Director of Barclays Global Investors from 1998 to 2010 and Global Chief Marketing Officer for iShares and Barclays Global Investors from 2000 to 2010. Trustee of the San Francisco Mechanics’ Institute, a non-profit organization, from 2013 to 2015. Board member of the Russell Exchange Traded Fund Trust from 2011 to 2012. Director of Barclays Global Investors Holdings Deutschland GmbH from 2006 to 2009. Mr. Polisson is an attorney and has a retired status with the Massachusetts and District of Columbia Bar Associations. | N/A |
Pamela Wheelock
(Born 1959) | Trustee,
since January
2020; previously
Trustee from
January 2018 to
July 2019 | Retired. Executive and Senior Financial leadership positions in the public, private and nonprofit sectors. Interim President and CEO, McKnight Foundation, 2020. Interim Commissioner, Minnesota Department of Human Services, 2019. Chief Operating Officer, Twin Cities Habitat for Humanity, 2017-2019. Vice President for University Services, University of Minnesota, 2012-2016. Interim President and CEO, Blue Cross and Blue Shield of Minnesota, 2011-2012. Executive Vice-President and Chief Financial Officer, Minnesota Wild, 2002-2008. Commissioner, Minnesota Department of Finance, 1999-2002. Chair of the Board of Directors of Destination Medical Center Corporation. Board member of the Minnesota Wild Foundation. | N/A |
* Length of service dates reflect the Trustee’s commencement of service with the Trust’s predecessor entities, where applicable.
Allspring Core Plus Bond Fund | 53
Other information (unaudited)
Officers2
Name and
year of birth | Position held and
length of service | Principal occupations during past five years or longer |
Andrew Owen
(Born 1960) | President,
since 2017 | President and Chief Executive Officer of Allspring Funds Management, LLC since 2017 and Head of Global Fund Governance of Allspring Global Investments since 2022. Prior thereto, co-president of Galliard Capital Management, LLC, an affiliate of Allspring Funds Management, LLC, from 2019 to 2022 and Head of Affiliated Managers, Allspring Global Investments, from 2014 to 2019 and Executive Vice President responsible for marketing, investments and product development for Allspring Funds Management, LLC, from 2009 to 2014. |
Jeremy DePalma
(Born 1974) | Treasurer,
since 2012
(for certain funds in
the Fund Complex);
since 2021 (for
the remaining funds in the
Fund Complex) | Senior Vice President of Allspring Funds Management, LLC since 2009. Senior Vice President of Evergreen Investment Management Company, LLC from 2008 to 2010 and head of the Fund Reporting and Control Team within Fund Administration from 2005 to 2010. |
Christopher Baker
(Born 1976) | Chief Compliance Officer, since 2022 | Global Chief Compliance Officer for Allspring Global Investments since 2022. Prior thereto, Chief Compliance Officer for State Street Global Advisors from 2018 to 2021. Senior Compliance Officer for the State Street divisions of Alternative Investment Solutions, Sector Solutions, and Global Marketing from 2015 to 2018. From 2010 to 2015 Vice President, Global Head of Investment and Marketing Compliance for State Street Global Advisors. |
Matthew Prasse
(Born 1983) | Chief Legal Officer, since 2022; Secretary, since 2021 | Senior Counsel of the Allspring Legal Department since 2021. Senior Counsel of the Wells Fargo Legal Department from 2018 to 2021. Previously, Counsel for Barings LLC from 2015 to 2018. Prior to joining Barings, Associate at Morgan, Lewis & Bockius LLP from 2008 to 2015. |
1 The Statement of Additional Information includes additional information about the Trustees and is available, without charge, upon request, by calling 1-800-222-8222 or by visiting the website at allspringglobal.com.
2 For those Officers with tenures at Allspring Global Investments and/or Allspring Funds Management, LLC that began prior to 2021, such tenures include years of service during which these businesses/entities were known as Wells Fargo Asset Management and Wells Fargo Funds Management, LLC, respectively.
54 | Allspring Core Plus Bond Fund
For more information
More information about Allspring Funds is available free upon request. To obtain literature, please write, visit the Fund's website, or call:
Allspring Funds
P.O. Box 219967
Kansas City, MO 64121-9967
Website: allspringglobal.com
Individual investors: 1-800-222-8222
Retail investment professionals: 1-888-877-9275
Institutional investment professionals: 1-800-260-5969
This report and the financial statements contained herein are submitted for the general information of the shareholders of the Fund. If this report is used for promotional purposes, distribution of the report must be accompanied or preceded by a current prospectus. Before investing, please consider the investment objectives, risks, charges, and expenses of the investment. For a current prospectus and, if available, a summary prospectus, containing this information, call
1-800-222-8222 or visit the Fund's website at allspringglobal.com. Read the prospectus carefully before you invest or send money.
Allspring Global InvestmentsTM is the trade name for the asset management firms of Allspring Global Investments Holdings, LLC, a holding company indirectly owned by certain private funds of GTCR LLC and Reverence Capital Partners, L.P. These firms include but are not limited to Allspring Global Investments, LLC, and Allspring Funds Management, LLC. Certain products managed by Allspring entities are distributed by Allspring Funds Distributor, LLC (a broker-dealer and Member FINRA/SIPC).
This material is for general informational and educational purposes only and is NOT intended to provide investment advice or a recommendation of any kind - including a recommendation for any specific investment, strategy, or plan.
© 2023 Allspring Global Investments Holdings, LLC. All rights reserved.
ALL-03102023-2qlpvbov 04-23
SAR0059 02-23
Semi-Annual Report
February 28, 2023
Allspring
Government Securities Fund
The views expressed and any forward-looking statements are as of February 28, 2023, unless otherwise noted, and are those of the Fund's portfolio managers and/or Allspring Global Investments. Discussions of individual securities or the markets generally are not intended as individual recommendations. Future events or results may vary significantly from those expressed in any forward-looking statements. The views expressed are subject to change at any time in response to changing circumstances in the market. Allspring Global Investments disclaims any obligation to publicly update or revise any views expressed or forward-looking statements.
Allspring Government Securities Fund | 1
Letter to shareholders (unaudited)
Andrew Owen
President
Allspring Funds
Dear Shareholder:
We are pleased to offer you this semi-annual report for the Allspring Government Securities Fund for the six-month period that ended February 28, 2023. Globally, stocks and bonds experienced heightened volatility through the challenging period. Earlier tailwinds provided by global stimulus programs, vaccination rollouts, and recovering consumer and corporate sentiment were wiped away by the highest rate of inflation in four decades as well as the impact of ongoing aggressive central bank rate hikes and the prospect of more rate hikes. Compounding these concerns were the global reverberations of the Russia-Ukraine war and the impact of China’s strict COVID-19 lockdowns.
For the six-month period, stocks and bonds had mixed results, with non-U.S. equities––both developed market and emerging market––outperforming U.S. stocks overall. Bonds––both U.S. and non-U.S.––began to recover from sustained aggressive interest rate increases. After suffering deep and broad losses over the past year, recent fixed income performance benefited from a base of higher yields that can now generate higher income. For the period, U.S. stocks, based on the S&P 500 Index,1 returned 1.26%. International stocks, as measured by the MSCI ACWI ex USA Index (Net),2 returned 7.30%, while the MSCI EM Index (Net) (USD)3 lost 2.29%. Among bond indexes, the Bloomberg U.S. Aggregate Bond Index4 returned -2.13%, the Bloomberg Global Aggregate ex-USD Index (unhedged)5 returned -0.11%, the Bloomberg Municipal Bond Index6 gained 0.66%, and the ICE BofA U.S. High Yield Index7 returned 2.41%.
The Russia-Ukraine war, high inflation, and central bank rate hikes rocked markets
A challenging calendar year for investors continued in September as all asset classes suffered major losses. Central banks kept up their battle against rapidly rising prices with more rate hikes. The strength of the U.S. dollar weighed on results for investors holding non-U.S.-dollar assets. U.S. mortgage rates jumped to near 7% on 30-year fixed-rate mortgages; the decreased housing affordability began to cool demand somewhat. The U.K. experienced a sharp sell-off of government bonds and the British pound in September as investors panicked in response to a new government budget that was seen as financially unsound. The Bank of England (BoE) then stepped in and bought long-dated government bonds.
“ A challenging calendar year for investors continued in September as all asset classes suffered major losses.”
| 1 | The S&P 500 Index consists of 500 stocks chosen for market size, liquidity, and industry group representation. It is a market-value-weighted index with each stock's weight in the index proportionate to its market value. You cannot invest directly in an index. |
| 2 | The Morgan Stanley Capital International (MSCI) All Country World Index (ACWI) ex USA Index (Net) is a free-float-adjusted market-capitalization-weighted index that is designed to measure the equity market performance of developed and emerging markets, excluding the U.S. Source: MSCI. MSCI makes no express or implied warranties or representations and shall have no liability whatsoever with respect to any MSCI data contained herein. The MSCI data may not be further redistributed or used as a basis for other indexes or any securities or financial products. This report is not approved, reviewed, or produced by MSCI. You cannot invest directly in an index. |
| 3 | The MSCI Emerging Markets (EM) Index (Net) (USD) is a free-float-adjusted market-capitalization-weighted index that is designed to measure equity market performance of emerging markets. You cannot invest directly in an index. |
| 4 | The Bloomberg U.S. Aggregate Bond Index is a broad-based benchmark that measures the investment-grade, U.S.-dollar-denominated, fixed-rate taxable bond market, including Treasuries, government-related and corporate securities, mortgage-backed securities (agency fixed-rate and hybrid adjustable-rate mortgage pass-throughs), asset-backed securities, and commercial mortgage-backed securities. You cannot invest directly in an index. |
| 5 | The Bloomberg Global Aggregate ex-USD Index (unhedged) is an unmanaged index that provides a broad-based measure of the global investment-grade fixed-income markets excluding the U.S.-dollar-denominated debt market. You cannot invest directly in an index. |
| 6 | The Bloomberg Municipal Bond Index is an unmanaged index composed of long-term tax-exempt bonds with a minimum credit rating of Baa. You cannot invest directly in an index. |
| 7 | The ICE BofA U.S. High Yield Index is a market-capitalization-weighted index of domestic and Yankee high-yield bonds. The index tracks the performance of high-yield securities traded in the U.S. bond market. You cannot invest directly in an index. Copyright 2023. ICE Data Indices, LLC. All rights reserved. |
2 | Allspring Government Securities Fund
Letter to shareholders (unaudited)
Equities had a reprieve in October. Value stocks and small caps fared best. Globally, developed markets outpaced emerging market equities, which were hurt by weakness among Chinese stocks. Central banks continued to try to curtail high inflation with aggressive interest rate hikes. Geopolitical risks persisted, including the ongoing Russia-Ukraine war and economic, financial market, and political turmoil in the U.K. Concerns over Europe’s energy crisis eased thanks to unseasonably warm weather and plentiful gas on hand. The U.S. labor market continued its resilience against rising prices as unemployment remained near a record low.
Stocks and bonds rallied in November. Economic news was encouraging, driven by U.S. labor market strength. Although central banks kept raising rates, hopes rose for an easing in the pace of rate hikes and a possible end to central bank monetary tightening in 2023. Although inflation remained at record highs in the eurozone, we began to see signs of a possible decline in inflationary pressures as U.S. inflation moderated, with a 7.1% annual price rise in November and a monthly price increase of just 0.1%. China’s economic data remained weak, reflecting its zero-COVID-19 policy.
Financial markets cooled in December, with U.S. equities posting negative overall results in response to a weakening U.S. dollar. Fixed income securities ended one of their worst years ever with flat overall monthly returns as markets weighed the hopes for an end to the monetary tightening cycle with the reality that central banks had not completed their jobs yet. U.S. Consumer Price Index (CPI)1 data showed a strong consistent trend downward, which brought down the 12-month CPI to 6.5% in December from 9.1% in June. Other countries and regions reported still-high but declining inflation rates as the year winded down.
The year 2023 began with a rally across global equities and fixed income securities. Investor optimism rose in response to data indicating declining inflation rates and the reopening of China’s economy with the abrupt end to its zero-COVID-19 policy. The U.S. reported surprisingly strong job gains––employers added more than 500,000 jobs––and unemployment fell to 3.4%, the lowest level since 1969. Meanwhile, wage growth, seen as a potential contributor to ongoing high inflation, continued to moderate. All eyes remained fixed on the Federal Reserve (Fed) and on how many more rate hikes remain in this tightening cycle. The 0.25% federal funds rate hike announced in January was the Fed’s smallest rate increase since March 2022.
Financial markets declined in February as investors responded unfavorably to resilient economic data. The takeaway: Central banks will likely continue their monetary tightening cycle for longer than markets had priced in. In this environment—where strong economic data is seen as bad news—the resilient U.S. labor market was seen as a negative while the inflation rate has not been falling quickly enough for the Fed, which raised interest rates by 0.25% in early February. Meanwhile, the BoE and the European Central Bank both raised rates by 0.50%. At this stage in the economic cycle, the overriding question remained: “What will central banks do?” In February, the answer appeared to be: “Move rates higher for longer.”
| 1 | The Consumer Price Index (CPI) is a measure of the average change over time in the prices paid by urban consumers for a market basket of consumer goods and services. You cannot invest directly in an index. |
Allspring Government Securities Fund | 3
Letter to shareholders (unaudited)
Don’t let short-term uncertainty derail long-term investment goals.
Periods of investment uncertainty can present challenges, but experience has taught us that maintaining long-term investment goals can be an effective way to plan for the future. To help you create a sound strategy based on your personal goals and risk tolerance, Allspring Funds offers more than 100 mutual funds spanning a wide range of asset classes and investment styles. Although diversification cannot guarantee an investment profit or prevent losses, we believe it can be an effective way to manage investment risk and potentially smooth out overall portfolio performance. We encourage investors to know their investments and to understand that appropriate levels of risk-taking may unlock opportunities.
Thank you for choosing to invest with Allspring Funds. We appreciate your confidence in us and remain committed to helping you meet your financial needs.
Sincerely,
Andrew Owen
President
Allspring Funds
For further information about your fund, contact your investment professional, visit our website at allspringglobal.com, or call us directly at 1-800-222-8222.
4 | Allspring Government Securities Fund
This page is intentionally left blank.
Performance highlights (unaudited)
| Investment objective | The Fund seeks current income. |
| Manager | Allspring Funds Management, LLC |
| Subadviser | Allspring Global Investments, LLC |
| Portfolio managers | Christopher Y. Kauffman, CFA®‡, Michal Stanczyk |
| Average annual total returns (%) as of February 28, 2023 |
| | | Including sales charge | | Excluding sales charge | | Expense ratios1 (%) |
| | Inception date | 1 year | 5 year | 10 year | | 1 year | 5 year | 10 year | | Gross | Net 2 |
| Class A (SGVDX) | 8-31-1999 | -14.38 | -1.09 | -0.12 | | -10.34 | -0.18 | 0.34 | | 0.90 | 0.85 |
| Class C (WGSCX) | 12-26-2002 | -12.02 | -0.93 | -0.25 | | -11.02 | -0.93 | -0.25 | | 1.65 | 1.60 |
| Administrator Class (WGSDX) | 4-8-2005 | – | – | – | | -10.25 | 0.01 | 0.55 | | 0.84 | 0.64 |
| Institutional Class (SGVIX) | 8-31-1999 | – | – | – | | -10.02 | 0.20 | 0.72 | | 0.57 | 0.48 |
| Bloomberg U.S. Aggregate ex Credit Index3 | – | – | – | – | | -9.53 | 0.25 | 0.75 | | – | – |
| Bloomberg U.S. Government Intermediate Bond Index4 | – | – | – | – | | -6.27 | 0.68 | 0.67 | | – | – |
Figures quoted represent past performance, which is no guarantee of future results, and do not reflect taxes that a shareholder may pay on an investment in a fund. Investment return and principal value of an investment will fluctuate so that an investor’s shares, when redeemed, may be worth more or less than their original cost. Performance shown without sales charges would be lower if sales charges were reflected. Current performance may be lower or higher than the performance data quoted, which assumes the reinvestment of dividends and capital gains. Current month-end performance is available on the Fund’s website, allspringglobal.com.
Index returns do not include transaction costs associated with buying and selling securities, any mutual fund fees or expenses, or any taxes. It is not possible to invest directly in an index.
For Class A shares, the maximum front-end sales charge is 4.50%. For Class C shares, the maximum contingent deferred sales charge is 1.00%. Performance including a contingent deferred sales charge assumes the sales charge for the corresponding time period. Administrator Class and Institutional Class shares are sold without a front-end sales charge or contingent deferred sales charge.
| 1 | Reflects the expense ratios as stated in the most recent prospectuses. The expense ratios shown are subject to change and may differ from the annualized expense ratios shown in the financial highlights of this report. |
| 2 | The manager has contractually committed through December 31, 2023, to waive fees and/or reimburse expenses to the extent necessary to cap total annual fund operating expenses after fee waivers at 0.85% for Class A, 1.60% for Class C, 0.64% for Administrator Class, and 0.48% for Institutional Class. Brokerage commissions, stamp duty fees, interest, taxes, acquired fund fees and expenses (if any), and extraordinary expenses are excluded from the expense caps. Prior to or after the commitment expiration date, the caps may be increased or the commitment to maintain the caps may be terminated only with the approval of the Board of Trustees. Without these caps, the Fund’s returns would have been lower. The expense ratio paid by an investor is the net expense ratio (the total annual fund operating expenses after fee waivers) as stated in the prospectuses. |
| 3 | The Bloomberg U.S. Aggregate ex Credit Index is composed of the Bloomberg U.S. Government Index and the Bloomberg U.S. Mortgage-Backed Securities Index and includes Treasury issues, agency issues, and mortgage-backed securities. You cannot invest directly in an index. |
| 4 | The Bloomberg U.S. Government Intermediate Bond Index is an unmanaged index composed of U.S. government securities with maturities in the 1- to 10-year range, including securities issued by the U.S. Treasury and U.S. government agencies. You cannot invest directly in an index. |
Bond values fluctuate in response to the financial condition of individual issuers, general market and economic conditions, and changes in interest rates. Changes in market conditions and government policies may lead to periods of heightened volatility in the bond market and reduced liquidity for certain bonds held by the Fund. In general, when interest rates rise, bond values fall and investors may lose principal value. Interest rate changes and their impact on the Fund and its share price can be sudden and unpredictable. The use of derivatives may reduce returns and/or increase volatility. Securities issued by U.S. government agencies or government-sponsored entities may not be guaranteed by the U.S. Treasury. Certain investment strategies tend to increase the total risk of an investment (relative to the broader market). This fund is exposed to mortgage- and asset-backed securities risk. The U.S. government guarantee applies to certain underlying securities and not to shares of the Fund. Consult the Fund’s prospectus for additional information on these and other risks.
| ‡ | CFA® and Chartered Financial Analyst® are trademarks owned by CFA Institute. |
6 | Allspring Government Securities Fund
Performance highlights (unaudited)
| Ten largest holdings (%) as of February 28, 20231 |
| U.S. Treasury Note, 2.75%, 4-30-2027 | 4.61 |
| FNMA, 2.00%, 2-1-2052 | 3.27 |
| State of Israel, 5.50%, 12-4-2023 | 3.27 |
| U.S. Treasury Note, 4.13%, 11-15-2032 | 2.73 |
| FNMA, 2.00%, 2-1-2052 | 2.63 |
| Resolution Funding Corporation STRIPS, 0.00%, 1-15-2030 | 2.47 |
| FNMA, 2.00%, 2-1-2052 | 2.30 |
| FNMA, 4.50%, 9-1-2052 | 2.28 |
| STRIPS, 0.00%, 5-15-2039 | 2.21 |
| GNMA, 2.50%, 4-20-2052 | 2.04 |
| 1 | Figures represent the percentage of the Fund's net assets. Holdings are subject to change and may have changed since the date specified. |
| Portfolio composition as of February 28, 20231 |
| 1 | Figures represent the percentage of the Fund's long-term investments. Allocations are subject to change and may have changed since the date specified. |
Allspring Government Securities Fund | 7
Fund expenses (unaudited)
As a shareholder of the Fund, you incur two types of costs: (1) transaction costs, including sales charges (loads) on purchase payments and contingent deferred sales charges (if any) on redemptions and (2) ongoing costs, including management fees, distribution (12b-1) and/or shareholder servicing fees, and other Fund expenses. This example is intended to help you understand your ongoing costs (in dollars) of investing in the Fund and to compare these costs with the ongoing costs of investing in other mutual funds.
The example is based on an investment of $1,000 invested at the beginning of the six-month period and held for the entire period from September 1, 2022 to February 28, 2023.
Actual expenses
The “Actual” line of the table below provides information about actual account values and actual expenses. You may use the information in this line, together with the amount you invested, to estimate the expenses that you paid over the period. Simply divide your account value by $1,000 (for example, an $8,600 account value divided by $1,000 = 8.6), then multiply the result by the number in the “Actual” line under the heading entitled “Expenses paid during period” for your applicable class of shares to estimate the expenses you paid on your account during this period.
Hypothetical example for comparison purposes
The “Hypothetical” line of the table below provides information about hypothetical account values and hypothetical expenses based on the Fund’s actual expense ratio and an assumed rate of return of 5% per year before expenses, which is not the Fund’s actual return. The hypothetical account values and expenses may not be used to estimate the actual ending account balance or expenses you paid for the period. You may use this information to compare the ongoing costs of investing in the Fund and other funds. To do so, compare this 5% hypothetical example with the 5% hypothetical examples that appear in the shareholder reports of the other funds.
Please note that the expenses shown in the table are meant to highlight your ongoing costs only and do not reflect any transactional costs, such as sales charges (loads) and contingent deferred sales charges. Therefore, the “Hypothetical” line of the table is useful in comparing ongoing costs only, and will not help you determine the relative total costs of owning different funds. In addition, if these transactional costs were included, your costs would have been higher.
| | Beginning
account value
9-1-2022 | Ending
account value
2-28-2023 | Expenses
paid during
the period1 | Annualized net
expense ratio |
| Class A | | | | |
| Actual | $1,000.00 | $ 970.44 | $4.15 | 0.85% |
| Hypothetical (5% return before expenses) | $1,000.00 | $1,020.58 | $4.26 | 0.85% |
| Class C | | | | |
| Actual | $1,000.00 | $ 967.77 | $7.81 | 1.60% |
| Hypothetical (5% return before expenses) | $1,000.00 | $1,016.86 | $8.00 | 1.60% |
| Administrator Class | | | | |
| Actual | $1,000.00 | $ 971.41 | $3.13 | 0.64% |
| Hypothetical (5% return before expenses) | $1,000.00 | $1,021.62 | $3.21 | 0.64% |
| Institutional Class | | | | |
| Actual | $1,000.00 | $ 973.18 | $2.35 | 0.48% |
| Hypothetical (5% return before expenses) | $1,000.00 | $1,022.41 | $2.41 | 0.48% |
1 Expenses paid is equal to the annualized net expense ratio of each class multiplied by the average account value over the period, multiplied by 181 divided by 365 (to reflect the one-half-year period).
8 | Allspring Government Securities Fund
Portfolio of investments—February 28, 2023 (unaudited)
| | | Interest
rate | Maturity
date | Principal | Value |
| Agency securities: 77.93% | | | | | | |
| FHLB | | 5.50% | 7-15-2036 | $ | 1,150,000 | $ 1,285,117 |
| FHLB | | 5.63 | 3-14-2036 | | 6,020,000 | 6,668,127 |
| FHLMC ¤ | | 0.00 | 9-15-2036 | | 2,500,000 | 1,373,620 |
| FHLMC ¤ | | 0.00 | 11-15-2038 | | 1,575,000 | 780,340 |
| FHLMC | | 2.50 | 11-1-2051 | | 9,783,254 | 8,341,754 |
| FHLMC | | 3.00 | 6-1-2050 | | 530,287 | 475,345 |
| FHLMC | | 3.00 | 7-1-2050 | | 1,342,383 | 1,203,309 |
| FHLMC | | 3.00 | 8-1-2050 | | 651,090 | 583,625 |
| FHLMC | | 3.00 | 8-1-2050 | | 2,836,074 | 2,514,041 |
| FHLMC (3 Year Treasury Constant Maturity +2.28%) ± | | 3.34 | 5-1-2026 | | 3,119 | 3,073 |
| FHLMC (1 Year Treasury Constant Maturity +2.25%) ± | | 3.38 | 6-1-2032 | | 3,556 | 3,508 |
| FHLMC | | 3.50 | 8-1-2045 | | 1,278,405 | 1,192,076 |
| FHLMC | | 3.50 | 11-1-2045 | | 2,245,074 | 2,094,197 |
| FHLMC | | 3.50 | 12-1-2045 | | 1,612,729 | 1,502,573 |
| FHLMC | | 3.50 | 12-1-2045 | | 430,565 | 401,891 |
| FHLMC (1 Year Treasury Constant Maturity +2.16%) ± | | 3.61 | 10-1-2026 | | 34,648 | 34,015 |
| FHLMC (12 Month LIBOR +1.68%) ± | | 3.67 | 7-1-2038 | | 470,706 | 476,031 |
| FHLMC (11th District COFI +1.25%) ± | | 3.99 | 7-1-2032 | | 142,606 | 137,766 |
| FHLMC | | 4.00 | 6-1-2044 | | 1,195,019 | 1,134,754 |
| FHLMC | | 4.00 | 5-1-2049 | | 718,277 | 685,101 |
| FHLMC | | 4.00 | 9-1-2049 | | 264,993 | 251,714 |
| FHLMC (12 Month LIBOR +1.91%) ± | | 4.16 | 9-1-2031 | | 2,209 | 2,178 |
| FHLMC (12 Month LIBOR +1.91%) ± | | 4.16 | 9-1-2031 | | 29,737 | 29,355 |
| FHLMC | | 4.50 | 3-1-2042 | | 98,891 | 98,290 |
| FHLMC | | 4.50 | 9-1-2044 | | 1,420,934 | 1,399,560 |
| FHLMC | | 4.50 | 9-1-2049 | | 2,914,195 | 2,848,070 |
| FHLMC (30 Day Average U.S. SOFR +0.26%) ± | | 4.56 | 7-1-2031 | | 3,013,000 | 2,980,595 |
| FHLMC | | 5.00 | 6-1-2026 | | 82,552 | 82,498 |
| FHLMC | | 5.00 | 8-1-2040 | | 414,487 | 418,146 |
| FHLMC | | 5.00 | 7-1-2052 | | 2,617,396 | 2,579,294 |
| FHLMC | | 5.50 | 7-1-2035 | | 1,303,185 | 1,338,742 |
| FHLMC | | 5.50 | 12-1-2038 | | 719,597 | 740,028 |
| FHLMC | | 6.00 | 10-1-2032 | | 11,565 | 11,947 |
| FHLMC (1 Year Treasury Constant Maturity +2.13%) ± | | 6.38 | 1-1-2026 | | 7,102 | 7,003 |
| FHLMC | | 6.50 | 9-1-2028 | | 5,792 | 6,005 |
| FHLMC | | 6.50 | 7-1-2031 | | 1 | 1 |
| FHLMC | | 7.00 | 12-1-2023 | | 159 | 159 |
| FHLMC | | 7.00 | 12-1-2026 | | 148 | 149 |
| FHLMC | | 7.00 | 4-1-2029 | | 612 | 627 |
| FHLMC | | 7.00 | 5-1-2029 | | 2,798 | 2,863 |
| FHLMC | | 7.00 | 4-1-2032 | | 38,916 | 40,255 |
| FHLMC | | 7.50 | 11-1-2031 | | 54,438 | 54,204 |
| FHLMC | | 7.50 | 4-1-2032 | | 83,751 | 85,723 |
| FHLMC | | 8.00 | 8-1-2023 | | 66 | 66 |
| FHLMC | | 8.00 | 6-1-2024 | | 431 | 433 |
| FHLMC | | 8.00 | 6-1-2024 | | 646 | 646 |
| FHLMC | | 8.00 | 6-1-2024 | | 1,114 | 1,113 |
| FHLMC | | 8.00 | 8-1-2026 | | 3,497 | 3,574 |
| FHLMC | | 8.00 | 11-1-2026 | | 3,838 | 3,915 |
| FHLMC | | 8.00 | 11-1-2028 | | 1,339 | 1,353 |
| FHLMC | | 8.50 | 12-1-2025 | | 1,864 | 1,887 |
| FHLMC | | 8.50 | 5-1-2026 | | 305 | 305 |
| FHLMC | | 8.50 | 8-1-2026 | | 2,178 | 2,176 |
The accompanying notes are an integral part of these financial statements.
Allspring Government Securities Fund | 9
Portfolio of investments—February 28, 2023 (unaudited)
| | | Interest
rate | Maturity
date | Principal | Value |
| Agency securities (continued) | | | | | | |
| FHLMC Multifamily Structured Pass-Through Certificates Series KIR2 Class A1 | | 2.75% | 3-25-2027 | $ | 3,286,123 | $ 3,127,252 |
| FHLMC Multifamily Structured Pass-Through Certificates Series KW02 Class A1 | | 2.90 | 4-25-2026 | | 4,949,468 | 4,815,154 |
| FHLMC Multifamily Structured Pass-Through Certificates Series KW03 Class A1 | | 2.62 | 12-25-2026 | | 2,627,008 | 2,531,673 |
| FHLMC Multifamily Structured Pass-Through Certificates Series K039 Class A2 | | 3.30 | 7-25-2024 | | 325,000 | 317,289 |
| FHLMC Multifamily Structured Pass-Through Certificates Series K075 Class A2 ±± | | 3.65 | 2-25-2028 | | 4,370,000 | 4,195,316 |
| FHLMC Multifamily Structured Pass-Through Certificates Series K153 Class A3 ±± | | 3.12 | 10-25-2031 | | 160,000 | 144,115 |
| FHLMC Multifamily Structured Pass-Through Certificates Series KF80 Class AS (30 Day Average U.S. SOFR +0.51%) ± | | 4.82 | 6-25-2030 | | 1,116,603 | 1,110,607 |
| FHLMC Series 2015-SC01 Class 1A | | 3.50 | 5-25-2045 | | 313,392 | 288,216 |
| FHLMC Series 2733 Class FB (1 Month LIBOR +0.60%) ± | | 5.19 | 10-15-2033 | | 198,929 | 199,810 |
| FHLMC Series 3070 Class FT (1 Month LIBOR +0.35%) ± | | 4.94 | 11-15-2035 | | 387,153 | 385,497 |
| FHLMC Series 3614 Class QB | | 4.00 | 12-15-2024 | | 227,065 | 224,225 |
| FHLMC Series 3830 Class FD (1 Month LIBOR +0.36%) ± | | 4.95 | 3-15-2041 | | 164,634 | 163,715 |
| FHLMC Series 3906 Class EA | | 3.00 | 5-15-2026 | | 35,582 | 35,331 |
| FHLMC Series 4057 Class FN (1 Month LIBOR +0.35%) ± | | 4.94 | 12-15-2041 | | 124,071 | 123,182 |
| FHLMC Series 4068 Class FK (1 Month LIBOR +0.30%) ± | | 4.89 | 6-15-2040 | | 53,724 | 53,646 |
| FHLMC Series 4093 Class FB (1 Month LIBOR +0.35%) ± | | 4.94 | 7-15-2039 | | 147,885 | 147,744 |
| FHLMC Series 4159 Class AF (1 Month LIBOR +1.18%) ± | | 5.77 | 12-15-2036 | | 166,307 | 171,430 |
| FHLMC Series 4218 Class DF (1 Month LIBOR +0.25%) ± | | 4.84 | 7-15-2042 | | 207,109 | 203,661 |
| FHLMC Series 4409 Class MA | | 3.00 | 1-15-2054 | | 19,791 | 19,141 |
| FHLMC Series 4604 Class PA | | 3.00 | 1-15-2044 | | 105,155 | 103,293 |
| FHLMC Series 4620 Class AF (1 Month LIBOR +0.44%) ± | | 3.61 | 11-15-2042 | | 1,588,267 | 1,577,935 |
| FHLMC Series T-15 Class A6 (1 Month LIBOR +0.40%) ± | | 5.02 | 11-25-2028 | | 35,660 | 35,579 |
| FHLMC Series T-35 Class A (1 Month LIBOR +0.28%) ± | | 4.90 | 9-25-2031 | | 322,981 | 321,249 |
| FHLMC Series T-42 Class A6 | | 9.50 | 2-25-2042 | | 499,153 | 550,233 |
| FHLMC Series T-55 Class 2A1 ±± | | 3.27 | 3-25-2043 | | 229,590 | 213,890 |
| FHLMC Series T-56 Class A4 | | 6.00 | 5-25-2043 | | 2,873,344 | 2,914,381 |
| FHLMC Series T-57 Class 1A1 | | 6.50 | 7-25-2043 | | 665,595 | 688,288 |
| FHLMC Series T-57 Class 2A1 ±± | | 3.69 | 7-25-2043 | | 1,261,746 | 1,169,724 |
| FHLMC Series T-62 Class 1A1 (12 Month Treasury Average +1.20%) ± | | 3.99 | 10-25-2044 | | 485,497 | 458,461 |
| FHLMC Series T-67 Class 1A1C ±± | | 3.68 | 3-25-2036 | | 458,480 | 445,474 |
| FHLMC Series T-67 Class 2A1C ±± | | 3.74 | 3-25-2036 | | 771,611 | 753,981 |
| FNMA ¤ | | 0.00 | 7-15-2037 | | 7,810,000 | 4,047,427 |
| FNMA ¤ | | 0.00 | 8-6-2038 | | 6,510,000 | 3,288,302 |
| FNMA | | 1.38 | 7-1-2030 | | 3,983,601 | 3,266,632 |
| FNMA | | 1.65 | 6-1-2030 | | 1,382,357 | 1,153,056 |
| FNMA | | 1.65 | 7-1-2030 | | 2,376,761 | 1,967,967 |
| FNMA | | 1.66 | 7-1-2032 | | 4,037,362 | 3,261,961 |
| FNMA | | 1.97 | 5-1-2030 | | 4,351,276 | 3,712,785 |
| FNMA | | 2.00 | 2-1-2052 | | 15,599,018 | 12,719,919 |
| FNMA | | 2.00 | 2-1-2052 | | 19,386,324 | 15,818,920 |
| FNMA | | 2.00 | 2-1-2052 | | 13,621,223 | 11,116,035 |
| FNMA | | 2.32 | 1-1-2026 | | 3,955,280 | 3,703,962 |
| FNMA | | 2.35 | 2-1-2032 | | 2,259,503 | 1,937,182 |
| FNMA (12 Month LIBOR +1.62%) ± | | 2.39 | 8-1-2050 | | 1,493,924 | 1,339,186 |
| FNMA | | 2.50 | 9-1-2050 | | 375,957 | 320,834 |
| FNMA | | 2.50 | 1-1-2052 | | 3,073,643 | 2,606,392 |
| FNMA %% | | 2.50 | 3-13-2053 | | 6,020,000 | 5,098,893 |
The accompanying notes are an integral part of these financial statements.
10 | Allspring Government Securities Fund
Portfolio of investments—February 28, 2023 (unaudited)
| | | Interest
rate | Maturity
date | Principal | Value |
| Agency securities (continued) | | | | | | |
| FNMA | | 2.51% | 9-1-2031 | $ | 5,086,059 | $ 4,427,587 |
| FNMA (12 Month LIBOR +1.61%) ± | | 2.52 | 5-1-2046 | | 713,084 | 732,322 |
| FNMA | | 2.60 | 12-1-2023 | | 1,835,037 | 1,793,372 |
| FNMA | | 2.65 | 2-1-2032 | | 2,858,876 | 2,511,128 |
| FNMA | | 2.65 | 2-1-2032 | | 2,223,570 | 1,953,099 |
| FNMA | | 2.75 | 9-1-2031 | | 890,926 | 786,722 |
| FNMA | | 2.86 | 7-1-2029 | | 972,936 | 884,360 |
| FNMA | | 3.00 | 5-1-2027 | | 274,124 | 263,967 |
| FNMA | | 3.00 | 6-1-2034 | | 2,281,207 | 2,132,357 |
| FNMA | | 3.00 | 4-1-2045 | | 31,085 | 28,075 |
| FNMA | | 3.00 | 11-1-2045 | | 2,738,668 | 2,469,490 |
| FNMA | | 3.00 | 12-1-2045 | | 6,464,418 | 5,831,737 |
| FNMA | | 3.00 | 12-1-2046 | | 241,968 | 218,210 |
| FNMA | | 3.00 | 9-1-2050 | | 3,343,983 | 2,969,032 |
| FNMA (11th District COFI +1.29%) ± | | 3.28 | 5-1-2036 | | 347,288 | 335,361 |
| FNMA (1 Year Treasury Constant Maturity +2.22%) ± | | 3.34 | 6-1-2032 | | 64,180 | 63,506 |
| FNMA (11th District COFI +1.25%) ± | | 3.37 | 9-1-2027 | | 65,505 | 64,150 |
| FNMA | | 3.48 | 3-1-2029 | | 873,752 | 825,917 |
| FNMA | | 3.50 | 4-1-2034 | | 3,094,391 | 2,984,051 |
| FNMA %% | | 3.50 | 3-16-2038 | | 6,880,000 | 6,557,500 |
| FNMA | | 3.50 | 2-1-2043 | | 17,004 | 15,953 |
| FNMA | | 3.50 | 2-1-2045 | | 380,003 | 356,073 |
| FNMA | | 3.50 | 4-1-2045 | | 1,618,498 | 1,510,042 |
| FNMA | | 3.50 | 8-1-2045 | | 142,136 | 132,464 |
| FNMA | | 3.50 | 12-1-2045 | | 591,128 | 551,394 |
| FNMA | | 3.50 | 2-1-2046 | | 554,088 | 514,951 |
| FNMA (11th District COFI +1.26%) ± | | 3.70 | 5-1-2036 | | 155,776 | 152,633 |
| FNMA (1 Year Treasury Constant Maturity +2.24%) ± | | 3.78 | 12-1-2040 | | 16,210 | 15,935 |
| FNMA (1 Year Treasury Constant Maturity +2.21%) ± | | 3.85 | 9-1-2035 | | 131,060 | 133,330 |
| FNMA | | 3.86 | 3-1-2029 | | 795,915 | 767,417 |
| FNMA (12 Month LIBOR +1.77%) ± | | 3.92 | 7-1-2044 | | 74,199 | 75,745 |
| FNMA (12 Month LIBOR +1.73%) ± | | 3.98 | 9-1-2036 | | 160,115 | 161,621 |
| FNMA %% | | 4.00 | 3-16-2038 | | 6,785,000 | 6,615,375 |
| FNMA (1 Year Treasury Constant Maturity +2.20%) ± | | 4.00 | 12-1-2040 | | 53,723 | 54,598 |
| FNMA | | 4.00 | 4-1-2046 | | 4,376,238 | 4,196,778 |
| FNMA | | 4.00 | 3-1-2047 | | 1,016,118 | 974,437 |
| FNMA | | 4.00 | 9-1-2048 | | 79,452 | 75,799 |
| FNMA %% | | 4.00 | 3-13-2053 | | 3,035,000 | 2,848,632 |
| FNMA (1 Year Treasury Constant Maturity +2.20%) ± | | 4.02 | 12-1-2034 | | 143,759 | 140,395 |
| FNMA (12 Month LIBOR +1.78%) ± | | 4.03 | 8-1-2036 | | 446,936 | 456,893 |
| FNMA (1 Year Treasury Constant Maturity +2.24%) ± | | 4.07 | 9-1-2031 | | 15,841 | 15,664 |
| FNMA (1 Year Treasury Constant Maturity +2.19%) ± | | 4.32 | 11-1-2031 | | 66,102 | 64,969 |
| FNMA (1 Year Treasury Constant Maturity +2.42%) ± | | 4.35 | 10-1-2027 | | 29,186 | 28,822 |
| FNMA | | 4.38 | 7-1-2032 | | 1,031,000 | 1,030,488 |
| FNMA | | 4.50 | 1-1-2026 | | 6,793 | 6,736 |
| FNMA | | 4.50 | 10-1-2046 | | 94,356 | 92,653 |
| FNMA | | 4.50 | 9-1-2049 | | 808,524 | 790,671 |
| FNMA | | 4.50 | 9-1-2052 | | 11,428,793 | 11,044,265 |
| FNMA (1 Year Treasury Constant Maturity +2.47%) ± | | 4.59 | 7-1-2026 | | 4,291 | 4,257 |
| FNMA | | 5.00 | 4-1-2023 | | 218 | 217 |
| FNMA | | 5.00 | 6-1-2023 | | 5,861 | 5,850 |
| FNMA | | 5.00 | 3-1-2034 | | 181,215 | 182,593 |
| FNMA | | 5.00 | 8-1-2040 | | 2,283,330 | 2,286,312 |
| FNMA | | 5.00 | 10-1-2040 | | 222,879 | 224,586 |
| FNMA | | 5.00 | 1-1-2042 | | 181,710 | 184,224 |
The accompanying notes are an integral part of these financial statements.
Allspring Government Securities Fund | 11
Portfolio of investments—February 28, 2023 (unaudited)
| | | Interest
rate | Maturity
date | Principal | Value |
| Agency securities (continued) | | | | | | |
| FNMA | | 5.00% | 12-1-2048 | $ | 234,787 | $ 233,740 |
| FNMA | | 5.50 | 11-1-2023 | | 2,422 | 2,416 |
| FNMA | | 5.50 | 1-1-2025 | | 661 | 659 |
| FNMA | | 5.50 | 1-1-2025 | | 2,835 | 2,825 |
| FNMA | | 5.50 | 9-1-2033 | | 867,813 | 890,482 |
| FNMA | | 5.50 | 9-1-2033 | | 274,650 | 281,820 |
| FNMA | | 5.50 | 8-1-2035 | | 291,798 | 298,979 |
| FNMA | | 5.50 | 1-1-2037 | | 227,696 | 233,189 |
| FNMA | | 5.50 | 4-1-2040 | | 601,879 | 615,469 |
| FNMA %% | | 5.50 | 3-13-2053 | | 6,920,000 | 6,908,106 |
| FNMA | | 5.63 | 7-15-2037 | | 1,225,000 | 1,390,878 |
| FNMA (6 Month LIBOR +3.13%) ± | | 5.99 | 7-1-2033 | | 112,531 | 111,360 |
| FNMA | | 6.00 | 3-1-2024 | | 6,160 | 6,234 |
| FNMA | | 6.00 | 1-1-2028 | | 283,090 | 286,486 |
| FNMA | | 6.00 | 2-1-2035 | | 474,713 | 478,231 |
| FNMA | | 6.00 | 11-1-2037 | | 193,957 | 200,862 |
| FNMA | | 6.00 | 7-1-2038 | | 64,218 | 66,661 |
| FNMA | | 6.50 | 3-1-2028 | | 6,188 | 6,168 |
| FNMA | | 6.50 | 12-1-2029 | | 69,869 | 71,662 |
| FNMA | | 6.50 | 11-1-2031 | | 14,987 | 15,371 |
| FNMA | | 6.50 | 7-1-2036 | | 144,636 | 152,713 |
| FNMA | | 6.50 | 7-1-2036 | | 50,416 | 51,704 |
| FNMA | | 7.00 | 11-1-2026 | | 1,276 | 1,278 |
| FNMA | | 7.00 | 1-1-2032 | | 1,150 | 1,142 |
| FNMA | | 7.00 | 2-1-2032 | | 28,212 | 29,129 |
| FNMA | | 7.00 | 10-1-2032 | | 98,779 | 102,208 |
| FNMA | | 7.00 | 2-1-2034 | | 1,365 | 1,394 |
| FNMA | | 7.00 | 4-1-2034 | | 47,460 | 48,427 |
| FNMA | | 7.50 | 9-1-2031 | | 31,458 | 32,233 |
| FNMA | | 7.50 | 2-1-2032 | | 15,539 | 15,974 |
| FNMA | | 7.50 | 10-1-2037 | | 329,278 | 347,006 |
| FNMA | | 8.00 | 5-1-2027 | | 14,796 | 14,785 |
| FNMA | | 8.00 | 6-1-2028 | | 234 | 234 |
| FNMA | | 8.00 | 2-1-2030 | | 16,498 | 16,501 |
| FNMA | | 8.00 | 7-1-2031 | | 259,050 | 264,139 |
| FNMA | | 8.50 | 8-1-2024 | | 418 | 417 |
| FNMA | | 8.50 | 5-1-2026 | | 11,021 | 11,030 |
| FNMA | | 8.50 | 7-1-2026 | | 5,549 | 5,539 |
| FNMA | | 8.50 | 11-1-2026 | | 1,298 | 1,296 |
| FNMA | | 8.50 | 11-1-2026 | | 13,713 | 13,686 |
| FNMA | | 8.50 | 12-1-2026 | | 39,550 | 40,325 |
| FNMA | | 8.50 | 12-1-2026 | | 5,818 | 5,836 |
| FNMA | | 8.50 | 3-1-2027 | | 357 | 358 |
| FNMA | | 8.50 | 6-1-2027 | | 18,122 | 18,126 |
| FNMA | | 9.00 | 1-1-2025 | | 1,986 | 1,989 |
| FNMA | | 9.00 | 3-1-2025 | | 729 | 727 |
| FNMA | | 9.00 | 7-1-2028 | | 892 | 892 |
| FNMA | | 9.50 | 7-1-2028 | | 1,641 | 1,638 |
| FNMA | | 3.50 | 5-1-2052 | | 5,852,204 | 5,330,621 |
| FNMA Series 2000-T6 Class A2 | | 9.50 | 11-25-2040 | | 358,419 | 366,861 |
| FNMA Series 2001-T10 Class A3 | | 9.50 | 12-25-2041 | | 400,414 | 418,993 |
| FNMA Series 2001-T12 Class A3 | | 9.50 | 8-25-2041 | | 105,975 | 112,935 |
| FNMA Series 2002-5 Class F (1 Month LIBOR +0.35%) ± | | 4.97 | 2-25-2032 | | 89,945 | 89,926 |
| FNMA Series 2002-T1 Class A3 | | 7.50 | 11-25-2031 | | 172,068 | 179,077 |
| FNMA Series 2002-T12 Class A5 ±± | | 4.60 | 10-25-2041 | | 486,254 | 456,104 |
The accompanying notes are an integral part of these financial statements.
12 | Allspring Government Securities Fund
Portfolio of investments—February 28, 2023 (unaudited)
| | | Interest
rate | Maturity
date | Principal | Value |
| Agency securities (continued) | | | | | | |
| FNMA Series 2002-T19 Class A1 | | 6.50% | 7-25-2042 | $ | 2,206,128 | $ 2,248,060 |
| FNMA Series 2002-T6 Class A1 | | 6.50 | 7-25-2042 | | 893,889 | 916,040 |
| FNMA Series 2002-W4 Class A4 | | 6.25 | 5-25-2042 | | 310,700 | 314,894 |
| FNMA Series 2003-T2 Class A1 (1 Month LIBOR +0.28%) ± | | 4.35 | 3-25-2033 | | 822,574 | 813,472 |
| FNMA Series 2003-W09 Class A (1 Month LIBOR +0.12%) ± | | 4.75 | 6-25-2033 | | 49,532 | 47,851 |
| FNMA Series 2003-W1 Class 1A1 ±± | | 4.83 | 12-25-2042 | | 413,752 | 394,442 |
| FNMA Series 2003-W11 Class A1 ±± | | 4.72 | 6-25-2033 | | 27,079 | 27,392 |
| FNMA Series 2003-W3 Class 1A4 ±± | | 3.95 | 8-25-2042 | | 1,231,865 | 1,141,885 |
| FNMA Series 2003-W5 Class A (1 Month LIBOR +0.11%) ± | | 4.73 | 4-25-2033 | | 204,530 | 200,506 |
| FNMA Series 2003-W6 Class 6A ±± | | 3.74 | 8-25-2042 | | 559,519 | 535,585 |
| FNMA Series 2003-W6 Class PT4 ±± | | 8.38 | 10-25-2042 | | 717,600 | 768,533 |
| FNMA Series 2003-W8 Class PT1 ±± | | 8.26 | 12-25-2042 | | 273,348 | 281,001 |
| FNMA Series 2004-T1 Class 1A2 | | 6.50 | 1-25-2044 | | 195,727 | 200,165 |
| FNMA Series 2004-W01 Class 2A2 | | 7.00 | 12-25-2033 | | 594,978 | 621,463 |
| FNMA Series 2004-W15 Class 1A3 | | 7.00 | 8-25-2044 | | 315,602 | 329,980 |
| FNMA Series 2005-71 Class DB | | 4.50 | 8-25-2025 | | 26,872 | 26,486 |
| FNMA Series 2006-50 Class BF (1 Month LIBOR +0.40%) ± | | 5.02 | 6-25-2036 | | 465,780 | 463,029 |
| FNMA Series 2007-101 Class A2 (1 Month LIBOR +0.25%) ± | | 4.48 | 6-27-2036 | | 49,506 | 48,832 |
| FNMA Series 2007-W10 Class 2A ±± | | 6.30 | 8-25-2047 | | 141,552 | 140,576 |
| FNMA Series 2008-17 Class DP | | 4.75 | 2-25-2038 | | 602,093 | 585,162 |
| FNMA Series 2010-136 Class FA (1 Month LIBOR +0.50%) ± | | 5.12 | 12-25-2040 | | 547,423 | 539,963 |
| FNMA Series 2011-110 Class FE (1 Month LIBOR +0.40%) ± | | 5.02 | 4-25-2041 | | 47,645 | 47,548 |
| FNMA Series 2011-128 Class FK (1 Month LIBOR +0.35%) ± | | 4.97 | 7-25-2041 | | ��� 101,037 | 100,607 |
| FNMA Series 2011-15 Class HI ♀ | | 5.50 | 3-25-2026 | | 7 | 0 |
| FNMA Series 2013-114 Class LM | | 4.00 | 3-25-2042 | | 673,755 | 633,536 |
| FNMA Series 2014-17 Class FE (1 Month LIBOR +0.55%) ± | | 5.17 | 4-25-2044 | | 1,062,849 | 1,047,979 |
| FNMA Series 2014-20 Class TM ±± | | 4.50 | 4-25-2044 | | 334,570 | 57,793 |
| FNMA Series 2017-M2 Class A2 ±± | | 2.81 | 2-25-2027 | | 6,515,925 | 6,127,873 |
| FNMA Series 2018-M1 Class A2 ±± | | 2.99 | 12-25-2027 | | 630,416 | 589,618 |
| FNMA Series 2018-M13 Class A2 ±± | | 3.74 | 9-25-2030 | | 373,974 | 354,895 |
| FNMA Series 2019-M5 Class A2 | | 3.27 | 2-25-2029 | | 5,126,356 | 4,791,728 |
| FNMA Series 265 Class 2 | | 9.00 | 3-25-2024 | | 2,481 | 2,496 |
| FNMA Series G93-39 Class ZQ | | 6.50 | 12-25-2023 | | 61,035 | 60,885 |
| GNMA %% | | 2.00 | 3-21-2053 | | 9,550,000 | 8,003,907 |
| GNMA | | 2.50 | 3-20-2052 | | 4,906,769 | 4,244,508 |
| GNMA | | 2.50 | 4-20-2052 | | 11,439,781 | 9,895,748 |
| GNMA | | 3.00 | 11-20-2045 | | 2,966,069 | 2,705,762 |
| GNMA | | 3.00 | 4-20-2051 | | 4,491,918 | 4,029,438 |
| GNMA %% | | 3.00 | 3-21-2053 | | 2,665,000 | 2,378,773 |
| GNMA | | 3.50 | 12-20-2047 | | 2,685,530 | 2,505,696 |
| GNMA | | 3.50 | 7-20-2051 | | 2,223,052 | 2,054,616 |
| GNMA | | 4.00 | 11-15-2024 | | 175,240 | 172,915 |
| GNMA | | 4.00 | 12-20-2047 | | 1,823,069 | 1,747,986 |
| GNMA | | 4.25 | 6-20-2036 | | 188,747 | 182,119 |
| GNMA | | 4.50 | 8-20-2049 | | 413,011 | 402,876 |
| GNMA | | 4.50 | 7-20-2052 | | 2,653,958 | 2,575,470 |
| GNMA | | 5.00 | 7-20-2040 | | 408,832 | 413,258 |
| GNMA | | 5.00 | 9-20-2052 | | 2,113,603 | 2,091,274 |
| GNMA | | 6.00 | 8-20-2034 | | 39,450 | 39,096 |
| GNMA | | 6.50 | 12-15-2025 | | 3,057 | 3,134 |
The accompanying notes are an integral part of these financial statements.
Allspring Government Securities Fund | 13
Portfolio of investments—February 28, 2023 (unaudited)
| | | Interest
rate | Maturity
date | Principal | Value |
| Agency securities (continued) | | | | | | |
| GNMA | | 6.50% | 5-15-2029 | $ | 268 | $ 275 |
| GNMA | | 6.50 | 5-15-2031 | | 543 | 557 |
| GNMA | | 6.50 | 9-20-2033 | | 24,651 | 25,391 |
| GNMA | | 7.00 | 5-15-2026 | | 533 | 534 |
| GNMA | | 7.00 | 3-15-2028 | | 4,322 | 4,316 |
| GNMA | | 7.00 | 4-15-2031 | | 509 | 506 |
| GNMA | | 7.00 | 8-15-2031 | | 14,653 | 14,553 |
| GNMA | | 7.00 | 3-15-2032 | | 11,131 | 11,034 |
| GNMA | | 8.00 | 6-15-2023 | | 17 | 17 |
| GNMA | | 8.00 | 12-15-2023 | | 3,760 | 3,758 |
| GNMA | | 8.00 | 2-15-2024 | | 66 | 66 |
| GNMA | | 8.00 | 6-15-2025 | | 3 | 3 |
| GNMA Series 2005-23 Class IO ♀±± | | 0.00 | 6-17-2045 | | 553,090 | 1 |
| GNMA Series 2006-32 Class XM ♀±± | | 0.13 | 11-16-2045 | | 2,200,332 | 23 |
| GNMA Series 2008-22 Class XM ♀±± | | 1.28 | 2-16-2050 | | 6,219,217 | 124,264 |
| GNMA Series 2010-158 Class EI ♀ | | 4.00 | 12-16-2025 | | 1,301,698 | 29,778 |
| GNMA Series 2012-12 Class HD | | 2.00 | 5-20-2062 | | 18,235 | 16,612 |
| GNMA Series 2019-H06 Class HI ♀±± | | 1.81 | 4-20-2069 | | 2,964,898 | 87,788 |
| Resolution Funding Corporation STRIPS ¤ | | 0.00 | 1-15-2030 | | 16,245,000 | 11,953,303 |
| Resolution Funding Corporation STRIPS ¤ | | 0.00 | 4-15-2030 | | 9,185,000 | 6,696,978 |
| STRIPS ¤ | | 0.00 | 5-15-2039 | | 20,000,000 | 10,674,079 |
| STRIPS ¤ | | 0.00 | 5-15-2040 | | 7,275,000 | 3,548,729 |
| TVA | | 4.25 | 9-15-2052 | | 5,000,000 | 4,524,340 |
| TVA | | 4.25 | 9-15-2065 | | 2,600,000 | 2,311,318 |
| TVA | | 4.63 | 9-15-2060 | | 7,550,000 | 7,249,849 |
| TVA | | 5.88 | 4-1-2036 | | 4,380,000 | 4,885,549 |
| TVA STRIPS ¤ | | 0.00 | 11-1-2025 | | 5,650,000 | 4,971,493 |
| TVA STRIPS ¤ | | 0.00 | 6-15-2035 | | 2,448,000 | 1,348,633 |
| TVA STRIPS ¤ | | 0.00 | 1-15-2048 | | 1,000,000 | 286,500 |
| U.S. International Development Finance Corporation ¤ | | 0.00 | 1-17-2026 | | 2,000,000 | 1,973,964 |
| U.S. International Development Finance Corporation | | 2.12 | 3-20-2024 | | 4,285,000 | 4,222,554 |
| U.S. International Development Finance Corporation | | 2.82 | 3-20-2024 | | 3,802,500 | 3,761,337 |
| Total Agency securities (Cost $415,265,716) | | | | | | 377,148,591 |
| Asset-backed securities: 1.31% | | | | | | |
| American Tower Trust I 144A | | 3.65 | 3-15-2048 | | 4,000,000 | 3,668,005 |
| Navient Student Loan Trust Series 2018-3A Class A2 (1 Month LIBOR +0.42%) 144A± | | 5.04 | 3-25-2067 | | 210,844 | 210,686 |
| Navient Student Loan Trust Series 2019-2A Class A2 (1 Month LIBOR +1.00%) 144A± | | 5.62 | 2-27-2068 | | 2,485,611 | 2,449,056 |
| Total Asset-backed securities (Cost $6,696,811) | | | | | | 6,327,747 |
| Corporate bonds and notes: 2.81% | | | | | | |
| Financials: 2.27% | | | | | | |
| Consumer finance: 1.88% | | | | | | |
| Private Export Funding Corporation 144A | | 0.55 | 7-30-2024 | | 9,715,000 | 9,080,901 |
| Diversified financial services: 0.39% | | | | | | |
| GTP Acquisition Partners Corporation 144A | | 3.48 | 6-15-2050 | | 2,000,000 | 1,893,716 |
The accompanying notes are an integral part of these financial statements.
14 | Allspring Government Securities Fund
Portfolio of investments—February 28, 2023 (unaudited)
| | | Interest
rate | Maturity
date | Principal | Value |
| Industrials: 0.54% | | | | | | |
| Commercial services & supplies: 0.54% | | | | | | |
| Rockfeller Foundation Class B | | 2.49% | 10-1-2050 | $ | 4,000,000 | $ 2,628,218 |
| Total Corporate bonds and notes (Cost $15,859,295) | | | | | | 13,602,835 |
| Non-agency mortgage-backed securities: 6.48% | | | | | | |
| Angel Oak Mortgage Trust I LLC Series 2020-4 Class A1 144A±± | | 1.47 | 6-25-2065 | | 644,590 | 577,745 |
| Arroyo Mortgage Trust Series 2019-1 Class A1 144A±± | | 3.81 | 1-25-2049 | | 1,142,821 | 1,060,738 |
| Benchmark Mortgage Trust Series 2018-B1 Class A4 | | 3.40 | 1-15-2051 | | 246,357 | 232,145 |
| Bravo Residential Funding Trust Series 2020-RPL1 Class A1 144A±± | | 2.50 | 5-26-2059 | | 1,923,246 | 1,821,034 |
| BX Trust Series 2019-OC11 Class A 144A | | 3.20 | 12-9-2041 | | 3,030,000 | 2,610,600 |
| CD Commercial Mortgage Trust Series 2014-CR16 Class A3 | | 3.78 | 4-10-2047 | | 2,540,783 | 2,493,137 |
| CD Commercial Mortgage Trust Series 2017-6 Class A5 | | 3.46 | 11-13-2050 | | 2,340,000 | 2,162,725 |
| FirstKey Homes Trust Series 2021 Class A 144A | | 1.54 | 8-17-2038 | | 1,240,470 | 1,083,612 |
| Goldman Sachs Mortgage Securities Trust Series 2014-GC24 Class A4 | | 3.67 | 9-10-2047 | | 3,831,208 | 3,716,607 |
| JPMorgan Chase Commercial Mortgage Securities Corporation Series 2015-C28 Class A4 | | 3.23 | 10-15-2048 | | 5,000,000 | 4,735,798 |
| Legacy Mortgage Asset Trust Series 2020-RPL1 Class A1 144A±± | | 3.00 | 9-25-2059 | | 2,420,624 | 2,244,700 |
| New Residential Mortgage Loan Series 2020-NQM2 Class A1 144A±± | | 1.65 | 5-24-2060 | | 409,190 | 371,470 |
| Starwood Mortgage Residential Trust Series 2021-6 Class A1 144A±± | | 1.92 | 11-25-2066 | | 3,953,383 | 3,275,308 |
| Towd Point Mortgage Trust Series 2015-2 Class 1M2 144A±± | | 3.50 | 11-25-2060 | | 2,194,304 | 2,143,347 |
| UBS Commercial Mortgage Trust Series 2017-C5 Class A5 | | 3.47 | 11-15-2050 | | 2,581,000 | 2,384,307 |
| Vendee Mortgage Trust Series 1995-1 Class 4 ±± | | 7.84 | 2-15-2025 | | 22,604 | 22,847 |
| Vendee Mortgage Trust Series 1995-2C Class 3A | | 8.79 | 6-15-2025 | | 45,878 | 47,196 |
| Verus Securitization Trust Series 2021-R3 Class A1 144A±± | | 1.02 | 4-25-2064 | | 449,458 | 400,237 |
| Total Non-agency mortgage-backed securities (Cost $34,514,815) | | | | | | 31,383,553 |
| U.S. Treasury securities: 14.29% | | | | | | |
| U.S. Treasury Bond ## | | 2.25 | 5-15-2041 | | 13,005,000 | 9,881,260 |
| U.S. Treasury Bond | | 2.25 | 2-15-2052 | | 1,905,000 | 1,358,280 |
| U.S. Treasury Bond | | 2.88 | 5-15-2043 | | 2,245,000 | 1,857,211 |
| U.S. Treasury Bond | | 3.00 | 8-15-2052 | | 4,935,000 | 4,148,484 |
| U.S. Treasury Bond | | 3.13 | 5-15-2048 | | 6,980,000 | 5,958,357 |
| U.S. Treasury Note | | 2.00 | 11-15-2041 | | 5,230,000 | 3,780,105 |
| U.S. Treasury Note ## | | 2.75 | 4-30-2027 | | 23,720,000 | 22,325,531 |
| U.S. Treasury Note ## | | 2.75 | 7-31-2027 | | 1,225,000 | 1,150,830 |
| U.S. Treasury Note ## | | 3.50 | 2-15-2033 | | 5,695,000 | 5,507,243 |
| U.S. Treasury Note ## | | 4.13 | 11-15-2032 | | 13,005,000 | 13,212,267 |
| Total U.S. Treasury securities (Cost $77,229,196) | | | | | | 69,179,568 |
The accompanying notes are an integral part of these financial statements.
Allspring Government Securities Fund | 15
Portfolio of investments—February 28, 2023 (unaudited)
| | | Interest
rate | Maturity
date | Principal | Value |
| Yankee corporate bonds and notes: 0.52% | | | | | | |
| Financials: 0.52% | | | | | | |
| Banks: 0.52% | | | | | | |
| Inter-American Development Bank | | 7.00% | 6-15-2025 | $ | 2,000,000 | $ 2,089,143 |
| International Bank for Reconstruction and Development ¤ | | 0.00 | 3-11-2031 | | 615,000 | 434,845 |
| Total Yankee corporate bonds and notes (Cost $2,687,379) | | | | | | 2,523,988 |
| Yankee government bonds: 3.27% | | | | | | |
| State of Israel | | 5.50 | 12-4-2023 | | 15,790,000 | 15,805,980 |
| Total Yankee government bonds (Cost $16,410,142) | | | | | | 15,805,980 |
| | | Yield | | Shares | |
| Short-term investments: 1.10% | | | | | | |
| Investment companies: 1.10% | | | | | | |
| Allspring Government Money Market Fund Select Class ♠∞## | | 4.39 | | | 5,302,678 | 5,302,678 |
| Total Short-term investments (Cost $5,302,678) | | | | | | 5,302,678 |
| Total investments in securities (Cost $573,966,032) | 107.71% | | | | | 521,274,940 |
| Other assets and liabilities, net | (7.71) | | | | | (37,295,830) |
| Total net assets | 100.00% | | | | | $483,979,110 |
| ¤ | The security is issued in zero coupon form with no periodic interest payments. |
| ± | Variable rate investment. The rate shown is the rate in effect at period end. |
| ±± | The coupon of the security is adjusted based on the principal and/or interest payments received from the underlying pool of mortgages as well as the credit quality and the actual prepayment speed of the underlying mortgages. The rate shown is the rate in effect at period end. |
| ♀ | Investment in an interest-only security that entitles holders to receive only the interest payments on the underlying mortgages. The principal amount shown is the notional amount of the underlying mortgages. The rate represents the coupon rate. |
| 144A | The security may be resold in transactions exempt from registration, normally to qualified institutional buyers, pursuant to Rule 144A under the Securities Act of 1933. |
| ## | All or a portion of this security is segregated for when-issued securities. |
| ♠ | The issuer of the security is an affiliated person of the Fund as defined in the Investment Company Act of 1940. |
| ∞ | The rate represents the 7-day annualized yield at period end. |
| %% | The security is purchased on a when-issued basis. |
| Abbreviations: |
| COFI | Cost of Funds Index |
| FHLB | Federal Home Loan Bank |
| FHLMC | Federal Home Loan Mortgage Corporation |
| FNMA | Federal National Mortgage Association |
| GNMA | Government National Mortgage Association |
| LIBOR | London Interbank Offered Rate |
| SOFR | Secured Overnight Financing Rate |
| STRIPS | Separate trading of registered interest and principal securities |
| TVA | Tennessee Valley Authority |
The accompanying notes are an integral part of these financial statements.
16 | Allspring Government Securities Fund
Portfolio of investments—February 28, 2023 (unaudited)
Investments in affiliates
An affiliated investment is an investment in which the Fund owns at least 5% of the outstanding voting shares of the issuer or as a result of other relationships, such as the Fund and the issuer having the same investment manager. Transactions with issuers that were affiliates of the Fund at the end of the period were as follows:
| | Value,
beginning of
period | Purchases | Sales
proceeds | Net
realized
gains
(losses) | Net
change in
unrealized
gains
(losses) | Value,
end of
period | Shares,
end
of period | Income
from
affiliated
securities |
| Short-term investments | | | | | | | |
| Allspring Government Money Market Fund Select Class | $43,810,728 | $87,592,637 | $(126,100,687) | $0 | $0 | $5,302,678 | 5,302,678 | $111,241 |
Futures contracts
| Description | Number of
contracts | Expiration
date | Notional
cost | Notional
value | Unrealized
gains | | Unrealized
losses |
| Long | | | | | | | |
| 2-Year U.S. Treasury Notes | 309 | 6-30-2023 | $ 63,137,885 | $ 62,951,508 | $ 0 | | $ (186,377) |
| 5-Year U.S. Treasury Notes | 398 | 6-30-2023 | 42,735,865 | 42,607,766 | 0 | | (128,099) |
| Short | | | | | | | |
| 10-Year U.S. Treasury Notes | (69) | 6-21-2023 | (7,717,172) | (7,704,281) | 12,891 | | 0 |
| 10-Year U.S. Ultra Treasury Notes | (74) | 6-21-2023 | (8,692,672) | (8,671,875) | 20,797 | | 0 |
| U.S. Long Term Bonds | (159) | 6-21-2023 | (20,068,503) | (19,909,781) | 158,722 | | 0 |
| U.S. Ultra Bond | (100) | 6-21-2023 | (13,620,656) | (13,506,250) | 114,406 | | 0 |
| | | | | | $306,816 | | $(314,476) |
The accompanying notes are an integral part of these financial statements.
Allspring Government Securities Fund | 17
Statement of assets and liabilities—February 28, 2023 (unaudited)
| | |
| Assets | |
Investments in unaffiliated securities, at value (cost $568,663,354)
| $ 515,972,262 |
Investments in affiliated securities, at value (cost $5,302,678)
| 5,302,678 |
Cash
| 5,135 |
Cash held at broker
| 290,000 |
Cash at broker segregated for futures contracts
| 2,666,000 |
Receivable for investments sold
| 13,327,362 |
Receivable for interest
| 2,422,773 |
Receivable for Fund shares sold
| 355,905 |
Principal paydown receivable
| 55,516 |
Receivable for daily variation margin on open futures contracts
| 3,758 |
Prepaid expenses and other assets
| 88,200 |
Total assets
| 540,489,589 |
| Liabilities | |
Payable for when-issued transactions
| 52,370,144 |
Payable for investments purchased
| 2,902,493 |
Payable for Fund shares redeemed
| 786,981 |
Dividends payable
| 172,663 |
Management fee payable
| 132,335 |
Administration fees payable
| 42,207 |
Distribution fee payable
| 967 |
Accrued expenses and other liabilities
| 102,689 |
Total liabilities
| 56,510,479 |
Total net assets
| $483,979,110 |
| Net assets consist of | |
Paid-in capital
| $ 576,609,778 |
Total distributable loss
| (92,630,668) |
Total net assets
| $483,979,110 |
| Computation of net asset value and offering price per share | |
Net assets – Class A
| $ 176,410,615 |
Shares outstanding – Class A1
| 18,168,478 |
Net asset value per share – Class A
| $9.71 |
Maximum offering price per share – Class A2
| $10.17 |
Net assets – Class C
| $ 1,676,295 |
Shares outstanding – Class C1
| 172,664 |
Net asset value per share – Class C
| $9.71 |
Net assets – Administrator Class
| $ 74,369,924 |
Shares outstanding – Administrator Class1
| 7,662,956 |
Net asset value per share – Administrator Class
| $9.71 |
Net assets – Institutional Class
| $ 231,522,276 |
Shares outstanding – Institutional Class1
| 23,854,990 |
Net asset value per share – Institutional Class
| $9.71 |
| 1 | The Fund has an unlimited number of authorized shares. |
| 2 | Maximum offering price is computed as 100/95.50 of net asset value. On investments of $50,000 or more, the offering price is reduced. |
The accompanying notes are an integral part of these financial statements.
18 | Allspring Government Securities Fund
Statement of operations—six months ended February 28, 2023 (unaudited)
| | |
| Investment income | |
Interest
| $ 7,632,568 |
Income from affiliated securities
| 111,241 |
Total investment income
| 7,743,809 |
| Expenses | |
Management fee
| 1,120,081 |
| Administration fees | |
Class A
| 144,387 |
Class C
| 1,402 |
Administrator Class
| 38,634 |
Institutional Class
| 95,454 |
| Shareholder servicing fees | |
Class A
| 224,191 |
Class C
| 2,179 |
Administrator Class
| 96,153 |
| Distribution fee | |
Class C
| 6,529 |
Custody and accounting fees
| 11,629 |
Professional fees
| 43,921 |
Registration fees
| 22,764 |
Shareholder report expenses
| 21,818 |
Trustees’ fees and expenses
| 10,625 |
Other fees and expenses
| 1,957 |
Total expenses
| 1,841,724 |
| Less: Fee waivers and/or expense reimbursements | |
Fund-level
| (116,464) |
Class A
| (9,024) |
Administrator Class
| (57,951) |
Institutional Class
| (59,659) |
Net expenses
| 1,598,626 |
Net investment income
| 6,145,183 |
| Realized and unrealized gains (losses) on investments | |
| Net realized gains (losses) on | |
Unaffiliated securities
| (11,362,944) |
Futures contracts
| 1,833,034 |
Net realized losses on investments
| (9,529,910) |
| Net change in unrealized gains (losses) on | |
Unaffiliated securities
| (12,136,628) |
Futures contracts
| 31,569 |
Net change in unrealized gains (losses) on investments
| (12,105,059) |
Net realized and unrealized gains (losses) on investments
| (21,634,969) |
Net decrease in net assets resulting from operations
| $(15,489,786) |
The accompanying notes are an integral part of these financial statements.
Allspring Government Securities Fund | 19
Statement of changes in net assets
| | | | | |
| | Six months ended
February 28, 2023
(unaudited) | Year ended
August 31, 2022 |
| Operations | | | | |
Net investment income
| | $ 6,145,183 | | $ 9,261,287 |
Net realized losses on investments
| | (9,529,910) | | (15,840,928) |
Net change in unrealized gains (losses) on investments
| | (12,105,059) | | (64,246,074) |
Net decrease in net assets resulting from operations
| | (15,489,786) | | (70,825,715) |
| Distributions to shareholders from | | | | |
| Net investment income and net realized gains | | | | |
Class A
| | (1,871,901) | | (2,702,584) |
Class C
| | (11,540) | | (10,895) |
Administrator Class
| | (881,440) | | (1,343,333) |
Institutional Class
| | (2,915,708) | | (4,534,056) |
Total distributions to shareholders
| | (5,680,589) | | (8,590,868) |
| Capital share transactions | Shares | | Shares | |
| Proceeds from shares sold | | | | |
Class A
| 604,940 | 5,886,059 | 1,408,891 | 15,372,202 |
Class C
| 7,555 | 73,854 | 30,432 | 315,688 |
Administrator Class
| 493,871 | 4,832,455 | 1,353,906 | 14,726,732 |
Institutional Class
| 6,228,731 | 61,107,576 | 17,751,806 | 191,802,896 |
| | | 71,899,944 | | 222,217,518 |
| Reinvestment of distributions | | | | |
Class A
| 171,477 | 1,665,674 | 223,519 | 2,401,606 |
Class C
| 1,019 | 9,901 | 883 | 9,353 |
Administrator Class
| 89,371 | 867,869 | 122,729 | 1,319,682 |
Institutional Class
| 224,555 | 2,181,233 | 314,703 | 3,374,424 |
| | | 4,724,677 | | 7,105,065 |
| Payment for shares redeemed | | | | |
Class A
| (2,085,304) | (20,322,206) | (5,223,872) | (56,935,298) |
Class C
| (41,580) | (409,465) | (90,454) | (963,071) |
Administrator Class
| (1,179,771) | (11,455,899) | (2,938,959) | (32,001,376) |
Institutional Class
| (7,935,112) | (77,588,023) | (19,414,727) | (207,837,081) |
| | | (109,775,593) | | (297,736,826) |
Net decrease in net assets resulting from capital share transactions
| | (33,150,972) | | (68,414,243) |
Total decrease in net assets
| | (54,321,347) | | (147,830,826) |
| Net assets | | | | |
Beginning of period
| | 538,300,457 | | 686,131,283 |
End of period
| | $ 483,979,110 | | $ 538,300,457 |
The accompanying notes are an integral part of these financial statements.
20 | Allspring Government Securities Fund
Financial highlights
(For a share outstanding throughout each period)
| | | Year ended August 31 |
| Class A | Six months ended
February 28, 2023
(unaudited) | 2022 | 2021 | 2020 | 2019 | 2018 |
Net asset value, beginning of period
| $10.11 | $11.49 | $11.67 | $11.31 | $10.65 | $11.01 |
Net investment income
| 0.11 | 0.14 | 0.12 1 | 0.18 1 | 0.23 | 0.19 |
Net realized and unrealized gains (losses) on investments
| (0.41) | (1.39) | (0.17) | 0.38 | 0.68 | (0.35) |
Total from investment operations
| (0.30) | (1.25) | (0.05) | 0.56 | 0.91 | (0.16) |
| Distributions to shareholders from | | | | | | |
Net investment income
| (0.10) | (0.13) | (0.11) | (0.19) | (0.25) | (0.20) |
Tax basis return of capital
| 0.00 | 0.00 | (0.02) | (0.01) | 0.00 | 0.00 |
Total distributions to shareholders
| (0.10) | (0.13) | (0.13) | (0.20) | (0.25) | (0.20) |
Net asset value, end of period
| $9.71 | $10.11 | $11.49 | $11.67 | $11.31 | $10.65 |
Total return2
| (2.96)% | (10.95)% | (0.40)% | 5.02% | 8.65% | (1.44)% |
| Ratios to average net assets (annualized) | | | | | | |
Gross expenses
| 0.90% | 0.89% | 0.89% | 0.91% | 0.91% | 0.90% |
Net expenses
| 0.85% | 0.84% | 0.84% | 0.84% | 0.85% | 0.85% |
Net investment income
| 2.26% | 1.28% | 1.00% | 1.56% | 2.20% | 1.86% |
| Supplemental data | | | | | | |
Portfolio turnover rate
| 67% | 309% | 221% | 111% | 178% | 197% |
Net assets, end of period (000s omitted)
| $176,411 | $196,839 | $265,018 | $276,310 | $271,986 | $292,550 |
| 1 | Calculated based upon average shares outstanding |
| 2 | Total return calculations do not include any sales charges. Returns for periods of less than one year are not annualized. |
The accompanying notes are an integral part of these financial statements.
Allspring Government Securities Fund | 21
Financial highlights
(For a share outstanding throughout each period)
| | | Year ended August 31 |
| Class C | Six months ended
February 28, 2023
(unaudited) | 2022 | 2021 | 2020 | 2019 | 2018 |
Net asset value, beginning of period
| $10.10 | $11.49 | $11.67 | $11.31 | $10.65 | $11.01 |
Net investment income
| 0.07 1 | 0.06 1 | 0.03 1 | 0.09 1 | 0.15 1 | 0.12 1 |
Net realized and unrealized gains (losses) on investments
| (0.40) | (1.40) | (0.17) | 0.38 | 0.68 | (0.36) |
Total from investment operations
| (0.33) | (1.34) | (0.14) | 0.47 | 0.83 | (0.24) |
| Distributions to shareholders from | | | | | | |
Net investment income
| (0.06) | (0.05) | (0.02) | (0.10) | (0.17) | (0.12) |
Tax basis return of capital
| 0.00 | 0.00 | (0.02) | (0.01) | 0.00 | 0.00 |
Total distributions to shareholders
| (0.06) | (0.05) | (0.04) | (0.11) | (0.17) | (0.12) |
Net asset value, end of period
| $9.71 | $10.10 | $11.49 | $11.67 | $11.31 | $10.65 |
Total return2
| (3.22)% | (11.71)% | (1.16)% | 4.24% | 7.84% | (2.18)% |
| Ratios to average net assets (annualized) | | | | | | |
Gross expenses
| 1.65% | 1.63% | 1.64% | 1.66% | 1.66% | 1.65% |
Net expenses
| 1.60% | 1.60% | 1.60% | 1.60% | 1.60% | 1.60% |
Net investment income
| 1.50% | 0.52% | 0.24% | 0.81% | 1.44% | 1.12% |
| Supplemental data | | | | | | |
Portfolio turnover rate
| 67% | 309% | 221% | 111% | 178% | 197% |
Net assets, end of period (000s omitted)
| $1,676 | $2,078 | $3,042 | $7,560 | $11,026 | $15,508 |
| 1 | Calculated based upon average shares outstanding |
| 2 | Total return calculations do not include any sales charges. Returns for periods of less than one year are not annualized. |
The accompanying notes are an integral part of these financial statements.
22 | Allspring Government Securities Fund
Financial highlights
(For a share outstanding throughout each period)
| | | Year ended August 31 |
| Administrator Class | Six months ended
February 28, 2023
(unaudited) | 2022 | 2021 | 2020 | 2019 | 2018 |
Net asset value, beginning of period
| $10.10 | $11.48 | $11.66 | $11.31 | $10.65 | $11.01 |
Net investment income
| 0.12 1 | 0.16 1 | 0.14 1 | 0.20 1 | 0.26 1 | 0.22 1 |
Net realized and unrealized gains (losses) on investments
| (0.40) | (1.39) | (0.16) | 0.37 | 0.67 | (0.35) |
Total from investment operations
| (0.28) | (1.23) | (0.02) | 0.57 | 0.93 | (0.13) |
| Distributions to shareholders from | | | | | | |
Net investment income
| (0.11) | (0.15) | (0.14) | (0.21) | (0.27) | (0.23) |
Tax basis return of capital
| 0.00 | 0.00 | (0.02) | (0.01) | 0.00 | 0.00 |
Total distributions to shareholders
| (0.11) | (0.15) | (0.16) | (0.22) | (0.27) | (0.23) |
Net asset value, end of period
| $9.71 | $10.10 | $11.48 | $11.66 | $11.31 | $10.65 |
Total return2
| (2.76)% | (10.78)% | (0.21)% | 5.15% | 8.88% | (1.23)% |
| Ratios to average net assets (annualized) | | | | | | |
Gross expenses
| 0.84% | 0.83% | 0.83% | 0.85% | 0.85% | 0.84% |
Net expenses
| 0.64% | 0.64% | 0.64% | 0.64% | 0.64% | 0.64% |
Net investment income
| 2.47% | 1.49% | 1.21% | 1.75% | 2.42% | 2.07% |
| Supplemental data | | | | | | |
Portfolio turnover rate
| 67% | 309% | 221% | 111% | 178% | 197% |
Net assets, end of period (000s omitted)
| $74,370 | $83,432 | $111,639 | $120,181 | $106,355 | $91,671 |
| 1 | Calculated based upon average shares outstanding |
| 2 | Returns for periods of less than one year are not annualized. |
The accompanying notes are an integral part of these financial statements.
Allspring Government Securities Fund | 23
Financial highlights
(For a share outstanding throughout each period)
| | | Year ended August 31 |
| Institutional Class | Six months ended
February 28, 2023
(unaudited) | 2022 | 2021 | 2020 | 2019 | 2018 |
Net asset value, beginning of period
| $10.10 | $11.48 | $11.66 | $11.31 | $10.65 | $11.00 |
Net investment income
| 0.13 1 | 0.17 | 0.16 1 | 0.21 1 | 0.27 1 | 0.24 1 |
Net realized and unrealized gains (losses) on investments
| (0.40) | (1.38) | (0.17) | 0.38 | 0.68 | (0.35) |
Total from investment operations
| (0.27) | (1.21) | (0.01) | 0.59 | 0.95 | (0.11) |
| Distributions to shareholders from | | | | | | |
Net investment income
| (0.12) | (0.17) | (0.15) | (0.23) | (0.29) | (0.24) |
Tax basis return of capital
| 0.00 | 0.00 | (0.02) | (0.01) | 0.00 | 0.00 |
Total distributions to shareholders
| (0.12) | (0.17) | (0.17) | (0.24) | (0.29) | (0.24) |
Net asset value, end of period
| $9.71 | $10.10 | $11.48 | $11.66 | $11.31 | $10.65 |
Total return2
| (2.68)% | (10.63)% | (0.05)% | 5.31% | 9.05% | (0.99)% |
| Ratios to average net assets (annualized) | | | | | | |
Gross expenses
| 0.58% | 0.56% | 0.56% | 0.58% | 0.58% | 0.57% |
Net expenses
| 0.48% | 0.48% | 0.48% | 0.48% | 0.48% | 0.48% |
Net investment income
| 2.63% | 1.66% | 1.36% | 1.87% | 2.56% | 2.22% |
| Supplemental data | | | | | | |
Portfolio turnover rate
| 67% | 309% | 221% | 111% | 178% | 197% |
Net assets, end of period (000s omitted)
| $231,522 | $255,952 | $306,431 | $329,083 | $210,424 | $310,966 |
| 1 | Calculated based upon average shares outstanding |
| 2 | Returns for periods of less than one year are not annualized. |
The accompanying notes are an integral part of these financial statements.
24 | Allspring Government Securities Fund
Notes to financial statements (unaudited)
1. ORGANIZATION
Allspring Funds Trust (the "Trust"), a Delaware statutory trust organized on March 10, 1999, is an open-end management investment company registered under the Investment Company Act of 1940, as amended (the "1940 Act"). As an investment company, the Trust follows the accounting and reporting guidance in Financial Accounting Standards Board ("FASB") Accounting Standards Codification Topic 946, Financial Services – Investment Companies. These financial statements report on the Allspring Government Securities Fund (the "Fund") which is a diversified series of the Trust.
2. SIGNIFICANT ACCOUNTING POLICIES
The following significant accounting policies, which are consistently followed in the preparation of the financial statements of the Fund, are in conformity with U.S. generally accepted accounting principles which require management to make estimates and assumptions that affect the reported amounts of assets and liabilities, disclosure of contingent assets and liabilities at the date of the financial statements, and the reported amounts of income and expenses during the reporting period. Actual results could differ from those estimates.
Securities valuation
All investments are valued each business day as of the close of regular trading on the New York Stock Exchange (generally 4 p.m. Eastern Time), although the Fund may deviate from this calculation time under unusual or unexpected circumstances.
Debt securities are valued at the evaluated bid price provided by an independent pricing service (e.g. taking into account various factors, including yields, maturities, or credit ratings) or, if a reliable price is not available, the quoted bid price from an independent broker-dealer.
Futures contracts that are listed on a foreign or domestic exchange or market are valued at the official closing price or, if none, the last sales price.
Investments in registered open-end investment companies (other than those listed on a foreign or domestic exchange or market) are valued at net asset value.
Investments which are not valued using the methods discussed above are valued at their fair value, as determined in good faith by Allspring Funds Management, LLC ("Allspring Funds Management"), which was named the valuation designee by the Board of Trustees. As the valuation designee, Allspring Funds Management is responsible for day-to-day valuation activities for the Allspring Funds. In connection with these responsibilities, Allspring Funds Management has established a Valuation Committee and has delegated to it the authority to take any actions regarding the valuation of portfolio securities that the Valuation Committee deems necessary or appropriate, including determining the fair value of portfolio securities. On a quarterly basis, the Board of Trustees receives reports of valuation actions taken by the Valuation Committee. On at least an annual basis, the Board of Trustees receives an assessment of the adequacy and effectiveness of Allspring Funds Management's process for determining the fair value of the portfolio of investments.
When-issued transactions
The Fund may purchase securities on a forward commitment or when-issued basis. The Fund records a when-issued transaction on the trade date and will segregate assets in an amount at least equal in value to the Fund's commitment to purchase when-issued securities. Securities purchased on a when-issued basis are marked-to-market daily and the Fund begins earning interest on the settlement date. Losses may arise due to changes in the market value of the underlying securities or if the counterparty does not perform under the contract.
Futures contracts
Futures contracts are agreements between the Fund and a counterparty to buy or sell a specific amount of a commodity, financial instrument or currency at a specified price on a specified date. The Fund may buy and sell futures contracts in order to gain exposure to, or protect against, changes in interest rates and is subject to interest rate risk. The primary risks associated with the use of futures contracts are the imperfect correlation between changes in market values of securities held by the Fund and the prices of futures contracts, and the possibility of an illiquid market. Futures contracts are generally entered into on a regulated futures exchange and cleared through a clearinghouse associated with the exchange. With futures contracts, there is minimal counterparty risk to the Fund since futures contracts are exchange-traded and the exchange’s clearinghouse, as the counterparty to all exchange-traded futures, guarantees the futures contracts against default.
Upon entering into a futures contract, the Fund is required to deposit either cash or securities (initial margin) with the broker in an amount equal to a certain percentage of the contract value. Subsequent payments (variation margin) are paid to or from the broker each day equal to the daily changes in the contract value. Such payments are recorded as unrealized gains or losses and, if any, shown as variation margin receivable (payable) in the Statement of Assets and Liabilities. Should the Fund fail to make
Allspring Government Securities Fund | 25
Notes to financial statements (unaudited)
requested variation margin payments, the broker can gain access to the initial margin to satisfy the Fund’s payment obligations. When the contracts are closed, a realized gain or loss is recorded in the Statement of Operations.
Mortgage dollar roll transactions
The Fund may engage in mortgage dollar roll transactions through TBA mortgage-backed securities issued by Government National Mortgage Association (GNMA), Federal National Mortgage Association (FNMA) and Federal Home Loan Mortgage Corporation (FHLMC). In a mortgage dollar roll transaction, the Fund sells a mortgage-backed security to a financial institution, such as a bank or broker-dealer and simultaneously agrees to repurchase a substantially similar security from the institution at a later date at an agreed upon price. The mortgage-backed securities that are repurchased will bear the same interest rate as those sold, but generally will be collateralized by different pools of mortgages with different pre-payment histories. During the roll period, the Fund foregoes principal and interest paid on the securities. The Fund is compensated by the difference between the current sales price and the forward price for the future purchase as well as by the earnings on the cash proceeds of the initial sale. Mortgage dollar rolls may be renewed without physical delivery of the securities subject to the contract. The Fund accounts for TBA dollar roll transactions as purchases and sales which, as a result, may increase its portfolio turnover rate.
Security transactions and income recognition
Securities transactions are recorded on a trade date basis. Realized gains or losses are recorded on the basis of identified cost.
Interest income is accrued daily and bond discounts are accreted and premiums are amortized daily. To the extent debt obligations are placed on non-accrual status, any related interest income may be reduced by writing off interest receivables when the collection of all or a portion of interest has been determined to be doubtful based on consistently applied procedures and the fair value has decreased. If the issuer subsequently resumes interest payments or when the collectability of interest is reasonably assured, the debt obligation is removed from non-accrual status. Paydown gains and losses are included in interest income.
Distributions to shareholders
Distributions to shareholders from net investment income are declared daily and paid monthly. Distributions from net realized gains, if any, are recorded on the ex-dividend date and paid at least annually. Such distributions are determined in accordance with income tax regulations and may differ from U.S. generally accepted accounting principles. Dividend sources are estimated at the time of declaration. The tax character of distributions is determined as of the Fund's fiscal year end. Therefore, a portion of the Fund's distributions made prior to the Fund’s fiscal year end may be categorized as a tax return of capital at year end.
Federal and other taxes
The Fund intends to continue to qualify as a regulated investment company by distributing substantially all of its investment company taxable income and any net realized capital gains (after reduction for capital loss carryforwards) sufficient to relieve it from all, or substantially all, federal income taxes. Accordingly, no provision for federal income taxes was required.
The Fund’s income and federal excise tax returns and all financial records supporting those returns for the prior three fiscal years are subject to examination by the federal and Delaware revenue authorities. Management has analyzed the Fund's tax positions taken on federal, state, and foreign tax returns, as applicable, for all open tax years and does not believe that there are any uncertain tax positions that require recognition of a tax liability.
As of February 28, 2023, the aggregate cost of all investments for federal income tax purposes was $583,209,149 and the unrealized gains (losses) consisted of:
| Gross unrealized gains | $ 1,287,486 |
| Gross unrealized losses | (63,229,355) |
| Net unrealized losses | $(61,941,869) |
As of August 31, 2022, the Fund had capital loss carryforwards which consisted of $21,709,751 in short-term capital losses.
Class allocations
The separate classes of shares offered by the Fund differ principally in applicable sales charges, distribution, shareholder servicing, and administration fees. Class specific expenses are charged directly to that share class. Investment income, common fund-level expenses, and realized and unrealized gains (losses) on investments are allocated daily to each class of shares based on the relative proportion of net assets of each class.
26 | Allspring Government Securities Fund
Notes to financial statements (unaudited)
3. FAIR VALUATION MEASUREMENTS
Fair value measurements of investments are determined within a framework that has established a fair value hierarchy based upon the various data inputs utilized in determining the value of the Fund’s investments. The three-level hierarchy gives the highest priority to unadjusted quoted prices in active markets for identical assets or liabilities (Level 1) and the lowest priority to unobservable inputs (Level 3). The Fund’s investments are classified within the fair value hierarchy based on the lowest level of input that is significant to the fair value measurement. The inputs are summarized into three broad levels as follows:
| ■ | Level 1 – quoted prices in active markets for identical securities |
| ■ | Level 2 – other significant observable inputs (including quoted prices for similar securities, interest rates, prepayment speeds, credit risk, etc.) |
| ■ | Level 3 – significant unobservable inputs (including the Fund’s own assumptions in determining the fair value of investments) |
The inputs or methodologies used for valuing investments in securities are not necessarily an indication of the risk associated with investing in those securities.
The following is a summary of the inputs used in valuing the Fund’s assets and liabilities as of February 28, 2023:
| | Quoted prices
(Level 1) | Other significant
observable inputs
(Level 2) | Significant
unobservable inputs
(Level 3) | Total |
| Assets | | | | |
| Investments in: | | | | |
| Agency securities | $ 0 | $ 377,148,591 | $0 | $ 377,148,591 |
| Asset-backed securities | 0 | 6,327,747 | 0 | 6,327,747 |
| Corporate bonds and notes | 0 | 13,602,835 | 0 | 13,602,835 |
| Non-agency mortgage-backed securities | 0 | 31,383,553 | 0 | 31,383,553 |
| U.S. Treasury securities | 69,179,568 | 0 | 0 | 69,179,568 |
| Yankee corporate bonds and notes | 0 | 2,523,988 | 0 | 2,523,988 |
| Yankee government bonds | 0 | 15,805,980 | 0 | 15,805,980 |
| Short-term investments | | | | |
| Investment companies | 5,302,678 | 0 | 0 | 5,302,678 |
| | 74,482,246 | 446,792,694 | 0 | 521,274,940 |
| Futures contracts | 306,816 | 0 | 0 | 306,816 |
| Total assets | $74,789,062 | $446,792,694 | $0 | $521,581,756 |
| Liabilities | | | | |
| Futures contracts | $ 314,476 | $ 0 | $0 | $ 314,476 |
| Total liabilities | $ 314,476 | $ 0 | $0 | $ 314,476 |
Futures contracts are reported at their cumulative unrealized gains (losses) at measurement date as reported in the table following the Portfolio of Investments. For futures contracts, the current day’s variation margin is reported on the Statement of Assets and Liabilities. All other assets and liabilities are reported at their market value at measurement date.
Additional sector, industry or geographic detail, if any, is included in the Portfolio of Investments.
For the six months ended February 28, 2023, the Fund did not have any transfers into/out of Level 3.
4. TRANSACTIONS WITH AFFILIATES
Management fee
Allspring Funds Management, a wholly owned subsidiary of Allspring Global Investments Holdings, LLC, a holding company indirectly owned by certain private funds of GTCR LLC and Reverence Capital Partners, L.P., is the manager of the Fund and provides advisory and fund-level administrative services under an investment management agreement. Under the investment management agreement, Allspring Funds Management is responsible for, among other services, implementing the investment objectives and strategies of the Fund, supervising the subadviser and providing fund-level administrative services in connection
Allspring Government Securities Fund | 27
Notes to financial statements (unaudited)
with the Fund’s operations. As compensation for its services under the investment management agreement, Allspring Funds Management is entitled to receive a management fee at the following annual rate based on the Fund’s average daily net assets:
| Average daily net assets | Management fee |
| First $500 million | 0.450% |
| Next $500 million | 0.425 |
| Next $2 billion | 0.400 |
| Next $2 billion | 0.375 |
| Next $5 billion | 0.340 |
| Over $10 billion | 0.320 |
For the six months ended February 28, 2023, the advisory fee was equivalent to an annual rate of 0.45% of the Fund’s average daily net assets.
Allspring Funds Management has retained the services of a subadviser to provide daily portfolio management to the Fund. The fee for subadvisory services is borne by Allspring Funds Management. Allspring Global Investments, LLC, an affiliate of Allspring Funds Management and a wholly owned subsidiary of Allspring Global Investments Holdings, LLC, is the subadviser to the Fund and is entitled to receive a fee from Allspring Funds Management at an annual rate starting at 0.20% and declining to 0.10% as the average daily net assets of the Fund increase.
Administration fees
Under a class-level administration agreement, Allspring Funds Management provides class-level administrative services to the Fund, which includes paying fees and expenses for services provided by the transfer agent, sub-transfer agents, omnibus account servicers and record-keepers. As compensation for its services under the class-level administration agreement, Allspring Funds Management receives an annual fee which is calculated based on the average daily net assets of each class as follows:
| | Class-level
administration fee |
| Class A | 0.16% |
| Class C | 0.16 |
| Administrator Class | 0.10 |
| Institutional Class | 0.08 |
Waivers and/or expense reimbursements
Allspring Funds Management has contractually committed to waive and/or reimburse management and administration fees to the extent necessary to maintain certain net operating expense ratios for the Fund. When each class of the Fund has exceeded its expense cap, Allspring Funds Management will waive fees and/or reimburse expenses from fund-level expenses on a proportionate basis and then from class specific expenses. When only certain classes exceed their expense caps, waivers and/or reimbursements are applied against class specific expenses before fund-level expenses. Allspring Funds Management has contractually committed through December 31, 2023 to waive fees and/or reimburse expenses to the extent necessary to cap expenses. Prior to or after the commitment expiration date, the caps may be increased or the commitment to maintain the caps may be terminated only with the approval of the Board of Trustees. As of February 28, 2023, the contractual expense caps are as follows:
| | Expense ratio caps |
| Class A | 0.85% |
| Class C | 1.60 |
| Administrator Class | 0.64 |
| Institutional Class | 0.48 |
28 | Allspring Government Securities Fund
Notes to financial statements (unaudited)
Distribution fee
The Trust has adopted a distribution plan for Class C shares pursuant to Rule 12b-1 under the 1940 Act. A distribution fee is charged to Class C shares and paid to Allspring Funds Distributor, LLC ("Allspring Funds Distributor"), the principal underwriter, an affiliate of Allspring Funds Management, at an annual rate up to 0.75% of the average daily net assets of Class C shares.
In addition, Allspring Funds Distributor is entitled to receive the front-end sales charge from the purchase of Class A shares and a contingent deferred sales charge on the redemption of certain Class A shares. Allspring Funds Distributor is also entitled to receive the contingent deferred sales charges from redemptions of Class C shares. For the six months ended February 28, 2023, Allspring Funds Distributor received $374 from the sale of Class A shares. No contingent deferred sales charges were incurred by Class A and Class C shares for the six months ended February 28, 2023.
Shareholder servicing fees
The Trust has entered into contracts with one or more shareholder servicing agents, whereby Class A, Class C and Administrator Class are charged a fee at an annual rate up to 0.25% of the average daily net assets of each respective class. A portion of these total shareholder servicing fees were paid to affiliates of the Fund.
Interfund transactions
The Fund may purchase or sell portfolio investment securities to certain affiliates pursuant to Rule 17a-7 under the 1940 Act and under procedures adopted by the Board of Trustees. The procedures have been designed to ensure that these interfund transactions, which do not incur broker commissions, are effected at current market prices.
5. INVESTMENT PORTFOLIO TRANSACTIONS
Purchases and sales of investments, excluding short-term securities, for the six months ended February 28, 2023 were as follows:
| Purchases at cost | | Sales proceeds |
U.S.
government | Non-U.S.
government | | U.S.
government | Non-U.S.
government |
| $181,469,599 | $175,800,692 | | $183,118,906 | $196,323,514 |
6. DERIVATIVE TRANSACTIONS
During the six months ended February 28, 2023, the Fund entered into futures contracts to manage duration and yield curve exposures. The Fund had an average notional amount of $77,860,193 in long futures contracts and $41,115,656 in short futures contracts during the six months ended February 28, 2023.
The fair value, realized gains or losses and change in unrealized gains or losses, if any, on derivative instruments are reflected in the corresponding financial statement captions.
7. BANK BORROWINGS
The Trust (excluding the money market funds), Allspring Master Trust and Allspring Variable Trust are parties to a $350,000,000 revolving credit agreement whereby the Fund is permitted to use bank borrowings for temporary or emergency purposes, such as to fund shareholder redemption requests. Interest under the credit agreement is charged to the Fund based on a borrowing rate equal to the higher of the Federal Funds rate or the overnight bank funding rate in effect on that day plus a spread. In addition, an annual commitment fee equal based on the unused balance is allocated to each participating fund.
For the six months ended February 28, 2023, there were no borrowings by the Fund under the agreement.
8. MARKET RISKS
On March 11, 2020, the World Health Organization announced that it had made the assessment that coronavirus disease 2019 (“COVID-19”) is a pandemic. The impacts of COVID-19 are affecting the entire global economy, individual companies and investment products, the funds, and the market in general. There is significant uncertainty around the extent and duration of business disruptions related to COVID-19 and the impacts may last for an extended period of time. COVID-19 has led to significant uncertainty and volatility in the financial markets.
Allspring Government Securities Fund | 29
Notes to financial statements (unaudited)
9. INDEMNIFICATION
Under the Fund's organizational documents, the officers and Trustees have been granted certain indemnification rights against certain liabilities that may arise out of performance of their duties to the Fund. The Fund has entered into a separate agreement with each Trustee that converts indemnification rights currently existing under the Fund’s organizational documents into contractual rights that cannot be changed in the future without the consent of the Trustee. Additionally, in the normal course of business, the Fund may enter into contracts with service providers that contain a variety of indemnification clauses. The Fund’s maximum exposure under these arrangements is dependent on future claims that may be made against the Fund and, therefore, cannot be estimated.
30 | Allspring Government Securities Fund
Other information (unaudited)
PROXY VOTING INFORMATION
A description of the policies and procedures used to determine how to vote proxies relating to portfolio securities is available without charge, upon request, by calling 1-800-222-8222, visiting our website at allspringglobal.com, or visiting the SEC website at sec.gov. Information regarding how the proxies related to portfolio securities were voted during the most recent 12-month period ended June 30 is available on the website at allspringglobal.com or by visiting the SEC website at sec.gov.
QUARTERLY PORTFOLIO HOLDINGS INFORMATION
The Fund files its complete schedule of portfolio holdings with the SEC for the first and third quarters of each fiscal year as an exhibit to its reports on Form N-PORT. Shareholders may view the filed Form N-PORT by visiting the SEC website at sec.gov.
Allspring Government Securities Fund | 31
Other information (unaudited)
BOARD OF TRUSTEES AND OFFICERS
Each of the Trustees and Officers listed in the table below acts in identical capacities for each fund in the Allspring family of funds, which consists of 127 mutual funds comprising the Allspring Funds Trust, Allspring Variable Trust, Allspring Master Trust and four closed-end funds (collectively the “Fund Complex”). This table should be read in conjunction with the Prospectus and the Statement of Additional Information1. The mailing address of each Trustee and Officer is 1415 Vantage Park Drive, 3rd Floor, Charlotte, NC 28203. Each Trustee and Officer serves an indefinite term, however, each Trustee serves such term until reaching the mandatory retirement age established by the Trustees.
Independent Trustees
Name and
year of birth | Position held and
length of service* | Principal occupations during past five years or longer | Current other
public company or
investment
company
directorships |
William R. Ebsworth
(Born 1957) | Trustee,
since 2015 | Retired. From 1984 to 2013, equities analyst, portfolio manager, research director and chief investment officer at Fidelity Management and Research Company in Boston, Tokyo, and Hong Kong, and retired in 2013 as Chief Investment Officer of Fidelity Strategic Advisers, Inc. where he led a team of investment professionals managing client assets. Prior thereto, Board member of Hong Kong Securities Clearing Co., Hong Kong Options Clearing Corp., the Thailand International Fund, Ltd., Fidelity Investments Life Insurance Company, and Empire Fidelity Investments Life Insurance Company. Audit Committee Chair and Investment Committee Chair of the Vincent Memorial Hospital Foundation (non-profit organization). Mr. Ebsworth is a CFA® charterholder. | N/A |
Jane A. Freeman
(Born 1953) | Trustee,
since 2015;
Chair Liaison,
since 2018 | Retired. From 2012 to 2014 and 1999 to 2008, Chief Financial Officer of Scientific Learning Corporation. From 2008 to 2012, Ms. Freeman provided consulting services related to strategic business projects. Prior to 1999, Portfolio Manager at Rockefeller & Co. and Scudder, Stevens & Clark. Board member of the Harding Loevner Funds from 1996 to 2014, serving as both Lead Independent Director and chair of the Audit Committee. Board member of the Russell Exchange Traded Funds Trust from 2011 to 2012 and the chair of the Audit Committee. Ms. Freeman is also an inactive Chartered Financial Analyst. | N/A |
Isaiah Harris, Jr.
(Born 1952) | Trustee,
since 2009; Audit
Committee
Chair,
since 2019 | Retired. Member of the Advisory Board of CEF of East Central Florida. Chairman of the Board of CIGNA Corporation from 2009 to 2021, and Director from 2005 to 2008. From 2003 to 2011, Director of Deluxe Corporation. Prior thereto, President and CEO of BellSouth Advertising and Publishing Corp. from 2005 to 2007, President and CEO of BellSouth Enterprises from 2004 to 2005 and President of BellSouth Consumer Services from 2000 to 2003. Emeritus member of the Iowa State University Foundation Board of Governors. Emeritus Member of the Advisory Board of Iowa State University School of Business. Advisory Board Member, Palm Harbor Academy (private school). Advisory Board Member, Fellowship of Christian Athletes. Mr. Harris is a certified public accountant (inactive status). | N/A |
David F. Larcker
(Born 1950) | Trustee,
since 2009 | Distinguished Visiting Fellow at the Hoover Institution since 2022. James Irvin Miller Professor of Accounting at the Graduate School of Business (Emeritus), Stanford University, Director of the Corporate Governance Research Initiative and Senior Faculty of The Rock Center for Corporate Governance since 2006. From 2005 to 2008, Professor of Accounting at the Graduate School of Business, Stanford University. Prior thereto, Ernst & Young Professor of Accounting at The Wharton School, University of Pennsylvania from 1985 to 2005. | N/A |
32 | Allspring Government Securities Fund
Other information (unaudited)
Name and
year of birth | Position held and
length of service* | Principal occupations during past five years or longer | Current other
public company or
investment
company
directorships |
Olivia S. Mitchell
(Born 1953) | Trustee,
since 2006;
Nominating and
Governance
Committee Chair,
since 2018 | International Foundation of Employee Benefit Plans Professor since 1993, Wharton School of the University of Pennsylvania. Director of Wharton’s Pension Research Council and Boettner Center on Pensions & Retirement Research, and Research Associate at the National Bureau of Economic Research. Previously taught at Cornell University from 1978 to 1993. | N/A |
Timothy J. Penny
(Born 1951) | Trustee,
since 1996;
Chair,
since 2018 | President and Chief Executive Officer of Southern Minnesota Initiative Foundation, a non-profit organization, since 2007. Vice Chair of the Economic Club of Minnesota, since 2007. Co-Chair of the Committee for a Responsible Federal Budget, since 1995. Member of the Board of Trustees of NorthStar Education Finance, Inc., a non-profit organization, from 2007-2022. Senior Fellow of the University of Minnesota Humphrey Institute from 1995 to 2017. | N/A |
James G. Polisson
(Born 1959) | Trustee,
since 2018 | Retired. Chief Marketing Officer, Source (ETF) UK Services, Ltd, from 2015 to 2017. From 2012 to 2015, Principal of The Polisson Group, LLC, a management consulting, corporate advisory and principal investing company. Chief Executive Officer and Managing Director at Russell Investments, Global Exchange Traded Funds from 2010 to 2012. Managing Director of Barclays Global Investors from 1998 to 2010 and Global Chief Marketing Officer for iShares and Barclays Global Investors from 2000 to 2010. Trustee of the San Francisco Mechanics’ Institute, a non-profit organization, from 2013 to 2015. Board member of the Russell Exchange Traded Fund Trust from 2011 to 2012. Director of Barclays Global Investors Holdings Deutschland GmbH from 2006 to 2009. Mr. Polisson is an attorney and has a retired status with the Massachusetts and District of Columbia Bar Associations. | N/A |
Pamela Wheelock
(Born 1959) | Trustee,
since January
2020; previously
Trustee from
January 2018 to
July 2019 | Retired. Executive and Senior Financial leadership positions in the public, private and nonprofit sectors. Interim President and CEO, McKnight Foundation, 2020. Interim Commissioner, Minnesota Department of Human Services, 2019. Chief Operating Officer, Twin Cities Habitat for Humanity, 2017-2019. Vice President for University Services, University of Minnesota, 2012-2016. Interim President and CEO, Blue Cross and Blue Shield of Minnesota, 2011-2012. Executive Vice-President and Chief Financial Officer, Minnesota Wild, 2002-2008. Commissioner, Minnesota Department of Finance, 1999-2002. Chair of the Board of Directors of Destination Medical Center Corporation. Board member of the Minnesota Wild Foundation. | N/A |
* Length of service dates reflect the Trustee’s commencement of service with the Trust’s predecessor entities, where applicable.
Allspring Government Securities Fund | 33
Other information (unaudited)
Officers2
Name and
year of birth | Position held and
length of service | Principal occupations during past five years or longer |
Andrew Owen
(Born 1960) | President,
since 2017 | President and Chief Executive Officer of Allspring Funds Management, LLC since 2017 and Head of Global Fund Governance of Allspring Global Investments since 2022. Prior thereto, co-president of Galliard Capital Management, LLC, an affiliate of Allspring Funds Management, LLC, from 2019 to 2022 and Head of Affiliated Managers, Allspring Global Investments, from 2014 to 2019 and Executive Vice President responsible for marketing, investments and product development for Allspring Funds Management, LLC, from 2009 to 2014. |
Jeremy DePalma
(Born 1974) | Treasurer,
since 2012
(for certain funds in
the Fund Complex);
since 2021 (for
the remaining funds in the
Fund Complex) | Senior Vice President of Allspring Funds Management, LLC since 2009. Senior Vice President of Evergreen Investment Management Company, LLC from 2008 to 2010 and head of the Fund Reporting and Control Team within Fund Administration from 2005 to 2010. |
Christopher Baker
(Born 1976) | Chief Compliance Officer, since 2022 | Global Chief Compliance Officer for Allspring Global Investments since 2022. Prior thereto, Chief Compliance Officer for State Street Global Advisors from 2018 to 2021. Senior Compliance Officer for the State Street divisions of Alternative Investment Solutions, Sector Solutions, and Global Marketing from 2015 to 2018. From 2010 to 2015 Vice President, Global Head of Investment and Marketing Compliance for State Street Global Advisors. |
Matthew Prasse
(Born 1983) | Chief Legal Officer, since 2022; Secretary, since 2021 | Senior Counsel of the Allspring Legal Department since 2021. Senior Counsel of the Wells Fargo Legal Department from 2018 to 2021. Previously, Counsel for Barings LLC from 2015 to 2018. Prior to joining Barings, Associate at Morgan, Lewis & Bockius LLP from 2008 to 2015. |
1 The Statement of Additional Information includes additional information about the Trustees and is available, without charge, upon request, by calling 1-800-222-8222 or by visiting the website at allspringglobal.com.
2 For those Officers with tenures at Allspring Global Investments and/or Allspring Funds Management, LLC that began prior to 2021, such tenures include years of service during which these businesses/entities were known as Wells Fargo Asset Management and Wells Fargo Funds Management, LLC, respectively.
34 | Allspring Government Securities Fund
For more information
More information about Allspring Funds is available free upon request. To obtain literature, please write, visit the Fund's website, or call:
Allspring Funds
P.O. Box 219967
Kansas City, MO 64121-9967
Website: allspringglobal.com
Individual investors: 1-800-222-8222
Retail investment professionals: 1-888-877-9275
Institutional investment professionals: 1-800-260-5969
This report and the financial statements contained herein are submitted for the general information of the shareholders of the Fund. If this report is used for promotional purposes, distribution of the report must be accompanied or preceded by a current prospectus. Before investing, please consider the investment objectives, risks, charges, and expenses of the investment. For a current prospectus and, if available, a summary prospectus, containing this information, call
1-800-222-8222 or visit the Fund's website at allspringglobal.com. Read the prospectus carefully before you invest or send money.
Allspring Global InvestmentsTM is the trade name for the asset management firms of Allspring Global Investments Holdings, LLC, a holding company indirectly owned by certain private funds of GTCR LLC and Reverence Capital Partners, L.P. These firms include but are not limited to Allspring Global Investments, LLC, and Allspring Funds Management, LLC. Certain products managed by Allspring entities are distributed by Allspring Funds Distributor, LLC (a broker-dealer and Member FINRA/SIPC).
This material is for general informational and educational purposes only and is NOT intended to provide investment advice or a recommendation of any kind - including a recommendation for any specific investment, strategy, or plan.
© 2023 Allspring Global Investments Holdings, LLC. All rights reserved.
ALL-03102023-gbjw1iew 04-23
SAR3004 02-23
Semi-Annual Report
February 28, 2023
Allspring High Yield Bond Fund
The views expressed and any forward-looking statements are as of February 28, 2023, unless otherwise noted, and are those of the Fund's portfolio managers and/or Allspring Global Investments. Discussions of individual securities or the markets generally are not intended as individual recommendations. Future events or results may vary significantly from those expressed in any forward-looking statements. The views expressed are subject to change at any time in response to changing circumstances in the market. Allspring Global Investments disclaims any obligation to publicly update or revise any views expressed or forward-looking statements.
Allspring High Yield Bond Fund | 1
Letter to shareholders (unaudited)
Andrew Owen
President
Allspring Funds
Dear Shareholder:
We are pleased to offer you this semi-annual report for the Allspring High Yield Bond Fund for the six-month period that ended February 28, 2023. Globally, stocks and bonds experienced heightened volatility through the challenging period. Earlier tailwinds provided by global stimulus programs, vaccination rollouts, and recovering consumer and corporate sentiment were wiped away by the highest rate of inflation in four decades as well as the impact of ongoing aggressive central bank rate hikes and the prospect of more rate hikes. Compounding these concerns were the global reverberations of the Russia-Ukraine war and the impact of China’s strict COVID-19 lockdowns.
For the six-month period, stocks and bonds had mixed results, with non-U.S. equities––both developed market and emerging market––outperforming U.S. stocks overall. Bonds––both U.S. and non-U.S.––began to recover from sustained aggressive interest rate increases. After suffering deep and broad losses over the past year, recent fixed income performance benefited from a base of higher yields that can now generate higher income. For the period, U.S. stocks, based on the S&P 500 Index,1 returned 1.26%. International stocks, as measured by the MSCI ACWI ex USA Index (Net),2 returned 7.30%, while the MSCI EM Index (Net) (USD)3 lost 2.29%. Among bond indexes, the Bloomberg U.S. Aggregate Bond Index4 returned -2.13%, the Bloomberg Global Aggregate ex-USD Index (unhedged)5 returned -0.11%, the Bloomberg Municipal Bond Index6 gained 0.66%, and the ICE BofA U.S. High Yield Index7 returned 2.41%.
The Russia-Ukraine war, high inflation, and central bank rate hikes rocked markets
A challenging calendar year for investors continued in September as all asset classes suffered major losses. Central banks kept up their battle against rapidly rising prices with more rate hikes. The strength of the U.S. dollar weighed on results for investors holding non-U.S.-dollar assets. U.S. mortgage rates jumped to near 7% on 30-year fixed-rate mortgages; the decreased housing affordability began to cool demand somewhat. The U.K. experienced a sharp sell-off of government bonds and the British pound in September as investors panicked in response to a new government budget that was seen as financially unsound. The Bank of England (BoE) then stepped in and bought long-dated government bonds.
“ A challenging calendar year for investors continued in September as all asset classes suffered major losses.”
| 1 | The S&P 500 Index consists of 500 stocks chosen for market size, liquidity, and industry group representation. It is a market-value-weighted index with each stock's weight in the index proportionate to its market value. You cannot invest directly in an index. |
| 2 | The Morgan Stanley Capital International (MSCI) All Country World Index (ACWI) ex USA Index (Net) is a free-float-adjusted market-capitalization-weighted index that is designed to measure the equity market performance of developed and emerging markets, excluding the U.S. Source: MSCI. MSCI makes no express or implied warranties or representations and shall have no liability whatsoever with respect to any MSCI data contained herein. The MSCI data may not be further redistributed or used as a basis for other indexes or any securities or financial products. This report is not approved, reviewed, or produced by MSCI. You cannot invest directly in an index. |
| 3 | The MSCI Emerging Markets (EM) Index (Net) (USD) is a free-float-adjusted market-capitalization-weighted index that is designed to measure equity market performance of emerging markets. You cannot invest directly in an index. |
| 4 | The Bloomberg U.S. Aggregate Bond Index is a broad-based benchmark that measures the investment-grade, U.S.-dollar-denominated, fixed-rate taxable bond market, including Treasuries, government-related and corporate securities, mortgage-backed securities (agency fixed-rate and hybrid adjustable-rate mortgage pass-throughs), asset-backed securities, and commercial mortgage-backed securities. You cannot invest directly in an index. |
| 5 | The Bloomberg Global Aggregate ex-USD Index (unhedged) is an unmanaged index that provides a broad-based measure of the global investment-grade fixed-income markets excluding the U.S.-dollar-denominated debt market. You cannot invest directly in an index. |
| 6 | The Bloomberg Municipal Bond Index is an unmanaged index composed of long-term tax-exempt bonds with a minimum credit rating of Baa. You cannot invest directly in an index. |
| 7 | The ICE BofA U.S. High Yield Index is a market-capitalization-weighted index of domestic and Yankee high-yield bonds. The index tracks the performance of high-yield securities traded in the U.S. bond market. You cannot invest directly in an index. Copyright 2023. ICE Data Indices, LLC. All rights reserved. |
2 | Allspring High Yield Bond Fund
Letter to shareholders (unaudited)
Equities had a reprieve in October. Value stocks and small caps fared best. Globally, developed markets outpaced emerging market equities, which were hurt by weakness among Chinese stocks. Central banks continued to try to curtail high inflation with aggressive interest rate hikes. Geopolitical risks persisted, including the ongoing Russia-Ukraine war and economic, financial market, and political turmoil in the U.K. Concerns over Europe’s energy crisis eased thanks to unseasonably warm weather and plentiful gas on hand. The U.S. labor market continued its resilience against rising prices as unemployment remained near a record low.
Stocks and bonds rallied in November. Economic news was encouraging, driven by U.S. labor market strength. Although central banks kept raising rates, hopes rose for an easing in the pace of rate hikes and a possible end to central bank monetary tightening in 2023. Although inflation remained at record highs in the eurozone, we began to see signs of a possible decline in inflationary pressures as U.S. inflation moderated, with a 7.1% annual price rise in November and a monthly price increase of just 0.1%. China’s economic data remained weak, reflecting its zero-COVID-19 policy.
Financial markets cooled in December, with U.S. equities posting negative overall results in response to a weakening U.S. dollar. Fixed income securities ended one of their worst years ever with flat overall monthly returns as markets weighed the hopes for an end to the monetary tightening cycle with the reality that central banks had not completed their jobs yet. U.S. Consumer Price Index (CPI)1 data showed a strong consistent trend downward, which brought down the 12-month CPI to 6.5% in December from 9.1% in June. Other countries and regions reported still-high but declining inflation rates as the year winded down.
The year 2023 began with a rally across global equities and fixed income securities. Investor optimism rose in response to data indicating declining inflation rates and the reopening of China’s economy with the abrupt end to its zero-COVID-19 policy. The U.S. reported surprisingly strong job gains––employers added more than 500,000 jobs––and unemployment fell to 3.4%, the lowest level since 1969. Meanwhile, wage growth, seen as a potential contributor to ongoing high inflation, continued to moderate. All eyes remained fixed on the Federal Reserve (Fed) and on how many more rate hikes remain in this tightening cycle. The 0.25% federal funds rate hike announced in January was the Fed’s smallest rate increase since March 2022.
Financial markets declined in February as investors responded unfavorably to resilient economic data. The takeaway: Central banks will likely continue their monetary tightening cycle for longer than markets had priced in. In this environment—where strong economic data is seen as bad news—the resilient U.S. labor market was seen as a negative while the inflation rate has not been falling quickly enough for the Fed, which raised interest rates by 0.25% in early February. Meanwhile, the BoE and the European Central Bank both raised rates by 0.50%. At this stage in the economic cycle, the overriding question remained: “What will central banks do?” In February, the answer appeared to be: “Move rates higher for longer.”
| 1 | The Consumer Price Index (CPI) is a measure of the average change over time in the prices paid by urban consumers for a market basket of consumer goods and services. You cannot invest directly in an index. |
Allspring High Yield Bond Fund | 3
Letter to shareholders (unaudited)
Don’t let short-term uncertainty derail long-term investment goals.
Periods of investment uncertainty can present challenges, but experience has taught us that maintaining long-term investment goals can be an effective way to plan for the future. To help you create a sound strategy based on your personal goals and risk tolerance, Allspring Funds offers more than 100 mutual funds spanning a wide range of asset classes and investment styles. Although diversification cannot guarantee an investment profit or prevent losses, we believe it can be an effective way to manage investment risk and potentially smooth out overall portfolio performance. We encourage investors to know their investments and to understand that appropriate levels of risk-taking may unlock opportunities.
Thank you for choosing to invest with Allspring Funds. We appreciate your confidence in us and remain committed to helping you meet your financial needs.
Sincerely,
Andrew Owen
President
Allspring Funds
For further information about your fund, contact your investment professional, visit our website at allspringglobal.com, or call us directly at 1-800-222-8222.
4 | Allspring High Yield Bond Fund
This page is intentionally left blank.
Performance highlights (unaudited)
| Investment objective | The Fund seeks total return, consisting of a high level of current income and capital appreciation. |
| Manager | Allspring Funds Management, LLC |
| Subadviser | Allspring Global Investments, LLC |
| Portfolio managers | Chris Lee, CFA®‡, Michael J. Schueller, CFA®‡ |
| Average annual total returns (%) as of February 28, 2023 |
| | | Including sales charge | | Excluding sales charge | | Expense ratios1 (%) |
| | Inception date | 1 year | 5 year | 10 year | | 1 year | 5 year | 10 year | | Gross | Net 2 |
| Class A (EKHAX) | 1-20-1998 | -9.83 | 0.58 | 2.62 | | -5.68 | 1.52 | 3.08 | | 1.01 | 0.93 |
| Class C (EKHCX) | 1-21-1998 | -7.68 | 0.76 | 2.49 | | -6.68 | 0.76 | 2.49 | | 1.76 | 1.68 |
| Administrator Class (EKHYX) | 4-14-1998 | – | – | – | | -5.85 | 1.65 | 3.25 | | 0.95 | 0.80 |
| Institutional Class (EKHIX)3 | 10-31-2014 | – | – | – | | -5.60 | 1.92 | 3.44 | | 0.68 | 0.53 |
| ICE BofA U.S. High Yield Constrained Index4 | – | – | – | – | | -5.45 | 2.69 | 4.02 | | – | – |
Figures quoted represent past performance, which is no guarantee of future results, and do not reflect taxes that a shareholder may pay on an investment in a fund. Investment return and principal value of an investment will fluctuate so that an investor’s shares, when redeemed, may be worth more or less than their original cost. Performance shown without sales charges would be lower if sales charges were reflected. Current performance may be lower or higher than the performance data quoted, which assumes the reinvestment of dividends and capital gains. Current month-end performance is available on the Fund’s website, allspringglobal.com.
Index returns do not include transaction costs associated with buying and selling securities, any mutual fund fees or expenses, or any taxes. It is not possible to invest directly in an index.
For Class A shares, the maximum front-end sales charge is 4.50%. For Class C shares, the maximum contingent deferred sales charge is 1.00%. Performance including a contingent deferred sales charge assumes the sales charge for the corresponding time period. Administrator Class and Institutional Class shares are sold without a front-end sales charge or contingent deferred sales charge.
| 1 | Reflects the expense ratios as stated in the most recent prospectuses. The expense ratios shown are subject to change and may differ from the annualized expense ratios shown in the financial highlights of this report. |
| 2 | The manager has contractually committed through December 31, 2023, to waive fees and/or reimburse expenses to the extent necessary to cap total annual fund operating expenses after fee waivers at 0.93% for Class A, 1.68% for Class C, 0.80% for Administrator Class, and 0.53% for Institutional Class. Brokerage commissions, stamp duty fees, interest, taxes, acquired fund fees and expenses (if any), and extraordinary expenses are excluded from the expense caps. Prior to or after the commitment expiration date, the caps may be increased or the commitment to maintain the caps may be terminated only with the approval of the Board of Trustees. Without these caps, the Fund’s returns would have been lower. The expense ratio paid by an investor is the net expense ratio (the total annual fund operating expenses after fee waivers) as stated in the prospectuses. |
| 3 | Historical performance shown for the Institutional Class shares prior to their inception reflects the performance of the Administrator Class shares, and includes the higher expenses applicable to the Administrator Class shares. If these expenses had not been included, returns for the Institutional Class shares would be higher. |
| 4 | The ICE BofA U.S. High Yield Constrained Index is a market value-weighted index of all domestic and Yankee high-yield bonds, including deferred interest bonds and payment-in kind securities. Issues included in the index have maturities of one year or more and have a credit rating lower than BBB–/Baa3, but are not in default. The ICE BofA U.S. High Yield Constrained Index limits any individual issuer to a maximum of 2% benchmark exposure. You cannot invest directly in an index. Copyright 2023. ICE Data Indices, LLC. All rights reserved. |
Bond values fluctuate in response to the financial condition of individual issuers, general market and economic conditions, and changes in interest rates. Changes in market conditions and government policies may lead to periods of heightened volatility in the bond market and reduced liquidity for certain bonds held by the Fund. In general, when interest rates rise, bond values fall and investors may lose principal value. Interest rate changes and their impact on the Fund and its share price can be sudden and unpredictable. The use of derivatives may reduce returns and/or increase volatility. High-yield securities have a greater risk of default and tend to be more volatile than higher-rated debt securities. Loans are subject to risks similar to those associated with other below-investment-grade bond investments, such as credit risk (for example, risk of issuer default), below-investment-grade bond risk (for example, risk of greater volatility in value), and risk that the loan may become illiquid or difficult to price. This fund is exposed to foreign investment risk. Consult the Fund’s prospectus for additional information on these and other risks.
| ‡ | CFA® and Chartered Financial Analyst® are trademarks owned by CFA Institute. |
6 | Allspring High Yield Bond Fund
Performance highlights (unaudited)
| Ten largest holdings (%) as of February 28, 20231 |
| Enviva Partners LP, 6.50%, 1-15-2026 | 1.61 |
| Gray Escrow II Incorporated, 5.38%, 11-15-2031 | 1.47 |
| Enact Holdings Incorporated, 6.50%, 8-15-2025 | 1.34 |
| Occidental Petroleum Corporation, 6.45%, 9-15-2036 | 1.27 |
| PG&E Corporation, 5.25%, 7-1-2030 | 1.26 |
| The Geo Group Incorporated, 11.74%, 3-23-2027 | 1.26 |
| CoreCivic Incorporated, 8.25%, 4-15-2026 | 1.25 |
| CCM Merger Incorporated , 6.38%, 5-1-2026 | 1.22 |
| TerraForm Power Operating LLC, 5.00%, 1-31-2028 | 1.17 |
| GIP III Stetson I LP, 8.88%, 7-18-2025 | 1.14 |
| 1 | Figures represent the percentage of the Fund's net assets. Holdings are subject to change and may have changed since the date specified. |
| Credit quality as of February 28, 20231 |
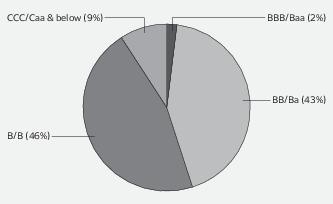
| 1 | The credit quality distribution of portfolio holdings reflected in the chart is based on ratings from Standard & Poor’s, Moody’s Investors Service, and/or Fitch Ratings Ltd. Credit quality ratings apply to the underlying holdings of the Fund and not to the Fund itself. The percentages of the portfolio with the ratings depicted in the chart are calculated based on the market value of fixed income securities held by the Fund. If a security was rated by all three rating agencies, the middle rating was utilized. If rated by two of the three rating agencies, the lower rating was utilized, and if rated by one of the rating agencies, that rating was utilized. Standard & Poor’s rates the creditworthiness of bonds, ranging from AAA (highest) to D (lowest). Ratings from A to CCC may be modified by the addition of a plus (+) or minus (-) sign to show relative standing within the rating categories. Standard & Poor’s rates the creditworthiness of short-term notes from SP-1 (highest) to SP-3 (lowest). Moody’s rates the creditworthiness of bonds, ranging from Aaa (highest) to C (lowest). Ratings Aa to B may be modified by the addition of a number 1 (highest) to 3 (lowest) to show relative standing within the ratings categories. Moody’s rates the creditworthiness of short-term U.S. tax-exempt municipal securities from MIG 1/VMIG 1 (highest) to SG (lowest). Fitch rates the creditworthiness of bonds, ranging from AAA (highest) to D (lowest). Credit quality distribution is subject to change and may have changed since the date specified. |
Allspring High Yield Bond Fund | 7
Fund expenses (unaudited)
As a shareholder of the Fund, you incur two types of costs: (1) transaction costs, including sales charges (loads) on purchase payments and contingent deferred sales charges (if any) on redemptions and (2) ongoing costs, including management fees, distribution (12b-1) and/or shareholder servicing fees, and other Fund expenses. This example is intended to help you understand your ongoing costs (in dollars) of investing in the Fund and to compare these costs with the ongoing costs of investing in other mutual funds.
The example is based on an investment of $1,000 invested at the beginning of the six-month period and held for the entire period from September 1, 2022 to February 28, 2023.
Actual expenses
The “Actual” line of the table below provides information about actual account values and actual expenses. You may use the information in this line, together with the amount you invested, to estimate the expenses that you paid over the period. Simply divide your account value by $1,000 (for example, an $8,600 account value divided by $1,000 = 8.6), then multiply the result by the number in the “Actual” line under the heading entitled “Expenses paid during period” for your applicable class of shares to estimate the expenses you paid on your account during this period.
Hypothetical example for comparison purposes
The “Hypothetical” line of the table below provides information about hypothetical account values and hypothetical expenses based on the Fund’s actual expense ratio and an assumed rate of return of 5% per year before expenses, which is not the Fund’s actual return. The hypothetical account values and expenses may not be used to estimate the actual ending account balance or expenses you paid for the period. You may use this information to compare the ongoing costs of investing in the Fund and other funds. To do so, compare this 5% hypothetical example with the 5% hypothetical examples that appear in the shareholder reports of the other funds.
Please note that the expenses shown in the table are meant to highlight your ongoing costs only and do not reflect any transactional costs, such as sales charges (loads) and contingent deferred sales charges. Therefore, the “Hypothetical” line of the table is useful in comparing ongoing costs only, and will not help you determine the relative total costs of owning different funds. In addition, if these transactional costs were included, your costs would have been higher.
| | Beginning
account value
9-1-2022 | Ending
account value
2-28-2023 | Expenses
paid during
the period1 | Annualized net
expense ratio |
| Class A | | | | |
| Actual | $1,000.00 | $1,027.88 | $4.68 | 0.93% |
| Hypothetical (5% return before expenses) | $1,000.00 | $1,020.18 | $4.66 | 0.93% |
| Class C | | | | |
| Actual | $1,000.00 | $1,020.57 | $8.42 | 1.68% |
| Hypothetical (5% return before expenses) | $1,000.00 | $1,016.46 | $8.40 | 1.68% |
| Administrator Class | | | | |
| Actual | $1,000.00 | $1,028.52 | $4.02 | 0.80% |
| Hypothetical (5% return before expenses) | $1,000.00 | $1,020.83 | $4.01 | 0.80% |
| Institutional Class | | | | |
| Actual | $1,000.00 | $1,029.90 | $2.67 | 0.53% |
| Hypothetical (5% return before expenses) | $1,000.00 | $1,022.17 | $2.66 | 0.53% |
1 Expenses paid is equal to the annualized net expense ratio of each class multiplied by the average account value over the period, multiplied by 181 divided by 365 (to reflect the one-half-year period).
8 | Allspring High Yield Bond Fund
Portfolio of investments—February 28, 2023 (unaudited)
| | | | | Shares | Value |
| Common stocks: 0.24% | | | | | |
| Energy: 0.17% | | | | | |
| Oil, gas & consumable fuels: 0.17% | | | | | |
| Denbury Incorporated † | | | | 6,070 | $ 506,056 |
| Financials: 0.07% | | | | | |
| Mortgage REITs: 0.07% | | | | | |
| Starwood Property Trust Incorporated | | | | 11,000 | 210,760 |
| Total Common stocks (Cost $691,705) | | | | | 716,816 |
| | | Interest
rate | Maturity
date | Principal | |
| Corporate bonds and notes: 82.17% | | | | | |
| Communication services: 14.65% | | | | | |
| Diversified telecommunication services: 0.81% | | | | | |
| Cablevision Lightpath LLC 144A | | 3.88% | 9-15-2027 | $ 860,000 | 701,038 |
| Cablevision Lightpath LLC 144A | | 5.63 | 9-15-2028 | 800,000 | 596,000 |
| Level 3 Financing Incorporated 144A | | 3.63 | 1-15-2029 | 1,775,000 | 1,138,982 |
| | | | | | 2,436,020 |
| Entertainment: 1.13% | | | | | |
| Dave & Buster's Incorporated 144A | | 7.63 | 11-1-2025 | 535,000 | 542,356 |
| Live Nation Entertainment Incorporated 144A | | 3.75 | 1-15-2028 | 575,000 | 499,968 |
| Live Nation Entertainment Incorporated 144A | | 5.63 | 3-15-2026 | 670,000 | 644,962 |
| Live Nation Entertainment Incorporated 144A | | 6.50 | 5-15-2027 | 1,735,000 | 1,705,939 |
| | | | | | 3,393,225 |
| Media: 12.71% | | | | | |
| CCO Holdings LLC 144A | | 4.25 | 1-15-2034 | 3,175,000 | 2,376,654 |
| CCO Holdings LLC 144A | | 4.50 | 8-15-2030 | 3,000,000 | 2,467,560 |
| CCO Holdings LLC 144A | | 5.00 | 2-1-2028 | 975,000 | 883,594 |
| CCO Holdings LLC 144A | | 5.13 | 5-1-2027 | 1,975,000 | 1,827,408 |
| Cinemark USA Incorporated 144A« | | 5.25 | 7-15-2028 | 1,675,000 | 1,407,419 |
| Cinemark USA Incorporated 144A | | 8.75 | 5-1-2025 | 1,965,000 | 2,004,695 |
| Clear Channel Outdoor Holdings 144A | | 7.50 | 6-1-2029 | 1,865,000 | 1,510,650 |
| CSC Holdings LLC 144A | | 4.13 | 12-1-2030 | 1,670,000 | 1,206,876 |
| CSC Holdings LLC 144A | | 5.75 | 1-15-2030 | 2,725,000 | 1,560,689 |
| DIRECTV Financing LLC 144A | | 5.88 | 8-15-2027 | 1,675,000 | 1,497,481 |
| DISH DBS Corporation 144A | | 5.75 | 12-1-2028 | 1,225,000 | 978,530 |
| DISH Network Corporation 144A | | 11.75 | 11-15-2027 | 1,475,000 | 1,494,507 |
| Gray Escrow II Incorporated 144A | | 5.38 | 11-15-2031 | 5,975,000 | 4,436,145 |
| Match Group Holdings II LLC 144A« | | 5.63 | 2-15-2029 | 2,495,000 | 2,298,612 |
| Nexstar Broadcasting Incorporated 144A | | 4.75 | 11-1-2028 | 950,000 | 830,557 |
| Nexstar Broadcasting Incorporated 144A | | 5.63 | 7-15-2027 | 905,000 | 840,503 |
| Outfront Media Capital Corporation 144A | | 4.63 | 3-15-2030 | 1,275,000 | 1,042,363 |
| Outfront Media Capital Corporation 144A | | 5.00 | 8-15-2027 | 1,250,000 | 1,128,125 |
| QVC Incorporated | | 4.38 | 9-1-2028 | 1,330,000 | 741,063 |
| QVC Incorporated | | 4.75 | 2-15-2027 | 1,220,000 | 780,800 |
| QVC Incorporated | | 5.95 | 3-15-2043 | 700,000 | 336,218 |
| Scripps Escrow II Incorporated 144A« | | 5.38 | 1-15-2031 | 1,625,000 | 1,150,468 |
| Scripps Escrow II Incorporated 144A | | 5.88 | 7-15-2027 | 1,800,000 | 1,441,299 |
The accompanying notes are an integral part of these financial statements.
Allspring High Yield Bond Fund | 9
Portfolio of investments—February 28, 2023 (unaudited)
| | | Interest
rate | Maturity
date | Principal | Value |
| Media (continued) | | | | | |
| Sirius XM Radio Incorporated 144A | | 4.13% | 7-1-2030 | $1,860,000 | $ 1,511,677 |
| Townsquare Media Incorporated 144A | | 6.88 | 2-1-2026 | 2,815,000 | 2,579,308 |
| | | | | | 38,333,201 |
| Consumer discretionary: 12.65% | | | | | |
| Auto components: 0.06% | | | | | |
| Clarios Global LP 144A | | 6.25 | 5-15-2026 | 176,000 | 172,744 |
| Automobiles: 0.55% | | | | | |
| Ford Motor Company | | 3.25 | 2-12-2032 | 1,035,000 | 784,641 |
| Ford Motor Company | | 4.75 | 1-15-2043 | 1,200,000 | 875,156 |
| | | | | | 1,659,797 |
| Hotels, restaurants & leisure: 7.27% | | | | | |
| Carnival Corporation 144A | | 4.00 | 8-1-2028 | 1,175,000 | 993,392 |
| Carnival Corporation 144A | | 6.00 | 5-1-2029 | 1,925,000 | 1,499,190 |
| Carnival Corporation 144A | | 9.88 | 8-1-2027 | 1,850,000 | 1,883,282 |
| Carnival Holdings Bermuda Limited 144A | | 10.38 | 5-1-2028 | 2,275,000 | 2,434,250 |
| CCM Merger Incorporated 144A | | 6.38 | 5-1-2026 | 3,845,000 | 3,689,802 |
| Churchill Downs Incorporated 144A | | 4.75 | 1-15-2028 | 1,655,000 | 1,506,492 |
| MGM Resorts International | | 6.75 | 5-1-2025 | 635,000 | 636,568 |
| NCL Corporation Limited 144A | | 5.88 | 3-15-2026 | 1,945,000 | 1,682,425 |
| NCL Corporation Limited 144A | | 5.88 | 2-15-2027 | 1,310,000 | 1,215,025 |
| NCL Corporation Limited 144A« | | 7.75 | 2-15-2029 | 830,000 | 722,515 |
| Royal Caribbean Cruises Limited 144A | | 5.38 | 7-15-2027 | 200,000 | 175,787 |
| Royal Caribbean Cruises Limited 144A | | 5.50 | 4-1-2028 | 2,655,000 | 2,314,098 |
| Royal Caribbean Cruises Limited 144A | | 9.25 | 1-15-2029 | 905,000 | 959,961 |
| Royal Caribbean Cruises Limited 144A | | 11.63 | 8-15-2027 | 2,075,000 | 2,209,958 |
| | | | | | 21,922,745 |
| Household durables: 0.39% | | | | | |
| Toll Brothers Finance Corporation | | 4.35 | 2-15-2028 | 1,260,000 | 1,160,449 |
| Multiline retail: 1.09% | | | | | |
| LSF9 Atlantis Holdings LLC 144A | | 7.75 | 2-15-2026 | 2,430,000 | 2,136,720 |
| Macy's Retail Holdings LLC 144A« | | 5.88 | 4-1-2029 | 945,000 | 858,400 |
| Macy's Retail Holdings LLC 144A | | 6.13 | 3-15-2032 | 355,000 | 305,300 |
| | | | | | 3,300,420 |
| Specialty retail: 2.46% | | | | | |
| Bath & Body Works Incorporated 144A | | 9.38 | 7-1-2025 | 635,000 | 671,513 |
| Michaels Companies Incorporated 144A | | 7.88 | 5-1-2029 | 1,980,000 | 1,489,950 |
| NMG Holding Company Incorporated 144A | | 7.13 | 4-1-2026 | 1,325,000 | 1,278,625 |
| PetSmart Incorporated 144A | | 4.75 | 2-15-2028 | 2,510,000 | 2,284,616 |
| Rent-A-Center Incorporated 144A« | | 6.38 | 2-15-2029 | 1,980,000 | 1,698,583 |
| | | | | | 7,423,287 |
| Textiles, apparel & luxury goods: 0.83% | | | | | |
| G-III Apparel Group Limited 144A | | 7.88 | 8-15-2025 | 2,640,000 | 2,488,200 |
The accompanying notes are an integral part of these financial statements.
10 | Allspring High Yield Bond Fund
Portfolio of investments—February 28, 2023 (unaudited)
| | | Interest
rate | Maturity
date | Principal | Value |
| Consumer staples: 0.62% | | | | | |
| Food products: 0.62% | | | | | |
| CHS Incorporated 144A | | 5.25% | 5-15-2030 | $1,055,000 | $ 844,127 |
| US Foods Incorporated 144A | | 6.25 | 4-15-2025 | 1,025,000 | 1,021,253 |
| | | | | | 1,865,380 |
| Energy: 15.77% | | | | | |
| Energy equipment & services: 3.73% | | | | | |
| Bristow Group Incorporated 144A | | 6.88 | 3-1-2028 | 3,025,000 | 2,847,644 |
| Hilcorp Energy Company 144A | | 5.75 | 2-1-2029 | 490,000 | 443,450 |
| Hilcorp Energy Company 144A | | 6.00 | 4-15-2030 | 350,000 | 317,517 |
| Hilcorp Energy Company 144A | | 6.25 | 11-1-2028 | 610,000 | 566,744 |
| Hilcorp Energy Company 144A | | 6.25 | 4-15-2032 | 350,000 | 317,377 |
| Oceaneering International Incorporated | | 4.65 | 11-15-2024 | 900,000 | 866,322 |
| Oceaneering International Incorporated | | 6.00 | 2-1-2028 | 1,875,000 | 1,778,663 |
| Pattern Energy Operations LP 144A | | 4.50 | 8-15-2028 | 3,250,000 | 2,902,283 |
| USA Compression Partners LP | | 6.88 | 4-1-2026 | 1,150,000 | 1,102,149 |
| USA Compression Partners LP | | 6.88 | 9-1-2027 | 100,000 | 94,684 |
| | | | | | 11,236,833 |
| Oil, gas & consumable fuels: 12.04% | | | | | |
| Aethon United 144A | | 8.25 | 2-15-2026 | 1,600,000 | 1,538,931 |
| Archrock Partners LP 144A | | 6.25 | 4-1-2028 | 415,000 | 393,951 |
| Archrock Partners LP 144A | | 6.88 | 4-1-2027 | 1,650,000 | 1,600,715 |
| Buckeye Partners LP 144A | | 4.50 | 3-1-2028 | 1,025,000 | 900,062 |
| CQP Holdco LP 144A | | 5.50 | 6-15-2031 | 2,075,000 | 1,820,813 |
| DT Midstream Incorporated 144A | | 4.38 | 6-15-2031 | 2,475,000 | 2,072,813 |
| Encino Acquisition Partners Company 144A | | 8.50 | 5-1-2028 | 3,080,000 | 2,690,349 |
| EnLink Midstream Partners LP | | 5.38 | 6-1-2029 | 1,200,000 | 1,114,278 |
| EnLink Midstream Partners LP 144A | | 6.50 | 9-1-2030 | 1,050,000 | 1,034,177 |
| Enviva Partners LP 144A | | 6.50 | 1-15-2026 | 5,175,000 | 4,851,356 |
| EQM Midstream Partners 144A | | 7.50 | 6-1-2027 | 20,000 | 19,600 |
| EQM Midstream Partners 144A | | 7.50 | 6-1-2030 | 1,555,000 | 1,481,481 |
| Harvest Midstream LP 144A | | 7.50 | 9-1-2028 | 1,000,000 | 964,360 |
| Hess Midstream Operation Company 144A | | 5.50 | 10-15-2030 | 205,000 | 184,500 |
| Kinetik Holdings LP Company 144A | | 5.88 | 6-15-2030 | 1,615,000 | 1,492,599 |
| Murphy Oil Corporation | | 6.38 | 7-15-2028 | 710,000 | 685,381 |
| Nabors Industries Limited 144A | | 7.38 | 5-15-2027 | 1,240,000 | 1,195,087 |
| Occidental Petroleum Corporation | | 6.45 | 9-15-2036 | 3,800,000 | 3,819,000 |
| Rockies Express Pipeline LLC 144A | | 6.88 | 4-15-2040 | 1,415,000 | 1,158,696 |
| Southwestern Energy Company | | 4.75 | 2-1-2032 | 1,825,000 | 1,568,277 |
| Tallgrass Energy Partners LP 144A | | 6.00 | 12-31-2030 | 3,155,000 | 2,720,683 |
| Tallgrass Energy Partners LP 144A | | 6.00 | 9-1-2031 | 155,000 | 132,453 |
| Venture Global Calcasieu Pass LLC 144A | | 6.25 | 1-15-2030 | 1,725,000 | 1,701,281 |
| Vital Energy Incorporated | | 9.50 | 1-15-2025 | 1,165,000 | 1,174,402 |
| | | | | | 36,315,245 |
| Financials: 12.73% | | | | | |
| Capital markets: 0.27% | | | | | |
| Oppenheimer Holdings Incorporated | | 5.50 | 10-1-2025 | 825,000 | 810,563 |
| Consumer finance: 5.24% | | | | | |
| FirstCash Incorporated 144A | | 4.63 | 9-1-2028 | 2,215,000 | 1,924,215 |
The accompanying notes are an integral part of these financial statements.
Allspring High Yield Bond Fund | 11
Portfolio of investments—February 28, 2023 (unaudited)
| | | Interest
rate | Maturity
date | Principal | Value |
| Consumer finance (continued) | | | | | |
| FirstCash Incorporated 144A | | 5.63% | 1-1-2030 | $ 210,000 | $ 185,753 |
| Ford Motor Credit Company LLC | | 4.39 | 1-8-2026 | 1,600,000 | 1,504,976 |
| Ford Motor Credit Company LLC | | 5.11 | 5-3-2029 | 3,325,000 | 3,039,383 |
| Ford Motor Credit Company LLC | | 5.13 | 6-16-2025 | 200,000 | 193,076 |
| LFS TopCo LLC 144A | | 5.88 | 10-15-2026 | 895,000 | 770,771 |
| Navient Corporation | | 5.00 | 3-15-2027 | 1,325,000 | 1,177,925 |
| Navient Corporation | | 5.63 | 8-1-2033 | 700,000 | 525,329 |
| Navient Corporation | | 5.88 | 10-25-2024 | 350,000 | 340,221 |
| OneMain Finance Corporation | | 5.38 | 11-15-2029 | 935,000 | 787,307 |
| OneMain Finance Corporation | | 7.13 | 3-15-2026 | 575,000 | 558,963 |
| PECF USS Intermediate Holding III Corporation 144A | | 8.00 | 11-15-2029 | 1,805,000 | 1,268,799 |
| PRA Group Incorporated 144A | | 5.00 | 10-1-2029 | 2,075,000 | 1,768,336 |
| Rocket Mortgage LLC 144A | | 2.88 | 10-15-2026 | 1,375,000 | 1,186,474 |
| Rocket Mortgage LLC 144A | | 4.00 | 10-15-2033 | 765,000 | 565,562 |
| | | | | | 15,797,090 |
| Diversified financial services: 2.47% | | | | | |
| Camelot Return Merger Sub Incorporated 144A | | 8.75 | 8-1-2028 | 2,640,000 | 2,508,000 |
| Hat Holdings LLC 144A | | 3.38 | 6-15-2026 | 850,000 | 737,375 |
| Hat Holdings LLC 144A | | 3.75 | 9-15-2030 | 495,000 | 373,666 |
| Hat Holdings LLC 144A | | 6.00 | 4-15-2025 | 395,000 | 380,689 |
| LPL Holdings Incorporated 144A | | 4.38 | 5-15-2031 | 2,570,000 | 2,223,129 |
| United Wholesale Mortgage LLC 144A | | 5.50 | 11-15-2025 | 1,310,000 | 1,216,990 |
| | | | | | 7,439,849 |
| Insurance: 1.85% | | | | | |
| Amwins Group Incorporated 144A | | 4.88 | 6-30-2029 | 1,905,000 | 1,617,924 |
| AssuredPartners Incorporated 144A | | 5.63 | 1-15-2029 | 1,050,000 | 889,657 |
| Broadstreet Partners Incorporated 144A | | 5.88 | 4-15-2029 | 2,425,000 | 2,087,715 |
| Tri Pointe Homes Incorporated | | 5.88 | 6-15-2024 | 1,000,000 | 987,500 |
| | | | | | 5,582,796 |
| Mortgage REITs: 0.67% | | | | | |
| Starwood Property Trust Incorporated 144A | | 4.38 | 1-15-2027 | 1,495,000 | 1,296,095 |
| Starwood Property Trust Incorporated | | 4.75 | 3-15-2025 | 760,000 | 725,245 |
| | | | | | 2,021,340 |
| Thrifts & mortgage finance: 2.23% | | | | | |
| Enact Holdings Incorporated 144A | | 6.50 | 8-15-2025 | 4,115,000 | 4,044,016 |
| Ladder Capital Finance Holdings LP 144A | | 4.25 | 2-1-2027 | 2,250,000 | 1,912,645 |
| Ladder Capital Finance Holdings LP 144A | | 4.75 | 6-15-2029 | 65,000 | 52,856 |
| United Wholesale Mortgage LLC 144A | | 5.50 | 4-15-2029 | 850,000 | 703,545 |
| | | | | | 6,713,062 |
| Health care: 1.63% | | | | | |
| Health care providers & services: 1.10% | | | | | |
| Air Methods Corporation 144A | | 8.00 | 5-15-2025 | 755,000 | 45,300 |
| Pediatrix Medical Group 144A« | | 5.38 | 2-15-2030 | 830,000 | 732,213 |
| Select Medical Corporation 144A | | 6.25 | 8-15-2026 | 1,775,000 | 1,695,125 |
| Tenet Healthcare Corporation | | 4.88 | 1-1-2026 | 875,000 | 833,338 |
| | | | | | 3,305,976 |
The accompanying notes are an integral part of these financial statements.
12 | Allspring High Yield Bond Fund
Portfolio of investments—February 28, 2023 (unaudited)
| | | Interest
rate | Maturity
date | Principal | Value |
| Pharmaceuticals: 0.53% | | | | | |
| Catalent Pharma Solutions Company 144A | | 5.00% | 7-15-2027 | $1,675,000 | $ 1,614,482 |
| Industrials: 9.11% | | | | | |
| Aerospace & defense: 1.18% | | | | | |
| Spirit AeroSystems Incorporated 144A | | 7.50 | 4-15-2025 | 840,000 | 839,244 |
| Spirit AeroSystems Incorporated 144A | | 9.38 | 11-30-2029 | 1,925,000 | 2,033,281 |
| TransDigm Group Incorporated | | 7.50 | 3-15-2027 | 700,000 | 691,250 |
| | | | | | 3,563,775 |
| Airlines: 1.48% | | | | | |
| American Airlines Group Incorporated 144A | | 5.75 | 4-20-2029 | 1,275,000 | 1,212,672 |
| Hawaiian Brand Intellectual Property Limited 144A | | 5.75 | 1-20-2026 | 1,135,000 | 1,055,454 |
| Spirit Loyalty Cayman Limited 144A | | 8.00 | 9-20-2025 | 2,185,000 | 2,193,194 |
| | | | | | 4,461,320 |
| Commercial services & supplies: 2.12% | | | | | |
| Allied Universal Holdco LLC 144A | | 6.00 | 6-1-2029 | 2,205,000 | 1,642,667 |
| Allied Universal Holdco LLC 144A | | 6.63 | 7-15-2026 | 1,000,000 | 949,760 |
| CoreCivic Incorporated | | 8.25 | 4-15-2026 | 3,730,000 | 3,776,140 |
| | | | | | 6,368,567 |
| Machinery: 1.66% | | | | | |
| Chart Industries Incorporated 144A | | 7.50 | 1-1-2030 | 315,000 | 319,725 |
| Chart Industries Incorporated 144A | | 9.50 | 1-1-2031 | 525,000 | 548,625 |
| TK Elevator US Newco Incorporated 144A | | 5.25 | 7-15-2027 | 2,300,000 | 2,083,643 |
| Werner FinCo LP 144A | | 8.75 | 7-15-2025 | 2,580,000 | 2,057,550 |
| | | | | | 5,009,543 |
| Road & rail: 1.52% | | | | | |
| Uber Technologies Incorporated 144A | | 4.50 | 8-15-2029 | 2,895,000 | 2,559,412 |
| Uber Technologies Incorporated 144A | | 8.00 | 11-1-2026 | 2,000,000 | 2,030,453 |
| | | | | | 4,589,865 |
| Trading companies & distributors: 1.15% | | | | | |
| Fortress Transportation & Infrastructure Investors LLC 144A | | 5.50 | 5-1-2028 | 2,205,000 | 1,969,201 |
| Fortress Transportation & Infrastructure Investors LLC 144A | | 6.50 | 10-1-2025 | 830,000 | 809,560 |
| Fortress Transportation & Infrastructure Investors LLC 144A | | 9.75 | 8-1-2027 | 675,000 | 693,513 |
| | | | | | 3,472,274 |
| Information technology: 5.22% | | | | | |
| Communications equipment: 0.70% | | | | | |
| Ciena Corporation 144A | | 4.00 | 1-31-2030 | 1,000,000 | 851,250 |
| CommScope Technologies LLC 144A | | 4.75 | 9-1-2029 | 415,000 | 338,225 |
| CommScope Technologies LLC 144A | | 5.00 | 3-15-2027 | 1,195,000 | 911,112 |
| | | | | | 2,100,587 |
| Electronic equipment, instruments & components: 0.55% | | | | | |
| Wesco Distribution Incorporated 144A | | 7.13 | 6-15-2025 | 1,660,000 | 1,675,049 |
The accompanying notes are an integral part of these financial statements.
Allspring High Yield Bond Fund | 13
Portfolio of investments—February 28, 2023 (unaudited)
| | | Interest
rate | Maturity
date | Principal | Value |
| IT services: 1.81% | | | | | |
| Sabre GLBL Incorporated 144A | | 9.25% | 4-15-2025 | $3,155,000 | $ 3,105,597 |
| Sabre GLBL Incorporated 144A | | 11.25 | 12-15-2027 | 2,360,000 | 2,358,513 |
| | | | | | 5,464,110 |
| Software: 2.16% | | | | | |
| McAfee Corporation 144A | | 7.38 | 2-15-2030 | 1,800,000 | 1,426,547 |
| MPH Acquisition Holdings LLC 144A | | 5.50 | 9-1-2028 | 820,000 | 621,273 |
| MPH Acquisition Holdings LLC 144A« | | 5.75 | 11-1-2028 | 2,235,000 | 1,452,571 |
| NCR Corporation 144A | | 6.13 | 9-1-2029 | 2,000,000 | 1,945,000 |
| SS&C Technologies Incorporated 144A | | 5.50 | 9-30-2027 | 1,125,000 | 1,058,635 |
| | | | | | 6,504,026 |
| Materials: 2.85% | | | | | |
| Chemicals: 0.49% | | | | | |
| Avient Corporation 144A | | 7.13 | 8-1-2030 | 405,000 | 406,013 |
| Chemours Company 144A | | 4.63 | 11-15-2029 | 1,300,000 | 1,055,041 |
| | | | | | 1,461,054 |
| Containers & packaging: 1.30% | | | | | |
| Berry Global Incorporated 144A | | 5.63 | 7-15-2027 | 2,450,000 | 2,358,125 |
| Clydesdale Acquisition Holdings Incorporated 144A | | 8.75 | 4-15-2030 | 1,735,000 | 1,567,364 |
| | | | | | 3,925,489 |
| Metals & mining: 0.70% | | | | | |
| Arches Buyer Incorporated 144A | | 4.25 | 6-1-2028 | 725,000 | 596,806 |
| Arches Buyer Incorporated 144A« | | 6.13 | 12-1-2028 | 1,830,000 | 1,506,383 |
| | | | | | 2,103,189 |
| Paper & forest products: 0.36% | | | | | |
| Clearwater Paper Corporation 144A | | 4.75 | 8-15-2028 | 1,255,000 | 1,097,434 |
| Real estate: 2.93% | | | | | |
| Equity REITs: 2.93% | | | | | |
| GLP Capital LP | | 3.25 | 1-15-2032 | 1,050,000 | 834,054 |
| Iron Mountain Incorporated 144A | | 4.50 | 2-15-2031 | 3,800,000 | 3,146,315 |
| MPT Operating Partnership LP | | 3.50 | 3-15-2031 | 3,335,000 | 2,286,009 |
| Service Properties Trust Company | | 4.35 | 10-1-2024 | 1,825,000 | 1,746,890 |
| Service Properties Trust Company | | 4.95 | 2-15-2027 | 915,000 | 788,821 |
| Service Properties Trust Company | | 5.25 | 2-15-2026 | 50,000 | 45,375 |
| | | | | | 8,847,464 |
| Utilities: 4.01% | | | | | |
| Electric utilities: 1.26% | | | | | |
| PG&E Corporation | | 5.25 | 7-1-2030 | 4,260,000 | 3,802,050 |
| Independent power & renewable electricity producers: 2.75% | | | | | |
| NSG Holdings LLC 144A | | 7.75 | 12-15-2025 | 1,806,439 | 1,770,311 |
| TerraForm Power Operating LLC 144A | | 5.00 | 1-31-2028 | 3,830,000 | 3,523,600 |
| Vistra Operations Company LLC 144A | | 4.38 | 5-1-2029 | 1,300,000 | 1,123,062 |
The accompanying notes are an integral part of these financial statements.
14 | Allspring High Yield Bond Fund
Portfolio of investments—February 28, 2023 (unaudited)
| | | Interest
rate | Maturity
date | Principal | Value |
| Independent power & renewable electricity producers (continued) | | | | | |
| Vistra Operations Company LLC 144A | | 5.63% | 2-15-2027 | $1,375,000 | $ 1,302,978 |
| Vistra Operations Company LLC (5 Year Treasury Constant Maturity +5.74%) 144Aʊ± | | 7.00 | 12-15-2026 | 615,000 | 575,228 |
| | | | | | 8,295,179 |
| Total Corporate bonds and notes (Cost $273,369,938) | | | | | 247,733,679 |
| Loans: 7.05% | | | | | |
| Communication services: 1.33% | | | | | |
| Diversified telecommunication services: 0.75% | | | | | |
| Intelsat Jackson Holdings SA (U.S. SOFR 1 Month +4.25%) ± | | 9.18 | 2-1-2029 | 2,293,732 | 2,265,061 |
| Entertainment: 0.23% | | | | | |
| Dave & Buster's Incorporated (U.S. SOFR 1 Month +5.00%) <± | | 9.75 | 6-29-2029 | 696,849 | 698,765 |
| Media: 0.35% | | | | | |
| Clear Channel Outdoor Holdings (1 Month LIBOR +3.50%) ± | | 8.23 | 8-21-2026 | 581,992 | 550,466 |
| Hubbard Radio LLC (1 Month LIBOR +4.25%) ± | | 8.89 | 3-28-2025 | 554,991 | 491,628 |
| | | | | | 1,042,094 |
| Consumer discretionary: 0.14% | | | | | |
| Specialty retail: 0.14% | | | | | |
| Michaels Companies Incorporated (1 Month LIBOR +4.25%) ± | | 8.98 | 4-15-2028 | 460,327 | 420,623 |
| Energy: 2.01% | | | | | |
| Oil, gas & consumable fuels: 2.01% | | | | | |
| GIP II Blue Holdings LP (1 Month LIBOR +4.50%) ± | | 9.23 | 9-29-2028 | 2,095,490 | 2,086,501 |
| GIP III Stetson I LP (3 Month LIBOR +4.25%) ± | | 8.88 | 7-18-2025 | 3,445,167 | 3,435,486 |
| M6 ETX Holdings II MidCo LLC (U.S. SOFR 1 Month +4.50%) ± | | 9.16 | 9-19-2029 | 558,600 | 555,572 |
| | | | | | 6,077,559 |
| Financials: 1.09% | | | | | |
| Diversified financial services: 0.69% | | | | | |
| CTC Holdings LP (U.S. SOFR 1 Month +5.00%) ౠ| | 9.95 | 2-20-2029 | 287,825 | 280,629 |
| Mallinckrodt International Finace SA (3 Month LIBOR +5.25%) <± | | 9.99 | 9-30-2027 | 24,958 | 19,693 |
| Resolute Investment Managers Incorporated (1 Month LIBOR +4.25%) ‡<± | | 8.98 | 4-30-2024 | 1,065,000 | 836,025 |
| Russell Investments US Institutional Holdco Incorporated (1 Month LIBOR +3.50%) ± | | 8.13 | 5-30-2025 | 957,107 | 941,554 |
| | | | | | 2,077,901 |
| Insurance: 0.40% | | | | | |
| Asurion LLC (1 Month LIBOR +3.00%) <± | | 7.63 | 11-3-2024 | 785,000 | 529,914 |
| Asurion LLC (1 Month LIBOR +5.25%) ± | | 9.88 | 1-31-2028 | 800,000 | 680,800 |
| | | | | | 1,210,714 |
The accompanying notes are an integral part of these financial statements.
Allspring High Yield Bond Fund | 15
Portfolio of investments—February 28, 2023 (unaudited)
| | | Interest
rate | Maturity
date | Principal | Value |
| Health care: 0.31% | | | | | |
| Health care technology: 0.31% | | | | | |
| Athenahealth Incorporated (U.S. SOFR 1 Month +3.50%) ± | | 3.50% | 2-15-2029 | $ 77,114 | $ 71,138 |
| Athenahealth Incorporated (U.S. SOFR 1 Month +3.50%) ± | | 8.06 | 2-15-2029 | 943,953 | 870,797 |
| | | | | | 941,935 |
| Industrials: 2.17% | | | | | |
| Airlines: 0.81% | | | | | |
| Mileage Plus Holdings LLC (1 Month LIBOR +5.25%) ± | | 10.00 | 6-21-2027 | 1,260,000 | 1,310,715 |
| SkyMiles IP Limited (3 Month LIBOR +3.75%) <± | | 8.56 | 10-20-2027 | 1,086,500 | 1,123,854 |
| | | | | | 2,434,569 |
| Commercial services & supplies: 1.26% | | | | | |
| The Geo Group Incorporated (1 Month LIBOR +7.13%) ± | | 11.74 | 3-23-2027 | 3,768,293 | 3,793,879 |
| Machinery: 0.10% | | | | | |
| Chart Industries Incorporated (U.S. SOFR 1 Month +3.75%) <± | | 8.59 | 12-7-2029 | 305,000 | 304,430 |
| Total Loans (Cost $21,237,094) | | | | | 21,267,530 |
| Yankee corporate bonds and notes: 8.34% | | | | | |
| Communication services: 0.93% | | | | | |
| Media: 0.58% | | | | | |
| Videotron Limited 144A | | 5.13 | 4-15-2027 | 1,850,000 | 1,729,750 |
| Wireless telecommunication services: 0.35% | | | | | |
| Connect U.S. Finco LLC 144A | | 6.75 | 10-1-2026 | 1,150,000 | 1,063,796 |
| Consumer discretionary: 0.27% | | | | | |
| Auto components: 0.27% | | | | | |
| Adient Global Holdings Limited 144A | | 4.88 | 8-15-2026 | 870,000 | 805,150 |
| Energy: 0.70% | | | | | |
| Oil, gas & consumable fuels: 0.70% | | | | | |
| NorthRiver Midstream Finance LP 144A | | 5.63 | 2-15-2026 | 2,230,000 | 2,099,965 |
| Financials: 1.31% | | | | | |
| Diversified financial services: 1.31% | | | | | |
| Castlelake Aviation Finance 144A« | | 5.00 | 4-15-2027 | 1,905,000 | 1,711,006 |
| New Red Finance Incorporated 144A | | 3.88 | 1-15-2028 | 850,000 | 756,380 |
| New Red Finance Incorporated 144A | | 4.00 | 10-15-2030 | 1,795,000 | 1,482,526 |
| | | | | | 3,949,912 |
| Health care: 0.97% | | | | | |
| Biotechnology: 0.51% | | | | | |
| Grifols Escrow Issuer SA 144A | | 4.75 | 10-15-2028 | 1,800,000 | 1,539,000 |
| Pharmaceuticals: 0.46% | | | | | |
| Bausch Health Companies Incorporated 144A | | 4.88 | 6-1-2028 | 770,000 | 480,291 |
| Teva Pharmaceutical Finance Netherlands III BV | | 6.75 | 3-1-2028 | 950,000 | 913,188 |
| | | | | | 1,393,479 |
The accompanying notes are an integral part of these financial statements.
16 | Allspring High Yield Bond Fund
Portfolio of investments—February 28, 2023 (unaudited)
| | | Interest
rate | Maturity
date | Principal | Value |
| Industrials: 3.42% | | | | | |
| Airlines: 1.57% | | | | | |
| Air Canada Pass-Through Trust Series 2020-1 Class C 144A | | 10.50% | 7-15-2026 | $2,475,000 | $ 2,635,875 |
| VistaJet Malta Finance PLC 144A | | 6.38 | 2-1-2030 | 2,400,000 | 2,100,637 |
| | | | | | 4,736,512 |
| Electrical equipment: 0.92% | | | | | |
| Sensata Technologies BV 144A | | 4.00 | 4-15-2029 | 2,020,000 | 1,781,579 |
| Sensata Technologies BV 144A | | 5.88 | 9-1-2030 | 1,060,000 | 1,005,103 |
| | | | | | 2,786,682 |
| Trading companies & distributors: 0.93% | | | | | |
| Fly Leasing Limited 144A## | | 7.00 | 10-15-2024 | 3,220,000 | 2,793,636 |
| Information technology: 0.40% | | | | | |
| Technology hardware, storage & peripherals: 0.40% | | | | | |
| Seagate HDD | | 4.13 | 1-15-2031 | 1,468,000 | 1,217,985 |
| Materials: 0.34% | | | | | |
| Containers & packaging: 0.34% | | | | | |
| Ardagh Packaging Finance plc 144A | | 6.00 | 6-15-2027 | 1,050,000 | 1,016,127 |
| Total Yankee corporate bonds and notes (Cost $27,463,765) | | | | | 25,131,994 |
| | | Yield | | Shares | |
| Short-term investments: 3.27% | | | | | |
| Investment companies: 3.27% | | | | | |
| Allspring Government Money Market Fund Select Class ♠∞## | | 4.39 | | 1,483,915 | 1,483,915 |
| Securities Lending Cash Investments LLC ♠∩∞ | | 4.54 | | 8,363,671 | 8,363,671 |
| Total Short-term investments (Cost $9,847,247) | | | | | 9,847,586 |
| Total investments in securities (Cost $332,609,749) | 101.07% | | | | 304,697,605 |
| Other assets and liabilities, net | (1.07) | | | | (3,223,856) |
| Total net assets | 100.00% | | | | $301,473,749 |
| † | Non-income-earning security |
| 144A | The security may be resold in transactions exempt from registration, normally to qualified institutional buyers, pursuant to Rule 144A under the Securities Act of 1933. |
| ± | Variable rate investment. The rate shown is the rate in effect at period end. |
| < | All or a portion of the position represents an unfunded loan commitment. The rate represents the current interest rate if the loan is partially funded. |
| ‡ | Security is valued using significant unobservable inputs. |
| ## | All or a portion of this security is segregated for unfunded loans. |
| « | All or a portion of this security is on loan. |
| ♠ | The issuer of the security is an affiliated person of the Fund as defined in the Investment Company Act of 1940. |
| ∩ | The investment is a non-registered investment company purchased with cash collateral received from securities on loan. |
| ∞ | The rate represents the 7-day annualized yield at period end. |
| ʊ | Security is perpetual in nature and has no stated maturity date. The date shown reflects the next call date. |
| Abbreviations: |
| LIBOR | London Interbank Offered Rate |
| REIT | Real estate investment trust |
| SOFR | Secured Overnight Financing Rate |
The accompanying notes are an integral part of these financial statements.
Allspring High Yield Bond Fund | 17
Portfolio of investments—February 28, 2023 (unaudited)
Investments in affiliates
An affiliated investment is an investment in which the Fund owns at least 5% of the outstanding voting shares of the issuer or as a result of other relationships, such as the Fund and the issuer having the same investment manager. Transactions with issuers that were affiliates of the Fund at the end of the period were as follows:
| | Value,
beginning of
period | Purchases | Sales
proceeds | Net
realized
gains
(losses) | | Net
change in
unrealized
gains
(losses) | | Value,
end of
period | Shares,
end
of period | Income
from
affiliated
securities |
| Short-term investments | | | | | | | | | |
| Allspring Government Money Market Fund Select Class | $11,285,787 | $62,854,594 | $(72,656,466) | $ 0 | | $ 0 | | $ 1,483,915 | 1,483,915 | $ 75,436 |
| Securities Lending Cash Investments LLC | 2,080,069 | 51,582,003 | (45,298,006) | (734) | | 339 | | 8,363,671 | 8,363,671 | 76,749 # |
| | | | | $ (734) | | $339 | | $9,847,586 | | $152,185 |
| # | Amount shown represents income before fees and rebates. |
The accompanying notes are an integral part of these financial statements.
18 | Allspring High Yield Bond Fund
Statement of assets and liabilities—February 28, 2023 (unaudited)
| | |
| Assets | |
Investments in unaffiliated securities (including $8,187,588 of securities loaned), at value (cost $322,762,502)
| $ 294,850,019 |
Investments in affiliated securities, at value (cost $9,847,247)
| 9,847,586 |
Cash
| 39,909 |
Receivable for investments sold
| 5,342,402 |
Receivable for interest
| 4,685,539 |
Receivable for securities lending income, net
| 22,180 |
Receivable for Fund shares sold
| 10,985 |
Prepaid expenses and other assets
| 44,755 |
Total assets
| 314,843,375 |
| Liabilities | |
Payable upon receipt of securities loaned
| 8,363,671 |
Payable for investments purchased
| 4,181,588 |
Payable for Fund shares redeemed
| 418,551 |
Management fee payable
| 101,150 |
Dividends payable
| 89,398 |
Administration fees payable
| 30,229 |
Distribution fee payable
| 1,118 |
Accrued expenses and other liabilities
| 183,921 |
Total liabilities
| 13,369,626 |
Total net assets
| $301,473,749 |
| Net assets consist of | |
Paid-in capital
| $ 391,598,846 |
Total distributable loss
| (90,125,097) |
Total net assets
| $301,473,749 |
| Computation of net asset value and offering price per share | |
Net assets – Class A
| $ 179,077,789 |
Shares outstanding – Class A1
| 61,424,404 |
Net asset value per share – Class A
| $2.92 |
Maximum offering price per share – Class A2
| $3.06 |
Net assets – Class C
| $ 1,900,217 |
Shares outstanding – Class C1
| 649,855 |
Net asset value per share – Class C
| $2.92 |
Net assets – Administrator Class
| $ 13,579,299 |
Shares outstanding – Administrator Class1
| 4,652,214 |
Net asset value per share – Administrator Class
| $2.92 |
Net assets – Institutional Class
| $ 106,916,444 |
Shares outstanding – Institutional Class1
| 36,617,408 |
Net asset value per share – Institutional Class
| $2.92 |
| 1 | The Fund has an unlimited number of authorized shares. |
| 2 | Maximum offering price is computed as 100/95.50 of net asset value. On investments of $50,000 or more, the offering price is reduced. |
The accompanying notes are an integral part of these financial statements.
Allspring High Yield Bond Fund | 19
Statement of operations—six months ended February 28, 2023 (unaudited)
| | |
| Investment income | |
Interest
| $ 10,420,815 |
Income from affiliated securities
| 179,746 |
Dividends
| 32,300 |
Total investment income
| 10,632,861 |
| Expenses | |
Management fee
| 834,153 |
| Administration fees | |
Class A
| 143,685 |
Class C
| 1,633 |
Administrator Class
| 6,804 |
Institutional Class
| 43,229 |
| Shareholder servicing fees | |
Class A
| 224,177 |
Class C
| 2,545 |
Administrator Class
| 16,982 |
| Distribution fee | |
Class C
| 7,634 |
Custody and accounting fees
| 8,997 |
Professional fees
| 36,388 |
Registration fees
| 16,100 |
Shareholder report expenses
| 16,433 |
Trustees’ fees and expenses
| 10,624 |
Other fees and expenses
| 3,980 |
Total expenses
| 1,373,364 |
| Less: Fee waivers and/or expense reimbursements | |
Fund-level
| (140,266) |
Administrator Class
| (4,763) |
Institutional Class
| (37,826) |
Net expenses
| 1,190,509 |
Net investment income
| 9,442,352 |
| Realized and unrealized gains (losses) on investments | |
| Net realized losses on | |
Unaffiliated securities
| (8,649,855) |
Affiliated securities
| (734) |
Net realized losses on investments
| (8,650,589) |
| Net change in unrealized gains (losses) on | |
Unaffiliated securities
| 8,147,165 |
Affiliated securities
| 339 |
Net change in unrealized gains (losses) on investments
| 8,147,504 |
Net realized and unrealized gains (losses) on investments
| (503,085) |
Net increase in net assets resulting from operations
| $ 8,939,267 |
The accompanying notes are an integral part of these financial statements.
20 | Allspring High Yield Bond Fund
Statement of changes in net assets
| | | | | |
| | Six months ended
February 28, 2023
(unaudited) | Year ended
August 31, 2022 |
| Operations | | | | |
Net investment income
| | $ 9,442,352 | | $ 14,605,041 |
Net realized losses on investments
| | (8,650,589) | | (8,111,652) |
Net change in unrealized gains (losses) on investments
| | 8,147,504 | | (50,715,580) |
Net increase (decrease) in net assets resulting from operations
| | 8,939,267 | | (44,222,191) |
| Distributions to shareholders from | | | | |
| Net investment income and net realized gains | | | | |
Class A
| | (4,970,008) | | (8,681,745) |
Class C
| | (48,619) | | (104,228) |
Administrator Class
| | (385,253) | | (681,298) |
Institutional Class
| | (3,202,376) | | (5,359,209) |
Total distributions to shareholders
| | (8,606,256) | | (14,826,480) |
| Capital share transactions | Shares | | Shares | |
| Proceeds from shares sold | | | | |
Class A
| 1,004,991 | 2,910,882 | 2,258,343 | 7,258,246 |
Class C
| 8,967 | 26,391 | 26,839 | 85,400 |
Administrator Class
| 41,880 | 121,839 | 126,614 | 418,863 |
Institutional Class
| 10,691,626 | 30,430,456 | 18,518,205 | 60,159,788 |
| | | 33,489,568 | | 67,922,297 |
| Reinvestment of distributions | | | | |
Class A
| 1,569,931 | 4,541,540 | 2,509,753 | 7,928,405 |
Class C
| 16,777 | 48,616 | 32,772 | 104,172 |
Administrator Class
| 124,482 | 360,732 | 201,763 | 638,979 |
Institutional Class
| 1,088,597 | 3,155,988 | 1,659,213 | 5,256,201 |
| | | 8,106,876 | | 13,927,757 |
| Payment for shares redeemed | | | | |
Class A
| (5,082,782) | (14,735,123) | (9,975,519) | (32,130,537) |
Class C
| (190,774) | (554,433) | (434,843) | (1,408,617) |
Administrator Class
| (322,087) | (934,748) | (817,280) | (2,640,902) |
Institutional Class
| (9,037,117) | (26,168,194) | (21,193,164) | (66,599,574) |
| | | (42,392,498) | | (102,779,630) |
Net decrease in net assets resulting from capital share transactions
| | (796,054) | | (20,929,576) |
Total decrease in net assets
| | (463,043) | | (79,978,247) |
| Net assets | | | | |
Beginning of period
| | 301,936,792 | | 381,915,039 |
End of period
| | $301,473,749 | | $ 301,936,792 |
The accompanying notes are an integral part of these financial statements.
Allspring High Yield Bond Fund | 21
Financial highlights
(For a share outstanding throughout each period)
| | | Year ended August 31 |
| Class A | Six months ended
February 28, 2023
(unaudited) | 2022 | 2021 | 2020 | 2019 | 2018 |
Net asset value, beginning of period
| $2.92 | $3.45 | $3.33 | $3.29 | $3.28 | $3.40 |
Net investment income
| 0.09 | 0.13 | 0.11 | 0.13 | 0.14 | 0.14 |
Payment from affiliate
| 0.00 | 0.00 | 0.00 | 0.00 1 | 0.00 | 0.00 |
Net realized and unrealized gains (losses) on investments
| (0.01) | (0.53) | 0.12 | 0.04 | 0.01 | (0.12) |
Total from investment operations
| 0.08 | (0.40) | 0.23 | 0.17 | 0.15 | 0.02 |
| Distributions to shareholders from | | | | | | |
Net investment income
| (0.08) | (0.13) | (0.11) | (0.13) | (0.14) | (0.13) |
Tax basis return of capital
| 0.00 | 0.00 | 0.00 | 0.00 | 0.00 | (0.01) |
Total distributions to shareholders
| (0.08) | (0.13) | (0.11) | (0.13) | (0.14) | (0.14) |
Net asset value, end of period
| $2.92 | $2.92 | $3.45 | $3.33 | $3.29 | $3.28 |
Total return2
| 2.79% | (11.76)% | 7.07% | 5.31 % 3 | 4.79% | 0.68% |
| Ratios to average net assets (annualized) | | | | | | |
Gross expenses
| 1.02% | 1.01% | 1.01% | 1.04% | 1.04% | 1.02% |
Net expenses
| 0.93% | 0.92% | 0.92% | 0.93% | 0.93% | 0.93% |
Net investment income
| 2.95% | 4.08% | 3.29% | 4.01% | 4.36% | 4.26% |
| Supplemental data | | | | | | |
Portfolio turnover rate
| 30% | 138% | 49% | 34% | 26% | 18% |
Net assets, end of period (000s omitted)
| $179,078 | $186,532 | $238,817 | $251,410 | $273,553 | $272,170 |
| 1 | Amount is less than $0.005. |
| 2 | Total return calculations do not include any sales charges. Returns for periods of less than one year are not annualized. |
| 3 | During the year ended August 31, 2020, the Fund received a payment from an affiliate that had an impact of less than 0.005% on total return. |
The accompanying notes are an integral part of these financial statements.
22 | Allspring High Yield Bond Fund
Financial highlights
(For a share outstanding throughout each period)
| | | Year ended August 31 |
| Class C | Six months ended
February 28, 2023
(unaudited) | 2022 | 2021 | 2020 | 2019 | 2018 |
Net asset value, beginning of period
| $2.93 | $3.46 | $3.34 | $3.29 | $3.28 | $3.40 |
Net investment income
| 0.07 1 | 0.11 1 | 0.09 1 | 0.11 1 | 0.12 1 | 0.12 |
Payment from affiliate
| 0.00 | 0.00 | 0.00 | 0.01 | 0.00 | 0.00 |
Net realized and unrealized gains (losses) on investments
| (0.01) | (0.53) | 0.12 | 0.03 | 0.01 | (0.12) |
Total from investment operations
| 0.06 | (0.42) | 0.21 | 0.15 | 0.13 | 0.00 |
| Distributions to shareholders from | | | | | | |
Net investment income
| (0.07) | (0.11) | (0.09) | (0.10) | (0.12) | (0.11) |
Tax basis return of capital
| 0.00 | 0.00 | 0.00 | 0.00 | 0.00 | (0.01) |
Total distributions to shareholders
| (0.07) | (0.11) | (0.09) | (0.10) | (0.12) | (0.12) |
Net asset value, end of period
| $2.92 | $2.93 | $3.46 | $3.34 | $3.29 | $3.28 |
Total return2
| 2.06% | (12.39)% | 6.25% | 4.83 % 3 | 4.00% | (0.07)% |
| Ratios to average net assets (annualized) | | | | | | |
Gross expenses
| 1.77% | 1.76% | 1.76% | 1.79% | 1.79% | 1.77% |
Net expenses
| 1.68% | 1.68% | 1.68% | 1.68% | 1.68% | 1.68% |
Net investment income
| 2.56% | 3.26% | 2.57% | 3.25% | 3.64% | 3.51% |
| Supplemental data | | | | | | |
Portfolio turnover rate
| 30% | 138% | 49% | 34% | 26% | 18% |
Net assets, end of period (000s omitted)
| $1,900 | $2,384 | $4,123 | $8,265 | $12,220 | $47,811 |
| 1 | Calculated based upon average shares outstanding |
| 2 | Total return calculations do not include any sales charges. Returns for periods of less than one year are not annualized. |
| 3 | During the year ended August 31, 2020, the Fund received a payment from an affiliate that had a 0.31% impact on the total return. |
The accompanying notes are an integral part of these financial statements.
Allspring High Yield Bond Fund | 23
Financial highlights
(For a share outstanding throughout each period)
| | | Year ended August 31 |
| Administrator Class | Six months ended
February 28, 2023
(unaudited) | 2022 | 2021 | 2020 | 2019 | 2018 |
Net asset value, beginning of period
| $2.92 | $3.46 | $3.34 | $3.29 | $3.29 | $3.41 |
Net investment income
| 0.09 | 0.14 | 0.12 1 | 0.13 | 0.15 1 | 0.15 |
Net realized and unrealized gains (losses) on investments
| (0.01) | (0.54) | 0.12 | 0.05 | 0.00 | (0.12) |
Total from investment operations
| 0.08 | (0.40) | 0.24 | 0.18 | 0.15 | 0.03 |
| Distributions to shareholders from | | | | | | |
Net investment income
| (0.08) | (0.14) | (0.12) | (0.13) | (0.15) | (0.14) |
Tax basis return of capital
| 0.00 | 0.00 | 0.00 | 0.00 | 0.00 | (0.01) |
Total distributions to shareholders
| (0.08) | (0.14) | (0.12) | (0.13) | (0.15) | (0.15) |
Net asset value, end of period
| $2.92 | $2.92 | $3.46 | $3.34 | $3.29 | $3.29 |
Total return2
| 2.85% | (11.91)% | 7.20% | 5.76% | 4.60% | 0.82% |
| Ratios to average net assets (annualized) | | | | | | |
Gross expenses
| 0.96% | 0.95% | 0.95% | 0.99% | 0.98% | 0.96% |
Net expenses
| 0.80% | 0.80% | 0.79% | 0.79% | 0.80% | 0.80% |
Net investment income
| 3.01% | 4.20% | 3.42% | 4.14% | 4.48% | 4.39% |
| Supplemental data | | | | | | |
Portfolio turnover rate
| 30% | 138% | 49% | 34% | 26% | 18% |
Net assets, end of period (000s omitted)
| $13,579 | $14,045 | $18,317 | $21,185 | $24,667 | $23,940 |
| 1 | Calculated based upon average shares outstanding |
| 2 | Returns for periods of less than one year are not annualized. |
The accompanying notes are an integral part of these financial statements.
24 | Allspring High Yield Bond Fund
Financial highlights
(For a share outstanding throughout each period)
| | | Year ended August 31 |
| Institutional Class | Six months ended
February 28, 2023
(unaudited) | 2022 | 2021 | 2020 | 2019 | 2018 |
Net asset value, beginning of period
| $2.92 | $3.46 | $3.34 | $3.29 | $3.28 | $3.41 |
Net investment income
| 0.10 | 0.14 | 0.12 | 0.14 | 0.15 | 0.16 |
Net realized and unrealized gains (losses) on investments
| (0.01) | (0.54) | 0.13 | 0.05 | 0.01 | (0.13) |
Total from investment operations
| 0.09 | (0.40) | 0.25 | 0.19 | 0.16 | 0.03 |
| Distributions to shareholders from | | | | | | |
Net investment income
| (0.09) | (0.14) | (0.13) | (0.14) | (0.15) | (0.15) |
Tax basis return of capital
| 0.00 | 0.00 | 0.00 | 0.00 | 0.00 | (0.01) |
Total distributions to shareholders
| (0.09) | (0.14) | (0.13) | (0.14) | (0.15) | (0.16) |
Net asset value, end of period
| $2.92 | $2.92 | $3.46 | $3.34 | $3.29 | $3.28 |
Total return1
| 2.99% | (11.68)% | 7.48% | 6.04% | 5.20% | 0.79% |
| Ratios to average net assets (annualized) | | | | | | |
Gross expenses
| 0.69% | 0.68% | 0.69% | 0.71% | 0.71% | 0.69% |
Net expenses
| 0.53% | 0.53% | 0.53% | 0.53% | 0.53% | 0.53% |
Net investment income
| 3.14% | 4.50% | 3.66% | 4.39% | 4.75% | 4.67% |
| Supplemental data | | | | | | |
Portfolio turnover rate
| 30% | 138% | 49% | 34% | 26% | 18% |
Net assets, end of period (000s omitted)
| $106,916 | $98,975 | $120,658 | $73,568 | $75,877 | $134,770 |
| 1 | Returns for periods of less than one year are not annualized. |
The accompanying notes are an integral part of these financial statements.
Allspring High Yield Bond Fund | 25
Notes to financial statements (unaudited)
1. ORGANIZATION
Allspring Funds Trust (the "Trust"), a Delaware statutory trust organized on March 10, 1999, is an open-end management investment company registered under the Investment Company Act of 1940, as amended (the "1940 Act"). As an investment company, the Trust follows the accounting and reporting guidance in Financial Accounting Standards Board ("FASB") Accounting Standards Codification Topic 946, Financial Services – Investment Companies. These financial statements report on the Allspring High Yield Bond Fund (the "Fund") which is a diversified series of the Trust.
2. SIGNIFICANT ACCOUNTING POLICIES
The following significant accounting policies, which are consistently followed in the preparation of the financial statements of the Fund, are in conformity with U.S. generally accepted accounting principles which require management to make estimates and assumptions that affect the reported amounts of assets and liabilities, disclosure of contingent assets and liabilities at the date of the financial statements, and the reported amounts of income and expenses during the reporting period. Actual results could differ from those estimates.
Securities valuation
All investments are valued each business day as of the close of regular trading on the New York Stock Exchange (generally 4 p.m. Eastern Time), although the Fund may deviate from this calculation time under unusual or unexpected circumstances.
Debt securities are valued at the evaluated bid price provided by an independent pricing service (e.g. taking into account various factors, including yields, maturities, or credit ratings) or, if a reliable price is not available, the quoted bid price from an independent broker-dealer.
Equity securities that are listed on a foreign or domestic exchange or market are valued at the official closing price or, if none, the last sales price.
Investments in registered open-end investment companies (other than those listed on a foreign or domestic exchange or market) are valued at net asset value. Interests in non-registered investment companies that are redeemable at net asset value are fair valued normally at net asset value.
Investments which are not valued using the methods discussed above are valued at their fair value, as determined in good faith by Allspring Funds Management, LLC ("Allspring Funds Management"), which was named the valuation designee by the Board of Trustees. As the valuation designee, Allspring Funds Management is responsible for day-to-day valuation activities for the Allspring Funds. In connection with these responsibilities, Allspring Funds Management has established a Valuation Committee and has delegated to it the authority to take any actions regarding the valuation of portfolio securities that the Valuation Committee deems necessary or appropriate, including determining the fair value of portfolio securities. On a quarterly basis, the Board of Trustees receives reports of valuation actions taken by the Valuation Committee. On at least an annual basis, the Board of Trustees receives an assessment of the adequacy and effectiveness of Allspring Funds Management's process for determining the fair value of the portfolio of investments.
Securities lending
The Fund may lend its securities from time to time in order to earn additional income in the form of fees or interest on securities received as collateral or the investment of any cash received as collateral. When securities are on loan, the Fund receives interest or dividends on those securities. Cash collateral received in connection with its securities lending transactions is invested in Securities Lending Cash Investments, LLC (the "Securities Lending Fund"), an affiliated non-registered investment company. Investments in Securities Lending Fund are valued at the evaluated bid price provided by an independent pricing service. Income earned from investment in the Securities Lending Fund (net of fees and rebates), if any, is included in income from affiliated securities on the Statement of Operations.
In a securities lending transaction, the net asset value of the Fund is affected by an increase or decrease in the value of the securities loaned and by an increase or decrease in the value of the instrument in which collateral is invested. The amount of securities lending activity undertaken by the Fund fluctuates from time to time. The Fund has the right under the lending agreement to recover the securities from the borrower on demand. In the event of default or bankruptcy by the borrower, the Fund may be prevented from recovering the loaned securities or gaining access to the collateral or may experience delays or costs in doing so. In such an event, the terms of the agreement allow the unaffiliated securities lending agent to use the collateral to purchase replacement securities on behalf of the Fund or pay the Fund the market value of the loaned securities. The Fund bears the risk of loss with respect to depreciation of its investment of the cash collateral.
26 | Allspring High Yield Bond Fund
Notes to financial statements (unaudited)
When-issued transactions
The Fund may purchase securities on a forward commitment or when-issued basis. The Fund records a when-issued transaction on the trade date and will segregate assets in an amount at least equal in value to the Fund's commitment to purchase when-issued securities. Securities purchased on a when-issued basis are marked-to-market daily and the Fund begins earning interest on the settlement date. Losses may arise due to changes in the market value of the underlying securities or if the counterparty does not perform under the contract.
Loans
The Fund may invest in direct debt instruments which are interests in amounts owed to lenders by corporate or other borrowers. The loans pay interest at rates which are periodically reset by reference to a base lending rate plus a spread. Investments in loans may be in the form of participations in loans or assignments of all or a portion of loans from third parties. When the Fund purchases participations, it generally has no rights to enforce compliance with the terms of the loan agreement with the borrower. As a result, the Fund assumes the credit risk of both the borrower and the lender that is selling the participation. When the Fund purchases assignments from lenders, it acquires direct rights against the borrower on the loan and may enforce compliance by the borrower with the terms of the loan agreement. Loans may include fully funded term loans or unfunded loan commitments, which are contractual obligations for future funding.
Security transactions and income recognition
Securities transactions are recorded on a trade date basis. Realized gains or losses are recorded on the basis of identified cost.
Interest income is accrued daily and bond discounts are accreted and premiums are amortized daily. To the extent debt obligations are placed on non-accrual status, any related interest income may be reduced by writing off interest receivables when the collection of all or a portion of interest has been determined to be doubtful based on consistently applied procedures and the fair value has decreased. If the issuer subsequently resumes interest payments or when the collectability of interest is reasonably assured, the debt obligation is removed from non-accrual status.
Dividend income is recognized on the ex-dividend date.
Distributions to shareholders
Distributions to shareholders from net investment income are declared daily and paid monthly. Distributions from net realized gains, if any, are recorded on the ex-dividend date and paid at least annually. Such distributions are determined in accordance with income tax regulations and may differ from U.S. generally accepted accounting principles. Dividend sources are estimated at the time of declaration. The tax character of distributions is determined as of the Fund's fiscal year end. Therefore, a portion of the Fund's distributions made prior to the Fund’s fiscal year end may be categorized as a tax return of capital at year end.
Federal and other taxes
The Fund intends to continue to qualify as a regulated investment company by distributing substantially all of its investment company taxable income and any net realized capital gains (after reduction for capital loss carryforwards) sufficient to relieve it from all, or substantially all, federal income taxes. Accordingly, no provision for federal income taxes was required.
The Fund’s income and federal excise tax returns and all financial records supporting those returns for the prior three fiscal years are subject to examination by the federal and Delaware revenue authorities. Management has analyzed the Fund's tax positions taken on federal, state, and foreign tax returns, as applicable, for all open tax years and does not believe that there are any uncertain tax positions that require recognition of a tax liability.
As of February 28, 2023, the aggregate cost of all investments for federal income tax purposes was $368,938,532 and the unrealized gains (losses) consisted of:
| Gross unrealized gains | $ 1,306,573 |
| Gross unrealized losses | (65,547,500) |
| Net unrealized losses | $(64,240,927) |
As of August 31, 2022, the Fund had capital loss carryforwards which consisted of $30,449,454 in short-term capital losses and $24,059,308 in long-term capital losses.
Class allocations
The separate classes of shares offered by the Fund differ principally in applicable sales charges, distribution, shareholder servicing, and administration fees. Class specific expenses are charged directly to that share class. Investment income, common
Allspring High Yield Bond Fund | 27
Notes to financial statements (unaudited)
fund-level expenses, and realized and unrealized gains (losses) on investments are allocated daily to each class of shares based on the relative proportion of net assets of each class.
3. FAIR VALUATION MEASUREMENTS
Fair value measurements of investments are determined within a framework that has established a fair value hierarchy based upon the various data inputs utilized in determining the value of the Fund’s investments. The three-level hierarchy gives the highest priority to unadjusted quoted prices in active markets for identical assets or liabilities (Level 1) and the lowest priority to unobservable inputs (Level 3). The Fund’s investments are classified within the fair value hierarchy based on the lowest level of input that is significant to the fair value measurement. The inputs are summarized into three broad levels as follows:
| ■ | Level 1 – quoted prices in active markets for identical securities |
| ■ | Level 2 – other significant observable inputs (including quoted prices for similar securities, interest rates, prepayment speeds, credit risk, etc.) |
| ■ | Level 3 – significant unobservable inputs (including the Fund’s own assumptions in determining the fair value of investments) |
The inputs or methodologies used for valuing investments in securities are not necessarily an indication of the risk associated with investing in those securities.
The following is a summary of the inputs used in valuing the Fund’s assets and liabilities as of February 28, 2023:
| | Quoted prices
(Level 1) | Other significant
observable inputs
(Level 2) | Significant
unobservable inputs
(Level 3) | Total |
| Assets | | | | |
| Investments in: | | | | |
| Common stocks | | | | |
| Energy | $ 506,056 | $ 0 | $ 0 | $ 506,056 |
| Financials | 210,760 | 0 | 0 | 210,760 |
| Corporate bonds and notes | 0 | 247,733,679 | 0 | 247,733,679 |
| Loans | 0 | 20,150,876 | 1,116,654 | 21,267,530 |
| Yankee corporate bonds and notes | 0 | 25,131,994 | 0 | 25,131,994 |
| Short-term investments | | | | |
| Investment companies | 9,847,586 | 0 | 0 | 9,847,586 |
| Total assets | $10,564,402 | $293,016,549 | $1,116,654 | $304,697,605 |
Additional sector, industry or geographic detail, if any, is included in the Portfolio of Investments.
For the six months ended February 28, 2023, the Fund did not have any transfers into/out of Level 3.
4. TRANSACTIONS WITH AFFILIATES
Management fee
Allspring Funds Management, a wholly owned subsidiary of Allspring Global Investments Holdings, LLC, a holding company indirectly owned by certain private funds of GTCR LLC and Reverence Capital Partners, L.P., is the manager of the Fund and provides advisory and fund-level administrative services under an investment management agreement. Under the investment management agreement, Allspring Funds Management is responsible for, among other services, implementing the investment objectives and strategies of the Fund, supervising the subadviser and providing fund-level administrative services in connection with the Fund’s operations. As compensation for its services under the investment management agreement, Allspring Funds Management is entitled to receive a management fee at the following annual rate based on the Fund’s average daily net assets:
28 | Allspring High Yield Bond Fund
Notes to financial statements (unaudited)
| Average daily net assets | Management fee |
| First $500 million | 0.550% |
| Next $500 million | 0.525 |
| Next $2 billion | 0.500 |
| Next $2 billion | 0.475 |
| Next $5 billion | 0.440 |
| Over $10 billion | 0.430 |
For the six months ended February 28, 2023, the management fee was equivalent to an annual rate of 0.55% of the Fund’s average daily net assets.
Allspring Funds Management has retained the services of a subadviser to provide daily portfolio management to the Fund. The fee for subadvisory services is borne by Allspring Funds Management. Allspring Global Investments, LLC ("Allspring Investments"), an affiliate of Allspring Funds Management and a wholly owned subsidiary of Allspring Global Investments Holdings, LLC, is the subadviser to the Fund and is entitled to receive a fee from Allspring Funds Management at an annual rate starting at 0.35% and declining to 0.20% as the average daily net assets of the Fund increase.
Administration fees
Under a class-level administration agreement, Allspring Funds Management provides class-level administrative services to the Fund, which includes paying fees and expenses for services provided by the transfer agent, sub-transfer agents, omnibus account servicers and record-keepers. As compensation for its services under the class-level administration agreement, Allspring Funds Management receives an annual fee which is calculated based on the average daily net assets of each class as follows:
| | Class-level
administration fee |
| Class A | 0.16% |
| Class C | 0.16 |
| Administrator Class | 0.10 |
| Institutional Class | 0.08 |
Waivers and/or expense reimbursements
Allspring Funds Management has contractually committed to waive and/or reimburse management and administration fees to the extent necessary to maintain certain net operating expense ratios for the Fund. When each class of the Fund has exceeded its expense cap, Allspring Funds Management will waive fees and/or reimburse expenses from fund-level expenses on a proportionate basis and then from class specific expenses. When only certain classes exceed their expense caps, waivers and/or reimbursements are applied against class specific expenses before fund-level expenses. Allspring Funds Management has contractually committed through December 31, 2023 to waive fees and/or reimburse expenses to the extent necessary to cap expenses. Prior to or after the commitment expiration date, the caps may be increased or the commitment to maintain the caps may be terminated only with the approval of the Board of Trustees. As of February 28, 2023, the contractual expense caps are as follows:
| | Expense ratio caps |
| Class A | 0.93% |
| Class C | 1.68 |
| Administrator Class | 0.80 |
| Institutional Class | 0.53 |
Allspring High Yield Bond Fund | 29
Notes to financial statements (unaudited)
Distribution fee
The Trust has adopted a distribution plan for Class C shares pursuant to Rule 12b-1 under the 1940 Act. A distribution fee is charged to Class C shares and paid to Allspring Funds Distributor, LLC ("Allspring Funds Distributor"), the principal underwriter, an affiliate of Allspring Funds Management, at an annual rate up to 0.75% of the average daily net assets of Class C shares.
In addition, Allspring Funds Distributor is entitled to receive the front-end sales charge from the purchase of Class A shares and a contingent deferred sales charge on the redemption of certain Class A shares. Allspring Funds Distributor is also entitled to receive the contingent deferred sales charges from redemptions of Class C shares. Allspring Funds Distributor did not receive any front-end or contingent deferred sales charges from Class A or Class C shares for the six months ended February 28, 2023.
Shareholder servicing fees
The Trust has entered into contracts with one or more shareholder servicing agents, whereby Class A, Class C and Administrator Class are charged a fee at an annual rate up to 0.25% of the average daily net assets of each respective class. A portion of these total shareholder servicing fees were paid to affiliates of the Fund.
Interfund transactions
The Fund may purchase or sell portfolio investment securities to certain affiliates pursuant to Rule 17a-7 under the 1940 Act and under procedures adopted by the Board of Trustees. The procedures have been designed to ensure that these interfund transactions, which do not incur broker commissions, are effected at current market prices.
5. INVESTMENT PORTFOLIO TRANSACTIONS
Purchases and sales of investments, excluding U.S. government obligations (if any) and short-term securities, for the six months ended February 28, 2023 were $96,610,932 and $89,391,292, respectively.
As of February 28, 2023, the Fund had unfunded loan commitments of $2,203,886.
6. SECURITIES LENDING TRANSACTIONS
The Fund lends its securities through an unaffiliated securities lending agent and receives collateral in the form of cash or securities with a value at least equal to the value of the securities on loan. The value of the loaned securities is determined at the close of each business day and any increases or decreases in the required collateral are exchanged between the Fund and the counterparty on the next business day. Cash collateral received is invested in the Securities Lending Fund which seeks to provide a positive return compared to the daily Federal Funds Open Rate by investing in high-quality, U.S. dollar-denominated short-term money market instruments and is exempt from registration under Section 3(c)(7) of the 1940 Act. Securities Lending Fund is managed by Allspring Funds Management and is subadvised by Allspring Investments. Allspring Funds Management receives an advisory fee starting at 0.05% and declining to 0.01% as the average daily net assets of the Securities Lending Fund increase. All of the fees received by Allspring Funds Management are paid to Allspring Investments for its services as subadviser.
In the event of counterparty default or the failure of a borrower to return a loaned security, the Fund has the right to use the collateral to offset any losses incurred. As of February 28, 2023, the Fund had securities lending transactions with the following counterparties which are subject to offset:
| Counterparty | Value of
securities on
loan | Collateral
received1 | Net amount |
| Bank of America Securities Incorporated | $2,366,854 | $(2,366,854) | $0 |
| Barclays Capital Incorporated | 4,555,714 | (4,555,714) | 0 |
| BNP Paribas Securities Corporation | 560,296 | (560,296) | 0 |
| Credit Suisse Securities (USA) LLC | 265,441 | (265,441) | 0 |
| Nomura Securities International Incorporated | 84,466 | (84,466) | 0 |
| UBS Securities LLC | 354,817 | (354,817) | 0 |
1 Collateral disclosed within this table is limited to the net transaction with the counterparty.
30 | Allspring High Yield Bond Fund
Notes to financial statements (unaudited)
7. BANK BORROWINGS
The Trust (excluding the money market funds), Allspring Master Trust and Allspring Variable Trust are parties to a $350,000,000 revolving credit agreement whereby the Fund is permitted to use bank borrowings for temporary or emergency purposes, such as to fund shareholder redemption requests. Interest under the credit agreement is charged to the Fund based on a borrowing rate equal to the higher of the Federal Funds rate or the overnight bank funding rate in effect on that day plus a spread. In addition, an annual commitment fee equal based on the unused balance is allocated to each participating fund.
For the six months ended February 28, 2023, there were no borrowings by the Fund under the agreement.
8. MARKET RISKS
On March 11, 2020, the World Health Organization announced that it had made the assessment that coronavirus disease 2019 (“COVID-19”) is a pandemic. The impacts of COVID-19 are affecting the entire global economy, individual companies and investment products, the funds, and the market in general. There is significant uncertainty around the extent and duration of business disruptions related to COVID-19 and the impacts may last for an extended period of time. COVID-19 has led to significant uncertainty and volatility in the financial markets.
9. INDEMNIFICATION
Under the Fund's organizational documents, the officers and Trustees have been granted certain indemnification rights against certain liabilities that may arise out of performance of their duties to the Fund. The Fund has entered into a separate agreement with each Trustee that converts indemnification rights currently existing under the Fund’s organizational documents into contractual rights that cannot be changed in the future without the consent of the Trustee. Additionally, in the normal course of business, the Fund may enter into contracts with service providers that contain a variety of indemnification clauses. The Fund’s maximum exposure under these arrangements is dependent on future claims that may be made against the Fund and, therefore, cannot be estimated.
Allspring High Yield Bond Fund | 31
Other information (unaudited)
PROXY VOTING INFORMATION
A description of the policies and procedures used to determine how to vote proxies relating to portfolio securities is available without charge, upon request, by calling 1-800-222-8222, visiting our website at allspringglobal.com, or visiting the SEC website at sec.gov. Information regarding how the proxies related to portfolio securities were voted during the most recent 12-month period ended June 30 is available on the website at allspringglobal.com or by visiting the SEC website at sec.gov.
QUARTERLY PORTFOLIO HOLDINGS INFORMATION
The Fund files its complete schedule of portfolio holdings with the SEC for the first and third quarters of each fiscal year as an exhibit to its reports on Form N-PORT. Shareholders may view the filed Form N-PORT by visiting the SEC website at sec.gov.
32 | Allspring High Yield Bond Fund
Other information (unaudited)
BOARD OF TRUSTEES AND OFFICERS
Each of the Trustees and Officers listed in the table below acts in identical capacities for each fund in the Allspring family of funds, which consists of 127 mutual funds comprising the Allspring Funds Trust, Allspring Variable Trust, Allspring Master Trust and four closed-end funds (collectively the “Fund Complex”). This table should be read in conjunction with the Prospectus and the Statement of Additional Information1. The mailing address of each Trustee and Officer is 1415 Vantage Park Drive, 3rd Floor, Charlotte, NC 28203. Each Trustee and Officer serves an indefinite term, however, each Trustee serves such term until reaching the mandatory retirement age established by the Trustees.
Independent Trustees
Name and
year of birth | Position held and
length of service* | Principal occupations during past five years or longer | Current other
public company or
investment
company
directorships |
William R. Ebsworth
(Born 1957) | Trustee,
since 2015 | Retired. From 1984 to 2013, equities analyst, portfolio manager, research director and chief investment officer at Fidelity Management and Research Company in Boston, Tokyo, and Hong Kong, and retired in 2013 as Chief Investment Officer of Fidelity Strategic Advisers, Inc. where he led a team of investment professionals managing client assets. Prior thereto, Board member of Hong Kong Securities Clearing Co., Hong Kong Options Clearing Corp., the Thailand International Fund, Ltd., Fidelity Investments Life Insurance Company, and Empire Fidelity Investments Life Insurance Company. Audit Committee Chair and Investment Committee Chair of the Vincent Memorial Hospital Foundation (non-profit organization). Mr. Ebsworth is a CFA® charterholder. | N/A |
Jane A. Freeman
(Born 1953) | Trustee,
since 2015;
Chair Liaison,
since 2018 | Retired. From 2012 to 2014 and 1999 to 2008, Chief Financial Officer of Scientific Learning Corporation. From 2008 to 2012, Ms. Freeman provided consulting services related to strategic business projects. Prior to 1999, Portfolio Manager at Rockefeller & Co. and Scudder, Stevens & Clark. Board member of the Harding Loevner Funds from 1996 to 2014, serving as both Lead Independent Director and chair of the Audit Committee. Board member of the Russell Exchange Traded Funds Trust from 2011 to 2012 and the chair of the Audit Committee. Ms. Freeman is also an inactive Chartered Financial Analyst. | N/A |
Isaiah Harris, Jr.
(Born 1952) | Trustee,
since 2009; Audit
Committee
Chair,
since 2019 | Retired. Member of the Advisory Board of CEF of East Central Florida. Chairman of the Board of CIGNA Corporation from 2009 to 2021, and Director from 2005 to 2008. From 2003 to 2011, Director of Deluxe Corporation. Prior thereto, President and CEO of BellSouth Advertising and Publishing Corp. from 2005 to 2007, President and CEO of BellSouth Enterprises from 2004 to 2005 and President of BellSouth Consumer Services from 2000 to 2003. Emeritus member of the Iowa State University Foundation Board of Governors. Emeritus Member of the Advisory Board of Iowa State University School of Business. Advisory Board Member, Palm Harbor Academy (private school). Advisory Board Member, Fellowship of Christian Athletes. Mr. Harris is a certified public accountant (inactive status). | N/A |
David F. Larcker
(Born 1950) | Trustee,
since 2009 | Distinguished Visiting Fellow at the Hoover Institution since 2022. James Irvin Miller Professor of Accounting at the Graduate School of Business (Emeritus), Stanford University, Director of the Corporate Governance Research Initiative and Senior Faculty of The Rock Center for Corporate Governance since 2006. From 2005 to 2008, Professor of Accounting at the Graduate School of Business, Stanford University. Prior thereto, Ernst & Young Professor of Accounting at The Wharton School, University of Pennsylvania from 1985 to 2005. | N/A |
Allspring High Yield Bond Fund | 33
Other information (unaudited)
Name and
year of birth | Position held and
length of service* | Principal occupations during past five years or longer | Current other
public company or
investment
company
directorships |
Olivia S. Mitchell
(Born 1953) | Trustee,
since 2006;
Nominating and
Governance
Committee Chair,
since 2018 | International Foundation of Employee Benefit Plans Professor since 1993, Wharton School of the University of Pennsylvania. Director of Wharton’s Pension Research Council and Boettner Center on Pensions & Retirement Research, and Research Associate at the National Bureau of Economic Research. Previously taught at Cornell University from 1978 to 1993. | N/A |
Timothy J. Penny
(Born 1951) | Trustee,
since 1996;
Chair,
since 2018 | President and Chief Executive Officer of Southern Minnesota Initiative Foundation, a non-profit organization, since 2007. Vice Chair of the Economic Club of Minnesota, since 2007. Co-Chair of the Committee for a Responsible Federal Budget, since 1995. Member of the Board of Trustees of NorthStar Education Finance, Inc., a non-profit organization, from 2007-2022. Senior Fellow of the University of Minnesota Humphrey Institute from 1995 to 2017. | N/A |
James G. Polisson
(Born 1959) | Trustee,
since 2018 | Retired. Chief Marketing Officer, Source (ETF) UK Services, Ltd, from 2015 to 2017. From 2012 to 2015, Principal of The Polisson Group, LLC, a management consulting, corporate advisory and principal investing company. Chief Executive Officer and Managing Director at Russell Investments, Global Exchange Traded Funds from 2010 to 2012. Managing Director of Barclays Global Investors from 1998 to 2010 and Global Chief Marketing Officer for iShares and Barclays Global Investors from 2000 to 2010. Trustee of the San Francisco Mechanics’ Institute, a non-profit organization, from 2013 to 2015. Board member of the Russell Exchange Traded Fund Trust from 2011 to 2012. Director of Barclays Global Investors Holdings Deutschland GmbH from 2006 to 2009. Mr. Polisson is an attorney and has a retired status with the Massachusetts and District of Columbia Bar Associations. | N/A |
Pamela Wheelock
(Born 1959) | Trustee,
since January
2020; previously
Trustee from
January 2018 to
July 2019 | Retired. Executive and Senior Financial leadership positions in the public, private and nonprofit sectors. Interim President and CEO, McKnight Foundation, 2020. Interim Commissioner, Minnesota Department of Human Services, 2019. Chief Operating Officer, Twin Cities Habitat for Humanity, 2017-2019. Vice President for University Services, University of Minnesota, 2012-2016. Interim President and CEO, Blue Cross and Blue Shield of Minnesota, 2011-2012. Executive Vice-President and Chief Financial Officer, Minnesota Wild, 2002-2008. Commissioner, Minnesota Department of Finance, 1999-2002. Chair of the Board of Directors of Destination Medical Center Corporation. Board member of the Minnesota Wild Foundation. | N/A |
* Length of service dates reflect the Trustee’s commencement of service with the Trust’s predecessor entities, where applicable.
34 | Allspring High Yield Bond Fund
Other information (unaudited)
Officers2
Name and
year of birth | Position held and
length of service | Principal occupations during past five years or longer |
Andrew Owen
(Born 1960) | President,
since 2017 | President and Chief Executive Officer of Allspring Funds Management, LLC since 2017 and Head of Global Fund Governance of Allspring Global Investments since 2022. Prior thereto, co-president of Galliard Capital Management, LLC, an affiliate of Allspring Funds Management, LLC, from 2019 to 2022 and Head of Affiliated Managers, Allspring Global Investments, from 2014 to 2019 and Executive Vice President responsible for marketing, investments and product development for Allspring Funds Management, LLC, from 2009 to 2014. |
Jeremy DePalma
(Born 1974) | Treasurer,
since 2012
(for certain funds in
the Fund Complex);
since 2021 (for
the remaining funds in the
Fund Complex) | Senior Vice President of Allspring Funds Management, LLC since 2009. Senior Vice President of Evergreen Investment Management Company, LLC from 2008 to 2010 and head of the Fund Reporting and Control Team within Fund Administration from 2005 to 2010. |
Christopher Baker
(Born 1976) | Chief Compliance Officer, since 2022 | Global Chief Compliance Officer for Allspring Global Investments since 2022. Prior thereto, Chief Compliance Officer for State Street Global Advisors from 2018 to 2021. Senior Compliance Officer for the State Street divisions of Alternative Investment Solutions, Sector Solutions, and Global Marketing from 2015 to 2018. From 2010 to 2015 Vice President, Global Head of Investment and Marketing Compliance for State Street Global Advisors. |
Matthew Prasse
(Born 1983) | Chief Legal Officer, since 2022; Secretary, since 2021 | Senior Counsel of the Allspring Legal Department since 2021. Senior Counsel of the Wells Fargo Legal Department from 2018 to 2021. Previously, Counsel for Barings LLC from 2015 to 2018. Prior to joining Barings, Associate at Morgan, Lewis & Bockius LLP from 2008 to 2015. |
1 The Statement of Additional Information includes additional information about the Trustees and is available, without charge, upon request, by calling 1-800-222-8222 or by visiting the website at allspringglobal.com.
2 For those Officers with tenures at Allspring Global Investments and/or Allspring Funds Management, LLC that began prior to 2021, such tenures include years of service during which these businesses/entities were known as Wells Fargo Asset Management and Wells Fargo Funds Management, LLC, respectively.
Allspring High Yield Bond Fund | 35
For more information
More information about Allspring Funds is available free upon request. To obtain literature, please write, visit the Fund's website, or call:
Allspring Funds
P.O. Box 219967
Kansas City, MO 64121-9967
Website: allspringglobal.com
Individual investors: 1-800-222-8222
Retail investment professionals: 1-888-877-9275
Institutional investment professionals: 1-800-260-5969
This report and the financial statements contained herein are submitted for the general information of the shareholders of the Fund. If this report is used for promotional purposes, distribution of the report must be accompanied or preceded by a current prospectus. Before investing, please consider the investment objectives, risks, charges, and expenses of the investment. For a current prospectus and, if available, a summary prospectus, containing this information, call
1-800-222-8222 or visit the Fund's website at allspringglobal.com. Read the prospectus carefully before you invest or send money.
Allspring Global InvestmentsTM is the trade name for the asset management firms of Allspring Global Investments Holdings, LLC, a holding company indirectly owned by certain private funds of GTCR LLC and Reverence Capital Partners, L.P. These firms include but are not limited to Allspring Global Investments, LLC, and Allspring Funds Management, LLC. Certain products managed by Allspring entities are distributed by Allspring Funds Distributor, LLC (a broker-dealer and Member FINRA/SIPC).
This material is for general informational and educational purposes only and is NOT intended to provide investment advice or a recommendation of any kind - including a recommendation for any specific investment, strategy, or plan.
© 2023 Allspring Global Investments Holdings, LLC. All rights reserved.
ALL-03102023-8nlcshqr 04-23
SAR4323 02-23
Semi-Annual Report
February 28, 2023
Allspring Short Duration
Government Bond Fund
The views expressed and any forward-looking statements are as of February 28, 2023, unless otherwise noted, and are those of the Fund's portfolio managers and/or Allspring Global Investments. Discussions of individual securities or the markets generally are not intended as individual recommendations. Future events or results may vary significantly from those expressed in any forward-looking statements. The views expressed are subject to change at any time in response to changing circumstances in the market. Allspring Global Investments disclaims any obligation to publicly update or revise any views expressed or forward-looking statements.
Allspring Short Duration Government Bond Fund | 1
Letter to shareholders (unaudited)
Andrew Owen
President
Allspring Funds
Dear Shareholder:
We are pleased to offer you this semi-annual report for the Allspring Short Duration Government Bond Fund for the six-month period that ended February 28, 2023. Globally, stocks and bonds experienced heightened volatility through the challenging period. Earlier tailwinds provided by global stimulus programs, vaccination rollouts, and recovering consumer and corporate sentiment were wiped away by the highest rate of inflation in four decades as well as the impact of ongoing aggressive central bank rate hikes and the prospect of more rate hikes. Compounding these concerns were the global reverberations of the Russia-Ukraine war and the impact of China’s strict COVID-19 lockdowns.
For the six-month period, stocks and bonds had mixed results, with non-U.S. equities––both developed market and emerging market––outperforming U.S. stocks overall. Bonds––both U.S. and non-U.S.––began to recover from sustained aggressive interest rate increases. After suffering deep and broad losses over the past year, recent fixed income performance benefited from a base of higher yields that can now generate higher income. For the period, U.S. stocks, based on the S&P 500 Index,1 returned 1.26%. International stocks, as measured by the MSCI ACWI ex USA Index (Net),2 returned 7.30%, while the MSCI EM Index (Net) (USD)3 lost 2.29%. Among bond indexes, the Bloomberg U.S. Aggregate Bond Index4 returned -2.13%, the Bloomberg Global Aggregate ex-USD Index (unhedged)5 returned -0.11%, the Bloomberg Municipal Bond Index6 gained 0.66%, and the ICE BofA U.S. High Yield Index7 returned 2.41%.
The Russia-Ukraine war, high inflation, and central bank rate hikes rocked markets
A challenging calendar year for investors continued in September as all asset classes suffered major losses. Central banks kept up their battle against rapidly rising prices with more rate hikes. The strength of the U.S. dollar weighed on results for investors holding non-U.S.-dollar assets. U.S. mortgage rates jumped to near 7% on 30-year fixed-rate mortgages; the decreased housing affordability began to cool demand somewhat. The U.K. experienced a sharp sell-off of government bonds and the British pound in September as investors panicked in response to a new government budget that was seen as financially unsound. The Bank of England (BoE) then stepped in and bought long-dated government bonds.
“ A challenging calendar year for investors continued in September as all asset classes suffered major losses.”
| 1 | The S&P 500 Index consists of 500 stocks chosen for market size, liquidity, and industry group representation. It is a market-value-weighted index with each stock's weight in the index proportionate to its market value. You cannot invest directly in an index. |
| 2 | The Morgan Stanley Capital International (MSCI) All Country World Index (ACWI) ex USA Index (Net) is a free-float-adjusted market-capitalization-weighted index that is designed to measure the equity market performance of developed and emerging markets, excluding the U.S. Source: MSCI. MSCI makes no express or implied warranties or representations and shall have no liability whatsoever with respect to any MSCI data contained herein. The MSCI data may not be further redistributed or used as a basis for other indexes or any securities or financial products. This report is not approved, reviewed, or produced by MSCI. You cannot invest directly in an index. |
| 3 | The MSCI Emerging Markets (EM) Index (Net) (USD) is a free-float-adjusted market-capitalization-weighted index that is designed to measure equity market performance of emerging markets. You cannot invest directly in an index. |
| 4 | The Bloomberg U.S. Aggregate Bond Index is a broad-based benchmark that measures the investment-grade, U.S.-dollar-denominated, fixed-rate taxable bond market, including Treasuries, government-related and corporate securities, mortgage-backed securities (agency fixed-rate and hybrid adjustable-rate mortgage pass-throughs), asset-backed securities, and commercial mortgage-backed securities. You cannot invest directly in an index. |
| 5 | The Bloomberg Global Aggregate ex-USD Index (unhedged) is an unmanaged index that provides a broad-based measure of the global investment-grade fixed-income markets excluding the U.S.-dollar-denominated debt market. You cannot invest directly in an index. |
| 6 | The Bloomberg Municipal Bond Index is an unmanaged index composed of long-term tax-exempt bonds with a minimum credit rating of Baa. You cannot invest directly in an index. |
| 7 | The ICE BofA U.S. High Yield Index is a market-capitalization-weighted index of domestic and Yankee high-yield bonds. The index tracks the performance of high-yield securities traded in the U.S. bond market. You cannot invest directly in an index. Copyright 2023. ICE Data Indices, LLC. All rights reserved. |
2 | Allspring Short Duration Government Bond Fund
Letter to shareholders (unaudited)
Equities had a reprieve in October. Value stocks and small caps fared best. Globally, developed markets outpaced emerging market equities, which were hurt by weakness among Chinese stocks. Central banks continued to try to curtail high inflation with aggressive interest rate hikes. Geopolitical risks persisted, including the ongoing Russia-Ukraine war and economic, financial market, and political turmoil in the U.K. Concerns over Europe’s energy crisis eased thanks to unseasonably warm weather and plentiful gas on hand. The U.S. labor market continued its resilience against rising prices as unemployment remained near a record low.
Stocks and bonds rallied in November. Economic news was encouraging, driven by U.S. labor market strength. Although central banks kept raising rates, hopes rose for an easing in the pace of rate hikes and a possible end to central bank monetary tightening in 2023. Although inflation remained at record highs in the eurozone, we began to see signs of a possible decline in inflationary pressures as U.S. inflation moderated, with a 7.1% annual price rise in November and a monthly price increase of just 0.1%. China’s economic data remained weak, reflecting its zero-COVID-19 policy.
Financial markets cooled in December, with U.S. equities posting negative overall results in response to a weakening U.S. dollar. Fixed income securities ended one of their worst years ever with flat overall monthly returns as markets weighed the hopes for an end to the monetary tightening cycle with the reality that central banks had not completed their jobs yet. U.S. Consumer Price Index (CPI)1 data showed a strong consistent trend downward, which brought down the 12-month CPI to 6.5% in December from 9.1% in June. Other countries and regions reported still-high but declining inflation rates as the year winded down.
The year 2023 began with a rally across global equities and fixed income securities. Investor optimism rose in response to data indicating declining inflation rates and the reopening of China’s economy with the abrupt end to its zero-COVID-19 policy. The U.S. reported surprisingly strong job gains––employers added more than 500,000 jobs––and unemployment fell to 3.4%, the lowest level since 1969. Meanwhile, wage growth, seen as a potential contributor to ongoing high inflation, continued to moderate. All eyes remained fixed on the Federal Reserve (Fed) and on how many more rate hikes remain in this tightening cycle. The 0.25% federal funds rate hike announced in January was the Fed’s smallest rate increase since March 2022.
Financial markets declined in February as investors responded unfavorably to resilient economic data. The takeaway: Central banks will likely continue their monetary tightening cycle for longer than markets had priced in. In this environment—where strong economic data is seen as bad news—the resilient U.S. labor market was seen as a negative while the inflation rate has not been falling quickly enough for the Fed, which raised interest rates by 0.25% in early February. Meanwhile, the BoE and the European Central Bank both raised rates by 0.50%. At this stage in the economic cycle, the overriding question remained: “What will central banks do?” In February, the answer appeared to be: “Move rates higher for longer.”
| 1 | The Consumer Price Index (CPI) is a measure of the average change over time in the prices paid by urban consumers for a market basket of consumer goods and services. You cannot invest directly in an index. |
Allspring Short Duration Government Bond Fund | 3
Letter to shareholders (unaudited)
Don’t let short-term uncertainty derail long-term investment goals.
Periods of investment uncertainty can present challenges, but experience has taught us that maintaining long-term investment goals can be an effective way to plan for the future. To help you create a sound strategy based on your personal goals and risk tolerance, Allspring Funds offers more than 100 mutual funds spanning a wide range of asset classes and investment styles. Although diversification cannot guarantee an investment profit or prevent losses, we believe it can be an effective way to manage investment risk and potentially smooth out overall portfolio performance. We encourage investors to know their investments and to understand that appropriate levels of risk-taking may unlock opportunities.
Thank you for choosing to invest with Allspring Funds. We appreciate your confidence in us and remain committed to helping you meet your financial needs.
Sincerely,
Andrew Owen
President
Allspring Funds
Notice to Shareholders
Following approval by the Fund’s Board of Trustees at a meeting held on February 28 - March 1, 2023, the Fund’s principal investment strategy is changed effective May 1, 2023 to the following:
Under normal circumstances, we invest:
* at least 90% of the Fund’s net assets in U.S. Government obligations; and
* up to 10% of the Fund’s net assets in non-government mortgage- and asset-backed securities.
For further information about your fund, contact your investment professional, visit our website at allspringglobal.com, or call us directly at 1-800-222-8222.
4 | Allspring Short Duration Government Bond Fund
This page is intentionally left blank.
Performance highlights (unaudited)
| Investment objective | The Fund seeks to provide current income consistent with capital preservation. |
| Manager | Allspring Funds Management, LLC |
| Subadviser | Allspring Global Investments, LLC |
| Portfolio managers | Maulik Bhansali, CFA®‡, Jarad Vasquez |
| Average annual total returns (%) as of February 28, 2023 |
| | | Including sales charge | | Excluding sales charge | | Expense ratios1 (%) |
| | Inception date | 1 year | 5 year | 10 year | | 1 year | 5 year | 10 year | | Gross | Net 2 |
| Class A (MSDAX) | 3-11-1996 | -6.27 | -0.38 | -0.07 | | -4.35 | 0.02 | 0.13 | | 0.79 | 0.78 |
| Class C (MSDCX) | 5-31-2002 | -5.97 | -0.73 | -0.47 | | -4.97 | -0.73 | -0.47 | | 1.54 | 1.53 |
| Class R6 (MSDRX)3 | 11-30-2012 | – | – | – | | -3.94 | 0.42 | 0.54 | | 0.41 | 0.37 |
| Administrator Class (MNSGX) | 12-18-1992 | – | – | – | | -4.17 | 0.20 | 0.32 | | 0.73 | 0.60 |
| Institutional Class (WSGIX) | 4-8-2005 | – | – | – | | -4.00 | 0.38 | 0.50 | | 0.46 | 0.42 |
| Bloomberg U.S. 1-3 Year Government Bond Index4 | – | – | – | – | | -2.76 | 0.81 | 0.65 | | – | – |
Figures quoted represent past performance, which is no guarantee of future results, and do not reflect taxes that a shareholder may pay on an investment in a fund. Investment return and principal value of an investment will fluctuate so that an investor’s shares, when redeemed, may be worth more or less than their original cost. Performance shown without sales charges would be lower if sales charges were reflected. Current performance may be lower or higher than the performance data quoted, which assumes the reinvestment of dividends and capital gains. Current month-end performance is available on the Fund’s website, allspringglobal.com.
Index returns do not include transaction costs associated with buying and selling securities, any mutual fund fees or expenses, or any taxes. It is not possible to invest directly in an index.
For Class A shares, the maximum front-end sales charge is 2.00%. For Class C shares, the maximum contingent deferred sales charge is 1.00%. Performance including a contingent deferred sales charge assumes the sales charge for the corresponding time period. Class R6, Administrator Class and Institutional Class shares are sold without a front-end sales charge or contingent deferred sales charge.
| 1 | Reflects the expense ratios as stated in the most recent prospectuses. The expense ratios shown are subject to change and may differ from the annualized expense ratios shown in the financial highlights of this report. |
| 2 | The manager has contractually committed through December 31, 2023, to waive fees and/or reimburse expenses to the extent necessary to cap total annual fund operating expenses after fee waivers at 0.78% for Class A, 1.53% for Class C, 0.37% for Class R6, 0.60% for Administrator Class, and 0.42% for Institutional Class. Brokerage commissions, stamp duty fees, interest, taxes, acquired fund fees and expenses (if any), and extraordinary expenses are excluded from the expense caps. Prior to or after the commitment expiration date, the caps may be increased or the commitment to maintain the caps may be terminated only with the approval of the Board of Trustees. Without these caps, the Fund’s returns would have been lower. The expense ratio paid by an investor is the net expense ratio (the total annual fund operating expenses after fee waivers) as stated in the prospectuses. |
| 3 | Historical performance shown for the Class R6 shares prior to their inception reflects the performance of the Institutional Class shares, and includes the higher expenses applicable to the Institutional Class shares. If these expenses had not been included, returns for the Class R6 shares would be higher. |
| 4 | The Bloomberg U.S. 1–3 Year Government Bond Index is composed of all publicly issued, non-convertible domestic debt of the U.S. government and its agencies. The index also includes corporate debt guaranteed by the U.S. government. Only notes and bonds with a minimum maturity of one year up to a maximum maturity of 2.9 years are included. You cannot invest directly in an index. |
Bond values fluctuate in response to the financial condition of individual issuers, general market and economic conditions, and changes in interest rates. Changes in market conditions and government policies may lead to periods of heightened volatility in the bond market and reduced liquidity for certain bonds held by the Fund. In general, when interest rates rise, bond values fall and investors may lose principal value. Interest rate changes and their impact on the Fund and its share price can be sudden and unpredictable. Securities issued by U.S. government agencies or government-sponsored entities may not be guaranteed by the U.S. Treasury. Certain investment strategies tend to increase the total risk of an investment (relative to the broader market). This fund is exposed to mortgage- and asset-backed securities risk. The U.S. government guarantee applies to certain underlying securities and not to shares of the Fund. Consult the Fund’s prospectus for additional information on these and other risks.
| ‡ | CFA® and Chartered Financial Analyst® are trademarks owned by CFA Institute. |
6 | Allspring Short Duration Government Bond Fund
Performance highlights (unaudited)
| Ten largest holdings (%) as of February 28, 20231 |
| FHLMC, 2.82%, 5-1-2049 | 12.85 |
| FHLMC, 3.65%, 2-1-2046 | 6.37 |
| FNMA, 3.45%, 7-1-2049 | 5.82 |
| FHLMC, 3.07%, 6-1-2043 | 4.56 |
| FHLMC, 3.28%, 4-1-2047 | 3.71 |
| FHLMC, 3.70%, 1-1-2049 | 3.66 |
| U.S. Treasury Note, 4.25%, 12-31-2024 | 2.83 |
| U.S. Treasury Note, 4.00%, 2-15-2026 | 2.81 |
| FHLMC, 2.42%, 10-1-2043 | 2.44 |
| FHLMC, 3.73%, 9-1-2047 | 2.33 |
| 1 | Figures represent the percentage of the Fund's net assets. Holdings are subject to change and may have changed since the date specified. |
| Portfolio composition as of February 28, 20231 |
| 1 | Figures represent the percentage of the Fund's long-term investments. Allocations are subject to change and may have changed since the date specified. |
Allspring Short Duration Government Bond Fund | 7
Fund expenses (unaudited)
As a shareholder of the Fund, you incur two types of costs: (1) transaction costs, including sales charges (loads) on purchase payments and contingent deferred sales charges (if any) on redemptions and (2) ongoing costs, including management fees, distribution (12b-1) and/or shareholder servicing fees, and other Fund expenses. This example is intended to help you understand your ongoing costs (in dollars) of investing in the Fund and to compare these costs with the ongoing costs of investing in other mutual funds.
The example is based on an investment of $1,000 invested at the beginning of the six-month period and held for the entire period from September 1, 2022 to February 28, 2023.
Actual expenses
The “Actual” line of the table below provides information about actual account values and actual expenses. You may use the information in this line, together with the amount you invested, to estimate the expenses that you paid over the period. Simply divide your account value by $1,000 (for example, an $8,600 account value divided by $1,000 = 8.6), then multiply the result by the number in the “Actual” line under the heading entitled “Expenses paid during period” for your applicable class of shares to estimate the expenses you paid on your account during this period.
Hypothetical example for comparison purposes
The “Hypothetical” line of the table below provides information about hypothetical account values and hypothetical expenses based on the Fund’s actual expense ratio and an assumed rate of return of 5% per year before expenses, which is not the Fund’s actual return. The hypothetical account values and expenses may not be used to estimate the actual ending account balance or expenses you paid for the period. You may use this information to compare the ongoing costs of investing in the Fund and other funds. To do so, compare this 5% hypothetical example with the 5% hypothetical examples that appear in the shareholder reports of the other funds.
Please note that the expenses shown in the table are meant to highlight your ongoing costs only and do not reflect any transactional costs, such as sales charges (loads) and contingent deferred sales charges. Therefore, the “Hypothetical” line of the table is useful in comparing ongoing costs only, and will not help you determine the relative total costs of owning different funds. In addition, if these transactional costs were included, your costs would have been higher.
| | Beginning
account value
9-1-2022 | Ending
account value
2-28-2023 | Expenses
paid during
the period1 | Annualized net
expense ratio |
| Class A | | | | |
| Actual | $1,000.00 | $ 989.22 | $3.85 | 0.78% |
| Hypothetical (5% return before expenses) | $1,000.00 | $1,020.93 | $3.91 | 0.78% |
| Class C | | | | |
| Actual | $1,000.00 | $ 985.59 | $7.53 | 1.53% |
| Hypothetical (5% return before expenses) | $1,000.00 | $1,017.21 | $7.65 | 1.53% |
| Class R6 | | | | |
| Actual | $1,000.00 | $ 991.31 | $1.83 | 0.37% |
| Hypothetical (5% return before expenses) | $1,000.00 | $1,022.96 | $1.86 | 0.37% |
| Administrator Class | | | | |
| Actual | $1,000.00 | $ 990.15 | $2.96 | 0.60% |
| Hypothetical (5% return before expenses) | $1,000.00 | $1,021.82 | $3.01 | 0.60% |
| Institutional Class | | | | |
| Actual | $1,000.00 | $ 991.03 | $2.07 | 0.42% |
| Hypothetical (5% return before expenses) | $1,000.00 | $1,022.71 | $2.11 | 0.42% |
1 Expenses paid is equal to the annualized net expense ratio of each class multiplied by the average account value over the period, multiplied by 181 divided by 365 (to reflect the one-half-year period).
8 | Allspring Short Duration Government Bond Fund
Portfolio of investments—February 28, 2023 (unaudited)
| | | Interest
rate | Maturity
date | Principal | Value |
| Agency securities: 70.17% | | | | | | |
| FHLMC (12 Month LIBOR +1.63%) ± | | 2.42% | 10-1-2043 | $ | 8,266,167 | $ 8,346,764 |
| FHLMC | | 2.50 | 5-15-2047 | | 5,948,503 | 5,489,946 |
| FHLMC (12 Month LIBOR +1.62%) ± | | 2.65 | 10-1-2043 | | 6,051,247 | 6,138,787 |
| FHLMC (12 Month LIBOR +1.65%) ± | | 2.71 | 9-1-2045 | | 5,867,320 | 5,954,787 |
| FHLMC (12 Month LIBOR +1.64%) ± | | 2.82 | 5-1-2049 | | 45,108,982 | 43,859,758 |
| FHLMC (12 Month LIBOR +1.64%) ± | | 2.83 | 7-1-2047 | | 1,513,539 | 1,479,961 |
| FHLMC (12 Month LIBOR +1.66%) ± | | 3.07 | 6-1-2043 | | 15,433,497 | 15,558,079 |
| FHLMC (12 Month LIBOR +1.63%) ± | | 3.28 | 4-1-2047 | | 12,702,935 | 12,681,440 |
| FHLMC (12 Month LIBOR +1.62%) ± | | 3.38 | 8-1-2046 | | 6,035,247 | 6,046,343 |
| FHLMC (12 Month LIBOR +1.85%) ± | | 3.65 | 5-1-2042 | | 533,088 | 536,855 |
| FHLMC (12 Month LIBOR +1.62%) ± | | 3.65 | 2-1-2046 | | 21,665,538 | 21,731,326 |
| FHLMC (12 Month LIBOR +1.63%) ± | | 3.70 | 1-1-2049 | | 12,496,456 | 12,482,646 |
| FHLMC (12 Month LIBOR +1.69%) ± | | 3.73 | 9-1-2047 | | 7,816,918 | 7,962,303 |
| FHLMC (30 Day Average U.S. SOFR +2.13%) ± | | 4.21 | 6-1-2052 | | 4,589,794 | 4,403,494 |
| FHLMC Series 3284 Class AF (1 Month LIBOR +0.31%) ± | | 4.90 | 3-15-2037 | | 2,709,445 | 2,667,167 |
| FHLMC Series 3632 Class PK | | 5.00 | 2-15-2040 | | 1,288,808 | 1,273,191 |
| FHLMC Series 4940 Class AG | | 3.00 | 5-15-2040 | | 7,568,335 | 6,993,601 |
| FNMA (12 Month LIBOR +1.60%) ± | | 2.42 | 9-1-2043 | | 2,776,812 | 2,848,057 |
| FNMA | | 3.00 | 5-25-2035 | | 8,044,705 | 7,608,251 |
| FNMA | | 3.00 | 8-1-2036 | | 3,158,026 | 2,921,679 |
| FNMA (12 Month LIBOR +1.56%) ± | | 3.38 | 9-1-2045 | | 667,677 | 667,179 |
| FNMA (12 Month LIBOR +1.61%) ± | | 3.45 | 7-1-2049 | | 20,853,159 | 19,879,460 |
| FNMA | | 3.50 | 7-1-2043 | | 2,296,583 | 2,174,701 |
| FNMA (12 Month LIBOR +1.58%) ± | | 3.74 | 6-1-2045 | | 534,174 | 538,075 |
| FNMA (12 Month LIBOR +1.58%) ± | | 3.83 | 1-1-2046 | | 654,469 | 657,168 |
| FNMA (1 Year Treasury Constant Maturity +2.04%) ± | | 3.94 | 3-1-2049 | | 2,460,451 | 2,406,927 |
| FNMA | | 4.00 | 3-1-2031 | | 3,814,592 | 3,722,563 |
| FNMA | | 4.00 | 2-1-2034 | | 2,087,489 | 2,002,184 |
| FNMA | | 4.00 | 6-1-2038 | | 4,941,600 | 4,740,455 |
| FNMA (12 Month LIBOR +1.59%) ± | | 4.09 | 5-1-2047 | | 1,372,568 | 1,392,218 |
| FNMA (1 Month LIBOR +0.35%) ± | | 4.97 | 1-25-2048 | | 1,108,766 | 1,076,959 |
| FNMA | | 5.00 | 10-1-2040 | | 608,548 | 613,193 |
| FNMA (1 Month LIBOR +0.40%) ± | | 5.02 | 11-25-2036 | | 4,940,615 | 4,904,675 |
| FNMA (1 Month LIBOR +0.40%) ± | | 5.02 | 1-25-2044 | | 1,427,428 | 1,410,834 |
| FNMA (1 Month LIBOR +0.40%) ± | | 5.02 | 7-25-2049 | | 3,243,054 | 3,176,513 |
| FNMA (1 Month LIBOR +0.55%) ± | | 5.17 | 12-25-2037 | | 1,052,064 | 1,047,471 |
| FNMA (12 Month LIBOR +1.69%) ± | | 6.06 | 11-1-2042 | | 541,503 | 554,173 |
| FNMA (12 Month LIBOR +1.58%) ± | | 7.05 | 2-1-2046 | | 649,770 | 666,655 |
| FNMA Series 2019-33 Class MA | | 3.50 | 7-25-2055 | | 5,607,860 | 5,357,565 |
| GNMA | | 4.50 | 6-20-2048 | | 1,393,136 | 1,369,596 |
| GNMA Series 2010 Class FL (1 Month LIBOR +0.35%) ± | | 4.95 | 12-20-2040 | | 1,728,258 | 1,715,005 |
| GNMA Series 2019 Class DF (1 Month LIBOR +0.45%) ± | | 5.05 | 10-20-2049 | | 2,554,452 | 2,508,477 |
| Total Agency securities (Cost $247,783,262) | | | | | | 239,566,481 |
| Asset-backed securities: 7.78% | | | | | | |
| AmeriCredit Automobile Receivables Series 2022-1 Class A3 | | 2.45 | 11-18-2026 | | 2,271,000 | 2,186,489 |
| Enterprise Fleet Financing LLC 144A%% | | 5.59 | 10-22-2029 | | 1,797,000 | 1,798,685 |
| GM Financial Automobile Leasing Trust Series 2023 Class A4 | | 5.16 | 1-20-2027 | | 1,667,000 | 1,659,442 |
| Hyundai Auto Receivables Trust Series 2022-C Class A4 | | 5.52 | 10-16-2028 | | 1,660,000 | 1,677,574 |
| Navient Student Loan Trust Series 2019-GA Class A 144A | | 2.40 | 10-15-2068 | | 1,675,651 | 1,527,218 |
| Navient Student Loan Trust Series 2020-DA Class A 144A | | 1.69 | 5-15-2069 | | 3,622,876 | 3,282,439 |
| Navient Student Loan Trust Series 2020-GA Class A 144A | | 1.17 | 9-16-2069 | | 1,275,974 | 1,133,433 |
The accompanying notes are an integral part of these financial statements.
Allspring Short Duration Government Bond Fund | 9
Portfolio of investments—February 28, 2023 (unaudited)
| | | Interest
rate | Maturity
date | Principal | Value |
| Asset-backed securities (continued) | | | | | | |
| Navient Student Loan Trust Series 2020-HA Class A 144A | | 1.31% | 1-15-2069 | $ | 718,795 | $ 652,709 |
| Navient Student Loan Trust Series 2021-A Class A 144A | | 0.84 | 5-15-2069 | | 910,669 | 789,973 |
| Nelnet Student Loan Trust Series 2004-4 Class A5 (3 Month LIBOR +0.16%) ± | | 4.98 | 1-25-2037 | | 1,614,649 | 1,589,044 |
| Nelnet Student Loan Trust Series 2016-1A Class A (1 Month LIBOR +0.80%) 144A± | | 5.42 | 9-25-2065 | | 2,878,848 | 2,855,683 |
| SLC Student Loan Trust Series 2010-1 Class A (3 Month LIBOR +0.88%) ± | | 5.83 | 11-25-2042 | | 437,714 | 434,356 |
| SMB Private Education Loan Trust Series 2016-B Class A2B (1 Month LIBOR +1.45%) 144A± | | 6.04 | 2-17-2032 | | 569,490 | 566,347 |
| SoFi Professional Loan Program LLC Series 2017-E Class A2B 144A | | 2.72 | 11-26-2040 | | 51,035 | 50,777 |
| SoFi Professional Loan Program LLC Series 2020-C Class AFX 144A | | 1.95 | 2-15-2046 | | 663,520 | 600,192 |
| SoFi Professional Loan Program LLC Series 2021-A Class AFX 144A | | 1.03 | 8-17-2043 | | 2,327,918 | 1,934,211 |
| T-Mobile US Trust Series 2022-1A Class A 144A | | 4.91 | 5-22-2028 | | 1,609,000 | 1,600,247 |
| Westlake Automobile Receivables Series 2022-1A 144A | | 2.42 | 7-15-2025 | | 2,267,000 | 2,216,024 |
| Total Asset-backed securities (Cost $28,034,248) | | | | | | 26,554,843 |
| Non-agency mortgage-backed securities: 8.14% | | | | | | |
| Angel Oak Mortgage Trust Series 2020-5 Class A1 144A±± | | 1.37 | 5-25-2065 | | 623,420 | 565,800 |
| Bunker Hill Loan Depositary Trust Series 2019-2 Class A1 144A | | 2.88 | 7-25-2049 | | 523,245 | 485,804 |
| BX Trust Series 2021-VOLT Class A (1 Month LIBOR +0.70%) 144A± | | 5.29 | 9-15-2036 | | 5,045,000 | 4,923,690 |
| BX Trust Series 2021-XL2 Class A (1 Month LIBOR +0.69%) 144A± | | 5.28 | 10-15-2038 | | 4,630,795 | 4,515,058 |
| Citigroup Commercial Mortgage Trust Series 2014-GC25 Class AAB | | 3.37 | 10-10-2047 | | 181,395 | 178,057 |
| Med Trust Series 2021-MDLN (1 Month LIBOR +0.95%) 144A± | | 5.54 | 11-15-2038 | | 2,520,512 | 2,459,096 |
| NewRez WareHouse Securitization Series 2021-1 Class A (1 Month LIBOR +0.75%) 144A± | | 5.37 | 5-25-2055 | | 5,533,000 | 5,472,882 |
| Verus Securitization Trust Series 2019-2 Class A1 144A±± | | 2.91 | 7-25-2059 | | 386,286 | 373,662 |
| Verus Securitization Trust Series 2019-3 Class A1 144A±± | | 2.69 | 11-25-2059 | | 423,287 | 401,329 |
| Verus Securitization Trust Series 2019-4 Class A1 144A | | 2.64 | 11-25-2059 | | 184,080 | 175,094 |
| Verus Securitization Trust Series 2020-5 Class A1 144A | | 1.22 | 5-25-2065 | | 1,220,568 | 1,105,994 |
| Verus Securitization Trust Series 2021-3 Class A1 144A±± | | 1.05 | 6-25-2066 | | 2,065,573 | 1,713,879 |
| Verus Securitization Trust Series 2021-4 Class A1 144A±± | | 0.94 | 7-25-2066 | | 2,505,190 | 1,990,552 |
| Verus Securitization Trust Series 2021-7 Class A1 144A±± | | 1.83 | 10-25-2066 | | 4,093,760 | 3,433,236 |
| Total Non-agency mortgage-backed securities (Cost $29,918,798) | | | | | | 27,794,133 |
| U.S. Treasury securities: 11.08% | | | | | | |
| U.S. Treasury Note | | 3.88 | 1-15-2026 | | 5,554,000 | 5,458,541 |
| U.S. Treasury Note | | 4.00 | 12-15-2025 | | 908,000 | 895,870 |
| U.S. Treasury Note | | 4.00 | 2-15-2026 | | 9,735,000 | 9,600,383 |
| U.S. Treasury Note | | 4.13 | 1-31-2025 | | 7,564,000 | 7,465,609 |
| U.S. Treasury Note | | 4.25 | 12-31-2024 | | 9,774,000 | 9,664,424 |
| U.S. Treasury Note | | 4.25 | 10-15-2025 | | 1,168,000 | 1,158,191 |
The accompanying notes are an integral part of these financial statements.
10 | Allspring Short Duration Government Bond Fund
Portfolio of investments—February 28, 2023 (unaudited)
| | | Interest
rate | Maturity
date | Principal | Value |
| U.S. Treasury securities (continued) | | | | | | |
| U.S. Treasury Note | | 4.50% | 11-30-2024 | $ | 410,000 | $ 407,037 |
| U.S. Treasury Note | | 4.50 | 11-15-2025 | | 3,173,000 | 3,167,670 |
| Total U.S. Treasury securities (Cost $38,564,810) | | | | | | 37,817,725 |
| | | Yield | | Shares | |
| Short-term investments: 1.87% | | | | | | |
| Investment companies: 1.87% | | | | | | |
| Allspring Government Money Market Fund Select Class ♠∞## | | 4.39 | | | 6,406,330 | 6,406,330 |
| Total Short-term investments (Cost $6,406,330) | | | | | | 6,406,330 |
| Total investments in securities (Cost $350,707,448) | 99.04% | | | | | 338,139,512 |
| Other assets and liabilities, net | 0.96 | | | | | 3,262,353 |
| Total net assets | 100.00% | | | | | $341,401,865 |
| ± | Variable rate investment. The rate shown is the rate in effect at period end. |
| 144A | The security may be resold in transactions exempt from registration, normally to qualified institutional buyers, pursuant to Rule 144A under the Securities Act of 1933. |
| ±± | The coupon of the security is adjusted based on the principal and/or interest payments received from the underlying pool of mortgages as well as the credit quality and the actual prepayment speed of the underlying mortgages. The rate shown is the rate in effect at period end. |
| ## | All or a portion of this security is segregated for when-issued securities. |
| ♠ | The issuer of the security is an affiliated person of the Fund as defined in the Investment Company Act of 1940. |
| ∞ | The rate represents the 7-day annualized yield at period end. |
| %% | The security is purchased on a when-issued basis. |
| Abbreviations: |
| FHLMC | Federal Home Loan Mortgage Corporation |
| FNMA | Federal National Mortgage Association |
| GNMA | Government National Mortgage Association |
| LIBOR | London Interbank Offered Rate |
| SOFR | Secured Overnight Financing Rate |
Investments in affiliates
An affiliated investment is an investment in which the Fund owns at least 5% of the outstanding voting shares of the issuer or as a result of other relationships, such as the Fund and the issuer having the same investment manager. Transactions with issuers that were affiliates of the Fund at the end of the period were as follows:
| | Value,
beginning of
period | Purchases | Sales
proceeds | Net
realized
gains
(losses) | Net
change in
unrealized
gains
(losses) | Value,
end of
period | Shares,
end
of period | Income
from
affiliated
securities |
| Short-term investments | | | | | | | |
| Allspring Government Money Market Fund Select Class | $9,265,106 | $121,240,489 | $(124,099,265) | $0 | $0 | $6,406,330 | 6,406,330 | $140,666 |
The accompanying notes are an integral part of these financial statements.
Allspring Short Duration Government Bond Fund | 11
Portfolio of investments—February 28, 2023 (unaudited)
Futures contracts
| Description | Number of
contracts | Expiration
date | Notional
cost | Notional
value | Unrealized
gains | | Unrealized
losses |
| Long | | | | | | | |
| 2-Year U.S. Treasury Notes | 774 | 6-30-2023 | $158,117,098 | $157,684,359 | $ 0 | | $ (432,739) |
| Short | | | | | | | |
| 10-Year U.S. Ultra Treasury Notes | (59) | 6-21-2023 | (6,911,658) | (6,914,063) | 0 | | (2,405) |
| 5-Year U.S. Treasury Notes | (262) | 6-30-2023 | (28,129,784) | (28,048,328) | 81,456 | | 0 |
| | | | | | $81,456 | | $(435,144) |
The accompanying notes are an integral part of these financial statements.
12 | Allspring Short Duration Government Bond Fund
Statement of assets and liabilities—February 28, 2023 (unaudited)
| | |
| Assets | |
Investments in unaffiliated securities, at value (cost $344,301,118)
| $ 331,733,182 |
Investments in affiliated securities, at value (cost $6,406,330)
| 6,406,330 |
Cash
| 1,050,153 |
Cash at broker segregated for futures contracts
| 1,149,000 |
Principal paydown receivable
| 3,223,710 |
Receivable for interest
| 1,324,116 |
Receivable for Fund shares sold
| 94,789 |
Prepaid expenses and other assets
| 80,179 |
Total assets
| 345,061,459 |
| Liabilities | |
Payable for when-issued transactions
| 1,796,510 |
Payable for investments purchased
| 1,047,997 |
Payable for Fund shares redeemed
| 536,132 |
Dividends payable
| 118,197 |
Management fee payable
| 73,434 |
Administration fees payable
| 21,943 |
Payable for daily variation margin on open futures contracts
| 21,702 |
Distribution fee payable
| 1,266 |
Accrued expenses and other liabilities
| 42,413 |
Total liabilities
| 3,659,594 |
Total net assets
| $ 341,401,865 |
| Net assets consist of | |
Paid-in capital
| $ 473,130,124 |
Total distributable loss
| (131,728,259) |
Total net assets
| $ 341,401,865 |
| Computation of net asset value and offering price per share | |
Net assets – Class A
| $ 26,987,499 |
Shares outstanding – Class A1
| 3,054,966 |
Net asset value per share – Class A
| $8.83 |
Maximum offering price per share – Class A2
| $9.01 |
Net assets – Class C
| $ 2,197,821 |
Shares outstanding – Class C1
| 248,421 |
Net asset value per share – Class C
| $8.85 |
Net assets – Class R6
| $ 38,686,739 |
Shares outstanding – Class R61
| 4,364,337 |
Net asset value per share – Class R6
| $8.86 |
Net assets – Administrator Class
| $ 20,332,076 |
Shares outstanding – Administrator Class1
| 2,297,035 |
Net asset value per share – Administrator Class
| $8.85 |
Net assets – Institutional Class
| $ 253,197,730 |
Shares outstanding – Institutional Class1
| 28,617,949 |
Net asset value per share – Institutional Class
| $8.85 |
| 1 | The Fund has an unlimited number of authorized shares. |
| 2 | Maximum offering price is computed as 100/98.00 of net asset value. On investments of $100,000 or more, the offering price is reduced. |
The accompanying notes are an integral part of these financial statements.
Allspring Short Duration Government Bond Fund | 13
Statement of operations—six months ended February 28, 2023 (unaudited)
| | |
| Investment income | |
Interest
| $ 5,459,023 |
Income from affiliated securities
| 140,666 |
Total investment income
| 5,599,689 |
| Expenses | |
Management fee
| 673,751 |
| Administration fees | |
Class A
| 22,569 |
Class C
| 1,801 |
Class R6
| 6,146 |
Administrator Class
| 12,259 |
Institutional Class
| 115,619 |
| Shareholder servicing fees | |
Class A
| 35,263 |
Class C
| 2,807 |
Administrator Class
| 30,502 |
| Distribution fee | |
Class C
| 8,422 |
Custody and accounting fees
| 14,629 |
Professional fees
| 27,879 |
Registration fees
| 28,495 |
Shareholder report expenses
| 18,604 |
Trustees’ fees and expenses
| 10,625 |
Other fees and expenses
| 5,607 |
Total expenses
| 1,014,978 |
| Less: Fee waivers and/or expense reimbursements | |
Fund-level
| (82,981) |
Class R6
| (6,146) |
Administrator Class
| (13,485) |
Institutional Class
| (28,905) |
Net expenses
| 883,461 |
Net investment income
| 4,716,228 |
| Realized and unrealized gains (losses) on investments | |
| Net realized losses on | |
Unaffiliated securities
| (9,467,940) |
Futures contracts
| (2,631,874) |
Net realized losses on investments
| (12,099,814) |
| Net change in unrealized gains (losses) on | |
Unaffiliated securities
| 3,308,334 |
Futures contracts
| (282,742) |
Net change in unrealized gains (losses) on investments
| 3,025,592 |
Net realized and unrealized gains (losses) on investments
| (9,074,222) |
Net decrease in net assets resulting from operations
| $ (4,357,994) |
The accompanying notes are an integral part of these financial statements.
14 | Allspring Short Duration Government Bond Fund
Statement of changes in net assets
| | | | | |
| | Six months ended
February 28, 2023
(unaudited) | Year ended
August 31, 2022 |
| Operations | | | | |
Net investment income
| | $ 4,716,228 | | $ 4,606,625 |
Net realized losses on investments
| | (12,099,814) | | (20,233,978) |
Net change in unrealized gains (losses) on investments
| | 3,025,592 | | (18,519,705) |
Net decrease in net assets resulting from operations
| | (4,357,994) | | (34,147,058) |
| Distributions to shareholders from | | | | |
| Net investment income and net realized gains | | | | |
Class A
| | (358,369) | | (598,430) |
Class C
| | (20,204) | | (17,988) |
Class R6
| | (604,665) | | (758,267) |
Administrator Class
| | (330,853) | | (434,404) |
Institutional Class
| | (4,164,697) | | (7,869,553) |
Total distributions to shareholders
| | (5,478,788) | | (9,678,642) |
| Capital share transactions | Shares | | Shares | |
| Proceeds from shares sold | | | | |
Class A
| 49,177 | 437,256 | 170,022 | 1,592,587 |
Class C
| 6,031 | 53,612 | 8,053 | 74,814 |
Class R6
| 273,871 | 2,435,621 | 1,230,686 | 11,586,137 |
Administrator Class
| 242,405 | 2,171,324 | 378,650 | 3,509,562 |
Institutional Class
| 3,453,730 | 30,684,604 | 16,694,832 | 156,076,726 |
| | | 35,782,417 | | 172,839,826 |
| Reinvestment of distributions | | | | |
Class A
| 38,953 | 344,752 | 62,180 | 581,610 |
Class C
| 2,279 | 20,204 | 1,944 | 17,988 |
Class R6
| 64,016 | 568,559 | 76,231 | 712,095 |
Administrator Class
| 36,828 | 326,569 | 46,297 | 432,110 |
Institutional Class
| 396,153 | 3,511,428 | 745,676 | 6,981,870 |
| | | 4,771,512 | | 8,725,673 |
| Payment for shares redeemed | | | | |
Class A
| (440,972) | (3,907,461) | (3,825,387) | (35,919,031) |
Class C
| (47,208) | (422,042) | (233,246) | (2,192,919) |
Class R6
| (727,895) | (6,478,170) | (1,425,467) | (13,557,384) |
Administrator Class
| (987,632) | (8,767,974) | (748,286) | (7,075,499) |
Institutional Class
| (12,115,896) | (107,589,879) | (39,209,404) | (364,188,674) |
| | | (127,165,526) | | (422,933,507) |
Net decrease in net assets resulting from capital share transactions
| | (86,611,597) | | (241,368,008) |
Total decrease in net assets
| | (96,448,379) | | (285,193,708) |
| Net assets | | | | |
Beginning of period
| | 437,850,244 | | 723,043,952 |
End of period
| | $ 341,401,865 | | $ 437,850,244 |
The accompanying notes are an integral part of these financial statements.
Allspring Short Duration Government Bond Fund | 15
Financial highlights
(For a share outstanding throughout each period)
| | | Year ended August 31 |
| Class A | Six months ended
February 28, 2023
(unaudited) | 2022 | 2021 | 2020 | 2019 | 2018 |
Net asset value, beginning of period
| $9.04 | $9.71 | $9.85 | $9.73 | $9.60 | $9.85 |
Net investment income
| 0.09 1 | 0.04 1 | 0.00 1,2 | 0.15 | 0.21 | 0.14 |
Net realized and unrealized gains (losses) on investments
| (0.19) | (0.59) | (0.04) | 0.18 | 0.16 | (0.20) |
Total from investment operations
| (0.10) | (0.55) | (0.04) | 0.33 | 0.37 | (0.06) |
| Distributions to shareholders from | | | | | | |
Net investment income
| (0.11) | (0.12) | (0.10) | (0.21) | (0.24) | (0.19) |
Net asset value, end of period
| $8.83 | $9.04 | $9.71 | $9.85 | $9.73 | $9.60 |
Total return3
| (1.08)% | (5.65)% | (0.45)% | 3.41% | 3.92% | (0.56)% |
| Ratios to average net assets (annualized) | | | | | | |
Gross expenses
| 0.82% | 0.79% | 0.79% | 0.81% | 0.81% | 0.80% |
Net expenses
| 0.78% | 0.78% | 0.78% | 0.78% | 0.78% | 0.78% |
Net investment income
| 2.15% | 0.38% | 0.01% | 1.32% | 2.22% | 1.36% |
| Supplemental data | | | | | | |
Portfolio turnover rate
| 229% | 367% | 294% | 395% | 635% | 331% |
Net assets, end of period (000s omitted)
| $26,987 | $30,817 | $67,959 | $60,425 | $29,618 | $30,538 |
| 1 | Calculated based upon average shares outstanding |
| 2 | Amount is less than $0.005. |
| 3 | Total return calculations do not include any sales charges. Returns for periods of less than one year are not annualized. |
The accompanying notes are an integral part of these financial statements.
16 | Allspring Short Duration Government Bond Fund
Financial highlights
(For a share outstanding throughout each period)
| | | Year ended August 31 |
| Class C | Six months ended
February 28, 2023
(unaudited) | 2022 | 2021 | 2020 | 2019 | 2018 |
Net asset value, beginning of period
| $9.06 | $9.72 | $9.87 | $9.75 | $9.62 | $9.87 |
Net investment income (loss)
| 0.06 | (0.03) 1 | (0.07) 1 | 0.07 | 0.14 1 | 0.06 1 |
Net realized and unrealized gains (losses) on investments
| (0.19) | (0.58) | (0.06) | 0.18 | 0.16 | (0.19) |
Total from investment operations
| (0.13) | (0.61) | (0.13) | 0.25 | 0.30 | (0.13) |
| Distributions to shareholders from | | | | | | |
Net investment income
| (0.08) | (0.05) | (0.02) | (0.13) | (0.17) | (0.12) |
Net asset value, end of period
| $8.85 | $9.06 | $9.72 | $9.87 | $9.75 | $9.62 |
Total return2
| (1.44)% | (6.26)% | (1.29)% | 2.64% | 3.14% | (1.30)% |
| Ratios to average net assets (annualized) | | | | | | |
Gross expenses
| 1.56% | 1.53% | 1.54% | 1.56% | 1.56% | 1.55% |
Net expenses
| 1.53% | 1.52% | 1.53% | 1.53% | 1.53% | 1.53% |
Net investment income (loss)
| 1.40% | (0.34)% | (0.69)% | 0.61% | 1.49% | 0.62% |
| Supplemental data | | | | | | |
Portfolio turnover rate
| 229% | 367% | 294% | 395% | 635% | 331% |
Net assets, end of period (000s omitted)
| $2,198 | $2,602 | $4,963 | $8,868 | $10,032 | $15,093 |
| 1 | Calculated based upon average shares outstanding |
| 2 | Total return calculations do not include any sales charges. Returns for periods of less than one year are not annualized. |
The accompanying notes are an integral part of these financial statements.
Allspring Short Duration Government Bond Fund | 17
Financial highlights
(For a share outstanding throughout each period)
| | | Year ended August 31 |
| Class R6 | Six months ended
February 28, 2023
(unaudited) | 2022 | 2021 | 2020 | 2019 | 2018 |
Net asset value, beginning of period
| $9.07 | $9.74 | $9.89 | $9.77 | $9.64 | $9.89 |
Net investment income
| 0.11 | 0.09 | 0.04 | 0.19 | 0.25 1 | 0.16 1 |
Net realized and unrealized gains (losses) on investments
| (0.19) | (0.60) | (0.05) | 0.18 | 0.16 | (0.17) |
Total from investment operations
| (0.08) | (0.51) | (0.01) | 0.37 | 0.41 | (0.01) |
| Distributions to shareholders from | | | | | | |
Net investment income
| (0.13) | (0.16) | (0.14) | (0.25) | (0.28) | (0.24) |
Net asset value, end of period
| $8.86 | $9.07 | $9.74 | $9.89 | $9.77 | $9.64 |
Total return2
| (0.87)% | (5.24)% | (0.13)% | 3.83% | 4.34% | (0.14)% |
| Ratios to average net assets (annualized) | | | | | | |
Gross expenses
| 0.44% | 0.42% | 0.41% | 0.43% | 0.43% | 0.42% |
Net expenses
| 0.37% | 0.37% | 0.37% | 0.37% | 0.37% | 0.37% |
Net investment income
| 2.57% | 0.93% | 0.42% | 1.77% | 2.62% | 1.64% |
| Supplemental data | | | | | | |
Portfolio turnover rate
| 229% | 367% | 294% | 395% | 635% | 331% |
Net assets, end of period (000s omitted)
| $38,687 | $43,142 | $47,471 | $48,371 | $41,987 | $35,472 |
| 1 | Calculated based upon average shares outstanding |
| 2 | Returns for periods of less than one year are not annualized. |
The accompanying notes are an integral part of these financial statements.
18 | Allspring Short Duration Government Bond Fund
Financial highlights
(For a share outstanding throughout each period)
| | | Year ended August 31 |
| Administrator Class | Six months ended
February 28, 2023
(unaudited) | 2022 | 2021 | 2020 | 2019 | 2018 |
Net asset value, beginning of period
| $9.06 | $9.73 | $9.87 | $9.75 | $9.62 | $9.87 |
Net investment income
| 0.10 1 | 0.06 | 0.02 1 | 0.16 1 | 0.23 1 | 0.15 1 |
Net realized and unrealized gains (losses) on investments
| (0.19) | (0.59) | (0.05) | 0.19 | 0.16 | (0.19) |
Total from investment operations
| (0.09) | (0.53) | (0.03) | 0.35 | 0.39 | (0.04) |
| Distributions to shareholders from | | | | | | |
Net investment income
| (0.12) | (0.14) | (0.11) | (0.23) | (0.26) | (0.21) |
Net asset value, end of period
| $8.85 | $9.06 | $9.73 | $9.87 | $9.75 | $9.62 |
Total return2
| (0.99)% | (5.47)% | (0.26)% | 3.60% | 4.10% | (0.37)% |
| Ratios to average net assets (annualized) | | | | | | |
Gross expenses
| 0.75% | 0.73% | 0.73% | 0.75% | 0.75% | 0.74% |
Net expenses
| 0.60% | 0.60% | 0.60% | 0.60% | 0.60% | 0.60% |
Net investment income
| 2.30% | 0.68% | 0.20% | 1.54% | 2.41% | 1.56% |
| Supplemental data | | | | | | |
Portfolio turnover rate
| 229% | 367% | 294% | 395% | 635% | 331% |
Net assets, end of period (000s omitted)
| $20,332 | $27,229 | $32,375 | $36,262 | $38,816 | $71,997 |
| 1 | Calculated based upon average shares outstanding |
| 2 | Returns for periods of less than one year are not annualized. |
The accompanying notes are an integral part of these financial statements.
Allspring Short Duration Government Bond Fund | 19
Financial highlights
(For a share outstanding throughout each period)
| | | Year ended August 31 |
| Institutional Class | Six months ended
February 28, 2023
(unaudited) | 2022 | 2021 | 2020 | 2019 | 2018 |
Net asset value, beginning of period
| $9.06 | $9.72 | $9.87 | $9.75 | $9.62 | $9.87 |
Net investment income
| 0.11 1 | 0.07 1 | 0.04 1 | 0.17 | 0.25 | 0.17 |
Net realized and unrealized gains (losses) on investments
| (0.19) | (0.57) | (0.06) | 0.19 | 0.16 | (0.19) |
Total from investment operations
| (0.08) | (0.50) | (0.02) | 0.36 | 0.41 | (0.02) |
| Distributions to shareholders from | | | | | | |
Net investment income
| (0.13) | (0.16) | (0.13) | (0.24) | (0.28) | (0.23) |
Net asset value, end of period
| $8.85 | $9.06 | $9.72 | $9.87 | $9.75 | $9.62 |
Total return2
| (0.90)% | (5.20)% | (0.19)% | 3.78% | 4.29% | (0.20)% |
| Ratios to average net assets (annualized) | | | | | | |
Gross expenses
| 0.48% | 0.46% | 0.46% | 0.48% | 0.48% | 0.47% |
Net expenses
| 0.42% | 0.42% | 0.42% | 0.42% | 0.42% | 0.42% |
Net investment income
| 2.48% | 0.79% | 0.37% | 1.72% | 2.57% | 1.75% |
| Supplemental data | | | | | | |
Portfolio turnover rate
| 229% | 367% | 294% | 395% | 635% | 331% |
Net assets, end of period (000s omitted)
| $253,198 | $334,060 | $570,276 | $451,715 | $445,211 | $493,372 |
| 1 | Calculated based upon average shares outstanding |
| 2 | Returns for periods of less than one year are not annualized. |
The accompanying notes are an integral part of these financial statements.
20 | Allspring Short Duration Government Bond Fund
Notes to financial statements (unaudited)
1. ORGANIZATION
Allspring Funds Trust (the "Trust"), a Delaware statutory trust organized on March 10, 1999, is an open-end management investment company registered under the Investment Company Act of 1940, as amended (the "1940 Act"). As an investment company, the Trust follows the accounting and reporting guidance in Financial Accounting Standards Board ("FASB") Accounting Standards Codification Topic 946, Financial Services – Investment Companies. These financial statements report on the Allspring Short Duration Government Bond Fund (the "Fund") which is a diversified series of the Trust.
2. SIGNIFICANT ACCOUNTING POLICIES
The following significant accounting policies, which are consistently followed in the preparation of the financial statements of the Fund, are in conformity with U.S. generally accepted accounting principles which require management to make estimates and assumptions that affect the reported amounts of assets and liabilities, disclosure of contingent assets and liabilities at the date of the financial statements, and the reported amounts of income and expenses during the reporting period. Actual results could differ from those estimates.
Securities valuation
All investments are valued each business day as of the close of regular trading on the New York Stock Exchange (generally 4 p.m. Eastern Time), although the Fund may deviate from this calculation time under unusual or unexpected circumstances.
Debt securities are valued at the evaluated bid price provided by an independent pricing service (e.g. taking into account various factors, including yields, maturities, or credit ratings) or, if a reliable price is not available, the quoted bid price from an independent broker-dealer.
Futures contracts that are listed on a foreign or domestic exchange or market are valued at the official closing price or, if none, the last sales price.
Investments in registered open-end investment companies (other than those listed on a foreign or domestic exchange or market) are valued at net asset value.
Investments which are not valued using the methods discussed above are valued at their fair value, as determined in good faith by Allspring Funds Management, LLC ("Allspring Funds Management"), which was named the valuation designee by the Board of Trustees. As the valuation designee, Allspring Funds Management is responsible for day-to-day valuation activities for the Allspring Funds. In connection with these responsibilities, Allspring Funds Management has established a Valuation Committee and has delegated to it the authority to take any actions regarding the valuation of portfolio securities that the Valuation Committee deems necessary or appropriate, including determining the fair value of portfolio securities. On a quarterly basis, the Board of Trustees receives reports of valuation actions taken by the Valuation Committee. On at least an annual basis, the Board of Trustees receives an assessment of the adequacy and effectiveness of Allspring Funds Management's process for determining the fair value of the portfolio of investments.
When-issued transactions
The Fund may purchase securities on a forward commitment or when-issued basis. The Fund records a when-issued transaction on the trade date and will segregate assets in an amount at least equal in value to the Fund's commitment to purchase when-issued securities. Securities purchased on a when-issued basis are marked-to-market daily and the Fund begins earning interest on the settlement date. Losses may arise due to changes in the market value of the underlying securities or if the counterparty does not perform under the contract.
Futures contracts
Futures contracts are agreements between the Fund and a counterparty to buy or sell a specific amount of a commodity, financial instrument or currency at a specified price on a specified date. The Fund may buy and sell futures contracts in order to gain exposure to, or protect against, changes in interest rates and is subject to interest rate risk. The primary risks associated with the use of futures contracts are the imperfect correlation between changes in market values of securities held by the Fund and the prices of futures contracts, and the possibility of an illiquid market. Futures contracts are generally entered into on a regulated futures exchange and cleared through a clearinghouse associated with the exchange. With futures contracts, there is minimal counterparty risk to the Fund since futures contracts are exchange-traded and the exchange’s clearinghouse, as the counterparty to all exchange-traded futures, guarantees the futures contracts against default.
Upon entering into a futures contract, the Fund is required to deposit either cash or securities (initial margin) with the broker in an amount equal to a certain percentage of the contract value. Subsequent payments (variation margin) are paid to or from the broker each day equal to the daily changes in the contract value. Such payments are recorded as unrealized gains or losses and, if any, shown as variation margin receivable (payable) in the Statement of Assets and Liabilities. Should the Fund fail to make
Allspring Short Duration Government Bond Fund | 21
Notes to financial statements (unaudited)
requested variation margin payments, the broker can gain access to the initial margin to satisfy the Fund’s payment obligations. When the contracts are closed, a realized gain or loss is recorded in the Statement of Operations.
Security transactions and income recognition
Securities transactions are recorded on a trade date basis. Realized gains or losses are recorded on the basis of identified cost.
Interest income is accrued daily and bond discounts are accreted and premiums are amortized daily. To the extent debt obligations are placed on non-accrual status, any related interest income may be reduced by writing off interest receivables when the collection of all or a portion of interest has been determined to be doubtful based on consistently applied procedures and the fair value has decreased. If the issuer subsequently resumes interest payments or when the collectability of interest is reasonably assured, the debt obligation is removed from non-accrual status. Paydown gains and losses are included in interest income.
Distributions to shareholders
Distributions to shareholders from net investment income are declared daily and paid monthly. Distributions from net realized gains, if any, are recorded on the ex-dividend date and paid at least annually. Such distributions are determined in accordance with income tax regulations and may differ from U.S. generally accepted accounting principles. Dividend sources are estimated at the time of declaration. The tax character of distributions is determined as of the Fund's fiscal year end. Therefore, a portion of the Fund's distributions made prior to the Fund’s fiscal year end may be categorized as a tax return of capital at year end.
Federal and other taxes
The Fund intends to continue to qualify as a regulated investment company by distributing substantially all of its investment company taxable income and any net realized capital gains (after reduction for capital loss carryforwards) sufficient to relieve it from all, or substantially all, federal income taxes. Accordingly, no provision for federal income taxes was required.
The Fund’s income and federal excise tax returns and all financial records supporting those returns for the prior three fiscal years are subject to examination by the federal and Delaware revenue authorities. Management has analyzed the Fund's tax positions taken on federal, state, and foreign tax returns, as applicable, for all open tax years and does not believe that there are any uncertain tax positions that require recognition of a tax liability.
As of February 28, 2023, the aggregate cost of all investments for federal income tax purposes was $349,898,604 and the unrealized gains (losses) consisted of:
| Gross unrealized gains | $ 438,531 |
| Gross unrealized losses | (12,551,311) |
| Net unrealized losses | $(12,112,780) |
As of August 31, 2022, the Fund had capital loss carryforwards which consisted of $57,452,134 in short-term capital losses and $49,101,723 in long-term capital losses.
Class allocations
The separate classes of shares offered by the Fund differ principally in applicable sales charges, distribution, shareholder servicing, and administration fees. Class specific expenses are charged directly to that share class. Investment income, common fund-level expenses, and realized and unrealized gains (losses) on investments are allocated daily to each class of shares based on the relative proportion of net assets of each class.
22 | Allspring Short Duration Government Bond Fund
Notes to financial statements (unaudited)
3. FAIR VALUATION MEASUREMENTS
Fair value measurements of investments are determined within a framework that has established a fair value hierarchy based upon the various data inputs utilized in determining the value of the Fund’s investments. The three-level hierarchy gives the highest priority to unadjusted quoted prices in active markets for identical assets or liabilities (Level 1) and the lowest priority to unobservable inputs (Level 3). The Fund’s investments are classified within the fair value hierarchy based on the lowest level of input that is significant to the fair value measurement. The inputs are summarized into three broad levels as follows:
| ■ | Level 1 – quoted prices in active markets for identical securities |
| ■ | Level 2 – other significant observable inputs (including quoted prices for similar securities, interest rates, prepayment speeds, credit risk, etc.) |
| ■ | Level 3 – significant unobservable inputs (including the Fund’s own assumptions in determining the fair value of investments) |
The inputs or methodologies used for valuing investments in securities are not necessarily an indication of the risk associated with investing in those securities.
The following is a summary of the inputs used in valuing the Fund’s assets and liabilities as of February 28, 2023:
| | Quoted prices
(Level 1) | Other significant
observable inputs
(Level 2) | Significant
unobservable inputs
(Level 3) | Total |
| Assets | | | | |
| Investments in: | | | | |
| Agency securities | $ 0 | $ 239,566,481 | $0 | $ 239,566,481 |
| Asset-backed securities | 0 | 26,554,843 | 0 | 26,554,843 |
| Non-agency mortgage-backed securities | 0 | 27,794,133 | 0 | 27,794,133 |
| U.S. Treasury securities | 37,817,725 | 0 | 0 | 37,817,725 |
| Short-term investments | | | | |
| Investment companies | 6,406,330 | 0 | 0 | 6,406,330 |
| | 44,224,055 | 293,915,457 | 0 | 338,139,512 |
| Futures contracts | 81,456 | 0 | 0 | 81,456 |
| Total assets | $44,305,511 | $293,915,457 | $0 | $338,220,968 |
| Liabilities | | | | |
| Futures contracts | $ 435,144 | $ 0 | $0 | $ 435,144 |
| Total liabilities | $ 435,144 | $ 0 | $0 | $ 435,144 |
Futures contracts are reported at their cumulative unrealized gains (losses) at measurement date as reported in the table following the Portfolio of Investments. For futures contracts, the current day’s variation margin is reported on the Statement of Assets and Liabilities. All other assets and liabilities are reported at their market value at measurement date.
Additional sector, industry or geographic detail, if any, is included in the Portfolio of Investments.
For the six months ended February 28, 2023, the Fund did not have any transfers into/out of Level 3.
4. TRANSACTIONS WITH AFFILIATES
Management fee
Allspring Funds Management, a wholly owned subsidiary of Allspring Global Investments Holdings, LLC, a holding company indirectly owned by certain private funds of GTCR LLC and Reverence Capital Partners, L.P., is the manager of the Fund and provides advisory and fund-level administrative services under an investment management agreement. Under the investment management agreement, Allspring Funds Management is responsible for, among other services, implementing the investment objectives and strategies of the Fund, supervising the subadviser and providing fund-level administrative services in connection with the Fund’s operations. As compensation for its services under the investment management agreement, Allspring Funds Management is entitled to receive a management fee at the following annual rate based on the Fund’s average daily net assets:
Allspring Short Duration Government Bond Fund | 23
Notes to financial statements (unaudited)
| Average daily net assets | Management fee |
| First $1 billion | 0.350% |
| Next $4 billion | 0.325 |
| Next $3 billion | 0.290 |
| Next $2 billion | 0.265 |
| Over $10 billion | 0.255 |
For the six months ended February 28, 2023, the management fee was equivalent to an annual rate of 0.35% of the Fund’s average daily net assets.
Allspring Funds Management has retained the services of a subadviser to provide daily portfolio management to the Fund. The fee for subadvisory services is borne by Allspring Funds Management. Allspring Global Investments, LLC, an affiliate of Allspring Funds Management and a wholly owned subsidiary of Allspring Global Investments Holdings, LLC, is the subadviser to the Fund and is entitled to receive a fee from Allspring Funds Management at an annual rate starting at 0.15% and declining to 0.05% as the average daily net assets of the Fund increase.
Administration fees
Under a class-level administration agreement, Allspring Funds Management provides class-level administrative services to the Fund, which includes paying fees and expenses for services provided by the transfer agent, sub-transfer agents, omnibus account servicers and record-keepers. As compensation for its services under the class-level administration agreement, Allspring Funds Management receives an annual fee which is calculated based on the average daily net assets of each class as follows:
| | Class-level
administration fee |
| Class A | 0.16% |
| Class C | 0.16 |
| Class R6 | 0.03 |
| Administrator Class | 0.10 |
| Institutional Class | 0.08 |
Waivers and/or expense reimbursements
Allspring Funds Management has contractually committed to waive and/or reimburse management and administration fees to the extent necessary to maintain certain net operating expense ratios for the Fund. When each class of the Fund has exceeded its expense cap, Allspring Funds Management will waive fees and/or reimburse expenses from fund-level expenses on a proportionate basis and then from class specific expenses. When only certain classes exceed their expense caps, waivers and/or reimbursements are applied against class specific expenses before fund-level expenses. Allspring Funds Management has contractually committed through December 31, 2023 to waive fees and/or reimburse expenses to the extent necessary to cap expenses. Prior to or after the commitment expiration date, the caps may be increased or the commitment to maintain the caps may be terminated only with the approval of the Board of Trustees. As of February 28, 2023, the contractual expense caps are as follows:
| | Expense ratio caps |
| Class A | 0.78% |
| Class C | 1.53 |
| Class R6 | 0.37 |
| Administrator Class | 0.60 |
| Institutional Class | 0.42 |
24 | Allspring Short Duration Government Bond Fund
Notes to financial statements (unaudited)
Distribution fee
The Trust has adopted a distribution plan for Class C shares pursuant to Rule 12b-1 under the 1940 Act. A distribution fee is charged to Class C shares and paid to Allspring Funds Distributor, LLC ("Allspring Funds Distributor"), the principal underwriter, an affiliate of Allspring Funds Management, at an annual rate up to 0.75% of the average daily net assets of Class C shares.
In addition, Allspring Funds Distributor is entitled to receive the front-end sales charge from the purchase of Class A shares and a contingent deferred sales charge on the redemption of certain Class A shares. Allspring Funds Distributor is also entitled to receive the contingent deferred sales charges from redemptions of Class C shares. For the six months ended February 28, 2023, Allspring Funds Distributor received $22 from the sale of Class A shares. No contingent deferred sales charges were incurred by Class A and Class C shares for the six months ended February 28, 2023.
Shareholder servicing fees
The Trust has entered into contracts with one or more shareholder servicing agents, whereby Class A, Class C and Administrator Class are charged a fee at an annual rate up to 0.25% of the average daily net assets of each respective class. A portion of these total shareholder servicing fees were paid to affiliates of the Fund.
Interfund transactions
The Fund may purchase or sell portfolio investment securities to certain affiliates pursuant to Rule 17a-7 under the 1940 Act and under procedures adopted by the Board of Trustees. The procedures have been designed to ensure that these interfund transactions, which do not incur broker commissions, are effected at current market prices.
5. INVESTMENT PORTFOLIO TRANSACTIONS
Purchases and sales of investments, excluding short-term securities, for the six months ended February 28, 2023 were as follows:
| Purchases at cost | | Sales proceeds |
U.S.
government | Non-U.S.
government | | U.S.
government | Non-U.S.
government |
| $724,327,990 | $176,180,468 | | $710,525,222 | $261,811,067 |
6. DERIVATIVE TRANSACTIONS
During the six months ended February 28, 2023, the Fund entered into futures contracts to speculate on interest rates and to help manage the duration of the portfolio. The Fund had an average notional amount of $160,563,364 in long futures contracts and $46,817,502 in short futures contracts during the six months ended February 28, 2023.
The fair value, realized gains or losses and change in unrealized gains or losses, if any, on derivative instruments are reflected in the corresponding financial statement captions.
7. BANK BORROWINGS
The Trust (excluding the money market funds), Allspring Master Trust and Allspring Variable Trust are parties to a $350,000,000 revolving credit agreement whereby the Fund is permitted to use bank borrowings for temporary or emergency purposes, such as to fund shareholder redemption requests. Interest under the credit agreement is charged to the Fund based on a borrowing rate equal to the higher of the Federal Funds rate or the overnight bank funding rate in effect on that day plus a spread. In addition, an annual commitment fee equal based on the unused balance is allocated to each participating fund.
For the six months ended February 28, 2023, there were no borrowings by the Fund under the agreement.
8. MARKET RISKS
On March 11, 2020, the World Health Organization announced that it had made the assessment that coronavirus disease 2019 (“COVID-19”) is a pandemic. The impacts of COVID-19 are affecting the entire global economy, individual companies and investment products, the funds, and the market in general. There is significant uncertainty around the extent and duration of business disruptions related to COVID-19 and the impacts may last for an extended period of time. COVID-19 has led to significant uncertainty and volatility in the financial markets.
Allspring Short Duration Government Bond Fund | 25
Notes to financial statements (unaudited)
9. INDEMNIFICATION
Under the Fund's organizational documents, the officers and Trustees have been granted certain indemnification rights against certain liabilities that may arise out of performance of their duties to the Fund. The Fund has entered into a separate agreement with each Trustee that converts indemnification rights currently existing under the Fund’s organizational documents into contractual rights that cannot be changed in the future without the consent of the Trustee. Additionally, in the normal course of business, the Fund may enter into contracts with service providers that contain a variety of indemnification clauses. The Fund’s maximum exposure under these arrangements is dependent on future claims that may be made against the Fund and, therefore, cannot be estimated.
26 | Allspring Short Duration Government Bond Fund
Other information (unaudited)
PROXY VOTING INFORMATION
A description of the policies and procedures used to determine how to vote proxies relating to portfolio securities is available without charge, upon request, by calling 1-800-222-8222, visiting our website at allspringglobal.com, or visiting the SEC website at sec.gov. Information regarding how the proxies related to portfolio securities were voted during the most recent 12-month period ended June 30 is available on the website at allspringglobal.com or by visiting the SEC website at sec.gov.
QUARTERLY PORTFOLIO HOLDINGS INFORMATION
The Fund files its complete schedule of portfolio holdings with the SEC for the first and third quarters of each fiscal year as an exhibit to its reports on Form N-PORT. Shareholders may view the filed Form N-PORT by visiting the SEC website at sec.gov.
Allspring Short Duration Government Bond Fund | 27
Other information (unaudited)
BOARD OF TRUSTEES AND OFFICERS
Each of the Trustees and Officers listed in the table below acts in identical capacities for each fund in the Allspring family of funds, which consists of 127 mutual funds comprising the Allspring Funds Trust, Allspring Variable Trust, Allspring Master Trust and four closed-end funds (collectively the “Fund Complex”). This table should be read in conjunction with the Prospectus and the Statement of Additional Information1. The mailing address of each Trustee and Officer is 1415 Vantage Park Drive, 3rd Floor, Charlotte, NC 28203. Each Trustee and Officer serves an indefinite term, however, each Trustee serves such term until reaching the mandatory retirement age established by the Trustees.
Independent Trustees
Name and
year of birth | Position held and
length of service* | Principal occupations during past five years or longer | Current other
public company or
investment
company
directorships |
William R. Ebsworth
(Born 1957) | Trustee,
since 2015 | Retired. From 1984 to 2013, equities analyst, portfolio manager, research director and chief investment officer at Fidelity Management and Research Company in Boston, Tokyo, and Hong Kong, and retired in 2013 as Chief Investment Officer of Fidelity Strategic Advisers, Inc. where he led a team of investment professionals managing client assets. Prior thereto, Board member of Hong Kong Securities Clearing Co., Hong Kong Options Clearing Corp., the Thailand International Fund, Ltd., Fidelity Investments Life Insurance Company, and Empire Fidelity Investments Life Insurance Company. Audit Committee Chair and Investment Committee Chair of the Vincent Memorial Hospital Foundation (non-profit organization). Mr. Ebsworth is a CFA® charterholder. | N/A |
Jane A. Freeman
(Born 1953) | Trustee,
since 2015;
Chair Liaison,
since 2018 | Retired. From 2012 to 2014 and 1999 to 2008, Chief Financial Officer of Scientific Learning Corporation. From 2008 to 2012, Ms. Freeman provided consulting services related to strategic business projects. Prior to 1999, Portfolio Manager at Rockefeller & Co. and Scudder, Stevens & Clark. Board member of the Harding Loevner Funds from 1996 to 2014, serving as both Lead Independent Director and chair of the Audit Committee. Board member of the Russell Exchange Traded Funds Trust from 2011 to 2012 and the chair of the Audit Committee. Ms. Freeman is also an inactive Chartered Financial Analyst. | N/A |
Isaiah Harris, Jr.
(Born 1952) | Trustee,
since 2009; Audit
Committee
Chair,
since 2019 | Retired. Member of the Advisory Board of CEF of East Central Florida. Chairman of the Board of CIGNA Corporation from 2009 to 2021, and Director from 2005 to 2008. From 2003 to 2011, Director of Deluxe Corporation. Prior thereto, President and CEO of BellSouth Advertising and Publishing Corp. from 2005 to 2007, President and CEO of BellSouth Enterprises from 2004 to 2005 and President of BellSouth Consumer Services from 2000 to 2003. Emeritus member of the Iowa State University Foundation Board of Governors. Emeritus Member of the Advisory Board of Iowa State University School of Business. Advisory Board Member, Palm Harbor Academy (private school). Advisory Board Member, Fellowship of Christian Athletes. Mr. Harris is a certified public accountant (inactive status). | N/A |
David F. Larcker
(Born 1950) | Trustee,
since 2009 | Distinguished Visiting Fellow at the Hoover Institution since 2022. James Irvin Miller Professor of Accounting at the Graduate School of Business (Emeritus), Stanford University, Director of the Corporate Governance Research Initiative and Senior Faculty of The Rock Center for Corporate Governance since 2006. From 2005 to 2008, Professor of Accounting at the Graduate School of Business, Stanford University. Prior thereto, Ernst & Young Professor of Accounting at The Wharton School, University of Pennsylvania from 1985 to 2005. | N/A |
28 | Allspring Short Duration Government Bond Fund
Other information (unaudited)
Name and
year of birth | Position held and
length of service* | Principal occupations during past five years or longer | Current other
public company or
investment
company
directorships |
Olivia S. Mitchell
(Born 1953) | Trustee,
since 2006;
Nominating and
Governance
Committee Chair,
since 2018 | International Foundation of Employee Benefit Plans Professor since 1993, Wharton School of the University of Pennsylvania. Director of Wharton’s Pension Research Council and Boettner Center on Pensions & Retirement Research, and Research Associate at the National Bureau of Economic Research. Previously taught at Cornell University from 1978 to 1993. | N/A |
Timothy J. Penny
(Born 1951) | Trustee,
since 1996;
Chair,
since 2018 | President and Chief Executive Officer of Southern Minnesota Initiative Foundation, a non-profit organization, since 2007. Vice Chair of the Economic Club of Minnesota, since 2007. Co-Chair of the Committee for a Responsible Federal Budget, since 1995. Member of the Board of Trustees of NorthStar Education Finance, Inc., a non-profit organization, from 2007-2022. Senior Fellow of the University of Minnesota Humphrey Institute from 1995 to 2017. | N/A |
James G. Polisson
(Born 1959) | Trustee,
since 2018 | Retired. Chief Marketing Officer, Source (ETF) UK Services, Ltd, from 2015 to 2017. From 2012 to 2015, Principal of The Polisson Group, LLC, a management consulting, corporate advisory and principal investing company. Chief Executive Officer and Managing Director at Russell Investments, Global Exchange Traded Funds from 2010 to 2012. Managing Director of Barclays Global Investors from 1998 to 2010 and Global Chief Marketing Officer for iShares and Barclays Global Investors from 2000 to 2010. Trustee of the San Francisco Mechanics’ Institute, a non-profit organization, from 2013 to 2015. Board member of the Russell Exchange Traded Fund Trust from 2011 to 2012. Director of Barclays Global Investors Holdings Deutschland GmbH from 2006 to 2009. Mr. Polisson is an attorney and has a retired status with the Massachusetts and District of Columbia Bar Associations. | N/A |
Pamela Wheelock
(Born 1959) | Trustee,
since January
2020; previously
Trustee from
January 2018 to
July 2019 | Retired. Executive and Senior Financial leadership positions in the public, private and nonprofit sectors. Interim President and CEO, McKnight Foundation, 2020. Interim Commissioner, Minnesota Department of Human Services, 2019. Chief Operating Officer, Twin Cities Habitat for Humanity, 2017-2019. Vice President for University Services, University of Minnesota, 2012-2016. Interim President and CEO, Blue Cross and Blue Shield of Minnesota, 2011-2012. Executive Vice-President and Chief Financial Officer, Minnesota Wild, 2002-2008. Commissioner, Minnesota Department of Finance, 1999-2002. Chair of the Board of Directors of Destination Medical Center Corporation. Board member of the Minnesota Wild Foundation. | N/A |
* Length of service dates reflect the Trustee’s commencement of service with the Trust’s predecessor entities, where applicable.
Allspring Short Duration Government Bond Fund | 29
Other information (unaudited)
Officers2
Name and
year of birth | Position held and
length of service | Principal occupations during past five years or longer |
Andrew Owen
(Born 1960) | President,
since 2017 | President and Chief Executive Officer of Allspring Funds Management, LLC since 2017 and Head of Global Fund Governance of Allspring Global Investments since 2022. Prior thereto, co-president of Galliard Capital Management, LLC, an affiliate of Allspring Funds Management, LLC, from 2019 to 2022 and Head of Affiliated Managers, Allspring Global Investments, from 2014 to 2019 and Executive Vice President responsible for marketing, investments and product development for Allspring Funds Management, LLC, from 2009 to 2014. |
Jeremy DePalma
(Born 1974) | Treasurer,
since 2012
(for certain funds in
the Fund Complex);
since 2021 (for
the remaining funds in the
Fund Complex) | Senior Vice President of Allspring Funds Management, LLC since 2009. Senior Vice President of Evergreen Investment Management Company, LLC from 2008 to 2010 and head of the Fund Reporting and Control Team within Fund Administration from 2005 to 2010. |
Christopher Baker
(Born 1976) | Chief Compliance Officer, since 2022 | Global Chief Compliance Officer for Allspring Global Investments since 2022. Prior thereto, Chief Compliance Officer for State Street Global Advisors from 2018 to 2021. Senior Compliance Officer for the State Street divisions of Alternative Investment Solutions, Sector Solutions, and Global Marketing from 2015 to 2018. From 2010 to 2015 Vice President, Global Head of Investment and Marketing Compliance for State Street Global Advisors. |
Matthew Prasse
(Born 1983) | Chief Legal Officer, since 2022; Secretary, since 2021 | Senior Counsel of the Allspring Legal Department since 2021. Senior Counsel of the Wells Fargo Legal Department from 2018 to 2021. Previously, Counsel for Barings LLC from 2015 to 2018. Prior to joining Barings, Associate at Morgan, Lewis & Bockius LLP from 2008 to 2015. |
1 The Statement of Additional Information includes additional information about the Trustees and is available, without charge, upon request, by calling 1-800-222-8222 or by visiting the website at allspringglobal.com.
2 For those Officers with tenures at Allspring Global Investments and/or Allspring Funds Management, LLC that began prior to 2021, such tenures include years of service during which these businesses/entities were known as Wells Fargo Asset Management and Wells Fargo Funds Management, LLC, respectively.
30 | Allspring Short Duration Government Bond Fund
For more information
More information about Allspring Funds is available free upon request. To obtain literature, please write, visit the Fund's website, or call:
Allspring Funds
P.O. Box 219967
Kansas City, MO 64121-9967
Website: allspringglobal.com
Individual investors: 1-800-222-8222
Retail investment professionals: 1-888-877-9275
Institutional investment professionals: 1-800-260-5969
This report and the financial statements contained herein are submitted for the general information of the shareholders of the Fund. If this report is used for promotional purposes, distribution of the report must be accompanied or preceded by a current prospectus. Before investing, please consider the investment objectives, risks, charges, and expenses of the investment. For a current prospectus and, if available, a summary prospectus, containing this information, call
1-800-222-8222 or visit the Fund's website at allspringglobal.com. Read the prospectus carefully before you invest or send money.
Allspring Global InvestmentsTM is the trade name for the asset management firms of Allspring Global Investments Holdings, LLC, a holding company indirectly owned by certain private funds of GTCR LLC and Reverence Capital Partners, L.P. These firms include but are not limited to Allspring Global Investments, LLC, and Allspring Funds Management, LLC. Certain products managed by Allspring entities are distributed by Allspring Funds Distributor, LLC (a broker-dealer and Member FINRA/SIPC).
This material is for general informational and educational purposes only and is NOT intended to provide investment advice or a recommendation of any kind - including a recommendation for any specific investment, strategy, or plan.
© 2023 Allspring Global Investments Holdings, LLC. All rights reserved.
ALL-03102023-yxy4seki 04-23
SAR0932 02-23
Semi-Annual Report
February 28, 2023
Allspring
Short-Term Bond Plus Fund
The views expressed and any forward-looking statements are as of February 28, 2023, unless otherwise noted, and are those of the Fund's portfolio managers and/or Allspring Global Investments. Discussions of individual securities or the markets generally are not intended as individual recommendations. Future events or results may vary significantly from those expressed in any forward-looking statements. The views expressed are subject to change at any time in response to changing circumstances in the market. Allspring Global Investments disclaims any obligation to publicly update or revise any views expressed or forward-looking statements.
Allspring Short-Term Bond Plus Fund | 1
Letter to shareholders (unaudited)
Andrew Owen
President
Allspring Funds
Dear Shareholder:
We are pleased to offer you this semi-annual report for the Allspring Short-Term Bond Plus Fund for the six-month period that ended February 28, 2023. Globally, stocks and bonds experienced heightened volatility through the challenging period. Earlier tailwinds provided by global stimulus programs, vaccination rollouts, and recovering consumer and corporate sentiment were wiped away by the highest rate of inflation in four decades as well as the impact of ongoing aggressive central bank rate hikes and the prospect of more rate hikes. Compounding these concerns were the global reverberations of the Russia-Ukraine war and the impact of China’s strict COVID-19 lockdowns.
For the six-month period, stocks and bonds had mixed results, with non-U.S. equities––both developed market and emerging market––outperforming U.S. stocks overall. Bonds––both U.S. and non-U.S.––began to recover from sustained aggressive interest rate increases. After suffering deep and broad losses over the past year, recent fixed income performance benefited from a base of higher yields that can now generate higher income. For the period, U.S. stocks, based on the S&P 500 Index,1 returned 1.26%. International stocks, as measured by the MSCI ACWI ex USA Index (Net),2 returned 7.30%, while the MSCI EM Index (Net) (USD)3 lost 2.29%. Among bond indexes, the Bloomberg U.S. Aggregate Bond Index4 returned -2.13%, the Bloomberg Global Aggregate ex-USD Index (unhedged)5 returned -0.11%, the Bloomberg Municipal Bond Index6 gained 0.66%, and the ICE BofA U.S. High Yield Index7 returned 2.41%.
The Russia-Ukraine war, high inflation, and central bank rate hikes rocked markets
A challenging calendar year for investors continued in September as all asset classes suffered major losses. Central banks kept up their battle against rapidly rising prices with more rate hikes. The strength of the U.S. dollar weighed on results for investors holding non-U.S.-dollar assets. U.S. mortgage rates jumped to near 7% on 30-year fixed-rate mortgages; the decreased housing affordability began to cool demand somewhat. The U.K. experienced a sharp sell-off of government bonds and the British pound in September as investors panicked in response to a new government budget that was seen as financially unsound. The Bank of England (BoE) then stepped in and bought long-dated government bonds.
“ A challenging calendar year for investors continued in September as all asset classes suffered major losses.”
| 1 | The S&P 500 Index consists of 500 stocks chosen for market size, liquidity, and industry group representation. It is a market-value-weighted index with each stock's weight in the index proportionate to its market value. You cannot invest directly in an index. |
| 2 | The Morgan Stanley Capital International (MSCI) All Country World Index (ACWI) ex USA Index (Net) is a free-float-adjusted market-capitalization-weighted index that is designed to measure the equity market performance of developed and emerging markets, excluding the U.S. Source: MSCI. MSCI makes no express or implied warranties or representations and shall have no liability whatsoever with respect to any MSCI data contained herein. The MSCI data may not be further redistributed or used as a basis for other indexes or any securities or financial products. This report is not approved, reviewed, or produced by MSCI. You cannot invest directly in an index. |
| 3 | The MSCI Emerging Markets (EM) Index (Net) (USD) is a free-float-adjusted market-capitalization-weighted index that is designed to measure equity market performance of emerging markets. You cannot invest directly in an index. |
| 4 | The Bloomberg U.S. Aggregate Bond Index is a broad-based benchmark that measures the investment-grade, U.S.-dollar-denominated, fixed-rate taxable bond market, including Treasuries, government-related and corporate securities, mortgage-backed securities (agency fixed-rate and hybrid adjustable-rate mortgage pass-throughs), asset-backed securities, and commercial mortgage-backed securities. You cannot invest directly in an index. |
| 5 | The Bloomberg Global Aggregate ex-USD Index (unhedged) is an unmanaged index that provides a broad-based measure of the global investment-grade fixed-income markets excluding the U.S.-dollar-denominated debt market. You cannot invest directly in an index. |
| 6 | The Bloomberg Municipal Bond Index is an unmanaged index composed of long-term tax-exempt bonds with a minimum credit rating of Baa. You cannot invest directly in an index. |
| 7 | The ICE BofA U.S. High Yield Index is a market-capitalization-weighted index of domestic and Yankee high-yield bonds. The index tracks the performance of high-yield securities traded in the U.S. bond market. You cannot invest directly in an index. Copyright 2023. ICE Data Indices, LLC. All rights reserved. |
2 | Allspring Short-Term Bond Plus Fund
Letter to shareholders (unaudited)
Equities had a reprieve in October. Value stocks and small caps fared best. Globally, developed markets outpaced emerging market equities, which were hurt by weakness among Chinese stocks. Central banks continued to try to curtail high inflation with aggressive interest rate hikes. Geopolitical risks persisted, including the ongoing Russia-Ukraine war and economic, financial market, and political turmoil in the U.K. Concerns over Europe’s energy crisis eased thanks to unseasonably warm weather and plentiful gas on hand. The U.S. labor market continued its resilience against rising prices as unemployment remained near a record low.
Stocks and bonds rallied in November. Economic news was encouraging, driven by U.S. labor market strength. Although central banks kept raising rates, hopes rose for an easing in the pace of rate hikes and a possible end to central bank monetary tightening in 2023. Although inflation remained at record highs in the eurozone, we began to see signs of a possible decline in inflationary pressures as U.S. inflation moderated, with a 7.1% annual price rise in November and a monthly price increase of just 0.1%. China’s economic data remained weak, reflecting its zero-COVID-19 policy.
Financial markets cooled in December, with U.S. equities posting negative overall results in response to a weakening U.S. dollar. Fixed income securities ended one of their worst years ever with flat overall monthly returns as markets weighed the hopes for an end to the monetary tightening cycle with the reality that central banks had not completed their jobs yet. U.S. Consumer Price Index (CPI)1 data showed a strong consistent trend downward, which brought down the 12-month CPI to 6.5% in December from 9.1% in June. Other countries and regions reported still-high but declining inflation rates as the year winded down.
The year 2023 began with a rally across global equities and fixed income securities. Investor optimism rose in response to data indicating declining inflation rates and the reopening of China’s economy with the abrupt end to its zero-COVID-19 policy. The U.S. reported surprisingly strong job gains––employers added more than 500,000 jobs––and unemployment fell to 3.4%, the lowest level since 1969. Meanwhile, wage growth, seen as a potential contributor to ongoing high inflation, continued to moderate. All eyes remained fixed on the Federal Reserve (Fed) and on how many more rate hikes remain in this tightening cycle. The 0.25% federal funds rate hike announced in January was the Fed’s smallest rate increase since March 2022.
Financial markets declined in February as investors responded unfavorably to resilient economic data. The takeaway: Central banks will likely continue their monetary tightening cycle for longer than markets had priced in. In this environment—where strong economic data is seen as bad news—the resilient U.S. labor market was seen as a negative while the inflation rate has not been falling quickly enough for the Fed, which raised interest rates by 0.25% in early February. Meanwhile, the BoE and the European Central Bank both raised rates by 0.50%. At this stage in the economic cycle, the overriding question remained: “What will central banks do?” In February, the answer appeared to be: “Move rates higher for longer.”
| 1 | The Consumer Price Index (CPI) is a measure of the average change over time in the prices paid by urban consumers for a market basket of consumer goods and services. You cannot invest directly in an index. |
Allspring Short-Term Bond Plus Fund | 3
Letter to shareholders (unaudited)
Don’t let short-term uncertainty derail long-term investment goals.
Periods of investment uncertainty can present challenges, but experience has taught us that maintaining long-term investment goals can be an effective way to plan for the future. To help you create a sound strategy based on your personal goals and risk tolerance, Allspring Funds offers more than 100 mutual funds spanning a wide range of asset classes and investment styles. Although diversification cannot guarantee an investment profit or prevent losses, we believe it can be an effective way to manage investment risk and potentially smooth out overall portfolio performance. We encourage investors to know their investments and to understand that appropriate levels of risk-taking may unlock opportunities.
Thank you for choosing to invest with Allspring Funds. We appreciate your confidence in us and remain committed to helping you meet your financial needs.
Sincerely,
Andrew Owen
President
Allspring Funds
For further information about your fund, contact your investment professional, visit our website at allspringglobal.com, or call us directly at 1-800-222-8222.
4 | Allspring Short-Term Bond Plus Fund
This page is intentionally left blank.
Performance highlights (unaudited)
| Investment objective | The Fund seeks current income consistent with capital preservation. |
| Manager | Allspring Funds Management, LLC |
| Subadviser | Allspring Global Investments, LLC |
| Portfolio managers | Christopher Y. Kauffman, CFA®‡, Janet S. Rilling, CFA®‡, CPA, Michael J. Schueller, CFA®‡, Michal Stanczyk, Noah M. Wise, CFA®‡ |
| Average annual total returns (%) as of February 28, 2023 |
| | | Including sales charge | | Excluding sales charge | | Expense ratios1 (%) |
| | Inception date | 1 year | 5 year | 10 year | | 1 year | 5 year | 10 year | | Gross | Net 2 |
| Class A (SSTVX) | 8-31-1999 | -4.91 | 1.00 | 0.98 | | -2.97 | 1.41 | 1.19 | | 0.82 | 0.73 |
| Class C (WFSHX) | 3-31-2008 | -4.85 | 0.62 | 0.57 | | -3.85 | 0.62 | 0.57 | | 1.57 | 1.48 |
| Class R6 (SSTYX)3 | 7-31-2018 | – | – | – | | -2.78 | 1.67 | 1.46 | | 0.44 | 0.41 |
| Institutional Class (SSHIX) | 8-31-1999 | – | – | – | | -2.82 | 1.65 | 1.45 | | 0.49 | 0.46 |
| Bloomberg U.S. 1-3 Year Government/Credit Bond Index4 | – | – | – | – | | -2.51 | 1.00 | 0.87 | | – | – |
Figures quoted represent past performance, which is no guarantee of future results, and do not reflect taxes that a shareholder may pay on an investment in a fund. Investment return and principal value of an investment will fluctuate so that an investor’s shares, when redeemed, may be worth more or less than their original cost. Performance shown without sales charges would be lower if sales charges were reflected. Current performance may be lower or higher than the performance data quoted, which assumes the reinvestment of dividends and capital gains. Current month-end performance is available on the Fund’s website, allspringglobal.com.
Index returns do not include transaction costs associated with buying and selling securities, any mutual fund fees or expenses, or any taxes. It is not possible to invest directly in an index.
For Class A shares, the maximum front-end sales charge is 2.00%. For Class C shares, the maximum contingent deferred sales charge is 1.00%. Performance including a contingent deferred sales charge assumes the sales charge for the corresponding time period. Class R6 and Institutional Class shares are sold without a front-end sales charge or contingent deferred sales charge.
| 1 | Reflects the expense ratios as stated in the most recent prospectuses, which include the impact of 0.01% in acquired fund fees and expenses. The expense ratios shown are subject to change and may differ from the annualized expense ratios shown in the financial highlights of this report, which do not include acquired fund fees and expenses. |
| 2 | The manager has contractually committed through December 31, 2023, to waive fees and/or reimburse expenses to the extent necessary to cap total annual fund operating expenses after fee waivers at 0.72% for Class A, 1.47% for Class C, 0.40% for Class R6, and 0.45% for Institutional Class. Brokerage commissions, stamp duty fees, interest, taxes, acquired fund fees and expenses (if any), and extraordinary expenses are excluded from the expense caps. Prior to or after the commitment expiration date, the caps may be increased or the commitment to maintain the caps may be terminated only with the approval of the Board of Trustees. Without these caps, the Fund’s returns would have been lower. The expense ratio paid by an investor is the net expense ratio (the total annual fund operating expenses after fee waivers) as stated in the prospectuses. |
| 3 | Historical performance shown for the Class R6 shares prior to their inception reflects the performance of the Institutional Class shares, and includes the higher expenses applicable to the Institutional Class shares. If these expenses had not been included, returns for the Class R6 shares would be higher. |
| 4 | The Bloomberg U.S. 1-3 Year Government/Credit Bond Index is the one- to three-year component of the Bloomberg U.S. Government/Credit Bond Index that includes securities in the Government and Credit Indexes. The Government Index includes Treasuries (that is, public obligations of the U.S. Treasury that have remaining maturities of more than one year) and agencies (that is, publicly issued debt of U.S. government agencies, quasi-federal corporations, and corporate or foreign debt guaranteed by the U.S. government). The Credit Index includes publicly issued U.S. corporate and foreign debentures and secured notes that meet specified maturity, liquidity, and quality requirements. You cannot invest directly in an index. |
| ‡ | CFA® and Chartered Financial Analyst® are trademarks owned by CFA Institute. |
6 | Allspring Short-Term Bond Plus Fund
Performance highlights (unaudited)
Bond values fluctuate in response to the financial condition of individual issuers, general market and economic conditions, and changes in interest rates. Changes in market conditions and government policies may lead to periods of heightened volatility in the bond market and reduced liquidity for certain bonds held by the Fund. In general, when interest rates rise, bond values fall and investors may lose principal value. Interest rate changes and their impact on the Fund and its share price can be sudden and unpredictable. Loans are subject to risks similar to those associated with other below-investment-grade bond investments, such as credit risk (for example, risk of issuer default), below investment-grade bond risk (for example, risk of greater volatility in value), and risk that the loan may become illiquid or difficult to price. The use of derivatives may reduce returns and/or increase volatility. Certain investment strategies tend to increase the total risk of an investment (relative to the broader market). Foreign investments are especially volatile and can rise or fall dramatically due to differences in the political and economic conditions of the host country. These risks are generally intensified in emerging markets. This fund is exposed to high-yield securities risk and mortgage- and asset-backed securities risk. Consult the Fund’s prospectus for additional information on these and other risks.
Allspring Short-Term Bond Plus Fund | 7
Performance highlights (unaudited)
| Ten largest holdings (%) as of February 28, 20231 |
| U.S. Treasury Note, 3.25%, 8-31-2024 | 11.43 |
| U.S. Treasury Note, 0.38%, 12-31-2025 | 9.01 |
| U.S. Treasury Note, 1.13%, 1-15-2025 | 5.66 |
| France, 0.75%, 2-25-2028 | 1.45 |
| Germany, 1.30%, 10-15-2027 | 1.23 |
| CPS Auto Receivables Trust 2021-A Class D, 1.16%, 12-15-2026 | 0.67 |
| AVIS Budget Rental Car Funding Series 2019-2A Class A , 3.35%, 9-22-2025 | 0.64 |
| U.S. Treasury Note, 0.25%, 5-15-2024 | 0.62 |
| Anchorage Capital CLO Limited Series 2015-6A Class B2RR , 6.64%, 7-15-2030 | 0.60 |
| CIFC Funding Limited Series 2018-1A Class A , 5.79%, 4-18-2031 | 0.60 |
| 1 | Figures represent the percentage of the Fund's net assets. Holdings are subject to change and may have changed since the date specified. |
| Portfolio composition as of February 28, 20231 |
| 1 | Figures represent the percentage of the Fund's long-term investments. Allocations are subject to change and may have changed since the date specified. |
8 | Allspring Short-Term Bond Plus Fund
Fund expenses (unaudited)
As a shareholder of the Fund, you incur two types of costs: (1) transaction costs, including sales charges (loads) on purchase payments and contingent deferred sales charges (if any) on redemptions and (2) ongoing costs, including management fees, distribution (12b-1) and/or shareholder servicing fees, and other Fund expenses. This example is intended to help you understand your ongoing costs (in dollars) of investing in the Fund and to compare these costs with the ongoing costs of investing in other mutual funds.
The example is based on an investment of $1,000 invested at the beginning of the six-month period and held for the entire period from September 1, 2022 to February 28, 2023.
Actual expenses
The “Actual” line of the table below provides information about actual account values and actual expenses. You may use the information in this line, together with the amount you invested, to estimate the expenses that you paid over the period. Simply divide your account value by $1,000 (for example, an $8,600 account value divided by $1,000 = 8.6), then multiply the result by the number in the “Actual” line under the heading entitled “Expenses paid during period” for your applicable class of shares to estimate the expenses you paid on your account during this period.
Hypothetical example for comparison purposes
The “Hypothetical” line of the table below provides information about hypothetical account values and hypothetical expenses based on the Fund’s actual expense ratio and an assumed rate of return of 5% per year before expenses, which is not the Fund’s actual return. The hypothetical account values and expenses may not be used to estimate the actual ending account balance or expenses you paid for the period. You may use this information to compare the ongoing costs of investing in the Fund and other funds. To do so, compare this 5% hypothetical example with the 5% hypothetical examples that appear in the shareholder reports of the other funds.
Please note that the expenses shown in the table are meant to highlight your ongoing costs only and do not reflect any transactional costs, such as sales charges (loads) and contingent deferred sales charges. Therefore, the “Hypothetical” line of the table is useful in comparing ongoing costs only, and will not help you determine the relative total costs of owning different funds. In addition, if these transactional costs were included, your costs would have been higher.
| | Beginning
account value
9-1-2022 | Ending
account value
2-28-2023 | Expenses
paid during
the period1 | Annualized net
expense ratio |
| Class A | | | | |
| Actual | $1,000.00 | $1,000.51 | $3.57 | 0.72% |
| Hypothetical (5% return before expenses) | $1,000.00 | $1,021.22 | $3.61 | 0.72% |
| Class C | | | | |
| Actual | $1,000.00 | $ 995.44 | $7.27 | 1.47% |
| Hypothetical (5% return before expenses) | $1,000.00 | $1,017.50 | $7.35 | 1.47% |
| Class R6 | | | | |
| Actual | $1,000.00 | $1,002.06 | $1.99 | 0.40% |
| Hypothetical (5% return before expenses) | $1,000.00 | $1,022.81 | $2.01 | 0.40% |
| Institutional Class | | | | |
| Actual | $1,000.00 | $1,001.82 | $2.23 | 0.45% |
| Hypothetical (5% return before expenses) | $1,000.00 | $1,022.56 | $2.26 | 0.45% |
1 Expenses paid is equal to the annualized net expense ratio of each class multiplied by the average account value over the period, multiplied by 181 divided by 365 (to reflect the one-half-year period).
Allspring Short-Term Bond Plus Fund | 9
Portfolio of investments—February 28, 2023 (unaudited)
| | | Interest
rate | Maturity
date | Principal | Value |
| Agency securities: 0.58% | | | | | | |
| FHLMC (1 Year Treasury Constant Maturity +2.25%) ± | | 3.25% | 4-1-2032 | $ | 15,278 | $ 15,109 |
| FHLMC (3 Year Treasury Constant Maturity +2.28%) ± | | 3.34 | 5-1-2026 | | 2,732 | 2,692 |
| FHLMC | | 3.50 | 10-15-2025 | | 90,872 | 88,934 |
| FHLMC | | 4.00 | 5-1-2025 | | 114,932 | 112,348 |
| FHLMC (12 Month LIBOR +1.91%) ± | | 4.16 | 9-1-2031 | | 1,657 | 1,633 |
| FHLMC (1 Year Treasury Constant Maturity +2.25%) ± | | 4.17 | 4-1-2038 | | 75,880 | 76,432 |
| FHLMC Series 2597 Class AE | | 5.50 | 4-15-2033 | | 9,108 | 9,078 |
| FHLMC Series 2642 Class AR | | 4.50 | 7-15-2023 | | 5,795 | 5,772 |
| FHLMC Series QO04 Class AFL (12 Month Treasury Average +0.74%) ± | | 3.88 | 5-25-2044 | | 290,348 | 290,456 |
| FHLMC Series T-42 Class A6 | | 9.50 | 2-25-2042 | | 201,803 | 222,454 |
| FHLMC Series T-57 Class 2A1 ±± | | 3.69 | 7-25-2043 | | 49,089 | 45,509 |
| FHLMC Series T-59 Class 2A1 ±± | | 3.57 | 10-25-2043 | | 513,807 | 385,427 |
| FNMA (1 Year Treasury Constant Maturity +1.27%) ± | | 3.40 | 8-1-2034 | | 56,750 | 55,441 |
| FNMA (12 Month LIBOR +1.77%) ± | | 3.92 | 7-1-2044 | | 250,275 | 255,487 |
| FNMA | | 4.00 | 6-25-2026 | | 97,601 | 95,686 |
| FNMA (1 Year Treasury Constant Maturity +2.27%) ± | | 4.00 | 8-1-2036 | | 388,783 | 395,961 |
| FNMA | | 4.00 | 8-25-2037 | | 26,561 | 26,328 |
| FNMA (1 Year Treasury Constant Maturity +2.19%) ± | | 4.32 | 11-1-2031 | | 22,034 | 21,656 |
| FNMA | | 5.50 | 3-1-2023 | | 4 | 4 |
| FNMA | | 6.00 | 3-1-2033 | | 124,391 | 125,953 |
| FNMA | | 6.50 | 8-1-2031 | | 115,551 | 121,304 |
| FNMA | | 9.00 | 11-1-2024 | | 7,350 | 7,338 |
| FNMA Grantor Trust Series 2002-T12 Class A4 | | 9.50 | 5-25-2042 | | 331,422 | 345,656 |
| FNMA Series 2002-T1 Class A4 | | 9.50 | 11-25-2031 | | 15,978 | 17,514 |
| FNMA Series 2003-W11 Class A1 ±± | | 4.72 | 6-25-2033 | | 3,719 | 3,762 |
| FNMA Series 2003-W6 Class 6A ±± | | 3.74 | 8-25-2042 | | 261,901 | 250,698 |
| FNMA Series 2003-W6 Class PT4 ±± | | 8.38 | 10-25-2042 | | 32,656 | 34,974 |
| FNMA Series 2005-84 Class MB | | 5.75 | 10-25-2035 | | 98,142 | 98,447 |
| FNMA Series 2006-W1 Class 2AF2 (1 Month LIBOR +0.19%) ± | | 4.81 | 2-25-2046 | | 558,709 | 552,193 |
| FNMA Series 2010-37 Class A1 | | 5.41 | 5-25-2035 | | 156,983 | 155,381 |
| GNMA | | 4.50 | 4-20-2035 | | 23,059 | 22,625 |
| GNMA | | 8.00 | 12-15-2023 | | 289 | 289 |
| Total Agency securities (Cost $3,982,619) | | | | | | 3,842,541 |
| Asset-backed securities: 9.05% | | | | | | |
| Aqua Finance Trust Series 2021-A Class A 144A | | 1.54 | 7-17-2046 | | 1,842,581 | 1,635,104 |
| AVIS Budget Rental Car Funding Series 2019-2A Class A 144A | | 3.35 | 9-22-2025 | | 4,330,000 | 4,192,423 |
| AVIS Budget Rental Car Funding Series 2020-1A Class B 144A | | 2.68 | 8-20-2026 | | 2,220,000 | 2,041,705 |
| Bankers Healthcare Group Series 2021-A Class A 144A | | 1.42 | 11-17-2033 | | 1,494,675 | 1,389,523 |
| Brean Asset-Backed Securities Trust 2021-RM2 Class A 144A±± | | 1.75 | 10-25-2061 | | 1,716,703 | 1,495,583 |
| Cajun Global LLC Series 2021-1 Class A2 144A | | 3.93 | 11-20-2051 | | 981,250 | 831,013 |
| Chase Auto Credit Linked Note Series 2020-1 Class B 144A | | 0.99 | 1-25-2028 | | 628,735 | 620,882 |
| CommonBond Student Loan Trust Series 2018-B-GS Class A1 144A | | 3.56 | 9-25-2045 | | 771,928 | 719,526 |
| CPS Auto Receivables Trust 2021-A Class D 144A | | 1.16 | 12-15-2026 | | 4,645,000 | 4,420,677 |
| CPS Auto Receivables Trust Series 2020-A Class D 144A | | 2.90 | 12-15-2025 | | 2,095,551 | 2,082,648 |
The accompanying notes are an integral part of these financial statements.
10 | Allspring Short-Term Bond Plus Fund
Portfolio of investments—February 28, 2023 (unaudited)
| | | Interest
rate | Maturity
date | Principal | Value |
| Asset-backed securities (continued) | | | | | | |
| Dominos Pizza Master Issuer LLC Series 2015-1A Class A2 144A | | 4.47% | 10-25-2045 | $ | 3,093,750 | $ 2,977,428 |
| Drive Auto Receivables Trust Series 2019 Class 3D | | 3.18 | 10-15-2026 | | 2,272,426 | 2,252,402 |
| DT Auto Owner Trust Series 2020-2A Class C 144A | | 3.28 | 3-16-2026 | | 1,295,175 | 1,282,615 |
| Educational Services of America Incorporated Series 2015-2 Class A (1 Month LIBOR +1.00%) 144A± | | 5.62 | 12-25-2056 | | 218,081 | 218,110 |
| Exeter Automobile Receivables Trust Series 2021-3A Class C | | 0.96 | 10-15-2026 | | 1,800,000 | 1,720,079 |
| Freedom Financial Trust Series 2021-1CP Class B 144A | | 1.41 | 3-20-2028 | | 97,756 | 97,416 |
| Gracie Point International Funding Series 2021-1A Class B (1 Month LIBOR +1.40%) 144A± | | 5.97 | 11-1-2023 | | 1,500,000 | 1,498,455 |
| Hertz Vehicle Financing LLC Series 2021-1A Class A 144A | | 1.21 | 12-26-2025 | | 2,325,000 | 2,157,110 |
| Lendmark Funding Trust Series 2019-2A Class A 144A | | 2.78 | 4-20-2028 | | 1,865,377 | 1,828,119 |
| Mission Lane Master Trust Series 2021 Class A 144A | | 1.59 | 9-15-2026 | | 3,000,000 | 2,935,478 |
| Navient Student Loan Trust Series 2021-EA Class A 144A | | 0.97 | 12-16-2069 | | 2,285,484 | 1,923,421 |
| Octane Receivables Trust Series 2020-1A Class A 144A | | 1.71 | 2-20-2025 | | 284,614 | 282,118 |
| Octane Receivables Trust Series 2021-1A Class A 144A | | 0.93 | 3-22-2027 | | 558,074 | 538,568 |
| Ondeck Asset Securitization Trust Series 2021-1A Class A 144A | | 1.59 | 5-17-2027 | | 2,850,922 | 2,651,918 |
| Pagaya AI Debt Selection Trust Series 2021-1 Class A 144A | | 1.18 | 11-15-2027 | | 447,623 | 443,353 |
| Pagaya AI Debt Selection Trust Series 2021-HG1 Class A 144A | | 1.22 | 1-16-2029 | | 1,869,839 | 1,782,640 |
| PFS Financing Corporation Series 2021-A Class A 144A | | 0.71 | 4-15-2026 | | 2,010,000 | 1,902,782 |
| Prodigy Finance Series 2021 Class A (1 Month LIBOR +1.25%) 144A± | | 5.87 | 7-25-2051 | | 1,769,537 | 1,729,393 |
| Santander Drive Auto Receivables Trust Series 2021-1 Class C | | 0.75 | 2-17-2026 | | 2,590,997 | 2,557,914 |
| Service Experts Issuer Series 2021-1A Class A 144A | | 2.67 | 2-2-2032 | | 2,147,815 | 1,949,527 |
| SLM Student Loan Trust Series 2003-10A Class A4 (3 Month LIBOR +0.67%) 144A± | | 5.44 | 12-17-2068 | | 2,101,757 | 2,059,202 |
| SLM Student Loan Trust Series 2012-3 Class A (1 Month LIBOR +0.65%) ± | | 5.27 | 12-27-2038 | | 1,228,572 | 1,208,909 |
| SLM Student Loan Trust Series 2013-1 Class A3 (1 Month LIBOR +0.55%) ± | | 5.17 | 5-26-2055 | | 622,581 | 602,048 |
| SpringCastle America Funding LLC 144A | | 1.97 | 9-25-2037 | | 886,887 | 799,785 |
| Taco Bell Funding LLC Series 2021 Class A2 144A | | 1.95 | 8-25-2051 | | 2,725,500 | 2,352,098 |
| Towd Point Asset Trust Series 2018-SL1 Class A (1 Month LIBOR +0.60%) 144A± | | 5.11 | 1-25-2046 | | 412,800 | 410,424 |
| Total Asset-backed securities (Cost $62,737,387) | | | | | | 59,590,396 |
| Corporate bonds and notes: 20.84% | | | | | | |
| Communication services: 1.29% | | | | | | |
| Diversified telecommunication services: 0.45% | | | | | | |
| T-Mobile USA Incorporated | | 4.95 | 3-15-2028 | | 3,000,000 | 2,944,919 |
| Media: 0.35% | | | | | | |
| Magallanes Incorporated 144A | | 3.64 | 3-15-2025 | | 1,000,000 | 953,841 |
| Magallanes Incorporated 144A | | 3.76 | 3-15-2027 | | 1,500,000 | 1,376,002 |
| | | | | | | 2,329,843 |
The accompanying notes are an integral part of these financial statements.
Allspring Short-Term Bond Plus Fund | 11
Portfolio of investments—February 28, 2023 (unaudited)
| | | Interest
rate | Maturity
date | Principal | Value |
| Wireless telecommunication services: 0.49% | | | | | | |
| Sprint Corporation | | 7.63% | 3-1-2026 | $ | 2,000,000 | $ 2,077,002 |
| Sprint Spectrum Company 144A | | 4.74 | 3-20-2025 | | 1,125,000 | 1,112,027 |
| | | | | | | 3,189,029 |
| Consumer discretionary: 1.15% | | | | | | |
| Hotels, restaurants & leisure: 0.54% | | | | | | |
| Genting New York LLC 144A | | 3.30 | 2-15-2026 | | 1,080,000 | 944,632 |
| Las Vegas Sands Corporation | | 3.20 | 8-8-2024 | | 2,155,000 | 2,073,912 |
| Royal Caribbean Cruises Limited | | 4.25 | 6-15-2023 | | 500,000 | 536,414 |
| | | | | | | 3,554,958 |
| Internet & direct marketing retail: 0.28% | | | | | | |
| QVC Incorporated | | 4.85 | 4-1-2024 | | 2,000,000 | 1,877,520 |
| Textiles, apparel & luxury goods: 0.33% | | | | | | |
| Michael Kors USA Incorporated 144A | | 4.25 | 11-1-2024 | | 2,241,000 | 2,148,559 |
| Consumer staples: 0.45% | | | | | | |
| Tobacco: 0.45% | | | | | | |
| Philip Morris International Incorporated | | 4.88 | 2-15-2028 | | 3,000,000 | 2,936,764 |
| Energy: 1.25% | | | | | | |
| Oil, gas & consumable fuels: 1.25% | | | | | | |
| Energy Transfer LP | | 5.55 | 2-15-2028 | | 2,415,000 | 2,405,702 |
| Plains All American Pipeline LP | | 3.85 | 10-15-2023 | | 2,205,000 | 2,181,624 |
| Plains All American Pipeline LP | | 4.65 | 10-15-2025 | | 758,000 | 739,524 |
| Vistra Operations Company LLC 144A | | 3.55 | 7-15-2024 | | 3,000,000 | 2,880,398 |
| | | | | | | 8,207,248 |
| Financials: 10.39% | | | | | | |
| Banks: 4.23% | | | | | | |
| Bank of America Corporation (U.S. SOFR +0.74%) ± | | 0.81 | 10-24-2024 | | 3,000,000 | 2,906,216 |
| Bank of America Corporation (U.S. SOFR +0.65%) ± | | 1.53 | 12-6-2025 | | 2,500,000 | 2,323,948 |
| Bank of America Corporation (U.S. SOFR +0.91%) ± | | 1.66 | 3-11-2027 | | 2,370,000 | 2,110,524 |
| Bank of America Corporation (3 Month LIBOR +0.94%) ± | | 3.86 | 7-23-2024 | | 1,000,000 | 992,609 |
| Citigroup Incorporated (U.S. SOFR +1.28%) ± | | 3.07 | 2-24-2028 | | 2,500,000 | 2,268,855 |
| Citigroup Incorporated (U.S. SOFR +1.55%) ± | | 5.61 | 9-29-2026 | | 3,000,000 | 3,000,021 |
| JPMorgan Chase & Company (U.S. SOFR +0.49%) ± | | 0.77 | 8-9-2025 | | 2,000,000 | 1,857,170 |
| JPMorgan Chase & Company (U.S. SOFR +0.54%) ± | | 0.82 | 6-1-2025 | | 1,220,000 | 1,144,509 |
| JPMorgan Chase & Company (U.S. SOFR 3 Month +0.70%) ± | | 1.04 | 2-4-2027 | | 835,000 | 733,236 |
| JPMorgan Chase & Company (U.S. SOFR +1.46%) ± | | 1.51 | 6-1-2024 | | 3,000,000 | 2,970,659 |
| Santander Holdings USA Incorporated (U.S. SOFR +1.38%) ± | | 4.26 | 6-9-2025 | | 800,000 | 777,322 |
| Santander Holdings USA Incorporated (U.S. SOFR +2.33%) ± | | 5.81 | 9-9-2026 | | 1,250,000 | 1,249,775 |
| Truist Financial Corporation (U.S. SOFR +1.44%) ± | | 4.87 | 1-26-2029 | | 2,800,000 | 2,747,953 |
| Wells Fargo & Company (U.S. SOFR +1.51%) ± | | 3.53 | 3-24-2028 | | 3,000,000 | 2,777,994 |
| | | | | | | 27,860,791 |
The accompanying notes are an integral part of these financial statements.
12 | Allspring Short-Term Bond Plus Fund
Portfolio of investments—February 28, 2023 (unaudited)
| | | Interest
rate | Maturity
date | Principal | Value |
| Capital markets: 1.61% | | | | | | |
| Goldman Sachs Group Incorporated (U.S. SOFR +0.91%) ± | | 1.95% | 10-21-2027 | $ | 3,000,000 | $ 2,627,837 |
| Morgan Stanley (U.S. SOFR +0.62%) ± | | 0.73 | 4-5-2024 | | 2,000,000 | 1,989,812 |
| Morgan Stanley (U.S. SOFR +0.56%) ± | | 1.16 | 10-21-2025 | | 2,000,000 | 1,852,503 |
| Morgan Stanley (U.S. SOFR +1.99%) ± | | 2.19 | 4-28-2026 | | 2,305,000 | 2,148,402 |
| Morgan Stanley (U.S. SOFR +1.73%) ± | | 5.12 | 2-1-2029 | | 2,035,000 | 1,998,389 |
| | | | | | | 10,616,943 |
| Consumer finance: 0.93% | | | | | | |
| Daimler Finance North America LLC 144A | | 5.15 | 1-16-2026 | | 2,000,000 | 1,977,679 |
| Ford Motor Credit Company LLC | | 2.30 | 2-10-2025 | | 2,000,000 | 1,837,935 |
| General Motors Financial Company | | 6.00 | 1-9-2028 | | 1,300,000 | 1,308,421 |
| Hyundai Capital America Company 144A | | 1.30 | 1-8-2026 | | 1,115,000 | 987,448 |
| | | | | | | 6,111,483 |
| Diversified financial services: 1.68% | | | | | | |
| Bankers Healthcare Group BHG Series 2021 Class A-B 144A | | 2.79 | 11-17-2033 | | 1,335,000 | 1,152,270 |
| Blackstone Holdings Finance Company 144A | | 5.90 | 11-3-2027 | | 2,145,000 | 2,178,194 |
| DAE Funding LLC 144A | | 1.55 | 8-1-2024 | | 1,000,000 | 936,372 |
| Equitable Financial Life 144A | | 5.50 | 12-2-2025 | | 3,080,000 | 3,063,489 |
| GTP Acquisition Partners Corporation 144A | | 3.48 | 6-15-2050 | | 1,900,000 | 1,799,030 |
| WEA Finance LLC 144A | | 3.75 | 9-17-2024 | | 2,000,000 | 1,907,012 |
| | | | | | | 11,036,367 |
| Insurance: 1.82% | | | | | | |
| Brighthouse Financial Incorporated 144A | | 1.00 | 4-12-2024 | | 2,000,000 | 1,888,100 |
| GA Global Funding Trust 144A | | 1.00 | 4-8-2024 | | 3,022,000 | 2,851,153 |
| Guardian Life Global Funding 144A | | 5.55 | 10-28-2027 | | 2,815,000 | 2,874,315 |
| Met Life Incorporated 144A | | 4.40 | 6-30-2027 | | 2,000,000 | 1,941,608 |
| Protective Life Global 144A | | 1.62 | 4-15-2026 | | 2,370,000 | 2,114,770 |
| Security Benefit Company 144A | | 1.25 | 5-17-2024 | | 335,000 | 315,271 |
| | | | | | | 11,985,217 |
| Mortgage REITs: 0.12% | | | | | | |
| Starwood Property Trust Incorporated 144A | | 3.75 | 12-31-2024 | | 65,000 | 61,174 |
| Starwood Property Trust Incorporated 144A | | 5.50 | 11-1-2023 | | 750,000 | 742,773 |
| | | | | | | 803,947 |
| Health care: 0.45% | | | | | | |
| Biotechnology: 0.45% | | | | | | |
| Amgen Incorporated %% | | 5.15 | 3-2-2028 | | 3,000,000 | 2,988,130 |
| Industrials: 1.07% | | | | | | |
| Aerospace & defense: 0.31% | | | | | | |
| The Boeing Company | | 4.51 | 5-1-2023 | | 2,000,000 | 1,997,140 |
| Airlines: 0.76% | | | | | | |
| American Airline Series 2014-1 | | 3.70 | 4-15-2027 | | 1,635,066 | 1,529,408 |
| Delta Air Lines Incorporated 144A | | 4.50 | 10-20-2025 | | 2,250,403 | 2,185,888 |
The accompanying notes are an integral part of these financial statements.
Allspring Short-Term Bond Plus Fund | 13
Portfolio of investments—February 28, 2023 (unaudited)
| | | Interest
rate | Maturity
date | Principal | Value |
| Airlines (continued) | | | | | | |
| Delta Air Lines Pass-Through Certificates Series 2015-B | | 4.25% | 1-30-2025 | $ | 747,240 | $ 740,832 |
| United Airlines Pass-Through Trust Certificates Series 2020-1 Class B | | 4.88 | 7-15-2027 | | 586,035 | 568,044 |
| | | | | | | 5,024,172 |
| Information technology: 1.41% | | | | | | |
| IT services: 0.73% | | | | | | |
| Fiserv Incorporated %% | | 5.45 | 3-2-2028 | | 3,000,000 | 2,995,836 |
| Kyndryl Holdings Incorporated | | 2.05 | 10-15-2026 | | 2,150,000 | 1,847,989 |
| | | | | | | 4,843,825 |
| Semiconductors & semiconductor equipment: 0.68% | | | | | | |
| Intel Corporation | | 4.88 | 2-10-2028 | | 3,000,000 | 2,956,170 |
| Microchip Technology Incorporated | | 2.67 | 9-1-2023 | | 1,525,000 | 1,501,708 |
| | | | | | | 4,457,878 |
| Materials: 0.19% | | | | | | |
| Chemicals: 0.19% | | | | | | |
| Celanese US Holding LLC | | 6.17 | 7-15-2027 | | 1,245,000 | 1,235,773 |
| Real estate: 1.38% | | | | | | |
| Equity REITs: 1.38% | | | | | | |
| Brandywine Operating Partnership Series 3 | | 7.55 | 3-15-2028 | | 1,140,000 | 1,117,688 |
| EPR Properties Company | | 4.50 | 4-1-2025 | | 1,500,000 | 1,437,550 |
| Omega Healthcare Investors Incorporated | | 4.75 | 1-15-2028 | | 145,000 | 136,001 |
| Piedmont Operating Partnership LP | | 4.45 | 3-15-2024 | | 1,765,000 | 1,739,465 |
| Sabra Health Care LP / Sabra Capital Corporation | | 5.13 | 8-15-2026 | | 1,490,000 | 1,409,356 |
| Service Properties Trust | | 4.50 | 6-15-2023 | | 1,500,000 | 1,498,828 |
| VICI Properties LP | | 4.38 | 5-15-2025 | | 1,835,000 | 1,765,986 |
| | | | | | | 9,104,874 |
| Utilities: 1.81% | | | | | | |
| Electric utilities: 1.15% | | | | | | |
| NextEra Energy Capital Company %% | | 6.05 | 3-1-2025 | | 1,750,000 | 1,760,657 |
| Southern California Edison Company | | 0.70 | 4-3-2023 | | 2,200,000 | 2,191,263 |
| Southern California Edison Company %% | | 5.30 | 3-1-2028 | | 3,605,000 | 3,588,021 |
| | | | | | | 7,539,941 |
| Multi-utilities: 0.66% | | | | | | |
| CenterPoint Energy Incorporated | | 0.70 | 3-2-2023 | | 765,000 | 765,000 |
| CenterPoint Energy Incorporated (U.S. SOFR +0.65%) ± | | 5.21 | 5-13-2024 | | 680,000 | 676,737 |
| CenterPoint Energy Incorporated (3 Month LIBOR +0.50%) ± | | 5.28 | 3-2-2023 | | 443,000 | 443,000 |
| Evergy Missouri West Incorporated 144A | | 5.15 | 12-15-2027 | | 2,500,000 | 2,477,306 |
| | | | | | | 4,362,043 |
| Total Corporate bonds and notes (Cost $143,049,256) | | | | | | 137,157,364 |
The accompanying notes are an integral part of these financial statements.
14 | Allspring Short-Term Bond Plus Fund
Portfolio of investments—February 28, 2023 (unaudited)
| | | Interest
rate | Maturity
date | Principal | Value |
| Foreign corporate bonds and notes : 1.10% | | | | | | |
| Communication services: 0.22% | | | | | | |
| Media: 0.22% | | | | | | |
| SES SA ʊ | | 2.88% | 12-31-2049 | EUR | 1,625,000 | $ 1,445,994 |
| Consumer staples: 0.23% | | | | | | |
| Tobacco: 0.23% | | | | | | |
| Altria Group Incorporated | | 1.70 | 6-15-2025 | EUR | 1,515,000 | 1,520,275 |
| Financials: 0.16% | | | | | | |
| Banks: 0.16% | | | | | | |
| Permanent TSB Group | | 2.13 | 9-26-2024 | EUR | 1,000,000 | 1,034,568 |
| Industrials: 0.27% | | | | | | |
| Containers & packaging: 0.19% | | | | | | |
| Can-Pack SA 144A | | 2.38 | 11-1-2027 | EUR | 1,500,000 | 1,259,102 |
| Electrical equipment: 0.08% | | | | | | |
| Gamma Bidco SpA 144A | | 6.25 | 7-15-2025 | EUR | 500,000 | 532,140 |
| Real estate: 0.22% | | | | | | |
| Equity REITs: 0.22% | | | | | | |
| Aedas Homes Opco SLU 144A | | 4.00 | 8-15-2026 | EUR | 1,500,000 | 1,426,308 |
| Total Foreign corporate bonds and notes (Cost $8,884,407) | | | | | | 7,218,387 |
| Foreign government bonds : 3.73% | | | | | | |
| Bonos y Obligaciones del Estado ¤ | | 0.00 | 1-31-2028 | EUR | 2,680,000 | 2,410,574 |
| Brazil ¤ | | 0.00 | 1-1-2024 | BRL | 17,000,000 | 2,925,298 |
| France | | 0.75 | 2-25-2028 | EUR | 10,045,000 | 9,518,488 |
| Germany | | 1.30 | 10-15-2027 | EUR | 8,175,000 | 8,115,943 |
| Malaysia | | 3.88 | 3-14-2025 | MYR | 6,895,000 | 1,552,111 |
| Total Foreign government bonds (Cost $25,384,304) | | | | | | 24,522,414 |
| Loans: 0.58% | | | | | | |
| Communication services: 0.43% | | | | | | |
| Media: 0.43% | | | | | | |
| CSC Holdings LLC (3 Month LIBOR +2.25%) ± | | 6.84 | 7-17-2025 | $ | 1,948,605 | 1,878,280 |
| Gray Television Incorporated (1 Month LIBOR +2.50%) ± | | 7.07 | 2-7-2024 | | 991,640 | 989,984 |
| | | | | | | 2,868,264 |
| Financials: 0.15% | | | | | | |
| Diversified financial services: 0.15% | | | | | | |
| Russell Investments US Institutional Holdco Incorporated (1 Month LIBOR +3.50%) ± | | 8.13 | 5-30-2025 | | 991,610 | 975,496 |
| Total Loans (Cost $3,894,459) | | | | | | 3,843,760 |
The accompanying notes are an integral part of these financial statements.
Allspring Short-Term Bond Plus Fund | 15
Portfolio of investments—February 28, 2023 (unaudited)
| | | Interest
rate | Maturity
date | Principal | Value |
| Municipal obligations: 0.43% | | | | | | |
| Indiana: 0.13% | | | | | | |
| Education revenue: 0.13% | | | | | | |
| Indiana Secondary Market for Education Loans Incorporated (1 Month LIBOR +0.80%) ± | | 1.47% | 2-25-2044 | $ | 873,166 | $ 871,402 |
| New Jersey: 0.30% | | | | | | |
| Miscellaneous revenue: 0.30% | | | | | | |
| New Jersey Transportation Trust Fund Authority System Series B | | 2.55 | 6-15-2023 | | 2,000,000 | 1,984,896 |
| Total Municipal obligations (Cost $2,865,361) | | | | | | 2,856,298 |
| Non-agency mortgage-backed securities: 19.55% | | | | | | |
| Achieve Mortgage Series 2022-HE1 Class A 144A±± | | 7.00 | 10-25-2037 | | 2,539,748 | 2,541,553 |
| Affirm Incorporated Series 2021-B Class A 144A | | 1.03 | 8-17-2026 | | 3,653,000 | 3,501,497 |
| Ajax Mortgage Loan Trust Series 2021-E Class A1 144A±± | | 1.74 | 12-25-2060 | | 3,082,397 | 2,615,972 |
| Anchorage Capital CLO Limited Series 2015-6A Class B2RR (3 Month LIBOR +1.85%) 144A± | | 6.64 | 7-15-2030 | | 4,000,000 | 3,964,240 |
| Angel Oak Mortgage Trust I LLC Series 2020-4 Class A1 144A±± | | 1.47 | 6-25-2065 | | 429,727 | 385,163 |
| Angel Oak Mortgage Trust I LLC Series 2020-R1 Class A1 144A±± | | 0.99 | 4-25-2053 | | 662,497 | 609,771 |
| APEX Credit CLO LLC Series 2017 Class 2A (3 Month LIBOR +1.60%) 144A± | | 6.35 | 9-20-2029 | | 3,000,000 | 2,915,511 |
| Auburn CLO Limited. Series 2017-1A Class A2A (3 Month LIBOR +1.62%) 144A± | | 6.43 | 10-20-2030 | | 470,000 | 461,859 |
| Black Diamond CLO Limited Series 2017-1A Class A1 (3 Month LIBOR +1.05%) 144A± | | 5.87 | 4-24-2029 | | 1,918,495 | 1,906,033 |
| Bojangles Issuer LLC Series 2020-1A Class A2 144A | | 3.83 | 10-20-2050 | | 2,202,750 | 1,997,112 |
| Bravo Residential Funding Trust Series 2021-HE2 Class A1 (30 Day Average U.S. SOFR +0.75%) 144A± | | 5.23 | 11-25-2069 | | 2,187,313 | 2,170,720 |
| Bunker Hill Loan Depositary Trust Series 2019-3 Class A1 144A | | 2.72 | 11-25-2059 | | 327,668 | 316,259 |
| BX Trust Series 2021-ARIA Class D (1 Month LIBOR +1.90%) 144A± | | 6.48 | 10-15-2036 | | 2,165,000 | 2,063,282 |
| Carlyle Global Market Series 2015-1A Class CR3 (3 Month LIBOR +2.00%) 144A± | | 6.24 | 7-20-2031 | | 3,000,000 | 2,825,346 |
| Cascade Funding Mortgage Trust Series 2018-RM2 Class A 144A±± | | 4.00 | 10-25-2068 | | 202,643 | 195,833 |
| Cascade Funding Mortgage Trust Series 2018-RM2 Class B 144A±± | | 4.00 | 10-25-2068 | | 883,524 | 836,081 |
| Cascade Funding Mortgage Trust Series 2020-HB4 Class A 144A±± | | 0.95 | 12-26-2030 | | 1,715,701 | 1,666,841 |
| Cascade Funding Mortgage Trust Series 2021-AL1 Class B 144A | | 1.39 | 9-22-2031 | | 1,409,871 | 1,341,633 |
| CIFC Funding Limited Series 2017-2A (3 Month LIBOR +1.85%) 144A± | | 6.66 | 4-20-2030 | | 1,250,000 | 1,194,855 |
| CIFC Funding Limited Series 2018-1A Class A (3 Month LIBOR +1.00%) 144A± | | 5.79 | 4-18-2031 | | 4,000,000 | 3,943,695 |
| Colt Funding LLC Series 2020-2 Class A1 144A±± | | 1.85 | 3-25-2065 | | 102,146 | 100,462 |
| Commercial Mortgage Trust Series 2012-CR4 Class A | | 3.25 | 10-15-2045 | | 2,000,000 | 1,814,009 |
| Commercial Mortgage Trust Series 2014-CR14 Class B ±± | | 4.59 | 2-10-2047 | | 680,000 | 658,631 |
The accompanying notes are an integral part of these financial statements.
16 | Allspring Short-Term Bond Plus Fund
Portfolio of investments—February 28, 2023 (unaudited)
| | | Interest
rate | Maturity
date | Principal | Value |
| Non-agency mortgage-backed securities (continued) | | | | | | |
| Commercial Mortgage Trust Series 2015-DC1 Class A3 | | 3.22% | 2-10-2048 | $ | 58,798 | $ 58,725 |
| ContiMortgage Home Equity Loan Trust Series 1996-2 Class IO ±± | | 0.00 | 7-15-2027 | | 367,709 | 4,413 |
| Countrywide Home Loans Mortgage Pass-Through Trust Series 2001-HYB1 Class 2A1 ±± | | 4.01 | 6-19-2031 | | 64,210 | 61,704 |
| Credit Suisse Mortgage Trust Series 2020-AFC1 Class A3 144A±± | | 2.51 | 2-25-2050 | | 673,013 | 618,186 |
| Credit Suisse Mortgage Trust Series 2021-AFC1 Class A2 144A±± | | 1.07 | 3-25-2056 | | 1,414,190 | 1,112,981 |
| CSAIL Commercial Mortgage Trust Series 2016-C5 Class A4 | | 3.49 | 11-15-2048 | | 817,720 | 774,148 |
| DBWF Mortgage Trust Series 2018-GLKS Class A (1 Month LIBOR +1.13%) 144A± | | 5.73 | 12-19-2030 | | 550,000 | 543,791 |
| Dryden Senior Loan Fund Series 2019-72A (3 Month LIBOR +1.85%) 144A± | | 6.71 | 5-15-2032 | | 1,000,000 | 947,028 |
| EquiFirst Mortgage Loan Trust Series 2003-2 Class 3A3 (1 Month LIBOR +1.13%) ± | | 5.34 | 9-25-2033 | | 148,734 | 145,360 |
| FirstKey Homes Trust Series 2021 Class B 144A | | 1.61 | 9-17-2038 | | 2,235,000 | 1,948,620 |
| FirstKey Homes Trust Series 2021 Class C 144A | | 1.89 | 8-17-2038 | | 1,835,000 | 1,591,983 |
| FS Rialto Issuer Limited Series 2021-FL3 Class B (1 Month LIBOR +1.80%) 144A± | | 6.39 | 11-16-2036 | | 2,000,000 | 1,892,601 |
| FWD Securitization Trust Series 2020-INV1 Class A3 144A±± | | 2.44 | 1-25-2050 | | 761,069 | 676,178 |
| GCAT Series 2021-NQM1 Class A1 144A±± | | 0.87 | 1-25-2066 | | 1,206,508 | 1,006,076 |
| Golden National Mortgage Asset-Backed Certificates Series 1998-GN1 Class M2 | | 8.02 | 2-25-2027 | | 34,322 | 33,451 |
| Goldman Sachs Mortgage Securities Trust Series 2014-GC22 Class A3 | | 3.52 | 6-10-2047 | | 1,233,338 | 1,209,251 |
| Gracie Point International Funding 2022-1A (30 Day Average U.S. SOFR +2.75%) 144A± | | 7.06 | 4-1-2024 | | 1,595,000 | 1,594,462 |
| GSMPS Mortgage Loan Trust Series 1998-1 Class A 144A±± | | 8.00 | 9-19-2027 | | 103,116 | 96,515 |
| Harbor Group International Limited Series 2021-FL1 Class A (1 Month LIBOR +1.05%) 144A± | | 5.64 | 6-16-2036 | | 1,560,692 | 1,498,076 |
| Harbor Group International Limited Series 2021-FL2 Class C (1 Month LIBOR +1.80%) 144A± | | 6.39 | 9-17-2036 | | 1,000,000 | 944,563 |
| Hospitality Mortgage Trust Series 2019 Class A (1 Month LIBOR +1.00%) 144A± | | 5.59 | 11-15-2036 | | 1,653,874 | 1,639,505 |
| Imperial Fund Mortgage Trust Series 2021-NQM3 Class A1 144A±± | | 1.60 | 11-25-2056 | | 2,610,084 | 2,155,169 |
| Imperial Fund Mortgage Trust Series 2022-NQM3 Class A3 144A±± | | 4.45 | 5-25-2067 | | 4,005,000 | 3,390,583 |
| Jonah Energy LLC Series 2022-1 Class A1 144A | | 7.20 | 12-10-2037 | | 2,557,479 | 2,534,573 |
| JPMorgan Chase Commercial Mortgage Securities Trust Series 2018-PHH Class A (1 Month LIBOR +1.21%) 144A± | | 5.80 | 6-15-2035 | | 566,915 | 523,117 |
| JPMorgan Chase Commercial Mortgage Securities Trust Series 2019-MFP Class A (1 Month LIBOR +0.96%) 144A± | | 5.55 | 7-15-2036 | | 1,149,504 | 1,136,918 |
| JPMorgan Chase Commercial Mortgage Securities Trust Series 2020 Class A7 144A±± | | 3.50 | 7-25-2050 | | 1,035,020 | 918,944 |
| Madison Park Funding Limited Series 2012-0A (3 Month LIBOR +1.55%) 144A± | | 6.36 | 7-27-2030 | | 1,570,000 | 1,542,611 |
| Marlette Funding Trust Series 2021-2A Class B 144A | | 1.06 | 9-15-2031 | | 3,321,048 | 3,250,675 |
| Master Mortgages Trust Series 2002-3 Class 4A1 ±± | | 2.84 | 10-25-2032 | | 803 | 756 |
The accompanying notes are an integral part of these financial statements.
Allspring Short-Term Bond Plus Fund | 17
Portfolio of investments—February 28, 2023 (unaudited)
| | | Interest
rate | Maturity
date | Principal | Value |
| Non-agency mortgage-backed securities (continued) | | | | | | |
| MED Trust Series 2021-MDLN Class B (1 Month LIBOR +1.45%) 144A± | | 6.04% | 11-15-2038 | $ | 2,991,114 | $ 2,923,838 |
| MF1 Multifamily Housing Mortgage Loan Trust Series 2021-FL5 Class A (U.S. SOFR 1 Month +0.96%) 144A± | | 5.53 | 7-15-2036 | | 1,411,935 | 1,374,677 |
| MF1 Multifamily Housing Mortgage Series 2022-FL8 Class A (30 Day Average U.S. SOFR +1.35%) 144A± | | 5.78 | 2-19-2037 | | 3,800,000 | 3,753,815 |
| MFRA Trust Series 2020-NQM1 Class A2 144A±± | | 1.79 | 8-25-2049 | | 549,688 | 507,100 |
| MFRA Trust Series 2021-NQM1 Class A2 144A±± | | 1.38 | 4-25-2065 | | 898,944 | 795,578 |
| Morgan Stanley Capital I Trust 2014-150E Class A 144A | | 3.91 | 9-9-2032 | | 800,000 | 704,418 |
| New Residential Mortgage Loan Series 2018-5A Class A1A 144A±± | | 4.25 | 12-25-2057 | | 1,825,378 | 1,736,599 |
| New Residential Mortgage Loan Series 2019-6A Class A1B 144A±± | | 3.50 | 9-25-2059 | | 1,128,378 | 1,028,036 |
| New York Mortgage Trust Series 2022 Class A1 144A | | 2.04 | 7-25-2061 | | 2,681,688 | 2,391,894 |
| Oceanview Mortgage Trust 2021-EBO1 Class 1A 144A | | 1.22 | 12-29-2051 | | 584,320 | 560,321 |
| Octagon Investment Partners Series 2017-1A Class A2R (3 Month LIBOR +1.45%) 144A± | | 6.26 | 3-17-2030 | | 2,190,000 | 2,144,135 |
| Octane Receivables Trust 2023-1 Class A 144A | | 5.87 | 5-21-2029 | | 790,000 | 789,506 |
| Octane Receivables Trust 2023-1 Class B 144A | | 5.96 | 7-20-2029 | | 645,000 | 643,250 |
| Octane Receivables Trust Series 2022-2A Class A 144A | | 5.11 | 2-22-2028 | | 1,456,906 | 1,442,657 |
| OPG Trust 2021-PORT (1 Month LIBOR +0.71%) 144A± | | 5.30 | 10-15-2036 | | 3,152,721 | 3,034,215 |
| Pagaya AI Debt Selection Trust 2023-1 144A | | 7.56 | 7-15-2030 | | 3,305,000 | 3,312,733 |
| PKHL Commercial Mortgage Trust Series 2021 Class B (1 Month LIBOR +1.18%) 144A± | | 5.77 | 7-15-2038 | | 3,342,000 | 3,134,045 |
| ReadyCap Commercial Mortgage Trust Series 2019-5 Class A 144A | | 3.78 | 2-25-2052 | | 162,431 | 159,933 |
| Residential Mortgage Loan Trust Series 2021-1R Class A2 144A±± | | 1.10 | 1-25-2065 | | 300,022 | 275,639 |
| Sound Point CLO Limited Series 2015-1RA Class AR (3 Month LIBOR +1.08%) 144A± | | 5.87 | 4-15-2030 | | 741,327 | 732,906 |
| Sound Point CLO Limited Series 2015-1RA Class BR (3 Month LIBOR +1.55%) 144A± | | 6.34 | 4-15-2030 | | 2,660,000 | 2,573,750 |
| Starwood Mortgage Residential Trust Series 2020-1 Class A3 144A±± | | 2.56 | 2-25-2050 | | 1,321,259 | 1,257,781 |
| Towd Point Mortgage Trust Series 2017-1 Class A1 144A±± | | 2.75 | 10-25-2056 | | 358,238 | 352,939 |
| Towd Point Mortgage Trust Series 2017-4 Class A1 144A±± | | 2.75 | 6-25-2057 | | 368,641 | 349,165 |
| Towd Point Mortgage Trust Series 2019-4 Class A1 144A±± | | 2.90 | 10-25-2059 | | 903,422 | 839,478 |
| Towd Point Mortgage Trust Series 2019-MH1 Class A1 144A±± | | 3.00 | 11-25-2058 | | 163,479 | 160,542 |
| UBS Commercial Mortgage Trust Series 2018-NYCH Class A (1 Month LIBOR +0.85%) 144A± | | 5.44 | 2-15-2032 | | 1,459,270 | 1,426,513 |
| Venture CDO Limited Series 2017-29A (3 Month LIBOR +0.99%) 144A± | | 5.85 | 9-7-2030 | | 2,477,340 | 2,446,892 |
| Verus Securitization Trust Series 2021-2 Class A1 144A±± | | 1.03 | 2-25-2066 | | 1,776,586 | 1,506,971 |
| Verus Securitization Trust Series 2021-8 Class A2 144A±± | | 2.29 | 11-25-2066 | | 2,101,175 | 1,760,373 |
| Verus Securitization Trust Series 2021-R1 Class A2 144A±± | | 1.06 | 10-25-2063 | | 131,880 | 118,380 |
The accompanying notes are an integral part of these financial statements.
18 | Allspring Short-Term Bond Plus Fund
Portfolio of investments—February 28, 2023 (unaudited)
| | | Interest
rate | Maturity
date | Principal | Value |
| Non-agency mortgage-backed securities (continued) | | | | | | |
| Verus Securitization Trust Series 2021-R3 Class A1 144A±± | | 1.02% | 4-25-2064 | $ | 1,025,380 | $ 913,089 |
| Vibrant CLO Limited (3 Month LIBOR +0.95%) 144A± | | 5.70 | 6-20-2029 | | 1,440,919 | 1,431,515 |
| Voya CLO Limited Series 2017-1A (3 Month LIBOR +1.90%) 144A± | | 6.69 | 4-17-2030 | | 2,500,000 | 2,356,245 |
| Wilshire Funding Corporation Series 1996-3 Class M2 ±± | | 7.53 | 8-25-2032 | | 47,308 | 47,984 |
| Wilshire Funding Corporation Series 1996-3 Class M3 ±± | | 7.53 | 8-25-2032 | | 31,146 | 30,538 |
| Wilshire Funding Corporation Series 1998-2 Class M1 (12 Month Treasury Average +2.00%) ± | | 4.05 | 12-28-2037 | | 3,787 | 3,724 |
| Wind River CLO Limited Series 2013-2A Class AR (3 Month LIBOR +1.00%) 144A± | | 5.79 | 10-18-2030 | | 3,815,277 | 3,767,876 |
| Zais CLO Limited Series 2017-1A (3 Month LIBOR +2.65%) 144A± | | 7.44 | 7-15-2029 | | 2,050,000 | 1,983,865 |
| Total Non-agency mortgage-backed securities (Cost $135,426,546) | | | | | | 128,650,236 |
| U.S. Treasury securities: 27.79% | | | | | | |
| U.S. Treasury Note | | 0.25 | 5-15-2024 | | 4,355,000 | 4,107,650 |
| U.S. Treasury Note | | 0.38 | 12-31-2025 | | 66,440,000 | 59,274,342 |
| U.S. Treasury Note | | 1.13 | 1-15-2025 | | 39,905,000 | 37,259,735 |
| U.S. Treasury Note | | 2.88 | 6-15-2025 | | 2,470,000 | 2,373,902 |
| U.S. Treasury Note | | 3.25 | 8-31-2024 | | 77,250,000 | 75,261,416 |
| U.S. Treasury Note | | 3.50 | 9-15-2025 | | 1,690,000 | 1,645,571 |
| U.S. Treasury Note | | 3.50 | 1-31-2028 | | 530,000 | 513,893 |
| U.S. Treasury Note | | 4.63 | 2-28-2025 | | 2,480,000 | 2,472,056 |
| Total U.S. Treasury securities (Cost $186,440,086) | | | | | | 182,908,565 |
| Yankee corporate bonds and notes: 13.16% | | | | | | |
| Consumer discretionary: 0.87% | | | | | | |
| Auto components: 0.12% | | | | | | |
| Faurecia SE | | 7.25 | 6-15-2026 | | 700,000 | 760,426 |
| Automobiles: 0.35% | | | | | | |
| Conti Gummi Finance BV | | 1.13 | 9-25-2024 | | 2,000,000 | 2,028,059 |
| Stellantis NV | | 5.25 | 4-15-2023 | | 250,000 | 249,330 |
| | | | | | | 2,277,389 |
| Internet & direct marketing retail: 0.40% | | | | | | |
| Prosus NV 144A | | 3.26 | 1-19-2027 | | 3,000,000 | 2,667,615 |
| Consumer staples: 0.29% | | | | | | |
| Food products: 0.29% | | | | | | |
| Viterra Finance BV 144A | | 4.90 | 4-21-2027 | | 2,000,000 | 1,894,660 |
| Energy: 0.44% | | | | | | |
| Oil, gas & consumable fuels: 0.44% | | | | | | |
| BP Capital Markets plc (5 Year Treasury Constant Maturity +4.04%) ʊ± | | 4.38 | 6-22-2025 | | 3,000,000 | 2,860,175 |
The accompanying notes are an integral part of these financial statements.
Allspring Short-Term Bond Plus Fund | 19
Portfolio of investments—February 28, 2023 (unaudited)
| | | Interest
rate | Maturity
date | Principal | Value |
| Financials: 10.01% | | | | | | |
| Banks: 6.41% | | | | | | |
| Banco Santander (1 Year Treasury Constant Maturity +0.45%) ± | | 0.70% | 6-30-2024 | $ | 2,000,000 | $ 1,961,460 |
| Bank of Montreal | | 4.70 | 9-14-2027 | | 2,460,000 | 2,405,589 |
| Banque Fédérative du Crédit Mutuel 144A | | 4.52 | 7-13-2025 | | 3,000,000 | 2,931,645 |
| Barclays Bank plc (1 Year Treasury Constant Maturity +0.80%) ± | | 1.01 | 12-10-2024 | | 1,155,000 | 1,112,138 |
| BNP Paribas (U.S. SOFR +1.00%) 144A± | | 1.32 | 1-13-2027 | | 1,545,000 | 1,367,950 |
| BNP Paribas (1 Year Treasury Constant Maturity +1.45%) 144A± | | 5.13 | 1-13-2029 | | 3,000,000 | 2,949,977 |
| BPCE SA 144A | | 4.75 | 7-19-2027 | | 2,560,000 | 2,488,100 |
| Central American Bank 144A | | 1.14 | 2-9-2026 | | 2,500,000 | 2,215,875 |
| Crédit Agricole Group SA 144A | | 5.30 | 7-12-2028 | | 3,000,000 | 2,983,614 |
| Danske Bank A/S (1 Year Treasury Constant Maturity +0.55%) 144A± | | 0.98 | 9-10-2025 | | 2,000,000 | 1,852,276 |
| Danske Bank Class A (1 Year Treasury Constant Maturity +2.10%) 144A± | | 6.47 | 1-9-2026 | | 1,000,000 | 1,006,146 |
| Deutsche Bank (U.S. SOFR +2.16%) ± | | 2.22 | 9-18-2024 | | 1,500,000 | 1,466,252 |
| HSBC Holdings plc (U.S. SOFR +0.71%) ± | | 0.98 | 5-24-2025 | | 600,000 | 564,412 |
| HSBC Holdings plc (U.S. SOFR +1.10%) ± | | 2.25 | 11-22-2027 | | 1,760,000 | 1,548,166 |
| HSBC Holdings plc (U.S. SOFR +2.61%) ± | | 5.21 | 8-11-2028 | | 2,400,000 | 2,346,819 |
| Intesa Sanpaolo SpA 144A | | 3.25 | 9-23-2024 | | 2,000,000 | 1,905,060 |
| Mitsubishi UFJ Financial Group (1 Year Treasury Constant Maturity +1.90%) ± | | 5.35 | 9-13-2028 | | 2,950,000 | 2,921,171 |
| Mitsubishi UFJ Financial Group Incorporated (1 Year Treasury Constant Maturity +1.08%) ± | | 5.72 | 2-20-2026 | | 3,000,000 | 2,995,824 |
| Mizuho Financial Group (U.S. SOFR +1.24%) ± | | 2.84 | 7-16-2025 | | 1,000,000 | 956,292 |
| NatWest Markets plc 144A | | 2.38 | 5-21-2023 | | 1,375,000 | 1,365,533 |
| Sumitomo Mitsui Financial Group Incorporated | | 5.52 | 1-13-2028 | | 2,840,000 | 2,832,498 |
| | | | | | | 42,176,797 |
| Capital markets: 1.21% | | | | | | |
| Credit Suisse Group AG (U.S. SOFR +2.04%) 144A± | | 2.19 | 6-5-2026 | | 3,000,000 | 2,583,997 |
| Macquarie Group Limited (U.S. SOFR +1.07%) 144A± | | 1.34 | 1-12-2027 | | 1,885,000 | 1,656,858 |
| UBS Group AG (1 Year Treasury Constant Maturity +0.85%) 144A± | | 1.49 | 8-10-2027 | | 2,000,000 | 1,733,288 |
| UBS Group AG (1 Year Treasury Constant Maturity +1.55%) 144A± | | 5.71 | 1-12-2027 | | 2,000,000 | 1,995,807 |
| | | | | | | 7,969,950 |
| Consumer finance: 0.23% | | | | | | |
| Volkswagen Financial Services AG | | 3.38 | 4-6-2028 | | 1,500,000 | 1,514,215 |
| Diversified financial services: 1.05% | | | | | | |
| AerCap Ireland Capital Designated Activity Company / AerCap Global Aviation Trust | | 1.65 | 10-29-2024 | | 2,500,000 | 2,319,192 |
| African Export Import BA 144A | | 2.63 | 5-17-2026 | | 550,000 | 491,713 |
| Avolon Holdings Funding Limited 144A | | 2.53 | 11-18-2027 | | 862,000 | 718,241 |
| Avolon Holdings Funding Limited 144A | | 5.50 | 1-15-2026 | | 965,000 | 933,816 |
| Cirsa Finance International 144A | | 10.38 | 11-30-2027 | | 400,000 | 448,042 |
| New Red Finance Incorporated 144A« | | 5.75 | 4-15-2025 | | 2,000,000 | 1,987,510 |
| | | | | | | 6,898,514 |
The accompanying notes are an integral part of these financial statements.
20 | Allspring Short-Term Bond Plus Fund
Portfolio of investments—February 28, 2023 (unaudited)
| | | Interest
rate | Maturity
date | Principal | Value |
| Insurance: 0.69% | | | | | | |
| Allied World Assurance Company Holdings Limited | | 4.35% | 10-29-2025 | $ | 2,880,000 | $ 2,751,266 |
| Athene Global Funding | | 0.37 | 9-10-2026 | | 2,000,000 | 1,802,629 |
| | | | | | | 4,553,895 |
| Thrifts & mortgage finance: 0.42% | | | | | | |
| Nationwide Building Society 144A | | 4.85 | 7-27-2027 | | 2,860,000 | 2,787,911 |
| Health care: 0.28% | | | | | | |
| Biotechnology: 0.28% | | | | | | |
| Mylan NV | | 3.95 | 6-15-2026 | | 2,000,000 | 1,870,366 |
| Industrials: 0.05% | | | | | | |
| Commercial services & supplies: 0.05% | | | | | | |
| Verisure Holding AB 144A | | 9.25 | 10-15-2027 | | 300,000 | 335,574 |
| Information technology: 0.40% | | | | | | |
| Semiconductors & semiconductor equipment: 0.40% | | | | | | |
| Renesas Electronics Corporation 144A | | 1.54 | 11-26-2024 | | 2,830,000 | 2,603,738 |
| Materials: 0.30% | | | | | | |
| Chemicals: 0.30% | | | | | | |
| Syngenta Finance NV 144A | | 4.44 | 4-24-2023 | | 2,000,000 | 1,994,827 |
| Real estate: 0.52% | | | | | | |
| Equity REITs: 0.29% | | | | | | |
| Scentre Group Trust 144A | | 3.63 | 1-28-2026 | | 2,000,000 | 1,883,293 |
| Real estate management & development: 0.23% | | | | | | |
| Cadillac Fairview Corporation Limited 144A | | 3.88 | 3-20-2027 | | 1,687,000 | 1,541,842 |
| Total Yankee corporate bonds and notes (Cost $90,771,929) | | | | | | 86,591,187 |
| | | Yield | | Shares | |
| Short-term investments: 4.20% | | | | | | |
| Investment companies: 4.20% | | | | | | |
| Allspring Government Money Market Fund Select Class ♠∞## | | 4.39 | | | 27,568,373 | 27,568,373 |
| Securities Lending Cash Investments LLC ♠∩∞ | | 4.54 | | | 104,016 | 104,016 |
| Total Short-term investments (Cost $27,672,379) | | | | | | 27,672,389 |
| Total investments in securities (Cost $691,108,733) | 101.01% | | | | | 664,853,537 |
| Other assets and liabilities, net | (1.01) | | | | | (6,637,788) |
| Total net assets | 100.00% | | | | | $658,215,749 |
The accompanying notes are an integral part of these financial statements.
Allspring Short-Term Bond Plus Fund | 21
Portfolio of investments—February 28, 2023 (unaudited)
| ± | Variable rate investment. The rate shown is the rate in effect at period end. |
| ±± | The coupon of the security is adjusted based on the principal and/or interest payments received from the underlying pool of mortgages as well as the credit quality and the actual prepayment speed of the underlying mortgages. The rate shown is the rate in effect at period end. |
| 144A | The security may be resold in transactions exempt from registration, normally to qualified institutional buyers, pursuant to Rule 144A under the Securities Act of 1933. |
| ¤ | The security is issued in zero coupon form with no periodic interest payments. |
| ## | All or a portion of this security is segregated for when-issued securities. |
| « | All or a portion of this security is on loan. |
| ♠ | The issuer of the security is an affiliated person of the Fund as defined in the Investment Company Act of 1940. |
| ∩ | The investment is a non-registered investment company purchased with cash collateral received from securities on loan. |
| ∞ | The rate represents the 7-day annualized yield at period end. |
| %% | The security is purchased on a when-issued basis. |
| ʊ | Security is perpetual in nature and has no stated maturity date. The date shown reflects the next call date. |
| Abbreviations: |
| BRL | Brazilian real |
| EUR | Euro |
| FHLMC | Federal Home Loan Mortgage Corporation |
| FNMA | Federal National Mortgage Association |
| GNMA | Government National Mortgage Association |
| LIBOR | London Interbank Offered Rate |
| MYR | Malaysian ringgit |
| REIT | Real estate investment trust |
| SOFR | Secured Overnight Financing Rate |
Investments in affiliates
An affiliated investment is an investment in which the Fund owns at least 5% of the outstanding voting shares of the issuer or as a result of other relationships, such as the Fund and the issuer having the same investment manager. Transactions with issuers that were affiliates of the Fund at the end of the period were as follows:
| | Value,
beginning of
period | Purchases | Sales
proceeds | Net
realized
gains
(losses) | | Net
change in
unrealized
gains
(losses) | | Value,
end of
period | Shares,
end
of period | Income
from
affiliated
securities |
| Short-term investments | | | | | | | | | |
| Allspring Government Money Market Fund Select Class | $34,859,487 | $237,253,142 | $(244,544,256) | $ 0 | | $ 0 | | $ 27,568,373 | 27,568,373 | $ 566,656 |
| Securities Lending Cash Investments LLC | 385,605 | 159,872,526 | (160,153,846) | (279) | | 10 | | 104,016 | 104,016 | 144,244 # |
| | | | | $ (279) | | $10 | | $27,672,389 | | $710,900 |
| # | Amount shown represents income before fees and rebates. |
The accompanying notes are an integral part of these financial statements.
22 | Allspring Short-Term Bond Plus Fund
Portfolio of investments—February 28, 2023 (unaudited)
Forward foreign currency contracts
Currency to be
received | Currency to be
delivered | Counterparty | Settlement
date | Unrealized
gains | | Unrealized
losses |
| 2,615,000 EUR | 2,862,376 USD | Morgan Stanley | 3-31-2023 | $ 0 | | $ (91,687) |
| 208,037,384 JPY | 1,480,000 EUR | Morgan Stanley | 3-31-2023 | 0 | | (71,134) |
| 20,476,650 USD | 19,195,000 EUR | Morgan Stanley | 3-31-2023 | 138,837 | | 0 |
| 1,359,210 USD | 1,270,000 EUR | Morgan Stanley | 3-31-2023 | 13,598 | | 0 |
| 4,658,227 USD | 4,350,000 EUR | Morgan Stanley | 3-31-2023 | 49,241 | | 0 |
| 1,618,541 USD | 1,500,000 EUR | Morgan Stanley | 3-31-2023 | 29,235 | | 0 |
| 6,520,629 USD | 6,050,000 EUR | Morgan Stanley | 3-31-2023 | 110,431 | | 0 |
| 1,631,253 USD | 1,500,000 EUR | Morgan Stanley | 3-31-2023 | 41,947 | | 0 |
| 208,037,384 JPY | 1,480,000 EUR | Morgan Stanley | 3-31-2023 | 37,174 | | 0 |
| 757,575 USD | 695,000 EUR | Morgan Stanley | 3-31-2023 | 21,197 | | 0 |
| 876,187 USD | 805,000 EUR | Morgan Stanley | 3-31-2023 | 23,259 | | 0 |
| | | | | $464,919 | | $(162,821) |
Futures contracts
| Description | Number of
contracts | Expiration
date | Notional
cost | Notional
value | Unrealized
gains | | Unrealized
losses |
| Long | | | | | | | |
| 2-Year U.S. Treasury Notes | 1,050 | 6-30-2023 | $214,500,898 | $213,912,890 | $ 0 | | $ (588,008) |
| Short | | | | | | | |
| Euro-BOBL Futures | (40) | 3-8-2023 | (5,047,707) | (4,873,034) | 174,673 | | 0 |
| 10-Year U.S. Treasury Notes | (39) | 6-21-2023 | (4,361,880) | (4,354,594) | 7,286 | | 0 |
| 5-Year U.S. Treasury Notes | (527) | 6-30-2023 | (56,556,217) | (56,417,821) | 138,396 | | 0 |
| | | | | | $320,355 | | $(588,008) |
The accompanying notes are an integral part of these financial statements.
Allspring Short-Term Bond Plus Fund | 23
Statement of assets and liabilities—February 28, 2023 (unaudited)
| | |
| Assets | |
Investments in unaffiliated securities (including $101,911 of securities loaned), at value (cost $663,436,354)
| $ 637,181,148 |
Investments in affiliated securities, at value (cost $27,672,379)
| 27,672,389 |
Segregated cash for forward foreign currency contracts
| 220,000 |
Cash at broker segregated for futures contracts
| 1,730,000 |
Receivable for investments sold
| 9,005,621 |
Receivable for interest
| 3,089,962 |
Receivable for Fund shares sold
| 953,119 |
Unrealized gains on forward foreign currency contracts
| 464,919 |
Principal paydown receivable
| 5,185 |
Receivable for securities lending income, net
| 229 |
Prepaid expenses and other assets
| 106,484 |
Total assets
| 680,429,056 |
| Liabilities | |
Payable for when-issued transactions
| 14,063,330 |
Payable for investments purchased
| 4,077,382 |
Due to custodian bank, foreign currency, at value (cost $2,088,406)
| 2,088,406 |
Payable for Fund shares redeemed
| 1,022,953 |
Overdraft due to custodian bank
| 392,101 |
Unrealized losses on forward foreign currency contracts
| 162,821 |
Management fee payable
| 159,373 |
Payable upon receipt of securities loaned
| 104,016 |
Administration fees payable
| 48,664 |
Payable for daily variation margin on open futures contracts
| 7,638 |
Distribution fee payable
| 2,014 |
Accrued expenses and other liabilities
| 84,609 |
Total liabilities
| 22,213,307 |
Total net assets
| $658,215,749 |
| Net assets consist of | |
Paid-in capital
| $ 696,230,744 |
Total distributable loss
| (38,014,995) |
Total net assets
| $658,215,749 |
| Computation of net asset value and offering price per share | |
Net assets – Class A
| $ 137,047,709 |
Shares outstanding – Class A1
| 16,521,609 |
Net asset value per share – Class A
| $8.30 |
Maximum offering price per share – Class A2
| $8.47 |
Net assets – Class C
| $ 3,396,799 |
Shares outstanding – Class C1
| 410,054 |
Net asset value per share – Class C
| $8.28 |
Net assets – Class R6
| $ 13,915,034 |
Shares outstanding – Class R61
| 1,678,251 |
Net asset value per share – Class R6
| $8.29 |
Net assets – Institutional Class
| $ 503,856,207 |
Shares outstanding – Institutional Class1
| 60,717,694 |
Net asset value per share – Institutional Class
| $8.30 |
| 1 | The Fund has an unlimited number of authorized shares. |
| 2 | Maximum offering price is computed as 100/98 of net asset value. On investments of $100,000 or more, the offering price is reduced. |
The accompanying notes are an integral part of these financial statements.
24 | Allspring Short-Term Bond Plus Fund
Statement of operations—six months ended February 28, 2023 (unaudited)
| | |
| Investment income | |
Interest
| $ 10,060,995 |
Income from affiliated securities
| 638,069 |
Total investment income
| 10,699,064 |
| Expenses | |
Management fee
| 1,075,565 |
| Administration fees | |
Class A
| 109,490 |
Class C
| 3,065 |
Class R6
| 2,231 |
Institutional Class
| 183,616 |
| Shareholder servicing fees | |
Class A
| 170,876 |
Class C
| 4,781 |
| Distribution fee | |
Class C
| 14,343 |
Custody and accounting fees
| 20,679 |
Professional fees
| 35,556 |
Registration fees
| 32,891 |
Shareholder report expenses
| 30,318 |
Trustees’ fees and expenses
| 10,625 |
Other fees and expenses
| 8,415 |
Total expenses
| 1,702,451 |
| Less: Fee waivers and/or expense reimbursements | |
Fund-level
| (72,217) |
Class A
| (47,902) |
Class C
| (1,149) |
Class R6
| (744) |
Net expenses
| 1,580,439 |
Net investment income
| 9,118,625 |
| Realized and unrealized gains (losses) on investments | |
| Net realized losses on | |
Unaffiliated securities
| (5,207,653) |
Affiliated securities
| (279) |
Forward foreign currency contracts
| (74,660) |
Futures contracts
| (2,976,719) |
Net realized losses on investments
| (8,259,311) |
| Net change in unrealized gains (losses) on | |
Unaffiliated securities
| 507,273 |
Affiliated securities
| 10 |
Forward foreign currency contracts
| (527,968) |
Futures contracts
| (47,671) |
Net change in unrealized gains (losses) on investments
| (68,356) |
Net realized and unrealized gains (losses) on investments
| (8,327,667) |
Net increase in net assets resulting from operations
| $ 790,958 |
The accompanying notes are an integral part of these financial statements.
Allspring Short-Term Bond Plus Fund | 25
Statement of changes in net assets
| | | | | |
| | Six months ended
February 28, 2023
(unaudited) | Year ended
August 31, 2022 |
| Operations | | | | |
Net investment income
| | $ 9,118,625 | | $ 8,785,034 |
Net realized losses on investments
| | (8,259,311) | | (4,518,213) |
Net change in unrealized gains (losses) on investments
| | (68,356) | | (32,399,021) |
Net increase (decrease) in net assets resulting from operations
| | 790,958 | | (28,132,200) |
| Distributions to shareholders from | | | | |
| Net investment income and net realized gains | | | | |
Class A
| | (1,885,332) | | (3,260,447) |
Class C
| | (37,430) | | (66,976) |
Class R6
| | (226,341) | | (576,380) |
Institutional Class
| | (6,939,065) | | (9,456,485) |
Total distributions to shareholders
| | (9,088,168) | | (13,360,288) |
| Capital share transactions | Shares | | Shares | |
| Proceeds from shares sold | | | | |
Class A
| 1,136,754 | 9,450,378 | 1,472,078 | 12,971,130 |
Class C
| 11,058 | 91,836 | 111,895 | 994,577 |
Class R6
| 96,539 | 801,867 | 489,531 | 4,166,599 |
Institutional Class
| 21,860,536 | 181,319,490 | 29,373,532 | 254,171,578 |
| | | 191,663,571 | | 272,303,884 |
| Reinvestment of distributions | | | | |
Class A
| 215,559 | 1,784,991 | 351,308 | 3,077,067 |
Class C
| 4,527 | 37,430 | 7,551 | 66,318 |
Class R6
| 6,847 | 56,654 | 4,660 | 40,256 |
Institutional Class
| 631,009 | 5,226,544 | 867,848 | 7,589,450 |
| | | 7,105,619 | | 10,773,091 |
| Payment for shares redeemed | | | | |
Class A
| (1,692,199) | (14,039,814) | (4,367,651) | (38,301,946) |
Class C
| (108,692) | (901,175) | (203,015) | (1,765,491) |
Class R6
| (397,231) | (3,295,479) | (2,084,157) | (18,249,955) |
Institutional Class
| (14,865,758) | (123,210,703) | (22,157,051) | (192,938,192) |
| | | (141,447,171) | | (251,255,584) |
Net increase in net assets resulting from capital share transactions
| | 57,322,019 | | 31,821,391 |
Total increase (decrease) in net assets
| | 49,024,809 | | (9,671,097) |
| Net assets | | | | |
Beginning of period
| | 609,190,940 | | 618,862,037 |
End of period
| | $ 658,215,749 | | $ 609,190,940 |
The accompanying notes are an integral part of these financial statements.
26 | Allspring Short-Term Bond Plus Fund
Financial highlights
(For a share outstanding throughout each period)
| | | Year ended August 31 |
| Class A | Six months ended
February 28, 2023
(unaudited) | 2022 | 2021 | 2020 | 2019 | 2018 |
Net asset value, beginning of period
| $8.41 | $9.02 | $9.09 | $8.84 | $8.65 | $8.77 |
Net investment income
| 0.11 | 0.11 1 | 0.14 | 0.19 | 0.20 | 0.15 |
Net realized and unrealized gains (losses) on investments
| (0.11) | (0.54) | 0.02 | 0.24 | 0.19 | (0.12) |
Total from investment operations
| 0.00 | (0.43) | 0.16 | 0.43 | 0.39 | 0.03 |
| Distributions to shareholders from | | | | | | |
Net investment income
| (0.11) | (0.11) | (0.13) | (0.18) | (0.20) | (0.15) |
Net realized gains
| 0.00 | (0.07) | (0.10) | 0.00 | 0.00 | 0.00 |
Total distributions to shareholders
| (0.11) | (0.18) | (0.23) | (0.18) | (0.20) | (0.15) |
Net asset value, end of period
| $8.30 | $8.41 | $9.02 | $9.09 | $8.84 | $8.65 |
Total return2
| 0.05% | (4.83)% | 1.76% | 4.96% | 4.60% | 0.31% |
| Ratios to average net assets (annualized) | | | | | | |
Gross expenses
| 0.81% | 0.81% | 0.81% | 0.82% | 0.82% | 0.82% |
Net expenses
| 0.72% | 0.70% | 0.70% | 0.71% | 0.72% | 0.72% |
Net investment income
| 2.70% | 1.30% | 1.48% | 2.10% | 2.33% | 1.68% |
| Supplemental data | | | | | | |
Portfolio turnover rate
| 44% | 65% | 65% | 88% | 43% | 43% |
Net assets, end of period (000s omitted)
| $137,048 | $141,782 | $175,111 | $170,975 | $170,345 | $182,179 |
| 1 | Calculated based upon average shares outstanding |
| 2 | Total return calculations do not include any sales charges. Returns for periods of less than one year are not annualized. |
The accompanying notes are an integral part of these financial statements.
Allspring Short-Term Bond Plus Fund | 27
Financial highlights
(For a share outstanding throughout each period)
| | | Year ended August 31 |
| Class C | Six months ended
February 28, 2023
(unaudited) | 2022 | 2021 | 2020 | 2019 | 2018 |
Net asset value, beginning of period
| $8.40 | $9.01 | $9.07 | $8.83 | $8.64 | $8.76 |
Net investment income
| 0.08 1 | 0.05 | 0.06 | 0.12 | 0.14 | 0.08 |
Net realized and unrealized gains (losses) on investments
| (0.12) | (0.55) | 0.04 | 0.24 | 0.19 | (0.12) |
Total from investment operations
| (0.04) | (0.50) | 0.10 | 0.36 | 0.33 | (0.04) |
| Distributions to shareholders from | | | | | | |
Net investment income
| (0.08) | (0.04) | (0.06) | (0.12) | (0.14) | (0.08) |
Net realized gains
| 0.00 | (0.07) | (0.10) | 0.00 | 0.00 | 0.00 |
Total distributions to shareholders
| (0.08) | (0.11) | (0.16) | (0.12) | (0.14) | (0.08) |
Net asset value, end of period
| $8.28 | $8.40 | $9.01 | $9.07 | $8.83 | $8.64 |
Total return2
| (0.46)% | (5.57)% | 1.10% | 4.10% | 3.82% | (0.44)% |
| Ratios to average net assets (annualized) | | | | | | |
Gross expenses
| 1.55% | 1.55% | 1.56% | 1.56% | 1.57% | 1.57% |
Net expenses
| 1.47% | 1.47% | 1.47% | 1.47% | 1.47% | 1.47% |
Net investment income
| 1.92% | 0.53% | 0.71% | 1.36% | 1.57% | 0.93% |
| Supplemental data | | | | | | |
Portfolio turnover rate
| 44% | 65% | 65% | 88% | 43% | 43% |
Net assets, end of period (000s omitted)
| $3,397 | $4,225 | $5,286 | $5,773 | $7,146 | $8,588 |
| 1 | Calculated based upon average shares outstanding |
| 2 | Total return calculations do not include any sales charges. Returns for periods of less than one year are not annualized. |
The accompanying notes are an integral part of these financial statements.
28 | Allspring Short-Term Bond Plus Fund
Financial highlights
(For a share outstanding throughout each period)
| | | Year ended August 31 |
| Class R6 | Six months ended
February 28, 2023
(unaudited) | 2022 | 2021 | 2020 | 2019 | 2018 1 |
Net asset value, beginning of period
| $8.40 | $9.02 | $9.08 | $8.83 | $8.66 | $8.64 |
Net investment income
| 0.14 | 0.14 2 | 0.16 | 0.21 | 0.23 | 0.02 2 |
Net realized and unrealized gains (losses) on investments
| (0.12) | (0.56) | 0.03 | 0.25 | 0.17 | 0.02 |
Total from investment operations
| 0.02 | (0.42) | 0.19 | 0.46 | 0.40 | 0.04 |
| Distributions to shareholders from | | | | | | |
Net investment income
| (0.13) | (0.13) | (0.15) | (0.21) | (0.23) | (0.02) |
Net realized gains
| 0.00 | (0.07) | (0.10) | 0.00 | 0.00 | 0.00 |
Total distributions to shareholders
| (0.13) | (0.20) | (0.25) | (0.21) | (0.23) | (0.02) |
Net asset value, end of period
| $8.29 | $8.40 | $9.02 | $9.08 | $8.83 | $8.66 |
Total return3
| 0.21% | (4.65)% | 2.18% | 5.28% | 4.69% | 0.42% |
| Ratios to average net assets (annualized) | | | | | | |
Gross expenses
| 0.43% | 0.43% | 0.43% | 0.44% | 0.44% | 0.44% |
Net expenses
| 0.40% | 0.40% | 0.40% | 0.40% | 0.40% | 0.40% |
Net investment income
| 2.99% | 1.55% | 1.79% | 2.41% | 2.71% | 2.24% |
| Supplemental data | | | | | | |
Portfolio turnover rate
| 44% | 65% | 65% | 88% | 43% | 43% |
Net assets, end of period (000s omitted)
| $13,915 | $16,575 | $32,131 | $35,301 | $30,585 | $2,553 |
| 1 | For the period from July 31, 2018 (commencement of class operations) to August 31, 2018 |
| 2 | Calculated based upon average shares outstanding |
| 3 | Returns for periods of less than one year are not annualized. |
The accompanying notes are an integral part of these financial statements.
Allspring Short-Term Bond Plus Fund | 29
Financial highlights
(For a share outstanding throughout each period)
| | | Year ended August 31 |
| Institutional Class | Six months ended
February 28, 2023
(unaudited) | 2022 | 2021 | 2020 | 2019 | 2018 |
Net asset value, beginning of period
| $8.41 | $9.03 | $9.09 | $8.84 | $8.65 | $8.78 |
Net investment income
| 0.12 | 0.13 | 0.15 | 0.21 | 0.23 | 0.17 |
Net realized and unrealized gains (losses) on investments
| (0.11) | (0.55) | 0.04 | 0.24 | 0.19 | (0.13) |
Total from investment operations
| 0.01 | (0.42) | 0.19 | 0.45 | 0.42 | 0.04 |
| Distributions to shareholders from | | | | | | |
Net investment income
| (0.12) | (0.13) | (0.15) | (0.20) | (0.23) | (0.17) |
Net realized gains
| 0.00 | (0.07) | (0.10) | 0.00 | 0.00 | 0.00 |
Total distributions to shareholders
| (0.12) | (0.20) | (0.25) | (0.20) | (0.23) | (0.17) |
Net asset value, end of period
| $8.30 | $8.41 | $9.03 | $9.09 | $8.84 | $8.65 |
Total return1
| 0.18% | (4.69)% | 2.13% | 5.23% | 4.88% | 0.46% |
| Ratios to average net assets (annualized) | | | | | | |
Gross expenses
| 0.47% | 0.48% | 0.48% | 0.49% | 0.49% | 0.49% |
Net expenses
| 0.45% | 0.45% | 0.45% | 0.45% | 0.45% | 0.46% |
Net investment income
| 2.97% | 1.57% | 1.69% | 2.37% | 2.60% | 1.95% |
| Supplemental data | | | | | | |
Portfolio turnover rate
| 44% | 65% | 65% | 88% | 43% | 43% |
Net assets, end of period (000s omitted)
| $503,856 | $446,610 | $406,333 | $251,480 | $226,517 | $226,655 |
| 1 | Returns for periods of less than one year are not annualized. |
The accompanying notes are an integral part of these financial statements.
30 | Allspring Short-Term Bond Plus Fund
Notes to financial statements (unaudited)
1. ORGANIZATION
Allspring Funds Trust (the "Trust"), a Delaware statutory trust organized on March 10, 1999, is an open-end management investment company registered under the Investment Company Act of 1940, as amended (the "1940 Act"). As an investment company, the Trust follows the accounting and reporting guidance in Financial Accounting Standards Board ("FASB") Accounting Standards Codification Topic 946, Financial Services – Investment Companies. These financial statements report on the Allspring Short-Term Bond Plus Fund (the "Fund") which is a diversified series of the Trust.
2. SIGNIFICANT ACCOUNTING POLICIES
The following significant accounting policies, which are consistently followed in the preparation of the financial statements of the Fund, are in conformity with U.S. generally accepted accounting principles which require management to make estimates and assumptions that affect the reported amounts of assets and liabilities, disclosure of contingent assets and liabilities at the date of the financial statements, and the reported amounts of income and expenses during the reporting period. Actual results could differ from those estimates.
Securities valuation
All investments are valued each business day as of the close of regular trading on the New York Stock Exchange (generally 4 p.m. Eastern Time), although the Fund may deviate from this calculation time under unusual or unexpected circumstances.
Debt securities are valued at the evaluated bid price provided by an independent pricing service (e.g. taking into account various factors, including yields, maturities, or credit ratings) or, if a reliable price is not available, the quoted bid price from an independent broker-dealer.
Equity securities and futures contracts that are listed on a foreign or domestic exchange or market are valued at the official closing price or, if none, the last sales price.
The values of securities denominated in foreign currencies are translated into U.S. dollars at rates provided by an independent foreign currency pricing source at a time each business day specified by the Valuation Committee established by Allspring Funds Management, LLC ("Allspring Funds Management").
Forward foreign currency contracts are recorded at the forward rate provided by an independent foreign currency pricing source at a time each business day specified by the Valuation Committee.
Swap contracts are valued at the evaluated price provided by an independent pricing service or, if a reliable price is not available, the quoted bid price from an independent broker-dealer.
Investments in registered open-end investment companies (other than those listed on a foreign or domestic exchange or market) are valued at net asset value. Interests in non-registered investment companies that are redeemable at net asset value are fair valued normally at net asset value.
Investments which are not valued using the methods discussed above are valued at their fair value, as determined in good faith by Allspring Funds Management, which was named the valuation designee by the Board of Trustees. As the valuation designee, Allspring Funds Management is responsible for day-to-day valuation activities for the Allspring Funds. In connection with these responsibilities, Allspring Funds Management has established a Valuation Committee and has delegated to it the authority to take any actions regarding the valuation of portfolio securities that the Valuation Committee deems necessary or appropriate, including determining the fair value of portfolio securities. On a quarterly basis, the Board of Trustees receives reports of valuation actions taken by the Valuation Committee. On at least an annual basis, the Board of Trustees receives an assessment of the adequacy and effectiveness of Allspring Funds Management's process for determining the fair value of the portfolio of investments.
Foreign currency translation
The accounting records of the Fund are maintained in U.S. dollars. The values of other assets and liabilities denominated in foreign currencies are translated into U.S. dollars at rates provided by an independent foreign currency pricing source at a time each business day specified by the Valuation Committee. Purchases and sales of securities, and income and expenses are converted at the rate of exchange on the respective dates of such transactions. Net realized foreign exchange gains or losses arise from sales of foreign currencies, currency gains or losses realized between the trade and settlement dates on securities transactions, and the difference between the amounts of dividends, interest and foreign withholding taxes recorded and the U.S. dollar equivalent of the amounts actually paid or received. Net unrealized foreign exchange gains and losses arise from changes in the fair value of assets and liabilities other than investments in securities resulting from changes in exchange rates.
Allspring Short-Term Bond Plus Fund | 31
Notes to financial statements (unaudited)
The changes in net assets arising from changes in exchange rates of securities and the changes in net assets resulting from changes in market prices of securities are not separately presented. Such changes are included in net realized and unrealized gains or losses from investments.
Securities lending
The Fund may lend its securities from time to time in order to earn additional income in the form of fees or interest on securities received as collateral or the investment of any cash received as collateral. When securities are on loan, the Fund receives interest or dividends on those securities. Cash collateral received in connection with its securities lending transactions is invested in Securities Lending Cash Investments, LLC (the "Securities Lending Fund"), an affiliated non-registered investment company. Investments in Securities Lending Fund are valued at the evaluated bid price provided by an independent pricing service. Income earned from investment in the Securities Lending Fund (net of fees and rebates), if any, is included in income from affiliated securities on the Statement of Operations.
In a securities lending transaction, the net asset value of the Fund is affected by an increase or decrease in the value of the securities loaned and by an increase or decrease in the value of the instrument in which collateral is invested. The amount of securities lending activity undertaken by the Fund fluctuates from time to time. The Fund has the right under the lending agreement to recover the securities from the borrower on demand. In the event of default or bankruptcy by the borrower, the Fund may be prevented from recovering the loaned securities or gaining access to the collateral or may experience delays or costs in doing so. In such an event, the terms of the agreement allow the unaffiliated securities lending agent to use the collateral to purchase replacement securities on behalf of the Fund or pay the Fund the market value of the loaned securities. The Fund bears the risk of loss with respect to depreciation of its investment of the cash collateral.
When-issued transactions
The Fund may purchase securities on a forward commitment or when-issued basis. The Fund records a when-issued transaction on the trade date and will segregate assets in an amount at least equal in value to the Fund's commitment to purchase when-issued securities. Securities purchased on a when-issued basis are marked-to-market daily and the Fund begins earning interest on the settlement date. Losses may arise due to changes in the market value of the underlying securities or if the counterparty does not perform under the contract.
Loans
The Fund may invest in direct debt instruments which are interests in amounts owed to lenders by corporate or other borrowers. The loans pay interest at rates which are periodically reset by reference to a base lending rate plus a spread. Investments in loans may be in the form of participations in loans or assignments of all or a portion of loans from third parties. When the Fund purchases participations, it generally has no rights to enforce compliance with the terms of the loan agreement with the borrower. As a result, the Fund assumes the credit risk of both the borrower and the lender that is selling the participation. When the Fund purchases assignments from lenders, it acquires direct rights against the borrower on the loan and may enforce compliance by the borrower with the terms of the loan agreement. Loans may include fully funded term loans or unfunded loan commitments, which are contractual obligations for future funding.
Forward foreign currency contracts
A forward foreign currency contract is an agreement between two parties to purchase or sell a specific currency for an agreed-upon price at a future date. The Fund enters into forward foreign currency contracts to facilitate transactions in foreign-denominated securities and to attempt to minimize the risk to the Fund from adverse changes in the relationship between currencies. Forward foreign currency contracts are recorded at the forward rate and marked-to-market daily. When the contracts are closed, realized gains and losses arising from such transactions are recorded as realized gains or losses on forward foreign currency contracts. The Fund is subject to foreign currency risk and may be exposed to risks if the counterparties to the contracts are unable to meet the terms of their contracts or if the value of the foreign currency changes unfavorably. The Fund's maximum risk of loss from counterparty credit risk is the unrealized gains on the contracts. This risk may be mitigated if there is a master netting arrangement between the Fund and the counterparty.
Futures contracts
Futures contracts are agreements between the Fund and a counterparty to buy or sell a specific amount of a commodity, financial instrument or currency at a specified price on a specified date. The Fund may buy and sell futures contracts in order to gain exposure to, or protect against, changes in interest rates and is subject to interest rate risk. The primary risks associated with the use of futures contracts are the imperfect correlation between changes in market values of securities held by the Fund and the prices of futures contracts, and the possibility of an illiquid market. Futures contracts are generally entered into on a regulated futures exchange and cleared through a clearinghouse associated with the exchange. With futures contracts, there is
32 | Allspring Short-Term Bond Plus Fund
Notes to financial statements (unaudited)
minimal counterparty risk to the Fund since futures contracts are exchange-traded and the exchange’s clearinghouse, as the counterparty to all exchange-traded futures, guarantees the futures contracts against default.
Upon entering into a futures contract, the Fund is required to deposit either cash or securities (initial margin) with the broker in an amount equal to a certain percentage of the contract value. Subsequent payments (variation margin) are paid to or from the broker each day equal to the daily changes in the contract value. Such payments are recorded as unrealized gains or losses and, if any, shown as variation margin receivable (payable) in the Statement of Assets and Liabilities. Should the Fund fail to make requested variation margin payments, the broker can gain access to the initial margin to satisfy the Fund’s payment obligations. When the contracts are closed, a realized gain or loss is recorded in the Statement of Operations.
Swap contracts
Swap contracts are agreements between the Fund and a counterparty to exchange a series of cash flows over a specified period. Swap agreements are privately negotiated contracts between the Fund that are entered into as bilateral contracts in the over-the-counter market or centrally cleared (“centrally cleared swaps”) with a central clearinghouse.
The Fund entered into centrally cleared swaps. In a centrally cleared swap, immediately following execution of the swap contract, the swap contract is novated to a central counterparty (the “CCP”) and the counterparty on the swap agreement becomes the CCP. Upon entering into a centrally cleared swap, the Fund is required to deposit an initial margin with the broker in the form of cash or securities. Securities deposited as initial margin are designated in the Portfolio of Investments and cash deposited is shown as cash segregated for centrally cleared swaps in the Statement of Assets and Liabilities. Pursuant to the contract, the Fund agrees to receive from or pay to the broker an amount of cash equal to the daily fluctuation in market value of the contract (“variation margin”). The variation margin is recorded as an unrealized gain (or loss) and shown as daily variation margin receivable (or payable) on centrally cleared swaps in the Statement of Assets and Liabilities. Payments received from (paid to) the counterparty are recorded as realized gains (losses) in the Statement of Operations when the contract is closed.
Credit default swaps
The Fund may enter into credit default swaps for hedging or speculative purposes to provide or receive a measure of protection against default on a referenced entity, obligation or index or a basket of single-name issuers or traded indexes. An index credit default swap references all the names in the index, and if a credit event is triggered, the credit event is settled based on that name’s weight in the index. Credit default swaps are agreements in which the protection buyer pays fixed periodic payments to the protection seller in consideration for a promise from the protection seller to make a specific payment should a negative credit event take place with respect to the referenced entity (e.g., bankruptcy, failure to pay, obligation acceleration, repudiation, moratorium or restructuring).
The Fund may enter into credit default swaps as either the seller of protection or the buyer of protection. If the Fund is the buyer of protection and a credit event occurs, the Fund will either receive from the seller an amount equal to the notional amount of the swap and deliver the referenced security or underlying securities comprising the index, or receive a net settlement of cash equal to the notional amount of the swap less the recovery value of the security or underlying securities comprising the index. If the Fund is the seller of protection and a credit event occurs, the Fund will either pay the buyer an amount equal to the notional amount of the swap and take delivery of the referenced security or underlying securities comprising the index or pay a net settlement of cash equal to the notional amount of the swap less the recovery value of the security or underlying securities comprising the index.
As the seller of protection, the Fund is subject to investment exposure on the notional amount of the swap and has assumed the risk of default of the underlying security or index. As the buyer of protection, the Fund could be exposed to risks if the seller of the protection defaults on its obligation to perform, or if there are unfavorable changes in the fluctuation of interest rates.
By entering into credit default swap contracts, the Fund is exposed to credit risk. In addition, certain credit default swap contracts entered into by the Fund provide for conditions that result in events of default or termination that enable the counterparty to the agreement to cause an early termination of the transactions under those agreements.
Mortgage dollar roll transactions
The Fund may engage in mortgage dollar roll transactions through TBA mortgage-backed securities issued by Government National Mortgage Association (GNMA), Federal National Mortgage Association (FNMA) and Federal Home Loan Mortgage Corporation (FHLMC). In a mortgage dollar roll transaction, the Fund sells a mortgage-backed security to a financial institution, such as a bank or broker-dealer and simultaneously agrees to repurchase a substantially similar security from the institution at a later date at an agreed upon price. The mortgage-backed securities that are repurchased will bear the same interest rate as those sold, but generally will be collateralized by different pools of mortgages with different pre-payment histories. During the roll period, the Fund foregoes principal and interest paid on the securities. The Fund is compensated by the difference between
Allspring Short-Term Bond Plus Fund | 33
Notes to financial statements (unaudited)
the current sales price and the forward price for the future purchase as well as by the earnings on the cash proceeds of the initial sale. Mortgage dollar rolls may be renewed without physical delivery of the securities subject to the contract. The Fund accounts for TBA dollar roll transactions as purchases and sales which, as a result, may increase its portfolio turnover rate.
Security transactions and income recognition
Securities transactions are recorded on a trade date basis. Realized gains or losses are recorded on the basis of identified cost.
Interest income is accrued daily and bond discounts are accreted and premiums are amortized daily. To the extent debt obligations are placed on non-accrual status, any related interest income may be reduced by writing off interest receivables when the collection of all or a portion of interest has been determined to be doubtful based on consistently applied procedures and the fair value has decreased. If the issuer subsequently resumes interest payments or when the collectability of interest is reasonably assured, the debt obligation is removed from non-accrual status. Paydown gains and losses are included in interest income.
Income dividends and capital gain distributions from investment companies are recorded on the ex-dividend date. Capital gain distributions from investment companies are treated as realized gains.
Distributions to shareholders
Distributions to shareholders are recorded on the ex-dividend date and paid from net investment income monthly and any net realized gains are paid at least annually. Such distributions are determined in accordance with income tax regulations and may differ from U.S. generally accepted accounting principles. Dividend sources are estimated at the time of declaration. The tax character of distributions is determined as of the Fund's fiscal year end. Therefore, a portion of the Fund's distributions made prior to the Fund’s fiscal year end may be categorized as a tax return of capital at year end.
Federal and other taxes
The Fund intends to continue to qualify as a regulated investment company by distributing substantially all of its investment company taxable income and any net realized capital gains (after reduction for capital loss carryforwards) sufficient to relieve it from all, or substantially all, federal income taxes. Accordingly, no provision for federal income taxes was required.
The Fund’s income and federal excise tax returns and all financial records supporting those returns for the prior three fiscal years are subject to examination by the federal and Delaware revenue authorities. Management has analyzed the Fund's tax positions taken on federal, state, and foreign tax returns, as applicable, for all open tax years and does not believe that there are any uncertain tax positions that require recognition of a tax liability.
As of February 28, 2023, the aggregate cost of all investments for federal income tax purposes was $689,206,892 and the unrealized gains (losses) consisted of:
| Gross unrealized gains | $ 3,999,335 |
| Gross unrealized losses | (28,318,245) |
| Net unrealized losses | $(24,318,910) |
Class allocations
The separate classes of shares offered by the Fund differ principally in applicable sales charges, distribution, shareholder servicing, and administration fees. Class specific expenses are charged directly to that share class. Investment income, common fund-level expenses, and realized and unrealized gains (losses) on investments are allocated daily to each class of shares based on the relative proportion of net assets of each class.
34 | Allspring Short-Term Bond Plus Fund
Notes to financial statements (unaudited)
3. FAIR VALUATION MEASUREMENTS
Fair value measurements of investments are determined within a framework that has established a fair value hierarchy based upon the various data inputs utilized in determining the value of the Fund’s investments. The three-level hierarchy gives the highest priority to unadjusted quoted prices in active markets for identical assets or liabilities (Level 1) and the lowest priority to unobservable inputs (Level 3). The Fund’s investments are classified within the fair value hierarchy based on the lowest level of input that is significant to the fair value measurement. The inputs are summarized into three broad levels as follows:
| ■ | Level 1 – quoted prices in active markets for identical securities |
| ■ | Level 2 – other significant observable inputs (including quoted prices for similar securities, interest rates, prepayment speeds, credit risk, etc.) |
| ■ | Level 3 – significant unobservable inputs (including the Fund’s own assumptions in determining the fair value of investments) |
The inputs or methodologies used for valuing investments in securities are not necessarily an indication of the risk associated with investing in those securities.
The following is a summary of the inputs used in valuing the Fund’s assets and liabilities as of February 28, 2023:
| | Quoted prices
(Level 1) | Other significant
observable inputs
(Level 2) | Significant
unobservable inputs
(Level 3) | Total |
| Assets | | | | |
| Investments in: | | | | |
| Agency securities | $ 0 | $ 3,842,541 | $0 | $ 3,842,541 |
| Asset-backed securities | 0 | 59,590,396 | 0 | 59,590,396 |
| Corporate bonds and notes | 0 | 137,157,364 | 0 | 137,157,364 |
| Foreign corporate bonds and notes | 0 | 7,218,387 | 0 | 7,218,387 |
| Foreign government bonds | 0 | 24,522,414 | 0 | 24,522,414 |
| Loans | 0 | 3,843,760 | 0 | 3,843,760 |
| Municipal obligations | 0 | 2,856,298 | 0 | 2,856,298 |
| Non-agency mortgage-backed securities | 0 | 128,650,236 | 0 | 128,650,236 |
| U.S. Treasury securities | 182,908,565 | 0 | 0 | 182,908,565 |
| Yankee corporate bonds and notes | 0 | 86,591,187 | 0 | 86,591,187 |
| Short-term investments | | | | |
| Investment companies | 27,672,389 | 0 | 0 | 27,672,389 |
| | 210,580,954 | 454,272,583 | 0 | 664,853,537 |
| Forward foreign currency contracts | 0 | 464,919 | 0 | 464,919 |
| Futures contracts | 320,355 | 0 | 0 | 320,355 |
| Total assets | $210,901,309 | $454,737,502 | $0 | $665,638,811 |
| Liabilities | | | | |
| Forward foreign currency contracts | $ 0 | $ 162,821 | $0 | $ 162,821 |
| Futures contracts | 588,008 | 0 | 0 | 588,008 |
| Total liabilities | $ 588,008 | $ 162,821 | $0 | $ 750,829 |
Futures contracts and forward foreign currency contracts are reported at their cumulative unrealized gains (losses) at measurement date as reported in the tables following the Portfolio of Investments. For futures contracts, the current day’s variation margin is reported on the Statement of Assets and Liabilities. All other assets and liabilities are reported at their market value at measurement date.
Additional sector, industry or geographic detail, if any, is included in the Portfolio of Investments.
For the six months ended February 28, 2023, the Fund did not have any transfers into/out of Level 3.
Allspring Short-Term Bond Plus Fund | 35
Notes to financial statements (unaudited)
4. TRANSACTIONS WITH AFFILIATES
Management fee
Allspring Funds Management, a wholly owned subsidiary of Allspring Global Investments Holdings, LLC, a holding company indirectly owned by certain private funds of GTCR LLC and Reverence Capital Partners, L.P., is the manager of the Fund and provides advisory and fund-level administrative services under an investment management agreement. Under the investment management agreement, Allspring Funds Management is responsible for, among other services, implementing the investment objectives and strategies of the Fund, supervising the subadviser and providing fund-level administrative services in connection with the Fund’s operations. As compensation for its services under the investment management agreement, Allspring Funds Management is entitled to receive a management fee at the following annual rate based on the Fund’s average daily net assets:
| Average daily net assets | Management fee |
| First $1 billion | 0.350% |
| Next $4 billion | 0.325 |
| Next $3 billion | 0.290 |
| Next $2 billion | 0.265 |
| Over $10 billion | 0.255 |
For the six months ended February 28, 2023, the management fee was equivalent to an annual rate of 0.35% of the Fund’s average daily net assets.
Allspring Funds Management has retained the services of a subadviser to provide daily portfolio management to the Fund. The fee for subadvisory services is borne by Allspring Funds Management. Allspring Global Investments, LLC ("Allspring Investments"), an affiliate of Allspring Funds Management and a wholly owned subsidiary of Allspring Global Investments Holdings, LLC, is the subadviser to the Fund and is entitled to receive a fee from Allspring Funds Management at an annual rate starting at 0.15% and declining to 0.05% as the average daily net assets of the Fund increase.
Administration fees
Under a class-level administration agreement, Allspring Funds Management provides class-level administrative services to the Fund, which includes paying fees and expenses for services provided by the transfer agent, sub-transfer agents, omnibus account servicers and record-keepers. As compensation for its services under the class-level administration agreement, Allspring Funds Management receives an annual fee which is calculated based on the average daily net assets of each class as follows:
| | Class-level
administration fee |
| Class A | 0.16% |
| Class C | 0.16 |
| Class R6 | 0.03 |
| Institutional Class | 0.08 |
Waivers and/or expense reimbursements
Allspring Funds Management has contractually committed to waive and/or reimburse management and administration fees to the extent necessary to maintain certain net operating expense ratios for the Fund. When each class of the Fund has exceeded its expense cap, Allspring Funds Management will waive fees and/or reimburse expenses from fund-level expenses on a proportionate basis and then from class specific expenses. When only certain classes exceed their expense caps, waivers and/or reimbursements are applied against class specific expenses before fund-level expenses. Allspring Funds Management has contractually committed through December 31, 2023 to waive fees and/or reimburse expenses to the extent necessary to cap expenses. Prior to or after the commitment expiration date, the caps may be increased or the commitment to maintain the caps may be terminated only with the approval of the Board of Trustees. As of February 28, 2023, the contractual expense caps are as follows:
36 | Allspring Short-Term Bond Plus Fund
Notes to financial statements (unaudited)
| | Expense ratio caps |
| Class A | 0.72% |
| Class C | 1.47 |
| Class R6 | 0.40 |
| Institutional Class | 0.45 |
Distribution fee
The Trust has adopted a distribution plan for Class C shares pursuant to Rule 12b-1 under the 1940 Act. A distribution fee is charged to Class C shares and paid to Allspring Funds Distributor, LLC ("Allspring Funds Distributor"), the principal underwriter, an affiliate of Allspring Funds Management, at an annual rate up to 0.75% of the average daily net assets of Class C shares.
In addition, Allspring Funds Distributor is entitled to receive the front-end sales charge from the purchase of Class A shares and a contingent deferred sales charge on the redemption of certain Class A shares. Allspring Funds Distributor is also entitled to receive the contingent deferred sales charges from redemptions of Class C shares. For the six months ended February 28, 2023, Allspring Funds Distributor received $201 from the sale of Class A shares. No contingent deferred sales charges were incurred by Class A and Class C shares for the six months ended February 28, 2023.
Shareholder servicing fees
The Trust has entered into contracts with one or more shareholder servicing agents, whereby Class A and Class C are charged a fee at an annual rate up to 0.25% of the average daily net assets of each respective class. A portion of these total shareholder servicing fees were paid to affiliates of the Fund.
Interfund transactions
The Fund may purchase or sell portfolio investment securities to certain affiliates pursuant to Rule 17a-7 under the 1940 Act and under procedures adopted by the Board of Trustees. The procedures have been designed to ensure that these interfund transactions, which do not incur broker commissions, are effected at current market prices.
5. INVESTMENT PORTFOLIO TRANSACTIONS
Purchases and sales of investments, excluding short-term securities, for the six months ended February 28, 2023 were as follows:
| Purchases at cost | | Sales proceeds |
U.S.
government | Non-U.S.
government | | U.S.
government | Non-U.S.
government |
| $187,255,714 | $176,212,503 | | $115,783,193 | $138,387,790 |
6. SECURITIES LENDING TRANSACTIONS
The Fund lends its securities through an unaffiliated securities lending agent and receives collateral in the form of cash or securities with a value at least equal to the value of the securities on loan. The value of the loaned securities is determined at the close of each business day and any increases or decreases in the required collateral are exchanged between the Fund and the counterparty on the next business day. Cash collateral received is invested in the Securities Lending Fund which seeks to provide a positive return compared to the daily Federal Funds Open Rate by investing in high-quality, U.S. dollar-denominated short-term money market instruments and is exempt from registration under Section 3(c)(7) of the 1940 Act. Securities Lending Fund is managed by Allspring Funds Management and is subadvised by Allspring Investments. Allspring Funds Management receives an advisory fee starting at 0.05% and declining to 0.01% as the average daily net assets of the Securities Lending Fund increase. All of the fees received by Allspring Funds Management are paid to Allspring Investments for its services as subadviser.
In the event of counterparty default or the failure of a borrower to return a loaned security, the Fund has the right to use the collateral to offset any losses incurred. As of February 28, 2023, the Fund had securities lending transactions with the following counterparties which are subject to offset:
Allspring Short-Term Bond Plus Fund | 37
Notes to financial statements (unaudited)
| Counterparty | Value of
securities on
loan | Collateral
received1 | Net amount |
| Jefferies LLC | $101,911 | $(101,911) | $0 |
1 Collateral disclosed within this table is limited to the net transaction with the counterparty.
7. DERIVATIVE TRANSACTIONS
During the six months ended February 28, 2023, the Fund entered into futures contracts to speculate on interest rates and to help manage the duration of the portfolio. The Fund also entered into forward foreign currency contracts .
The volume of the Fund's derivative activity during the six months ended February 28, 2023 was as follows:
| Futures contracts | |
| Average notional balance on long futures | $211,680,327 |
| Average notional balance on short futures | 42,573,229 |
| Forward foreign currency contracts | |
| Average contract amounts to buy | $ 2,544,459 |
| Average contract amounts to sell | 16,008,125 |
The fair value of derivative instruments as of February 28, 2023 by primary risk type was as follows for the Fund:
| | Asset derivatives | | Liability derivatives |
| | Statement of Assets and Liabilities location | Fair value | | Statement of Assets and Liabilities location | Fair value |
| Interest rate risk | Unrealized gains on futures contracts | $ 320,355* | | Unrealized losses on futures contracts | $ 588,008* |
| Foreign currency risk | Unrealized gains on forward foreign currency contracts | 464,919 | | Unrealized losses on forward foreign currency contracts | 162,821 |
| | | $785,274 | | | $750,829 |
| * | Amount represents cumulative unrealized gains (losses) on futures contracts as reported in the table following the Portfolio of Investments. For futures contracts, only the current day’s variation margin as of February 28, 2023 is reported separately on the Statement of Assets and Liabilities. |
The effect of derivative instruments on the Statement of Operations for the six months ended February 28, 2023 was as follows:
| | Net realized gains (losses) on derivatives |
| | Forward
foreign
currency
contracts | Futures
contracts | Total |
| Interest rate risk | $ 0 | $ (2,976,719) | $ (2,976,719) |
| Foreign currency risk | (74,660) | 0 | (74,660) |
| | $(74,660) | $(2,976,719) | $(3,051,379) |
| | Net change in unrealized gains (losses) on derivatives |
| | Forward
foreign
currency
contracts | Futures
contracts | Total |
| Interest rate risk | $ 0 | $ (47,671) | $ (47,671) |
| Foreign currency risk | (527,968) | 0 | (527,968) |
| | $(527,968) | $(47,671) | $(575,639) |
38 | Allspring Short-Term Bond Plus Fund
Notes to financial statements (unaudited)
For certain types of derivative transactions, the Fund has entered into International Swaps and Derivatives Association, Inc. master agreements (“ISDA Master Agreements”) or similar agreements with approved counterparties. The ISDA Master Agreements or similar agreements may have requirements to deliver/deposit securities or cash to/with an exchange or broker-dealer as collateral and allows the Fund to offset, with each counterparty, certain derivative financial instrument’s assets and/or liabilities with collateral held or pledged. Collateral requirements differ by type of derivative. Collateral or margin requirements are set by the broker or exchange clearinghouse for exchange traded derivatives while collateral terms are contract specific for over-the-counter traded derivatives. Cash collateral that has been pledged to cover obligations of the Fund under ISDA Master Agreements or similar agreements, if any, are reported separately in the Statement of Assets and Liabilities. Securities pledged as collateral, if any, are noted in the Portfolio of Investments. With respect to balance sheet offsetting, absent an event of default by the counterparty or a termination of the agreement, the reported amounts of financial assets and financial liabilities in the Statement of Assets and Liabilities are not offset across transactions between the Fund and the applicable counterparty. A reconciliation of the gross amounts on the Statement of Assets and Liabilities to the net amounts by counterparty, including any collateral exposure, for OTC derivatives is as follows:
| Counterparty | Gross amounts
of assets in the
Statement of
Assets and
Liabilities | Amounts
subject to
netting
agreements | Collateral
received | Net amount
of assets |
| Morgan Stanley | $464,919 | $(162,821) | $0 | $302,098 |
| Counterparty | Gross amounts
of liabilities in the
Statement of
Assets and
Liabilities | Amounts
subject to
netting
agreements | Collateral
pledged | Net amount
of liabilities |
| Morgan Stanley | $162,821 | $(162,821) | $0 | $0 |
8. BANK BORROWINGS
The Trust (excluding the money market funds), Allspring Master Trust and Allspring Variable Trust are parties to a $350,000,000 revolving credit agreement whereby the Fund is permitted to use bank borrowings for temporary or emergency purposes, such as to fund shareholder redemption requests. Interest under the credit agreement is charged to the Fund based on a borrowing rate equal to the higher of the Federal Funds rate or the overnight bank funding rate in effect on that day plus a spread. In addition, an annual commitment fee equal based on the unused balance is allocated to each participating fund.
For the six months ended February 28, 2023, there were no borrowings by the Fund under the agreement.
9. MARKET RISKS
On March 11, 2020, the World Health Organization announced that it had made the assessment that coronavirus disease 2019 (“COVID-19”) is a pandemic. The impacts of COVID-19 are affecting the entire global economy, individual companies and investment products, the funds, and the market in general. There is significant uncertainty around the extent and duration of business disruptions related to COVID-19 and the impacts may last for an extended period of time. COVID-19 has led to significant uncertainty and volatility in the financial markets.
10. INDEMNIFICATION
Under the Fund's organizational documents, the officers and Trustees have been granted certain indemnification rights against certain liabilities that may arise out of performance of their duties to the Fund. The Fund has entered into a separate agreement with each Trustee that converts indemnification rights currently existing under the Fund’s organizational documents into contractual rights that cannot be changed in the future without the consent of the Trustee. Additionally, in the normal course of business, the Fund may enter into contracts with service providers that contain a variety of indemnification clauses. The Fund’s maximum exposure under these arrangements is dependent on future claims that may be made against the Fund and, therefore, cannot be estimated.
Allspring Short-Term Bond Plus Fund | 39
Other information (unaudited)
PROXY VOTING INFORMATION
A description of the policies and procedures used to determine how to vote proxies relating to portfolio securities is available without charge, upon request, by calling 1-800-222-8222, visiting our website at allspringglobal.com, or visiting the SEC website at sec.gov. Information regarding how the proxies related to portfolio securities were voted during the most recent 12-month period ended June 30 is available on the website at allspringglobal.com or by visiting the SEC website at sec.gov.
QUARTERLY PORTFOLIO HOLDINGS INFORMATION
The Fund files its complete schedule of portfolio holdings with the SEC for the first and third quarters of each fiscal year as an exhibit to its reports on Form N-PORT. Shareholders may view the filed Form N-PORT by visiting the SEC website at sec.gov.
40 | Allspring Short-Term Bond Plus Fund
Other information (unaudited)
BOARD OF TRUSTEES AND OFFICERS
Each of the Trustees and Officers listed in the table below acts in identical capacities for each fund in the Allspring family of funds, which consists of 127 mutual funds comprising the Allspring Funds Trust, Allspring Variable Trust, Allspring Master Trust and four closed-end funds (collectively the “Fund Complex”). This table should be read in conjunction with the Prospectus and the Statement of Additional Information1. The mailing address of each Trustee and Officer is 1415 Vantage Park Drive, 3rd Floor, Charlotte, NC 28203. Each Trustee and Officer serves an indefinite term, however, each Trustee serves such term until reaching the mandatory retirement age established by the Trustees.
Independent Trustees
Name and
year of birth | Position held and
length of service* | Principal occupations during past five years or longer | Current other
public company or
investment
company
directorships |
William R. Ebsworth
(Born 1957) | Trustee,
since 2015 | Retired. From 1984 to 2013, equities analyst, portfolio manager, research director and chief investment officer at Fidelity Management and Research Company in Boston, Tokyo, and Hong Kong, and retired in 2013 as Chief Investment Officer of Fidelity Strategic Advisers, Inc. where he led a team of investment professionals managing client assets. Prior thereto, Board member of Hong Kong Securities Clearing Co., Hong Kong Options Clearing Corp., the Thailand International Fund, Ltd., Fidelity Investments Life Insurance Company, and Empire Fidelity Investments Life Insurance Company. Audit Committee Chair and Investment Committee Chair of the Vincent Memorial Hospital Foundation (non-profit organization). Mr. Ebsworth is a CFA® charterholder. | N/A |
Jane A. Freeman
(Born 1953) | Trustee,
since 2015;
Chair Liaison,
since 2018 | Retired. From 2012 to 2014 and 1999 to 2008, Chief Financial Officer of Scientific Learning Corporation. From 2008 to 2012, Ms. Freeman provided consulting services related to strategic business projects. Prior to 1999, Portfolio Manager at Rockefeller & Co. and Scudder, Stevens & Clark. Board member of the Harding Loevner Funds from 1996 to 2014, serving as both Lead Independent Director and chair of the Audit Committee. Board member of the Russell Exchange Traded Funds Trust from 2011 to 2012 and the chair of the Audit Committee. Ms. Freeman is also an inactive Chartered Financial Analyst. | N/A |
Isaiah Harris, Jr.
(Born 1952) | Trustee,
since 2009; Audit
Committee
Chair,
since 2019 | Retired. Member of the Advisory Board of CEF of East Central Florida. Chairman of the Board of CIGNA Corporation from 2009 to 2021, and Director from 2005 to 2008. From 2003 to 2011, Director of Deluxe Corporation. Prior thereto, President and CEO of BellSouth Advertising and Publishing Corp. from 2005 to 2007, President and CEO of BellSouth Enterprises from 2004 to 2005 and President of BellSouth Consumer Services from 2000 to 2003. Emeritus member of the Iowa State University Foundation Board of Governors. Emeritus Member of the Advisory Board of Iowa State University School of Business. Advisory Board Member, Palm Harbor Academy (private school). Advisory Board Member, Fellowship of Christian Athletes. Mr. Harris is a certified public accountant (inactive status). | N/A |
David F. Larcker
(Born 1950) | Trustee,
since 2009 | Distinguished Visiting Fellow at the Hoover Institution since 2022. James Irvin Miller Professor of Accounting at the Graduate School of Business (Emeritus), Stanford University, Director of the Corporate Governance Research Initiative and Senior Faculty of The Rock Center for Corporate Governance since 2006. From 2005 to 2008, Professor of Accounting at the Graduate School of Business, Stanford University. Prior thereto, Ernst & Young Professor of Accounting at The Wharton School, University of Pennsylvania from 1985 to 2005. | N/A |
Allspring Short-Term Bond Plus Fund | 41
Other information (unaudited)
Name and
year of birth | Position held and
length of service* | Principal occupations during past five years or longer | Current other
public company or
investment
company
directorships |
Olivia S. Mitchell
(Born 1953) | Trustee,
since 2006;
Nominating and
Governance
Committee Chair,
since 2018 | International Foundation of Employee Benefit Plans Professor since 1993, Wharton School of the University of Pennsylvania. Director of Wharton’s Pension Research Council and Boettner Center on Pensions & Retirement Research, and Research Associate at the National Bureau of Economic Research. Previously taught at Cornell University from 1978 to 1993. | N/A |
Timothy J. Penny
(Born 1951) | Trustee,
since 1996;
Chair,
since 2018 | President and Chief Executive Officer of Southern Minnesota Initiative Foundation, a non-profit organization, since 2007. Vice Chair of the Economic Club of Minnesota, since 2007. Co-Chair of the Committee for a Responsible Federal Budget, since 1995. Member of the Board of Trustees of NorthStar Education Finance, Inc., a non-profit organization, from 2007-2022. Senior Fellow of the University of Minnesota Humphrey Institute from 1995 to 2017. | N/A |
James G. Polisson
(Born 1959) | Trustee,
since 2018 | Retired. Chief Marketing Officer, Source (ETF) UK Services, Ltd, from 2015 to 2017. From 2012 to 2015, Principal of The Polisson Group, LLC, a management consulting, corporate advisory and principal investing company. Chief Executive Officer and Managing Director at Russell Investments, Global Exchange Traded Funds from 2010 to 2012. Managing Director of Barclays Global Investors from 1998 to 2010 and Global Chief Marketing Officer for iShares and Barclays Global Investors from 2000 to 2010. Trustee of the San Francisco Mechanics’ Institute, a non-profit organization, from 2013 to 2015. Board member of the Russell Exchange Traded Fund Trust from 2011 to 2012. Director of Barclays Global Investors Holdings Deutschland GmbH from 2006 to 2009. Mr. Polisson is an attorney and has a retired status with the Massachusetts and District of Columbia Bar Associations. | N/A |
Pamela Wheelock
(Born 1959) | Trustee,
since January
2020; previously
Trustee from
January 2018 to
July 2019 | Retired. Executive and Senior Financial leadership positions in the public, private and nonprofit sectors. Interim President and CEO, McKnight Foundation, 2020. Interim Commissioner, Minnesota Department of Human Services, 2019. Chief Operating Officer, Twin Cities Habitat for Humanity, 2017-2019. Vice President for University Services, University of Minnesota, 2012-2016. Interim President and CEO, Blue Cross and Blue Shield of Minnesota, 2011-2012. Executive Vice-President and Chief Financial Officer, Minnesota Wild, 2002-2008. Commissioner, Minnesota Department of Finance, 1999-2002. Chair of the Board of Directors of Destination Medical Center Corporation. Board member of the Minnesota Wild Foundation. | N/A |
* Length of service dates reflect the Trustee’s commencement of service with the Trust’s predecessor entities, where applicable.
42 | Allspring Short-Term Bond Plus Fund
Other information (unaudited)
Officers2
Name and
year of birth | Position held and
length of service | Principal occupations during past five years or longer |
Andrew Owen
(Born 1960) | President,
since 2017 | President and Chief Executive Officer of Allspring Funds Management, LLC since 2017 and Head of Global Fund Governance of Allspring Global Investments since 2022. Prior thereto, co-president of Galliard Capital Management, LLC, an affiliate of Allspring Funds Management, LLC, from 2019 to 2022 and Head of Affiliated Managers, Allspring Global Investments, from 2014 to 2019 and Executive Vice President responsible for marketing, investments and product development for Allspring Funds Management, LLC, from 2009 to 2014. |
Jeremy DePalma
(Born 1974) | Treasurer,
since 2012
(for certain funds in
the Fund Complex);
since 2021 (for
the remaining funds in the
Fund Complex) | Senior Vice President of Allspring Funds Management, LLC since 2009. Senior Vice President of Evergreen Investment Management Company, LLC from 2008 to 2010 and head of the Fund Reporting and Control Team within Fund Administration from 2005 to 2010. |
Christopher Baker
(Born 1976) | Chief Compliance Officer, since 2022 | Global Chief Compliance Officer for Allspring Global Investments since 2022. Prior thereto, Chief Compliance Officer for State Street Global Advisors from 2018 to 2021. Senior Compliance Officer for the State Street divisions of Alternative Investment Solutions, Sector Solutions, and Global Marketing from 2015 to 2018. From 2010 to 2015 Vice President, Global Head of Investment and Marketing Compliance for State Street Global Advisors. |
Matthew Prasse
(Born 1983) | Chief Legal Officer, since 2022; Secretary, since 2021 | Senior Counsel of the Allspring Legal Department since 2021. Senior Counsel of the Wells Fargo Legal Department from 2018 to 2021. Previously, Counsel for Barings LLC from 2015 to 2018. Prior to joining Barings, Associate at Morgan, Lewis & Bockius LLP from 2008 to 2015. |
1 The Statement of Additional Information includes additional information about the Trustees and is available, without charge, upon request, by calling 1-800-222-8222 or by visiting the website at allspringglobal.com.
2 For those Officers with tenures at Allspring Global Investments and/or Allspring Funds Management, LLC that began prior to 2021, such tenures include years of service during which these businesses/entities were known as Wells Fargo Asset Management and Wells Fargo Funds Management, LLC, respectively.
Allspring Short-Term Bond Plus Fund | 43
For more information
More information about Allspring Funds is available free upon request. To obtain literature, please write, visit the Fund's website, or call:
Allspring Funds
P.O. Box 219967
Kansas City, MO 64121-9967
Website: allspringglobal.com
Individual investors: 1-800-222-8222
Retail investment professionals: 1-888-877-9275
Institutional investment professionals: 1-800-260-5969
This report and the financial statements contained herein are submitted for the general information of the shareholders of the Fund. If this report is used for promotional purposes, distribution of the report must be accompanied or preceded by a current prospectus. Before investing, please consider the investment objectives, risks, charges, and expenses of the investment. For a current prospectus and, if available, a summary prospectus, containing this information, call
1-800-222-8222 or visit the Fund's website at allspringglobal.com. Read the prospectus carefully before you invest or send money.
Allspring Global InvestmentsTM is the trade name for the asset management firms of Allspring Global Investments Holdings, LLC, a holding company indirectly owned by certain private funds of GTCR LLC and Reverence Capital Partners, L.P. These firms include but are not limited to Allspring Global Investments, LLC, and Allspring Funds Management, LLC. Certain products managed by Allspring entities are distributed by Allspring Funds Distributor, LLC (a broker-dealer and Member FINRA/SIPC).
This material is for general informational and educational purposes only and is NOT intended to provide investment advice or a recommendation of any kind - including a recommendation for any specific investment, strategy, or plan.
© 2023 Allspring Global Investments Holdings, LLC. All rights reserved.
ALL-03102023-tmfjygz8 04-23
SAR3005 02-23
Semi-Annual Report
February 28, 2023
Allspring
Short-Term High Income Fund
(formerly, Allspring Short-Term High Yield Bond Fund)
Allspring Short-Term High Income Fund | 1
Letter to shareholders (unaudited)
Andrew Owen
President
Allspring Funds
Dear Shareholder:
We are pleased to offer you this semi-annual report for the Allspring Short-Term High Income Fund for the six-month period that ended February 28, 2023. Effective January 17, 2023, the Fund changed its name from Allspring Short-Term High Yield Bond Fund to Allspring Short-Term High Income Fund. Globally, stocks and bonds experienced heightened volatility through the challenging period. Earlier tailwinds provided by global stimulus programs, vaccination rollouts, and recovering consumer and corporate sentiment were wiped away by the highest rate of inflation in four decades as well as the impact of ongoing aggressive central bank rate hikes and the prospect of more rate hikes. Compounding these concerns were the global reverberations of the Russia-Ukraine war and the impact of China’s strict COVID-19 lockdowns.
For the six-month period, stocks and bonds had mixed results, with non-U.S. equities––both developed market and emerging market––outperforming U.S. stocks overall. Bonds––both U.S. and non-U.S.––began to recover from sustained aggressive interest rate increases. After suffering deep and broad losses over the past year, recent fixed income performance benefited from a base of higher yields that can now generate higher income. For the period, U.S. stocks, based on the S&P 500 Index,1 returned 1.26%. International stocks, as measured by the MSCI ACWI ex USA Index (Net),2 returned 7.30%, while the MSCI EM Index (Net) (USD)3 lost 2.29%. Among bond indexes, the Bloomberg U.S. Aggregate Bond Index4 returned -2.13%, the Bloomberg Global Aggregate ex-USD Index (unhedged)5 returned -0.11%, the Bloomberg Municipal Bond Index6 gained 0.66%, and the ICE BofA U.S. High Yield Index7 returned 2.41%.
The Russia-Ukraine war, high inflation, and central bank rate hikes rocked markets
A challenging calendar year for investors continued in September as all asset classes suffered major losses. Central banks kept up their battle against rapidly rising prices with more rate hikes. The strength of the U.S. dollar weighed on results for investors holding non-U.S.-dollar assets. U.S. mortgage rates jumped to near 7% on 30-year fixed-rate mortgages; the decreased housing affordability began to cool demand somewhat. The U.K. experienced a sharp sell-off of government bonds and the British pound in September as investors panicked in response to a new government budget that was seen as financially unsound. The Bank of England (BoE) then stepped in and bought long-dated government bonds.
“ A challenging calendar year for investors continued in September as all asset classes suffered major losses.”
| 1 | The S&P 500 Index consists of 500 stocks chosen for market size, liquidity, and industry group representation. It is a market-value-weighted index with each stock's weight in the index proportionate to its market value. You cannot invest directly in an index. |
| 2 | The Morgan Stanley Capital International (MSCI) All Country World Index (ACWI) ex USA Index (Net) is a free-float-adjusted market-capitalization-weighted index that is designed to measure the equity market performance of developed and emerging markets, excluding the U.S. Source: MSCI. MSCI makes no express or implied warranties or representations and shall have no liability whatsoever with respect to any MSCI data contained herein. The MSCI data may not be further redistributed or used as a basis for other indexes or any securities or financial products. This report is not approved, reviewed, or produced by MSCI. You cannot invest directly in an index. |
| 3 | The MSCI Emerging Markets (EM) Index (Net) (USD) is a free-float-adjusted market-capitalization-weighted index that is designed to measure equity market performance of emerging markets. You cannot invest directly in an index. |
| 4 | The Bloomberg U.S. Aggregate Bond Index is a broad-based benchmark that measures the investment-grade, U.S.-dollar-denominated, fixed-rate taxable bond market, including Treasuries, government-related and corporate securities, mortgage-backed securities (agency fixed-rate and hybrid adjustable-rate mortgage pass-throughs), asset-backed securities, and commercial mortgage-backed securities. You cannot invest directly in an index. |
| 5 | The Bloomberg Global Aggregate ex-USD Index (unhedged) is an unmanaged index that provides a broad-based measure of the global investment-grade fixed-income markets excluding the U.S.-dollar-denominated debt market. You cannot invest directly in an index. |
| 6 | The Bloomberg Municipal Bond Index is an unmanaged index composed of long-term tax-exempt bonds with a minimum credit rating of Baa. You cannot invest directly in an index. |
| 7 | The ICE BofA U.S. High Yield Index is a market-capitalization-weighted index of domestic and Yankee high-yield bonds. The index tracks the performance of high-yield securities traded in the U.S. bond market. You cannot invest directly in an index. Copyright 2023. ICE Data Indices, LLC. All rights reserved. |
2 | Allspring Short-Term High Income Fund
Letter to shareholders (unaudited)
Equities had a reprieve in October. Value stocks and small caps fared best. Globally, developed markets outpaced emerging market equities, which were hurt by weakness among Chinese stocks. Central banks continued to try to curtail high inflation with aggressive interest rate hikes. Geopolitical risks persisted, including the ongoing Russia-Ukraine war and economic, financial market, and political turmoil in the U.K. Concerns over Europe’s energy crisis eased thanks to unseasonably warm weather and plentiful gas on hand. The U.S. labor market continued its resilience against rising prices as unemployment remained near a record low.
Stocks and bonds rallied in November. Economic news was encouraging, driven by U.S. labor market strength. Although central banks kept raising rates, hopes rose for an easing in the pace of rate hikes and a possible end to central bank monetary tightening in 2023. Although inflation remained at record highs in the eurozone, we began to see signs of a possible decline in inflationary pressures as U.S. inflation moderated, with a 7.1% annual price rise in November and a monthly price increase of just 0.1%. China’s economic data remained weak, reflecting its zero-COVID-19 policy.
Financial markets cooled in December, with U.S. equities posting negative overall results in response to a weakening U.S. dollar. Fixed income securities ended one of their worst years ever with flat overall monthly returns as markets weighed the hopes for an end to the monetary tightening cycle with the reality that central banks had not completed their jobs yet. U.S. Consumer Price Index (CPI)1 data showed a strong consistent trend downward, which brought down the 12-month CPI to 6.5% in December from 9.1% in June. Other countries and regions reported still-high but declining inflation rates as the year winded down.
The year 2023 began with a rally across global equities and fixed income securities. Investor optimism rose in response to data indicating declining inflation rates and the reopening of China’s economy with the abrupt end to its zero-COVID-19 policy. The U.S. reported surprisingly strong job gains––employers added more than 500,000 jobs––and unemployment fell to 3.4%, the lowest level since 1969. Meanwhile, wage growth, seen as a potential contributor to ongoing high inflation, continued to moderate. All eyes remained fixed on the Federal Reserve (Fed) and on how many more rate hikes remain in this tightening cycle. The 0.25% federal funds rate hike announced in January was the Fed’s smallest rate increase since March 2022.
Financial markets declined in February as investors responded unfavorably to resilient economic data. The takeaway: Central banks will likely continue their monetary tightening cycle for longer than markets had priced in. In this environment—where strong economic data is seen as bad news—the resilient U.S. labor market was seen as a negative while the inflation rate has not been falling quickly enough for the Fed, which raised interest rates by 0.25% in early February. Meanwhile, the BoE and the European Central Bank both raised rates by 0.50%. At this stage in the economic cycle, the overriding question remained: “What will central banks do?” In February, the answer appeared to be: “Move rates higher for longer.”
| 1 | The Consumer Price Index (CPI) is a measure of the average change over time in the prices paid by urban consumers for a market basket of consumer goods and services. You cannot invest directly in an index. |
Allspring Short-Term High Income Fund | 3
Letter to shareholders (unaudited)
Don’t let short-term uncertainty derail long-term investment goals.
Periods of investment uncertainty can present challenges, but experience has taught us that maintaining long-term investment goals can be an effective way to plan for the future. To help you create a sound strategy based on your personal goals and risk tolerance, Allspring Funds offers more than 100 mutual funds spanning a wide range of asset classes and investment styles. Although diversification cannot guarantee an investment profit or prevent losses, we believe it can be an effective way to manage investment risk and potentially smooth out overall portfolio performance. We encourage investors to know their investments and to understand that appropriate levels of risk-taking may unlock opportunities.
Thank you for choosing to invest with Allspring Funds. We appreciate your confidence in us and remain committed to helping you meet your financial needs.
Sincerely,
Andrew Owen
President
Allspring Funds
For further information about your fund, contact your investment professional, visit our website at allspringglobal.com, or call us directly at 1-800-222-8222.
4 | Allspring Short-Term High Income Fund
This page is intentionally left blank.
Performance highlights (unaudited)
| Investment objective | The Fund seeks total return, consisting of a high level of current income and capital appreciation. |
| Manager | Allspring Funds Management, LLC |
| Subadviser | Allspring Global Investments, LLC |
| Portfolio managers | Chris Lee, CFA®‡, Michael J. Schueller, CFA®‡ |
| Average annual total returns (%) as of February 28, 2023 |
| | | Including sales charge | | Excluding sales charge | | Expense ratios1 (%) |
| | Inception date | 1 year | 5 year | 10 year | | 1 year | 5 year | 10 year | | Gross | Net 2 |
| Class A (SSTHX) | 2-29-2000 | -2.83 | 2.38 | 2.42 | | 0.18 | 3.00 | 2.73 | | 0.92 | 0.81 |
| Class C (WFHYX) | 3-31-2008 | -1.44 | 2.26 | 2.12 | | -0.44 | 2.26 | 2.12 | | 1.67 | 1.56 |
| Administrator Class (WDHYX) | 7-30-2010 | – | – | – | | 0.33 | 3.16 | 2.89 | | 0.86 | 0.65 |
| Institutional Class (STYIX) | 11-30-2012 | – | – | – | | 0.48 | 3.32 | 3.05 | | 0.59 | 0.50 |
| ICE BofA 1-3 Year BB U.S. Cash Pay High Yield Index3 | – | – | – | – | | 0.68 | 3.45 | 3.66 | | – | – |
Figures quoted represent past performance, which is no guarantee of future results, and do not reflect taxes that a shareholder may pay on an investment in a fund. Investment return and principal value of an investment will fluctuate so that an investor’s shares, when redeemed, may be worth more or less than their original cost. Performance shown without sales charges would be lower if sales charges were reflected. Current performance may be lower or higher than the performance data quoted, which assumes the reinvestment of dividends and capital gains. Current month-end performance is available on the Fund’s website, allspringglobal.com.
Index returns do not include transaction costs associated with buying and selling securities, any mutual fund fees or expenses, or any taxes. It is not possible to invest directly in an index.
For Class A shares, the maximum front-end sales charge is 3.00%. For Class C shares, the maximum contingent deferred sales charge is 1.00%. Performance including a contingent deferred sales charge assumes the sales charge for the corresponding time period. Administrator Class and Institutional Class shares are sold without a front-end sales charge or contingent deferred sales charge.
| 1 | Reflects the expense ratios as stated in the most recent prospectuses. The expense ratios shown are subject to change and may differ from the annualized expense ratios shown in the financial highlights of this report. |
| 2 | The manager has contractually committed through December 31, 2023, to waive fees and/or reimburse expenses to the extent necessary to cap total annual fund operating expenses after fee waivers at 0.81% for Class A, 1.56% for Class C, 0.65% for Administrator Class, and 0.50% for Institutional Class. Brokerage commissions, stamp duty fees, interest, taxes, acquired fund fees and expenses (if any), and extraordinary expenses are excluded from the expense caps. Prior to or after the commitment expiration date, the caps may be increased or the commitment to maintain the caps may be terminated only with the approval of the Board of Trustees. Without these caps, the Fund’s returns would have been lower. The expense ratio paid by an investor is the net expense ratio (the total annual fund operating expenses after fee waivers) as stated in the prospectuses. |
| 3 | The ICE BofA 1-3 Year BB U.S. Cash Pay High Yield Index, a subset of the ICE BofA U.S. High Yield Master II Index, tracks the performance of U.S- dollar denominated below investment grade rated corporate debt publicly issued in the U.S. domestic market. This subset includes all securities with a given investment grade rating BB with maturities between one to three years. You cannot invest directly in an index. Copyright 2023. ICE Data Indices, LLC. All rights reserved. |
Bond values fluctuate in response to the financial condition of individual issuers, general market and economic conditions, and changes in interest rates. Changes in market conditions and government policies may lead to periods of heightened volatility in the bond market and reduced liquidity for certain bonds held by the Fund. In general, when interest rates rise, bond values fall and investors may lose principal value. Interest rate changes and their impact on the Fund and its share price can be sudden and unpredictable. High-yield securities have a greater risk of default and tend to be more volatile than higher-rated debt securities. Loans are subject to risks similar to those associated with other below-investment-grade bond investments, such as credit risk (for example, risk of issuer default), below-investment-grade bond risk (for example, risk of greater volatility in value), and risk that the loan may become illiquid or difficult to price. The use of derivatives may reduce returns and/or increase volatility. Certain investment strategies tend to increase the total risk of an investment (relative to the broader market). This fund is exposed to foreign investment risk. Consult the Fund’s prospectus for additional information on these and other risks.
| ‡ | CFA® and Chartered Financial Analyst® are trademarks owned by CFA Institute. |
6 | Allspring Short-Term High Income Fund
Performance highlights (unaudited)
| Ten largest holdings (%) as of February 28, 20231 |
| Enact Holdings Incorporated, 6.50%, 8-15-2025 | 1.93 |
| Celanese US Holding LLC, 6.05%, 3-15-2025 | 1.83 |
| NextEra Energy Operating Partners LP, 4.25%, 7-15-2024 | 1.77 |
| CoreCivic Incorporated, 8.25%, 4-15-2026 | 1.46 |
| Enviva Partners LP, 6.50%, 1-15-2026 | 1.42 |
| Oceaneering International Incorporated, 4.65%, 11-15-2024 | 1.40 |
| Ford Motor Credit Company LLC, 5.58%, 3-18-2024 | 1.39 |
| NorthRiver Midstream Finance LP, 5.63%, 2-15-2026 | 1.36 |
| Teva Pharmaceutical Finance Netherlands III BV, 6.00%, 4-15-2024 | 1.31 |
| Las Vegas Sands Corporation, 3.20%, 8-8-2024 | 1.30 |
| 1 | Figures represent the percentage of the Fund's net assets. Holdings are subject to change and may have changed since the date specified. |
| Credit quality as of February 28, 20231 |
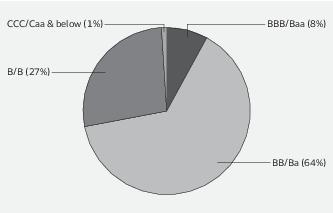
| 1 | The credit quality distribution of portfolio holdings reflected in the chart is based on ratings from Standard & Poor’s, Moody’s Investors Service, and/or Fitch Ratings Ltd. Credit quality ratings apply to the underlying holdings of the Fund and not to the Fund itself. The percentages of the portfolio with the ratings depicted in the chart are calculated based on the market value of fixed income securities held by the Fund. If a security was rated by all three rating agencies, the middle rating was utilized. If rated by two of the three rating agencies, the lower rating was utilized, and if rated by one of the rating agencies, that rating was utilized. Standard & Poor’s rates the creditworthiness of bonds, ranging from AAA (highest) to D (lowest). Ratings from A to CCC may be modified by the addition of a plus (+) or minus (-) sign to show relative standing within the rating categories. Standard & Poor’s rates the creditworthiness of short-term notes from SP-1 (highest) to SP-3 (lowest). Moody’s rates the creditworthiness of bonds, ranging from Aaa (highest) to C (lowest). Ratings Aa to B may be modified by the addition of a number 1 (highest) to 3 (lowest) to show relative standing within the ratings categories. Moody’s rates the creditworthiness of short-term U.S. tax-exempt municipal securities from MIG 1/VMIG 1 (highest) to SG (lowest). Fitch rates the creditworthiness of bonds, ranging from AAA (highest) to D (lowest). Credit quality distribution is subject to change and may have changed since the date specified. |
| Effective maturity distribution as of February 28, 20231 |
| 1 | Figures represent the percentage of the Fund's long-term investments. Allocations are subject to change and may have changed since the date specified. |
Allspring Short-Term High Income Fund | 7
Fund expenses (unaudited)
As a shareholder of the Fund, you incur two types of costs: (1) transaction costs, including sales charges (loads) on purchase payments and contingent deferred sales charges (if any) on redemptions and (2) ongoing costs, including management fees, distribution (12b-1) and/or shareholder servicing fees, and other Fund expenses. This example is intended to help you understand your ongoing costs (in dollars) of investing in the Fund and to compare these costs with the ongoing costs of investing in other mutual funds.
The example is based on an investment of $1,000 invested at the beginning of the six-month period and held for the entire period from September 1, 2022 to February 28, 2023.
Actual expenses
The “Actual” line of the table below provides information about actual account values and actual expenses. You may use the information in this line, together with the amount you invested, to estimate the expenses that you paid over the period. Simply divide your account value by $1,000 (for example, an $8,600 account value divided by $1,000 = 8.6), then multiply the result by the number in the “Actual” line under the heading entitled “Expenses paid during period” for your applicable class of shares to estimate the expenses you paid on your account during this period.
Hypothetical example for comparison purposes
The “Hypothetical” line of the table below provides information about hypothetical account values and hypothetical expenses based on the Fund’s actual expense ratio and an assumed rate of return of 5% per year before expenses, which is not the Fund’s actual return. The hypothetical account values and expenses may not be used to estimate the actual ending account balance or expenses you paid for the period. You may use this information to compare the ongoing costs of investing in the Fund and other funds. To do so, compare this 5% hypothetical example with the 5% hypothetical examples that appear in the shareholder reports of the other funds.
Please note that the expenses shown in the table are meant to highlight your ongoing costs only and do not reflect any transactional costs, such as sales charges (loads) and contingent deferred sales charges. Therefore, the “Hypothetical” line of the table is useful in comparing ongoing costs only, and will not help you determine the relative total costs of owning different funds. In addition, if these transactional costs were included, your costs would have been higher.
| | Beginning
account value
9-1-2022 | Ending
account value
2-28-2023 | Expenses
paid during
the period1 | Annualized net
expense ratio |
| Class A | | | | |
| Actual | $1,000.00 | $1,028.89 | $4.07 | 0.81% |
| Hypothetical (5% return before expenses) | $1,000.00 | $1,020.78 | $4.06 | 0.81% |
| Class C | | | | |
| Actual | $1,000.00 | $1,026.39 | $7.84 | 1.56% |
| Hypothetical (5% return before expenses) | $1,000.00 | $1,017.06 | $7.80 | 1.56% |
| Administrator Class | | | | |
| Actual | $1,000.00 | $1,029.69 | $3.27 | 0.65% |
| Hypothetical (5% return before expenses) | $1,000.00 | $1,021.57 | $3.26 | 0.65% |
| Institutional Class | | | | |
| Actual | $1,000.00 | $1,030.47 | $2.52 | 0.50% |
| Hypothetical (5% return before expenses) | $1,000.00 | $1,022.32 | $2.51 | 0.50% |
1 Expenses paid is equal to the annualized net expense ratio of each class multiplied by the average account value over the period, multiplied by 181 divided by 365 (to reflect the one-half-year period).
8 | Allspring Short-Term High Income Fund
Portfolio of investments—February 28, 2023 (unaudited)
| | | Interest
rate | Maturity
date | Principal | Value |
| Corporate bonds and notes: 80.47% | | | | | |
| Communication services: 8.49% | | | | | |
| Diversified telecommunication services: 0.02% | | | | | |
| Level 3 Financing Incorporated 144A | | 4.63% | 9-15-2027 | $ 525,000 | $ 392,438 |
| Entertainment: 2.02% | | | | | |
| Dave & Buster's Incorporated 144A | | 7.63 | 11-1-2025 | 16,246,000 | 16,469,383 |
| Live Nation Entertainment Incorporated 144A | | 4.88 | 11-1-2024 | 13,250,000 | 12,852,500 |
| Live Nation Entertainment Incorporated 144A | | 6.50 | 5-15-2027 | 3,350,000 | 3,293,887 |
| | | | | | 32,615,770 |
| Media: 4.33% | | | | | |
| CCO Holdings LLC 144A | | 5.13 | 5-1-2027 | 430,000 | 397,866 |
| CCO Holdings LLC 144A | | 5.50 | 5-1-2026 | 21,100,000 | 20,361,500 |
| Cinemark USA Incorporated 144A | | 8.75 | 5-1-2025 | 15,447,000 | 15,759,048 |
| Gray Television Incorporated 144A | | 5.88 | 7-15-2026 | 12,152,000 | 10,975,500 |
| Nexstar Broadcasting Incorporated 144A | | 5.63 | 7-15-2027 | 6,930,000 | 6,436,116 |
| Sirius XM Radio Incorporated 144A | | 5.00 | 8-1-2027 | 9,000,000 | 8,257,500 |
| Townsquare Media Incorporated 144A | | 6.88 | 2-1-2026 | 8,630,000 | 7,907,433 |
| | | | | | 70,094,963 |
| Wireless telecommunication services: 2.12% | | | | | |
| Sprint Corporation | | 7.13 | 6-15-2024 | 18,109,000 | 18,337,173 |
| Sprint Corporation | | 7.88 | 9-15-2023 | 11,080,000 | 11,183,477 |
| Sprint Spectrum Company 144A | | 4.74 | 3-20-2025 | 4,848,750 | 4,792,834 |
| | | | | | 34,313,484 |
| Consumer discretionary: 14.69% | | | | | |
| Auto components: 1.16% | | | | | |
| Allison Transmission Incorporated 144A | | 5.88 | 6-1-2029 | 915,000 | 866,963 |
| Clarios Global LP 144A | | 6.25 | 5-15-2026 | 6,605,000 | 6,482,808 |
| Clarios Global LP 144A | | 6.75 | 5-15-2025 | 7,058,000 | 7,016,584 |
| Goodyear Tire & Rubber Company « | | 5.00 | 5-31-2026 | 4,624,000 | 4,450,600 |
| | | | | | 18,816,955 |
| Commercial services & supplies: 0.65% | | | | | |
| Prime Security Services Borrower LLC 144A | | 5.75 | 4-15-2026 | 10,850,000 | 10,483,813 |
| Hotels, restaurants & leisure: 8.67% | | | | | |
| Carnival Corporation 144A | | 9.88 | 8-1-2027 | 400,000 | 407,196 |
| Carnival Corporation 144A | | 10.50 | 2-1-2026 | 8,110,000 | 8,393,668 |
| CCM Merger Incorporated 144A | | 6.38 | 5-1-2026 | 3,145,000 | 3,018,057 |
| Cedar Fair LP 144A | | 5.50 | 5-1-2025 | 18,580,000 | 18,353,132 |
| Hilton Domestic Operating Company Incorporated 144A | | 5.38 | 5-1-2025 | 17,777,000 | 17,553,828 |
| International Game Technology plc 144A | | 6.50 | 2-15-2025 | 4,600,000 | 4,611,500 |
| Las Vegas Sands Corporation | | 3.20 | 8-8-2024 | 21,900,000 | 21,075,953 |
| MGM Resorts International | | 6.75 | 5-1-2025 | 7,660,000 | 7,678,913 |
| NCL Corporation limited 144A | | 8.38 | 2-1-2028 | 7,205,000 | 7,320,100 |
| Royal Caribbean Cruises Limited 144A | | 5.38 | 7-15-2027 | 13,500,000 | 11,865,602 |
| Royal Caribbean Cruises Limited 144A | | 11.50 | 6-1-2025 | 7,389,000 | 7,870,172 |
The accompanying notes are an integral part of these financial statements.
Allspring Short-Term High Income Fund | 9
Portfolio of investments—February 28, 2023 (unaudited)
| | | Interest
rate | Maturity
date | Principal | Value |
| Hotels, restaurants & leisure (continued) | | | | | |
| SeaWorld Parks & Entertainment Incorporated 144A | | 8.75% | 5-1-2025 | $19,407,000 | $ 19,809,865 |
| Six Flags Entertainment Company 144A | | 7.00 | 7-1-2025 | 12,225,000 | 12,354,585 |
| | | | | | 140,312,571 |
| Household durables: 0.48% | | | | | |
| Newell Brands Incorporated | | 4.45 | 4-1-2026 | 8,195,000 | 7,746,734 |
| Internet & direct marketing retail: 1.14% | | | | | |
| QVC Incorporated | | 4.85 | 4-1-2024 | 19,710,000 | 18,502,960 |
| Leisure products: 0.07% | | | | | |
| Mattel Incorporated 144A | | 3.38 | 4-1-2026 | 1,150,000 | 1,055,125 |
| Specialty retail: 1.21% | | | | | |
| Bath & Body Works Incorporated 144A | | 9.38 | 7-1-2025 | 18,196,000 | 19,242,270 |
| Penske Automotive Group Incorporated « | | 3.50 | 9-1-2025 | 375,000 | 350,644 |
| | | | | | 19,592,914 |
| Textiles, apparel & luxury goods: 1.31% | | | | | |
| G-III Apparel Group Limited 144A | | 7.88 | 8-15-2025 | 17,595,000 | 16,583,288 |
| Michael Kors USA Incorporated 144A | | 4.25 | 11-1-2024 | 4,755,000 | 4,558,856 |
| | | | | | 21,142,144 |
| Consumer staples: 3.16% | | | | | |
| Food products: 2.06% | | | | | |
| Performance Food Group Incorporated 144A | | 6.88 | 5-1-2025 | 14,552,000 | 14,583,374 |
| US Foods Incorporated 144A | | 6.25 | 4-15-2025 | 18,903,000 | 18,833,893 |
| | | | | | 33,417,267 |
| Household products: 1.10% | | | | | |
| Spectrum Brands Incorporated | | 5.75 | 7-15-2025 | 18,137,000 | 17,783,656 |
| Energy: 13.25% | | | | | |
| Energy equipment & services: 2.26% | | | | | |
| Oceaneering International Incorporated | | 4.65 | 11-15-2024 | 23,585,000 | 22,702,438 |
| USA Compression Partners LP | | 6.88 | 4-1-2026 | 12,640,000 | 12,114,050 |
| USA Compression Partners LP | | 6.88 | 9-1-2027 | 1,795,000 | 1,699,578 |
| | | | | | 36,516,066 |
| Oil, gas & consumable fuels: 10.99% | | | | | |
| Aethon United 144A | | 8.25 | 2-15-2026 | 13,865,000 | 13,335,796 |
| Antero Midstream Company 144A | | 7.88 | 5-15-2026 | 7,618,000 | 7,693,828 |
| Antero Resources Corporation 144A | | 8.38 | 7-15-2026 | 6,395,000 | 6,611,200 |
| Archrock Partners LP 144A | | 6.88 | 4-1-2027 | 250,000 | 242,533 |
| Buckeye Partners LP 144A | | 4.13 | 3-1-2025 | 6,795,000 | 6,370,240 |
| Buckeye Partners LP | | 4.15 | 7-1-2023 | 8,019,000 | 7,959,659 |
| Crestwood Midstream Partners LP | | 5.75 | 4-1-2025 | 16,325,000 | 15,834,641 |
| DCP Midstream Operating LP | | 5.38 | 7-15-2025 | 8,640,000 | 8,533,435 |
| EnLink Midstream Partners LP | | 4.15 | 6-1-2025 | 5,917,000 | 5,673,959 |
| Enviva Partners LP 144A | | 6.50 | 1-15-2026 | 24,501,000 | 22,968,707 |
| EQM Midsteram Partners LP | | 4.00 | 8-1-2024 | 7,785,000 | 7,436,694 |
| EQT Corporation | | 6.13 | 2-1-2025 | 5,546,000 | 5,553,654 |
| Murphy Oil Corporation | | 5.75 | 8-15-2025 | 6,086,000 | 6,024,200 |
The accompanying notes are an integral part of these financial statements.
10 | Allspring Short-Term High Income Fund
Portfolio of investments—February 28, 2023 (unaudited)
| | | Interest
rate | Maturity
date | Principal | Value |
| Oil, gas & consumable fuels (continued) | | | | | |
| Range Resources Corporation | | 4.88% | 5-15-2025 | $ 8,215,000 | $ 8,014,533 |
| Range Resources Corporation | | 8.25 | 1-15-2029 | 1,910,000 | 1,960,138 |
| Rockies Express Pipeline LLC 144A | | 3.60 | 5-15-2025 | 16,795,000 | 15,530,021 |
| Southwestern Energy Company | | 5.70 | 1-23-2025 | 12,702,000 | 12,585,435 |
| Tallgrass Energy Partners LP 144A | | 6.00 | 3-1-2027 | 20,290,000 | 18,839,054 |
| Western Gas Partners LP | | 3.95 | 6-1-2025 | 1,735,000 | 1,648,250 |
| Western Gas Partners LP | | 4.65 | 7-1-2026 | 5,335,000 | 5,068,250 |
| | | | | | 177,884,227 |
| Financials: 13.14% | | | | | |
| Consumer finance: 5.46% | | | | | |
| Ford Motor Credit Company LLC | | 4.13 | 8-17-2027 | 4,600,000 | 4,098,410 |
| Ford Motor Credit Company LLC | | 5.13 | 6-16-2025 | 3,955,000 | 3,818,076 |
| Ford Motor Credit Company LLC | | 5.58 | 3-18-2024 | 22,725,000 | 22,565,925 |
| LFS TopCo LLC 144A | | 5.88 | 10-15-2026 | 2,860,000 | 2,463,022 |
| Navient Corporation | | 5.88 | 10-25-2024 | 14,850,000 | 14,435,091 |
| Navient Corporation | | 7.25 | 9-25-2023 | 2,265,000 | 2,271,569 |
| OneMain Finance Corporation | | 3.50 | 1-15-2027 | 2,440,000 | 2,049,274 |
| OneMain Finance Corporation | | 6.13 | 3-15-2024 | 17,485,000 | 17,239,874 |
| OneMain Finance Corporation | | 7.13 | 3-15-2026 | 2,350,000 | 2,284,459 |
| PRA Group Incorporated 144A | | 7.38 | 9-1-2025 | 6,880,000 | 6,857,336 |
| Rocket Mortgage LLC 144A | | 2.88 | 10-15-2026 | 11,865,000 | 10,238,190 |
| | | | | | 88,321,226 |
| Diversified financial services: 2.57% | | | | | |
| Hat Holdings LLC 144A | | 3.38 | 6-15-2026 | 5,000,000 | 4,337,500 |
| Hat Holdings LLC 144A | | 6.00 | 4-15-2025 | 21,550,000 | 20,769,244 |
| United Wholesale Mortgage LLC 144A | | 5.50 | 11-15-2025 | 17,745,000 | 16,485,105 |
| | | | | | 41,591,849 |
| Insurance: 0.80% | | | | | |
| Tri Pointe Homes Incorporated | | 5.88 | 6-15-2024 | 13,183,000 | 13,018,213 |
| Mortgage REITs: 1.33% | | | | | |
| Starwood Property Trust Incorporated 144A | | 3.63 | 7-15-2026 | 2,930,000 | 2,563,938 |
| Starwood Property Trust Incorporated 144A | | 3.75 | 12-31-2024 | 7,730,000 | 7,275,032 |
| Starwood Property Trust Incorporated | | 4.75 | 3-15-2025 | 10,120,000 | 9,657,212 |
| Starwood Property Trust Incorporated 144A | | 5.50 | 11-1-2023 | 2,040,000 | 2,020,342 |
| | | | | | 21,516,524 |
| Thrifts & mortgage finance: 2.98% | | | | | |
| Enact Holdings Incorporated 144A | | 6.50 | 8-15-2025 | 31,787,000 | 31,238,662 |
| Ladder Capital Finance Holdings LP 144A | | 5.25 | 10-1-2025 | 18,090,000 | 16,903,500 |
| | | | | | 48,142,162 |
| Health care: 2.96% | | | | | |
| Health care providers & services: 2.39% | | | | | |
| MPT Operating Partnership LP « | | 5.25 | 8-1-2026 | 15,940,000 | 14,218,161 |
| Tenet Healthcare Corporation | | 4.63 | 7-15-2024 | 14,117,000 | 13,887,599 |
| Tenet Healthcare Corporation | | 4.88 | 1-1-2026 | 11,135,000 | 10,604,825 |
| | | | | | 38,710,585 |
The accompanying notes are an integral part of these financial statements.
Allspring Short-Term High Income Fund | 11
Portfolio of investments—February 28, 2023 (unaudited)
| | | Interest
rate | Maturity
date | Principal | Value |
| Health care technology: 0.57% | | | | | |
| IQVIA Incorporated 144A | | 5.00% | 10-15-2026 | $ 9,540,000 | $ 9,110,700 |
| Industrials: 11.39% | | | | | |
| Aerospace & defense: 1.27% | | | | | |
| TransDigm Group Incorporated 144A | | 6.25 | 3-15-2026 | 20,820,000 | 20,544,049 |
| Airlines: 3.55% | | | | | |
| American Airlines Group Incorporated 144A | | 5.50 | 4-20-2026 | 5,315,000 | 5,172,816 |
| Delta Air Lines Incorporated | | 7.38 | 1-15-2026 | 2,600,000 | 2,675,400 |
| Hawaiian Airlines Incorporated | | 3.90 | 7-15-2027 | 3,504,115 | 3,158,889 |
| Hawaiian Brand Intellectual Property Limited 144A | | 5.75 | 1-20-2026 | 13,345,000 | 12,409,716 |
| Mileage Plus Holdings LLC 144A | | 6.50 | 6-20-2027 | 5,004,000 | 5,004,000 |
| Spirit Loyalty Cayman Limited 144A | | 8.00 | 9-20-2025 | 28,971,000 | 29,079,642 |
| | | | | | 57,500,463 |
| Commercial services & supplies: 4.18% | | | | | |
| Allied Universal Holdco LLC 144A | | 6.63 | 7-15-2026 | 9,485,000 | 9,008,474 |
| Aramark Services Incorporated 144A | | 6.38 | 5-1-2025 | 18,150,000 | 18,031,844 |
| CoreCivic Incorporated | | 8.25 | 4-15-2026 | 23,400,000 | 23,689,458 |
| Stericycle Incorporated 144A | | 5.38 | 7-15-2024 | 17,165,000 | 16,913,018 |
| | | | | | 67,642,794 |
| Road & rail: 1.10% | | | | | |
| Uber Technologies Incorporated 144A | | 7.50 | 5-15-2025 | 17,570,000 | 17,748,107 |
| Trading companies & distributors: 1.29% | | | | | |
| Fortress Transportation & Infrastructure Investors LLC 144A | | 6.50 | 10-1-2025 | 21,351,000 | 20,825,187 |
| Information technology: 4.16% | | | | | |
| Electronic equipment, instruments & components: 1.13% | | | | | |
| Wesco Distribution Incorporated 144A | | 7.13 | 6-15-2025 | 18,072,000 | 18,235,834 |
| IT services: 1.49% | | | | | |
| Block Incorporated | | 2.75 | 6-1-2026 | 1,760,000 | 1,570,423 |
| Sabre GLBL Incorporated 144A | | 9.25 | 4-15-2025 | 13,005,000 | 12,801,361 |
| Sabre GLBL Incorporated 144A | | 11.25 | 12-15-2027 | 9,790,000 | 9,783,832 |
| | | | | | 24,155,616 |
| Software: 0.96% | | | | | |
| NCR Corporation 144A | | 5.75 | 9-1-2027 | 2,060,000 | 1,996,629 |
| NortonLifeLock Incorporated 144A | | 5.00 | 4-15-2025 | 13,997,000 | 13,596,126 |
| | | | | | 15,592,755 |
| Technology hardware, storage & peripherals: 0.58% | | | | | |
| Western Digital Corporation | | 4.75 | 2-15-2026 | 9,883,000 | 9,330,936 |
| Materials: 4.48% | | | | | |
| Chemicals: 2.24% | | | | | |
| Avient Corporation 144A | | 5.75 | 5-15-2025 | 6,760,000 | 6,625,735 |
| Celanese US Holding LLC | | 6.05 | 3-15-2025 | 29,775,000 | 29,664,805 |
| | | | | | 36,290,540 |
The accompanying notes are an integral part of these financial statements.
12 | Allspring Short-Term High Income Fund
Portfolio of investments—February 28, 2023 (unaudited)
| | | Interest
rate | Maturity
date | Principal | Value |
| Containers & packaging: 1.34% | | | | | |
| Berry Global Incorporated 144A | | 4.88% | 7-15-2026 | $ 1,750,000 | $ 1,675,625 |
| Berry Global Incorporated 144A | | 5.63 | 7-15-2027 | 140,000 | 134,750 |
| Owens-Brockway Packaging Incorporated 144A | | 5.88 | 8-15-2023 | 5,025,000 | 4,997,233 |
| Sealed Air Corporation 144A | | 5.13 | 12-1-2024 | 7,629,000 | 7,495,125 |
| Sealed Air Corporation 144A | | 5.50 | 9-15-2025 | 7,550,000 | 7,428,747 |
| | | | | | 21,731,480 |
| Metals & mining: 0.31% | | | | | |
| Cleveland-Cliffs Incorporated 144A | | 6.75 | 3-15-2026 | 4,885,000 | 4,934,485 |
| Paper & forest products: 0.59% | | | | | |
| Clearwater Paper Corporation 144A | | 5.38 | 2-1-2025 | 9,870,000 | 9,570,445 |
| Real estate: 1.00% | | | | | |
| Equity REITs: 1.00% | | | | | |
| Service Properties Trust Company | | 4.35 | 10-1-2024 | 12,732,000 | 12,187,070 |
| Service Properties Trust Company | | 7.50 | 9-15-2025 | 4,085,000 | 4,048,970 |
| | | | | | 16,236,040 |
| Utilities: 3.75% | | | | | |
| Electric utilities: 1.77% | | | | | |
| NextEra Energy Operating Partners LP 144A | | 4.25 | 7-15-2024 | 29,632,000 | 28,631,920 |
| Independent power & renewable electricity producers: 1.98% | | | | | |
| NSG Holdings LLC 144A | | 7.75 | 12-15-2025 | 12,651,318 | 12,398,291 |
| Vistra Operations Company LLC 144A | | 5.50 | 9-1-2026 | 14,725,000 | 14,063,747 |
| Vistra Operations Company LLC 144A | | 5.63 | 2-15-2027 | 5,910,000 | 5,600,437 |
| | | | | | 32,062,475 |
| Total Corporate bonds and notes (Cost $1,337,472,984) | | | | | 1,302,115,472 |
| Loans: 6.19% | | | | | |
| Communication services: 0.27% | | | | | |
| Media: 0.27% | | | | | |
| Gray Television Incorporated (3 Month LIBOR +2.50%) <± | | 7.07 | 1-2-2026 | 1,725,000 | 1,700,557 |
| Hubbard Radio LLC (1 Month LIBOR +4.25%) ± | | 8.89 | 3-28-2025 | 911,314 | 807,269 |
| The E.W. Scripps Company (1 Month LIBOR +2.00%) <± | | 6.85 | 10-2-2024 | 1,900,000 | 1,887,726 |
| | | | | | 4,395,552 |
| Consumer discretionary: 1.00% | | | | | |
| Auto components: 0.13% | | | | | |
| Clarios Global LP (1 Month LIBOR +3.25%) ± | | 7.88 | 4-30-2026 | 2,194,428 | 2,181,064 |
| Hotels, restaurants & leisure: 0.87% | | | | | |
| Carnival Corporation (1 Month LIBOR +3.00%) ± | | 7.63 | 6-30-2025 | 6,703,113 | 6,584,133 |
| SeaWorld Parks & Entertainment Incorporated (1 Month LIBOR +3.00%) ± | | 7.69 | 8-25-2028 | 7,510,079 | 7,478,762 |
| | | | | | 14,062,895 |
The accompanying notes are an integral part of these financial statements.
Allspring Short-Term High Income Fund | 13
Portfolio of investments—February 28, 2023 (unaudited)
| | | Interest
rate | Maturity
date | Principal | Value |
| Energy: 0.25% | | | | | |
| Oil, gas & consumable fuels: 0.25% | | | | | |
| GIP II Blue Holdings LP (1 Month LIBOR +4.50%) ± | | 9.23% | 9-29-2028 | $ 4,091,960 | $ 4,074,405 |
| Financials: 1.34% | | | | | |
| Diversified financial services: 0.64% | | | | | |
| Resolute Investment Managers Incorporated (1 Month LIBOR +4.25%) ౠ| | 8.98 | 4-30-2024 | 2,474,172 | 1,942,225 |
| Russell Investments US Institutional Holdco Incorporated (1 Month LIBOR +3.50%) ± | | 8.13 | 5-30-2025 | 8,510,095 | 8,371,806 |
| | | | | | 10,314,031 |
| Insurance: 0.53% | | | | | |
| Asurion LLC (1 Month LIBOR +3.00%) <± | | 7.63 | 11-3-2024 | 8,598,340 | 8,563,001 |
| Mortgage REITs: 0.17% | | | | | |
| Claros Mortgage Trust Incorporated (U.S. SOFR 1 Month +4.50%) ౠ| | 9.16 | 8-9-2026 | 2,781,900 | 2,750,604 |
| Health care: 0.34% | | | | | |
| Health care providers & services: 0.34% | | | | | |
| Select Medical Corporation (3 Month LIBOR +2.50%) ± | | 7.14 | 3-6-2025 | 5,450,000 | 5,421,061 |
| Industrials: 2.37% | | | | | |
| Airlines: 1.78% | | | | | |
| Mileage Plus Holdings LLC (1 Month LIBOR +5.25%) ± | | 10.00 | 6-21-2027 | 8,437,500 | 8,777,109 |
| SkyMiles IP Limited (3 Month LIBOR +3.75%) <± | | 8.56 | 10-20-2027 | 19,372,500 | 20,038,527 |
| | | | | | 28,815,636 |
| Commercial services & supplies: 0.41% | | | | | |
| GFL Environmental Incorporated (U.S. SOFR 1 Month +3.00%) ± | | 7.56 | 5-28-2027 | 2,572,500 | 2,574,712 |
| The Geo Group Incorporated (1 Month LIBOR +7.13%) <± | | 11.74 | 3-23-2027 | 4,000,000 | 4,027,160 |
| | | | | | 6,601,872 |
| Machinery: 0.00% | | | | | |
| Vertical US Newco Incorporated (1 Month LIBOR +3.50%) ± | | 8.60 | 7-30-2027 | 21,261 | 20,766 |
| Road & rail: 0.18% | | | | | |
| Uber Technologies Incorporated (1 Month LIBOR +3.50%) ± | | 8.45 | 4-4-2025 | 2,855,205 | 2,852,093 |
| Materials: 0.24% | | | | | |
| Chemicals: 0.24% | | | | | |
| The Chemours Company (1 Month LIBOR +1.75%) <± | | 6.39 | 4-3-2025 | 3,969,218 | 3,940,163 |
| Utilities: 0.38% | | | | | |
| Electric utilities: 0.38% | | | | | |
| ExGen Renewables IV LLC (1 Month LIBOR +2.50%) ± | | 7.46 | 12-15-2027 | 6,242,650 | 6,221,175 |
| Total Loans (Cost $100,776,516) | | | | | 100,214,318 |
The accompanying notes are an integral part of these financial statements.
14 | Allspring Short-Term High Income Fund
Portfolio of investments—February 28, 2023 (unaudited)
| | | Interest
rate | Maturity
date | Principal | Value |
| Yankee corporate bonds and notes: 9.81% | | | | | |
| Communication services: 0.88% | | | | | |
| Media: 0.88% | | | | | |
| Clear Channel International Limited 144A« | | 6.63% | 8-1-2025 | $ 3,000,000 | $ 2,925,149 |
| Videotron Limited 144A | | 5.38 | 6-15-2024 | 11,523,000 | 11,398,201 |
| | | | | | 14,323,350 |
| Consumer discretionary: 0.66% | | | | | |
| Auto components: 0.61% | | | | | |
| Adient Global Holdings Limited 144A | | 4.88 | 8-15-2026 | 10,605,000 | 9,814,503 |
| Automobiles: 0.05% | | | | | |
| Stellantis NV | | 5.25 | 4-15-2023 | 896,000 | 893,599 |
| Energy: 1.36% | | | | | |
| Oil, gas & consumable fuels: 1.36% | | | | | |
| NorthRiver Midstream Finance LP 144A | | 5.63 | 2-15-2026 | 23,390,000 | 22,026,090 |
| Financials: 1.76% | | | | | |
| Diversified financial services: 1.76% | | | | | |
| DAE Funding LLC 144A | | 2.63 | 3-20-2025 | 5,910,000 | 5,529,124 |
| FMG Resources Proprietary Limited 144A | | 5.13 | 5-15-2024 | 6,771,000 | 6,686,363 |
| New Red Finance Incorporated 144A | | 5.75 | 4-15-2025 | 16,390,000 | 16,287,644 |
| | | | | | 28,503,131 |
| Health care: 1.84% | | | | | |
| Pharmaceuticals: 1.84% | | | | | |
| Teva Pharmaceutical Finance Netherlands III BV | | 6.00 | 4-15-2024 | 21,195,000 | 21,150,491 |
| Teva Pharmaceutical Finance Netherlands III BV | | 7.13 | 1-31-2025 | 8,500,000 | 8,606,250 |
| | | | | | 29,756,741 |
| Industrials: 1.24% | | | | | |
| Airlines: 0.75% | | | | | |
| Air Canada Pass-Through Trust Series 2020-1 Class C 144A | | 10.50 | 7-15-2026 | 11,315,000 | 12,050,475 |
| Electrical equipment: 0.10% | | | | | |
| Sensata Technologies BV 144A | | 5.63 | 11-1-2024 | 1,605,000 | 1,587,947 |
| Trading companies & distributors: 0.39% | | | | | |
| Fly Leasing Limited 144A | | 7.00 | 10-15-2024 | 7,330,000 | 6,359,425 |
| Materials: 2.07% | | | | | |
| Chemicals: 0.83% | | | | | |
| Park Aerospace Holdings Company 144A | | 5.50 | 2-15-2024 | 13,602,000 | 13,439,665 |
| Containers & packaging: 0.83% | | | | | |
| Ardagh Packaging Finance plc 144A | | 5.25 | 4-30-2025 | 13,934,000 | 13,470,695 |
| Metals & mining: 0.41% | | | | | |
| Constellium SE 144A | | 5.88 | 2-15-2026 | 6,710,000 | 6,552,349 |
| Total Yankee corporate bonds and notes (Cost $163,873,377) | | | | | 158,777,970 |
The accompanying notes are an integral part of these financial statements.
Allspring Short-Term High Income Fund | 15
Portfolio of investments—February 28, 2023 (unaudited)
| | | Yield | | Shares | Value |
| Short-term investments: 4.45% | | | | | |
| Investment companies: 4.45% | | | | | |
| Allspring Government Money Market Fund Select Class ♠∞## | | 4.39% | | 52,818,797 | $ 52,818,797 |
| Securities Lending Cash Investments LLC ♠∩∞ | | 4.54 | | 19,127,630 | 19,127,630 |
| Total Short-term investments (Cost $71,945,784) | | | | | 71,946,427 |
| Total investments in securities (Cost $1,674,068,661) | 100.92% | | | | 1,633,054,187 |
| Other assets and liabilities, net | (0.92) | | | | (14,941,976) |
| Total net assets | 100.00% | | | | $1,618,112,211 |
| 144A | The security may be resold in transactions exempt from registration, normally to qualified institutional buyers, pursuant to Rule 144A under the Securities Act of 1933. |
| < | All or a portion of the position represents an unfunded loan commitment. The rate represents the current interest rate if the loan is partially funded. |
| ± | Variable rate investment. The rate shown is the rate in effect at period end. |
| ‡ | Security is valued using significant unobservable inputs. |
| ## | All or a portion of this security is segregated for unfunded loans. |
| « | All or a portion of this security is on loan. |
| ♠ | The issuer of the security is an affiliated person of the Fund as defined in the Investment Company Act of 1940. |
| ∩ | The investment is a non-registered investment company purchased with cash collateral received from securities on loan. |
| ∞ | The rate represents the 7-day annualized yield at period end. |
| Abbreviations: |
| LIBOR | London Interbank Offered Rate |
| REIT | Real estate investment trust |
| SOFR | Secured Overnight Financing Rate |
Investments in affiliates
An affiliated investment is an investment in which the Fund owns at least 5% of the outstanding voting shares of the issuer or as a result of other relationships, such as the Fund and the issuer having the same investment manager. Transactions with issuers that were affiliates of the Fund at the end of the period were as follows:
| | Value,
beginning of
period | Purchases | Sales
proceeds | Net
realized
gains
(losses) | | Net
change in
unrealized
gains
(losses) | | Value,
end of
period | Shares,
end
of period | Income
from
affiliated
securities |
| Short-term investments | | | | | | | | | |
| Allspring Government Money Market Fund Select Class | $59,079,830 | $485,158,186 | $(491,419,219) | $ 0 | | $ 0 | | $ 52,818,797 | 52,818,797 | $ 1,121,106 |
| Securities Lending Cash Investments LLC | 257,700 | 84,750,288 | (65,879,720) | (1,281) | | 643 | | 19,127,630 | 19,127,630 | 288,007 # |
| | | | | $ (1,281) | | $643 | | $71,946,427 | | $1,409,113 |
| # | Amount shown represents income before fees and rebates. |
The accompanying notes are an integral part of these financial statements.
16 | Allspring Short-Term High Income Fund
Statement of assets and liabilities—February 28, 2023 (unaudited)
| | |
| Assets | |
Investments in unaffiliated securities (including $18,742,713 of securities loaned), at value (cost $1,602,122,877)
| $ 1,561,107,760 |
Investments in affiliated securities, at value (cost $71,945,784)
| 71,946,427 |
Cash
| 5,549,725 |
Receivable for interest
| 25,047,076 |
Receivable for Fund shares sold
| 2,811,899 |
Receivable for securities lending income, net
| 32,660 |
Prepaid expenses and other assets
| 169,728 |
Total assets
| 1,666,665,275 |
| Liabilities | |
Payable for investments purchased
| 23,600,108 |
Payable upon receipt of securities loaned
| 19,127,630 |
Payable for Fund shares redeemed
| 4,939,193 |
Management fee payable
| 499,829 |
Dividends payable
| 179,859 |
Administration fees payable
| 108,670 |
Distribution fee payable
| 12,138 |
Accrued expenses and other liabilities
| 85,637 |
Total liabilities
| 48,553,064 |
Total net assets
| $1,618,112,211 |
| Net assets consist of | |
Paid-in capital
| $ 1,712,057,765 |
Total distributable loss
| (93,945,554) |
Total net assets
| $1,618,112,211 |
| Computation of net asset value and offering price per share | |
Net assets – Class A
| $ 107,968,402 |
Shares outstanding – Class A1
| 13,905,291 |
Net asset value per share – Class A
| $7.76 |
Maximum offering price per share – Class A2
| $8.00 |
Net assets – Class C
| $ 21,012,246 |
Shares outstanding – Class C1
| 2,705,311 |
Net asset value per share – Class C
| $7.77 |
Net assets – Administrator Class
| $ 42,750,924 |
Shares outstanding – Administrator Class1
| 5,506,697 |
Net asset value per share – Administrator Class
| $7.76 |
Net assets – Institutional Class
| $ 1,446,380,639 |
Shares outstanding – Institutional Class1
| 186,552,532 |
Net asset value per share – Institutional Class
| $7.75 |
| 1 | The Fund has an unlimited number of authorized shares. |
| 2 | Maximum offering price is computed as 100/97 of net asset value. On investments of $50,000 or more, the offering price is reduced. |
The accompanying notes are an integral part of these financial statements.
Allspring Short-Term High Income Fund | 17
Statement of operations—six months ended February 28, 2023 (unaudited)
| | |
| Investment income | |
Interest
| $ 38,078,245 |
Income from affiliated securities
| 1,235,464 |
Total investment income
| 39,313,709 |
| Expenses | |
Management fee
| 3,339,838 |
| Administration fees | |
Class A
| 80,828 |
Class C
| 16,017 |
Administrator Class
| 25,680 |
Institutional Class
| 491,723 |
| Shareholder servicing fees | |
Class A
| 126,294 |
Class C
| 24,989 |
Administrator Class
| 64,201 |
| Distribution fee | |
Class C
| 74,967 |
Custody and accounting fees
| 30,562 |
Professional fees
| 33,977 |
Registration fees
| 29,845 |
Shareholder report expenses
| 18,191 |
Trustees’ fees and expenses
| 10,625 |
Other fees and expenses
| 7,013 |
Total expenses
| 4,374,750 |
| Less: Fee waivers and/or expense reimbursements | |
Fund-level
| (527,884) |
Class A
| (10,104) |
Class C
| (1,001) |
Administrator Class
| (30,817) |
Net expenses
| 3,804,944 |
Net investment income
| 35,508,765 |
| Realized and unrealized gains (losses) on investments | |
| Net realized losses on | |
Unaffiliated securities
| (2,616,128) |
Affiliated securities
| (1,281) |
Net realized losses on investments
| (2,617,409) |
| Net change in unrealized gains (losses) on | |
Unaffiliated securities
| 11,051,641 |
Affiliated securities
| 643 |
Net change in unrealized gains (losses) on investments
| 11,052,284 |
Net realized and unrealized gains (losses) on investments
| 8,434,875 |
Net increase in net assets resulting from operations
| $43,943,640 |
The accompanying notes are an integral part of these financial statements.
18 | Allspring Short-Term High Income Fund
Statement of changes in net assets
| | | | | |
| | Six months ended
February 28, 2023
(unaudited) | Year ended
August 31, 2022 |
| Operations | | | | |
Net investment income
| | $ 35,508,765 | | $ 40,573,223 |
Net realized losses on investments
| | (2,617,409) | | (1,017,745) |
Net change in unrealized gains (losses) on investments
| | 11,052,284 | | (68,869,372) |
Net increase (decrease) in net assets resulting from operations
| | 43,943,640 | | (29,313,894) |
| Distributions to shareholders from | | | | |
| Net investment income and net realized gains | | | | |
Class A
| | (2,384,502) | | (4,440,504) |
Class C
| | (397,212) | | (747,079) |
Administrator Class
| | (1,233,156) | | (3,101,812) |
Institutional Class
| | (31,224,379) | | (34,334,025) |
Total distributions to shareholders
| | (35,239,249) | | (42,623,420) |
| Capital share transactions | Shares | | Shares | |
| Proceeds from shares sold | | | | |
Class A
| 2,982,833 | 23,079,118 | 2,984,697 | 24,088,926 |
Class C
| 560,191 | 4,342,521 | 461,803 | 3,733,142 |
Administrator Class
| 810,232 | 6,289,058 | 2,784,449 | 22,285,584 |
Institutional Class
| 105,544,262 | 816,059,569 | 86,332,743 | 683,450,660 |
| | | 849,770,266 | | 733,558,312 |
| Reinvestment of distributions | | | | |
Class A
| 300,841 | 2,327,254 | 537,113 | 4,300,266 |
Class C
| 51,300 | 397,079 | 93,087 | 746,042 |
Administrator Class
| 159,155 | 1,229,749 | 386,235 | 3,095,742 |
Institutional Class
| 3,899,800 | 30,155,520 | 3,866,076 | 30,795,541 |
| | | 34,109,602 | | 38,937,591 |
| Payment for shares redeemed | | | | |
Class A
| (2,311,032) | (17,842,040) | (5,537,985) | (44,164,124) |
Class C
| (440,335) | (3,408,382) | (1,550,050) | (12,485,964) |
Administrator Class
| (3,296,043) | (25,567,680) | (5,289,215) | (41,553,437) |
Institutional Class
| (50,582,104) | (391,710,391) | (62,445,161) | (496,501,163) |
| | | (438,528,493) | | (594,704,688) |
Net increase in net assets resulting from capital share transactions
| | 445,351,375 | | 177,791,215 |
Total increase in net assets
| | 454,055,766 | | 105,853,901 |
| Net assets | | | | |
Beginning of period
| | 1,164,056,445 | | 1,058,202,544 |
End of period
| | $1,618,112,211 | | $1,164,056,445 |
The accompanying notes are an integral part of these financial statements.
Allspring Short-Term High Income Fund | 19
Financial highlights
(For a share outstanding throughout each period)
| | | Year ended August 31 |
| Class A | Six months ended
February 28, 2023
(unaudited) | 2022 | 2021 | 2020 | 2019 | 2018 |
Net asset value, beginning of period
| $7.72 | $8.25 | $8.09 | $8.07 | $7.99 | $8.07 |
Net investment income
| 0.18 | 0.29 | 0.28 | 0.26 | 0.25 | 0.24 |
Net realized and unrealized gains (losses) on investments
| 0.04 | (0.51) | 0.18 | 0.02 | 0.09 | (0.08) |
Total from investment operations
| 0.22 | (0.22) | 0.46 | 0.28 | 0.34 | 0.16 |
| Distributions to shareholders from | | | | | | |
Net investment income
| (0.18) | (0.31) | (0.30) | (0.26) | (0.26) | (0.24) |
Net asset value, end of period
| $7.76 | $7.72 | $8.25 | $8.09 | $8.07 | $7.99 |
Total return1
| 2.89% | (2.73)% | 5.73% | 3.61% | 4.40% | 2.00% |
| Ratios to average net assets (annualized) | | | | | | |
Gross expenses
| 0.91% | 0.92% | 0.93% | 0.94% | 0.94% | 0.93% |
Net expenses
| 0.81% | 0.81% | 0.80% | 0.81% | 0.81% | 0.81% |
Net investment income
| 4.76% | 3.65% | 3.46% | 3.19% | 3.18% | 2.96% |
| Supplemental data | | | | | | |
Portfolio turnover rate
| 13% | 43% | 63% | 78% | 44% | 34% |
Net assets, end of period (000s omitted)
| $107,968 | $99,828 | $123,375 | $97,985 | $104,671 | $127,024 |
| 1 | Total return calculations do not include any sales charges. Returns for periods of less than one year are not annualized. |
The accompanying notes are an integral part of these financial statements.
20 | Allspring Short-Term High Income Fund
Financial highlights
(For a share outstanding throughout each period)
| | | Year ended August 31 |
| Class C | Six months ended
February 28, 2023
(unaudited) | 2022 | 2021 | 2020 | 2019 | 2018 |
Net asset value, beginning of period
| $7.72 | $8.26 | $8.09 | $8.07 | $8.00 | $8.07 |
Net investment income
| 0.15 1 | 0.24 | 0.24 | 0.20 | 0.19 | 0.18 |
Net realized and unrealized gains (losses) on investments
| 0.05 | (0.53) | 0.17 | 0.02 | 0.08 | (0.07) |
Total from investment operations
| 0.20 | (0.29) | 0.41 | 0.22 | 0.27 | 0.11 |
| Distributions to shareholders from | | | | | | |
Net investment income
| (0.15) | (0.25) | (0.24) | (0.20) | (0.20) | (0.18) |
Net asset value, end of period
| $7.77 | $7.72 | $8.26 | $8.09 | $8.07 | $8.00 |
Total return2
| 2.64% | (3.58)% | 5.06% | 2.84% | 3.49% | 1.36% |
| Ratios to average net assets (annualized) | | | | | | |
Gross expenses
| 1.65% | 1.67% | 1.68% | 1.69% | 1.69% | 1.68% |
Net expenses
| 1.56% | 1.56% | 1.56% | 1.56% | 1.56% | 1.56% |
Net investment income
| 4.01% | 2.88% | 2.73% | 2.43% | 2.43% | 2.21% |
| Supplemental data | | | | | | |
Portfolio turnover rate
| 13% | 43% | 63% | 78% | 44% | 34% |
Net assets, end of period (000s omitted)
| $21,012 | $19,567 | $29,136 | $46,066 | $59,113 | $77,169 |
| 1 | Calculated based upon average shares outstanding |
| 2 | Total return calculations do not include any sales charges. Returns for periods of less than one year are not annualized. |
The accompanying notes are an integral part of these financial statements.
Allspring Short-Term High Income Fund | 21
Financial highlights
(For a share outstanding throughout each period)
| | | Year ended August 31 |
| Administrator Class | Six months ended
February 28, 2023
(unaudited) | 2022 | 2021 | 2020 | 2019 | 2018 |
Net asset value, beginning of period
| $7.72 | $8.25 | $8.09 | $8.06 | $7.99 | $8.07 |
Net investment income
| 0.19 | 0.30 | 0.30 1 | 0.27 | 0.27 | 0.25 |
Net realized and unrealized gains (losses) on investments
| 0.04 | (0.51) | 0.17 | 0.03 | 0.08 | (0.08) |
Total from investment operations
| 0.23 | (0.21) | 0.47 | 0.30 | 0.35 | 0.17 |
| Distributions to shareholders from | | | | | | |
Net investment income
| (0.19) | (0.32) | (0.31) | (0.27) | (0.28) | (0.25) |
Net asset value, end of period
| $7.76 | $7.72 | $8.25 | $8.09 | $8.06 | $7.99 |
Total return2
| 2.97% | (2.58)% | 5.90% | 3.90% | 4.44% | 2.16% |
| Ratios to average net assets (annualized) | | | | | | |
Gross expenses
| 0.85% | 0.86% | 0.87% | 0.88% | 0.87% | 0.86% |
Net expenses
| 0.65% | 0.65% | 0.65% | 0.65% | 0.65% | 0.65% |
Net investment income
| 4.85% | 3.80% | 3.63% | 3.29% | 3.34% | 3.13% |
| Supplemental data | | | | | | |
Portfolio turnover rate
| 13% | 43% | 63% | 78% | 44% | 34% |
Net assets, end of period (000s omitted)
| $42,751 | $60,460 | $82,124 | $52,406 | $86,892 | $102,673 |
| 1 | Calculated based upon average shares outstanding |
| 2 | Returns for periods of less than one year are not annualized. |
The accompanying notes are an integral part of these financial statements.
22 | Allspring Short-Term High Income Fund
Financial highlights
(For a share outstanding throughout each period)
| | | Year ended August 31 |
| Institutional Class | Six months ended
February 28, 2023
(unaudited) | 2022 | 2021 | 2020 | 2019 | 2018 |
Net asset value, beginning of period
| $7.71 | $8.24 | $8.08 | $8.05 | $7.98 | $8.06 |
Net investment income
| 0.19 | 0.32 | 0.31 1 | 0.29 | 0.28 | 0.27 |
Net realized and unrealized gains (losses) on investments
| 0.04 | (0.52) | 0.17 | 0.03 | 0.08 | (0.08) |
Total from investment operations
| 0.23 | (0.20) | 0.48 | 0.32 | 0.36 | 0.19 |
| Distributions to shareholders from | | | | | | |
Net investment income
| (0.19) | (0.33) | (0.32) | (0.29) | (0.29) | (0.27) |
Net asset value, end of period
| $7.75 | $7.71 | $8.24 | $8.08 | $8.05 | $7.98 |
Total return2
| 3.05% | (2.44)% | 6.06% | 4.06% | 4.59% | 2.31% |
| Ratios to average net assets (annualized) | | | | | | |
Gross expenses
| 0.58% | 0.59% | 0.60% | 0.61% | 0.61% | 0.59% |
Net expenses
| 0.50% | 0.50% | 0.50% | 0.50% | 0.50% | 0.50% |
Net investment income
| 5.12% | 3.99% | 3.78% | 3.47% | 3.49% | 3.27% |
| Supplemental data | | | | | | |
Portfolio turnover rate
| 13% | 43% | 63% | 78% | 44% | 34% |
Net assets, end of period (000s omitted)
| $1,446,381 | $984,201 | $823,568 | $554,044 | $701,157 | $764,680 |
| 1 | Calculated based upon average shares outstanding |
| 2 | Returns for periods of less than one year are not annualized. |
The accompanying notes are an integral part of these financial statements.
Allspring Short-Term High Income Fund | 23
Notes to financial statements (unaudited)
1. ORGANIZATION
Allspring Funds Trust (the "Trust"), a Delaware statutory trust organized on March 10, 1999, is an open-end management investment company registered under the Investment Company Act of 1940, as amended (the "1940 Act"). As an investment company, the Trust follows the accounting and reporting guidance in Financial Accounting Standards Board ("FASB") Accounting Standards Codification Topic 946, Financial Services – Investment Companies. These financial statements report on the Allspring Short-Term High Income Fund (formerly, Allspring Short-Term High Yield Bond Fund) (the "Fund") which is a diversified series of the Trust.
2. SIGNIFICANT ACCOUNTING POLICIES
The following significant accounting policies, which are consistently followed in the preparation of the financial statements of the Fund, are in conformity with U.S. generally accepted accounting principles which require management to make estimates and assumptions that affect the reported amounts of assets and liabilities, disclosure of contingent assets and liabilities at the date of the financial statements, and the reported amounts of income and expenses during the reporting period. Actual results could differ from those estimates.
Securities valuation
All investments are valued each business day as of the close of regular trading on the New York Stock Exchange (generally 4 p.m. Eastern Time), although the Fund may deviate from this calculation time under unusual or unexpected circumstances.
Debt securities are valued at the evaluated bid price provided by an independent pricing service (e.g. taking into account various factors, including yields, maturities, or credit ratings) or, if a reliable price is not available, the quoted bid price from an independent broker-dealer.
Equity securities that are listed on a foreign or domestic exchange or market are valued at the official closing price or, if none, the last sales price.
Investments in registered open-end investment companies (other than those listed on a foreign or domestic exchange or market) are valued at net asset value. Interests in non-registered investment companies that are redeemable at net asset value are fair valued normally at net asset value.
Investments which are not valued using the methods discussed above are valued at their fair value, as determined in good faith by Allspring Funds Management, LLC ("Allspring Funds Management"), which was named the valuation designee by the Board of Trustees. As the valuation designee, Allspring Funds Management is responsible for day-to-day valuation activities for the Allspring Funds. In connection with these responsibilities, Allspring Funds Management has established a Valuation Committee and has delegated to it the authority to take any actions regarding the valuation of portfolio securities that the Valuation Committee deems necessary or appropriate, including determining the fair value of portfolio securities. On a quarterly basis, the Board of Trustees receives reports of valuation actions taken by the Valuation Committee. On at least an annual basis, the Board of Trustees receives an assessment of the adequacy and effectiveness of Allspring Funds Management's process for determining the fair value of the portfolio of investments.
Securities lending
The Fund may lend its securities from time to time in order to earn additional income in the form of fees or interest on securities received as collateral or the investment of any cash received as collateral. When securities are on loan, the Fund receives interest or dividends on those securities. Cash collateral received in connection with its securities lending transactions is invested in Securities Lending Cash Investments, LLC (the "Securities Lending Fund"), an affiliated non-registered investment company. Investments in Securities Lending Fund are valued at the evaluated bid price provided by an independent pricing service. Income earned from investment in the Securities Lending Fund (net of fees and rebates), if any, is included in income from affiliated securities on the Statement of Operations.
In a securities lending transaction, the net asset value of the Fund is affected by an increase or decrease in the value of the securities loaned and by an increase or decrease in the value of the instrument in which collateral is invested. The amount of securities lending activity undertaken by the Fund fluctuates from time to time. The Fund has the right under the lending agreement to recover the securities from the borrower on demand. In the event of default or bankruptcy by the borrower, the Fund may be prevented from recovering the loaned securities or gaining access to the collateral or may experience delays or costs in doing so. In such an event, the terms of the agreement allow the unaffiliated securities lending agent to use the collateral to purchase replacement securities on behalf of the Fund or pay the Fund the market value of the loaned securities. The Fund bears the risk of loss with respect to depreciation of its investment of the cash collateral.
24 | Allspring Short-Term High Income Fund
Notes to financial statements (unaudited)
When-issued transactions
The Fund may purchase securities on a forward commitment or when-issued basis. The Fund records a when-issued transaction on the trade date and will segregate assets in an amount at least equal in value to the Fund's commitment to purchase when-issued securities. Securities purchased on a when-issued basis are marked-to-market daily and the Fund begins earning interest on the settlement date. Losses may arise due to changes in the market value of the underlying securities or if the counterparty does not perform under the contract.
Loans
The Fund may invest in direct debt instruments which are interests in amounts owed to lenders by corporate or other borrowers. The loans pay interest at rates which are periodically reset by reference to a base lending rate plus a spread. Investments in loans may be in the form of participations in loans or assignments of all or a portion of loans from third parties. When the Fund purchases participations, it generally has no rights to enforce compliance with the terms of the loan agreement with the borrower. As a result, the Fund assumes the credit risk of both the borrower and the lender that is selling the participation. When the Fund purchases assignments from lenders, it acquires direct rights against the borrower on the loan and may enforce compliance by the borrower with the terms of the loan agreement. Loans may include fully funded term loans or unfunded loan commitments, which are contractual obligations for future funding.
Security transactions and income recognition
Securities transactions are recorded on a trade date basis. Realized gains or losses are recorded on the basis of identified cost.
Interest income is accrued daily and bond discounts are accreted and premiums are amortized daily. To the extent debt obligations are placed on non-accrual status, any related interest income may be reduced by writing off interest receivables when the collection of all or a portion of interest has been determined to be doubtful based on consistently applied procedures and the fair value has decreased. If the issuer subsequently resumes interest payments or when the collectability of interest is reasonably assured, the debt obligation is removed from non-accrual status. Paydown gains and losses are included in interest income.
Distributions to shareholders
Distributions to shareholders from net investment income are declared daily and paid monthly. Distributions from net realized gains, if any, are recorded on the ex-dividend date and paid at least annually. Such distributions are determined in accordance with income tax regulations and may differ from U.S. generally accepted accounting principles. Dividend sources are estimated at the time of declaration. The tax character of distributions is determined as of the Fund's fiscal year end. Therefore, a portion of the Fund's distributions made prior to the Fund’s fiscal year end may be categorized as a tax return of capital at year end.
Federal and other taxes
The Fund intends to continue to qualify as a regulated investment company by distributing substantially all of its investment company taxable income and any net realized capital gains (after reduction for capital loss carryforwards) sufficient to relieve it from all, or substantially all, federal income taxes. Accordingly, no provision for federal income taxes was required.
The Fund’s income and federal excise tax returns and all financial records supporting those returns for the prior three fiscal years are subject to examination by the federal and Delaware revenue authorities. Management has analyzed the Fund's tax positions taken on federal, state, and foreign tax returns, as applicable, for all open tax years and does not believe that there are any uncertain tax positions that require recognition of a tax liability.
As of February 28, 2023, the aggregate cost of all investments for federal income tax purposes was $1,676,507,661 and the unrealized gains (losses) consisted of:
| Gross unrealized gains | $ 5,456,618 |
| Gross unrealized losses | (48,910,092) |
| Net unrealized losses | $(43,453,474) |
As of August 31, 2022, the Fund had capital loss carryforwards which consisted of $15,095,105 in short-term capital losses and $32,843,197 in long-term capital losses.
Class allocations
The separate classes of shares offered by the Fund differ principally in applicable sales charges, distribution, shareholder servicing, and administration fees. Class specific expenses are charged directly to that share class. Investment income, common
Allspring Short-Term High Income Fund | 25
Notes to financial statements (unaudited)
fund-level expenses, and realized and unrealized gains (losses) on investments are allocated daily to each class of shares based on the relative proportion of net assets of each class.
3. FAIR VALUATION MEASUREMENTS
Fair value measurements of investments are determined within a framework that has established a fair value hierarchy based upon the various data inputs utilized in determining the value of the Fund’s investments. The three-level hierarchy gives the highest priority to unadjusted quoted prices in active markets for identical assets or liabilities (Level 1) and the lowest priority to unobservable inputs (Level 3). The Fund’s investments are classified within the fair value hierarchy based on the lowest level of input that is significant to the fair value measurement. The inputs are summarized into three broad levels as follows:
| ■ | Level 1 – quoted prices in active markets for identical securities |
| ■ | Level 2 – other significant observable inputs (including quoted prices for similar securities, interest rates, prepayment speeds, credit risk, etc.) |
| ■ | Level 3 – significant unobservable inputs (including the Fund’s own assumptions in determining the fair value of investments) |
The inputs or methodologies used for valuing investments in securities are not necessarily an indication of the risk associated with investing in those securities.
The following is a summary of the inputs used in valuing the Fund’s assets and liabilities as of February 28, 2023:
| | Quoted prices
(Level 1) | Other significant
observable inputs
(Level 2) | Significant
unobservable inputs
(Level 3) | Total |
| Assets | | | | |
| Investments in: | | | | |
| Corporate bonds and notes | $ 0 | $ 1,302,115,472 | $ 0 | $ 1,302,115,472 |
| Loans | 0 | 95,521,489 | 4,692,829 | 100,214,318 |
| Yankee corporate bonds and notes | 0 | 158,777,970 | 0 | 158,777,970 |
| Short-term investments | | | | |
| Investment companies | 71,946,427 | 0 | 0 | 71,946,427 |
| Total assets | $71,946,427 | $1,556,414,931 | $4,692,829 | $1,633,054,187 |
Additional sector, industry or geographic detail, if any, is included in the Portfolio of Investments.
For the six months ended February 28, 2023, the Fund did not have any transfers into/out of Level 3.
4. TRANSACTIONS WITH AFFILIATES
Management fee
Allspring Funds Management, a wholly owned subsidiary of Allspring Global Investments Holdings, LLC, a holding company indirectly owned by certain private funds of GTCR LLC and Reverence Capital Partners, L.P., is the manager of the Fund and provides advisory and fund-level administrative services under an investment management agreement. Under the investment management agreement, Allspring Funds Management is responsible for, among other services, implementing the investment objectives and strategies of the Fund, supervising the subadviser and providing fund-level administrative services in connection with the Fund’s operations. As compensation for its services under the investment management agreement, Allspring Funds Management is entitled to receive a management fee at the following annual rate based on the Fund’s average daily net assets:
| Average daily net assets | Management fee |
| First $500 million | 0.500% |
| Next $500 million | 0.475 |
| Next $2 billion | 0.450 |
| Next $2 billion | 0.425 |
| Next $5 billion | 0.390 |
| Over $10 billion | 0.380 |
26 | Allspring Short-Term High Income Fund
Notes to financial statements (unaudited)
For the six months ended February 28, 2023, the management fee was equivalent to an annual rate of 0.48% of the Fund’s average daily net assets.
Allspring Funds Management has retained the services of a subadviser to provide daily portfolio management to the Fund. The fee for subadvisory services is borne by Allspring Funds Management. Allspring Global Investments, LLC ("Allspring Investments"), an affiliate of Allspring Funds Management and a wholly owned subsidiary of Allspring Global Investments Holdings, LLC, is the subadviser to the Fund and is entitled to receive a fee from Allspring Funds Management at an annual rate starting at 0.35% and declining to 0.20% as the average daily net assets of the Fund increase.
Administration fees
Under a class-level administration agreement, Allspring Funds Management provides class-level administrative services to the Fund, which includes paying fees and expenses for services provided by the transfer agent, sub-transfer agents, omnibus account servicers and record-keepers. As compensation for its services under the class-level administration agreement, Allspring Funds Management receives an annual fee which is calculated based on the average daily net assets of each class as follows:
| | Class-level
administration fee |
| Class A | 0.16% |
| Class C | 0.16 |
| Administrator Class | 0.10 |
| Institutional Class | 0.08 |
Waivers and/or expense reimbursements
Allspring Funds Management has contractually committed to waive and/or reimburse management and administration fees to the extent necessary to maintain certain net operating expense ratios for the Fund. When each class of the Fund has exceeded its expense cap, Allspring Funds Management will waive fees and/or reimburse expenses from fund-level expenses on a proportionate basis and then from class specific expenses. When only certain classes exceed their expense caps, waivers and/or reimbursements are applied against class specific expenses before fund-level expenses. Allspring Funds Management has contractually committed through December 31, 2023 to waive fees and/or reimburse expenses to the extent necessary to cap expenses. Prior to or after the commitment expiration date, the caps may be increased or the commitment to maintain the caps may be terminated only with the approval of the Board of Trustees. As of February 28, 2023, the contractual expense caps are as follows:
| | Expense ratio caps |
| Class A | 0.81% |
| Class C | 1.56 |
| Administrator Class | 0.65 |
| Institutional Class | 0.50 |
Distribution fee
The Trust has adopted a distribution plan for Class C shares pursuant to Rule 12b-1 under the 1940 Act. A distribution fee is charged to Class C shares and paid to Allspring Funds Distributor, LLC ("Allspring Funds Distributor"), the principal underwriter, an affiliate of Allspring Funds Management, at an annual rate up to 0.75% of the average daily net assets of Class C shares.
In addition, Allspring Funds Distributor is entitled to receive the front-end sales charge from the purchase of Class A shares and a contingent deferred sales charge on the redemption of certain Class A shares. Allspring Funds Distributor is also entitled to receive the contingent deferred sales charges from redemptions of Class C shares. For the six months ended February 28, 2023, Allspring Funds Distributor received $4,434 from the sale of Class A shares. No contingent deferred sales charges were incurred by Class A and Class C shares for the six months ended February 28, 2023.
Allspring Short-Term High Income Fund | 27
Notes to financial statements (unaudited)
Shareholder servicing fees
The Trust has entered into contracts with one or more shareholder servicing agents, whereby Class A, Class C and Administrator Class are charged a fee at an annual rate up to 0.25% of the average daily net assets of each respective class. A portion of these total shareholder servicing fees were paid to affiliates of the Fund.
Interfund transactions
The Fund may purchase or sell portfolio investment securities to certain affiliates pursuant to Rule 17a-7 under the 1940 Act and under procedures adopted by the Board of Trustees. The procedures have been designed to ensure that these interfund transactions, which do not incur broker commissions, are effected at current market prices.
5. INVESTMENT PORTFOLIO TRANSACTIONS
Purchases and sales of investments, excluding U.S. government obligations (if any) and short-term securities, for the six months ended February 28, 2023 were $695,017,590 and $172,056,251, respectively.
As of February 28, 2023, the Fund had the following unfunded loan commitments:
| | Unfunded commitments | Unrealized
gain (loss) |
| Asurion LLC | $ 8,510,946 | $ 52,055 |
| Gray Television Incorporated | 1,690,500 | 10,057 |
| SkyMiles IP Limited | 4,400,044 | 36,706 |
| The Chemours Company | 1,995,000 | 2,046 |
| The E.W. Scripps Company | 1,876,250 | 11,476 |
| The Geo Group Incoprated | 4,050,000 | (22,840) |
| | $22,522,740 | $ 89,500 |
6. SECURITIES LENDING TRANSACTIONS
The Fund lends its securities through an unaffiliated securities lending agent and receives collateral in the form of cash or securities with a value at least equal to the value of the securities on loan. The value of the loaned securities is determined at the close of each business day and any increases or decreases in the required collateral are exchanged between the Fund and the counterparty on the next business day. Cash collateral received is invested in the Securities Lending Fund which seeks to provide a positive return compared to the daily Federal Funds Open Rate by investing in high-quality, U.S. dollar-denominated short-term money market instruments and is exempt from registration under Section 3(c)(7) of the 1940 Act. Securities Lending Fund is managed by Allspring Funds Management and is subadvised by Allspring Investments. Allspring Funds Management receives an advisory fee starting at 0.05% and declining to 0.01% as the average daily net assets of the Securities Lending Fund increase. All of the fees received by Allspring Funds Management are paid to Allspring Investments for its services as subadviser.
In the event of counterparty default or the failure of a borrower to return a loaned security, the Fund has the right to use the collateral to offset any losses incurred. As of February 28, 2023, the Fund had securities lending transactions with the following counterparties which are subject to offset:
| Counterparty | Value of
securities on
loan | Collateral
received1 | Net amount |
| Bank of America Securities Incorporated | $ 3,308,805 | $ (3,308,805) | $0 |
| Barclays Capital Incorporated | 14,862,736 | (14,862,736) | 0 |
| Citigroup Global Markets Incorporated | 473,964 | (473,964) | 0 |
| JPMorgan Securities LLC | 97,208 | (97,208) | 0 |
1 Collateral disclosed within this table is limited to the net transaction with the counterparty.
28 | Allspring Short-Term High Income Fund
Notes to financial statements (unaudited)
7. BANK BORROWINGS
The Trust (excluding the money market funds), Allspring Master Trust and Allspring Variable Trust are parties to a $350,000,000 revolving credit agreement whereby the Fund is permitted to use bank borrowings for temporary or emergency purposes, such as to fund shareholder redemption requests. Interest under the credit agreement is charged to the Fund based on a borrowing rate equal to the higher of the Federal Funds rate or the overnight bank funding rate in effect on that day plus a spread. In addition, an annual commitment fee equal based on the unused balance is allocated to each participating fund.
For the six months ended February 28, 2023, there were no borrowings by the Fund under the agreement.
8. MARKET RISKS
On March 11, 2020, the World Health Organization announced that it had made the assessment that coronavirus disease 2019 (“COVID-19”) is a pandemic. The impacts of COVID-19 are affecting the entire global economy, individual companies and investment products, the funds, and the market in general. There is significant uncertainty around the extent and duration of business disruptions related to COVID-19 and the impacts may last for an extended period of time. COVID-19 has led to significant uncertainty and volatility in the financial markets.
9. INDEMNIFICATION
Under the Fund's organizational documents, the officers and Trustees have been granted certain indemnification rights against certain liabilities that may arise out of performance of their duties to the Fund. The Fund has entered into a separate agreement with each Trustee that converts indemnification rights currently existing under the Fund’s organizational documents into contractual rights that cannot be changed in the future without the consent of the Trustee. Additionally, in the normal course of business, the Fund may enter into contracts with service providers that contain a variety of indemnification clauses. The Fund’s maximum exposure under these arrangements is dependent on future claims that may be made against the Fund and, therefore, cannot be estimated.
Allspring Short-Term High Income Fund | 29
Other information (unaudited)
PROXY VOTING INFORMATION
A description of the policies and procedures used to determine how to vote proxies relating to portfolio securities is available without charge, upon request, by calling 1-800-222-8222, visiting our website at allspringglobal.com, or visiting the SEC website at sec.gov. Information regarding how the proxies related to portfolio securities were voted during the most recent 12-month period ended June 30 is available on the website at allspringglobal.com or by visiting the SEC website at sec.gov.
QUARTERLY PORTFOLIO HOLDINGS INFORMATION
The Fund files its complete schedule of portfolio holdings with the SEC for the first and third quarters of each fiscal year as an exhibit to its reports on Form N-PORT. Shareholders may view the filed Form N-PORT by visiting the SEC website at sec.gov.
30 | Allspring Short-Term High Income Fund
Other information (unaudited)
BOARD OF TRUSTEES AND OFFICERS
Each of the Trustees and Officers listed in the table below acts in identical capacities for each fund in the Allspring family of funds, which consists of 127 mutual funds comprising the Allspring Funds Trust, Allspring Variable Trust, Allspring Master Trust and four closed-end funds (collectively the “Fund Complex”). This table should be read in conjunction with the Prospectus and the Statement of Additional Information1. The mailing address of each Trustee and Officer is 1415 Vantage Park Drive, 3rd Floor, Charlotte, NC 28203. Each Trustee and Officer serves an indefinite term, however, each Trustee serves such term until reaching the mandatory retirement age established by the Trustees.
Independent Trustees
Name and
year of birth | Position held and
length of service* | Principal occupations during past five years or longer | Current other
public company or
investment
company
directorships |
William R. Ebsworth
(Born 1957) | Trustee,
since 2015 | Retired. From 1984 to 2013, equities analyst, portfolio manager, research director and chief investment officer at Fidelity Management and Research Company in Boston, Tokyo, and Hong Kong, and retired in 2013 as Chief Investment Officer of Fidelity Strategic Advisers, Inc. where he led a team of investment professionals managing client assets. Prior thereto, Board member of Hong Kong Securities Clearing Co., Hong Kong Options Clearing Corp., the Thailand International Fund, Ltd., Fidelity Investments Life Insurance Company, and Empire Fidelity Investments Life Insurance Company. Audit Committee Chair and Investment Committee Chair of the Vincent Memorial Hospital Foundation (non-profit organization). Mr. Ebsworth is a CFA® charterholder. | N/A |
Jane A. Freeman
(Born 1953) | Trustee,
since 2015;
Chair Liaison,
since 2018 | Retired. From 2012 to 2014 and 1999 to 2008, Chief Financial Officer of Scientific Learning Corporation. From 2008 to 2012, Ms. Freeman provided consulting services related to strategic business projects. Prior to 1999, Portfolio Manager at Rockefeller & Co. and Scudder, Stevens & Clark. Board member of the Harding Loevner Funds from 1996 to 2014, serving as both Lead Independent Director and chair of the Audit Committee. Board member of the Russell Exchange Traded Funds Trust from 2011 to 2012 and the chair of the Audit Committee. Ms. Freeman is also an inactive Chartered Financial Analyst. | N/A |
Isaiah Harris, Jr.
(Born 1952) | Trustee,
since 2009; Audit
Committee
Chair,
since 2019 | Retired. Member of the Advisory Board of CEF of East Central Florida. Chairman of the Board of CIGNA Corporation from 2009 to 2021, and Director from 2005 to 2008. From 2003 to 2011, Director of Deluxe Corporation. Prior thereto, President and CEO of BellSouth Advertising and Publishing Corp. from 2005 to 2007, President and CEO of BellSouth Enterprises from 2004 to 2005 and President of BellSouth Consumer Services from 2000 to 2003. Emeritus member of the Iowa State University Foundation Board of Governors. Emeritus Member of the Advisory Board of Iowa State University School of Business. Advisory Board Member, Palm Harbor Academy (private school). Advisory Board Member, Fellowship of Christian Athletes. Mr. Harris is a certified public accountant (inactive status). | N/A |
David F. Larcker
(Born 1950) | Trustee,
since 2009 | Distinguished Visiting Fellow at the Hoover Institution since 2022. James Irvin Miller Professor of Accounting at the Graduate School of Business (Emeritus), Stanford University, Director of the Corporate Governance Research Initiative and Senior Faculty of The Rock Center for Corporate Governance since 2006. From 2005 to 2008, Professor of Accounting at the Graduate School of Business, Stanford University. Prior thereto, Ernst & Young Professor of Accounting at The Wharton School, University of Pennsylvania from 1985 to 2005. | N/A |
Allspring Short-Term High Income Fund | 31
Other information (unaudited)
Name and
year of birth | Position held and
length of service* | Principal occupations during past five years or longer | Current other
public company or
investment
company
directorships |
Olivia S. Mitchell
(Born 1953) | Trustee,
since 2006;
Nominating and
Governance
Committee Chair,
since 2018 | International Foundation of Employee Benefit Plans Professor since 1993, Wharton School of the University of Pennsylvania. Director of Wharton’s Pension Research Council and Boettner Center on Pensions & Retirement Research, and Research Associate at the National Bureau of Economic Research. Previously taught at Cornell University from 1978 to 1993. | N/A |
Timothy J. Penny
(Born 1951) | Trustee,
since 1996;
Chair,
since 2018 | President and Chief Executive Officer of Southern Minnesota Initiative Foundation, a non-profit organization, since 2007. Vice Chair of the Economic Club of Minnesota, since 2007. Co-Chair of the Committee for a Responsible Federal Budget, since 1995. Member of the Board of Trustees of NorthStar Education Finance, Inc., a non-profit organization, from 2007-2022. Senior Fellow of the University of Minnesota Humphrey Institute from 1995 to 2017. | N/A |
James G. Polisson
(Born 1959) | Trustee,
since 2018 | Retired. Chief Marketing Officer, Source (ETF) UK Services, Ltd, from 2015 to 2017. From 2012 to 2015, Principal of The Polisson Group, LLC, a management consulting, corporate advisory and principal investing company. Chief Executive Officer and Managing Director at Russell Investments, Global Exchange Traded Funds from 2010 to 2012. Managing Director of Barclays Global Investors from 1998 to 2010 and Global Chief Marketing Officer for iShares and Barclays Global Investors from 2000 to 2010. Trustee of the San Francisco Mechanics’ Institute, a non-profit organization, from 2013 to 2015. Board member of the Russell Exchange Traded Fund Trust from 2011 to 2012. Director of Barclays Global Investors Holdings Deutschland GmbH from 2006 to 2009. Mr. Polisson is an attorney and has a retired status with the Massachusetts and District of Columbia Bar Associations. | N/A |
Pamela Wheelock
(Born 1959) | Trustee,
since January
2020; previously
Trustee from
January 2018 to
July 2019 | Retired. Executive and Senior Financial leadership positions in the public, private and nonprofit sectors. Interim President and CEO, McKnight Foundation, 2020. Interim Commissioner, Minnesota Department of Human Services, 2019. Chief Operating Officer, Twin Cities Habitat for Humanity, 2017-2019. Vice President for University Services, University of Minnesota, 2012-2016. Interim President and CEO, Blue Cross and Blue Shield of Minnesota, 2011-2012. Executive Vice-President and Chief Financial Officer, Minnesota Wild, 2002-2008. Commissioner, Minnesota Department of Finance, 1999-2002. Chair of the Board of Directors of Destination Medical Center Corporation. Board member of the Minnesota Wild Foundation. | N/A |
* Length of service dates reflect the Trustee’s commencement of service with the Trust’s predecessor entities, where applicable.
32 | Allspring Short-Term High Income Fund
Other information (unaudited)
Officers2
Name and
year of birth | Position held and
length of service | Principal occupations during past five years or longer |
Andrew Owen
(Born 1960) | President,
since 2017 | President and Chief Executive Officer of Allspring Funds Management, LLC since 2017 and Head of Global Fund Governance of Allspring Global Investments since 2022. Prior thereto, co-president of Galliard Capital Management, LLC, an affiliate of Allspring Funds Management, LLC, from 2019 to 2022 and Head of Affiliated Managers, Allspring Global Investments, from 2014 to 2019 and Executive Vice President responsible for marketing, investments and product development for Allspring Funds Management, LLC, from 2009 to 2014. |
Jeremy DePalma
(Born 1974) | Treasurer,
since 2012
(for certain funds in
the Fund Complex);
since 2021 (for
the remaining funds in the
Fund Complex) | Senior Vice President of Allspring Funds Management, LLC since 2009. Senior Vice President of Evergreen Investment Management Company, LLC from 2008 to 2010 and head of the Fund Reporting and Control Team within Fund Administration from 2005 to 2010. |
Christopher Baker
(Born 1976) | Chief Compliance Officer, since 2022 | Global Chief Compliance Officer for Allspring Global Investments since 2022. Prior thereto, Chief Compliance Officer for State Street Global Advisors from 2018 to 2021. Senior Compliance Officer for the State Street divisions of Alternative Investment Solutions, Sector Solutions, and Global Marketing from 2015 to 2018. From 2010 to 2015 Vice President, Global Head of Investment and Marketing Compliance for State Street Global Advisors. |
Matthew Prasse
(Born 1983) | Chief Legal Officer, since 2022; Secretary, since 2021 | Senior Counsel of the Allspring Legal Department since 2021. Senior Counsel of the Wells Fargo Legal Department from 2018 to 2021. Previously, Counsel for Barings LLC from 2015 to 2018. Prior to joining Barings, Associate at Morgan, Lewis & Bockius LLP from 2008 to 2015. |
1 The Statement of Additional Information includes additional information about the Trustees and is available, without charge, upon request, by calling 1-800-222-8222 or by visiting the website at allspringglobal.com.
2 For those Officers with tenures at Allspring Global Investments and/or Allspring Funds Management, LLC that began prior to 2021, such tenures include years of service during which these businesses/entities were known as Wells Fargo Asset Management and Wells Fargo Funds Management, LLC, respectively.
Allspring Short-Term High Income Fund | 33
For more information
More information about Allspring Funds is available free upon request. To obtain literature, please write, visit the Fund's website, or call:
Allspring Funds
P.O. Box 219967
Kansas City, MO 64121-9967
Website: allspringglobal.com
Individual investors: 1-800-222-8222
Retail investment professionals: 1-888-877-9275
Institutional investment professionals: 1-800-260-5969
This report and the financial statements contained herein are submitted for the general information of the shareholders of the Fund. If this report is used for promotional purposes, distribution of the report must be accompanied or preceded by a current prospectus. Before investing, please consider the investment objectives, risks, charges, and expenses of the investment. For a current prospectus and, if available, a summary prospectus, containing this information, call
1-800-222-8222 or visit the Fund's website at allspringglobal.com. Read the prospectus carefully before you invest or send money.
Allspring Global InvestmentsTM is the trade name for the asset management firms of Allspring Global Investments Holdings, LLC, a holding company indirectly owned by certain private funds of GTCR LLC and Reverence Capital Partners, L.P. These firms include but are not limited to Allspring Global Investments, LLC, and Allspring Funds Management, LLC. Certain products managed by Allspring entities are distributed by Allspring Funds Distributor, LLC (a broker-dealer and Member FINRA/SIPC).
This material is for general informational and educational purposes only and is NOT intended to provide investment advice or a recommendation of any kind - including a recommendation for any specific investment, strategy, or plan.
© 2023 Allspring Global Investments Holdings, LLC. All rights reserved.
ALL-03102023-838daj8e 04-23
SAR3017 02-23
Semi-Annual Report
February 28, 2023
Allspring
Ultra Short-Term Income Fund
The views expressed and any forward-looking statements are as of February 28, 2023, unless otherwise noted, and are those of the Fund's portfolio managers and/or Allspring Global Investments. Discussions of individual securities or the markets generally are not intended as individual recommendations. Future events or results may vary significantly from those expressed in any forward-looking statements. The views expressed are subject to change at any time in response to changing circumstances in the market. Allspring Global Investments disclaims any obligation to publicly update or revise any views expressed or forward-looking statements.
Allspring Ultra Short-Term Income Fund | 1
Letter to shareholders (unaudited)
Andrew Owen
President
Allspring Funds
Dear Shareholder:
We are pleased to offer you this semi-annual report for the Allspring Ultra Short-Term Income Fund for the six-month period that ended February 28, 2023. Globally, stocks and bonds experienced heightened volatility through the challenging period. Earlier tailwinds provided by global stimulus programs, vaccination rollouts, and recovering consumer and corporate sentiment were wiped away by the highest rate of inflation in four decades as well as the impact of ongoing aggressive central bank rate hikes and the prospect of more rate hikes. Compounding these concerns were the global reverberations of the Russia-Ukraine war and the impact of China’s strict COVID-19 lockdowns.
For the six-month period, stocks and bonds had mixed results, with non-U.S. equities––both developed market and emerging market––outperforming U.S. stocks overall. Bonds––both U.S. and non-U.S.––began to recover from sustained aggressive interest rate increases. After suffering deep and broad losses over the past year, recent fixed income performance benefited from a base of higher yields that can now generate higher income. For the period, U.S. stocks, based on the S&P 500 Index,1 returned 1.26%. International stocks, as measured by the MSCI ACWI ex USA Index (Net),2 returned 7.30%, while the MSCI EM Index (Net) (USD)3 lost 2.29%. Among bond indexes, the Bloomberg U.S. Aggregate Bond Index4 returned -2.13%, the Bloomberg Global Aggregate ex-USD Index (unhedged)5 returned -0.11%, the Bloomberg Municipal Bond Index6 gained 0.66%, and the ICE BofA U.S. High Yield Index7 returned 2.41%.
The Russia-Ukraine war, high inflation, and central bank rate hikes rocked markets
A challenging calendar year for investors continued in September as all asset classes suffered major losses. Central banks kept up their battle against rapidly rising prices with more rate hikes. The strength of the U.S. dollar weighed on results for investors holding non-U.S.-dollar assets. U.S. mortgage rates jumped to near 7% on 30-year fixed-rate mortgages; the decreased housing affordability began to cool demand somewhat. The U.K. experienced a sharp sell-off of government bonds and the British pound in September as investors panicked in response to a new government budget that was seen as financially unsound. The Bank of England (BoE) then stepped in and bought long-dated government bonds.
“ A challenging calendar year for investors continued in September as all asset classes suffered major losses.”
| 1 | The S&P 500 Index consists of 500 stocks chosen for market size, liquidity, and industry group representation. It is a market-value-weighted index with each stock's weight in the index proportionate to its market value. You cannot invest directly in an index. |
| 2 | The Morgan Stanley Capital International (MSCI) All Country World Index (ACWI) ex USA Index (Net) is a free-float-adjusted market-capitalization-weighted index that is designed to measure the equity market performance of developed and emerging markets, excluding the U.S. Source: MSCI. MSCI makes no express or implied warranties or representations and shall have no liability whatsoever with respect to any MSCI data contained herein. The MSCI data may not be further redistributed or used as a basis for other indexes or any securities or financial products. This report is not approved, reviewed, or produced by MSCI. You cannot invest directly in an index. |
| 3 | The MSCI Emerging Markets (EM) Index (Net) (USD) is a free-float-adjusted market-capitalization-weighted index that is designed to measure equity market performance of emerging markets. You cannot invest directly in an index. |
| 4 | The Bloomberg U.S. Aggregate Bond Index is a broad-based benchmark that measures the investment-grade, U.S.-dollar-denominated, fixed-rate taxable bond market, including Treasuries, government-related and corporate securities, mortgage-backed securities (agency fixed-rate and hybrid adjustable-rate mortgage pass-throughs), asset-backed securities, and commercial mortgage-backed securities. You cannot invest directly in an index. |
| 5 | The Bloomberg Global Aggregate ex-USD Index (unhedged) is an unmanaged index that provides a broad-based measure of the global investment-grade fixed-income markets excluding the U.S.-dollar-denominated debt market. You cannot invest directly in an index. |
| 6 | The Bloomberg Municipal Bond Index is an unmanaged index composed of long-term tax-exempt bonds with a minimum credit rating of Baa. You cannot invest directly in an index. |
| 7 | The ICE BofA U.S. High Yield Index is a market-capitalization-weighted index of domestic and Yankee high-yield bonds. The index tracks the performance of high-yield securities traded in the U.S. bond market. You cannot invest directly in an index. Copyright 2023. ICE Data Indices, LLC. All rights reserved. |
2 | Allspring Ultra Short-Term Income Fund
Letter to shareholders (unaudited)
Equities had a reprieve in October. Value stocks and small caps fared best. Globally, developed markets outpaced emerging market equities, which were hurt by weakness among Chinese stocks. Central banks continued to try to curtail high inflation with aggressive interest rate hikes. Geopolitical risks persisted, including the ongoing Russia-Ukraine war and economic, financial market, and political turmoil in the U.K. Concerns over Europe’s energy crisis eased thanks to unseasonably warm weather and plentiful gas on hand. The U.S. labor market continued its resilience against rising prices as unemployment remained near a record low.
Stocks and bonds rallied in November. Economic news was encouraging, driven by U.S. labor market strength. Although central banks kept raising rates, hopes rose for an easing in the pace of rate hikes and a possible end to central bank monetary tightening in 2023. Although inflation remained at record highs in the eurozone, we began to see signs of a possible decline in inflationary pressures as U.S. inflation moderated, with a 7.1% annual price rise in November and a monthly price increase of just 0.1%. China’s economic data remained weak, reflecting its zero-COVID-19 policy.
Financial markets cooled in December, with U.S. equities posting negative overall results in response to a weakening U.S. dollar. Fixed income securities ended one of their worst years ever with flat overall monthly returns as markets weighed the hopes for an end to the monetary tightening cycle with the reality that central banks had not completed their jobs yet. U.S. Consumer Price Index (CPI)1 data showed a strong consistent trend downward, which brought down the 12-month CPI to 6.5% in December from 9.1% in June. Other countries and regions reported still-high but declining inflation rates as the year winded down.
The year 2023 began with a rally across global equities and fixed income securities. Investor optimism rose in response to data indicating declining inflation rates and the reopening of China’s economy with the abrupt end to its zero-COVID-19 policy. The U.S. reported surprisingly strong job gains––employers added more than 500,000 jobs––and unemployment fell to 3.4%, the lowest level since 1969. Meanwhile, wage growth, seen as a potential contributor to ongoing high inflation, continued to moderate. All eyes remained fixed on the Federal Reserve (Fed) and on how many more rate hikes remain in this tightening cycle. The 0.25% federal funds rate hike announced in January was the Fed’s smallest rate increase since March 2022.
Financial markets declined in February as investors responded unfavorably to resilient economic data. The takeaway: Central banks will likely continue their monetary tightening cycle for longer than markets had priced in. In this environment—where strong economic data is seen as bad news—the resilient U.S. labor market was seen as a negative while the inflation rate has not been falling quickly enough for the Fed, which raised interest rates by 0.25% in early February. Meanwhile, the BoE and the European Central Bank both raised rates by 0.50%. At this stage in the economic cycle, the overriding question remained: “What will central banks do?” In February, the answer appeared to be: “Move rates higher for longer.”
| 1 | The Consumer Price Index (CPI) is a measure of the average change over time in the prices paid by urban consumers for a market basket of consumer goods and services. You cannot invest directly in an index. |
Allspring Ultra Short-Term Income Fund | 3
Letter to shareholders (unaudited)
Don’t let short-term uncertainty derail long-term investment goals.
Periods of investment uncertainty can present challenges, but experience has taught us that maintaining long-term investment goals can be an effective way to plan for the future. To help you create a sound strategy based on your personal goals and risk tolerance, Allspring Funds offers more than 100 mutual funds spanning a wide range of asset classes and investment styles. Although diversification cannot guarantee an investment profit or prevent losses, we believe it can be an effective way to manage investment risk and potentially smooth out overall portfolio performance. We encourage investors to know their investments and to understand that appropriate levels of risk-taking may unlock opportunities.
Thank you for choosing to invest with Allspring Funds. We appreciate your confidence in us and remain committed to helping you meet your financial needs.
Sincerely,
Andrew Owen
President
Allspring Funds
For further information about your fund, contact your investment professional, visit our website at allspringglobal.com, or call us directly at 1-800-222-8222.
4 | Allspring Ultra Short-Term Income Fund
This page is intentionally left blank.
Performance highlights (unaudited)
| Investment objective | The Fund seeks current income consistent with capital preservation. |
| Manager | Allspring Funds Management, LLC |
| Subadviser | Allspring Global Investments, LLC |
| Portfolio managers | Christopher Y. Kauffman, CFA®‡, Janet S. Rilling, CFA®‡, CPA, Michael J. Schueller, CFA®‡, Michal Stanczyk, Noah M. Wise, CFA®‡ |
| Average annual total returns (%) as of February 28, 2023 |
| | | Including sales charge | | Excluding sales charge | | Expense ratios1 (%) |
| | Inception date | 1 year | 5 year | 10 year | | 1 year | 5 year | 10 year | | Gross | Net 2 |
| Class A (SADAX) | 8-31-1999 | -0.91 | 1.16 | 0.90 | | 1.12 | 1.57 | 1.11 | | 0.66 | 0.51 |
| Class A2 (WUSNX)3 | 5-29-2020 | – | – | – | | 1.08 | 1.56 | 1.10 | | 0.56 | 0.41 |
| Class C (WUSTX) | 7-18-2008 | -0.65 | 0.85 | 0.51 | | 0.35 | 0.85 | 0.51 | | 1.41 | 1.26 |
| Administrator Class (WUSDX) | 4-8-2005 | – | – | – | | 0.98 | 1.61 | 1.21 | | 0.60 | 0.51 |
| Institutional Class (SADIX) | 8-31-1999 | – | – | – | | 1.24 | 1.84 | 1.43 | | 0.33 | 0.26 |
| Bloomberg Short-Term Government/Corporate Bond Index4 | – | – | – | – | | 1.45 | 1.44 | 0.98 | | – | – |
Figures quoted represent past performance, which is no guarantee of future results, and do not reflect taxes that a shareholder may pay on an investment in a fund. Investment return and principal value of an investment will fluctuate so that an investor’s shares, when redeemed, may be worth more or less than their original cost. Performance shown without sales charges would be lower if sales charges were reflected. Current performance may be lower or higher than the performance data quoted, which assumes the reinvestment of dividends and capital gains. Current month-end performance is available on the Fund’s website, allspringglobal.com.
Index returns do not include transaction costs associated with buying and selling securities, any mutual fund fees or expenses, or any taxes. It is not possible to invest directly in an index.
For Class A shares, the maximum front-end sales charge is 2.00%. For Class C shares, the maximum contingent deferred sales charge is 1.00%. Performance including a contingent deferred sales charge assumes the sales charge for the corresponding time period. Class A2, Administrator Class and Institutional Class shares are sold without a front-end sales charge or contingent deferred sales charge.
| 1 | Reflects the expense ratios as stated in the most recent prospectuses, which include the impact of 0.01% in acquired fund fees and expenses. The expense ratios shown are subject to change and may differ from the annualized expense ratios shown in the financial highlights of this report, which do not include acquired fund fees and expenses. |
| 2 | The manager has contractually committed through December 31, 2023, to waive fees and/or reimburse expenses to the extent necessary to cap total annual fund operating expenses after fee waivers at 0.50% for Class A, 0.40% for Class A2, 1.25% for Class C, 0.50% for Administrator Class, and 0.25% for Institutional Class. Brokerage commissions, stamp duty fees, interest, taxes, acquired fund fees and expenses (if any), and extraordinary expenses are excluded from the expense caps. Prior to or after the commitment expiration date, the caps may be increased or the commitment to maintain the caps may be terminated only with the approval of the Board of Trustees. Without these caps, the Fund’s returns would have been lower. The expense ratio paid by an investor is the net expense ratio (the total annual fund operating expenses after fee waivers) as stated in the prospectuses. |
| 3 | Historical performance for the Class A2 shares prior to their inception reflects the performance of the Class A shares, and includes the higher expenses applicable to the Class A shares. If these expenses had not been included, returns for the Class A2 shares would be higher. |
| 4 | The Bloomberg Short-Term Government/Corporate Bond Index contains securities that have fallen out of the Bloomberg Government/Credit Bond Index because of the standard minimum one-year-to-maturity constraint. Securities in the Bloomberg Short-Term Government/Corporate Bond Index must have a maturity from 1 up to (but not including) 12 months. You cannot invest directly in an index. |
| ‡ | CFA® and Chartered Financial Analyst® are trademarks owned by CFA Institute. |
6 | Allspring Ultra Short-Term Income Fund
Performance highlights (unaudited)
Bond values fluctuate in response to the financial condition of individual issuers, general market and economic conditions, and changes in interest rates. Changes in market conditions and government policies may lead to periods of heightened volatility in the bond market and reduced liquidity for certain bonds held by the Fund. In general, when interest rates rise, bond values fall and investors may lose principal value. Interest rate changes and their impact on the Fund and its share price can be sudden and unpredictable. Loans are subject to risks similar to those associated with other below-investment-grade bond investments, such as credit risk (for example, risk of issuer default), below-investment-grade bond risk (for example, risk of greater volatility in value), and risk that the loan may become illiquid or difficult to price. The use of derivatives may reduce returns and/or increase volatility. Foreign investments are especially volatile and can rise or fall dramatically due to differences in the political and economic conditions of the host country. These risks are generally intensified in emerging markets. Certain investment strategies tend to increase the total risk of an investment (relative to the broader market). This fund is exposed to high-yield securities risk and mortgage- and asset-backed securities risk. Consult the Fund’s prospectus for additional information on these and other risks.
Allspring Ultra Short-Term Income Fund | 7
Performance highlights (unaudited)
| Ten largest holdings (%) as of February 28, 20231 |
| SPDR Portfolio Short Term Corporate Bond ETF | 1.51 |
| Santander Drive Auto Receivable Trust Series 2020-4 Class D, 1.48%, 1-15-2027 | 1.25 |
| GA Global Funding Trust, 1.00%, 4-8-2024 | 1.19 |
| SPGN TFLM Mortgage Trust Series 2022 Class A, 6.11%, 2-15-2039 | 1.16 |
| Nationwide Building Society, 0.55%, 1-22-2024 | 1.16 |
| Mercury Financial Credit Card Master Trust MFCC Series 2022-1A, 2.50%, 9-21-2026 | 1.14 |
| Palmer Square Loan Funding Limited Series 2013-2A Class A1A3, 5.79%, 10-17-2031 | 1.07 |
| iShares 0-5 Year High Yield Corporate Bond ETF | 1.05 |
| OPG Trust Series 2021-PORT Class A, 5.07%, 10-15-2036 | 1.01 |
| Danske Bank Class A, 3.77%, 3-28-2025 | 1.00 |
| 1 | Figures represent the percentage of the Fund's net assets. Holdings are subject to change and may have changed since the date specified. |
| Portfolio composition as of February 28, 20231 |
| 1 | Figures represent the percentage of the Fund's long-term investments. Allocations are subject to change and may have changed since the date specified. |
8 | Allspring Ultra Short-Term Income Fund
Fund expenses (unaudited)
As a shareholder of the Fund, you incur two types of costs: (1) transaction costs, including sales charges (loads) on purchase payments and contingent deferred sales charges (if any) on redemptions and (2) ongoing costs, including management fees, distribution (12b-1) and/or shareholder servicing fees, and other Fund expenses. This example is intended to help you understand your ongoing costs (in dollars) of investing in the Fund and to compare these costs with the ongoing costs of investing in other mutual funds.
The example is based on an investment of $1,000 invested at the beginning of the six-month period and held for the entire period from September 1, 2022 to February 28, 2023.
Actual expenses
The “Actual” line of the table below provides information about actual account values and actual expenses. You may use the information in this line, together with the amount you invested, to estimate the expenses that you paid over the period. Simply divide your account value by $1,000 (for example, an $8,600 account value divided by $1,000 = 8.6), then multiply the result by the number in the “Actual” line under the heading entitled “Expenses paid during period” for your applicable class of shares to estimate the expenses you paid on your account during this period.
Hypothetical example for comparison purposes
The “Hypothetical” line of the table below provides information about hypothetical account values and hypothetical expenses based on the Fund’s actual expense ratio and an assumed rate of return of 5% per year before expenses, which is not the Fund’s actual return. The hypothetical account values and expenses may not be used to estimate the actual ending account balance or expenses you paid for the period. You may use this information to compare the ongoing costs of investing in the Fund and other funds. To do so, compare this 5% hypothetical example with the 5% hypothetical examples that appear in the shareholder reports of the other funds.
Please note that the expenses shown in the table are meant to highlight your ongoing costs only and do not reflect any transactional costs, such as sales charges (loads) and contingent deferred sales charges. Therefore, the “Hypothetical” line of the table is useful in comparing ongoing costs only, and will not help you determine the relative total costs of owning different funds. In addition, if these transactional costs were included, your costs would have been higher.
| | Beginning
account value
9-1-2022 | Ending
account value
2-28-2023 | Expenses
paid during
the period1 | Annualized net
expense ratio |
| Class A | | | | |
| Actual | $1,000.00 | $1,018.48 | $2.50 | 0.50% |
| Hypothetical (5% return before expenses) | $1,000.00 | $1,022.32 | $2.51 | 0.50% |
| Class A2 | | | | |
| Actual | $1,000.00 | $1,018.97 | $2.00 | 0.40% |
| Hypothetical (5% return before expenses) | $1,000.00 | $1,022.81 | $2.01 | 0.40% |
| Class C | | | | |
| Actual | $1,000.00 | $1,014.70 | $6.24 | 1.25% |
| Hypothetical (5% return before expenses) | $1,000.00 | $1,018.60 | $6.26 | 1.25% |
| Administrator Class | | | | |
| Actual | $1,000.00 | $1,018.50 | $2.50 | 0.50% |
| Hypothetical (5% return before expenses) | $1,000.00 | $1,022.32 | $2.51 | 0.50% |
| Institutional Class | | | | |
| Actual | $1,000.00 | $1,019.73 | $1.25 | 0.25% |
| Hypothetical (5% return before expenses) | $1,000.00 | $1,023.55 | $1.25 | 0.25% |
1 Expenses paid is equal to the annualized net expense ratio of each class multiplied by the average account value over the period, multiplied by 181 divided by 365 (to reflect the one-half-year period).
Allspring Ultra Short-Term Income Fund | 9
Portfolio of investments—February 28, 2023 (unaudited)
| | | Interest
rate | Maturity
date | Principal | Value |
| Agency securities: 1.16% | | | | | |
| FHLMC (1 Year Treasury Constant Maturity +2.21%) ± | | 2.87% | 5-1-2035 | $ 74,183 | $ 74,255 |
| FHLMC (1 Year Treasury Constant Maturity +2.25%) ± | | 3.25 | 4-1-2032 | 36,285 | 35,884 |
| FHLMC (1 Year Treasury Constant Maturity +2.25%) ± | | 3.38 | 6-1-2032 | 275 | 271 |
| FHLMC (1 Year Treasury Constant Maturity +2.23%) ± | | 3.74 | 3-1-2035 | 275,437 | 279,059 |
| FHLMC (1 Year Treasury Constant Maturity +2.25%) ± | | 3.90 | 10-1-2038 | 264,976 | 259,256 |
| FHLMC (1 Year Treasury Constant Maturity +2.25%) ± | | 3.99 | 9-1-2038 | 513,716 | 515,935 |
| FHLMC (1 Year Treasury Constant Maturity +2.25%) ± | | 4.13 | 11-1-2035 | 670,828 | 685,368 |
| FHLMC (1 Year Treasury Constant Maturity +2.25%) ± | | 4.17 | 4-1-2038 | 228,707 | 230,371 |
| FHLMC | | 4.50 | 6-1-2024 | 89,545 | 88,889 |
| FHLMC | | 4.50 | 9-1-2026 | 158,408 | 157,194 |
| FHLMC | | 5.50 | 12-1-2023 | 9,389 | 9,374 |
| FHLMC | | 6.00 | 1-1-2024 | 2,215 | 2,210 |
| FHLMC | | 7.00 | 6-1-2031 | 148,016 | 149,796 |
| FHLMC Series 2611 Class HD | | 5.00 | 5-15-2023 | 7,027 | 7,009 |
| FHLMC Series 2704 Class BH | | 4.50 | 11-15-2023 | 14,625 | 14,556 |
| FHLMC Series 3924 Class MF (1 Month LIBOR +0.50%) ± | | 5.09 | 9-15-2041 | 528,100 | 520,872 |
| FHLMC Series 4172 Class PB | | 1.50 | 7-15-2040 | 2,591 | 2,583 |
| FHLMC Series 4889 Class CD | | 3.00 | 4-15-2049 | 590,292 | 530,431 |
| FHLMC Series 4938 Class BF (1 Month LIBOR +0.50%) ± | | 5.12 | 12-25-2049 | 2,978,424 | 2,916,397 |
| FHLMC Series QO04 Class AFL (12 Month Treasury Average +0.74%) ± | | 3.88 | 5-25-2044 | 910,061 | 910,397 |
| FHLMC Series T-42 Class A6 | | 9.50 | 2-25-2042 | 388,083 | 427,796 |
| FNMA (1 Year Treasury Constant Maturity +2.22%) ± | | 3.34 | 6-1-2032 | 53,911 | 53,345 |
| FNMA (1 Year Treasury Constant Maturity +2.22%) ± | | 3.35 | 6-1-2034 | 337,922 | 336,704 |
| FNMA (6 Month LIBOR +1.51%) ± | | 3.55 | 9-1-2037 | 171,350 | 171,640 |
| FNMA (1 Year Treasury Constant Maturity +2.20%) ± | | 3.68 | 10-1-2034 | 2,944 | 2,993 |
| FNMA (1 Year Treasury Constant Maturity +2.24%) ± | | 3.78 | 12-1-2040 | 85,100 | 83,658 |
| FNMA (1 Year Treasury Constant Maturity +2.21%) ± | | 3.85 | 9-1-2035 | 141,034 | 143,477 |
| FNMA (12 Month LIBOR +1.77%) ± | | 3.92 | 7-1-2044 | 750,823 | 766,461 |
| FNMA (1 Year Treasury Constant Maturity +2.24%) ± | | 3.98 | 7-1-2038 | 1,031,700 | 1,051,828 |
| FNMA (1 Year Treasury Constant Maturity +2.31%) ± | | 3.99 | 5-1-2036 | 182,436 | 185,091 |
| FNMA (1 Year Treasury Constant Maturity +2.27%) ± | | 4.00 | 8-1-2036 | 660,932 | 673,134 |
| FNMA (1 Year Treasury Constant Maturity +2.20%) ± | | 4.00 | 12-1-2040 | 1,212,934 | 1,232,695 |
| FNMA (1 Year Treasury Constant Maturity +2.23%) ± | | 4.04 | 11-1-2038 | 287,857 | 293,251 |
| FNMA (1 Year Treasury Constant Maturity +2.02%) ± | | 4.10 | 12-1-2034 | 113,441 | 114,903 |
| FNMA (1 Year Treasury Constant Maturity +2.19%) ± | | 4.32 | 11-1-2031 | 31,670 | 31,126 |
| FNMA (1 Year Treasury Constant Maturity +2.26%) ± | | 4.38 | 11-1-2035 | 37,836 | 37,135 |
| FNMA (1 Year Treasury Constant Maturity +2.36%) ± | | 4.40 | 11-1-2034 | 315,111 | 321,958 |
| FNMA | | 4.50 | 1-1-2027 | 282,523 | 280,159 |
| FNMA (12 Month Treasury Average +2.05%) ± | | 4.80 | 8-1-2045 | 155,812 | 153,007 |
| FNMA | | 5.00 | 6-1-2024 | 68,913 | 68,792 |
| FNMA | | 6.50 | 8-1-2031 | 185,908 | 195,164 |
| FNMA (6 Month LIBOR +1.38%) ± | | 6.50 | 10-1-2031 | 34,893 | 35,001 |
| FNMA Series 2000-T6 Class A2 | | 9.50 | 11-25-2040 | 172,140 | 176,195 |
| FNMA Series 2001-T10 Class A3 | | 9.50 | 12-25-2041 | 262,995 | 275,198 |
| FNMA Series 2001-T12 Class A3 | | 9.50 | 8-25-2041 | 232,921 | 248,217 |
| FNMA Series 2002-T1 Class A4 | | 9.50 | 11-25-2031 | 298,073 | 326,740 |
| FNMA Series 2002-W04 Class A6 ±± | | 3.86 | 5-25-2042 | 315,910 | 302,117 |
| FNMA Series 2003-W11 Class A1 ±± | | 4.72 | 6-25-2033 | 9,590 | 9,700 |
| FNMA Series 2003-W3 Class 1A4 ±± | | 3.95 | 8-25-2042 | 17,235 | 15,976 |
| FNMA Series 2007-W2 Class 1A1 (1 Month LIBOR +0.32%) ± | | 4.83 | 3-25-2037 | 187,811 | 184,536 |
| FNMA Series 2010-25 Class ND | | 3.50 | 3-25-2025 | 11 | 11 |
| FNMA Series 2010-37 Class A1 | | 5.41 | 5-25-2035 | 472,906 | 468,080 |
The accompanying notes are an integral part of these financial statements.
10 | Allspring Ultra Short-Term Income Fund
Portfolio of investments—February 28, 2023 (unaudited)
| | | Interest
rate | Maturity
date | Principal | Value |
| Agency securities (continued) | | | | | |
| FNMA Series 2013-23 Class LF (1 Month LIBOR +0.35%) ± | | 3.92% | 3-25-2043 | $ 2,641,400 | $ 2,599,492 |
| FNMA Series 2014-19 Class HA | | 2.00 | 6-25-2040 | 152,237 | 142,797 |
| GNMA | | 7.00 | 6-15-2033 | 219,776 | 230,756 |
| Total Agency securities (Cost $19,241,785) | | | | | 19,029,240 |
| Asset-backed securities: 14.14% | | | | | |
| ACM Auto Trust Series 2022-1A Class A 144A | | 3.23 | 4-20-2029 | 486,360 | 485,746 |
| Acres plc Series 2021-FL2 Class A (1 Month LIBOR +1.40%) 144A± | | 6.00 | 1-15-2037 | 4,000,000 | 3,907,176 |
| American Credit Acceptance Receivables Trust Series 2019-4 Class D 144A | | 2.97 | 12-12-2025 | 5,030,108 | 4,988,976 |
| American Credit Acceptance Receivables Trust Series 2021-1 Class C 144A | | 0.83 | 3-15-2027 | 5,467,998 | 5,374,844 |
| Aqua Finance Trust Series 2021-A Class A 144A | | 1.54 | 7-17-2046 | 2,017,626 | 1,790,439 |
| Bankers Healthcare Group Series 2021-A Class A 144A | | 1.42 | 11-17-2033 | 2,535,065 | 2,356,721 |
| CarNow Auto Receivables Trust 2020 Class C 144A | | 3.84 | 9-16-2024 | 732,095 | 730,904 |
| Carvana Auto Receivables Trust Series 2019-4A Class D 144A | | 3.07 | 7-15-2025 | 8,340,130 | 8,228,152 |
| CommonBond Student Loan Trust Series 2018-B-GS Class A1 144A | | 3.56 | 9-25-2045 | 2,350,131 | 2,190,594 |
| Credit Acceptance Auto Loan Trust Series 2020-3A Class A 144A | | 1.24 | 10-15-2029 | 2,530,215 | 2,488,057 |
| Crossroads Asset Trust Series 2021-A Class A2 144A | | 0.82 | 3-20-2024 | 155,460 | 154,924 |
| Dominos Pizza Master Issuer LLC Series 2015-1A Class A2 144A | | 4.47 | 10-25-2045 | 15,937,500 | 15,338,266 |
| DT Auto Owner Trust Series 2019-4A Class D 144A | | 2.85 | 7-15-2025 | 5,917,339 | 5,820,741 |
| DT Auto Owner Trust Series 2020-1A Class C 144A | | 2.29 | 11-17-2025 | 683,233 | 681,304 |
| ECMC Group Student Loan Trust Series 2020-2A Class A (1 Month LIBOR +1.15%) 144A± | | 5.77 | 11-25-2069 | 4,847,751 | 4,725,810 |
| Educational Services of America Incorporated Series 2015-2 Class A (1 Month LIBOR +1.00%) 144A± | | 5.62 | 12-25-2056 | 229,869 | 229,900 |
| Enterprise Fleet Financing LLC Series 2021-1 Class A2 144A | | 0.44 | 12-21-2026 | 3,951,063 | 3,840,119 |
| Exeter Automobile Receivables Trust Series 2021-3A Class C | | 0.96 | 10-15-2026 | 8,418,000 | 8,044,237 |
| Exeter Automobile Receivables Trust Series 2020-1A Class D 144A | | 2.73 | 12-15-2025 | 5,057,253 | 4,955,170 |
| Flagship Credit Auto Trust Series FCAT 2018-3 Class D 144A | | 4.15 | 12-16-2024 | 2,579,141 | 2,559,106 |
| GLS Automobile Receivables Trust Series 2019-3A Class C 144A | | 2.96 | 5-15-2025 | 1,824,492 | 1,810,483 |
| GLS Automobile Receivables Trust Series 2020-1A Class C 144A | | 2.72 | 11-17-2025 | 7,953,524 | 7,868,157 |
| Hertz Vehicle Financing LLC Series 2021-1A Class A 144A | | 1.21 | 12-26-2025 | 11,325,000 | 10,507,213 |
| Mercury Financial Credit Card Master Trust MFCC Series 2022-1A 144A | | 2.50 | 9-21-2026 | 20,000,000 | 18,768,080 |
| MFRA Trust Series 2020-NQM1 Class A1 144A±± | | 1.48 | 3-25-2065 | 1,203,872 | 1,107,871 |
| Navient Student Loan Trust Series 2017-3A Class A3 (1 Month LIBOR +1.05%) 144A± | | 5.67 | 7-26-2066 | 5,526,821 | 5,489,723 |
| Navient Student Loan Trust Series 2018-CA Class A2 144A | | 3.52 | 6-16-2042 | 408,948 | 401,029 |
| Navient Student Loan Trust Series 2021-EA Class A 144A | | 0.97 | 12-16-2069 | 7,157,077 | 6,023,263 |
| Octane Receivables Trust Series 2020-1A Class A 144A | | 1.71 | 2-20-2025 | 853,841 | 846,354 |
| Octane Receivables Trust Series 2021-1A Class A 144A | | 0.93 | 3-22-2027 | 5,685,442 | 5,486,714 |
| Ondeck Asset Securitization Trust Series 2021-1A Class A 144A | | 1.59 | 5-17-2027 | 8,487,858 | 7,895,378 |
The accompanying notes are an integral part of these financial statements.
Allspring Ultra Short-Term Income Fund | 11
Portfolio of investments—February 28, 2023 (unaudited)
| | | Interest
rate | Maturity
date | Principal | Value |
| Asset-backed securities (continued) | | | | | |
| OneMain Direct Auto Receivables Trust Series 2021-1A Class A 144A | | 0.87% | 7-14-2028 | $11,760,000 | $ 10,989,624 |
| Oscar US Funding Trust Series 2018-2A Class A4 144A | | 3.63 | 9-10-2025 | 507,150 | 504,867 |
| Pagaya AI Debt Selection Trust Series 2021-1 Class A 144A | | 1.18 | 11-15-2027 | 3,436,333 | 3,403,555 |
| PFS Financing Corporation Series 2021-A Class A 144A | | 0.71 | 4-15-2026 | 9,340,000 | 8,841,781 |
| Santander Drive Auto Receivable Trust Series 2020-4 Class D | | 1.48 | 1-15-2027 | 21,370,000 | 20,507,702 |
| Santander Drive Auto Receivable Trust Series 2021-2 Class B | | 0.59 | 9-15-2025 | 35,003 | 34,938 |
| SLM Student Loan Trust Series 2003-10A Class A4 (3 Month LIBOR +0.67%) 144A± | | 5.44 | 12-17-2068 | 16,002,778 | 15,678,762 |
| SLM Student Loan Trust Series 2004-B Class A3 (3 Month LIBOR +0.33%) ± | | 5.10 | 3-15-2024 | 1,743,847 | 1,740,885 |
| SLM Student Loan Trust Series 2013-1 Class A3 (1 Month LIBOR +0.55%) ± | | 5.17 | 5-26-2055 | 3,356,748 | 3,246,041 |
| SoFi Consumer Loan Program Trust Series 2021-1 Class A 144A | | 0.49 | 9-25-2030 | 724,747 | 708,268 |
| SoFi Professional Loan Program LLC Series 2017-A Class A1 (1 Month LIBOR +0.70%) 144A± | | 5.32 | 3-26-2040 | 327,704 | 327,192 |
| SpringCastle America Funding LLC 144A | | 1.97 | 9-25-2037 | 2,724,010 | 2,456,482 |
| Taco Bell Funding LLC Series 2016-1A Class A23 144A | | 4.97 | 5-25-2046 | 6,460,838 | 6,275,411 |
| Towd Point Asset Trust Series 2018-SL1 Class A (1 Month LIBOR +0.60%) 144A± | | 5.11 | 1-25-2046 | 825,537 | 820,785 |
| Voya CLO Limited Series 2017-1A Class A1R (3 Month LIBOR +0.95%) 144A± | | 5.74 | 4-17-2030 | 7,410,789 | 7,339,290 |
| Westlake Automobile Receivables Trust Series 2020-3A Class B 144A | | 0.78 | 11-17-2025 | 4,480,598 | 4,470,798 |
| Total Asset-backed securities (Cost $243,160,879) | | | | | 232,441,832 |
| Corporate bonds and notes: 33.89% | | | | | |
| Communication services: 0.23% | | | | | |
| Wireless telecommunication services: 0.23% | | | | | |
| Sprint Spectrum Company 144A | | 4.74 | 3-20-2025 | 3,755,813 | 3,712,501 |
| Consumer discretionary: 1.89% | | | | | |
| Hotels, restaurants & leisure: 0.87% | | | | | |
| Las Vegas Sands Corporation | | 3.20 | 8-8-2024 | 14,845,000 | 14,286,417 |
| Internet & direct marketing retail: 0.29% | | | | | |
| QVC Incorporated | | 4.85 | 4-1-2024 | 5,000,000 | 4,693,800 |
| Textiles, apparel & luxury goods: 0.73% | | | | | |
| Michael Kors USA Incorporated 144A | | 4.25 | 11-1-2024 | 12,574,000 | 12,055,323 |
| Consumer staples: 0.42% | | | | | |
| Tobacco: 0.42% | | | | | |
| Philip Morris International Incorporated | | 4.88 | 2-13-2026 | 7,000,000 | 6,921,140 |
| Energy: 3.01% | | | | | |
| Energy equipment & services: 0.72% | | | | | |
| Alexander Funding Trust 144A | | 1.84 | 11-15-2023 | 12,265,000 | 11,849,603 |
The accompanying notes are an integral part of these financial statements.
12 | Allspring Ultra Short-Term Income Fund
Portfolio of investments—February 28, 2023 (unaudited)
| | | Interest
rate | Maturity
date | Principal | Value |
| Oil, gas & consumable fuels: 2.29% | | | | | |
| Energy Transfer Partners LP | | 4.20% | 9-15-2023 | $ 4,866,000 | $ 4,832,663 |
| Plains All American Pipeline LP | | 3.85 | 10-15-2023 | 8,971,000 | 8,875,897 |
| Sabine Pass Liquefaction LLC | | 5.63 | 3-1-2025 | 10,000,000 | 9,988,421 |
| Vistra Operations Company LLC 144A | | 3.55 | 7-15-2024 | 14,500,000 | 13,921,925 |
| | | | | | 37,618,906 |
| Financials: 17.72% | | | | | |
| Banks: 4.22% | | | | | |
| Bank of America Corporation (U.S. SOFR +0.74%) ± | | 0.81 | 10-24-2024 | 12,000,000 | 11,624,864 |
| Bank of America Corporation (U.S. SOFR +0.65%) ± | | 1.53 | 12-6-2025 | 4,500,000 | 4,183,106 |
| Bank of America Corporation (U.S. SOFR +0.67%) ± | | 1.84 | 2-4-2025 | 8,000,000 | 7,708,719 |
| Bank of America Corporation (3 Month LIBOR +0.94%) ± | | 3.86 | 7-23-2024 | 4,894,000 | 4,857,828 |
| Citigroup Incorporated (U.S. SOFR +0.69%) ± | | 0.78 | 10-30-2024 | 8,000,000 | 7,732,751 |
| Citigroup Incorporated (U.S. SOFR +0.67%) ± | | 0.98 | 5-1-2025 | 2,000,000 | 1,888,806 |
| JPMorgan Chase & Company (U.S. SOFR +0.49%) ± | | 0.77 | 8-9-2025 | 6,000,000 | 5,571,509 |
| JPMorgan Chase & Company (U.S. SOFR +0.54%) ± | | 0.82 | 6-1-2025 | 6,280,000 | 5,891,404 |
| JPMorgan Chase & Company (U.S. SOFR +1.46%) ± | | 1.51 | 6-1-2024 | 7,250,000 | 7,179,093 |
| JPMorgan Chase & Company (U.S. SOFR +0.92%) ± | | 5.47 | 2-24-2026 | 5,000,000 | 5,007,600 |
| Santander Holdings USA Incorporated (U.S. SOFR +1.38%) ± | | 4.26 | 6-9-2025 | 7,900,000 | 7,676,057 |
| | | | | | 69,321,737 |
| Capital markets: 2.51% | | | | | |
| Goldman Sachs Group Incorporated (U.S. SOFR +0.49%) ± | | 0.93 | 10-21-2024 | 8,000,000 | 7,743,341 |
| Morgan Stanley (U.S. SOFR +0.62%) ± | | 0.73 | 4-5-2024 | 5,000,000 | 4,974,530 |
| Morgan Stanley (U.S. SOFR +0.56%) ± | | 1.16 | 10-21-2025 | 8,000,000 | 7,410,012 |
| Morgan Stanley (U.S. SOFR +1.16%) ± | | 3.62 | 4-17-2025 | 10,000,000 | 9,768,599 |
| Morgan Stanley (U.S. SOFR +0.94%) ± | | 2.63 | 2-18-2026 | 12,000,000 | 11,318,760 |
| | | | | | 41,215,242 |
| Consumer finance: 3.89% | | | | | |
| Bayer US Finance II LLC Company 144A | | 3.88 | 12-15-2023 | 10,700,000 | 10,555,690 |
| BMW US Capital LLC 144A | | 3.80 | 4-6-2023 | 5,000,000 | 4,993,173 |
| Daimler Finance North America LLC 144A | | 1.75 | 3-10-2023 | 1,715,000 | 1,713,778 |
| Daimler Finance North America LLC 144A | | 1.13 | 12-14-2023 | 10,780,000 | 10,432,771 |
| Daimler Finance North America LLC 144A | | 5.15 | 1-16-2026 | 7,800,000 | 7,712,948 |
| Ford Motor Credit Company LLC | | 2.30 | 2-10-2025 | 8,000,000 | 7,351,742 |
| Hyundai Capital America Company 144A | | 0.80 | 1-8-2024 | 10,000,000 | 9,596,405 |
| Hyundai Capital America Company 144A | | 1.25 | 9-18-2023 | 4,750,000 | 4,634,146 |
| Navient Corporation | | 7.25 | 9-25-2023 | 2,400,000 | 2,406,960 |
| Onemain Finance Corporation | | 5.63 | 3-15-2023 | 4,550,000 | 4,543,118 |
| | | | | | 63,940,731 |
| Diversified financial services: 1.90% | | | | | |
| DAE Funding LLC 144A | | 1.55 | 8-1-2024 | 5,250,000 | 4,915,955 |
| Equitable Financial Life 144A | | 5.50 | 12-2-2025 | 10,615,000 | 10,558,097 |
| Jackson Financial Incorporated | | 1.13 | 11-22-2023 | 5,725,000 | 5,548,453 |
| WEA Finance LLC 144A | | 3.75 | 9-17-2024 | 10,766,000 | 10,265,444 |
| | | | | | 31,287,949 |
| Insurance: 5.20% | | | | | |
| Athene Global Funding 144A | | 1.20 | 10-13-2023 | 5,000,000 | 4,873,544 |
| Athene Global Funding 144A | | 2.80 | 5-26-2023 | 5,000,000 | 4,971,902 |
The accompanying notes are an integral part of these financial statements.
Allspring Ultra Short-Term Income Fund | 13
Portfolio of investments—February 28, 2023 (unaudited)
| | | Interest
rate | Maturity
date | Principal | Value |
| Insurance (continued) | | | | | |
| Athene Global Funding 144A | | 0.91% | 8-19-2024 | $ 5,000,000 | $ 4,622,742 |
| Brighthouse Financial 144A | | 0.60 | 6-28-2023 | 6,595,000 | 6,491,115 |
| Brighthouse Financial 144A | | 1.75 | 1-13-2025 | 11,340,000 | 10,448,598 |
| GA Global Funding Trust 144A | | 1.00 | 4-8-2024 | 20,775,000 | 19,600,494 |
| Met Tower Global Funding 144A | | 0.70 | 4-5-2024 | 12,000,000 | 11,385,958 |
| Principal Life Global Funding II 144A | | 1.38 | 1-10-2025 | 13,000,000 | 12,039,452 |
| Protective Life Global Funding 144A | | 0.47 | 1-12-2024 | 10,000,000 | 9,596,865 |
| Security Benefit Company 144A | | 1.25 | 5-17-2024 | 1,665,000 | 1,566,944 |
| | | | | | 85,597,614 |
| Health care: 1.35% | | | | | |
| Biotechnology: 0.91% | | | | | |
| Amgen Incorporated %% | | 5.25 | 3-2-2025 | 15,000,000 | 14,966,642 |
| Health care providers & services: 0.44% | | | | | |
| HCA Incorporated | | 5.25 | 4-15-2025 | 7,360,000 | 7,287,602 |
| Industrials: 1.63% | | | | | |
| Aerospace & defense: 0.53% | | | | | |
| The Boeing Company | | 1.43 | 2-4-2024 | 5,000,000 | 4,808,168 |
| The Boeing Company | | 4.51 | 5-1-2023 | 4,000,000 | 3,994,280 |
| | | | | | 8,802,448 |
| Airlines: 0.78% | | | | | |
| Delta Air Lines Incorporated 144A | | 4.50 | 10-20-2025 | 9,166,612 | 8,903,822 |
| Delta Air Lines Pass-Through Certificates Series 2015-B | | 4.25 | 1-30-2025 | 3,586,750 | 3,555,995 |
| US Airways Group Incorporated | | 3.95 | 5-15-2027 | 388,352 | 367,946 |
| | | | | | 12,827,763 |
| Electrical equipment: 0.32% | | | | | |
| Regal Rexnord Corporation 144A | | 6.05 | 2-15-2026 | 5,255,000 | 5,212,864 |
| Information technology: 2.06% | | | | | |
| IT services: 0.79% | | | | | |
| Fidelity National Information Services Incorporated | | 0.38 | 3-1-2023 | 13,000,000 | 13,000,000 |
| Semiconductors & semiconductor equipment: 1.10% | | | | | |
| Intel Corporation | | 4.88 | 2-10-2026 | 10,000,000 | 9,904,069 |
| Marvell Technology Incorporated | | 4.20 | 6-22-2023 | 2,800,000 | 2,786,456 |
| Microchip Technology Incorporated | | 2.67 | 9-1-2023 | 3,475,000 | 3,421,925 |
| Skyworks Solutions Incorporated « | | 0.90 | 6-1-2023 | 2,000,000 | 1,974,401 |
| | | | | | 18,086,851 |
| Technology hardware, storage & peripherals: 0.17% | | | | | |
| Western Digital Corporation | | 4.75 | 2-15-2026 | 3,000,000 | 2,832,420 |
| Materials: 0.64% | | | | | |
| Chemicals: 0.64% | | | | | |
| Celanese US Holding LLC | | 6.05 | 3-15-2025 | 10,600,000 | 10,560,770 |
| Real estate: 1.62% | | | | | |
| Equity REITs: 1.62% | | | | | |
| Camden Property Trust | | 4.88 | 6-15-2023 | 3,000,000 | 2,992,079 |
The accompanying notes are an integral part of these financial statements.
14 | Allspring Ultra Short-Term Income Fund
Portfolio of investments—February 28, 2023 (unaudited)
| | | Interest
rate | Maturity
date | Principal | Value |
| Equity REITs (continued) | | | | | |
| Piedmont Operating Partnership LP | | 4.45% | 3-15-2024 | $10,235,000 | $ 10,086,924 |
| Service Properties Trust | | 4.50 | 6-15-2023 | 3,500,000 | 3,497,265 |
| Simon Property Group LP (U.S. SOFR +0.43%) ± | | 4.87 | 1-11-2024 | 10,000,000 | 9,975,823 |
| | | | | | 26,552,091 |
| Utilities: 3.32% | | | | | |
| Electric utilities: 2.04% | | | | | |
| American Electric Power | | 0.75 | 11-1-2023 | 7,000,000 | 6,781,605 |
| Entergy Louisiana LLC | | 0.62 | 11-17-2023 | 6,045,000 | 5,844,332 |
| NextEra Energy Capital Company %% | | 6.05 | 3-1-2025 | 6,250,000 | 6,288,060 |
| NextEra Energy Operating Partners LP 144A | | 4.25 | 7-15-2024 | 2,030,000 | 1,961,488 |
| Oncor Electric Delivery Company | | 2.95 | 4-1-2025 | 5,105,000 | 4,861,304 |
| Southern California Edison Company | | 0.70 | 4-3-2023 | 7,800,000 | 7,769,022 |
| | | | | | 33,505,811 |
| Gas utilities: 0.61% | | | | | |
| Southern California Gas Company (3 Month LIBOR +0.35%) ± | | 5.10 | 9-14-2023 | 10,000,000 | 9,985,804 |
| Multi-utilities: 0.67% | | | | | |
| CenterPoint Energy Incorporated | | 0.70 | 3-2-2023 | 4,625,000 | 4,625,000 |
| CenterPoint Energy Incorporated (U.S. SOFR +0.65%) ± | | 5.21 | 5-13-2024 | 3,840,000 | 3,821,573 |
| CenterPoint Energy Incorporated (3 Month LIBOR +0.50%) ± | | 5.28 | 3-2-2023 | 2,665,000 | 2,665,000 |
| | | | | | 11,111,573 |
| Total Corporate bonds and notes (Cost $576,424,458) | | | | | 557,233,602 |
| | | | | Shares | |
| Investment companies: 2.56% | | | | | |
| Exchange-traded funds: 2.56% | | | | | |
| iShares 0-5 Year High Yield Corporate Bond ETF | | | | 417,000 | 17,238,780 |
| SPDR Portfolio Short Term Corporate Bond ETF | | | | 847,800 | 24,933,798 |
| Total Investment companies (Cost $44,581,230) | | | | | 42,172,578 |
| | | | | Principal | |
| Municipal obligations: 0.12% | | | | | |
| Indiana: 0.12% | | | | | |
| Education revenue: 0.12% | | | | | |
| Indiana Secondary Market for Education Loans Incorporated (1 Month LIBOR +0.80%) ± | | 1.47 | 2-25-2044 | $ 1,962,821 | 1,939,571 |
| Total Municipal obligations (Cost $1,926,126) | | | | | 1,939,571 |
| Non-agency mortgage-backed securities: 26.76% | | | | | |
| American Money Management Corporation Series 2014-14A Class A1R2 (3 Month LIBOR +1.02%) 144A± | | 5.84 | 7-25-2029 | 5,436,229 | 5,416,903 |
| Angel Oak Mortgage Trust I LLC Series 2019-4 Class A1 144A±± | | 2.99 | 7-26-2049 | 69,579 | 69,239 |
| Angel Oak Mortgage Trust I LLC Series 2020-4 Class A1 144A±± | | 1.47 | 6-25-2065 | 859,453 | 770,326 |
The accompanying notes are an integral part of these financial statements.
Allspring Ultra Short-Term Income Fund | 15
Portfolio of investments—February 28, 2023 (unaudited)
| | | Interest
rate | Maturitydate | Principal | Value |
| Non-agency mortgage-backed securities (continued) | | | | | |
| Angel Oak Mortgage Trust I LLC Series 2020-5 Class A2 144A±± | | 1.58% | 5-25-2065 | $ 623,421 | $ 566,595 |
| Angel Oak Mortgage Trust I LLC Series 2020-R1 Class A1 144A±± | | 0.99 | 4-25-2053 | 2,572,047 | 2,367,347 |
| Black Diamond CLO Limited Series 2017-1A Class A1 (3 Month LIBOR +1.05%) 144A± | | 5.87 | 4-24-2029 | 525,718 | 522,302 |
| Bravo Residential Funding Trust Series 2020-RPL1 Class A1 144A±± | | 2.50 | 5-26-2059 | 961,623 | 910,517 |
| Bravo Residential Funding Trust Series 2021-HE2 Class A1 (30 Day Average U.S. SOFR +0.75%) 144A± | | 5.23 | 11-25-2069 | 6,324,762 | 6,276,781 |
| Bunker Hill Loan Depositary Trust Series 2019-2 Class A1 144A | | 2.88 | 7-25-2049 | 1,231,107 | 1,143,016 |
| Carlyle C17 CLO Limited Series C17-A Class A1AR (3 Month LIBOR +1.03%) 144A± | | 5.83 | 4-30-2031 | 3,000,000 | 2,984,163 |
| Cascade Funding Mortgage Trust Series 2018-RM2 Class A 144A±± | | 4.00 | 10-25-2068 | 498,241 | 481,498 |
| Cascade Funding Mortgage Trust Series 2020-HB4 Class A 144A±± | | 0.95 | 12-26-2030 | 2,016,238 | 1,958,819 |
| Cascade Funding Mortgage Trust Series 2021-AL1 Class B 144A | | 1.39 | 9-22-2031 | 7,049,353 | 6,708,166 |
| Cascade Funding Mortgage Trust Series 2021-EBO1 Class A 144A±± | | 0.98 | 11-25-2050 | 4,077,040 | 3,849,993 |
| Cascade Funding Mortgage Trust Series 2021-HB7 Class A 144A±± | | 1.15 | 10-27-2031 | 3,721,119 | 3,491,696 |
| CCG Receivables Trust Series 2022-1 Class A2 144A | | 3.91 | 7-16-2029 | 4,610,594 | 4,527,004 |
| CGMS Series 2015-1A Class AR3 (3 Month LIBOR +0.98%) 144A± | | 5.79 | 7-20-2031 | 10,991,779 | 10,871,859 |
| CHNGE Mortgage Trust Series 2022-2 Class A1 144A±± | | 3.76 | 3-25-2067 | 12,904,175 | 11,997,997 |
| CIFC Funding Limited Series 2018-1A Class A (3 Month LIBOR +1.00%) 144A± | | 5.79 | 4-18-2031 | 1,750,000 | 1,725,366 |
| Colt Funding LLC Series 2020-2 Class A1 144A±± | | 1.85 | 3-25-2065 | 244,453 | 240,421 |
| Colt Funding LLC Series 2021-1R Class A1 144A±± | | 0.86 | 5-25-2065 | 2,611,940 | 2,177,812 |
| Colt Funding LLC Series 2021-HX1 Class A1 144A±± | | 1.11 | 10-25-2066 | 11,336,980 | 9,151,529 |
| Commercial Mortgage Trust Series 2014-CR16 Class ASB | | 3.65 | 4-10-2047 | 653,793 | 648,678 |
| Commercial Mortgage Trust Series 2014-UBS5 Class A2 | | 3.03 | 9-10-2047 | 113,748 | 110,091 |
| Countrywide Home Loans Mortgage Pass-Through Trust Series 2001-HYB1 Class 1A1 ±± | | 3.25 | 6-19-2031 | 87,360 | 83,604 |
| Countrywide Home Loans Mortgage Pass-Through Trust Series 2001-HYB1 Class 2A1 ±± | | 4.01 | 6-19-2031 | 54,820 | 52,680 |
| Credit Suisse Mortgage Trust Series 2020-AFC1 Class A3 144A±± | | 2.51 | 2-25-2050 | 1,650,589 | 1,516,123 |
| Credit Suisse Mortgage Trust Series 2020-SPT1 Class A1 144A | | 1.62 | 4-25-2065 | 695,050 | 679,386 |
| Credit Suisse Mortgage Trust Series 2021-NQM2 Class A1 144A±± | | 1.18 | 2-25-2066 | 4,315,159 | 3,622,477 |
| Credit Suisse Mortgage Trust Series 2022-NQM1 Class A1 144A±± | | 2.27 | 11-25-2066 | 6,410,547 | 5,538,550 |
| CSAIL Commercial Mortgage Trust Series 2018-CX12 Class A2 | | 4.14 | 8-15-2051 | 825,009 | 819,787 |
| DBWF Mortgage Trust Series 2018-GLKS Class A (1 Month LIBOR +1.13%) 144A± | | 5.73 | 12-19-2030 | 635,000 | 627,831 |
| Dryden Senior Loan Fund Series 2013-30A (3 Month LIBOR +0.82%) 144A± | | 5.68 | 11-15-2028 | 4,196,205 | 4,169,190 |
| Dryden Senior Loan Fund Series 2019-80A AR (U.S. SOFR 3 Month +1.25%) 144A± | | 5.91 | 1-17-2033 | 11,000,000 | 10,850,741 |
The accompanying notes are an integral part of these financial statements.
16 | Allspring Ultra Short-Term Income Fund
Portfolio of investments—February 28, 2023 (unaudited)
| | | Interest
rate | Maturitydate | Principal | Value |
| Non-agency mortgage-backed securities (continued) | | | | | |
| Ellington Financial Mortgage Trust Series 2020-1 Class A1 144A±± | | 2.01% | 5-25-2065 | $ 327,570 | $ 316,839 |
| Ellington Financial Mortgage Trust Series 2021-1 Class A1 144A±± | | 0.80 | 2-25-2066 | 728,263 | 592,167 |
| EquiFirst Mortgage Loan Trust Series 2003-2 Class 3A3 (1 Month LIBOR +1.13%) ± | | 5.34 | 9-25-2033 | 196,937 | 192,470 |
| GCAT Series 2022 HX1 Class A1 144A±± | | 2.89 | 12-27-2066 | 15,265,993 | 13,615,407 |
| Goldman Sachs Mortgage Securities Trust Series 2013-GC16 Class AAB | | 3.81 | 11-10-2046 | 250,856 | 249,510 |
| Goldman Sachs Mortgage Securities Trust Series 2014-GC22 Class A3 | | 3.52 | 6-10-2047 | 1,233,338 | 1,209,251 |
| Goldman Sachs Mortgage Securities Trust Series 2020-NQM1 Class A1 144A±± | | 1.38 | 9-27-2060 | 1,231,428 | 1,118,334 |
| Gracie Point International Funding Series 2022-1A Class A (30 Day Average U.S. SOFR +2.25%) 144A± | | 6.77 | 4-1-2024 | 11,999,887 | 11,957,988 |
| GSMPS Mortgage Loan Trust Series 1998-1 Class A 144A±± | | 8.00 | 9-19-2027 | 23,717 | 22,198 |
| HGI CRE CLO Limited Series 2021-FL2 Class A (1 Month LIBOR +1.00%) 144A± | | 5.59 | 9-17-2036 | 8,070,000 | 7,694,275 |
| Hospitality Mortgage Trust Series 2019 Class A (1 Month LIBOR +1.00%) 144A± | | 5.59 | 11-15-2036 | 3,728,874 | 3,696,476 |
| Imperial Fund Mortgage Trust Series 2020-NQM1 Class A1 144A±± | | 1.38 | 10-25-2055 | 2,607,849 | 2,293,185 |
| Imperial Fund Mortgage Trust Series 2021-NQM1 Class A1 144A±± | | 1.07 | 6-25-2056 | 2,163,167 | 1,781,262 |
| Imperial Fund Mortgage Trust Series 2021-NQM3 Class A1 144A±± | | 1.60 | 11-25-2056 | 6,569,582 | 5,424,559 |
| Imperial Fund Mortgage Trust Series 2022-NQM3 Class A1 144A | | 4.38 | 5-25-2067 | 14,065,049 | 13,407,364 |
| JPMorgan Chase Commercial Mortgage Securities Trust Series 2018-PHH Class A (1 Month LIBOR +1.21%) 144A± | | 5.80 | 6-15-2035 | 3,571,081 | 3,295,192 |
| JPMorgan Chase Commercial Mortgage Securities Trust Series 2019-7 Class B2A 144A±± | | 3.02 | 2-25-2050 | 2,303,783 | 1,820,674 |
| JPMorgan Chase Commercial Mortgage Securities Trust Series 2019-MFP Class A (1 Month LIBOR +0.96%) 144A± | | 5.55 | 7-15-2036 | 2,299,009 | 2,273,836 |
| Legacy Mortgage Asset Trust Series 2020-RPL1 Class A1 144A±± | | 3.00 | 9-25-2059 | 7,946,074 | 7,368,575 |
| Marlette Funding Trust Series 2021-1A Class B 144A | | 1.00 | 6-16-2031 | 2,102,013 | 2,083,628 |
| Master Mortgages Trust Series 2002-3 Class 4A1 ±± | | 2.84 | 10-25-2032 | 1,607 | 1,513 |
| Med Trust Series 2021-MDLN (1 Month LIBOR +0.95%) 144A± | | 5.54 | 11-15-2038 | 7,976,304 | 7,781,950 |
| MF1 Multifamily Housing Mortgage Loan Trust Series 2021-FL5 Class A (U.S. SOFR 1 Month +0.96%) 144A± | | 5.53 | 7-15-2036 | 7,530,320 | 7,331,611 |
| MF1 Multifamily Housing Mortgage Series 2021-FL7 Class A (1 Month LIBOR +1.08%) 144A± | | 5.67 | 10-16-2036 | 12,000,000 | 11,776,926 |
| MF1 Multifamily Housing Mortgage Series 2022-FL8 Class A (30 Day Average U.S. SOFR +1.35%) 144A± | | 5.78 | 2-19-2037 | 13,025,000 | 12,866,694 |
| MFRA Trust Series 2020-NQM3 Class A1 144A±± | | 1.01 | 1-26-2065 | 1,170,308 | 1,071,546 |
| MFRA Trust Series 2021-NQM1 Class A1 144A±± | | 1.15 | 4-25-2065 | 3,911,907 | 3,458,334 |
| Mill City Mortgage Loan Trust Series 2017-2 Class A1 144A±± | | 2.75 | 7-25-2059 | 556,472 | 547,107 |
| Mill City Mortgage Loan Trust Series 2018-2 Class A1 144A±± | | 3.50 | 5-25-2058 | 738,882 | 721,438 |
The accompanying notes are an integral part of these financial statements.
Allspring Ultra Short-Term Income Fund | 17
Portfolio of investments—February 28, 2023 (unaudited)
| | | Interest
rate | Maturitydate | Principal | Value |
| Non-agency mortgage-backed securities (continued) | | | | | |
| New Residential Mortgage Loan Series 2021-INV1 Class A6 144A±± | | 2.50% | 6-25-2051 | $ 5,619,181 | $ 4,845,386 |
| NewRez WareHouse Securitization Series 2021-1 Class A (1 Month LIBOR +0.75%) 144A± | | 5.37 | 5-25-2055 | 10,000,000 | 9,891,346 |
| Oceanview Mortgage Trust 2021-EBO1 Class 1A 144A | | 1.22 | 12-29-2051 | 2,520,282 | 2,416,770 |
| Octagon Investment Partners Series 2017-1A Class A1R (3 Month LIBOR +1.00%) 144A± | | 5.81 | 3-17-2030 | 11,164,564 | 11,050,652 |
| OneMain Financial Issuance Trust Series 2020-1A Class A 144A | | 3.84 | 5-14-2032 | 6,890,267 | 6,851,682 |
| Onslow Bay Financial LLC Series 2020-EXP1 Class 1A8 144A±± | | 3.50 | 2-25-2060 | 690,604 | 607,833 |
| Onslow Bay Financial LLC Series 2021-NQM3 Class A1 144A±± | | 1.05 | 7-25-2061 | 4,456,288 | 3,436,797 |
| OPG Trust Series 2021-PORT Class A (1 Month LIBOR +0.48%) 144A± | | 5.07 | 10-15-2036 | 17,134,353 | 16,636,527 |
| Palmer Square Loan Funding Limited Series 2013-2A Class A1A3 (3 Month LIBOR +1.00%) 144A± | | 5.79 | 10-17-2031 | 17,785,000 | 17,609,604 |
| PFS Financing Corporation Series 2020-E Class A 144A | | 1.00 | 10-15-2025 | 15,000,000 | 14,568,899 |
| ReadyCap Commercial Mortgage Trust Series 2019-5 Class A 144A | | 3.78 | 2-25-2052 | 410,855 | 404,537 |
| Residential Mortgage Loan Trust Series 2019-2 Class A1 144A±± | | 2.91 | 5-25-2059 | 257,902 | 253,263 |
| Residential Mortgage Loan Trust Series 2021-1R Class A1 144A±± | | 0.86 | 1-25-2065 | 3,000,218 | 2,754,211 |
| Salomon Brothers Mortgage Securities VII Series 1990-2 Class A ±± | | 0.85 | 11-25-2049 | 76,387 | 76,053 |
| Sound Point CLO Limited Series 2015-1RA Class AR (3 Month LIBOR +1.08%) 144A± | | 5.87 | 4-15-2030 | 10,399,283 | 10,281,158 |
| SPGN TFLM Mortgage Trust Series 2022 Class A (U.S. SOFR 1 Month +1.55%) 144A± | | 6.11 | 2-15-2039 | 20,000,000 | 19,146,986 |
| Starwood Mortgage Residential Trust Series 2020-1 Class A3 144A±± | | 2.56 | 2-25-2050 | 3,240,031 | 3,084,369 |
| Starwood Mortgage Residential Trust Series 2021-2 Class A1 144A±± | | 0.94 | 5-25-2065 | 2,702,828 | 2,488,471 |
| TCI Symphony CLO Series 2016-1A Class AR2 (3 Month LIBOR +1.02%) 144A± | | 5.84 | 10-13-2032 | 7,685,000 | 7,604,753 |
| Toorak Mortgage Trust Series 2021-INV2 Class A1 144A±± | | 1.97 | 11-25-2056 | 12,893,469 | 10,708,252 |
| Towd Point Mortgage Trust Series 2017-1 Class A1 144A±± | | 2.75 | 10-25-2056 | 503,765 | 496,314 |
| Towd Point Mortgage Trust Series 2017-4 Class A1 144A±± | | 2.75 | 6-25-2057 | 909,661 | 861,602 |
| Towd Point Mortgage Trust Series 2017-6 Class A1 144A±± | | 2.75 | 10-25-2057 | 945,920 | 899,351 |
| Towd Point Mortgage Trust Series 2018-2 Class A1 144A±± | | 3.25 | 3-25-2058 | 1,675,071 | 1,604,771 |
| Towd Point Mortgage Trust Series 2018-3 Class A1 144A±± | | 3.75 | 5-25-2058 | 3,466,162 | 3,301,852 |
| TPG Real Estate Finance Trust Series 2022-FL5 Class A (30 Day Average U.S. SOFR +1.65%) 144A± | | 6.07 | 2-15-2039 | 15,000,000 | 14,599,064 |
| UBS Commercial Mortgage Trust Series 2018-NYCH Class A (1 Month LIBOR +0.85%) 144A± | | 5.44 | 2-15-2032 | 3,574,342 | 3,494,107 |
| Verus Securitization Trust Series 2019-3 Class A1 144A±± | | 2.69 | 11-25-2059 | 1,291,706 | 1,224,700 |
| Verus Securitization Trust Series 2020-2 Class A1 144A±± | | 2.23 | 5-25-2060 | 188,958 | 181,168 |
| Verus Securitization Trust Series 2020-INV1 Class A1 144A±± | | 1.98 | 3-25-2060 | 379,189 | 369,695 |
| Verus Securitization Trust Series 2021-1 Class A2 144A±± | | 1.05 | 1-25-2066 | 3,618,936 | 2,965,532 |
The accompanying notes are an integral part of these financial statements.
18 | Allspring Ultra Short-Term Income Fund
Portfolio of investments—February 28, 2023 (unaudited)
| | | Interest
rate | Maturitydate | Principal | Value |
| Non-agency mortgage-backed securities (continued) | | | | | |
| Verus Securitization Trust Series 2021-2 Class A1 144A±± | | 1.03% | 2-25-2066 | $ 2,023,551 | $ 1,718,338 |
| Verus Securitization Trust Series 2021-R3 Class A1 144A±± | | 1.02 | 4-25-2064 | 3,604,211 | 3,209,508 |
| Wilshire Funding Corporation Series 1996-3 Class M2 ±± | | 7.53 | 8-25-2032 | 78,194 | 79,311 |
| Wilshire Funding Corporation Series 1996-3 Class M3 ±± | | 7.53 | 8-25-2032 | 45,384 | 44,498 |
| Wilshire Funding Corporation Series 1998-2 Class M1 (12 Month Treasury Average +2.00%) ± | | 4.05 | 12-28-2037 | 72,322 | 71,128 |
| Wind River CLO Limited Series 2013-2A Class AR (3 Month LIBOR +1.00%) 144A± | | 5.79 | 10-18-2030 | 16,119,547 | 15,919,278 |
| Zais Matrix CDO Series 2020-14A Class A1AR (3 Month LIBOR +1.20%) 144A± | | 5.99 | 4-15-2032 | 11,511,261 | 11,427,608 |
| Total Non-agency mortgage-backed securities (Cost $465,194,219) | | | | | 440,084,170 |
| Yankee corporate bonds and notes: 13.77% | | | | | |
| Consumer discretionary: 0.30% | | | | | |
| Automobiles: 0.30% | | | | | |
| Nissan Motor Company Limited 144A | | 3.04 | 9-15-2023 | 4,500,000 | 4,422,904 |
| Stellantis NV | | 5.25 | 4-15-2023 | 530,000 | 528,580 |
| | | | | | 4,951,484 |
| Consumer staples: 0.30% | | | | | |
| Beverages: 0.30% | | | | | |
| Coca-Cola Europacific Partners plc 144A | | 0.50 | 5-5-2023 | 5,000,000 | 4,955,108 |
| Energy: 0.29% | | | | | |
| Oil, gas & consumable fuels: 0.29% | | | | | |
| Harvest Operations Corporation 144A | | 1.00 | 4-26-2024 | 5,000,000 | 4,747,150 |
| Financials: 10.40% | | | | | |
| Banks: 8.23% | | | | | |
| Banco Bilbao Vizcaya Argentaria SA | | 0.88 | 9-18-2023 | 5,000,000 | 4,871,399 |
| Banco Santander SA | | 3.89 | 5-24-2024 | 10,000,000 | 9,787,238 |
| Banque Fédérative du Crédit Mutuel 144A | | 4.94 | 1-26-2026 | 5,000,000 | 4,929,793 |
| Barclays Bank plc (1 Year Treasury Constant Maturity +0.80%) ± | | 1.01 | 12-10-2024 | 5,135,000 | 4,944,440 |
| BNP Paribas 144A | | 3.50 | 3-1-2023 | 4,000,000 | 4,000,000 |
| Corporación Andina de Fomento | | 2.38 | 5-12-2023 | 4,860,000 | 4,829,576 |
| Credit Suisse New York | | 3.63 | 9-9-2024 | 8,000,000 | 7,561,536 |
| Danske Bank Class A (1 Year Treasury Constant Maturity +1.45%) 144A± | | 3.77 | 3-28-2025 | 16,850,000 | 16,489,307 |
| Deutsche Bank (U.S. SOFR +2.16%) ± | | 2.22 | 9-18-2024 | 3,500,000 | 3,421,255 |
| HSBC Holdings plc (U.S. SOFR +0.58%) ± | | 1.16 | 11-22-2024 | 10,000,000 | 9,648,062 |
| HSBC Holdings plc (3 Month LIBOR +1.21%) ± | | 3.80 | 3-11-2025 | 10,000,000 | 9,789,901 |
| ING Groep NV (U.S. SOFR +1.64%) ± | | 3.87 | 3-28-2026 | 4,000,000 | 3,847,853 |
| Mitsubishi UFJ Financial Group Incorporated (1 Year Treasury Constant Maturity +0.68%) ± | | 0.85 | 9-15-2024 | 4,000,000 | 3,894,342 |
| Mitsubishi UFJ Financial Group Incorporated (1 Year Treasury Constant Maturity +1.08%) ± | | 5.72 | 2-20-2026 | 5,000,000 | 4,993,040 |
| Mizuho Financial Group Incorporated (U.S. SOFR +0.87%) ± | | 0.85 | 9-8-2024 | 6,990,000 | 6,806,293 |
| Mizuho Financial Group Incorporated (U.S. SOFR +1.25%) ± | | 1.24 | 7-10-2024 | 2,420,000 | 2,380,755 |
| NatWest Markets plc 144A | | 2.38 | 5-21-2023 | 5,290,000 | 5,253,577 |
| Nordea Bank AB 144A | | 3.75 | 8-30-2023 | 10,000,000 | 9,918,714 |
The accompanying notes are an integral part of these financial statements.
Allspring Ultra Short-Term Income Fund | 19
Portfolio of investments—February 28, 2023 (unaudited)
| | | Interest
rate | Maturitydate | Principal | Value |
| Banks (continued) | | | | | |
| Sumitomo Mitsui Banking Corporation | | 5.46% | 1-13-2026 | $10,000,000 | $ 9,978,045 |
| Toronto-Dominion Bank (U.S. SOFR +0.45%) ± | | 4.87 | 9-28-2023 | 3,000,000 | 3,002,310 |
| Toronto-Dominion Bank | | 5.10 | 1-9-2026 | 5,000,000 | 4,984,691 |
| | | | | | 135,332,127 |
| Capital markets: 0.42% | | | | | |
| UBS AG 144A | | 0.38 | 6-1-2023 | 7,000,000 | 6,917,559 |
| Diversified financial services: 0.59% | | | | | |
| AerCap Ireland Capital Designated Activity Company / AerCap Global Aviation Trust | | 1.15 | 10-29-2023 | 10,000,000 | 9,703,659 |
| Thrifts & mortgage finance: 1.16% | | | | | |
| Nationwide Building Society 144A | | 0.55 | 1-22-2024 | 20,000,000 | 19,095,463 |
| Industrials: 0.57% | | | | | |
| Transportation infrastructure: 0.57% | | | | | |
| Sydney Airport Finance Company | | 3.90 | 3-22-2023 | 9,265,000 | 9,257,477 |
| Information technology: 0.88% | | | | | |
| Semiconductors & semiconductor equipment: 0.88% | | | | | |
| Renesas Electronics Corporation 144A | | 1.54 | 11-26-2024 | 15,670,000 | 14,417,167 |
| Materials: 1.03% | | | | | |
| Chemicals: 1.03% | | | | | |
| Park Aerospace Holdings Company 144A | | 4.50 | 3-15-2023 | 4,000,000 | 3,996,673 |
| Syngenta Finance NV 144A | | 4.44 | 4-24-2023 | 13,000,000 | 12,966,376 |
| | | | | | 16,963,049 |
| Total Yankee corporate bonds and notes (Cost $232,301,379) | | | | | 226,340,243 |
| | | Yield | | Shares | |
| Short-term investments: 8.85% | | | | | |
| Investment companies: 5.22% | | | | | |
| Allspring Government Money Market Fund Select Class ♠∞## | | 4.39 | | 85,784,696 | 85,784,696 |
| Securities Lending Cash Investments LLC ♠∩∞ | | 4.54 | | 30,522 | 30,522 |
| | | | | | 85,815,218 |
| | | Interest
rate | | Principal | |
| U.S. Treasury securities: 3.63% | | | | | |
| U.S. Treasury Bill ☼ | | 4.51 | 4-18-2023 | $35,000,000 | 34,785,159 |
| U.S. Treasury Bill ☼ | | 4.67 | 3-28-2023 | 25,000,000 | 24,915,294 |
| | | | | | 59,700,453 |
| Total Short-term investments (Cost $145,514,620) | | | | | 145,515,671 |
| Total investments in securities (Cost $1,728,344,696) | 101.25% | | | | 1,664,756,907 |
| Other assets and liabilities, net | (1.25) | | | | (20,504,593) |
| Total net assets | 100.00% | | | | $1,644,252,314 |
The accompanying notes are an integral part of these financial statements.
20 | Allspring Ultra Short-Term Income Fund
Portfolio of investments—February 28, 2023 (unaudited)
| ± | Variable rate investment. The rate shown is the rate in effect at period end. |
| ±± | The coupon of the security is adjusted based on the principal and/or interest payments received from the underlying pool of mortgages as well as the credit quality and the actual prepayment speed of the underlying mortgages. The rate shown is the rate in effect at period end. |
| 144A | The security may be resold in transactions exempt from registration, normally to qualified institutional buyers, pursuant to Rule 144A under the Securities Act of 1933. |
| ## | All or a portion of this security is segregated for when-issued securities. |
| « | All or a portion of this security is on loan. |
| ♠ | The issuer of the security is an affiliated person of the Fund as defined in the Investment Company Act of 1940. |
| ∩ | The investment is a non-registered investment company purchased with cash collateral received from securities on loan. |
| ∞ | The rate represents the 7-day annualized yield at period end. |
| ☼ | Zero coupon security. The rate represents the current yield to maturity. |
| %% | The security is purchased on a when-issued basis. |
| Abbreviations: |
| FHLMC | Federal Home Loan Mortgage Corporation |
| FNMA | Federal National Mortgage Association |
| GNMA | Government National Mortgage Association |
| LIBOR | London Interbank Offered Rate |
| REIT | Real estate investment trust |
| SOFR | Secured Overnight Financing Rate |
Investments in affiliates
An affiliated investment is an investment in which the Fund owns at least 5% of the outstanding voting shares of the issuer or as a result of other relationships, such as the Fund and the issuer having the same investment manager. Transactions with issuers that were affiliates of the Fund at the end of the period were as follows:
| | Value,
beginning of
period | Purchases | Sales
proceeds | Net
realized
gains
(losses) | | Net
change in
unrealized
gains
(losses) | | Value,
end of
period | Shares,
end
of period | Income
from
affiliated
securities |
| Short-term investments | | | | | | | | | |
| Allspring Government Money Market Fund Select Class | $90,308,312 | $578,530,368 | $(583,053,984) | $0 | | $0 | | $ 85,784,696 | 85,784,696 | $ 1,481,593 |
| Securities Lending Cash Investments LLC | 0 | 96,427,807 | (96,397,288) | 0 | | 3 | | 30,522 | 30,522 | 72,451 # |
| | | | | $0 | | $3 | | $85,815,218 | | $1,554,044 |
| # | Amount shown represents income before fees and rebates. |
Futures contracts
| Description | Number of
contracts | Expiration
date | Notional
cost | Notional
value | Unrealized
gains | | Unrealized
losses |
| Long | | | | | | | |
| 5-Year U.S. Treasury Notes | 121 | 6-30-2023 | $ 12,992,561 | $ 12,953,617 | $ 0 | | $ (38,944) |
| Long | | | | | | | |
| 2-Year U.S. Treasury Notes | (998) | 6-30-2023 | (203,816,418) | (203,319,109) | 497,309 | | 0 |
| 10-Year U.S. Treasury Notes | (330) | 6-21-2023 | (36,908,216) | (36,846,563) | 61,653 | | 0 |
| | | | | | $558,962 | | $(38,944) |
The accompanying notes are an integral part of these financial statements.
Allspring Ultra Short-Term Income Fund | 21
Statement of assets and liabilities—February 28, 2023 (unaudited)
| | |
| Assets | |
Investments in unaffiliated securities (including $29,677 of securities loaned), at value (cost $1,642,529,481)
| $ 1,578,941,689 |
Investments in affiliated securities, at value (cost $85,815,215)
| 85,815,218 |
Cash
| 8,174 |
Cash at broker segregated for futures contracts
| 2,919,000 |
Receivable for interest
| 7,986,332 |
Receivable for Fund shares sold
| 3,452,536 |
Principal paydown receivable
| 128,814 |
Receivable for daily variation margin on open futures contracts
| 23,391 |
Receivable for securities lending income, net
| 50 |
Prepaid expenses and other assets
| 93,095 |
Total assets
| 1,679,368,299 |
| Liabilities | |
Payable for when-issued transactions
| 21,255,725 |
Payable for Fund shares redeemed
| 12,171,877 |
Dividends payable
| 1,289,435 |
Management fee payable
| 170,866 |
Administration fees payable
| 117,476 |
Payable upon receipt of securities loaned
| 30,522 |
Payable for daily variation margin on open futures contracts
| 16,429 |
Distribution fee payable
| 2,615 |
Accrued expenses and other liabilities
| 61,040 |
Total liabilities
| 35,115,985 |
Total net assets
| $1,644,252,314 |
| Net assets consist of | |
Paid-in capital
| $ 1,730,239,601 |
Total distributable loss
| (85,987,287) |
Total net assets
| $1,644,252,314 |
| Computation of net asset value and offering price per share | |
Net assets – Class A
| $ 187,295,227 |
Shares outstanding – Class A1
| 22,113,953 |
Net asset value per share – Class A
| $8.47 |
Maximum offering price per share – Class A2
| $8.64 |
Net assets – Class A2
| $ 53,798,203 |
Shares outstanding – Class A21
| 6,355,964 |
Net asset value per share – Class A2
| $8.46 |
Net assets – Class C
| $ 4,585,328 |
Shares outstanding – Class C1
| 542,007 |
Net asset value per share – Class C
| $8.46 |
Net assets – Administrator Class
| $ 12,759,703 |
Shares outstanding – Administrator Class1
| 1,513,416 |
Net asset value per share – Administrator Class
| $8.43 |
Net assets – Institutional Class
| $ 1,385,813,853 |
Shares outstanding – Institutional Class1
| 163,733,999 |
Net asset value per share – Institutional Class
| $8.46 |
| 1 | The Fund has an unlimited number of authorized shares. |
| 2 | Maximum offering price is computed as 100/98.00 of net asset value. On investments of $100,000 or more, the offering price is reduced. |
The accompanying notes are an integral part of these financial statements.
22 | Allspring Ultra Short-Term Income Fund
Statement of operations—six months ended February 28, 2023 (unaudited)
| | |
| Investment income | |
Interest
| $ 23,130,724 |
Income from affiliated securities
| 1,542,161 |
Dividends
| 863,352 |
Total investment income
| 25,536,237 |
| Expenses | |
Management fee
| 2,229,098 |
| Administration fees | |
Class A
| 169,017 |
Class A2
| 57,740 |
Class C
| 3,887 |
Administrator Class
| 6,871 |
Institutional Class
| 627,670 |
| Shareholder servicing fees | |
Class A
| 263,939 |
Class A2
| 54,131 |
Class C
| 6,071 |
Administrator Class
| 17,030 |
| Distribution fee | |
Class C
| 18,212 |
Custody and accounting fees
| 25,541 |
Professional fees
| 45,067 |
Registration fees
| 69,672 |
Shareholder report expenses
| 20,482 |
Trustees’ fees and expenses
| 10,625 |
Other fees and expenses
| 20,404 |
Total expenses
| 3,645,457 |
| Less: Fee waivers and/or expense reimbursements | |
Fund-level
| (831,748) |
Class A
| (87,414) |
Class A2
| (28,160) |
Class C
| (1,922) |
Administrator Class
| (1,198) |
Net expenses
| 2,695,015 |
Net investment income
| 22,841,222 |
| Realized and unrealized gains (losses) on investments | |
| Net realized gains (losses) on | |
Unaffiliated securities
| (3,818,657) |
Futures contracts
| 7,206,612 |
Net realized gains on investments
| 3,387,955 |
| Net change in unrealized gains (losses) on | |
Unaffiliated securities
| 5,590,671 |
Affiliated securities
| 3 |
Futures contracts
| 542,543 |
Net change in unrealized gains (losses) on investments
| 6,133,217 |
Net realized and unrealized gains (losses) on investments
| 9,521,172 |
Net increase in net assets resulting from operations
| $32,362,394 |
The accompanying notes are an integral part of these financial statements.
Allspring Ultra Short-Term Income Fund | 23
Statement of changes in net assets
| | | | | |
| | Six months ended
February 28, 2023
(unaudited) | Year ended
August 31, 2022 |
| Operations | | | | |
Net investment income
| | $ 22,841,222 | | $ 30,150,890 |
Net realized gains on investments
| | 3,387,955 | | 2,203,909 |
Net change in unrealized gains (losses) on investments
| | 6,133,217 | | (78,974,874) |
Net increase (decrease) in net assets resulting from operations
| | 32,362,394 | | (46,620,075) |
| Distributions to shareholders from | | | | |
| Net investment income and net realized gains | | | | |
Class A
| | (2,364,375) | | (2,203,328) |
Class A2
| | (822,945) | | (1,210,667) |
Class C
| | (36,296) | | (10,434) |
Administrator Class
| | (154,577) | | (144,350) |
Institutional Class
| | (19,367,498) | | (27,124,417) |
Total distributions to shareholders
| | (22,745,691) | | (30,693,196) |
| Capital share transactions | Shares | | Shares | |
| Proceeds from shares sold | | | | |
Class A
| 1,528,324 | 12,812,164 | 5,895,635 | 50,420,825 |
Class A2
| 415,229 | 3,485,249 | 9,904,616 | 84,764,729 |
Class C
| 73,616 | 618,057 | 159,424 | 1,346,884 |
Administrator Class
| 295,839 | 2,473,013 | 813,408 | 6,904,746 |
Institutional Class
| 41,276,356 | 346,532,030 | 273,686,740 | 2,334,975,807 |
| | | 365,920,513 | | 2,478,412,991 |
| Reinvestment of distributions | | | | |
Class A
| 253,343 | 2,129,195 | 232,255 | 1,967,202 |
Class A2
| 98,048 | 822,877 | 142,824 | 1,210,276 |
Class C
| 3,749 | 31,486 | 1,082 | 9,096 |
Administrator Class
| 18,257 | 152,803 | 16,776 | 141,490 |
Institutional Class
| 1,312,791 | 11,027,777 | 1,711,908 | 14,504,288 |
| | | 14,164,138 | | 17,832,352 |
| Payment for shares redeemed | | | | |
Class A
| (8,788,881) | (73,778,784) | (10,433,023) | (88,799,648) |
Class A2
| (6,045,046) | (50,622,637) | (19,219,923) | (163,385,107) |
Class C
| (156,686) | (1,314,223) | (263,806) | (2,242,894) |
Administrator Class
| (561,419) | (4,701,825) | (1,559,646) | (13,205,778) |
Institutional Class
| (99,896,375) | (837,357,887) | (369,065,613) | (3,132,101,475) |
| | | (967,775,356) | | (3,399,734,902) |
Net decrease in net assets resulting from capital share transactions
| | (587,690,705) | | (903,489,559) |
Total decrease in net assets
| | (578,074,002) | | (980,802,830) |
| Net assets | | | | |
Beginning of period
| | 2,222,326,316 | | 3,203,129,146 |
End of period
| | $1,644,252,314 | | $ 2,222,326,316 |
The accompanying notes are an integral part of these financial statements.
24 | Allspring Ultra Short-Term Income Fund
Financial highlights
(For a share outstanding throughout each period)
| | | Year ended August 31 |
| Class A | Six months ended
February 28, 2023
(unaudited) | 2022 | 2021 | 2020 | 2019 | 2018 |
Net asset value, beginning of period
| $8.41 | $8.61 | $8.60 | $8.54 | $8.46 | $8.48 |
Net investment income
| 0.09 1 | 0.07 | 0.07 | 0.16 | 0.17 1 | 0.13 |
Net realized and unrealized gains (losses) on investments
| 0.06 | (0.20) | 0.01 | 0.06 | 0.08 | (0.02) |
Total from investment operations
| 0.15 | (0.13) | 0.08 | 0.22 | 0.25 | 0.11 |
| Distributions to shareholders from | | | | | | |
Net investment income
| (0.09) | (0.07) | (0.07) | (0.16) | (0.17) | (0.13) |
Net asset value, end of period
| $8.47 | $8.41 | $8.61 | $8.60 | $8.54 | $8.46 |
Total return2
| 1.85% | (1.51)% | 0.99% | 2.62% | 3.04% | 1.24% |
| Ratios to average net assets (annualized) | | | | | | |
Gross expenses
| 0.67% | 0.65% | 0.66% | 0.77% | 0.80% | 0.80% |
Net expenses
| 0.50% | 0.49% | 0.49% | 0.64% | 0.70% | 0.70% |
Net investment income
| 2.25% | 0.79% | 0.84% | 1.92% | 2.05% | 1.47% |
| Supplemental data | | | | | | |
Portfolio turnover rate
| 14% | 77% | 106% | 68% | 36% | 55% |
Net assets, end of period (000s omitted)
| $187,295 | $244,894 | $287,697 | $232,660 | $215,503 | $243,909 |
| 1 | Calculated based upon average shares outstanding |
| 2 | Total return calculations do not include any sales charges. Returns for periods of less than one year are not annualized. |
The accompanying notes are an integral part of these financial statements.
Allspring Ultra Short-Term Income Fund | 25
Financial highlights
(For a share outstanding throughout each period)
| | | Year ended August 31 |
| Class A2 | Six months ended
February 28, 2023
(unaudited) | 2022 | 2021 | 2020 1 |
Net asset value, beginning of period
| $8.40 | $8.60 | $8.59 | $8.52 |
Net investment income
| 0.10 | 0.07 | 0.07 | 0.03 |
Net realized and unrealized gains (losses) on investments
| 0.06 | (0.20) | 0.01 | 0.07 |
Total from investment operations
| 0.16 | (0.13) | 0.08 | 0.10 |
| Distributions to shareholders from | | | | |
Net investment income
| (0.10) | (0.07) | (0.07) | (0.03) |
Net asset value, end of period
| $8.46 | $8.40 | $8.60 | $8.59 |
Total return2
| 1.90% | (1.49)% | 0.97% | 1.22% |
| Ratios to average net assets (annualized) | | | | |
Gross expenses
| 0.57% | 0.62% | 0.65% | 0.66% |
Net expenses
| 0.40% | 0.47% | 0.50% | 0.50% |
Net investment income
| 2.29% | 0.75% | 0.73% | 1.38% |
| Supplemental data | | | | |
Portfolio turnover rate
| 14% | 77% | 106% | 68% |
Net assets, end of period (000s omitted)
| $53,798 | $99,902 | $181,131 | $29,971 |
| 1 | For the period from May 29, 2020 (commencement of class operations) to August 31, 2020 |
| 2 | Returns for periods of less than one year are not annualized. |
The accompanying notes are an integral part of these financial statements.
26 | Allspring Ultra Short-Term Income Fund
Financial highlights
(For a share outstanding throughout each period)
| | | Year ended August 31 |
| Class C | Six months ended
February 28, 2023
(unaudited) | 2022 | 2021 | 2020 | 2019 | 2018 |
Net asset value, beginning of period
| $8.40 | $8.60 | $8.59 | $8.54 | $8.46 | $8.47 |
Net investment income
| 0.06 | 0.01 | 0.01 1 | 0.10 | 0.11 | 0.06 |
Net realized and unrealized gains (losses) on investments
| 0.06 | (0.19) | 0.01 | 0.05 | 0.08 | (0.01) |
Total from investment operations
| 0.12 | (0.18) | 0.02 | 0.15 | 0.19 | 0.05 |
| Distributions to shareholders from | | | | | | |
Net investment income
| (0.06) | (0.02) | (0.01) | (0.10) | (0.11) | (0.06) |
Net asset value, end of period
| $8.46 | $8.40 | $8.60 | $8.59 | $8.54 | $8.46 |
Total return2
| 1.47% | (2.13)% | 0.28% | 1.73% | 2.27% | 0.60% |
| Ratios to average net assets (annualized) | | | | | | |
Gross expenses
| 1.42% | 1.38% | 1.40% | 1.51% | 1.55% | 1.55% |
Net expenses
| 1.25% | 1.11% * | 1.19% * | 1.40% | 1.45% | 1.45% |
Net investment income
| 1.50% | 0.18% | 0.13% | 1.16% | 1.31% | 0.72% |
| Supplemental data | | | | | | |
Portfolio turnover rate
| 14% | 77% | 106% | 68% | 36% | 55% |
Net assets, end of period (000s omitted)
| $4,585 | $5,219 | $6,230 | $5,187 | $5,257 | $5,056 |
| * | Ratio includes class-level expenses which were voluntarily waived by the investment manager. Without this voluntary waiver, the net expense ratio would be increased by the following amounts: |
| Year ended August 31, 2022 | 0.14% |
| Year ended August 31, 2021 | 0.06% |
| 1 | Calculated based upon average shares outstanding |
| 2 | Total return calculations do not include any sales charges. Returns for periods of less than one year are not annualized. |
The accompanying notes are an integral part of these financial statements.
Allspring Ultra Short-Term Income Fund | 27
Financial highlights
(For a share outstanding throughout each period)
| | | Year ended August 31 |
| Administrator Class | Six months ended
February 28, 2023
(unaudited) | 2022 | 2021 | 2020 | 2019 | 2018 |
Net asset value, beginning of period
| $8.37 | $8.57 | $8.56 | $8.51 | $8.43 | $8.45 |
Net investment income
| 0.09 | 0.07 1 | 0.07 1 | 0.17 | 0.19 1 | 0.13 |
Net realized and unrealized gains (losses) on investments
| 0.06 | (0.20) | 0.01 | 0.05 | 0.08 | (0.01) |
Total from investment operations
| 0.15 | (0.13) | 0.08 | 0.22 | 0.27 | 0.12 |
| Distributions to shareholders from | | | | | | |
Net investment income
| (0.09) | (0.07) | (0.07) | (0.17) | (0.19) | (0.14) |
Net asset value, end of period
| $8.43 | $8.37 | $8.57 | $8.56 | $8.51 | $8.43 |
Total return2
| 1.85% | (1.53)% | 0.98% | 2.61% | 3.19% | 1.39% |
| Ratios to average net assets (annualized) | | | | | | |
Gross expenses
| 0.61% | 0.59% | 0.60% | 0.71% | 0.74% | 0.74% |
Net expenses
| 0.50% | 0.50% | 0.50% | 0.54% | 0.55% | 0.55% |
Net investment income
| 2.26% | 0.77% | 0.82% | 2.03% | 2.20% | 1.54% |
| Supplemental data | | | | | | |
Portfolio turnover rate
| 14% | 77% | 106% | 68% | 36% | 55% |
Net assets, end of period (000s omitted)
| $12,760 | $14,740 | $21,336 | $15,359 | $13,748 | $15,037 |
| 1 | Calculated based upon average shares outstanding |
| 2 | Returns for periods of less than one year are not annualized. |
The accompanying notes are an integral part of these financial statements.
28 | Allspring Ultra Short-Term Income Fund
Financial highlights
(For a share outstanding throughout each period)
| | | Year ended August 31 |
| Institutional Class | Six months ended
February 28, 2023
(unaudited) | 2022 | 2021 | 2020 | 2019 | 2018 |
Net asset value, beginning of period
| $8.40 | $8.60 | $8.59 | $8.54 | $8.46 | $8.48 |
Net investment income
| 0.11 | 0.09 | 0.09 | 0.19 | 0.20 | 0.15 |
Net realized and unrealized gains (losses) on investments
| 0.05 | (0.20) | 0.02 | 0.05 | 0.08 | (0.02) |
Total from investment operations
| 0.16 | (0.11) | 0.11 | 0.24 | 0.28 | 0.13 |
| Distributions to shareholders from | | | | | | |
Net investment income
| (0.10) | (0.09) | (0.10) | (0.19) | (0.20) | (0.15) |
Net asset value, end of period
| $8.46 | $8.40 | $8.60 | $8.59 | $8.54 | $8.46 |
Total return1
| 1.97% | (1.28)% | 1.23% | 2.83% | 3.40% | 1.59% |
| Ratios to average net assets (annualized) | | | | | | |
Gross expenses
| 0.34% | 0.32% | 0.33% | 0.44% | 0.47% | 0.47% |
Net expenses
| 0.25% | 0.25% | 0.25% | 0.32% | 0.35% | 0.35% |
Net investment income
| 2.48% | 1.01% | 1.03% | 2.25% | 2.41% | 1.80% |
| Supplemental data | | | | | | |
Portfolio turnover rate
| 14% | 77% | 106% | 68% | 36% | 55% |
Net assets, end of period (000s omitted)
| $1,385,814 | $1,857,572 | $2,706,735 | $1,004,777 | $836,456 | $744,844 |
| 1 | Returns for periods of less than one year are not annualized. |
The accompanying notes are an integral part of these financial statements.
Allspring Ultra Short-Term Income Fund | 29
Notes to financial statements (unaudited)
1. ORGANIZATION
Allspring Funds Trust (the "Trust"), a Delaware statutory trust organized on March 10, 1999, is an open-end management investment company registered under the Investment Company Act of 1940, as amended (the "1940 Act"). As an investment company, the Trust follows the accounting and reporting guidance in Financial Accounting Standards Board ("FASB") Accounting Standards Codification Topic 946, Financial Services – Investment Companies. These financial statements report on the Allspring Ultra Short-Term Income Fund (the "Fund") which is a diversified series of the Trust.
2. SIGNIFICANT ACCOUNTING POLICIES
The following significant accounting policies, which are consistently followed in the preparation of the financial statements of the Fund, are in conformity with U.S. generally accepted accounting principles which require management to make estimates and assumptions that affect the reported amounts of assets and liabilities, disclosure of contingent assets and liabilities at the date of the financial statements, and the reported amounts of income and expenses during the reporting period. Actual results could differ from those estimates.
Securities valuation
All investments are valued each business day as of the close of regular trading on the New York Stock Exchange (generally 4 p.m. Eastern Time), although the Fund may deviate from this calculation time under unusual or unexpected circumstances.
Debt securities are valued at the evaluated bid price provided by an independent pricing service (e.g. taking into account various factors, including yields, maturities, or credit ratings) or, if a reliable price is not available, the quoted bid price from an independent broker-dealer.
Equity securities and futures contracts that are listed on a foreign or domestic exchange or market are valued at the official closing price or, if none, the last sales price.
Investments in registered open-end investment companies (other than those listed on a foreign or domestic exchange or market) are valued at net asset value. Interests in non-registered investment companies that are redeemable at net asset value are fair valued normally at net asset value.
Investments which are not valued using the methods discussed above are valued at their fair value, as determined in good faith by Allspring Funds Management, LLC ("Allspring Funds Management"), which was named the valuation designee by the Board of Trustees. As the valuation designee, Allspring Funds Management is responsible for day-to-day valuation activities for the Allspring Funds. In connection with these responsibilities, Allspring Funds Management has established a Valuation Committee and has delegated to it the authority to take any actions regarding the valuation of portfolio securities that the Valuation Committee deems necessary or appropriate, including determining the fair value of portfolio securities. On a quarterly basis, the Board of Trustees receives reports of valuation actions taken by the Valuation Committee. On at least an annual basis, the Board of Trustees receives an assessment of the adequacy and effectiveness of Allspring Funds Management's process for determining the fair value of the portfolio of investments.
Securities lending
The Fund may lend its securities from time to time in order to earn additional income in the form of fees or interest on securities received as collateral or the investment of any cash received as collateral. When securities are on loan, the Fund receives interest or dividends on those securities. Cash collateral received in connection with its securities lending transactions is invested in Securities Lending Cash Investments, LLC (the "Securities Lending Fund"), an affiliated non-registered investment company. Investments in Securities Lending Fund are valued at the evaluated bid price provided by an independent pricing service. Income earned from investment in the Securities Lending Fund (net of fees and rebates), if any, is included in income from affiliated securities on the Statement of Operations.
In a securities lending transaction, the net asset value of the Fund is affected by an increase or decrease in the value of the securities loaned and by an increase or decrease in the value of the instrument in which collateral is invested. The amount of securities lending activity undertaken by the Fund fluctuates from time to time. The Fund has the right under the lending agreement to recover the securities from the borrower on demand. In the event of default or bankruptcy by the borrower, the Fund may be prevented from recovering the loaned securities or gaining access to the collateral or may experience delays or costs in doing so. In such an event, the terms of the agreement allow the unaffiliated securities lending agent to use the collateral to purchase replacement securities on behalf of the Fund or pay the Fund the market value of the loaned securities. The Fund bears the risk of loss with respect to depreciation of its investment of the cash collateral.
30 | Allspring Ultra Short-Term Income Fund
Notes to financial statements (unaudited)
When-issued transactions
The Fund may purchase securities on a forward commitment or when-issued basis. The Fund records a when-issued transaction on the trade date and will segregate assets in an amount at least equal in value to the Fund's commitment to purchase when-issued securities. Securities purchased on a when-issued basis are marked-to-market daily and the Fund begins earning interest on the settlement date. Losses may arise due to changes in the market value of the underlying securities or if the counterparty does not perform under the contract.
Futures contracts
Futures contracts are agreements between the Fund and a counterparty to buy or sell a specific amount of a commodity, financial instrument or currency at a specified price on a specified date. The Fund may buy and sell futures contracts in order to gain exposure to, or protect against, changes in interest rates and is subject to interest rate risk. The primary risks associated with the use of futures contracts are the imperfect correlation between changes in market values of securities held by the Fund and the prices of futures contracts, and the possibility of an illiquid market. Futures contracts are generally entered into on a regulated futures exchange and cleared through a clearinghouse associated with the exchange. With futures contracts, there is minimal counterparty risk to the Fund since futures contracts are exchange-traded and the exchange’s clearinghouse, as the counterparty to all exchange-traded futures, guarantees the futures contracts against default.
Upon entering into a futures contract, the Fund is required to deposit either cash or securities (initial margin) with the broker in an amount equal to a certain percentage of the contract value. Subsequent payments (variation margin) are paid to or from the broker each day equal to the daily changes in the contract value. Such payments are recorded as unrealized gains or losses and, if any, shown as variation margin receivable (payable) in the Statement of Assets and Liabilities. Should the Fund fail to make requested variation margin payments, the broker can gain access to the initial margin to satisfy the Fund’s payment obligations. When the contracts are closed, a realized gain or loss is recorded in the Statement of Operations.
Mortgage dollar roll transactions
The Fund may engage in mortgage dollar roll transactions through TBA mortgage-backed securities issued by Government National Mortgage Association (GNMA), Federal National Mortgage Association (FNMA) and Federal Home Loan Mortgage Corporation (FHLMC). In a mortgage dollar roll transaction, the Fund sells a mortgage-backed security to a financial institution, such as a bank or broker-dealer and simultaneously agrees to repurchase a substantially similar security from the institution at a later date at an agreed upon price. The mortgage-backed securities that are repurchased will bear the same interest rate as those sold, but generally will be collateralized by different pools of mortgages with different pre-payment histories. During the roll period, the Fund foregoes principal and interest paid on the securities. The Fund is compensated by the difference between the current sales price and the forward price for the future purchase as well as by the earnings on the cash proceeds of the initial sale. Mortgage dollar rolls may be renewed without physical delivery of the securities subject to the contract. The Fund accounts for TBA dollar roll transactions as purchases and sales which, as a result, may increase its portfolio turnover rate.
Security transactions and income recognition
Securities transactions are recorded on a trade date basis. Realized gains or losses are recorded on the basis of identified cost.
Interest income is accrued daily and bond discounts are accreted and premiums are amortized daily. To the extent debt obligations are placed on non-accrual status, any related interest income may be reduced by writing off interest receivables when the collection of all or a portion of interest has been determined to be doubtful based on consistently applied procedures and the fair value has decreased. If the issuer subsequently resumes interest payments or when the collectability of interest is reasonably assured, the debt obligation is removed from non-accrual status. Paydown gains and losses are included in interest income.
Distributions to shareholders
Distributions to shareholders from net investment income are declared daily and paid monthly. Distributions from net realized gains, if any, are recorded on the ex-dividend date and paid at least annually. Such distributions are determined in accordance with income tax regulations and may differ from U.S. generally accepted accounting principles. Dividend sources are estimated at the time of declaration. The tax character of distributions is determined as of the Fund's fiscal year end. Therefore, a portion of the Fund's distributions made prior to the Fund’s fiscal year end may be categorized as a tax return of capital at year end.
Federal and other taxes
The Fund intends to continue to qualify as a regulated investment company by distributing substantially all of its investment company taxable income and any net realized capital gains (after reduction for capital loss carryforwards) sufficient to relieve it from all, or substantially all, federal income taxes. Accordingly, no provision for federal income taxes was required.
Allspring Ultra Short-Term Income Fund | 31
Notes to financial statements (unaudited)
The Fund’s income and federal excise tax returns and all financial records supporting those returns for the prior three fiscal years are subject to examination by the federal and Delaware revenue authorities. Management has analyzed the Fund's tax positions taken on federal, state, and foreign tax returns, as applicable, for all open tax years and does not believe that there are any uncertain tax positions that require recognition of a tax liability.
As of February 28, 2023, the aggregate cost of all investments for federal income tax purposes was $1,728,968,957 and the unrealized gains (losses) consisted of:
| Gross unrealized gains | $ 870,040 |
| Gross unrealized losses | (64,562,072) |
| Net unrealized losses | $(63,692,032) |
As of August 31, 2022, the Fund had capital loss carryforwards which consisted of $1,793,671 in short-term capital losses and $23,510,734 in long-term capital losses.
Class allocations
The separate classes of shares offered by the Fund differ principally in applicable sales charges, distribution, shareholder servicing, and administration fees. Class specific expenses are charged directly to that share class. Investment income, common fund-level expenses, and realized and unrealized gains (losses) on investments are allocated daily to each class of shares based on the relative proportion of net assets of each class.
3. FAIR VALUATION MEASUREMENTS
Fair value measurements of investments are determined within a framework that has established a fair value hierarchy based upon the various data inputs utilized in determining the value of the Fund’s investments. The three-level hierarchy gives the highest priority to unadjusted quoted prices in active markets for identical assets or liabilities (Level 1) and the lowest priority to unobservable inputs (Level 3). The Fund’s investments are classified within the fair value hierarchy based on the lowest level of input that is significant to the fair value measurement. The inputs are summarized into three broad levels as follows:
| ■ | Level 1 – quoted prices in active markets for identical securities |
| ■ | Level 2 – other significant observable inputs (including quoted prices for similar securities, interest rates, prepayment speeds, credit risk, etc.) |
| ■ | Level 3 – significant unobservable inputs (including the Fund’s own assumptions in determining the fair value of investments) |
The inputs or methodologies used for valuing investments in securities are not necessarily an indication of the risk associated with investing in those securities.
32 | Allspring Ultra Short-Term Income Fund
Notes to financial statements (unaudited)
The following is a summary of the inputs used in valuing the Fund’s assets and liabilities as of February 28, 2023:
| | Quoted prices
(Level 1) | Other significant
observable inputs
(Level 2) | Significant
unobservable inputs
(Level 3) | Total |
| Assets | | | | |
| Investments in: | | | | |
| Agency securities | $ 0 | $ 19,029,240 | $0 | $ 19,029,240 |
| Asset-backed securities | 0 | 232,441,832 | 0 | 232,441,832 |
| Corporate bonds and notes | 0 | 557,233,602 | 0 | 557,233,602 |
| Investment companies | 42,172,578 | 0 | 0 | 42,172,578 |
| Municipal obligations | 0 | 1,939,571 | 0 | 1,939,571 |
| Non-agency mortgage-backed securities | 0 | 440,084,170 | 0 | 440,084,170 |
| Yankee corporate bonds and notes | 0 | 226,340,243 | 0 | 226,340,243 |
| Short-term investments | | | | |
| Investment companies | 85,815,218 | 0 | 0 | 85,815,218 |
| U.S. Treasury securities | 59,700,453 | 0 | 0 | 59,700,453 |
| | 187,688,249 | 1,477,068,658 | 0 | 1,664,756,907 |
| Futures contracts | 558,962 | 0 | 0 | 558,962 |
| Total assets | $188,247,211 | $1,477,068,658 | $0 | $1,665,315,869 |
| Liabilities | | | | |
| Futures contracts | $ 38,944 | $ 0 | $0 | $ 38,944 |
| Total liabilities | $ 38,944 | $ 0 | $0 | $ 38,944 |
Futures contracts are reported at their cumulative unrealized gains (losses) at measurement date as reported in the table following the Portfolio of Investments. For futures contracts, the current day’s variation margin is reported on the Statement of Assets and Liabilities. All other assets and liabilities are reported at their market value at measurement date.
Additional sector, industry or geographic detail, if any, is included in the Portfolio of Investments.
For the six months ended February 28, 2023, the Fund did not have any transfers into/out of Level 3.
4. TRANSACTIONS WITH AFFILIATES
Management fee
Allspring Funds Management, a wholly owned subsidiary of Allspring Global Investments Holdings, LLC, a holding company indirectly owned by certain private funds of GTCR LLC and Reverence Capital Partners, L.P., is the manager of the Fund and provides advisory and fund-level administrative services under an investment management agreement. Under the investment management agreement, Allspring Funds Management is responsible for, among other services, implementing the investment objectives and strategies of the Fund, supervising the subadviser and providing fund-level administrative services in connection with the Fund’s operations. As compensation for its services under the investment management agreement, Allspring Funds Management is entitled to receive a management fee at the following annual rate based on the Fund’s average daily net assets:
| Average daily net assets | Management fee |
| First $1 billion | 0.250% |
| Next $4 billion | 0.225 |
| Next $5 billion | 0.190 |
| Over $10 billion | 0.180 |
For the six months ended February 28, 2023, the management fee was equivalent to an annual rate of 0.24% of the Fund’s average daily net assets.
Allspring Funds Management has retained the services of a subadviser to provide daily portfolio management to the Fund. The fee for subadvisory services is borne by Allspring Funds Management. Allspring Global Investments, LLC ("Allspring
Allspring Ultra Short-Term Income Fund | 33
Notes to financial statements (unaudited)
Investments"), an affiliate of Allspring Funds Management and a wholly owned subsidiary of Allspring Global Investments Holdings, LLC, is the subadviser to the Fund and is entitled to receive a fee from Allspring Funds Management at an annual rate starting at 0.15% and declining to 0.05% as the average daily net assets of the Fund increase.
Administration fees
Under a class-level administration agreement, Allspring Funds Management provides class-level administrative services to the Fund, which includes paying fees and expenses for services provided by the transfer agent, sub-transfer agents, omnibus account servicers and record-keepers. As compensation for its services under the class-level administration agreement, Allspring Funds Management receives an annual fee which is calculated based on the average daily net assets of each class as follows:
| | Class-level
administration fee |
| Class A | 0.16% |
| Class A2 | 0.16 |
| Class C | 0.16 |
| Administrator Class | 0.10 |
| Institutional Class | 0.08 |
Waivers and/or expense reimbursements
Allspring Funds Management has contractually committed to waive and/or reimburse management and administration fees to the extent necessary to maintain certain net operating expense ratios for the Fund. When each class of the Fund has exceeded its expense cap, Allspring Funds Management will waive fees and/or reimburse expenses from fund-level expenses on a proportionate basis and then from class specific expenses. When only certain classes exceed their expense caps, waivers and/or reimbursements are applied against class specific expenses before fund-level expenses. Allspring Funds Management has contractually committed through December 31, 2023 to waive fees and/or reimburse expenses to the extent necessary to cap expenses. Prior to or after the commitment expiration date, the caps may be increased or the commitment to maintain the caps may be terminated only with the approval of the Board of Trustees. As of February 28, 2023, the contractual expense caps are as follows:
| | Expense ratio caps |
| Class A | 0.50% |
| Class A2 | 0.40 |
| Class C | 1.25 |
| Administrator Class | 0.50 |
| Institutional Class | 0.25 |
Distribution fee
The Trust has adopted a distribution plan for Class C shares pursuant to Rule 12b-1 under the 1940 Act. A distribution fee is charged to Class C shares and paid to Allspring Funds Distributor, LLC ("Allspring Funds Distributor"), the principal underwriter, an affiliate of Allspring Funds Management, at an annual rate up to 0.75% of the average daily net assets of Class C shares.
In addition, Allspring Funds Distributor is entitled to receive the front-end sales charge from the purchase of Class A shares and a contingent deferred sales charge on the redemption of certain Class A shares. Allspring Funds Distributor is also entitled to receive the contingent deferred sales charges from redemptions of Class C shares. Allspring Funds Distributor received $266 in contingent deferred sales charges from Class A shares for the six months ended February 28, 2023. No front-end sales charges were incurred by Class A shares and no contingent deferred sales charges were incurred by Class C shares for the six months ended February 28, 2023.
Shareholder servicing fees
The Trust has entered into contracts with one or more shareholder servicing agents, whereby Class A, Class C, and Administrator Class are charged a fee at an annual rate up to 0.25% of the average daily net assets of each respective class. A portion of these total shareholder servicing fees were paid to affiliates of the Fund.
34 | Allspring Ultra Short-Term Income Fund
Notes to financial statements (unaudited)
Interfund transactions
The Fund may purchase or sell portfolio investment securities to certain affiliates pursuant to Rule 17a-7 under the 1940 Act and under procedures adopted by the Board of Trustees. The procedures have been designed to ensure that these interfund transactions, which do not incur broker commissions, are effected at current market prices.
5. INVESTMENT PORTFOLIO TRANSACTIONS
Purchases and sales of investments, excluding U.S. government obligations (if any) and short-term securities, for the six months ended February 28, 2023 were $228,165,791 and $432,097,576, respectively.
6. SECURITIES LENDING TRANSACTIONS
The Fund lends its securities through an unaffiliated securities lending agent and receives collateral in the form of cash or securities with a value at least equal to the value of the securities on loan. The value of the loaned securities is determined at the close of each business day and any increases or decreases in the required collateral are exchanged between the Fund and the counterparty on the next business day. Cash collateral received is invested in the Securities Lending Fund which seeks to provide a positive return compared to the daily Federal Funds Open Rate by investing in high-quality, U.S. dollar-denominated short-term money market instruments and is exempt from registration under Section 3(c)(7) of the 1940 Act. Securities Lending Fund is managed by Allspring Funds Management and is subadvised by Allspring Investments. Allspring Funds Management receives an advisory fee starting at 0.05% and declining to 0.01% as the average daily net assets of the Securities Lending Fund increase. All of the fees received by Allspring Funds Management are paid to Allspring Investments for its services as subadviser.
In the event of counterparty default or the failure of a borrower to return a loaned security, the Fund has the right to use the collateral to offset any losses incurred. As of February 28, 2023, the Fund had securities lending transactions with the following counterparties which are subject to offset:
| Counterparty | Value of
securities on
loan | Collateral
received1 | Net amount |
| Bank of America Securities Incorporated | $29,677 | $(29,677) | $0 |
1 Collateral disclosed within this table is limited to the net transaction with the counterparty.
7. DERIVATIVE TRANSACTIONS
During the six months ended February 28, 2023, the Fund entered into futures contracts to speculate on interest rates and to help manage the duration of the portfolio. The Fund had an average notional amount of $76,929,579 in long futures contracts and $361,610,646 in short futures contracts during the six months ended February 28, 2023.
The fair value, realized gains or losses and change in unrealized gains or losses, if any, on derivative instruments are reflected in the corresponding financial statement captions.
8. BANK BORROWINGS
The Trust (excluding the money market funds), Allspring Master Trust and Allspring Variable Trust are parties to a $350,000,000 revolving credit agreement whereby the Fund is permitted to use bank borrowings for temporary or emergency purposes, such as to fund shareholder redemption requests. Interest under the credit agreement is charged to the Fund based on a borrowing rate equal to the higher of the Federal Funds rate or the overnight bank funding rate in effect on that day plus a spread. In addition, an annual commitment fee equal based on the unused balance is allocated to each participating fund.
For the six months ended February 28, 2023, there were no borrowings by the Fund under the agreement.
9. MARKET RISKS
On March 11, 2020, the World Health Organization announced that it had made the assessment that coronavirus disease 2019 (“COVID-19”) is a pandemic. The impacts of COVID-19 are affecting the entire global economy, individual companies and investment products, the funds, and the market in general. There is significant uncertainty around the extent and duration of business disruptions related to COVID-19 and the impacts may last for an extended period of time. COVID-19 has led to significant uncertainty and volatility in the financial markets.
Allspring Ultra Short-Term Income Fund | 35
Notes to financial statements (unaudited)
10. INDEMNIFICATION
Under the Fund's organizational documents, the officers and Trustees have been granted certain indemnification rights against certain liabilities that may arise out of performance of their duties to the Fund. The Fund has entered into a separate agreement with each Trustee that converts indemnification rights currently existing under the Fund’s organizational documents into contractual rights that cannot be changed in the future without the consent of the Trustee. Additionally, in the normal course of business, the Fund may enter into contracts with service providers that contain a variety of indemnification clauses. The Fund’s maximum exposure under these arrangements is dependent on future claims that may be made against the Fund and, therefore, cannot be estimated.
36 | Allspring Ultra Short-Term Income Fund
Other information (unaudited)
PROXY VOTING INFORMATION
A description of the policies and procedures used to determine how to vote proxies relating to portfolio securities is available without charge, upon request, by calling 1-800-222-8222, visiting our website at allspringglobal.com, or visiting the SEC website at sec.gov. Information regarding how the proxies related to portfolio securities were voted during the most recent 12-month period ended June 30 is available on the website at allspringglobal.com or by visiting the SEC website at sec.gov.
QUARTERLY PORTFOLIO HOLDINGS INFORMATION
The Fund files its complete schedule of portfolio holdings with the SEC for the first and third quarters of each fiscal year as an exhibit to its reports on Form N-PORT. Shareholders may view the filed Form N-PORT by visiting the SEC website at sec.gov.
Allspring Ultra Short-Term Income Fund | 37
Other information (unaudited)
BOARD OF TRUSTEES AND OFFICERS
Each of the Trustees and Officers listed in the table below acts in identical capacities for each fund in the Allspring family of funds, which consists of 127 mutual funds comprising the Allspring Funds Trust, Allspring Variable Trust, Allspring Master Trust and four closed-end funds (collectively the “Fund Complex”). This table should be read in conjunction with the Prospectus and the Statement of Additional Information1. The mailing address of each Trustee and Officer is 1415 Vantage Park Drive, 3rd Floor, Charlotte, NC 28203. Each Trustee and Officer serves an indefinite term, however, each Trustee serves such term until reaching the mandatory retirement age established by the Trustees.
Independent Trustees
Name and
year of birth | Position held and
length of service* | Principal occupations during past five years or longer | Current other
public company or
investment
company
directorships |
William R. Ebsworth
(Born 1957) | Trustee,
since 2015 | Retired. From 1984 to 2013, equities analyst, portfolio manager, research director and chief investment officer at Fidelity Management and Research Company in Boston, Tokyo, and Hong Kong, and retired in 2013 as Chief Investment Officer of Fidelity Strategic Advisers, Inc. where he led a team of investment professionals managing client assets. Prior thereto, Board member of Hong Kong Securities Clearing Co., Hong Kong Options Clearing Corp., the Thailand International Fund, Ltd., Fidelity Investments Life Insurance Company, and Empire Fidelity Investments Life Insurance Company. Audit Committee Chair and Investment Committee Chair of the Vincent Memorial Hospital Foundation (non-profit organization). Mr. Ebsworth is a CFA® charterholder. | N/A |
Jane A. Freeman
(Born 1953) | Trustee,
since 2015;
Chair Liaison,
since 2018 | Retired. From 2012 to 2014 and 1999 to 2008, Chief Financial Officer of Scientific Learning Corporation. From 2008 to 2012, Ms. Freeman provided consulting services related to strategic business projects. Prior to 1999, Portfolio Manager at Rockefeller & Co. and Scudder, Stevens & Clark. Board member of the Harding Loevner Funds from 1996 to 2014, serving as both Lead Independent Director and chair of the Audit Committee. Board member of the Russell Exchange Traded Funds Trust from 2011 to 2012 and the chair of the Audit Committee. Ms. Freeman is also an inactive Chartered Financial Analyst. | N/A |
Isaiah Harris, Jr.
(Born 1952) | Trustee,
since 2009; Audit
Committee
Chair,
since 2019 | Retired. Member of the Advisory Board of CEF of East Central Florida. Chairman of the Board of CIGNA Corporation from 2009 to 2021, and Director from 2005 to 2008. From 2003 to 2011, Director of Deluxe Corporation. Prior thereto, President and CEO of BellSouth Advertising and Publishing Corp. from 2005 to 2007, President and CEO of BellSouth Enterprises from 2004 to 2005 and President of BellSouth Consumer Services from 2000 to 2003. Emeritus member of the Iowa State University Foundation Board of Governors. Emeritus Member of the Advisory Board of Iowa State University School of Business. Advisory Board Member, Palm Harbor Academy (private school). Advisory Board Member, Fellowship of Christian Athletes. Mr. Harris is a certified public accountant (inactive status). | N/A |
David F. Larcker
(Born 1950) | Trustee,
since 2009 | Distinguished Visiting Fellow at the Hoover Institution since 2022. James Irvin Miller Professor of Accounting at the Graduate School of Business (Emeritus), Stanford University, Director of the Corporate Governance Research Initiative and Senior Faculty of The Rock Center for Corporate Governance since 2006. From 2005 to 2008, Professor of Accounting at the Graduate School of Business, Stanford University. Prior thereto, Ernst & Young Professor of Accounting at The Wharton School, University of Pennsylvania from 1985 to 2005. | N/A |
38 | Allspring Ultra Short-Term Income Fund
Other information (unaudited)
Name and
year of birth | Position held and
length of service* | Principal occupations during past five years or longer | Current other
public company or
investment
company
directorships |
Olivia S. Mitchell
(Born 1953) | Trustee,
since 2006;
Nominating and
Governance
Committee Chair,
since 2018 | International Foundation of Employee Benefit Plans Professor since 1993, Wharton School of the University of Pennsylvania. Director of Wharton’s Pension Research Council and Boettner Center on Pensions & Retirement Research, and Research Associate at the National Bureau of Economic Research. Previously taught at Cornell University from 1978 to 1993. | N/A |
Timothy J. Penny
(Born 1951) | Trustee,
since 1996;
Chair,
since 2018 | President and Chief Executive Officer of Southern Minnesota Initiative Foundation, a non-profit organization, since 2007. Vice Chair of the Economic Club of Minnesota, since 2007. Co-Chair of the Committee for a Responsible Federal Budget, since 1995. Member of the Board of Trustees of NorthStar Education Finance, Inc., a non-profit organization, from 2007-2022. Senior Fellow of the University of Minnesota Humphrey Institute from 1995 to 2017. | N/A |
James G. Polisson
(Born 1959) | Trustee,
since 2018 | Retired. Chief Marketing Officer, Source (ETF) UK Services, Ltd, from 2015 to 2017. From 2012 to 2015, Principal of The Polisson Group, LLC, a management consulting, corporate advisory and principal investing company. Chief Executive Officer and Managing Director at Russell Investments, Global Exchange Traded Funds from 2010 to 2012. Managing Director of Barclays Global Investors from 1998 to 2010 and Global Chief Marketing Officer for iShares and Barclays Global Investors from 2000 to 2010. Trustee of the San Francisco Mechanics’ Institute, a non-profit organization, from 2013 to 2015. Board member of the Russell Exchange Traded Fund Trust from 2011 to 2012. Director of Barclays Global Investors Holdings Deutschland GmbH from 2006 to 2009. Mr. Polisson is an attorney and has a retired status with the Massachusetts and District of Columbia Bar Associations. | N/A |
Pamela Wheelock
(Born 1959) | Trustee,
since January
2020; previously
Trustee from
January 2018 to
July 2019 | Retired. Executive and Senior Financial leadership positions in the public, private and nonprofit sectors. Interim President and CEO, McKnight Foundation, 2020. Interim Commissioner, Minnesota Department of Human Services, 2019. Chief Operating Officer, Twin Cities Habitat for Humanity, 2017-2019. Vice President for University Services, University of Minnesota, 2012-2016. Interim President and CEO, Blue Cross and Blue Shield of Minnesota, 2011-2012. Executive Vice-President and Chief Financial Officer, Minnesota Wild, 2002-2008. Commissioner, Minnesota Department of Finance, 1999-2002. Chair of the Board of Directors of Destination Medical Center Corporation. Board member of the Minnesota Wild Foundation. | N/A |
* Length of service dates reflect the Trustee’s commencement of service with the Trust’s predecessor entities, where applicable.
Allspring Ultra Short-Term Income Fund | 39
Other information (unaudited)
Officers2
Name and
year of birth | Position held and
length of service | Principal occupations during past five years or longer |
Andrew Owen
(Born 1960) | President,
since 2017 | President and Chief Executive Officer of Allspring Funds Management, LLC since 2017 and Head of Global Fund Governance of Allspring Global Investments since 2022. Prior thereto, co-president of Galliard Capital Management, LLC, an affiliate of Allspring Funds Management, LLC, from 2019 to 2022 and Head of Affiliated Managers, Allspring Global Investments, from 2014 to 2019 and Executive Vice President responsible for marketing, investments and product development for Allspring Funds Management, LLC, from 2009 to 2014. |
Jeremy DePalma
(Born 1974) | Treasurer,
since 2012
(for certain funds in
the Fund Complex);
since 2021 (for
the remaining funds in the
Fund Complex) | Senior Vice President of Allspring Funds Management, LLC since 2009. Senior Vice President of Evergreen Investment Management Company, LLC from 2008 to 2010 and head of the Fund Reporting and Control Team within Fund Administration from 2005 to 2010. |
Christopher Baker
(Born 1976) | Chief Compliance Officer, since 2022 | Global Chief Compliance Officer for Allspring Global Investments since 2022. Prior thereto, Chief Compliance Officer for State Street Global Advisors from 2018 to 2021. Senior Compliance Officer for the State Street divisions of Alternative Investment Solutions, Sector Solutions, and Global Marketing from 2015 to 2018. From 2010 to 2015 Vice President, Global Head of Investment and Marketing Compliance for State Street Global Advisors. |
Matthew Prasse
(Born 1983) | Chief Legal Officer, since 2022; Secretary, since 2021 | Senior Counsel of the Allspring Legal Department since 2021. Senior Counsel of the Wells Fargo Legal Department from 2018 to 2021. Previously, Counsel for Barings LLC from 2015 to 2018. Prior to joining Barings, Associate at Morgan, Lewis & Bockius LLP from 2008 to 2015. |
1 The Statement of Additional Information includes additional information about the Trustees and is available, without charge, upon request, by calling 1-800-222-8222 or by visiting the website at allspringglobal.com.
2 For those Officers with tenures at Allspring Global Investments and/or Allspring Funds Management, LLC that began prior to 2021, such tenures include years of service during which these businesses/entities were known as Wells Fargo Asset Management and Wells Fargo Funds Management, LLC, respectively.
40 | Allspring Ultra Short-Term Income Fund
For more information
More information about Allspring Funds is available free upon request. To obtain literature, please write, visit the Fund's website, or call:
Allspring Funds
P.O. Box 219967
Kansas City, MO 64121-9967
Website: allspringglobal.com
Individual investors: 1-800-222-8222
Retail investment professionals: 1-888-877-9275
Institutional investment professionals: 1-800-260-5969
This report and the financial statements contained herein are submitted for the general information of the shareholders of the Fund. If this report is used for promotional purposes, distribution of the report must be accompanied or preceded by a current prospectus. Before investing, please consider the investment objectives, risks, charges, and expenses of the investment. For a current prospectus and, if available, a summary prospectus, containing this information, call
1-800-222-8222 or visit the Fund's website at allspringglobal.com. Read the prospectus carefully before you invest or send money.
Allspring Global InvestmentsTM is the trade name for the asset management firms of Allspring Global Investments Holdings, LLC, a holding company indirectly owned by certain private funds of GTCR LLC and Reverence Capital Partners, L.P. These firms include but are not limited to Allspring Global Investments, LLC, and Allspring Funds Management, LLC. Certain products managed by Allspring entities are distributed by Allspring Funds Distributor, LLC (a broker-dealer and Member FINRA/SIPC).
This material is for general informational and educational purposes only and is NOT intended to provide investment advice or a recommendation of any kind - including a recommendation for any specific investment, strategy, or plan.
© 2023 Allspring Global Investments Holdings, LLC. All rights reserved.
ALL-03102023-we6nouz8 04-23
SAR3006 02-23
Semi-Annual Report
February 28, 2023
Allspring Managed Account
| ■ | Allspring Managed Account CoreBuilder® Shares – Series CP |
The views expressed and any forward-looking statements are as of February 28, 2023, unless otherwise noted, and are those of the Fund's portfolio managers and/or Allspring Global Investments. Discussions of individual securities or the markets generally are not intended as individual recommendations. Future events or results may vary significantly from those expressed in any forward-looking statements. The views expressed are subject to change at any time in response to changing circumstances in the market. Allspring Global Investments disclaims any obligation to publicly update or revise any views expressed or forward-looking statements.
Allspring Managed Account | 1
Performance highlights (unaudited)
| Investment objective | The Fund seeks total return, consisting of current income and capital appreciation. |
| Manager | Allspring Funds Management, LLC |
| Subadviser | Allspring Global Investments, LLC |
| Portfolio managers | Christopher Y. Kauffman, CFA®‡, Janet S. Rilling, CFA®‡, CPA, Michael J. Schueller, CFA®‡, Michal Stanczyk, Noah M. Wise, CFA®‡ |
| Average annual total returns (%) as of February 28, 2023 |
| | | | | Expense ratios (%) |
| | Inception date | 1 year | Since inception | Gross | Net 1 |
| Allspring Managed Account CoreBuilder Shares - Series CP (WFCPX) | 6-2-2021 | -9.11 | -6.42 | 0.96 | 0.00 |
| Bloomberg U.S. Aggregate Bond Index2 | – | -9.72 | -7.03 ¤ | – | – |
Figures quoted represent past performance, which is no guarantee of future results, and do not reflect taxes that a shareholder may pay on an investment in a fund. Investment return and principal value of an investment will fluctuate so that an investor’s shares, when redeemed, may be worth more or less than their original cost. Current performance may be lower or higher than the performance data quoted, which assumes the reinvestment of dividends and capital gains. Current month-end performance is available by calling 1-888-877-9275.
Index returns do not include transaction costs associated with buying and selling securities, any mutual fund fees or expenses, or any taxes. It is not possible to invest directly in an index.
Shares are sold without a front-end sales charge or contingent deferred sales charge.
| ¤ | Based on the Fund's inception date. |
| 1 | Generally, no ordinary fees or expenses are charged to the Fund. Allspring Funds Management, LLC has contractually committed to irrevocably absorb and pay or reimburse all ordinary operating expenses of the Fund, except portfolio transactions or other investment related costs (e.g., commissions), fees payable for services provided by the Fund’s securities lending agent (if any), interest, taxes, leverage expenses and other expenses not incurred in the ordinary course of the Fund’s business. This commitment has an indefinite term. |
| 2 | The Bloomberg U.S. Aggregate Bond Index is a broad-based benchmark that measures the investment-grade, U.S. dollar–denominated, fixed-rate taxable bond market, including Treasuries, government-related and corporate securities, mortgage-backed securities (agency fixed-rate and hybrid adjustable-rate mortgage pass-throughs), asset-backed securities, and commercial mortgage-backed securities. You cannot invest directly in an index. |
Bond values fluctuate in response to the financial condition of individual issuers, general market and economic conditions, and changes in interest rates. Changes in market conditions and government policies may lead to periods of heightened volatility in the bond market and reduced liquidity for certain bonds held by the Fund. In general, when interest rates rise, bond values fall and investors may lose principal value. Interest rate changes and their impact on the Fund and its share price can be sudden and unpredictable. Loans are subject to risks similar to those associated with other below-investment-grade bond investments, such as risk of greater volatility in value, credit risk (for example, risk of issuer default), and risk that the loan may become illiquid or difficult to price. The use of derivatives may reduce returns and/or increase volatility. Certain investment strategies tend to increase the total risk of an investment (relative to the broader market). This fund is exposed to foreign investment risk, high-yield securities risk, and mortgage- and asset-backed securities risk. High-yield securities have a greater risk of default and tend to be more volatile than higher-rated debt securities. Consult the Fund’s prospectus for additional information on these and other risks.
CoreBuilder Shares are a series of investment options within the separately managed accounts advised or subadvised by Allspring Funds Management, LLC. The shares are fee-waived mutual funds that enable certain separately managed account investors to achieve greater diversification than smaller managed accounts might otherwise achieve.
Please remember that shares of the Fund may be purchased only by or on behalf of separately managed account clients where Allspring Funds Management, LLC has an agreement to serve as investment adviser or subadviser to the account with the separately managed account sponsor (typically a registered investment adviser or broker/dealer) or directly with the client.
| ‡ | CFA® and Chartered Financial Analyst® are trademarks owned by CFA Institute. |
2 | Allspring Managed Account
Performance highlights (unaudited)
| Credit quality as of February 28, 20231 |
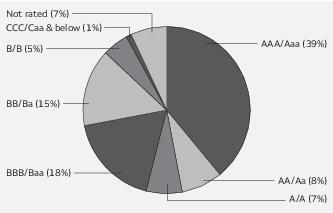
| 1 | The credit quality distribution of portfolio holdings reflected in the chart is based on ratings from Standard & Poor’s, Moody’s Investors Service, and/or Fitch Ratings Ltd. Credit quality ratings apply to the underlying holdings of the Fund and not to the Fund itself. The percentages of the portfolio with the ratings depicted in the chart are calculated based on the market value of fixed income securities held by the Fund. If a security was rated by all three rating agencies, the middle rating was utilized. If rated by two of the three rating agencies, the lower rating was utilized, and if rated by one of the rating agencies, that rating was utilized. Standard & Poor’s rates the creditworthiness of bonds, ranging from AAA (highest) to D (lowest). Ratings from A to CCC may be modified by the addition of a plus (+) or minus (-) sign to show relative standing within the rating categories. Standard & Poor’s rates the creditworthiness of short-term notes from SP-1 (highest) to SP-3 (lowest). Moody’s rates the creditworthiness of bonds, ranging from Aaa (highest) to C (lowest). Ratings Aa to B may be modified by the addition of a number 1 (highest) to 3 (lowest) to show relative standing within the ratings categories. Moody’s rates the creditworthiness of short-term U.S. tax-exempt municipal securities from MIG 1/VMIG 1 (highest) to SG (lowest). Fitch rates the creditworthiness of bonds, ranging from AAA (highest) to D (lowest). Credit quality distribution is subject to change and may have changed since the date specified. |
| Effective maturity distribution as of February 28, 20231 |
| 1 | Figures represent the percentage of the Fund's long-term investments. Allocations are subject to change and may have changed since the date specified. |
Allspring Managed Account | 3
Fund expenses (unaudited)
As a shareholder of the Fund, you incur and other Fund expenses. This example is intended to help you understand your ongoing costs (in dollars) of investing in the Fund and to compare these costs with the ongoing costs of investing in other mutual funds.
The example is based on an investment of $1,000 invested at the beginning of the six-month period and held for the entire period from September 1, 2022 to February 28, 2023.
Actual expenses
The “Actual” line of the table below provides information about actual account values and actual expenses. You may use the information in this line, together with the amount you invested, to estimate the expenses that you paid over the period. Simply divide your account value by $1,000 (for example, an $8,600 account value divided by $1,000 = 8.6), then multiply the result by the number in the “Actual” line under the heading entitled “Expenses paid during period” for your applicable class of shares to estimate the expenses you paid on your account during this period.
Hypothetical example for comparison purposes
The “Hypothetical” line of the table below provides information about hypothetical account values and hypothetical expenses based on the Fund’s actual expense ratio and an assumed rate of return of 5% per year before expenses, which is not the Fund’s actual return. The hypothetical account values and expenses may not be used to estimate the actual ending account balance or expenses you paid for the period. You may use this information to compare the ongoing costs of investing in the Fund and other funds. To do so, compare this 5% hypothetical example with the 5% hypothetical examples that appear in the shareholder reports of the other funds.
Please note that the expenses shown in the table are meant to highlight your ongoing costs only. Therefore, the “Hypothetical” line of the table is useful in comparing ongoing costs only, and will not help you determine the relative total costs of owning different funds.
| | Beginning
account value
9-1-2022 | Ending
account value
2-28-2023 | Expenses
paid during
the period1 | Annualized net
expense ratio |
| Actual | $1,000.00 | $ 994.08 | $0.00 * | 0.00% * |
| Hypothetical (5% return before expenses) | $1,000.00 | $1,024.79 | $0.00 * | 0.00% * |
1 Expenses paid is equal to the annualized net expense ratio multiplied by the average account value over the period, multiplied by 181 divided by 365 (to reflect the one-half-year period).
* Generally, no ordinary fees or expenses are charged to the Fund. Allspring Funds Management, LLC has contractually committed to irrevocably absorb and pay or reimburse all ordinary operating expenses of the Fund, except portfolio transactions or other investment related costs (e.g., commissions), fees payable for services provided by the Fund’s securities lending agent (if any), interest, taxes, leverage expenses and other expenses not incurred in the ordinary course of the Fund’s business. This commitment has an indefinite term.
4 | Allspring Managed Account
Portfolio of investments—February 28, 2023 (unaudited)
| | | Interest
rate | Maturity
date | Principal | Value |
| Agency securities: 14.76% | | | | | | |
| FHLB | | 5.50% | 7-15-2036 | $ | 230,000 | $ 257,023 |
| FNMA %% | | 5.50 | 3-13-2053 | | 1,400,000 | 1,397,594 |
| FNMA | | 6.21 | 8-6-2038 | | 95,000 | 111,769 |
| GNMA %% | | 2.00 | 3-21-2053 | | 525,000 | 440,005 |
| GNMA %% | | 5.00 | 3-21-2053 | | 900,000 | 889,172 |
| Resolution Funding Corporation STRIPS ¤ | | 0.00 | 4-15-2030 | | 310,000 | 226,028 |
| Total Agency securities (Cost $3,376,685) | | | | | | 3,321,591 |
| Asset-backed securities: 16.17% | | | | | | |
| Carvana Auto Receivables Trust Series 2019-2A Class D 144A | | 3.28 | 1-15-2025 | | 162,308 | 161,333 |
| DB Master Finance LLC Series 21-1A Class A23 144A | | 2.79 | 11-20-2051 | | 301,188 | 241,932 |
| DT Auto Owner Trust Series 2021-3A Class B 144A | | 0.58 | 11-17-2025 | | 340,000 | 331,521 |
| ECMC Group Student Loan Trust Series 2018-1A Class A (1 Month LIBOR +0.75%) 144A± | | 5.37 | 2-27-2068 | | 205,606 | 198,111 |
| Oak Street Investment Grade Net Lease Fund Series 2021-1A Class A3 144A | | 2.80 | 1-20-2051 | | 250,000 | 225,209 |
| OneMain Financial Trust Series 2018-2A Class A 144A | | 3.57 | 3-14-2033 | | 250,000 | 245,936 |
| Pagaya AI Debt Selection Trust Series 2021-1 Class A 144A | | 1.18 | 11-15-2027 | | 35,983 | 35,639 |
| PFS Financing Corporation Series 2021-A Class A 144A | | 0.71 | 4-15-2026 | | 300,000 | 283,997 |
| Taco Bell Funding LLC Series 2016-1A Class A23 144A | | 4.97 | 5-25-2046 | | 235,625 | 228,863 |
| Wendy's Funding LLC Series 2021-1A Class A2II 144A | | 2.78 | 6-15-2051 | | 246,250 | 200,100 |
| Westlake Automobile Receivable Series 2020-1A Class D 144A | | 2.80 | 6-16-2025 | | 340,000 | 335,120 |
| Westlake Automobile Receivable Series 2020-3A Class C 144A | | 1.24 | 11-17-2025 | | 340,000 | 333,451 |
| Westlake Automobile Receivable Series 2021-1A Class C 144A | | 0.95 | 3-16-2026 | | 415,000 | 399,462 |
| Wingstop Funding LLC Series 2020-1A Class A2 144A | | 2.84 | 12-5-2050 | | 247,500 | 214,111 |
| Zaxby's Funding LLC Series 2021-1A Class A2 144A | | 3.24 | 7-30-2051 | | 246,250 | 203,772 |
| Total Asset-backed securities (Cost $3,869,215) | | | | | | 3,638,557 |
| Corporate bonds and notes: 14.65% | | | | | | |
| Communication services: 0.55% | | | | | | |
| Media: 0.55% | | | | | | |
| CCO Holdings LLC 144A | | 4.50 | 8-15-2030 | | 50,000 | 41,126 |
| CSC Holdings LLC 144A | | 4.63 | 12-1-2030 | | 60,000 | 32,303 |
| Scripps Escrow II Incorporated 144A | | 5.38 | 1-15-2031 | | 70,000 | 49,559 |
| | | | | | | 122,988 |
| Consumer discretionary: 0.99% | | | | | | |
| Diversified consumer services: 0.11% | | | | | | |
| Howard University | | 5.21 | 10-1-2052 | | 30,000 | 24,512 |
| Household durables: 0.19% | | | | | | |
| KB Home Company | | 4.80 | 11-15-2029 | | 50,000 | 43,625 |
| Specialty retail: 0.69% | | | | | | |
| Michaels Companies Incorporated 144A | | 7.88 | 5-1-2029 | | 50,000 | 37,625 |
The accompanying notes are an integral part of these financial statements.
Allspring Managed Account | 5
Portfolio of investments—February 28, 2023 (unaudited)
| | | Interest
rate | Maturity
date | Principal | Value |
| Specialty retail (continued) | | | | | | |
| NMG Holding Company Incorporated 144A | | 7.13% | 4-1-2026 | $ | 50,000 | $ 48,250 |
| Rent-A-Center Incorporated 144A | | 6.38 | 2-15-2029 | | 80,000 | 68,630 |
| | | | | | | 154,505 |
| Energy: 1.76% | | | | | | |
| Oil, gas & consumable fuels: 1.76% | | | | | | |
| Aethon United 144A | | 8.25 | 2-15-2026 | | 160,000 | 153,893 |
| Apache Corporation | | 5.35 | 7-1-2049 | | 60,000 | 47,525 |
| Energy Transfer Partners LP | | 5.00 | 5-15-2050 | | 50,000 | 40,972 |
| Harvest Midstream LP 144A | | 7.50 | 9-1-2028 | | 70,000 | 67,505 |
| Rockies Express Pipeline LLC 144A | | 4.95 | 7-15-2029 | | 50,000 | 43,495 |
| Tallgrass Energy Partners LP 144A | | 6.00 | 12-31-2030 | | 50,000 | 43,117 |
| | | | | | | 396,507 |
| Financials: 4.64% | | | | | | |
| Banks: 1.61% | | | | | | |
| Citigroup Incorporated (5 Year Treasury Constant Maturity +3.60%) ʊ± | | 4.00 | 12-10-2025 | | 130,000 | 118,950 |
| Citigroup Incorporated (U.S. SOFR 3 Month +4.78%) ± | | 6.25 | 12-29-2049 | | 50,000 | 49,815 |
| Wells Fargo & Company (U.S. SOFR +1.32%) ± | | 3.91 | 4-25-2026 | | 200,000 | 192,912 |
| | | | | | | 361,677 |
| Capital markets: 0.71% | | | | | | |
| Morgan Stanley (U.S. SOFR +1.20%) ± | | 2.51 | 10-20-2032 | | 150,000 | 118,723 |
| Morgan Stanley (U.S. SOFR +2.62%) ± | | 5.30 | 4-20-2037 | | 45,000 | 41,931 |
| | | | | | | 160,654 |
| Consumer finance: 0.89% | | | | | | |
| OneMain Finance Corporation | | 7.13 | 3-15-2026 | | 170,000 | 165,259 |
| PECF USS Intermediate Holding III Corporation 144A | | 8.00 | 11-15-2029 | | 50,000 | 35,147 |
| | | | | | | 200,406 |
| Insurance: 1.43% | | | | | | |
| Hill City Funding Trust 144A | | 4.05 | 8-15-2041 | | 100,000 | 70,949 |
| Maple Grove Funding Trust 144A | | 4.16 | 8-15-2051 | | 100,000 | 71,444 |
| MetLife Incorporated | | 5.00 | 7-15-2052 | | 35,000 | 33,534 |
| National Life Global Insurance Company (3 Month LIBOR +3.31%) 144A± | | 5.25 | 7-19-2068 | | 40,000 | 36,722 |
| OneAmerica Financial Partners Incorporated 144A | | 4.25 | 10-15-2050 | | 25,000 | 18,189 |
| Transatlantic Holdings Incorporated | | 8.00 | 11-30-2039 | | 73,000 | 91,085 |
| | | | | | | 321,923 |
| Health care: 0.10% | | | | | | |
| Pharmaceuticals: 0.10% | | | | | | |
| Bausch Health Companies Incorporated 144A | | 5.00 | 1-30-2028 | | 50,000 | 21,559 |
| Industrials: 1.37% | | | | | | |
| Aerospace & defense: 0.30% | | | | | | |
| The Boeing Company | | 5.81 | 5-1-2050 | | 70,000 | 66,585 |
The accompanying notes are an integral part of these financial statements.
6 | Allspring Managed Account
Portfolio of investments—February 28, 2023 (unaudited)
| | | Interest
rate | Maturity
date | Principal | Value |
| Airlines: 0.54% | | | | | | |
| American Airlines Group Incorporated 144A | | 5.75% | 4-20-2029 | $ | 80,000 | $ 76,089 |
| Hawaiian Brand Intellectual Property Limited 144A | | 5.75 | 1-20-2026 | | 50,000 | 46,496 |
| | | | | | | 122,585 |
| Industrial conglomerates: 0.14% | | | | | | |
| General Electric Company (3 Month LIBOR +3.33%) ± | | 8.10 | 12-29-2049 | | 32,000 | 31,958 |
| Trading companies & distributors: 0.39% | | | | | | |
| Fortress Transportation & Infrastructure Investors LLC 144A | | 6.50 | 10-1-2025 | | 38,000 | 37,064 |
| Fortress Transportation & Infrastructure Investors LLC 144A | | 9.75 | 8-1-2027 | | 50,000 | 51,371 |
| | | | | | | 88,435 |
| Information technology: 2.03% | | | | | | |
| Electronic equipment, instruments & components: 0.04% | | | | | | |
| Dell International LLC | | 8.35 | 7-15-2046 | | 8,000 | 9,082 |
| IT services: 0.27% | | | | | | |
| Fidelity National Information Services Incorporated | | 5.63 | 7-15-2052 | | 40,000 | 37,366 |
| Global Payments Incorporated | | 5.95 | 8-15-2052 | | 25,000 | 23,114 |
| | | | | | | 60,480 |
| Software: 1.72% | | | | | | |
| Fortinet Incorporated | | 2.20 | 3-15-2031 | | 250,000 | 199,362 |
| MPH Acquisition Holdings LLC 144A | | 5.50 | 9-1-2028 | | 60,000 | 45,459 |
| MPH Acquisition Holdings LLC 144A | | 5.75 | 11-1-2028 | | 220,000 | 142,982 |
| | | | | | | 387,803 |
| Materials: 1.34% | | | | | | |
| Containers & packaging: 1.34% | | | | | | |
| AptarGroup Incorporated | | 3.60 | 3-15-2032 | | 250,000 | 210,846 |
| Clydesdale Acquisition Holdings Incorporated 144A | | 8.75 | 4-15-2030 | | 100,000 | 90,338 |
| | | | | | | 301,184 |
| Real estate: 1.27% | | | | | | |
| Equity REITs: 1.27% | | | | | | |
| Brandywine Operating Partnership Series 3 | | 7.55 | 3-15-2028 | | 45,000 | 44,119 |
| EPR Properties | | 3.60 | 11-15-2031 | | 25,000 | 18,814 |
| EPR Properties | | 3.75 | 8-15-2029 | | 35,000 | 28,526 |
| Sabra Health Care LP / Sabra Capital Corporation | | 5.13 | 8-15-2026 | | 125,000 | 118,235 |
| Service Properties Trust Company | | 4.35 | 10-1-2024 | | 80,000 | 76,576 |
| | | | | | | 286,270 |
| Utilities: 0.60% | | | | | | |
| Electric utilities: 0.60% | | | | | | |
| Edison International | | 6.95 | 11-15-2029 | | 100,000 | 104,989 |
| Oklahoma Gas & Electric Company | | 5.40 | 1-15-2033 | | 30,000 | 30,104 |
| | | | | | | 135,093 |
| Total Corporate bonds and notes (Cost $3,823,000) | | | | | | 3,297,831 |
The accompanying notes are an integral part of these financial statements.
Allspring Managed Account | 7
Portfolio of investments—February 28, 2023 (unaudited)
| | | Interest
rate | Maturity
date | Principal | Value |
| Foreign corporate bonds and notes : 6.43% | | | | | | |
| Communication services: 1.85% | | | | | | |
| Media: 1.13% | | | | | | |
| SES SA (EUR Swap Annual (vs. 6 Month EURIBOR) 5 Year +3.19%) | | 2.88% | 12-31-2049 | EUR | 100,000 | $ 88,984 |
| Tele Columbus AG 144A | | 3.88 | 5-2-2025 | EUR | 100,000 | 84,355 |
| Ziggo Bond Company BV 144A | | 3.38 | 2-28-2030 | EUR | 100,000 | 80,121 |
| | | | | | | 253,460 |
| Wireless telecommunication services: 0.72% | | | | | | |
| Tele2 AB Company | | 0.75 | 3-23-2031 | EUR | 200,000 | 161,320 |
| Consumer discretionary: 0.45% | | | | | | |
| Automobiles: 0.45% | | | | | | |
| Peugeot SA Company | | 2.00 | 3-20-2025 | EUR | 100,000 | 101,817 |
| Consumer staples: 0.87% | | | | | | |
| Food products: 0.37% | | | | | | |
| Sigma Holdings Company BV 144A | | 5.75 | 5-15-2026 | EUR | 100,000 | 84,687 |
| Tobacco: 0.50% | | | | | | |
| BAT International Finance plc | | 2.25 | 1-16-2030 | EUR | 130,000 | 111,766 |
| Energy: 0.40% | | | | | | |
| Oil, gas & consumable fuels: 0.40% | | | | | | |
| Eni SpA | | 1.13 | 9-19-2028 | EUR | 100,000 | 90,564 |
| Financials: 1.66% | | | | | | |
| Banks: 0.92% | | | | | | |
| Deutsche Bank (3 Month EURIBOR +2.95%) ± | | 5.00 | 9-5-2030 | EUR | 200,000 | 205,259 |
| Consumer finance: 0.74% | | | | | | |
| Abertis Finance BV Company (EUR Swap Annual (vs. 6 Month EURIBOR) 5 Year +2.63%) ʊ | | 2.63 | 1-26-2027 | EUR | 100,000 | 87,260 |
| Cellnex Finance Company SA | | 2.00 | 9-15-2032 | EUR | 100,000 | 79,705 |
| | | | | | | 166,965 |
| Industrials: 0.37% | | | | | | |
| Containers & packaging: 0.37% | | | | | | |
| Can-Pack SA 144A | | 2.38 | 11-1-2027 | EUR | 100,000 | 83,940 |
| Materials: 0.40% | | | | | | |
| Paper & forest products: 0.40% | | | | | | |
| Ahlstrom-Munksjo Holding 3 Oy 144A | | 3.63 | 2-4-2028 | EUR | 100,000 | 90,055 |
| Utilities: 0.43% | | | | | | |
| Independent power & renewable electricity producers: 0.43% | | | | | | |
| RWE AG | | 2.75 | 5-24-2030 | EUR | 100,000 | 96,453 |
| Total Foreign corporate bonds and notes (Cost $1,803,519) | | | | | | 1,446,286 |
| Foreign government bonds : 13.85% | | | | | | |
| Bonos y Obligaciones del Estado ¤ | | 0.00 | 1-31-2028 | EUR | 395,000 | 355,290 |
| Brazil ¤ | | 0.00 | 7-1-2024 | BRL | 2,900,000 | 470,943 |
The accompanying notes are an integral part of these financial statements.
8 | Allspring Managed Account
Portfolio of investments—February 28, 2023 (unaudited)
| | | Interest
rate | Maturity
date | Principal | Value |
| Foreign government bonds (continued) | | | | | | |
| France | | 0.75% | 2-25-2028 | EUR | 1,035,000 | $ 980,750 |
| Germany | | 1.30 | 10-15-2027 | EUR | 995,000 | 987,812 |
| Malaysia | | 3.88 | 3-14-2025 | MYR | 975,000 | 219,479 |
| Mexico | | 3.75 | 2-21-2024 | EUR | 100,000 | 103,244 |
| Total Foreign government bonds (Cost $3,248,508) | | | | | | 3,117,518 |
| Non-agency mortgage-backed securities: 19.52% | | | | | | |
| Auburn CLO Limited. Series 2017-1A Class A2A (3 Month LIBOR +1.62%) 144A± | | 6.43 | 10-20-2030 | $ | 250,000 | 245,670 |
| BX Trust Series 2019-OC11 Class A 144A | | 3.20 | 12-9-2041 | | 250,000 | 215,396 |
| Carlyle Global Market Series 2017-2A Class R2 (3 Month LIBOR +1.60%) 144A± | | 6.41 | 7-20-2031 | | 250,000 | 239,954 |
| Cascade Funding Mortgage Trust Series 2018-RM2 Class B 144A±± | | 4.00 | 10-25-2068 | | 294,508 | 278,694 |
| Cascade Funding Mortgage Trust Series 2021-HB7 Class M2 144A±± | | 2.68 | 10-27-2031 | | 250,000 | 228,005 |
| Dryden Senior Loan Fund Series 2020-78A Class A (3 Month LIBOR +1.18%) 144A± | | 5.97 | 4-17-2033 | | 400,000 | 395,664 |
| FREMF Mortgage Trust Series 2019-KF70 Class B (1 Month LIBOR +2.30%) 144A± | | 6.87 | 9-25-2029 | | 88,488 | 85,608 |
| Imperial Fund Mortgage Trust Series 2021-NQM1 Class A1 144A±± | | 1.07 | 6-25-2056 | | 144,597 | 119,068 |
| JPMorgan Mortgage Trust Series 2020-1 Class A15 144A±± | | 3.50 | 6-25-2050 | | 87,745 | 77,257 |
| Madison Park Funding Limited Series 2020-46A Class B1R (3 Month LIBOR +1.65%) 144A± | | 6.44 | 10-15-2034 | | 500,000 | 489,916 |
| MF1 Multifamily Housing Mortgage Loan Trust Series 2022-FL8 Class C (30 Day Average U.S. SOFR +2.20%) 144A± | | 6.63 | 2-19-2037 | | 250,000 | 234,689 |
| MFRA Trust Series 2020-NQM3 Class M1 144A±± | | 2.65 | 1-26-2065 | | 250,000 | 200,373 |
| Neuberger Berman CLO Limited Series 2017-25A Class BR (3 Month LIBOR +1.35%) 144A± | | 6.14 | 10-18-2029 | | 250,000 | 244,172 |
| Octagon Investment Partners Series 2017-1A Class A1R (3 Month LIBOR +1.00%) 144A± | | 5.81 | 3-17-2030 | | 244,837 | 242,339 |
| Residential Mortgage Loan Trust Series 2019-3 Class A3 144A±± | | 3.04 | 9-25-2059 | | 45,231 | 44,314 |
| Starwood Mortgage Residential Trust Series 2020-INV1 Class A1 144A±± | | 1.03 | 11-25-2055 | | 85,170 | 74,678 |
| Towd Point Mortgage Trust Series 2019-HY3 Class A2 (1 Month LIBOR +1.30%) 144A± | | 5.92 | 10-25-2059 | | 150,000 | 144,835 |
| Towd Point Mortgage Trust Series 2020-4 Class A2 144A | | 2.50 | 10-25-2060 | | 350,000 | 278,507 |
| Verus Securitization Trust Series 2021-R3 Class A1 144A±± | | 1.02 | 4-25-2064 | | 85,448 | 76,091 |
| Verus Securitization Trust Series 2021-R3 Class A2 144A±± | | 1.28 | 4-25-2064 | | 88,186 | 78,531 |
| Wind River CLO Limited Series 2018-2A Class A2 (3 Month LIBOR +1.45%) 144A± | | 6.24 | 7-15-2030 | | 409,000 | 399,287 |
| Total Non-agency mortgage-backed securities (Cost $4,759,014) | | | | | | 4,393,048 |
| U.S. Treasury securities: 16.46% | | | | | | |
| U.S. Treasury Bond | | 2.00 | 8-15-2051 | | 110,000 | 73,936 |
| U.S. Treasury Bond ## | | 2.25 | 5-15-2041 | | 550,000 | 417,893 |
| U.S. Treasury Bond | | 3.00 | 2-15-2049 | | 130,000 | 108,773 |
| U.S. Treasury Bond | | 3.00 | 8-15-2052 | | 365,000 | 306,828 |
The accompanying notes are an integral part of these financial statements.
Allspring Managed Account | 9
Portfolio of investments—February 28, 2023 (unaudited)
| | | Interest
rate | Maturity
date | Principal | Value |
| U.S. Treasury securities (continued) | | | | | | |
| U.S. Treasury Bond ## | | 3.13% | 5-15-2048 | $ | 1,385,000 | $ 1,182,281 |
| U.S. Treasury Note ## | | 3.50 | 2-15-2033 | | 395,000 | 381,977 |
| U.S. Treasury Note | | 4.00 | 11-15-2042 | | 70,000 | 69,005 |
| U.S. Treasury Note | | 4.00 | 11-15-2052 | | 185,000 | 188,295 |
| U.S. Treasury Note ## | | 4.13 | 11-15-2032 | | 960,000 | 975,300 |
| Total U.S. Treasury securities (Cost $4,032,403) | | | | | | 3,704,288 |
| Yankee corporate bonds and notes: 5.16% | | | | | | |
| Financials: 3.24% | | | | | | |
| Banks: 2.35% | | | | | | |
| Banco do Brasil SA 144A | | 4.88 | 1-11-2029 | | 200,000 | 185,940 |
| Itau Unibanco Holding SA 144A | | 3.25 | 1-24-2025 | | 200,000 | 190,050 |
| Macquire Bank Limited (5 Year Treasury Constant Maturity +1.70%) 144A± | | 3.05 | 3-3-2036 | | 200,000 | 151,976 |
| | | | | | | 527,966 |
| Consumer finance: 0.49% | | | | | | |
| Unifin Financiera SAB de CV 144A† | | 9.88 | 1-28-2029 | | 250,000 | 9,375 |
| Volkswagen Financial Services AG | | 3.38 | 4-6-2028 | | 100,000 | 100,948 |
| | | | | | | 110,323 |
| Insurance: 0.40% | | | | | | |
| Athene Global Funding | | 0.37 | 9-10-2026 | | 100,000 | 90,131 |
| Health care: 0.43% | | | | | | |
| Life sciences tools & services: 0.43% | | | | | | |
| Danaher Corporation | | 2.50 | 3-30-2030 | | 100,000 | 96,151 |
| Materials: 0.38% | | | | | | |
| Chemicals: 0.38% | | | | | | |
| Westlake Chemical Corporation | | 1.63 | 7-17-2029 | | 100,000 | 85,874 |
| Utilities: 1.11% | | | | | | |
| Electric utilities: 1.11% | | | | | | |
| Comision Federal de Electricidad SA de CV 144A | | 3.88 | 7-26-2033 | | 200,000 | 151,514 |
| Duke Energy Corporation | | 3.10 | 6-15-2028 | | 100,000 | 99,435 |
| | | | | | | 250,949 |
| Total Yankee corporate bonds and notes (Cost $1,508,577) | | | | | | 1,161,394 |
| Yankee government bonds: 1.77% | | | | | | |
| Dominican Republic 144A | | 4.88 | 9-23-2032 | | 230,000 | 192,241 |
| Mexico | | 6.35 | 2-9-2035 | | 200,000 | 205,197 |
| Total Yankee government bonds (Cost $436,149) | | | | | | 397,438 |
The accompanying notes are an integral part of these financial statements.
10 | Allspring Managed Account
Portfolio of investments—February 28, 2023 (unaudited)
| | | Yield | | Shares | Value |
| Short-term investments: 1.48% | | | | | | |
| Investment companies: 1.48% | | | | | | |
| Allspring Government Money Market Fund Select Class ♠∞ | | 4.39% | | | 332,295 | $ 332,295 |
| Total Short-term investments (Cost $332,295) | | | | | | 332,295 |
| Total investments in securities (Cost $27,189,365) | 110.25% | | | | | 24,810,246 |
| Other assets and liabilities, net | (10.25) | | | | | (2,307,280) |
| Total net assets | 100.00% | | | | | $22,502,966 |
| ¤ | The security is issued in zero coupon form with no periodic interest payments. |
| 144A | The security may be resold in transactions exempt from registration, normally to qualified institutional buyers, pursuant to Rule 144A under the Securities Act of 1933. |
| ± | Variable rate investment. The rate shown is the rate in effect at period end. |
| ±± | The coupon of the security is adjusted based on the principal and/or interest payments received from the underlying pool of mortgages as well as the credit quality and the actual prepayment speed of the underlying mortgages. The rate shown is the rate in effect at period end. |
| ## | All or a portion of this security is segregated for when-issued securities. |
| † | Non-income-earning security |
| ♠ | The issuer of the security is an affiliated person of the Fund as defined in the Investment Company Act of 1940. |
| ∞ | The rate represents the 7-day annualized yield at period end. |
| %% | The security is purchased on a when-issued basis. |
| ʊ | Security is perpetual in nature and has no stated maturity date. The date shown reflects the next call date. |
| Abbreviations: |
| BRL | Brazilian real |
| EUR | Euro |
| EURIBOR | Euro Interbank Offered Rate |
| FHLB | Federal Home Loan Bank |
| FNMA | Federal National Mortgage Association |
| GNMA | Government National Mortgage Association |
| LIBOR | London Interbank Offered Rate |
| MYR | Malaysian ringgit |
| REIT | Real estate investment trust |
| SOFR | Secured Overnight Financing Rate |
| STRIPS | Separate trading of registered interest and principal securities |
Investments in affiliates
An affiliated investment is an investment in which the Fund owns at least 5% of the outstanding voting shares of the issuer or as a result of other relationships, such as the Fund and the issuer having the same investment manager. Transactions with issuers that were affiliates of the Fund at the end of the period were as follows:
| | Value,
beginning of
period | Purchases | Sales
proceeds | Net
realized
gains
(losses) | Net
change in
unrealized
gains
(losses) | Value,
end of
period | Shares,
end
of period | Income
from
affiliated
securities |
| Short-term investments | | | | | | | |
| Allspring Government Money Market Fund Select Class | $1,224,726 | $5,840,201 | $(6,732,632) | $0 | $0 | $332,295 | 332,295 | $6,203 |
The accompanying notes are an integral part of these financial statements.
Allspring Managed Account | 11
Portfolio of investments—February 28, 2023 (unaudited)
Forward foreign currency contracts
Currency to be
received | Currency to be
delivered | Counterparty | Settlement
date | Unrealized
gains | | Unrealized
losses |
| 2,071,967 USD | 1,945,000 EUR | Citibank NA | 3-31-2023 | $ 11,167 | | $ 0 |
| 113,224 USD | 105,000 EUR | Citibank NA | 3-31-2023 | 1,973 | | 0 |
| 495,570 USD | 460,000 EUR | Citibank NA | 3-31-2023 | 8,183 | | 0 |
| 224,906 USD | 208,000 EUR | Citibank NA | 3-31-2023 | 4,523 | | 0 |
| 328,526 USD | 300,000 EUR | Citibank NA | 3-31-2023 | 10,665 | | 0 |
| 49,011 USD | 45,000 EUR | Citibank NA | 3-31-2023 | 1,332 | | 0 |
| 59,825 USD | 55,000 EUR | Citibank NA | 3-31-2023 | 1,550 | | 0 |
| 229,750 USD | 210,000 EUR | Citibank NA | 3-31-2023 | 7,247 | | 0 |
| 187,206 USD | 175,000 EUR | Citibank NA | 3-31-2023 | 1,787 | | 0 |
| 101,842 USD | 95,000 EUR | Citibank NA | 3-31-2023 | 1,186 | | 0 |
| 642,150 USD | 600,000 EUR | Citibank NA | 3-31-2023 | 6,428 | | 0 |
| 113,718 USD | 105,000 EUR | Citibank NA | 3-31-2023 | 2,466 | | 0 |
| 14,737,254 JPY | 113,718 USD | Citibank NA | 3-31-2023 | 0 | | (5,039) |
| | | | | $58,507 | | $(5,039) |
Futures contracts
| Description | Number of
contracts | Expiration
date | Notional
cost | Notional
value | Unrealized
gains | | Unrealized
losses |
| Long | | | | | | | |
| 10-Year U.S. Ultra Treasury Notes | 4 | 6-21-2023 | $ 467,710 | $ 468,750 | $ 1,040 | | $ 0 |
| U.S. Ultra Treasury Bonds | 2 | 6-21-2023 | 271,561 | 270,125 | 0 | | (1,436) |
| 2-Year U.S. Treasury Notes | 42 | 6-30-2023 | 8,581,848 | 8,556,516 | 0 | | (25,332) |
| 5-Year U.S. Treasury Notes | 15 | 6-30-2023 | 1,610,648 | 1,605,820 | 0 | | (4,828) |
| Short | | | | | | | |
| Euro-BOBL Futures | (4) | 3-8-2023 | (478,187) | (460,720) | 17,467 | | 0 |
| Euro-Bund | (5) | 3-8-2023 | (708,754) | (664,550) | 44,204 | | 0 |
| Euro-Schatz Futures | (2) | 3-8-2023 | (213,246) | (209,960) | 3,286 | | 0 |
| 10-Year U.S. Treasury Notes | (21) | 6-21-2023 | (2,348,705) | (2,344,781) | 3,924 | | 0 |
| | | | | | $69,921 | | $(31,596) |
The accompanying notes are an integral part of these financial statements.
12 | Allspring Managed Account
Statement of assets and liabilities—February 28, 2023 (unaudited)
| | |
| Assets | |
Investments in unaffiliated securities, at value (cost $26,857,070)
| $ 24,477,951 |
Investments in affiliated securities, at value (cost $332,295)
| 332,295 |
Cash at broker segregated for futures contracts
| 140,000 |
Receivable for investments sold
| 240,020 |
Receivable for interest
| 188,749 |
Unrealized gains on forward foreign currency contracts
| 58,507 |
Receivable for daily variation margin on open futures contracts
| 4,613 |
Receivable from manager
| 47 |
Prepaid expenses and other assets
| 17,288 |
Total assets
| 25,459,470 |
| Liabilities | |
Payable for investments purchased
| 2,757,074 |
Due to custodian bank, foreign currency, at value (cost $193,786)
| 193,786 |
Unrealized losses on forward foreign currency contracts
| 5,039 |
Accrued expenses and other liabilities
| 605 |
Total liabilities
| 2,956,504 |
Total net assets
| $22,502,966 |
| Net assets consist of | |
Paid-in capital
| $ 26,824,305 |
Total distributable loss
| (4,321,339) |
Total net assets
| $22,502,966 |
| Computation of net asset value per share | |
Net assets
| $ 22,502,966 |
Share outstanding 1
| 1,352,547 |
Net asset value per share
| $16.64 |
| 1 | The Fund has an unlimited number of authorized shares. |
The accompanying notes are an integral part of these financial statements.
Allspring Managed Account | 13
Statement of operations—six months ended February 28, 2023 (unaudited)
| | |
| Investment income | |
Interest
| $ 460,226 |
Income from affiliated securities
| 6,203 |
Total investment income
| 466,429 |
| Expenses | |
Custody and accounting fees
| 4,734 |
Professional fees
| 13,123 |
Registration fees
| 19,884 |
Shareholder report expenses
| 6,526 |
Trustees’ fees and expenses
| 11,716 |
Other fees and expenses
| 2,323 |
Total expenses
| 58,306 |
Less: Fee waivers and/or expense reimbursements
| (58,306) |
Net expenses
| 0 |
Net investment income
| 466,429 |
| Realized and unrealized gains (losses) on investments | |
| Net realized gains (losses) on | |
Unaffiliated securities
| (1,159,946) |
Foreign currency and foreign currency translations
| 1,885 |
Forward foreign currency contracts
| 7,525 |
Futures contracts
| (134,760) |
Net realized losses on investments
| (1,285,296) |
| Net change in unrealized gains (losses) on | |
Unaffiliated securities
| 744,476 |
Forward foreign currency contracts
| (43,895) |
Futures contracts
| 29,361 |
Net change in unrealized gains (losses) on investments
| 729,942 |
Net realized and unrealized gains (losses) on investments
| (555,354) |
Net decrease in net assets resulting from operations
| $ (88,925) |
The accompanying notes are an integral part of these financial statements.
14 | Allspring Managed Account
Statement of changes in net assets
| | | | | |
| | Six months ended
February 28, 2023
(unaudited) | Year ended
August 31, 2022 |
| Operations | | | | |
Net investment income
| | $ 466,429 | | $ 732,682 |
Net realized losses on investments
| | (1,285,296) | | (499,398) |
Net change in unrealized gains (losses) on investments
| | 729,942 | | (3,174,526) |
Net decrease in net assets resulting from operations
| | (88,925) | | (2,941,242) |
| Distributions to shareholders from | | | | |
Net investment income and net realized gains
| | (667,062) | | (961,294) |
| Capital share transactions | Shares | | Shares | |
Proceeds from shares sold
| 660 | 10,878 | 26,564 | 496,561 |
Reinvestment of distributions
| 37,014 | 605,851 | 38,309 | 711,015 |
Net increase in net assets resulting from capital share transactions
| | 616,729 | | 1,207,576 |
Total decrease in net assets
| | (139,258) | | (2,694,960) |
| Net assets | | | | |
Beginning of period
| | 22,642,224 | | 25,337,184 |
End of period
| | $22,502,966 | | $22,642,224 |
The accompanying notes are an integral part of these financial statements.
Allspring Managed Account | 15
Financial highlights
(For a share outstanding throughout each period)
| | | Year ended August 31 |
| | Six months ended
February 28, 2023
(unaudited) | 2022 | 2021 1 |
Net asset value, beginning of period
| $17.22 | $20.27 | $20.00 |
Net investment income
| 0.35 | 0.57 | 0.14 |
Net realized and unrealized gains (losses) on investments
| (0.43) | (2.86) | 0.13 |
Total from investment operations
| (0.08) | (2.29) | 0.27 |
| Distributions to shareholders from | | | |
Net investment income
| (0.46) | (0.72) | 0.00 |
Net realized gains
| (0.04) | (0.04) | 0.00 |
Total distributions to shareholders
| (0.50) | (0.76) | 0.00 |
Net asset value, end of period
| $16.64 | $17.22 | $20.27 |
Total return
| (0.59)% | (11.59)% | 1.35% |
| Ratios to average net assets (annualized) | | | |
Gross expenses
| 0.53% | 0.96% | 0.83% |
Net expenses2
| 0.00% | 0.00% | 0.00% |
Net investment income
| 4.22% | 3.04% | 2.75% |
| Supplemental data | | | |
Portfolio turnover rate
| 88% | 125% | 27% |
Net assets, end of period (000s omitted)
| $22,503 | $22,642 | $25,337 |
| 1 | For the period from June 2, 2021 (commencement of operations) to August 31, 2021 |
| 2 | The manager has contractually committed to irrevocably absorb and pay or reimburse all ordinary operating expenses of the Fund, except portfolio transactions or other investment-related costs (e.g., commissions), fees payable for services provided by the Fund’s securities lending agent (if any), interest, taxes, leverage expenses, and others expenses not incurred in the ordinary course of the Fund’s business. This commitment has an indefinite term. |
The accompanying notes are an integral part of these financial statements.
16 | Allspring Managed Account
Notes to financial statements (unaudited)
1. ORGANIZATION
Allspring Funds Trust (the “Trust”), a Delaware statutory trust organized on March 10, 1999, is an open-end management investment company registered under the Investment Company Act of 1940, as amended (the “1940 Act”). As an investment company, the Trust follows the accounting and reporting guidance in Financial Accounting Standards Board (“FASB”) Accounting Standards Codification Topic 946, Financial Services – Investment Companies. These financial statements report on the Allspring Managed Account CoreBuilder Shares - Series CP (the “Fund”) which is a diversified series of the Trust.
The Fund is a special purpose fund intended to be used in combination with selected individual securities to effectively model institutional-level investment strategies. The Fund is intended to help enable certain separately managed account investors to achieve greater diversification than smaller managed accounts might otherwise achieve.
2. SIGNIFICANT ACCOUNTING POLICIES
The following significant accounting policies, which are consistently followed in the preparation of the financial statements of the Fund, are in conformity with U.S. generally accepted accounting principles which require management to make estimates and assumptions that affect the reported amounts of assets and liabilities, disclosure of contingent assets and liabilities at the date of the financial statements, and the reported amounts of income and expenses during the reporting period. Actual results could differ from those estimates.
Securities valuation
All investments are valued each business day as of the close of regular trading on the New York Stock Exchange (generally 4 p.m. Eastern Time), although the Fund may deviate from this calculation time under unusual or unexpected circumstances.
Debt securities are valued at the evaluated bid price provided by an independent pricing service (e.g. taking into account various factors, including yields, maturities, or credit ratings) or, if a reliable price is not available, the quoted bid price from an independent broker-dealer.
The values of securities denominated in foreign currencies are translated into U.S. dollars at rates provided by an independent foreign currency pricing source at a time each business day specified by the Valuation Committee established by Allspring Funds Management, LLC ("Allspring Funds Management").
Futures contracts that are listed on a foreign or domestic exchange or market are valued at the official closing price or, if none, the last sales price.
Forward foreign currency contracts are recorded at the forward rate provided by an independent foreign currency pricing source at a time each business day specified by the Valuation Committee.
Investments in registered open-end investment companies (other than those listed on a foreign or domestic exchange or market) are valued at net asset value.
Investments which are not valued using the methods discussed above are valued at their fair value, as determined in good faith by Allspring Funds Management, which was named the valuation designee by the Board of Trustees. As the valuation designee, Allspring Funds Management is responsible for day-to-day valuation activities for the Allspring Funds. In connection with these responsibilities, Allspring Funds Management has established a Valuation Committee and has delegated to it the authority to take any actions regarding the valuation of portfolio securities that the Valuation Committee deems necessary or appropriate, including determining the fair value of portfolio securities. On a quarterly basis, the Board of Trustees receives reports of valuation actions taken by the Valuation Committee. On at least an annual basis, the Board of Trustees receives an assessment of the adequacy and effectiveness of Allspring Funds Management's process for determining the fair value of the portfolio of investments.
Foreign currency translation
The accounting records of the Fund are maintained in U.S. dollars. The values of other assets and liabilities denominated in foreign currencies are translated into U.S. dollars at rates provided by an independent foreign currency pricing source at a time each business day specified by the Valuation Committee. Purchases and sales of securities, and income and expenses are converted at the rate of exchange on the respective dates of such transactions. Net realized foreign exchange gains or losses arise from sales of foreign currencies, currency gains or losses realized between the trade and settlement dates on securities transactions, and the difference between the amounts of dividends, interest and foreign withholding taxes recorded and the U.S. dollar equivalent of the amounts actually paid or received. Net unrealized foreign exchange gains and losses arise from changes in the fair value of assets and liabilities other than investments in securities resulting from changes in exchange rates.
Allspring Managed Account | 17
Notes to financial statements (unaudited)
The changes in net assets arising from changes in exchange rates of securities and the changes in net assets resulting from changes in market prices of securities are not separately presented. Such changes are included in net realized and unrealized gains or losses from investments.
When-issued transactions
The Fund may purchase securities on a forward commitment or when-issued basis. The Fund records a when-issued transaction on the trade date and will segregate assets in an amount at least equal in value to the Fund's commitment to purchase when-issued securities. Securities purchased on a when-issued basis are marked-to-market daily and the Fund begins earning interest on the settlement date. Losses may arise due to changes in the market value of the underlying securities or if the counterparty does not perform under the contract.
Futures contracts
Futures contracts are agreements between the Fund and a counterparty to buy or sell a specific amount of a commodity, financial instrument or currency at a specified price on a specified date. The Fund may buy and sell futures contracts in order to gain exposure to, or protect against, changes in interest rates and is subject to interest rate risk. The primary risks associated with the use of futures contracts are the imperfect correlation between changes in market values of securities held by the Fund and the prices of futures contracts, and the possibility of an illiquid market. Futures contracts are generally entered into on a regulated futures exchange and cleared through a clearinghouse associated with the exchange. With futures contracts, there is minimal counterparty risk to the Fund since futures contracts are exchange-traded and the exchange’s clearinghouse, as the counterparty to all exchange-traded futures, guarantees the futures contracts against default.
Upon entering into a futures contract, the Fund is required to deposit either cash or securities (initial margin) with the broker in an amount equal to a certain percentage of the contract value. Subsequent payments (variation margin) are paid to or from the broker each day equal to the daily changes in the contract value. Such payments are recorded as unrealized gains or losses and, if any, shown as variation margin receivable (payable) in the Statement of Assets and Liabilities. Should the Fund fail to make requested variation margin payments, the broker can gain access to the initial margin to satisfy the Fund’s payment obligations. When the contracts are closed, a realized gain or loss is recorded in the Statement of Operations.
Forward foreign currency contracts
A forward foreign currency contract is an agreement between two parties to purchase or sell a specific currency for an agreed-upon price at a future date. The Fund enters into forward foreign currency contracts to facilitate transactions in foreign-denominated securities and to attempt to minimize the risk to the Fund from adverse changes in the relationship between currencies. Forward foreign currency contracts are recorded at the forward rate and marked-to-market daily. When the contracts are closed, realized gains and losses arising from such transactions are recorded as realized gains or losses on forward foreign currency contracts. The Fund is subject to foreign currency risk and may be exposed to risks if the counterparties to the contracts are unable to meet the terms of their contracts or if the value of the foreign currency changes unfavorably. The Fund's maximum risk of loss from counterparty credit risk is the unrealized gains on the contracts. This risk may be mitigated if there is a master netting arrangement between the Fund and the counterparty.
Security transactions and income recognition
Securities transactions are recorded on a trade date basis. Realized gains or losses are recorded on the basis of identified cost.
Interest income is accrued daily and bond discounts are accreted and premiums are amortized daily. To the extent debt obligations are placed on non-accrual status, any related interest income may be reduced by writing off interest receivables when the collection of all or a portion of interest has been determined to be doubtful based on consistently applied procedures and the fair value has decreased. If the issuer subsequently resumes interest payments or when the collectability of interest is reasonably assured, the debt obligation is removed from non-accrual status. Paydown gains and losses are included in interest income.
Distributions to shareholders
Distributions to shareholders are recorded on the ex-dividend date and paid from net investment income monthly and any net realized gains are paid at least annually. Such distributions are determined in accordance with income tax regulations and may differ from U.S. generally accepted accounting principles. Dividend sources are estimated at the time of declaration. The tax character of distributions is determined as of the Fund's fiscal year end. Therefore, a portion of the Fund's distributions made prior to the Fund’s fiscal year end may be categorized as a tax return of capital at year end.
18 | Allspring Managed Account
Notes to financial statements (unaudited)
Federal and other taxes
The Fund intends to continue to qualify as a regulated investment company by distributing substantially all of its investment company taxable income and any net realized capital gains (after reduction for capital loss carryforwards) sufficient to relieve it from all, or substantially all, federal income taxes. Accordingly, no provision for federal income taxes was required.
The Fund’s income and federal excise tax returns and all financial records supporting those returns for the period since commencement of operations are subject to examination by the federal and Delaware revenue authorities. Management has analyzed the Fund's tax positions taken on federal, state, and foreign tax returns, as applicable, for all open tax years and does not believe that there are any uncertain tax positions that require recognition of a tax liability.
As of February 28, 2023, the aggregate cost of all investments for federal income tax purposes was $30,302,000 and the unrealized gains (losses) consisted of:
| Gross unrealized gains | $ 170,733 |
| Gross unrealized losses | (5,570,694) |
| Net unrealized losses | $(5,399,961) |
As of August 31, 2022, the Fund had current year deferred post-October capital losses consisting of $634,662 in short-term capital losses and $50,774 in long-term capital losses which was recognized in the first day of the current fiscal year.
3. FAIR VALUATION MEASUREMENTS
Fair value measurements of investments are determined within a framework that has established a fair value hierarchy based upon the various data inputs utilized in determining the value of the Fund’s investments. The three-level hierarchy gives the highest priority to unadjusted quoted prices in active markets for identical assets or liabilities (Level 1) and the lowest priority to unobservable inputs (Level 3). The Fund’s investments are classified within the fair value hierarchy based on the lowest level of input that is significant to the fair value measurement. The inputs are summarized into three broad levels as follows:
| ■ | Level 1 – quoted prices in active markets for identical securities |
| ■ | Level 2 – other significant observable inputs (including quoted prices for similar securities, interest rates, prepayment speeds, credit risk, etc.) |
| ■ | Level 3 – significant unobservable inputs (including the Fund’s own assumptions in determining the fair value of investments) |
The inputs or methodologies used for valuing investments in securities are not necessarily an indication of the risk associated with investing in those securities.
Allspring Managed Account | 19
Notes to financial statements (unaudited)
The following is a summary of the inputs used in valuing the Fund’s assets and liabilities as of February 28, 2023:
| | Quoted prices
(Level 1) | Other significant
observable inputs
(Level 2) | Significant
unobservable inputs
(Level 3) | Total |
| Assets | | | | |
| Investments in: | | | | |
| Agency securities | $ 0 | $ 3,321,591 | $0 | $ 3,321,591 |
| Asset-backed securities | 0 | 3,638,557 | 0 | 3,638,557 |
| Corporate bonds and notes | 0 | 3,297,831 | 0 | 3,297,831 |
| Foreign corporate bonds and notes | 0 | 1,446,286 | 0 | 1,446,286 |
| Foreign government bonds | 0 | 3,117,518 | 0 | 3,117,518 |
| Non-agency mortgage-backed securities | 0 | 4,393,048 | 0 | 4,393,048 |
| U.S. Treasury securities | 3,704,288 | 0 | 0 | 3,704,288 |
| Yankee corporate bonds and notes | 0 | 1,161,394 | 0 | 1,161,394 |
| Yankee government bonds | 0 | 397,438 | 0 | 397,438 |
| Short-term investments | | | | |
| Investment companies | 332,295 | 0 | 0 | 332,295 |
| | 4,036,583 | 20,773,663 | 0 | 24,810,246 |
| Forward foreign currency contracts | 0 | 58,507 | 0 | 58,507 |
| Futures contracts | 69,921 | 0 | 0 | 69,921 |
| Total assets | $4,106,504 | $20,832,170 | $0 | $24,938,674 |
| Liabilities | | | | |
| Forward foreign currency contracts | $ 0 | $ 5,039 | $0 | $ 5,039 |
| Futures contracts | 31,596 | 0 | 0 | 31,596 |
| Total liabilities | $ 31,596 | $ 5,039 | $0 | $ 36,635 |
Futures contracts and forward foreign currency contracts are reported at their cumulative unrealized gains (losses) at measurement date as reported in the tables following the Portfolio of Investments. For futures contracts, the current day’s variation margin is reported on the Statement of Assets and Liabilities. All other assets and liabilities are reported at their market value at measurement date.
Additional sector, industry or geographic detail, if any, is included in the Portfolio of Investments.
For the six months ended February 28, 2023, the Fund did not have any transfers into/out of Level 3.
4. TRANSACTIONS WITH AFFILIATES
The Trust has entered into an investment management contract with Allspring Funds Management, a wholly owned subsidiary of Allspring Global Investments Holdings, LLC, a holding company indirectly owned by certain private funds of GTCR LLC and Reverence Capital Partners, L.P. The manager is responsible for implementing investment policies and guidelines and for supervising the subadviser, who is responsible for day-to-day portfolio management of the Fund. For providing these services, Allspring Funds Management does not receive a fee from the Fund but is entitled to receive fees from separately managed account sponsors of the wrap-fee programs. Out of these fees, Allspring Funds Management pays Allspring Global Investments, LLC, an affiliate of Allspring Funds Management and a wholly owned subsidiary of Allspring Global Investments Holdings, LLC, for its services as the subadviser to the Fund.
Generally, no ordinary operating fees or expenses are charged to the Fund. Allspring Funds Management has contractually committed to irrevocably absorb and pay or reimburse all ordinary operating expenses of the Fund, except portfolio transactions or other investment-related costs (e.g., commissions), fees payable for services provided by the Fund’s securities lending agent (if any), interest, taxes, leverage expenses, and other expenses not incurred in the ordinary course of the Fund’s business. This commitment has an indefinite term.
20 | Allspring Managed Account
Notes to financial statements (unaudited)
Interfund transactions
The Fund may purchase or sell portfolio investment securities to certain affiliates pursuant to Rule 17a-7 under the 1940 Act and under procedures adopted by the Board of Trustees. The procedures have been designed to ensure that these interfund transactions, which do not incur broker commissions, are effected at current market prices.
5. INVESTMENT PORTFOLIO TRANSACTIONS
Purchases and sales of investments, excluding short-term securities, for the six months ended February 28, 2023 were as follows:
| Purchases at cost | | Sales proceeds |
U.S.
government | Non-U.S.
government | | U.S.
government | Non-U.S.
government |
| $7,299,893 | $16,071,394 | | $6,672,815 | $13,180,041 |
6. DERIVATIVE TRANSACTIONS
During the six months ended February 28, 2023, the Fund entered into futures contracts to speculate on interest rates and to help manage the duration of the portfolio. The Fund also entered into forward foreign currency contracts for economic hedging purposes.
The volume of the Fund's derivative activity during the six months ended February 28, 2023 was as follows:
| Futures contracts | |
| Average notional balance on long futures | $10,833,227 |
| Average notional balance on short futures | 5,208,224 |
| Forward foreign currency contracts | |
| Average contract amounts to buy | $ 285,672 |
| Average contract amounts to sell | 2,705,852 |
A summary of the location of derivative instruments on the financial statements by primary risk exposure is outlined in the following tables.
The fair value of derivative instruments as of February 28, 2023 by primary risk type was as follows for the Fund:
| | Asset derivatives | | Liability derivatives |
| | Statement of
Assets and Liabilities location | Fair value | | Statement of
Assets and Liabilities location | Fair value |
| Interest rate risk | Unrealized gains on futures contracts | $ 69,921* | | Unrealized losses on futures contracts | $ 31,596* |
| Foreign currency risk | Unrealized gains on forward foreign currency contracts | 58,507 | | Unrealized losses on forward foreign currency contracts | 5,039 |
| | | $128,428 | | | $36,635 |
* Amount represents the cumulative unrealized gains (losses) as reported in the table following the Portfolio of Investments. For futures contracts, only the current day's variation margin as of February 28, 2023 is reported separately on the Statement of Assets and Liabilities.
Allspring Managed Account | 21
Notes to financial statements (unaudited)
The effect of derivative instruments on the Statement of Operations for the six months ended February 28, 2023 was as follows:
| | Net realized gains (losses) on derivatives |
| | Forward
foreign
currency
contracts | Futures
contracts | Total |
| Interest rate risk | $ 0 | $ (134,760) | $ (134,760) |
| Foreign currency risk | 7,525 | 0 | 7,525 |
| | $7,525 | $(134,760) | $(127,235) |
| | Net change in unrealized gains (losses) on derivatives |
| | Forward
foreign
currency
contracts | Futures
contracts | Total |
| Interest rate risk | $ 0 | $ 29,361 | $ 29,361 |
| Foreign currency risk | (43,895) | 0 | (43,895) |
| | $(43,895) | $29,361 | $(14,534) |
For certain types of derivative transactions, the Fund has entered into International Swaps and Derivatives Association, Inc. master agreements (“ISDA Master Agreements”) or similar agreements with approved counterparties. The ISDA Master Agreements or similar agreements may have requirements to deliver/deposit securities or cash to/with an exchange or broker-dealer as collateral and allows the Fund to offset, with each counterparty, certain derivative financial instrument’s assets and/or liabilities with collateral held or pledged. Collateral requirements differ by type of derivative. Collateral or margin requirements are set by the broker or exchange clearinghouse for exchange traded derivatives while collateral terms are contract specific for over-the-counter traded derivatives. Cash collateral that has been pledged to cover obligations of the Fund under ISDA Master Agreements or similar agreements, if any, are reported separately in the Statement of Assets and Liabilities. Securities pledged as collateral, if any, are noted in the Portfolio of Investments. With respect to balance sheet offsetting, absent an event of default by the counterparty or a termination of the agreement, the reported amounts of financial assets and financial liabilities in the Statement of Assets and Liabilities are not offset across transactions between the Fund and the applicable counterparty. A reconciliation of the gross amounts on the Statement of Assets and Liabilities to the net amounts by counterparty, including any collateral exposure, for OTC derivatives is as follows:
| Counterparty | Gross amounts
of assets in the
Statement of
Assets and
Liabilities | Amounts
subject to
netting
agreements | Collateral
received | Net amount
of assets |
| Citibank NA | $58,507 | $(5,039) | $0 | $53,468 |
| Counterparty | Gross amounts
of liabilities in the
Statement of
Assets and
Liabilities | Amounts
subject to
netting
agreements | Collateral
pledged | Net amount
of liabilities |
| Citibank NA | $5,039 | $(5,039) | $0 | $0 |
7. CONCENTRATION RISK
Concentration risk exists when a shareholder owns a large amount of shares of the Fund. A fund with a concentration of ownership may be more affected by the investment activity of those shareholders than would be a fund that does not have any ownership concentration. As of February 28, 2023, Allspring Funds Management or one of its affiliates owned 100% of the Fund.
22 | Allspring Managed Account
Notes to financial statements (unaudited)
8. MARKET RISKS
On March 11, 2020, the World Health Organization announced that it had made the assessment that coronavirus disease 2019 (“COVID-19”) is a pandemic. The impacts of COVID-19 are affecting the entire global economy, individual companies and investment products, the funds, and the market in general. There is significant uncertainty around the extent and duration of business disruptions related to COVID-19 and the impacts may last for an extended period of time. COVID-19 has led to significant uncertainty and volatility in the financial markets.
9. INDEMNIFICATION
Under the Fund's organizational documents, the officers and Trustees have been granted certain indemnification rights against certain liabilities that may arise out of performance of their duties to the Fund. The Fund has entered into a separate agreement with each Trustee that converts indemnification rights currently existing under the Fund’s organizational documents into contractual rights that cannot be changed in the future without the consent of the Trustee. Additionally, in the normal course of business, the Fund may enter into contracts with service providers that contain a variety of indemnification clauses. The Fund’s maximum exposure under these arrangements is dependent on future claims that may be made against the Fund and, therefore, cannot be estimated.
Allspring Managed Account | 23
Other information (unaudited)
PROXY VOTING INFORMATION
A description of the policies and procedures used to determine how to vote proxies relating to portfolio securities is available without charge, upon request, by calling 1-800-222-8222, visiting our website at allspringglobal.com, or visiting the SEC website at sec.gov. Information regarding how the proxies related to portfolio securities were voted during the most recent 12-month period ended June 30 is available on the website at allspringglobal.com or by visiting the SEC website at sec.gov.
QUARTERLY PORTFOLIO HOLDINGS INFORMATION
The Fund files its complete schedule of portfolio holdings with the SEC for the first and third quarters of each fiscal year as an exhibit to its reports on Form N-PORT. Shareholders may view the filed Form N-PORT by visiting the SEC website at sec.gov.
24 | Allspring Managed Account
Other information (unaudited)
BOARD OF TRUSTEES AND OFFICERS
Each of the Trustees and Officers listed in the table below acts in identical capacities for each fund in the Allspring family of funds, which consists of 127 mutual funds comprising the Allspring Funds Trust, Allspring Variable Trust, Allspring Master Trust and four closed-end funds (collectively the “Fund Complex”). This table should be read in conjunction with the Prospectus and the Statement of Additional Information1. The mailing address of each Trustee and Officer is 1415 Vantage Park Drive, 3rd Floor, Charlotte, NC 28203. Each Trustee and Officer serves an indefinite term, however, each Trustee serves such term until reaching the mandatory retirement age established by the Trustees.
Independent Trustees
Name and
year of birth | Position held and
length of service* | Principal occupations during past five years or longer | Current other
public company or
investment
company
directorships |
William R. Ebsworth
(Born 1957) | Trustee,
since 2015 | Retired. From 1984 to 2013, equities analyst, portfolio manager, research director and chief investment officer at Fidelity Management and Research Company in Boston, Tokyo, and Hong Kong, and retired in 2013 as Chief Investment Officer of Fidelity Strategic Advisers, Inc. where he led a team of investment professionals managing client assets. Prior thereto, Board member of Hong Kong Securities Clearing Co., Hong Kong Options Clearing Corp., the Thailand International Fund, Ltd., Fidelity Investments Life Insurance Company, and Empire Fidelity Investments Life Insurance Company. Audit Committee Chair and Investment Committee Chair of the Vincent Memorial Hospital Foundation (non-profit organization). Mr. Ebsworth is a CFA® charterholder. | N/A |
Jane A. Freeman
(Born 1953) | Trustee,
since 2015;
Chair Liaison,
since 2018 | Retired. From 2012 to 2014 and 1999 to 2008, Chief Financial Officer of Scientific Learning Corporation. From 2008 to 2012, Ms. Freeman provided consulting services related to strategic business projects. Prior to 1999, Portfolio Manager at Rockefeller & Co. and Scudder, Stevens & Clark. Board member of the Harding Loevner Funds from 1996 to 2014, serving as both Lead Independent Director and chair of the Audit Committee. Board member of the Russell Exchange Traded Funds Trust from 2011 to 2012 and the chair of the Audit Committee. Ms. Freeman is also an inactive Chartered Financial Analyst. | N/A |
Isaiah Harris, Jr.
(Born 1952) | Trustee,
since 2009; Audit
Committee
Chair,
since 2019 | Retired. Member of the Advisory Board of CEF of East Central Florida. Chairman of the Board of CIGNA Corporation from 2009 to 2021, and Director from 2005 to 2008. From 2003 to 2011, Director of Deluxe Corporation. Prior thereto, President and CEO of BellSouth Advertising and Publishing Corp. from 2005 to 2007, President and CEO of BellSouth Enterprises from 2004 to 2005 and President of BellSouth Consumer Services from 2000 to 2003. Emeritus member of the Iowa State University Foundation Board of Governors. Emeritus Member of the Advisory Board of Iowa State University School of Business. Advisory Board Member, Palm Harbor Academy (private school). Advisory Board Member, Fellowship of Christian Athletes. Mr. Harris is a certified public accountant (inactive status). | N/A |
David F. Larcker
(Born 1950) | Trustee,
since 2009 | Distinguished Visiting Fellow at the Hoover Institution since 2022. James Irvin Miller Professor of Accounting at the Graduate School of Business (Emeritus), Stanford University, Director of the Corporate Governance Research Initiative and Senior Faculty of The Rock Center for Corporate Governance since 2006. From 2005 to 2008, Professor of Accounting at the Graduate School of Business, Stanford University. Prior thereto, Ernst & Young Professor of Accounting at The Wharton School, University of Pennsylvania from 1985 to 2005. | N/A |
Allspring Managed Account | 25
Other information (unaudited)
Name and
year of birth | Position held and
length of service* | Principal occupations during past five years or longer | Current other
public company or
investment
company
directorships |
Olivia S. Mitchell
(Born 1953) | Trustee,
since 2006;
Nominating and
Governance
Committee Chair,
since 2018 | International Foundation of Employee Benefit Plans Professor since 1993, Wharton School of the University of Pennsylvania. Director of Wharton’s Pension Research Council and Boettner Center on Pensions & Retirement Research, and Research Associate at the National Bureau of Economic Research. Previously taught at Cornell University from 1978 to 1993. | N/A |
Timothy J. Penny
(Born 1951) | Trustee,
since 1996;
Chair,
since 2018 | President and Chief Executive Officer of Southern Minnesota Initiative Foundation, a non-profit organization, since 2007. Vice Chair of the Economic Club of Minnesota, since 2007. Co-Chair of the Committee for a Responsible Federal Budget, since 1995. Member of the Board of Trustees of NorthStar Education Finance, Inc., a non-profit organization, from 2007-2022. Senior Fellow of the University of Minnesota Humphrey Institute from 1995 to 2017. | N/A |
James G. Polisson
(Born 1959) | Trustee,
since 2018 | Retired. Chief Marketing Officer, Source (ETF) UK Services, Ltd, from 2015 to 2017. From 2012 to 2015, Principal of The Polisson Group, LLC, a management consulting, corporate advisory and principal investing company. Chief Executive Officer and Managing Director at Russell Investments, Global Exchange Traded Funds from 2010 to 2012. Managing Director of Barclays Global Investors from 1998 to 2010 and Global Chief Marketing Officer for iShares and Barclays Global Investors from 2000 to 2010. Trustee of the San Francisco Mechanics’ Institute, a non-profit organization, from 2013 to 2015. Board member of the Russell Exchange Traded Fund Trust from 2011 to 2012. Director of Barclays Global Investors Holdings Deutschland GmbH from 2006 to 2009. Mr. Polisson is an attorney and has a retired status with the Massachusetts and District of Columbia Bar Associations. | N/A |
Pamela Wheelock
(Born 1959) | Trustee,
since January
2020; previously
Trustee from
January 2018 to
July 2019 | Retired. Executive and Senior Financial leadership positions in the public, private and nonprofit sectors. Interim President and CEO, McKnight Foundation, 2020. Interim Commissioner, Minnesota Department of Human Services, 2019. Chief Operating Officer, Twin Cities Habitat for Humanity, 2017-2019. Vice President for University Services, University of Minnesota, 2012-2016. Interim President and CEO, Blue Cross and Blue Shield of Minnesota, 2011-2012. Executive Vice-President and Chief Financial Officer, Minnesota Wild, 2002-2008. Commissioner, Minnesota Department of Finance, 1999-2002. Chair of the Board of Directors of Destination Medical Center Corporation. Board member of the Minnesota Wild Foundation. | N/A |
* Length of service dates reflect the Trustee’s commencement of service with the Trust’s predecessor entities, where applicable.
26 | Allspring Managed Account
Other information (unaudited)
Officers2
Name and
year of birth | Position held and
length of service | Principal occupations during past five years or longer |
Andrew Owen
(Born 1960) | President,
since 2017 | President and Chief Executive Officer of Allspring Funds Management, LLC since 2017 and Head of Global Fund Governance of Allspring Global Investments since 2022. Prior thereto, co-president of Galliard Capital Management, LLC, an affiliate of Allspring Funds Management, LLC, from 2019 to 2022 and Head of Affiliated Managers, Allspring Global Investments, from 2014 to 2019 and Executive Vice President responsible for marketing, investments and product development for Allspring Funds Management, LLC, from 2009 to 2014. |
Jeremy DePalma
(Born 1974) | Treasurer,
since 2012
(for certain funds in
the Fund Complex);
since 2021 (for
the remaining funds in the
Fund Complex) | Senior Vice President of Allspring Funds Management, LLC since 2009. Senior Vice President of Evergreen Investment Management Company, LLC from 2008 to 2010 and head of the Fund Reporting and Control Team within Fund Administration from 2005 to 2010. |
Christopher Baker
(Born 1976) | Chief Compliance Officer, since 2022 | Global Chief Compliance Officer for Allspring Global Investments since 2022. Prior thereto, Chief Compliance Officer for State Street Global Advisors from 2018 to 2021. Senior Compliance Officer for the State Street divisions of Alternative Investment Solutions, Sector Solutions, and Global Marketing from 2015 to 2018. From 2010 to 2015 Vice President, Global Head of Investment and Marketing Compliance for State Street Global Advisors. |
Matthew Prasse
(Born 1983) | Chief Legal Officer, since 2022; Secretary, since 2021 | Senior Counsel of the Allspring Legal Department since 2021. Senior Counsel of the Wells Fargo Legal Department from 2018 to 2021. Previously, Counsel for Barings LLC from 2015 to 2018. Prior to joining Barings, Associate at Morgan, Lewis & Bockius LLP from 2008 to 2015. |
1 The Statement of Additional Information includes additional information about the Trustees and is available, without charge, upon request, by calling 1-800-222-8222 or by visiting the website at allspringglobal.com.
2 For those Officers with tenures at Allspring Global Investments and/or Allspring Funds Management, LLC that began prior to 2021, such tenures include years of service during which these businesses/entities were known as Wells Fargo Asset Management and Wells Fargo Funds Management, LLC, respectively.
Allspring Managed Account | 27
For more information
More information about Allspring Funds is available free upon request. To obtain literature, please write, visit the Fund's website, or call:
Allspring Funds
Attn: Managed Account Services
P.O. Box 1450
Milwaukee, WI 53201
Website: allspringglobal.com
Telephone: 1-888-877-9275
This report and the financial statements contained herein are submitted for the general information of the shareholders of the Fund. If this report is used for promotional purposes, distribution of the report must be accompanied or preceded by a current prospectus. Before investing, please consider the investment objectives, risks, charges, and expenses of the investment. For a current prospectus and, if available, a summary prospectus, containing this information, call
1-888-877-9275 or visit the Fund's website at allspringglobal.com. Read the prospectus carefully before you invest or send money.
Allspring Global InvestmentsTM is the trade name for the asset management firms of Allspring Global Investments Holdings, LLC, a holding company indirectly owned by certain private funds of GTCR LLC and Reverence Capital Partners, L.P. These firms include but are not limited to Allspring Global Investments, LLC, and Allspring Funds Management, LLC. Certain products managed by Allspring entities are distributed by Allspring Funds Distributor, LLC (a broker-dealer and Member FINRA/SIPC).
This material is for general informational and educational purposes only and is NOT intended to provide investment advice or a recommendation of any kind - including a recommendation for any specific investment, strategy, or plan.
© 2023 Allspring Global Investments Holdings, LLC. All rights reserved.
ALL-03102023-ajwiicrp 04-23
SAR4903 02-23
ITEM 2. CODE OF ETHICS
=======================
Not applicable.
ITEM 3. AUDIT COMMITTEE FINANCIAL EXPERT
=========================================
Not applicable.
ITEM 4. PRINCIPAL ACCOUNTANT FEES AND SERVICES
===============================================
Not applicable.
ITEM 5. AUDIT COMMITTEE OF LISTED REGISTRANTS
==============================================
Not applicable.
ITEM 6. INVESTMENTS
====================
A Portfolio of Investments for each series of Allspring Funds Trust is included as part of the report to shareholders filed under Item 1 of this Form.
ITEM 7. DISCLOSURE OF PROXY VOTING POLICIES AND PROCEDURES FOR CLOSED-END MANAGEMENT INVESTMENT COMPANIES
===============================================================
Not applicable.
ITEM 8. PORTFOLIO MANAGERS OF CLOSED-END MANAGEMENT INVESTMENT COMPANIES
==============================================================================
Not applicable.
ITEM 9. PURCHASES OF EQUITY SECURITIES BY CLOSED-END MANAGEMEENT INVESTMENT COMPANY AND AFFILIATED PURCHASERS
===================================================================
Not applicable.
ITEM 10. SUBMISSION OF MATTERS TO A VOTE OF SECURITY HOLDERS
============================================================
There have been no material changes to the procedures by which shareholders may recommend nominees to the registrant’s Board of Trustees that have been implemented since the registrant’s last provided disclosure in response to the requirements of this Item.
ITEM 11. CONTROLS AND PROCEDURES
==================================
(a) The President and Treasurer have concluded that the Allspring Funds Trust disclosure controls and procedures (as defined in Rule 30a-3(c) under the Investment Company Act of 1940) provide reasonable assurances that material information relating to the registrant is made known to them by the appropriate persons, based on their evaluation of these controls and procedures as of a date within 90 days of the filing of this report.
(b) There were no significant changes in the registrant’s internal controls over financial reporting (as defined in Rule 30a-3(d) under the Investment Company Act of 1940) that occurred during the most recent fiscal half-year of the period covered by this report that materially affected, or is reasonably likely to materially affect, the registrant’s internal control over financial reporting.
ITEM 12. DISCLOSURES OF SECURITIES LENDING ACTIVITES FOR CLOSED-END MANAGEMENT INVESTMENT COMPANIES
====================================================================
Not applicable.
ITEM 13. EXHIBITS
=================
(a)(1) Not applicable.
(a)(2) Certifications pursuant to Section 302 of the Sarbanes-Oxley Act of 2002.
(b) Certifications pursuant to Section 906 of the Sarbanes-Oxley Act of 2002.
SIGNATURES
Pursuant to the requirements of the Securities Exchange Act of 1934 and the Investment Company Act of 1940, the registrant has duly caused this report to be signed on its behalf by the undersigned, thereunto duly authorized.
| | |
| Allspring Funds Trust |
| |
| By: | | /s/ Andrew Owen |
| | Andrew Owen |
| | President |
|
| Date: April 26, 2023 |
Pursuant to the requirements of the Securities Exchange Act of 1934 and the Investment Company Act of 1940, this report has been signed below by the following persons on behalf of the registrant and in the capacities and on the date indicated.
| | |
| Allspring Funds Trust |
| |
| By: | | /s/ Andrew Owen |
| | Andrew Owen |
| | President |
|
| Date: April 26, 2023 |
| | | | |
| By: | | /s/ Jeremy DePalma |
| | Jeremy DePalma |
| | Treasurer |
|
| Date: April 26, 2023 |