UNITED STATES
SECURITIES AND EXCHANGE COMMISSION
Washington, D.C. 20549
FORM N-CSRS
CERTIFIED SHAREHOLDER REPORT OF REGISTERED
MANAGEMENT INVESTMENT COMPANIES
Investment Company Act file number: 811-09253
Allspring Funds Trust
(Exact name of registrant as specified in charter)
1415 Vantage Park Drive, 3rd Floor, Charlotte, NC 28203
(Address of principal executive offices) (Zip code)
Matthew Prasse
Allspring Funds Management, LLC
1415 Vantage Park Drive, 3rd Floor, Charlotte, NC 28203
(Name and address of agent for service)
Registrant’s telephone number, including area code: 800-222-8222
Date of fiscal year end: July 31
Registrant is making a filing for 9 of its series: Allspring Disciplined U.S. Core Fund, Allspring Discovery Large Cap Growth Fund, Allspring Discovery All Cap Growth Fund, Allspring Growth Fund, Allspring Large Cap Core Fund, Allspring Large Cap Growth Fund, Allspring Large Company Value Fund, Allspring Premier Large Company Growth Fund and Allspring Special Large Cap Value Fund.
Date of reporting period: January 31, 2024
ITEM 1. REPORT TO STOCKHOLDERS
Allspring Disciplined U.S. Core Fund
Semi-Annual Report
January 31, 2024
The views expressed and any forward-looking statements are as of January 31, 2024, unless otherwise noted, and are those of the Fund’s portfolio managers and/or Allspring Global Investments. Discussions of individual securities or the markets generally are not intended as individual recommendations. Future events or results may vary significantly from those expressed in any forward-looking statements. The views expressed are subject to change at any time in response to changing circumstances in the market. Allspring Global Investments disclaims any obligation to publicly update or revise any views expressed or forward-looking statements.
Allspring Disciplined U.S. Core Fund | 1
Letter to shareholders (unaudited)
Andrew Owen
President
Allspring Funds
Dear Shareholder:
We are pleased to offer you this semi-annual report for the Allspring Disciplined U.S. Core Fund for the six-month period that ended January 31, 2024. Globally, stocks and bonds experienced high levels of volatility throughout the period. The market was focused on persistently high inflation and the impact of ongoing aggressive central bank rate hikes. Riskier assets rallied as investors anticipated an end to the tight monetary policy despite concerns of a possible recession.
For the period, U.S. stocks, based on the S&P 500 Index,1 returned 6.43%. International stocks, as measured by the MSCI ACWI ex USA Index (Net),2 gained 0.48% while the MSCI EM Index (Net) (USD),3 returned -6.00%. Among bond indexes, the Bloomberg U.S. Aggregate Bond Index4 returned 3.15%, the Bloomberg Global Aggregate ex-USD Index (unhedged)5 gained 1.15%, the Bloomberg Municipal Bond Index6 returned 2.70%, and the ICE BofA U.S. High Yield Index7 gained 6.17%.
Still focused on high inflation and elevated central bank rates, markets were volatile.
The six-month period began with stocks retreating in August after a July rally while monthly bond returns were flat overall. Increased global market volatility reflected unease over the Chinese property market being stressed along with weak Chinese economic data. However, speculation grew over a possible end to the Federal Reserve’s (Fed’s) campaign of interest rate increases or at least a pause in September. U.S. economic data generally remained solid, with resilient job market data and inflation ticking up slightly in August as the annual Consumer Price Index (CPI)8 rose 3.7%. However, the three-month trend for Core CPI9 stood at an annualized 2.4%.
Stocks and bonds both had negative overall returns in September as investors were disappointed by the Fed’s determination not to lower interest rates until it knows it has vanquished persistently high inflation. As of September, the two primary gauges of U.S. inflation—the annual Core Personal Consumption Expenditures Price Index10 and the CPI—both stood at roughly 4%, twice as high as the Fed’s oft-stated 2% target. The month ended with the prospect of yet another U.S. government shutdown, averted at least temporarily but looming later in the year.
1
The S&P 500 Index consists of 500 stocks chosen for market size, liquidity, and industry group representation. It is a market-value-weighted index with each stock’s weight in the index proportionate to its market value. You cannot invest directly in an index.
2
The Morgan Stanley Capital International (MSCI) All Country World Index (ACWI) ex USA Index (Net) is a free-float-adjusted market-capitalization-weighted index that is designed to measure the equity market performance of developed and emerging markets, excluding the U.S. Source: MSCI. MSCI makes no express or implied warranties or representations and shall have no liability whatsoever with respect to any MSCI data contained herein. The MSCI data may not be further redistributed or used as a basis for other indexes or any securities or financial products. This report is not approved, reviewed, or produced by MSCI. You cannot invest directly in an index.
3
The MSCI Emerging Markets (EM) Index (Net) (USD) is a free-float-adjusted market-capitalization-weighted index that is designed to measure the equity market performance of emerging markets. You cannot invest directly in an index.
4
The Bloomberg U.S. Aggregate Bond Index is a broad-based benchmark that measures the investment-grade, U.S.-dollar-denominated, fixed-rate taxable bond market, including Treasuries, government-related and corporate securities, mortgage-backed securities (agency fixed-rate and hybrid adjustable-rate mortgage pass-throughs), asset-backed securities, and commercial mortgage-backed securities. You cannot invest directly in an index.
5
The Bloomberg Global Aggregate ex-USD Index (unhedged) is an unmanaged index that provides a broad-based measure of the global investment-grade fixed-income markets excluding the U.S.-dollar-denominated debt market. You cannot invest directly in an index.
6
The Bloomberg Municipal Bond Index is an unmanaged index composed of long-term tax-exempt bonds with a minimum credit rating of Baa. You cannot invest directly in an index.
7
The ICE BofA U.S. High Yield Index is a market-capitalization-weighted index of domestic and Yankee high yield bonds. The index tracks the performance of high yield securities traded in the U.S. bond market. You cannot invest directly in an index. Copyright 2024. ICE Data Indices, LLC. All rights reserved.
8
The Consumer Price Index (CPI) is a measure of the average change over time in the prices paid by urban consumers for a market basket of consumer goods and services. You cannot invest directly in an index.
9
The Core CPI is a measure of the average change over time in the prices paid by urban consumers for a market basket of consumer goods and services excluding energy and food prices. You cannot invest directly in an index.
10
The Core Personal Consumption Expenditures Price Index (PCE) is a measure of prices that people living in the United States, or those buying on their behalf, pay for goods and services. It is sometimes called the core PCE price index, because two categories that can have price swings – food and energy – are left out to make underlying inflation easier to see. You cannot invest directly in an index.
2 | Allspring Disciplined U.S. Core Fund
Letter to shareholders (unaudited)
October was a tough month for financial markets overall. Key global and domestic indexes all were pushed down by rising geopolitical tensions—particularly the Israel-Hamas conflict—and concerns over the Fed’s “higher for longer” monetary policy. The U.S. 10-year Treasury yield rose above 5% for the first time since 2007. Commodity prices did well as oil prices rallied in response to the prospect of oil supply disruptions from the Middle East. U.S. annualized third quarter GDP was estimated at a healthier-than-anticipated 4.9%. China’s GDP indicated surprisingly strong industrial production and retail sales, offset by ongoing weakness in its real estate sector.
In November, the market mood turned positive as cooling inflation inspired confidence that central banks could hold off on further rate hikes. Overall annual inflation in the U.S. fell to 3.1% in November while 12-month inflation in the U.K. and eurozone eased to 4.6% and 2.4%, respectively—far below their peak levels of mid-2022. Third quarter annualized U.S. GDP growth was raised to an estimated 5.2% while U.S. job totals rose by just below 200,000 in November, indicating a slight cooling of the labor market. All of this fresh evidence added to confidence for a U.S. soft economic landing, leading to a more buoyant mood heading into winter as the Federal Open Market Committee held rates steady at its December meeting.
The broad year-end rally among stocks and bonds that began in November continued through December as investors became more confident that monetary policy would ease in 2024. Supporting the bubbly market mood were a series of reports confirming lower inflationary trends in the U.S. and Europe. During the period, it appeared more likely that the U.S. economy could achieve a soft landing, cooling enough to lower inflation without the pain of a recession. However, by year-end, an expectations gap developed. Capital markets priced in a total of 1.50 percentage points in federal funds rate cuts in 2024, twice as much as the three cuts of 0.25% hinted at by Fed officials.
Financial market performance was mixed in January 2024 as U.S. stocks had modest gains while non-U.S. equities, particularly those in emerging markets, and fixed income assets were held back by central bank pushback on market optimism over rate cuts. Overall, optimism was supported by indications of a soft landing for the U.S. economy. Key data included a surprisingly strong gain of 353,000 jobs in January, an unemployment rate of just 3.7%, and a rise of just 3.1% in the CPI in January. However, that resilience helped push back expectations of a rate cut in March to a more likely second quarter initial move.
Don’t let short-term uncertainty derail long-term investment goals.
Periods of investment uncertainty can present challenges, but experience has taught us that maintaining long-term investment goals can be an effective way to plan for the future. To help you create a sound strategy based on your personal goals and risk tolerance, Allspring Funds offers more than 100 mutual funds spanning a wide range of asset classes and investment styles. Although diversification cannot guarantee an investment profit or prevent losses, we believe it can be an effective way to manage investment risk and potentially smooth out overall portfolio performance. We encourage investors to know their investments and to understand that appropriate levels of risk-taking may unlock opportunities.
Thank you for choosing to invest with Allspring Funds. We appreciate your confidence in us and remain committed to helping you meet your financial needs.
Sincerely,
Andrew Owen
President
Allspring Funds
“ In November, the market mood turned positive as cooling inflation inspired confidence that central banks could hold off on further rate hikes. ”
For further information about your fund, contact your investment professional, visit our website at allspringglobal.com, or call us directly at 1-800-222-8222.
Allspring Disciplined U.S. Core Fund | 3
Letter to shareholders (unaudited)
|
Beginning in July 2024, the Fund will be required by the Securities and Exchange Commission to send shareholders a paper copy of a new tailored shareholder report in place of the full shareholder report that you are now receiving. The tailored shareholder report will contain concise information about the Fund, including certain expense and performance information and fund statistics. If you wish to receive this new tailored shareholder report electronically, please follow the instructions on the back cover of this report. |
Other information that is currently included in the shareholder report, such as the Fund’s financial statements, will be available online and upon request, free of charge, in paper or electronic format. |
4 | Allspring Disciplined U.S. Core Fund
This page is intentionally left blank.
Performance highlights (unaudited)
Performance highlights
| The Fund seeks long-term capital appreciation. |
| Allspring Funds Management, LLC |
| Allspring Global Investments, LLC |
| Justin P. Carr, CFA, Robert M. Wicentowski, CFA |
Average annual total returns (%) as of January 31, 2024 |
| | | | |
| | | | | | | | | |
| | | | | | | | | |
| | | | | | | | | |
| | | | | | | | | |
Administrator Class (EVSYX) | | | | | | | | | |
Institutional Class (EVSIX) | | | | | | | | | |
| | | | | | | | | |
Figures quoted represent past performance, which is no guarantee of future results, and do not reflect taxes that a shareholder may pay on an investment in a fund. Investment return and principal value of an investment will fluctuate so that an investor’s shares, when redeemed, may be worth more or less than their original cost. Performance shown without sales charges would be lower if sales charges were reflected. Current performance may be lower or higher than the performance data quoted, which assumes the reinvestment of dividends and capital gains. Current month-end performance is available on the Fund’s website, allspringglobal.com.
Index returns do not include transaction costs associated with buying and selling securities, any mutual fund fees or expenses, or any taxes. It is not possible to invest directly in an index.
For Class A shares, the maximum front-end sales charge is 5.75%. For Class C shares, the maximum contingent deferred sales charge is 1.00%. Performance including a contingent deferred sales charge assumes the sales charge for the corresponding time period. Class R6, Administrator Class and Institutional Class shares are sold without a front-end sales charge or contingent deferred sales charge.
|
| Reflects the expense ratios as stated in the most recent prospectuses. The expense ratios shown are subject to change and may differ from the annualized expense ratios shown in the Financial Highlights of this report. |
| The manager has contractually committed through November 30, 2024, to waive fees and/or reimburse expenses to the extent necessary to cap total annual fund operating expenses after fee waivers at 0.86% for Class A, 1.61% for Class C, 0.43% for Class R6, 0.74% for Administrator Class and 0.48% for Institutional Class. Brokerage commissions, stamp duty fees, interest, taxes, acquired fund fees and expenses (if any), and extraordinary expenses are excluded from the expense caps. Prior to or after the commitment expiration date, the caps may be increased or the commitment to maintain the caps may be terminated only with the approval of the Board of Trustees. Without these caps, the Fund’s returns would have been lower. The expense ratio paid by an investor is the net expense ratio (the total annual fund operating expenses after fee waivers) as stated in the prospectuses. |
| Historical performance shown for the Class R6 shares prior to their inception reflects the performance of the Institutional Class shares, and includes the higher expenses applicable to the Institutional Class shares. If these expenses had not been included, returns for the Class R6 shares would be higher. |
| The S&P 500 Index consists of 500 stocks chosen for market size, liquidity, and industry group representation. It is a market-value-weighted index with each stock’s weight in the index proportionate to its market value. You cannot invest directly in an index. |
Stock values fluctuate in response to the activities of individual companies and general market and economic conditions. The use of derivatives may reduce returns and/or increase volatility. Consult the Fund’s prospectus for additional information on these and other risks.
CFA® and Chartered Financial Analyst® are trademarks owned by CFA Institute. |
6 | Allspring Disciplined U.S. Core Fund
Performance highlights (unaudited)
Ten largest holdings (%) as of January 31, 20241 |
| |
| |
| |
| |
Meta Platforms, Inc. Class A | |
| |
| |
| |
| |
Berkshire Hathaway, Inc. Class B | |
| Figures represent the percentage of the Fund’s net assets. Holdings are subject to change and may have changed since the date specified. |
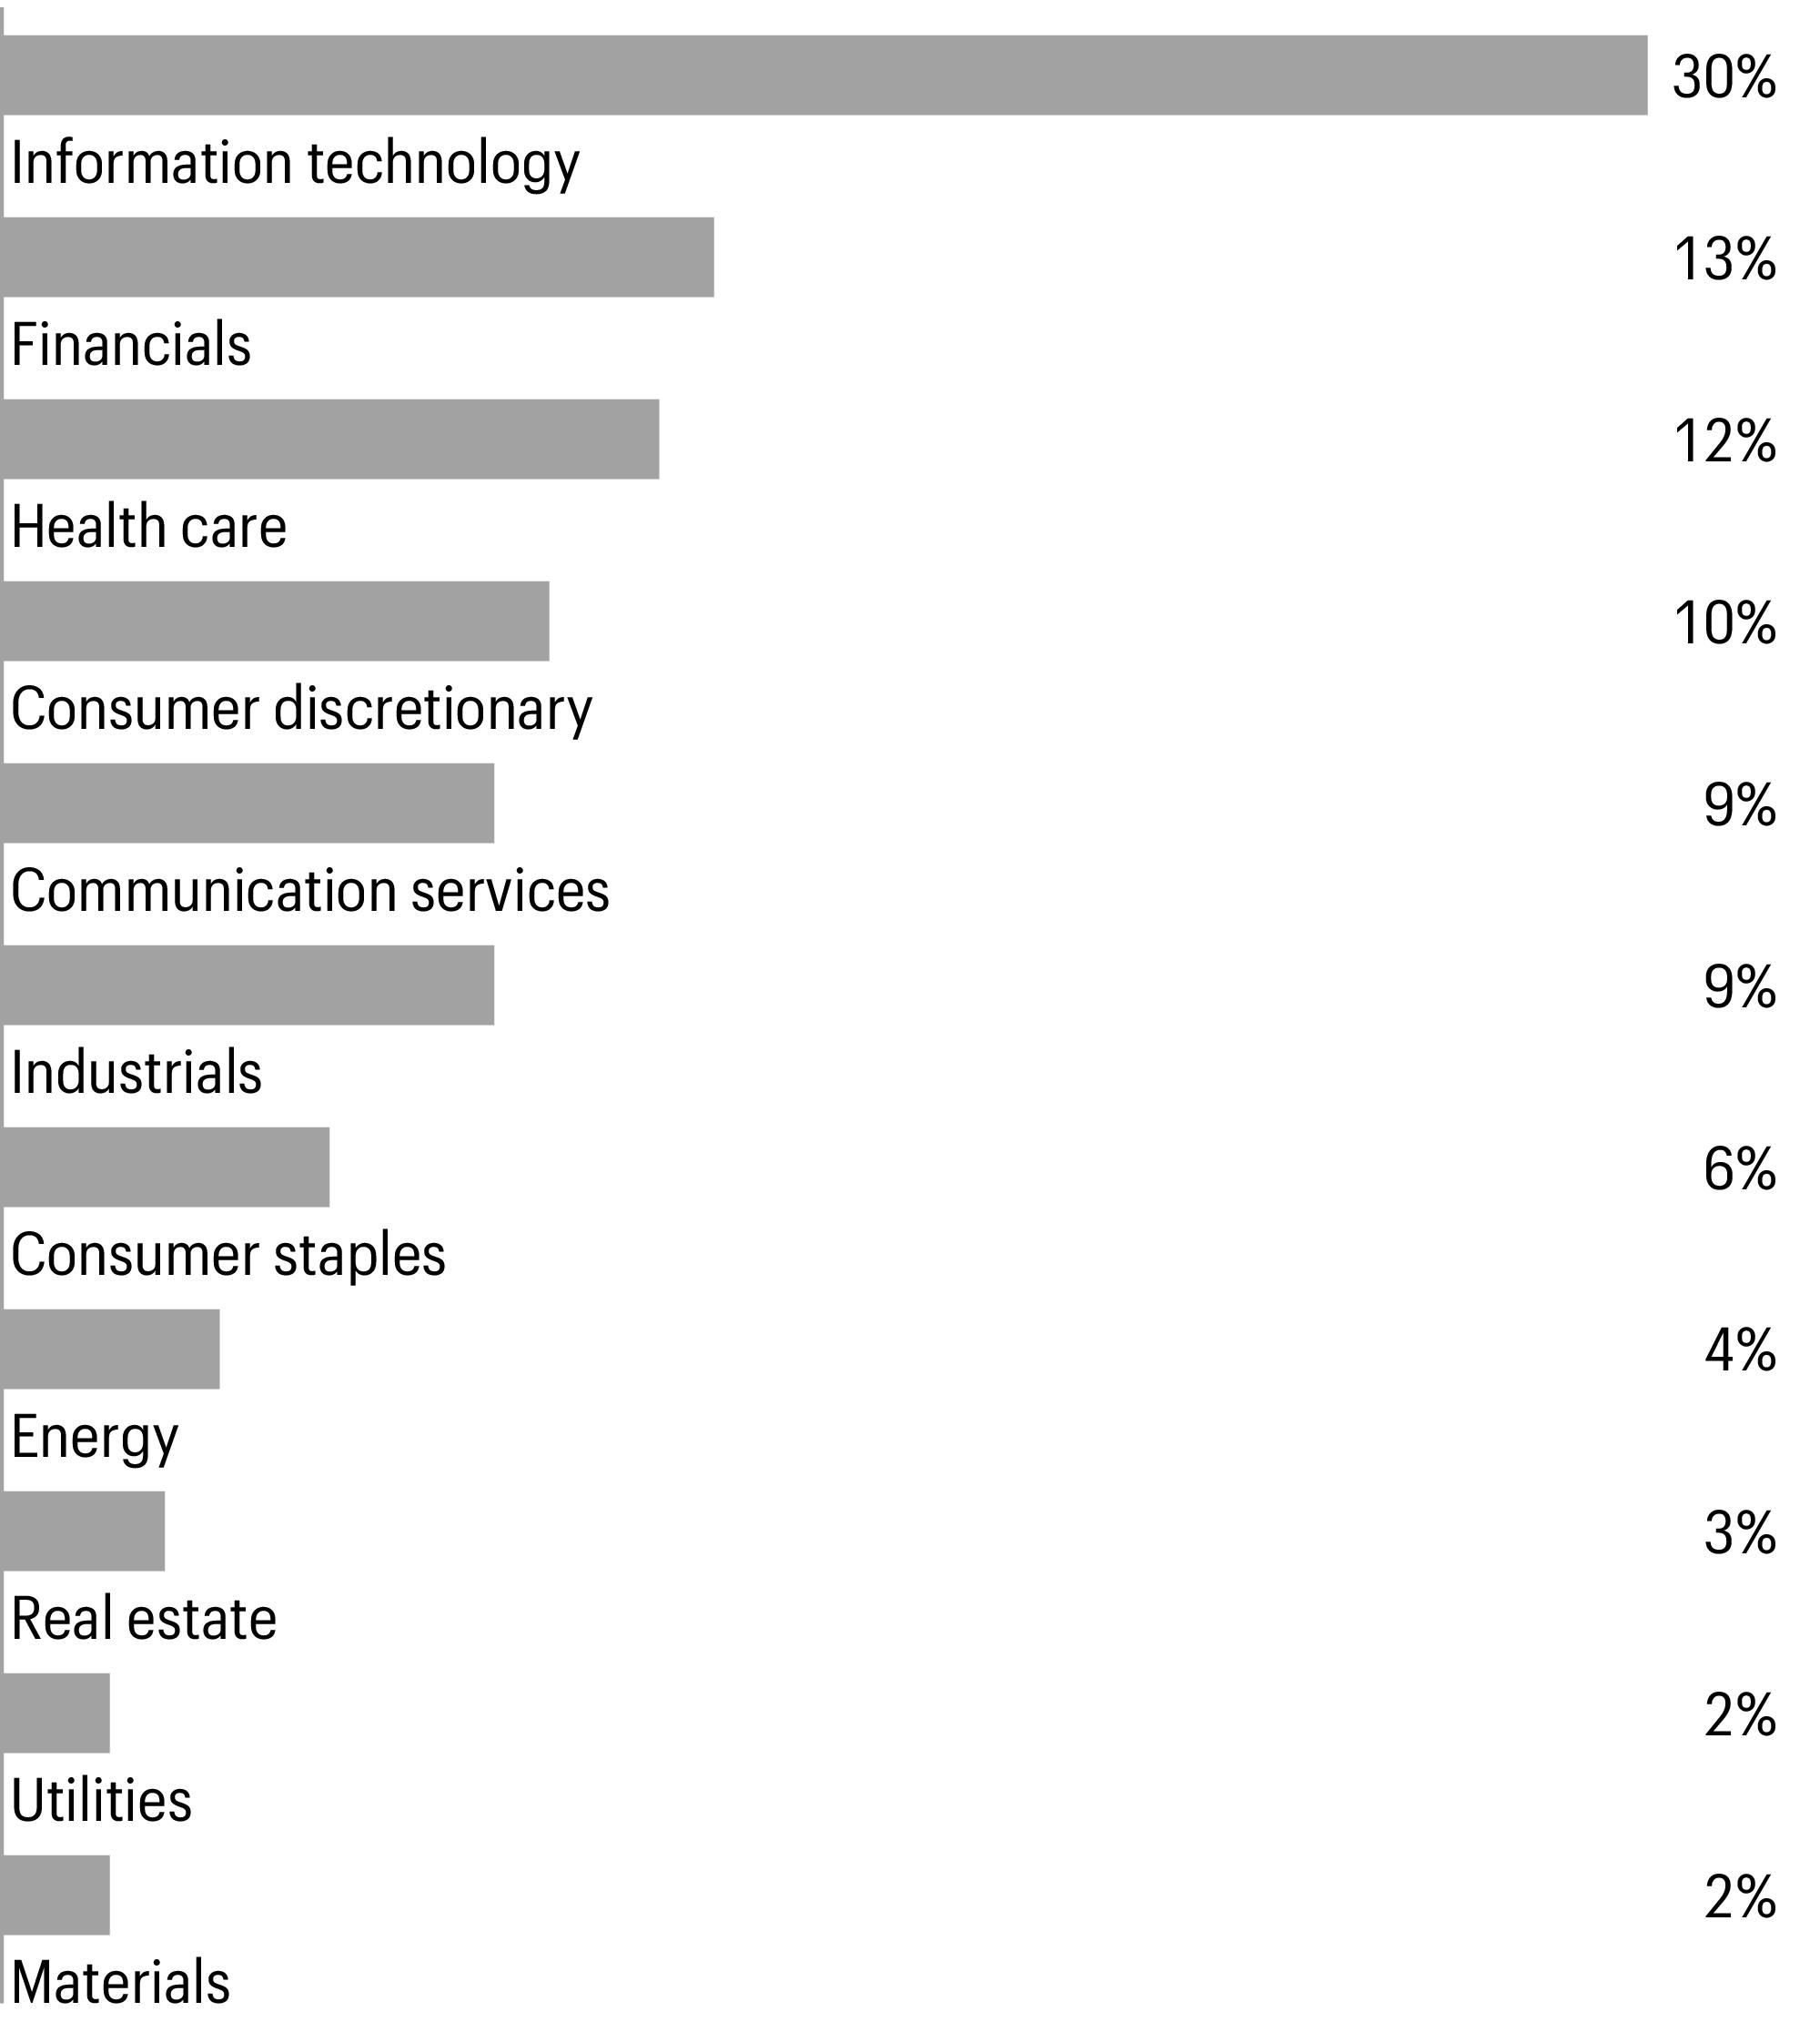
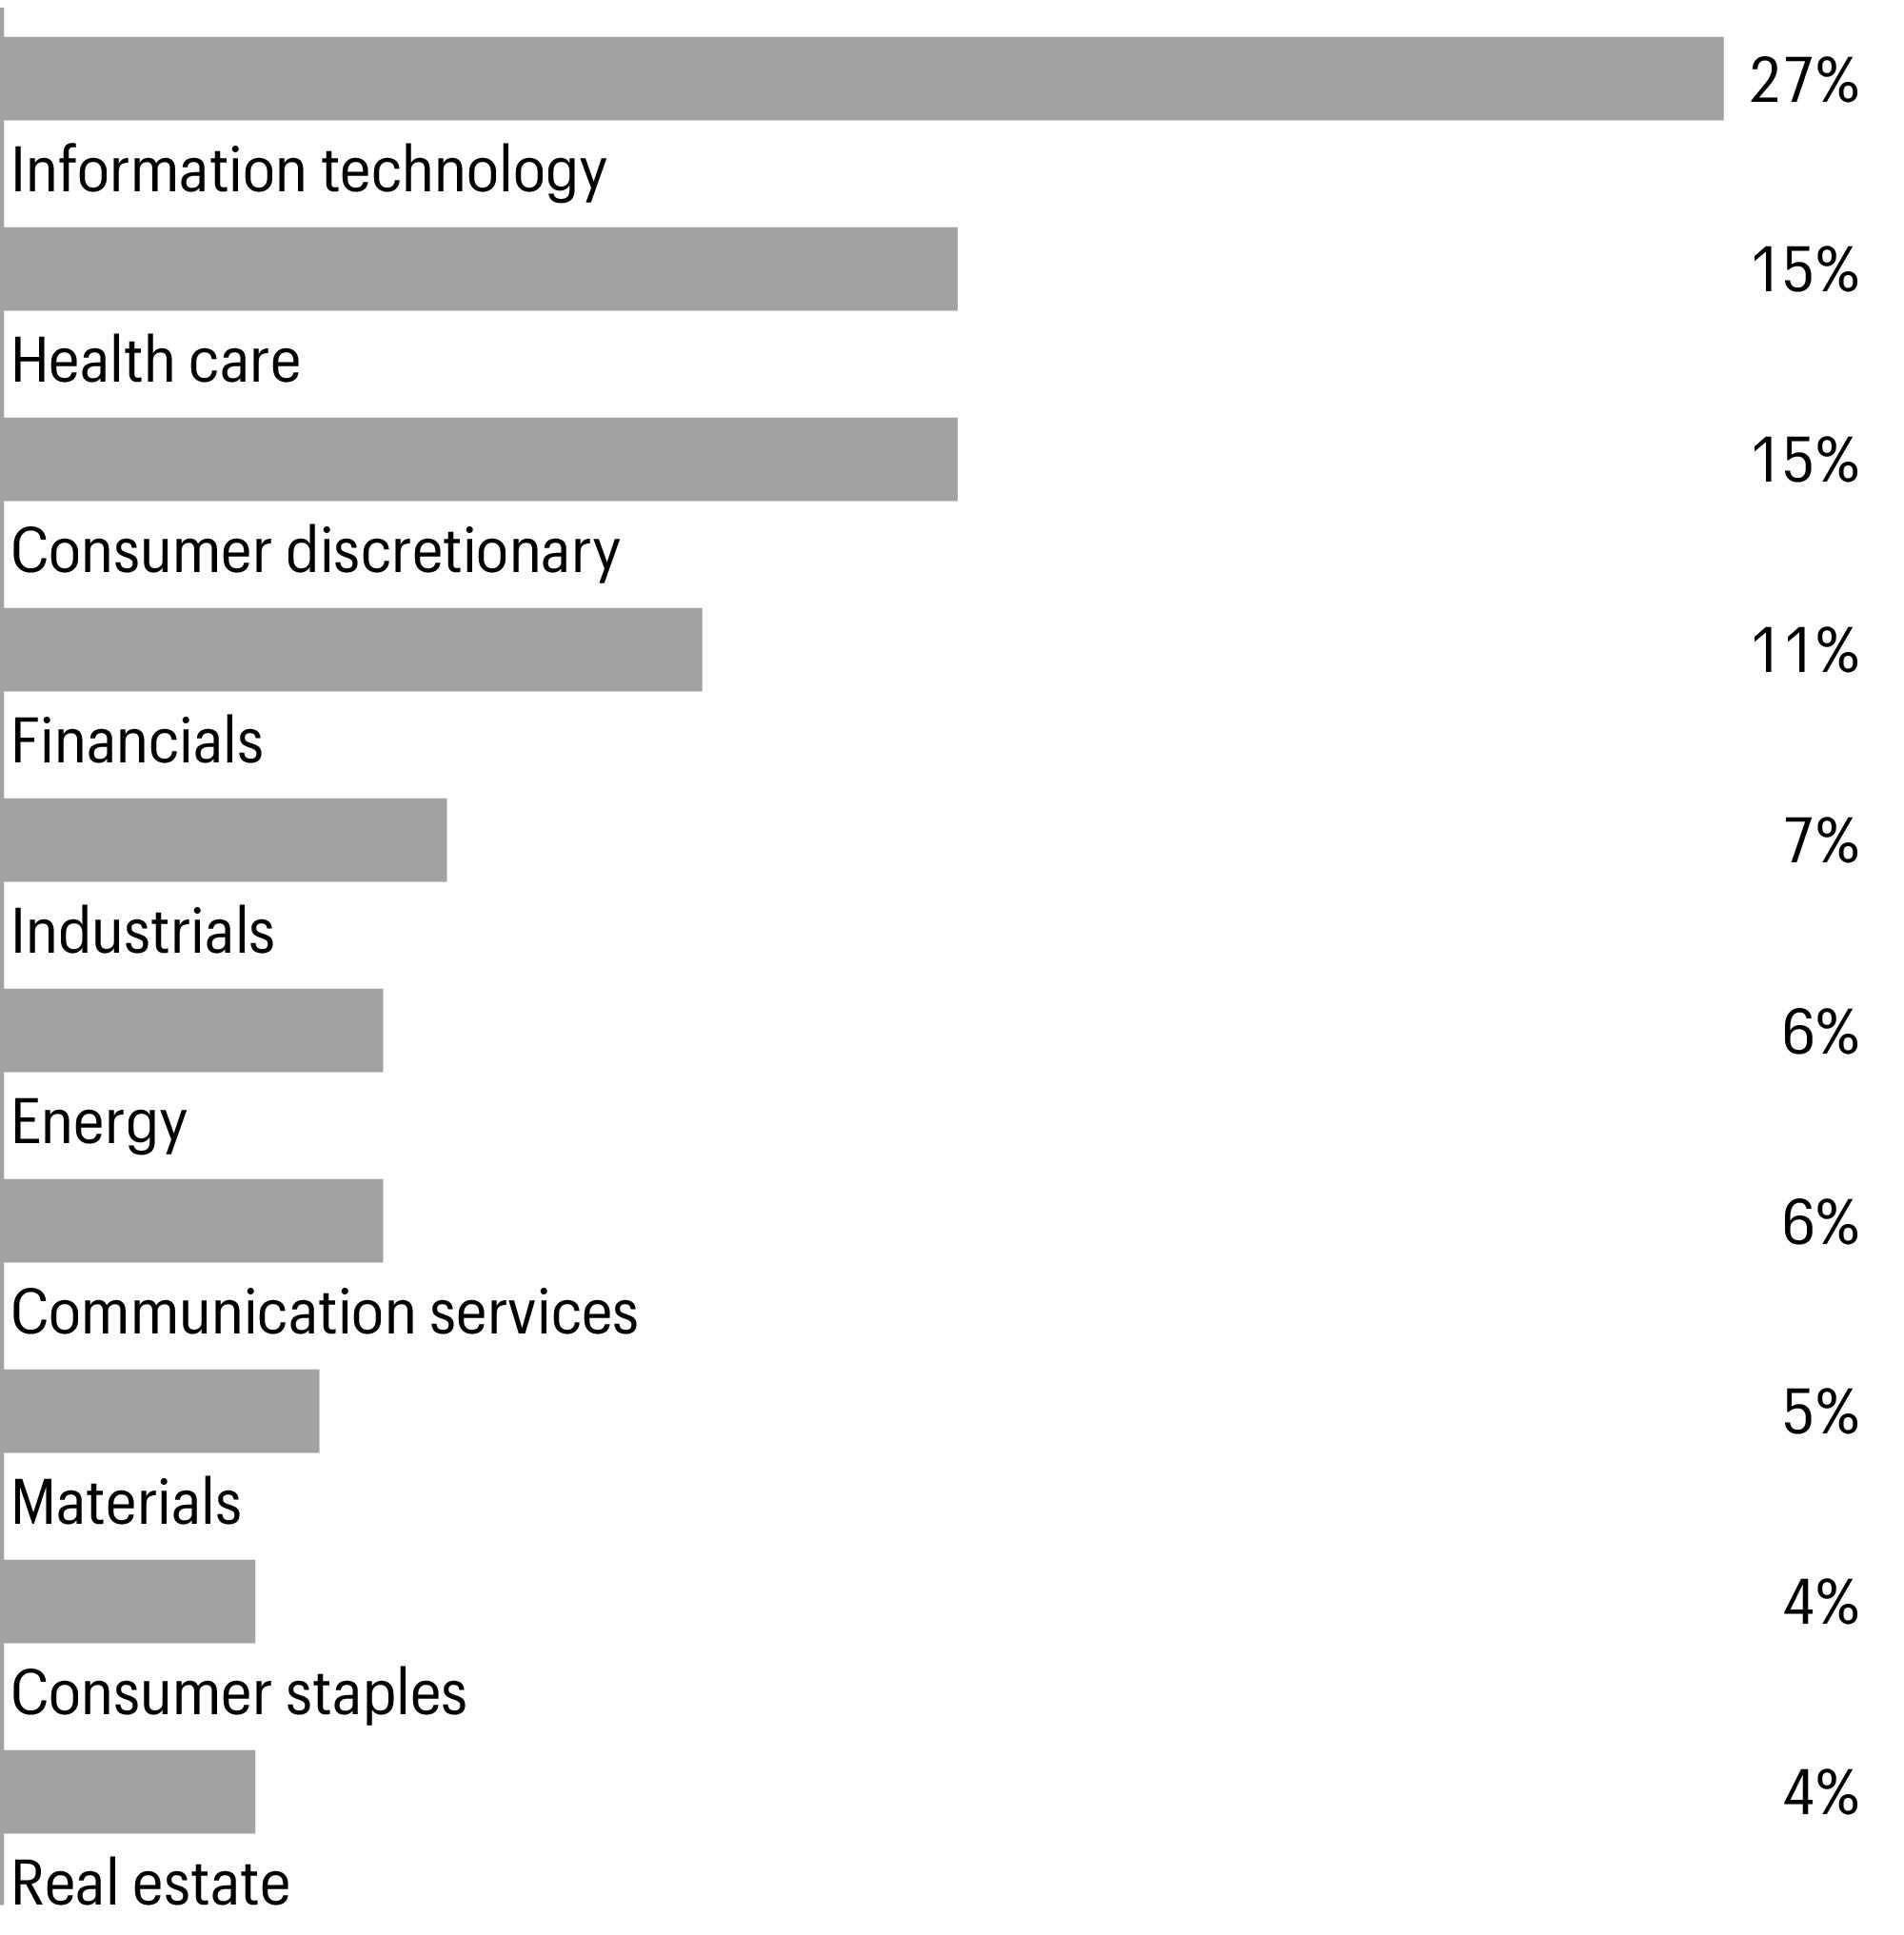
Sector allocation as of January 31, 20241 |
| Figures represent the percentage of the Fund’s long-term investments. Allocations are subject to change and may have changed since the date specified. |
Allspring Disciplined U.S. Core Fund | 7
Fund expenses (unaudited)
Fund expenses
As a shareholder of the Fund, you incur two types of costs: (1) transaction costs, including sales charges (loads) on purchase payments and contingent deferred sales charges (if any) on redemptions and (2) ongoing costs, including management fees, distribution (12b-1) and/or shareholder servicing fees, and other Fund expenses. This example is intended to help you understand your ongoing costs (in dollars) of investing in the Fund and to compare these costs with the ongoing costs of investing in other mutual funds.
The example is based on an investment of $1,000 invested at the beginning of the six-month period and held for the entire period from August 1, 2023 to January 31, 2024.
Actual expenses
The “Actual” line of the table below provides information about actual account values and actual expenses. You may use the information in this line, together with the amount you invested, to estimate the expenses that you paid over the period. Simply divide your account value by $1,000 (for example, an $8,600 account value divided by $1,000= 8.6), then multiply the result by the number in the “Actual” line under the heading entitled “Expenses paid during period” for your applicable class of shares to estimate the expenses you paid on your account during this period.
Hypothetical example for comparison purposes
The “Hypothetical” line of the table below provides information about hypothetical account values and hypothetical expenses based on the Fund’s actual expense ratio and an assumed rate of return of 5% per year before expenses, which is not the Fund’s actual return. The hypothetical account values and expenses may not be used to estimate the actual ending account balance or expenses you paid for the period. You may use this information to compare the ongoing costs of investing in the Fund and other funds. To do so, compare this 5% hypothetical example with the 5% hypothetical examples that appear in the shareholder reports of the other funds.
Please note that the expenses shown in the table are meant to highlight your ongoing costs only and do not reflect any transactional costs, such as sales charges (loads) and contingent deferred sales charges. Therefore, the “Hypothetical” line of the table is useful in comparing ongoing costs only, and will not help you determine the relative total costs of owning different funds. In addition, if these transactional costs were included, your costs would have been higher.
| Beginning
account value
8-1-2023 | Ending
account value
1-31-2024 | | Annualized net
expense ratio |
| | | | |
| | | | |
Hypothetical (5% return before expenses) | | | | |
| | | | |
| | | | |
Hypothetical (5% return before expenses) | | | | |
| | | | |
| | | | |
Hypothetical (5% return before expenses) | | | | |
| | | | |
| | | | |
Hypothetical (5% return before expenses) | | | | |
| | | | |
| | | | |
Hypothetical (5% return before expenses) | | | | |
| Expenses paid is equal to the annualized net expense ratio of each class multiplied by the average account value over the period, multiplied by 184 divided by 366 (to reflect the one-half-year period). |
8 | Allspring Disciplined U.S. Core Fund
Portfolio of investments—January 31, 2024 (unaudited)
| | | | | |
| | | | | | |
Communication services: 9.14% | | | | | | |
Diversified telecommunication services: 0.67% | | | | | | |
| | | | | | |
| | | | | | |
Live Nation Entertainment, Inc.† | | | | | | |
| | | | | | |
| | | | | | |
Interactive media & services: 6.42% | | | | | | |
| | | | | | |
| | | | | | |
Meta Platforms, Inc. Class A† | | | | | | |
| | | | | | |
| | | | | | |
| | | | | | |
Consumer discretionary: 9.58% | | | | | | |
| | | | | | |
| | | | | | |
| | | | | | |
| | | | | | |
| | | | | | |
| | | | | | |
| | | | | | |
| | | | | | |
Hotels, restaurants & leisure: 1.24% | | | | | | |
| | | | | | |
| | | | | | |
Royal Caribbean Cruises Ltd.† | | | | | | |
| | | | | | |
Household durables: 0.87% | | | | | | |
| | | | | | |
| | | | | | |
| | | | | | |
| | | | | | |
| | | | | | |
| | | | | | |
| | | | | | |
| | | | | | |
Textiles, apparel & luxury goods: 0.59% | | | | | | |
| | | | | | |
The accompanying notes are an integral part of these financial statements.
Allspring Disciplined U.S. Core Fund | 9
Portfolio of investments—January 31, 2024 (unaudited)
| | | | | |
Textiles, apparel & luxury goods(continued) | | | | | | |
| | | | | | |
| | | | | | |
| | | | | | |
| | | | | | |
| | | | | | |
| | | | | | |
| | | | | | |
| | | | | | |
Consumer staples distribution & retail: 2.39% | | | | | | |
| | | | | | |
| | | | | | |
| | | | | | |
| | | | | | |
| | | | | | |
| | | | | | |
Archer-Daniels-Midland Co. | | | | | | |
| | | | | | |
| | | | | | |
Household products: 1.66% | | | | | | |
| | | | | | |
| | | | | | |
| | | | | | |
| | | | | | |
| | | | | | |
| | | | | | |
Philip Morris International, Inc. | | | | | | |
| | | | | | |
| | | | | | |
Energy equipment & services: 0.26% | | | | | | |
| | | | | | |
Oil, gas & consumable fuels: 3.64% | | | | | | |
| | | | | | |
| | | | | | |
| | | | | | |
| | | | | | |
| | | | | | |
| | | | | | |
| | | | | | |
| | | | | | |
| | | | | | |
| | | | | | |
The accompanying notes are an integral part of these financial statements.
10 | Allspring Disciplined U.S. Core Fund
Portfolio of investments—January 31, 2024 (unaudited)
| | | | | |
| | | | | | |
| | | | | | |
| | | | | | |
| | | | | | |
New York Community Bancorp, Inc. | | | | | | |
| | | | | | |
| | | | | | |
| | | | | | |
Ameriprise Financial, Inc. | | | | | | |
Bank of New York Mellon Corp. | | | | | | |
Goldman Sachs Group, Inc. | | | | | | |
Interactive Brokers Group, Inc. Class A | | | | | | |
| | | | | | |
| | | | | | |
| | | | | | |
Capital One Financial Corp. | | | | | | |
Financial services: 4.80% | | | | | | |
Apollo Global Management, Inc. | | | | | | |
Berkshire Hathaway, Inc. Class B† | | | | | | |
FleetCor Technologies, Inc.† | | | | | | |
| | | | | | |
| | | | | | |
| | | | | | |
| | | | | | |
| | | | | | |
| | | | | | |
| | | | | | |
Hartford Financial Services Group, Inc. | | | | | | |
| | | | | | |
| | | | | | |
Reinsurance Group of America, Inc. | | | | | | |
| | | | | | |
| | | | | | |
| | | | | | |
| | | | | | |
| | | | | | |
| | | | | | |
| | | | | | |
| | | | | | |
Regeneron Pharmaceuticals, Inc.† | | | | | | |
United Therapeutics Corp.† | | | | | | |
Vertex Pharmaceuticals, Inc.† | | | | | | |
| | | | | | |
The accompanying notes are an integral part of these financial statements.
Allspring Disciplined U.S. Core Fund | 11
Portfolio of investments—January 31, 2024 (unaudited)
| | | | | |
Health care equipment & supplies: 2.89% | | | | | | |
| | | | | | |
| | | | | | |
Edwards Lifesciences Corp.† | | | | | | |
Intuitive Surgical, Inc.† | | | | | | |
| | | | | | |
| | | | | | |
Zimmer Biomet Holdings, Inc. | | | | | | |
| | | | | | |
Health care providers & services: 3.12% | | | | | | |
| | | | | | |
| | | | | | |
| | | | | | |
| | | | | | |
| | | | | | |
| | | | | | |
| | | | | | |
Life sciences tools & services: 0.34% | | | | | | |
| | | | | | |
| | | | | | |
| | | | | | |
| | | | | | |
Jazz Pharmaceuticals PLC† | | | | | | |
| | | | | | |
| | | | | | |
| | | | | | |
| | | | | | |
| | | | | | |
| | | | | | |
Aerospace & defense: 1.83% | | | | | | |
| | | | | | |
| | | | | | |
| | | | | | |
| | | | | | |
| | | | | | |
| | | | | | |
Air freight & logistics: 0.22% | | | | | | |
United Parcel Service, Inc. Class B | | | | | | |
| | | | | | |
| | | | | | |
| | | | | | |
| | | | | | |
Commercial services & supplies: 0.43% | | | | | | |
| | | | | | |
The accompanying notes are an integral part of these financial statements.
12 | Allspring Disciplined U.S. Core Fund
Portfolio of investments—January 31, 2024 (unaudited)
| | | | | |
Construction & engineering: 0.84% | | | | | | |
| | | | | | |
| | | | | | |
| | | | | | |
Electrical equipment: 0.84% | | | | | | |
| | | | | | |
| | | | | | |
| | | | | | |
Ground transportation: 0.33% | | | | | | |
| | | | | | |
| | | | | | |
| | | | | | |
Allison Transmission Holdings, Inc. | | | | | | |
| | | | | | |
| | | | | | |
| | | | | | |
| | | | | | |
| | | | | | |
Passenger airlines: 0.38% | | | | | | |
United Airlines Holdings, Inc.† | | | | | | |
Professional services: 0.45% | | | | | | |
Automatic Data Processing, Inc. | | | | | | |
CACI International, Inc. Class A† | | | | | | |
| | | | | | |
Trading companies & distributors: 0.22% | | | | | | |
WESCO International, Inc. | | | | | | |
Information technology: 29.04% | | | | | | |
Communications equipment: 0.97% | | | | | | |
| | | | | | |
Electronic equipment, instruments & components: 0.50% | | | | | | |
| | | | | | |
| | | | | | |
| | | | | | |
| | | | | | |
| | | | | | |
| | | | | | |
Semiconductors & semiconductor equipment: 8.79% | | | | | | |
Advanced Micro Devices, Inc.† | | | | | | |
| | | | | | |
| | | | | | |
| | | | | | |
The accompanying notes are an integral part of these financial statements.
Allspring Disciplined U.S. Core Fund | 13
Portfolio of investments—January 31, 2024 (unaudited)
| | | | | |
Semiconductors & semiconductor equipment(continued) | | | | | | |
| | | | | | |
| | | | | | |
Monolithic Power Systems, Inc. | | | | | | |
| | | | | | |
| | | | | | |
| | | | | | |
| | | | | | |
| | | | | | |
| | | | | | |
Cadence Design Systems, Inc.† | | | | | | |
| | | | | | |
| | | | | | |
| | | | | | |
| | | | | | |
| | | | | | |
| | | | | | |
| | | | | | |
Technology hardware, storage & peripherals: 6.46% | | | | | | |
| | | | | | |
| | | | | | |
| | | | | | |
| | | | | | |
CF Industries Holdings, Inc. | | | | | | |
| | | | | | |
Construction materials: 0.29% | | | | | | |
| | | | | | |
| | | | | | |
| | | | | | |
| | | | | | |
Reliance Steel & Aluminum Co. | | | | | | |
| | | | | | |
| | | | | | |
Hotel & resort REITs: 0.31% | | | | | | |
Host Hotels & Resorts, Inc. | | | | | | |
| | | | | | |
| | | | | | |
| | | | | | |
Simon Property Group, Inc. | | | | | | |
Specialized REITs : 1.24% | | | | | | |
| | | | | | |
Gaming & Leisure Properties, Inc. | | | | | | |
The accompanying notes are an integral part of these financial statements.
14 | Allspring Disciplined U.S. Core Fund
Portfolio of investments—January 31, 2024 (unaudited)
| | | | | |
Specialized REITs (continued) | | | | | | |
| | | | | | |
| | | | | | |
| | | | | | |
| | | | | | |
Electric utilities: 1.43% | | | | | | |
American Electric Power Co., Inc. | | | | | | |
| | | | | | |
| | | | | | |
| | | | | | |
| | | | | | |
Public Service Enterprise Group, Inc. | | | | | | |
Total common stocks (Cost $502,992,448) | | | | | | |
| | | | | |
Short-term investments: 2.49% | | | | | | |
Investment companies: 2.49% | | | | | | |
Allspring Government Money Market Fund Select Class♠∞ | | | | | | |
Total short-term investments (Cost $24,147,055) | | | | | | |
Total investments in securities (Cost $527,139,503) | | | | | | |
Other assets and liabilities, net | | | | | | |
| | | | | | |
| Non-income-earning security |
| The issuer of the security is an affiliated person of the Fund as defined in the Investment Company Act of 1940. |
| The rate represents the 7-day annualized yield at period end. |
|
| Real estate investment trust |
Investments in affiliates
An affiliated investment is an investment in which the Fund owns at least 5% of the outstanding voting shares of the issuer or as a result of other relationships, such as the Fund and the issuer having the same investment manager. Transactions with issuers that were affiliates of the Fund at the end of the period were as follows:
| | | | | Net
change in
unrealized
gains
(losses) | | | Income
from
affiliated
securities |
| | | | | | | | |
Allspring Government Money Market Fund Select Class | | | | | | | | |
The accompanying notes are an integral part of these financial statements.
Allspring Disciplined U.S. Core Fund | 15
Portfolio of investments—January 31, 2024 (unaudited)
The accompanying notes are an integral part of these financial statements.
16 | Allspring Disciplined U.S. Core Fund
Statement of assets and liabilities—January 31, 2024 (unaudited)
Financial statements
Statement of assets and liabilities
| |
Investments in unaffiliated securities, at value (cost $502,992,448) | |
Investments in affiliated securities, at value (cost $24,147,055) | |
| |
Cash at broker segregated for futures contracts | |
Receivable for investments sold | |
| |
Receivable for Fund shares sold | |
Prepaid expenses and other assets | |
| |
| |
Payable for investments purchased | |
Payable for Fund shares redeemed | |
Payable for daily variation margin on open futures contracts | |
| |
Administration fees payable | |
Distribution fees payable | |
Accrued expenses and other liabilities | |
| |
| |
| |
| |
Total distributable earnings | |
| |
Computation of net asset value and offering price per share | |
| |
Shares outstanding–Class A1 | |
Net asset value per share–Class A | |
Maximum offering price per share – Class A2 | |
| |
Shares outstanding–Class C1 | |
Net asset value per share–Class C | |
| |
Shares outstanding–Class R61 | |
Net asset value per share–Class R6 | |
Net assets–Administrator Class | |
Shares outstanding–Administrator Class1 | |
Net asset value per share–Administrator Class | |
Net assets–Institutional Class | |
Shares outstanding–Institutional Class1 | |
Net asset value per share–Institutional Class | |
1 The Fund has an unlimited number of authorized shares.
2 Maximum offering price is computed as 100/94.25 of net asset value. On investments of $50,000 or more, the offering price is reduced.
The accompanying notes are an integral part of these financial statements.
Allspring Disciplined U.S. Core Fund | 17
Statement of operations—six months ended January 31, 2024 (unaudited)
Statement of operations
| |
| |
Income from affiliated securities | |
| |
| |
| |
| |
| |
| |
| |
| |
| |
| |
Shareholder servicing fees | |
| |
| |
| |
| |
| |
Custody and accounting fees | |
| |
| |
Shareholder report expenses | |
Trustees’ fees and expenses | |
| |
| |
Less: Fee waivers and/or expense reimbursements | |
| |
| |
| |
| |
Realized and unrealized gains (losses) on investments | |
| |
| |
| |
Net realized gains on investments | |
Net change in unrealized gains (losses) on | |
| |
| |
Net change in unrealized gains (losses) on investments | |
Net realized and unrealized gains (losses) on investments | |
Net increase in net assets resulting from operations | |
The accompanying notes are an integral part of these financial statements.
18 | Allspring Disciplined U.S. Core Fund
Statement of changes in net assets
Statement of changes in net assets
|
Six months ended
January 31, 2024 (unaudited) | |
| | | | |
| | | | |
Net realized gains on investments | | | | |
Net change in unrealized gains (losses) on investments | | | | |
Net increase in net assets resulting from operations | | | | |
Distributions to shareholders from | | | | |
Net investment income and net realized gains | | | | |
| | | | |
| | | | |
| | | | |
| | | | |
| | | | |
| | | | |
Total distributions to shareholders | | | | |
Capital share transactions | | | | |
Proceeds from shares sold | | | | |
| | | | |
| | | | |
| | | | |
| | | | |
| | | | |
| | | | |
| | | | |
Reinvestment of distributions | | | | |
| | | | |
| | | | |
| | | | |
| | | | |
| | | | |
| | | | |
| | | | |
1 For the period from August 1, 2022 to June 16, 2023. Effective at the close of business on June 16, 2023, Class R shares were converted to Class A shares and are no longer offered by the Fund.
The accompanying notes are an integral part of these financial statements.
Allspring Disciplined U.S. Core Fund | 19
Statement of changes in net assets
| Six months ended January 31, 2024 (unaudited) | |
| | | | |
Payment for shares redeemed | | | | |
| | | | |
| | | | |
| | | | |
| | | | |
| | | | |
| | | | |
| | | | |
Net increase (decrease) in net assets resulting from capital share transactions | | | | |
Total increase (decrease) in net assets | | | | |
| | | | |
| | | | |
| | | | |
1 For the period from August 1, 2022 to June 16, 2023. Effective at the close of business on June 16, 2023, Class R shares were converted to Class A shares and are no longer offered by the Fund.
The accompanying notes are an integral part of these financial statements.
20 | Allspring Disciplined U.S. Core Fund
Financial highlights
(For a share outstanding throughout each period)
| Six months ended
January 31, 2024
(unaudited) | |
| | | | | |
Net asset value, beginning of period | | | | | | |
| | | | | | |
Net realized and unrealized gains (losses) on investments | | | | | | |
Total from investment operations | | | | | | |
Distributions to shareholders from | | | | | | |
| | | | | | |
| | | | | | |
Total distributions to shareholders | | | | | | |
Net asset value, end of period | | | | | | |
| | | | | | |
Ratios to average net assets (annualized) | | | | | | |
| | | | | | |
| | | | | | |
| | | | | | |
| | | | | | |
| | | | | | |
Net assets, end of period (000s omitted) | | | | | | |
| Calculated based upon average shares outstanding |
| Total return calculations do not include any sales charges. Returns for periods of less than one year are not annualized. |
The accompanying notes are an integral part of these financial statements.
Allspring Disciplined U.S. Core Fund | 21
(For a share outstanding throughout each period)
| Six months ended
January 31, 2024
(unaudited) | |
| | | | | |
Net asset value, beginning of period | | | | | | |
Net investment income (loss) | | | | | | |
Net realized and unrealized gains (losses) on investments | | | | | | |
Total from investment operations | | | | | | |
Distributions to shareholders from | | | | | | |
| | | | | | |
| | | | | | |
Total distributions to shareholders | | | | | | |
Net asset value, end of period | | | | | | |
| | | | | | |
Ratios to average net assets (annualized) | | | | | | |
| | | | | | |
| | | | | | |
Net investment income (loss) | | | | | | |
| | | | | | |
| | | | | | |
Net assets, end of period (000s omitted) | | | | | | |
| Amount is less than $0.005. |
| Calculated based upon average shares outstanding |
| Amount is more than $(0.005). |
| Total return calculations do not include any sales charges. Returns for periods of less than one year are not annualized. |
The accompanying notes are an integral part of these financial statements.
22 | Allspring Disciplined U.S. Core Fund
(For a share outstanding throughout each period)
| Six months ended
January 31, 2024
(unaudited) | |
| | | | | |
Net asset value, beginning of period | | | | | | |
| | | | | | |
Net realized and unrealized gains (losses) on investments | | | | | | |
Total from investment operations | | | | | | |
Distributions to shareholders from | | | | | | |
| | | | | | |
| | | | | | |
Total distributions to shareholders | | | | | | |
Net asset value, end of period | | | | | | |
| | | | | | |
Ratios to average net assets (annualized) | | | | | | |
| | | | | | |
| | | | | | |
| | | | | | |
| | | | | | |
| | | | | | |
Net assets, end of period (000s omitted) | | | | | | |
| Calculated based upon average shares outstanding |
| Returns for periods of less than one year are not annualized. |
The accompanying notes are an integral part of these financial statements.
Allspring Disciplined U.S. Core Fund | 23
(For a share outstanding throughout each period)
| Six months ended
January 31, 2024
(unaudited) | |
| | | | | |
Net asset value, beginning of period | | | | | | |
| | | | | | |
Net realized and unrealized gains (losses) on investments | | | | | | |
Total from investment operations | | | | | | |
Distributions to shareholders from | | | | | | |
| | | | | | |
| | | | | | |
Total distributions to shareholders | | | | | | |
Net asset value, end of period | | | | | | |
| | | | | | |
Ratios to average net assets (annualized) | | | | | | |
| | | | | | |
| | | | | | |
| | | | | | |
| | | | | | |
| | | | | | |
Net assets, end of period (000s omitted) | | | | | | |
| Calculated based upon average shares outstanding |
| Returns for periods of less than one year are not annualized. |
The accompanying notes are an integral part of these financial statements.
24 | Allspring Disciplined U.S. Core Fund
(For a share outstanding throughout each period)
| Six months ended
January 31, 2024
(unaudited) | |
| | | | | |
Net asset value, beginning of period | | | | | | |
| | | | | | |
Net realized and unrealized gains (losses) on investments | | | | | | |
Total from investment operations | | | | | | |
Distributions to shareholders from | | | | | | |
| | | | | | |
| | | | | | |
Total distributions to shareholders | | | | | | |
Net asset value, end of period | | | | | | |
| | | | | | |
Ratios to average net assets (annualized) | | | | | | |
| | | | | | |
| | | | | | |
| | | | | | |
| | | | | | |
| | | | | | |
Net assets, end of period (000s omitted) | | | | | | |
| Calculated based upon average shares outstanding |
| Returns for periods of less than one year are not annualized. |
The accompanying notes are an integral part of these financial statements.
Allspring Disciplined U.S. Core Fund | 25
Notes to financial statements (unaudited)
Notes to financial statements
Allspring Funds Trust (the “Trust”), a Delaware statutory trust organized on March 10, 1999, is an open-end management investment company registered under the Investment Company Act of 1940, as amended (the “1940 Act”). As an investment company, the Trust follows the accounting and reporting guidance in Financial Accounting Standards Board (“FASB”) Accounting Standards Codification Topic 946, Financial Services – Investment Companies. These financial statements report on the Allspring Disciplined U.S. Core Fund (the “Fund”) which is a diversified series of the Trust.
2.
SIGNIFICANT ACCOUNTING POLICIES
The following significant accounting policies, which are consistently followed in the preparation of the financial statements of the Fund, are in conformity with U.S. generally accepted accounting principles which require management to make estimates and assumptions that affect the reported amounts of assets and liabilities, disclosure of contingent assets and liabilities at the date of the financial statements, and the reported amounts of income and expenses during the reporting period. Actual results could differ from those estimates.
Securities valuation
All investments are valued each business day as of the close of regular trading on the New York Stock Exchange (generally 4 p.m. Eastern Time), although the Fund may deviate from this calculation time under unusual or unexpected circumstances.
Equity securities, exchange-traded funds and futures contracts that are listed on a foreign or domestic exchange or market are valued at the official closing price or, if none, the last sales price.
Investments in registered open-end investment companies (other than those listed on a foreign or domestic exchange or market) are valued at net asset value.
Investments which are not valued using the methods discussed above are valued at their fair value, as determined in good faith by Allspring Funds Management, LLC (“Allspring Funds Management”), which was named the valuation designee by the Board of Trustees. As the valuation designee, Allspring Funds Management is responsible for day-to-day valuation activities for the Allspring Funds. In connection with these responsibilities, Allspring Funds Management has established a Valuation Committee and has delegated to it the authority to take any actions regarding the valuation of portfolio securities that the Valuation Committee deems necessary or appropriate, including determining the fair value of portfolio securities. On a quarterly basis, the Board of Trustees receives reports of valuation actions taken by the Valuation Committee. On at least an annual basis, the Board of Trustees receives an assessment of the adequacy and effectiveness of Allspring Funds Management’s process for determining the fair value of the portfolio of investments.
Futures contracts
Futures contracts are agreements between the Fund and a counterparty to buy or sell a specific amount of a commodity, financial instrument or currency at a specified price and on a specified date. The Fund may buy and sell futures contracts in order to gain exposure to, or protect against, changes in security values and is subject to equity price risk. The primary risks associated with the use of futures contracts are the imperfect correlation between changes in market values of securities held by the Fund and the prices of futures contracts, and the possibility of an illiquid market. Futures contracts are generally entered into on a regulated futures exchange and cleared through a clearinghouse associated with the exchange. With futures contracts, there is minimal counterparty risk to the Fund since futures contracts are exchange-traded and the exchange’s clearinghouse, as the counterparty to all exchange-traded futures, guarantees the futures contracts against default.
Upon entering into a futures contracts, the Fund is required to deposit either cash or securities (initial margin) with the broker in an amount equal to a certain percentage of the contract value. Subsequent payments (variation margin) are paid to or received from the broker each day equal to the daily changes in the contract value. Such payments are recorded as unrealized gains or losses and, if any, shown as variation margin receivable (payable) in the Statement of Assets and Liabilities. Should the Fund fail to make requested variation margin payments, the broker can gain access to the initial margin to satisfy the Fund’s payment obligations. When the contracts are closed, a realized gain or loss is recorded in the Statement of Operations.
Security transactions and income recognition
Securities transactions are recorded on a trade date basis. Realized gains or losses are recorded on the basis of identified cost.
Dividend income is recognized on the ex-dividend date.
Interest earned on cash balances held at the custodian is recorded as interest income.
Distributions received from REIT investments may be characterized as ordinary income, capital gains, or a return of capital to the Fund based on information provided by the REIT. The proper characterization of REIT distributions is generally not known until after the end of each calendar year. As such, estimates may be used in reporting the character of income and distributions for financial statement purposes.
Distributions to shareholders
Distributions to shareholders from net investment income and any net realized gains are recorded on the ex-dividend date and paid at least annually. Such distributions are determined in accordance with income tax regulations and may differ from U.S. generally accepted accounting principles.
26 | Allspring Disciplined U.S. Core Fund
Notes to financial statements (unaudited)
Dividend sources are estimated at the time of declaration. The tax character of distributions is determined as of the Fund’s fiscal year end. Therefore, a portion of the Fund’s distributions made prior to the Fund’s fiscal year end may be categorized as a tax return of capital at year end.
Federal and other taxes
The Fund intends to continue to qualify as a regulated investment company by distributing substantially all of its investment company taxable income and any net realized capital gains (after reduction for capital loss carryforwards) sufficient to relieve it from all, or substantially all, federal income taxes. Accordingly, no provision for federal income taxes was required.
The Fund’s income and federal excise tax returns and all financial records supporting those returns for the prior three fiscal years are subject to examination by the federal and Delaware revenue authorities. Management has analyzed the Fund’s tax positions taken on federal, state, and foreign tax returns, as applicable, for all open tax years and does not believe that there are any uncertain tax positions that require recognition of a tax liability.
As of January 31, 2024, the aggregate cost of all investments for federal income tax purposes was $528,903,026 and the unrealized gains (losses) consisted of:
Class allocations
The separate classes of shares offered by the Fund differ principally in applicable sales charges, distribution, shareholder servicing, and administration fees. Class specific expenses are charged directly to that share class. Investment income, common fund-level expenses, and realized and unrealized gains (losses) on investments are allocated daily to each class of shares based on the relative proportion of net assets of each class.
3.
FAIR VALUATION MEASUREMENTS
Fair value measurements of investments are determined within a framework that has established a fair value hierarchy based upon the various data inputs utilized in determining the value of the Fund’s investments. The three-level hierarchy gives the highest priority to unadjusted quoted prices in active markets for identical assets or liabilities (Level 1) and the lowest priority to unobservable inputs (Level 3). The Fund’s investments are classified within the fair value hierarchy based on the lowest level of input that is significant to the fair value measurement. The inputs are summarized into three broad levels as follows:
•Level 1—quoted prices in active markets for identical securities
•Level 2—other significant observable inputs (including quoted prices for similar securities, interest rates, prepayment speeds, credit risk, etc.)
•Level 3—significant unobservable inputs (including the Fund’s own assumptions in determining the fair value of investments)
The inputs or methodologies used for valuing investments in securities are not necessarily an indication of the risk associated with investing in those securities.
Allspring Disciplined U.S. Core Fund | 27
Notes to financial statements (unaudited)
The following is a summary of the inputs used in valuing the Fund’s assets and liabilities as of January 31, 2024:
| | Other significant
observable inputs
(Level 2) | Significant
unobservable inputs
(Level 3) | |
| | | | |
| | | | |
| | | | |
| | | | |
| | | | |
| | | | |
| | | | |
| | | | |
| | | | |
| | | | |
| | | | |
| | | | |
| | | | |
| | | | |
| | | | |
| | | | |
| | | | |
| | | | |
| | | | |
Futures contracts are reported at their cumulative unrealized gains (losses) at measurement date as reported in the table following the Portfolio of Investments. For futures contracts, the current day’s variation margin is reported on the Statement of Assets and Liabilities. All other assets and liabilities are reported at their market value at measurement date.
Additional sector, industry or geographic detail, if any, is included in the Portfolio of Investments.
At January 31, 2024, the Fund did not have any transfers into/out of Level 3.
4.
TRANSACTIONS WITH AFFILIATES
Management fee
Allspring Funds Management, a wholly owned subsidiary of Allspring Global Investments Holdings, LLC, a holding company indirectly owned by certain private funds of GTCR LLC and Reverence Capital Partners, L.P., is the manager of the Fund and provides advisory and fund-level administrative services under an investment management agreement. Under the investment management agreement, Allspring Funds Management is responsible for, among other services, implementing the investment objectives and strategies of the Fund, supervising the subadviser and providing fund-level administrative services in connection with the Fund’s operations. As compensation for its services under the investment management agreement, Allspring Funds Management is entitled to receive a management fee at the following annual rate based on the Fund’s average daily net assets:
For the six months ended January 31, 2024, the management fee was equivalent to an annual rate of 0.35% of the Fund’s average daily net assets.
Allspring Funds Management has retained the services of a subadviser to provide daily portfolio management to the Fund. The fee for subadvisory services is borne by Allspring Funds Management. Allspring Global Investments, LLC, an affiliate of Allspring Funds Management and a wholly owned subsidiary of Allspring Global Investments Holdings, LLC, is the subadviser to the Fund and is entitled to receive a fee from Allspring Funds Management at an annual rate starting at 0.25% and declining to 0.15% as the average daily net assets of the Fund increase.
Administration fees
Under a class-level administration agreement, Allspring Funds Management provides class-level administrative services to the Fund, which includes paying fees and expenses for services provided by the transfer agent, sub-transfer agents, omnibus account servicers and record-keepers. As
28 | Allspring Disciplined U.S. Core Fund
Notes to financial statements (unaudited)
compensation for its services under the class-level administration agreement, Allspring Funds Management receives an annual fee which is calculated based on the average daily net assets of each class as follows:
| Class-level
administration fee |
| |
| |
| |
| |
| |
Waivers and/or expense reimbursements
Allspring Funds Management has contractually committed to waive and/or reimburse management and administration fees to the extent necessary to maintain certain net operating expense ratios for the Fund. When each class of the Fund has exceeded its expense cap, Allspring Funds Management will waive fees and/or reimburse expenses from fund-level expenses on a proportionate basis and then from class specific expenses. When only certain classes exceed their expense caps, waivers and/or reimbursements are applied against class specific expenses before fund-level expenses. Allspring Funds Management has contractually committed through November 30, 2024 to waive fees and/or reimburse expenses to the extent necessary to cap the Fund’s expenses. Prior to or after the commitment expiration date, the cap may be increased or the commitment to maintain the cap may be terminated only with the approval of the Board of Trustees. As of January 31, 2024, the contractual expense caps are as follows:
Distribution fees
The Trust has adopted a distribution plan for Class C shares pursuant to Rule 12b-1 under the 1940 Act. Distribution fees are charged to Class C shares and paid to Allspring Funds Distributor, LLC (“Allspring Funds Distributor”), the principal underwriter, an affiliate of Allspring Funds Management, at an annual rate up to 0.75% of the average daily net assets of Class C shares.
In addition, Allspring Funds Distributor is entitled to receive the front-end sales charge from the purchase of Class A shares and a contingent deferred sales charge on the redemption of certain Class A shares. Allspring Funds Distributor is also entitled to receive the contingent deferred sales charges from redemptions of Class C shares. For the six months ended January 31, 2024, Allspring Funds Distributor received $13,001 from the sale of Class A shares. No contingent deferred sales charges were incurred by Class A and Class C shares for the six months ended January 31, 2024.
Shareholder servicing fees
The Trust has entered into contracts with one or more shareholder servicing agents, whereby Class A, Class C and Administrator Class are charged a fee at an annual rate up to 0.25% of the average daily net assets of each respective class. A portion of these total shareholder servicing fees were paid to affiliates of the Fund.
Interfund transactions
The Fund may purchase or sell portfolio investment securities to certain affiliates pursuant to Rule 17a-7 under the 1940 Act and under procedures adopted by the Board of Trustees. The procedures have been designed to ensure that these interfund transactions, which do not incur broker commissions, are effected at current market prices. Pursuant to these procedures, the Fund did not have any interfund transactions during the six months ended January 31, 2024.
5.
INVESTMENT PORTFOLIO TRANSACTIONS
Purchases and sales of investments, excluding U.S. government obligations (if any) and short-term securities, for the six months ended January 31, 2024 were $219,396,936 and $239,988,501, respectively.
6.
DERIVATIVE TRANSACTIONS
During the six months ended January 31, 2024, the Fund entered into futures contracts to gain market exposure. The Fund had an average notional amount of $17,232,812 in long futures contracts during the six months ended January 31, 2024.
The fair value, realized gains or losses and change in unrealized gains or losses, if any, on derivative instruments are reflected in the corresponding financial statement captions.
Allspring Disciplined U.S. Core Fund | 29
Notes to financial statements (unaudited)
The Trust (excluding the money market funds), Allspring Master Trust and Allspring Variable Trust are parties to a $350,000,000 revolving credit agreement whereby the Fund is permitted to use bank borrowings for temporary or emergency purposes, such as to fund shareholder redemption requests. Interest under the credit agreement is charged to the Fund based on borrowing rate equal to the higher of the Federal Funds rate or the overnight bank funding rate in effect on that day plus a spread. In addition, an annual commitment fee based on the unused balance is allocated to each participating fund.
For the six months ended January 31, 2024, there were no borrowings by the Fund under the agreement.
As of the end of the period, the Fund concentrated its portfolio of investments in the information technology sector. A fund that invests a substantial portion of its assets in any sector may be more affected by changes in that sector than would be a fund whose investments are not heavily weighted in any sector.
Under the Fund’s organizational documents, the officers and Trustees have been granted certain indemnification rights against certain liabilities that may arise out of performance of their duties to the Fund. The Fund has entered into a separate agreement with each Trustee that converts indemnification rights currently existing under the Fund’s organizational documents into contractual rights that cannot be changed in the future without the consent of the Trustee. Additionally, in the normal course of business, the Fund may enter into contracts with service providers that contain a variety of indemnification clauses. The Fund’s maximum exposure under these arrangements is dependent on future claims that may be made against the Fund and, therefore, cannot be estimated.
30 | Allspring Disciplined U.S. Core Fund
Other information (unaudited)
Other information
Proxy voting information
A description of the policies and procedures used to determine how to vote proxies relating to portfolio securities is available without charge, upon request, by calling 1-866-259-3305, visiting our website at allspringglobal.com, or visiting the SEC website at sec.gov. Information regarding how the proxies related to portfolio securities were voted during the most recent 12-month period ended June 30 is available on the website at allspringglobal.com or by visiting the SEC website at sec.gov.
Quarterly portfolio holdings information
The Fund files its complete schedule of portfolio holdings with the SEC for the first and third quarters of each fiscal year as an exhibit to its reports on Form N-PORT. Shareholders may view the filed Form N-PORT by visiting the SEC website at sec.gov.
Allspring Disciplined U.S. Core Fund | 31
Other information (unaudited)
Board of trustees and officers
Each of the Trustees and Officers listed in the table below acts in identical capacities for each fund in the Allspring family of funds, which consists of 116 mutual funds comprising the Allspring Funds Trust, Allspring Variable Trust, Allspring Master Trust and four closed-end funds (collectively the “Fund Complex”). This table should be read in conjunction with the Prospectus and the Statement of Additional Information†. The mailing address of each Trustee and Officer is 1415 Vantage Park Drive, 3rd Floor, Charlotte, NC 28203. Each Trustee and Officer serves an indefinite term, however, each Trustee serves such term until reaching the mandatory retirement age established by the Trustees.
Independent Trustees
| | Principal occupations during past five years or longer | Current other
public company or
investment
company
directorships |
William R. Ebsworth
(Born 1957) | | Retired. From 1984 to 2013, equities analyst, portfolio manager, research director and chief investment officer at Fidelity Management and Research Company in Boston, Tokyo, and Hong Kong, and retired in 2013 as Chief Investment Officer of Fidelity Strategic Advisers, Inc. where he led a team of investment professionals managing client assets. Prior thereto, Board member of Hong Kong Securities Clearing Co., Hong Kong Options Clearing Corp., the Thailand International Fund, Ltd., Fidelity Investments Life Insurance Company, and Empire Fidelity Investments Life Insurance Company. Serves on the Investment Company Institute’s Board of Governors since 2022 and Executive Committee since 2023 as well as the Vice Chairman of the Governing Council of the Independent Directors Council since 2023. Audit Committee Chair and Investment Committee Chair of the Vincent Memorial Hospital Foundation (non-profit organization). Mr. Ebsworth is a CFA charterholder. | |
Jane A. Freeman
(Born 1953) | Trustee,
since 2015;
Chair Liaison,
| Retired. From 2012 to 2014 and 1999 to 2008, Chief Financial Officer of Scientific Learning Corporation. From 2008 to 2012, Ms. Freeman provided consulting services related to strategic business projects. Prior to 1999, Portfolio Manager at Rockefeller & Co. and Scudder, Stevens & Clark. Board member of the Harding Loevner Funds from 1996 to 2014, serving as both Lead Independent Director and chair of the Audit Committee. Board member of the Russell Exchange Traded Funds Trust from 2011 to 2012 and the chair of the Audit Committee. Ms. Freeman is also an inactive Chartered Financial Analyst. | |
Isaiah Harris, Jr.
(Born 1952) | Trustee,
since 2009;
Audit Committee Chair,
since 2019 | Retired. Member of the Advisory Board of CEF of East Central Florida. Chairman of the Board of CIGNA Corporation from 2009 to 2021, and Director from 2005 to 2008. From 2003 to 2011, Director of Deluxe Corporation. Prior thereto, President and CEO of BellSouth Advertising and Publishing Corp. from 2005 to 2007, President and CEO of BellSouth Enterprises from 2004 to 2005 and President of BellSouth Consumer Services from 2000 to 2003. Emeritus member of the Iowa State University Foundation Board of Governors. Emeritus Member of the Advisory board of Iowa State University School of Business. Advisory Board Member, Palm Harbor Academy (private school). Advisory Board Member, Fellowship of Christian Athletes. Mr. Harris is a certified public accountant (inactive status). | |
David F. Larcker
(Born 1950) | | Distinguished Visiting Fellow at the Hoover Institution since 2022. James Irvin Miller Professor of Accounting at the Graduate School of Business (Emeritus), Stanford University, Director of the Corporate Governance Research Initiative and Senior Faculty of The Rock Center for Corporate Governance since 2006. From 2005 to 2008, Professor of Accounting at the Graduate School of Business, Stanford University. Prior thereto, Ernst & Young Professor of Accounting at The Wharton School, University of Pennsylvania from 1985 to 2005. | |
Olivia S. Mitchell
(Born 1953) | | International Foundation of Employee Benefit Plans Professor since 1993, Wharton School of the University of Pennsylvania. Director of Wharton’s Pension Research Council and Boettner Center on Pensions & Retirement Research, and Research Associate at the National Bureau of Economic Research. Previously taught at Cornell University from 1978 to 1993. | |
Timothy J. Penny
(Born 1951) | Trustee,
since 1996;
Chair,
since 2018 | President and Chief Executive Officer of Southern Minnesota Initiative Foundation, a non-profit organization, since 2007. Vice Chair of the Economic Club of Minnesota, since 2007. Co-Chair of the Committee for a Responsible Federal Budget, since 1995. Member of the Board of Trustees of NorthStar Education Finance, Inc., a non-profit organization, from 2007-2022. Senior Fellow of the University of Minnesota Humphrey Institute from 1995 to 2017. | |
* Length of service dates reflect the Trustee’s commencement of service with the Trust’s predecessor entities, where applicable.
# Ms. Freeman will serve as Chair Liaison through June 2024, at which time Ms. Wheelock will assume the role.
†
The Statement of Additional Information includes additional information about the Trustees and is available, without charge, upon request, by calling 1-800-222-8222 or by visiting the website at allspringglobal.com.
32 | Allspring Disciplined U.S. Core Fund
Other information (unaudited)
| Position held and length of service* | Principal occupations during past five years or longer | Current other public company or investment company directorships |
James G. Polisson
(Born 1959) | Trustee,
since 2018; Nominating and Governance Committee Chair, since 2024 | Retired. Chief Marketing Officer, Source (ETF) UK Services, Ltd, from 2015 to 2017. From 2012 to 2015, Principal of The Polisson Group, LLC, a management consulting, corporate advisory and principal investing company. Chief Executive Officer and Managing Director at Russell Investments, Global Exchange Traded Funds from 2010 to 2012. Managing Director of Barclays Global Investors from 1998 to 2010 and Global Chief Marketing Officer for iShares and Barclays Global Investors from 2000 to 2010. Trustee of the San Francisco Mechanics’ Institute, a non- profit organization, from 2013 to 2015. Board member of the Russell Exchange Traded Fund Trust from 2011 to 2012. Director of Barclays Global Investors Holdings Deutschland GmbH from 2006 to 2009. Mr. Polisson is an attorney and has a retired status with the Massachusetts and District of Columbia Bar Associations. | |
Pamela Wheelock
(Born 1959) | Trustee,
since January 2020;
previously Trustee from
January 2018 to
| Retired. Executive and Senior Financial leadership positions in the public, private and nonprofit sectors. Interim President and CEO, McKnight Foundation, 2020. Interim Commissioner, Minnesota Department of Human Services, 2019. Chief Operating Officer, Twin Cities Habitat for Humanity, 2017-2019. Vice President for University Services, University of Minnesota, 2012- 2016. Interim President and CEO, Blue Cross and Blue Shield of Minnesota, 2011-2012. Executive Vice-President and Chief Financial Officer, Minnesota Wild, 2002-2008. Commissioner, Minnesota Department of Finance, 1999-2002. Chair of the Board of Directors of Destination Medical Center Corporation. Board member of the Minnesota Wild Foundation. | |
* Length of service dates reflect the Trustee’s commencement of service with the Trust’s predecessor entities, where applicable.
# Ms. Freeman will serve as Chair Liaison through June 2024, at which time Ms. Wheelock will assume the role.
Allspring Disciplined U.S. Core Fund | 33
Other information (unaudited)
Officers1
| Position held and
length of service | Principal occupations during past five years or longer |
| | President and Chief Executive Officer of Allspring Funds Management, LLC since 2017 and Head of Global Fund Governance of Allspring Global Investments since 2022. Prior thereto, co-president of Galliard Capital Management, LLC, an affiliate of Allspring Funds Management, LLC, from 2019 to 2022 and Head of Affiliated Managers, Allspring Global Investments, from 2014 to 2019 and Executive Vice President responsible for marketing, investments and product development for Allspring Funds Management, LLC, from 2009 to 2014. |
Jeremy DePalma
(Born 1974) | Treasurer,
since 2012
(for certain funds in
the Fund Complex);
since 2021 (for
the remaining funds in the Complex) | Senior Vice President of Allspring Funds Management, LLC since 2009. Senior Vice President of Evergreen Investment Management Company, LLC from 2008 to 2010 and head of the Fund Reporting and Control Team within Fund Administration from 2005 to 2010. |
Christopher Baker
(Born 1976) | Chief Compliance Officer,
since 2022 | Global Chief Compliance Officer for Allspring Global Investments since 2022. Prior thereto, Chief Compliance Officer for State Street Global Advisors from 2018 to 2021. Senior Compliance Officer for the State Street divisions of Alternative Investment Solutions, Sector Solutions, and Global Marketing from 2015 to 2018. From 2010 to 2015 Vice President, Global Head of Investment and Marketing Compliance for State Street Global Advisors. |
Matthew Prasse
(Born 1983) | Chief Legal Officer,
since 2022;
Secretary,
since 2021 | Senior Counsel of the Allspring Legal Department since 2021. Senior Counsel of the Wells Fargo Legal Department from 2018 to 2021. Previously, Counsel for Barings LLC from 2015 to 2018. Prior to joining Barings, Associate at Morgan, Lewis & Bockius LLP from 2008 to 2015. |
1 For those Officers with tenures at Allspring Global Investments and/or Allspring Funds Management, LLC that began prior to 2021, such tenures include years of service during which these businesses/entities were known as Wells Fargo Asset Management and Wells Fargo Funds Management, LLC, respectively.
34 | Allspring Disciplined U.S. Core Fund
This page is intentionally left blank.
This page is intentionally left blank.
For more information
More information about Allspring Funds is available free upon request. To obtain literature, please write, visit the Fund’s website, or call:
Allspring Funds
P.O. Box 219967
Kansas City, MO 64121-9967
Website: allspringglobal.com
Individual investors: 1-800-222-8222
Retail investment professionals: 1-888-877-9275
Institutional investment professionals: 1-800-260-5969
This report and the financial statements contained herein are submitted for the general information of the shareholders of the Fund. If this report is used for promotional purposes, distribution of the report must be accompanied or preceded by a current prospectus. Before investing, please consider the investment objectives, risks, charges, and expenses of the investment. For a current prospectus and, if available, a summary prospectus, containing this information, call 1-800-222-8222 or visit the Fund’s website at allspringglobal.com. Read the prospectus carefully before you invest or send money.
Allspring Global InvestmentsTM is the trade name for the asset management firms of Allspring Global Investments Holdings, LLC, a holding company indirectly owned by certain private funds of GTCR LLC and Reverence Capital Partners, L.P. These firms include but are not limited to Allspring Global Investments, LLC, and Allspring Funds Management, LLC. Certain products managed by Allspring entities are distributed by Allspring Funds Distributor, LLC (a broker-dealer and Member FINRA/SIPC).
This material is for general informational and educational purposes only and is NOT intended to provide investment advice or a recommendation of any kind - including a recommendation for any specific investment, strategy, or plan.
© 2024 Allspring Global Investments Holdings, LLC. All rights reserved.
ALL-02052024-sphuxqoq 03-24
SAR0616 01-24
Allspring Discovery
All Cap Growth Fund
Semi-Annual Report
January 31, 2024
The views expressed and any forward-looking statements are as of January 31, 2024, unless otherwise noted, and are those of the Fund’s portfolio managers and/or Allspring Global Investments. Discussions of individual securities or the markets generally are not intended as individual recommendations. Future events or results may vary significantly from those expressed in any forward-looking statements. The views expressed are subject to change at any time in response to changing circumstances in the market. Allspring Global Investments disclaims any obligation to publicly update or revise any views expressed or forward-looking statements.
Allspring Discovery All Cap Growth Fund | 1
Letter to shareholders (unaudited)
Andrew Owen
President
Allspring Funds
Dear Shareholder:
We are pleased to offer you this semi-annual report for the Allspring Discovery All Cap Growth Fund for the six-month period that ended January 31, 2024. Globally, stocks and bonds experienced high levels of volatility throughout the period. The market was focused on persistently high inflation and the impact of ongoing aggressive central bank rate hikes. Riskier assets rallied as investors anticipated an end to the tight monetary policy despite concerns of a possible recession.
For the period, U.S. stocks, based on the S&P 500 Index,1 returned 6.43%. International stocks, as measured by the MSCI ACWI ex USA Index (Net),2 gained 0.48% while the MSCI EM Index (Net) (USD),3 returned -6.00%. Among bond indexes, the Bloomberg U.S. Aggregate Bond Index4 returned 3.15%, the Bloomberg Global Aggregate ex-USD Index (unhedged)5 gained 1.15%, the Bloomberg Municipal Bond Index6 returned 2.70%, and the ICE BofA U.S. High Yield Index7 gained 6.17%.
Still focused on high inflation and elevated central bank rates, markets were volatile.
The six-month period began with stocks retreating in August after a July rally while monthly bond returns were flat overall. Increased global market volatility reflected unease over the Chinese property market being stressed along with weak Chinese economic data. However, speculation grew over a possible end to the Federal Reserve’s (Fed’s) campaign of interest rate increases or at least a pause in September. U.S. economic data generally remained solid, with resilient job market data and inflation ticking up slightly in August as the annual Consumer Price Index (CPI)8 rose 3.7%. However, the three-month trend for Core CPI9 stood at an annualized 2.4%.
Stocks and bonds both had negative overall returns in September as investors were disappointed by the Fed’s determination not to lower interest rates until it knows it has vanquished persistently high inflation. As of September, the two primary gauges of U.S. inflation—the annual Core Personal Consumption Expenditures Price Index10 and the CPI—both stood at roughly 4%, twice as high as the Fed’s oft-stated 2% target. The month ended with the prospect of yet another U.S. government shutdown, averted at least temporarily but looming later in the year.
1
The S&P 500 Index consists of 500 stocks chosen for market size, liquidity, and industry group representation. It is a market-value-weighted index with each stock’s weight in the index proportionate to its market value. You cannot invest directly in an index.
2
The Morgan Stanley Capital International (MSCI) All Country World Index (ACWI) ex USA Index (Net) is a free-float-adjusted market-capitalization-weighted index that is designed to measure the equity market performance of developed and emerging markets, excluding the U.S. Source: MSCI. MSCI makes no express or implied warranties or representations and shall have no liability whatsoever with respect to any MSCI data contained herein. The MSCI data may not be further redistributed or used as a basis for other indexes or any securities or financial products. This report is not approved, reviewed, or produced by MSCI. You cannot invest directly in an index.
3
The MSCI Emerging Markets (EM) Index (Net) (USD) is a free-float-adjusted market-capitalization-weighted index that is designed to measure the equity market performance of emerging markets. You cannot invest directly in an index.
4
The Bloomberg U.S. Aggregate Bond Index is a broad-based benchmark that measures the investment-grade, U.S.-dollar-denominated, fixed-rate taxable bond market, including Treasuries, government-related and corporate securities, mortgage-backed securities (agency fixed-rate and hybrid adjustable-rate mortgage pass-throughs), asset-backed securities, and commercial mortgage-backed securities. You cannot invest directly in an index.
5
The Bloomberg Global Aggregate ex-USD Index (unhedged) is an unmanaged index that provides a broad-based measure of the global investment-grade fixed-income markets excluding the U.S.-dollar-denominated debt market. You cannot invest directly in an index.
6
The Bloomberg Municipal Bond Index is an unmanaged index composed of long-term tax-exempt bonds with a minimum credit rating of Baa. You cannot invest directly in an index.
7
The ICE BofA U.S. High Yield Index is a market-capitalization-weighted index of domestic and Yankee high yield bonds. The index tracks the performance of high yield securities traded in the U.S. bond market. You cannot invest directly in an index. Copyright 2024. ICE Data Indices, LLC. All rights reserved.
8
The Consumer Price Index (CPI) is a measure of the average change over time in the prices paid by urban consumers for a market basket of consumer goods and services. You cannot invest directly in an index.
9
The Core CPI is a measure of the average change over time in the prices paid by urban consumers for a market basket of consumer goods and services excluding energy and food prices. You cannot invest directly in an index.
10
The Core Personal Consumption Expenditures Price Index (PCE) is a measure of prices that people living in the United States, or those buying on their behalf, pay for goods and services. It is sometimes called the core PCE price index, because two categories that can have price swings – food and energy – are left out to make underlying inflation easier to see. You cannot invest directly in an index.
2 | Allspring Discovery All Cap Growth Fund
Letter to shareholders (unaudited)
October was a tough month for financial markets overall. Key global and domestic indexes all were pushed down by rising geopolitical tensions—particularly the Israel-Hamas conflict—and concerns over the Fed’s “higher for longer” monetary policy. The U.S. 10-year Treasury yield rose above 5% for the first time since 2007. Commodity prices did well as oil prices rallied in response to the prospect of oil supply disruptions from the Middle East. U.S. annualized third quarter GDP was estimated at a healthier-than-anticipated 4.9%. China’s GDP indicated surprisingly strong industrial production and retail sales, offset by ongoing weakness in its real estate sector.
In November, the market mood turned positive as cooling inflation inspired confidence that central banks could hold off on further rate hikes. Overall annual inflation in the U.S. fell to 3.1% in November while 12-month inflation in the U.K. and eurozone eased to 4.6% and 2.4%, respectively—far below their peak levels of mid-2022. Third quarter annualized U.S. GDP growth was raised to an estimated 5.2% while U.S. job totals rose by just below 200,000 in November, indicating a slight cooling of the labor market. All of this fresh evidence added to confidence for a U.S. soft economic landing, leading to a more buoyant mood heading into winter as the Federal Open Market Committee held rates steady at its December meeting.
The broad year-end rally among stocks and bonds that began in November continued through December as investors became more confident that monetary policy would ease in 2024. Supporting the bubbly market mood were a series of reports confirming lower inflationary trends in the U.S. and Europe. During the period, it appeared more likely that the U.S. economy could achieve a soft landing, cooling enough to lower inflation without the pain of a recession. However, by year-end, an expectations gap developed. Capital markets priced in a total of 1.50 percentage points in federal funds rate cuts in 2024, twice as much as the three cuts of 0.25% hinted at by Fed officials.
Financial market performance was mixed in January 2024 as U.S. stocks had modest gains while non-U.S. equities, particularly those in emerging markets, and fixed income assets were held back by central bank pushback on market optimism over rate cuts. Overall, optimism was supported by indications of a soft landing for the U.S. economy. Key data included a surprisingly strong gain of 353,000 jobs in January, an unemployment rate of just 3.7%, and a rise of just 3.1% in the CPI in January. However, that resilience helped push back expectations of a rate cut in March to a more likely second quarter initial move.
Don’t let short-term uncertainty derail long-term investment goals.
Periods of investment uncertainty can present challenges, but experience has taught us that maintaining long-term investment goals can be an effective way to plan for the future. To help you create a sound strategy based on your personal goals and risk tolerance, Allspring Funds offers more than 100 mutual funds spanning a wide range of asset classes and investment styles. Although diversification cannot guarantee an investment profit or prevent losses, we believe it can be an effective way to manage investment risk and potentially smooth out overall portfolio performance. We encourage investors to know their investments and to understand that appropriate levels of risk-taking may unlock opportunities.
Thank you for choosing to invest with Allspring Funds. We appreciate your confidence in us and remain committed to helping you meet your financial needs.
Sincerely,
Andrew Owen
President
Allspring Funds
“ In November, the market mood turned positive as cooling inflation inspired confidence that central banks could hold off on further rate hikes. ”
For further information about your fund, contact your investment professional, visit our website at allspringglobal.com, or call us directly at 1-800-222-8222.
Allspring Discovery All Cap Growth Fund | 3
Letter to shareholders (unaudited)
|
Beginning in July 2024, the Fund will be required by the Securities and Exchange Commission to send shareholders a paper copy of a new tailored shareholder report in place of the full shareholder report that you are now receiving. The tailored shareholder report will contain concise information about the Fund, including certain expense and performance information and fund statistics. If you wish to receive this new tailored shareholder report electronically, please follow the instructions on the back cover of this report. |
Other information that is currently included in the shareholder report, such as the Fund’s financial statements, will be available online and upon request, free of charge, in paper or electronic format. |
4 | Allspring Discovery All Cap Growth Fund
This page is intentionally left blank.
Performance highlights (unaudited)
Performance highlights
| The Fund seeks long-term capital appreciation. |
| Allspring Funds Management, LLC |
| Allspring Global Investments, LLC |
| Michael T. Smith, CFA, Christopher J. Warner, CFA |
Average annual total returns (%) as of January 31, 2024 |
| | | | |
| | | | | | | | | |
| | | | | | | | | |
| | | | | | | | | |
Administrator Class (EOMYX) | | | | | | | | | |
Institutional Class (EKONX) | | | | | | | | | |
| | | | | | | | | |
Russell 3000® Growth Index4 | | | | | | | | | |
Figures quoted represent past performance, which is no guarantee of future results, and do not reflect taxes that a shareholder may pay on an investment in a fund. Investment return and principal value of an investment will fluctuate so that an investor’s shares, when redeemed, may be worth more or less than their original cost. Performance shown without sales charges would be lower if sales charges were reflected. Current performance may be lower or higher than the performance data quoted, which assumes the reinvestment of dividends and capital gains. Current month-end performance is available on the Fund’s website, allspringglobal.com.
Please keep in mind that high double-digit returns were primarily achieved during favorable market conditions. You should not expect that such favorable returns can be consistently achieved. A fund’s performance, especially for short time periods, should not be the sole factor in making your investment decision.
Index returns do not include transaction costs associated with buying and selling securities, any mutual fund fees or expenses, or any taxes. It is not possible to invest directly in an index.
For Class A shares, the maximum front-end sales charge is 5.75%. For Class C shares, the maximum contingent deferred sales charge is 1.00%. Performance including a contingent deferred sales charge assumes the sales charge for the corresponding time period. Administrator Class and Institutional Class shares are sold without a front-end sales charge or contingent deferred sales charge.
|
| Reflects the expense ratios as stated in the most recent prospectuses. The expense ratios shown are subject to change and may differ from the annualized expense ratios shown in the Financial Highlights of this report. |
| The manager has contractually committed through November 30, 2024, to waive fees and/or reimburse expenses to the extent necessary to cap total annual fund operating expenses after fee waivers at 1.24% for Class A, 1.99% for Class C, 1.10% for Administrator Class and 0.85% for Institutional Class. Brokerage commissions, stamp duty fees, interest, taxes, acquired fund fees and expenses (if any), and extraordinary expenses are excluded from the expense caps. Prior to or after the commitment expiration date, the caps may be increased or the commitment to maintain the caps may be terminated only with the approval of the Board of Trustees. Without these caps, the Fund’s returns would have been lower. The expense ratio paid by an investor is the net expense ratio (the total annual fund operating expenses after fee waivers) as stated in the prospectuses. |
| The Russell 3000® Index measures the performance of the 3,000 largest U.S. companies based on total market capitalization, which represents approximately 98% of the investable U.S. equity market. You cannot invest directly in an index. |
| The Russell 3000® Growth Index measures the performance of those Russell 3000® Index companies with higher price/book ratios and higher forecasted growth values. You cannot invest directly in an index. |
Stock values fluctuate in response to the activities of individual companies and general market and economic conditions. Certain investment strategies tend to increase the total risk of an investment (relative to the broader market). This fund is exposed to foreign investment risk and smaller-company securities risk. Consult the Fund’s prospectus for additional information on these and other risks.
CFA® and Chartered Financial Analyst® are trademarks owned by CFA Institute. |
6 | Allspring Discovery All Cap Growth Fund
Performance highlights (unaudited)
Ten largest holdings (%) as of January 31, 20241 |
| |
| |
| |
| |
| |
| |
Chipotle Mexican Grill, Inc. | |
| |
| |
| |
| Figures represent the percentage of the Fund’s net assets. Holdings are subject to change and may have changed since the date specified. |
Sector allocation as of January 31, 20241 |
| Figures represent the percentage of the Fund’s long-term investments. Allocations are subject to change and may have changed since the date specified. |
Allspring Discovery All Cap Growth Fund | 7
Fund expenses (unaudited)
Fund expenses
As a shareholder of the Fund, you incur two types of costs: (1) transaction costs, including sales charges (loads) on purchase payments and contingent deferred sales charges (if any) on redemptions and (2) ongoing costs, including management fees, distribution (12b-1) and/or shareholder servicing fees, and other Fund expenses. This example is intended to help you understand your ongoing costs (in dollars) of investing in the Fund and to compare these costs with the ongoing costs of investing in other mutual funds.
The example is based on an investment of $1,000 invested at the beginning of the six-month period and held for the entire period from August 1, 2023 to January 31, 2024.
Actual expenses
The “Actual” line of the table below provides information about actual account values and actual expenses. You may use the information in this line, together with the amount you invested, to estimate the expenses that you paid over the period. Simply divide your account value by $1,000 (for example, an $8,600 account value divided by $1,000= 8.6), then multiply the result by the number in the “Actual” line under the heading entitled “Expenses paid during period” for your applicable class of shares to estimate the expenses you paid on your account during this period.
Hypothetical example for comparison purposes
The “Hypothetical” line of the table below provides information about hypothetical account values and hypothetical expenses based on the Fund’s actual expense ratio and an assumed rate of return of 5% per year before expenses, which is not the Fund’s actual return. The hypothetical account values and expenses may not be used to estimate the actual ending account balance or expenses you paid for the period. You may use this information to compare the ongoing costs of investing in the Fund and other funds. To do so, compare this 5% hypothetical example with the 5% hypothetical examples that appear in the shareholder reports of the other funds.
Please note that the expenses shown in the table are meant to highlight your ongoing costs only and do not reflect any transactional costs, such as sales charges (loads) and contingent deferred sales charges. Therefore, the “Hypothetical” line of the table is useful in comparing ongoing costs only, and will not help you determine the relative total costs of owning different funds. In addition, if these transactional costs were included, your costs would have been higher.
| Beginning
account value
8-1-2023 | Ending
account value
1-31-2024 | | Annualized net
expense ratio |
| | | | |
| | | | |
Hypothetical (5% return before expenses) | | | | |
| | | | |
| | | | |
Hypothetical (5% return before expenses) | | | | |
| | | | |
| | | | |
Hypothetical (5% return before expenses) | | | | |
| | | | |
| | | | |
Hypothetical (5% return before expenses) | | | | |
| Expenses paid is equal to the annualized net expense ratio of each class multiplied by the average account value over the period, multiplied by 184 divided by 366 (to reflect the one-half-year period). |
8 | Allspring Discovery All Cap Growth Fund
Portfolio of investments—January 31, 2024 (unaudited)
| | | | | |
| | | | | | |
Communication services: 7.87% | | | | | | |
| | | | | | |
| | | | | | |
Interactive media & services: 6.44% | | | | | | |
| | | | | | |
Consumer discretionary: 14.64% | | | | | | |
| | | | | | |
| | | | | | |
| | | | | | |
| | | | | | |
| | | | | | |
| | | | | | |
Hotels, restaurants & leisure: 2.11% | | | | | | |
Chipotle Mexican Grill, Inc.† | | | | | | |
| | | | | | |
| | | | | | |
Textiles, apparel & luxury goods: 1.13% | | | | | | |
lululemon athletica, Inc.† | | | | | | |
| | | | | | |
| | | | | | |
| | | | | | |
| | | | | | |
| | | | | | |
Intercontinental Exchange, Inc. | | | | | | |
Tradeweb Markets, Inc. Class A | | | | | | |
| | | | | | |
Financial services: 6.74% | | | | | | |
| | | | | | |
| | | | | | |
| | | | | | |
| | | | | | |
| | | | | | |
| | | | | | |
| | | | | | |
| | | | | | |
Health care equipment & supplies: 3.77% | | | | | | |
| | | | | | |
Intuitive Surgical, Inc.† | | | | | | |
| | | | | | |
The accompanying notes are an integral part of these financial statements.
Allspring Discovery All Cap Growth Fund | 9
Portfolio of investments—January 31, 2024 (unaudited)
| | | | | |
Health care providers & services: 3.16% | | | | | | |
| | | | | | |
Health care technology: 1.42% | | | | | | |
Veeva Systems, Inc. Class A† | | | | | | |
Life sciences tools & services: 2.46% | | | | | | |
| | | | | | |
| | | | | | |
| | | | | | |
| | | | | | |
| | | | | | |
| | | | | | |
| | | | | | |
| | | | | | |
Commercial services & supplies: 3.41% | | | | | | |
| | | | | | |
| | | | | | |
| | | | | | |
Electrical equipment: 1.06% | | | | | | |
| | | | | | |
Ground transportation: 1.34% | | | | | | |
Old Dominion Freight Line, Inc. | | | | | | |
Industrial conglomerates: 1.57% | | | | | | |
| | | | | | |
| | | | | | |
| | | | | | |
Professional services: 1.02% | | | | | | |
| | | | | | |
Information technology: 36.02% | | | | | | |
Communications equipment: 1.99% | | | | | | |
| | | | | | |
Electronic equipment, instruments & components: 2.17% | | | | | | |
Teledyne Technologies, Inc.† | | | | | | |
Zebra Technologies Corp. Class A† | | | | | | |
| | | | | | |
| | | | | | |
| | | | | | |
| | | | | | |
| | | | | | |
| | | | | | |
The accompanying notes are an integral part of these financial statements.
10 | Allspring Discovery All Cap Growth Fund
Portfolio of investments—January 31, 2024 (unaudited)
| | | | | |
Semiconductors & semiconductor equipment: 5.77% | | | | | | |
Advanced Micro Devices, Inc.† | | | | | | |
| | | | | | |
| | | | | | |
Monolithic Power Systems, Inc. | | | | | | |
| | | | | | |
| | | | | | |
| | | | | | |
Cadence Design Systems, Inc.† | | | | | | |
Crowdstrike Holdings, Inc. Class A† | | | | | | |
| | | | | | |
| | | | | | |
| | | | | | |
| | | | | | |
| | | | | | |
| | | | | | |
| | | | | | |
| | | | | | |
| | | | | | |
| | | | | | |
Specialized REITs : 0.99% | | | | | | |
SBA Communications Corp. Class A | | | | | | |
Total common stocks (Cost $362,705,480) | | | | | | |
| | | | | |
Short-term investments: 1.03% | | | | | | |
Investment companies: 1.03% | | | | | | |
Allspring Government Money Market Fund Select Class♠∞ | | | | | | |
Total short-term investments (Cost $7,651,638) | | | | | | |
Total investments in securities (Cost $370,357,118) | | | | | | |
Other assets and liabilities, net | | | | | | |
| | | | | | |
| Non-income-earning security |
| The issuer of the security is an affiliated person of the Fund as defined in the Investment Company Act of 1940. |
| The rate represents the 7-day annualized yield at period end. |
|
| Real estate investment trust |
The accompanying notes are an integral part of these financial statements.
Allspring Discovery All Cap Growth Fund | 11
Portfolio of investments—January 31, 2024 (unaudited)
Investments in affiliates
An affiliated investment is an investment in which the Fund owns at least 5% of the outstanding voting shares of the issuer or as a result of other relationships, such as the Fund and the issuer having the same investment manager. Transactions with issuers that were affiliates of the Fund at the end of the period were as follows:
| | | | | Net
change in
unrealized
gains
(losses) | | | Income
from
affiliated
securities |
| | | | | | | | |
Allspring Government Money Market Fund Select Class | | | | | | | | |
The accompanying notes are an integral part of these financial statements.
12 | Allspring Discovery All Cap Growth Fund
Statement of assets and liabilities—January 31, 2024 (unaudited)
Financial statements
Statement of assets and liabilities
| |
Investments in unaffiliated securities, at value (cost $362,705,480) | |
Investments in affiliated securities, at value (cost $7,651,638) | |
Receivable for Fund shares sold | |
| |
Prepaid expenses and other assets | |
| |
| |
| |
Payable for Fund shares redeemed | |
Shareholder servicing fees payable | |
Administration fees payable | |
Distribution fees payable | |
Accrued expenses and other liabilities | |
| |
| |
| |
| |
Total distributable earnings | |
| |
Computation of net asset value and offering price per share | |
| |
Shares outstanding–Class A1 | |
Net asset value per share–Class A | |
Maximum offering price per share – Class A2 | |
| |
Shares outstanding–Class C1 | |
Net asset value per share–Class C | |
Net assets–Administrator Class | |
Shares outstanding–Administrator Class1 | |
Net asset value per share–Administrator Class | |
Net assets–Institutional Class | |
Shares outstanding–Institutional Class1 | |
Net asset value per share–Institutional Class | |
1 The Fund has an unlimited number of authorized shares.
2 Maximum offering price is computed as 100/94.25 of net asset value. On investments of $50,000 or more, the offering price is reduced.
The accompanying notes are an integral part of these financial statements.
Allspring Discovery All Cap Growth Fund | 13
Statement of operations—six months ended January 31, 2024 (unaudited)
Statement of operations
| |
Dividends (net of foreign withholdings taxes of $8,006) | |
Income from affiliated securities | |
| |
| |
| |
| |
| |
| |
| |
| |
| |
Shareholder servicing fees | |
| |
| |
| |
| |
| |
Custody and accounting fees | |
| |
| |
Shareholder report expenses | |
Trustees’ fees and expenses | |
| |
| |
Less: Fee waivers and/or expense reimbursements | |
| |
| |
| |
| |
| |
| |
Realized and unrealized gains (losses) on investments | |
Net realized gains (losses) on | |
| |
Foreign currency and foreign currency translations | |
Net realized gains on investments | |
Net change in unrealized gains (losses) on investments | |
Net realized and unrealized gains (losses) on investments | |
Net increase in net assets resulting from operations | |
The accompanying notes are an integral part of these financial statements.
14 | Allspring Discovery All Cap Growth Fund
Statement of changes in net assets
Statement of changes in net assets
|
Six months ended
January 31, 2024 (unaudited) | |
| | | | |
| | | | |
Net realized gains on investments | | | | |
Net change in unrealized gains (losses) on investments | | | | |
Net increase in net assets resulting from operations | | | | |
Distributions to shareholders from | | | | |
Net investment income and net realized gains | | | | |
| | | | |
| | | | |
| | | | |
| | | | |
| | | | |
Total distributions to shareholders | | | | |
Capital share transactions | | | | |
Proceeds from shares sold | | | | |
| | | | |
| | | | |
| | | | |
| | | | |
| | | | |
| | | | |
Reinvestment of distributions | | | | |
| | | | |
| | | | |
| | | | |
| | | | |
| | | | |
| | | | |
Payment for shares redeemed | | | | |
| | | | |
| | | | |
| | | | |
| | | | |
| | | | |
| | | | |
Net decrease in net assets resulting from capital share transactions | | | | |
Total increase (decrease) in net assets | | | | |
| | | | |
| | | | |
| | | | |
1 For the period from August 1, 2022 to June 16, 2023. Effective at the close of business on June 16, 2023, Class R shares were converted to Class A shares and are no longer offered by the Fund.
The accompanying notes are an integral part of these financial statements.
Allspring Discovery All Cap Growth Fund | 15
Financial highlights
(For a share outstanding throughout each period)
| Six months ended
January 31, 2024
(unaudited) | |
| | | | | |
Net asset value, beginning of period | | | | | | |
| | | | | | |
| | | | | | |
Net realized and unrealized gains (losses) on investments | | | | | | |
Total from investment operations | | | | | | |
Distributions to shareholders from | | | | | | |
| | | | | | |
Net asset value, end of period | | | | | | |
| | | | | | |
Ratios to average net assets (annualized) | | | | | | |
| | | | | | |
| | | | | | |
| | | | | | |
| | | | | | |
| | | | | | |
Net assets, end of period (000s omitted) | | | | | | |
| Calculated based upon average shares outstanding |
| Amount is less than $0.005. |
| Total return calculations do not include any sales charges. Returns for periods of less than one year are not annualized. |
| During the year ended July 31, 2021, the Fund received a payment from an affiliate which had a 0.005% impact on the total return. |
The accompanying notes are an integral part of these financial statements.
16 | Allspring Discovery All Cap Growth Fund
(For a share outstanding throughout each period)
| Six months ended
January 31, 2024
(unaudited) | |
| | | | | |
Net asset value, beginning of period | | | | | | |
| | | | | | |
| | | | | | |
Net realized and unrealized gains (losses) on investments | | | | | | |
Total from investment operations | | | | | | |
Distributions to shareholders from | | | | | | |
| | | | | | |
Net asset value, end of period | | | | | | |
| | | | | | |
Ratios to average net assets (annualized) | | | | | | |
| | | | | | |
| | | | | | |
| | | | | | |
| | | | | | |
| | | | | | |
Net assets, end of period (000s omitted) | | | | | | |
| Calculated based upon average shares outstanding |
| Total return calculations do not include any sales charges. Returns for periods of less than one year are not annualized. |
| During the year ended July 31, 2021, the Fund received a payment from an affiliate which had a 0.62% impact on the total return. |
The accompanying notes are an integral part of these financial statements.
Allspring Discovery All Cap Growth Fund | 17
(For a share outstanding throughout each period)
| Six months ended
January 31, 2024
(unaudited) | |
| | | | | |
Net asset value, beginning of period | | | | | | |
| | | | | | |
Net realized and unrealized gains (losses) on investments | | | | | | |
Total from investment operations | | | | | | |
Distributions to shareholders from | | | | | | |
| | | | | | |
Net asset value, end of period | | | | | | |
| | | | | | |
Ratios to average net assets (annualized) | | | | | | |
| | | | | | |
| | | | | | |
| | | | | | |
| | | | | | |
| | | | | | |
Net assets, end of period (000s omitted) | | | | | | |
| Calculated based upon average shares outstanding |
| Returns for periods of less than one year are not annualized. |
The accompanying notes are an integral part of these financial statements.
18 | Allspring Discovery All Cap Growth Fund
(For a share outstanding throughout each period)
| Six months ended
January 31, 2024
(unaudited) | |
| | | | | |
Net asset value, beginning of period | | | | | | |
| | | | | | |
Net realized and unrealized gains (losses) on investments | | | | | | |
Total from investment operations | | | | | | |
Distributions to shareholders from | | | | | | |
| | | | | | |
Net asset value, end of period | | | | | | |
| | | | | | |
Ratios to average net assets (annualized) | | | | | | |
| | | | | | |
| | | | | | |
| | | | | | |
| | | | | | |
| | | | | | |
Net assets, end of period (000s omitted) | | | | | | |
| Calculated based upon average shares outstanding |
| Returns for periods of less than one year are not annualized. |
The accompanying notes are an integral part of these financial statements.
Allspring Discovery All Cap Growth Fund | 19
Notes to financial statements (unaudited)
Notes to financial statements
Allspring Funds Trust (the “Trust”), a Delaware statutory trust organized on March 10, 1999, is an open-end management investment company registered under the Investment Company Act of 1940, as amended (the “1940 Act”). As an investment company, the Trust follows the accounting and reporting guidance in Financial Accounting Standards Board (“FASB”) Accounting Standards Codification Topic 946, Financial Services – Investment Companies. These financial statements report on the Allspring Discovery All Cap Growth Fund (the “Fund”) which is a diversified series of the Trust.
2.
SIGNIFICANT ACCOUNTING POLICIES
The following significant accounting policies, which are consistently followed in the preparation of the financial statements of the Fund, are in conformity with U.S. generally accepted accounting principles which require management to make estimates and assumptions that affect the reported amounts of assets and liabilities, disclosure of contingent assets and liabilities at the date of the financial statements, and the reported amounts of income and expenses during the reporting period. Actual results could differ from those estimates.
Securities valuation
All investments are valued each business day as of the close of regular trading on the New York Stock Exchange (generally 4 p.m. Eastern Time), although the Fund may deviate from this calculation time under unusual or unexpected circumstances.
Equity securities and exchange-traded funds that are listed on a foreign or domestic exchange or market are valued at the official closing price or, if none, the last sales price.
Investments in registered open-end investment companies (other than those listed on a foreign or domestic exchange or market) are valued at net asset value.
Investments which are not valued using the methods discussed above are valued at their fair value, as determined in good faith by Allspring Funds Management, LLC (“Allspring Funds Management”), which was named the valuation designee by the Board of Trustees. As the valuation designee, Allspring Funds Management is responsible for day-to-day valuation activities for the Allspring Funds. In connection with these responsibilities, Allspring Funds Management has established a Valuation Committee and has delegated to it the authority to take any actions regarding the valuation of portfolio securities that the Valuation Committee deems necessary or appropriate, including determining the fair value of portfolio securities. On a quarterly basis, the Board of Trustees receives reports of valuation actions taken by the Valuation Committee. On at least an annual basis, the Board of Trustees receives an assessment of the adequacy and effectiveness of Allspring Funds Management’s process for determining the fair value of the portfolio of investments.
Foreign currency translation
The accounting records of the Fund are maintained in U.S. dollars. The values of other assets and liabilities denominated in foreign currencies are translated into U.S. dollars at rates provided by an independent foreign currency pricing source at a time each business day specified by the Valuation Committee. Purchases and sales of securities, and income and expenses are converted at the rate of exchange on the respective dates of such transactions. Net realized foreign exchange gains or losses arise from sales of foreign currencies, currency gains or losses realized between the trade and settlement dates on securities transactions, and the difference between the amounts of dividends, interest and foreign withholding taxes recorded and the U.S. dollar equivalent of the amounts actually paid or received. Net unrealized foreign exchange gains and losses arise from changes in the fair value of assets and liabilities other than investments in securities resulting from changes in exchange rates. The changes in net assets arising from changes in exchange rates of securities and the changes in net assets resulting from changes in market prices of securities are not separately presented. Such changes are included in net realized and unrealized gains or losses from investments.
Security transactions and income recognition
Securities transactions are recorded on a trade date basis. Realized gains or losses are recorded on the basis of identified cost.
Dividend income is recognized on the ex-dividend date. Dividend income is recorded net of foreign taxes withheld where recovery of such taxes is not assured.
Interest earned on cash balances held at the custodian is recorded as interest income.
Distributions received from REIT investments may be characterized as ordinary income, capital gains, or a return of capital to the Fund based on information provided by the REIT. The proper characterization of REIT distributions is generally not known until after the end of each calendar year. As such, estimates may be used in reporting the character of income and distributions for financial statement purposes.
Distributions to shareholders
Distributions to shareholders from net investment income and any net realized gains are recorded on the ex-dividend date and paid at least annually. Such distributions are determined in accordance with income tax regulations and may differ from U.S. generally accepted accounting principles. Dividend sources are estimated at the time of declaration. The tax character of distributions is determined as of the Fund’s fiscal year end. Therefore, a portion of the Fund’s distributions made prior to the Fund’s fiscal year end may be categorized as a tax return of capital at year end.
20 | Allspring Discovery All Cap Growth Fund
Notes to financial statements (unaudited)
Federal and other taxes
The Fund intends to continue to qualify as a regulated investment company by distributing substantially all of its investment company taxable income and any net realized capital gains (after reduction for capital loss carryforwards) sufficient to relieve it from all, or substantially all, federal income taxes. Accordingly, no provision for federal income taxes was required.
The Fund’s income and federal excise tax returns and all financial records supporting those returns for the prior three fiscal years are subject to examination by the federal and Delaware revenue authorities. Management has analyzed the Fund’s tax positions taken on federal, state, and foreign tax returns, as applicable, for all open tax years and does not believe that there are any uncertain tax positions that require recognition of a tax liability.
As of January 31, 2024, the aggregate cost of all investments for federal income tax purposes was $370,620,679 and the unrealized gains (losses) consisted of:
As of July 31, 2023, the Fund had a qualified late-year ordinary loss of $2,601,052 which was recognized on the first day of the current fiscal year.
Class allocations
The separate classes of shares offered by the Fund differ principally in applicable sales charges, distribution, shareholder servicing, and administration fees. Class specific expenses are charged directly to that share class. Investment income, common fund-level expenses, and realized and unrealized gains (losses) on investments are allocated daily to each class of shares based on the relative proportion of net assets of each class.
3.
FAIR VALUATION MEASUREMENTS
Fair value measurements of investments are determined within a framework that has established a fair value hierarchy based upon the various data inputs utilized in determining the value of the Fund’s investments. The three-level hierarchy gives the highest priority to unadjusted quoted prices in active markets for identical assets or liabilities (Level 1) and the lowest priority to unobservable inputs (Level 3). The Fund’s investments are classified within the fair value hierarchy based on the lowest level of input that is significant to the fair value measurement. The inputs are summarized into three broad levels as follows:
•Level 1—quoted prices in active markets for identical securities
•Level 2—other significant observable inputs (including quoted prices for similar securities, interest rates, prepayment speeds, credit risk, etc.)
•Level 3—significant unobservable inputs (including the Fund’s own assumptions in determining the fair value of investments)
The inputs or methodologies used for valuing investments in securities are not necessarily an indication of the risk associated with investing in those securities.
The following is a summary of the inputs used in valuing the Fund’s assets and liabilities as of January 31, 2024:
| | Other significant
observable inputs
(Level 2) | Significant
unobservable inputs
(Level 3) | |
| | | | |
| | | | |
| | | | |
| | | | |
| | | | |
| | | | |
| | | | |
| | | | |
| | | | |
| | | | |
| | | | |
| | | | |
| | | | |
| | | | |
| | | | |
Additional sector, industry or geographic detail, if any, is included in the Portfolio of Investments.
Allspring Discovery All Cap Growth Fund | 21
Notes to financial statements (unaudited)
At January 31, 2024, the Fund did not have any transfers into/out of Level 3.
4.
TRANSACTIONS WITH AFFILIATES
Management fee
Allspring Funds Management, a wholly owned subsidiary of Allspring Global Investments Holdings, LLC, a holding company indirectly owned by certain private funds of GTCR LLC and Reverence Capital Partners, L.P., is the manager of the Fund and provides advisory and fund-level administrative services under an investment management agreement. Under the investment management agreement, Allspring Funds Management is responsible for, among other services, implementing the investment objectives and strategies of the Fund, supervising the subadviser and providing fund-level administrative services in connection with the Fund’s operations. As compensation for its services under the investment management agreement, Allspring Funds Management is entitled to receive a management fee at the following annual rate based on the Fund’s average daily net assets:
For the six months ended January 31, 2024, the management fee was equivalent to an annual rate of 0.79% of the Fund’s average daily net assets.
Allspring Funds Management has retained the services of a subadviser to provide daily portfolio management to the Fund. The fee for subadvisory services is borne by Allspring Funds Management. Allspring Global Investments, LLC, an affiliate of Allspring Funds Management and a wholly owned subsidiary of Allspring Global Investments Holdings, LLC, is the subadviser to the Fund and is entitled to receive a fee from Allspring Funds Management at an annual rate starting at 0.45% and declining to 0.30% as the average daily net assets of the Fund increase.
Administration fees
Under a class-level administration agreement, Allspring Funds Management provides class-level administrative services to the Fund, which includes paying fees and expenses for services provided by the transfer agent, sub-transfer agents, omnibus account servicers and record-keepers. As compensation for its services under the class-level administration agreement, Allspring Funds Management receives an annual fee which is calculated based on the average daily net assets of each class as follows:
| Class-level
administration fee |
| |
| |
| |
| |
Waivers and/or expense reimbursements
Allspring Funds Management has contractually committed to waive and/or reimburse management and administration fees to the extent necessary to maintain certain net operating expense ratios for the Fund. When each class of the Fund has exceeded its expense cap, Allspring Funds Management will waive fees and/or reimburse expenses from fund-level expenses on a proportionate basis and then from class specific expenses. When only certain classes exceed their expense caps, waivers and/or reimbursements are applied against class specific expenses before fund-level expenses. Allspring Funds Management has contractually committed through November 30, 2024 to waive fees and/or reimburse expenses to the extent necessary to cap the Fund’s expenses. Prior to or after the commitment expiration date, the cap may be increased or the commitment to maintain the cap may be terminated only with the approval of the Board of Trustees. As of January 31, 2024, the contractual expense caps are as follows:
22 | Allspring Discovery All Cap Growth Fund
Notes to financial statements (unaudited)
Distribution fees
The Trust has adopted a distribution plan for Class C shares pursuant to Rule 12b-1 under the 1940 Act. Distribution fees are charged to Class C shares and paid to Allspring Funds Distributor, LLC (“Allspring Funds Distributor”), the principal underwriter, an affiliate of Allspring Funds Management, at an annual rate up to 0.75% of the average daily net assets of Class C shares.
In addition, Allspring Funds Distributor is entitled to receive the front-end sales charge from the purchase of Class A shares and a contingent deferred sales charge on the redemption of certain Class A shares. Allspring Funds Distributor is also entitled to receive the contingent deferred sales charges from redemptions of Class C shares. For the six months ended January 31, 2024, Allspring Funds Distributor received $3,750 from the sale of Class A shares and $256 in contingent deferred sales charges from redemptions of Class A shares. No contingent deferred sales charges were incurred by Class C shares for the six months ended January 31, 2024.
Shareholder servicing fees
The Trust has entered into contracts with one or more shareholder servicing agents, whereby Class A, Class C and Administrator Class are charged a fee at an annual rate up to 0.25% of the average daily net assets of each respective class. A portion of these total shareholder servicing fees were paid to affiliates of the Fund.
Interfund transactions
The Fund may purchase or sell portfolio investment securities to certain affiliates pursuant to Rule 17a-7 under the 1940 Act and under procedures adopted by the Board of Trustees. The procedures have been designed to ensure that these interfund transactions, which do not incur broker commissions, are effected at current market prices. Pursuant to these procedures, the Fund did not have any interfund transactions during the six months ended January 31, 2024.
5.
INVESTMENT PORTFOLIO TRANSACTIONS
Purchases and sales of investments, excluding U.S. government obligations (if any) and short-term securities, for the six months ended January 31, 2024 were $125,020,339 and $175,461,778, respectively.
The Trust (excluding the money market funds), Allspring Master Trust and Allspring Variable Trust are parties to a $350,000,000 revolving credit agreement whereby the Fund is permitted to use bank borrowings for temporary or emergency purposes, such as to fund shareholder redemption requests. Interest under the credit agreement is charged to the Fund based on borrowing rate equal to the higher of the Federal Funds rate or the overnight bank funding rate in effect on that day plus a spread. In addition, an annual commitment fee based on the unused balance is allocated to each participating fund.
For the six months ended January 31, 2024, there were no borrowings by the Fund under the agreement.
As of the end of the period, the Fund concentrated its portfolio of investments in the information technology sector. A fund that invests a substantial portion of its assets in any sector may be more affected by changes in that sector than would be a fund whose investments are not heavily weighted in any sector.
Under the Fund’s organizational documents, the officers and Trustees have been granted certain indemnification rights against certain liabilities that may arise out of performance of their duties to the Fund. The Fund has entered into a separate agreement with each Trustee that converts indemnification rights currently existing under the Fund’s organizational documents into contractual rights that cannot be changed in the future without the consent of the Trustee. Additionally, in the normal course of business, the Fund may enter into contracts with service providers that contain a variety of indemnification clauses. The Fund’s maximum exposure under these arrangements is dependent on future claims that may be made against the Fund and, therefore, cannot be estimated.
Allspring Discovery All Cap Growth Fund | 23
Other information (unaudited)
Other information
Proxy voting information
A description of the policies and procedures used to determine how to vote proxies relating to portfolio securities is available without charge, upon request, by calling 1-866-259-3305, visiting our website at allspringglobal.com, or visiting the SEC website at sec.gov. Information regarding how the proxies related to portfolio securities were voted during the most recent 12-month period ended June 30 is available on the website at allspringglobal.com or by visiting the SEC website at sec.gov.
Quarterly portfolio holdings information
The Fund files its complete schedule of portfolio holdings with the SEC for the first and third quarters of each fiscal year as an exhibit to its reports on Form N-PORT. Shareholders may view the filed Form N-PORT by visiting the SEC website at sec.gov.
24 | Allspring Discovery All Cap Growth Fund
Other information (unaudited)
Board of trustees and officers
Each of the Trustees and Officers listed in the table below acts in identical capacities for each fund in the Allspring family of funds, which consists of 116 mutual funds comprising the Allspring Funds Trust, Allspring Variable Trust, Allspring Master Trust and four closed-end funds (collectively the “Fund Complex”). This table should be read in conjunction with the Prospectus and the Statement of Additional Information†. The mailing address of each Trustee and Officer is 1415 Vantage Park Drive, 3rd Floor, Charlotte, NC 28203. Each Trustee and Officer serves an indefinite term, however, each Trustee serves such term until reaching the mandatory retirement age established by the Trustees.
Independent Trustees
| | Principal occupations during past five years or longer | Current other
public company or
investment
company
directorships |
William R. Ebsworth
(Born 1957) | | Retired. From 1984 to 2013, equities analyst, portfolio manager, research director and chief investment officer at Fidelity Management and Research Company in Boston, Tokyo, and Hong Kong, and retired in 2013 as Chief Investment Officer of Fidelity Strategic Advisers, Inc. where he led a team of investment professionals managing client assets. Prior thereto, Board member of Hong Kong Securities Clearing Co., Hong Kong Options Clearing Corp., the Thailand International Fund, Ltd., Fidelity Investments Life Insurance Company, and Empire Fidelity Investments Life Insurance Company. Serves on the Investment Company Institute’s Board of Governors since 2022 and Executive Committee since 2023 as well as the Vice Chairman of the Governing Council of the Independent Directors Council since 2023. Audit Committee Chair and Investment Committee Chair of the Vincent Memorial Hospital Foundation (non-profit organization). Mr. Ebsworth is a CFA charterholder. | |
Jane A. Freeman
(Born 1953) | Trustee,
since 2015;
Chair Liaison,
| Retired. From 2012 to 2014 and 1999 to 2008, Chief Financial Officer of Scientific Learning Corporation. From 2008 to 2012, Ms. Freeman provided consulting services related to strategic business projects. Prior to 1999, Portfolio Manager at Rockefeller & Co. and Scudder, Stevens & Clark. Board member of the Harding Loevner Funds from 1996 to 2014, serving as both Lead Independent Director and chair of the Audit Committee. Board member of the Russell Exchange Traded Funds Trust from 2011 to 2012 and the chair of the Audit Committee. Ms. Freeman is also an inactive Chartered Financial Analyst. | |
Isaiah Harris, Jr.
(Born 1952) | Trustee,
since 2009;
Audit Committee Chair,
since 2019 | Retired. Member of the Advisory Board of CEF of East Central Florida. Chairman of the Board of CIGNA Corporation from 2009 to 2021, and Director from 2005 to 2008. From 2003 to 2011, Director of Deluxe Corporation. Prior thereto, President and CEO of BellSouth Advertising and Publishing Corp. from 2005 to 2007, President and CEO of BellSouth Enterprises from 2004 to 2005 and President of BellSouth Consumer Services from 2000 to 2003. Emeritus member of the Iowa State University Foundation Board of Governors. Emeritus Member of the Advisory board of Iowa State University School of Business. Advisory Board Member, Palm Harbor Academy (private school). Advisory Board Member, Fellowship of Christian Athletes. Mr. Harris is a certified public accountant (inactive status). | |
David F. Larcker
(Born 1950) | | Distinguished Visiting Fellow at the Hoover Institution since 2022. James Irvin Miller Professor of Accounting at the Graduate School of Business (Emeritus), Stanford University, Director of the Corporate Governance Research Initiative and Senior Faculty of The Rock Center for Corporate Governance since 2006. From 2005 to 2008, Professor of Accounting at the Graduate School of Business, Stanford University. Prior thereto, Ernst & Young Professor of Accounting at The Wharton School, University of Pennsylvania from 1985 to 2005. | |
Olivia S. Mitchell
(Born 1953) | | International Foundation of Employee Benefit Plans Professor since 1993, Wharton School of the University of Pennsylvania. Director of Wharton’s Pension Research Council and Boettner Center on Pensions & Retirement Research, and Research Associate at the National Bureau of Economic Research. Previously taught at Cornell University from 1978 to 1993. | |
Timothy J. Penny
(Born 1951) | Trustee,
since 1996;
Chair,
since 2018 | President and Chief Executive Officer of Southern Minnesota Initiative Foundation, a non-profit organization, since 2007. Vice Chair of the Economic Club of Minnesota, since 2007. Co-Chair of the Committee for a Responsible Federal Budget, since 1995. Member of the Board of Trustees of NorthStar Education Finance, Inc., a non-profit organization, from 2007-2022. Senior Fellow of the University of Minnesota Humphrey Institute from 1995 to 2017. | |
* Length of service dates reflect the Trustee’s commencement of service with the Trust’s predecessor entities, where applicable.
# Ms. Freeman will serve as Chair Liaison through June 2024, at which time Ms. Wheelock will assume the role.
†
The Statement of Additional Information includes additional information about the Trustees and is available, without charge, upon request, by calling 1-800-222-8222 or by visiting the website at allspringglobal.com.
Allspring Discovery All Cap Growth Fund | 25
Other information (unaudited)
| Position held and length of service* | Principal occupations during past five years or longer | Current other public company or investment company directorships |
James G. Polisson
(Born 1959) | Trustee,
since 2018; Nominating and Governance Committee Chair, since 2024 | Retired. Chief Marketing Officer, Source (ETF) UK Services, Ltd, from 2015 to 2017. From 2012 to 2015, Principal of The Polisson Group, LLC, a management consulting, corporate advisory and principal investing company. Chief Executive Officer and Managing Director at Russell Investments, Global Exchange Traded Funds from 2010 to 2012. Managing Director of Barclays Global Investors from 1998 to 2010 and Global Chief Marketing Officer for iShares and Barclays Global Investors from 2000 to 2010. Trustee of the San Francisco Mechanics’ Institute, a non- profit organization, from 2013 to 2015. Board member of the Russell Exchange Traded Fund Trust from 2011 to 2012. Director of Barclays Global Investors Holdings Deutschland GmbH from 2006 to 2009. Mr. Polisson is an attorney and has a retired status with the Massachusetts and District of Columbia Bar Associations. | |
Pamela Wheelock
(Born 1959) | Trustee,
since January 2020;
previously Trustee from
January 2018 to
| Retired. Executive and Senior Financial leadership positions in the public, private and nonprofit sectors. Interim President and CEO, McKnight Foundation, 2020. Interim Commissioner, Minnesota Department of Human Services, 2019. Chief Operating Officer, Twin Cities Habitat for Humanity, 2017-2019. Vice President for University Services, University of Minnesota, 2012- 2016. Interim President and CEO, Blue Cross and Blue Shield of Minnesota, 2011-2012. Executive Vice-President and Chief Financial Officer, Minnesota Wild, 2002-2008. Commissioner, Minnesota Department of Finance, 1999-2002. Chair of the Board of Directors of Destination Medical Center Corporation. Board member of the Minnesota Wild Foundation. | |
* Length of service dates reflect the Trustee’s commencement of service with the Trust’s predecessor entities, where applicable.
# Ms. Freeman will serve as Chair Liaison through June 2024, at which time Ms. Wheelock will assume the role.
26 | Allspring Discovery All Cap Growth Fund
Other information (unaudited)
Officers1
| Position held and
length of service | Principal occupations during past five years or longer |
| | President and Chief Executive Officer of Allspring Funds Management, LLC since 2017 and Head of Global Fund Governance of Allspring Global Investments since 2022. Prior thereto, co-president of Galliard Capital Management, LLC, an affiliate of Allspring Funds Management, LLC, from 2019 to 2022 and Head of Affiliated Managers, Allspring Global Investments, from 2014 to 2019 and Executive Vice President responsible for marketing, investments and product development for Allspring Funds Management, LLC, from 2009 to 2014. |
Jeremy DePalma
(Born 1974) | Treasurer,
since 2012
(for certain funds in
the Fund Complex);
since 2021 (for
the remaining funds in the Complex) | Senior Vice President of Allspring Funds Management, LLC since 2009. Senior Vice President of Evergreen Investment Management Company, LLC from 2008 to 2010 and head of the Fund Reporting and Control Team within Fund Administration from 2005 to 2010. |
Christopher Baker
(Born 1976) | Chief Compliance Officer,
since 2022 | Global Chief Compliance Officer for Allspring Global Investments since 2022. Prior thereto, Chief Compliance Officer for State Street Global Advisors from 2018 to 2021. Senior Compliance Officer for the State Street divisions of Alternative Investment Solutions, Sector Solutions, and Global Marketing from 2015 to 2018. From 2010 to 2015 Vice President, Global Head of Investment and Marketing Compliance for State Street Global Advisors. |
Matthew Prasse
(Born 1983) | Chief Legal Officer,
since 2022;
Secretary,
since 2021 | Senior Counsel of the Allspring Legal Department since 2021. Senior Counsel of the Wells Fargo Legal Department from 2018 to 2021. Previously, Counsel for Barings LLC from 2015 to 2018. Prior to joining Barings, Associate at Morgan, Lewis & Bockius LLP from 2008 to 2015. |
1 For those Officers with tenures at Allspring Global Investments and/or Allspring Funds Management, LLC that began prior to 2021, such tenures include years of service during which these businesses/entities were known as Wells Fargo Asset Management and Wells Fargo Funds Management, LLC, respectively.
Allspring Discovery All Cap Growth Fund | 27
This page is intentionally left blank.
For more information
More information about Allspring Funds is available free upon request. To obtain literature, please write, visit the Fund’s website, or call:
Allspring Funds
P.O. Box 219967
Kansas City, MO 64121-9967
Website: allspringglobal.com
Individual investors: 1-800-222-8222
Retail investment professionals: 1-888-877-9275
Institutional investment professionals: 1-800-260-5969
This report and the financial statements contained herein are submitted for the general information of the shareholders of the Fund. If this report is used for promotional purposes, distribution of the report must be accompanied or preceded by a current prospectus. Before investing, please consider the investment objectives, risks, charges, and expenses of the investment. For a current prospectus and, if available, a summary prospectus, containing this information, call 1-800-222-8222 or visit the Fund’s website at allspringglobal.com. Read the prospectus carefully before you invest or send money.
Allspring Global InvestmentsTM is the trade name for the asset management firms of Allspring Global Investments Holdings, LLC, a holding company indirectly owned by certain private funds of GTCR LLC and Reverence Capital Partners, L.P. These firms include but are not limited to Allspring Global Investments, LLC, and Allspring Funds Management, LLC. Certain products managed by Allspring entities are distributed by Allspring Funds Distributor, LLC (a broker-dealer and Member FINRA/SIPC).
This material is for general informational and educational purposes only and is NOT intended to provide investment advice or a recommendation of any kind - including a recommendation for any specific investment, strategy, or plan.
© 2024 Allspring Global Investments Holdings, LLC. All rights reserved.
ALL-02052024-x5itlwlh 03-24
SAR0419 01-24
Allspring Discovery Large Cap Growth Fund
Semi-Annual Report
January 31, 2024
The views expressed and any forward-looking statements are as of January 31, 2024, unless otherwise noted, and are those of the Fund’s portfolio managers and/or Allspring Global Investments. Discussions of individual securities or the markets generally are not intended as individual recommendations. Future events or results may vary significantly from those expressed in any forward-looking statements. The views expressed are subject to change at any time in response to changing circumstances in the market. Allspring Global Investments disclaims any obligation to publicly update or revise any views expressed or forward-looking statements.
Allspring Discovery Large Cap Growth Fund | 1
Letter to shareholders (unaudited)
Andrew Owen
President
Allspring Funds
Dear Shareholder:
We are pleased to offer you this semi-annual report for the Allspring Discovery Large Cap Growth Fund for the six-month period that ended January 31, 2024. Globally, stocks and bonds experienced high levels of volatility throughout the period. The market was focused on persistently high inflation and the impact of ongoing aggressive central bank rate hikes. Riskier assets rallied as investors anticipated an end to the tight monetary policy despite concerns of a possible recession.
For the period, U.S. stocks, based on the S&P 500 Index,1 returned 6.43%. International stocks, as measured by the MSCI ACWI ex USA Index (Net),2 gained 0.48% while the MSCI EM Index (Net) (USD),3 returned -6.00%. Among bond indexes, the Bloomberg U.S. Aggregate Bond Index4 returned 3.15%, the Bloomberg Global Aggregate ex-USD Index (unhedged)5 gained 1.15%, the Bloomberg Municipal Bond Index6 returned 2.70%, and the ICE BofA U.S. High Yield Index7 gained 6.17%.
Still focused on high inflation and elevated central bank rates, markets were volatile.
The six-month period began with stocks retreating in August after a July rally while monthly bond returns were flat overall. Increased global market volatility reflected unease over the Chinese property market being stressed along with weak Chinese economic data. However, speculation grew over a possible end to the Federal Reserve’s (Fed’s) campaign of interest rate increases or at least a pause in September. U.S. economic data generally remained solid, with resilient job market data and inflation ticking up slightly in August as the annual Consumer Price Index (CPI)8 rose 3.7%. However, the three-month trend for Core CPI9 stood at an annualized 2.4%.
Stocks and bonds both had negative overall returns in September as investors were disappointed by the Fed’s determination not to lower interest rates until it knows it has vanquished persistently high inflation. As of September, the two primary gauges of U.S. inflation—the annual Core Personal Consumption Expenditures Price Index10 and the CPI—both stood at roughly 4%, twice as high as the Fed’s oft-stated 2% target. The month ended with the prospect of yet another U.S. government shutdown, averted at least temporarily but looming later in the year.
1
The S&P 500 Index consists of 500 stocks chosen for market size, liquidity, and industry group representation. It is a market-value-weighted index with each stock’s weight in the index proportionate to its market value. You cannot invest directly in an index.
2
The Morgan Stanley Capital International (MSCI) All Country World Index (ACWI) ex USA Index (Net) is a free-float-adjusted market-capitalization-weighted index that is designed to measure the equity market performance of developed and emerging markets, excluding the U.S. Source: MSCI. MSCI makes no express or implied warranties or representations and shall have no liability whatsoever with respect to any MSCI data contained herein. The MSCI data may not be further redistributed or used as a basis for other indexes or any securities or financial products. This report is not approved, reviewed, or produced by MSCI. You cannot invest directly in an index.
3
The MSCI Emerging Markets (EM) Index (Net) (USD) is a free-float-adjusted market-capitalization-weighted index that is designed to measure the equity market performance of emerging markets. You cannot invest directly in an index.
4
The Bloomberg U.S. Aggregate Bond Index is a broad-based benchmark that measures the investment-grade, U.S.-dollar-denominated, fixed-rate taxable bond market, including Treasuries, government-related and corporate securities, mortgage-backed securities (agency fixed-rate and hybrid adjustable-rate mortgage pass-throughs), asset-backed securities, and commercial mortgage-backed securities. You cannot invest directly in an index.
5
The Bloomberg Global Aggregate ex-USD Index (unhedged) is an unmanaged index that provides a broad-based measure of the global investment-grade fixed-income markets excluding the U.S.-dollar-denominated debt market. You cannot invest directly in an index.
6
The Bloomberg Municipal Bond Index is an unmanaged index composed of long-term tax-exempt bonds with a minimum credit rating of Baa. You cannot invest directly in an index.
7
The ICE BofA U.S. High Yield Index is a market-capitalization-weighted index of domestic and Yankee high yield bonds. The index tracks the performance of high yield securities traded in the U.S. bond market. You cannot invest directly in an index. Copyright 2024. ICE Data Indices, LLC. All rights reserved.
8
The Consumer Price Index (CPI) is a measure of the average change over time in the prices paid by urban consumers for a market basket of consumer goods and services. You cannot invest directly in an index.
9
The Core CPI is a measure of the average change over time in the prices paid by urban consumers for a market basket of consumer goods and services excluding energy and food prices. You cannot invest directly in an index.
10
The Core Personal Consumption Expenditures Price Index (PCE) is a measure of prices that people living in the United States, or those buying on their behalf, pay for goods and services. It is sometimes called the core PCE price index, because two categories that can have price swings – food and energy – are left out to make underlying inflation easier to see. You cannot invest directly in an index.
2 | Allspring Discovery Large Cap Growth Fund
Letter to shareholders (unaudited)
October was a tough month for financial markets overall. Key global and domestic indexes all were pushed down by rising geopolitical tensions—particularly the Israel-Hamas conflict—and concerns over the Fed’s “higher for longer” monetary policy. The U.S. 10-year Treasury yield rose above 5% for the first time since 2007. Commodity prices did well as oil prices rallied in response to the prospect of oil supply disruptions from the Middle East. U.S. annualized third quarter GDP was estimated at a healthier-than-anticipated 4.9%. China’s GDP indicated surprisingly strong industrial production and retail sales, offset by ongoing weakness in its real estate sector.
In November, the market mood turned positive as cooling inflation inspired confidence that central banks could hold off on further rate hikes. Overall annual inflation in the U.S. fell to 3.1% in November while 12-month inflation in the U.K. and eurozone eased to 4.6% and 2.4%, respectively—far below their peak levels of mid-2022. Third quarter annualized U.S. GDP growth was raised to an estimated 5.2% while U.S. job totals rose by just below 200,000 in November, indicating a slight cooling of the labor market. All of this fresh evidence added to confidence for a U.S. soft economic landing, leading to a more buoyant mood heading into winter as the Federal Open Market Committee held rates steady at its December meeting.
The broad year-end rally among stocks and bonds that began in November continued through December as investors became more confident that monetary policy would ease in 2024. Supporting the bubbly market mood were a series of reports confirming lower inflationary trends in the U.S. and Europe. During the period, it appeared more likely that the U.S. economy could achieve a soft landing, cooling enough to lower inflation without the pain of a recession. However, by year-end, an expectations gap developed. Capital markets priced in a total of 1.50 percentage points in federal funds rate cuts in 2024, twice as much as the three cuts of 0.25% hinted at by Fed officials.
Financial market performance was mixed in January 2024 as U.S. stocks had modest gains while non-U.S. equities, particularly those in emerging markets, and fixed income assets were held back by central bank pushback on market optimism over rate cuts. Overall, optimism was supported by indications of a soft landing for the U.S. economy. Key data included a surprisingly strong gain of 353,000 jobs in January, an unemployment rate of just 3.7%, and a rise of just 3.1% in the CPI in January. However, that resilience helped push back expectations of a rate cut in March to a more likely second quarter initial move.
Don’t let short-term uncertainty derail long-term investment goals.
Periods of investment uncertainty can present challenges, but experience has taught us that maintaining long-term investment goals can be an effective way to plan for the future. To help you create a sound strategy based on your personal goals and risk tolerance, Allspring Funds offers more than 100 mutual funds spanning a wide range of asset classes and investment styles. Although diversification cannot guarantee an investment profit or prevent losses, we believe it can be an effective way to manage investment risk and potentially smooth out overall portfolio performance. We encourage investors to know their investments and to understand that appropriate levels of risk-taking may unlock opportunities.
Thank you for choosing to invest with Allspring Funds. We appreciate your confidence in us and remain committed to helping you meet your financial needs.
Sincerely,
Andrew Owen
President
Allspring Funds
“ In November, the market mood turned positive as cooling inflation inspired confidence that central banks could hold off on further rate hikes. ”
For further information about your fund, contact your investment professional, visit our website at allspringglobal.com, or call us directly at 1-800-222-8222.
Allspring Discovery Large Cap Growth Fund | 3
Letter to shareholders (unaudited)
|
Beginning in July 2024, the Fund will be required by the Securities and Exchange Commission to send shareholders a paper copy of a new tailored shareholder report in place of the full shareholder report that you are now receiving. The tailored shareholder report will contain concise information about the Fund, including certain expense and performance information and fund statistics. If you wish to receive this new tailored shareholder report electronically, please follow the instructions on the back cover of this report. |
Other information that is currently included in the shareholder report, such as the Fund’s financial statements, will be available online and upon request, free of charge, in paper or electronic format. |
4 | Allspring Discovery Large Cap Growth Fund
This page is intentionally left blank.
Performance highlights (unaudited)
Performance highlights
| The Fund seeks long-term capital appreciation. |
| Allspring Funds Management, LLC |
| Allspring Global Investments, LLC |
| Michael T. Smith, CFA, Christopher J. Warner, CFA |
Average annual total returns (%) as of January 31, 2024 |
| | | | |
| | | | | | | | | |
| | | | | | | | | |
| | | | | | | | | |
| | | | | | | | | |
Administrator Class (WECDX) | | | | | | | | | |
Institutional Class (WFCIX) | | | | | | | | | |
| | | | | | | | | |
Russell 1000® Growth Index5 | | | | | | | | | |
Figures quoted represent past performance, which is no guarantee of future results, and do not reflect taxes that a shareholder may pay on an investment in a fund. Investment return and principal value of an investment will fluctuate so that an investor’s shares, when redeemed, may be worth more or less than their original cost. Performance shown without sales charges would be lower if sales charges were reflected. Current performance may be lower or higher than the performance data quoted, which assumes the reinvestment of dividends and capital gains. Current month-end performance is available on the Fund’s website, allspringglobal.com.
Please keep in mind that high double-digit returns were primarily achieved during favorable market conditions. You should not expect that such favorable returns can be consistently achieved. A fund’s performance, especially for short time periods, should not be the sole factor in making your investment decision.
Index returns do not include transaction costs associated with buying and selling securities, any mutual fund fees or expenses, or any taxes. It is not possible to invest directly in an index.
For Class A shares, the maximum front-end sales charge is 5.75%. For Class C shares, the maximum contingent deferred sales charge is 1.00%. Performance including a contingent deferred sales charge assumes the sales charge for the corresponding time period. Class R6, Administrator Class and Institutional Class shares are sold without a front-end sales charge or contingent deferred sales charge.
|
| Reflects the expense ratios as stated in the most recent prospectuses. The expense ratios shown are subject to change and may differ from the annualized expense ratios shown in the Financial Highlights of this report. |
| The manager has contractually committed through November 30, 2024, to waive fees and/or reimburse expenses to the extent necessary to cap total annual fund operating expenses after fee waivers at 1.02% for Class A, 1.77% for Class C, 0.60% for Class R6, 0.94% for Administrator Class and 0.70% for Institutional Class. Brokerage commissions, stamp duty fees, interest, taxes, acquired fund fees and expenses (if any), and extraordinary expenses are excluded from the expense caps. Prior to or after the commitment expiration date, the caps may be increased or the commitment to maintain the caps may be terminated only with the approval of the Board of Trustees. Without these caps, the Fund’s returns would have been lower. The expense ratio paid by an investor is the net expense ratio (the total annual fund operating expenses after fee waivers) as stated in the prospectuses. |
| Historical performance shown for the Class R6 shares prior to their inception reflects the performance of the Institutional Class shares, and includes the higher expenses applicable to the Institutional Class shares. If these expenses had not been included, returns for the Class R6 shares would be higher. |
| The Russell 3000® Index measures the performance of the 3,000 largest U.S. companies based on total market capitalization, which represents approximately 98% of the investable U.S. equity market. You cannot invest directly in an index. |
| The Russell 1000® Growth Index measures the performance of those Russell 1000 companies with higher price/book ratios and higher forecasted growth values. You cannot invest directly in an index. |
Stock values fluctuate in response to the activities of individual companies and general market and economic conditions. Certain investment strategies tend to increase the total risk of an investment (relative to the broader market). This fund is exposed to foreign investment risk, focused portfolio risk and smaller-company securities risk. Consult the Fund’s prospectus for additional information on these and other risks.
CFA® and Chartered Financial Analyst® are trademarks owned by CFA Institute. |
6 | Allspring Discovery Large Cap Growth Fund
Performance highlights (unaudited)
Ten largest holdings (%) as of January 31, 20241 |
| |
| |
| |
| |
| |
| |
Chipotle Mexican Grill, Inc. | |
| |
| |
| |
| Figures represent the percentage of the Fund’s net assets. Holdings are subject to change and may have changed since the date specified. |
Sector allocation as of January 31, 20241 |
| Figures represent the percentage of the Fund’s long-term investments. Allocations are subject to change and may have changed since the date specified. |
Allspring Discovery Large Cap Growth Fund | 7
Fund expenses (unaudited)
Fund expenses
As a shareholder of the Fund, you incur two types of costs: (1) transaction costs, including sales charges (loads) on purchase payments and contingent deferred sales charges (if any) on redemptions and (2) ongoing costs, including management fees, distribution (12b-1) and/or shareholder servicing fees, and other Fund expenses. This example is intended to help you understand your ongoing costs (in dollars) of investing in the Fund and to compare these costs with the ongoing costs of investing in other mutual funds.
The example is based on an investment of $1,000 invested at the beginning of the six-month period and held for the entire period from August 1, 2023 to January 31, 2024.
Actual expenses
The “Actual” line of the table below provides information about actual account values and actual expenses. You may use the information in this line, together with the amount you invested, to estimate the expenses that you paid over the period. Simply divide your account value by $1,000 (for example, an $8,600 account value divided by $1,000= 8.6), then multiply the result by the number in the “Actual” line under the heading entitled “Expenses paid during period” for your applicable class of shares to estimate the expenses you paid on your account during this period.
Hypothetical example for comparison purposes
The “Hypothetical” line of the table below provides information about hypothetical account values and hypothetical expenses based on the Fund’s actual expense ratio and an assumed rate of return of 5% per year before expenses, which is not the Fund’s actual return. The hypothetical account values and expenses may not be used to estimate the actual ending account balance or expenses you paid for the period. You may use this information to compare the ongoing costs of investing in the Fund and other funds. To do so, compare this 5% hypothetical example with the 5% hypothetical examples that appear in the shareholder reports of the other funds.
Please note that the expenses shown in the table are meant to highlight your ongoing costs only and do not reflect any transactional costs, such as sales charges (loads) and contingent deferred sales charges. Therefore, the “Hypothetical” line of the table is useful in comparing ongoing costs only, and will not help you determine the relative total costs of owning different funds. In addition, if these transactional costs were included, your costs would have been higher.
| Beginning
account value
8-1-2023 | Ending
account value
1-31-2024 | | Annualized net
expense ratio |
| | | | |
| | | | |
Hypothetical (5% return before expenses) | | | | |
| | | | |
| | | | |
Hypothetical (5% return before expenses) | | | | |
| | | | |
| | | | |
Hypothetical (5% return before expenses) | | | | |
| | | | |
| | | | |
Hypothetical (5% return before expenses) | | | | |
| | | | |
| | | | |
Hypothetical (5% return before expenses) | | | | |
| Expenses paid is equal to the annualized net expense ratio of each class multiplied by the average account value over the period, multiplied by 184 divided by 366 (to reflect the one-half-year period). |
8 | Allspring Discovery Large Cap Growth Fund
Portfolio of investments—January 31, 2024 (unaudited)
| | | | | |
| | | | | | |
Communication services: 10.47% | | | | | | |
| | | | | | |
| | | | | | |
Interactive media & services: 6.92% | | | | | | |
| | | | | | |
Wireless telecommunication services: 2.13% | | | | | | |
| | | | | | |
Consumer discretionary: 15.68% | | | | | | |
| | | | | | |
| | | | | | |
| | | | | | |
| | | | | | |
| | | | | | |
| | | | | | |
Hotels, restaurants & leisure: 2.50% | | | | | | |
Chipotle Mexican Grill, Inc.† | | | | | | |
| | | | | | |
| | | | | | |
| | | | | | |
| | | | | | |
Intercontinental Exchange, Inc. | | | | | | |
| | | | | | |
Tradeweb Markets, Inc. Class A | | | | | | |
| | | | | | |
Financial services: 7.68% | | | | | | |
| | | | | | |
| | | | | | |
| | | | | | |
| | | | | | |
| | | | | | |
| | | | | | |
Health care equipment & supplies: 4.69% | | | | | | |
| | | | | | |
Intuitive Surgical, Inc.† | | | | | | |
| | | | | | |
Health care providers & services: 3.46% | | | | | | |
| | | | | | |
Health care technology: 1.91% | | | | | | |
Veeva Systems, Inc. Class A† | | | | | | |
The accompanying notes are an integral part of these financial statements.
Allspring Discovery Large Cap Growth Fund | 9
Portfolio of investments—January 31, 2024 (unaudited)
| | | | | |
Life sciences tools & services: 1.76% | | | | | | |
| | | | | | |
| | | | | | |
| | | | | | |
| | | | | | |
| | | | | | |
| | | | | | |
Commercial services & supplies: 0.00% | | | | | | |
| | | | | | |
Ground transportation: 1.74% | | | | | | |
Old Dominion Freight Line, Inc. | | | | | | |
Industrial conglomerates: 2.29% | | | | | | |
| | | | | | |
Information technology: 34.00% | | | | | | |
Communications equipment: 2.39% | | | | | | |
| | | | | | |
| | | | | | |
| | | | | | |
| | | | | | |
| | | | | | |
| | | | | | |
Semiconductors & semiconductor equipment: 4.90% | | | | | | |
Advanced Micro Devices, Inc.† | | | | | | |
| | | | | | |
| | | | | | |
| | | | | | |
| | | | | | |
Cadence Design Systems, Inc.† | | | | | | |
Crowdstrike Holdings, Inc. Class A† | | | | | | |
| | | | | | |
| | | | | | |
| | | | | | |
| | | | | | |
| | | | | | |
| | | | | | |
| | | | | | |
| | | | | | |
Specialized REITs : 1.35% | | | | | | |
SBA Communications Corp. Class A | | | | | | |
Total common stocks (Cost $86,573,986) | | | | | | |
The accompanying notes are an integral part of these financial statements.
10 | Allspring Discovery Large Cap Growth Fund
Portfolio of investments—January 31, 2024 (unaudited)
| | | | | |
Short-term investments: 0.04% | | | | | | |
Investment companies: 0.04% | | | | | | |
Allspring Government Money Market Fund Select Class♠∞ | | | | | | |
Total short-term investments (Cost $76,926) | | | | | | |
Total investments in securities (Cost $86,650,912) | | | | | | |
Other assets and liabilities, net | | | | | | |
| | | | | | |
| Non-income-earning security |
| The issuer of the security is an affiliated person of the Fund as defined in the Investment Company Act of 1940. |
| The rate represents the 7-day annualized yield at period end. |
|
| Real estate investment trust |
Investments in affiliates
An affiliated investment is an investment in which the Fund owns at least 5% of the outstanding voting shares of the issuer or as a result of other relationships, such as the Fund and the issuer having the same investment manager. Transactions with issuers that were affiliates of the Fund at the end of the period were as follows:
| | | | | Net
change in
unrealized
gains
(losses) | | | Income
from
affiliated
securities |
| | | | | | | | |
Allspring Government Money Market Fund Select Class | | | | | | | | |
The accompanying notes are an integral part of these financial statements.
Allspring Discovery Large Cap Growth Fund | 11
Statement of assets and liabilities—January 31, 2024 (unaudited)
Financial statements
Statement of assets and liabilities
| |
Investments in unaffiliated securities, at value (cost $86,573,986) | |
Investments in affiliated securities, at value (cost $76,926) | |
Receivable for investments sold | |
Receivable for Fund shares sold | |
| |
Prepaid expenses and other assets | |
| |
| |
Payable for Fund shares redeemed | |
| |
Administration fees payable | |
Shareholder servicing fees payable | |
Professional fees payable | |
| |
Accrued expenses and other liabilities | |
| |
| |
| |
| |
Total distributable earnings | |
| |
Computation of net asset value and offering price per share | |
| |
Shares outstanding–Class A1 | |
Net asset value per share–Class A | |
Maximum offering price per share – Class A2 | |
| |
Shares outstanding–Class C1 | |
Net asset value per share–Class C | |
| |
Shares outstanding–Class R61 | |
Net asset value per share–Class R6 | |
Net assets–Administrator Class | |
Shares outstanding–Administrator Class1 | |
Net asset value per share–Administrator Class | |
Net assets–Institutional Class | |
Shares outstanding–Institutional Class1 | |
Net asset value per share–Institutional Class | |
1 The Fund has an unlimited number of authorized shares.
2 Maximum offering price is computed as 100/94.25 of net asset value. On investments of $50,000 or more, the offering price is reduced.
The accompanying notes are an integral part of these financial statements.
12 | Allspring Discovery Large Cap Growth Fund
Statement of operations—six months ended January 31, 2024 (unaudited)
Statement of operations
| |
Dividends (net of foreign withholdings taxes of $1,515) | |
Income from affiliated securities | |
| |
| |
| |
| |
| |
| |
| |
| |
| |
| |
Shareholder servicing fees | |
| |
| |
| |
| |
| |
Custody and accounting fees | |
| |
| |
Shareholder report expenses | |
Trustees’ fees and expenses | |
| |
| |
Less: Fee waivers and/or expense reimbursements | |
| |
| |
| |
| |
| |
| |
| |
Realized and unrealized gains (losses) on investments | |
Net realized gains (losses) on | |
| |
Foreign currency and foreign currency translations | |
Net realized gains on investments | |
Net change in unrealized gains (losses) on investments | |
Net realized and unrealized gains (losses) on investments | |
Net increase in net assets resulting from operations | |
The accompanying notes are an integral part of these financial statements.
Allspring Discovery Large Cap Growth Fund | 13
Statement of changes in net assets
Statement of changes in net assets
|
Six months ended
January 31, 2024 (unaudited) | |
| | | | |
| | | | |
Net realized gains on investments | | | | |
Net change in unrealized gains (losses) on investments | | | | |
Net increase in net assets resulting from operations | | | | |
Distributions to shareholders from | | | | |
Net investment income and net realized gains | | | | |
| | | | |
| | | | |
| | | | |
| | | | |
| | | | |
Total distributions to shareholders | | | | |
Capital share transactions | | | | |
Proceeds from shares sold | | | | |
| | | | |
| | | | |
| | | | |
| | | | |
| | | | |
| | | | |
Reinvestment of distributions | | | | |
| | | | |
| | | | |
| | | | |
| | | | |
| | | | |
| | | | |
Payment for shares redeemed | | | | |
| | | | |
| | | | |
| | | | |
| | | | |
| | | | |
| | | | |
Net decrease in net assets resulting from capital share transactions | | | | |
Total decrease in net assets | | | | |
| | | | |
| | | | |
| | | | |
The accompanying notes are an integral part of these financial statements.
14 | Allspring Discovery Large Cap Growth Fund
Financial highlights
(For a share outstanding throughout each period)
| Six months ended
January 31, 2024
(unaudited) | |
| | | | | |
Net asset value, beginning of period | | | | | | |
| | | | | | |
Net realized and unrealized gains (losses) on investments | | | | | | |
Total from investment operations | | | | | | |
Distributions to shareholders from | | | | | | |
| | | | | | |
Net asset value, end of period | | | | | | |
| | | | | | |
Ratios to average net assets (annualized) | | | | | | |
| | | | | | |
| | | | | | |
| | | | | | |
| | | | | | |
| | | | | | |
Net assets, end of period (000s omitted) | | | | | | |
| Calculated based upon average shares outstanding |
| Total return calculations do not include any sales charges. Returns for periods of less than one year are not annualized. |
The accompanying notes are an integral part of these financial statements.
Allspring Discovery Large Cap Growth Fund | 15
(For a share outstanding throughout each period)
| Six months ended
January 31, 2024
(unaudited) | |
| | | | | |
Net asset value, beginning of period | | | | | | |
| | | | | | |
Net realized and unrealized gains (losses) on investments | | | | | | |
Total from investment operations | | | | | | |
Distributions to shareholders from | | | | | | |
| | | | | | |
Net asset value, end of period | | | | | | |
| | | | | | |
Ratios to average net assets (annualized) | | | | | | |
| | | | | | |
| | | | | | |
| | | | | | |
| | | | | | |
| | | | | | |
Net assets, end of period (000s omitted) | | | | | | |
| Calculated based upon average shares outstanding |
| Total return calculations do not include any sales charges. Returns for periods of less than one year are not annualized. |
The accompanying notes are an integral part of these financial statements.
16 | Allspring Discovery Large Cap Growth Fund
(For a share outstanding throughout each period)
| Six months ended
January 31, 2024
(unaudited) | |
| | | | |
Net asset value, beginning of period | | | | | |
Net investment income (loss) | | | | | |
Net realized and unrealized gains (losses) on investments | | | | | |
Total from investment operations | | | | | |
Distributions to shareholders from | | | | | |
| | | | | |
Net asset value, end of period | | | | | |
| | | | | |
Ratios to average net assets (annualized) | | | | | |
| | | | | |
| | | | | |
Net investment income (loss) | | | | | |
| | | | | |
| | | | | |
Net assets, end of period (000s omitted) | | | | | |
| For the period from September 20, 2019 (commencement of class operations) to July 31, 2020 |
| Amount is more than $(0.005). |
| Calculated based upon average shares outstanding |
| Amount is less than $0.005. |
| Returns for periods of less than one year are not annualized. |
The accompanying notes are an integral part of these financial statements.
Allspring Discovery Large Cap Growth Fund | 17
(For a share outstanding throughout each period)
| Six months ended
January 31, 2024
(unaudited) | |
| | | | | |
Net asset value, beginning of period | | | | | | |
| | | | | | |
Net realized and unrealized gains (losses) on investments | | | | | | |
Total from investment operations | | | | | | |
Distributions to shareholders from | | | | | | |
| | | | | | |
Net asset value, end of period | | | | | | |
| | | | | | |
Ratios to average net assets (annualized) | | | | | | |
| | | | | | |
| | | | | | |
| | | | | | |
| | | | | | |
| | | | | | |
Net assets, end of period (000s omitted) | | | | | | |
| Calculated based upon average shares outstanding |
| Returns for periods of less than one year are not annualized. |
The accompanying notes are an integral part of these financial statements.
18 | Allspring Discovery Large Cap Growth Fund
(For a share outstanding throughout each period)
| Six months ended
January 31, 2024
(unaudited) | |
| | | | | |
Net asset value, beginning of period | | | | | | |
Net investment income (loss) | | | | | | |
Net realized and unrealized gains (losses) on investments | | | | | | |
Total from investment operations | | | | | | |
Distributions to shareholders from | | | | | | |
| | | | | | |
Net asset value, end of period | | | | | | |
| | | | | | |
Ratios to average net assets (annualized) | | | | | | |
| | | | | | |
| | | | | | |
Net investment income (loss) | | | | | | |
| | | | | | |
| | | | | | |
Net assets, end of period (000s omitted) | | | | | | |
| Calculated based upon average shares outstanding |
| Amount is less than $0.005. |
| Returns for periods of less than one year are not annualized. |
The accompanying notes are an integral part of these financial statements.
Allspring Discovery Large Cap Growth Fund | 19
Notes to financial statements (unaudited)
Notes to financial statements
Allspring Funds Trust (the “Trust”), a Delaware statutory trust organized on March 10, 1999, is an open-end management investment company registered under the Investment Company Act of 1940, as amended (the “1940 Act”). As an investment company, the Trust follows the accounting and reporting guidance in Financial Accounting Standards Board (“FASB”) Accounting Standards Codification Topic 946, Financial Services – Investment Companies. These financial statements report on the Allspring Discovery Large Cap Growth Fund (the “Fund”) which is a diversified series of the Trust.
2.
SIGNIFICANT ACCOUNTING POLICIES
The following significant accounting policies, which are consistently followed in the preparation of the financial statements of the Fund, are in conformity with U.S. generally accepted accounting principles which require management to make estimates and assumptions that affect the reported amounts of assets and liabilities, disclosure of contingent assets and liabilities at the date of the financial statements, and the reported amounts of income and expenses during the reporting period. Actual results could differ from those estimates.
Securities valuation
All investments are valued each business day as of the close of regular trading on the New York Stock Exchange (generally 4 p.m. Eastern Time), although the Fund may deviate from this calculation time under unusual or unexpected circumstances.
Equity securities and exchange-traded funds that are listed on a foreign or domestic exchange or market are valued at the official closing price or, if none, the last sales price.
Investments in registered open-end investment companies (other than those listed on a foreign or domestic exchange or market) are valued at net asset value.
Investments which are not valued using the methods discussed above are valued at their fair value, as determined in good faith by Allspring Funds Management, LLC (“Allspring Funds Management”), which was named the valuation designee by the Board of Trustees. As the valuation designee, Allspring Funds Management is responsible for day-to-day valuation activities for the Allspring Funds. In connection with these responsibilities, Allspring Funds Management has established a Valuation Committee and has delegated to it the authority to take any actions regarding the valuation of portfolio securities that the Valuation Committee deems necessary or appropriate, including determining the fair value of portfolio securities. On a quarterly basis, the Board of Trustees receives reports of valuation actions taken by the Valuation Committee. On at least an annual basis, the Board of Trustees receives an assessment of the adequacy and effectiveness of Allspring Funds Management’s process for determining the fair value of the portfolio of investments.
Foreign currency translation
The accounting records of the Fund are maintained in U.S. dollars. The values of other assets and liabilities denominated in foreign currencies are translated into U.S. dollars at rates provided by an independent foreign currency pricing source at a time each business day specified by the Valuation Committee. Purchases and sales of securities, and income and expenses are converted at the rate of exchange on the respective dates of such transactions. Net realized foreign exchange gains or losses arise from sales of foreign currencies, currency gains or losses realized between the trade and settlement dates on securities transactions, and the difference between the amounts of dividends, interest and foreign withholding taxes recorded and the U.S. dollar equivalent of the amounts actually paid or received. Net unrealized foreign exchange gains and losses arise from changes in the fair value of assets and liabilities other than investments in securities resulting from changes in exchange rates. The changes in net assets arising from changes in exchange rates of securities and the changes in net assets resulting from changes in market prices of securities are not separately presented. Such changes are included in net realized and unrealized gains or losses from investments.
Security transactions and income recognition
Securities transactions are recorded on a trade date basis. Realized gains or losses are recorded on the basis of identified cost.
Dividend income is recognized on the ex-dividend date. Dividend income is recorded net of foreign taxes withheld where recovery of such taxes is not assured.
Interest earned on cash balances held at the custodian is recorded as interest income.
Distributions received from REIT investments may be characterized as ordinary income, capital gains, or a return of capital to the Fund based on information provided by the REIT. The proper characterization of REIT distributions is generally not known until after the end of each calendar year. As such, estimates may be used in reporting the character of income and distributions for financial statement purposes.
Distributions to shareholders
Distributions to shareholders from net investment income and any net realized gains are recorded on the ex-dividend date and paid at least annually. Such distributions are determined in accordance with income tax regulations and may differ from U.S. generally accepted accounting principles. Dividend sources are estimated at the time of declaration. The tax character of distributions is determined as of the Fund’s fiscal year end. Therefore, a portion of the Fund’s distributions made prior to the Fund’s fiscal year end may be categorized as a tax return of capital at year end.
20 | Allspring Discovery Large Cap Growth Fund
Notes to financial statements (unaudited)
Federal and other taxes
The Fund intends to continue to qualify as a regulated investment company by distributing substantially all of its investment company taxable income and any net realized capital gains (after reduction for capital loss carryforwards) sufficient to relieve it from all, or substantially all, federal income taxes. Accordingly, no provision for federal income taxes was required.
The Fund’s income and federal excise tax returns and all financial records supporting those returns for the prior three fiscal years are subject to examination by the federal and Delaware revenue authorities. Management has analyzed the Fund’s tax positions taken on federal, state, and foreign tax returns, as applicable, for all open tax years and does not believe that there are any uncertain tax positions that require recognition of a tax liability.
As of January 31, 2024, the aggregate cost of all investments for federal income tax purposes was $87,325,224 and the unrealized gains (losses) consisted of:
As of July 31, 2023, the Fund had a qualified late-year ordinary loss of $238,172 which was recognized on the first day of the current fiscal year.
Class allocations
The separate classes of shares offered by the Fund differ principally in applicable sales charges, distribution, shareholder servicing, and administration fees. Class specific expenses are charged directly to that share class. Investment income, common fund-level expenses, and realized and unrealized gains (losses) on investments are allocated daily to each class of shares based on the relative proportion of net assets of each class.
3.
FAIR VALUATION MEASUREMENTS
Fair value measurements of investments are determined within a framework that has established a fair value hierarchy based upon the various data inputs utilized in determining the value of the Fund’s investments. The three-level hierarchy gives the highest priority to unadjusted quoted prices in active markets for identical assets or liabilities (Level 1) and the lowest priority to unobservable inputs (Level 3). The Fund’s investments are classified within the fair value hierarchy based on the lowest level of input that is significant to the fair value measurement. The inputs are summarized into three broad levels as follows:
•Level 1—quoted prices in active markets for identical securities
•Level 2—other significant observable inputs (including quoted prices for similar securities, interest rates, prepayment speeds, credit risk, etc.)
•Level 3—significant unobservable inputs (including the Fund’s own assumptions in determining the fair value of investments)
The inputs or methodologies used for valuing investments in securities are not necessarily an indication of the risk associated with investing in those securities.
The following is a summary of the inputs used in valuing the Fund’s assets and liabilities as of January 31, 2024:
| | Other significant
observable inputs
(Level 2) | Significant
unobservable inputs
(Level 3) | |
| | | | |
| | | | |
| | | | |
| | | | |
| | | | |
| | | | |
| | | | |
| | | | |
| | | | |
| | | | |
| | | | |
| | | | |
| | | | |
| | | | |
Additional sector, industry or geographic detail, if any, is included in the Portfolio of Investments.
At January 31, 2024, the Fund did not have any transfers into/out of Level 3.
Allspring Discovery Large Cap Growth Fund | 21
Notes to financial statements (unaudited)
4.
TRANSACTIONS WITH AFFILIATES
Management fee
Allspring Funds Management, a wholly owned subsidiary of Allspring Global Investments Holdings, LLC, a holding company indirectly owned by certain private funds of GTCR LLC and Reverence Capital Partners, L.P., is the manager of the Fund and provides advisory and fund-level administrative services under an investment management agreement. Under the investment management agreement, Allspring Funds Management is responsible for, among other services, implementing the investment objectives and strategies of the Fund, supervising the subadviser and providing fund-level administrative services in connection with the Fund’s operations. As compensation for its services under the investment management agreement, Allspring Funds Management is entitled to receive a management fee at the following annual rate based on the Fund’s average daily net assets:
For the six months ended January 31, 2024, the management fee was equivalent to an annual rate of 0.70% of the Fund’s average daily net assets.
Allspring Funds Management has retained the services of a subadviser to provide daily portfolio management to the Fund. The fee for subadvisory services is borne by Allspring Funds Management. Allspring Global Investments, LLC, an affiliate of Allspring Funds Management and a wholly owned subsidiary of Allspring Global Investments Holdings, LLC, is the subadviser to the Fund and is entitled to receive a fee from Allspring Funds Management at an annual rate starting at 0.30% and declining to 0.20% as the average daily net assets of the Fund increase.
Administration fees
Under a class-level administration agreement, Allspring Funds Management provides class-level administrative services to the Fund, which includes paying fees and expenses for services provided by the transfer agent, sub-transfer agents, omnibus account servicers and record-keepers. As compensation for its services under the class-level administration agreement, Allspring Funds Management receives an annual fee which is calculated based on the average daily net assets of each class as follows:
| Class-level
administration fee |
| |
| |
| |
| |
| |
Waivers and/or expense reimbursements
Allspring Funds Management has contractually committed to waive and/or reimburse management and administration fees to the extent necessary to maintain certain net operating expense ratios for the Fund. When each class of the Fund has exceeded its expense cap, Allspring Funds Management will waive fees and/or reimburse expenses from fund-level expenses on a proportionate basis and then from class specific expenses. When only certain classes exceed their expense caps, waivers and/or reimbursements are applied against class specific expenses before fund-level expenses. Allspring Funds Management has contractually committed through November 30, 2024 to waive fees and/or reimburse expenses to the extent necessary to cap the Fund’s expenses. Prior to or after the commitment expiration date, the cap may be increased or the commitment to maintain the cap may be terminated only with the approval of the Board of Trustees. As of January 31, 2024, the contractual expense caps are as follows:
22 | Allspring Discovery Large Cap Growth Fund
Notes to financial statements (unaudited)
Distribution fee
The Trust has adopted a distribution plan for Class C shares pursuant to Rule 12b-1 under the 1940 Act. A distribution fee is charged to Class C shares and paid to Allspring Funds Distributor, LLC (“Allspring Funds Distributor”), the principal underwriter, an affiliate of Allspring Funds Management, at an annual rate up to 0.75% of the average daily net assets of Class C shares.
In addition, Allspring Funds Distributor is entitled to receive the front-end sales charge from the purchase of Class A shares and a contingent deferred sales charge on the redemption of certain Class A shares. Allspring Funds Distributor is also entitled to receive the contingent deferred sales charges from redemptions of Class C shares. For the six months ended January 31, 2024, Allspring Funds Distributor received $655 from the sale of Class A shares. No contingent deferred sales charges were incurred by Class A and Class C shares for the six months ended January 31, 2024.
Shareholder servicing fees
The Trust has entered into contracts with one or more shareholder servicing agents, whereby Class A, Class C and Administrator Class are charged a fee at an annual rate up to 0.25% of the average daily net assets of each respective class. A portion of these total shareholder servicing fees were paid to affiliates of the Fund.
Interfund transactions
The Fund may purchase or sell portfolio investment securities to certain affiliates pursuant to Rule 17a-7 under the 1940 Act and under procedures adopted by the Board of Trustees. The procedures have been designed to ensure that these interfund transactions, which do not incur broker commissions, are effected at current market prices. Pursuant to these procedures, the Fund did not have any interfund transactions during the six months ended January 31, 2024.
5.
INVESTMENT PORTFOLIO TRANSACTIONS
Purchases and sales of investments, excluding U.S. government obligations (if any) and short-term securities, for the six months ended January 31, 2024 were $37,620,340 and $57,915,075, respectively.
The Trust (excluding the money market funds), Allspring Master Trust and Allspring Variable Trust are parties to a $350,000,000 revolving credit agreement whereby the Fund is permitted to use bank borrowings for temporary or emergency purposes, such as to fund shareholder redemption requests. Interest under the credit agreement is charged to the Fund based on borrowing rate equal to the higher of the Federal Funds rate or the overnight bank funding rate in effect on that day plus a spread. In addition, an annual commitment fee based on the unused balance is allocated to each participating fund.
For the six months ended January 31, 2024, there were no borrowings by the Fund under the agreement.
As of the end of the period, the Fund concentrated its portfolio of investments in the information technology sector. A fund that invests a substantial portion of its assets in any sector may be more affected by changes in that sector than would be a fund whose investments are not heavily weighted in any sector.
Under the Fund’s organizational documents, the officers and Trustees have been granted certain indemnification rights against certain liabilities that may arise out of performance of their duties to the Fund. The Fund has entered into a separate agreement with each Trustee that converts indemnification rights currently existing under the Fund’s organizational documents into contractual rights that cannot be changed in the future without the consent of the Trustee. Additionally, in the normal course of business, the Fund may enter into contracts with service providers that contain a variety of indemnification clauses. The Fund’s maximum exposure under these arrangements is dependent on future claims that may be made against the Fund and, therefore, cannot be estimated.
Allspring Discovery Large Cap Growth Fund | 23
Other information (unaudited)
Other information
Proxy voting information
A description of the policies and procedures used to determine how to vote proxies relating to portfolio securities is available without charge, upon request, by calling 1-866-259-3305, visiting our website at allspringglobal.com, or visiting the SEC website at sec.gov. Information regarding how the proxies related to portfolio securities were voted during the most recent 12-month period ended June 30 is available on the website at allspringglobal.com or by visiting the SEC website at sec.gov.
Quarterly portfolio holdings information
The Fund files its complete schedule of portfolio holdings with the SEC for the first and third quarters of each fiscal year as an exhibit to its reports on Form N-PORT. Shareholders may view the filed Form N-PORT by visiting the SEC website at sec.gov.
24 | Allspring Discovery Large Cap Growth Fund
Other information (unaudited)
Board of trustees and officers
Each of the Trustees and Officers listed in the table below acts in identical capacities for each fund in the Allspring family of funds, which consists of 116 mutual funds comprising the Allspring Funds Trust, Allspring Variable Trust, Allspring Master Trust and four closed-end funds (collectively the “Fund Complex”). This table should be read in conjunction with the Prospectus and the Statement of Additional Information†. The mailing address of each Trustee and Officer is 1415 Vantage Park Drive, 3rd Floor, Charlotte, NC 28203. Each Trustee and Officer serves an indefinite term, however, each Trustee serves such term until reaching the mandatory retirement age established by the Trustees.
Independent Trustees
| | Principal occupations during past five years or longer | Current other
public company or
investment
company
directorships |
William R. Ebsworth
(Born 1957) | | Retired. From 1984 to 2013, equities analyst, portfolio manager, research director and chief investment officer at Fidelity Management and Research Company in Boston, Tokyo, and Hong Kong, and retired in 2013 as Chief Investment Officer of Fidelity Strategic Advisers, Inc. where he led a team of investment professionals managing client assets. Prior thereto, Board member of Hong Kong Securities Clearing Co., Hong Kong Options Clearing Corp., the Thailand International Fund, Ltd., Fidelity Investments Life Insurance Company, and Empire Fidelity Investments Life Insurance Company. Serves on the Investment Company Institute’s Board of Governors since 2022 and Executive Committee since 2023 as well as the Vice Chairman of the Governing Council of the Independent Directors Council since 2023. Audit Committee Chair and Investment Committee Chair of the Vincent Memorial Hospital Foundation (non-profit organization). Mr. Ebsworth is a CFA charterholder. | |
Jane A. Freeman
(Born 1953) | Trustee,
since 2015;
Chair Liaison,
| Retired. From 2012 to 2014 and 1999 to 2008, Chief Financial Officer of Scientific Learning Corporation. From 2008 to 2012, Ms. Freeman provided consulting services related to strategic business projects. Prior to 1999, Portfolio Manager at Rockefeller & Co. and Scudder, Stevens & Clark. Board member of the Harding Loevner Funds from 1996 to 2014, serving as both Lead Independent Director and chair of the Audit Committee. Board member of the Russell Exchange Traded Funds Trust from 2011 to 2012 and the chair of the Audit Committee. Ms. Freeman is also an inactive Chartered Financial Analyst. | |
Isaiah Harris, Jr.
(Born 1952) | Trustee,
since 2009;
Audit Committee Chair,
since 2019 | Retired. Member of the Advisory Board of CEF of East Central Florida. Chairman of the Board of CIGNA Corporation from 2009 to 2021, and Director from 2005 to 2008. From 2003 to 2011, Director of Deluxe Corporation. Prior thereto, President and CEO of BellSouth Advertising and Publishing Corp. from 2005 to 2007, President and CEO of BellSouth Enterprises from 2004 to 2005 and President of BellSouth Consumer Services from 2000 to 2003. Emeritus member of the Iowa State University Foundation Board of Governors. Emeritus Member of the Advisory board of Iowa State University School of Business. Advisory Board Member, Palm Harbor Academy (private school). Advisory Board Member, Fellowship of Christian Athletes. Mr. Harris is a certified public accountant (inactive status). | |
David F. Larcker
(Born 1950) | | Distinguished Visiting Fellow at the Hoover Institution since 2022. James Irvin Miller Professor of Accounting at the Graduate School of Business (Emeritus), Stanford University, Director of the Corporate Governance Research Initiative and Senior Faculty of The Rock Center for Corporate Governance since 2006. From 2005 to 2008, Professor of Accounting at the Graduate School of Business, Stanford University. Prior thereto, Ernst & Young Professor of Accounting at The Wharton School, University of Pennsylvania from 1985 to 2005. | |
Olivia S. Mitchell
(Born 1953) | | International Foundation of Employee Benefit Plans Professor since 1993, Wharton School of the University of Pennsylvania. Director of Wharton’s Pension Research Council and Boettner Center on Pensions & Retirement Research, and Research Associate at the National Bureau of Economic Research. Previously taught at Cornell University from 1978 to 1993. | |
Timothy J. Penny
(Born 1951) | Trustee,
since 1996;
Chair,
since 2018 | President and Chief Executive Officer of Southern Minnesota Initiative Foundation, a non-profit organization, since 2007. Vice Chair of the Economic Club of Minnesota, since 2007. Co-Chair of the Committee for a Responsible Federal Budget, since 1995. Member of the Board of Trustees of NorthStar Education Finance, Inc., a non-profit organization, from 2007-2022. Senior Fellow of the University of Minnesota Humphrey Institute from 1995 to 2017. | |
* Length of service dates reflect the Trustee’s commencement of service with the Trust’s predecessor entities, where applicable.
# Ms. Freeman will serve as Chair Liaison through June 2024, at which time Ms. Wheelock will assume the role.
†
The Statement of Additional Information includes additional information about the Trustees and is available, without charge, upon request, by calling 1-800-222-8222 or by visiting the website at allspringglobal.com.
Allspring Discovery Large Cap Growth Fund | 25
Other information (unaudited)
| Position held and length of service* | Principal occupations during past five years or longer | Current other public company or investment company directorships |
James G. Polisson
(Born 1959) | Trustee,
since 2018; Nominating and Governance Committee Chair, since 2024 | Retired. Chief Marketing Officer, Source (ETF) UK Services, Ltd, from 2015 to 2017. From 2012 to 2015, Principal of The Polisson Group, LLC, a management consulting, corporate advisory and principal investing company. Chief Executive Officer and Managing Director at Russell Investments, Global Exchange Traded Funds from 2010 to 2012. Managing Director of Barclays Global Investors from 1998 to 2010 and Global Chief Marketing Officer for iShares and Barclays Global Investors from 2000 to 2010. Trustee of the San Francisco Mechanics’ Institute, a non- profit organization, from 2013 to 2015. Board member of the Russell Exchange Traded Fund Trust from 2011 to 2012. Director of Barclays Global Investors Holdings Deutschland GmbH from 2006 to 2009. Mr. Polisson is an attorney and has a retired status with the Massachusetts and District of Columbia Bar Associations. | |
Pamela Wheelock
(Born 1959) | Trustee,
since January 2020;
previously Trustee from
January 2018 to
| Retired. Executive and Senior Financial leadership positions in the public, private and nonprofit sectors. Interim President and CEO, McKnight Foundation, 2020. Interim Commissioner, Minnesota Department of Human Services, 2019. Chief Operating Officer, Twin Cities Habitat for Humanity, 2017-2019. Vice President for University Services, University of Minnesota, 2012- 2016. Interim President and CEO, Blue Cross and Blue Shield of Minnesota, 2011-2012. Executive Vice-President and Chief Financial Officer, Minnesota Wild, 2002-2008. Commissioner, Minnesota Department of Finance, 1999-2002. Chair of the Board of Directors of Destination Medical Center Corporation. Board member of the Minnesota Wild Foundation. | |
* Length of service dates reflect the Trustee’s commencement of service with the Trust’s predecessor entities, where applicable.
# Ms. Freeman will serve as Chair Liaison through June 2024, at which time Ms. Wheelock will assume the role.
26 | Allspring Discovery Large Cap Growth Fund
Other information (unaudited)
Officers1
| Position held and
length of service | Principal occupations during past five years or longer |
| | President and Chief Executive Officer of Allspring Funds Management, LLC since 2017 and Head of Global Fund Governance of Allspring Global Investments since 2022. Prior thereto, co-president of Galliard Capital Management, LLC, an affiliate of Allspring Funds Management, LLC, from 2019 to 2022 and Head of Affiliated Managers, Allspring Global Investments, from 2014 to 2019 and Executive Vice President responsible for marketing, investments and product development for Allspring Funds Management, LLC, from 2009 to 2014. |
Jeremy DePalma
(Born 1974) | Treasurer,
since 2012
(for certain funds in
the Fund Complex);
since 2021 (for
the remaining funds in the Complex) | Senior Vice President of Allspring Funds Management, LLC since 2009. Senior Vice President of Evergreen Investment Management Company, LLC from 2008 to 2010 and head of the Fund Reporting and Control Team within Fund Administration from 2005 to 2010. |
Christopher Baker
(Born 1976) | Chief Compliance Officer,
since 2022 | Global Chief Compliance Officer for Allspring Global Investments since 2022. Prior thereto, Chief Compliance Officer for State Street Global Advisors from 2018 to 2021. Senior Compliance Officer for the State Street divisions of Alternative Investment Solutions, Sector Solutions, and Global Marketing from 2015 to 2018. From 2010 to 2015 Vice President, Global Head of Investment and Marketing Compliance for State Street Global Advisors. |
Matthew Prasse
(Born 1983) | Chief Legal Officer,
since 2022;
Secretary,
since 2021 | Senior Counsel of the Allspring Legal Department since 2021. Senior Counsel of the Wells Fargo Legal Department from 2018 to 2021. Previously, Counsel for Barings LLC from 2015 to 2018. Prior to joining Barings, Associate at Morgan, Lewis & Bockius LLP from 2008 to 2015. |
1 For those Officers with tenures at Allspring Global Investments and/or Allspring Funds Management, LLC that began prior to 2021, such tenures include years of service during which these businesses/entities were known as Wells Fargo Asset Management and Wells Fargo Funds Management, LLC, respectively.
Allspring Discovery Large Cap Growth Fund | 27
This page is intentionally left blank.
For more information
More information about Allspring Funds is available free upon request. To obtain literature, please write, visit the Fund’s website, or call:
Allspring Funds
P.O. Box 219967
Kansas City, MO 64121-9967
Website: allspringglobal.com
Individual investors: 1-800-222-8222
Retail investment professionals: 1-888-877-9275
Institutional investment professionals: 1-800-260-5969
This report and the financial statements contained herein are submitted for the general information of the shareholders of the Fund. If this report is used for promotional purposes, distribution of the report must be accompanied or preceded by a current prospectus. Before investing, please consider the investment objectives, risks, charges, and expenses of the investment. For a current prospectus and, if available, a summary prospectus, containing this information, call 1-800-222-8222 or visit the Fund’s website at allspringglobal.com. Read the prospectus carefully before you invest or send money.
Allspring Global InvestmentsTM is the trade name for the asset management firms of Allspring Global Investments Holdings, LLC, a holding company indirectly owned by certain private funds of GTCR LLC and Reverence Capital Partners, L.P. These firms include but are not limited to Allspring Global Investments, LLC, and Allspring Funds Management, LLC. Certain products managed by Allspring entities are distributed by Allspring Funds Distributor, LLC (a broker-dealer and Member FINRA/SIPC).
This material is for general informational and educational purposes only and is NOT intended to provide investment advice or a recommendation of any kind - including a recommendation for any specific investment, strategy, or plan.
© 2024 Allspring Global Investments Holdings, LLC. All rights reserved.
ALL-02052024-k0cizqom 03-24
SAR4303 01-24
Semi-Annual Report
January 31, 2024
The views expressed and any forward-looking statements are as of January 31, 2024, unless otherwise noted, and are those of the Fund’s portfolio managers and/or Allspring Global Investments. Discussions of individual securities or the markets generally are not intended as individual recommendations. Future events or results may vary significantly from those expressed in any forward-looking statements. The views expressed are subject to change at any time in response to changing circumstances in the market. Allspring Global Investments disclaims any obligation to publicly update or revise any views expressed or forward-looking statements.
Allspring Growth Fund | 1
Letter to shareholders (unaudited)
Andrew Owen
President
Allspring Funds
Dear Shareholder:
We are pleased to offer you this semi-annual report for the Allspring Growth Fund for the six-month period that ended January 31, 2024. Globally, stocks and bonds experienced high levels of volatility throughout the period. The market was focused on persistently high inflation and the impact of ongoing aggressive central bank rate hikes. Riskier assets rallied as investors anticipated an end to the tight monetary policy despite concerns of a possible recession.
For the period, U.S. stocks, based on the S&P 500 Index,1 returned 6.43%. International stocks, as measured by the MSCI ACWI ex USA Index (Net),2 gained 0.48% while the MSCI EM Index (Net) (USD),3 returned -6.00%. Among bond indexes, the Bloomberg U.S. Aggregate Bond Index4 returned 3.15%, the Bloomberg Global Aggregate ex-USD Index (unhedged)5 gained 1.15%, the Bloomberg Municipal Bond Index6 returned 2.70%, and the ICE BofA U.S. High Yield Index7 gained 6.17%.
Still focused on high inflation and elevated central bank rates, markets were volatile.
The six-month period began with stocks retreating in August after a July rally while monthly bond returns were flat overall. Increased global market volatility reflected unease over the Chinese property market being stressed along with weak Chinese economic data. However, speculation grew over a possible end to the Federal Reserve’s (Fed’s) campaign of interest rate increases or at least a pause in September. U.S. economic data generally remained solid, with resilient job market data and inflation ticking up slightly in August as the annual Consumer Price Index (CPI)8 rose 3.7%. However, the three-month trend for Core CPI9 stood at an annualized 2.4%.
Stocks and bonds both had negative overall returns in September as investors were disappointed by the Fed’s determination not to lower interest rates until it knows it has vanquished persistently high inflation. As of September, the two primary gauges of U.S. inflation—the annual Core Personal Consumption Expenditures Price Index10 and the CPI—both stood at roughly 4%, twice as high as the Fed’s oft-stated 2% target. The month ended with the prospect of yet another U.S. government shutdown, averted at least temporarily but looming later in the year.
1
The S&P 500 Index consists of 500 stocks chosen for market size, liquidity, and industry group representation. It is a market-value-weighted index with each stock’s weight in the index proportionate to its market value. You cannot invest directly in an index.
2
The Morgan Stanley Capital International (MSCI) All Country World Index (ACWI) ex USA Index (Net) is a free-float-adjusted market-capitalization-weighted index that is designed to measure the equity market performance of developed and emerging markets, excluding the U.S. Source: MSCI. MSCI makes no express or implied warranties or representations and shall have no liability whatsoever with respect to any MSCI data contained herein. The MSCI data may not be further redistributed or used as a basis for other indexes or any securities or financial products. This report is not approved, reviewed, or produced by MSCI. You cannot invest directly in an index.
3
The MSCI Emerging Markets (EM) Index (Net) (USD) is a free-float-adjusted market-capitalization-weighted index that is designed to measure the equity market performance of emerging markets. You cannot invest directly in an index.
4
The Bloomberg U.S. Aggregate Bond Index is a broad-based benchmark that measures the investment-grade, U.S.-dollar-denominated, fixed-rate taxable bond market, including Treasuries, government-related and corporate securities, mortgage-backed securities (agency fixed-rate and hybrid adjustable-rate mortgage pass-throughs), asset-backed securities, and commercial mortgage-backed securities. You cannot invest directly in an index.
5
The Bloomberg Global Aggregate ex-USD Index (unhedged) is an unmanaged index that provides a broad-based measure of the global investment-grade fixed-income markets excluding the U.S.-dollar-denominated debt market. You cannot invest directly in an index.
6
The Bloomberg Municipal Bond Index is an unmanaged index composed of long-term tax-exempt bonds with a minimum credit rating of Baa. You cannot invest directly in an index.
7
The ICE BofA U.S. High Yield Index is a market-capitalization-weighted index of domestic and Yankee high yield bonds. The index tracks the performance of high yield securities traded in the U.S. bond market. You cannot invest directly in an index. Copyright 2024. ICE Data Indices, LLC. All rights reserved.
8
The Consumer Price Index (CPI) is a measure of the average change over time in the prices paid by urban consumers for a market basket of consumer goods and services. You cannot invest directly in an index.
9
The Core CPI is a measure of the average change over time in the prices paid by urban consumers for a market basket of consumer goods and services excluding energy and food prices. You cannot invest directly in an index.
10
The Core Personal Consumption Expenditures Price Index (PCE) is a measure of prices that people living in the United States, or those buying on their behalf, pay for goods and services. It is sometimes called the core PCE price index, because two categories that can have price swings – food and energy – are left out to make underlying inflation easier to see. You cannot invest directly in an index.
2 | Allspring Growth Fund
Letter to shareholders (unaudited)
October was a tough month for financial markets overall. Key global and domestic indexes all were pushed down by rising geopolitical tensions—particularly the Israel-Hamas conflict—and concerns over the Fed’s “higher for longer” monetary policy. The U.S. 10-year Treasury yield rose above 5% for the first time since 2007. Commodity prices did well as oil prices rallied in response to the prospect of oil supply disruptions from the Middle East. U.S. annualized third quarter GDP was estimated at a healthier-than-anticipated 4.9%. China’s GDP indicated surprisingly strong industrial production and retail sales, offset by ongoing weakness in its real estate sector.
In November, the market mood turned positive as cooling inflation inspired confidence that central banks could hold off on further rate hikes. Overall annual inflation in the U.S. fell to 3.1% in November while 12-month inflation in the U.K. and eurozone eased to 4.6% and 2.4%, respectively—far below their peak levels of mid-2022. Third quarter annualized U.S. GDP growth was raised to an estimated 5.2% while U.S. job totals rose by just below 200,000 in November, indicating a slight cooling of the labor market. All of this fresh evidence added to confidence for a U.S. soft economic landing, leading to a more buoyant mood heading into winter as the Federal Open Market Committee held rates steady at its December meeting.
The broad year-end rally among stocks and bonds that began in November continued through December as investors became more confident that monetary policy would ease in 2024. Supporting the bubbly market mood were a series of reports confirming lower inflationary trends in the U.S. and Europe. During the period, it appeared more likely that the U.S. economy could achieve a soft landing, cooling enough to lower inflation without the pain of a recession. However, by year-end, an expectations gap developed. Capital markets priced in a total of 1.50 percentage points in federal funds rate cuts in 2024, twice as much as the three cuts of 0.25% hinted at by Fed officials.
Financial market performance was mixed in January 2024 as U.S. stocks had modest gains while non-U.S. equities, particularly those in emerging markets, and fixed income assets were held back by central bank pushback on market optimism over rate cuts. Overall, optimism was supported by indications of a soft landing for the U.S. economy. Key data included a surprisingly strong gain of 353,000 jobs in January, an unemployment rate of just 3.7%, and a rise of just 3.1% in the CPI in January. However, that resilience helped push back expectations of a rate cut in March to a more likely second quarter initial move.
Don’t let short-term uncertainty derail long-term investment goals.
Periods of investment uncertainty can present challenges, but experience has taught us that maintaining long-term investment goals can be an effective way to plan for the future. To help you create a sound strategy based on your personal goals and risk tolerance, Allspring Funds offers more than 100 mutual funds spanning a wide range of asset classes and investment styles. Although diversification cannot guarantee an investment profit or prevent losses, we believe it can be an effective way to manage investment risk and potentially smooth out overall portfolio performance. We encourage investors to know their investments and to understand that appropriate levels of risk-taking may unlock opportunities.
Thank you for choosing to invest with Allspring Funds. We appreciate your confidence in us and remain committed to helping you meet your financial needs.
Sincerely,
Andrew Owen
President
Allspring Funds
“ In November, the market mood turned positive as cooling inflation inspired confidence that central banks could hold off on further rate hikes. ”
For further information about your fund, contact your investment professional, visit our website at allspringglobal.com, or call us directly at 1-800-222-8222.
Allspring Growth Fund | 3
Letter to shareholders (unaudited)
|
Beginning in July 2024, the Fund will be required by the Securities and Exchange Commission to send shareholders a paper copy of a new tailored shareholder report in place of the full shareholder report that you are now receiving. The tailored shareholder report will contain concise information about the Fund, including certain expense and performance information and fund statistics. If you wish to receive this new tailored shareholder report electronically, please follow the instructions on the back cover of this report. |
Other information that is currently included in the shareholder report, such as the Fund’s financial statements, will be available online and upon request, free of charge, in paper or electronic format. |
4 | Allspring Growth Fund
This page is intentionally left blank.
Performance highlights (unaudited)
Performance highlights
| The Fund seeks long-term capital appreciation. |
| Allspring Funds Management, LLC |
| Allspring Global Investments, LLC |
| Robert Gruendyke, CFA, David Nazaret, CFA, Thomas C. Ognar, CFA |
Average annual total returns (%) as of January 31, 2024 |
| | | | |
| | | | | | | | | |
| | | | | | | | | |
| | | | | | | | | |
| | | | | | | | | |
Administrator Class (SGRKX) | | | | | | | | | |
Institutional Class (SGRNX) | | | | | | | | | |
| | | | | | | | | |
Russell 3000® Growth Index5 | | | | | | | | | |
Figures quoted represent past performance, which is no guarantee of future results, and do not reflect taxes that a shareholder may pay on an investment in a fund. Investment return and principal value of an investment will fluctuate so that an investor’s shares, when redeemed, may be worth more or less than their original cost. Performance shown without sales charges would be lower if sales charges were reflected. Current performance may be lower or higher than the performance data quoted, which assumes the reinvestment of dividends and capital gains. Current month-end performance is available on the Fund’s website, allspringglobal.com.
Please keep in mind that high double-digit returns were primarily achieved during favorable market conditions. You should not expect that such favorable returns can be consistently achieved. A fund’s performance, especially for short time periods, should not be the sole factor in making your investment decision.
Index returns do not include transaction costs associated with buying and selling securities, any mutual fund fees or expenses, or any taxes. It is not possible to invest directly in an index.
For Class A shares, the maximum front-end sales charge is 5.75%. For Class C shares, the maximum contingent deferred sales charge is 1.00%. Performance including a contingent deferred sales charge assumes the sales charge for the corresponding time period. Class R6, Administrator Class and Institutional Class shares are sold without a front-end sales charge or contingent deferred sales charge.
|
| Reflects the expense ratios as stated in the most recent prospectuses. The expense ratios shown are subject to change and may differ from the annualized expense ratios shown in the Financial Highlights of this report. |
| The manager has contractually committed through November 30, 2024, to waive fees and/or reimburse expenses to the extent necessary to cap total annual fund operating expenses after fee waivers at 1.15% for Class A, 1.90% for Class C, 0.70% for Class R6, 0.96% for Administrator Class and 0.75% for Institutional Class. Brokerage commissions, stamp duty fees, interest, taxes, acquired fund fees and expenses (if any), and extraordinary expenses are excluded from the expense caps. Prior to or after the commitment expiration date, the caps may be increased or the commitment to maintain the caps may be terminated only with the approval of the Board of Trustees. Without these caps, the Fund’s returns would have been lower. The expense ratio paid by an investor is the net expense ratio (the total annual fund operating expenses after fee waivers) as stated in the prospectuses. |
| Historical performance shown for the Class R6 shares prior to their inception reflects the performance of the Institutional Class shares, and includes the higher expenses applicable to the Institutional Class shares. If these expenses had not been included, returns for the Class R6 shares would be higher. |
| The Russell 3000® Index measures the performance of the 3,000 largest U.S. companies based on total market capitalization, which represents approximately 98% of the investable U.S. equity market. You cannot invest directly in an index. |
| The Russell 3000® Growth Index measures the performance of those Russell 3000® Index companies with higher price/book ratios and higher forecasted growth values. You cannot invest directly in an index. |
Stock values fluctuate in response to the activities of individual companies and general market and economic conditions. Certain investment strategies tend to increase the total risk of an investment (relative to the broader market). This fund is exposed to foreign investment risk and smaller-company securities risk. Consult the Fund’s prospectus for additional information on these and other risks.
CFA® and Chartered Financial Analyst® are trademarks owned by CFA Institute. |
6 | Allspring Growth Fund
Performance highlights (unaudited)
Ten largest holdings (%) as of January 31, 20241 |
| |
| |
| |
| |
Meta Platforms, Inc. Class A | |
| |
| |
| |
| |
| |
| Figures represent the percentage of the Fund’s net assets. Holdings are subject to change and may have changed since the date specified. |
Sector allocation as of January 31, 20241 |
| Figures represent the percentage of the Fund’s long-term investments. Allocations are subject to change and may have changed since the date specified. |
Allspring Growth Fund | 7
Fund expenses (unaudited)
Fund expenses
As a shareholder of the Fund, you incur two types of costs: (1) transaction costs, including sales charges (loads) on purchase payments and contingent deferred sales charges (if any) on redemptions and (2) ongoing costs, including management fees, distribution (12b-1) and/or shareholder servicing fees, and other Fund expenses. This example is intended to help you understand your ongoing costs (in dollars) of investing in the Fund and to compare these costs with the ongoing costs of investing in other mutual funds.
The example is based on an investment of $1,000 invested at the beginning of the six-month period and held for the entire period from August 1, 2023 to January 31, 2024.
Actual expenses
The “Actual” line of the table below provides information about actual account values and actual expenses. You may use the information in this line, together with the amount you invested, to estimate the expenses that you paid over the period. Simply divide your account value by $1,000 (for example, an $8,600 account value divided by $1,000= 8.6), then multiply the result by the number in the “Actual” line under the heading entitled “Expenses paid during period” for your applicable class of shares to estimate the expenses you paid on your account during this period.
Hypothetical example for comparison purposes
The “Hypothetical” line of the table below provides information about hypothetical account values and hypothetical expenses based on the Fund’s actual expense ratio and an assumed rate of return of 5% per year before expenses, which is not the Fund’s actual return. The hypothetical account values and expenses may not be used to estimate the actual ending account balance or expenses you paid for the period. You may use this information to compare the ongoing costs of investing in the Fund and other funds. To do so, compare this 5% hypothetical example with the 5% hypothetical examples that appear in the shareholder reports of the other funds.
Please note that the expenses shown in the table are meant to highlight your ongoing costs only and do not reflect any transactional costs, such as sales charges (loads) and contingent deferred sales charges. Therefore, the “Hypothetical” line of the table is useful in comparing ongoing costs only, and will not help you determine the relative total costs of owning different funds. In addition, if these transactional costs were included, your costs would have been higher.
| Beginning
account value
8-1-2023 | Ending
account value
1-31-2024 | | Annualized net
expense ratio |
| | | | |
| | | | |
Hypothetical (5% return before expenses) | | | | |
| | | | |
| | | | |
Hypothetical (5% return before expenses) | | | | |
| | | | |
| | | | |
Hypothetical (5% return before expenses) | | | | |
| | | | |
| | | | |
Hypothetical (5% return before expenses) | | | | |
| | | | |
| | | | |
Hypothetical (5% return before expenses) | | | | |
| Expenses paid is equal to the annualized net expense ratio of each class multiplied by the average account value over the period, multiplied by 184 divided by 366 (to reflect the one-half-year period). |
8 | Allspring Growth Fund
Portfolio of investments—January 31, 2024 (unaudited)
| | | | | |
| | | | | | |
Communication services: 12.05% | | | | | | |
| | | | | | |
Live Nation Entertainment, Inc.† | | | | | | |
| | | | | | |
| | | | | | |
Interactive media & services: 11.00% | | | | | | |
| | | | | | |
| | | | | | |
Meta Platforms, Inc. Class A† | | | | | | |
| | | | | | |
Consumer discretionary: 15.68% | | | | | | |
| | | | | | |
| | | | | | |
| | | | | | |
| | | | | | |
Hotels, restaurants & leisure: 2.90% | | | | | | |
| | | | | | |
Chipotle Mexican Grill, Inc.† | | | | | | |
| | | | | | |
DraftKings, Inc. Class A† | | | | | | |
| | | | | | |
| | | | | | |
| | | | | | |
| | | | | | |
Boot Barn Holdings, Inc.† | | | | | | |
| | | | | | |
Floor & Decor Holdings, Inc. Class A† | | | | | | |
O’Reilly Automotive, Inc.† | | | | | | |
| | | | | | |
| | | | | | |
Textiles, apparel & luxury goods: 1.20% | | | | | | |
lululemon athletica, Inc.† | | | | | | |
| | | | | | |
| | | | | | |
| | | | | | |
| | | | | | |
| | | | | | |
Personal care products: 0.66% | | | | | | |
| | | | | | |
| | | | | | |
| | | | | | |
The accompanying notes are an integral part of these financial statements.
Allspring Growth Fund | 9
Portfolio of investments—January 31, 2024 (unaudited)
| | | | | |
| | | | | | |
| | | | | | |
LPL Financial Holdings, Inc. | | | | | | |
| | | | | | |
Tradeweb Markets, Inc. Class A | | | | | | |
| | | | | | |
Financial services: 4.64% | | | | | | |
| | | | | | |
| | | | | | |
| | | | | | |
| | | | | | |
| | | | | | |
Kinsale Capital Group, Inc. | | | | | | |
| | | | | | |
| | | | | | |
| | | | | | |
| | | | | | |
Vertex Pharmaceuticals, Inc.† | | | | | | |
| | | | | | |
Health care equipment & supplies: 5.73% | | | | | | |
| | | | | | |
| | | | | | |
Intuitive Surgical, Inc.† | | | | | | |
| | | | | | |
| | | | | | |
| | | | | | |
| | | | | | |
| | | | | | |
Health care providers & services: 0.14% | | | | | | |
| | | | | | |
Health care technology: 1.38% | | | | | | |
Veeva Systems, Inc. Class A† | | | | | | |
Life sciences tools & services: 0.30% | | | | | | |
| | | | | | |
West Pharmaceutical Services, Inc. | | | | | | |
| | | | | | |
| | | | | | |
| | | | | | |
| | | | | | |
| | | | | | |
| | | | | | |
The accompanying notes are an integral part of these financial statements.
10 | Allspring Growth Fund
Portfolio of investments—January 31, 2024 (unaudited)
| | | | | |
| | | | | | |
Aerospace & defense: 0.36% | | | | | | |
| | | | | | |
Commercial services & supplies: 2.35% | | | | | | |
Casella Waste Systems, Inc. Class A† | | | | | | |
| | | | | | |
| | | | | | |
Electrical equipment: 0.81% | | | | | | |
Array Technologies, Inc.† | | | | | | |
NEXTracker, Inc. Class A† | | | | | | |
Shoals Technologies Group, Inc. Class A† | | | | | | |
| | | | | | |
| | | | | | |
Ground transportation: 1.68% | | | | | | |
| | | | | | |
| | | | | | |
| | | | | | |
Professional services: 1.33% | | | | | | |
| | | | | | |
| | | | | | |
| | | | | | |
| | | | | | |
Information technology: 44.26% | | | | | | |
Communications equipment: 0.63% | | | | | | |
| | | | | | |
| | | | | | |
| | | | | | |
| | | | | | |
| | | | | | |
Semiconductors & semiconductor equipment: 12.23% | | | | | | |
Advanced Micro Devices, Inc.† | | | | | | |
Allegro MicroSystems, Inc.† | | | | | | |
| | | | | | |
Microchip Technology, Inc. | | | | | | |
Monolithic Power Systems, Inc. | | | | | | |
| | | | | | |
| | | | | | |
| | | | | | |
Clearwater Analytics Holdings, Inc. Class A† | | | | | | |
Crowdstrike Holdings, Inc. Class A† | | | | | | |
| | | | | | |
DoubleVerify Holdings, Inc.† | | | | | | |
The accompanying notes are an integral part of these financial statements.
Allspring Growth Fund | 11
Portfolio of investments—January 31, 2024 (unaudited)
| | | | | |
| | | | | | |
| | | | | | |
| | | | | | |
| | | | | | |
| | | | | | |
| | | | | | |
Palo Alto Networks, Inc.† | | | | | | |
Procore Technologies, Inc.† | | | | | | |
| | | | | | |
| | | | | | |
| | | | | | |
Technology hardware, storage & peripherals: 6.74% | | | | | | |
| | | | | | |
| | | | | | |
| | | | | | |
| | | | | | |
| | | | | | |
Specialized REITs : 0.37% | | | | | | |
| | | | | | |
Total common stocks (Cost $1,249,776,666) | | | | | | |
| | | | | |
Short-term investments: 0.92% | | | | | | |
Investment companies: 0.92% | | | | | | |
Allspring Government Money Market Fund Select Class♠∞ | | | | | | |
Total short-term investments (Cost $27,791,908) | | | | | | |
Total investments in securities (Cost $1,277,568,574) | | | | | | |
Other assets and liabilities, net | | | | | | |
| | | | | | |
| Non-income-earning security |
| The issuer of the security is an affiliated person of the Fund as defined in the Investment Company Act of 1940. |
| The rate represents the 7-day annualized yield at period end. |
|
| American depositary receipt |
| Real estate investment trust |
The accompanying notes are an integral part of these financial statements.
12 | Allspring Growth Fund
Portfolio of investments—January 31, 2024 (unaudited)
Investments in affiliates
An affiliated investment is an investment in which the Fund owns at least 5% of the outstanding voting shares of the issuer or as a result of other relationships, such as the Fund and the issuer having the same investment manager. Transactions with issuers that were affiliates of the Fund at the end of the period were as follows:
| | | | | Net
change in
unrealized
gains
(losses) | | | Income
from
affiliated
securities |
| | | | | | | | |
Allspring Government Money Market Fund Select Class | | | | | | | | |
The accompanying notes are an integral part of these financial statements.
Allspring Growth Fund | 13
Statement of assets and liabilities—January 31, 2024 (unaudited)
Financial statements
Statement of assets and liabilities
| |
Investments in unaffiliated securities, at value (cost $1,249,776,666) | |
Investments in affiliated securities, at value (cost $27,791,908) | |
Receivable for investments sold | |
Receivable for Fund shares sold | |
| |
Prepaid expenses and other assets | |
| |
| |
Payable for Fund shares redeemed | |
Payable for investments purchased | |
| |
Administration fees payable | |
| |
Accrued expenses and other liabilities | |
| |
| |
| |
| |
Total distributable earnings | |
| |
Computation of net asset value and offering price per share | |
| |
Shares outstanding–Class A1 | |
Net asset value per share–Class A | |
Maximum offering price per share – Class A2 | |
| |
Shares outstanding–Class C1 | |
Net asset value per share–Class C | |
| |
Shares outstanding–Class R61 | |
Net asset value per share–Class R6 | |
Net assets–Administrator Class | |
Shares outstanding–Administrator Class1 | |
Net asset value per share–Administrator Class | |
Net assets–Institutional Class | |
Shares outstanding–Institutional Class1 | |
Net asset value per share–Institutional Class | |
1 The Fund has an unlimited number of authorized shares.
2 Maximum offering price is computed as 100/94.25 of net asset value. On investments of $50,000 or more, the offering price is reduced.
The accompanying notes are an integral part of these financial statements.
14 | Allspring Growth Fund
Statement of operations—six months ended January 31, 2024 (unaudited)
Statement of operations
| |
| |
Income from affiliated securities | |
| |
| |
| |
| |
| |
| |
| |
| |
| |
| |
Shareholder servicing fees | |
| |
| |
| |
| |
| |
Custody and accounting fees | |
| |
| |
Shareholder report expenses | |
Trustees’ fees and expenses | |
| |
| |
Less: Fee waivers and/or expense reimbursements | |
| |
| |
| |
| |
| |
| |
Realized and unrealized gains (losses) on investments | |
Net realized gains on investments | |
Net change in unrealized gains (losses) on investments | |
Net realized and unrealized gains (losses) on investments | |
Net increase in net assets resulting from operations | |
The accompanying notes are an integral part of these financial statements.
Allspring Growth Fund | 15
Statement of changes in net assets
Statement of changes in net assets
|
Six months ended
January 31, 2024 (unaudited) | |
| | | | |
| | | | |
Net realized gains on investments | | | | |
Net change in unrealized gains (losses) on investments | | | | |
Net increase in net assets resulting from operations | | | | |
Distributions to shareholders from | | | | |
Net investment income and net realized gains | | | | |
| | | | |
| | | | |
| | | | |
| | | | |
| | | | |
Total distributions to shareholders | | | | |
Capital share transactions | | | | |
Proceeds from shares sold | | | | |
| | | | |
| | | | |
| | | | |
| | | | |
| | | | |
| | | | |
Reinvestment of distributions | | | | |
| | | | |
| | | | |
| | | | |
| | | | |
| | | | |
| | | | |
Payment for shares redeemed | | | | |
| | | | |
| | | | |
| | | | |
| | | | |
| | | | |
| | | | |
Net decrease in net assets resulting from capital share transactions | | | | |
Total decrease in net assets | | | | |
| | | | |
| | | | |
| | | | |
The accompanying notes are an integral part of these financial statements.
16 | Allspring Growth Fund
Financial highlights
(For a share outstanding throughout each period)
| Six months ended
January 31, 2024
(unaudited) | |
| | | | | |
Net asset value, beginning of period | | | | | | |
| | | | | | |
| | | | | | |
Net realized and unrealized gains (losses) on investments | | | | | | |
Total from investment operations | | | | | | |
Distributions to shareholders from | | | | | | |
| | | | | | |
Net asset value, end of period | | | | | | |
| | | | | | |
Ratios to average net assets (annualized) | | | | | | |
| | | | | | |
| | | | | | |
| | | | | | |
| | | | | | |
| | | | | | |
Net assets, end of period (000s omitted) | | | | | | |
| Calculated based upon average shares outstanding |
| Amount is less than $0.005. |
| Total return calculations do not include any sales charges. Returns for periods of less than one year are not annualized. |
| During the year ended July 31, 2021, the Fund received a payment from an affiliate which had a 0.01% impact on the total return. |
The accompanying notes are an integral part of these financial statements.
Allspring Growth Fund | 17
(For a share outstanding throughout each period)
| Six months ended
January 31, 2024
(unaudited) | |
| | | | | |
Net asset value, beginning of period | | | | | | |
| | | | | | |
| | | | | | |
Net realized and unrealized gains (losses) on investments | | | | | | |
Total from investment operations | | | | | | |
Distributions to shareholders from | | | | | | |
| | | | | | |
Net asset value, end of period | | | | | | |
| | | | | | |
Ratios to average net assets (annualized) | | | | | | |
| | | | | | |
| | | | | | |
| | | | | | |
| | | | | | |
| | | | | | |
Net assets, end of period (000s omitted) | | | | | | |
| Calculated based upon average shares outstanding |
| Total return calculations do not include any sales charges. Returns for periods of less than one year are not annualized. |
| During the year ended July 31, 2022, the Fund received payments from a service provider which had a 0.14% impact on the total return. |
| During the year ended July 31, 2021, the Fund received a payment from an affiliate which had a 5.92% impact on the total return. |
The accompanying notes are an integral part of these financial statements.
18 | Allspring Growth Fund
(For a share outstanding throughout each period)
| Six months ended
January 31, 2024
(unaudited) | |
| | | | | |
Net asset value, beginning of period | | | | | | |
| | | | | | |
Net realized and unrealized gains (losses) on investments | | | | | | |
Total from investment operations | | | | | | |
Distributions to shareholders from | | | | | | |
| | | | | | |
Net asset value, end of period | | | | | | |
| | | | | | |
Ratios to average net assets (annualized) | | | | | | |
| | | | | | |
| | | | | | |
| | | | | | |
| | | | | | |
| | | | | | |
Net assets, end of period (000s omitted) | | | | | | |
| Calculated based upon average shares outstanding |
| Amount is less than $0.005. |
| Returns for periods of less than one year are not annualized. |
The accompanying notes are an integral part of these financial statements.
Allspring Growth Fund | 19
(For a share outstanding throughout each period)
| Six months ended
January 31, 2024
(unaudited) | |
| | | | | |
Net asset value, beginning of period | | | | | | |
| | | | | | |
Net realized and unrealized gains (losses) on investments | | | | | | |
Total from investment operations | | | | | | |
Distributions to shareholders from | | | | | | |
| | | | | | |
Net asset value, end of period | | | | | | |
| | | | | | |
Ratios to average net assets (annualized) | | | | | | |
| | | | | | |
| | | | | | |
| | | | | | |
| | | | | | |
| | | | | | |
Net assets, end of period (000s omitted) | | | | | | |
| Calculated based upon average shares outstanding |
| Returns for periods of less than one year are not annualized. |
The accompanying notes are an integral part of these financial statements.
20 | Allspring Growth Fund
(For a share outstanding throughout each period)
| Six months ended
January 31, 2024
(unaudited) | |
| | | | | |
Net asset value, beginning of period | | | | | | |
| | | | | | |
Net realized and unrealized gains (losses) on investments | | | | | | |
Total from investment operations | | | | | | |
Distributions to shareholders from | | | | | | |
| | | | | | |
Net asset value, end of period | | | | | | |
| | | | | | |
Ratios to average net assets (annualized) | | | | | | |
| | | | | | |
| | | | | | |
| | | | | | |
| | | | | | |
| | | | | | |
Net assets, end of period (000s omitted) | | | | | | |
| Calculated based upon average shares outstanding |
| Returns for periods of less than one year are not annualized. |
The accompanying notes are an integral part of these financial statements.
Allspring Growth Fund | 21
Notes to financial statements (unaudited)
Notes to financial statements
Allspring Funds Trust (the “Trust”), a Delaware statutory trust organized on March 10, 1999, is an open-end management investment company registered under the Investment Company Act of 1940, as amended (the “1940 Act”). As an investment company, the Trust follows the accounting and reporting guidance in Financial Accounting Standards Board (“FASB”) Accounting Standards Codification Topic 946, Financial Services – Investment Companies. These financial statements report on the Allspring Growth Fund (the “Fund”) which is a diversified series of the Trust.
2.
SIGNIFICANT ACCOUNTING POLICIES
The following significant accounting policies, which are consistently followed in the preparation of the financial statements of the Fund, are in conformity with U.S. generally accepted accounting principles which require management to make estimates and assumptions that affect the reported amounts of assets and liabilities, disclosure of contingent assets and liabilities at the date of the financial statements, and the reported amounts of income and expenses during the reporting period. Actual results could differ from those estimates.
Securities valuation
All investments are valued each business day as of the close of regular trading on the New York Stock Exchange (generally 4 p.m. Eastern Time), although the Fund may deviate from this calculation time under unusual or unexpected circumstances.
Equity securities and exchange-traded funds that are listed on a foreign or domestic exchange or market are valued at the official closing price or, if none, the last sales price.
Investments in registered open-end investment companies (other than those listed on a foreign or domestic exchange or market) are valued at net asset value.
Investments which are not valued using the methods discussed above are valued at their fair value, as determined in good faith by Allspring Funds Management, LLC (“Allspring Funds Management”), which was named the valuation designee by the Board of Trustees. As the valuation designee, Allspring Funds Management is responsible for day-to-day valuation activities for the Allspring Funds. In connection with these responsibilities, Allspring Funds Management has established a Valuation Committee and has delegated to it the authority to take any actions regarding the valuation of portfolio securities that the Valuation Committee deems necessary or appropriate, including determining the fair value of portfolio securities. On a quarterly basis, the Board of Trustees receives reports of valuation actions taken by the Valuation Committee. On at least an annual basis, the Board of Trustees receives an assessment of the adequacy and effectiveness of Allspring Funds Management’s process for determining the fair value of the portfolio of investments.
Security transactions and income recognition
Securities transactions are recorded on a trade date basis. Realized gains or losses are recorded on the basis of identified cost.
Dividend income is recognized on the ex-dividend date.
Interest earned on cash balances held at the custodian is recorded as interest income.
Distributions received from REIT investments may be characterized as ordinary income, capital gains, or a return of capital to the Fund based on information provided by the REIT. The proper characterization of REIT distributions is generally not known until after the end of each calendar year. As such, estimates may be used in reporting the character of income and distributions for financial statement purposes.
Distributions to shareholders
Distributions to shareholders from net investment income and any net realized gains are recorded on the ex-dividend date and paid at least annually. Such distributions are determined in accordance with income tax regulations and may differ from U.S. generally accepted accounting principles. Dividend sources are estimated at the time of declaration. The tax character of distributions is determined as of the Fund’s fiscal year end. Therefore, a portion of the Fund’s distributions made prior to the Fund’s fiscal year end may be categorized as a tax return of capital at year end.
Federal and other taxes
The Fund intends to continue to qualify as a regulated investment company by distributing substantially all of its investment company taxable income and any net realized capital gains (after reduction for capital loss carryforwards) sufficient to relieve it from all, or substantially all, federal income taxes. Accordingly, no provision for federal income taxes was required.
The Fund’s income and federal excise tax returns and all financial records supporting those returns for the prior three fiscal years are subject to examination by the federal and Delaware revenue authorities. Management has analyzed the Fund’s tax positions taken on federal, state, and foreign tax returns, as applicable, for all open tax years and does not believe that there are any uncertain tax positions that require recognition of a tax liability.
22 | Allspring Growth Fund
Notes to financial statements (unaudited)
As of January 31, 2024, the aggregate cost of all investments for federal income tax purposes was $1,278,478,852 and the unrealized gains (losses) consisted of:
As of July 31, 2023, the Fund had a qualified late-year ordinary loss of $9,054,902 which was recognized on the first day of the current fiscal year.
Class allocations
The separate classes of shares offered by the Fund differ principally in applicable sales charges, distribution, shareholder servicing, and administration fees. Class specific expenses are charged directly to that share class. Investment income, common fund-level expenses, and realized and unrealized gains (losses) on investments are allocated daily to each class of shares based on the relative proportion of net assets of each class.
3.
FAIR VALUATION MEASUREMENTS
Fair value measurements of investments are determined within a framework that has established a fair value hierarchy based upon the various data inputs utilized in determining the value of the Fund’s investments. The three-level hierarchy gives the highest priority to unadjusted quoted prices in active markets for identical assets or liabilities (Level 1) and the lowest priority to unobservable inputs (Level 3). The Fund’s investments are classified within the fair value hierarchy based on the lowest level of input that is significant to the fair value measurement. The inputs are summarized into three broad levels as follows:
•Level 1—quoted prices in active markets for identical securities
•Level 2—other significant observable inputs (including quoted prices for similar securities, interest rates, prepayment speeds, credit risk, etc.)
•Level 3—significant unobservable inputs (including the Fund’s own assumptions in determining the fair value of investments)
The inputs or methodologies used for valuing investments in securities are not necessarily an indication of the risk associated with investing in those securities.
The following is a summary of the inputs used in valuing the Fund’s assets and liabilities as of January 31, 2024:
| | Other significant
observable inputs
(Level 2) | Significant
unobservable inputs
(Level 3) | |
| | | | |
| | | | |
| | | | |
| | | | |
| | | | |
| | | | |
| | | | |
| | | | |
| | | | |
| | | | |
| | | | |
| | | | |
| | | | |
| | | | |
| | | | |
Additional sector, industry or geographic detail, if any, is included in the Portfolio of Investments.
At January 31, 2024, the Fund did not have any transfers into/out of Level 3.
4.
TRANSACTIONS WITH AFFILIATES
Management fee
Allspring Funds Management, a wholly owned subsidiary of Allspring Global Investments Holdings, LLC, a holding company indirectly owned by certain private funds of GTCR LLC and Reverence Capital Partners, L.P., is the manager of the Fund and provides advisory and fund-level administrative services under an investment management agreement. Under the investment management agreement, Allspring Funds Management is responsible for, among other services, implementing the investment objectives and strategies of the Fund, supervising the subadviser and providing fund-level administrative
Allspring Growth Fund | 23
Notes to financial statements (unaudited)
services in connection with the Fund’s operations. As compensation for its services under the investment management agreement, Allspring Funds Management is entitled to receive a management fee at the following annual rate based on the Fund’s average daily net assets:
For the six months ended January 31, 2024, the management fee was equivalent to an annual rate of 0.72% of the Fund’s average daily net assets.
Allspring Funds Management has retained the services of a subadviser to provide daily portfolio management to the Fund. The fee for subadvisory services is borne by Allspring Funds Management. Allspring Global Investments, LLC, an affiliate of Allspring Funds Management and a wholly owned subsidiary of Allspring Global Investments Holdings, LLC, is the subadviser to the Fund and is entitled to receive a fee from Allspring Funds Management at an annual rate starting at 0.45% and declining to 0.30% as the average daily net assets of the Fund increase.
Administration fees
Under a class-level administration agreement, Allspring Funds Management provides class-level administrative services to the Fund, which includes paying fees and expenses for services provided by the transfer agent, sub-transfer agents, omnibus account servicers and record-keepers. As compensation for its services under the class-level administration agreement, Allspring Funds Management receives an annual fee which is calculated based on the average daily net assets of each class as follows:
| Class-level
administration fee |
| |
| |
| |
| |
| |
Waivers and/or expense reimbursements
Allspring Funds Management has contractually committed to waive and/or reimburse management and administration fees to the extent necessary to maintain certain net operating expense ratios for the Fund. When each class of the Fund has exceeded its expense cap, Allspring Funds Management will waive fees and/or reimburse expenses from fund-level expenses on a proportionate basis and then from class specific expenses. When only certain classes exceed their expense caps, waivers and/or reimbursements are applied against class specific expenses before fund-level expenses. Allspring Funds Management has contractually committed through November 30, 2024 to waive fees and/or reimburse expenses to the extent necessary to cap the Fund’s expenses. Prior to or after the commitment expiration date, the cap may be increased or the commitment to maintain the cap may be terminated only with the approval of the Board of Trustees. As of January 31, 2024, the contractual expense caps are as follows:
Distribution fee
The Trust has adopted a distribution plan for Class C shares pursuant to Rule 12b-1 under the 1940 Act. A distribution fee is charged to Class C shares and paid to Allspring Funds Distributor, LLC (“Allspring Funds Distributor”), the principal underwriter, an affiliate of Allspring Funds Management, at an annual rate up to 0.75% of the average daily net assets of Class C shares.
In addition, Allspring Funds Distributor is entitled to receive the front-end sales charge from the purchase of Class A shares and a contingent deferred sales charge on the redemption of certain Class A shares. Allspring Funds Distributor is also entitled to receive the contingent deferred sales charges
24 | Allspring Growth Fund
Notes to financial statements (unaudited)
from redemptions of Class C shares. For the six months ended January 31, 2024, Allspring Funds Distributor received $3,292 from the sale of Class A shares. No contingent deferred sales charges were incurred by Class A and Class C shares for the six months ended January 31, 2024.
Shareholder servicing fees
The Trust has entered into contracts with one or more shareholder servicing agents, whereby Class A, Class C and Administrator Class are charged a fee at an annual rate up to 0.25% of the average daily net assets of each respective class. A portion of these total shareholder servicing fees were paid to affiliates of the Fund.
Interfund transactions
The Fund may purchase or sell portfolio investment securities to certain affiliates pursuant to Rule 17a-7 under the 1940 Act and under procedures adopted by the Board of Trustees. The procedures have been designed to ensure that these interfund transactions, which do not incur broker commissions, are effected at current market prices. Pursuant to these procedures, the Fund did not have any interfund transactions during the six months ended January 31, 2024.
5.
INVESTMENT PORTFOLIO TRANSACTIONS
Purchases and sales of investments, excluding U.S. government obligations (if any) and short-term securities, for the six months ended January 31, 2024 were $513,944,838 and $1,015,853,286, respectively.
The Trust (excluding the money market funds), Allspring Master Trust and Allspring Variable Trust are parties to a $350,000,000 revolving credit agreement whereby the Fund is permitted to use bank borrowings for temporary or emergency purposes, such as to fund shareholder redemption requests. Interest under the credit agreement is charged to the Fund based on borrowing rate equal to the higher of the Federal Funds rate or the overnight bank funding rate in effect on that day plus a spread. In addition, an annual commitment fee based on the unused balance is allocated to each participating fund.
For the six months ended January 31, 2024, there were no borrowings by the Fund under the agreement.
As of the end of the period, the Fund concentrated its portfolio of investments in the information technology sector. A fund that invests a substantial portion of its assets in any sector may be more affected by changes in that sector than would be a fund whose investments are not heavily weighted in any sector.
Under the Fund’s organizational documents, the officers and Trustees have been granted certain indemnification rights against certain liabilities that may arise out of performance of their duties to the Fund. The Fund has entered into a separate agreement with each Trustee that converts indemnification rights currently existing under the Fund’s organizational documents into contractual rights that cannot be changed in the future without the consent of the Trustee. Additionally, in the normal course of business, the Fund may enter into contracts with service providers that contain a variety of indemnification clauses. The Fund’s maximum exposure under these arrangements is dependent on future claims that may be made against the Fund and, therefore, cannot be estimated.
Allspring Growth Fund | 25
Other information (unaudited)
Other information
Proxy voting information
A description of the policies and procedures used to determine how to vote proxies relating to portfolio securities is available without charge, upon request, by calling 1-866-259-3305, visiting our website at allspringglobal.com, or visiting the SEC website at sec.gov. Information regarding how the proxies related to portfolio securities were voted during the most recent 12-month period ended June 30 is available on the website at allspringglobal.com or by visiting the SEC website at sec.gov.
Quarterly portfolio holdings information
The Fund files its complete schedule of portfolio holdings with the SEC for the first and third quarters of each fiscal year as an exhibit to its reports on Form N-PORT. Shareholders may view the filed Form N-PORT by visiting the SEC website at sec.gov.
26 | Allspring Growth Fund
Other information (unaudited)
Board of trustees and officers
Each of the Trustees and Officers listed in the table below acts in identical capacities for each fund in the Allspring family of funds, which consists of 116 mutual funds comprising the Allspring Funds Trust, Allspring Variable Trust, Allspring Master Trust and four closed-end funds (collectively the “Fund Complex”). This table should be read in conjunction with the Prospectus and the Statement of Additional Information†. The mailing address of each Trustee and Officer is 1415 Vantage Park Drive, 3rd Floor, Charlotte, NC 28203. Each Trustee and Officer serves an indefinite term, however, each Trustee serves such term until reaching the mandatory retirement age established by the Trustees.
Independent Trustees
| | Principal occupations during past five years or longer | Current other
public company or
investment
company
directorships |
William R. Ebsworth
(Born 1957) | | Retired. From 1984 to 2013, equities analyst, portfolio manager, research director and chief investment officer at Fidelity Management and Research Company in Boston, Tokyo, and Hong Kong, and retired in 2013 as Chief Investment Officer of Fidelity Strategic Advisers, Inc. where he led a team of investment professionals managing client assets. Prior thereto, Board member of Hong Kong Securities Clearing Co., Hong Kong Options Clearing Corp., the Thailand International Fund, Ltd., Fidelity Investments Life Insurance Company, and Empire Fidelity Investments Life Insurance Company. Serves on the Investment Company Institute’s Board of Governors since 2022 and Executive Committee since 2023 as well as the Vice Chairman of the Governing Council of the Independent Directors Council since 2023. Audit Committee Chair and Investment Committee Chair of the Vincent Memorial Hospital Foundation (non-profit organization). Mr. Ebsworth is a CFA charterholder. | |
Jane A. Freeman
(Born 1953) | Trustee,
since 2015;
Chair Liaison,
| Retired. From 2012 to 2014 and 1999 to 2008, Chief Financial Officer of Scientific Learning Corporation. From 2008 to 2012, Ms. Freeman provided consulting services related to strategic business projects. Prior to 1999, Portfolio Manager at Rockefeller & Co. and Scudder, Stevens & Clark. Board member of the Harding Loevner Funds from 1996 to 2014, serving as both Lead Independent Director and chair of the Audit Committee. Board member of the Russell Exchange Traded Funds Trust from 2011 to 2012 and the chair of the Audit Committee. Ms. Freeman is also an inactive Chartered Financial Analyst. | |
Isaiah Harris, Jr.
(Born 1952) | Trustee,
since 2009;
Audit Committee Chair,
since 2019 | Retired. Member of the Advisory Board of CEF of East Central Florida. Chairman of the Board of CIGNA Corporation from 2009 to 2021, and Director from 2005 to 2008. From 2003 to 2011, Director of Deluxe Corporation. Prior thereto, President and CEO of BellSouth Advertising and Publishing Corp. from 2005 to 2007, President and CEO of BellSouth Enterprises from 2004 to 2005 and President of BellSouth Consumer Services from 2000 to 2003. Emeritus member of the Iowa State University Foundation Board of Governors. Emeritus Member of the Advisory board of Iowa State University School of Business. Advisory Board Member, Palm Harbor Academy (private school). Advisory Board Member, Fellowship of Christian Athletes. Mr. Harris is a certified public accountant (inactive status). | |
David F. Larcker
(Born 1950) | | Distinguished Visiting Fellow at the Hoover Institution since 2022. James Irvin Miller Professor of Accounting at the Graduate School of Business (Emeritus), Stanford University, Director of the Corporate Governance Research Initiative and Senior Faculty of The Rock Center for Corporate Governance since 2006. From 2005 to 2008, Professor of Accounting at the Graduate School of Business, Stanford University. Prior thereto, Ernst & Young Professor of Accounting at The Wharton School, University of Pennsylvania from 1985 to 2005. | |
Olivia S. Mitchell
(Born 1953) | | International Foundation of Employee Benefit Plans Professor since 1993, Wharton School of the University of Pennsylvania. Director of Wharton’s Pension Research Council and Boettner Center on Pensions & Retirement Research, and Research Associate at the National Bureau of Economic Research. Previously taught at Cornell University from 1978 to 1993. | |
Timothy J. Penny
(Born 1951) | Trustee,
since 1996;
Chair,
since 2018 | President and Chief Executive Officer of Southern Minnesota Initiative Foundation, a non-profit organization, since 2007. Vice Chair of the Economic Club of Minnesota, since 2007. Co-Chair of the Committee for a Responsible Federal Budget, since 1995. Member of the Board of Trustees of NorthStar Education Finance, Inc., a non-profit organization, from 2007-2022. Senior Fellow of the University of Minnesota Humphrey Institute from 1995 to 2017. | |
* Length of service dates reflect the Trustee’s commencement of service with the Trust’s predecessor entities, where applicable.
# Ms. Freeman will serve as Chair Liaison through June 2024, at which time Ms. Wheelock will assume the role.
†
The Statement of Additional Information includes additional information about the Trustees and is available, without charge, upon request, by calling 1-800-222-8222 or by visiting the website at allspringglobal.com.
Allspring Growth Fund | 27
Other information (unaudited)
| Position held and length of service* | Principal occupations during past five years or longer | Current other public company or investment company directorships |
James G. Polisson
(Born 1959) | Trustee,
since 2018; Nominating and Governance Committee Chair, since 2024 | Retired. Chief Marketing Officer, Source (ETF) UK Services, Ltd, from 2015 to 2017. From 2012 to 2015, Principal of The Polisson Group, LLC, a management consulting, corporate advisory and principal investing company. Chief Executive Officer and Managing Director at Russell Investments, Global Exchange Traded Funds from 2010 to 2012. Managing Director of Barclays Global Investors from 1998 to 2010 and Global Chief Marketing Officer for iShares and Barclays Global Investors from 2000 to 2010. Trustee of the San Francisco Mechanics’ Institute, a non- profit organization, from 2013 to 2015. Board member of the Russell Exchange Traded Fund Trust from 2011 to 2012. Director of Barclays Global Investors Holdings Deutschland GmbH from 2006 to 2009. Mr. Polisson is an attorney and has a retired status with the Massachusetts and District of Columbia Bar Associations. | |
Pamela Wheelock
(Born 1959) | Trustee,
since January 2020;
previously Trustee from
January 2018 to
| Retired. Executive and Senior Financial leadership positions in the public, private and nonprofit sectors. Interim President and CEO, McKnight Foundation, 2020. Interim Commissioner, Minnesota Department of Human Services, 2019. Chief Operating Officer, Twin Cities Habitat for Humanity, 2017-2019. Vice President for University Services, University of Minnesota, 2012- 2016. Interim President and CEO, Blue Cross and Blue Shield of Minnesota, 2011-2012. Executive Vice-President and Chief Financial Officer, Minnesota Wild, 2002-2008. Commissioner, Minnesota Department of Finance, 1999-2002. Chair of the Board of Directors of Destination Medical Center Corporation. Board member of the Minnesota Wild Foundation. | |
* Length of service dates reflect the Trustee’s commencement of service with the Trust’s predecessor entities, where applicable.
# Ms. Freeman will serve as Chair Liaison through June 2024, at which time Ms. Wheelock will assume the role.
28 | Allspring Growth Fund
Other information (unaudited)
Officers1
| Position held and
length of service | Principal occupations during past five years or longer |
| | President and Chief Executive Officer of Allspring Funds Management, LLC since 2017 and Head of Global Fund Governance of Allspring Global Investments since 2022. Prior thereto, co-president of Galliard Capital Management, LLC, an affiliate of Allspring Funds Management, LLC, from 2019 to 2022 and Head of Affiliated Managers, Allspring Global Investments, from 2014 to 2019 and Executive Vice President responsible for marketing, investments and product development for Allspring Funds Management, LLC, from 2009 to 2014. |
Jeremy DePalma
(Born 1974) | Treasurer,
since 2012
(for certain funds in
the Fund Complex);
since 2021 (for
the remaining funds in the Complex) | Senior Vice President of Allspring Funds Management, LLC since 2009. Senior Vice President of Evergreen Investment Management Company, LLC from 2008 to 2010 and head of the Fund Reporting and Control Team within Fund Administration from 2005 to 2010. |
Christopher Baker
(Born 1976) | Chief Compliance Officer,
since 2022 | Global Chief Compliance Officer for Allspring Global Investments since 2022. Prior thereto, Chief Compliance Officer for State Street Global Advisors from 2018 to 2021. Senior Compliance Officer for the State Street divisions of Alternative Investment Solutions, Sector Solutions, and Global Marketing from 2015 to 2018. From 2010 to 2015 Vice President, Global Head of Investment and Marketing Compliance for State Street Global Advisors. |
Matthew Prasse
(Born 1983) | Chief Legal Officer,
since 2022;
Secretary,
since 2021 | Senior Counsel of the Allspring Legal Department since 2021. Senior Counsel of the Wells Fargo Legal Department from 2018 to 2021. Previously, Counsel for Barings LLC from 2015 to 2018. Prior to joining Barings, Associate at Morgan, Lewis & Bockius LLP from 2008 to 2015. |
1 For those Officers with tenures at Allspring Global Investments and/or Allspring Funds Management, LLC that began prior to 2021, such tenures include years of service during which these businesses/entities were known as Wells Fargo Asset Management and Wells Fargo Funds Management, LLC, respectively.
Allspring Growth Fund | 29
For more information
More information about Allspring Funds is available free upon request. To obtain literature, please write, visit the Fund’s website, or call:
Allspring Funds
P.O. Box 219967
Kansas City, MO 64121-9967
Website: allspringglobal.com
Individual investors: 1-800-222-8222
Retail investment professionals: 1-888-877-9275
Institutional investment professionals: 1-800-260-5969
This report and the financial statements contained herein are submitted for the general information of the shareholders of the Fund. If this report is used for promotional purposes, distribution of the report must be accompanied or preceded by a current prospectus. Before investing, please consider the investment objectives, risks, charges, and expenses of the investment. For a current prospectus and, if available, a summary prospectus, containing this information, call 1-800-222-8222 or visit the Fund’s website at allspringglobal.com. Read the prospectus carefully before you invest or send money.
Allspring Global InvestmentsTM is the trade name for the asset management firms of Allspring Global Investments Holdings, LLC, a holding company indirectly owned by certain private funds of GTCR LLC and Reverence Capital Partners, L.P. These firms include but are not limited to Allspring Global Investments, LLC, and Allspring Funds Management, LLC. Certain products managed by Allspring entities are distributed by Allspring Funds Distributor, LLC (a broker-dealer and Member FINRA/SIPC).
This material is for general informational and educational purposes only and is NOT intended to provide investment advice or a recommendation of any kind - including a recommendation for any specific investment, strategy, or plan.
© 2024 Allspring Global Investments Holdings, LLC. All rights reserved.
ALL-02052024-wwkigerx 03-24
SAR3009 01-24
Allspring Large Cap Core Fund
Semi-Annual Report
January 31, 2024
The views expressed and any forward-looking statements are as of January 31, 2024, unless otherwise noted, and are those of the Fund’s portfolio managers and/or Allspring Global Investments. Discussions of individual securities or the markets generally are not intended as individual recommendations. Future events or results may vary significantly from those expressed in any forward-looking statements. The views expressed are subject to change at any time in response to changing circumstances in the market. Allspring Global Investments disclaims any obligation to publicly update or revise any views expressed or forward-looking statements.
Allspring Large Cap Core Fund | 1
Letter to shareholders (unaudited)
Andrew Owen
President
Allspring Funds
Dear Shareholder:
We are pleased to offer you this semi-annual report for the Allspring Large Cap Core Fund for the six-month period that ended January 31, 2024. Globally, stocks and bonds experienced high levels of volatility throughout the period. The market was focused on persistently high inflation and the impact of ongoing aggressive central bank rate hikes. Riskier assets rallied as investors anticipated an end to the tight monetary policy despite concerns of a possible recession.
For the period, U.S. stocks, based on the S&P 500 Index,1 returned 6.43%. International stocks, as measured by the MSCI ACWI ex USA Index (Net),2 gained 0.48% while the MSCI EM Index (Net) (USD),3 returned -6.00%. Among bond indexes, the Bloomberg U.S. Aggregate Bond Index4 returned 3.15%, the Bloomberg Global Aggregate ex-USD Index (unhedged)5 gained 1.15%, the Bloomberg Municipal Bond Index6 returned 2.70%, and the ICE BofA U.S. High Yield Index7 gained 6.17%.
Still focused on high inflation and elevated central bank rates, markets were volatile.
The six-month period began with stocks retreating in August after a July rally while monthly bond returns were flat overall. Increased global market volatility reflected unease over the Chinese property market being stressed along with weak Chinese economic data. However, speculation grew over a possible end to the Federal Reserve’s (Fed’s) campaign of interest rate increases or at least a pause in September. U.S. economic data generally remained solid, with resilient job market data and inflation ticking up slightly in August as the annual Consumer Price Index (CPI)8 rose 3.7%. However, the three-month trend for Core CPI9 stood at an annualized 2.4%.
Stocks and bonds both had negative overall returns in September as investors were disappointed by the Fed’s determination not to lower interest rates until it knows it has vanquished persistently high inflation. As of September, the two primary gauges of U.S. inflation—the annual Core Personal Consumption Expenditures Price Index10 and the CPI—both stood at roughly 4%, twice as high as the Fed’s oft-stated 2% target. The month ended with the prospect of yet another U.S. government shutdown, averted at least temporarily but looming later in the year.
1
The S&P 500 Index consists of 500 stocks chosen for market size, liquidity, and industry group representation. It is a market-value-weighted index with each stock’s weight in the index proportionate to its market value. You cannot invest directly in an index.
2
The Morgan Stanley Capital International (MSCI) All Country World Index (ACWI) ex USA Index (Net) is a free-float-adjusted market-capitalization-weighted index that is designed to measure the equity market performance of developed and emerging markets, excluding the U.S. Source: MSCI. MSCI makes no express or implied warranties or representations and shall have no liability whatsoever with respect to any MSCI data contained herein. The MSCI data may not be further redistributed or used as a basis for other indexes or any securities or financial products. This report is not approved, reviewed, or produced by MSCI. You cannot invest directly in an index.
3
The MSCI Emerging Markets (EM) Index (Net) (USD) is a free-float-adjusted market-capitalization-weighted index that is designed to measure the equity market performance of emerging markets. You cannot invest directly in an index.
4
The Bloomberg U.S. Aggregate Bond Index is a broad-based benchmark that measures the investment-grade, U.S.-dollar-denominated, fixed-rate taxable bond market, including Treasuries, government-related and corporate securities, mortgage-backed securities (agency fixed-rate and hybrid adjustable-rate mortgage pass-throughs), asset-backed securities, and commercial mortgage-backed securities. You cannot invest directly in an index.
5
The Bloomberg Global Aggregate ex-USD Index (unhedged) is an unmanaged index that provides a broad-based measure of the global investment-grade fixed-income markets excluding the U.S.-dollar-denominated debt market. You cannot invest directly in an index.
6
The Bloomberg Municipal Bond Index is an unmanaged index composed of long-term tax-exempt bonds with a minimum credit rating of Baa. You cannot invest directly in an index.
7
The ICE BofA U.S. High Yield Index is a market-capitalization-weighted index of domestic and Yankee high yield bonds. The index tracks the performance of high yield securities traded in the U.S. bond market. You cannot invest directly in an index. Copyright 2024. ICE Data Indices, LLC. All rights reserved.
8
The Consumer Price Index (CPI) is a measure of the average change over time in the prices paid by urban consumers for a market basket of consumer goods and services. You cannot invest directly in an index.
9
The Core CPI is a measure of the average change over time in the prices paid by urban consumers for a market basket of consumer goods and services excluding energy and food prices. You cannot invest directly in an index.
10
The Core Personal Consumption Expenditures Price Index (PCE) is a measure of prices that people living in the United States, or those buying on their behalf, pay for goods and services. It is sometimes called the core PCE price index, because two categories that can have price swings – food and energy – are left out to make underlying inflation easier to see. You cannot invest directly in an index.
2 | Allspring Large Cap Core Fund
Letter to shareholders (unaudited)
October was a tough month for financial markets overall. Key global and domestic indexes all were pushed down by rising geopolitical tensions—particularly the Israel-Hamas conflict—and concerns over the Fed’s “higher for longer” monetary policy. The U.S. 10-year Treasury yield rose above 5% for the first time since 2007. Commodity prices did well as oil prices rallied in response to the prospect of oil supply disruptions from the Middle East. U.S. annualized third quarter GDP was estimated at a healthier-than-anticipated 4.9%. China’s GDP indicated surprisingly strong industrial production and retail sales, offset by ongoing weakness in its real estate sector.
In November, the market mood turned positive as cooling inflation inspired confidence that central banks could hold off on further rate hikes. Overall annual inflation in the U.S. fell to 3.1% in November while 12-month inflation in the U.K. and eurozone eased to 4.6% and 2.4%, respectively—far below their peak levels of mid-2022. Third quarter annualized U.S. GDP growth was raised to an estimated 5.2% while U.S. job totals rose by just below 200,000 in November, indicating a slight cooling of the labor market. All of this fresh evidence added to confidence for a U.S. soft economic landing, leading to a more buoyant mood heading into winter as the Federal Open Market Committee held rates steady at its December meeting.
The broad year-end rally among stocks and bonds that began in November continued through December as investors became more confident that monetary policy would ease in 2024. Supporting the bubbly market mood were a series of reports confirming lower inflationary trends in the U.S. and Europe. During the period, it appeared more likely that the U.S. economy could achieve a soft landing, cooling enough to lower inflation without the pain of a recession. However, by year-end, an expectations gap developed. Capital markets priced in a total of 1.50 percentage points in federal funds rate cuts in 2024, twice as much as the three cuts of 0.25% hinted at by Fed officials.
Financial market performance was mixed in January 2024 as U.S. stocks had modest gains while non-U.S. equities, particularly those in emerging markets, and fixed income assets were held back by central bank pushback on market optimism over rate cuts. Overall, optimism was supported by indications of a soft landing for the U.S. economy. Key data included a surprisingly strong gain of 353,000 jobs in January, an unemployment rate of just 3.7%, and a rise of just 3.1% in the CPI in January. However, that resilience helped push back expectations of a rate cut in March to a more likely second quarter initial move.
Don’t let short-term uncertainty derail long-term investment goals.
Periods of investment uncertainty can present challenges, but experience has taught us that maintaining long-term investment goals can be an effective way to plan for the future. To help you create a sound strategy based on your personal goals and risk tolerance, Allspring Funds offers more than 100 mutual funds spanning a wide range of asset classes and investment styles. Although diversification cannot guarantee an investment profit or prevent losses, we believe it can be an effective way to manage investment risk and potentially smooth out overall portfolio performance. We encourage investors to know their investments and to understand that appropriate levels of risk-taking may unlock opportunities.
Thank you for choosing to invest with Allspring Funds. We appreciate your confidence in us and remain committed to helping you meet your financial needs.
Sincerely,
Andrew Owen
President
Allspring Funds
“ In November, the market mood turned positive as cooling inflation inspired confidence that central banks could hold off on further rate hikes. ”
For further information about your fund, contact your investment professional, visit our website at allspringglobal.com, or call us directly at 1-800-222-8222.
Allspring Large Cap Core Fund | 3
Letter to shareholders (unaudited)
|
Beginning in July 2024, the Fund will be required by the Securities and Exchange Commission to send shareholders a paper copy of a new tailored shareholder report in place of the full shareholder report that you are now receiving. The tailored shareholder report will contain concise information about the Fund, including certain expense and performance information and fund statistics. If you wish to receive this new tailored shareholder report electronically, please follow the instructions on the back cover of this report. |
Other information that is currently included in the shareholder report, such as the Fund’s financial statements, will be available online and upon request, free of charge, in paper or electronic format. |
4 | Allspring Large Cap Core Fund
This page is intentionally left blank.
Performance highlights (unaudited)
Performance highlights
| The Fund seeks long-term capital appreciation. |
| Allspring Funds Management, LLC |
| Allspring Global Investments, LLC |
| John R. Campbell, CFA, Vince Fioramonti, CFA |
Average annual total returns (%) as of January 31, 2024 |
| | | | |
| | | | | | | | | |
| | | | | | | | | |
| | | | | | | | | |
| | | | | | | | | |
Administrator Class (WFLLX) | | | | | | | | | |
Institutional Class (EGOIX) | | | | | | | | | |
| | | | | | | | | |
Figures quoted represent past performance, which is no guarantee of future results, and do not reflect taxes that a shareholder may pay on an investment in a fund. Investment return and principal value of an investment will fluctuate so that an investor’s shares, when redeemed, may be worth more or less than their original cost. Performance shown without sales charges would be lower if sales charges were reflected. Current performance may be lower or higher than the performance data quoted, which assumes the reinvestment of dividends and capital gains. Current month-end performance is available on the Fund’s website, allspringglobal.com.
Index returns do not include transaction costs associated with buying and selling securities, any mutual fund fees or expenses, or any taxes. It is not possible to invest directly in an index.
For Class A shares, the maximum front-end sales charge is 5.75%. For Class C shares, the maximum contingent deferred sales charge is 1.00%. Performance including a contingent deferred sales charge assumes the sales charge for the corresponding time period. Class R6, Administrator Class and Institutional Class shares are sold without a front-end sales charge or contingent deferred sales charge.
|
| Reflects the expense ratios as stated in the most recent prospectuses. The expense ratios shown are subject to change and may differ from the annualized expense ratios shown in the Financial Highlights of this report. |
| The manager has contractually committed through November 30, 2024, to waive fees and/or reimburse expenses to the extent necessary to cap total annual fund operating expenses after fee waivers at 1.07% for Class A, 1.82% for Class C, 0.65% for Class R6, 0.97% for Administrator Class and 0.67% for Institutional Class. Brokerage commissions, stamp duty fees, interest, taxes, acquired fund fees and expenses (if any), and extraordinary expenses are excluded from the expense caps. Prior to or after the commitment expiration date, the caps may be increased or the commitment to maintain the caps may be terminated only with the approval of the Board of Trustees. Without these caps, the Fund’s returns would have been lower. The expense ratio paid by an investor is the net expense ratio (the total annual fund operating expenses after fee waivers) as stated in the prospectuses. |
| Historical performance shown for the Class R6 shares prior to their inception reflects the performance of the Institutional Class shares, and includes the higher expenses applicable to the Institutional Class shares. If these expenses had not been included, returns for the Class R6 shares would be higher. |
| The S&P 500 Index consists of 500 stocks chosen for market size, liquidity, and industry group representation. It is a market-value-weighted index with each stock’s weight in the index proportionate to its market value. You cannot invest directly in an index. |
Stock values fluctuate in response to the activities of individual companies and general market and economic conditions. Certain investment strategies tend to increase the total risk of an investment (relative to the broader market). This fund is exposed to foreign investment risk and focused portfolio risk. Consult the Fund’s prospectus for additional information on these and other risks.
CFA® and Chartered Financial Analyst® are trademarks owned by CFA Institute. |
6 | Allspring Large Cap Core Fund
Performance highlights (unaudited)
Ten largest holdings (%) as of January 31, 20241 |
| |
| |
| |
| |
| |
| |
Royal Caribbean Cruises Ltd. | |
| |
| |
| |
| Figures represent the percentage of the Fund’s net assets. Holdings are subject to change and may have changed since the date specified. |
Sector allocation as of January 31, 20241 |
| Figures represent the percentage of the Fund’s long-term investments. Allocations are subject to change and may have changed since the date specified. |
Allspring Large Cap Core Fund | 7
Fund expenses (unaudited)
Fund expenses
As a shareholder of the Fund, you incur two types of costs: (1) transaction costs, including sales charges (loads) on purchase payments and contingent deferred sales charges (if any) on redemptions and (2) ongoing costs, including management fees, distribution (12b-1) and/or shareholder servicing fees, and other Fund expenses. This example is intended to help you understand your ongoing costs (in dollars) of investing in the Fund and to compare these costs with the ongoing costs of investing in other mutual funds.
The example is based on an investment of $1,000 invested at the beginning of the six-month period and held for the entire period from August 1, 2023 to January 31, 2024.
Actual expenses
The “Actual” line of the table below provides information about actual account values and actual expenses. You may use the information in this line, together with the amount you invested, to estimate the expenses that you paid over the period. Simply divide your account value by $1,000 (for example, an $8,600 account value divided by $1,000= 8.6), then multiply the result by the number in the “Actual” line under the heading entitled “Expenses paid during period” for your applicable class of shares to estimate the expenses you paid on your account during this period.
Hypothetical example for comparison purposes
The “Hypothetical” line of the table below provides information about hypothetical account values and hypothetical expenses based on the Fund’s actual expense ratio and an assumed rate of return of 5% per year before expenses, which is not the Fund’s actual return. The hypothetical account values and expenses may not be used to estimate the actual ending account balance or expenses you paid for the period. You may use this information to compare the ongoing costs of investing in the Fund and other funds. To do so, compare this 5% hypothetical example with the 5% hypothetical examples that appear in the shareholder reports of the other funds.
Please note that the expenses shown in the table are meant to highlight your ongoing costs only and do not reflect any transactional costs, such as sales charges (loads) and contingent deferred sales charges. Therefore, the “Hypothetical” line of the table is useful in comparing ongoing costs only, and will not help you determine the relative total costs of owning different funds. In addition, if these transactional costs were included, your costs would have been higher.
| Beginning
account value
8-1-2023 | Ending
account value
1-31-2024 | | Annualized net
expense ratio |
| | | | |
| | | | |
Hypothetical (5% return before expenses) | | | | |
| | | | |
| | | | |
Hypothetical (5% return before expenses) | | | | |
| | | | |
| | | | |
Hypothetical (5% return before expenses) | | | | |
| | | | |
| | | | |
Hypothetical (5% return before expenses) | | | | |
| | | | |
| | | | |
Hypothetical (5% return before expenses) | | | | |
| Expenses paid is equal to the annualized net expense ratio of each class multiplied by the average account value over the period, multiplied by 184 divided by 366 (to reflect the one-half-year period). |
8 | Allspring Large Cap Core Fund
Portfolio of investments—January 31, 2024 (unaudited)
| | | | | |
| | | | | | |
Communication services: 5.48% | | | | | | |
Interactive media & services: 3.78% | | | | | | |
| | | | | | |
| | | | | | |
| | | | | | |
Consumer discretionary: 14.52% | | | | | | |
| | | | | | |
| | | | | | |
Hotels, restaurants & leisure: 2.33% | | | | | | |
Royal Caribbean Cruises Ltd.† | | | | | | |
Household durables: 4.29% | | | | | | |
| | | | | | |
| | | | | | |
| | | | | | |
| | | | | | |
O’Reilly Automotive, Inc.† | | | | | | |
| | | | | | |
| | | | | | |
| | | | | | |
| | | | | | |
Consumer staples distribution & retail : 2.68% | | | | | | |
| | | | | | |
| | | | | | |
Archer-Daniels-Midland Co. | | | | | | |
| | | | | | |
Energy equipment & services: 1.55% | | | | | | |
| | | | | | |
Oil, gas & consumable fuels: 4.75% | | | | | | |
| | | | | | |
| | | | | | |
| | | | | | |
| | | | | | |
| | | | | | |
| | | | | | |
| | | | | | |
Citizens Financial Group, Inc. | | | | | | |
First Citizens BancShares, Inc. Class A | | | | | | |
| | | | | | |
| | | | | | |
The accompanying notes are an integral part of these financial statements.
Allspring Large Cap Core Fund | 9
Portfolio of investments—January 31, 2024 (unaudited)
| | | | | |
| | | | | | |
Goldman Sachs Group, Inc. | | | | | | |
Virtu Financial, Inc. Class A | | | | | | |
| | | | | | |
Financial services: 2.06% | | | | | | |
| | | | | | |
| | | | | | |
| | | | | | |
| | | | | | |
| | | | | | |
Regeneron Pharmaceuticals, Inc.† | | | | | | |
United Therapeutics Corp.† | | | | | | |
| | | | | | |
Health care equipment & supplies: 3.87% | | | | | | |
Edwards Lifesciences Corp.† | | | | | | |
Intuitive Surgical, Inc.† | | | | | | |
| | | | | | |
Health care providers & services: 3.54% | | | | | | |
| | | | | | |
| | | | | | |
| | | | | | |
| | | | | | |
| | | | | | |
| | | | | | |
Commercial services & supplies: 1.82% | | | | | | |
| | | | | | |
Construction & engineering: 1.89% | | | | | | |
| | | | | | |
Electrical equipment: 1.95% | | | | | | |
| | | | | | |
| | | | | | |
| | | | | | |
Information technology: 27.13% | | | | | | |
Communications equipment: 2.26% | | | | | | |
| | | | | | |
Semiconductors & semiconductor equipment: 8.35% | | | | | | |
| | | | | | |
| | | | | | |
| | | | | | |
| | | | | | |
| | | | | | |
The accompanying notes are an integral part of these financial statements.
10 | Allspring Large Cap Core Fund
Portfolio of investments—January 31, 2024 (unaudited)
| | | | | |
| | | | | | |
| | | | | | |
Cadence Design Systems, Inc.† | | | | | | |
| | | | | | |
| | | | | | |
| | | | | | |
Technology hardware, storage & peripherals: 4.65% | | | | | | |
| | | | | | |
| | | | | | |
| | | | | | |
CF Industries Holdings, Inc. | | | | | | |
| | | | | | |
| | | | | | |
Reliance Steel & Aluminum Co. | | | | | | |
| | | | | | |
| | | | | | |
| | | | | | |
Simon Property Group, Inc. | | | | | | |
Specialized REITs : 1.50% | | | | | | |
| | | | | | |
Total common stocks (Cost $306,865,330) | | | | | | |
| | | | | |
Short-term investments: 1.11% | | | | | | |
Investment companies: 1.11% | | | | | | |
Allspring Government Money Market Fund Select Class♠∞ | | | | | | |
Total short-term investments (Cost $5,183,479) | | | | | | |
Total investments in securities (Cost $312,048,809) | | | | | | |
Other assets and liabilities, net | | | | | | |
| | | | | | |
| Non-income-earning security |
| The issuer of the security is an affiliated person of the Fund as defined in the Investment Company Act of 1940. |
| The rate represents the 7-day annualized yield at period end. |
|
| Real estate investment trust |
The accompanying notes are an integral part of these financial statements.
Allspring Large Cap Core Fund | 11
Portfolio of investments—January 31, 2024 (unaudited)
Investments in affiliates
An affiliated investment is an investment in which the Fund owns at least 5% of the outstanding voting shares of the issuer or as a result of other relationships, such as the Fund and the issuer having the same investment manager. Transactions with issuers that were affiliates of the Fund at the end of the period were as follows:
| | | | | Net
change in
unrealized
gains
(losses) | | | Income
from
affiliated
securities |
| | | | | | | | |
Allspring Government Money Market Fund Select Class | | | | | | | | |
Futures contracts
The accompanying notes are an integral part of these financial statements.
12 | Allspring Large Cap Core Fund
Statement of assets and liabilities—January 31, 2024 (unaudited)
Financial statements
Statement of assets and liabilities
| |
Investments in unaffiliated securities, at value (cost $306,865,330) | |
Investments in affiliated securities, at value (cost $5,183,479) | |
Cash at broker segregated for futures contracts | |
Receivable for Fund shares sold | |
| |
Prepaid expenses and other assets | |
| |
| |
Payable for Fund shares redeemed | |
| |
Shareholder servicing fees payable | |
Administration fees payable | |
Payable for daily variation margin on open futures contracts | |
Distribution fees payable | |
Accrued expenses and other liabilities | |
| |
| |
| |
| |
Total distributable earnings | |
| |
Computation of net asset value and offering price per share | |
| |
Shares outstanding–Class A1 | |
Net asset value per share–Class A | |
Maximum offering price per share – Class A2 | |
| |
Shares outstanding–Class C1 | |
Net asset value per share–Class C | |
| |
Shares outstanding–Class R61 | |
Net asset value per share–Class R6 | |
Net assets–Administrator Class | |
Shares outstanding–Administrator Class1 | |
Net asset value per share–Administrator Class | |
Net assets–Institutional Class | |
Shares outstanding–Institutional Class1 | |
Net asset value per share–Institutional Class | |
1 The Fund has an unlimited number of authorized shares.
2 Maximum offering price is computed as 100/94.25 of net asset value. On investments of $50,000 or more, the offering price is reduced.
The accompanying notes are an integral part of these financial statements.
Allspring Large Cap Core Fund | 13
Statement of operations—six months ended January 31, 2024 (unaudited)
Statement of operations
| |
| |
Income from affiliated securities | |
| |
| |
| |
| |
| |
| |
| |
| |
| |
| |
Shareholder servicing fees | |
| |
| |
| |
| |
| |
Custody and accounting fees | |
| |
| |
Shareholder report expenses | |
Trustees’ fees and expenses | |
| |
| |
Less: Fee waivers and/or expense reimbursements | |
| |
| |
| |
| |
| |
| |
Realized and unrealized gains (losses) on investments | |
| |
| |
| |
Net realized gains on investments | |
Net change in unrealized gains (losses) on | |
| |
| |
Net change in unrealized gains (losses) on investments | |
Net realized and unrealized gains (losses) on investments | |
Net increase in net assets resulting from operations | |
The accompanying notes are an integral part of these financial statements.
14 | Allspring Large Cap Core Fund
Statement of changes in net assets
Statement of changes in net assets
|
Six months ended
January 31, 2024 (unaudited) | |
| | | | |
| | | | |
Net realized gains on investments | | | | |
Net change in unrealized gains (losses) on investments | | | | |
Net increase in net assets resulting from operations | | | | |
Distributions to shareholders from | | | | |
Net investment income and net realized gains | | | | |
| | | | |
| | | | |
| | | | |
| | | | |
| | | | |
| | | | |
Total distributions to shareholders | | | | |
Capital share transactions | | | | |
Proceeds from shares sold | | | | |
| | | | |
| | | | |
| | | | |
| | | | |
| | | | |
| | | | |
| | | | |
Reinvestment of distributions | | | | |
| | | | |
| | | | |
| | | | |
| | | | |
| | | | |
| | | | |
| | | | |
1 For the period from August 1, 2022 to June 16, 2023. Effective at the close of business on June 16, 2023, Class R shares were converted to Class A shares and are no longer offered by the Fund.
The accompanying notes are an integral part of these financial statements.
Allspring Large Cap Core Fund | 15
Statement of changes in net assets
| Six months ended January 31, 2024 (unaudited) | |
| | | | |
Payment for shares redeemed | | | | |
| | | | |
| | | | |
| | | | |
| | | | |
| | | | |
| | | | |
| | | | |
Net increase (decrease) in net assets resulting from capital share transactions | | | | |
Total increase (decrease) in net assets | | | | |
| | | | |
| | | | |
| | | | |
1 For the period from August 1, 2022 to June 16, 2023. Effective at the close of business on June 16, 2023, Class R shares were converted to Class A shares and are no longer offered by the Fund.
The accompanying notes are an integral part of these financial statements.
16 | Allspring Large Cap Core Fund
Financial highlights
(For a share outstanding throughout each period)
| Six months ended
January 31, 2024
(unaudited) | |
| | | | | |
Net asset value, beginning of period | | | | | | |
| | | | | | |
Net realized and unrealized gains (losses) on investments | | | | | | |
Total from investment operations | | | | | | |
Distributions to shareholders from | | | | | | |
| | | | | | |
| | | | | | |
Total distributions to shareholders | | | | | | |
Net asset value, end of period | | | | | | |
| | | | | | |
Ratios to average net assets (annualized) | | | | | | |
| | | | | | |
| | | | | | |
| | | | | | |
| | | | | | |
| | | | | | |
Net assets, end of period (000s omitted) | | | | | | |
| Calculated based upon average shares outstanding |
| Total return calculations do not include any sales charges. Returns for periods of less than one year are not annualized. |
The accompanying notes are an integral part of these financial statements.
Allspring Large Cap Core Fund | 17
(For a share outstanding throughout each period)
| Six months ended
January 31, 2024
(unaudited) | |
| | | | | |
Net asset value, beginning of period | | | | | | |
Net investment income (loss) | | | | | | |
Net realized and unrealized gains (losses) on investments | | | | | | |
Total from investment operations | | | | | | |
Distributions to shareholders from | | | | | | |
| | | | | | |
| | | | | | |
Total distributions to shareholders | | | | | | |
Net asset value, end of period | | | | | | |
| | | | | | |
Ratios to average net assets (annualized) | | | | | | |
| | | | | | |
| | | | | | |
Net investment income (loss) | | | | | | |
| | | | | | |
| | | | | | |
Net assets, end of period (000s omitted) | | | | | | |
| Calculated based upon average shares outstanding |
| Total return calculations do not include any sales charges. Returns for periods of less than one year are not annualized. |
The accompanying notes are an integral part of these financial statements.
18 | Allspring Large Cap Core Fund
(For a share outstanding throughout each period)
| Six months ended
January 31, 2024
(unaudited) | |
| | | | | |
Net asset value, beginning of period | | | | | | |
| | | | | | |
Net realized and unrealized gains (losses) on investments | | | | | | |
Total from investment operations | | | | | | |
Distributions to shareholders from | | | | | | |
| | | | | | |
| | | | | | |
Total distributions to shareholders | | | | | | |
Net asset value, end of period | | | | | | |
| | | | | | |
Ratios to average net assets (annualized) | | | | | | |
| | | | | | |
| | | | | | |
| | | | | | |
| | | | | | |
| | | | | | |
Net assets, end of period (000s omitted) | | | | | | |
| Calculated based upon average shares outstanding |
| Returns for periods of less than one year are not annualized. |
The accompanying notes are an integral part of these financial statements.
Allspring Large Cap Core Fund | 19
(For a share outstanding throughout each period)
| Six months ended
January 31, 2024
(unaudited) | |
| | | | | |
Net asset value, beginning of period | | | | | | |
| | | | | | |
Net realized and unrealized gains (losses) on investments | | | | | | |
Total from investment operations | | | | | | |
Distributions to shareholders from | | | | | | |
| | | | | | |
| | | | | | |
Total distributions to shareholders | | | | | | |
Net asset value, end of period | | | | | | |
| | | | | | |
Ratios to average net assets (annualized) | | | | | | |
| | | | | | |
| | | | | | |
| | | | | | |
| | | | | | |
| | | | | | |
Net assets, end of period (000s omitted) | | | | | | |
| Calculated based upon average shares outstanding |
| Returns for periods of less than one year are not annualized. |
The accompanying notes are an integral part of these financial statements.
20 | Allspring Large Cap Core Fund
(For a share outstanding throughout each period)
| Six months ended
January 31, 2024
(unaudited) | |
| | | | | |
Net asset value, beginning of period | | | | | | |
| | | | | | |
Net realized and unrealized gains (losses) on investments | | | | | | |
Total from investment operations | | | | | | |
Distributions to shareholders from | | | | | | |
| | | | | | |
| | | | | | |
Total distributions to shareholders | | | | | | |
Net asset value, end of period | | | | | | |
| | | | | | |
Ratios to average net assets (annualized) | | | | | | |
| | | | | | |
| | | | | | |
| | | | | | |
| | | | | | |
| | | | | | |
Net assets, end of period (000s omitted) | | | | | | |
| Calculated based upon average shares outstanding |
| Returns for periods of less than one year are not annualized. |
The accompanying notes are an integral part of these financial statements.
Allspring Large Cap Core Fund | 21
Notes to financial statements (unaudited)
Notes to financial statements
Allspring Funds Trust (the “Trust”), a Delaware statutory trust organized on March 10, 1999, is an open-end management investment company registered under the Investment Company Act of 1940, as amended (the “1940 Act”). As an investment company, the Trust follows the accounting and reporting guidance in Financial Accounting Standards Board (“FASB”) Accounting Standards Codification Topic 946, Financial Services – Investment Companies. These financial statements report on the Allspring Large Cap Core Fund (the “Fund”) which is a diversified series of the Trust.
2.
SIGNIFICANT ACCOUNTING POLICIES
The following significant accounting policies, which are consistently followed in the preparation of the financial statements of the Fund, are in conformity with U.S. generally accepted accounting principles which require management to make estimates and assumptions that affect the reported amounts of assets and liabilities, disclosure of contingent assets and liabilities at the date of the financial statements, and the reported amounts of income and expenses during the reporting period. Actual results could differ from those estimates.
Securities valuation
All investments are valued each business day as of the close of regular trading on the New York Stock Exchange (generally 4 p.m. Eastern Time), although the Fund may deviate from this calculation time under unusual or unexpected circumstances.
Equity securities, exchange-traded funds and futures contracts that are listed on a foreign or domestic exchange or market are valued at the official closing price or, if none, the last sales price.
Investments in registered open-end investment companies (other than those listed on a foreign or domestic exchange or market) are valued at net asset value.
Investments which are not valued using the methods discussed above are valued at their fair value, as determined in good faith by Allspring Funds Management, LLC (“Allspring Funds Management”), which was named the valuation designee by the Board of Trustees. As the valuation designee, Allspring Funds Management is responsible for day-to-day valuation activities for the Allspring Funds. In connection with these responsibilities, Allspring Funds Management has established a Valuation Committee and has delegated to it the authority to take any actions regarding the valuation of portfolio securities that the Valuation Committee deems necessary or appropriate, including determining the fair value of portfolio securities. On a quarterly basis, the Board of Trustees receives reports of valuation actions taken by the Valuation Committee. On at least an annual basis, the Board of Trustees receives an assessment of the adequacy and effectiveness of Allspring Funds Management’s process for determining the fair value of the portfolio of investments.
Futures contracts
Futures contracts are agreements between the Fund and a counterparty to buy or sell a specific amount of a commodity, financial instrument or currency at a specified price and on a specified date. The Fund may buy and sell futures contracts in order to gain exposure to, or protect against, changes in security values and is subject to equity price risk. The primary risks associated with the use of futures contracts are the imperfect correlation between changes in market values of securities held by the Fund and the prices of futures contracts, and the possibility of an illiquid market. Futures contracts are generally entered into on a regulated futures exchange and cleared through a clearinghouse associated with the exchange. With futures contracts, there is minimal counterparty risk to the Fund since futures contracts are exchange-traded and the exchange’s clearinghouse, as the counterparty to all exchange-traded futures, guarantees the futures contracts against default.
Upon entering into a futures contract, the Fund is required to deposit either cash or securities (initial margin) with the broker in an amount equal to a certain percentage of the contract value. Subsequent payments (variation margin) are paid to or received from the broker each day equal to the daily changes in the contract value. Such payments are recorded as unrealized gains or losses and, if any, shown as variation margin receivable (payable) in the Statement of Assets and Liabilities. Should the Fund fail to make requested variation margin payments, the broker can gain access to the initial margin to satisfy the Fund’s payment obligations. When the contracts are closed, a realized gain or loss is recorded in the Statement of Operations.
Security transactions and income recognition
Securities transactions are recorded on a trade date basis. Realized gains or losses are recorded on the basis of identified cost.
Dividend income is recognized on the ex-dividend date.
Interest earned on cash balances held at the custodian is recorded as interest income.
Distributions received from REIT investments may be characterized as ordinary income, capital gains, or a return of capital to the Fund based on information provided by the REIT. The proper characterization of REIT distributions is generally not known until after the end of each calendar year. As such, estimates may be used in reporting the character of income and distributions for financial statement purposes.
Distributions to shareholders
Distributions to shareholders from net investment income and any net realized gains are recorded on the ex-dividend date and paid at least annually. Such distributions are determined in accordance with income tax regulations and may differ from U.S. generally accepted accounting principles.
22 | Allspring Large Cap Core Fund
Notes to financial statements (unaudited)
Dividend sources are estimated at the time of declaration. The tax character of distributions is determined as of the Fund’s fiscal year end. Therefore, a portion of the Fund’s distributions made prior to the Fund’s fiscal year end may be categorized as a tax return of capital at year end.
Federal and other taxes
The Fund intends to continue to qualify as a regulated investment company by distributing substantially all of its investment company taxable income and any net realized capital gains (after reduction for capital loss carryforwards) sufficient to relieve it from all, or substantially all, federal income taxes. Accordingly, no provision for federal income taxes was required.
The Fund’s income and federal excise tax returns and all financial records supporting those returns for the prior three fiscal years are subject to examination by the federal and Delaware revenue authorities. Management has analyzed the Fund’s tax positions taken on federal, state, and foreign tax returns, as applicable, for all open tax years and does not believe that there are any uncertain tax positions that require recognition of a tax liability.
As of January 31, 2024, the aggregate cost of all investments for federal income tax purposes was $312,158,322 and the unrealized gains (losses) consisted of:
Class allocations
The separate classes of shares offered by the Fund differ principally in applicable sales charges, distribution, shareholder servicing, and administration fees. Class specific expenses are charged directly to that share class. Investment income, common fund-level expenses, and realized and unrealized gains (losses) on investments are allocated daily to each class of shares based on the relative proportion of net assets of each class.
3.
FAIR VALUATION MEASUREMENTS
Fair value measurements of investments are determined within a framework that has established a fair value hierarchy based upon the various data inputs utilized in determining the value of the Fund’s investments. The three-level hierarchy gives the highest priority to unadjusted quoted prices in active markets for identical assets or liabilities (Level 1) and the lowest priority to unobservable inputs (Level 3). The Fund’s investments are classified within the fair value hierarchy based on the lowest level of input that is significant to the fair value measurement. The inputs are summarized into three broad levels as follows:
•Level 1—quoted prices in active markets for identical securities
•Level 2—other significant observable inputs (including quoted prices for similar securities, interest rates, prepayment speeds, credit risk, etc.)
•Level 3—significant unobservable inputs (including the Fund’s own assumptions in determining the fair value of investments)
The inputs or methodologies used for valuing investments in securities are not necessarily an indication of the risk associated with investing in those securities.
Allspring Large Cap Core Fund | 23
Notes to financial statements (unaudited)
The following is a summary of the inputs used in valuing the Fund’s assets and liabilities as of January 31, 2024:
| | Other significant
observable inputs
(Level 2) | Significant
unobservable inputs
(Level 3) | |
| | | | |
| | | | |
| | | | |
| | | | |
| | | | |
| | | | |
| | | | |
| | | | |
| | | | |
| | | | |
| | | | |
| | | | |
| | | | |
| | | | |
| | | | |
| | | | |
| | | | |
| | | | |
Futures contracts are reported at their cumulative unrealized gains (losses) at measurement date as reported in the table following the Portfolio of Investments. For futures contracts, the current day’s variation margin is reported on the Statement of Assets and Liabilities. All other assets and liabilities are reported at their market value at measurement date.
Additional sector, industry or geographic detail, if any, is included in the Portfolio of Investments.
At January 31, 2024, the Fund did not have any transfers into/out of Level 3.
4.
TRANSACTIONS WITH AFFILIATES
Management fee
Allspring Funds Management, a wholly owned subsidiary of Allspring Global Investments Holdings, LLC, a holding company indirectly owned by certain private funds of GTCR LLC and Reverence Capital Partners, L.P., is the manager of the Fund and provides advisory and fund-level administrative services under an investment management agreement. Under the investment management agreement, Allspring Funds Management is responsible for, among other services, implementing the investment objectives and strategies of the Fund, supervising the subadviser and providing fund-level administrative services in connection with the Fund’s operations. As compensation for its services under the investment management agreement, Allspring Funds Management is entitled to receive a management fee at the following annual rate based on the Fund’s average daily net assets:
For the six months ended January 31, 2024, the management fee was equivalent to an annual rate of 0.70% of the Fund’s average daily net assets.
Allspring Funds Management has retained the services of a subadviser to provide daily portfolio management to the Fund. The fee for subadvisory services is borne by Allspring Funds Management. Allspring Global Investments, LLC, an affiliate of Allspring Funds Management and a wholly owned subsidiary of Allspring Global Investments Holdings, LLC, is the subadviser to the Fund and is entitled to receive a fee from Allspring Funds Management at an annual rate starting at 0.35% and declining to 0.30% as the average daily net assets of the Fund increase.
24 | Allspring Large Cap Core Fund
Notes to financial statements (unaudited)
Administration fees
Under a class-level administration agreement, Allspring Funds Management provides class-level administrative services to the Fund, which includes paying fees and expenses for services provided by the transfer agent, sub-transfer agents, omnibus account servicers and record-keepers. As compensation for its services under the class-level administration agreement, Allspring Funds Management receives an annual fee which is calculated based on the average daily net assets of each class as follows:
| Class-level
administration fee |
| |
| |
| |
| |
| |
Waivers and/or expense reimbursements
Allspring Funds Management has contractually committed to waive and/or reimburse management and administration fees to the extent necessary to maintain certain net operating expense ratios for the Fund. When each class of the Fund has exceeded its expense cap, Allspring Funds Management will waive fees and/or reimburse expenses from fund-level expenses on a proportionate basis and then from class specific expenses. When only certain classes exceed their expense caps, waivers and/or reimbursements are applied against class specific expenses before fund-level expenses. Allspring Funds Management has contractually committed through November 30, 2024 to waive fees and/or reimburse expenses to the extent necessary to cap the Fund’s expenses. Prior to or after the commitment expiration date, the cap may be increased or the commitment to maintain the cap may be terminated only with the approval of the Board of Trustees. As of January 31, 2024, the contractual expense caps are as follows:
Distribution fees
The Trust has adopted a distribution plan for Class C shares pursuant to Rule 12b-1 under the 1940 Act. Distribution fees are charged to Class C shares and paid to Allspring Funds Distributor, LLC (“Allspring Funds Distributor”), the principal underwriter, an affiliate of Allspring Funds Management, at an annual rate up to 0.75% of the average daily net assets of Class C shares.
In addition, Allspring Funds Distributor is entitled to receive the front-end sales charge from the purchase of Class A shares and a contingent deferred sales charge on the redemption of certain Class A shares. Allspring Funds Distributor is also entitled to receive the contingent deferred sales charges from redemptions of Class C shares. For the six months ended January 31, 2024, Allspring Funds Distributor received $1,754 from the sale of Class A shares. No contingent deferred sales charges were incurred by Class A and Class C shares for the six months ended January 31, 2024.
Shareholder servicing fees
The Trust has entered into contracts with one or more shareholder servicing agents, whereby Class A, Class C and Administrator Class are charged a fee at an annual rate up to 0.25% of the average daily net assets of each respective class. A portion of these total shareholder servicing fees were paid to affiliates of the Fund.
Interfund transactions
The Fund may purchase or sell portfolio investment securities to certain affiliates pursuant to Rule 17a-7 under the 1940 Act and under procedures adopted by the Board of Trustees. The procedures have been designed to ensure that these interfund transactions, which do not incur broker commissions, are effected at current market prices. Pursuant to these procedures, the Fund did not have any interfund transactions during the six months ended January 31, 2024.
5.
INVESTMENT PORTFOLIO TRANSACTIONS
Purchases and sales of investments, excluding U.S. government obligations (if any) and short-term securities, for the six months ended January 31, 2024 were $74,020,762 and $92,583,236, respectively.
6.
DERIVATIVE TRANSACTIONS
During the six months ended January 31, 2024, the Fund entered into futures contracts to gain market exposure. The Fund had an average notional amount of $4,786,580 in long futures contracts during the six months ended January 31, 2024.
Allspring Large Cap Core Fund | 25
Notes to financial statements (unaudited)
The fair value, realized gains or losses and change in unrealized gains or losses, if any, on derivative instruments are reflected in the corresponding financial statement captions.
The Trust (excluding the money market funds), Allspring Master Trust and Allspring Variable Trust are parties to a $350,000,000 revolving credit agreement whereby the Fund is permitted to use bank borrowings for temporary or emergency purposes, such as to fund shareholder redemption requests. Interest under the credit agreement is charged to the Fund based on borrowing rate equal to the higher of the Federal Funds rate or the overnight bank funding rate in effect on that day plus a spread. In addition, an annual commitment fee based on the unused balance is allocated to each participating fund.
For the six months ended January 31, 2024, there were no borrowings by the Fund under the agreement.
As of the end of the period, the Fund concentrated its portfolio of investments in the information technology sector. A fund that invests a substantial portion of its assets in any sector may be more affected by changes in that sector than would be a fund whose investments are not heavily weighted in any sector.
Under the Fund’s organizational documents, the officers and Trustees have been granted certain indemnification rights against certain liabilities that may arise out of performance of their duties to the Fund. The Fund has entered into a separate agreement with each Trustee that converts indemnification rights currently existing under the Fund’s organizational documents into contractual rights that cannot be changed in the future without the consent of the Trustee. Additionally, in the normal course of business, the Fund may enter into contracts with service providers that contain a variety of indemnification clauses. The Fund’s maximum exposure under these arrangements is dependent on future claims that may be made against the Fund and, therefore, cannot be estimated.
26 | Allspring Large Cap Core Fund
Other information (unaudited)
Other information
Proxy voting information
A description of the policies and procedures used to determine how to vote proxies relating to portfolio securities is available without charge, upon request, by calling 1-866-259-3305, visiting our website at allspringglobal.com, or visiting the SEC website at sec.gov. Information regarding how the proxies related to portfolio securities were voted during the most recent 12-month period ended June 30 is available on the website at allspringglobal.com or by visiting the SEC website at sec.gov.
Quarterly portfolio holdings information
The Fund files its complete schedule of portfolio holdings with the SEC for the first and third quarters of each fiscal year as an exhibit to its reports on Form N-PORT. Shareholders may view the filed Form N-PORT by visiting the SEC website at sec.gov.
Allspring Large Cap Core Fund | 27
Other information (unaudited)
Board of trustees and officers
Each of the Trustees and Officers listed in the table below acts in identical capacities for each fund in the Allspring family of funds, which consists of 116 mutual funds comprising the Allspring Funds Trust, Allspring Variable Trust, Allspring Master Trust and four closed-end funds (collectively the “Fund Complex”). This table should be read in conjunction with the Prospectus and the Statement of Additional Information†. The mailing address of each Trustee and Officer is 1415 Vantage Park Drive, 3rd Floor, Charlotte, NC 28203. Each Trustee and Officer serves an indefinite term, however, each Trustee serves such term until reaching the mandatory retirement age established by the Trustees.
Independent Trustees
| | Principal occupations during past five years or longer | Current other
public company or
investment
company
directorships |
William R. Ebsworth
(Born 1957) | | Retired. From 1984 to 2013, equities analyst, portfolio manager, research director and chief investment officer at Fidelity Management and Research Company in Boston, Tokyo, and Hong Kong, and retired in 2013 as Chief Investment Officer of Fidelity Strategic Advisers, Inc. where he led a team of investment professionals managing client assets. Prior thereto, Board member of Hong Kong Securities Clearing Co., Hong Kong Options Clearing Corp., the Thailand International Fund, Ltd., Fidelity Investments Life Insurance Company, and Empire Fidelity Investments Life Insurance Company. Serves on the Investment Company Institute’s Board of Governors since 2022 and Executive Committee since 2023 as well as the Vice Chairman of the Governing Council of the Independent Directors Council since 2023. Audit Committee Chair and Investment Committee Chair of the Vincent Memorial Hospital Foundation (non-profit organization). Mr. Ebsworth is a CFA charterholder. | |
Jane A. Freeman
(Born 1953) | Trustee,
since 2015;
Chair Liaison,
| Retired. From 2012 to 2014 and 1999 to 2008, Chief Financial Officer of Scientific Learning Corporation. From 2008 to 2012, Ms. Freeman provided consulting services related to strategic business projects. Prior to 1999, Portfolio Manager at Rockefeller & Co. and Scudder, Stevens & Clark. Board member of the Harding Loevner Funds from 1996 to 2014, serving as both Lead Independent Director and chair of the Audit Committee. Board member of the Russell Exchange Traded Funds Trust from 2011 to 2012 and the chair of the Audit Committee. Ms. Freeman is also an inactive Chartered Financial Analyst. | |
Isaiah Harris, Jr.
(Born 1952) | Trustee,
since 2009;
Audit Committee Chair,
since 2019 | Retired. Member of the Advisory Board of CEF of East Central Florida. Chairman of the Board of CIGNA Corporation from 2009 to 2021, and Director from 2005 to 2008. From 2003 to 2011, Director of Deluxe Corporation. Prior thereto, President and CEO of BellSouth Advertising and Publishing Corp. from 2005 to 2007, President and CEO of BellSouth Enterprises from 2004 to 2005 and President of BellSouth Consumer Services from 2000 to 2003. Emeritus member of the Iowa State University Foundation Board of Governors. Emeritus Member of the Advisory board of Iowa State University School of Business. Advisory Board Member, Palm Harbor Academy (private school). Advisory Board Member, Fellowship of Christian Athletes. Mr. Harris is a certified public accountant (inactive status). | |
David F. Larcker
(Born 1950) | | Distinguished Visiting Fellow at the Hoover Institution since 2022. James Irvin Miller Professor of Accounting at the Graduate School of Business (Emeritus), Stanford University, Director of the Corporate Governance Research Initiative and Senior Faculty of The Rock Center for Corporate Governance since 2006. From 2005 to 2008, Professor of Accounting at the Graduate School of Business, Stanford University. Prior thereto, Ernst & Young Professor of Accounting at The Wharton School, University of Pennsylvania from 1985 to 2005. | |
Olivia S. Mitchell
(Born 1953) | | International Foundation of Employee Benefit Plans Professor since 1993, Wharton School of the University of Pennsylvania. Director of Wharton’s Pension Research Council and Boettner Center on Pensions & Retirement Research, and Research Associate at the National Bureau of Economic Research. Previously taught at Cornell University from 1978 to 1993. | |
Timothy J. Penny
(Born 1951) | Trustee,
since 1996;
Chair,
since 2018 | President and Chief Executive Officer of Southern Minnesota Initiative Foundation, a non-profit organization, since 2007. Vice Chair of the Economic Club of Minnesota, since 2007. Co-Chair of the Committee for a Responsible Federal Budget, since 1995. Member of the Board of Trustees of NorthStar Education Finance, Inc., a non-profit organization, from 2007-2022. Senior Fellow of the University of Minnesota Humphrey Institute from 1995 to 2017. | |
* Length of service dates reflect the Trustee’s commencement of service with the Trust’s predecessor entities, where applicable.
# Ms. Freeman will serve as Chair Liaison through June 2024, at which time Ms. Wheelock will assume the role.
†
The Statement of Additional Information includes additional information about the Trustees and is available, without charge, upon request, by calling 1-800-222-8222 or by visiting the website at allspringglobal.com.
28 | Allspring Large Cap Core Fund
Other information (unaudited)
| Position held and length of service* | Principal occupations during past five years or longer | Current other public company or investment company directorships |
James G. Polisson
(Born 1959) | Trustee,
since 2018; Nominating and Governance Committee Chair, since 2024 | Retired. Chief Marketing Officer, Source (ETF) UK Services, Ltd, from 2015 to 2017. From 2012 to 2015, Principal of The Polisson Group, LLC, a management consulting, corporate advisory and principal investing company. Chief Executive Officer and Managing Director at Russell Investments, Global Exchange Traded Funds from 2010 to 2012. Managing Director of Barclays Global Investors from 1998 to 2010 and Global Chief Marketing Officer for iShares and Barclays Global Investors from 2000 to 2010. Trustee of the San Francisco Mechanics’ Institute, a non- profit organization, from 2013 to 2015. Board member of the Russell Exchange Traded Fund Trust from 2011 to 2012. Director of Barclays Global Investors Holdings Deutschland GmbH from 2006 to 2009. Mr. Polisson is an attorney and has a retired status with the Massachusetts and District of Columbia Bar Associations. | |
Pamela Wheelock
(Born 1959) | Trustee,
since January 2020;
previously Trustee from
January 2018 to
| Retired. Executive and Senior Financial leadership positions in the public, private and nonprofit sectors. Interim President and CEO, McKnight Foundation, 2020. Interim Commissioner, Minnesota Department of Human Services, 2019. Chief Operating Officer, Twin Cities Habitat for Humanity, 2017-2019. Vice President for University Services, University of Minnesota, 2012- 2016. Interim President and CEO, Blue Cross and Blue Shield of Minnesota, 2011-2012. Executive Vice-President and Chief Financial Officer, Minnesota Wild, 2002-2008. Commissioner, Minnesota Department of Finance, 1999-2002. Chair of the Board of Directors of Destination Medical Center Corporation. Board member of the Minnesota Wild Foundation. | |
* Length of service dates reflect the Trustee’s commencement of service with the Trust’s predecessor entities, where applicable.
# Ms. Freeman will serve as Chair Liaison through June 2024, at which time Ms. Wheelock will assume the role.
Allspring Large Cap Core Fund | 29
Other information (unaudited)
Officers1
| Position held and
length of service | Principal occupations during past five years or longer |
| | President and Chief Executive Officer of Allspring Funds Management, LLC since 2017 and Head of Global Fund Governance of Allspring Global Investments since 2022. Prior thereto, co-president of Galliard Capital Management, LLC, an affiliate of Allspring Funds Management, LLC, from 2019 to 2022 and Head of Affiliated Managers, Allspring Global Investments, from 2014 to 2019 and Executive Vice President responsible for marketing, investments and product development for Allspring Funds Management, LLC, from 2009 to 2014. |
Jeremy DePalma
(Born 1974) | Treasurer,
since 2012
(for certain funds in
the Fund Complex);
since 2021 (for
the remaining funds in the Complex) | Senior Vice President of Allspring Funds Management, LLC since 2009. Senior Vice President of Evergreen Investment Management Company, LLC from 2008 to 2010 and head of the Fund Reporting and Control Team within Fund Administration from 2005 to 2010. |
Christopher Baker
(Born 1976) | Chief Compliance Officer,
since 2022 | Global Chief Compliance Officer for Allspring Global Investments since 2022. Prior thereto, Chief Compliance Officer for State Street Global Advisors from 2018 to 2021. Senior Compliance Officer for the State Street divisions of Alternative Investment Solutions, Sector Solutions, and Global Marketing from 2015 to 2018. From 2010 to 2015 Vice President, Global Head of Investment and Marketing Compliance for State Street Global Advisors. |
Matthew Prasse
(Born 1983) | Chief Legal Officer,
since 2022;
Secretary,
since 2021 | Senior Counsel of the Allspring Legal Department since 2021. Senior Counsel of the Wells Fargo Legal Department from 2018 to 2021. Previously, Counsel for Barings LLC from 2015 to 2018. Prior to joining Barings, Associate at Morgan, Lewis & Bockius LLP from 2008 to 2015. |
1 For those Officers with tenures at Allspring Global Investments and/or Allspring Funds Management, LLC that began prior to 2021, such tenures include years of service during which these businesses/entities were known as Wells Fargo Asset Management and Wells Fargo Funds Management, LLC, respectively.
30 | Allspring Large Cap Core Fund
This page is intentionally left blank.
This page is intentionally left blank.
For more information
More information about Allspring Funds is available free upon request. To obtain literature, please write, visit the Fund’s website, or call:
Allspring Funds
P.O. Box 219967
Kansas City, MO 64121-9967
Website: allspringglobal.com
Individual investors: 1-800-222-8222
Retail investment professionals: 1-888-877-9275
Institutional investment professionals: 1-800-260-5969
This report and the financial statements contained herein are submitted for the general information of the shareholders of the Fund. If this report is used for promotional purposes, distribution of the report must be accompanied or preceded by a current prospectus. Before investing, please consider the investment objectives, risks, charges, and expenses of the investment. For a current prospectus and, if available, a summary prospectus, containing this information, call 1-800-222-8222 or visit the Fund’s website at allspringglobal.com. Read the prospectus carefully before you invest or send money.
Allspring Global InvestmentsTM is the trade name for the asset management firms of Allspring Global Investments Holdings, LLC, a holding company indirectly owned by certain private funds of GTCR LLC and Reverence Capital Partners, L.P. These firms include but are not limited to Allspring Global Investments, LLC, and Allspring Funds Management, LLC. Certain products managed by Allspring entities are distributed by Allspring Funds Distributor, LLC (a broker-dealer and Member FINRA/SIPC).
This material is for general informational and educational purposes only and is NOT intended to provide investment advice or a recommendation of any kind - including a recommendation for any specific investment, strategy, or plan.
© 2024 Allspring Global Investments Holdings, LLC. All rights reserved.
ALL-02052024-icrs1jxs 03-24
SAR4314 01-24
Allspring Large Cap Growth Fund
Semi-Annual Report
January 31, 2024
The views expressed and any forward-looking statements are as of January 31, 2024, unless otherwise noted, and are those of the Fund’s portfolio managers and/or Allspring Global Investments. Discussions of individual securities or the markets generally are not intended as individual recommendations. Future events or results may vary significantly from those expressed in any forward-looking statements. The views expressed are subject to change at any time in response to changing circumstances in the market. Allspring Global Investments disclaims any obligation to publicly update or revise any views expressed or forward-looking statements.
Allspring Large Cap Growth Fund | 1
Letter to shareholders (unaudited)
Andrew Owen
President
Allspring Funds
Dear Shareholder:
We are pleased to offer you this semi-annual report for the Allspring Large Cap Growth Fund for the six-month period that ended January 31, 2024. Globally, stocks and bonds experienced high levels of volatility throughout the period. The market was focused on persistently high inflation and the impact of ongoing aggressive central bank rate hikes. Riskier assets rallied as investors anticipated an end to the tight monetary policy despite concerns of a possible recession.
For the period, U.S. stocks, based on the S&P 500 Index,1 returned 6.43%. International stocks, as measured by the MSCI ACWI ex USA Index (Net),2 gained 0.48% while the MSCI EM Index (Net) (USD),3 returned -6.00%. Among bond indexes, the Bloomberg U.S. Aggregate Bond Index4 returned 3.15%, the Bloomberg Global Aggregate ex-USD Index (unhedged)5 gained 1.15%, the Bloomberg Municipal Bond Index6 returned 2.70%, and the ICE BofA U.S. High Yield Index7 gained 6.17%.
Still focused on high inflation and elevated central bank rates, markets were volatile.
The six-month period began with stocks retreating in August after a July rally while monthly bond returns were flat overall. Increased global market volatility reflected unease over the Chinese property market being stressed along with weak Chinese economic data. However, speculation grew over a possible end to the Federal Reserve’s (Fed’s) campaign of interest rate increases or at least a pause in September. U.S. economic data generally remained solid, with resilient job market data and inflation ticking up slightly in August as the annual Consumer Price Index (CPI)8 rose 3.7%. However, the three-month trend for Core CPI9 stood at an annualized 2.4%.
Stocks and bonds both had negative overall returns in September as investors were disappointed by the Fed’s determination not to lower interest rates until it knows it has vanquished persistently high inflation. As of September, the two primary gauges of U.S. inflation—the annual Core Personal Consumption Expenditures Price Index10 and the CPI—both stood at roughly 4%, twice as high as the Fed’s oft-stated 2% target. The month ended with the prospect of yet another U.S. government shutdown, averted at least temporarily but looming later in the year.
1
The S&P 500 Index consists of 500 stocks chosen for market size, liquidity, and industry group representation. It is a market-value-weighted index with each stock’s weight in the index proportionate to its market value. You cannot invest directly in an index.
2
The Morgan Stanley Capital International (MSCI) All Country World Index (ACWI) ex USA Index (Net) is a free-float-adjusted market-capitalization-weighted index that is designed to measure the equity market performance of developed and emerging markets, excluding the U.S. Source: MSCI. MSCI makes no express or implied warranties or representations and shall have no liability whatsoever with respect to any MSCI data contained herein. The MSCI data may not be further redistributed or used as a basis for other indexes or any securities or financial products. This report is not approved, reviewed, or produced by MSCI. You cannot invest directly in an index.
3
The MSCI Emerging Markets (EM) Index (Net) (USD) is a free-float-adjusted market-capitalization-weighted index that is designed to measure the equity market performance of emerging markets. You cannot invest directly in an index.
4
The Bloomberg U.S. Aggregate Bond Index is a broad-based benchmark that measures the investment-grade, U.S.-dollar-denominated, fixed-rate taxable bond market, including Treasuries, government-related and corporate securities, mortgage-backed securities (agency fixed-rate and hybrid adjustable-rate mortgage pass-throughs), asset-backed securities, and commercial mortgage-backed securities. You cannot invest directly in an index.
5
The Bloomberg Global Aggregate ex-USD Index (unhedged) is an unmanaged index that provides a broad-based measure of the global investment-grade fixed-income markets excluding the U.S.-dollar-denominated debt market. You cannot invest directly in an index.
6
The Bloomberg Municipal Bond Index is an unmanaged index composed of long-term tax-exempt bonds with a minimum credit rating of Baa. You cannot invest directly in an index.
7
The ICE BofA U.S. High Yield Index is a market-capitalization-weighted index of domestic and Yankee high yield bonds. The index tracks the performance of high yield securities traded in the U.S. bond market. You cannot invest directly in an index. Copyright 2024. ICE Data Indices, LLC. All rights reserved.
8
The Consumer Price Index (CPI) is a measure of the average change over time in the prices paid by urban consumers for a market basket of consumer goods and services. You cannot invest directly in an index.
9
The Core CPI is a measure of the average change over time in the prices paid by urban consumers for a market basket of consumer goods and services excluding energy and food prices. You cannot invest directly in an index.
10
The Core Personal Consumption Expenditures Price Index (PCE) is a measure of prices that people living in the United States, or those buying on their behalf, pay for goods and services. It is sometimes called the core PCE price index, because two categories that can have price swings – food and energy – are left out to make underlying inflation easier to see. You cannot invest directly in an index.
2 | Allspring Large Cap Growth Fund
Letter to shareholders (unaudited)
October was a tough month for financial markets overall. Key global and domestic indexes all were pushed down by rising geopolitical tensions—particularly the Israel-Hamas conflict—and concerns over the Fed’s “higher for longer” monetary policy. The U.S. 10-year Treasury yield rose above 5% for the first time since 2007. Commodity prices did well as oil prices rallied in response to the prospect of oil supply disruptions from the Middle East. U.S. annualized third quarter GDP was estimated at a healthier-than-anticipated 4.9%. China’s GDP indicated surprisingly strong industrial production and retail sales, offset by ongoing weakness in its real estate sector.
In November, the market mood turned positive as cooling inflation inspired confidence that central banks could hold off on further rate hikes. Overall annual inflation in the U.S. fell to 3.1% in November while 12-month inflation in the U.K. and eurozone eased to 4.6% and 2.4%, respectively—far below their peak levels of mid-2022. Third quarter annualized U.S. GDP growth was raised to an estimated 5.2% while U.S. job totals rose by just below 200,000 in November, indicating a slight cooling of the labor market. All of this fresh evidence added to confidence for a U.S. soft economic landing, leading to a more buoyant mood heading into winter as the Federal Open Market Committee held rates steady at its December meeting.
The broad year-end rally among stocks and bonds that began in November continued through December as investors became more confident that monetary policy would ease in 2024. Supporting the bubbly market mood were a series of reports confirming lower inflationary trends in the U.S. and Europe. During the period, it appeared more likely that the U.S. economy could achieve a soft landing, cooling enough to lower inflation without the pain of a recession. However, by year-end, an expectations gap developed. Capital markets priced in a total of 1.50 percentage points in federal funds rate cuts in 2024, twice as much as the three cuts of 0.25% hinted at by Fed officials.
Financial market performance was mixed in January 2024 as U.S. stocks had modest gains while non-U.S. equities, particularly those in emerging markets, and fixed income assets were held back by central bank pushback on market optimism over rate cuts. Overall, optimism was supported by indications of a soft landing for the U.S. economy. Key data included a surprisingly strong gain of 353,000 jobs in January, an unemployment rate of just 3.7%, and a rise of just 3.1% in the CPI in January. However, that resilience helped push back expectations of a rate cut in March to a more likely second quarter initial move.
Don’t let short-term uncertainty derail long-term investment goals.
Periods of investment uncertainty can present challenges, but experience has taught us that maintaining long-term investment goals can be an effective way to plan for the future. To help you create a sound strategy based on your personal goals and risk tolerance, Allspring Funds offers more than 100 mutual funds spanning a wide range of asset classes and investment styles. Although diversification cannot guarantee an investment profit or prevent losses, we believe it can be an effective way to manage investment risk and potentially smooth out overall portfolio performance. We encourage investors to know their investments and to understand that appropriate levels of risk-taking may unlock opportunities.
Thank you for choosing to invest with Allspring Funds. We appreciate your confidence in us and remain committed to helping you meet your financial needs.
Sincerely,
Andrew Owen
President
Allspring Funds
“ In November, the market mood turned positive as cooling inflation inspired confidence that central banks could hold off on further rate hikes. ”
For further information about your fund, contact your investment professional, visit our website at allspringglobal.com, or call us directly at 1-800-222-8222.
Allspring Large Cap Growth Fund | 3
Letter to shareholders (unaudited)
|
Beginning in July 2024, the Fund will be required by the Securities and Exchange Commission to send shareholders a paper copy of a new tailored shareholder report in place of the full shareholder report that you are now receiving. The tailored shareholder report will contain concise information about the Fund, including certain expense and performance information and fund statistics. If you wish to receive this new tailored shareholder report electronically, please follow the instructions on the back cover of this report. |
Other information that is currently included in the shareholder report, such as the Fund’s financial statements, will be available online and upon request, free of charge, in paper or electronic format. |
4 | Allspring Large Cap Growth Fund
This page is intentionally left blank.
Performance highlights (unaudited)
Performance highlights
| The Fund seeks long-term capital appreciation. |
| Allspring Funds Management, LLC |
| Allspring Global Investments, LLC |
| Robert Gruendyke, CFA, David Nazaret, CFA, Thomas C. Ognar, CFA |
Average annual total returns (%) as of January 31, 2024 |
| | | | |
| | | | | | | | | |
| | | | | | | | | |
| | | | | | | | | |
| | | | | | | | | |
Administrator Class (STDFX) | | | | | | | | | |
Institutional Class (STNFX) | | | | | | | | | |
| | | | | | | | | |
Russell 1000® Growth Index4 | | | | | | | | | |
Figures quoted represent past performance, which is no guarantee of future results, and do not reflect taxes that a shareholder may pay on an investment in a fund. Investment return and principal value of an investment will fluctuate so that an investor’s shares, when redeemed, may be worth more or less than their original cost. Performance shown without sales charges would be lower if sales charges were reflected. Current performance may be lower or higher than the performance data quoted, which assumes the reinvestment of dividends and capital gains. Current month-end performance is available on the Fund’s website, allspringglobal.com.
Please keep in mind that high double-digit returns were primarily achieved during favorable market conditions. You should not expect that such favorable returns can be consistently achieved. A fund’s performance, especially for short time periods, should not be the sole factor in making your investment decision.
Index returns do not include transaction costs associated with buying and selling securities, any mutual fund fees or expenses, or any taxes. It is not possible to invest directly in an index.
For Class A shares, the maximum front-end sales charge is 5.75%. For Class C shares, the maximum contingent deferred sales charge is 1.00%. Performance including a contingent deferred sales charge assumes the sales charge for the corresponding time period. Class R6, Administrator Class and Institutional Class shares are sold without a front-end sales charge or contingent deferred sales charge.
|
| Reflects the expense ratios as stated in the most recent prospectuses. The expense ratios shown are subject to change and may differ from the annualized expense ratios shown in the Financial Highlights of this report. |
| The manager has contractually committed through November 30, 2024, to waive fees and/or reimburse expenses to the extent necessary to cap total annual fund operating expenses after fee waivers at 1.07% for Class A, 1.82% for Class C, 0.65% for Class R6, 0.95% for Administrator Class and 0.75% for Institutional Class. Brokerage commissions, stamp duty fees, interest, taxes, acquired fund fees and expenses (if any), and extraordinary expenses are excluded from the expense caps. Prior to or after the commitment expiration date, the caps may be increased or the commitment to maintain the caps may be terminated only with the approval of the Board of Trustees. Without these caps, the Fund’s returns would have been lower. The expense ratio paid by an investor is the net expense ratio (the total annual fund operating expenses after fee waivers) as stated in the prospectuses. |
| The Russell 3000® Index measures the performance of the 3,000 largest U.S. companies based on total market capitalization, which represents approximately 98% of the investable U.S. equity market. You cannot invest directly in an index. |
| The Russell 1000® Growth Index measures the performance of those Russell 1000 companies with higher price/book ratios and higher forecasted growth values. You cannot invest directly in an index. |
Stock values fluctuate in response to the activities of individual companies and general market and economic conditions. Certain investment strategies tend to increase the total risk of an investment (relative to the broader market). This fund is exposed to foreign investment risk. Consult the Fund’s prospectus for additional information on these and other risks.
CFA® and Chartered Financial Analyst® are trademarks owned by CFA Institute. |
6 | Allspring Large Cap Growth Fund
Performance highlights (unaudited)
Ten largest holdings (%) as of January 31, 20241 |
| |
| |
| |
| |
Meta Platforms, Inc. Class A | |
| |
| |
Advanced Micro Devices, Inc. | |
| |
| |
| Figures represent the percentage of the Fund’s net assets. Holdings are subject to change and may have changed since the date specified. |
Sector allocation as of January 31, 20241 |
| Figures represent the percentage of the Fund’s long-term investments. Allocations are subject to change and may have changed since the date specified. |
Allspring Large Cap Growth Fund | 7
Fund expenses (unaudited)
Fund expenses
As a shareholder of the Fund, you incur two types of costs: (1) transaction costs, including sales charges (loads) on purchase payments and contingent deferred sales charges (if any) on redemptions and (2) ongoing costs, including management fees, distribution (12b-1) and/or shareholder servicing fees, and other Fund expenses. This example is intended to help you understand your ongoing costs (in dollars) of investing in the Fund and to compare these costs with the ongoing costs of investing in other mutual funds.
The example is based on an investment of $1,000 invested at the beginning of the six-month period and held for the entire period from August 1, 2023 to January 31, 2024.
Actual expenses
The “Actual” line of the table below provides information about actual account values and actual expenses. You may use the information in this line, together with the amount you invested, to estimate the expenses that you paid over the period. Simply divide your account value by $1,000 (for example, an $8,600 account value divided by $1,000= 8.6), then multiply the result by the number in the “Actual” line under the heading entitled “Expenses paid during period” for your applicable class of shares to estimate the expenses you paid on your account during this period.
Hypothetical example for comparison purposes
The “Hypothetical” line of the table below provides information about hypothetical account values and hypothetical expenses based on the Fund’s actual expense ratio and an assumed rate of return of 5% per year before expenses, which is not the Fund’s actual return. The hypothetical account values and expenses may not be used to estimate the actual ending account balance or expenses you paid for the period. You may use this information to compare the ongoing costs of investing in the Fund and other funds. To do so, compare this 5% hypothetical example with the 5% hypothetical examples that appear in the shareholder reports of the other funds.
Please note that the expenses shown in the table are meant to highlight your ongoing costs only and do not reflect any transactional costs, such as sales charges (loads) and contingent deferred sales charges. Therefore, the “Hypothetical” line of the table is useful in comparing ongoing costs only, and will not help you determine the relative total costs of owning different funds. In addition, if these transactional costs were included, your costs would have been higher.
| Beginning
account value
8-1-2023 | Ending
account value
1-31-2024 | | Annualized net
expense ratio |
| | | | |
| | | | |
Hypothetical (5% return before expenses) | | | | |
| | | | |
| | | | |
Hypothetical (5% return before expenses) | | | | |
| | | | |
| | | | |
Hypothetical (5% return before expenses) | | | | |
| | | | |
| | | | |
Hypothetical (5% return before expenses) | | | | |
| | | | |
| | | | |
Hypothetical (5% return before expenses) | | | | |
| Expenses paid is equal to the annualized net expense ratio of each class multiplied by the average account value over the period, multiplied by 184 divided by 366 (to reflect the one-half-year period). |
8 | Allspring Large Cap Growth Fund
Portfolio of investments—January 31, 2024 (unaudited)
| | | | | |
| | | | | | |
Communication services: 12.54% | | | | | | |
| | | | | | |
| | | | | | |
Interactive media & services: 10.99% | | | | | | |
| | | | | | |
| | | | | | |
Meta Platforms, Inc. Class A† | | | | | | |
| | | | | | |
Consumer discretionary: 18.27% | | | | | | |
| | | | | | |
| | | | | | |
| | | | | | |
| | | | | | |
Hotels, restaurants & leisure: 3.76% | | | | | | |
| | | | | | |
| | | | | | |
Chipotle Mexican Grill, Inc.† | | | | | | |
| | | | | | |
| | | | | | |
| | | | | | |
| | | | | | |
| | | | | | |
O’Reilly Automotive, Inc.† | | | | | | |
| | | | | | |
| | | | | | |
| | | | | | |
Textiles, apparel & luxury goods: 1.50% | | | | | | |
lululemon athletica, Inc.† | | | | | | |
| | | | | | |
| | | | | | |
| | | | | | |
| | | | | | |
Constellation Brands, Inc. Class A | | | | | | |
| | | | | | |
| | | | | | |
| | | | | | |
| | | | | | |
| | | | | | |
| | | | | | |
Financial services: 5.10% | | | | | | |
| | | | | | |
The accompanying notes are an integral part of these financial statements.
Allspring Large Cap Growth Fund | 9
Portfolio of investments—January 31, 2024 (unaudited)
| | | | | |
Financial services(continued) | | | | | | |
| | | | | | |
| | | | | | |
| | | | | | |
| | | | | | |
| | | | | | |
Vertex Pharmaceuticals, Inc.† | | | | | | |
Health care equipment & supplies: 3.75% | | | | | | |
| | | | | | |
| | | | | | |
Intuitive Surgical, Inc.† | | | | | | |
| | | | | | |
| | | | | | |
Health care providers & services: 0.33% | | | | | | |
| | | | | | |
Health care technology: 1.75% | | | | | | |
Veeva Systems, Inc. Class A† | | | | | | |
| | | | | | |
| | | | | | |
| | | | | | |
| | | | | | |
| | | | | | |
| | | | | | |
Aerospace & defense: 0.74% | | | | | | |
| | | | | | |
Commercial services & supplies: 1.70% | | | | | | |
| | | | | | |
Ground transportation: 1.97% | | | | | | |
| | | | | | |
| | | | | | |
| | | | | | |
Information technology: 43.32% | | | | | | |
Communications equipment: 1.21% | | | | | | |
| | | | | | |
| | | | | | |
| | | | | | |
Semiconductors & semiconductor equipment: 12.15% | | | | | | |
Advanced Micro Devices, Inc.† | | | | | | |
| | | | | | |
| | | | | | |
The accompanying notes are an integral part of these financial statements.
10 | Allspring Large Cap Growth Fund
Portfolio of investments—January 31, 2024 (unaudited)
| | | | | |
Semiconductors & semiconductor equipment(continued) | | | | | | |
Microchip Technology, Inc. | | | | | | |
| | | | | | |
| | | | | | |
| | | | | | |
| | | | | | |
Cadence Design Systems, Inc.† | | | | | | |
Check Point Software Technologies Ltd.† | | | | | | |
Crowdstrike Holdings, Inc. Class A† | | | | | | |
| | | | | | |
| | | | | | |
| | | | | | |
Palo Alto Networks, Inc.† | | | | | | |
| | | | | | |
| | | | | | |
| | | | | | |
| | | | | | |
Technology hardware, storage & peripherals: 7.76% | | | | | | |
| | | | | | |
| | | | | | |
| | | | | | |
| | | | | | |
| | | | | | |
Specialized REITs : 0.64% | | | | | | |
| | | | | | |
Total common stocks (Cost $264,095,733) | | | | | | |
| | | | | |
Short-term investments: 1.08% | | | | | | |
Investment companies: 1.08% | | | | | | |
Allspring Government Money Market Fund Select Class♠∞ | | | | | | |
Total short-term investments (Cost $7,766,611) | | | | | | |
Total investments in securities (Cost $271,862,344) | | | | | | |
Other assets and liabilities, net | | | | | | |
| | | | | | |
| Non-income-earning security |
| The issuer of the security is an affiliated person of the Fund as defined in the Investment Company Act of 1940. |
| The rate represents the 7-day annualized yield at period end. |
|
| American depositary receipt |
| Real estate investment trust |
The accompanying notes are an integral part of these financial statements.
Allspring Large Cap Growth Fund | 11
Portfolio of investments—January 31, 2024 (unaudited)
Investments in affiliates
An affiliated investment is an investment in which the Fund owns at least 5% of the outstanding voting shares of the issuer or as a result of other relationships, such as the Fund and the issuer having the same investment manager. Transactions with issuers that were affiliates of the Fund at the end of the period were as follows:
| | | | | Net
change in
unrealized
gains
(losses) | | | Income
from
affiliated
securities |
| | | | | | | | |
Allspring Government Money Market Fund Select Class | | | | | | | | |
The accompanying notes are an integral part of these financial statements.
12 | Allspring Large Cap Growth Fund
Statement of assets and liabilities—January 31, 2024 (unaudited)
Financial statements
Statement of assets and liabilities
| |
Investments in unaffiliated securities, at value (cost $264,095,733) | |
Investments in affiliated securities, at value (cost $7,766,611) | |
Receivable for investments sold | |
Receivable for Fund shares sold | |
| |
Prepaid expenses and other assets | |
| |
| |
Payable for investments purchased | |
Payable for Fund shares redeemed | |
| |
Shareholder servicing fees payable | |
Administration fees payable | |
Distribution fees payable | |
Accrued expenses and other liabilities | |
| |
| |
| |
| |
Total distributable earnings | |
| |
Computation of net asset value and offering price per share | |
| |
Shares outstanding–Class A1 | |
Net asset value per share–Class A | |
Maximum offering price per share – Class A2 | |
| |
Shares outstanding–Class C1 | |
Net asset value per share–Class C | |
| |
Shares outstanding–Class R61 | |
Net asset value per share–Class R6 | |
Net assets–Administrator Class | |
Shares outstanding–Administrator Class1 | |
Net asset value per share–Administrator Class | |
Net assets–Institutional Class | |
Shares outstanding–Institutional Class1 | |
Net asset value per share–Institutional Class | |
1 The Fund has an unlimited number of authorized shares.
2 Maximum offering price is computed as 100/94.25 of net asset value. On investments of $50,000 or more, the offering price is reduced.
The accompanying notes are an integral part of these financial statements.
Allspring Large Cap Growth Fund | 13
Statement of operations—six months ended January 31, 2024 (unaudited)
Statement of operations
| |
Dividends (net of foreign withholdings taxes of $1,681) | |
Income from affiliated securities | |
| |
| |
| |
| |
| |
| |
| |
| |
| |
| |
Shareholder servicing fees | |
| |
| |
| |
| |
| |
Custody and accounting fees | |
| |
| |
Shareholder report expenses | |
Trustees’ fees and expenses | |
| |
| |
Less: Fee waivers and/or expense reimbursements | |
| |
| |
| |
| |
Realized and unrealized gains (losses) on investments | |
Net realized gains on investments | |
Net change in unrealized gains (losses) on investments | |
Net realized and unrealized gains (losses) on investments | |
Net increase in net assets resulting from operations | |
The accompanying notes are an integral part of these financial statements.
14 | Allspring Large Cap Growth Fund
Statement of changes in net assets
Statement of changes in net assets
|
Six months ended
January 31, 2024 (unaudited) | |
| | | | |
| | | | |
Net realized gains on investments | | | | |
Net change in unrealized gains (losses) on investments | | | | |
Net increase in net assets resulting from operations | | | | |
Distributions to shareholders from | | | | |
Net investment income and net realized gains | | | | |
| | | | |
| | | | |
| | | | |
| | | | |
| | | | |
| | | | |
| | | | |
Total distributions to shareholders | | | | |
Capital share transactions | | | | |
Proceeds from shares sold | | | | |
| | | | |
| | | | |
| | | | |
| | | | |
| | | | |
| | | | |
| | | | |
Reinvestment of distributions | | | | |
| | | | |
| | | | |
| | | | |
| | | | |
| | | | |
| | | | |
| | | | |
| | | | |
1 For the period from August 1, 2022 to June 16, 2023. Effective at the close of business on June 16, 2023, Class R shares were converted to Class A shares and are no longer offered by the Fund.
2 For the period from August 1, 2022 to June 16, 2023. The class was closed at the close of business on June 16, 2023 and is no longer offered by the Fund.
The accompanying notes are an integral part of these financial statements.
Allspring Large Cap Growth Fund | 15
Statement of changes in net assets
| Six months ended January 31, 2024 (unaudited) | |
| | | | |
Payment for shares redeemed | | | | |
| | | | |
| | | | |
| | | | |
| | | | |
| | | | |
| | | | |
| | | | |
| | | | |
Net increase (decrease) in net assets resulting from capital share transactions | | | | |
Total increase (decrease) in net assets | | | | |
| | | | |
| | | | |
| | | | |
1 For the period from August 1, 2022 to June 16, 2023. Effective at the close of business on June 16, 2023, Class R shares were converted to Class A shares and are no longer offered by the Fund.
2 For the period from August 1, 2022 to June 16, 2023. The class was closed at the close of business on June 16, 2023 and is no longer offered by the Fund.
The accompanying notes are an integral part of these financial statements.
16 | Allspring Large Cap Growth Fund
Financial highlights
(For a share outstanding throughout each period)
| Six months ended
January 31, 2024
(unaudited) | |
| | | | | |
Net asset value, beginning of period | | | | | | |
| | | | | | |
Net realized and unrealized gains (losses) on investments | | | | | | |
Total from investment operations | | | | | | |
Distributions to shareholders from | | | | | | |
| | | | | | |
Net asset value, end of period | | | | | | |
| | | | | | |
Ratios to average net assets (annualized) | | | | | | |
| | | | | | |
| | | | | | |
| | | | | | |
| | | | | | |
| | | | | | |
Net assets, end of period (000s omitted) | | | | | | |
| Calculated based upon average shares outstanding |
| Total return calculations do not include any sales charges. Returns for periods of less than one year are not annualized. |
The accompanying notes are an integral part of these financial statements.
Allspring Large Cap Growth Fund | 17
(For a share outstanding throughout each period)
| Six months ended
January 31, 2024
(unaudited) | |
| | | | | |
Net asset value, beginning of period | | | | | | |
| | | | | | |
Net realized and unrealized gains (losses) on investments | | | | | | |
Total from investment operations | | | | | | |
Distributions to shareholders from | | | | | | |
| | | | | | |
Net asset value, end of period | | | | | | |
| | | | | | |
Ratios to average net assets (annualized) | | | | | | |
| | | | | | |
| | | | | | |
| | | | | | |
| | | | | | |
| | | | | | |
Net assets, end of period (000s omitted) | | | | | | |
| Calculated based upon average shares outstanding |
| Total return calculations do not include any sales charges. Returns for periods of less than one year are not annualized. |
The accompanying notes are an integral part of these financial statements.
18 | Allspring Large Cap Growth Fund
(For a share outstanding throughout each period)
| Six months ended
January 31, 2024
(unaudited) | |
| | | | | |
Net asset value, beginning of period | | | | | | |
Net investment income (loss) | | | | | | |
Net realized and unrealized gains (losses) on investments | | | | | | |
Total from investment operations | | | | | | |
Distributions to shareholders from | | | | | | |
| | | | | | |
| | | | | | |
Total distributions to shareholders | | | | | | |
Net asset value, end of period | | | | | | |
| | | | | | |
Ratios to average net assets (annualized) | | | | | | |
| | | | | | |
| | | | | | |
Net investment income (loss) | | | | | | |
| | | | | | |
| | | | | | |
Net assets, end of period (000s omitted) | | | | | | |
| Calculated based upon average shares outstanding |
| Returns for periods of less than one year are not annualized. |
The accompanying notes are an integral part of these financial statements.
Allspring Large Cap Growth Fund | 19
(For a share outstanding throughout each period)
| Six months ended
January 31, 2024
(unaudited) | |
| | | | | |
Net asset value, beginning of period | | | | | | |
Net investment income (loss) | | | | | | |
Net realized and unrealized gains (losses) on investments | | | | | | |
Total from investment operations | | | | | | |
Distributions to shareholders from | | | | | | |
| | | | | | |
| | | | | | |
Total distributions to shareholders | | | | | | |
Net asset value, end of period | | | | | | |
| | | | | | |
Ratios to average net assets (annualized) | | | | | | |
| | | | | | |
| | | | | | |
Net investment income (loss) | | | | | | |
| | | | | | |
| | | | | | |
Net assets, end of period (000s omitted) | | | | | | |
| Calculated based upon average shares outstanding |
| Returns for periods of less than one year are not annualized. |
The accompanying notes are an integral part of these financial statements.
20 | Allspring Large Cap Growth Fund
(For a share outstanding throughout each period)
| Six months ended
January 31, 2024
(unaudited) | |
| | | | | |
Net asset value, beginning of period | | | | | | |
Net investment income (loss) | | | | | | |
Net realized and unrealized gains (losses) on investments | | | | | | |
Total from investment operations | | | | | | |
Distributions to shareholders from | | | | | | |
| | | | | | |
| | | | | | |
Total distributions to shareholders | | | | | | |
Net asset value, end of period | | | | | | |
| | | | | | |
Ratios to average net assets (annualized) | | | | | | |
| | | | | | |
| | | | | | |
Net investment income (loss) | | | | | | |
| | | | | | |
| | | | | | |
Net assets, end of period (000s omitted) | | | | | | |
| Calculated based upon average shares outstanding |
| Returns for periods of less than one year are not annualized. |
The accompanying notes are an integral part of these financial statements.
Allspring Large Cap Growth Fund | 21
Notes to financial statements (unaudited)
Notes to financial statements
Allspring Funds Trust (the “Trust”), a Delaware statutory trust organized on March 10, 1999, is an open-end management investment company registered under the Investment Company Act of 1940, as amended (the “1940 Act”). As an investment company, the Trust follows the accounting and reporting guidance in Financial Accounting Standards Board (“FASB”) Accounting Standards Codification Topic 946, Financial Services – Investment Companies. These financial statements report on the Allspring Large Cap Growth Fund (the “Fund”) which is a diversified series of the Trust.
2.
SIGNIFICANT ACCOUNTING POLICIES
The following significant accounting policies, which are consistently followed in the preparation of the financial statements of the Fund, are in conformity with U.S. generally accepted accounting principles which require management to make estimates and assumptions that affect the reported amounts of assets and liabilities, disclosure of contingent assets and liabilities at the date of the financial statements, and the reported amounts of income and expenses during the reporting period. Actual results could differ from those estimates.
Securities valuation
All investments are valued each business day as of the close of regular trading on the New York Stock Exchange (generally 4 p.m. Eastern Time), although the Fund may deviate from this calculation time under unusual or unexpected circumstances.
Equity securities and exchange-traded funds that are listed on a foreign or domestic exchange or market are valued at the official closing price or, if none, the last sales price.
Investments in registered open-end investment companies (other than those listed on a foreign or domestic exchange or market) are valued at net asset value.
Investments which are not valued using the methods discussed above are valued at their fair value, as determined in good faith by Allspring Funds Management, LLC (“Allspring Funds Management”), which was named the valuation designee by the Board of Trustees. As the valuation designee, Allspring Funds Management is responsible for day-to-day valuation activities for the Allspring Funds. In connection with these responsibilities, Allspring Funds Management has established a Valuation Committee and has delegated to it the authority to take any actions regarding the valuation of portfolio securities that the Valuation Committee deems necessary or appropriate, including determining the fair value of portfolio securities. On a quarterly basis, the Board of Trustees receives reports of valuation actions taken by the Valuation Committee. On at least an annual basis, the Board of Trustees receives an assessment of the adequacy and effectiveness of Allspring Funds Management’s process for determining the fair value of the portfolio of investments.
Foreign currency translation
The accounting records of the Fund are maintained in U.S. dollars. The values of other assets and liabilities denominated in foreign currencies are translated into U.S. dollars at rates provided by an independent foreign currency pricing source at a time each business day specified by the Valuation Committee. Purchases and sales of securities, and income and expenses are converted at the rate of exchange on the respective dates of such transactions. Net realized foreign exchange gains or losses arise from sales of foreign currencies, currency gains or losses realized between the trade and settlement dates on securities transactions, and the difference between the amounts of dividends, interest and foreign withholding taxes recorded and the U.S. dollar equivalent of the amounts actually paid or received. Net unrealized foreign exchange gains and losses arise from changes in the fair value of assets and liabilities other than investments in securities resulting from changes in exchange rates. The changes in net assets arising from changes in exchange rates of securities and the changes in net assets resulting from changes in market prices of securities are not separately presented. Such changes are included in net realized and unrealized gains or losses from investments.
Security transactions and income recognition
Securities transactions are recorded on a trade date basis. Realized gains or losses are recorded on the basis of identified cost.
Dividend income is recognized on the ex-dividend date. Dividend income is recorded net of foreign taxes withheld where recovery of such taxes is not assured.
Interest earned on cash balances held at the custodian is recorded as interest income.
Distributions received from REIT investments may be characterized as ordinary income, capital gains, or a return of capital to the Fund based on information provided by the REIT. The proper characterization of REIT distributions is generally not known until after the end of each calendar year. As such, estimates may be used in reporting the character of income and distributions for financial statement purposes.
Distributions to shareholders
Distributions to shareholders from net investment income and any net realized gains are recorded on the ex-dividend date and paid at least annually. Such distributions are determined in accordance with income tax regulations and may differ from U.S. generally accepted accounting principles. Dividend sources are estimated at the time of declaration. The tax character of distributions is determined as of the Fund’s fiscal year end. Therefore, a portion of the Fund’s distributions made prior to the Fund’s fiscal year end may be categorized as a tax return of capital at year end.
22 | Allspring Large Cap Growth Fund
Notes to financial statements (unaudited)
Federal and other taxes
The Fund intends to continue to qualify as a regulated investment company by distributing substantially all of its investment company taxable income and any net realized capital gains (after reduction for capital loss carryforwards) sufficient to relieve it from all, or substantially all, federal income taxes. Accordingly, no provision for federal income taxes was required.
The Fund’s income and federal excise tax returns and all financial records supporting those returns for the prior three fiscal years are subject to examination by the federal and Delaware revenue authorities. Management has analyzed the Fund’s tax positions taken on federal, state, and foreign tax returns, as applicable, for all open tax years and does not believe that there are any uncertain tax positions that require recognition of a tax liability.
As of January 31, 2024, the aggregate cost of all investments for federal income tax purposes was $272,042,489 and the unrealized gains (losses) consisted of:
As of July 31, 2023, the Fund had a qualified late-year ordinary loss of $1,046,290 which was recognized on the first day of the current fiscal year.
Class allocations
The separate classes of shares offered by the Fund differ principally in applicable sales charges, distribution, shareholder servicing, and administration fees. Class specific expenses are charged directly to that share class. Investment income, common fund-level expenses, and realized and unrealized gains (losses) on investments are allocated daily to each class of shares based on the relative proportion of net assets of each class.
3.
FAIR VALUATION MEASUREMENTS
Fair value measurements of investments are determined within a framework that has established a fair value hierarchy based upon the various data inputs utilized in determining the value of the Fund’s investments. The three-level hierarchy gives the highest priority to unadjusted quoted prices in active markets for identical assets or liabilities (Level 1) and the lowest priority to unobservable inputs (Level 3). The Fund’s investments are classified within the fair value hierarchy based on the lowest level of input that is significant to the fair value measurement. The inputs are summarized into three broad levels as follows:
•Level 1—quoted prices in active markets for identical securities
•Level 2—other significant observable inputs (including quoted prices for similar securities, interest rates, prepayment speeds, credit risk, etc.)
•Level 3—significant unobservable inputs (including the Fund’s own assumptions in determining the fair value of investments)
The inputs or methodologies used for valuing investments in securities are not necessarily an indication of the risk associated with investing in those securities.
The following is a summary of the inputs used in valuing the Fund’s assets and liabilities as of January 31, 2024:
| | Other significant
observable inputs
(Level 2) | Significant
unobservable inputs
(Level 3) | |
| | | | |
| | | | |
| | | | |
| | | | |
| | | | |
| | | | |
| | | | |
| | | | |
| | | | |
| | | | |
| | | | |
| | | | |
| | | | |
| | | | |
| | | | |
Additional sector, industry or geographic detail, if any, is included in the Portfolio of Investments.
Allspring Large Cap Growth Fund | 23
Notes to financial statements (unaudited)
At January 31, 2024, the Fund did not have any transfers into/out of Level 3.
4.
TRANSACTIONS WITH AFFILIATES
Management fee
Allspring Funds Management, a wholly owned subsidiary of Allspring Global Investments Holdings, LLC, a holding company indirectly owned by certain private funds of GTCR LLC and Reverence Capital Partners, L.P., is the manager of the Fund and provides advisory and fund-level administrative services under an investment management agreement. Under the investment management agreement, Allspring Funds Management is responsible for, among other services, implementing the investment objectives and strategies of the Fund, supervising the subadviser and providing fund-level administrative services in connection with the Fund’s operations. As compensation for its services under the investment management agreement, Allspring Funds Management is entitled to receive a management fee at the following annual rate based on the Fund’s average daily net assets:
For the six months ended January 31, 2024, the management fee was equivalent to an annual rate of 0.69% of the Fund’s average daily net assets.
Allspring Funds Management has retained the services of a subadviser to provide daily portfolio management to the Fund. The fee for subadvisory services is borne by Allspring Funds Management. Allspring Global Investments, LLC, an affiliate of Allspring Funds Management and a wholly owned subsidiary of Allspring Global Investments Holdings, LLC, is the subadviser to the Fund and is entitled to receive a fee from Allspring Funds Management at an annual rate starting at 0.30% and declining to 0.20% as the average daily net assets of the Fund increase.
Administration fees
Under a class-level administration agreement, Allspring Funds Management provides class-level administrative services to the Fund, which includes paying fees and expenses for services provided by the transfer agent, sub-transfer agents, omnibus account servicers and record-keepers. As compensation for its services under the class-level administration agreement, Allspring Funds Management receives an annual fee which is calculated based on the average daily net assets of each class as follows:
| Class-level
administration fee |
| |
| |
| |
| |
| |
Waivers and/or expense reimbursements
Allspring Funds Management has contractually committed to waive and/or reimburse management and administration fees to the extent necessary to maintain certain net operating expense ratios for the Fund. When each class of the Fund has exceeded its expense cap, Allspring Funds Management will waive fees and/or reimburse expenses from fund-level expenses on a proportionate basis and then from class specific expenses. When only certain classes exceed their expense caps, waivers and/or reimbursements are applied against class specific expenses before fund-level expenses. Allspring Funds Management has contractually committed through November 30, 2024 to waive fees and/or reimburse expenses to the extent necessary to cap the Fund’s expenses. Prior to or after the commitment expiration date, the cap may be increased or the commitment to maintain the cap may be terminated only with the approval of the Board of Trustees. As of January 31, 2024, the contractual expense caps are as follows:
24 | Allspring Large Cap Growth Fund
Notes to financial statements (unaudited)
Distribution fees
The Trust has adopted a distribution plan for Class C shares pursuant to Rule 12b-1 under the 1940 Act. Distribution fees are charged to Class C shares and paid to Allspring Funds Distributor, LLC (“Allspring Funds Distributor”), the principal underwriter, an affiliate of Allspring Funds Management, at an annual rate up to 0.75% of the average daily net assets of Class C shares.
In addition, Allspring Funds Distributor is entitled to receive the front-end sales charge from the purchase of Class A shares and a contingent deferred sales charge on the redemption of certain Class A shares. Allspring Funds Distributor is also entitled to receive the contingent deferred sales charges from redemptions of Class C shares. For the six months ended January 31, 2024, Allspring Funds Distributor received $1,042 from the sale of Class A shares. No contingent deferred sales charges were incurred by Class A and Class C shares for the six months ended January 31, 2024.
Shareholder servicing fees
The Trust has entered into contracts with one or more shareholder servicing agents, whereby Class A, Class C and Administrator Class are charged a fee at an annual rate up to 0.25% of the average daily net assets of each respective class. A portion of these total shareholder servicing fees were paid to affiliates of the Fund.
Interfund transactions
The Fund may purchase or sell portfolio investment securities to certain affiliates pursuant to Rule 17a-7 under the 1940 Act and under procedures adopted by the Board of Trustees. The procedures have been designed to ensure that these interfund transactions, which do not incur broker commissions, are effected at current market prices. Pursuant to these procedures, the Fund did not have any interfund transactions during the six months ended January 31, 2024.
5.
INVESTMENT PORTFOLIO TRANSACTIONS
Purchases and sales of investments, excluding U.S. government obligations (if any) and short-term securities, for the six months ended January 31, 2024 were $73,337,379 and $120,615,499, respectively.
The Trust (excluding the money market funds), Allspring Master Trust and Allspring Variable Trust are parties to a $350,000,000 revolving credit agreement whereby the Fund is permitted to use bank borrowings for temporary or emergency purposes, such as to fund shareholder redemption requests. Interest under the credit agreement is charged to the Fund based on borrowing rate equal to the higher of the Federal Funds rate or the overnight bank funding rate in effect on that day plus a spread. In addition, an annual commitment fee based on the unused balance is allocated to each participating fund.
For the six months ended January 31, 2024, there were no borrowings by the Fund under the agreement.
As of the end of the period, the Fund concentrated its portfolio of investments in the information technology sector. A fund that invests a substantial portion of its assets in any sector may be more affected by changes in that sector than would be a fund whose investments are not heavily weighted in any sector.
Under the Fund’s organizational documents, the officers and Trustees have been granted certain indemnification rights against certain liabilities that may arise out of performance of their duties to the Fund. The Fund has entered into a separate agreement with each Trustee that converts indemnification rights currently existing under the Fund’s organizational documents into contractual rights that cannot be changed in the future without the consent of the Trustee. Additionally, in the normal course of business, the Fund may enter into contracts with service providers that contain a variety of indemnification clauses. The Fund’s maximum exposure under these arrangements is dependent on future claims that may be made against the Fund and, therefore, cannot be estimated.
Allspring Large Cap Growth Fund | 25
Other information (unaudited)
Other information
Proxy voting information
A description of the policies and procedures used to determine how to vote proxies relating to portfolio securities is available without charge, upon request, by calling 1-866-259-3305, visiting our website at allspringglobal.com, or visiting the SEC website at sec.gov. Information regarding how the proxies related to portfolio securities were voted during the most recent 12-month period ended June 30 is available on the website at allspringglobal.com or by visiting the SEC website at sec.gov.
Quarterly portfolio holdings information
The Fund files its complete schedule of portfolio holdings with the SEC for the first and third quarters of each fiscal year as an exhibit to its reports on Form N-PORT. Shareholders may view the filed Form N-PORT by visiting the SEC website at sec.gov.
26 | Allspring Large Cap Growth Fund
Other information (unaudited)
Board of trustees and officers
Each of the Trustees and Officers listed in the table below acts in identical capacities for each fund in the Allspring family of funds, which consists of 116 mutual funds comprising the Allspring Funds Trust, Allspring Variable Trust, Allspring Master Trust and four closed-end funds (collectively the “Fund Complex”). This table should be read in conjunction with the Prospectus and the Statement of Additional Information†. The mailing address of each Trustee and Officer is 1415 Vantage Park Drive, 3rd Floor, Charlotte, NC 28203. Each Trustee and Officer serves an indefinite term, however, each Trustee serves such term until reaching the mandatory retirement age established by the Trustees.
Independent Trustees
| | Principal occupations during past five years or longer | Current other
public company or
investment
company
directorships |
William R. Ebsworth
(Born 1957) | | Retired. From 1984 to 2013, equities analyst, portfolio manager, research director and chief investment officer at Fidelity Management and Research Company in Boston, Tokyo, and Hong Kong, and retired in 2013 as Chief Investment Officer of Fidelity Strategic Advisers, Inc. where he led a team of investment professionals managing client assets. Prior thereto, Board member of Hong Kong Securities Clearing Co., Hong Kong Options Clearing Corp., the Thailand International Fund, Ltd., Fidelity Investments Life Insurance Company, and Empire Fidelity Investments Life Insurance Company. Serves on the Investment Company Institute’s Board of Governors since 2022 and Executive Committee since 2023 as well as the Vice Chairman of the Governing Council of the Independent Directors Council since 2023. Audit Committee Chair and Investment Committee Chair of the Vincent Memorial Hospital Foundation (non-profit organization). Mr. Ebsworth is a CFA charterholder. | |
Jane A. Freeman
(Born 1953) | Trustee,
since 2015;
Chair Liaison,
| Retired. From 2012 to 2014 and 1999 to 2008, Chief Financial Officer of Scientific Learning Corporation. From 2008 to 2012, Ms. Freeman provided consulting services related to strategic business projects. Prior to 1999, Portfolio Manager at Rockefeller & Co. and Scudder, Stevens & Clark. Board member of the Harding Loevner Funds from 1996 to 2014, serving as both Lead Independent Director and chair of the Audit Committee. Board member of the Russell Exchange Traded Funds Trust from 2011 to 2012 and the chair of the Audit Committee. Ms. Freeman is also an inactive Chartered Financial Analyst. | |
Isaiah Harris, Jr.
(Born 1952) | Trustee,
since 2009;
Audit Committee Chair,
since 2019 | Retired. Member of the Advisory Board of CEF of East Central Florida. Chairman of the Board of CIGNA Corporation from 2009 to 2021, and Director from 2005 to 2008. From 2003 to 2011, Director of Deluxe Corporation. Prior thereto, President and CEO of BellSouth Advertising and Publishing Corp. from 2005 to 2007, President and CEO of BellSouth Enterprises from 2004 to 2005 and President of BellSouth Consumer Services from 2000 to 2003. Emeritus member of the Iowa State University Foundation Board of Governors. Emeritus Member of the Advisory board of Iowa State University School of Business. Advisory Board Member, Palm Harbor Academy (private school). Advisory Board Member, Fellowship of Christian Athletes. Mr. Harris is a certified public accountant (inactive status). | |
David F. Larcker
(Born 1950) | | Distinguished Visiting Fellow at the Hoover Institution since 2022. James Irvin Miller Professor of Accounting at the Graduate School of Business (Emeritus), Stanford University, Director of the Corporate Governance Research Initiative and Senior Faculty of The Rock Center for Corporate Governance since 2006. From 2005 to 2008, Professor of Accounting at the Graduate School of Business, Stanford University. Prior thereto, Ernst & Young Professor of Accounting at The Wharton School, University of Pennsylvania from 1985 to 2005. | |
Olivia S. Mitchell
(Born 1953) | | International Foundation of Employee Benefit Plans Professor since 1993, Wharton School of the University of Pennsylvania. Director of Wharton’s Pension Research Council and Boettner Center on Pensions & Retirement Research, and Research Associate at the National Bureau of Economic Research. Previously taught at Cornell University from 1978 to 1993. | |
Timothy J. Penny
(Born 1951) | Trustee,
since 1996;
Chair,
since 2018 | President and Chief Executive Officer of Southern Minnesota Initiative Foundation, a non-profit organization, since 2007. Vice Chair of the Economic Club of Minnesota, since 2007. Co-Chair of the Committee for a Responsible Federal Budget, since 1995. Member of the Board of Trustees of NorthStar Education Finance, Inc., a non-profit organization, from 2007-2022. Senior Fellow of the University of Minnesota Humphrey Institute from 1995 to 2017. | |
* Length of service dates reflect the Trustee’s commencement of service with the Trust’s predecessor entities, where applicable.
# Ms. Freeman will serve as Chair Liaison through June 2024, at which time Ms. Wheelock will assume the role.
†
The Statement of Additional Information includes additional information about the Trustees and is available, without charge, upon request, by calling 1-800-222-8222 or by visiting the website at allspringglobal.com.
Allspring Large Cap Growth Fund | 27
Other information (unaudited)
| Position held and length of service* | Principal occupations during past five years or longer | Current other public company or investment company directorships |
James G. Polisson
(Born 1959) | Trustee,
since 2018; Nominating and Governance Committee Chair, since 2024 | Retired. Chief Marketing Officer, Source (ETF) UK Services, Ltd, from 2015 to 2017. From 2012 to 2015, Principal of The Polisson Group, LLC, a management consulting, corporate advisory and principal investing company. Chief Executive Officer and Managing Director at Russell Investments, Global Exchange Traded Funds from 2010 to 2012. Managing Director of Barclays Global Investors from 1998 to 2010 and Global Chief Marketing Officer for iShares and Barclays Global Investors from 2000 to 2010. Trustee of the San Francisco Mechanics’ Institute, a non- profit organization, from 2013 to 2015. Board member of the Russell Exchange Traded Fund Trust from 2011 to 2012. Director of Barclays Global Investors Holdings Deutschland GmbH from 2006 to 2009. Mr. Polisson is an attorney and has a retired status with the Massachusetts and District of Columbia Bar Associations. | |
Pamela Wheelock
(Born 1959) | Trustee,
since January 2020;
previously Trustee from
January 2018 to
| Retired. Executive and Senior Financial leadership positions in the public, private and nonprofit sectors. Interim President and CEO, McKnight Foundation, 2020. Interim Commissioner, Minnesota Department of Human Services, 2019. Chief Operating Officer, Twin Cities Habitat for Humanity, 2017-2019. Vice President for University Services, University of Minnesota, 2012- 2016. Interim President and CEO, Blue Cross and Blue Shield of Minnesota, 2011-2012. Executive Vice-President and Chief Financial Officer, Minnesota Wild, 2002-2008. Commissioner, Minnesota Department of Finance, 1999-2002. Chair of the Board of Directors of Destination Medical Center Corporation. Board member of the Minnesota Wild Foundation. | |
* Length of service dates reflect the Trustee’s commencement of service with the Trust’s predecessor entities, where applicable.
# Ms. Freeman will serve as Chair Liaison through June 2024, at which time Ms. Wheelock will assume the role.
28 | Allspring Large Cap Growth Fund
Other information (unaudited)
Officers1
| Position held and
length of service | Principal occupations during past five years or longer |
| | President and Chief Executive Officer of Allspring Funds Management, LLC since 2017 and Head of Global Fund Governance of Allspring Global Investments since 2022. Prior thereto, co-president of Galliard Capital Management, LLC, an affiliate of Allspring Funds Management, LLC, from 2019 to 2022 and Head of Affiliated Managers, Allspring Global Investments, from 2014 to 2019 and Executive Vice President responsible for marketing, investments and product development for Allspring Funds Management, LLC, from 2009 to 2014. |
Jeremy DePalma
(Born 1974) | Treasurer,
since 2012
(for certain funds in
the Fund Complex);
since 2021 (for
the remaining funds in the Complex) | Senior Vice President of Allspring Funds Management, LLC since 2009. Senior Vice President of Evergreen Investment Management Company, LLC from 2008 to 2010 and head of the Fund Reporting and Control Team within Fund Administration from 2005 to 2010. |
Christopher Baker
(Born 1976) | Chief Compliance Officer,
since 2022 | Global Chief Compliance Officer for Allspring Global Investments since 2022. Prior thereto, Chief Compliance Officer for State Street Global Advisors from 2018 to 2021. Senior Compliance Officer for the State Street divisions of Alternative Investment Solutions, Sector Solutions, and Global Marketing from 2015 to 2018. From 2010 to 2015 Vice President, Global Head of Investment and Marketing Compliance for State Street Global Advisors. |
Matthew Prasse
(Born 1983) | Chief Legal Officer,
since 2022;
Secretary,
since 2021 | Senior Counsel of the Allspring Legal Department since 2021. Senior Counsel of the Wells Fargo Legal Department from 2018 to 2021. Previously, Counsel for Barings LLC from 2015 to 2018. Prior to joining Barings, Associate at Morgan, Lewis & Bockius LLP from 2008 to 2015. |
1 For those Officers with tenures at Allspring Global Investments and/or Allspring Funds Management, LLC that began prior to 2021, such tenures include years of service during which these businesses/entities were known as Wells Fargo Asset Management and Wells Fargo Funds Management, LLC, respectively.
Allspring Large Cap Growth Fund | 29
For more information
More information about Allspring Funds is available free upon request. To obtain literature, please write, visit the Fund’s website, or call:
Allspring Funds
P.O. Box 219967
Kansas City, MO 64121-9967
Website: allspringglobal.com
Individual investors: 1-800-222-8222
Retail investment professionals: 1-888-877-9275
Institutional investment professionals: 1-800-260-5969
This report and the financial statements contained herein are submitted for the general information of the shareholders of the Fund. If this report is used for promotional purposes, distribution of the report must be accompanied or preceded by a current prospectus. Before investing, please consider the investment objectives, risks, charges, and expenses of the investment. For a current prospectus and, if available, a summary prospectus, containing this information, call 1-800-222-8222 or visit the Fund’s website at allspringglobal.com. Read the prospectus carefully before you invest or send money.
Allspring Global InvestmentsTM is the trade name for the asset management firms of Allspring Global Investments Holdings, LLC, a holding company indirectly owned by certain private funds of GTCR LLC and Reverence Capital Partners, L.P. These firms include but are not limited to Allspring Global Investments, LLC, and Allspring Funds Management, LLC. Certain products managed by Allspring entities are distributed by Allspring Funds Distributor, LLC (a broker-dealer and Member FINRA/SIPC).
This material is for general informational and educational purposes only and is NOT intended to provide investment advice or a recommendation of any kind - including a recommendation for any specific investment, strategy, or plan.
© 2024 Allspring Global Investments Holdings, LLC. All rights reserved.
ALL-02052024-lkslxsks 03-24
SAR3354 01-24
Allspring Large Company Value Fund
Semi-Annual Report
January 31, 2024
The views expressed and any forward-looking statements are as of January 31, 2024, unless otherwise noted, and are those of the Fund’s portfolio managers and/or Allspring Global Investments. Discussions of individual securities or the markets generally are not intended as individual recommendations. Future events or results may vary significantly from those expressed in any forward-looking statements. The views expressed are subject to change at any time in response to changing circumstances in the market. Allspring Global Investments disclaims any obligation to publicly update or revise any views expressed or forward-looking statements.
Allspring Large Company Value Fund | 1
Letter to shareholders (unaudited)
Andrew Owen
President
Allspring Funds
Dear Shareholder:
We are pleased to offer you this semi-annual report for the Allspring Large Company Value Fund for the six-month period that ended January 31, 2024. Globally, stocks and bonds experienced high levels of volatility throughout the period. The market was focused on persistently high inflation and the impact of ongoing aggressive central bank rate hikes. Riskier assets rallied as investors anticipated an end to the tight monetary policy despite concerns of a possible recession.
For the period, U.S. stocks, based on the S&P 500 Index,1 returned 6.43%. International stocks, as measured by the MSCI ACWI ex USA Index (Net),2 gained 0.48% while the MSCI EM Index (Net) (USD),3 returned -6.00%. Among bond indexes, the Bloomberg U.S. Aggregate Bond Index4 returned 3.15%, the Bloomberg Global Aggregate ex-USD Index (unhedged)5 gained 1.15%, the Bloomberg Municipal Bond Index6 returned 2.70%, and the ICE BofA U.S. High Yield Index7 gained 6.17%.
Still focused on high inflation and elevated central bank rates, markets were volatile.
The six-month period began with stocks retreating in August after a July rally while monthly bond returns were flat overall. Increased global market volatility reflected unease over the Chinese property market being stressed along with weak Chinese economic data. However, speculation grew over a possible end to the Federal Reserve’s (Fed’s) campaign of interest rate increases or at least a pause in September. U.S. economic data generally remained solid, with resilient job market data and inflation ticking up slightly in August as the annual Consumer Price Index (CPI)8 rose 3.7%. However, the three-month trend for Core CPI9 stood at an annualized 2.4%.
Stocks and bonds both had negative overall returns in September as investors were disappointed by the Fed’s determination not to lower interest rates until it knows it has vanquished persistently high inflation. As of September, the two primary gauges of U.S. inflation—the annual Core Personal Consumption Expenditures Price Index10 and the CPI—both stood at roughly 4%, twice as high as the Fed’s oft-stated 2% target. The month ended with the prospect of yet another U.S. government shutdown, averted at least temporarily but looming later in the year.
1
The S&P 500 Index consists of 500 stocks chosen for market size, liquidity, and industry group representation. It is a market-value-weighted index with each stock’s weight in the index proportionate to its market value. You cannot invest directly in an index.
2
The Morgan Stanley Capital International (MSCI) All Country World Index (ACWI) ex USA Index (Net) is a free-float-adjusted market-capitalization-weighted index that is designed to measure the equity market performance of developed and emerging markets, excluding the U.S. Source: MSCI. MSCI makes no express or implied warranties or representations and shall have no liability whatsoever with respect to any MSCI data contained herein. The MSCI data may not be further redistributed or used as a basis for other indexes or any securities or financial products. This report is not approved, reviewed, or produced by MSCI. You cannot invest directly in an index.
3
The MSCI Emerging Markets (EM) Index (Net) (USD) is a free-float-adjusted market-capitalization-weighted index that is designed to measure the equity market performance of emerging markets. You cannot invest directly in an index.
4
The Bloomberg U.S. Aggregate Bond Index is a broad-based benchmark that measures the investment-grade, U.S.-dollar-denominated, fixed-rate taxable bond market, including Treasuries, government-related and corporate securities, mortgage-backed securities (agency fixed-rate and hybrid adjustable-rate mortgage pass-throughs), asset-backed securities, and commercial mortgage-backed securities. You cannot invest directly in an index.
5
The Bloomberg Global Aggregate ex-USD Index (unhedged) is an unmanaged index that provides a broad-based measure of the global investment-grade fixed-income markets excluding the U.S.-dollar-denominated debt market. You cannot invest directly in an index.
6
The Bloomberg Municipal Bond Index is an unmanaged index composed of long-term tax-exempt bonds with a minimum credit rating of Baa. You cannot invest directly in an index.
7
The ICE BofA U.S. High Yield Index is a market-capitalization-weighted index of domestic and Yankee high yield bonds. The index tracks the performance of high yield securities traded in the U.S. bond market. You cannot invest directly in an index. Copyright 2024. ICE Data Indices, LLC. All rights reserved.
8
The Consumer Price Index (CPI) is a measure of the average change over time in the prices paid by urban consumers for a market basket of consumer goods and services. You cannot invest directly in an index.
9
The Core CPI is a measure of the average change over time in the prices paid by urban consumers for a market basket of consumer goods and services excluding energy and food prices. You cannot invest directly in an index.
10
The Core Personal Consumption Expenditures Price Index (PCE) is a measure of prices that people living in the United States, or those buying on their behalf, pay for goods and services. It is sometimes called the core PCE price index, because two categories that can have price swings – food and energy – are left out to make underlying inflation easier to see. You cannot invest directly in an index.
2 | Allspring Large Company Value Fund
Letter to shareholders (unaudited)
October was a tough month for financial markets overall. Key global and domestic indexes all were pushed down by rising geopolitical tensions—particularly the Israel-Hamas conflict—and concerns over the Fed’s “higher for longer” monetary policy. The U.S. 10-year Treasury yield rose above 5% for the first time since 2007. Commodity prices did well as oil prices rallied in response to the prospect of oil supply disruptions from the Middle East. U.S. annualized third quarter GDP was estimated at a healthier-than-anticipated 4.9%. China’s GDP indicated surprisingly strong industrial production and retail sales, offset by ongoing weakness in its real estate sector.
In November, the market mood turned positive as cooling inflation inspired confidence that central banks could hold off on further rate hikes. Overall annual inflation in the U.S. fell to 3.1% in November while 12-month inflation in the U.K. and eurozone eased to 4.6% and 2.4%, respectively—far below their peak levels of mid-2022. Third quarter annualized U.S. GDP growth was raised to an estimated 5.2% while U.S. job totals rose by just below 200,000 in November, indicating a slight cooling of the labor market. All of this fresh evidence added to confidence for a U.S. soft economic landing, leading to a more buoyant mood heading into winter as the Federal Open Market Committee held rates steady at its December meeting.
The broad year-end rally among stocks and bonds that began in November continued through December as investors became more confident that monetary policy would ease in 2024. Supporting the bubbly market mood were a series of reports confirming lower inflationary trends in the U.S. and Europe. During the period, it appeared more likely that the U.S. economy could achieve a soft landing, cooling enough to lower inflation without the pain of a recession. However, by year-end, an expectations gap developed. Capital markets priced in a total of 1.50 percentage points in federal funds rate cuts in 2024, twice as much as the three cuts of 0.25% hinted at by Fed officials.
Financial market performance was mixed in January 2024 as U.S. stocks had modest gains while non-U.S. equities, particularly those in emerging markets, and fixed income assets were held back by central bank pushback on market optimism over rate cuts. Overall, optimism was supported by indications of a soft landing for the U.S. economy. Key data included a surprisingly strong gain of 353,000 jobs in January, an unemployment rate of just 3.7%, and a rise of just 3.1% in the CPI in January. However, that resilience helped push back expectations of a rate cut in March to a more likely second quarter initial move.
Don’t let short-term uncertainty derail long-term investment goals.
Periods of investment uncertainty can present challenges, but experience has taught us that maintaining long-term investment goals can be an effective way to plan for the future. To help you create a sound strategy based on your personal goals and risk tolerance, Allspring Funds offers more than 100 mutual funds spanning a wide range of asset classes and investment styles. Although diversification cannot guarantee an investment profit or prevent losses, we believe it can be an effective way to manage investment risk and potentially smooth out overall portfolio performance. We encourage investors to know their investments and to understand that appropriate levels of risk-taking may unlock opportunities.
Thank you for choosing to invest with Allspring Funds. We appreciate your confidence in us and remain committed to helping you meet your financial needs.
Sincerely,
Andrew Owen
President
Allspring Funds
“ In November, the market mood turned positive as cooling inflation inspired confidence that central banks could hold off on further rate hikes. ”
For further information about your fund, contact your investment professional, visit our website at allspringglobal.com, or call us directly at 1-800-222-8222.
Allspring Large Company Value Fund | 3
Letter to shareholders (unaudited)
|
Beginning in July 2024, the Fund will be required by the Securities and Exchange Commission to send shareholders a paper copy of a new tailored shareholder report in place of the full shareholder report that you are now receiving. The tailored shareholder report will contain concise information about the Fund, including certain expense and performance information and fund statistics. If you wish to receive this new tailored shareholder report electronically, please follow the instructions on the back cover of this report. |
Other information that is currently included in the shareholder report, such as the Fund’s financial statements, will be available online and upon request, free of charge, in paper or electronic format. |
4 | Allspring Large Company Value Fund
This page is intentionally left blank.
Performance highlights (unaudited)
Performance highlights
| The Fund seeks long-term capital appreciation. |
| Allspring Funds Management, LLC |
| Allspring Global Investments, LLC |
| Ryan Brown, CFA, Harindra de Silva, Ph.D. CFA |
Average annual total returns (%) as of January 31, 2024 |
| | | | |
| | | | | | | | | |
| | | | | | | | | |
| | | | | | | | | |
| | | | | | | | | |
Administrator Class (WWIDX) | | | | | | | | | |
Institutional Class (WLCIX) | | | | | | | | | |
| | | | | | | | | |
Russell 1000® Value Index5 | | | | | | | | | |
Figures quoted represent past performance, which is no guarantee of future results, and do not reflect taxes that a shareholder may pay on an investment in a fund. Investment return and principal value of an investment will fluctuate so that an investor’s shares, when redeemed, may be worth more or less than their original cost. Performance shown without sales charges would be lower if sales charges were reflected. Current performance may be lower or higher than the performance data quoted, which assumes the reinvestment of dividends and capital gains. Current month-end performance is available on the Fund’s website, allspringglobal.com.
Index returns do not include transaction costs associated with buying and selling securities, any mutual fund fees or expenses, or any taxes. It is not possible to invest directly in an index.
For Class A shares, the maximum front-end sales charge is 5.75%. For Class C shares, the maximum contingent deferred sales charge is 1.00%. Performance including a contingent deferred sales charge assumes the sales charge for the corresponding time period. Class R6, Administrator Class and Institutional Class shares are sold without a front-end sales charge or contingent deferred sales charge.
|
| Reflects the expense ratios as stated in the most recent prospectuses. The expense ratios shown are subject to change and may differ from the annualized expense ratios shown in the Financial Highlights of this report. |
| The manager has contractually committed through November 30, 2024, to waive fees and/or reimburse expenses to the extent necessary to cap total annual fund operating expenses after fee waivers at 0.82% for Class A, 1.57% for Class C, 0.40% for Class R6, 0.75% for Administrator Class and 0.50% for Institutional Class. Brokerage commissions, stamp duty fees, interest, taxes, acquired fund fees and expenses (if any) from funds in which the affiliated master portfolio invests, and extraordinary expenses are excluded from the expense caps. Prior to or after the commitment expiration date, the caps may be increased or the commitment to maintain the caps may be terminated only with the approval of the Board of Trustees. Without these caps, the Fund’s returns would have been lower. The expense ratio paid by an investor is the net expense ratio (the total annual fund operating expenses after fee waivers) as stated in the prospectuses. |
| Historical performance shown for the Class R6 shares prior to their inception reflects the performance of the Institutional Class shares, and includes the higher expenses applicable to the Institutional Class shares. If these expenses had not been included, returns for the Class R6 shares would be higher. |
| The Russell 3000® Index measures the performance of the 3,000 largest U.S. companies based on total market capitalization, which represents approximately 98% of the investable U.S. equity market. You cannot invest directly in an index. |
| The Russell 1000® Value Index measures the performance of those Russell 1000 companies with lower price/book ratios and lower forecasted growth values. You cannot invest directly in an index. |
Stock values fluctuate in response to the activities of individual companies and general market and economic conditions. Certain investment strategies tend to increase the total risk of an investment (relative to the broader market). This fund is exposed to foreign investment risk. Consult the Fund’s prospectus for additional information on these and other risks.
CFA® and Chartered Financial Analyst® are trademarks owned by CFA Institute. |
6 | Allspring Large Company Value Fund
Performance highlights (unaudited)
Ten largest holdings (%) as of January 31, 20241 |
| |
| |
| |
| |
| |
| |
| |
| |
| |
| |
| Figures represent the percentage of the Fund’s net assets. Holdings are subject to change and may have changed since the date specified. |
Sector allocation as of January 31, 20241 |
| Figures represent the percentage of the Fund’s long-term investments. Allocations are subject to change and may have changed since the date specified. |
Allspring Large Company Value Fund | 7
Fund expenses (unaudited)
Fund expenses
As a shareholder of the Fund, you incur two types of costs: (1) transaction costs, including sales charges (loads) on purchase payments and contingent deferred sales charges (if any) on redemptions and (2) ongoing costs, including management fees, distribution (12b-1) and/or shareholder servicing fees, and other Fund expenses. This example is intended to help you understand your ongoing costs (in dollars) of investing in the Fund and to compare these costs with the ongoing costs of investing in other mutual funds.
The example is based on an investment of $1,000 invested at the beginning of the six-month period and held for the entire period from August 1, 2023 to January 31, 2024.
Actual expenses
The “Actual” line of the table below provides information about actual account values and actual expenses. You may use the information in this line, together with the amount you invested, to estimate the expenses that you paid over the period. Simply divide your account value by $1,000 (for example, an $8,600 account value divided by $1,000= 8.6), then multiply the result by the number in the “Actual” line under the heading entitled “Expenses paid during period” for your applicable class of shares to estimate the expenses you paid on your account during this period.
Hypothetical example for comparison purposes
The “Hypothetical” line of the table below provides information about hypothetical account values and hypothetical expenses based on the Fund’s actual expense ratio and an assumed rate of return of 5% per year before expenses, which is not the Fund’s actual return. The hypothetical account values and expenses may not be used to estimate the actual ending account balance or expenses you paid for the period. You may use this information to compare the ongoing costs of investing in the Fund and other funds. To do so, compare this 5% hypothetical example with the 5% hypothetical examples that appear in the shareholder reports of the other funds.
Please note that the expenses shown in the table are meant to highlight your ongoing costs only and do not reflect any transactional costs, such as sales charges (loads) and contingent deferred sales charges. Therefore, the “Hypothetical” line of the table is useful in comparing ongoing costs only, and will not help you determine the relative total costs of owning different funds. In addition, if these transactional costs were included, your costs would have been higher.
| Beginning
account value
8-1-2023 | Ending
account value
1-31-2024 | | Annualized net
expense ratio |
| | | | |
| | | | |
Hypothetical (5% return before expenses) | | | | |
| | | | |
| | | | |
Hypothetical (5% return before expenses) | | | | |
| | | | |
| | | | |
Hypothetical (5% return before expenses) | | | | |
| | | | |
| | | | |
Hypothetical (5% return before expenses) | | | | |
| | | | |
| | | | |
Hypothetical (5% return before expenses) | | | | |
| Expenses paid is equal to the annualized net expense ratio of each class multiplied by the average account value over the period, multiplied by 184 divided by 366 (to reflect the one-half-year period). |
8 | Allspring Large Company Value Fund
Portfolio of investments—January 31, 2024 (unaudited)
| | | | | |
| | | | | | |
Communication services: 4.13% | | | | | | |
Diversified telecommunication services: 1.03% | | | | | | |
Verizon Communications, Inc. | | | | | | |
Interactive media & services: 0.15% | | | | | | |
Meta Platforms, Inc. Class A† | | | | | | |
| | | | | | |
| | | | | | |
Wireless telecommunication services: 1.82% | | | | | | |
| | | | | | |
Consumer discretionary: 7.04% | | | | | | |
| | | | | | |
| | | | | | |
| | | | | | |
| | | | | | |
| | | | | | |
| | | | | | |
Hotels, restaurants & leisure: 2.16% | | | | | | |
| | | | | | |
Chipotle Mexican Grill, Inc.† | | | | | | |
| | | | | | |
| | | | | | |
| | | | | | |
| | | | | | |
| | | | | | |
| | | | | | |
| | | | | | |
| | | | | | |
Coca-Cola Consolidated, Inc. | | | | | | |
| | | | | | |
| | | | | | |
Consumer staples distribution & retail: 3.62% | | | | | | |
| | | | | | |
| | | | | | |
| | | | | | |
| | | | | | |
| | | | | | |
| | | | | | |
Archer-Daniels-Midland Co. | | | | | | |
| | | | | | |
| | | | | | |
The accompanying notes are an integral part of these financial statements.
Allspring Large Company Value Fund | 9
Portfolio of investments—January 31, 2024 (unaudited)
| | | | | |
| | | | | | |
| | | | | | |
Mondelez International, Inc. Class A | | | | | | |
| | | | | | |
Household products: 1.50% | | | | | | |
| | | | | | |
| | | | | | |
| | | | | | |
| | | | | | |
| | | | | | |
| | | | | | |
Oil, gas & consumable fuels: 6.88% | | | | | | |
| | | | | | |
| | | | | | |
| | | | | | |
| | | | | | |
| | | | | | |
| | | | | | |
| | | | | | |
| | | | | | |
| | | | | | |
| | | | | | |
| | | | | | |
Bank of NT Butterfield & Son Ltd. | | | | | | |
| | | | | | |
| | | | | | |
| | | | | | |
| | | | | | |
| | | | | | |
| | | | | | |
Affiliated Managers Group, Inc. | | | | | | |
| | | | | | |
| | | | | | |
| | | | | | |
Goldman Sachs Group, Inc. | | | | | | |
Intercontinental Exchange, Inc. | | | | | | |
| | | | | | |
| | | | | | |
| | | | | | |
| | | | | | |
| | | | | | |
| | | | | | |
| | | | | | |
The accompanying notes are an integral part of these financial statements.
10 | Allspring Large Company Value Fund
Portfolio of investments—January 31, 2024 (unaudited)
| | | | | |
Consumer finance(continued) | | | | | | |
Discover Financial Services | | | | | | |
| | | | | | |
| | | | | | |
Financial services: 4.53% | | | | | | |
Berkshire Hathaway, Inc. Class B† | | | | | | |
| | | | | | |
| | | | | | |
| | | | | | |
| | | | | | |
| | | | | | |
American Financial Group, Inc. | | | | | | |
American International Group, Inc. | | | | | | |
| | | | | | |
| | | | | | |
Hanover Insurance Group, Inc. | | | | | | |
| | | | | | |
Reinsurance Group of America, Inc. | | | | | | |
| | | | | | |
Mortgage real estate investment trusts (REITs): 0.21% | | | | | | |
| | | | | | |
| | | | | | |
| | | | | | |
Catalyst Pharmaceuticals, Inc.† | | | | | | |
| | | | | | |
Regeneron Pharmaceuticals, Inc.† | | | | | | |
Vertex Pharmaceuticals, Inc.† | | | | | | |
| | | | | | |
Health care equipment & supplies: 2.04% | | | | | | |
| | | | | | |
Intuitive Surgical, Inc.† | | | | | | |
| | | | | | |
| | | | | | |
| | | | | | |
Health care providers & services: 4.51% | | | | | | |
| | | | | | |
| | | | | | |
| | | | | | |
| | | | | | |
| | | | | | |
| | | | | | |
| | | | | | |
| | | | | | |
The accompanying notes are an integral part of these financial statements.
Allspring Large Company Value Fund | 11
Portfolio of investments—January 31, 2024 (unaudited)
| | | | | |
Pharmaceuticals(continued) | | | | | | |
| | | | | | |
| | | | | | |
| | | | | | |
| | | | | | |
Aerospace & defense: 3.84% | | | | | | |
| | | | | | |
| | | | | | |
| | | | | | |
| | | | | | |
Air freight & logistics: 2.31% | | | | | | |
| | | | | | |
United Parcel Service, Inc. Class B | | | | | | |
| | | | | | |
| | | | | | |
| | | | | | |
| | | | | | |
| | | | | | |
Construction & engineering: 1.75% | | | | | | |
Comfort Systems USA, Inc. | | | | | | |
| | | | | | |
| | | | | | |
| | | | | | |
Electrical equipment: 1.05% | | | | | | |
| | | | | | |
Industrial conglomerates: 2.82% | | | | | | |
| | | | | | |
| | | | | | |
| | | | | | |
| | | | | | |
| | | | | | |
| | | | | | |
Passenger airlines: 1.53% | | | | | | |
| | | | | | |
United Airlines Holdings, Inc.† | | | | | | |
| | | | | | |
Trading companies & distributors: 0.29% | | | | | | |
| | | | | | |
| | | | | | |
| | | | | | |
The accompanying notes are an integral part of these financial statements.
12 | Allspring Large Company Value Fund
Portfolio of investments—January 31, 2024 (unaudited)
| | | | | |
Information technology: 8.95% | | | | | | |
| | | | | | |
| | | | | | |
Cognizant Technology Solutions Corp. Class A | | | | | | |
| | | | | | |
| | | | | | |
Semiconductors & semiconductor equipment: 6.02% | | | | | | |
Allegro MicroSystems, Inc.† | | | | | | |
| | | | | | |
Axcelis Technologies, Inc.† | | | | | | |
| | | | | | |
| | | | | | |
| | | | | | |
| | | | | | |
| | | | | | |
| | | | | | |
Cadence Design Systems, Inc.† | | | | | | |
| | | | | | |
| | | | | | |
| | | | | | |
| | | | | | |
| | | | | | |
| | | | | | |
Technology hardware, storage & peripherals: 0.36% | | | | | | |
Hewlett Packard Enterprise Co. | | | | | | |
Super Micro Computer, Inc.† | | | | | | |
| | | | | | |
| | | | | | |
| | | | | | |
Air Products & Chemicals, Inc. | | | | | | |
| | | | | | |
| | | | | | |
| | | | | | |
Construction materials: 0.15% | | | | | | |
| | | | | | |
| | | | | | |
| | | | | | |
| | | | | | |
| | | | | | |
| | | | | | |
| | | | | | |
| | | | | | |
The accompanying notes are an integral part of these financial statements.
Allspring Large Company Value Fund | 13
Portfolio of investments—January 31, 2024 (unaudited)
| | | | | |
| | | | | | |
Hotel & resort REITs: 0.63% | | | | | | |
Park Hotels & Resorts, Inc. | | | | | | |
| | | | | | |
| | | | | | |
Real estate management & development: 0.35% | | | | | | |
Jones Lang LaSalle, Inc.† | | | | | | |
Specialized REITs : 0.95% | | | | | | |
| | | | | | |
| | | | | | |
Electric utilities: 3.13% | | | | | | |
| | | | | | |
| | | | | | |
| | | | | | |
| | | | | | |
Independent power and renewable electricity producers: 0.05% | | | | | | |
| | | | | | |
| | | | | | |
| | | | | | |
Total common stocks (Cost $201,011,148) | | | | | | |
| | | | | |
Short-term investments: 1.11% | | | | | | |
Investment companies: 1.11% | | | | | | |
Allspring Government Money Market Fund Select Class♠∞ | | | | | | |
Total short-term investments (Cost $2,444,952) | | | | | | |
Total investments in securities (Cost $203,456,100) | | | | | | |
Other assets and liabilities, net | | | | | | |
| | | | | | |
| Non-income-earning security |
| The issuer of the security is an affiliated person of the Fund as defined in the Investment Company Act of 1940. |
| The rate represents the 7-day annualized yield at period end. |
|
| Real estate investment trust |
The accompanying notes are an integral part of these financial statements.
14 | Allspring Large Company Value Fund
Portfolio of investments—January 31, 2024 (unaudited)
Investments in affiliates
An affiliated investment is an investment in which the Fund owns at least 5% of the outstanding voting shares of the issuer or as a result of other relationships, such as the Fund and the issuer having the same investment manager. Transactions with issuers that were affiliates of the Fund at the end of the period were as follows:
| | | | | Net
change in
unrealized
gains
(losses) | | | Income
from
affiliated
securities |
| | | | | | | | |
Allspring Government Money Market Fund Select Class | | | | | | | | |
Futures contracts
The accompanying notes are an integral part of these financial statements.
Allspring Large Company Value Fund | 15
Statement of assets and liabilities—January 31, 2024 (unaudited)
Financial statements
Statement of assets and liabilities
| |
Investments in unaffiliated securities, at value (cost $201,011,148) | |
Investments in affiliated securities, at value (cost $2,444,952) | |
| |
Cash at broker segregated for futures contracts | |
| |
Receivable for Fund shares sold | |
Prepaid expenses and other assets | |
| |
| |
Payable for Fund shares redeemed | |
Payable for daily variation margin on open futures contracts | |
| |
Shareholder servicing fees payable | |
Administration fees payable | |
| |
Accrued expenses and other liabilities | |
| |
| |
| |
| |
Total distributable earnings | |
| |
Computation of net asset value and offering price per share | |
| |
Shares outstanding–Class A1 | |
Net asset value per share–Class A | |
Maximum offering price per share – Class A2 | |
| |
Shares outstanding–Class C1 | |
Net asset value per share–Class C | |
| |
Shares outstanding–Class R61 | |
Net asset value per share–Class R6 | |
Net assets–Administrator Class | |
Shares outstanding–Administrator Class1 | |
Net asset value per share–Administrator Class | |
Net assets–Institutional Class | |
Shares outstanding–Institutional Class1 | |
Net asset value per share–Institutional Class | |
1 The Fund has an unlimited number of authorized shares.
2 Maximum offering price is computed as 100/94.25 of net asset value. On investments of $50,000 or more, the offering price is reduced.
The accompanying notes are an integral part of these financial statements.
16 | Allspring Large Company Value Fund
Statement of operations—six months ended January 31, 2024 (unaudited)
Statement of operations
| |
| |
Income from affiliated securities | |
| |
| |
| |
| |
| |
| |
| |
| |
| |
| |
Shareholder servicing fees | |
| |
| |
| |
| |
| |
Custody and accounting fees | |
| |
| |
Shareholder report expenses | |
Trustees’ fees and expenses | |
| |
| |
Less: Fee waivers and/or expense reimbursements | |
| |
| |
| |
| |
Realized and unrealized gains (losses) on investments | |
| |
| |
| |
Net realized gains on investments | |
Net change in unrealized gains (losses) on | |
| |
| |
Net change in unrealized gains (losses) on investments | |
Net realized and unrealized gains (losses) on investments | |
Net increase in net assets resulting from operations | |
The accompanying notes are an integral part of these financial statements.
Allspring Large Company Value Fund | 17
Statement of changes in net assets
Statement of changes in net assets
|
Six months ended
January 31, 2024 (unaudited) | |
| | | | |
| | | | |
Net realized gains on investments | | | | |
Net change in unrealized gains (losses) on investments | | | | |
Net increase in net assets resulting from operations | | | | |
Distributions to shareholders from | | | | |
Net investment income and net realized gains | | | | |
| | | | |
| | | | |
| | | | |
| | | | |
| | | | |
Total distributions to shareholders | | | | |
Capital share transactions | | | | |
Proceeds from shares sold | | | | |
| | | | |
| | | | |
| | | | |
| | | | |
| | | | |
| | | | |
Reinvestment of distributions | | | | |
| | | | |
| | | | |
| | | | |
| | | | |
| | | | |
| | | | |
Payment for shares redeemed | | | | |
| | | | |
| | | | |
| | | | |
| | | | |
| | | | |
| | | | |
Net decrease in net assets resulting from capital share transactions | | | | |
Total decrease in net assets | | | | |
| | | | |
| | | | |
| | | | |
The accompanying notes are an integral part of these financial statements.
18 | Allspring Large Company Value Fund
(For a share outstanding throughout each period)
| Six months ended
January 31, 2024
(unaudited) | |
| | | | | |
Net asset value, beginning of period | | | | | | |
| | | | | | |
Net realized and unrealized gains (losses) on investments | | | | | | |
Total from investment operations | | | | | | |
Distributions to shareholders from | | | | | | |
| | | | | | |
| | | | | | |
Total distributions to shareholders | | | | | | |
Net asset value, end of period | | | | | | |
| | | | | | |
Ratios to average net assets (annualized) | | | | | | |
| | | | | | |
| | | | | | |
| | | | | | |
| | | | | | |
| | | | | | |
Net assets, end of period (000s omitted) | | | | | | |
| Calculated based upon average shares outstanding |
| Total return calculations do not include any sales charges. Returns for periods of less than one year are not annualized. |
The accompanying notes are an integral part of these financial statements.
Allspring Large Company Value Fund | 19
(For a share outstanding throughout each period)
| Six months ended
January 31, 2024
(unaudited) | |
| | | | | |
Net asset value, beginning of period | | | | | | |
| | | | | | |
Net realized and unrealized gains (losses) on investments | | | | | | |
Total from investment operations | | | | | | |
Distributions to shareholders from | | | | | | |
| | | | | | |
| | | | | | |
Total distributions to shareholders | | | | | | |
Net asset value, end of period | | | | | | |
| | | | | | |
Ratios to average net assets (annualized) | | | | | | |
| | | | | | |
| | | | | | |
| | | | | | |
| | | | | | |
| | | | | | |
Net assets, end of period (000s omitted) | | | | | | |
| Calculated based upon average shares outstanding |
| Total return calculations do not include any sales charges. Returns for periods of less than one year are not annualized. |
The accompanying notes are an integral part of these financial statements.
20 | Allspring Large Company Value Fund
(For a share outstanding throughout each period)
| Six months ended
January 31, 2024
(unaudited) | |
| | | | | |
Net asset value, beginning of period | | | | | | |
| | | | | | |
Net realized and unrealized gains (losses) on investments | | | | | | |
Total from investment operations | | | | | | |
Distributions to shareholders from | | | | | | |
| | | | | | |
| | | | | | |
Total distributions to shareholders | | | | | | |
Net asset value, end of period | | | | | | |
| | | | | | |
Ratios to average net assets (annualized) | | | | | | |
| | | | | | |
| | | | | | |
| | | | | | |
| | | | | | |
| | | | | | |
Net assets, end of period (000s omitted) | | | | | | |
| Calculated based upon average shares outstanding |
| Returns for periods of less than one year are not annualized. |
The accompanying notes are an integral part of these financial statements.
Allspring Large Company Value Fund | 21
(For a share outstanding throughout each period)
| Six months ended
January 31, 2024
(unaudited) | |
| | | | | |
Net asset value, beginning of period | | | | | | |
| | | | | | |
Net realized and unrealized gains (losses) on investments | | | | | | |
Total from investment operations | | | | | | |
Distributions to shareholders from | | | | | | |
| | | | | | |
| | | | | | |
Total distributions to shareholders | | | | | | |
Net asset value, end of period | | | | | | |
| | | | | | |
Ratios to average net assets (annualized) | | | | | | |
| | | | | | |
| | | | | | |
| | | | | | |
| | | | | | |
| | | | | | |
Net assets, end of period (000s omitted) | | | | | | |
| Calculated based upon average shares outstanding |
| Returns for periods of less than one year are not annualized. |
The accompanying notes are an integral part of these financial statements.
22 | Allspring Large Company Value Fund
(For a share outstanding throughout each period)
| Six months ended
January 31, 2024
(unaudited) | |
| | | | | |
Net asset value, beginning of period | | | | | | |
| | | | | | |
Net realized and unrealized gains (losses) on investments | | | | | | |
Total from investment operations | | | | | | |
Distributions to shareholders from | | | | | | |
| | | | | | |
| | | | | | |
Total distributions to shareholders | | | | | | |
Net asset value, end of period | | | | | | |
| | | | | | |
Ratios to average net assets (annualized) | | | | | | |
| | | | | | |
| | | | | | |
| | | | | | |
| | | | | | |
| | | | | | |
Net assets, end of period (000s omitted) | | | | | | |
| Calculated based upon average shares outstanding |
| Returns for periods of less than one year are not annualized. |
The accompanying notes are an integral part of these financial statements.
Allspring Large Company Value Fund | 23
Notes to financial statements (unaudited)
Notes to financial statements
Allspring Funds Trust (the “Trust”), a Delaware statutory trust organized on March 10, 1999, is an open-end management investment company registered under the Investment Company Act of 1940, as amended (the “1940 Act”). As an investment company, the Trust follows the accounting and reporting guidance in Financial Accounting Standards Board (“FASB”) Accounting Standards Codification Topic 946, Financial Services – Investment Companies. These financial statements report on the Allspring Large Company Value Fund (the “Fund”) which is a diversified series of the Trust.
2.
SIGNIFICANT ACCOUNTING POLICIES
The following significant accounting policies, which are consistently followed in the preparation of the financial statements of the Fund, are in conformity with U.S. generally accepted accounting principles which require management to make estimates and assumptions that affect the reported amounts of assets and liabilities, disclosure of contingent assets and liabilities at the date of the financial statements, and the reported amounts of income and expenses during the reporting period. Actual results could differ from those estimates.
Securities valuation
All investments are valued each business day as of the close of regular trading on the New York Stock Exchange (generally 4 p.m. Eastern Time), although the Fund may deviate from this calculation time under unusual or unexpected circumstances.
Equity securities, exchange-traded funds and futures contracts that are listed on a foreign or domestic exchange or market are valued at the official closing price or, if none, the last sales price.
Investments in registered open-end investment companies (other than those listed on a foreign or domestic exchange or market) are valued at net asset value.
Investments which are not valued using the methods discussed above are valued at their fair value, as determined in good faith by Allspring Funds Management, LLC (“Allspring Funds Management”), which was named the valuation designee by the Board of Trustees. As the valuation designee, Allspring Funds Management is responsible for day-to-day valuation activities for the Allspring Funds. In connection with these responsibilities, Allspring Funds Management has established a Valuation Committee and has delegated to it the authority to take any actions regarding the valuation of portfolio securities that the Valuation Committee deems necessary or appropriate, including determining the fair value of portfolio securities. On a quarterly basis, the Board of Trustees receives reports of valuation actions taken by the Valuation Committee. On at least an annual basis, the Board of Trustees receives an assessment of the adequacy and effectiveness of Allspring Funds Management’s process for determining the fair value of the portfolio of investments.
Foreign currency translation
The accounting records of the Fund are maintained in U.S. dollars. The values of other assets and liabilities denominated in foreign currencies are translated into U.S. dollars at rates provided by an independent foreign currency pricing source at a time each business day specified by the Valuation Committee. Purchases and sales of securities, and income and expenses are converted at the rate of exchange on the respective dates of such transactions. Net realized foreign exchange gains or losses arise from sales of foreign currencies, currency gains or losses realized between the trade and settlement dates on securities transactions, and the difference between the amounts of dividends, interest and foreign withholding taxes recorded and the U.S. dollar equivalent of the amounts actually paid or received. Net unrealized foreign exchange gains and losses arise from changes in the fair value of assets and liabilities other than investments in securities resulting from changes in exchange rates. The changes in net assets arising from changes in exchange rates of securities and the changes in net assets resulting from changes in market prices of securities are not separately presented. Such changes are included in net realized and unrealized gains or losses from investments.
Futures contracts
Futures contracts are agreements between the Fund and a counterparty to buy or sell a specific amount of a commodity, financial instrument or currency at a specified price and on a specified date. The Fund may buy and sell futures contracts in order to gain exposure to, or protect against, changes in security values and is subject to equity price risk. The primary risks associated with the use of futures contracts are the imperfect correlation between changes in market values of securities held by the Fund and the prices of futures contracts, and the possibility of an illiquid market. Futures contracts are generally entered into on a regulated futures exchange and cleared through a clearinghouse associated with the exchange. With futures contracts, there is minimal counterparty risk to the Fund since futures contracts are exchange-traded and the exchange’s clearinghouse, as the counterparty to all exchange-traded futures, guarantees the futures contracts against default.
Upon entering into a futures contract, the Fund is required to deposit either cash or securities (initial margin) with the broker in an amount equal to a certain percentage of the contract value. Subsequent payments (variation margin) are paid to or received from the broker each day equal to the daily changes in the contract value. Such payments are recorded as unrealized gains or losses and, if any, shown as variation margin receivable (payable) in the Statement of Assets and Liabilities. Should the Fund fail to make requested variation margin payments, the broker can gain access to the initial margin to satisfy the Fund’s payment obligations. When the contracts are closed, a realized gain or loss is recorded in the Statement of Operations.
24 | Allspring Large Company Value Fund
Notes to financial statements (unaudited)
Security transactions and income recognition
Securities transactions are recorded on a trade date basis. Realized gains or losses are recorded on the basis of identified cost.
Dividend income is recognized on the ex-dividend date.
Interest earned on cash balances held at the custodian is recorded as interest income.
Distributions received from REIT investments may be characterized as ordinary income, capital gains, or a return of capital to the Fund based on information provided by the REIT. The proper characterization of REIT distributions is generally not known until after the end of each calendar year. As such, estimates may be used in reporting the character of income and distributions for financial statement purposes.
Distributions to shareholders
Distributions to shareholders are recorded on the ex-dividend date and paid from net investment income quarterly and any net realized gains are paid at least annually. Such distributions are determined in accordance with income tax regulations and may differ from U.S. generally accepted accounting principles. Dividend sources are estimated at the time of declaration. The tax character of distributions is determined as of the Fund’s fiscal year end. Therefore, a portion of the Fund’s distributions made prior to the Fund’s fiscal year end may be categorized as a tax return of capital at year end.
Federal and other taxes
The Fund intends to continue to qualify as a regulated investment company by distributing substantially all of its investment company taxable income and any net realized capital gains (after reduction for capital loss carryforwards) sufficient to relieve it from all, or substantially all, federal income taxes. Accordingly, no provision for federal income taxes was required.
The Fund’s income and federal excise tax returns and all financial records supporting those returns for the prior three fiscal years are subject to examination by the federal and Delaware revenue authorities. Management has analyzed the Fund’s tax positions taken on federal, state, and foreign tax returns, as applicable, for all open tax years and does not believe that there are any uncertain tax positions that require recognition of a tax liability.
As of January 31, 2024, the aggregate cost of all investments for federal income tax purposes was $206,258,027 and the unrealized gains (losses) consisted of:
As of July 31, 2023, the Fund had capital loss carryforwards which consisted of $1,572,191 in short-term capital losses.
Class allocations
The separate classes of shares offered by the Fund differ principally in applicable sales charges, distribution, shareholder servicing, and administration fees. Class specific expenses are charged directly to that share class. Investment income, common fund-level expenses, and realized and unrealized gains (losses) on investments are allocated daily to each class of shares based on the relative proportion of net assets of each class.
3.
FAIR VALUATION MEASUREMENTS
Fair value measurements of investments are determined within a framework that has established a fair value hierarchy based upon the various data inputs utilized in determining the value of the Fund’s investments. The three-level hierarchy gives the highest priority to unadjusted quoted prices in active markets for identical assets or liabilities (Level 1) and the lowest priority to unobservable inputs (Level 3). The Fund’s investments are classified within the fair value hierarchy based on the lowest level of input that is significant to the fair value measurement. The inputs are summarized into three broad levels as follows:
•Level 1—quoted prices in active markets for identical securities
•Level 2—other significant observable inputs (including quoted prices for similar securities, interest rates, prepayment speeds, credit risk, etc.)
•Level 3—significant unobservable inputs (including the Fund’s own assumptions in determining the fair value of investments)
The inputs or methodologies used for valuing investments in securities are not necessarily an indication of the risk associated with investing in those securities.
Allspring Large Company Value Fund | 25
Notes to financial statements (unaudited)
The following is a summary of the inputs used in valuing the Fund’s assets and liabilities as of January 31, 2024:
| | Other significant
observable inputs
(Level 2) | Significant
unobservable inputs
(Level 3) | |
| | | | |
| | | | |
| | | | |
| | | | |
| | | | |
| | | | |
| | | | |
| | | | |
| | | | |
| | | | |
| | | | |
| | | | |
| | | | |
| | | | |
| | | | |
| | | | |
| | | | |
| | | | |
| | | | |
Futures contracts are reported at their cumulative unrealized gains (losses) at measurement date as reported in the table following the Portfolio of Investments. For futures contracts , the current day’s variation margin is reported on the Statement of Assets and Liabilities. All other assets and liabilities are reported at their market value at measurement date.
Additional sector, industry or geographic detail, if any, is included in the Portfolio of Investments.
At January 2024, the Fund did not have any transfers into/out of Level 3.
4.
TRANSACTIONS WITH AFFILIATES
Management fee
Allspring Funds Management, a wholly owned subsidiary of Allspring Global Investments Holdings, LLC, a holding company indirectly owned by certain private funds of GTCR LLC and Reverence Capital Partners, L.P., is the manager of the Fund and provides advisory and fund-level administrative services under an investment management agreement. Under the investment management agreement, Allspring Funds Management is responsible for, among other services, implementing the investment objectives and strategies of the Fund, supervising the subadviser and providing fund-level administrative services in connection with the Fund’s operations. As compensation for its services under the investment management agreement, Allspring Funds Management is entitled to receive a management fee at the following annual rate based on the Fund’s average daily net assets:
For the six months ended January 31, 2024, the management fee was equivalent to an annual rate of 0.40% of the Fund’s average daily net assets.
Allspring Funds Management has retained the services of a subadviser to provide daily portfolio management to the Fund. The fee for subadvisory services is borne by Allspring Funds Management. Allspring Global Investments, LLC, an affiliate of Allspring Funds Management and a wholly owned subsidiary of Allspring Global Investments Holdings, LLC, is the subadviser to the Fund and is entitled to receive a fee from Allspring Funds Management at an annual rate starting at 0.25% and declining to 0.15% as the average daily net assets of the Fund increase.
Administration fees
Under a class-level administration agreement, Allspring Funds Management provides class-level administrative services to the Fund, which includes paying fees and expenses for services provided by the transfer agent, sub-transfer agents, omnibus account servicers and record-keepers. As
26 | Allspring Large Company Value Fund
Notes to financial statements (unaudited)
compensation for its services under the class-level administration agreement, Allspring Funds Management receives an annual fee which is calculated based on the average daily net assets of each class as follows:
| Class-level
administration fee |
| |
| |
| |
| |
| |
Waivers and/or expense reimbursements
Allspring Funds Management has contractually committed to waive and/or reimburse management and administration fees to the extent necessary to maintain certain net operating expense ratios for the Fund. When each class of the Fund has exceeded its expense cap, Allspring Funds Management will waive fees and/or reimburse expenses from fund-level expenses on a proportionate basis and then from class specific expenses. When only certain classes exceed their expense caps, waivers and/or reimbursements are applied against class specific expenses before fund-level expenses. Allspring Funds Management has contractually committed through November 30, 2024 to waive fees and/or reimburse expenses to the extent necessary to cap the Fund’s expenses. Prior to or after the commitment expiration date, the cap may be increased or the commitment to maintain the cap may be terminated only with the approval of the Board of Trustees. As of January 31, 2024, the contractual expense caps are as follows:
Distribution fee
The Trust has adopted a distribution plan for Class C shares pursuant to Rule 12b-1 under the 1940 Act. A distribution fee is charged to Class C shares and paid to Allspring Funds Distributor, LLC (“Allspring Funds Distributor”), the principal underwriter, an affiliate of Allspring Funds Management, at an annual rate up to 0.75% of the average daily net assets of Class C shares.
In addition, Allspring Funds Distributor is entitled to receive the front-end sales charge from the purchase of Class A shares and a contingent deferred sales charge on the redemption of certain Class A shares. Allspring Funds Distributor is also entitled to receive the contingent deferred sales charges from redemptions of Class C shares. For the six months ended January 31, 2024, Allspring Funds Distributor received $338 from the sale of Class A shares. No contingent deferred sales charges were incurred by Class A and Class C shares for the six months ended January 31, 2024.
Shareholder servicing fees
The Trust has entered into contracts with one or more shareholder servicing agents, whereby Class A, Class C and Administrator Class are charged a fee at an annual rate up to 0.25% of the average daily net assets of each respective class. A portion of these total shareholder servicing fees were paid to affiliates of the Fund.
Interfund transactions
The Fund may purchase or sell portfolio investment securities to certain affiliates pursuant to Rule 17a-7 under the 1940 Act and under procedures adopted by the Board of Trustees. The procedures have been designed to ensure that these interfund transactions, which do not incur broker commissions, are effected at current market prices. Pursuant to these procedures, the Fund did not have any interfund transactions during the six months ended January 31, 2024.
5.
INVESTMENT PORTFOLIO TRANSACTIONS
Purchases and sales of investments, excluding U.S. government obligations (if any) and short-term securities, for the six months ended January 31, 2024 were $304,817,794 and $313,562,329, respectively.
6.
DERIVATIVE TRANSACTIONS
During the six months ended January 31, 2024, the Fund entered into futures contracts to gain market exposure. The Fund had an average notional amount of $4,410,103 in long futures contracts during the six months ended January 31, 2024.
The fair value, realized gains or losses and change in unrealized gains or losses, if any, on derivative instruments are reflected in the corresponding financial statement captions.
Allspring Large Company Value Fund | 27
Notes to financial statements (unaudited)
The Trust (excluding the money market funds), Allspring Master Trust and Allspring Variable Trust are parties to a $350,000,000 revolving credit agreement whereby the Fund is permitted to use bank borrowings for temporary or emergency purposes, such as to fund shareholder redemption requests. Interest under the credit agreement is charged to the Fund based on borrowing rate equal to the higher of the Federal Funds rate or the overnight bank funding rate in effect on that day plus a spread. In addition, an annual commitment fee based on the unused balance is allocated to each participating fund.
For the six months ended January 31, 2024, there were no borrowings by the Fund under the agreement.
Under the Fund’s organizational documents, the officers and Trustees have been granted certain indemnification rights against certain liabilities that may arise out of performance of their duties to the Fund. The Fund has entered into a separate agreement with each Trustee that converts indemnification rights currently existing under the Fund’s organizational documents into contractual rights that cannot be changed in the future without the consent of the Trustee. Additionally, in the normal course of business, the Fund may enter into contracts with service providers that contain a variety of indemnification clauses. The Fund’s maximum exposure under these arrangements is dependent on future claims that may be made against the Fund and, therefore, cannot be estimated.
28 | Allspring Large Company Value Fund
Other information (unaudited)
Other information
Proxy voting information
A description of the policies and procedures used to determine how to vote proxies relating to portfolio securities is available without charge, upon request, by calling 1-866-259-3305, visiting our website at allspringglobal.com, or visiting the SEC website at sec.gov. Information regarding how the proxies related to portfolio securities were voted during the most recent 12-month period ended June 30 is available on the website at allspringglobal.com or by visiting the SEC website at sec.gov.
Quarterly portfolio holdings information
The Fund files its complete schedule of portfolio holdings with the SEC for the first and third quarters of each fiscal year as an exhibit to its reports on Form N-PORT. Shareholders may view the filed Form N-PORT by visiting the SEC website at sec.gov.
Allspring Large Company Value Fund | 29
Other information (unaudited)
Board of trustees and officers
Each of the Trustees and Officers listed in the table below acts in identical capacities for each fund in the Allspring family of funds, which consists of 116 mutual funds comprising the Allspring Funds Trust, Allspring Variable Trust, Allspring Master Trust and four closed-end funds (collectively the “Fund Complex”). This table should be read in conjunction with the Prospectus and the Statement of Additional Information†. The mailing address of each Trustee and Officer is 1415 Vantage Park Drive, 3rd Floor, Charlotte, NC 28203. Each Trustee and Officer serves an indefinite term, however, each Trustee serves such term until reaching the mandatory retirement age established by the Trustees.
Independent Trustees
| | Principal occupations during past five years or longer | Current other
public company or
investment
company
directorships |
William R. Ebsworth
(Born 1957) | | Retired. From 1984 to 2013, equities analyst, portfolio manager, research director and chief investment officer at Fidelity Management and Research Company in Boston, Tokyo, and Hong Kong, and retired in 2013 as Chief Investment Officer of Fidelity Strategic Advisers, Inc. where he led a team of investment professionals managing client assets. Prior thereto, Board member of Hong Kong Securities Clearing Co., Hong Kong Options Clearing Corp., the Thailand International Fund, Ltd., Fidelity Investments Life Insurance Company, and Empire Fidelity Investments Life Insurance Company. Serves on the Investment Company Institute’s Board of Governors since 2022 and Executive Committee since 2023 as well as the Vice Chairman of the Governing Council of the Independent Directors Council since 2023. Audit Committee Chair and Investment Committee Chair of the Vincent Memorial Hospital Foundation (non-profit organization). Mr. Ebsworth is a CFA charterholder. | |
Jane A. Freeman
(Born 1953) | Trustee,
since 2015;
Chair Liaison,
| Retired. From 2012 to 2014 and 1999 to 2008, Chief Financial Officer of Scientific Learning Corporation. From 2008 to 2012, Ms. Freeman provided consulting services related to strategic business projects. Prior to 1999, Portfolio Manager at Rockefeller & Co. and Scudder, Stevens & Clark. Board member of the Harding Loevner Funds from 1996 to 2014, serving as both Lead Independent Director and chair of the Audit Committee. Board member of the Russell Exchange Traded Funds Trust from 2011 to 2012 and the chair of the Audit Committee. Ms. Freeman is also an inactive Chartered Financial Analyst. | |
Isaiah Harris, Jr.
(Born 1952) | Trustee,
since 2009;
Audit Committee Chair,
since 2019 | Retired. Member of the Advisory Board of CEF of East Central Florida. Chairman of the Board of CIGNA Corporation from 2009 to 2021, and Director from 2005 to 2008. From 2003 to 2011, Director of Deluxe Corporation. Prior thereto, President and CEO of BellSouth Advertising and Publishing Corp. from 2005 to 2007, President and CEO of BellSouth Enterprises from 2004 to 2005 and President of BellSouth Consumer Services from 2000 to 2003. Emeritus member of the Iowa State University Foundation Board of Governors. Emeritus Member of the Advisory board of Iowa State University School of Business. Advisory Board Member, Palm Harbor Academy (private school). Advisory Board Member, Fellowship of Christian Athletes. Mr. Harris is a certified public accountant (inactive status). | |
David F. Larcker
(Born 1950) | | Distinguished Visiting Fellow at the Hoover Institution since 2022. James Irvin Miller Professor of Accounting at the Graduate School of Business (Emeritus), Stanford University, Director of the Corporate Governance Research Initiative and Senior Faculty of The Rock Center for Corporate Governance since 2006. From 2005 to 2008, Professor of Accounting at the Graduate School of Business, Stanford University. Prior thereto, Ernst & Young Professor of Accounting at The Wharton School, University of Pennsylvania from 1985 to 2005. | |
Olivia S. Mitchell
(Born 1953) | | International Foundation of Employee Benefit Plans Professor since 1993, Wharton School of the University of Pennsylvania. Director of Wharton’s Pension Research Council and Boettner Center on Pensions & Retirement Research, and Research Associate at the National Bureau of Economic Research. Previously taught at Cornell University from 1978 to 1993. | |
Timothy J. Penny
(Born 1951) | Trustee,
since 1996;
Chair,
since 2018 | President and Chief Executive Officer of Southern Minnesota Initiative Foundation, a non-profit organization, since 2007. Vice Chair of the Economic Club of Minnesota, since 2007. Co-Chair of the Committee for a Responsible Federal Budget, since 1995. Member of the Board of Trustees of NorthStar Education Finance, Inc., a non-profit organization, from 2007-2022. Senior Fellow of the University of Minnesota Humphrey Institute from 1995 to 2017. | |
* Length of service dates reflect the Trustee’s commencement of service with the Trust’s predecessor entities, where applicable.
# Ms. Freeman will serve as Chair Liaison through June 2024, at which time Ms. Wheelock will assume the role.
†
The Statement of Additional Information includes additional information about the Trustees and is available, without charge, upon request, by calling 1-800-222-8222 or by visiting the website at allspringglobal.com.
30 | Allspring Large Company Value Fund
Other information (unaudited)
| Position held and length of service* | Principal occupations during past five years or longer | Current other public company or investment company directorships |
James G. Polisson
(Born 1959) | Trustee,
since 2018; Nominating and Governance Committee Chair, since 2024 | Retired. Chief Marketing Officer, Source (ETF) UK Services, Ltd, from 2015 to 2017. From 2012 to 2015, Principal of The Polisson Group, LLC, a management consulting, corporate advisory and principal investing company. Chief Executive Officer and Managing Director at Russell Investments, Global Exchange Traded Funds from 2010 to 2012. Managing Director of Barclays Global Investors from 1998 to 2010 and Global Chief Marketing Officer for iShares and Barclays Global Investors from 2000 to 2010. Trustee of the San Francisco Mechanics’ Institute, a non- profit organization, from 2013 to 2015. Board member of the Russell Exchange Traded Fund Trust from 2011 to 2012. Director of Barclays Global Investors Holdings Deutschland GmbH from 2006 to 2009. Mr. Polisson is an attorney and has a retired status with the Massachusetts and District of Columbia Bar Associations. | |
Pamela Wheelock
(Born 1959) | Trustee,
since January 2020;
previously Trustee from
January 2018 to
| Retired. Executive and Senior Financial leadership positions in the public, private and nonprofit sectors. Interim President and CEO, McKnight Foundation, 2020. Interim Commissioner, Minnesota Department of Human Services, 2019. Chief Operating Officer, Twin Cities Habitat for Humanity, 2017-2019. Vice President for University Services, University of Minnesota, 2012- 2016. Interim President and CEO, Blue Cross and Blue Shield of Minnesota, 2011-2012. Executive Vice-President and Chief Financial Officer, Minnesota Wild, 2002-2008. Commissioner, Minnesota Department of Finance, 1999-2002. Chair of the Board of Directors of Destination Medical Center Corporation. Board member of the Minnesota Wild Foundation. | |
* Length of service dates reflect the Trustee’s commencement of service with the Trust’s predecessor entities, where applicable.
# Ms. Freeman will serve as Chair Liaison through June 2024, at which time Ms. Wheelock will assume the role.
Allspring Large Company Value Fund | 31
Other information (unaudited)
Officers1
| Position held and
length of service | Principal occupations during past five years or longer |
| | President and Chief Executive Officer of Allspring Funds Management, LLC since 2017 and Head of Global Fund Governance of Allspring Global Investments since 2022. Prior thereto, co-president of Galliard Capital Management, LLC, an affiliate of Allspring Funds Management, LLC, from 2019 to 2022 and Head of Affiliated Managers, Allspring Global Investments, from 2014 to 2019 and Executive Vice President responsible for marketing, investments and product development for Allspring Funds Management, LLC, from 2009 to 2014. |
Jeremy DePalma
(Born 1974) | Treasurer,
since 2012
(for certain funds in
the Fund Complex);
since 2021 (for
the remaining funds in the Complex) | Senior Vice President of Allspring Funds Management, LLC since 2009. Senior Vice President of Evergreen Investment Management Company, LLC from 2008 to 2010 and head of the Fund Reporting and Control Team within Fund Administration from 2005 to 2010. |
Christopher Baker
(Born 1976) | Chief Compliance Officer,
since 2022 | Global Chief Compliance Officer for Allspring Global Investments since 2022. Prior thereto, Chief Compliance Officer for State Street Global Advisors from 2018 to 2021. Senior Compliance Officer for the State Street divisions of Alternative Investment Solutions, Sector Solutions, and Global Marketing from 2015 to 2018. From 2010 to 2015 Vice President, Global Head of Investment and Marketing Compliance for State Street Global Advisors. |
Matthew Prasse
(Born 1983) | Chief Legal Officer,
since 2022;
Secretary,
since 2021 | Senior Counsel of the Allspring Legal Department since 2021. Senior Counsel of the Wells Fargo Legal Department from 2018 to 2021. Previously, Counsel for Barings LLC from 2015 to 2018. Prior to joining Barings, Associate at Morgan, Lewis & Bockius LLP from 2008 to 2015. |
1 For those Officers with tenures at Allspring Global Investments and/or Allspring Funds Management, LLC that began prior to 2021, such tenures include years of service during which these businesses/entities were known as Wells Fargo Asset Management and Wells Fargo Funds Management, LLC, respectively.
32 | Allspring Large Company Value Fund
For more information
More information about Allspring Funds is available free upon request. To obtain literature, please write, visit the Fund’s website, or call:
Allspring Funds
P.O. Box 219967
Kansas City, MO 64121-9967
Website: allspringglobal.com
Individual investors: 1-800-222-8222
Retail investment professionals: 1-888-877-9275
Institutional investment professionals: 1-800-260-5969
This report and the financial statements contained herein are submitted for the general information of the shareholders of the Fund. If this report is used for promotional purposes, distribution of the report must be accompanied or preceded by a current prospectus. Before investing, please consider the investment objectives, risks, charges, and expenses of the investment. For a current prospectus and, if available, a summary prospectus, containing this information, call 1-800-222-8222 or visit the Fund’s website at allspringglobal.com. Read the prospectus carefully before you invest or send money.
Allspring Global InvestmentsTM is the trade name for the asset management firms of Allspring Global Investments Holdings, LLC, a holding company indirectly owned by certain private funds of GTCR LLC and Reverence Capital Partners, L.P. These firms include but are not limited to Allspring Global Investments, LLC, and Allspring Funds Management, LLC. Certain products managed by Allspring entities are distributed by Allspring Funds Distributor, LLC (a broker-dealer and Member FINRA/SIPC).
This material is for general informational and educational purposes only and is NOT intended to provide investment advice or a recommendation of any kind - including a recommendation for any specific investment, strategy, or plan.
© 2024 Allspring Global Investments Holdings, LLC. All rights reserved.
ALL-02052024-vz4iuojl 03-24
SAR3325 01-24
Allspring Premier Large Company Growth Fund
Semi-Annual Report
January 31, 2024
The views expressed and any forward-looking statements are as of January 31, 2024, unless otherwise noted, and are those of the Fund’s portfolio managers and/or Allspring Global Investments. Discussions of individual securities or the markets generally are not intended as individual recommendations. Future events or results may vary significantly from those expressed in any forward-looking statements. The views expressed are subject to change at any time in response to changing circumstances in the market. Allspring Global Investments disclaims any obligation to publicly update or revise any views expressed or forward-looking statements.
Allspring Premier Large Company Growth Fund | 1
Letter to shareholders (unaudited)
Andrew Owen
President
Allspring Funds
Dear Shareholder:
We are pleased to offer you this semi-annual report for the Allspring Premier Large Company Growth Fund for the six-month period that ended January 31, 2024. Globally, stocks and bonds experienced high levels of volatility throughout the period. The market was focused on persistently high inflation and the impact of ongoing aggressive central bank rate hikes. Riskier assets rallied as investors anticipated an end to the tight monetary policy despite concerns of a possible recession.
For the period, U.S. stocks, based on the S&P 500 Index,1 returned 6.43%. International stocks, as measured by the MSCI ACWI ex USA Index (Net),2 gained 0.48% while the MSCI EM Index (Net) (USD),3 returned -6.00%. Among bond indexes, the Bloomberg U.S. Aggregate Bond Index4 returned 3.15%, the Bloomberg Global Aggregate ex-USD Index (unhedged)5 gained 1.15%, the Bloomberg Municipal Bond Index6 returned 2.70%, and the ICE BofA U.S. High Yield Index7 gained 6.17%.
Still focused on high inflation and elevated central bank rates, markets were volatile.
The six-month period began with stocks retreating in August after a July rally while monthly bond returns were flat overall. Increased global market volatility reflected unease over the Chinese property market being stressed along with weak Chinese economic data. However, speculation grew over a possible end to the Federal Reserve’s (Fed’s) campaign of interest rate increases or at least a pause in September. U.S. economic data generally remained solid, with resilient job market data and inflation ticking up slightly in August as the annual Consumer Price Index (CPI)8 rose 3.7%. However, the three-month trend for Core CPI9 stood at an annualized 2.4%.
Stocks and bonds both had negative overall returns in September as investors were disappointed by the Fed’s determination not to lower interest rates until it knows it has vanquished persistently high inflation. As of September, the two primary gauges of U.S. inflation—the annual Core Personal Consumption Expenditures Price Index10 and the CPI—both stood at roughly 4%, twice as high as the Fed’s oft-stated 2% target. The month ended with the prospect of yet another U.S. government shutdown, averted at least temporarily but looming later in the year.
1
The S&P 500 Index consists of 500 stocks chosen for market size, liquidity, and industry group representation. It is a market-value-weighted index with each stock’s weight in the index proportionate to its market value. You cannot invest directly in an index.
2
The Morgan Stanley Capital International (MSCI) All Country World Index (ACWI) ex USA Index (Net) is a free-float-adjusted market-capitalization-weighted index that is designed to measure the equity market performance of developed and emerging markets, excluding the U.S. Source: MSCI. MSCI makes no express or implied warranties or representations and shall have no liability whatsoever with respect to any MSCI data contained herein. The MSCI data may not be further redistributed or used as a basis for other indexes or any securities or financial products. This report is not approved, reviewed, or produced by MSCI. You cannot invest directly in an index.
3
The MSCI Emerging Markets (EM) Index (Net) (USD) is a free-float-adjusted market-capitalization-weighted index that is designed to measure the equity market performance of emerging markets. You cannot invest directly in an index.
4
The Bloomberg U.S. Aggregate Bond Index is a broad-based benchmark that measures the investment-grade, U.S.-dollar-denominated, fixed-rate taxable bond market, including Treasuries, government-related and corporate securities, mortgage-backed securities (agency fixed-rate and hybrid adjustable-rate mortgage pass-throughs), asset-backed securities, and commercial mortgage-backed securities. You cannot invest directly in an index.
5
The Bloomberg Global Aggregate ex-USD Index (unhedged) is an unmanaged index that provides a broad-based measure of the global investment-grade fixed-income markets excluding the U.S.-dollar-denominated debt market. You cannot invest directly in an index.
6
The Bloomberg Municipal Bond Index is an unmanaged index composed of long-term tax-exempt bonds with a minimum credit rating of Baa. You cannot invest directly in an index.
7
The ICE BofA U.S. High Yield Index is a market-capitalization-weighted index of domestic and Yankee high yield bonds. The index tracks the performance of high yield securities traded in the U.S. bond market. You cannot invest directly in an index. Copyright 2024. ICE Data Indices, LLC. All rights reserved.
8
The Consumer Price Index (CPI) is a measure of the average change over time in the prices paid by urban consumers for a market basket of consumer goods and services. You cannot invest directly in an index.
9
The Core CPI is a measure of the average change over time in the prices paid by urban consumers for a market basket of consumer goods and services excluding energy and food prices. You cannot invest directly in an index.
10
The Core Personal Consumption Expenditures Price Index (PCE) is a measure of prices that people living in the United States, or those buying on their behalf, pay for goods and services. It is sometimes called the core PCE price index, because two categories that can have price swings – food and energy – are left out to make underlying inflation easier to see. You cannot invest directly in an index.
2 | Allspring Premier Large Company Growth Fund
Letter to shareholders (unaudited)
October was a tough month for financial markets overall. Key global and domestic indexes all were pushed down by rising geopolitical tensions—particularly the Israel-Hamas conflict—and concerns over the Fed’s “higher for longer” monetary policy. The U.S. 10-year Treasury yield rose above 5% for the first time since 2007. Commodity prices did well as oil prices rallied in response to the prospect of oil supply disruptions from the Middle East. U.S. annualized third quarter GDP was estimated at a healthier-than-anticipated 4.9%. China’s GDP indicated surprisingly strong industrial production and retail sales, offset by ongoing weakness in its real estate sector.
In November, the market mood turned positive as cooling inflation inspired confidence that central banks could hold off on further rate hikes. Overall annual inflation in the U.S. fell to 3.1% in November while 12-month inflation in the U.K. and eurozone eased to 4.6% and 2.4%, respectively—far below their peak levels of mid-2022. Third quarter annualized U.S. GDP growth was raised to an estimated 5.2% while U.S. job totals rose by just below 200,000 in November, indicating a slight cooling of the labor market. All of this fresh evidence added to confidence for a U.S. soft economic landing, leading to a more buoyant mood heading into winter as the Federal Open Market Committee held rates steady at its December meeting.
The broad year-end rally among stocks and bonds that began in November continued through December as investors became more confident that monetary policy would ease in 2024. Supporting the bubbly market mood were a series of reports confirming lower inflationary trends in the U.S. and Europe. During the period, it appeared more likely that the U.S. economy could achieve a soft landing, cooling enough to lower inflation without the pain of a recession. However, by year-end, an expectations gap developed. Capital markets priced in a total of 1.50 percentage points in federal funds rate cuts in 2024, twice as much as the three cuts of 0.25% hinted at by Fed officials.
Financial market performance was mixed in January 2024 as U.S. stocks had modest gains while non-U.S. equities, particularly those in emerging markets, and fixed income assets were held back by central bank pushback on market optimism over rate cuts. Overall, optimism was supported by indications of a soft landing for the U.S. economy. Key data included a surprisingly strong gain of 353,000 jobs in January, an unemployment rate of just 3.7%, and a rise of just 3.1% in the CPI in January. However, that resilience helped push back expectations of a rate cut in March to a more likely second quarter initial move.
Don’t let short-term uncertainty derail long-term investment goals.
Periods of investment uncertainty can present challenges, but experience has taught us that maintaining long-term investment goals can be an effective way to plan for the future. To help you create a sound strategy based on your personal goals and risk tolerance, Allspring Funds offers more than 100 mutual funds spanning a wide range of asset classes and investment styles. Although diversification cannot guarantee an investment profit or prevent losses, we believe it can be an effective way to manage investment risk and potentially smooth out overall portfolio performance. We encourage investors to know their investments and to understand that appropriate levels of risk-taking may unlock opportunities.
Thank you for choosing to invest with Allspring Funds. We appreciate your confidence in us and remain committed to helping you meet your financial needs.
Sincerely,
Andrew Owen
President
Allspring Funds
“ In November, the market mood turned positive as cooling inflation inspired confidence that central banks could hold off on further rate hikes. ”
For further information about your fund, contact your investment professional, visit our website at allspringglobal.com, or call us directly at 1-800-222-8222.
Allspring Premier Large Company Growth Fund | 3
Letter to shareholders (unaudited)
|
Beginning in July 2024, the Fund will be required by the Securities and Exchange Commission to send shareholders a paper copy of a new tailored shareholder report in place of the full shareholder report that you are now receiving. The tailored shareholder report will contain concise information about the Fund, including certain expense and performance information and fund statistics. If you wish to receive this new tailored shareholder report electronically, please follow the instructions on the back cover of this report. |
Other information that is currently included in the shareholder report, such as the Fund’s financial statements, will be available online and upon request, free of charge, in paper or electronic format. |
4 | Allspring Premier Large Company Growth Fund
This page is intentionally left blank.
Performance highlights (unaudited)
Performance highlights
| The Fund seeks long-term capital appreciation. |
| Allspring Funds Management, LLC |
| Allspring Global Investments, LLC |
| Robert Gruendyke, CFA, David Nazaret, CFA, Thomas C. Ognar, CFA |
Average annual total returns (%) as of January 31, 2024 |
| | | | |
| | | | | | | | | |
| | | | | | | | | |
| | | | | | | | | |
| | | | | | | | | |
Administrator Class (WFPDX) | | | | | | | | | |
Institutional Class (EKJYX) | | | | | | | | | |
| | | | | | | | | |
Russell 1000® Growth Index4 | | | | | | | | | |
Figures quoted represent past performance, which is no guarantee of future results, and do not reflect taxes that a shareholder may pay on an investment in a fund. Investment return and principal value of an investment will fluctuate so that an investor’s shares, when redeemed, may be worth more or less than their original cost. Performance shown without sales charges would be lower if sales charges were reflected. Current performance may be lower or higher than the performance data quoted, which assumes the reinvestment of dividends and capital gains. Current month-end performance is available on the Fund’s website, allspringglobal.com.
Please keep in mind that high double-digit returns were primarily achieved during favorable market conditions. You should not expect that such favorable returns can be consistently achieved. A fund’s performance, especially for short time periods, should not be the sole factor in making your investment decision.
Index returns do not include transaction costs associated with buying and selling securities, any mutual fund fees or expenses, or any taxes. It is not possible to invest directly in an index.
For Class A shares, the maximum front-end sales charge is 5.75%. For Class C shares, the maximum contingent deferred sales charge is 1.00%. Performance including a contingent deferred sales charge assumes the sales charge for the corresponding time period. Class R6, Administrator Class and Institutional Class shares are sold without a front-end sales charge or contingent deferred sales charge.
|
| Reflects the expense ratios as stated in the most recent prospectuses. The expense ratios shown are subject to change and may differ from the annualized expense ratios shown in the Financial Highlights of this report. |
| The manager has contractually committed through November 30, 2024, to waive fees and/or reimburse expenses to the extent necessary to cap total annual fund operating expenses after fee waivers at 1.10% for Class A, 1.85% for Class C, 0.65% for Class R6, 1.00% for Administrator Class and 0.70% for Institutional Class. Brokerage commissions, stamp duty fees, interest, taxes, acquired fund fees and expenses (if any), and extraordinary expenses are excluded from the expense caps. Prior to or after the commitment expiration date, the caps may be increased or the commitment to maintain the caps may be terminated only with the approval of the Board of Trustees. Without these caps, the Fund’s returns would have been lower. The expense ratio paid by an investor is the net expense ratio (the total annual fund operating expenses after fee waivers) as stated in the prospectuses. |
| The Russell 3000® Index measures the performance of the 3,000 largest U.S. companies based on total market capitalization, which represents approximately 98% of the investable U.S. equity market. You cannot invest directly in an index. |
| The Russell 1000® Growth Index measures the performance of those Russell 1000 companies with higher price/book ratios and higher forecasted growth values. You cannot invest directly in an index. |
Stock values fluctuate in response to the activities of individual companies and general market and economic conditions. Certain investment strategies tend to increase the total risk of an investment (relative to the broader market). This fund is exposed to foreign investment risk. Consult the Fund’s prospectus for additional information on these and other risks.
CFA® and Chartered Financial Analyst® are trademarks owned by CFA Institute. |
6 | Allspring Premier Large Company Growth Fund
Performance highlights (unaudited)
Ten largest holdings (%) as of January 31, 20241 |
| |
| |
| |
Meta Platforms, Inc. Class A | |
| |
| |
| |
| |
| |
| |
| Figures represent the percentage of the Fund’s net assets. Holdings are subject to change and may have changed since the date specified. |
Sector allocation as of January 31, 20241 |
| Figures represent the percentage of the Fund’s long-term investments. Allocations are subject to change and may have changed since the date specified. |
Allspring Premier Large Company Growth Fund | 7
Fund expenses (unaudited)
Fund expenses
As a shareholder of the Fund, you incur two types of costs: (1) transaction costs, including sales charges (loads) on purchase payments and contingent deferred sales charges (if any) on redemptions and (2) ongoing costs, including management fees, distribution (12b-1) and/or shareholder servicing fees, and other Fund expenses. This example is intended to help you understand your ongoing costs (in dollars) of investing in the Fund and to compare these costs with the ongoing costs of investing in other mutual funds.
The example is based on an investment of $1,000 invested at the beginning of the six-month period and held for the entire period from August 1, 2023 to January 31, 2024.
Actual expenses
The “Actual” line of the table below provides information about actual account values and actual expenses. You may use the information in this line, together with the amount you invested, to estimate the expenses that you paid over the period. Simply divide your account value by $1,000 (for example, an $8,600 account value divided by $1,000= 8.6), then multiply the result by the number in the “Actual” line under the heading entitled “Expenses paid during period” for your applicable class of shares to estimate the expenses you paid on your account during this period.
Hypothetical example for comparison purposes
The “Hypothetical” line of the table below provides information about hypothetical account values and hypothetical expenses based on the Fund’s actual expense ratio and an assumed rate of return of 5% per year before expenses, which is not the Fund’s actual return. The hypothetical account values and expenses may not be used to estimate the actual ending account balance or expenses you paid for the period. You may use this information to compare the ongoing costs of investing in the Fund and other funds. To do so, compare this 5% hypothetical example with the 5% hypothetical examples that appear in the shareholder reports of the other funds.
Please note that the expenses shown in the table are meant to highlight your ongoing costs only and do not reflect any transactional costs, such as sales charges (loads) and contingent deferred sales charges. Therefore, the “Hypothetical” line of the table is useful in comparing ongoing costs only, and will not help you determine the relative total costs of owning different funds. In addition, if these transactional costs were included, your costs would have been higher.
| Beginning
account value
8-1-2023 | Ending
account value
1-31-2024 | | Annualized net
expense ratio |
| | | | |
| | | | |
Hypothetical (5% return before expenses) | | | | |
| | | | |
| | | | |
Hypothetical (5% return before expenses) | | | | |
| | | | |
| | | | |
Hypothetical (5% return before expenses) | | | | |
| | | | |
| | | | |
Hypothetical (5% return before expenses) | | | | |
| | | | |
| | | | |
Hypothetical (5% return before expenses) | | | | |
| Expenses paid is equal to the annualized net expense ratio of each class multiplied by the average account value over the period, multiplied by 184 divided by 366 (to reflect the one-half-year period). |
8 | Allspring Premier Large Company Growth Fund
Portfolio of investments—January 31, 2024 (unaudited)
| | | | | |
| | | | | | |
Communication services: 11.52% | | | | | | |
| | | | | | |
Live Nation Entertainment, Inc.† | | | | | | |
Take-Two Interactive Software, Inc.† | | | | | | |
| | | | | | |
Interactive media & services: 8.43% | | | | | | |
| | | | | | |
| | | | | | |
Meta Platforms, Inc. Class A† | | | | | | |
| | | | | | |
| | | | | | |
Trade Desk, Inc. Class A† | | | | | | |
Consumer discretionary: 15.65% | | | | | | |
| | | | | | |
| | | | | | |
| | | | | | |
| | | | | | |
Hotels, restaurants & leisure: 3.91% | | | | | | |
| | | | | | |
| | | | | | |
DraftKings, Inc. Class A† | | | | | | |
Hilton Worldwide Holdings, Inc. | | | | | | |
| | | | | | |
| | | | | | |
| | | | | | |
| | | | | | |
| | | | | | |
Textiles, apparel & luxury goods: 3.00% | | | | | | |
| | | | | | |
lululemon athletica, Inc.† | | | | | | |
| | | | | | |
| | | | | | |
| | | | | | |
| | | | | | |
Personal care products: 0.81% | | | | | | |
| | | | | | |
| | | | | | |
| | | | | | |
| | | | | | |
The accompanying notes are an integral part of these financial statements.
Allspring Premier Large Company Growth Fund | 9
Portfolio of investments—January 31, 2024 (unaudited)
| | | | | |
Capital markets(continued) | | | | | | |
| | | | | | |
Tradeweb Markets, Inc. Class A | | | | | | |
| | | | | | |
Financial services: 2.12% | | | | | | |
| | | | | | |
| | | | | | |
Kinsale Capital Group, Inc. | | | | | | |
| | | | | | |
| | | | | | |
| | | | | | |
| | | | | | |
Karuna Therapeutics, Inc.† | | | | | | |
Sarepta Therapeutics, Inc.† | | | | | | |
| | | | | | |
Health care equipment & supplies: 4.42% | | | | | | |
| | | | | | |
Intuitive Surgical, Inc.† | | | | | | |
| | | | | | |
| | | | | | |
| | | | | | |
Life sciences tools & services: 0.70% | | | | | | |
| | | | | | |
Thermo Fisher Scientific, Inc. | | | | | | |
| | | | | | |
| | | | | | |
| | | | | | |
| | | | | | |
| | | | | | |
| | | | | | |
Aerospace & defense: 1.21% | | | | | | |
| | | | | | |
| | | | | | |
| | | | | | |
Commercial services & supplies: 1.17% | | | | | | |
| | | | | | |
Construction & engineering: 1.27% | | | | | | |
| | | | | | |
The accompanying notes are an integral part of these financial statements.
10 | Allspring Premier Large Company Growth Fund
Portfolio of investments—January 31, 2024 (unaudited)
| | | | | |
Electrical equipment: 1.56% | | | | | | |
| | | | | | |
| | | | | | |
| | | | | | |
Ground transportation: 1.75% | | | | | | |
| | | | | | |
| | | | | | |
| | | | | | |
Information technology: 43.08% | | | | | | |
Communications equipment: 1.76% | | | | | | |
| | | | | | |
| | | | | | |
| | | | | | |
| | | | | | |
| | | | | | |
| | | | | | |
Semiconductors & semiconductor equipment: 9.68% | | | | | | |
Microchip Technology, Inc. | | | | | | |
Monolithic Power Systems, Inc. | | | | | | |
| | | | | | |
| | | | | | |
| | | | | | |
| | | | | | |
Cadence Design Systems, Inc.† | | | | | | |
| | | | | | |
| | | | | | |
| | | | | | |
| | | | | | |
Palo Alto Networks, Inc.† | | | | | | |
| | | | | | |
Tyler Technologies, Inc.† | | | | | | |
| | | | | | |
| | | | | | |
Technology hardware, storage & peripherals: 4.33% | | | | | | |
| | | | | | |
| | | | | | |
| | | | | | |
| | | | | | |
Total common stocks (Cost $649,618,195) | | | | | | |
The accompanying notes are an integral part of these financial statements.
Allspring Premier Large Company Growth Fund | 11
Portfolio of investments—January 31, 2024 (unaudited)
| | | | | |
Short-term investments: 0.15% | | | | | | |
Investment companies: 0.15% | | | | | | |
Allspring Government Money Market Fund Select Class♠∞ | | | | | | |
Total short-term investments (Cost $1,879,551) | | | | | | |
Total investments in securities (Cost $651,497,746) | | | | | | |
Other assets and liabilities, net | | | | | | |
| | | | | | |
| Non-income-earning security |
| The issuer of the security is an affiliated person of the Fund as defined in the Investment Company Act of 1940. |
| The rate represents the 7-day annualized yield at period end. |
|
| American depositary receipt |
Investments in affiliates
An affiliated investment is an investment in which the Fund owns at least 5% of the outstanding voting shares of the issuer or as a result of other relationships, such as the Fund and the issuer having the same investment manager. Transactions with issuers that were affiliates of the Fund at the end of the period were as follows:
| | | | | Net
change in
unrealized
gains
(losses) | | | Income
from
affiliated
securities |
| | | | | | | | |
Allspring Government Money Market Fund Select Class | | | | | | | | |
The accompanying notes are an integral part of these financial statements.
12 | Allspring Premier Large Company Growth Fund
Statement of assets and liabilities—January 31, 2024 (unaudited)
Financial statements
Statement of assets and liabilities
| |
Investments in unaffiliated securities, at value (cost $649,618,195) | |
Investments in affiliated securities, at value (cost $1,879,551) | |
| |
Receivable for investments sold | |
Receivable for Fund shares sold | |
| |
Prepaid expenses and other assets | |
| |
| |
Payable for Fund shares redeemed | |
Payable for investments purchased | |
| |
Administration fees payable | |
| |
Trustees’ fees and expenses payable | |
Accrued expenses and other liabilities | |
| |
| |
| |
| |
Total distributable earnings | |
| |
Computation of net asset value and offering price per share | |
| |
Shares outstanding–Class A1 | |
Net asset value per share–Class A | |
Maximum offering price per share – Class A2 | |
| |
Shares outstanding–Class C1 | |
Net asset value per share–Class C | |
| |
Shares outstanding–Class R61 | |
Net asset value per share–Class R6 | |
Net assets–Administrator Class | |
Shares outstanding–Administrator Class1 | |
Net asset value per share–Administrator Class | |
Net assets–Institutional Class | |
Shares outstanding–Institutional Class1 | |
Net asset value per share–Institutional Class | |
1 The Fund has an unlimited number of authorized shares.
2 Maximum offering price is computed as 100/94.25 of net asset value. On investments of $50,000 or more, the offering price is reduced.
The accompanying notes are an integral part of these financial statements.
Allspring Premier Large Company Growth Fund | 13
Statement of operations—six months ended January 31, 2024 (unaudited)
Statement of operations
| |
| |
Income from affiliated securities | |
Interest (net of foreign withholding taxes of $7,217) | |
| |
| |
| |
| |
| |
| |
| |
| |
| |
Shareholder servicing fees | |
| |
| |
| |
| |
| |
Custody and accounting fees | |
| |
| |
Shareholder report expenses | |
Trustees’ fees and expenses | |
| |
| |
Less: Fee waivers and/or expense reimbursements | |
| |
| |
| |
| |
| |
| |
| |
Realized and unrealized gains (losses) on investments | |
Net realized gains (losses) on | |
| |
Foreign currency and foreign currency translations | |
Net realized gains on investments | |
Net change in unrealized gains (losses) on investments | |
Net realized and unrealized gains (losses) on investments | |
Net increase in net assets resulting from operations | |
The accompanying notes are an integral part of these financial statements.
14 | Allspring Premier Large Company Growth Fund
Statement of changes in net assets
Statement of changes in net assets
|
Six months ended
January 31, 2024 (unaudited) | |
| | | | |
| | | | |
Net realized gains on investments | | | | |
Net change in unrealized gains (losses) on investments | | | | |
Net increase in net assets resulting from operations | | | | |
Distributions to shareholders from | | | | |
Net investment income and net realized gains | | | | |
| | | | |
| | | | |
| | | | |
| | | | |
| | | | |
Total distributions to shareholders | | | | |
Capital share transactions | | | | |
Proceeds from shares sold | | | | |
| | | | |
| | | | |
| | | | |
| | | | |
| | | | |
| | | | |
| | | | |
Reinvestment of distributions | | | | |
| | | | |
| | | | |
| | | | |
| | | | |
| | | | |
| | | | |
Payment for shares redeemed | | | | |
| | | | |
| | | | |
| | | | |
| | | | |
| | | | |
| | | | |
| | | | |
Net decrease in net assets resulting from capital share transactions | | | | |
Total decrease in net assets | | | | |
| | | | |
| | | | |
| | | | |
1 For the period from August 1, 2022 to June 16, 2023. Effective at the close of business on June 16, 2023, Class R4 shares were converted to Institutional Class shares and are no longer offered by the Fund.
The accompanying notes are an integral part of these financial statements.
Allspring Premier Large Company Growth Fund | 15
Financial highlights
(For a share outstanding throughout each period)
| Six months ended
January 31, 2024
(unaudited) | |
| | | | | |
Net asset value, beginning of period | | | | | | |
| | | | | | |
Net realized and unrealized gains (losses) on investments | | | | | | |
Total from investment operations | | | | | | |
Distributions to shareholders from | | | | | | |
| | | | | | |
Net asset value, end of period | | | | | | |
| | | | | | |
Ratios to average net assets (annualized) | | | | | | |
| | | | | | |
| | | | | | |
| | | | | | |
| | | | | | |
| | | | | | |
Net assets, end of period (000s omitted) | | | | | | |
| Calculated based upon average shares outstanding |
| Total return calculations do not include any sales charges. Returns for periods of less than one year are not annualized. |
The accompanying notes are an integral part of these financial statements.
16 | Allspring Premier Large Company Growth Fund
(For a share outstanding throughout each period)
| Six months ended
January 31, 2024
(unaudited) | |
| | | | | |
Net asset value, beginning of period | | | | | | |
| | | | | | |
Net realized and unrealized gains (losses) on investments | | | | | | |
Total from investment operations | | | | | | |
Distributions to shareholders from | | | | | | |
| | | | | | |
Net asset value, end of period | | | | | | |
| | | | | | |
Ratios to average net assets (annualized) | | | | | | |
| | | | | | |
| | | | | | |
| | | | | | |
| | | | | | |
| | | | | | |
Net assets, end of period (000s omitted) | | | | | | |
| Calculated based upon average shares outstanding |
| Total return calculations do not include any sales charges. Returns for periods of less than one year are not annualized. |
The accompanying notes are an integral part of these financial statements.
Allspring Premier Large Company Growth Fund | 17
(For a share outstanding throughout each period)
| Six months ended
January 31, 2024
(unaudited) | |
| | | | | |
Net asset value, beginning of period | | | | | | |
| | | | | | |
Net realized and unrealized gains (losses) on investments | | | | | | |
Total from investment operations | | | | | | |
Distributions to shareholders from | | | | | | |
| | | | | | |
Net asset value, end of period | | | | | | |
| | | | | | |
Ratios to average net assets (annualized) | | | | | | |
| | | | | | |
| | | | | | |
| | | | | | |
| | | | | | |
| | | | | | |
Net assets, end of period (000s omitted) | | | | | | |
| Calculated based upon average shares outstanding |
| Amount is more than $(0.005). |
| Returns for periods of less than one year are not annualized. |
The accompanying notes are an integral part of these financial statements.
18 | Allspring Premier Large Company Growth Fund
(For a share outstanding throughout each period)
| Six months ended
January 31, 2024
(unaudited) | |
| | | | | |
Net asset value, beginning of period | | | | | | |
| | | | | | |
Net realized and unrealized gains (losses) on investments | | | | | | |
Total from investment operations | | | | | | |
Distributions to shareholders from | | | | | | |
| | | | | | |
Net asset value, end of period | | | | | | |
| | | | | | |
Ratios to average net assets (annualized) | | | | | | |
| | | | | | |
| | | | | | |
| | | | | | |
| | | | | | |
| | | | | | |
Net assets, end of period (000s omitted) | | | | | | |
| Calculated based upon average shares outstanding |
| Returns for periods of less than one year are not annualized. |
The accompanying notes are an integral part of these financial statements.
Allspring Premier Large Company Growth Fund | 19
(For a share outstanding throughout each period)
| Six months ended
January 31, 2024
(unaudited) | |
| | | | | |
Net asset value, beginning of period | | | | | | |
Net investment income (loss) | | | | | | |
Net realized and unrealized gains (losses) on investments | | | | | | |
Total from investment operations | | | | | | |
Distributions to shareholders from | | | | | | |
| | | | | | |
Net asset value, end of period | | | | | | |
| | | | | | |
Ratios to average net assets (annualized) | | | | | | |
| | | | | | |
| | | | | | |
Net investment income (loss) | | | | | | |
| | | | | | |
| | | | | | |
Net assets, end of period (000s omitted) | | | | | | |
| Calculated based upon average shares outstanding |
| Amount is less than $0.005. |
| Returns for periods of less than one year are not annualized. |
The accompanying notes are an integral part of these financial statements.
20 | Allspring Premier Large Company Growth Fund
Notes to financial statements (unaudited)
Notes to financial statements
Allspring Funds Trust (the “Trust”), a Delaware statutory trust organized on March 10, 1999, is an open-end management investment company registered under the Investment Company Act of 1940, as amended (the “1940 Act”). As an investment company, the Trust follows the accounting and reporting guidance in Financial Accounting Standards Board (“FASB”) Accounting Standards Codification Topic 946, Financial Services – Investment Companies. These financial statements report on the Allspring Premier Large Company Growth Fund (the “Fund”) which is a diversified series of the Trust.
2.
SIGNIFICANT ACCOUNTING POLICIES
The following significant accounting policies, which are consistently followed in the preparation of the financial statements of the Fund, are in conformity with U.S. generally accepted accounting principles which require management to make estimates and assumptions that affect the reported amounts of assets and liabilities, disclosure of contingent assets and liabilities at the date of the financial statements, and the reported amounts of income and expenses during the reporting period. Actual results could differ from those estimates.
Securities valuation
All investments are valued each business day as of the close of regular trading on the New York Stock Exchange (generally 4 p.m. Eastern Time), although the Fund may deviate from this calculation time under unusual or unexpected circumstances.
Equity securities and exchange-traded funds that are listed on a foreign or domestic exchange or market are valued at the official closing price or, if none, the last sales price.
Investments in registered open-end investment companies (other than those listed on a foreign or domestic exchange or market) are valued at net asset value.
Investments which are not valued using the methods discussed above are valued at their fair value, as determined in good faith by Allspring Funds Management, LLC (“Allspring Funds Management”), which was named the valuation designee by the Board of Trustees. As the valuation designee, Allspring Funds Management is responsible for day-to-day valuation activities for the Allspring Funds. In connection with these responsibilities, Allspring Funds Management has established a Valuation Committee and has delegated to it the authority to take any actions regarding the valuation of portfolio securities that the Valuation Committee deems necessary or appropriate, including determining the fair value of portfolio securities. On a quarterly basis, the Board of Trustees receives reports of valuation actions taken by the Valuation Committee. On at least an annual basis, the Board of Trustees receives an assessment of the adequacy and effectiveness of Allspring Funds Management’s process for determining the fair value of the portfolio of investments.
Foreign currency translation
The accounting records of the Fund are maintained in U.S. dollars. The values of other assets and liabilities denominated in foreign currencies are translated into U.S. dollars at rates provided by an independent foreign currency pricing source at a time each business day specified by the Valuation Committee. Purchases and sales of securities, and income and expenses are converted at the rate of exchange on the respective dates of such transactions. Net realized foreign exchange gains or losses arise from sales of foreign currencies, currency gains or losses realized between the trade and settlement dates on securities transactions, and the difference between the amounts of dividends, interest and foreign withholding taxes recorded and the U.S. dollar equivalent of the amounts actually paid or received. Net unrealized foreign exchange gains and losses arise from changes in the fair value of assets and liabilities other than investments in securities resulting from changes in exchange rates. The changes in net assets arising from changes in exchange rates of securities and the changes in net assets resulting from changes in market prices of securities are not separately presented. Such changes are included in net realized and unrealized gains or losses from investments.
Security transactions and income recognition
Securities transactions are recorded on a trade date basis. Realized gains or losses are recorded on the basis of identified cost.
Dividend income is recognized on the ex-dividend date.
Interest earned on cash balances held at the custodian is recorded as interest income.
Income from foreign securities is recorded net of foreign taxes withheld where recovery of such taxes is not assured.
Distributions to shareholders
Distributions to shareholders from net investment income and any net realized gains are recorded on the ex-dividend date and paid at least annually. Such distributions are determined in accordance with income tax regulations and may differ from U.S. generally accepted accounting principles. Dividend sources are estimated at the time of declaration. The tax character of distributions is determined as of the Fund’s fiscal year end. Therefore, a portion of the Fund’s distributions made prior to the Fund’s fiscal year end may be categorized as a tax return of capital at year end.
Allspring Premier Large Company Growth Fund | 21
Notes to financial statements (unaudited)
Federal and other taxes
The Fund intends to continue to qualify as a regulated investment company by distributing substantially all of its investment company taxable income and any net realized capital gains (after reduction for capital loss carryforwards) sufficient to relieve it from all, or substantially all, federal income taxes. Accordingly, no provision for federal income taxes was required.
The Fund’s income and federal excise tax returns and all financial records supporting those returns for the prior three fiscal years are subject to examination by the federal and Delaware revenue authorities. Management has analyzed the Fund’s tax positions taken on federal, state, and foreign tax returns, as applicable, for all open tax years and does not believe that there are any uncertain tax positions that require recognition of a tax liability.
As of January 31, 2024, the aggregate cost of all investments for federal income tax purposes was $649,789,000 and the unrealized gains (losses) consisted of:
As of July 31, 2023, the Fund had a qualified late-year ordinary loss of $5,193,559 which was recognized on the first day of the current fiscal year.
Class allocations
The separate classes of shares offered by the Fund differ principally in applicable sales charges, distribution, shareholder servicing, and administration fees. Class specific expenses are charged directly to that share class. Investment income, common fund-level expenses, and realized and unrealized gains (losses) on investments are allocated daily to each class of shares based on the relative proportion of net assets of each class.
3.
FAIR VALUATION MEASUREMENTS
Fair value measurements of investments are determined within a framework that has established a fair value hierarchy based upon the various data inputs utilized in determining the value of the Fund’s investments. The three-level hierarchy gives the highest priority to unadjusted quoted prices in active markets for identical assets or liabilities (Level 1) and the lowest priority to unobservable inputs (Level 3). The Fund’s investments are classified within the fair value hierarchy based on the lowest level of input that is significant to the fair value measurement. The inputs are summarized into three broad levels as follows:
•Level 1—quoted prices in active markets for identical securities
•Level 2—other significant observable inputs (including quoted prices for similar securities, interest rates, prepayment speeds, credit risk, etc.)
•Level 3—significant unobservable inputs (including the Fund’s own assumptions in determining the fair value of investments)
The inputs or methodologies used for valuing investments in securities are not necessarily an indication of the risk associated with investing in those securities.
The following is a summary of the inputs used in valuing the Fund’s assets and liabilities as of January 31, 2024:
| | Other significant
observable inputs
(Level 2) | Significant
unobservable inputs
(Level 3) | |
| | | | |
| | | | |
| | | | |
| | | | |
| | | | |
| | | | |
| | | | |
| | | | |
| | | | |
| | | | |
| | | | |
| | | | |
| | | | |
| | | | |
Additional sector, industry or geographic detail, if any, is included in the Portfolio of Investments.
At January 31, 2024, the Fund did not have any transfers into/out of Level 3.
22 | Allspring Premier Large Company Growth Fund
Notes to financial statements (unaudited)
4.
TRANSACTIONS WITH AFFILIATES
Management fee
Allspring Funds Management, a wholly owned subsidiary of Allspring Global Investments Holdings, LLC, a holding company indirectly owned by certain private funds of GTCR LLC and Reverence Capital Partners, L.P., is the manager of the Fund and provides advisory and fund-level administrative services under an investment management agreement. Under the investment management agreement, Allspring Funds Management is responsible for, among other services, implementing the investment objectives and strategies of the Fund, supervising the subadviser and providing fund-level administrative services in connection with the Fund’s operations. As compensation for its services under the investment management agreement, Allspring Funds Management is entitled to receive a management fee at the following annual rate based on the Fund’s average daily net assets:
For the six months ended January 31, 2024, the management fee was equivalent to an annual rate of 0.68% of the Fund’s average daily net assets.
Allspring Funds Management has retained the services of a subadviser to provide daily portfolio management to the Fund. The fee for subadvisory services is borne by Allspring Funds Management. Allspring Global Investments, LLC, an affiliate of Allspring Funds Management and a wholly owned subsidiary of Allspring Global Investments Holdings, LLC, is the subadviser to the Fund and is entitled to receive a fee from Allspring Funds Management at an annual rate starting at 0.35% and declining to 0.275% as the average daily net assets of the Fund increase.
Administration fees
Under a class-level administration agreement, Allspring Funds Management provides class-level administrative services to the Fund, which includes paying fees and expenses for services provided by the transfer agent, sub-transfer agents, omnibus account servicers and record-keepers. As compensation for its services under the class-level administration agreement, Allspring Funds Management receives an annual fee which is calculated based on the average daily net assets of each class as follows:
| Class-level
administration fee |
| |
| |
| |
| |
| |
Waivers and/or expense reimbursements
Allspring Funds Management has contractually committed to waive and/or reimburse management and administration fees to the extent necessary to maintain certain net operating expense ratios for the Fund. When each class of the Fund has exceeded its expense cap, Allspring Funds Management will waive fees and/or reimburse expenses from fund-level expenses on a proportionate basis and then from class specific expenses. When only certain classes exceed their expense caps, waivers and/or reimbursements are applied against class specific expenses before fund-level expenses. Allspring Funds Management has contractually committed through November 30, 2024 to waive fees and/or reimburse expenses to the extent necessary to cap the Fund’s expenses. Prior to or after the commitment expiration date, the cap may be increased or the commitment to maintain the cap may be terminated only with the approval of the Board of Trustees. As of January 31, 2024, the contractual expense caps are as follows:
Allspring Premier Large Company Growth Fund | 23
Notes to financial statements (unaudited)
Distribution fee
The Trust has adopted a distribution plan for Class C shares pursuant to Rule 12b-1 under the 1940 Act. A distribution fee is charged to Class C shares and paid to Allspring Funds Distributor, LLC (“Allspring Funds Distributor”), the principal underwriter, an affiliate of Allspring Funds Management, at an annual rate up to 0.75% of the average daily net assets of Class C shares.
In addition, Allspring Funds Distributor is entitled to receive the front-end sales charge from the purchase of Class A shares and a contingent deferred sales charge on the redemption of certain Class A shares. Allspring Funds Distributor is also entitled to receive the contingent deferred sales charges from redemptions of Class C shares. For the six months ended January 31, 2024, Allspring Funds Distributor received $6,270 from the sale of Class A shares. No contingent deferred sales charges were incurred by Class A and Class C shares for the six months ended January 31, 2024.
Shareholder servicing fees
The Trust has entered into contracts with one or more shareholder servicing agents, whereby Class A, Class C and Administrator Class are charged a fee at an annual rate up to 0.25% of the average daily net assets of each respective class. A portion of these total shareholder servicing fees were paid to affiliates of the Fund.
Interfund transactions
The Fund may purchase or sell portfolio investment securities to certain affiliates pursuant to Rule 17a-7 under the 1940 Act and under procedures adopted by the Board of Trustees. The procedures have been designed to ensure that these interfund transactions, which do not incur broker commissions, are effected at current market prices. Pursuant to these procedures, the Fund did not have any interfund transactions during the six months ended January 31, 2024.
5.
INVESTMENT PORTFOLIO TRANSACTIONS
Purchases and sales of investments, excluding U.S. government obligations (if any) and short-term securities, for the six months ended January 31, 2024 were $335,043,736 and $1,275,813,754, respectively.
The Trust (excluding the money market funds), Allspring Master Trust and Allspring Variable Trust are parties to a $350,000,000 revolving credit agreement whereby the Fund is permitted to use bank borrowings for temporary or emergency purposes, such as to fund shareholder redemption requests. Interest under the credit agreement is charged to the Fund based on borrowing rate equal to the higher of the Federal Funds rate or the overnight bank funding rate in effect on that day plus a spread. In addition, an annual commitment fee based on the unused balance is allocated to each participating fund.
For the six months ended January 31, 2024, there were no borrowings by the Fund under the agreement.
As of the end of the period, the Fund concentrated its portfolio of investments in the information technology sector. A fund that invests a substantial portion of its assets in any sector may be more affected by changes in that sector than would be a fund whose investments are not heavily weighted in any sector.
Under the Fund’s organizational documents, the officers and Trustees have been granted certain indemnification rights against certain liabilities that may arise out of performance of their duties to the Fund. The Fund has entered into a separate agreement with each Trustee that converts indemnification rights currently existing under the Fund’s organizational documents into contractual rights that cannot be changed in the future without the consent of the Trustee. Additionally, in the normal course of business, the Fund may enter into contracts with service providers that contain a variety of indemnification clauses. The Fund’s maximum exposure under these arrangements is dependent on future claims that may be made against the Fund and, therefore, cannot be estimated.
24 | Allspring Premier Large Company Growth Fund
Other information (unaudited)
Other information
Proxy voting information
A description of the policies and procedures used to determine how to vote proxies relating to portfolio securities is available without charge, upon request, by calling 1-866-259-3305, visiting our website at allspringglobal.com, or visiting the SEC website at sec.gov. Information regarding how the proxies related to portfolio securities were voted during the most recent 12-month period ended June 30 is available on the website at allspringglobal.com or by visiting the SEC website at sec.gov.
Quarterly portfolio holdings information
The Fund files its complete schedule of portfolio holdings with the SEC for the first and third quarters of each fiscal year as an exhibit to its reports on Form N-PORT. Shareholders may view the filed Form N-PORT by visiting the SEC website at sec.gov.
Allspring Premier Large Company Growth Fund | 25
Other information (unaudited)
Board of trustees and officers
Each of the Trustees and Officers listed in the table below acts in identical capacities for each fund in the Allspring family of funds, which consists of 116 mutual funds comprising the Allspring Funds Trust, Allspring Variable Trust, Allspring Master Trust and four closed-end funds (collectively the “Fund Complex”). This table should be read in conjunction with the Prospectus and the Statement of Additional Information†. The mailing address of each Trustee and Officer is 1415 Vantage Park Drive, 3rd Floor, Charlotte, NC 28203. Each Trustee and Officer serves an indefinite term, however, each Trustee serves such term until reaching the mandatory retirement age established by the Trustees.
Independent Trustees
| | Principal occupations during past five years or longer | Current other
public company or
investment
company
directorships |
William R. Ebsworth
(Born 1957) | | Retired. From 1984 to 2013, equities analyst, portfolio manager, research director and chief investment officer at Fidelity Management and Research Company in Boston, Tokyo, and Hong Kong, and retired in 2013 as Chief Investment Officer of Fidelity Strategic Advisers, Inc. where he led a team of investment professionals managing client assets. Prior thereto, Board member of Hong Kong Securities Clearing Co., Hong Kong Options Clearing Corp., the Thailand International Fund, Ltd., Fidelity Investments Life Insurance Company, and Empire Fidelity Investments Life Insurance Company. Serves on the Investment Company Institute’s Board of Governors since 2022 and Executive Committee since 2023 as well as the Vice Chairman of the Governing Council of the Independent Directors Council since 2023. Audit Committee Chair and Investment Committee Chair of the Vincent Memorial Hospital Foundation (non-profit organization). Mr. Ebsworth is a CFA charterholder. | |
Jane A. Freeman
(Born 1953) | Trustee,
since 2015;
Chair Liaison,
| Retired. From 2012 to 2014 and 1999 to 2008, Chief Financial Officer of Scientific Learning Corporation. From 2008 to 2012, Ms. Freeman provided consulting services related to strategic business projects. Prior to 1999, Portfolio Manager at Rockefeller & Co. and Scudder, Stevens & Clark. Board member of the Harding Loevner Funds from 1996 to 2014, serving as both Lead Independent Director and chair of the Audit Committee. Board member of the Russell Exchange Traded Funds Trust from 2011 to 2012 and the chair of the Audit Committee. Ms. Freeman is also an inactive Chartered Financial Analyst. | |
Isaiah Harris, Jr.
(Born 1952) | Trustee,
since 2009;
Audit Committee Chair,
since 2019 | Retired. Member of the Advisory Board of CEF of East Central Florida. Chairman of the Board of CIGNA Corporation from 2009 to 2021, and Director from 2005 to 2008. From 2003 to 2011, Director of Deluxe Corporation. Prior thereto, President and CEO of BellSouth Advertising and Publishing Corp. from 2005 to 2007, President and CEO of BellSouth Enterprises from 2004 to 2005 and President of BellSouth Consumer Services from 2000 to 2003. Emeritus member of the Iowa State University Foundation Board of Governors. Emeritus Member of the Advisory board of Iowa State University School of Business. Advisory Board Member, Palm Harbor Academy (private school). Advisory Board Member, Fellowship of Christian Athletes. Mr. Harris is a certified public accountant (inactive status). | |
David F. Larcker
(Born 1950) | | Distinguished Visiting Fellow at the Hoover Institution since 2022. James Irvin Miller Professor of Accounting at the Graduate School of Business (Emeritus), Stanford University, Director of the Corporate Governance Research Initiative and Senior Faculty of The Rock Center for Corporate Governance since 2006. From 2005 to 2008, Professor of Accounting at the Graduate School of Business, Stanford University. Prior thereto, Ernst & Young Professor of Accounting at The Wharton School, University of Pennsylvania from 1985 to 2005. | |
Olivia S. Mitchell
(Born 1953) | | International Foundation of Employee Benefit Plans Professor since 1993, Wharton School of the University of Pennsylvania. Director of Wharton’s Pension Research Council and Boettner Center on Pensions & Retirement Research, and Research Associate at the National Bureau of Economic Research. Previously taught at Cornell University from 1978 to 1993. | |
Timothy J. Penny
(Born 1951) | Trustee,
since 1996;
Chair,
since 2018 | President and Chief Executive Officer of Southern Minnesota Initiative Foundation, a non-profit organization, since 2007. Vice Chair of the Economic Club of Minnesota, since 2007. Co-Chair of the Committee for a Responsible Federal Budget, since 1995. Member of the Board of Trustees of NorthStar Education Finance, Inc., a non-profit organization, from 2007-2022. Senior Fellow of the University of Minnesota Humphrey Institute from 1995 to 2017. | |
* Length of service dates reflect the Trustee’s commencement of service with the Trust’s predecessor entities, where applicable.
# Ms. Freeman will serve as Chair Liaison through June 2024, at which time Ms. Wheelock will assume the role.
†
The Statement of Additional Information includes additional information about the Trustees and is available, without charge, upon request, by calling 1-800-222-8222 or by visiting the website at allspringglobal.com.
26 | Allspring Premier Large Company Growth Fund
Other information (unaudited)
| Position held and length of service* | Principal occupations during past five years or longer | Current other public company or investment company directorships |
James G. Polisson
(Born 1959) | Trustee,
since 2018; Nominating and Governance Committee Chair, since 2024 | Retired. Chief Marketing Officer, Source (ETF) UK Services, Ltd, from 2015 to 2017. From 2012 to 2015, Principal of The Polisson Group, LLC, a management consulting, corporate advisory and principal investing company. Chief Executive Officer and Managing Director at Russell Investments, Global Exchange Traded Funds from 2010 to 2012. Managing Director of Barclays Global Investors from 1998 to 2010 and Global Chief Marketing Officer for iShares and Barclays Global Investors from 2000 to 2010. Trustee of the San Francisco Mechanics’ Institute, a non- profit organization, from 2013 to 2015. Board member of the Russell Exchange Traded Fund Trust from 2011 to 2012. Director of Barclays Global Investors Holdings Deutschland GmbH from 2006 to 2009. Mr. Polisson is an attorney and has a retired status with the Massachusetts and District of Columbia Bar Associations. | |
Pamela Wheelock
(Born 1959) | Trustee,
since January 2020;
previously Trustee from
January 2018 to
| Retired. Executive and Senior Financial leadership positions in the public, private and nonprofit sectors. Interim President and CEO, McKnight Foundation, 2020. Interim Commissioner, Minnesota Department of Human Services, 2019. Chief Operating Officer, Twin Cities Habitat for Humanity, 2017-2019. Vice President for University Services, University of Minnesota, 2012- 2016. Interim President and CEO, Blue Cross and Blue Shield of Minnesota, 2011-2012. Executive Vice-President and Chief Financial Officer, Minnesota Wild, 2002-2008. Commissioner, Minnesota Department of Finance, 1999-2002. Chair of the Board of Directors of Destination Medical Center Corporation. Board member of the Minnesota Wild Foundation. | |
* Length of service dates reflect the Trustee’s commencement of service with the Trust’s predecessor entities, where applicable.
# Ms. Freeman will serve as Chair Liaison through June 2024, at which time Ms. Wheelock will assume the role.
Allspring Premier Large Company Growth Fund | 27
Other information (unaudited)
Officers1
| Position held and
length of service | Principal occupations during past five years or longer |
| | President and Chief Executive Officer of Allspring Funds Management, LLC since 2017 and Head of Global Fund Governance of Allspring Global Investments since 2022. Prior thereto, co-president of Galliard Capital Management, LLC, an affiliate of Allspring Funds Management, LLC, from 2019 to 2022 and Head of Affiliated Managers, Allspring Global Investments, from 2014 to 2019 and Executive Vice President responsible for marketing, investments and product development for Allspring Funds Management, LLC, from 2009 to 2014. |
Jeremy DePalma
(Born 1974) | Treasurer,
since 2012
(for certain funds in
the Fund Complex);
since 2021 (for
the remaining funds in the Complex) | Senior Vice President of Allspring Funds Management, LLC since 2009. Senior Vice President of Evergreen Investment Management Company, LLC from 2008 to 2010 and head of the Fund Reporting and Control Team within Fund Administration from 2005 to 2010. |
Christopher Baker
(Born 1976) | Chief Compliance Officer,
since 2022 | Global Chief Compliance Officer for Allspring Global Investments since 2022. Prior thereto, Chief Compliance Officer for State Street Global Advisors from 2018 to 2021. Senior Compliance Officer for the State Street divisions of Alternative Investment Solutions, Sector Solutions, and Global Marketing from 2015 to 2018. From 2010 to 2015 Vice President, Global Head of Investment and Marketing Compliance for State Street Global Advisors. |
Matthew Prasse
(Born 1983) | Chief Legal Officer,
since 2022;
Secretary,
since 2021 | Senior Counsel of the Allspring Legal Department since 2021. Senior Counsel of the Wells Fargo Legal Department from 2018 to 2021. Previously, Counsel for Barings LLC from 2015 to 2018. Prior to joining Barings, Associate at Morgan, Lewis & Bockius LLP from 2008 to 2015. |
1 For those Officers with tenures at Allspring Global Investments and/or Allspring Funds Management, LLC that began prior to 2021, such tenures include years of service during which these businesses/entities were known as Wells Fargo Asset Management and Wells Fargo Funds Management, LLC, respectively.
28 | Allspring Premier Large Company Growth Fund
For more information
More information about Allspring Funds is available free upon request. To obtain literature, please write, visit the Fund’s website, or call:
Allspring Funds
P.O. Box 219967
Kansas City, MO 64121-9967
Website: allspringglobal.com
Individual investors: 1-800-222-8222
Retail investment professionals: 1-888-877-9275
Institutional investment professionals: 1-800-260-5969
This report and the financial statements contained herein are submitted for the general information of the shareholders of the Fund. If this report is used for promotional purposes, distribution of the report must be accompanied or preceded by a current prospectus. Before investing, please consider the investment objectives, risks, charges, and expenses of the investment. For a current prospectus and, if available, a summary prospectus, containing this information, call 1-800-222-8222 or visit the Fund’s website at allspringglobal.com. Read the prospectus carefully before you invest or send money.
Allspring Global InvestmentsTM is the trade name for the asset management firms of Allspring Global Investments Holdings, LLC, a holding company indirectly owned by certain private funds of GTCR LLC and Reverence Capital Partners, L.P. These firms include but are not limited to Allspring Global Investments, LLC, and Allspring Funds Management, LLC. Certain products managed by Allspring entities are distributed by Allspring Funds Distributor, LLC (a broker-dealer and Member FINRA/SIPC).
This material is for general informational and educational purposes only and is NOT intended to provide investment advice or a recommendation of any kind - including a recommendation for any specific investment, strategy, or plan.
© 2024 Allspring Global Investments Holdings, LLC. All rights reserved.
ALL-02052024-nmv7zfjt 03-24
SAR4325 01-24
Allspring Special Large Cap Value Fund
Semi-Annual Report
January 31, 2024
The views expressed and any forward-looking statements are as of January 31, 2024, unless otherwise noted, and are those of the Fund’s portfolio managers and/or Allspring Global Investments. Discussions of individual securities or the markets generally are not intended as individual recommendations. Future events or results may vary significantly from those expressed in any forward-looking statements. The views expressed are subject to change at any time in response to changing circumstances in the market. Allspring Global Investments disclaims any obligation to publicly update or revise any views expressed or forward-looking statements.
Allspring Special Large Cap Value Fund | 1
Letter to shareholders (unaudited)
Andrew Owen
President
Allspring Funds
Dear Shareholder:
We are pleased to offer you this semi-annual report for the Allspring Special Large Cap Value Fund for the six-month period that ended January 31, 2024. Globally, stocks and bonds experienced high levels of volatility throughout the period. The market was focused on persistently high inflation and the impact of ongoing aggressive central bank rate hikes. Riskier assets rallied as investors anticipated an end to the tight monetary policy despite concerns of a possible recession.
For the period, U.S. stocks, based on the S&P 500 Index,1 returned 6.43%. International stocks, as measured by the MSCI ACWI ex USA Index (Net),2 gained 0.48% while the MSCI EM Index (Net) (USD),3 returned -6.00%. Among bond indexes, the Bloomberg U.S. Aggregate Bond Index4 returned 3.15%, the Bloomberg Global Aggregate ex-USD Index (unhedged)5 gained 1.15%, the Bloomberg Municipal Bond Index6 returned 2.70%, and the ICE BofA U.S. High Yield Index7 gained 6.17%.
Still focused on high inflation and elevated central bank rates, markets were volatile.
The six-month period began with stocks retreating in August after a July rally while monthly bond returns were flat overall. Increased global market volatility reflected unease over the Chinese property market being stressed along with weak Chinese economic data. However, speculation grew over a possible end to the Federal Reserve’s (Fed’s) campaign of interest rate increases or at least a pause in September. U.S. economic data generally remained solid, with resilient job market data and inflation ticking up slightly in August as the annual Consumer Price Index (CPI)8 rose 3.7%. However, the three-month trend for Core CPI9 stood at an annualized 2.4%.
Stocks and bonds both had negative overall returns in September as investors were disappointed by the Fed’s determination not to lower interest rates until it knows it has vanquished persistently high inflation. As of September, the two primary gauges of U.S. inflation—the annual Core Personal Consumption Expenditures Price Index10 and the CPI—both stood at roughly 4%, twice as high as the Fed’s oft-stated 2% target. The month ended with the prospect of yet another U.S. government shutdown, averted at least temporarily but looming later in the year.
1
The S&P 500 Index consists of 500 stocks chosen for market size, liquidity, and industry group representation. It is a market-value-weighted index with each stock’s weight in the index proportionate to its market value. You cannot invest directly in an index.
2
The Morgan Stanley Capital International (MSCI) All Country World Index (ACWI) ex USA Index (Net) is a free-float-adjusted market-capitalization-weighted index that is designed to measure the equity market performance of developed and emerging markets, excluding the U.S. Source: MSCI. MSCI makes no express or implied warranties or representations and shall have no liability whatsoever with respect to any MSCI data contained herein. The MSCI data may not be further redistributed or used as a basis for other indexes or any securities or financial products. This report is not approved, reviewed, or produced by MSCI. You cannot invest directly in an index.
3
The MSCI Emerging Markets (EM) Index (Net) (USD) is a free-float-adjusted market-capitalization-weighted index that is designed to measure the equity market performance of emerging markets. You cannot invest directly in an index.
4
The Bloomberg U.S. Aggregate Bond Index is a broad-based benchmark that measures the investment-grade, U.S.-dollar-denominated, fixed-rate taxable bond market, including Treasuries, government-related and corporate securities, mortgage-backed securities (agency fixed-rate and hybrid adjustable-rate mortgage pass-throughs), asset-backed securities, and commercial mortgage-backed securities. You cannot invest directly in an index.
5
The Bloomberg Global Aggregate ex-USD Index (unhedged) is an unmanaged index that provides a broad-based measure of the global investment-grade fixed-income markets excluding the U.S.-dollar-denominated debt market. You cannot invest directly in an index.
6
The Bloomberg Municipal Bond Index is an unmanaged index composed of long-term tax-exempt bonds with a minimum credit rating of Baa. You cannot invest directly in an index.
7
The ICE BofA U.S. High Yield Index is a market-capitalization-weighted index of domestic and Yankee high yield bonds. The index tracks the performance of high yield securities traded in the U.S. bond market. You cannot invest directly in an index. Copyright 2024. ICE Data Indices, LLC. All rights reserved.
8
The Consumer Price Index (CPI) is a measure of the average change over time in the prices paid by urban consumers for a market basket of consumer goods and services. You cannot invest directly in an index.
9
The Core CPI is a measure of the average change over time in the prices paid by urban consumers for a market basket of consumer goods and services excluding energy and food prices. You cannot invest directly in an index.
10
The Core Personal Consumption Expenditures Price Index (PCE) is a measure of prices that people living in the United States, or those buying on their behalf, pay for goods and services. It is sometimes called the core PCE price index, because two categories that can have price swings – food and energy – are left out to make underlying inflation easier to see. You cannot invest directly in an index.
2 | Allspring Special Large Cap Value Fund
Letter to shareholders (unaudited)
October was a tough month for financial markets overall. Key global and domestic indexes all were pushed down by rising geopolitical tensions—particularly the Israel-Hamas conflict—and concerns over the Fed’s “higher for longer” monetary policy. The U.S. 10-year Treasury yield rose above 5% for the first time since 2007. Commodity prices did well as oil prices rallied in response to the prospect of oil supply disruptions from the Middle East. U.S. annualized third quarter GDP was estimated at a healthier-than-anticipated 4.9%. China’s GDP indicated surprisingly strong industrial production and retail sales, offset by ongoing weakness in its real estate sector.
In November, the market mood turned positive as cooling inflation inspired confidence that central banks could hold off on further rate hikes. Overall annual inflation in the U.S. fell to 3.1% in November while 12-month inflation in the U.K. and eurozone eased to 4.6% and 2.4%, respectively—far below their peak levels of mid-2022. Third quarter annualized U.S. GDP growth was raised to an estimated 5.2% while U.S. job totals rose by just below 200,000 in November, indicating a slight cooling of the labor market. All of this fresh evidence added to confidence for a U.S. soft economic landing, leading to a more buoyant mood heading into winter as the Federal Open Market Committee held rates steady at its December meeting.
The broad year-end rally among stocks and bonds that began in November continued through December as investors became more confident that monetary policy would ease in 2024. Supporting the bubbly market mood were a series of reports confirming lower inflationary trends in the U.S. and Europe. During the period, it appeared more likely that the U.S. economy could achieve a soft landing, cooling enough to lower inflation without the pain of a recession. However, by year-end, an expectations gap developed. Capital markets priced in a total of 1.50 percentage points in federal funds rate cuts in 2024, twice as much as the three cuts of 0.25% hinted at by Fed officials.
Financial market performance was mixed in January 2024 as U.S. stocks had modest gains while non-U.S. equities, particularly those in emerging markets, and fixed income assets were held back by central bank pushback on market optimism over rate cuts. Overall, optimism was supported by indications of a soft landing for the U.S. economy. Key data included a surprisingly strong gain of 353,000 jobs in January, an unemployment rate of just 3.7%, and a rise of just 3.1% in the CPI in January. However, that resilience helped push back expectations of a rate cut in March to a more likely second quarter initial move.
Don’t let short-term uncertainty derail long-term investment goals.
Periods of investment uncertainty can present challenges, but experience has taught us that maintaining long-term investment goals can be an effective way to plan for the future. To help you create a sound strategy based on your personal goals and risk tolerance, Allspring Funds offers more than 100 mutual funds spanning a wide range of asset classes and investment styles. Although diversification cannot guarantee an investment profit or prevent losses, we believe it can be an effective way to manage investment risk and potentially smooth out overall portfolio performance. We encourage investors to know their investments and to understand that appropriate levels of risk-taking may unlock opportunities.
Thank you for choosing to invest with Allspring Funds. We appreciate your confidence in us and remain committed to helping you meet your financial needs.
Sincerely,
Andrew Owen
President
Allspring Funds
“ In November, the market mood turned positive as cooling inflation inspired confidence that central banks could hold off on further rate hikes. ”
For further information about your fund, contact your investment professional, visit our website at allspringglobal.com, or call us directly at 1-800-222-8222.
Allspring Special Large Cap Value Fund | 3
Letter to shareholders (unaudited)
|
Beginning in July 2024, the Fund will be required by the Securities and Exchange Commission to send shareholders a paper copy of a new tailored shareholder report in place of the full shareholder report that you are now receiving. The tailored shareholder report will contain concise information about the Fund, including certain expense and performance information and fund statistics. If you wish to receive this new tailored shareholder report electronically, please follow the instructions on the back cover of this report. |
Other information that is currently included in the shareholder report, such as the Fund’s financial statements, will be available online and upon request, free of charge, in paper or electronic format. |
4 | Allspring Special Large Cap Value Fund
This page is intentionally left blank.
Performance highlights (unaudited)
Performance highlights
| The Fund seeks long-term capital appreciation. |
| Allspring Funds Management, LLC |
| Allspring Global Investments, LLC |
| James M. Tringas, CFA, Bryant VanCronkhite, CFA, CPA, Shane Zweck, CFA |
Average annual total returns (%) as of January 31, 2024 |
| | | | |
| | | | | | | | | |
| | | | | | | | | |
| | | | | | | | | |
| | | | | | | | | |
Administrator Class (EIVDX) | | | | | | | | | |
Institutional Class (EIVIX) | | | | | | | | | |
| | | | | | | | | |
Russell 1000® Value Index4 | | | | | | | | | |
Figures quoted represent past performance, which is no guarantee of future results, and do not reflect taxes that a shareholder may pay on an investment in a fund. Investment return and principal value of an investment will fluctuate so that an investor’s shares, when redeemed, may be worth more or less than their original cost. Performance shown without sales charges would be lower if sales charges were reflected. Current performance may be lower or higher than the performance data quoted, which assumes the reinvestment of dividends and capital gains. Current month-end performance is available on the Fund’s website, allspringglobal.com.
Index returns do not include transaction costs associated with buying and selling securities, any mutual fund fees or expenses, or any taxes. It is not possible to invest directly in an index.
For Class A shares, the maximum front-end sales charge is 5.75%. For Class C shares, the maximum contingent deferred sales charge is 1.00%. Performance including a contingent deferred sales charge assumes the sales charge for the corresponding time period. Class R6, Administrator Class and Institutional Class shares are sold without a front-end sales charge or contingent deferred sales charge.
|
| Reflects the expense ratios as stated in the most recent prospectuses. The expense ratios shown are subject to change and may differ from the annualized expense ratios shown in the Financial Highlights of this report. |
| The manager has contractually committed through November 30, 2024, to waive fees and/or reimburse expenses to the extent necessary to cap total annual fund operating expenses after fee waivers at 1.01% for Class A, 1.76% for Class C, 0.59% for Class R6, 0.94% for Administrator Class and 0.69% for Institutional Class. Brokerage commissions, stamp duty fees, interest, taxes, acquired fund fees and expenses (if any), and extraordinary expenses are excluded from the expense caps. Prior to or after the commitment expiration date, the caps may be increased or the commitment to maintain the caps may be terminated only with the approval of the Board of Trustees. Without these caps, the Fund’s returns would have been lower. The expense ratio paid by an investor is the net expense ratio (the total annual fund operating expenses after fee waivers) as stated in the prospectuses. |
| The Russell 3000® Index measures the performance of the 3,000 largest U.S. companies based on total market capitalization, which represents approximately 98% of the investable U.S. equity market. You cannot invest directly in an index. |
| The Russell 1000® Value Index measures the performance of those Russell 1000 companies with lower price/book ratios and lower forecasted growth values. You cannot invest directly in an index. |
Stock values fluctuate in response to the activities of individual companies and general market and economic conditions. Certain investment strategies tend to increase the total risk of an investment (relative to the broader market). This fund is exposed to foreign investment risk and focused portfolio risk. Consult the Fund’s prospectus for additional information on these and other risks.
CFA® and Chartered Financial Analyst® are trademarks owned by CFA Institute. |
6 | Allspring Special Large Cap Value Fund
Performance highlights (unaudited)
Ten largest holdings (%) as of January 31, 20241 |
| |
Berkshire Hathaway, Inc. Class B | |
| |
| |
Intercontinental Exchange, Inc. | |
| |
| |
| |
| |
| |
| Figures represent the percentage of the Fund’s net assets. Holdings are subject to change and may have changed since the date specified. |
Sector allocation as of January 31, 20241 |
| Figures represent the percentage of the Fund’s long-term investments. Allocations are subject to change and may have changed since the date specified. |
Allspring Special Large Cap Value Fund | 7
Fund expenses (unaudited)
Fund expenses
As a shareholder of the Fund, you incur two types of costs: (1) transaction costs, including sales charges (loads) on purchase payments and contingent deferred sales charges (if any) on redemptions and (2) ongoing costs, including management fees, distribution (12b-1) and/or shareholder servicing fees, and other Fund expenses. This example is intended to help you understand your ongoing costs (in dollars) of investing in the Fund and to compare these costs with the ongoing costs of investing in other mutual funds.
The example is based on an investment of $1,000 invested at the beginning of the six-month period and held for the entire period from August 1, 2023 to January 31, 2024.
Actual expenses
The “Actual” line of the table below provides information about actual account values and actual expenses. You may use the information in this line, together with the amount you invested, to estimate the expenses that you paid over the period. Simply divide your account value by $1,000 (for example, an $8,600 account value divided by $1,000= 8.6), then multiply the result by the number in the “Actual” line under the heading entitled “Expenses paid during period” for your applicable class of shares to estimate the expenses you paid on your account during this period.
Hypothetical example for comparison purposes
The “Hypothetical” line of the table below provides information about hypothetical account values and hypothetical expenses based on the Fund’s actual expense ratio and an assumed rate of return of 5% per year before expenses, which is not the Fund’s actual return. The hypothetical account values and expenses may not be used to estimate the actual ending account balance or expenses you paid for the period. You may use this information to compare the ongoing costs of investing in the Fund and other funds. To do so, compare this 5% hypothetical example with the 5% hypothetical examples that appear in the shareholder reports of the other funds.
Please note that the expenses shown in the table are meant to highlight your ongoing costs only and do not reflect any transactional costs, such as sales charges (loads) and contingent deferred sales charges. Therefore, the “Hypothetical” line of the table is useful in comparing ongoing costs only, and will not help you determine the relative total costs of owning different funds. In addition, if these transactional costs were included, your costs would have been higher.
| Beginning
account value
8-1-2023 | Ending
account value
1-31-2024 | | Annualized net
expense ratio |
| | | | |
| | | | |
Hypothetical (5% return before expenses) | | | | |
| | | | |
| | | | |
Hypothetical (5% return before expenses) | | | | |
| | | | |
| | | | |
Hypothetical (5% return before expenses) | | | | |
| | | | |
| | | | |
Hypothetical (5% return before expenses) | | | | |
| | | | |
| | | | |
Hypothetical (5% return before expenses) | | | | |
| Expenses paid is equal to the annualized net expense ratio of each class multiplied by the average account value over the period, multiplied by 184 divided by 366 (to reflect the one-half-year period). |
8 | Allspring Special Large Cap Value Fund
Portfolio of investments—January 31, 2024 (unaudited)
| | | | | |
| | | | | | |
Communication services: 4.81% | | | | | | |
Interactive media & services: 3.34% | | | | | | |
| | | | | | |
| | | | | | |
| | | | | | |
Consumer discretionary: 3.82% | | | | | | |
| | | | | | |
| | | | | | |
Household durables: 1.02% | | | | | | |
| | | | | | |
| | | | | | |
| | | | | | |
| | | | | | |
Consumer staples distribution & retail : 2.94% | | | | | | |
| | | | | | |
Personal care products: 3.77% | | | | | | |
| | | | | | |
| | | | | | |
| | | | | | |
| | | | | | |
Oil, gas & consumable fuels: 7.10% | | | | | | |
| | | | | | |
| | | | | | |
| | | | | | |
| | | | | | |
| | | | | | |
| | | | | | |
| | | | | | |
| | | | | | |
| | | | | | |
| | | | | | |
| | | | | | |
Intercontinental Exchange, Inc. | | | | | | |
Financial services: 7.75% | | | | | | |
Berkshire Hathaway, Inc. Class B† | | | | | | |
| | | | | | |
| | | | | | |
| | | | | | |
The accompanying notes are an integral part of these financial statements.
Allspring Special Large Cap Value Fund | 9
Portfolio of investments—January 31, 2024 (unaudited)
| | | | | |
| | | | | | |
| | | | | | |
American International Group, Inc. | | | | | | |
| | | | | | |
| | | | | | |
| | | | | | |
Vertex Pharmaceuticals, Inc.† | | | | | | |
Health care equipment & supplies: 3.47% | | | | | | |
Globus Medical, Inc. Class A† | | | | | | |
| | | | | | |
| | | | | | |
Health care providers & services: 5.99% | | | | | | |
| | | | | | |
| | | | | | |
Laboratory Corp. of America Holdings | | | | | | |
| | | | | | |
| | | | | | |
| | | | | | |
| | | | | | |
Aerospace & defense: 3.57% | | | | | | |
L3Harris Technologies, Inc. | | | | | | |
| | | | | | |
| | | | | | |
Commercial services & supplies: 2.47% | | | | | | |
| | | | | | |
Ground transportation: 2.66% | | | | | | |
Canadian Pacific Kansas City Ltd. | | | | | | |
Industrial conglomerates: 1.46% | | | | | | |
Honeywell International, Inc. | | | | | | |
| | | | | | |
| | | | | | |
Trading companies & distributors: 4.48% | | | | | | |
| | | | | | |
| | | | | | |
| | | | | | |
Information technology: 8.10% | | | | | | |
| | | | | | |
| | | | | | |
Semiconductors & semiconductor equipment: 2.28% | | | | | | |
| | | | | | |
The accompanying notes are an integral part of these financial statements.
10 | Allspring Special Large Cap Value Fund
Portfolio of investments—January 31, 2024 (unaudited)
| | | | | |
| | | | | | |
Cadence Design Systems, Inc.† | | | | | | |
| | | | | | |
| | | | | | |
| | | | | | |
| | | | | | |
| | | | | | |
Construction materials: 1.48% | | | | | | |
| | | | | | |
| | | | | | |
| | | | | | |
| | | | | | |
Real estate management & development: 2.86% | | | | | | |
CBRE Group, Inc. Class A† | | | | | | |
Specialized REITs : 1.53% | | | | | | |
| | | | | | |
| | | | | | |
Electric utilities: 3.31% | | | | | | |
| | | | | | |
Total common stocks (Cost $905,605,324) | | | | | | |
| | | | | |
Short-term investments: 2.00% | | | | | | |
Investment companies: 2.00% | | | | | | |
Allspring Government Money Market Fund Select Class♠∞ | | | | | | |
Total short-term investments (Cost $23,666,235) | | | | | | |
Total investments in securities (Cost $929,271,559) | | | | | | |
Other assets and liabilities, net | | | | | | |
| | | | | | |
| Non-income-earning security |
| The issuer of the security is an affiliated person of the Fund as defined in the Investment Company Act of 1940. |
| The rate represents the 7-day annualized yield at period end. |
|
| American depositary receipt |
| Real estate investment trust |
The accompanying notes are an integral part of these financial statements.
Allspring Special Large Cap Value Fund | 11
Portfolio of investments—January 31, 2024 (unaudited)
Investments in affiliates
An affiliated investment is an investment in which the Fund owns at least 5% of the outstanding voting shares of the issuer or as a result of other relationships, such as the Fund and the issuer having the same investment manager. Transactions with issuers that were affiliates of the Fund at the end of the period were as follows:
| | | | | Net
change in
unrealized
gains
(losses) | | | Income
from
affiliated
securities |
| | | | | | | | |
Allspring Government Money Market Fund Select Class | | | | | | | | |
The accompanying notes are an integral part of these financial statements.
12 | Allspring Special Large Cap Value Fund
Statement of assets and liabilities—January 31, 2024 (unaudited)
Financial statements
Statement of assets and liabilities
| |
Investments in unaffiliated securities, at value (cost $905,605,324) | |
Investments in affiliated securities, at value (cost $23,666,235) | |
| |
Receivable for investments sold | |
Receivable for Fund shares sold | |
| |
Prepaid expenses and other assets | |
| |
| |
Payable for investments purchased | |
Payable for Fund shares redeemed | |
| |
Administration fees payable | |
Trustees’ fees and expenses payable | |
Distribution fees payable | |
Accrued expenses and other liabilities | |
| |
| |
| |
| |
Total distributable earnings | |
| |
Computation of net asset value and offering price per share | |
| |
Shares outstanding–Class A1 | |
Net asset value per share–Class A | |
Maximum offering price per share – Class A2 | |
| |
Shares outstanding–Class C1 | |
Net asset value per share–Class C | |
| |
Shares outstanding–Class R61 | |
Net asset value per share–Class R6 | |
Net assets–Administrator Class | |
Shares outstanding–Administrator Class1 | |
Net asset value per share–Administrator Class | |
Net assets–Institutional Class | |
Shares outstanding–Institutional Class1 | |
Net asset value per share–Institutional Class | |
1 The Fund has an unlimited number of authorized shares.
2 Maximum offering price is computed as 100/94.25 of net asset value. On investments of $50,000 or more, the offering price is reduced.
The accompanying notes are an integral part of these financial statements.
Allspring Special Large Cap Value Fund | 13
Statement of operations—six months ended January 31, 2024 (unaudited)
Statement of operations
| |
Dividends (net of foreign withholdings taxes of $38,285) | |
Income from affiliated securities | |
| |
| |
| |
| |
| |
| |
| |
| |
| |
| |
Shareholder servicing fees | |
| |
| |
| |
| |
| |
Custody and accounting fees | |
| |
| |
Shareholder report expenses | |
Trustees’ fees and expenses | |
| |
| |
Less: Fee waivers and/or expense reimbursements | |
| |
| |
| |
| |
| |
| |
Realized and unrealized gains (losses) on investments | |
Net realized gains (losses) on | |
| |
Foreign currency and foreign currency translations | |
Net realized gains on investments | |
Net change in unrealized gains (losses) on investments | |
Net realized and unrealized gains (losses) on investments | |
Net increase in net assets resulting from operations | |
The accompanying notes are an integral part of these financial statements.
14 | Allspring Special Large Cap Value Fund
Statement of changes in net assets
Statement of changes in net assets
|
Six months ended
January 31, 2024 (unaudited) | |
| | | | |
| | | | |
Net realized gains on investments | | | | |
Net change in unrealized gains (losses) on investments | | | | |
Net increase in net assets resulting from operations | | | | |
Distributions to shareholders from | | | | |
Net investment income and net realized gains | | | | |
| | | | |
| | | | |
| | | | |
| | | | |
| | | | |
| | | | |
Total distributions to shareholders | | | | |
Capital share transactions | | | | |
Proceeds from shares sold | | | | |
| | | | |
| | | | |
| | | | |
| | | | |
| | | | |
| | | | |
| | | | |
Reinvestment of distributions | | | | |
| | | | |
| | | | |
| | | | |
| | | | |
| | | | |
| | | | |
| | | | |
1 For the period from August 1, 2022 to June 16, 2023. Effective at the close of business on June 16, 2023, Class R shares were converted to Class A shares and are no longer offered by the Fund.
The accompanying notes are an integral part of these financial statements.
Allspring Special Large Cap Value Fund | 15
Statement of changes in net assets
| Six months ended January 31, 2024 (unaudited) | |
| | | | |
Payment for shares redeemed | | | | |
| | | | |
| | | | |
| | | | |
| | | | |
| | | | |
| | | | |
| | | | |
Net increase in net assets resulting from capital share transactions | | | | |
Total increase in net assets | | | | |
| | | | |
| | | | |
| | | | |
1 For the period from August 1, 2022 to June 16, 2023. Effective at the close of business on June 16, 2023, Class R shares were converted to Class A shares and are no longer offered by the Fund.
The accompanying notes are an integral part of these financial statements.
16 | Allspring Special Large Cap Value Fund
Financial highlights
(For a share outstanding throughout each period)
| Six months ended
January 31, 2024
(unaudited) | |
| | | | | |
Net asset value, beginning of period | | | | | | |
| | | | | | |
| | | | | | |
Net realized and unrealized gains (losses) on investments | | | | | | |
Total from investment operations | | | | | | |
Distributions to shareholders from | | | | | | |
| | | | | | |
| | | | | | |
Total distributions to shareholders | | | | | | |
Net asset value, end of period | | | | | | |
| | | | | | |
Ratios to average net assets (annualized) | | | | | | |
| | | | | | |
| | | | | | |
| | | | | | |
| | | | | | |
| | | | | | |
Net assets, end of period (000s omitted) | | | | | | |
| Calculated based upon average shares outstanding |
| Amount is less than $0.005. |
| Total return calculations do not include any sales charges. Returns for periods of less than one year are not annualized. |
| During the year ended July 31, 2021, the Fund received a payment from an affiliate that had an impact of less than 0.005% on total return. |
The accompanying notes are an integral part of these financial statements.
Allspring Special Large Cap Value Fund | 17
(For a share outstanding throughout each period)
| Six months ended
January 31, 2024
(unaudited) | |
| | | | | |
Net asset value, beginning of period | | | | | | |
Net investment income (loss) | | | | | | |
| | | | | | |
Net realized and unrealized gains (losses) on investments | | | | | | |
Total from investment operations | | | | | | |
Distributions to shareholders from | | | | | | |
| | | | | | |
| | | | | | |
Total distributions to shareholders | | | | | | |
Net asset value, end of period | | | | | | |
| | | | | | |
Ratios to average net assets (annualized) | | | | | | |
| | | | | | |
| | | | | | |
Net investment income (loss) | | | | | | |
| | | | | | |
| | | | | | |
Net assets, end of period (000s omitted) | | | | | | |
| Calculated based upon average shares outstanding |
| Amount is less than $0.005. |
| Total return calculations do not include any sales charges. Returns for periods of less than one year are not annualized. |
| During the year ended July 31, 2021, the Fund received a payment from an affiliate that had a 0.50% impact on the total return. |
The accompanying notes are an integral part of these financial statements.
18 | Allspring Special Large Cap Value Fund
(For a share outstanding throughout each period)
| Six months ended
January 31, 2024
(unaudited) | |
| | | | | |
Net asset value, beginning of period | | | | | | |
| | | | | | |
Net realized and unrealized gains (losses) on investments | | | | | | |
Total from investment operations | | | | | | |
Distributions to shareholders from | | | | | | |
| | | | | | |
| | | | | | |
Total distributions to shareholders | | | | | | |
Net asset value, end of period | | | | | | |
| | | | | | |
Ratios to average net assets (annualized) | | | | | | |
| | | | | | |
| | | | | | |
| | | | | | |
| | | | | | |
| | | | | | |
Net assets, end of period (000s omitted) | | | | | | |
| Calculated based upon average shares outstanding |
| Returns for periods of less than one year are not annualized. |
The accompanying notes are an integral part of these financial statements.
Allspring Special Large Cap Value Fund | 19
(For a share outstanding throughout each period)
| Six months ended
January 31, 2024
(unaudited) | |
| | | | | |
Net asset value, beginning of period | | | | | | |
| | | | | | |
| | | | | | |
Net realized and unrealized gains (losses) on investments | | | | | | |
Total from investment operations | | | | | | |
Distributions to shareholders from | | | | | | |
| | | | | | |
| | | | | | |
Total distributions to shareholders | | | | | | |
Net asset value, end of period | | | | | | |
| | | | | | |
Ratios to average net assets (annualized) | | | | | | |
| | | | | | |
| | | | | | |
| | | | | | |
| | | | | | |
| | | | | | |
Net assets, end of period (000s omitted) | | | | | | |
| Calculated based upon average shares outstanding |
| Amount is less than $0.005. |
| Returns for periods of less than one year are not annualized. |
| During the year ended July 31, 2021, the Fund received a payment from an affiliate that had a 0.03% impact on the total return. |
The accompanying notes are an integral part of these financial statements.
20 | Allspring Special Large Cap Value Fund
(For a share outstanding throughout each period)
| Six months ended
January 31, 2024
(unaudited) | |
| | | | | |
Net asset value, beginning of period | | | | | | |
| | | | | | |
Net realized and unrealized gains (losses) on investments | | | | | | |
Total from investment operations | | | | | | |
Distributions to shareholders from | | | | | | |
| | | | | | |
| | | | | | |
Total distributions to shareholders | | | | | | |
Net asset value, end of period | | | | | | |
| | | | | | |
Ratios to average net assets (annualized) | | | | | | |
| | | | | | |
| | | | | | |
| | | | | | |
| | | | | | |
| | | | | | |
Net assets, end of period (000s omitted) | | | | | | |
| Calculated based upon average shares outstanding |
| Returns for periods of less than one year are not annualized. |
The accompanying notes are an integral part of these financial statements.
Allspring Special Large Cap Value Fund | 21
Notes to financial statements (unaudited)
Notes to financial statements
Allspring Funds Trust (the “Trust”), a Delaware statutory trust organized on March 10, 1999, is an open-end management investment company registered under the Investment Company Act of 1940, as amended (the “1940 Act”). As an investment company, the Trust follows the accounting and reporting guidance in Financial Accounting Standards Board (“FASB”) Accounting Standards Codification Topic 946, Financial Services – Investment Companies. These financial statements report on the Allspring Special Large Cap Value Fund (the “Fund”) which is a diversified series of the Trust.
2.
SIGNIFICANT ACCOUNTING POLICIES
The following significant accounting policies, which are consistently followed in the preparation of the financial statements of the Fund, are in conformity with U.S. generally accepted accounting principles which require management to make estimates and assumptions that affect the reported amounts of assets and liabilities, disclosure of contingent assets and liabilities at the date of the financial statements, and the reported amounts of income and expenses during the reporting period. Actual results could differ from those estimates.
Securities valuation
All investments are valued each business day as of the close of regular trading on the New York Stock Exchange (generally 4 p.m. Eastern Time), although the Fund may deviate from this calculation time under unusual or unexpected circumstances.
Equity securities and exchange-traded funds that are listed on a foreign or domestic exchange or market are valued at the official closing price or, if none, the last sales price.
Investments in registered open-end investment companies (other than those listed on a foreign or domestic exchange or market) are valued at net asset value.
Investments which are not valued using the methods discussed above are valued at their fair value, as determined in good faith by Allspring Funds Management, LLC (“Allspring Funds Management”), which was named the valuation designee by the Board of Trustees. As the valuation designee, Allspring Funds Management is responsible for day-to-day valuation activities for the Allspring Funds. In connection with these responsibilities, Allspring Funds Management has established a Valuation Committee and has delegated to it the authority to take any actions regarding the valuation of portfolio securities that the Valuation Committee deems necessary or appropriate, including determining the fair value of portfolio securities. On a quarterly basis, the Board of Trustees receives reports of valuation actions taken by the Valuation Committee. On at least an annual basis, the Board of Trustees receives an assessment of the adequacy and effectiveness of Allspring Funds Management’s process for determining the fair value of the portfolio of investments.
Foreign currency translation
The accounting records of the Fund are maintained in U.S. dollars. The values of other assets and liabilities denominated in foreign currencies are translated into U.S. dollars at rates provided by an independent foreign currency pricing source at a time each business day specified by the Valuation Committee. Purchases and sales of securities, and income and expenses are converted at the rate of exchange on the respective dates of such transactions. Net realized foreign exchange gains or losses arise from sales of foreign currencies, currency gains or losses realized between the trade and settlement dates on securities transactions, and the difference between the amounts of dividends, interest and foreign withholding taxes recorded and the U.S. dollar equivalent of the amounts actually paid or received. Net unrealized foreign exchange gains and losses arise from changes in the fair value of assets and liabilities other than investments in securities resulting from changes in exchange rates. The changes in net assets arising from changes in exchange rates of securities and the changes in net assets resulting from changes in market prices of securities are not separately presented. Such changes are included in net realized and unrealized gains or losses from investments.
Security transactions and income recognition
Securities transactions are recorded on a trade date basis. Realized gains or losses are recorded on the basis of identified cost.
Dividend income is recognized on the ex-dividend date. Dividend income is recorded net of foreign taxes withheld where recovery of such taxes is not assured.
Interest earned on cash balances held at the custodian is recorded as interest income.
Distributions received from REIT investments may be characterized as ordinary income, capital gains, or a return of capital to the Fund based on information provided by the REIT. The proper characterization of REIT distributions is generally not known until after the end of each calendar year. As such, estimates may be used in reporting the character of income and distributions for financial statement purposes.
Distributions to shareholders
Distributions to shareholders from net investment income and any net realized gains are recorded on the ex-dividend date and paid at least annually. Such distributions are determined in accordance with income tax regulations and may differ from U.S. generally accepted accounting principles. Dividend sources are estimated at the time of declaration. The tax character of distributions is determined as of the Fund’s fiscal year end. Therefore, a portion of the Fund’s distributions made prior to the Fund’s fiscal year end may be categorized as a tax return of capital at year end.
22 | Allspring Special Large Cap Value Fund
Notes to financial statements (unaudited)
Federal and other taxes
The Fund intends to continue to qualify as a regulated investment company by distributing substantially all of its investment company taxable income and any net realized capital gains (after reduction for capital loss carryforwards) sufficient to relieve it from all, or substantially all, federal income taxes. Accordingly, no provision for federal income taxes was required.
The Fund’s income and federal excise tax returns and all financial records supporting those returns for the prior three fiscal years are subject to examination by the federal and Delaware revenue authorities. Management has analyzed the Fund’s tax positions taken on federal, state, and foreign tax returns, as applicable, for all open tax years and does not believe that there are any uncertain tax positions that require recognition of a tax liability.
As of January 31, 2024, the aggregate cost of all investments for federal income tax purposes was $928,925,386 and the unrealized gains (losses) consisted of:
Class allocations
The separate classes of shares offered by the Fund differ principally in applicable sales charges, distribution, shareholder servicing, and administration fees. Class specific expenses are charged directly to that share class. Investment income, common fund-level expenses, and realized and unrealized gains (losses) on investments are allocated daily to each class of shares based on the relative proportion of net assets of each class.
3.
FAIR VALUATION MEASUREMENTS
Fair value measurements of investments are determined within a framework that has established a fair value hierarchy based upon the various data inputs utilized in determining the value of the Fund’s investments. The three-level hierarchy gives the highest priority to unadjusted quoted prices in active markets for identical assets or liabilities (Level 1) and the lowest priority to unobservable inputs (Level 3). The Fund’s investments are classified within the fair value hierarchy based on the lowest level of input that is significant to the fair value measurement. The inputs are summarized into three broad levels as follows:
•Level 1—quoted prices in active markets for identical securities
•Level 2—other significant observable inputs (including quoted prices for similar securities, interest rates, prepayment speeds, credit risk, etc.)
•Level 3—significant unobservable inputs (including the Fund’s own assumptions in determining the fair value of investments)
The inputs or methodologies used for valuing investments in securities are not necessarily an indication of the risk associated with investing in those securities.
The following is a summary of the inputs used in valuing the Fund’s assets and liabilities as of January 31, 2024:
| | Other significant
observable inputs
(Level 2) | Significant
unobservable inputs
(Level 3) | |
| | | | |
| | | | |
| | | | |
| | | | |
| | | | |
| | | | |
| | | | |
| | | | |
| | | | |
| | | | |
| | | | |
| | | | |
| | | | |
| | | | |
| | | | |
| | | | |
| | | | |
Additional sector, industry or geographic detail, if any, is included in the Portfolio of Investments.
Allspring Special Large Cap Value Fund | 23
Notes to financial statements (unaudited)
At January 31, 2024, the Fund did not have any transfers into/out of Level 3.
4.
TRANSACTIONS WITH AFFILIATES
Management fee
Allspring Funds Management, a wholly owned subsidiary of Allspring Global Investments Holdings, LLC, a holding company indirectly owned by certain private funds of GTCR LLC and Reverence Capital Partners, L.P., is the manager of the Fund and provides advisory and fund-level administrative services under an investment management agreement. Under the investment management agreement, Allspring Funds Management is responsible for, among other services, implementing the investment objectives and strategies of the Fund, supervising the subadviser and providing fund-level administrative services in connection with the Fund’s operations. As compensation for its services under the investment management agreement, Allspring Funds Management is entitled to receive a management fee at the following annual rate based on the Fund’s average daily net assets:
For the six months ended January 31, 2024, the management fee was equivalent to an annual rate of 0.68% of the Fund’s average daily net assets.
Allspring Funds Management has retained the services of a subadviser to provide daily portfolio management to the Fund. The fee for subadvisory services is borne by Allspring Funds Management. Allspring Global Investments, LLC, an affiliate of Allspring Funds Management and a wholly owned subsidiary of Allspring Global Investments Holdings, LLC, is the subadviser to the Fund and is entitled to receive a fee from Allspring Funds Management at an annual rate starting at 0.30% and declining to 0.20% as the average daily net assets of the Fund increase.
Administration fees
Under a class-level administration agreement, Allspring Funds Management provides class-level administrative services to the Fund, which includes paying fees and expenses for services provided by the transfer agent, sub-transfer agents, omnibus account servicers and record-keepers. As compensation for its services under the class-level administration agreement, Allspring Funds Management receives an annual fee which is calculated based on the average daily net assets of each class as follows:
| Class-level
administration fee |
| |
| |
| |
| |
| |
Waivers and/or expense reimbursements
Allspring Funds Management has contractually committed to waive and/or reimburse management and administration fees to the extent necessary to maintain certain net operating expense ratios for the Fund. When each class of the Fund has exceeded its expense cap, Allspring Funds Management will waive fees and/or reimburse expenses from fund-level expenses on a proportionate basis and then from class specific expenses. When only certain classes exceed their expense caps, waivers and/or reimbursements are applied against class specific expenses before fund-level expenses. Allspring Funds Management has contractually committed through November 30, 2024 to waive fees and/or reimburse expenses to the extent necessary to cap the Fund’s expenses. Prior to or after the commitment expiration date, the cap may be increased or the commitment to maintain the cap may be terminated only with the approval of the Board of Trustees. As of January 31, 2024, the contractual expense caps are as follows:
24 | Allspring Special Large Cap Value Fund
Notes to financial statements (unaudited)
Distribution fees
The Trust has adopted a distribution plan for Class C shares pursuant to Rule 12b-1 under the 1940 Act. Distribution fees are charged to Class C shares and paid to Allspring Funds Distributor, LLC (“Allspring Funds Distributor”), the principal underwriter, an affiliate of Allspring Funds Management, at an annual rate up to 0.75% of the average daily net assets of Class C shares.
In addition, Allspring Funds Distributor is entitled to receive the front-end sales charge from the purchase of Class A shares and a contingent deferred sales charge on the redemption of certain Class A shares. Allspring Funds Distributor is also entitled to receive the contingent deferred sales charges from redemptions of Class C shares. For the six months ended January 31, 2024, Allspring Funds Distributor received $400 from the sale of Class A shares. No contingent deferred sales charges were incurred by Class A and Class C shares for the six months ended January 31, 2024.
Shareholder servicing fees
The Trust has entered into contracts with one or more shareholder servicing agents, whereby Class A, Class C and Administrator Class are charged a fee at an annual rate up to 0.25% of the average daily net assets of each respective class. A portion of these total shareholder servicing fees were paid to affiliates of the Fund.
Interfund transactions
The Fund may purchase or sell portfolio investment securities to certain affiliates pursuant to Rule 17a-7 under the 1940 Act and under procedures adopted by the Board of Trustees. The procedures have been designed to ensure that these interfund transactions, which do not incur broker commissions, are effected at current market prices. Pursuant to these procedures, the Fund did not have any interfund transactions during the six months ended January 31, 2024.
5.
INVESTMENT PORTFOLIO TRANSACTIONS
Purchases and sales of investments, excluding U.S. government obligations (if any) and short-term securities, for the six months ended January 31, 2024 were $227,165,393 and $171,705,232, respectively.
The Trust (excluding the money market funds), Allspring Master Trust and Allspring Variable Trust are parties to a $350,000,000 revolving credit agreement whereby the Fund is permitted to use bank borrowings for temporary or emergency purposes, such as to fund shareholder redemption requests. Interest under the credit agreement is charged to the Fund based on borrowing rate equal to the higher of the Federal Funds rate or the overnight bank funding rate in effect on that day plus a spread. In addition, an annual commitment fee based on the unused balance is allocated to each participating fund.
For the six months ended January 31, 2024, there were no borrowings by the Fund under the agreement.
Under the Fund’s organizational documents, the officers and Trustees have been granted certain indemnification rights against certain liabilities that may arise out of performance of their duties to the Fund. The Fund has entered into a separate agreement with each Trustee that converts indemnification rights currently existing under the Fund’s organizational documents into contractual rights that cannot be changed in the future without the consent of the Trustee. Additionally, in the normal course of business, the Fund may enter into contracts with service providers that contain a variety of indemnification clauses. The Fund’s maximum exposure under these arrangements is dependent on future claims that may be made against the Fund and, therefore, cannot be estimated.
Allspring Special Large Cap Value Fund | 25
Other information (unaudited)
Other information
Proxy voting information
A description of the policies and procedures used to determine how to vote proxies relating to portfolio securities is available without charge, upon request, by calling 1-866-259-3305, visiting our website at allspringglobal.com, or visiting the SEC website at sec.gov. Information regarding how the proxies related to portfolio securities were voted during the most recent 12-month period ended June 30 is available on the website at allspringglobal.com or by visiting the SEC website at sec.gov.
Quarterly portfolio holdings information
The Fund files its complete schedule of portfolio holdings with the SEC for the first and third quarters of each fiscal year as an exhibit to its reports on Form N-PORT. Shareholders may view the filed Form N-PORT by visiting the SEC website at sec.gov.
26 | Allspring Special Large Cap Value Fund
Other information (unaudited)
Board of trustees and officers
Each of the Trustees and Officers listed in the table below acts in identical capacities for each fund in the Allspring family of funds, which consists of 116 mutual funds comprising the Allspring Funds Trust, Allspring Variable Trust, Allspring Master Trust and four closed-end funds (collectively the “Fund Complex”). This table should be read in conjunction with the Prospectus and the Statement of Additional Information†. The mailing address of each Trustee and Officer is 1415 Vantage Park Drive, 3rd Floor, Charlotte, NC 28203. Each Trustee and Officer serves an indefinite term, however, each Trustee serves such term until reaching the mandatory retirement age established by the Trustees.
Independent Trustees
| | Principal occupations during past five years or longer | Current other
public company or
investment
company
directorships |
William R. Ebsworth
(Born 1957) | | Retired. From 1984 to 2013, equities analyst, portfolio manager, research director and chief investment officer at Fidelity Management and Research Company in Boston, Tokyo, and Hong Kong, and retired in 2013 as Chief Investment Officer of Fidelity Strategic Advisers, Inc. where he led a team of investment professionals managing client assets. Prior thereto, Board member of Hong Kong Securities Clearing Co., Hong Kong Options Clearing Corp., the Thailand International Fund, Ltd., Fidelity Investments Life Insurance Company, and Empire Fidelity Investments Life Insurance Company. Serves on the Investment Company Institute’s Board of Governors since 2022 and Executive Committee since 2023 as well as the Vice Chairman of the Governing Council of the Independent Directors Council since 2023. Audit Committee Chair and Investment Committee Chair of the Vincent Memorial Hospital Foundation (non-profit organization). Mr. Ebsworth is a CFA charterholder. | |
Jane A. Freeman
(Born 1953) | Trustee,
since 2015;
Chair Liaison,
| Retired. From 2012 to 2014 and 1999 to 2008, Chief Financial Officer of Scientific Learning Corporation. From 2008 to 2012, Ms. Freeman provided consulting services related to strategic business projects. Prior to 1999, Portfolio Manager at Rockefeller & Co. and Scudder, Stevens & Clark. Board member of the Harding Loevner Funds from 1996 to 2014, serving as both Lead Independent Director and chair of the Audit Committee. Board member of the Russell Exchange Traded Funds Trust from 2011 to 2012 and the chair of the Audit Committee. Ms. Freeman is also an inactive Chartered Financial Analyst. | |
Isaiah Harris, Jr.
(Born 1952) | Trustee,
since 2009;
Audit Committee Chair,
since 2019 | Retired. Member of the Advisory Board of CEF of East Central Florida. Chairman of the Board of CIGNA Corporation from 2009 to 2021, and Director from 2005 to 2008. From 2003 to 2011, Director of Deluxe Corporation. Prior thereto, President and CEO of BellSouth Advertising and Publishing Corp. from 2005 to 2007, President and CEO of BellSouth Enterprises from 2004 to 2005 and President of BellSouth Consumer Services from 2000 to 2003. Emeritus member of the Iowa State University Foundation Board of Governors. Emeritus Member of the Advisory board of Iowa State University School of Business. Advisory Board Member, Palm Harbor Academy (private school). Advisory Board Member, Fellowship of Christian Athletes. Mr. Harris is a certified public accountant (inactive status). | |
David F. Larcker
(Born 1950) | | Distinguished Visiting Fellow at the Hoover Institution since 2022. James Irvin Miller Professor of Accounting at the Graduate School of Business (Emeritus), Stanford University, Director of the Corporate Governance Research Initiative and Senior Faculty of The Rock Center for Corporate Governance since 2006. From 2005 to 2008, Professor of Accounting at the Graduate School of Business, Stanford University. Prior thereto, Ernst & Young Professor of Accounting at The Wharton School, University of Pennsylvania from 1985 to 2005. | |
Olivia S. Mitchell
(Born 1953) | | International Foundation of Employee Benefit Plans Professor since 1993, Wharton School of the University of Pennsylvania. Director of Wharton’s Pension Research Council and Boettner Center on Pensions & Retirement Research, and Research Associate at the National Bureau of Economic Research. Previously taught at Cornell University from 1978 to 1993. | |
Timothy J. Penny
(Born 1951) | Trustee,
since 1996;
Chair,
since 2018 | President and Chief Executive Officer of Southern Minnesota Initiative Foundation, a non-profit organization, since 2007. Vice Chair of the Economic Club of Minnesota, since 2007. Co-Chair of the Committee for a Responsible Federal Budget, since 1995. Member of the Board of Trustees of NorthStar Education Finance, Inc., a non-profit organization, from 2007-2022. Senior Fellow of the University of Minnesota Humphrey Institute from 1995 to 2017. | |
* Length of service dates reflect the Trustee’s commencement of service with the Trust’s predecessor entities, where applicable.
# Ms. Freeman will serve as Chair Liaison through June 2024, at which time Ms. Wheelock will assume the role.
†
The Statement of Additional Information includes additional information about the Trustees and is available, without charge, upon request, by calling 1-800-222-8222 or by visiting the website at allspringglobal.com.
Allspring Special Large Cap Value Fund | 27
Other information (unaudited)
| Position held and length of service* | Principal occupations during past five years or longer | Current other public company or investment company directorships |
James G. Polisson
(Born 1959) | Trustee,
since 2018; Nominating and Governance Committee Chair, since 2024 | Retired. Chief Marketing Officer, Source (ETF) UK Services, Ltd, from 2015 to 2017. From 2012 to 2015, Principal of The Polisson Group, LLC, a management consulting, corporate advisory and principal investing company. Chief Executive Officer and Managing Director at Russell Investments, Global Exchange Traded Funds from 2010 to 2012. Managing Director of Barclays Global Investors from 1998 to 2010 and Global Chief Marketing Officer for iShares and Barclays Global Investors from 2000 to 2010. Trustee of the San Francisco Mechanics’ Institute, a non- profit organization, from 2013 to 2015. Board member of the Russell Exchange Traded Fund Trust from 2011 to 2012. Director of Barclays Global Investors Holdings Deutschland GmbH from 2006 to 2009. Mr. Polisson is an attorney and has a retired status with the Massachusetts and District of Columbia Bar Associations. | |
Pamela Wheelock
(Born 1959) | Trustee,
since January 2020;
previously Trustee from
January 2018 to
| Retired. Executive and Senior Financial leadership positions in the public, private and nonprofit sectors. Interim President and CEO, McKnight Foundation, 2020. Interim Commissioner, Minnesota Department of Human Services, 2019. Chief Operating Officer, Twin Cities Habitat for Humanity, 2017-2019. Vice President for University Services, University of Minnesota, 2012- 2016. Interim President and CEO, Blue Cross and Blue Shield of Minnesota, 2011-2012. Executive Vice-President and Chief Financial Officer, Minnesota Wild, 2002-2008. Commissioner, Minnesota Department of Finance, 1999-2002. Chair of the Board of Directors of Destination Medical Center Corporation. Board member of the Minnesota Wild Foundation. | |
* Length of service dates reflect the Trustee’s commencement of service with the Trust’s predecessor entities, where applicable.
# Ms. Freeman will serve as Chair Liaison through June 2024, at which time Ms. Wheelock will assume the role.
28 | Allspring Special Large Cap Value Fund
Other information (unaudited)
Officers1
| Position held and
length of service | Principal occupations during past five years or longer |
| | President and Chief Executive Officer of Allspring Funds Management, LLC since 2017 and Head of Global Fund Governance of Allspring Global Investments since 2022. Prior thereto, co-president of Galliard Capital Management, LLC, an affiliate of Allspring Funds Management, LLC, from 2019 to 2022 and Head of Affiliated Managers, Allspring Global Investments, from 2014 to 2019 and Executive Vice President responsible for marketing, investments and product development for Allspring Funds Management, LLC, from 2009 to 2014. |
Jeremy DePalma
(Born 1974) | Treasurer,
since 2012
(for certain funds in
the Fund Complex);
since 2021 (for
the remaining funds in the Complex) | Senior Vice President of Allspring Funds Management, LLC since 2009. Senior Vice President of Evergreen Investment Management Company, LLC from 2008 to 2010 and head of the Fund Reporting and Control Team within Fund Administration from 2005 to 2010. |
Christopher Baker
(Born 1976) | Chief Compliance Officer,
since 2022 | Global Chief Compliance Officer for Allspring Global Investments since 2022. Prior thereto, Chief Compliance Officer for State Street Global Advisors from 2018 to 2021. Senior Compliance Officer for the State Street divisions of Alternative Investment Solutions, Sector Solutions, and Global Marketing from 2015 to 2018. From 2010 to 2015 Vice President, Global Head of Investment and Marketing Compliance for State Street Global Advisors. |
Matthew Prasse
(Born 1983) | Chief Legal Officer,
since 2022;
Secretary,
since 2021 | Senior Counsel of the Allspring Legal Department since 2021. Senior Counsel of the Wells Fargo Legal Department from 2018 to 2021. Previously, Counsel for Barings LLC from 2015 to 2018. Prior to joining Barings, Associate at Morgan, Lewis & Bockius LLP from 2008 to 2015. |
1 For those Officers with tenures at Allspring Global Investments and/or Allspring Funds Management, LLC that began prior to 2021, such tenures include years of service during which these businesses/entities were known as Wells Fargo Asset Management and Wells Fargo Funds Management, LLC, respectively.
Allspring Special Large Cap Value Fund | 29
For more information
More information about Allspring Funds is available free upon request. To obtain literature, please write, visit the Fund’s website, or call:
Allspring Funds
P.O. Box 219967
Kansas City, MO 64121-9967
Website: allspringglobal.com
Individual investors: 1-800-222-8222
Retail investment professionals: 1-888-877-9275
Institutional investment professionals: 1-800-260-5969
This report and the financial statements contained herein are submitted for the general information of the shareholders of the Fund. If this report is used for promotional purposes, distribution of the report must be accompanied or preceded by a current prospectus. Before investing, please consider the investment objectives, risks, charges, and expenses of the investment. For a current prospectus and, if available, a summary prospectus, containing this information, call 1-800-222-8222 or visit the Fund’s website at allspringglobal.com. Read the prospectus carefully before you invest or send money.
Allspring Global InvestmentsTM is the trade name for the asset management firms of Allspring Global Investments Holdings, LLC, a holding company indirectly owned by certain private funds of GTCR LLC and Reverence Capital Partners, L.P. These firms include but are not limited to Allspring Global Investments, LLC, and Allspring Funds Management, LLC. Certain products managed by Allspring entities are distributed by Allspring Funds Distributor, LLC (a broker-dealer and Member FINRA/SIPC).
This material is for general informational and educational purposes only and is NOT intended to provide investment advice or a recommendation of any kind - including a recommendation for any specific investment, strategy, or plan.
© 2024 Allspring Global Investments Holdings, LLC. All rights reserved.
ALL-02052024-w3lzsvrh 03-24
SAR4302 01-24
ITEM 2. CODE OF ETHICS
Not applicable.
ITEM 3. AUDIT COMMITTEE FINANCIAL EXPERT
Not applicable.
ITEM 4. PRINCIPAL ACCOUNTANT FEES AND SERVICES
Not applicable.
ITEM 5. AUDIT COMMITTEE OF LISTED REGISTRANTS
Not applicable.
ITEM 6. INVESTMENTS
A Portfolio of Investments for the series of Allspring Funds Trust is included as part of the report to shareholders filed under Item 1 of this Form.
ITEM 7. DISCLOSURE OF PROXY VOTING POLICIES AND PROCEDURES FOR CLOSED-END MANAGEMENT INVESTMENT COMPANIES
Not applicable.
ITEM 8. PORTFOLIO MANAGERS OF CLOSED-END MANAGEMENT INVESTMENT COMPANIES
Not applicable.
ITEM 9. PURCHASES OF EQUITY SECURITIES BY CLOSED-END MANAGEMEENT INVESTMENT COMPANY AND AFFILIATED PURCHASERS
Not applicable.
ITEM 10. SUBMISSION OF MATTERS TO A VOTE OF SECURITY HOLDERS
There have been no material changes to the procedures by which shareholders may recommend nominees to the registrant’s Board of Trustees that have been implemented since the registrant’s last provided disclosure in response to the requirements of this Item.
ITEM 11. CONTROLS AND PROCEDURES
(a) The President and Treasurer have concluded that the Allspring Funds Trust disclosure controls and procedures (as defined in Rule 30a-3(c) under the Investment Company Act of 1940) provide reasonable assurances that material information relating to the registrant is made known to them by the appropriate persons, based on their evaluation of these controls and procedures as of a date within 90 days of the filing of this report.
(b) There were no significant changes in the registrant’s internal control over financial reporting (as defined in Rule 30a-3(d) under the Investment Company Act of 1940) that occurred during the period covered by this report that materially affected, or is reasonably likely to materially affect, the registrant’s internal control over financial reporting.
ITEM 12. DISCLOSURES OF SECURITIES LENDING ACTIVITES FOR CLOSED-END MANAGEMENT INVESTMENT COMPANIES
Not applicable.
ITEM 13. EXHIBITS
(a)(1) Not applicable.
(a)(2) Certifications pursuant to Section 302 of the Sarbanes-Oxley Act of 2002.
(a)(3) Not applicable.
(a)(4) Not applicable.
(b) Certifications pursuant to Section 906 of the Sarbanes-Oxley Act of 2002.
SIGNATURES
Pursuant to the requirements of the Securities Exchange Act of 1934 and the Investment Company Act of 1940, the registrant has duly caused this report to be signed on its behalf by the undersigned, thereunto duly authorized.
| | |
| Allspring Funds Trust |
| |
| By: | | /s/ Andrew Owen |
| | Andrew Owen |
| | President |
|
| Date: March 27, 2024 |
Pursuant to the requirements of the Securities Exchange Act of 1934 and the Investment Company Act of 1940, this report has been signed below by the following persons on behalf of the registrant and in the capacities and on the date indicated.
| | |
| Allspring Funds Trust |
| |
| By: | | /s/ Andrew Owen |
| | Andrew Owen |
| | President |
|
| Date: March 27, 2024 |
| |
| By: | | /s/ Jeremy DePalma |
| | Jeremy DePalma |
| | Treasurer |
|
| Date: March 27, 2024 |