UNITED STATES
SECURITIES AND EXCHANGE COMMISSION
Washington, D.C. 20549
FORM N-CSRS
CERTIFIED SHAREHOLDER REPORT OF REGISTERED
MANAGEMENT INVESTMENT COMPANIES
Investment Company Act file number: 811-09253
Allspring Funds Trust
(Exact name of registrant as specified in charter)
1415 Vantage Park Drive, 3rd Floor, Charlotte, NC 28203
(Address of principal executive offices) (Zip code)
Matthew Prasse
Allspring Funds Management, LLC
1415 Vantage Park Drive, 3rd Floor, Charlotte, NC 28203
(Name and address of agent for service)
Registrant’s telephone number, including area code: 800-222-8222
Date of fiscal year end: October 31
Registrant is making a filing for 8 of its series: Allspring Managed Account CoreBuilder Shares—Series EM, Allspring Emerging Markets Equity Fund, Allspring Emerging Markets Equity Income Fund, Allspring Global Long/Short Equity Fund, Allspring International Equity Fund, Allspring Special Global Small Cap Fund, Allspring Special International Small Cap Fund and Allspring U.S. Long/Short Equity Fund.
Date of reporting period: April 30, 2024
ITEM 1. REPORT TO STOCKHOLDERS
2
Allspring Managed Account
Allspring Managed Account CoreBuilder® Shares – Series EM
The views expressed and any forward-looking statements are as of April 30, 2024, unless otherwise noted, and are those of the portfolio managers and/or Allspring Global Investments. Discussions of individual securities or the markets generally are not intended as individual recommendations. Future events or results may vary significantly from those expressed in any forward-looking statements. The views expressed are subject to change at any time in response to changing circumstances in the market. Allspring Global Investments disclaims any obligation to publicly update or revise any views expressed or forward-looking statements.
Allspring Managed Account | 1
|
Beginning in July 2024, the Fund will be required by the Securities and Exchange Commission to send shareholders a paper copy of a new tailored shareholder report in place of the full shareholder report that you are now receiving. The tailored shareholder report will contain concise information about the Fund, including certain expense and performance information and fund statistics. If you wish to receive this new tailored shareholder report electronically, please follow the instructions on the back cover of this report. |
Other information that is currently included in the shareholder report, such as the Fund’s financial statements, will be available online and upon request, free of charge, in paper or electronic format. |
2 | Allspring Managed Account
This page is intentionally left blank.
Performance highlights (unaudited)
Performance highlights
| The Fund seeks to achieve long-term capital appreciation and current income. |
| Allspring Funds Management, LLC |
| Allspring Global Investments, LLC |
| Alison Shimada, Elaine Tse |
Average annual total returns (%) as of April 30, 2024 |
| | | | |
| | | | | |
Allspring Managed Account CoreBuilder® Shares - Series EM (ACBEX) | | | | | |
MSCI ACWI ex USA Index (Net)3 | | | | | |
MSCI EM Index (Net) (USD)4 | | | | | |
Figures quoted represent past performance, which is no guarantee of future results, and do not reflect taxes that a shareholder may pay on an investment in a fund. Investment return and principal value of an investment will fluctuate so that an investor’s shares, when redeemed, may be worth more or less than their original cost. Current performance may be lower or higher than the performance data quoted, which assumes the reinvestment of dividends and capital gains. Current month-end performance is available by calling 1-888-877-9275.
Index returns do not include transaction costs associated with buying and selling securities, any mutual fund fees or expenses, or any taxes. It is not possible to invest directly in an index.
Shares are sold without a front-end sales charge or contingent deferred sales charge.
|
| Based on the Fund’s inception date. |
| Reflects the expense ratios as stated in the most recent prospectus, which include the impact of 0.02% in acquired fund fees and expenses. The expense ratios shown are subject to change and may differ from the annualized expense ratios shown in the Financial Highlights of this report, which do not include acquired fund fees and expenses. |
| Generally, no ordinary fees or expenses are charged to the Fund. Allspring Funds Management, LLC has contractually committed to irrevocably absorb and pay or reimburse all ordinary operating expenses of the Fund, except portfolio transactions or other investment related costs (e.g., commissions), fees payable for services provided by the Fund’s securities lending agent (if any), interest, taxes, leverage expenses and other expenses not incurred in the ordinary course of the Fund’s business. This commitment has an indefinite term. |
| The Morgan Stanley Capital International (MSCI) All Country World Index (ACWI) ex USA Index (Net) is a free-float-adjusted market-capitalization-weighted index that is designed to measure the equity market performance of developed and emerging markets, excluding the U.S. Source: MSCI. MSCI makes no express or implied warranties or representations and shall have no liability whatsoever with respect to any MSCI data contained herein. The MSCI data may not be further redistributed or used as a basis for other indexes or any securities or financial products. This report is not approved, reviewed, or produced by MSCI. You cannot invest directly in an index. |
| MSCI Emerging Markets (EM) Index (Net) (USD) is a free-float-adjusted market-capitalization-weighted index that is designed to measure the equity market performance of emerging markets. You cannot invest directly in an index. |
Investing involves risk, including the possible loss of principal. Stock values fluctuate in response to the activities of individual companies and general market and economic conditions. Foreign investments are especially volatile and can rise or fall dramatically due to differences in the political and economic conditions of the host country. These risks are generally intensified in emerging markets. The use of derivatives may reduce returns and/or increase volatility. Certain investment strategies tend to increase the total risk of an investment (relative to the broader market). This fund is exposed to smaller-company securities risk. Consult the Fund’s prospectus for additional information on these and other risks.
CoreBuilder Shares are a series of investment options within the separately managed accounts advised or subadvised by Allspring Funds Management, LLC. The shares are fee-waived mutual funds that enable certain separately managed account investors to achieve greater diversification than smaller managed accounts might otherwise achieve.
Please remember that shares of the Fund may be purchased only by or on behalf of separately managed account clients where Allspring Funds Management, LLC has an agreement to serve as investment adviser or subadviser to the account with the separately managed account sponsor (typically a registered investment adviser or broker/dealer) or directly with the client.
4 | Allspring Managed Account
Performance highlights (unaudited)
Ten largest holdings (%) as of April 30, 20241 |
Samsung Electronics Co. Ltd., Preferred stock | |
Samsung Electronics Co. Ltd. | |
Power Grid Corp. of India Ltd. | |
Midea Group Co. Ltd. Class A | |
| |
| |
| |
| |
Embassy Office Parks REIT | |
China Resources Land Ltd. | |
| Figures represent the percentage of the Fund’s net assets. Holdings are subject to change and may have changed since the date specified. |
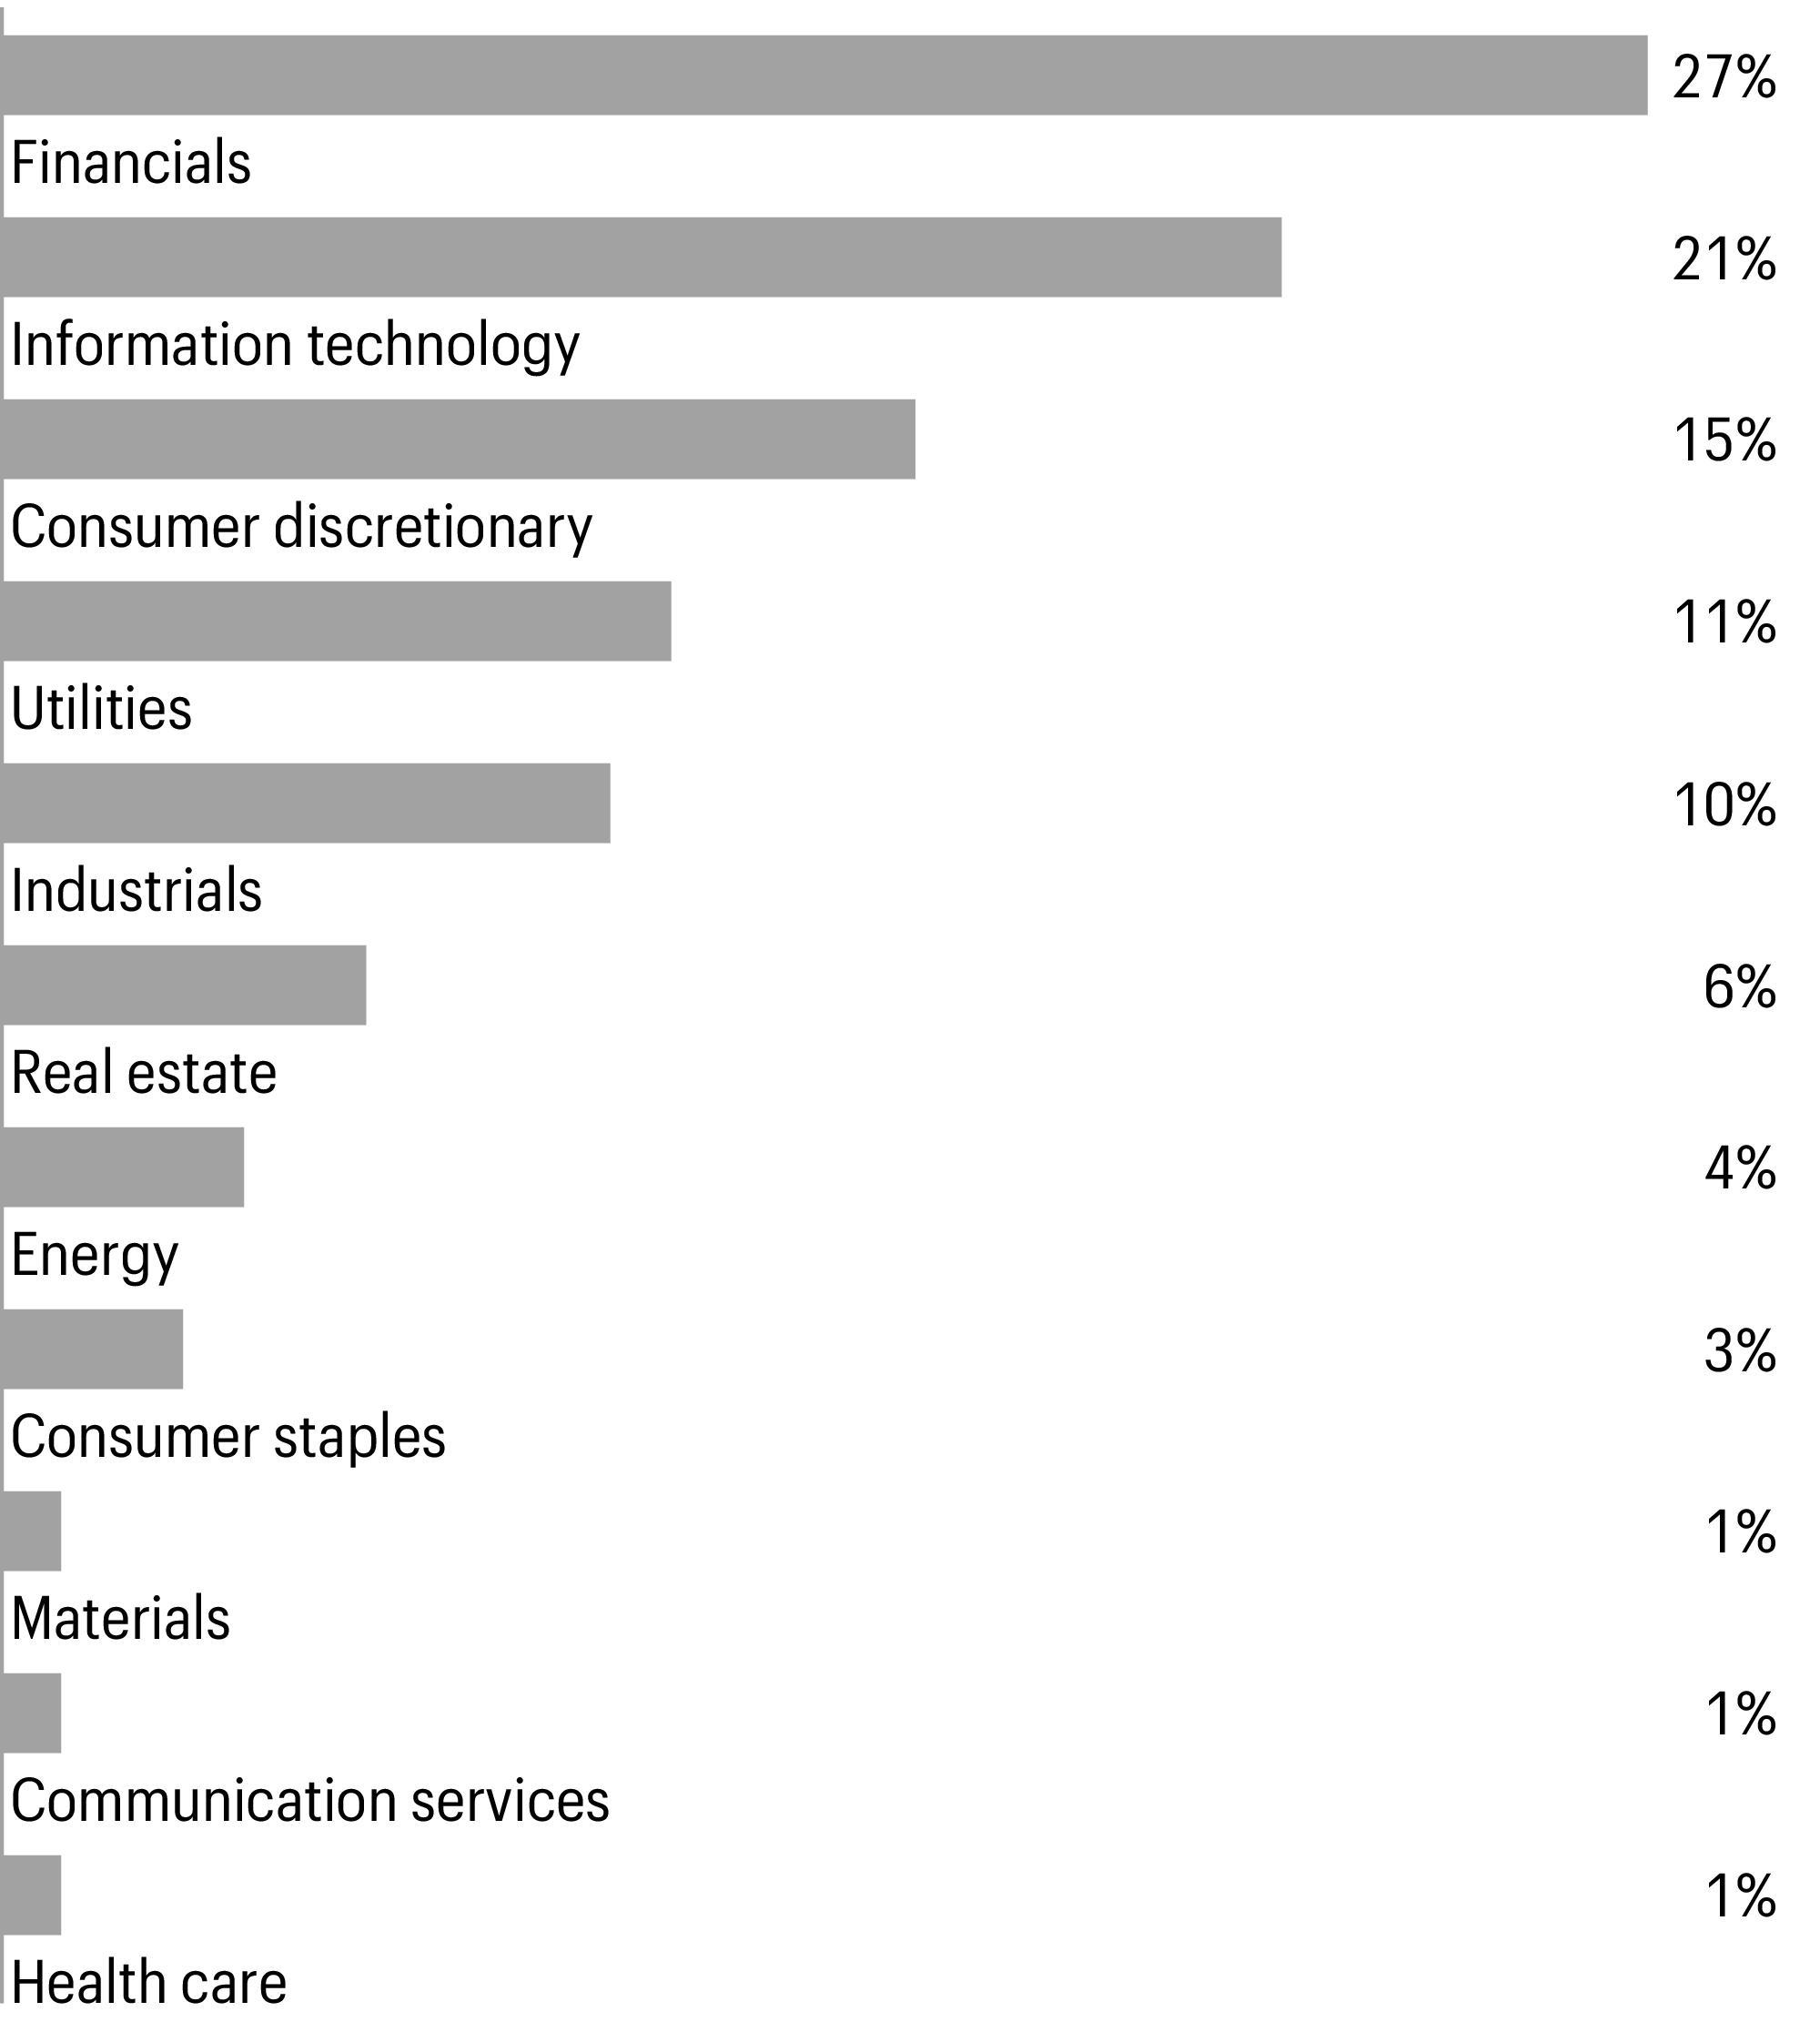
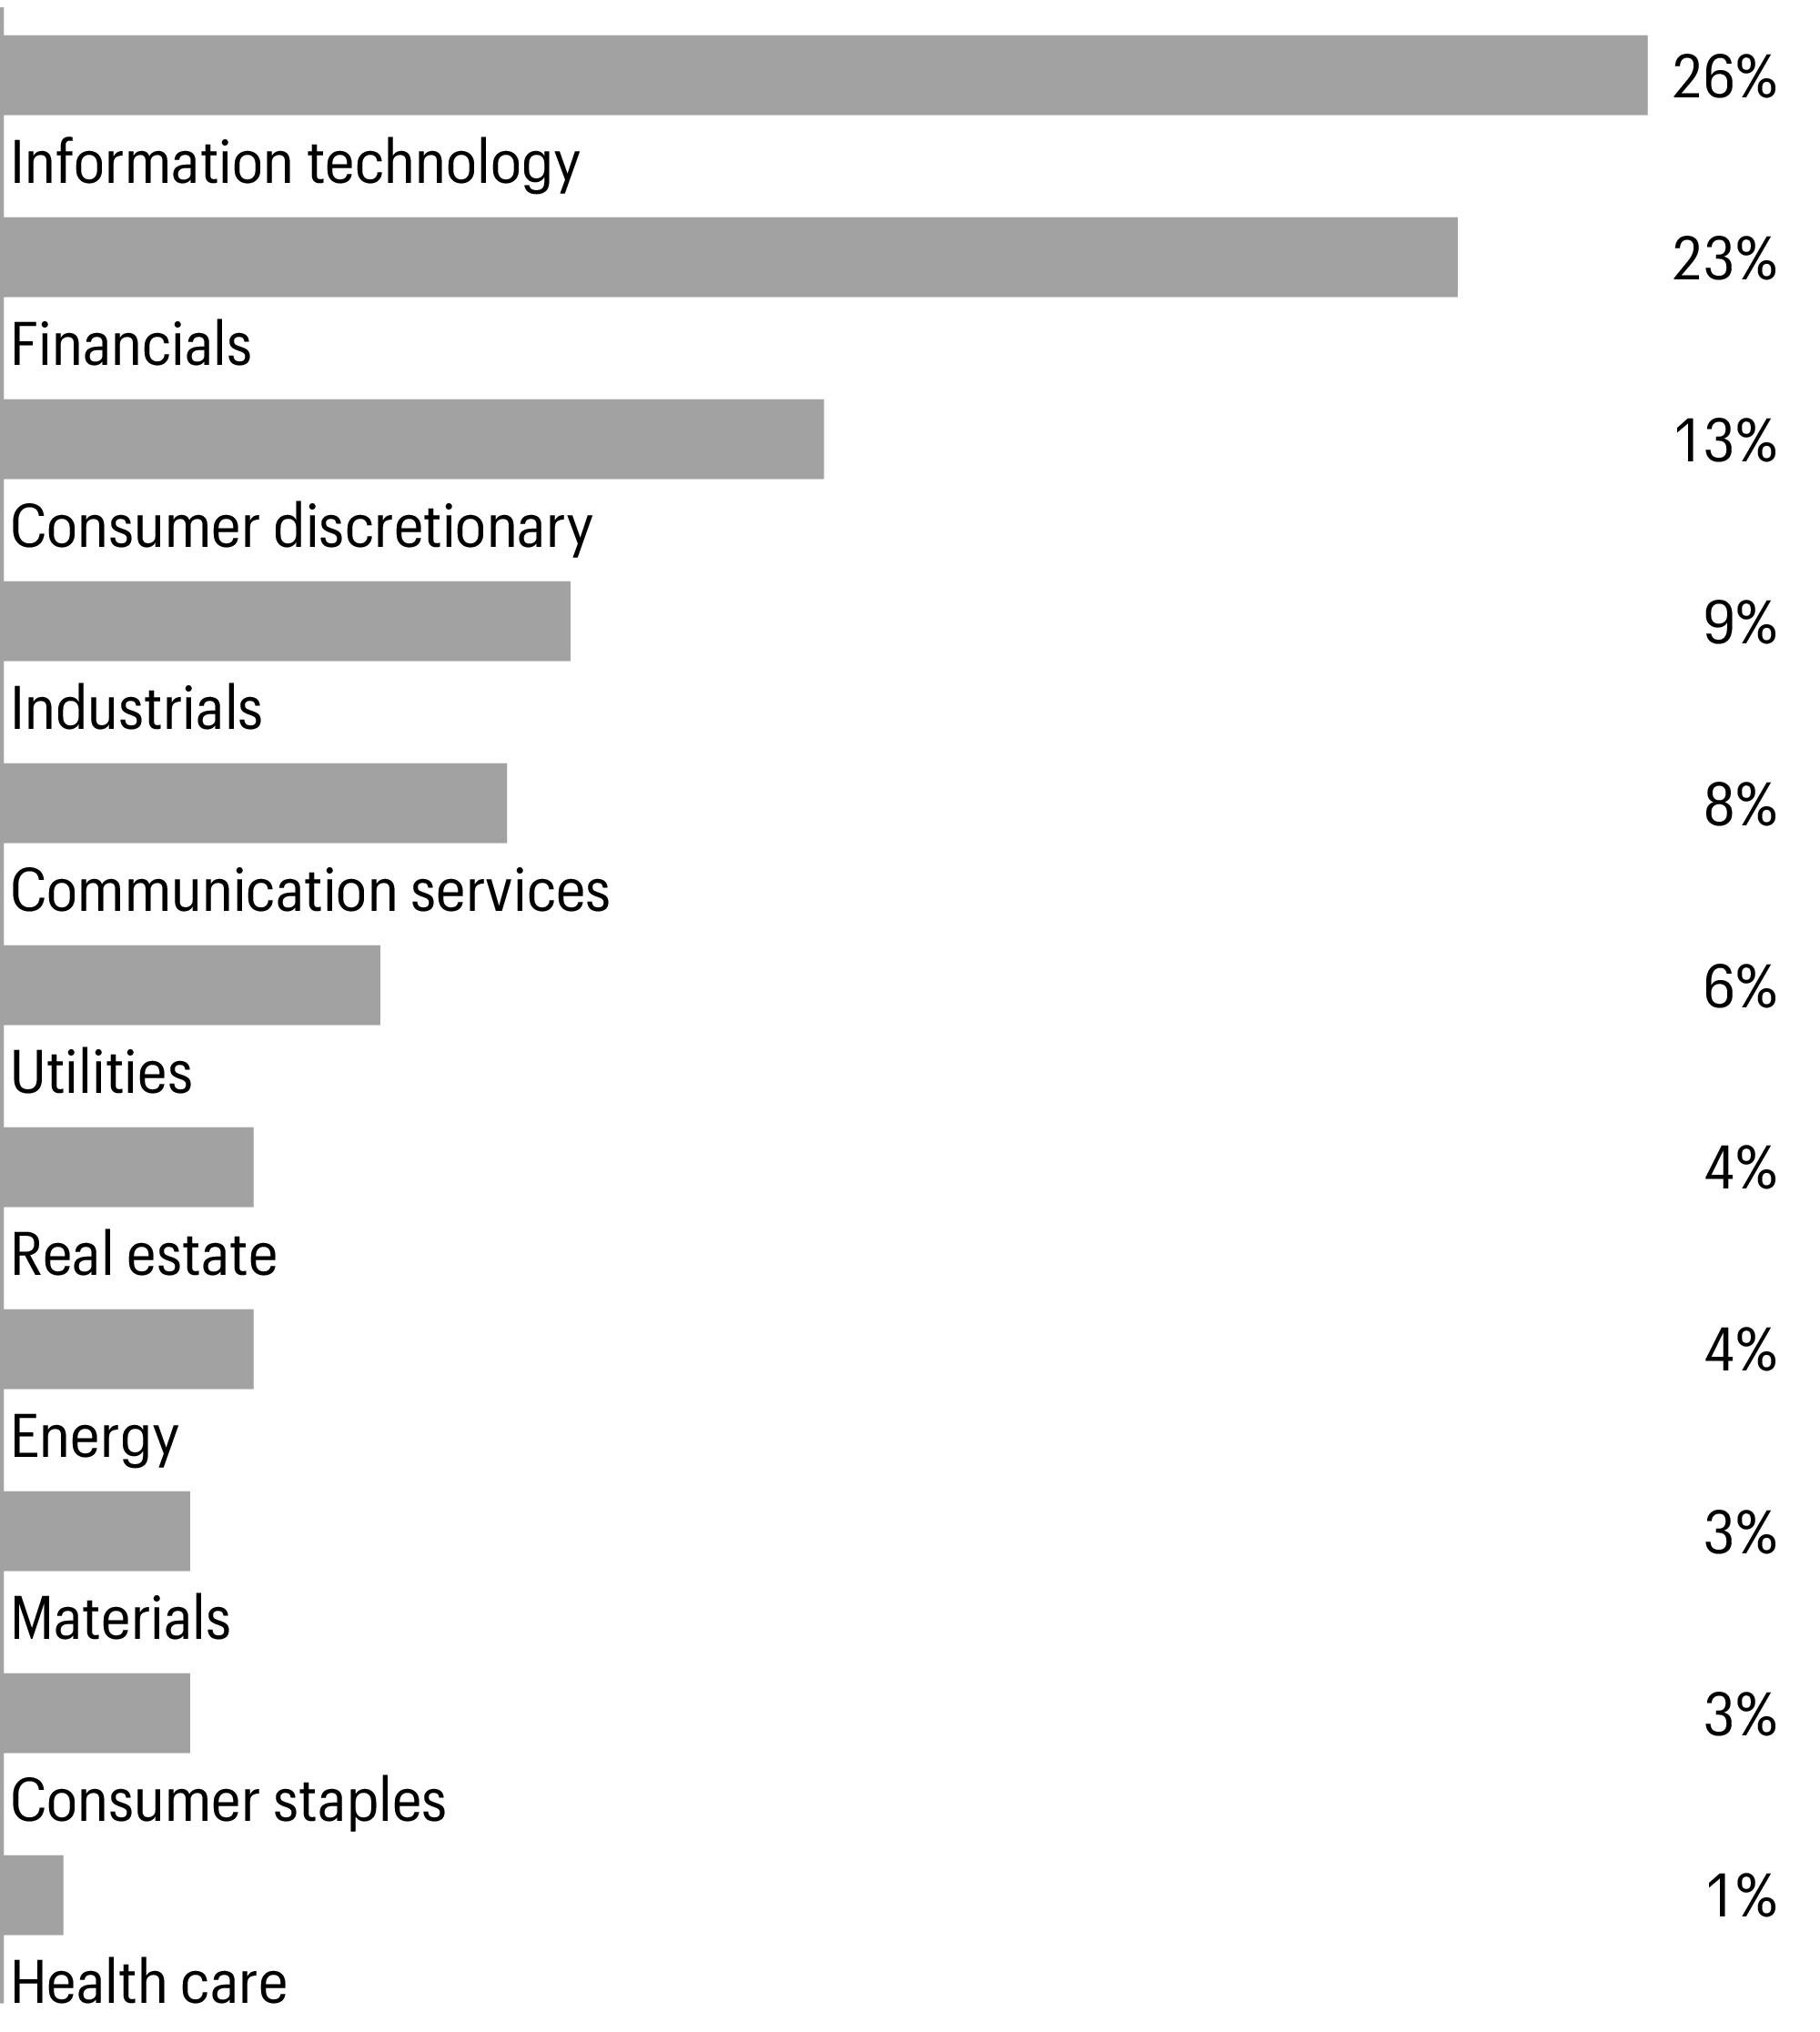
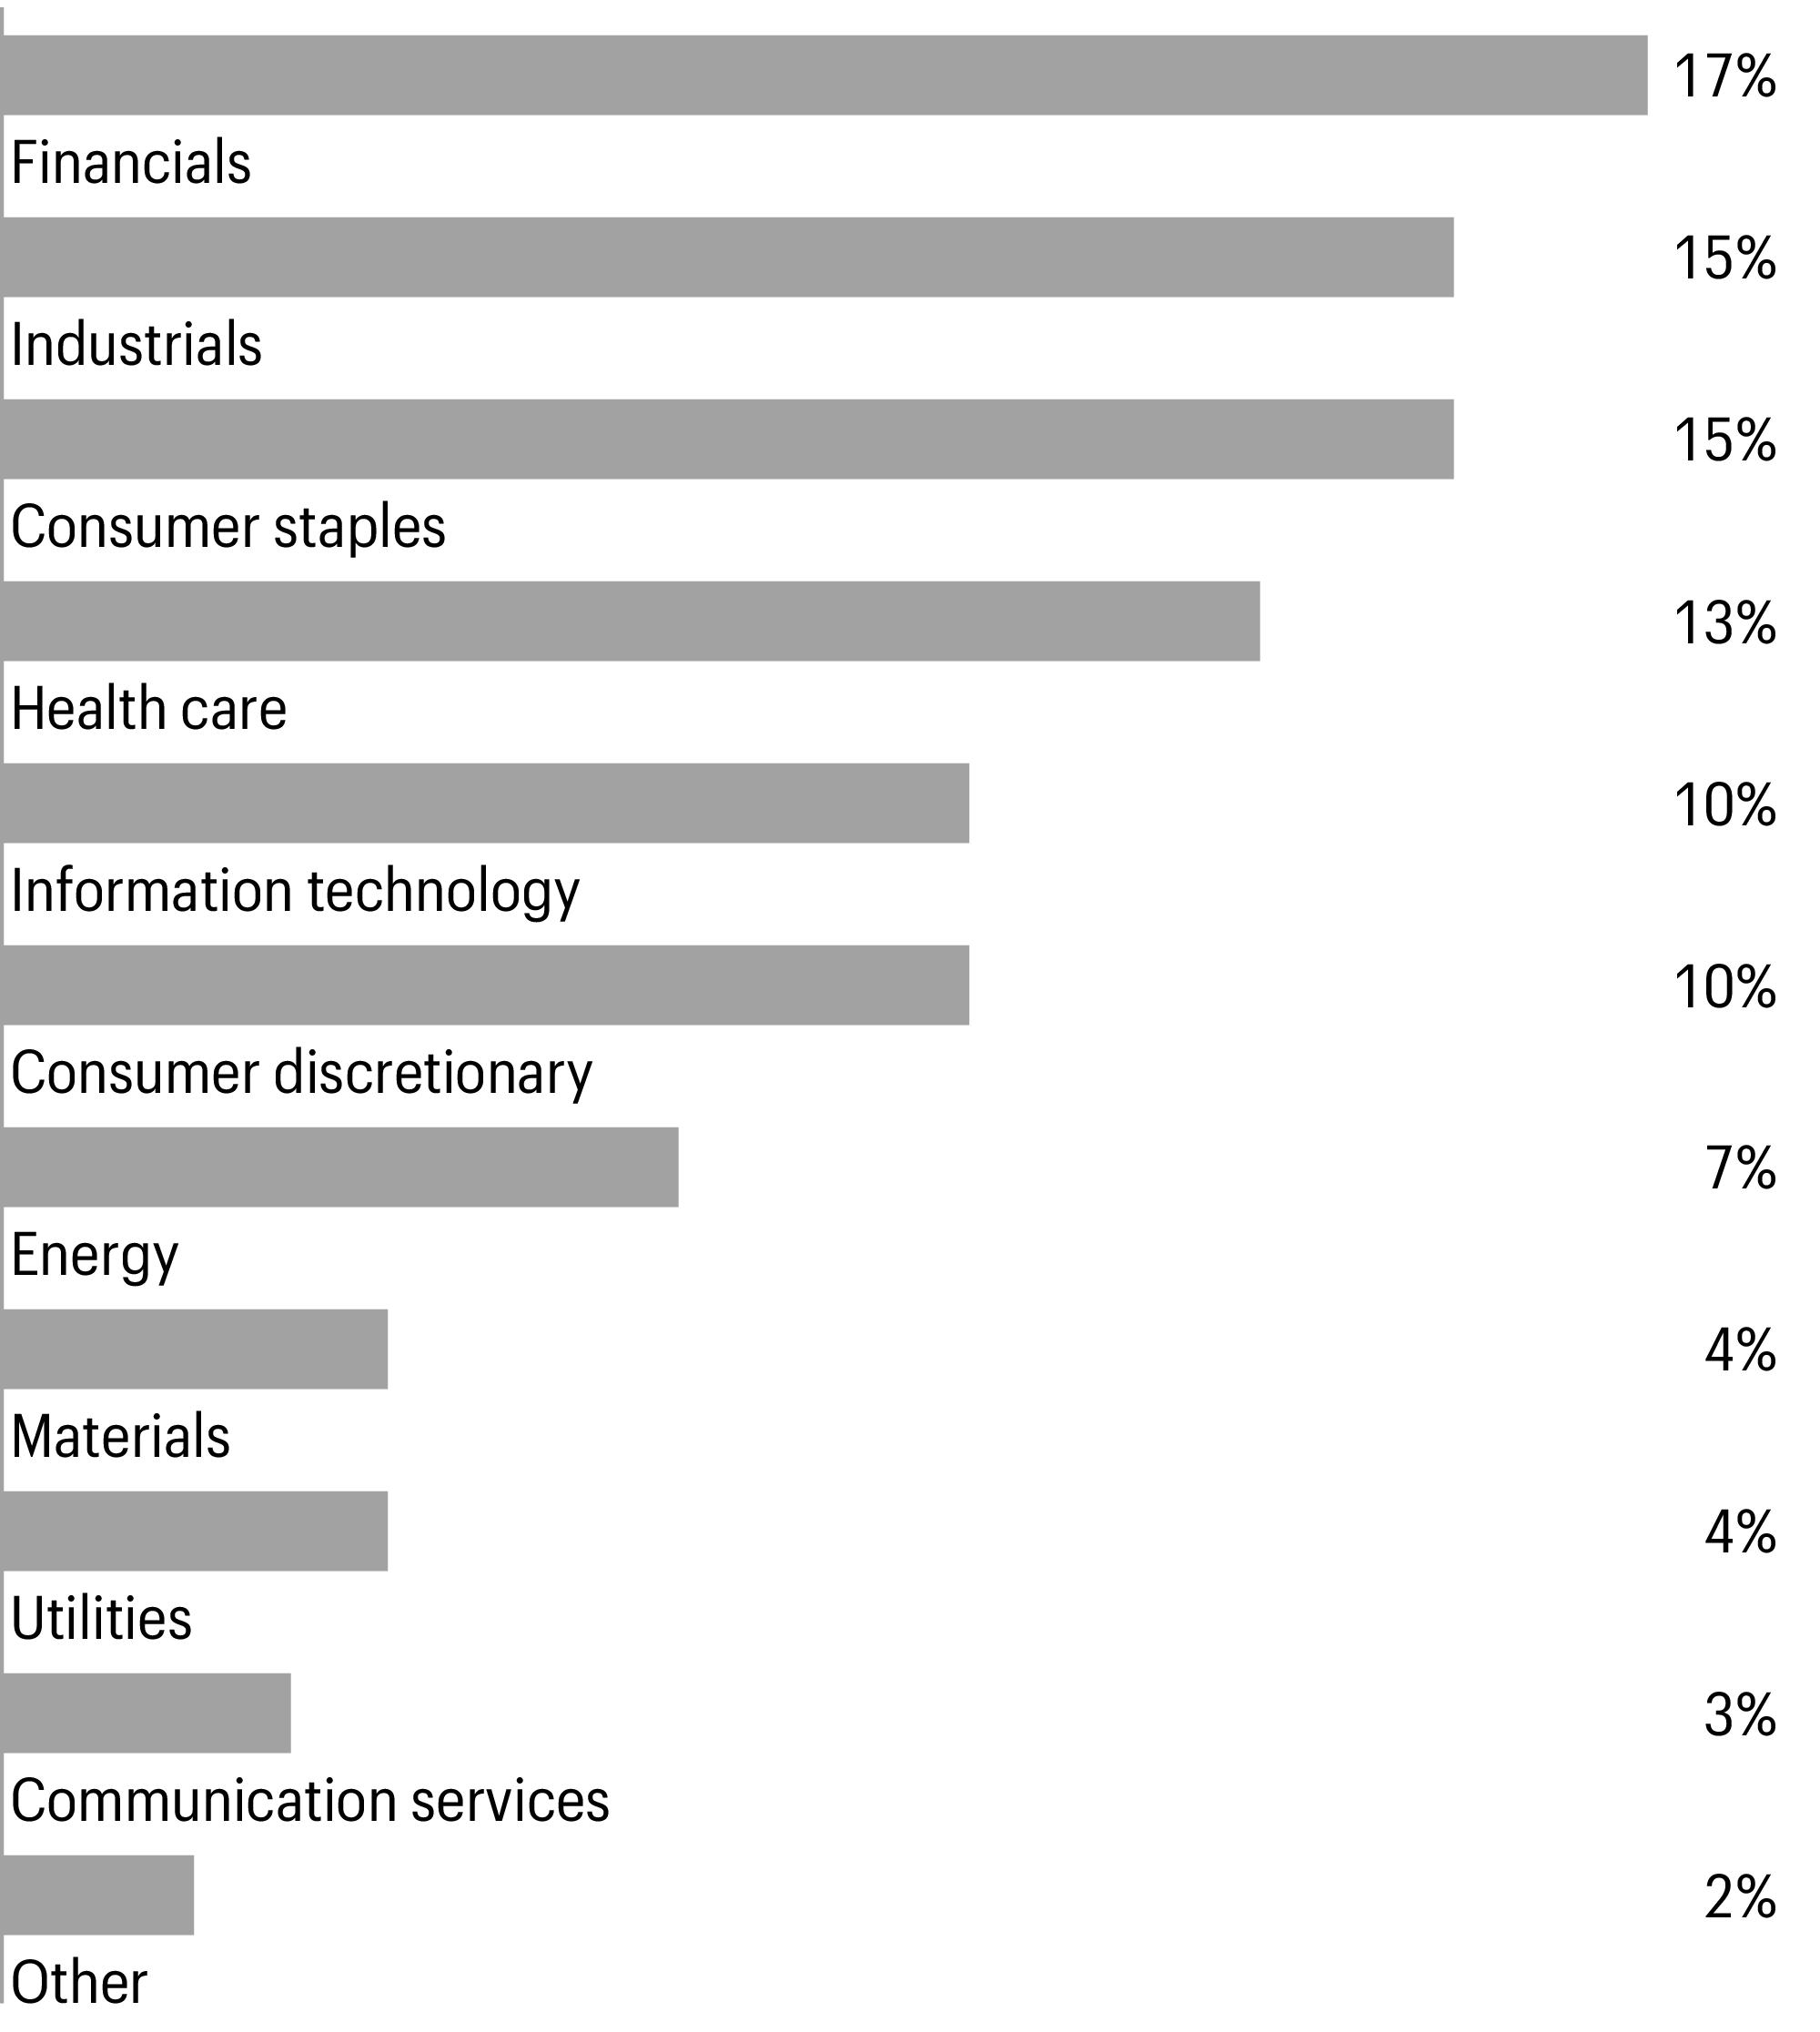
Sector allocation as of April 30, 20241 |
| Figures represent the percentage of the Fund’s long-term investments. Allocations are subject to change and may have changed since the date specified. |
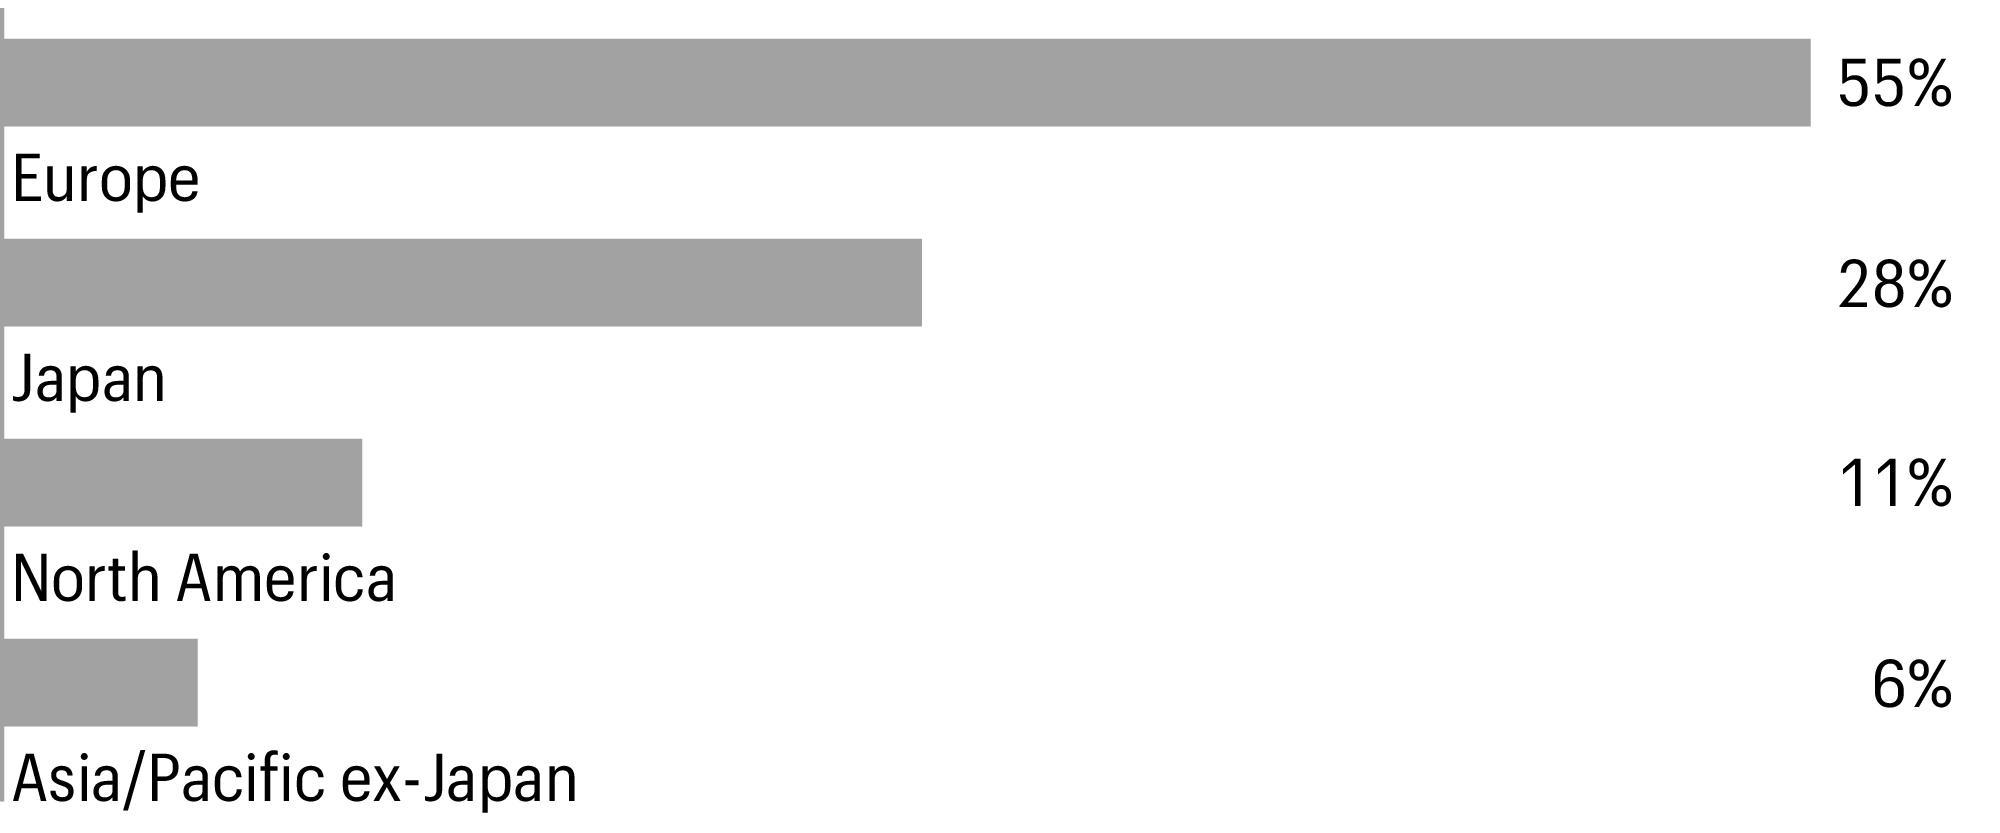
Geographic allocation as of April 30, 20241 |
| Figures represent the percentage of the Fund’s long-term investments. Allocations are subject to change and may have changed since the date specified. |
Allspring Managed Account | 5
Fund expenses (unaudited)
Fund expenses
As a shareholder of the Fund, you incur ongoing costs and other Fund expenses. This example is intended to help you understand your ongoing costs (in dollars) of investing in the Fund and to compare these costs with the ongoing costs of investing in other mutual funds.
The example is based on an investment of $1,000 invested at the beginning of the six-month period and held for the entire period from November 1, 2023 to April 30, 2024.
The “Actual” line of the table below provides information about actual account values and actual expenses. You may use the information in this line, together with the amount you invested, to estimate the expenses that you paid over the period. Simply divide your account value by $1,000 (for example, an $8,600 account value divided by $1,000= 8.6), then multiply the result by the number in the “Actual” line under the heading entitled “Expenses paid during period” for your applicable class of shares to estimate the expenses you paid on your account during this period.
Hypothetical example for comparison purposes
The “Hypothetical” line of the table below provides information about hypothetical account values and hypothetical expenses based on the Fund’s actual expense ratio and an assumed rate of return of 5% per year before expenses, which is not the Fund’s actual return. The hypothetical account values and expenses may not be used to estimate the actual ending account balance or expenses you paid for the period. You may use this information to compare the ongoing costs of investing in the Fund and other funds. To do so, compare this 5% hypothetical example with the 5% hypothetical examples that appear in the shareholder reports of the other funds.
Please note that the expenses shown in the table are meant to highlight your ongoing costs only. Therefore, the “Hypothetical” line of the table is useful in comparing ongoing costs only, and will not help you determine the relative total costs of owning different funds.
| Beginning
account value
11-1-2023 | Ending
account value
4-30-2024 | | Annualized net
expense ratio |
| | | | |
Hypothetical (5% return before expenses) | | | | |
| Expenses paid is equal to the annualized net expense ratio multiplied by the average account value over the period, multiplied by 182 divided by 366 (to reflect the one-half-year period). |
| Generally, no ordinary fees or expenses are charged to the Fund. Allspring Funds Management, LLC has contractually committed to irrevocably absorb and pay or reimburse all ordinary operating expenses of the Fund, except portfolio transactions or other investment related costs (e.g., commissions), fees payable for services provided by the Fund’s securities lending agent (if any), interest, taxes, leverage expenses and other expenses not incurred in the ordinary course of the Fund’s business. This commitment has an indefinite term. |
6 | Allspring Managed Account
Portfolio of investments—April 30, 2024 (unaudited)
| | | | | |
| | | | | | |
| | | | | | |
B3 SA - Brasil Bolsa Balcao (Financials, Capital markets) | | | | | | |
Banco BTG Pactual SA (Financials, Capital markets) | | | | | | |
| | | | | | |
| | | | | | |
China International Capital Corp. Ltd. Class H (Financials, Capital markets)144A | | | | | | |
China Oilfield Services Ltd. Class H (Energy, Energy equipment & services) | | | | | | |
China Resources Land Ltd. (Real estate, Real estate management & development) | | | | | | |
China State Construction International Holdings Ltd. (Industrials, Construction & engineering) | | | | | | |
Chinasoft International Ltd. (Information technology, IT services) | | | | | | |
Foxconn Industrial Internet Co. Ltd. Class A (Information technology, Electronic equipment, instruments & components) | | | | | | |
Fuyao Glass Industry Group Co. Ltd. Class H (Consumer discretionary, Automobile components)144A | | | | | | |
Gree Electric Appliances, Inc. of Zhuhai Class A (Consumer discretionary, Household durables) | | | | | | |
Inner Mongolia Yili Industrial Group Co. Ltd. Class A (Consumer staples, Food products) | | | | | | |
Midea Group Co. Ltd. Class A (Consumer discretionary, Household durables) | | | | | | |
Weichai Power Co. Ltd. Class H (Industrials, Machinery) | | | | | | |
| | | | | | |
| | | | | | |
Jumbo SA (Consumer discretionary, Specialty retail) | | | | | | |
National Bank of Greece SA (Financials, Banks)† | | | | | | |
| | | | | | |
| | | | | | |
Richter Gedeon Nyrt (Health care, Pharmaceuticals) | | | | | | |
| | | | | | |
360 ONE WAM Ltd. (Financials, Capital markets) | | | | | | |
Ashok Leyland Ltd. (Industrials, Machinery) | | | | | | |
Bajaj Auto Ltd. (Consumer discretionary, Automobiles) | | | | | | |
Embassy Office Parks REIT (Real estate, Office REITs) | | | | | | |
GAIL India Ltd. (Utilities, Gas utilities) | | | | | | |
LIC Housing Finance Ltd. (Financials, Financial services) | | | | | | |
NHPC Ltd. (Utilities, Independent power and renewable electricity producers) | | | | | | |
Power Finance Corp. Ltd. (Financials, Financial services) | | | | | | |
Power Grid Corp. of India Ltd. (Utilities, Electric utilities) | | | | | | |
Ujjivan Financial Services Ltd. (Financials, Consumer finance) | | | | | | |
| | | | | | |
| | | | | | |
Indofood CBP Sukses Makmur Tbk. PT (Consumer staples, Food products) | | | | | | |
The accompanying notes are an integral part of these financial statements.
Allspring Managed Account | 7
Portfolio of investments—April 30, 2024 (unaudited)
| | | | | |
| | | | | | |
CIMB Group Holdings Bhd. (Financials, Banks) | | | | | | |
Malaysia Airports Holdings Bhd. (Industrials, Transportation infrastructure) | | | | | | |
| | | | | | |
| | | | | | |
Bolsa Mexicana de Valores SAB de CV (Financials, Capital markets) | | | | | | |
| | | | | | |
Bank of the Philippine Islands (Financials, Banks) | | | | | | |
| | | | | | |
Bank Polska Kasa Opieki SA (Financials, Banks) | | | | | | |
LPP SA (Consumer discretionary, Textiles, apparel & luxury goods) | | | | | | |
| | | | | | |
| | | | | | |
Al Rajhi Bank (Financials, Banks) | | | | | | |
Arabian Drilling Co. (Energy, Energy equipment & services) | | | | | | |
Etihad Etisalat Co. (Communication services, Wireless telecommunication services) | | | | | | |
Saudi Awwal Bank (Financials, Banks) | | | | | | |
United International Transportation Co. (Industrials, Ground transportation) | | | | | | |
| | | | | | |
| | | | | | |
BOC Aviation Ltd. (Industrials, Trading companies & distributors)144A | | | | | | |
Yangzijiang Shipbuilding Holdings Ltd. (Industrials, Machinery) | | | | | | |
| | | | | | |
| | | | | | |
Doosan Bobcat, Inc. (Industrials, Machinery) | | | | | | |
Fila Holdings Corp. (Consumer discretionary, Textiles, apparel & luxury goods) | | | | | | |
Kia Corp. (Consumer discretionary, Automobiles) | | | | | | |
Samsung Electronics Co. Ltd. (Information technology, Technology hardware, storage & peripherals) | | | | | | |
| | | | | | |
| | | | | | |
Cathay Financial Holding Co. Ltd. (Financials, Insurance) | | | | | | |
Chroma ATE, Inc. (Information technology, Electronic equipment, instruments & components) | | | | | | |
Delta Electronics, Inc. (Information technology, Electronic equipment, instruments & components) | | | | | | |
E Ink Holdings, Inc. (Information technology, Electronic equipment, instruments & components) | | | | | | |
MediaTek, Inc. (Information technology, Semiconductors & semiconductor equipment) | | | | | | |
Quanta Computer, Inc. (Information technology, Technology hardware, storage & peripherals) | | | | | | |
Teco Electric & Machinery Co. Ltd. (Industrials, Electrical equipment) | | | | | | |
| | | | | | |
The accompanying notes are an integral part of these financial statements.
8 | Allspring Managed Account
Portfolio of investments—April 30, 2024 (unaudited)
| | | | | |
| | | | | | |
PTT Exploration & Production PCL (Energy, Oil, gas & consumable fuels) | | | | | | |
| | | | | | |
BIM Birlesik Magazalar AS (Consumer staples, Consumer staples distribution & retail) | | | | | | |
United Arab Emirates: 0.74% | | | | | | |
Abu Dhabi Commercial Bank PJSC (Financials, Banks) | | | | | | |
Total common stocks (Cost $4,378,948) | | | | | | |
| | | | | |
| | | | | | |
| | | | | | |
LG Chem Ltd. (Materials, Chemicals) | | | | | | |
Samsung Electronics Co. Ltd. (Information technology, Technology hardware, storage & peripherals) | | | | | | |
Total preferred stocks (Cost $388,166) | | | | | | |
| | | | | |
Short-term investments: 2.64% | | | | | | |
Investment companies: 2.64% | | | | | | |
Allspring Government Money Market Fund Select Class♠∞ | | | | | | |
Total short-term investments (Cost $141,698) | | | | | | |
Total investments in securities (Cost $4,908,812) | | | | | | |
Other assets and liabilities, net | | | | | | |
| | | | | | |
| The security may be resold in transactions exempt from registration, normally to qualified institutional buyers, pursuant to Rule 144A under the Securities Act of 1933. |
| Non-income-earning security |
| The issuer of the security is an affiliated person of the Fund as defined in the Investment Company Act of 1940. |
| The rate represents the 7-day annualized yield at period end. |
|
| Real estate investment trust |
Investments in affiliates
An affiliated investment is an investment in which the Fund owns at least 5% of the outstanding voting shares of the issuer or as a result of other relationships, such as the Fund and the issuer having the same investment manager. Transactions with issuers that were affiliates of the Fund at the end of the period were as follows:
| | | | | Net
change in
unrealized
gains
(losses) | | | Income
from
affiliated
securities |
| | | | | | | | |
Allspring Government Money Market Fund Select Class | | | | | | | | |
The accompanying notes are an integral part of these financial statements.
Allspring Managed Account | 9
Statement of assets and liabilities—April 30, 2024 (unaudited)
Financial statements
Statement of assets and liabilities
| |
Investments in unaffiliated securities, at value (cost $4,767,114) | |
Investments in affiliated securities, at value (cost $141,698) | |
Foreign currency, at value (cost $25,900) | |
Receivable for investments sold | |
| |
| |
Prepaid expenses and other assets | |
| |
| |
Payable for investments purchased | |
Professional fees payable | |
Accrued expenses and other liabilities | |
| |
| |
| |
| |
Total distributable earnings | |
| |
Computation of net asset value per share | |
| |
| |
Net asset value per share | |
1 The Fund has an unlimited number of authorized shares.
The accompanying notes are an integral part of these financial statements.
10 | Allspring Managed Account
Statement of operations—six months ended April 30, 2024 (unaudited)
Statement of operations
| |
Dividends (net of foreign withholdings taxes of $9,018) | |
Income from affiliated securities | |
| |
| |
| |
Custody and accounting fees | |
| |
| |
Shareholder report expenses | |
Trustees’ fees and expenses | |
| |
| |
Less: Fee waivers and/or expense reimbursements | |
| |
| |
Realized and unrealized gains (losses) on investments | |
Net realized gains (losses) on | |
| |
Foreign currency and foreign currency translations | |
Forward foreign currency contracts | |
Net realized gains on investments | |
Net change in unrealized gains (losses) on | |
| |
Foreign currency and foreign currency translations | |
Net change in unrealized gains (losses) on investments | |
Net realized and unrealized gains (losses) on investments | |
Net increase in net assets resulting from operations | |
The accompanying notes are an integral part of these financial statements.
Allspring Managed Account | 11
Statement of changes in net assets
Statement of changes in net assets
|
Six months ended
April 30, 2024 (unaudited) | year ended October 31, 20231 |
| | | | |
| | | | |
Net realized gains on investments | | | | |
Net change in unrealized gains (losses) on investments | | | | |
Net increase in net assets resulting from operations | | | | |
Distributions to shareholders from | | | | |
Net investment income and net realized gains | | | | |
Capital share transactions | | | | |
Proceeds from shares sold | | | | |
Reinvestment of distributions | | | | |
Payment for shares redeemed | | | | |
Net increase in net assets resulting from capital share transactions | | | | |
Total increase in net assets | | | | |
| | | | |
| | | | |
| | | | |
1 For the period from November 16, 2022 (commencement of operations) to October 31, 2023
The accompanying notes are an integral part of these financial statements.
12 | Allspring Managed Account
Financial highlights
(For a share outstanding throughout the period)
| Six months ended
April 30, 2024
(unaudited) | |
| |
Net asset value, beginning of period | | |
| | |
Net realized and unrealized gains (losses) on investments | | |
Total from investment operations | | |
Distributions to shareholders from | | |
| | |
| | |
Total distributions to shareholders | | |
Net asset value, end of period | | |
| | |
Ratios to average net assets (annualized) | | |
| | |
| | |
| | |
| | |
| | |
Net assets, end of period (000s omitted) | | |
| For the period from November 16, 2022 (commencement of operations) to October 31, 2023 |
| Calculated based upon average shares outstanding |
| Returns for periods of less than one year are not annualized. |
| The manager has contractually committed to irrevocably absorb and pay or reimburse all ordinary operating expenses of the Fund, except portfolio transactions or other investment-related costs (e.g., commissions), fees payable for services provided by the Fund’s securities lending agent (if any), interest, taxes, leverage expenses, and other expenses not incurred in the ordinary course of the Fund’s business. This commitment has an indefinite term. |
The accompanying notes are an integral part of these financial statements.
Allspring Managed Account | 13
Notes to financial statements (unaudited)
Notes to financial statements
Allspring Funds Trust (the “Trust”), a Delaware statutory trust organized on March 10, 1999, is an open-end management investment company registered under the Investment Company Act of 1940, as amended (the “1940 Act”). As an investment company, the Trust follows the accounting and reporting guidance in Financial Accounting Standards Board (“FASB”) Accounting Standards Codification Topic 946, Financial Services – Investment Companies. These financial statements report on the Allspring Managed Account CoreBuilder Shares - Series EM (the “Fund”) which is a diversified series of the Trust.
The Fund is a special purpose fund invested primarily in foreign equity securities and is intended to be used in combination with selected individual securities to effectively model institutional-level investment strategies. The Fund is intended to help enable certain separately managed account investors to achieve greater diversification than smaller managed accounts might otherwise achieve.
2.
SIGNIFICANT ACCOUNTING POLICIES
The following significant accounting policies, which are consistently followed in the preparation of the financial statements of the Fund, are in conformity with U.S. generally accepted accounting principles which require management to make estimates and assumptions that affect the reported amounts of assets and liabilities, disclosure of contingent assets and liabilities at the date of the financial statements, and the reported amounts of income and expenses during the reporting period. Actual results could differ from those estimates.
All investments are valued each business day as of the close of regular trading on the New York Stock Exchange (generally 4 p.m. Eastern Time), although the Fund may deviate from this calculation time under unusual or unexpected circumstances.
Equity securities and exchange-traded funds that are listed on a foreign or domestic exchange or market are valued at the official closing price or, if none, the last sales price.
The values of securities denominated in foreign currencies are translated into U.S. dollars at rates provided by an independent foreign currency pricing source at a time each business day specified by the Valuation Committee at Allspring Funds Management, LLC (“Allspring Funds Management”).
Many securities markets and exchanges outside the U.S. close prior to the close of the New York Stock Exchange and therefore may not fully reflect trading or events that occur after the close of the principal exchange in which the foreign securities are traded, but before the close of the New York Stock Exchange. If such trading or events are expected to materially affect the value of such securities, then fair value pricing procedures implemented by Allspring Funds Management are applied. These procedures take into account multiple factors including movements in U.S. securities markets after foreign exchanges close. Foreign securities that are fair valued under these procedures are categorized as Level 2 and the application of these procedures may result in transfers between Level 1 and Level 2. Depending on market activity, such fair valuations may be frequent. Such fair value pricing may result in net asset values that are higher or lower than net asset values based on the last reported sales price or latest quoted bid price. On April 30, 2024, such fair value pricing was used in pricing certain foreign securities.
Forward foreign currency contracts are recorded at the forward rate provided by an independent foreign currency pricing source at a time each business day specified by the Valuation Committee at Allspring Funds Management.
Investments in registered open-end investment companies (other than those listed on a foreign or domestic exchange or market) are valued at net asset value.
Investments which are not valued using the methods discussed above are valued at their fair value, as determined in good faith by Allspring Funds Management, which was named the valuation designee by the Board of Trustees. As the valuation designee, Allspring Funds Management is responsible for day-to-day valuation activities for the Allspring Funds. In connection with these responsibilities, Allspring Funds Management has established a Valuation Committee and has delegated to it the authority to take any actions regarding the valuation of portfolio securities that the Valuation Committee deems necessary or appropriate, including determining the fair value of portfolio securities. On a quarterly basis, the Board of Trustees receives reports of valuation actions taken by the Valuation Committee. On at least an annual basis, the Board of Trustees receives an assessment of the adequacy and effectiveness of Allspring Funds Management’s process for determining the fair value of the portfolio of investments.
Foreign currency translation
The accounting records of the Fund are maintained in U.S. dollars. The values of other assets and liabilities denominated in foreign currencies are translated into U.S. dollars at rates provided by an independent foreign currency pricing source at a time each business day specified by the Valuation Committee. Purchases and sales of securities, and income and expenses are converted at the rate of exchange on the respective dates of such transactions. Net realized foreign exchange gains or losses arise from sales of foreign currencies, currency gains or losses realized between the trade and settlement dates on securities transactions, and the difference between the amounts of dividends, interest and foreign withholding taxes recorded and the U.S. dollar equivalent of the amounts actually paid or received. Net unrealized foreign exchange gains and losses arise from changes in the fair value of assets and liabilities other than investments in securities resulting from changes in exchange rates. The changes in net assets arising from changes in exchange rates of securities and the changes in net assets resulting from changes in market prices of securities are not separately presented. Such changes are included in net realized and unrealized gains or losses from investments.
14 | Allspring Managed Account
Notes to financial statements (unaudited)
Forward foreign currency contracts
A forward foreign currency contract is an agreement between two parties to purchase or sell a specific currency for an agreed-upon price at a future date. The Fund enters into forward foreign currency contracts to facilitate transactions in foreign-denominated securities and to attempt to minimize the risk to the Fund from adverse changes in the relationship between currencies. Forward foreign currency contracts are recorded at the forward rate and marked-to-market daily. When the contracts are closed, realized gains and losses arising from such transactions are recorded as realized gains or losses on forward foreign currency contracts. The Fund is subject to foreign currency risk and may be exposed to risks if the counterparties to the contracts are unable to meet the terms of their contracts or if the value of the foreign currency changes unfavorably. The Fund’s maximum risk of loss from counterparty credit risk is the unrealized gains on the contracts. This risk may be mitigated if there is a master netting arrangement between the Fund and the counterparty.
Security transactions and income recognition
Securities transactions are recorded on a trade date basis. Realized gains or losses are recorded on the basis of identified cost.
Dividend income is recognized on the ex-dividend date, except for certain dividends from foreign securities, which are recorded as soon as the custodian verifies the ex-dividend date. Dividend income is recorded net of foreign taxes withheld where recovery of such taxes is not assured.
Interest earned on cash balances held at the custodian is recorded as interest income.
Distributions received from REIT investments may be characterized as ordinary income, capital gains, or a return of capital to the Fund based on information provided by the REIT. The proper characterization of REIT distributions is generally not known until after the end of each calendar year. As such, estimates may be used in reporting the character of income and distributions for financial statement purposes.
Distributions to shareholders
Distributions to shareholders are recorded on the ex-dividend date and paid from net investment income monthly and any net realized gains are paid at least annually. Such distributions are determined in accordance with income tax regulations and may differ from U.S. generally accepted accounting principles. Dividend sources are estimated at the time of declaration. The tax character of distributions is determined as of the Fund’s fiscal year end. Therefore, a portion of the Fund’s distributions made prior to the Fund’s fiscal year end may be categorized as a tax return of capital at year end.
The Fund intends to qualify as a regulated investment company by distributing substantially all of its investment company taxable income and any net realized capital gains (after reduction for capital loss carryforwards) sufficient to relieve it from all, or substantially all, federal income taxes. Accordingly, no provision for federal income taxes was required.
The Fund’s income and federal excise tax returns and all financial records supporting those returns for the fiscal years since commencement of operations are subject to examination by the federal and Delaware revenue authorities. The Fund is not subject to examination by federal and state tax authorities for taxes before 2023, the year the Fund commenced operations.
As of April 30, 2024, the aggregate cost of all investments for federal income tax purposes was $4,920,344 and the unrealized gains (losses) consisted of:
3.
FAIR VALUATION MEASUREMENTS
Fair value measurements of investments are determined within a framework that has established a fair value hierarchy based upon the various data inputs utilized in determining the value of the Fund’s investments. The three-level hierarchy gives the highest priority to unadjusted quoted prices in active markets for identical assets or liabilities (Level 1) and the lowest priority to unobservable inputs (Level 3). The Fund’s investments are classified within the fair value hierarchy based on the lowest level of input that is significant to the fair value measurement. The inputs are summarized into three broad levels as follows:
•Level 1—quoted prices in active markets for identical securities
•Level 2—other significant observable inputs (including quoted prices for similar securities, interest rates, prepayment speeds, credit risk, etc.)
•Level 3—significant unobservable inputs (including the Fund’s own assumptions in determining the fair value of investments)
The inputs or methodologies used for valuing investments in securities are not necessarily an indication of the risk associated with investing in those securities.
Allspring Managed Account | 15
Notes to financial statements (unaudited)
The following is a summary of the inputs used in valuing the Fund’s assets and liabilities as of April 30, 2024:
| | Other significant
observable inputs
(Level 2) | Significant
unobservable inputs
(Level 3) | |
| | | | |
| | | | |
| | | | |
| | | | |
| | | | |
| | | | |
| | | | |
| | | | |
| | | | |
| | | | |
| | | | |
| | | | |
| | | | |
| | | | |
| | | | |
| | | | |
| | | | |
| | | | |
| | | | |
| | | | |
| | | | |
| | | | |
| | | | |
| | | | |
| | | | |
Additional sector, industry or geographic detail, if any, is included in the Portfolio of Investments.
At April 30, 2024, the Fund did not have any transfers into/out of Level 3.
4.
TRANSACTIONS WITH AFFILIATES
The Trust has entered into an investment management contract with Allspring Funds Management, a wholly owned subsidiary of Allspring Global Investments Holdings, LLC, a holding company indirectly owned by certain private funds of GTCR LLC and Reverence Capital Partners, L.P. The manager is responsible for implementing investment policies and guidelines and for supervising the subadviser, who is responsible for day-to-day portfolio management of the Fund. For providing these services, Allspring Funds Management does not receive a fee from the Fund but is entitled to receive fees from separately managed account sponsors of the wrap-fee programs. Out of these fees, Allspring Funds Management pays Allspring Global Investments, LLC, an affiliate of Allspring Funds Management and a wholly owned subsidiary of Allspring Global Investments Holdings, LLC, for its services as the subadviser to the Fund.
Generally, no ordinary operating fees or expenses are charged to the Fund. Allspring Funds Management has contractually committed to irrevocably absorb and pay or reimburse all ordinary operating expenses of the Fund, except portfolio transactions or other investment-related costs (e.g., commissions), fees payable for services provided by the Fund’s securities lending agent (if any), interest, taxes, leverage expenses, and other expenses not incurred in the ordinary course of the Fund’s business. This commitment has an indefinite term.
The Fund may purchase or sell portfolio investment securities to certain affiliates pursuant to Rule 17a-7 under the 1940 Act and under procedures adopted by the Board of Trustees. The procedures have been designed to ensure that these interfund transactions, which do not incur broker commissions, are effected at current market prices. Pursuant to these procedures, the Fund did not have any interfund transactions during the six months ended April 30, 2024.
5.
INVESTMENT PORTFOLIO TRANSACTIONS
Purchases and sales of investments, excluding U.S. government obligations (if any) and short-term securities, for the six months ended April 30, 2024 were $3,533,573 and $3,522,494, respectively.
16 | Allspring Managed Account
Notes to financial statements (unaudited)
The Trust (excluding the money market funds), Allspring Master Trust and Allspring Variable Trust are parties to a $350,000,000 revolving credit agreement whereby the Fund is permitted to use bank borrowings for temporary or emergency purposes, such as to fund shareholder redemption requests. Interest under the credit agreement is charged to the Fund based on a borrowing rate equal to the higher of the Federal Funds rate or the overnight bank funding rate in effect on that day plus a spread. In addition, an annual commitment fee based on the unused balance is allocated to each participating fund.
For the six months ended April 30, 2024, there were no borrowings by the Fund under the agreement.
Concentration risk exists when a shareholder owns a large amount of shares of the Fund. A fund with a concentration of ownership may be more affected by the investment activity of those shareholders than would be a fund that does not have any ownership concentration. As of April 30, 2024, Allspring Funds Management or one of its affiliates owned 100% of the Fund.
As of the end of the period, the Fund concentrated its portfolio of investments in the financial sector and Asia/Pacific ex-Japan. A fund that invests a substantial portion of its assets in any sector or geographic region may be more affected by changes in that sector or geographic region than would be a fund whose investments are not heavily weighted in any sector or geographic region.
Under the Fund’s organizational documents, the officers and Trustees have been granted certain indemnification rights against certain liabilities that may arise out of performance of their duties to the Fund. The Fund has entered into a separate agreement with each Trustee that converts indemnification rights currently existing under the Fund’s organizational documents into contractual rights that cannot be changed in the future without the consent of the Trustee. Additionally, in the normal course of business, the Fund may enter into contracts with service providers that contain a variety of indemnification clauses. The Fund’s maximum exposure under these arrangements is dependent on future claims that may be made against the Fund and, therefore, cannot be estimated.
Allspring Managed Account | 17
Other information (unaudited)
Other information
A description of the policies and procedures used to determine how to vote proxies relating to portfolio securities is available without charge, upon request, by calling 1-866-259-3305, visiting our website at allspringglobal.com, or visiting the SEC website at sec.gov. Information regarding how the proxies related to portfolio securities were voted during the most recent 12-month period ended June 30 is available on the website at allspringglobal.com or by visiting the SEC website at sec.gov.
Quarterly portfolio holdings information
The Fund files its complete schedule of portfolio holdings with the SEC for the first and third quarters of each fiscal year as an exhibit to its reports on Form N-PORT. Shareholders may view the filed Form N-PORT by visiting the SEC website at sec.gov.
18 | Allspring Managed Account
Other information (unaudited)
Board of trustees and officers
Each of the Trustees and Officers listed in the table below acts in identical capacities for each fund in the Allspring family of funds, which consists of 99 mutual funds comprising the Allspring Funds Trust, Allspring Variable Trust, Allspring Master Trust and four closed-end funds (collectively the “Fund Complex”). This table should be read in conjunction with the Prospectus and the Statement of Additional Information*. The mailing address of each Trustee and Officer is 1415 Vantage Park Drive, 3rd Floor, Charlotte, NC 28203. Each Trustee and Officer serves an indefinite term, however, each Trustee serves such term until reaching the mandatory retirement age established by the Trustees.
| Position held and
length of | Principal occupations during past five years or longer | Current other
public company or
investment
company
directorships |
William R. Ebsworth
(Born 1957) | | Retired. From 1984 to 2013, equities analyst, portfolio manager, research director and chief investment officer at Fidelity Management and Research Company in Boston, Tokyo, and Hong Kong, and retired in 2013 as Chief Investment Officer of Fidelity Strategic Advisers, Inc. where he led a team of investment professionals managing client assets. Prior thereto, Board member of Hong Kong Securities Clearing Co., Hong Kong Options Clearing Corp., the Thailand International Fund, Ltd., Fidelity Investments Life Insurance Company, and Empire Fidelity Investments Life Insurance Company. Serves on the Investment Company Institute’s Board of Governors since 2022 and Executive Committee since 2023 as well as the Vice Chairman of the Governing Council of the Independent Directors Council since 2023. Audit Committee Chair and Investment Committee Chair of the Vincent Memorial Hospital Foundation (non-profit organization). Mr. Ebsworth is a CFA charterholder. | |
Jane A. Freeman
(Born 1953) | Trustee,
since 2015;
Chair Liaison,
| Retired. From 2012 to 2014 and 1999 to 2008, Chief Financial Officer of Scientific Learning Corporation. From 2008 to 2012, Ms. Freeman provided consulting services related to strategic business projects. Prior to 1999, Portfolio Manager at Rockefeller & Co. and Scudder, Stevens & Clark. Board member of the Harding Loevner Funds from 1996 to 2014, serving as both Lead Independent Director and chair of the Audit Committee. Board member of the Russell Exchange Traded Funds Trust from 2011 to 2012 and the chair of the Audit Committee. Ms. Freeman is also an inactive Chartered Financial Analyst. | |
Isaiah Harris, Jr.
(Born 1952) | Trustee,
since 2009;
Audit Committee Chair,
since 2019 | Retired. Member of the Advisory Board of CEF of East Central Florida. Chairman of the Board of CIGNA Corporation from 2009 to 2021, and Director from 2005 to 2008. From 2003 to 2011, Director of Deluxe Corporation. Prior thereto, President and CEO of BellSouth Advertising and Publishing Corp. from 2005 to 2007, President and CEO of BellSouth Enterprises from 2004 to 2005 and President of BellSouth Consumer Services from 2000 to 2003. Emeritus member of the Iowa State University Foundation Board of Governors. Emeritus Member of the Advisory board of Iowa State University School of Business. Advisory Board Member, Palm Harbor Academy (private school). Advisory Board Member, Fellowship of Christian Athletes. Mr. Harris is a certified public accountant (inactive status). | |
David F. Larcker
(Born 1950) | | Distinguished Visiting Fellow at the Hoover Institution since 2022. James Irvin Miller Professor of Accounting at the Graduate School of Business (Emeritus), Stanford University, Director of the Corporate Governance Research Initiative and Senior Faculty of The Rock Center for Corporate Governance since 2006. From 2005 to 2008, Professor of Accounting at the Graduate School of Business, Stanford University. Prior thereto, Ernst & Young Professor of Accounting at The Wharton School, University of Pennsylvania from 1985 to 2005. | |
Olivia S. Mitchell
(Born 1953) | | International Foundation of Employee Benefit Plans Professor since 1993, Wharton School of the University of Pennsylvania. Director of Wharton’s Pension Research Council and Boettner Center on Pensions & Retirement Research, and Research Associate at the National Bureau of Economic Research. Previously taught at Cornell University from 1978 to 1993. | |
Timothy J. Penny
(Born 1951) | Trustee,
since 1996;
Chair,
since 2018 | President and Chief Executive Officer of Southern Minnesota Initiative Foundation, a non-profit organization, since 2007. Vice Chair of the Economic Club of Minnesota, since 2007. Co-Chair of the Committee for a Responsible Federal Budget, since 1995. Member of the Board of Trustees of NorthStar Education Finance, Inc., a non-profit organization, from 2007-2022. Senior Fellow of the University of Minnesota Humphrey Institute from 1995 to 2017. | |
** Length of service dates reflect the Trustee’s commencement of service with the Trust’s predecessor entities, where applicable.
*** Ms. Freeman will serve as Chair Liaison through June 2024, at which time Ms. Wheelock will assume the role.
*
The Statement of Additional Information includes additional information about the Trustees and is available, without charge, upon request, by call 1-888-877-9275 or by visiting the website at allspringglobal.com.
Allspring Managed Account | 19
Other information (unaudited)
| Position held and length of service** | Principal occupations during past five years or longer | Current other public company or investment company directorships |
James G. Polisson
(Born 1959) | Trustee,
since 2018;
Nominating and Governance Committee Chair,
since 2024 | Retired. Chief Marketing Officer, Source (ETF) UK Services, Ltd, from 2015 to 2017. From 2012 to 2015, Principal of The Polisson Group, LLC, a management consulting, corporate advisory and principal investing company. Chief Executive Officer and Managing Director at Russell Investments, Global Exchange Traded Funds from 2010 to 2012. Managing Director of Barclays Global Investors from 1998 to 2010 and Global Chief Marketing Officer for iShares and Barclays Global Investors from 2000 to 2010. Trustee of the San Francisco Mechanics’ Institute, a non- profit organization, from 2013 to 2015. Board member of the Russell Exchange Traded Fund Trust from 2011 to 2012. Director of Barclays Global Investors Holdings Deutschland GmbH from 2006 to 2009. Mr. Polisson is an attorney and has a retired status with the Massachusetts and District of Columbia Bar Associations. | |
Pamela Wheelock
(Born 1959) | Trustee,
since January 2020;
previously Trustee from
January 2018 to
| Retired. Executive and Senior Financial leadership positions in the public, private and nonprofit sectors. Interim President and CEO, McKnight Foundation, 2020. Interim Commissioner, Minnesota Department of Human Services, 2019. Chief Operating Officer, Twin Cities Habitat for Humanity, 2017-2019. Vice President for University Services, University of Minnesota, 2012- 2016. Interim President and CEO, Blue Cross and Blue Shield of Minnesota, 2011-2012. Executive Vice-President and Chief Financial Officer, Minnesota Wild, 2002-2008. Commissioner, Minnesota Department of Finance, 1999-2002. Chair of the Board of Directors of Destination Medical Center Corporation. Board member of the Minnesota Wild Foundation. | |
** Length of service dates reflect the Trustee’s commencement of service with the Trust’s predecessor entities, where applicable.
*** Ms. Freeman will serve as Chair Liaison through June 2024, at which time Ms. Wheelock will assume the role.
20 | Allspring Managed Account
Other information (unaudited)
Officers1
| Position held and
length of service | Principal occupations during past five years or longer |
| | President and Chief Executive Officer of Allspring Funds Management, LLC since 2017 and Head of Global Fund Governance of Allspring Global Investments since 2022. Prior thereto, co-president of Galliard Capital Management, LLC, an affiliate of Allspring Funds Management, LLC, from 2019 to 2022 and Head of Affiliated Managers, Allspring Global Investments, from 2014 to 2019 and Executive Vice President responsible for marketing, investments and product development for Allspring Funds Management, LLC, from 2009 to 2014. |
Jeremy DePalma
(Born 1974) | Treasurer,
since 2012
(for certain funds in
the Fund Complex);
since 2021 (for
the remaining funds in the Complex) | Senior Vice President of Allspring Funds Management, LLC since 2009. Senior Vice President of Evergreen Investment Management Company, LLC from 2008 to 2010 and head of the Fund Reporting and Control Team within Fund Administration from 2005 to 2010. |
Christopher Baker
(Born 1976) | Chief Compliance Officer,
since 2022 | Global Chief Compliance Officer for Allspring Global Investments since 2022. Prior thereto, Chief Compliance Officer for State Street Global Advisors from 2018 to 2021. Senior Compliance Officer for the State Street divisions of Alternative Investment Solutions, Sector Solutions, and Global Marketing from 2015 to 2018. From 2010 to 2015 Vice President, Global Head of Investment and Marketing Compliance for State Street Global Advisors. |
Matthew Prasse
(Born 1983) | Chief Legal Officer,
since 2022;
Secretary,
since 2021 | Senior Counsel of the Allspring Legal Department since 2021. Senior Counsel of the Wells Fargo Legal Department from 2018 to 2021. Previously, Counsel for Barings LLC from 2015 to 2018. Prior to joining Barings, Associate at Morgan, Lewis & Bockius LLP from 2008 to 2015. |
1 For those Officers with tenures at Allspring Global Investments and/or Allspring Funds Management, LLC that began prior to 2021, such tenures include years of service during which these businesses/entities were known as Wells Fargo Asset Management and Wells Fargo Funds Management, LLC, respectively.
Allspring Managed Account | 21
For more information
More information about Allspring Funds is available free upon request. To obtain literature, please write, visit the Fund’s website, or call:
Allspring Funds
Attn: Managed Account Services
P.O. Box 1450
Milwaukee, WI 53201
Website: allspringglobal.com
Telephone: 1-888-877-9275
This report and the financial statements contained herein are submitted for the general information of the shareholders of the Fund. If this report is used for promotional purposes, distribution of the report must be accompanied or preceded by a current prospectus. Before investing, please consider the investment objectives, risks, charges, and expenses of the investment. For a current prospectus and, if available, a summary prospectus, containing this information, call 1-888-877-9275 or visit the Fund’s website at allspringglobal.com. Read the prospectus carefully before you invest or send money.
Allspring Global InvestmentsTM is the trade name for the asset management firms of Allspring Global Investments Holdings, LLC, a holding company indirectly owned by certain private funds of GTCR LLC and Reverence Capital Partners, L.P. These firms include but are not limited to Allspring Global Investments, LLC, and Allspring Funds Management, LLC. Certain products managed by Allspring entities are distributed by Allspring Funds Distributor, LLC (a broker-dealer and Member FINRA/SIPC).
This material is for general informational and educational purposes only and is NOT intended to provide investment advice or a recommendation of any kind - including a recommendation for any specific investment, strategy, or plan.
© 2024 Allspring Global Investments Holdings, LLC. All rights reserved.
ALL-05022024-zryovz8m 06-24
SAR4904 04-24
Allspring Emerging Markets Equity Fund
The views expressed and any forward-looking statements are as of April 30, 2024, unless otherwise noted, and are those of the portfolio managers and/or Allspring Global Investments. Discussions of individual securities or the markets generally are not intended as individual recommendations. Future events or results may vary significantly from those expressed in any forward-looking statements. The views expressed are subject to change at any time in response to changing circumstances in the market. Allspring Global Investments disclaims any obligation to publicly update or revise any views expressed or forward-looking statements.
Allspring Emerging Markets Equity Fund | 1
Letter to shareholders (unaudited)
Dear Shareholder:
We are pleased to offer you this semi-annual report for the Allspring Emerging Markets Equity Fund for the six-month period that ended April 30, 2024. Globally, stocks and bonds had strongly positive returns for the period. However, markets were volatile as investors focused on persistently high inflation and the impact of aggressive central bank rate hikes. Riskier assets rallied as investors anticipated an end to the tight monetary policy.
For the period, U.S. stocks, based on the S&P 500 Index,1 returned 20.98%. International stocks, as measured by the MSCI ACWI ex USA Index (Net),2 gained 17.69% while the MSCI EM Index (Net) (USD),3 returned 15.40%. Among bond indexes, the Bloomberg U.S. Aggregate Bond Index4 advanced 4.97%, the Bloomberg Global Aggregate ex-USD Index (unhedged)5 gained 3.92%, the Bloomberg Municipal Bond Index6 returned 7.06%, and the ICE BofA U.S. High Yield Index7 gained 8.94%.
Investors remained focused on central bank monetary policies.
As the six-month period began in November, the market mood brightened as cooling inflation inspired confidence that central banks could hold off on further rate hikes. Overall annual inflation in the U.S. fell to 3.1% in November while 12-month inflation in the U.K. and the eurozone eased to 4.6% and 2.4%, respectively—far below their peak levels of mid-2022. Third quarter annualized U.S. GDP growth was raised to an estimated 5.2% while U.S. job totals rose by close to 200,000 in November, indicating a slight cooling of the labor market. All of this fresh evidence added to confidence for a U.S. soft economic landing, leading to a more buoyant mood heading into winter.
The broad year-end rally among stocks and bonds that began in November continued through December as investors became more confident that monetary policy would ease in 2024. Supporting the bubbly market mood were a series of reports confirming lower inflationary trends in the U.S. and Europe. During the period, it appeared more likely that the U.S. economy could achieve a soft landing, cooling enough to lower inflation without the pain of a recession. However, by year-end, an expectations gap developed. Capital markets priced in a total of 1.50 percentage points in federal funds rate cuts in 2024—twice as much as the three cuts of 0.25% hinted at by Fed officials.
1
The S&P 500 Index consists of 500 stocks chosen for market size, liquidity, and industry group representation. It is a market-value-weighted index with each stock’s weight in the index proportionate to its market value. You cannot invest directly in an index.
2
The Morgan Stanley Capital International (MSCI) All Country World Index (ACWI) ex USA Index (Net) is a free-float-adjusted market-capitalization-weighted index that is designed to measure the equity market performance of developed and emerging markets, excluding the U.S. Source: MSCI. MSCI makes no express or implied warranties or representations and shall have no liability whatsoever with respect to any MSCI data contained herein. The MSCI data may not be further redistributed or used as a basis for other indexes or any securities or financial products. This report is not approved, reviewed, or produced by MSCI. You cannot invest directly in an index.
3
The MSCI Emerging Markets (EM) Index (Net) (USD) is a free-float-adjusted market-capitalization-weighted index that is designed to measure the equity market performance of emerging markets. You cannot invest directly in an index.
4
The Bloomberg U.S. Aggregate Bond Index is a broad-based benchmark that measures the investment-grade, U.S.-dollar-denominated, fixed-rate taxable bond market, including Treasuries, government-related and corporate securities, mortgage-backed securities (agency fixed-rate and hybrid adjustable-rate mortgage pass-throughs), asset-backed securities, and commercial mortgage-backed securities. You cannot invest directly in an index.
5
The Bloomberg Global Aggregate ex-USD Index (unhedged) is an unmanaged index that provides a broad-based measure of the global investment-grade fixed-income markets excluding the U.S.-dollar-denominated debt market. You cannot invest directly in an index.
6
The Bloomberg Municipal Bond Index is an unmanaged index composed of long-term tax-exempt bonds with a minimum credit rating of Baa. You cannot invest directly in an index.
7
The ICE BofA U.S. High Yield Index is a market-capitalization-weighted index of domestic and Yankee high yield bonds. The index tracks the performance of high yield securities traded in the U.S. bond market. Returns shown are net of transaction costs beginning on July 1, 2022. You cannot invest directly in an index. Copyright 2024. ICE Data Indices, LLC. All rights reserved.
2 | Allspring Emerging Markets Equity Fund
Letter to shareholders (unaudited)
Financial market performance was mixed in January 2024 as U.S. stocks had modest gains while non-U.S. equities, particularly those in emerging markets, and fixed income assets were held back by central bank pushback on market optimism over rate cuts. Overall, optimism was supported by hints of a soft landing for the U.S. economy. Key data included a surprisingly strong gain of 353,000 jobs in January, an unemployment rate of just 3.7%, and a rise of just 3.1% in the annual Consumer Price Index1 (CPI) in January. However, that resilience helped tone down expectations of a rate cut in March to a more likely second quarter initial move.
In February, stocks were supported by positive economic data and strong corporate earnings. However, fixed income investments were under pressure as resilient inflation curbed expectations on the timing of interest rate cuts. The S&P 500 Index had solid monthly gains along with emerging market equities, which benefited from a rebound in China.
The first quarter of 2024 closed with ongoing stock market momentum and a more muted sense of confidence in fixed income markets as investors adjusted to the prospect of greater-than-expected economic strength. On the flip side, expectations on the timing of an initial Fed rate cut were pushed back from March to June and then beyond. Additionally, the number of quarter-point rate cuts forecast by the market fell from six as projected in December 2023 to two to three cuts by fiscal period-end.
Markets retreated broadly in April as U.S. annual inflation continued to resist monetary policy efforts and expectations for its downward trajectory, with an April CPI reading of 3.4%. The timing of a Fed initial rate cut came into greater question in April. Not only was there less confidence regarding when a first cut would take place but also whether any rate reductions would occur at all in 2024. Market expectations continued to recede to a possible September Fed first cut. Meanwhile, eurozone annual inflation held steady in April at 2.4%. Developed market stocks and fixed income securities of all types were in the red for April.
Don’t let short-term uncertainty derail long-term investment goals.
Periods of investment uncertainty can present challenges, but experience has taught us that maintaining long-term investment goals can be an effective way to plan for the future. To help you create a sound strategy based on your personal goals and risk tolerance, Allspring Funds offers a wide variety of mutual funds spanning many asset classes and investment styles. Although diversification cannot guarantee an investment profit or prevent losses, we believe it can be an effective way to manage investment risk and potentially smooth out overall portfolio performance. We encourage investors to know their investments and to understand that appropriate levels of risk-taking may unlock opportunities.
Thank you for choosing to invest with Allspring Funds. We appreciate your confidence in us and remain committed to helping you meet your financial needs.
Andrew Owen
President
Allspring Funds
“ The first quarter of 2024 closed with ongoing stock market momentum and a more muted sense of confidence in fixed income markets as investors adjusted to the prospect of greater-than-expected economic strength. ”
For further information about your fund, contact your investment professional, visit our website at allspringglobal.com, or call us directly at 1-800-222-8222.
1
The Consumer Price Index (CPI) is a measure of the average change over time in the prices paid by urban consumers for a market basket of consumer goods and services. You cannot invest directly in an index.
Allspring Emerging Markets Equity Fund | 3
Letter to shareholders (unaudited)
|
Beginning in July 2024, the Fund will be required by the Securities and Exchange Commission to send shareholders a paper copy of a new tailored shareholder report in place of the full shareholder report that you are now receiving. The tailored shareholder report will contain concise information about the Fund, including certain expense and performance information and fund statistics. If you wish to receive this new tailored shareholder report electronically, please follow the instructions on the back cover of this report. |
Other information that is currently included in the shareholder report, such as the Fund’s financial statements, will be available online and upon request, free of charge, in paper or electronic format. |
4 | Allspring Emerging Markets Equity Fund
This page is intentionally left blank.
Performance highlights (unaudited)
Performance highlights
| The Fund seeks long-term capital appreciation. |
| Allspring Funds Management, LLC |
| Allspring Global Investments, LLC |
| Derrick Irwin, CFA, Richard Peck, CFA, Yi (Jerry) Zhang, Ph.D., CFA |
Average annual total returns (%) as of April 30, 2024 |
| | | | |
| | | | | | | | | |
| | | | | | | | | |
| | | | | | | | | |
| | | | | | | | | |
Administrator Class (EMGYX) | | | | | | | | | |
Institutional Class (EMGNX) | | | | | | | | | |
MSCI ACWI ex USA Index (Net)3 | | | | | | | | | |
MSCI Emerging Markets Index (Net) (USD)4 | | | | | | | | | |
Figures quoted represent past performance, which is no guarantee of future results, and do not reflect taxes that a shareholder may pay on an investment in a fund. Investment return and principal value of an investment will fluctuate so that an investor’s shares, when redeemed, may be worth more or less than their original cost. Performance shown without sales charges would be lower if sales charges were reflected. Current performance may be lower or higher than the performance data quoted, which assumes the reinvestment of dividends and capital gains. Current month-end performance is available on the Fund’s website, allspringglobal.com.
Index returns do not include transaction costs associated with buying and selling securities, any mutual fund fees or expenses, or any taxes. It is not possible to invest directly in an index.
For Class A shares, the maximum front-end sales charge is 5.75%. For Class C shares, the maximum contingent deferred sales charge is 1.00%. Performance including a contingent deferred sales charge assumes the sales charge for the corresponding time period. Class R6, Administrator Class and Institutional Class shares are sold without a front-end sales charge or contingent deferred sales charge.
|
| Reflects the expense ratios as stated in the most recent prospectuses. The expense ratios shown are subject to change and may differ from the annualized expense ratios shown in the Financial Highlights of this report. |
| The manager has contractually committed through February 28, 2025, to waive fees and/or reimburse expenses to the extent necessary to cap total annual fund operating expenses after fee waivers at 1.43% for Class A, 2.18% for Class C, 1.01% for Class R6, 1.36% for Administrator Class and 1.11% for Institutional Class. Brokerage commissions, stamp duty fees, interest, taxes, acquired fund fees and expenses (if any), and extraordinary expenses are excluded from the expense caps. Prior to or after the commitment expiration date, the caps may be increased or the commitment to maintain the caps may be terminated only with the approval of the Board of Trustees. Without these caps, the Fund’s returns would have been lower. The expense ratio paid by an investor is the net expense ratio (the total annual fund operating expenses after fee waivers) as stated in the prospectuses. |
| The Morgan Stanley Capital International (MSCI) All Country World Index (ACWI) ex USA Index (Net) is a free-float-adjusted market-capitalization-weighted index that is designed to measure the equity market performance of developed and emerging markets, excluding the U.S. Source: MSCI. MSCI makes no express or implied warranties or representations and shall have no liability whatsoever with respect to any MSCI data contained herein. The MSCI data may not be further redistributed or used as a basis for other indexes or any securities or financial products. This report is not approved, reviewed, or produced by MSCI. You cannot invest directly in an index. |
| MSCI Emerging Markets (EM) Index (Net) (USD) is a free-float-adjusted market-capitalization-weighted index that is designed to measure the equity market performance of emerging markets. You cannot invest directly in an index. |
Investing involves risk, including the possible loss of principal. Stock values fluctuate in response to the activities of individual companies and general market and economic conditions. Foreign investments are especially volatile and can rise or fall dramatically due to differences in the political and economic conditions of the host country. These risks are generally intensified in emerging markets. Consult the Fund’s prospectus for additional information on these and other risks.
CFA® and Chartered Financial Analyst® are trademarks owned by CFA Institute. |
6 | Allspring Emerging Markets Equity Fund
Performance highlights (unaudited)
Ten largest holdings (%) as of April 30, 20241 |
Samsung Electronics Co. Ltd. | |
Taiwan Semiconductor Manufacturing Co. Ltd. ADR | |
| |
Taiwan Semiconductor Manufacturing Co. Ltd. | |
Reliance Industries Ltd. GDR | |
Fomento Economico Mexicano SAB de CV ADR | |
| |
| |
| |
| |
| Figures represent the percentage of the Fund’s net assets. Holdings are subject to change and may have changed since the date specified. |
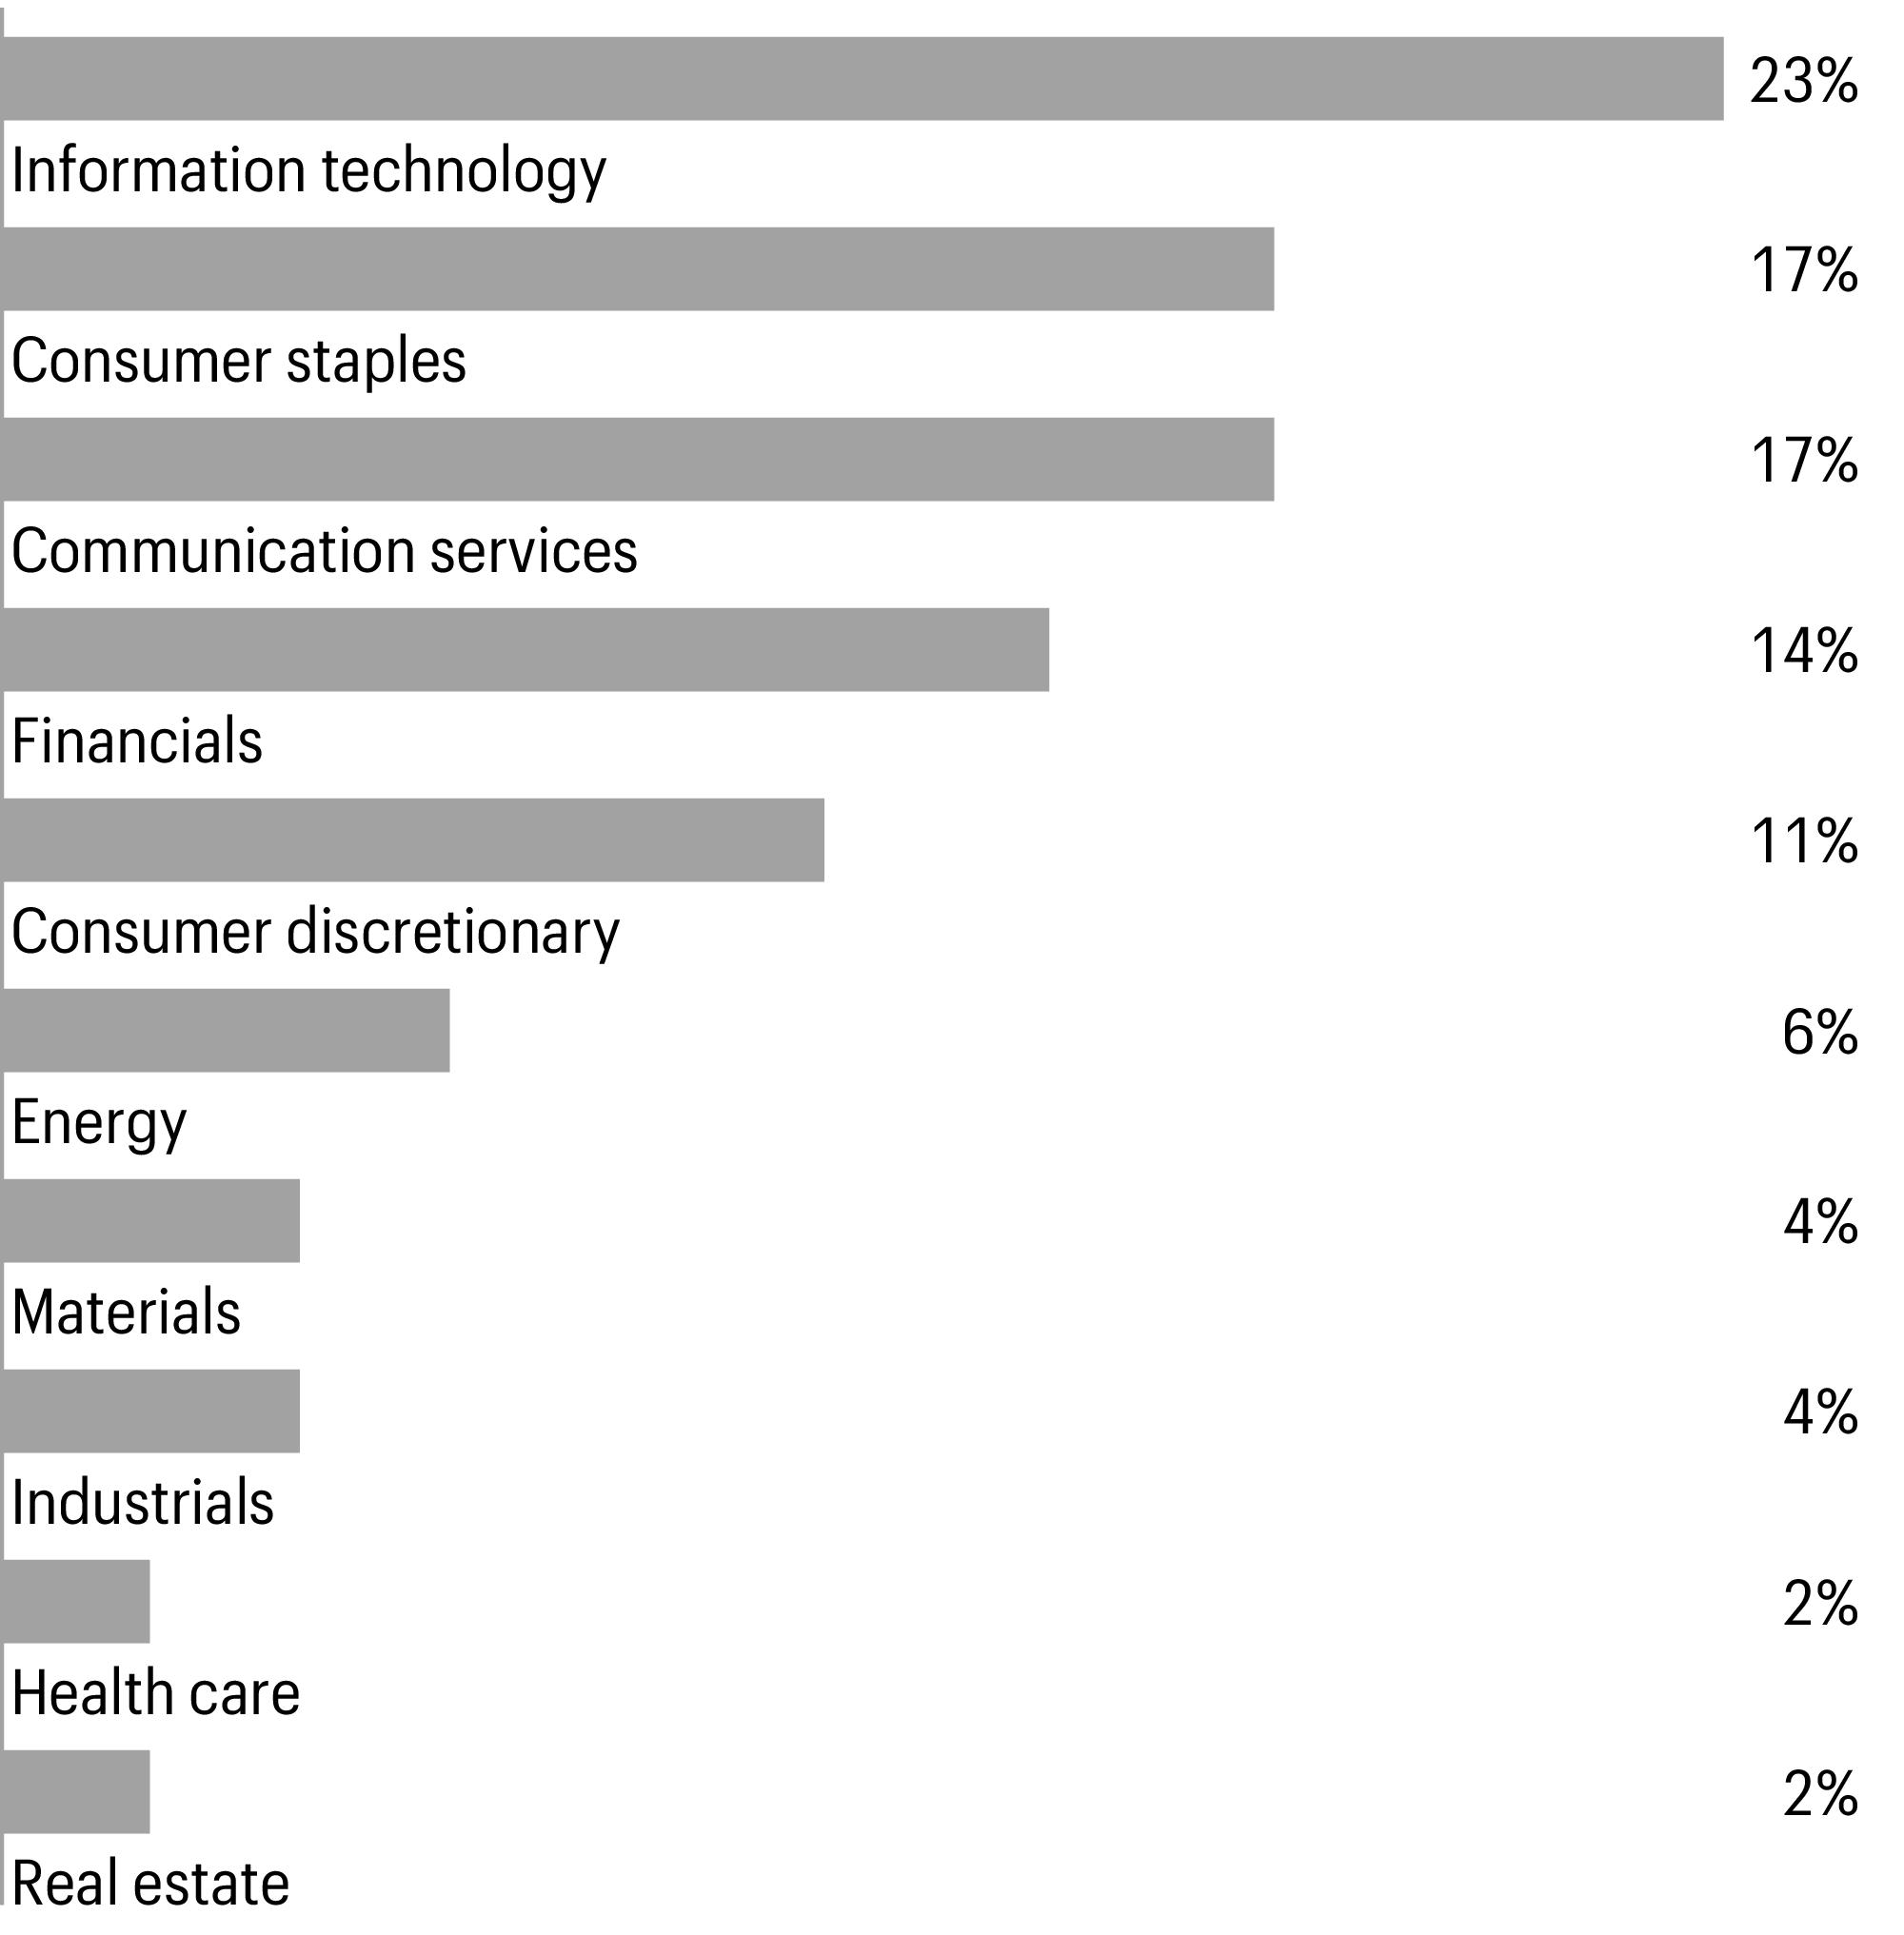
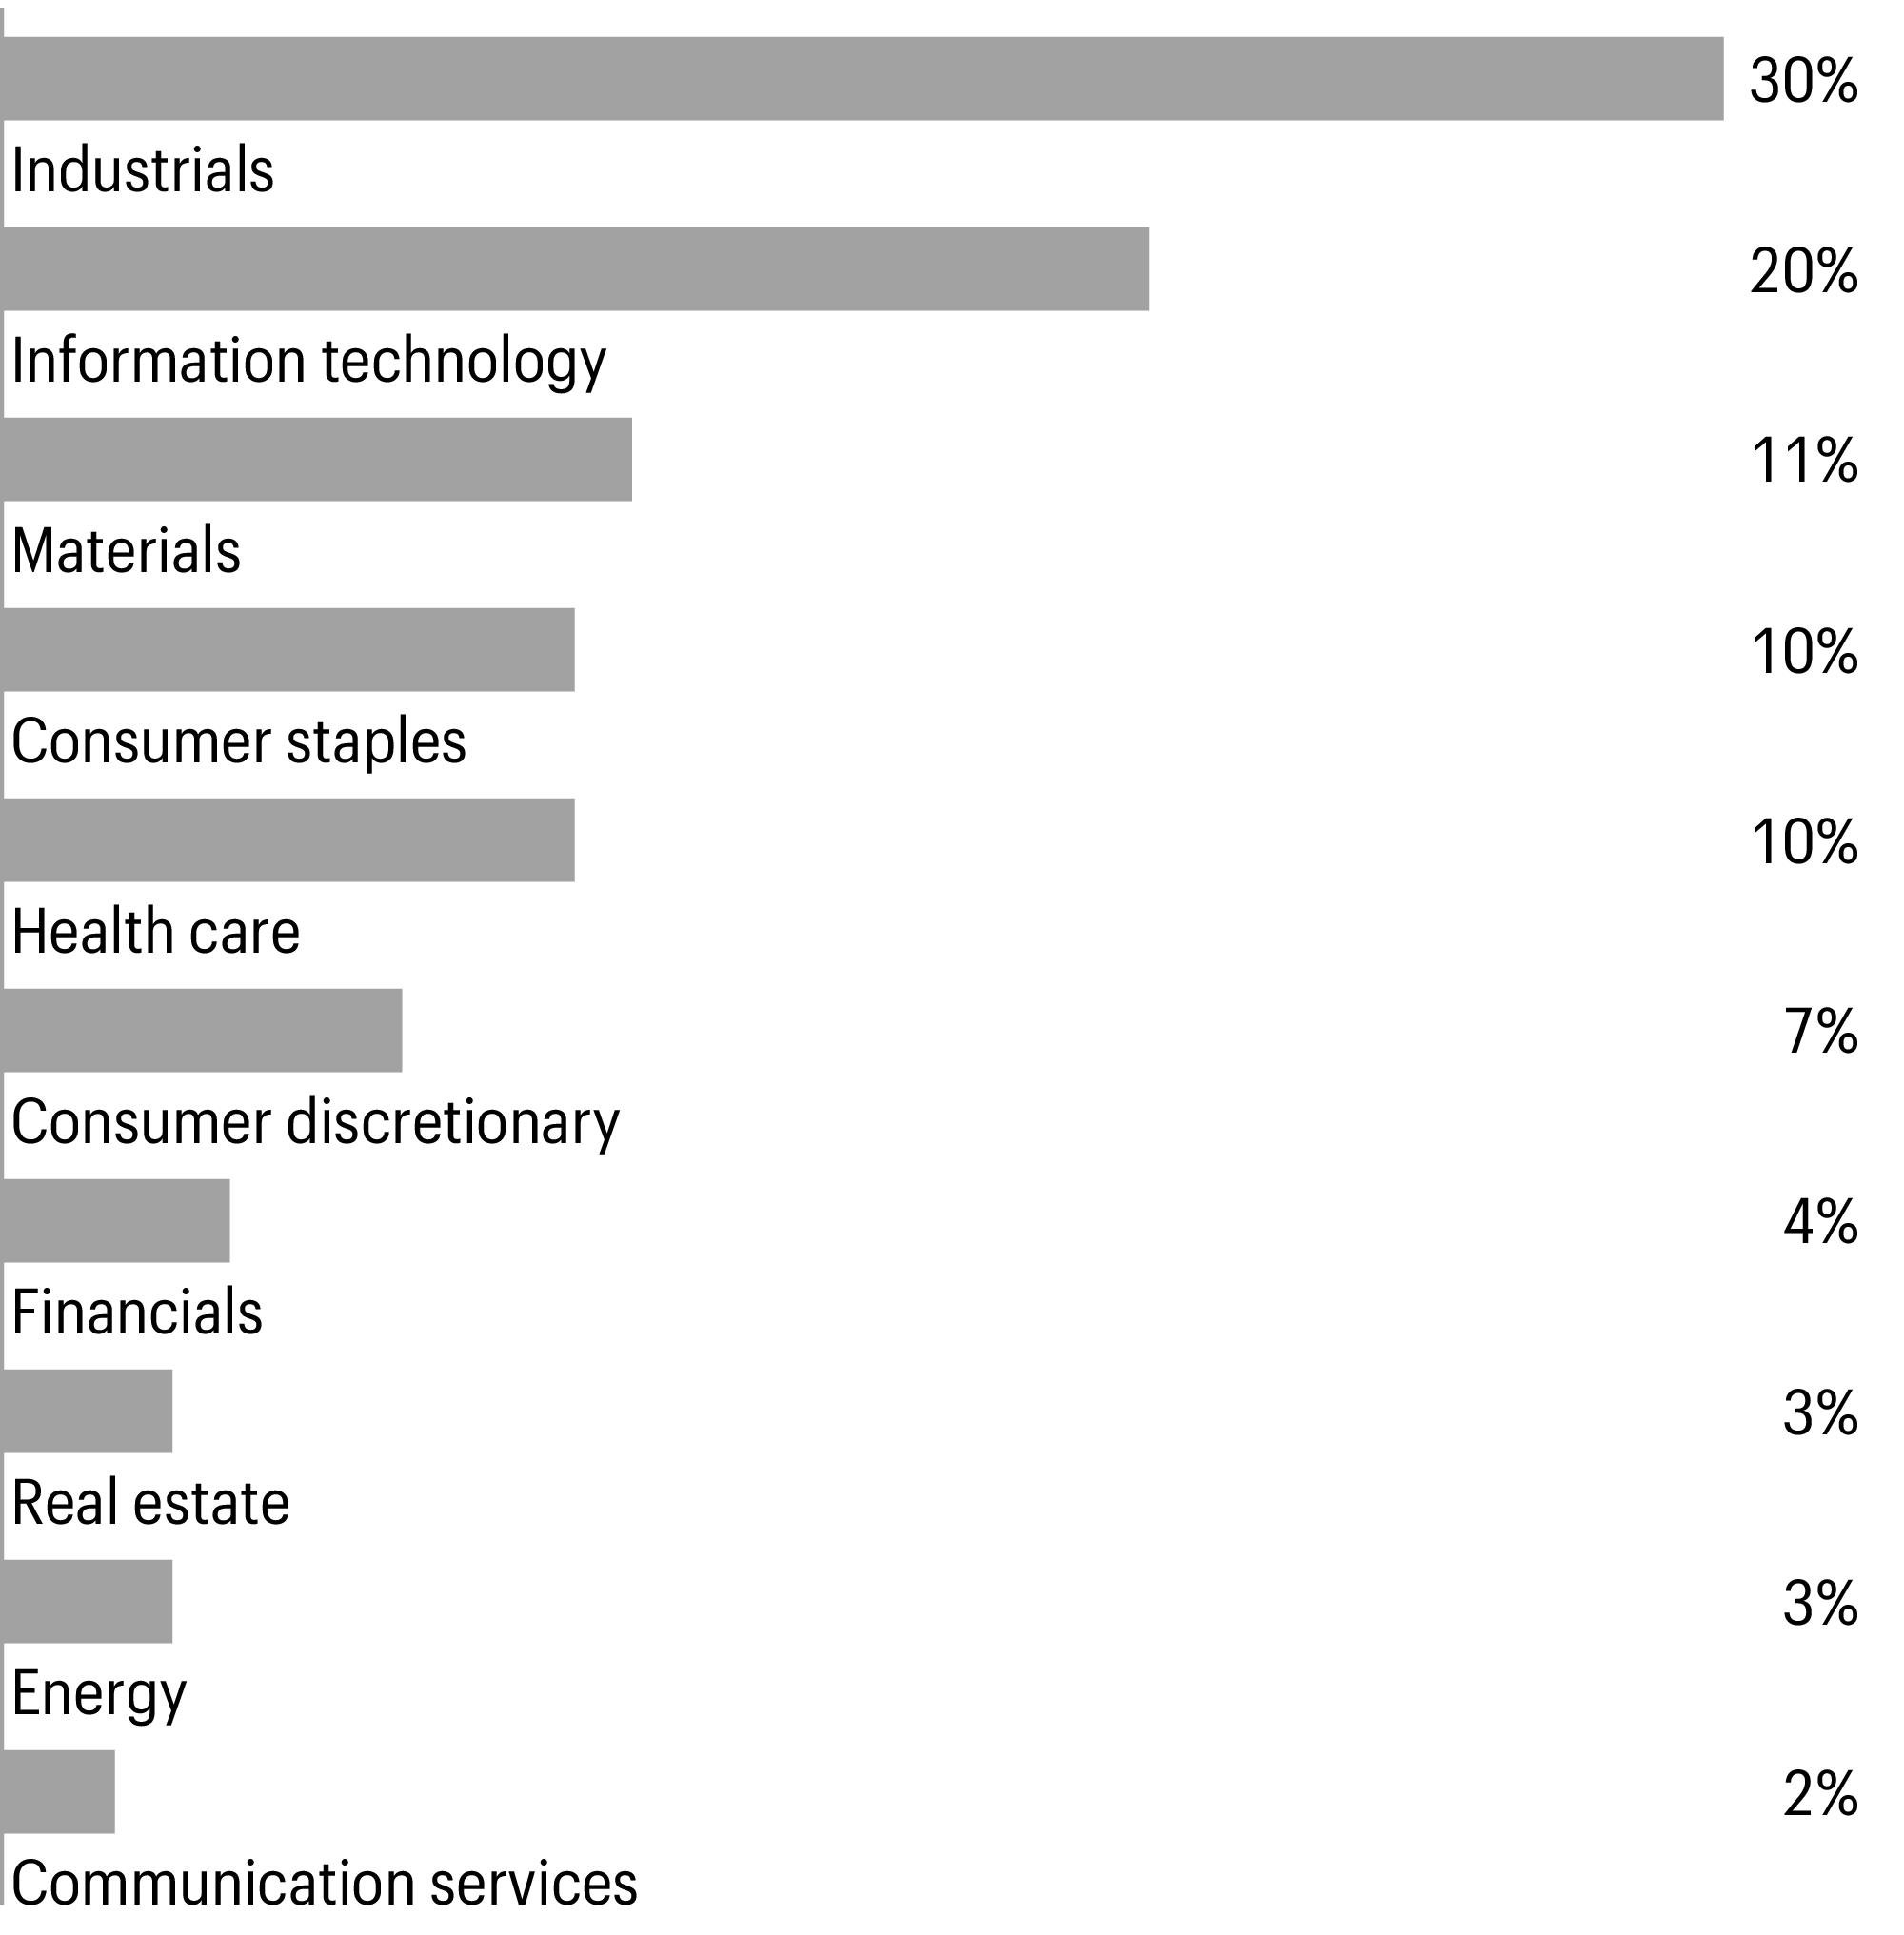
Sector allocation as of April 30, 20241 |
| Figures represent the percentage of the Fund’s long-term investments. Allocations are subject to change and may have changed since the date specified. |
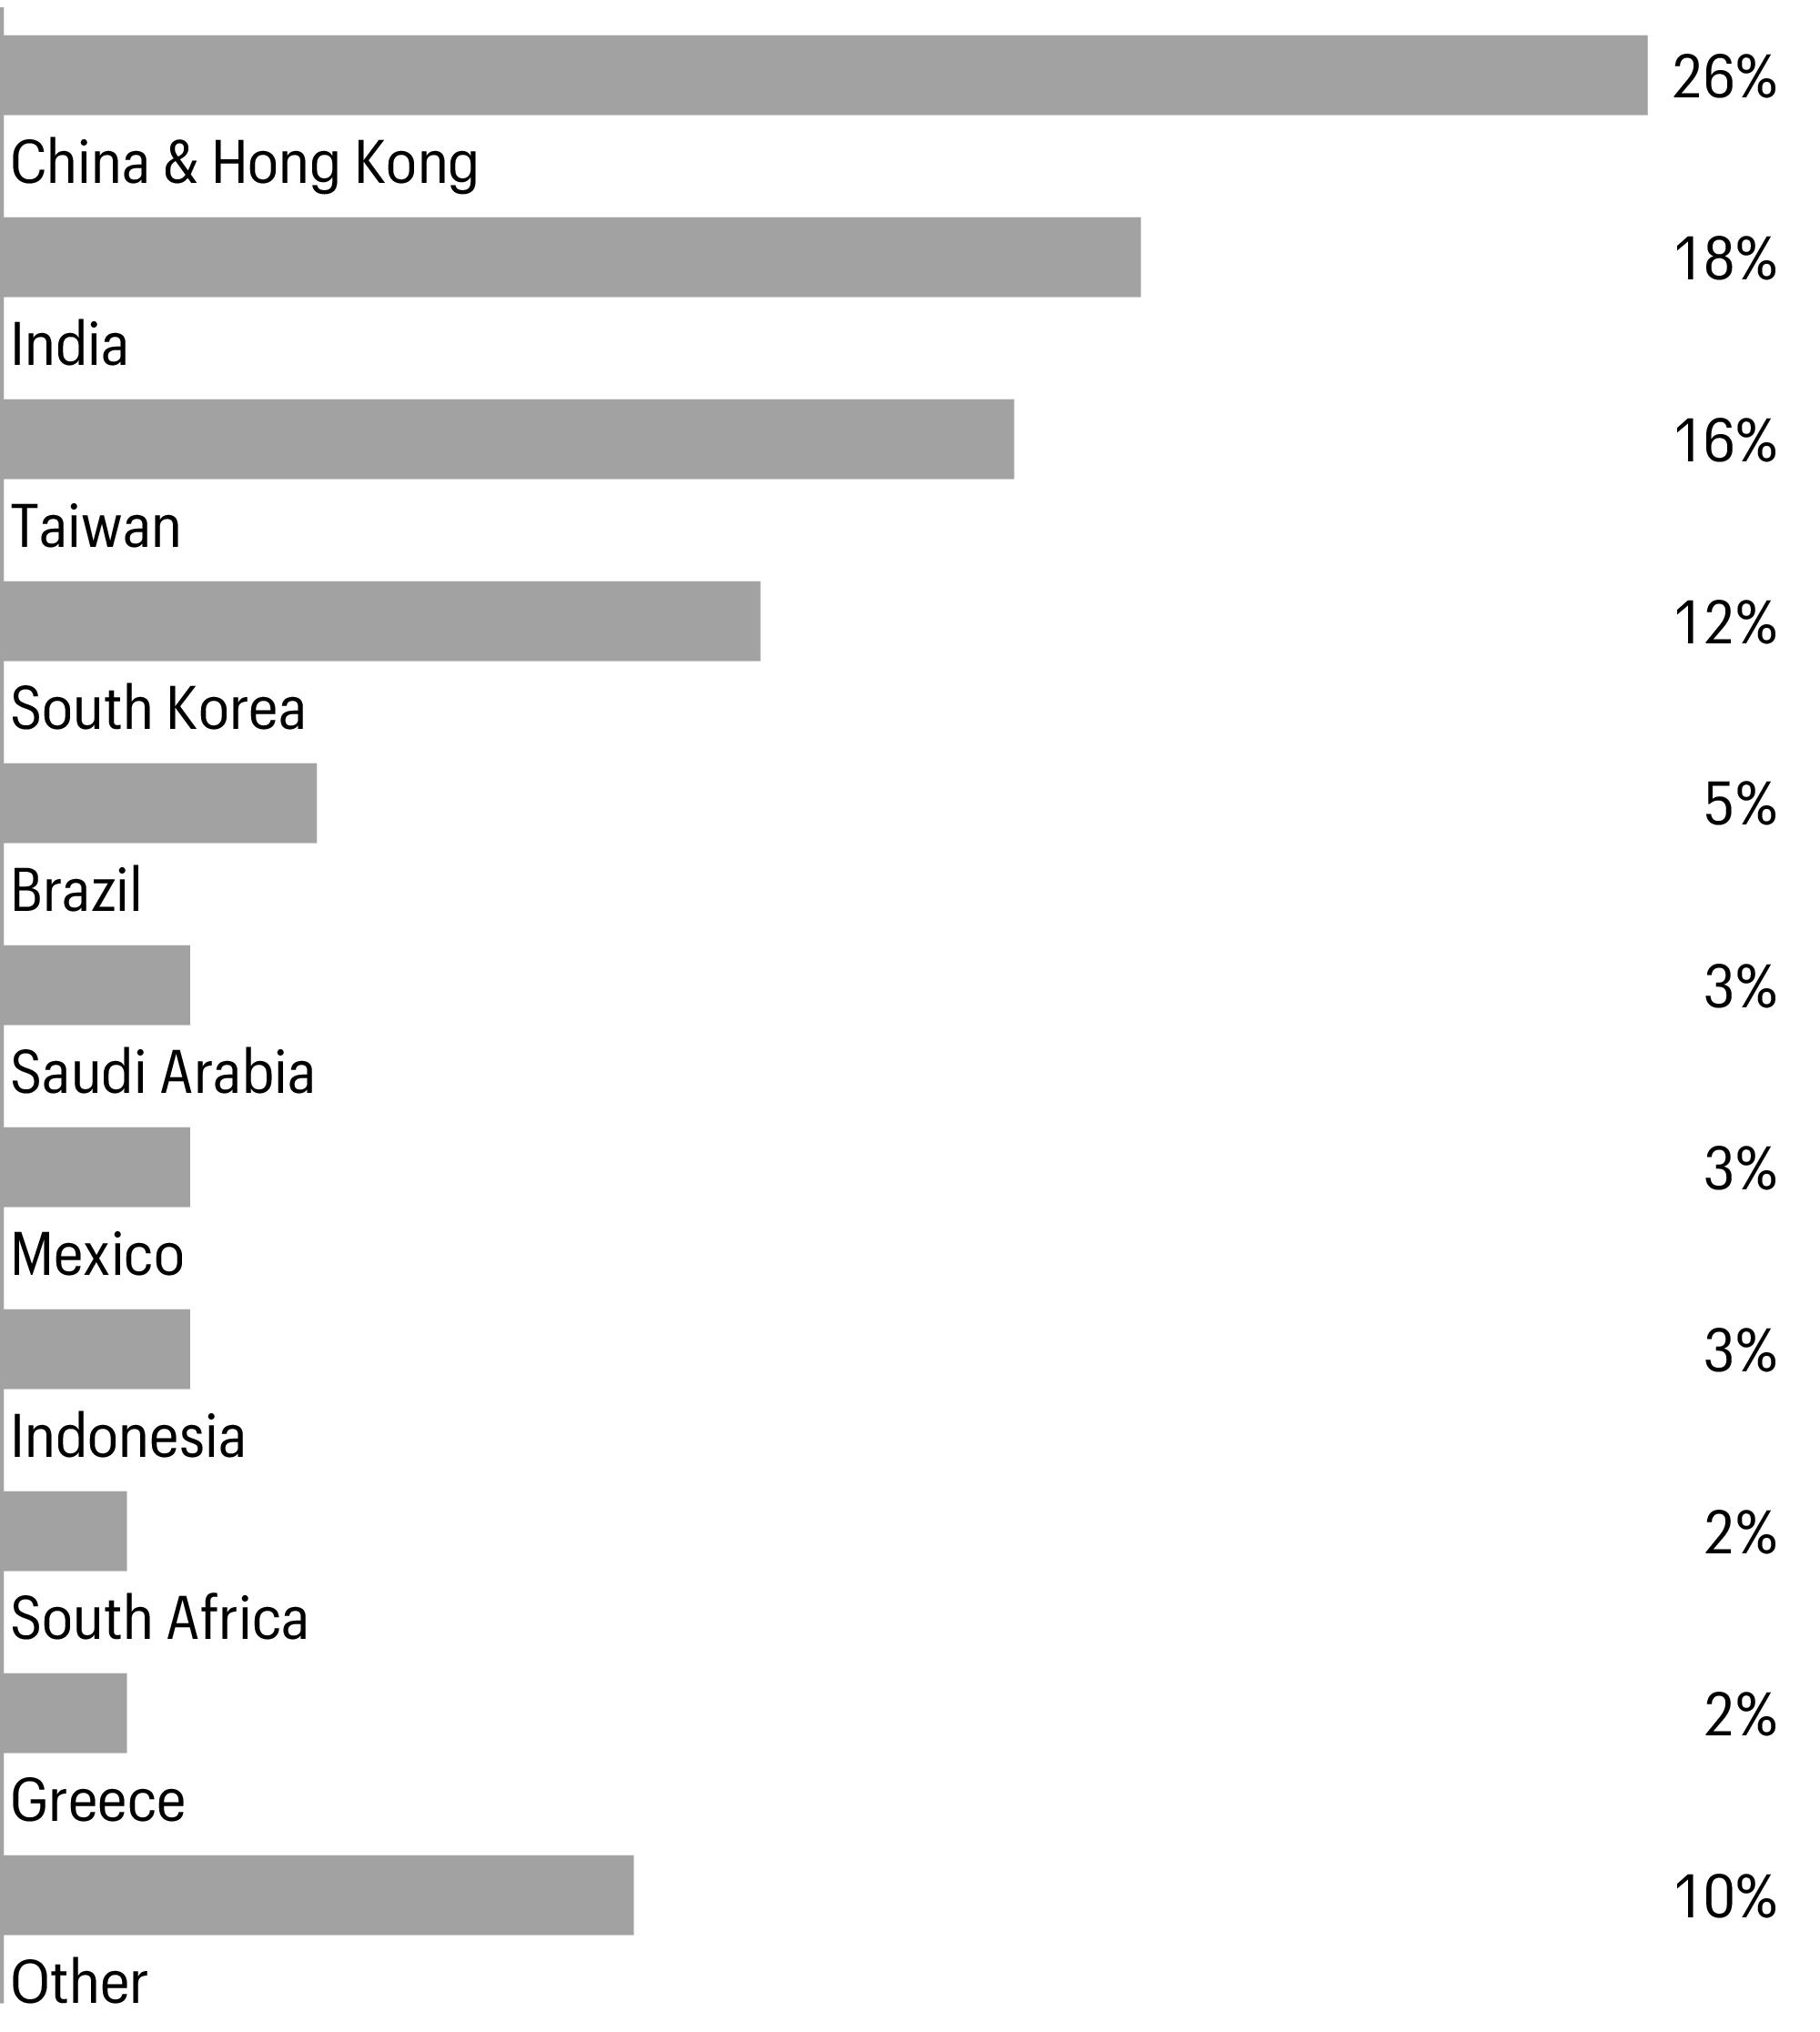
Country allocation as of April 30, 20241 |
| Figures represent the percentage of the Fund’s long-term investments. Allocations are subject to change and may have changed since the date specified. |
Allspring Emerging Markets Equity Fund | 7
Fund expenses (unaudited)
Fund expenses
As a shareholder of the Fund, you incur two types of costs: (1) transaction costs, including sales charges (loads) on purchase payments and contingent deferred sales charges (if any) on redemptions and (2) ongoing costs, including management fees, distribution (12b-1) and/or shareholder servicing fees, and other Fund expenses. This example is intended to help you understand your ongoing costs (in dollars) of investing in the Fund and to compare these costs with the ongoing costs of investing in other mutual funds.
The example is based on an investment of $1,000 invested at the beginning of the six-month period and held for the entire period from November 1, 2023 to April 30, 2024.
The “Actual” line of the table below provides information about actual account values and actual expenses. You may use the information in this line, together with the amount you invested, to estimate the expenses that you paid over the period. Simply divide your account value by $1,000 (for example, an $8,600 account value divided by $1,000= 8.6), then multiply the result by the number in the “Actual” line under the heading entitled “Expenses paid during period” for your applicable class of shares to estimate the expenses you paid on your account during this period.
Hypothetical example for comparison purposes
The “Hypothetical” line of the table below provides information about hypothetical account values and hypothetical expenses based on the Fund’s actual expense ratio and an assumed rate of return of 5% per year before expenses, which is not the Fund’s actual return. The hypothetical account values and expenses may not be used to estimate the actual ending account balance or expenses you paid for the period. You may use this information to compare the ongoing costs of investing in the Fund and other funds. To do so, compare this 5% hypothetical example with the 5% hypothetical examples that appear in the shareholder reports of the other funds.
Please note that the expenses shown in the table are meant to highlight your ongoing costs only and do not reflect any transactional costs, such as sales charges (loads) and contingent deferred sales charges. Therefore, the “Hypothetical” line of the table is useful in comparing ongoing costs only, and will not help you determine the relative total costs of owning different funds. In addition, if these transactional costs were included, your costs would have been higher.
| Beginning
account value
11-1-2023 | Ending
account value
4-30-2024 | | Annualized net
expense ratio |
| | | | |
| | | | |
Hypothetical (5% return before expenses) | | | | |
| | | | |
| | | | |
Hypothetical (5% return before expenses) | | | | |
| | | | |
| | | | |
Hypothetical (5% return before expenses) | | | | |
| | | | |
| | | | |
Hypothetical (5% return before expenses) | | | | |
| | | | |
| | | | |
Hypothetical (5% return before expenses) | | | | |
| Expenses paid is equal to the annualized net expense ratio of each class multiplied by the average account value over the period, multiplied by 182 divided by 366 (to reflect the one-half-year period). |
8 | Allspring Emerging Markets Equity Fund
Portfolio of investments—April 30, 2024 (unaudited)
| | | | | |
| | | | | | |
| | | | | | |
Atacadao SA (Consumer staples, Consumer staples distribution & retail) | | | | | | |
B3 SA - Brasil Bolsa Balcao (Financials, Capital markets) | | | | | | |
Banco Bradesco SA ADR (Financials, Banks) | | | | | | |
Cia Brasileira de Aluminio (Materials, Metals & mining) | | | | | | |
Diagnosticos da America SA (Health care, Health care providers & services)† | | | | | | |
Hapvida Participacoes e Investimentos SA (Health care, Health care providers & services)144A† | | | | | | |
Lojas Renner SA (Consumer discretionary, Specialty retail) | | | | | | |
Magazine Luiza SA (Consumer discretionary, Broadline retail)† | | | | | | |
Multiplan Empreendimentos Imobiliarios SA (Real estate, Real estate management & development) | | | | | | |
Petroleo Brasileiro SA ADR (Energy, Oil, gas & consumable fuels) | | | | | | |
Raia Drogasil SA (Consumer staples, Consumer staples distribution & retail) | | | | | | |
Suzano SA (Materials, Paper & forest products) | | | | | | |
Vale SA ADR (Materials, Metals & mining) | | | | | | |
| | | | | | |
| | | | | | |
Banco Santander Chile ADR (Financials, Banks) | | | | | | |
Falabella SA (Consumer discretionary, Broadline retail)† | | | | | | |
Sociedad Quimica y Minera de Chile SA ADR (Industrials, Electrical equipment) | | | | | | |
| | | | | | |
| | | | | | |
Agora, Inc. ADR (Information technology, Software)† | | | | | | |
Alibaba Group Holding Ltd. (Consumer discretionary, Broadline retail) | | | | | | |
Alibaba Group Holding Ltd. ADR (Consumer discretionary, Broadline retail) | | | | | | |
Bilibili, Inc. ADR (Communication services, Entertainment)† | | | | | | |
China Literature Ltd. (Communication services, Media)144A† | | | | | | |
China Meidong Auto Holdings Ltd. (Consumer discretionary, Specialty retail) | | | | | | |
FinVolution Group ADR (Financials, Consumer finance) | | | | | | |
GreenTree Hospitality Group Ltd. ADR (Consumer discretionary, Hotels, restaurants & leisure)† | | | | | | |
Hua Medicine (Health care, Pharmaceuticals)144A† | | | | | | |
Kingdee International Software Group Co. Ltd. (Information technology, Software)† | | | | | | |
Li Ning Co. Ltd. (Consumer discretionary, Textiles, apparel & luxury goods) | | | | | | |
Meituan Class B (Consumer discretionary, Hotels, restaurants & leisure)144A† | | | | | | |
The accompanying notes are an integral part of these financial statements.
Allspring Emerging Markets Equity Fund | 9
Portfolio of investments—April 30, 2024 (unaudited)
| | | | | |
| | | | | | |
Shandong Weigao Group Medical Polymer Co. Ltd. Class H (Health care, Health care equipment & supplies) | | | | | | |
Tencent Holdings Ltd. (Communication services, Interactive media & services) | | | | | | |
Tencent Music Entertainment Group ADR (Communication services, Entertainment)† | | | | | | |
Tongdao Liepin Group (Communication services, Interactive media & services)† | | | | | | |
Trip.com Group Ltd. ADR (Consumer discretionary, Hotels, restaurants & leisure)† | | | | | | |
Tsingtao Brewery Co. Ltd. Class H (Consumer staples, Beverages) | | | | | | |
Vipshop Holdings Ltd. ADR (Consumer discretionary, Broadline retail) | | | | | | |
Want Want China Holdings Ltd. (Consumer staples, Food products) | | | | | | |
Weibo Corp. ADR (Communication services, Interactive media & services) | | | | | | |
Wuxi Biologics Cayman, Inc. (Health care, Life sciences tools & services)144A† | | | | | | |
Xiaomi Corp. Class B (Information technology, Technology hardware, storage & peripherals)144A† | | | | | | |
Zepp Health Corp. ADR (Information technology, Electronic equipment, instruments & components)♠† | | | | | | |
Zhou Hei Ya International Holdings Co. Ltd. (Consumer staples, Food products)144A | | | | | | |
| | | | | | |
| | | | | | |
Bancolombia SA ADR (Financials, Banks) | | | | | | |
| | | | | | |
AIA Group Ltd. (Financials, Insurance) | | | | | | |
Johnson Electric Holdings Ltd. (Consumer discretionary, Automobile components) | | | | | | |
Sun Art Retail Group Ltd. (Consumer staples, Consumer staples distribution & retail) | | | | | | |
WH Group Ltd. (Consumer staples, Food products)144A | | | | | | |
| | | | | | |
| | | | | | |
Axis Bank Ltd. (Financials, Banks) | | | | | | |
Bajaj Finance Ltd. (Financials, Consumer finance) | | | | | | |
Bharti Airtel Ltd. (Communication services, Wireless telecommunication services) | | | | | | |
Bharti Airtel Ltd. (Partly Paid) (Communication services, Wireless telecommunication services) | | | | | | |
Dalmia Bharat Ltd. (Materials, Construction materials) | | | | | | |
Fortis Healthcare Ltd. (Health care, Health care providers & services) | | | | | | |
HDFC Bank Ltd. (Financials, Banks) | | | | | | |
The accompanying notes are an integral part of these financial statements.
10 | Allspring Emerging Markets Equity Fund
Portfolio of investments—April 30, 2024 (unaudited)
| | | | | |
| | | | | | |
HDFC Bank Ltd. ADR (Financials, Banks) | | | | | | |
IDFC First Bank Ltd. (Financials, Banks)† | | | | | | |
ITC Ltd. (Consumer staples, Tobacco) | | | | | | |
Kotak Mahindra Bank Ltd. (Financials, Banks) | | | | | | |
Reliance Industries Ltd. (Energy, Oil, gas & consumable fuels) | | | | | | |
Reliance Industries Ltd. GDR (Energy, Oil, gas & consumable fuels)144A | | | | | | |
SBI Life Insurance Co. Ltd. (Financials, Insurance)144A | | | | | | |
UltraTech Cement Ltd. (Materials, Construction materials) | | | | | | |
| | | | | | |
| | | | | | |
Astra International Tbk. PT (Industrials, Industrial conglomerates) | | | | | | |
Bank Central Asia Tbk. PT (Financials, Banks) | | | | | | |
Bank Rakyat Indonesia Persero Tbk. PT (Financials, Banks) | | | | | | |
Telkom Indonesia Persero Tbk. PT (Communication services, Diversified telecommunication services) | | | | | | |
Telkom Indonesia Persero Tbk. PT ADR (Communication services, Diversified telecommunication services) | | | | | | |
| | | | | | |
| | | | | | |
Allegro.eu SA (Consumer discretionary, Broadline retail)144A† | | | | | | |
InPost SA (Industrials, Air freight & logistics)† | | | | | | |
| | | | | | |
| | | | | | |
America Movil SAB de CV ADR (Communication services, Wireless telecommunication services) | | | | | | |
Becle SAB de CV (Consumer staples, Beverages) | | | | | | |
Cemex SAB de CV ADR (Materials, Construction materials)† | | | | | | |
Fibra Uno Administracion SA de CV (Real estate, Diversified REITs) | | | | | | |
Fomento Economico Mexicano SAB de CV ADR (Consumer staples, Beverages) | | | | | | |
Grupo Financiero Banorte SAB de CV Class O (Financials, Banks) | | | | | | |
Wal-Mart de Mexico SAB de CV (Consumer staples, Consumer staples distribution & retail) | | | | | | |
| | | | | | |
| | | | | | |
Ayala Corp. (Industrials, Industrial conglomerates) | | | | | | |
San Miguel Food & Beverage, Inc. (Consumer staples, Food products) | | | | | | |
SM Investments Corp. (Industrials, Industrial conglomerates) | | | | | | |
| | | | | | |
| | | | | | |
LUKOIL PJSC (Acquired 4-9-2002, cost $16,145,227) (Energy, Oil, gas & consumable fuels)♦‡†˃ | | | | | | |
The accompanying notes are an integral part of these financial statements.
Allspring Emerging Markets Equity Fund | 11
Portfolio of investments—April 30, 2024 (unaudited)
| | | | | |
| | | | | | |
Ozon Holdings PLC ADR (Acquired 11-24-2020, cost $2,412,000) (Consumer discretionary, Broadline retail)♦‡†˃ | | | | | | |
Sberbank of Russia PJSC (Acquired 8-18-2011, cost $17,232,150) (Financials, Banks)♦†˃ | | | | | | |
| | | | | | |
| | | | | | |
Grab Holdings Ltd. Class A (Industrials, Ground transportation)† | | | | | | |
Sea Ltd. ADR (Communication services, Entertainment)† | | | | | | |
| | | | | | |
| | | | | | |
MTN Group Ltd. (Communication services, Wireless telecommunication services) | | | | | | |
Shoprite Holdings Ltd. (Consumer staples, Consumer staples distribution & retail) | | | | | | |
Standard Bank Group Ltd. (Financials, Banks) | | | | | | |
Tiger Brands Ltd. (Consumer staples, Food products) | | | | | | |
| | | | | | |
| | | | | | |
KT Corp. (Communication services, Diversified telecommunication services) | | | | | | |
KT Corp. ADR (Communication services, Diversified telecommunication services) | | | | | | |
KT&G Corp. (Consumer staples, Tobacco) | | | | | | |
LG Chem Ltd. (Materials, Chemicals) | | | | | | |
NAVER Corp. (Communication services, Interactive media & services) | | | | | | |
Samsung Electronics Co. Ltd. (Information technology, Technology hardware, storage & peripherals) | | | | | | |
Samsung Life Insurance Co. Ltd. (Financials, Insurance) | | | | | | |
Samsung SDI Co. Ltd. (Information technology, Electronic equipment, instruments & components) | | | | | | |
SK Hynix, Inc. (Information technology, Semiconductors & semiconductor equipment) | | | | | | |
SK Telecom Co. Ltd. (Communication services, Wireless telecommunication services) | | | | | | |
SK Telecom Co. Ltd. ADR (Communication services, Wireless telecommunication services) | | | | | | |
| | | | | | |
| | | | | | |
104 Corp. (Industrials, Professional services) | | | | | | |
Delta Electronics, Inc. (Information technology, Electronic equipment, instruments & components) | | | | | | |
MediaTek, Inc. (Information technology, Semiconductors & semiconductor equipment) | | | | | | |
President Chain Store Corp. (Consumer staples, Consumer staples distribution & retail) | | | | | | |
The accompanying notes are an integral part of these financial statements.
12 | Allspring Emerging Markets Equity Fund
Portfolio of investments—April 30, 2024 (unaudited)
| | | | | |
| | | | | | |
Taiwan Semiconductor Manufacturing Co. Ltd. (Information technology, Semiconductors & semiconductor equipment) | | | | | | |
Taiwan Semiconductor Manufacturing Co. Ltd. ADR (Information technology, Semiconductors & semiconductor equipment) | | | | | | |
Uni-President Enterprises Corp. (Consumer staples, Food products) | | | | | | |
| | | | | | |
| | | | | | |
PTT Exploration & Production PCL (Energy, Oil, gas & consumable fuels) | | | | | | |
PTT PCL (Energy, Oil, gas & consumable fuels) | | | | | | |
SCB X PCL (Financials, Banks) | | | | | | |
Thai Beverage PCL (Consumer staples, Beverages) | | | | | | |
| | | | | | |
| | | | | | |
MercadoLibre, Inc. (Consumer discretionary, Broadline retail)† | | | | | | |
Southern Copper Corp. (Materials, Metals & mining) | | | | | | |
| | | | | | |
Total common stocks (Cost $3,062,344,300) | | | | | | |
| | | | | |
Convertible debentures: 0.00% | | | | | | |
| | | | | | |
Lupatech SA Series 1 (Energy, Oil & gas services)♦† | | | | | | |
Total convertible debentures (Cost $160,691) | | | | | | |
| | | | | |
| | | | | | |
| | | | | | |
Petroleo Brasileiro SA (Energy, Oil, gas & consumable fuels) | | | | | | |
Total preferred stocks (Cost $7,897,430) | | | | | | |
| | | | | |
| | | | | | |
| | | | | | |
Diagnosticos da America SA (Health care, Health care providers & services)♦† | | | | | | |
| | | | | | |
The accompanying notes are an integral part of these financial statements.
Allspring Emerging Markets Equity Fund | 13
Portfolio of investments—April 30, 2024 (unaudited)
| | | | | |
Short-term investments: 3.52% | | | | | | |
Investment companies: 3.52% | | | | | | |
Allspring Government Money Market Fund Select Class♠∞ | | | | | | |
Total short-term investments (Cost $141,390,238) | | | | | | |
Total investments in securities (Cost $3,211,792,659) | | | | | | |
Other assets and liabilities, net | | | | | | |
| | | | | | |
| Non-income-earning security |
| The security may be resold in transactions exempt from registration, normally to qualified institutional buyers, pursuant to Rule 144A under the Securities Act of 1933. |
| The issuer of the security is an affiliated person of the Fund as defined in the Investment Company Act of 1940. |
| The security is fair valued in accordance with procedures approved by the Board of Trustees. |
| Security is valued using significant unobservable inputs. |
| Restricted security as to resale, excluding Rule 144A securities. The Fund held restricted securities with an aggregate current value of $5,886,971 (original an aggregate cost of $35,789,377), representing 0.15% of its net assets as of period end. |
| The rate represents the 7-day annualized yield at period end. |
|
| American depositary receipt |
| Global depositary receipt |
| Real estate investment trust |
Investments in affiliates
An affiliated investment is an investment in which the Fund owns at least 5% of the outstanding voting shares of the issuer or as a result of other relationships, such as the Fund and the issuer having the same investment manager. Transactions with issuers that were affiliates of the Fund at the end of the period were as follows:
| | | | | Net
change in
unrealized
gains
(losses) | | | Income
from
affiliated
securities |
| | | | | | | | |
| | | | | | | | |
| | | | | | | | |
Allspring Government Money Market Fund Select Class | | | | | | | | |
| | | | | | | | |
| Non-income-earning security |
The accompanying notes are an integral part of these financial statements.
14 | Allspring Emerging Markets Equity Fund
Statement of assets and liabilities—April 30, 2024 (unaudited)
Financial statements
Statement of assets and liabilities
| |
Investments in unaffiliated securities, at value (cost $3,045,383,508) | |
Investments in affiliated securities, at value (cost $166,409,151) | |
| |
Cash collateral for securities on loan | |
Foreign currency, at value (cost $12,797,367) | |
| |
Receivable for Fund shares sold | |
Receivable for investments sold | |
Prepaid expenses and other assets | |
| |
| |
| |
Payable for investments purchased | |
Payable for Fund shares redeemed | |
| |
Payable upon receipt of securities loaned | |
Administration fees payable | |
| |
Accrued expenses and other liabilities | |
| |
| |
| |
| |
Total distributable earnings | |
| |
The accompanying notes are an integral part of these financial statements.
Allspring Emerging Markets Equity Fund | 15
Statement of assets and liabilities—April 30, 2024 (unaudited)
Statement of assets and liabilities
Computation of net asset value and offering price per share | |
| |
Shares outstanding–Class A1 | |
Net asset value per share–Class A | |
Maximum offering price per share – Class A2 | |
| |
Shares outstanding–Class C1 | |
Net asset value per share–Class C | |
| |
Shares outstanding–Class R61 | |
Net asset value per share–Class R6 | |
Net assets–Administrator Class | |
Shares outstanding–Administrator Class1 | |
Net asset value per share–Administrator Class | |
Net assets–Institutional Class | |
Shares outstanding–Institutional Class1 | |
Net asset value per share–Institutional Class | |
1 The Fund has an unlimited number of authorized shares.
2 Maximum offering price is computed as 100/94.25 of net asset value. On investments of $50,000 or more, the offering price is reduced.
The accompanying notes are an integral part of these financial statements.
16 | Allspring Emerging Markets Equity Fund
Statement of operations—six months ended April 30, 2024 (unaudited)
Statement of operations
| |
Dividends (net of foreign withholdings taxes of $5,981,117) | |
Income from affiliated securities | |
Interest (net of foreign withholding taxes of $40) | |
| |
| |
| |
| |
| |
| |
| |
| |
| |
Shareholder servicing fees | |
| |
| |
| |
| |
| |
Custody and accounting fees | |
| |
| |
Shareholder report expenses | |
Trustees’ fees and expenses | |
| |
| |
Less: Fee waivers and/or expense reimbursements | |
| |
| |
| |
| |
| |
| |
| |
The accompanying notes are an integral part of these financial statements.
Allspring Emerging Markets Equity Fund | 17
Statement of operations—six months ended April 30, 2024 (unaudited)
Statement of operations
Realized and unrealized gains (losses) on investments | |
Net realized gains (losses) on | |
| |
Foreign currency and foreign currency translations | |
Forward foreign currency contracts | |
Net realized gains on investments | |
Net change in unrealized gains (losses) on | |
Unaffiliated securities (net of deferred foreign capital gains tax of $4,180,089) | |
| |
Foreign currency and foreign currency translations | |
Net change in unrealized gains (losses) on investments | |
Net realized and unrealized gains (losses) on investments | |
Net increase in net assets resulting from operations | |
The accompanying notes are an integral part of these financial statements.
18 | Allspring Emerging Markets Equity Fund
Statement of changes in net assets
Statement of changes in net assets
|
Six months ended
April 30, 2024 (unaudited) | Year ended October 31, 2023 |
| | | | |
| | | | |
Net realized gains (losses) on investments | | | | |
Net change in unrealized gains (losses) on investments | | | | |
Net increase in net assets resulting from operations | | | | |
Distributions to shareholders from | | | | |
Net investment income and net realized gains | | | | |
| | | | |
| | | | |
| | | | |
| | | | |
Total distributions to shareholders | | | | |
Capital share transactions | | | | |
Proceeds from shares sold | | | | |
| | | | |
| | | | |
| | | | |
| | | | |
| | | | |
| | | | |
Reinvestment of distributions | | | | |
| | | | |
| | | | |
| | | | |
| | | | |
| | | | |
Payment for shares redeemed | | | | |
| | | | |
| | | | |
| | | | |
| | | | |
| | | | |
| | | | |
Net increase (decrease) in net assets resulting from capital share transactions | | | | |
Total increase in net assets | | | | |
| | | | |
| | | | |
| | | | |
The accompanying notes are an integral part of these financial statements.
Allspring Emerging Markets Equity Fund | 19
Financial highlights
(For a share outstanding throughout each period)
| Six months ended
April 30, 2024
(unaudited) | |
| | | | | |
Net asset value, beginning of period | | | | | | |
Net investment income (loss) | | | | | | |
| | | | | | |
Net realized and unrealized gains (losses) on investments | | | | | | |
Total from investment operations | | | | | | |
Distributions to shareholders from | | | | | | |
| | | | | | |
Net asset value, end of period | | | | | | |
| | | | | | |
Ratios to average net assets (annualized) | | | | | | |
| | | | | | |
| | | | | | |
Net investment income (loss) | | | | | | |
| | | | | | |
| | | | | | |
Net assets, end of period (000s omitted) | | | | | | |
| Calculated based upon average shares outstanding |
| Amount is less than $0.005. |
| Total return calculations do not include any sales charges. Returns for periods of less than one year are not annualized. |
| During the year ended October 31, 2020, the Fund received a payment from an affiliate that had an impact of less than 0.005% on total return. |
The accompanying notes are an integral part of these financial statements.
20 | Allspring Emerging Markets Equity Fund
(For a share outstanding throughout each period)
| Six months ended
April 30, 2024
(unaudited) | |
| | | | | |
Net asset value, beginning of period | | | | | | |
Net investment income (loss) | | | | | | |
| | | | | | |
Net realized and unrealized gains (losses) on investments | | | | | | |
Total from investment operations | | | | | | |
Net asset value, end of period | | | | | | |
| | | | | | |
Ratios to average net assets (annualized) | | | | | | |
| | | | | | |
| | | | | | |
Net investment income (loss) | | | | | | |
| | | | | | |
| | | | | | |
Net assets, end of period (000s omitted) | | | | | | |
| Calculated based upon average shares outstanding |
| Total return calculations do not include any sales charges. Returns for periods of less than one year are not annualized. |
| During the year ended October 31, 2020, the Fund received a payment from an affiliate which had a 0.18% impact on the total return. |
The accompanying notes are an integral part of these financial statements.
Allspring Emerging Markets Equity Fund | 21
(For a share outstanding throughout each period)
| Six months ended
April 30, 2024
(unaudited) | |
| | | | | |
Net asset value, beginning of period | | | | | | |
| | | | | | |
Net realized and unrealized gains (losses) on investments | | | | | | |
Total from investment operations | | | | | | |
Distributions to shareholders from | | | | | | |
| | | | | | |
Net asset value, end of period | | | | | | |
| | | | | | |
Ratios to average net assets (annualized) | | | | | | |
| | | | | | |
| | | | | | |
| | | | | | |
| | | | | | |
| | | | | | |
Net assets, end of period (000s omitted) | | | | | | |
| Calculated based upon average shares outstanding |
| Returns for periods of less than one year are not annualized. |
The accompanying notes are an integral part of these financial statements.
22 | Allspring Emerging Markets Equity Fund
(For a share outstanding throughout each period)
| Six months ended
April 30, 2024
(unaudited) | |
| | | | | |
Net asset value, beginning of period | | | | | | |
Net investment income (loss) | | | | | | |
| | | | | | |
Net realized and unrealized gains (losses) on investments | | | | | | |
Total from investment operations | | | | | | |
Distributions to shareholders from | | | | | | |
| | | | | | |
Net asset value, end of period | | | | | | |
| | | | | | |
Ratios to average net assets (annualized) | | | | | | |
| | | | | | |
| | | | | | |
Net investment income (loss) | | | | | | |
| | | | | | |
| | | | | | |
Net assets, end of period (000s omitted) | | | | | | |
| Calculated based upon average shares outstanding |
| Returns for periods of less than one year are not annualized. |
| During the year ended October 31, 2022, the Fund received payments from a service provider which had a 0.04% impact on the total return. |
| During the year ended October 31, 2020, the Fund received a payment from an affiliate which had a 1.16% impact on the total return. |
The accompanying notes are an integral part of these financial statements.
Allspring Emerging Markets Equity Fund | 23
(For a share outstanding throughout each period)
| Six months ended
April 30, 2024
(unaudited) | |
| | | | | |
Net asset value, beginning of period | | | | | | |
| | | | | | |
Net realized and unrealized gains (losses) on investments | | | | | | |
Total from investment operations | | | | | | |
Distributions to shareholders from | | | | | | |
| | | | | | |
Net asset value, end of period | | | | | | |
| | | | | | |
Ratios to average net assets (annualized) | | | | | | |
| | | | | | |
| | | | | | |
| | | | | | |
| | | | | | |
| | | | | | |
Net assets, end of period (000s omitted) | | | | | | |
| Calculated based upon average shares outstanding |
| Returns for periods of less than one year are not annualized. |
The accompanying notes are an integral part of these financial statements.
24 | Allspring Emerging Markets Equity Fund
Notes to financial statements (unaudited)
Notes to financial statements
Allspring Funds Trust (the “Trust”), a Delaware statutory trust organized on March 10, 1999, is an open-end management investment company registered under the Investment Company Act of 1940, as amended (the “1940 Act”). As an investment company, the Trust follows the accounting and reporting guidance in Financial Accounting Standards Board (“FASB”) Accounting Standards Codification Topic 946, Financial Services – Investment Companies. These financial statements report on the Allspring Emerging Markets Equity Fund (the “Fund”) which is a diversified series of the Trust.
2.
SIGNIFICANT ACCOUNTING POLICIES
The following significant accounting policies, which are consistently followed in the preparation of the financial statements of the Fund, are in conformity with U.S. generally accepted accounting principles which require management to make estimates and assumptions that affect the reported amounts of assets and liabilities, disclosure of contingent assets and liabilities at the date of the financial statements, and the reported amounts of income and expenses during the reporting period. Actual results could differ from those estimates.
All investments are valued each business day as of the close of regular trading on the New York Stock Exchange (generally 4 p.m. Eastern Time), although the Fund may deviate from this calculation time under unusual or unexpected circumstances.
Equity securities and exchange-traded funds that are listed on a foreign or domestic exchange or market are valued at the official closing price or, if none, the last sales price.
The values of securities denominated in foreign currencies are translated into U.S. dollars at rates provided by an independent foreign currency pricing source at a time each business day specified by the Valuation Committee at Allspring Funds Management, LLC (“Allspring Funds Management”).
Many securities markets and exchanges outside the U.S. close prior to the close of the New York Stock Exchange and therefore may not fully reflect trading or events that occur after the close of the principal exchange in which the foreign securities are traded, but before the close of the New York Stock Exchange. If such trading or events are expected to materially affect the value of such securities, then fair value pricing procedures implemented by Allspring Funds Management are applied. These procedures take into account multiple factors including movements in U.S. securities markets after foreign exchanges close. Foreign securities that are fair valued under these procedures are categorized as Level 2 and the application of these procedures may result in transfers between Level 1 and Level 2. Depending on market activity, such fair valuations may be frequent. Such fair value pricing may result in net asset values that are higher or lower than net asset values based on the last reported sales price or latest quoted bid price. On April 30, 2024, such fair value pricing was used in pricing certain foreign securities.
Debt securities are valued at the evaluated bid price provided by an independent pricing service (e.g., taking into account various factors, including yields, maturities, or credit ratings) or, if a reliable price is not available, the quoted bid price from an independent broker-dealer.
Forward foreign currency contracts are recorded at the forward rate provided by an independent foreign currency pricing source at a time each business day specified by the Valuation Committee at Allspring Funds Management.
Investments in registered open-end investment companies (other than those listed on a foreign or domestic exchange or market) are valued at net asset value.
Investments which are not valued using the methods discussed above are valued at their fair value, as determined in good faith by Allspring Funds Management, which was named the valuation designee by the Board of Trustees. As the valuation designee, Allspring Funds Management is responsible for day-to-day valuation activities for the Allspring Funds. In connection with these responsibilities, Allspring Funds Management has established a Valuation Committee and has delegated to it the authority to take any actions regarding the valuation of portfolio securities that the Valuation Committee deems necessary or appropriate, including determining the fair value of portfolio securities. On a quarterly basis, the Board of Trustees receives reports of valuation actions taken by the Valuation Committee. On at least an annual basis, the Board of Trustees receives an assessment of the adequacy and effectiveness of Allspring Funds Management’s process for determining the fair value of the portfolio of investments.
Foreign currency translation
The accounting records of the Fund are maintained in U.S. dollars. The values of other assets and liabilities denominated in foreign currencies are translated into U.S. dollars at rates provided by an independent foreign currency pricing source at a time each business day specified by the Valuation Committee. Purchases and sales of securities, and income and expenses are converted at the rate of exchange on the respective dates of such transactions. Net realized foreign exchange gains or losses arise from sales of foreign currencies, currency gains or losses realized between the trade and settlement dates on securities transactions, and the difference between the amounts of dividends, interest and foreign withholding taxes recorded and the U.S. dollar equivalent of the amounts actually paid or received. Net unrealized foreign exchange gains and losses arise from changes in the fair value of assets and liabilities other than investments in securities resulting from changes in exchange rates. The changes in net assets arising from changes in exchange rates of securities and the changes in net assets resulting from changes in market prices of securities are not separately presented. Such changes are included in net realized and unrealized gains or losses from investments.
Allspring Emerging Markets Equity Fund | 25
Notes to financial statements (unaudited)
Securities lending
The Fund, along with other Allspring funds, participated through March 29, 2023, the termination date, in a securities lending program (the “Program”) for Allspring funds. The Fund received cash collateral in connection with its securities lending transactions, which collateral was invested in Securities Lending Cash Investments, LLC, an affiliated non-registered investment company, which was liquidated upon termination of the Program. Effective at the close of business on March 29, 2023, the Fund has one unsettled loan which is fully collateralized by cash and will continue to hold the cash collateral until the security is returned to the Fund.
Income earned from investment in the Securities Lending Fund (net of fees and rebates), if any, is included in income from affiliated securities on the Statement of Operations.
Forward foreign currency contracts
A forward foreign currency contract is an agreement between two parties to purchase or sell a specific currency for an agreed-upon price at a future date. The Fund enters into forward foreign currency contracts to facilitate transactions in foreign-denominated securities and to attempt to minimize the risk to the Fund from adverse changes in the relationship between currencies. Forward foreign currency contracts are recorded at the forward rate and marked-to-market daily. When the contracts are closed, realized gains and losses arising from such transactions are recorded as realized gains or losses on forward foreign currency contracts. The Fund is subject to foreign currency risk and may be exposed to risks if the counterparties to the contracts are unable to meet the terms of their contracts or if the value of the foreign currency changes unfavorably. The Fund’s maximum risk of loss from counterparty credit risk is the unrealized gains on the contracts. This risk may be mitigated if there is a master netting arrangement between the Fund and the counterparty.
Security transactions and income recognition
Securities transactions are recorded on a trade date basis. Realized gains or losses are recorded on the basis of identified cost.
Dividend income is recognized on the ex-dividend date, except for certain dividends from foreign securities, which are recorded as soon as the custodian verifies the ex-dividend date.
Interest income is accrued daily and bond discounts are accreted and premiums are amortized daily. To the extent debt obligations are placed on non-accrual status, any related interest income may be reduced by writing off interest receivables when the collection of all or a portion of interest has been determined to be doubtful based on consistently applied procedures and the fair value has decreased. If the issuer subsequently resumes interest payments or when the collectability of interest is reasonably assured, the debt obligation is removed from non-accrual status.
Interest earned on cash balances held at the custodian is recorded as interest income.
Income is recorded net of foreign taxes withheld where recovery of such taxes is not assured.
Distributions received from REIT investments may be characterized as ordinary income, capital gains, or a return of capital to the Fund based on information provided by the REIT. The proper characterization of REIT distributions is generally not known until after the end of each calendar year. As such, estimates may be used in reporting the character of income and distributions for financial statement purposes.
Distributions to shareholders
Distributions to shareholders from net investment income and any net realized gains are recorded on the ex-dividend date and paid at least annually. Such distributions are determined in accordance with income tax regulations and may differ from U.S. generally accepted accounting principles. Dividend sources are estimated at the time of declaration. The tax character of distributions is determined as of the Fund’s fiscal year end. Therefore, a portion of the Fund’s distributions made prior to the Fund’s fiscal year end may be categorized as a tax return of capital at year end.
The Fund intends to continue to qualify as a regulated investment company by distributing substantially all of its investment company taxable income and any net realized capital gains (after reduction for capital loss carryforwards) sufficient to relieve it from all, or substantially all, federal income taxes. Accordingly, no provision for federal income taxes was required.
The Fund’s income and federal excise tax returns and all financial records supporting those returns for the prior three fiscal years are subject to examination by the federal and Delaware revenue authorities. Management has analyzed the Fund’s tax positions taken on federal, state, and foreign tax returns, as applicable, for all open tax years and does not believe that there are any uncertain tax positions that require recognition of a tax liability.
As of April 30, 2024, the aggregate cost of all investments for federal income tax purposes was $3,274,511,814 and the unrealized gains (losses) consisted of:
26 | Allspring Emerging Markets Equity Fund
Notes to financial statements (unaudited)
As of October 31, 2023, the Fund had capital loss carryforwards which consisted of $80,519,140 in short-term capital losses and $367,349,127 in long-term capital losses.
The separate classes of shares offered by the Fund differ principally in applicable sales charges, distribution, shareholder servicing, and administration fees. Class specific expenses are charged directly to that share class. Investment income, common fund-level expenses, and realized and unrealized gains (losses) on investments are allocated daily to each class of shares based on the relative proportion of net assets of each class.
3.
FAIR VALUATION MEASUREMENTS
Fair value measurements of investments are determined within a framework that has established a fair value hierarchy based upon the various data inputs utilized in determining the value of the Fund’s investments. The three-level hierarchy gives the highest priority to unadjusted quoted prices in active markets for identical assets or liabilities (Level 1) and the lowest priority to unobservable inputs (Level 3). The Fund’s investments are classified within the fair value hierarchy based on the lowest level of input that is significant to the fair value measurement. The inputs are summarized into three broad levels as follows:
•Level 1—quoted prices in active markets for identical securities
•Level 2—other significant observable inputs (including quoted prices for similar securities, interest rates, prepayment speeds, credit risk, etc.)
•Level 3—significant unobservable inputs (including the Fund’s own assumptions in determining the fair value of investments)
The inputs or methodologies used for valuing investments in securities are not necessarily an indication of the risk associated with investing in those securities.
The following is a summary of the inputs used in valuing the Fund’s assets and liabilities as of April 30, 2024:
| | Other significant
observable inputs
(Level 2) | Significant
unobservable inputs
(Level 3) | |
| | | | |
| | | | |
| | | | |
| | | | |
| | | | |
| | | | |
| | | | |
| | | | |
| | | | |
| | | | |
| | | | |
| | | | |
| | | | |
| | | | |
| | | | |
| | | | |
| | | | |
| | | | |
| | | | |
| | | | |
| | | | |
| | | | |
| | | | |
| | | | |
| | | | |
| | | | |
| | | | |
| | | | |
Additional sector, industry or geographic detail, if any, is included in the Portfolio of Investments.
At April 30, 2024, the Fund had no material transfers into/out of Level 3.
Allspring Emerging Markets Equity Fund | 27
Notes to financial statements (unaudited)
4.
TRANSACTIONS WITH AFFILIATES
Allspring Funds Management, a wholly owned subsidiary of Allspring Global Investments Holdings, LLC, a holding company indirectly owned by certain private funds of GTCR LLC and Reverence Capital Partners, L.P., is the manager of the Fund and provides advisory and fund-level administrative services under an investment management agreement. Under the investment management agreement, Allspring Funds Management is responsible for, among other services, implementing the investment objectives and strategies of the Fund, supervising the subadviser and providing fund-level administrative services in connection with the Fund’s operations. As compensation for its services under the investment management agreement, Allspring Funds Management is entitled to receive a management fee at the following annual rate based on the Fund’s average daily net assets:
For the six months ended April 30, 2024, the management fee was equivalent to an annual rate of 1.02% of the Fund’s average daily net assets.
Allspring Funds Management has retained the services of a subadviser to provide daily portfolio management to the Fund. The fee for subadvisory services is borne by Allspring Funds Management. Allspring Global Investments, LLC, an affiliate of Allspring Funds Management and a wholly owned subsidiary of Allspring Global Investments Holdings, LLC, is the subadviser to the Fund and is entitled to receive a fee from Allspring Funds Management at an annual rate starting at 0.65% and declining to 0.45% as the average daily net assets of the Fund increase.
Under a class-level administration agreement, Allspring Funds Management provides class-level administrative services to the Fund, which includes paying fees and expenses for services provided by the transfer agent, sub-transfer agents, omnibus account servicers and record-keepers. As compensation for its services under the class-level administration agreement, Allspring Funds Management receives an annual fee which is calculated based on the average daily net assets of each class as follows:
| Class-level
administration fee |
| |
| |
| |
| |
| |
Waivers and/or expense reimbursements
Allspring Funds Management has contractually committed to waive and/or reimburse management and administration fees to the extent necessary to maintain certain net operating expense ratios for the Fund. When each class of the Fund has exceeded its expense cap, Allspring Funds Management will waive fees and/or reimburse expenses from fund-level expenses on a proportionate basis and then from class specific expenses. When only certain classes exceed their expense caps, waivers and/or reimbursements are applied against class specific expenses before fund-level expenses. Allspring Funds Management has contractually committed through February 28, 2025 to waive fees and/or reimburse expenses to the extent necessary to cap the Fund’s expenses. Prior to or after the commitment expiration date, the cap may be increased or the commitment to maintain the cap may be terminated only with the approval of the Board of Trustees. As of April 30, 2024, the contractual caps are as follows:
28 | Allspring Emerging Markets Equity Fund
Notes to financial statements (unaudited)
Distribution fee
The Trust has adopted a distribution plan for Class C shares pursuant to Rule 12b-1 under the 1940 Act. A distribution fee is charged to Class C shares and paid to Allspring Funds Distributor, LLC (“Allspring Funds Distributor”), the principal underwriter, an affiliate of Allspring Funds Management, at an annual rate up to 0.75% of the average daily net assets of Class C shares.
In addition, Allspring Funds Distributor is entitled to receive the front-end sales charge from the purchase of Class A shares and a contingent deferred sales charge on the redemption of certain Class A shares. Allspring Funds Distributor is also entitled to receive the contingent deferred sales charges from redemptions of Class C shares. For the six months ended April 30, 2024, Allspring Funds Distributor received $878 from the sale of Class A shares. No contingent deferred sales charges were incurred by Class A and Class C shares for the six months ended April 30, 2024.
Shareholder servicing fees
The Trust has entered into contracts with one or more shareholder servicing agents, whereby Class A, Class C and Administrator Class are charged a fee at an annual rate up to 0.25% of the average daily net assets of each respective class. A portion of these total shareholder servicing fees were paid to affiliates of the Fund.
The Fund may purchase or sell portfolio investment securities to certain affiliates pursuant to Rule 17a-7 under the 1940 Act and under procedures adopted by the Board of Trustees. The procedures have been designed to ensure that these interfund transactions, which do not incur broker commissions, are effected at current market prices. Pursuant to these procedures, the Fund did not have any interfund transactions during the six months ended April 30, 2024.
5.
INVESTMENT PORTFOLIO TRANSACTIONS
Purchases and sales of investments, excluding U.S. government obligations (if any) and short-term securities, for the six months ended April 30, 2024 were $229,053,270 and $246,924,590, respectively.
The Trust (excluding the money market funds), Allspring Master Trust and Allspring Variable Trust are parties to a $350,000,000 revolving credit agreement whereby the Fund is permitted to use bank borrowings for temporary or emergency purposes, such as to fund shareholder redemption requests. Interest under the credit agreement is charged to the Fund based on a borrowing rate equal to the higher of the Federal Funds rate or the overnight bank funding rate in effect on that day plus a spread. In addition, an annual commitment fee based on the unused balance is allocated to each participating fund.
For the six months ended April 30, 2024, there were no borrowings by the Fund under the agreement.
Russia launched a large-scale invasion of Ukraine on February 24, 2022. As a result of this military action, the United States and many other countries have instituted various economic sanctions against Russian and Belarus individuals and entities. The situation has led to increased financial market volatility and could have severe adverse effects on regional and global economic markets, including the markets for certain securities and commodities, such as oil and natural gas. The extent and duration of the military action, resulting sanctions imposed, other punitive action taken and the resulting market disruptions cannot be easily predicted. As of April 30, 2024, the Fund held 0.15% of its total net assets in Russian securities with unrealized losses in the amount of $29,902,406.
Under the Fund’s organizational documents, the officers and Trustees have been granted certain indemnification rights against certain liabilities that may arise out of performance of their duties to the Fund. The Fund has entered into a separate agreement with each Trustee that converts indemnification rights currently existing under the Fund’s organizational documents into contractual rights that cannot be changed in the future without the consent of the Trustee. Additionally, in the normal course of business, the Fund may enter into contracts with service providers that contain a variety of indemnification clauses. The Fund’s maximum exposure under these arrangements is dependent on future claims that may be made against the Fund and, therefore, cannot be estimated.
Allspring Emerging Markets Equity Fund | 29
Other information (unaudited)
Other information
A description of the policies and procedures used to determine how to vote proxies relating to portfolio securities is available without charge, upon request, by calling 1-866-259-3305, visiting our website at allspringglobal.com, or visiting the SEC website at sec.gov. Information regarding how the proxies related to portfolio securities were voted during the most recent 12-month period ended June 30 is available on the website at allspringglobal.com or by visiting the SEC website at sec.gov.
Quarterly portfolio holdings information
The Fund files its complete schedule of portfolio holdings with the SEC for the first and third quarters of each fiscal year as an exhibit to its reports on Form N-PORT. Shareholders may view the filed Form N-PORT by visiting the SEC website at sec.gov.
30 | Allspring Emerging Markets Equity Fund
Other information (unaudited)
Board of trustees and officers
Each of the Trustees and Officers listed in the table below acts in identical capacities for each fund in the Allspring family of funds, which consists of 99 mutual funds comprising the Allspring Funds Trust, Allspring Variable Trust, Allspring Master Trust and four closed-end funds (collectively the “Fund Complex”). This table should be read in conjunction with the Prospectus and the Statement of Additional Information*. The mailing address of each Trustee and Officer is 1415 Vantage Park Drive, 3rd Floor, Charlotte, NC 28203. Each Trustee and Officer serves an indefinite term, however, each Trustee serves such term until reaching the mandatory retirement age established by the Trustees.
| Position held and
length of | Principal occupations during past five years or longer | Current other
public company or
investment
company
directorships |
William R. Ebsworth
(Born 1957) | | Retired. From 1984 to 2013, equities analyst, portfolio manager, research director and chief investment officer at Fidelity Management and Research Company in Boston, Tokyo, and Hong Kong, and retired in 2013 as Chief Investment Officer of Fidelity Strategic Advisers, Inc. where he led a team of investment professionals managing client assets. Prior thereto, Board member of Hong Kong Securities Clearing Co., Hong Kong Options Clearing Corp., the Thailand International Fund, Ltd., Fidelity Investments Life Insurance Company, and Empire Fidelity Investments Life Insurance Company. Serves on the Investment Company Institute’s Board of Governors since 2022 and Executive Committee since 2023 as well as the Vice Chairman of the Governing Council of the Independent Directors Council since 2023. Audit Committee Chair and Investment Committee Chair of the Vincent Memorial Hospital Foundation (non-profit organization). Mr. Ebsworth is a CFA charterholder. | |
Jane A. Freeman
(Born 1953) | Trustee,
since 2015;
Chair Liaison,
| Retired. From 2012 to 2014 and 1999 to 2008, Chief Financial Officer of Scientific Learning Corporation. From 2008 to 2012, Ms. Freeman provided consulting services related to strategic business projects. Prior to 1999, Portfolio Manager at Rockefeller & Co. and Scudder, Stevens & Clark. Board member of the Harding Loevner Funds from 1996 to 2014, serving as both Lead Independent Director and chair of the Audit Committee. Board member of the Russell Exchange Traded Funds Trust from 2011 to 2012 and the chair of the Audit Committee. Ms. Freeman is also an inactive Chartered Financial Analyst. | |
Isaiah Harris, Jr.
(Born 1952) | Trustee,
since 2009;
Audit Committee Chair,
since 2019 | Retired. Member of the Advisory Board of CEF of East Central Florida. Chairman of the Board of CIGNA Corporation from 2009 to 2021, and Director from 2005 to 2008. From 2003 to 2011, Director of Deluxe Corporation. Prior thereto, President and CEO of BellSouth Advertising and Publishing Corp. from 2005 to 2007, President and CEO of BellSouth Enterprises from 2004 to 2005 and President of BellSouth Consumer Services from 2000 to 2003. Emeritus member of the Iowa State University Foundation Board of Governors. Emeritus Member of the Advisory board of Iowa State University School of Business. Advisory Board Member, Palm Harbor Academy (private school). Advisory Board Member, Fellowship of Christian Athletes. Mr. Harris is a certified public accountant (inactive status). | |
David F. Larcker
(Born 1950) | | Distinguished Visiting Fellow at the Hoover Institution since 2022. James Irvin Miller Professor of Accounting at the Graduate School of Business (Emeritus), Stanford University, Director of the Corporate Governance Research Initiative and Senior Faculty of The Rock Center for Corporate Governance since 2006. From 2005 to 2008, Professor of Accounting at the Graduate School of Business, Stanford University. Prior thereto, Ernst & Young Professor of Accounting at The Wharton School, University of Pennsylvania from 1985 to 2005. | |
Olivia S. Mitchell
(Born 1953) | | International Foundation of Employee Benefit Plans Professor since 1993, Wharton School of the University of Pennsylvania. Director of Wharton’s Pension Research Council and Boettner Center on Pensions & Retirement Research, and Research Associate at the National Bureau of Economic Research. Previously taught at Cornell University from 1978 to 1993. | |
Timothy J. Penny
(Born 1951) | Trustee,
since 1996;
Chair,
since 2018 | President and Chief Executive Officer of Southern Minnesota Initiative Foundation, a non-profit organization, since 2007. Vice Chair of the Economic Club of Minnesota, since 2007. Co-Chair of the Committee for a Responsible Federal Budget, since 1995. Member of the Board of Trustees of NorthStar Education Finance, Inc., a non-profit organization, from 2007-2022. Senior Fellow of the University of Minnesota Humphrey Institute from 1995 to 2017. | |
** Length of service dates reflect the Trustee’s commencement of service with the Trust’s predecessor entities, where applicable.
*** Ms. Freeman will serve as Chair Liaison through June 2024, at which time Ms. Wheelock will assume the role.
*
The Statement of Additional Information includes additional information about the Trustees and is available, without charge, upon request, by calling 1-800-222-8222 or by visiting the website at allspringglobal.com.
Allspring Emerging Markets Equity Fund | 31
Other information (unaudited)
| Position held and length of service** | Principal occupations during past five years or longer | Current other public company or investment company directorships |
James G. Polisson
(Born 1959) | Trustee,
since 2018;
Nominating and Governance Committee Chair,
since 2024 | Retired. Chief Marketing Officer, Source (ETF) UK Services, Ltd, from 2015 to 2017. From 2012 to 2015, Principal of The Polisson Group, LLC, a management consulting, corporate advisory and principal investing company. Chief Executive Officer and Managing Director at Russell Investments, Global Exchange Traded Funds from 2010 to 2012. Managing Director of Barclays Global Investors from 1998 to 2010 and Global Chief Marketing Officer for iShares and Barclays Global Investors from 2000 to 2010. Trustee of the San Francisco Mechanics’ Institute, a non- profit organization, from 2013 to 2015. Board member of the Russell Exchange Traded Fund Trust from 2011 to 2012. Director of Barclays Global Investors Holdings Deutschland GmbH from 2006 to 2009. Mr. Polisson is an attorney and has a retired status with the Massachusetts and District of Columbia Bar Associations. | |
Pamela Wheelock
(Born 1959) | Trustee,
since January 2020;
previously Trustee from
January 2018 to
| Retired. Executive and Senior Financial leadership positions in the public, private and nonprofit sectors. Interim President and CEO, McKnight Foundation, 2020. Interim Commissioner, Minnesota Department of Human Services, 2019. Chief Operating Officer, Twin Cities Habitat for Humanity, 2017-2019. Vice President for University Services, University of Minnesota, 2012- 2016. Interim President and CEO, Blue Cross and Blue Shield of Minnesota, 2011-2012. Executive Vice-President and Chief Financial Officer, Minnesota Wild, 2002-2008. Commissioner, Minnesota Department of Finance, 1999-2002. Chair of the Board of Directors of Destination Medical Center Corporation. Board member of the Minnesota Wild Foundation. | |
** Length of service dates reflect the Trustee’s commencement of service with the Trust’s predecessor entities, where applicable.
*** Ms. Freeman will serve as Chair Liaison through June 2024, at which time Ms. Wheelock will assume the role.
32 | Allspring Emerging Markets Equity Fund
Other information (unaudited)
Officers1
| Position held and
length of service | Principal occupations during past five years or longer |
| | President and Chief Executive Officer of Allspring Funds Management, LLC since 2017 and Head of Global Fund Governance of Allspring Global Investments since 2022. Prior thereto, co-president of Galliard Capital Management, LLC, an affiliate of Allspring Funds Management, LLC, from 2019 to 2022 and Head of Affiliated Managers, Allspring Global Investments, from 2014 to 2019 and Executive Vice President responsible for marketing, investments and product development for Allspring Funds Management, LLC, from 2009 to 2014. |
Jeremy DePalma
(Born 1974) | Treasurer,
since 2012
(for certain funds in
the Fund Complex);
since 2021 (for
the remaining funds in the Complex) | Senior Vice President of Allspring Funds Management, LLC since 2009. Senior Vice President of Evergreen Investment Management Company, LLC from 2008 to 2010 and head of the Fund Reporting and Control Team within Fund Administration from 2005 to 2010. |
Christopher Baker
(Born 1976) | Chief Compliance Officer,
since 2022 | Global Chief Compliance Officer for Allspring Global Investments since 2022. Prior thereto, Chief Compliance Officer for State Street Global Advisors from 2018 to 2021. Senior Compliance Officer for the State Street divisions of Alternative Investment Solutions, Sector Solutions, and Global Marketing from 2015 to 2018. From 2010 to 2015 Vice President, Global Head of Investment and Marketing Compliance for State Street Global Advisors. |
Matthew Prasse
(Born 1983) | Chief Legal Officer,
since 2022;
Secretary,
since 2021 | Senior Counsel of the Allspring Legal Department since 2021. Senior Counsel of the Wells Fargo Legal Department from 2018 to 2021. Previously, Counsel for Barings LLC from 2015 to 2018. Prior to joining Barings, Associate at Morgan, Lewis & Bockius LLP from 2008 to 2015. |
1 For those Officers with tenures at Allspring Global Investments and/or Allspring Funds Management, LLC that began prior to 2021, such tenures include years of service during which these businesses/entities were known as Wells Fargo Asset Management and Wells Fargo Funds Management, LLC, respectively.
Allspring Emerging Markets Equity Fund | 33
For more information
More information about Allspring Funds is available free upon request. To obtain literature, please write, visit the Fund’s website, or call:
Allspring Funds
P.O. Box 219967
Kansas City, MO 64121-9967
Website: allspringglobal.com
Individual investors: 1-800-222-8222
Retail investment professionals: 1-888-877-9275
Institutional investment professionals: 1-800-260-5969
This report and the financial statements contained herein are submitted for the general information of the shareholders of the Fund. If this report is used for promotional purposes, distribution of the report must be accompanied or preceded by a current prospectus. Before investing, please consider the investment objectives, risks, charges, and expenses of the investment. For a current prospectus and, if available, a summary prospectus, containing this information, call 1-800-222-8222 or visit the Fund’s website at allspringglobal.com. Read the prospectus carefully before you invest or send money.
Allspring Global InvestmentsTM is the trade name for the asset management firms of Allspring Global Investments Holdings, LLC, a holding company indirectly owned by certain private funds of GTCR LLC and Reverence Capital Partners, L.P. These firms include but are not limited to Allspring Global Investments, LLC, and Allspring Funds Management, LLC. Certain products managed by Allspring entities are distributed by Allspring Funds Distributor, LLC (a broker-dealer and Member FINRA/SIPC).
This material is for general informational and educational purposes only and is NOT intended to provide investment advice or a recommendation of any kind - including a recommendation for any specific investment, strategy, or plan.
© 2024 Allspring Global Investments Holdings, LLC. All rights reserved.
ALL-05022024-ifcyvxbi 06-24
SAR0663 04-24
Allspring Emerging Markets Equity Income Fund
The views expressed and any forward-looking statements are as of April 30, 2024, unless otherwise noted, and are those of the portfolio managers and/or Allspring Global Investments. Discussions of individual securities or the markets generally are not intended as individual recommendations. Future events or results may vary significantly from those expressed in any forward-looking statements. The views expressed are subject to change at any time in response to changing circumstances in the market. Allspring Global Investments disclaims any obligation to publicly update or revise any views expressed or forward-looking statements.
Allspring Emerging Markets Equity Income Fund | 1
Letter to shareholders (unaudited)
Dear Shareholder:
We are pleased to offer you this semi-annual report for the Allspring Emerging Markets Equity Income Fund for the six-month period that ended April 30, 2024. Globally, stocks and bonds had strongly positive returns for the period. However, markets were volatile as investors focused on persistently high inflation and the impact of aggressive central bank rate hikes. Riskier assets rallied as investors anticipated an end to the tight monetary policy.
For the period, U.S. stocks, based on the S&P 500 Index,1 returned 20.98%. International stocks, as measured by the MSCI ACWI ex USA Index (Net),2 gained 17.69% while the MSCI EM Index (Net) (USD),3 returned 15.40%. Among bond indexes, the Bloomberg U.S. Aggregate Bond Index4 advanced 4.97%, the Bloomberg Global Aggregate ex-USD Index (unhedged)5 gained 3.92%, the Bloomberg Municipal Bond Index6 returned 7.06%, and the ICE BofA U.S. High Yield Index7 gained 8.94%.
Investors remained focused on central bank monetary policies.
As the six-month period began in November, the market mood brightened as cooling inflation inspired confidence that central banks could hold off on further rate hikes. Overall annual inflation in the U.S. fell to 3.1% in November while 12-month inflation in the U.K. and the eurozone eased to 4.6% and 2.4%, respectively—far below their peak levels of mid-2022. Third quarter annualized U.S. GDP growth was raised to an estimated 5.2% while U.S. job totals rose by close to 200,000 in November, indicating a slight cooling of the labor market. All of this fresh evidence added to confidence for a U.S. soft economic landing, leading to a more buoyant mood heading into winter.
The broad year-end rally among stocks and bonds that began in November continued through December as investors became more confident that monetary policy would ease in 2024. Supporting the bubbly market mood were a series of reports confirming lower inflationary trends in the U.S. and Europe. During the period, it appeared more likely that the U.S. economy could achieve a soft landing, cooling enough to lower inflation without the pain of a recession. However, by year-end, an expectations gap developed. Capital markets priced in a total of 1.50 percentage points in federal funds rate cuts in 2024—twice as much as the three cuts of 0.25% hinted at by Fed officials.
1
The S&P 500 Index consists of 500 stocks chosen for market size, liquidity, and industry group representation. It is a market-value-weighted index with each stock’s weight in the index proportionate to its market value. You cannot invest directly in an index.
2
The Morgan Stanley Capital International (MSCI) All Country World Index (ACWI) ex USA Index (Net) is a free-float-adjusted market-capitalization-weighted index that is designed to measure the equity market performance of developed and emerging markets, excluding the U.S. Source: MSCI. MSCI makes no express or implied warranties or representations and shall have no liability whatsoever with respect to any MSCI data contained herein. The MSCI data may not be further redistributed or used as a basis for other indexes or any securities or financial products. This report is not approved, reviewed, or produced by MSCI. You cannot invest directly in an index.
3
The MSCI Emerging Markets (EM) Index (Net) (USD) is a free-float-adjusted market-capitalization-weighted index that is designed to measure the equity market performance of emerging markets. You cannot invest directly in an index.
4
The Bloomberg U.S. Aggregate Bond Index is a broad-based benchmark that measures the investment-grade, U.S.-dollar-denominated, fixed-rate taxable bond market, including Treasuries, government-related and corporate securities, mortgage-backed securities (agency fixed-rate and hybrid adjustable-rate mortgage pass-throughs), asset-backed securities, and commercial mortgage-backed securities. You cannot invest directly in an index.
5
The Bloomberg Global Aggregate ex-USD Index (unhedged) is an unmanaged index that provides a broad-based measure of the global investment-grade fixed-income markets excluding the U.S.-dollar-denominated debt market. You cannot invest directly in an index.
6
The Bloomberg Municipal Bond Index is an unmanaged index composed of long-term tax-exempt bonds with a minimum credit rating of Baa. You cannot invest directly in an index.
7
The ICE BofA U.S. High Yield Index is a market-capitalization-weighted index of domestic and Yankee high yield bonds. The index tracks the performance of high yield securities traded in the U.S. bond market. Returns shown are net of transaction costs beginning on July 1, 2022. You cannot invest directly in an index. Copyright 2024. ICE Data Indices, LLC. All rights reserved.
2 | Allspring Emerging Markets Equity Income Fund
Letter to shareholders (unaudited)
Financial market performance was mixed in January 2024 as U.S. stocks had modest gains while non-U.S. equities, particularly those in emerging markets, and fixed income assets were held back by central bank pushback on market optimism over rate cuts. Overall, optimism was supported by hints of a soft landing for the U.S. economy. Key data included a surprisingly strong gain of 353,000 jobs in January, an unemployment rate of just 3.7%, and a rise of just 3.1% in the annual Consumer Price Index1 (CPI) in January. However, that resilience helped tone down expectations of a rate cut in March to a more likely second quarter initial move.
In February, stocks were supported by positive economic data and strong corporate earnings. However, fixed income investments were under pressure as resilient inflation curbed expectations on the timing of interest rate cuts. The S&P 500 Index had solid monthly gains along with emerging market equities, which benefited from a rebound in China.
The first quarter of 2024 closed with ongoing stock market momentum and a more muted sense of confidence in fixed income markets as investors adjusted to the prospect of greater-than-expected economic strength. On the flip side, expectations on the timing of an initial Fed rate cut were pushed back from March to June and then beyond. Additionally, the number of quarter-point rate cuts forecast by the market fell from six as projected in December 2023 to two to three cuts by fiscal period-end.
Markets retreated broadly in April as U.S. annual inflation continued to resist monetary policy efforts and expectations for its downward trajectory, with an April CPI reading of 3.4%. The timing of a Fed initial rate cut came into greater question in April. Not only was there less confidence regarding when a first cut would take place but also whether any rate reductions would occur at all in 2024. Market expectations continued to recede to a possible September Fed first cut. Meanwhile, eurozone annual inflation held steady in April at 2.4%. Developed market stocks and fixed income securities of all types were in the red for April.
Don’t let short-term uncertainty derail long-term investment goals.
Periods of investment uncertainty can present challenges, but experience has taught us that maintaining long-term investment goals can be an effective way to plan for the future. To help you create a sound strategy based on your personal goals and risk tolerance, Allspring Funds offers a wide variety of mutual funds spanning many asset classes and investment styles. Although diversification cannot guarantee an investment profit or prevent losses, we believe it can be an effective way to manage investment risk and potentially smooth out overall portfolio performance. We encourage investors to know their investments and to understand that appropriate levels of risk-taking may unlock opportunities.
Thank you for choosing to invest with Allspring Funds. We appreciate your confidence in us and remain committed to helping you meet your financial needs.
Andrew Owen
President
Allspring Funds
“ The first quarter of 2024 closed with ongoing stock market momentum and a more muted sense of confidence in fixed income markets as investors adjusted to the prospect of greater-than-expected economic strength. ”
For further information about your fund, contact your investment professional, visit our website at allspringglobal.com, or call us directly at 1-800-222-8222.
1
The Consumer Price Index (CPI) is a measure of the average change over time in the prices paid by urban consumers for a market basket of consumer goods and services. You cannot invest directly in an index.
Allspring Emerging Markets Equity Income Fund | 3
Letter to shareholders (unaudited)
|
Beginning in July 2024, the Fund will be required by the Securities and Exchange Commission to send shareholders a paper copy of a new tailored shareholder report in place of the full shareholder report that you are now receiving. The tailored shareholder report will contain concise information about the Fund, including certain expense and performance information and fund statistics. If you wish to receive this new tailored shareholder report electronically, please follow the instructions on the back cover of this report. |
Other information that is currently included in the shareholder report, such as the Fund’s financial statements, will be available online and upon request, free of charge, in paper or electronic format. |
4 | Allspring Emerging Markets Equity Income Fund
This page is intentionally left blank.
Performance highlights (unaudited)
Performance highlights
| The Fund seeks to achieve long-term capital appreciation and current income. |
| Allspring Funds Management, LLC |
| Allspring Global Investments, LLC |
| Alison Shimada, Elaine Tse |
Average annual total returns (%) as of April 30, 2024 |
| | | | |
| | | | | | | | | |
| | | | | | | | | |
| | | | | | | | | |
| | | | | | | | | |
Administrator Class (EQIDX) | | | | | | | | | |
Institutional Class (EQIIX) | | | | | | | | | |
MSCI ACWI ex USA Index (Net)4 | | | | | | | | | |
MSCI Emerging Markets Index (Net) (USD)5 | | | | | | | | | |
MSCI Emerging Markets High Dividend | | | | | | | | | |
Figures quoted represent past performance, which is no guarantee of future results, and do not reflect taxes that a shareholder may pay on an investment in a fund. Investment return and principal value of an investment will fluctuate so that an investor’s shares, when redeemed, may be worth more or less than their original cost. Performance shown without sales charges would be lower if sales charges were reflected. Current performance may be lower or higher than the performance data quoted, which assumes the reinvestment of dividends and capital gains. Current month-end performance is available on the Fund’s website, allspringglobal.com.
Index returns do not include transaction costs associated with buying and selling securities, any mutual fund fees or expenses, or any taxes. It is not possible to invest directly in an index.
For Class A shares, the maximum front-end sales charge is 5.75%. For Class C shares, the maximum contingent deferred sales charge is 1.00%. Performance including a contingent deferred sales charge assumes the sales charge for the corresponding time period. Class R6, Administrator Class and Institutional Class shares are sold without a front-end sales charge or contingent deferred sales charge.
|
| Reflects the expense ratios as stated in the most recent prospectuses. The expense ratios shown are subject to change and may differ from the annualized expense ratios shown in the Financial Highlights of this report. |
| The manager has contractually committed through February 28, 2025, to waive fees and/or reimburse expenses to the extent necessary to cap total annual fund operating expenses after fee waivers at 1.55% for Class A, 2.30% for Class C, 1.17% for Class R6, 1.45% for Administrator Class and 1.22% for Institutional Class. Brokerage commissions, stamp duty fees, interest, taxes, acquired fund fees and expenses (if any), and extraordinary expenses are excluded from the expense caps. Prior to or after the commitment expiration date, the caps may be increased or the commitment to maintain the caps may be terminated only with the approval of the Board of Trustees. Without these caps, the Fund’s returns would have been lower. The expense ratio paid by an investor is the net expense ratio (the total annual fund operating expenses after fee waivers) as stated in the prospectuses. |
| Historical performance shown for the Class R6 shares prior to their inception reflects the performance of the Institutional Class shares, and includes the higher expenses applicable to the Institutional Class shares. If these expenses had not been included, returns for the Class R6 shares would be higher. |
| The Morgan Stanley Capital International (MSCI) All Country World Index (ACWI) ex USA Index (Net) is a free-float-adjusted market-capitalization-weighted index that is designed to measure the equity market performance of developed and emerging markets, excluding the U.S. Source: MSCI. MSCI makes no express or implied warranties or representations and shall have no liability whatsoever with respect to any MSCI data contained herein. The MSCI data may not be further redistributed or used as a basis for other indexes or any securities or financial products. This report is not approved, reviewed, or produced by MSCI. You cannot invest directly in an index. |
| MSCI Emerging Markets (EM) Index (Net) (USD) is a free-float-adjusted market-capitalization-weighted index that is designed to measure the equity market performance of emerging markets. You cannot invest directly in an index. |
| The MSCI EM High Dividend Yield Index (Net) (USD) is based on the MSCI EM Index, its parent index (Net) (USD), and includes large and mid-cap stocks. The index is designed to reflect the performance of equities in the parent index (excluding REITs) with higher dividend income and quality characteristics than average dividend yields that are both sustainable and persistent. The index also applies quality screens and reviews 12-month past performance to omit stocks with potentially deteriorating fundamentals that could force them to cut or reduce dividends. You cannot invest directly in an index. |
Investing involves risk, including the possible loss of principal. Stock values fluctuate in response to the activities of individual companies and general market and economic conditions. Foreign investments are especially volatile and can rise or fall dramatically due to differences in the political and economic conditions of the host country. These risks are generally intensified in emerging markets. Consult the Fund’s prospectus for additional information on these and other risks.
6 | Allspring Emerging Markets Equity Income Fund
Performance highlights (unaudited)
Ten largest holdings (%) as of April 30, 20241 |
Taiwan Semiconductor Manufacturing Co. Ltd. | |
| |
Samsung Electronics Co. Ltd., Preferred stock | |
Samsung Electronics Co. Ltd. | |
Alibaba Group Holding Ltd. | |
Power Grid Corp. of India Ltd. | |
Midea Group Co. Ltd. Class A | |
| |
| |
| |
| Figures represent the percentage of the Fund’s net assets. Holdings are subject to change and may have changed since the date specified. |
Sector allocation as of April 30, 20241 |
| Figures represent the percentage of the Fund’s long-term investments. These amounts are subject to change and may have changed since the date specified. |
Country allocation as of April 30, 20241 |
| Figures represent the percentage of the Fund’s long-term investments. These amounts are subject to change and may have changed since the date specified. |
Allspring Emerging Markets Equity Income Fund | 7
Fund expenses (unaudited)
Fund expenses
As a shareholder of the Fund, you incur two types of costs: (1) transaction costs, including sales charges (loads) on purchase payments and contingent deferred sales charges (if any) on redemptions and (2) ongoing costs, including management fees, distribution (12b-1) and/or shareholder servicing fees, and other Fund expenses. This example is intended to help you understand your ongoing costs (in dollars) of investing in the Fund and to compare these costs with the ongoing costs of investing in other mutual funds.
The example is based on an investment of $1,000 invested at the beginning of the six-month period and held for the entire period from November 1, 2023 to April 30, 2024.
The “Actual” line of the table below provides information about actual account values and actual expenses. You may use the information in this line, together with the amount you invested, to estimate the expenses that you paid over the period. Simply divide your account value by $1,000 (for example, an $8,600 account value divided by $1,000= 8.6), then multiply the result by the number in the “Actual” line under the heading entitled “Expenses paid during period” for your applicable class of shares to estimate the expenses you paid on your account during this period.
Hypothetical example for comparison purposes
The “Hypothetical” line of the table below provides information about hypothetical account values and hypothetical expenses based on the Fund’s actual expense ratio and an assumed rate of return of 5% per year before expenses, which is not the Fund’s actual return. The hypothetical account values and expenses may not be used to estimate the actual ending account balance or expenses you paid for the period. You may use this information to compare the ongoing costs of investing in the Fund and other funds. To do so, compare this 5% hypothetical example with the 5% hypothetical examples that appear in the shareholder reports of the other funds.
Please note that the expenses shown in the table are meant to highlight your ongoing costs only and do not reflect any transactional costs, such as sales charges (loads) and contingent deferred sales charges. Therefore, the “Hypothetical” line of the table is useful in comparing ongoing costs only, and will not help you determine the relative total costs of owning different funds. In addition, if these transactional costs were included, your costs would have been higher.
| Beginning
account value
11-1-2023 | Ending
account value
4-30-2024 | | Annualized net
expense ratio |
| | | | |
| | | | |
Hypothetical (5% return before expenses) | | | | |
| | | | |
| | | | |
Hypothetical (5% return before expenses) | | | | |
| | | | |
| | | | |
Hypothetical (5% return before expenses) | | | | |
| | | | |
| | | | |
Hypothetical (5% return before expenses) | | | | |
| | | | |
| | | | |
Hypothetical (5% return before expenses) | | | | |
| Expenses paid is equal to the annualized net expense ratio of each class multiplied by the average account value over the period, multiplied by 182 divided by 366 (to reflect the one-half-year period). |
8 | Allspring Emerging Markets Equity Income Fund
Portfolio of investments—April 30, 2024 (unaudited)
| | | | | |
| | | | | | |
| | | | | | |
B3 SA - Brasil Bolsa Balcao (Financials, Capital markets) | | | | | | |
Banco BTG Pactual SA (Financials, Capital markets) | | | | | | |
Embraer SA ADR (Industrials, Aerospace & defense)† | | | | | | |
Petroleo Brasileiro SA ADR (Energy, Oil, gas & consumable fuels) | | | | | | |
Vale SA (Materials, Metals & mining) | | | | | | |
| | | | | | |
| | | | | | |
Alibaba Group Holding Ltd. (Consumer discretionary, Broadline retail) | | | | | | |
ANTA Sports Products Ltd. (Consumer discretionary, Textiles, apparel & luxury goods) | | | | | | |
Baidu, Inc. Class A (Communication services, Interactive media & services)† | | | | | | |
China Construction Bank Corp. Class H (Financials, Banks) | | | | | | |
China International Capital Corp. Ltd. Class H (Financials, Capital markets)144A | | | | | | |
China Merchants Bank Co. Ltd. Class H (Financials, Banks) | | | | | | |
China Oilfield Services Ltd. Class H (Energy, Energy equipment & services) | | | | | | |
China Resources Land Ltd. (Real estate, Real estate management & development) | | | | | | |
China State Construction International Holdings Ltd. (Industrials, Construction & engineering) | | | | | | |
Chinasoft International Ltd. (Information technology, IT services) | | | | | | |
ENN Energy Holdings Ltd. (Utilities, Gas utilities) | | | | | | |
Foxconn Industrial Internet Co. Ltd. Class A (Information technology, Electronic equipment, instruments & components) | | | | | | |
Fuyao Glass Industry Group Co. Ltd. Class H (Consumer discretionary, Automobile components)144A | | | | | | |
Great Wall Motor Co. Ltd. Class H (Consumer discretionary, Automobiles) | | | | | | |
Gree Electric Appliances, Inc. of Zhuhai Class A (Consumer discretionary, Household durables) | | | | | | |
Inner Mongolia Yili Industrial Group Co. Ltd. Class A (Consumer staples, Food products) | | | | | | |
Midea Group Co. Ltd. Class A (Consumer discretionary, Household durables) | | | | | | |
Ping An Insurance Group Co. of China Ltd. Class A (Financials, Insurance) | | | | | | |
Sinopharm Group Co. Ltd. Class H (Health care, Health care providers & services) | | | | | | |
Tencent Holdings Ltd. (Communication services, Interactive media & services) | | | | | | |
Tingyi Cayman Islands Holding Corp. (Consumer staples, Food products) | | | | | | |
TravelSky Technology Ltd. Class H (Consumer discretionary, Hotels, restaurants & leisure) | | | | | | |
Weichai Power Co. Ltd. Class H (Industrials, Machinery) | | | | | | |
| | | | | | |
| | | | | | |
Jumbo SA (Consumer discretionary, Specialty retail) | | | | | | |
National Bank of Greece SA (Financials, Banks)† | | | | | | |
| | | | | | |
| | | | | | |
Lenovo Group Ltd. (Information technology, Technology hardware, storage & peripherals) | | | | | | |
The accompanying notes are an integral part of these financial statements.
Allspring Emerging Markets Equity Income Fund | 9
Portfolio of investments—April 30, 2024 (unaudited)
| | | | | |
| | | | | | |
Richter Gedeon Nyrt (Health care, Pharmaceuticals) | | | | | | |
| | | | | | |
360 ONE WAM Ltd. (Financials, Capital markets) | | | | | | |
Ashok Leyland Ltd. (Industrials, Machinery) | | | | | | |
Bajaj Auto Ltd. (Consumer discretionary, Automobiles) | | | | | | |
Embassy Office Parks REIT (Real estate, Office REITs) | | | | | | |
GAIL India Ltd. (Utilities, Gas utilities) | | | | | | |
Infosys Ltd. (Information technology, IT services) | | | | | | |
LIC Housing Finance Ltd. (Financials, Financial services) | | | | | | |
NHPC Ltd. (Utilities, Independent power and renewable electricity producers) | | | | | | |
Power Finance Corp. Ltd. (Financials, Financial services) | | | | | | |
Power Grid Corp. of India Ltd. (Utilities, Electric utilities) | | | | | | |
Ujjivan Financial Services Ltd. (Financials, Consumer finance) | | | | | | |
| | | | | | |
| | | | | | |
Bank Mandiri Persero Tbk. PT (Financials, Banks) | | | | | | |
Bank Negara Indonesia Persero Tbk. PT (Financials, Banks) | | | | | | |
Indofood CBP Sukses Makmur Tbk. PT (Consumer staples, Food products) | | | | | | |
| | | | | | |
| | | | | | |
Samsonite International SA (Consumer discretionary, Textiles, apparel & luxury goods)144A† | | | | | | |
Ternium SA ADR (Materials, Metals & mining) | | | | | | |
| | | | | | |
| | | | | | |
CIMB Group Holdings Bhd. (Financials, Banks) | | | | | | |
Malaysia Airports Holdings Bhd. (Industrials, Transportation infrastructure) | | | | | | |
| | | | | | |
| | | | | | |
America Movil SAB de CV ADR (Communication services, Wireless telecommunication services) | | | | | | |
Bolsa Mexicana de Valores SAB de CV (Financials, Capital markets) | | | | | | |
Corp. Inmobiliaria Vesta SAB de CV ADR (Real estate, Real estate management & development) | | | | | | |
Grupo Aeroportuario del Sureste SAB de CV ADR (Industrials, Transportation infrastructure) | | | | | | |
Grupo Financiero Banorte SAB de CV Class O (Financials, Banks) | | | | | | |
Wal-Mart de Mexico SAB de CV (Consumer staples, Consumer staples distribution & retail) | | | | | | |
| | | | | | |
| | | | | | |
Copa Holdings SA Class A (Industrials, Passenger airlines) | | | | | | |
The accompanying notes are an integral part of these financial statements.
10 | Allspring Emerging Markets Equity Income Fund
Portfolio of investments—April 30, 2024 (unaudited)
| | | | | |
| | | | | | |
Credicorp Ltd. (Financials, Banks) | | | | | | |
| | | | | | |
Bank of the Philippine Islands (Financials, Banks) | | | | | | |
| | | | | | |
Bank Polska Kasa Opieki SA (Financials, Banks) | | | | | | |
LPP SA (Consumer discretionary, Textiles, apparel & luxury goods) | | | | | | |
| | | | | | |
| | | | | | |
Alrosa PJSC (Acquired 5-6-2021, cost $1,726,284) (Materials, Metals & mining)♦†˃ | | | | | | |
| | | | | | |
Al Rajhi Bank (Financials, Banks) | | | | | | |
Arabian Drilling Co. (Energy, Energy equipment & services) | | | | | | |
Etihad Etisalat Co. (Communication services, Wireless telecommunication services) | | | | | | |
Saudi Awwal Bank (Financials, Banks) | | | | | | |
United International Transportation Co. (Industrials, Ground transportation) | | | | | | |
| | | | | | |
| | | | | | |
BOC Aviation Ltd. (Industrials, Trading companies & distributors)144A | | | | | | |
Yangzijiang Shipbuilding Holdings Ltd. (Industrials, Machinery) | | | | | | |
| | | | | | |
| | | | | | |
Bidvest Group Ltd. (Industrials, Industrial conglomerates) | | | | | | |
Naspers Ltd. Class N (Consumer discretionary, Broadline retail) | | | | | | |
Sanlam Ltd. (Financials, Insurance) | | | | | | |
Standard Bank Group Ltd. (Financials, Banks) | | | | | | |
| | | | | | |
| | | | | | |
Doosan Bobcat, Inc. (Industrials, Machinery) | | | | | | |
Fila Holdings Corp. (Consumer discretionary, Textiles, apparel & luxury goods) | | | | | | |
KB Financial Group, Inc. (Financials, Banks) | | | | | | |
Kia Corp. (Consumer discretionary, Automobiles) | | | | | | |
Samsung Electronics Co. Ltd. (Information technology, Technology hardware, storage & peripherals) | | | | | | |
SK Telecom Co. Ltd. (Communication services, Wireless telecommunication services) | | | | | | |
| | | | | | |
| | | | | | |
ASE Technology Holding Co. Ltd. (Information technology, Semiconductors & semiconductor equipment) | | | | | | |
Cathay Financial Holding Co. Ltd. (Financials, Insurance) | | | | | | |
Chroma ATE, Inc. (Information technology, Electronic equipment, instruments & components) | | | | | | |
The accompanying notes are an integral part of these financial statements.
Allspring Emerging Markets Equity Income Fund | 11
Portfolio of investments—April 30, 2024 (unaudited)
| | | | | |
| | | | | | |
Delta Electronics, Inc. (Information technology, Electronic equipment, instruments & components) | | | | | | |
E Ink Holdings, Inc. (Information technology, Electronic equipment, instruments & components) | | | | | | |
Largan Precision Co. Ltd. (Information technology, Electronic equipment, instruments & components) | | | | | | |
MediaTek, Inc. (Information technology, Semiconductors & semiconductor equipment) | | | | | | |
Quanta Computer, Inc. (Information technology, Technology hardware, storage & peripherals) | | | | | | |
Taiwan Semiconductor Manufacturing Co. Ltd. (Information technology, Semiconductors & semiconductor equipment) | | | | | | |
Teco Electric & Machinery Co. Ltd. (Industrials, Electrical equipment) | | | | | | |
United Microelectronics Corp. (Information technology, Semiconductors & semiconductor equipment) | | | | | | |
| | | | | | |
| | | | | | |
PTT Exploration & Production PCL (Energy, Oil, gas & consumable fuels) | | | | | | |
| | | | | | |
Akbank TAS (Financials, Banks) | | | | | | |
BIM Birlesik Magazalar AS (Consumer staples, Consumer staples distribution & retail) | | | | | | |
| | | | | | |
United Arab Emirates: 0.41% | | | | | | |
Abu Dhabi Commercial Bank PJSC (Financials, Banks) | | | | | | |
| | | | | | |
Southern Copper Corp. (Materials, Metals & mining) | | | | | | |
Total common stocks (Cost $257,374,382) | | | | | | |
| | | | | |
| | | | | | |
| | | | | | |
Itau Unibanco Holding SA (Financials, Banks) | | | | | | |
| | | | | | |
LG Chem Ltd. (Materials, Chemicals) | | | | | | |
Samsung Electronics Co. Ltd. (Information technology, Technology hardware, storage & peripherals) | | | | | | |
| | | | | | |
Total preferred stocks (Cost $14,795,443) | | | | | | |
The accompanying notes are an integral part of these financial statements.
12 | Allspring Emerging Markets Equity Income Fund
Portfolio of investments—April 30, 2024 (unaudited)
| | | | | |
Short-term investments: 1.94% | | | | | | |
Investment companies: 1.94% | | | | | | |
Allspring Government Money Market Fund Select Class♠∞ | | | | | | |
Total short-term investments (Cost $6,899,012) | | | | | | |
Total investments in securities (Cost $279,068,837) | | | | | | |
Other assets and liabilities, net | | | | | | |
| | | | | | |
| Non-income-earning security |
| The security may be resold in transactions exempt from registration, normally to qualified institutional buyers, pursuant to Rule 144A under the Securities Act of 1933. |
| The security is fair valued in accordance with procedures approved by the Board of Trustees. |
| Restricted security as to resale, excluding Rule 144A securities. The Fund held a restricted security with a current value of $0 (original a cost of $1,726,284), representing 0.00% of its net assets as of period end. |
| The issuer of the security is an affiliated person of the Fund as defined in the Investment Company Act of 1940. |
| The rate represents the 7-day annualized yield at period end. |
|
| American depositary receipt |
| Real estate investment trust |
Investments in affiliates
An affiliated investment is an investment in which the Fund owns at least 5% of the outstanding voting shares of the issuer or as a result of other relationships, such as the Fund and the issuer having the same investment manager. Transactions with issuers that were affiliates of the Fund at the end of the period were as follows:
| | | | | Net
change in
unrealized
gains
(losses) | | | Income
from
affiliated
securities |
| | | | | | | | |
Allspring Government Money Market Fund Select Class | | | | | | | | |
The accompanying notes are an integral part of these financial statements.
Allspring Emerging Markets Equity Income Fund | 13
Statement of assets and liabilities—April 30, 2024 (unaudited)
Financial statements
Statement of assets and liabilities
| |
Investments in unaffiliated securities, at value (cost $272,169,825) | |
Investments in affiliated securities, at value (cost $6,899,012) | |
| |
Foreign currency, at value (cost $1,699,233) | |
Receivable for investments sold | |
| |
Receivable for Fund shares sold | |
Prepaid expenses and other assets | |
| |
| |
| |
Payable for investments purchased | |
Payable for Fund shares redeemed | |
| |
Administration fees payable | |
Distribution fees payable | |
Accrued expenses and other liabilities | |
| |
| |
| |
| |
Total distributable earnings | |
| |
Computation of net asset value and offering price per share | |
| |
Shares outstanding–Class A1 | |
Net asset value per share–Class A | |
Maximum offering price per share – Class A2 | |
| |
Shares outstanding–Class C1 | |
Net asset value per share–Class C | |
| |
Shares outstanding–Class R61 | |
Net asset value per share–Class R6 | |
Net assets–Administrator Class | |
Shares outstanding–Administrator Class1 | |
Net asset value per share–Administrator Class | |
Net assets–Institutional Class | |
Shares outstanding–Institutional Class1 | |
Net asset value per share–Institutional Class | |
1 The Fund has an unlimited number of authorized shares.
2 Maximum offering price is computed as 100/94.25 of net asset value. On investments of $50,000 or more, the offering price is reduced.
The accompanying notes are an integral part of these financial statements.
14 | Allspring Emerging Markets Equity Income Fund
Statement of operations—six months ended April 30, 2024 (unaudited)
Statement of operations
| |
Dividends (net of foreign withholdings taxes of $708,963) | |
Income from affiliated securities | |
Interest (net of foreign withholding taxes of $5) | |
| |
| |
| |
| |
| |
| |
| |
| |
| |
Shareholder servicing fees | |
| |
| |
| |
| |
| |
Custody and accounting fees | |
| |
| |
Shareholder report expenses | |
Trustees’ fees and expenses | |
| |
| |
Less: Fee waivers and/or expense reimbursements | |
| |
| |
| |
| |
| |
| |
| |
The accompanying notes are an integral part of these financial statements.
Allspring Emerging Markets Equity Income Fund | 15
Statement of operations—six months ended April 30, 2024 (unaudited)
Statement of operations
Realized and unrealized gains (losses) on investments | |
| |
| |
Foreign currency and foreign currency translations | |
Forward foreign currency contracts | |
Net realized losses on investments | |
Net change in unrealized gains (losses) on | |
Unaffiliated securities (net of deferred foreign capital gains tax of $1,849,416) | |
Foreign currency and foreign currency translations | |
Net change in unrealized gains (losses) on investments | |
Net realized and unrealized gains (losses) on investments | |
Net increase in net assets resulting from operations | |
The accompanying notes are an integral part of these financial statements.
16 | Allspring Emerging Markets Equity Income Fund
Statement of changes in net assets
Statement of changes in net assets
|
Six months ended
April 30, 2024 (unaudited) | Year ended October 31, 2023 |
| | | | |
| | | | |
Net realized losses on investments | | | | |
Net change in unrealized gains (losses) on investments | | | | |
Net increase in net assets resulting from operations | | | | |
Distributions to shareholders from | | | | |
Net investment income and net realized gains | | | | |
| | | | |
| | | | |
| | | | |
| | | | |
| | | | |
| | | | |
Total distributions to shareholders | | | | |
Capital share transactions | | | | |
Proceeds from shares sold | | | | |
| | | | |
| | | | |
| | | | |
| | | | |
| | | | |
| | | | |
| | | | |
Reinvestment of distributions | | | | |
| | | | |
| | | | |
| | | | |
| | | | |
| | | | |
| | | | |
| | | | |
Payment for shares redeemed | | | | |
| | | | |
| | | | |
| | | | |
| | | | |
| | | | |
| | | | |
| | | | |
1 For the period from November 1, 2022 to June 16, 2023
The accompanying notes are an integral part of these financial statements.
Allspring Emerging Markets Equity Income Fund | 17
Statement of changes in net assets
Statement of changes in net assets
| Six months ended April 30, 2024 (unaudited) | Year ended October 31, 2023 |
| | | | |
| | | | |
| | | | |
| | | | |
| | | | |
Net increase (decrease) in net assets resulting from capital share transactions | | | | |
Total increase in net assets | | | | |
| | | | |
| | | | |
| | | | |
2 For the period from November 1, 2022 to June 16, 2023. Effective at the close of business on June 16, 2023, Class R shares were converted to Class A shares and are no longer offered by the Fund.
The accompanying notes are an integral part of these financial statements.
18 | Allspring Emerging Markets Equity Income Fund
Financial highlights
(For a share outstanding throughout each period)
| Six months ended
April 30, 2024
(unaudited) | |
| | | | | |
Net asset value, beginning of period | | | | | | |
| | | | | | |
Net realized and unrealized gains (losses) on investments | | | | | | |
Total from investment operations | | | | | | |
Distributions to shareholders from | | | | | | |
| | | | | | |
Net asset value, end of period | | | | | | |
| | | | | | |
Ratios to average net assets (annualized) | | | | | | |
| | | | | | |
| | | | | | |
| | | | | | |
| | | | | | |
| | | | | | |
Net assets, end of period (000s omitted) | | | | | | |
| Calculated based upon average shares outstanding |
| Total return calculations do not include any sales charges. Returns for periods of less than one year are not annualized. |
The accompanying notes are an integral part of these financial statements.
Allspring Emerging Markets Equity Income Fund | 19
(For a share outstanding throughout each period)
| Six months ended
April 30, 2024
(unaudited) | |
| | | | | |
Net asset value, beginning of period | | | | | | |
| | | | | | |
Net realized and unrealized gains (losses) on investments | | | | | | |
Total from investment operations | | | | | | |
Distributions to shareholders from | | | | | | |
| | | | | | |
Net asset value, end of period | | | | | | |
| | | | | | |
Ratios to average net assets (annualized) | | | | | | |
| | | | | | |
| | | | | | |
| | | | | | |
| | | | | | |
| | | | | | |
Net assets, end of period (000s omitted) | | | | | | |
| Calculated based upon average shares outstanding |
| Total return calculations do not include any sales charges. Returns for periods of less than one year are not annualized. |
The accompanying notes are an integral part of these financial statements.
20 | Allspring Emerging Markets Equity Income Fund
(For a share outstanding throughout each period)
| Six months ended
April 30, 2024
(unaudited) | |
| | | | | |
Net asset value, beginning of period | | | | | | |
| | | | | | |
Net realized and unrealized gains (losses) on investments | | | | | | |
Total from investment operations | | | | | | |
Distributions to shareholders from | | | | | | |
| | | | | | |
Net asset value, end of period | | | | | | |
| | | | | | |
Ratios to average net assets (annualized) | | | | | | |
| | | | | | |
| | | | | | |
| | | | | | |
| | | | | | |
| | | | | | |
Net assets, end of period (000s omitted) | | | | | | |
| Calculated based upon average shares outstanding |
| Returns for periods of less than one year are not annualized. |
The accompanying notes are an integral part of these financial statements.
Allspring Emerging Markets Equity Income Fund | 21
(For a share outstanding throughout each period)
| Six months ended
April 30, 2024
(unaudited) | |
| | | | | |
Net asset value, beginning of period | | | | | | |
| | | | | | |
Net realized and unrealized gains (losses) on investments | | | | | | |
Total from investment operations | | | | | | |
Distributions to shareholders from | | | | | | |
| | | | | | |
Net asset value, end of period | | | | | | |
| | | | | | |
Ratios to average net assets (annualized) | | | | | | |
| | | | | | |
| | | | | | |
| | | | | | |
| | | | | | |
| | | | | | |
Net assets, end of period (000s omitted) | | | | | | |
| Calculated based upon average shares outstanding |
| Returns for periods of less than one year are not annualized. |
The accompanying notes are an integral part of these financial statements.
22 | Allspring Emerging Markets Equity Income Fund
(For a share outstanding throughout each period)
| Six months ended
April 30, 2024
(unaudited) | |
| | | | | |
Net asset value, beginning of period | | | | | | |
| | | | | | |
Net realized and unrealized gains (losses) on investments | | | | | | |
Total from investment operations | | | | | | |
Distributions to shareholders from | | | | | | |
| | | | | | |
Net asset value, end of period | | | | | | |
| | | | | | |
Ratios to average net assets (annualized) | | | | | | |
| | | | | | |
| | | | | | |
| | | | | | |
| | | | | | |
| | | | | | |
Net assets, end of period (000s omitted) | | | | | | |
| Calculated based upon average shares outstanding |
| Returns for periods of less than one year are not annualized. |
The accompanying notes are an integral part of these financial statements.
Allspring Emerging Markets Equity Income Fund | 23
Notes to financial statements (unaudited)
Notes to financial statements
Allspring Funds Trust (the “Trust”), a Delaware statutory trust organized on March 10, 1999, is an open-end management investment company registered under the Investment Company Act of 1940, as amended (the “1940 Act”). As an investment company, the Trust follows the accounting and reporting guidance in Financial Accounting Standards Board (“FASB”) Accounting Standards Codification Topic 946, Financial Services – Investment Companies. These financial statements report on the Allspring Emerging Markets Equity Income Fund (the “Fund”) which is a diversified series of the Trust.
Effective at the close of business on June 16, 2023, Class R shares became Class A shares in a tax-free conversion. Shareholders of Class R received Class A shares at a value equal to the value of their Class R shares immediately prior to the conversion. Class R shares are no longer offered by the Fund.
2.
SIGNIFICANT ACCOUNTING POLICIES
The following significant accounting policies, which are consistently followed in the preparation of the financial statements of the Fund, are in conformity with U.S. generally accepted accounting principles which require management to make estimates and assumptions that affect the reported amounts of assets and liabilities, disclosure of contingent assets and liabilities at the date of the financial statements, and the reported amounts of income and expenses during the reporting period. Actual results could differ from those estimates.
All investments are valued each business day as of the close of regular trading on the New York Stock Exchange (generally 4 p.m. Eastern Time), although the Fund may deviate from this calculation time under unusual or unexpected circumstances.
Equity securities and exchange-traded funds that are listed on a foreign or domestic exchange or market are valued at the official closing price or, if none, the last sales price.
The values of securities denominated in foreign currencies are translated into U.S. dollars at rates provided by an independent foreign currency pricing source at a time each business day specified by the Valuation Committee at Allspring Funds Management, LLC (“Allspring Funds Management”).
Many securities markets and exchanges outside the U.S. close prior to the close of the New York Stock Exchange and therefore may not fully reflect trading or events that occur after the close of the principal exchange in which the foreign securities are traded, but before the close of the New York Stock Exchange. If such trading or events are expected to materially affect the value of such securities, then fair value pricing procedures implemented by Allspring Funds Management are applied. These procedures take into account multiple factors including movements in U.S. securities markets after foreign exchanges close. Foreign securities that are fair valued under these procedures are categorized as Level 2 and the application of these procedures may result in transfers between Level 1 and Level 2. Depending on market activity, such fair valuations may be frequent. Such fair value pricing may result in net asset values that are higher or lower than net asset values based on the last reported sales price or latest quoted bid price. On April 30, 2024, such fair value pricing was used in pricing certain foreign securities.
Forward foreign currency contracts are recorded at the forward rate provided by an independent foreign currency pricing source at a time each business day specified by the Valuation Committee at Allspring Funds Management.
Investments in registered open-end investment companies (other than those listed on a foreign or domestic exchange or market) are valued at net asset value.
Investments which are not valued using the methods discussed above are valued at their fair value, as determined in good faith by Allspring Funds Management, which was named the valuation designee by the Board of Trustees. As the valuation designee, Allspring Funds Management is responsible for day-to-day valuation activities for the Allspring Funds. In connection with these responsibilities, Allspring Funds Management has established a Valuation Committee and has delegated to it the authority to take any actions regarding the valuation of portfolio securities that the Valuation Committee deems necessary or appropriate, including determining the fair value of portfolio securities. On a quarterly basis, the Board of Trustees receives reports of valuation actions taken by the Valuation Committee. On at least an annual basis, the Board of Trustees receives an assessment of the adequacy and effectiveness of Allspring Funds Management’s process for determining the fair value of the portfolio of investments.
Foreign currency translation
The accounting records of the Fund are maintained in U.S. dollars. The values of other assets and liabilities denominated in foreign currencies are translated into U.S. dollars at rates provided by an independent foreign currency pricing source at a time each business day specified by the Valuation Committee. Purchases and sales of securities, and income and expenses are converted at the rate of exchange on the respective dates of such transactions. Net realized foreign exchange gains or losses arise from sales of foreign currencies, currency gains or losses realized between the trade and settlement dates on securities transactions, and the difference between the amounts of dividends, interest and foreign withholding taxes recorded and the U.S. dollar equivalent of the amounts actually paid or received. Net unrealized foreign exchange gains and losses arise from changes in the fair value of assets and liabilities other than investments in securities resulting from changes in exchange rates. The changes in net assets arising from changes in exchange rates of securities and the changes in net assets resulting from changes in market prices of securities are not separately presented. Such changes are included in net realized and unrealized gains or losses from investments.
24 | Allspring Emerging Markets Equity Income Fund
Notes to financial statements (unaudited)
Forward foreign currency contracts
A forward foreign currency contract is an agreement between two parties to purchase or sell a specific currency for an agreed-upon price at a future date. The Fund enters into forward foreign currency contracts to facilitate transactions in foreign-denominated securities and to attempt to minimize the risk to the Fund from adverse changes in the relationship between currencies. Forward foreign currency contracts are recorded at the forward rate and marked-to-market daily. When the contracts are closed, realized gains and losses arising from such transactions are recorded as realized gains or losses on forward foreign currency contracts. The Fund is subject to foreign currency risk and may be exposed to risks if the counterparties to the contracts are unable to meet the terms of their contracts or if the value of the foreign currency changes unfavorably. The Fund’s maximum risk of loss from counterparty credit risk is the unrealized gains on the contracts. This risk may be mitigated if there is a master netting arrangement between the Fund and the counterparty.
Security transactions and income recognition
Securities transactions are recorded on a trade date basis. Realized gains or losses are recorded on the basis of identified cost.
Dividend income is recognized on the ex-dividend date, except for certain dividends from foreign securities, which are recorded as soon as the custodian verifies the ex-dividend date. Dividend income is recorded net of foreign taxes withheld where recovery of such taxes is not assured.
Interest earned on cash balances held at the custodian is recorded as interest income.
Distributions received from REIT investments may be characterized as ordinary income, capital gains, or a return of capital to the Fund based on information provided by the REIT. The proper characterization of REIT distributions is generally not known until after the end of each calendar year. As such, estimates may be used in reporting the character of income and distributions for financial statement purposes.
Distributions to shareholders
Distributions to shareholders are recorded on the ex-dividend date and paid from net investment income monthly and any net realized gains are paid at least annually. Such distributions are determined in accordance with income tax regulations and may differ from U.S. generally accepted accounting principles. Dividend sources are estimated at the time of declaration. The tax character of distributions is determined as of the Fund’s fiscal year end. Therefore, a portion of the Fund’s distributions made prior to the Fund’s fiscal year end may be categorized as a tax return of capital at year end.
The Fund intends to continue to qualify as a regulated investment company by distributing substantially all of its investment company taxable income and any net realized capital gains (after reduction for capital loss carryforwards) sufficient to relieve it from all, or substantially all, federal income taxes. Accordingly, no provision for federal income taxes was required.
The Fund’s income and federal excise tax returns and all financial records supporting those returns for the prior three fiscal years are subject to examination by the federal and Delaware revenue authorities. Management has analyzed the Fund’s tax positions taken on federal, state, and foreign tax returns, as applicable, for all open tax years and does not believe that there are any uncertain tax positions that require recognition of a tax liability.
As of April 30, 2024, the aggregate cost of all investments for federal income tax purposes was $284,949,377 and the unrealized gains (losses) consisted of:
As of October 31, 2023, the Fund had capital loss carryforwards which consisted of $42,914,641 in short-term capital losses and $15,187,412 in long-term capital losses.
The separate classes of shares offered by the Fund differ principally in applicable sales charges, distribution, shareholder servicing, and administration fees. Class specific expenses are charged directly to that share class. Investment income, common fund-level expenses, and realized and unrealized gains (losses) on investments are allocated daily to each class of shares based on the relative proportion of net assets of each class.
Allspring Emerging Markets Equity Income Fund | 25
Notes to financial statements (unaudited)
3.
FAIR VALUATION MEASUREMENTS
Fair value measurements of investments are determined within a framework that has established a fair value hierarchy based upon the various data inputs utilized in determining the value of the Fund’s investments. The three-level hierarchy gives the highest priority to unadjusted quoted prices in active markets for identical assets or liabilities (Level 1) and the lowest priority to unobservable inputs (Level 3). The Fund’s investments are classified within the fair value hierarchy based on the lowest level of input that is significant to the fair value measurement. The inputs are summarized into three broad levels as follows:
•Level 1—quoted prices in active markets for identical securities
•Level 2—other significant observable inputs (including quoted prices for similar securities, interest rates, prepayment speeds, credit risk, etc.)
•Level 3—significant unobservable inputs (including the Fund’s own assumptions in determining the fair value of investments)
The inputs or methodologies used for valuing investments in securities are not necessarily an indication of the risk associated with investing in those securities.
The following is a summary of the inputs used in valuing the Fund’s assets and liabilities as of April 30, 2024:
| | Other significant
observable inputs
(Level 2) | Significant
unobservable inputs
(Level 3) | |
| | | | |
| | | | |
| | | | |
| | | | |
| | | | |
| | | | |
| | | | |
| | | | |
| | | | |
| | | | |
| | | | |
| | | | |
| | | | |
| | | | |
| | | | |
| | | | |
| | | | |
| | | | |
| | | | |
| | | | |
| | | | |
| | | | |
| | | | |
| | | | |
| | | | |
| | | | |
| | | | |
| | | | |
| | | | |
| | | | |
| | | | |
| | | | |
| | | | |
Additional sector, industry or geographic detail, if any, is included in the Portfolio of Investments.
At April 30, 2024, the Fund did not have any transfers into/out of Level 3.
26 | Allspring Emerging Markets Equity Income Fund
Notes to financial statements (unaudited)
4.
TRANSACTIONS WITH AFFILIATES
Allspring Funds Management, a wholly owned subsidiary of Allspring Global Investments Holdings, LLC, a holding company indirectly owned by certain private funds of GTCR LLC and Reverence Capital Partners, L.P., is the manager of the Fund and provides advisory and fund-level administrative services under an investment management agreement. Under the investment management agreement, Allspring Funds Management is responsible for, among other services, implementing the investment objectives and strategies of the Fund, supervising the subadviser and providing fund-level administrative services in connection with the Fund’s operations. As compensation for its services under the investment management agreement, Allspring Funds Management is entitled to receive a management fee at the following annual rate based on the Fund’s average daily net assets:
For the six months ended April 30, 2024, the management fee was equivalent to an annual rate of 1.05% of the Fund’s average daily net assets.
Allspring Funds Management has retained the services of a subadviser to provide daily portfolio management to the Fund. The fee for subadvisory services is borne by Allspring Funds Management. Allspring Global Investments, LLC, an affiliate of Allspring Funds Management and a wholly owned subsidiary of Allspring Global Investments Holdings, LLC, is the subadviser to the Fund and is entitled to receive a fee from Allspring Funds Management at an annual rate starting at 0.65% and declining to 0.45% as the average daily net assets of the Fund increase.
Under a class-level administration agreement, Allspring Funds Management provides class-level administrative services to the Fund, which includes paying fees and expenses for services provided by the transfer agent, sub-transfer agents, omnibus account servicers and record-keepers. As compensation for its services under the class-level administration agreement, Allspring Funds Management receives an annual fee which is calculated based on the average daily net assets of each class as follows:
| Class-level
administration fee |
| |
| |
| |
| |
| |
Waivers and/or expense reimbursements
Allspring Funds Management has contractually committed to waive and/or reimburse management and administration fees to the extent necessary to maintain certain net operating expense ratios for the Fund. When each class of the Fund has exceeded its expense cap, Allspring Funds Management will waive fees and/or reimburse expenses from fund-level expenses on a proportionate basis and then from class specific expenses. When only certain classes exceed their expense caps, waivers and/or reimbursements are applied against class specific expenses before fund-level expenses. Allspring Funds Management has contractually committed through February 28, 2025 to waive fees and/or reimburse expenses to the extent necessary to cap the Fund’s expenses. Prior to or after the commitment expiration date, the cap may be increased or the commitment to maintain the cap may be terminated only with the approval of the Board of Trustees. As of April 30, 2024, the contractual caps are as follows:
Allspring Emerging Markets Equity Income Fund | 27
Notes to financial statements (unaudited)
Distribution fee
The Trust has adopted a distribution plan for Class C shares pursuant to Rule 12b-1 under the 1940 Act. A distribution fee is charged to Class C shares and paid to Allspring Funds Distributor, LLC (“Allspring Funds Distributor”), the principal underwriter, an affiliate of Allspring Funds Management, at an annual rate up to 0.75% of the average daily net assets of Class C shares.
In addition, Allspring Funds Distributor is entitled to receive the front-end sales charge from the purchase of Class A shares and a contingent deferred sales charge on the redemption of certain Class A shares. Allspring Funds Distributor is also entitled to receive the contingent deferred sales charges from redemptions of Class C shares. For the six months ended April 30, 2024, Allspring Funds Distributor received $171 from the sale of Class A shares. No contingent deferred sales charges were incurred by Class A and Class C shares for the six months ended April 30, 2024.
Shareholder servicing fees
The Trust has entered into contracts with one or more shareholder servicing agents, whereby Class A, Class C, and Administrator Class are charged a fee at an annual rate up to 0.25% of the average daily net assets of each respective class. A portion of these total shareholder servicing fees were paid to affiliates of the Fund.
The Fund may purchase or sell portfolio investment securities to certain affiliates pursuant to Rule 17a-7 under the 1940 Act and under procedures adopted by the Board of Trustees. The procedures have been designed to ensure that these interfund transactions, which do not incur broker commissions, are effected at current market prices. Pursuant to these procedures, the Fund did not have any interfund transactions during the six months ended April 30, 2024.
5.
INVESTMENT PORTFOLIO TRANSACTIONS
Purchases and sales of investments, excluding U.S. government obligations (if any) and short-term securities, for the six months ended April 30, 2024 were $156,328,050 and $145,189,573, respectively.
The Trust (excluding the money market funds), Allspring Master Trust and Allspring Variable Trust are parties to a $350,000,000 revolving credit agreement whereby the Fund is permitted to use bank borrowings for temporary or emergency purposes, such as to fund shareholder redemption requests. Interest under the credit agreement is charged to the Fund based on a borrowing rate equal to the higher of the Federal Funds rate or the overnight bank funding rate in effect on that day plus a spread. In addition, an annual commitment fee based on the unused balance is allocated to each participating fund.
For the six months ended April 30, 2024, there were no borrowings by the Fund under the agreement.
As of the end of the period, the Fund concentrated its portfolio of investments in Information technology and in China and Hong Kong. A fund that invests a substantial portion of its assets in any sector or geographic region may be more affected by changes in that sector or geographic region than would be a fund whose investments are not heavily weighted in any sector or geographic region.
Russia launched a large-scale invasion of Ukraine on February 24, 2022. As a result of this military action, the United States and many other countries have instituted various economic sanctions against Russian and Belarus individuals and entities. The situation has led to increased financial market volatility and could have severe adverse effects on regional and global economic markets, including the markets for certain securities and commodities, such as oil and natural gas. The extent and duration of the military action, resulting sanctions imposed, other punitive action taken and the resulting market disruptions cannot be easily predicted. As of April 30, 2024, the Fund held 0.00% of its total net assets in Russian securities with unrealized losses in the amount of $1,726,284.
Under the Fund’s organizational documents, the officers and Trustees have been granted certain indemnification rights against certain liabilities that may arise out of performance of their duties to the Fund. The Fund has entered into a separate agreement with each Trustee that converts indemnification rights currently existing under the Fund’s organizational documents into contractual rights that cannot be changed in the future without the consent of the Trustee. Additionally, in the normal course of business, the Fund may enter into contracts with service providers that contain a variety of indemnification clauses. The Fund’s maximum exposure under these arrangements is dependent on future claims that may be made against the Fund and, therefore, cannot be estimated.
28 | Allspring Emerging Markets Equity Income Fund
Other information (unaudited)
Other information
Pursuant to Section 853 of the Internal Revenue Code, the following amounts have been designated as foreign taxes paid for the fiscal year ended April 30, 2024. These amounts may be less than the actual foreign taxes paid for financial statement purposes. Foreign taxes paid or withheld should be included in taxable income with an offsetting deduction from gross income or as a credit for taxes paid to foreign governments. None of the income was derived from ineligible foreign sources as defined under Section 901(j) of the Internal Revenue Code.
Creditable
foreign taxes
paid | | Foreign
income as % of
ordinary income
distributions |
| | |
A description of the policies and procedures used to determine how to vote proxies relating to portfolio securities is available without charge, upon request, by calling 1-866-259-3305, visiting our website at allspringglobal.com, or visiting the SEC website at sec.gov. Information regarding how the proxies related to portfolio securities were voted during the most recent 12-month period ended June 30 is available on the website at allspringglobal.com or by visiting the SEC website at sec.gov.
Quarterly portfolio holdings information
The Fund files its complete schedule of portfolio holdings with the SEC for the first and third quarters of each fiscal year as an exhibit to its reports on Form N-PORT. Shareholders may view the filed Form N-PORT by visiting the SEC website at sec.gov.
Allspring Emerging Markets Equity Income Fund | 29
Other information (unaudited)
Board of trustees and officers
Each of the Trustees and Officers listed in the table below acts in identical capacities for each fund in the Allspring family of funds, which consists of 99 mutual funds comprising the Allspring Funds Trust, Allspring Variable Trust, Allspring Master Trust and four closed-end funds (collectively the “Fund Complex”). This table should be read in conjunction with the Prospectus and the Statement of Additional Information*. The mailing address of each Trustee and Officer is 1415 Vantage Park Drive, 3rd Floor, Charlotte, NC 28203. Each Trustee and Officer serves an indefinite term, however, each Trustee serves such term until reaching the mandatory retirement age established by the Trustees.
| Position held and
length of | Principal occupations during past five years or longer | Current other
public company or
investment
company
directorships |
William R. Ebsworth
(Born 1957) | | Retired. From 1984 to 2013, equities analyst, portfolio manager, research director and chief investment officer at Fidelity Management and Research Company in Boston, Tokyo, and Hong Kong, and retired in 2013 as Chief Investment Officer of Fidelity Strategic Advisers, Inc. where he led a team of investment professionals managing client assets. Prior thereto, Board member of Hong Kong Securities Clearing Co., Hong Kong Options Clearing Corp., the Thailand International Fund, Ltd., Fidelity Investments Life Insurance Company, and Empire Fidelity Investments Life Insurance Company. Serves on the Investment Company Institute’s Board of Governors since 2022 and Executive Committee since 2023 as well as the Vice Chairman of the Governing Council of the Independent Directors Council since 2023. Audit Committee Chair and Investment Committee Chair of the Vincent Memorial Hospital Foundation (non-profit organization). Mr. Ebsworth is a CFA charterholder. | |
Jane A. Freeman
(Born 1953) | Trustee,
since 2015;
Chair Liaison,
| Retired. From 2012 to 2014 and 1999 to 2008, Chief Financial Officer of Scientific Learning Corporation. From 2008 to 2012, Ms. Freeman provided consulting services related to strategic business projects. Prior to 1999, Portfolio Manager at Rockefeller & Co. and Scudder, Stevens & Clark. Board member of the Harding Loevner Funds from 1996 to 2014, serving as both Lead Independent Director and chair of the Audit Committee. Board member of the Russell Exchange Traded Funds Trust from 2011 to 2012 and the chair of the Audit Committee. Ms. Freeman is also an inactive Chartered Financial Analyst. | |
Isaiah Harris, Jr.
(Born 1952) | Trustee,
since 2009;
Audit Committee Chair,
since 2019 | Retired. Member of the Advisory Board of CEF of East Central Florida. Chairman of the Board of CIGNA Corporation from 2009 to 2021, and Director from 2005 to 2008. From 2003 to 2011, Director of Deluxe Corporation. Prior thereto, President and CEO of BellSouth Advertising and Publishing Corp. from 2005 to 2007, President and CEO of BellSouth Enterprises from 2004 to 2005 and President of BellSouth Consumer Services from 2000 to 2003. Emeritus member of the Iowa State University Foundation Board of Governors. Emeritus Member of the Advisory board of Iowa State University School of Business. Advisory Board Member, Palm Harbor Academy (private school). Advisory Board Member, Fellowship of Christian Athletes. Mr. Harris is a certified public accountant (inactive status). | |
David F. Larcker
(Born 1950) | | Distinguished Visiting Fellow at the Hoover Institution since 2022. James Irvin Miller Professor of Accounting at the Graduate School of Business (Emeritus), Stanford University, Director of the Corporate Governance Research Initiative and Senior Faculty of The Rock Center for Corporate Governance since 2006. From 2005 to 2008, Professor of Accounting at the Graduate School of Business, Stanford University. Prior thereto, Ernst & Young Professor of Accounting at The Wharton School, University of Pennsylvania from 1985 to 2005. | |
Olivia S. Mitchell
(Born 1953) | | International Foundation of Employee Benefit Plans Professor since 1993, Wharton School of the University of Pennsylvania. Director of Wharton’s Pension Research Council and Boettner Center on Pensions & Retirement Research, and Research Associate at the National Bureau of Economic Research. Previously taught at Cornell University from 1978 to 1993. | |
Timothy J. Penny
(Born 1951) | Trustee,
since 1996;
Chair,
since 2018 | President and Chief Executive Officer of Southern Minnesota Initiative Foundation, a non-profit organization, since 2007. Vice Chair of the Economic Club of Minnesota, since 2007. Co-Chair of the Committee for a Responsible Federal Budget, since 1995. Member of the Board of Trustees of NorthStar Education Finance, Inc., a non-profit organization, from 2007-2022. Senior Fellow of the University of Minnesota Humphrey Institute from 1995 to 2017. | |
** Length of service dates reflect the Trustee’s commencement of service with the Trust’s predecessor entities, where applicable.
*** Ms. Freeman will serve as Chair Liaison through June 2024, at which time Ms. Wheelock will assume the role.
*
The Statement of Additional Information includes additional information about the Trustees and is available, without charge, upon request, by calling 1-800-222-8222 or by visiting the website at allspringglobal.com.
30 | Allspring Emerging Markets Equity Income Fund
Other information (unaudited)
| Position held and length of service** | Principal occupations during past five years or longer | Current other public company or investment company directorships |
James G. Polisson
(Born 1959) | Trustee,
since 2018;
Nominating and Governance Committee Chair,
since 2024 | Retired. Chief Marketing Officer, Source (ETF) UK Services, Ltd, from 2015 to 2017. From 2012 to 2015, Principal of The Polisson Group, LLC, a management consulting, corporate advisory and principal investing company. Chief Executive Officer and Managing Director at Russell Investments, Global Exchange Traded Funds from 2010 to 2012. Managing Director of Barclays Global Investors from 1998 to 2010 and Global Chief Marketing Officer for iShares and Barclays Global Investors from 2000 to 2010. Trustee of the San Francisco Mechanics’ Institute, a non- profit organization, from 2013 to 2015. Board member of the Russell Exchange Traded Fund Trust from 2011 to 2012. Director of Barclays Global Investors Holdings Deutschland GmbH from 2006 to 2009. Mr. Polisson is an attorney and has a retired status with the Massachusetts and District of Columbia Bar Associations. | |
Pamela Wheelock
(Born 1959) | Trustee,
since January 2020;
previously Trustee from
January 2018 to
| Retired. Executive and Senior Financial leadership positions in the public, private and nonprofit sectors. Interim President and CEO, McKnight Foundation, 2020. Interim Commissioner, Minnesota Department of Human Services, 2019. Chief Operating Officer, Twin Cities Habitat for Humanity, 2017-2019. Vice President for University Services, University of Minnesota, 2012- 2016. Interim President and CEO, Blue Cross and Blue Shield of Minnesota, 2011-2012. Executive Vice-President and Chief Financial Officer, Minnesota Wild, 2002-2008. Commissioner, Minnesota Department of Finance, 1999-2002. Chair of the Board of Directors of Destination Medical Center Corporation. Board member of the Minnesota Wild Foundation. | |
** Length of service dates reflect the Trustee’s commencement of service with the Trust’s predecessor entities, where applicable.
*** Ms. Freeman will serve as Chair Liaison through June 2024, at which time Ms. Wheelock will assume the role.
Allspring Emerging Markets Equity Income Fund | 31
Other information (unaudited)
Officers1
| Position held and
length of service | Principal occupations during past five years or longer |
| | President and Chief Executive Officer of Allspring Funds Management, LLC since 2017 and Head of Global Fund Governance of Allspring Global Investments since 2022. Prior thereto, co-president of Galliard Capital Management, LLC, an affiliate of Allspring Funds Management, LLC, from 2019 to 2022 and Head of Affiliated Managers, Allspring Global Investments, from 2014 to 2019 and Executive Vice President responsible for marketing, investments and product development for Allspring Funds Management, LLC, from 2009 to 2014. |
Jeremy DePalma
(Born 1974) | Treasurer,
since 2012
(for certain funds in
the Fund Complex);
since 2021 (for
the remaining funds in the Complex) | Senior Vice President of Allspring Funds Management, LLC since 2009. Senior Vice President of Evergreen Investment Management Company, LLC from 2008 to 2010 and head of the Fund Reporting and Control Team within Fund Administration from 2005 to 2010. |
Christopher Baker
(Born 1976) | Chief Compliance Officer,
since 2022 | Global Chief Compliance Officer for Allspring Global Investments since 2022. Prior thereto, Chief Compliance Officer for State Street Global Advisors from 2018 to 2021. Senior Compliance Officer for the State Street divisions of Alternative Investment Solutions, Sector Solutions, and Global Marketing from 2015 to 2018. From 2010 to 2015 Vice President, Global Head of Investment and Marketing Compliance for State Street Global Advisors. |
Matthew Prasse
(Born 1983) | Chief Legal Officer,
since 2022;
Secretary,
since 2021 | Senior Counsel of the Allspring Legal Department since 2021. Senior Counsel of the Wells Fargo Legal Department from 2018 to 2021. Previously, Counsel for Barings LLC from 2015 to 2018. Prior to joining Barings, Associate at Morgan, Lewis & Bockius LLP from 2008 to 2015. |
1 For those Officers with tenures at Allspring Global Investments and/or Allspring Funds Management, LLC that began prior to 2021, such tenures include years of service during which these businesses/entities were known as Wells Fargo Asset Management and Wells Fargo Funds Management, LLC, respectively.
32 | Allspring Emerging Markets Equity Income Fund
For more information
More information about Allspring Funds is available free upon request. To obtain literature, please write, visit the Fund’s website, or call:
Allspring Funds
P.O. Box 219967
Kansas City, MO 64121-9967
Website: allspringglobal.com
Individual investors: 1-800-222-8222
Retail investment professionals: 1-888-877-9275
Institutional investment professionals: 1-800-260-5969
This report and the financial statements contained herein are submitted for the general information of the shareholders of the Fund. If this report is used for promotional purposes, distribution of the report must be accompanied or preceded by a current prospectus. Before investing, please consider the investment objectives, risks, charges, and expenses of the investment. For a current prospectus and, if available, a summary prospectus, containing this information, call 1-800-222-8222 or visit the Fund’s website at allspringglobal.com. Read the prospectus carefully before you invest or send money.
Allspring Global InvestmentsTM is the trade name for the asset management firms of Allspring Global Investments Holdings, LLC, a holding company indirectly owned by certain private funds of GTCR LLC and Reverence Capital Partners, L.P. These firms include but are not limited to Allspring Global Investments, LLC, and Allspring Funds Management, LLC. Certain products managed by Allspring entities are distributed by Allspring Funds Distributor, LLC (a broker-dealer and Member FINRA/SIPC).
This material is for general informational and educational purposes only and is NOT intended to provide investment advice or a recommendation of any kind - including a recommendation for any specific investment, strategy, or plan.
© 2024 Allspring Global Investments Holdings, LLC. All rights reserved.
ALL-05022024-dwmduaoj 06-24
SAR3356 04-24
Allspring Global Long/Short Equity Fund
The views expressed and any forward-looking statements are as of April 30, 2024, unless otherwise noted, and are those of the portfolio managers and/or Allspring Global Investments. Discussions of individual securities or the markets generally are not intended as individual recommendations. Future events or results may vary significantly from those expressed in any forward-looking statements. The views expressed are subject to change at any time in response to changing circumstances in the market. Allspring Global Investments disclaims any obligation to publicly update or revise any views expressed or forward-looking statements.
Allspring Global Long/Short Equity Fund | 1
Letter to shareholders (unaudited)
Dear Shareholder:
We are pleased to offer you this semi-annual report for the Allspring Global Long/Short Equity Fund for the six-month period that ended April 30, 2024. Globally, stocks and bonds had strongly positive returns for the period. However, markets were volatile as investors focused on persistently high inflation and the impact of aggressive central bank rate hikes. Riskier assets rallied as investors anticipated an end to the tight monetary policy.
For the period, U.S. stocks, based on the S&P 500 Index,1 returned 20.98%. International stocks, as measured by the MSCI ACWI ex USA Index (Net),2 gained 17.69% while the MSCI EM Index (Net) (USD),3 returned 15.40%. Among bond indexes, the Bloomberg U.S. Aggregate Bond Index4 advanced 4.97%, the Bloomberg Global Aggregate ex-USD Index (unhedged)5 gained 3.92%, the Bloomberg Municipal Bond Index6 returned 7.06%, and the ICE BofA U.S. High Yield Index7 gained 8.94%.
Investors remained focused on central bank monetary policies.
As the six-month period began in November, the market mood brightened as cooling inflation inspired confidence that central banks could hold off on further rate hikes. Overall annual inflation in the U.S. fell to 3.1% in November while 12-month inflation in the U.K. and the eurozone eased to 4.6% and 2.4%, respectively—far below their peak levels of mid-2022. Third quarter annualized U.S. GDP growth was raised to an estimated 5.2% while U.S. job totals rose by close to 200,000 in November, indicating a slight cooling of the labor market. All of this fresh evidence added to confidence for a U.S. soft economic landing, leading to a more buoyant mood heading into winter.
The broad year-end rally among stocks and bonds that began in November continued through December as investors became more confident that monetary policy would ease in 2024. Supporting the bubbly market mood were a series of reports confirming lower inflationary trends in the U.S. and Europe. During the period, it appeared more likely that the U.S. economy could achieve a soft landing, cooling enough to lower inflation without the pain of a recession. However, by year-end, an expectations gap developed. Capital markets priced in a total of 1.50 percentage points in federal funds rate cuts in 2024—twice as much as the three cuts of 0.25% hinted at by Fed officials.
1
The S&P 500 Index consists of 500 stocks chosen for market size, liquidity, and industry group representation. It is a market-value-weighted index with each stock’s weight in the index proportionate to its market value. You cannot invest directly in an index.
2
The Morgan Stanley Capital International (MSCI) All Country World Index (ACWI) ex USA Index (Net) is a free-float-adjusted market-capitalization-weighted index that is designed to measure the equity market performance of developed and emerging markets, excluding the U.S. Source: MSCI. MSCI makes no express or implied warranties or representations and shall have no liability whatsoever with respect to any MSCI data contained herein. The MSCI data may not be further redistributed or used as a basis for other indexes or any securities or financial products. This report is not approved, reviewed, or produced by MSCI. You cannot invest directly in an index.
3
The MSCI Emerging Markets (EM) Index (Net) (USD) is a free-float-adjusted market-capitalization-weighted index that is designed to measure the equity market performance of emerging markets. You cannot invest directly in an index.
4
The Bloomberg U.S. Aggregate Bond Index is a broad-based benchmark that measures the investment-grade, U.S.-dollar-denominated, fixed-rate taxable bond market, including Treasuries, government-related and corporate securities, mortgage-backed securities (agency fixed-rate and hybrid adjustable-rate mortgage pass-throughs), asset-backed securities, and commercial mortgage-backed securities. You cannot invest directly in an index.
5
The Bloomberg Global Aggregate ex-USD Index (unhedged) is an unmanaged index that provides a broad-based measure of the global investment-grade fixed-income markets excluding the U.S.-dollar-denominated debt market. You cannot invest directly in an index.
6
The Bloomberg Municipal Bond Index is an unmanaged index composed of long-term tax-exempt bonds with a minimum credit rating of Baa. You cannot invest directly in an index.
7
The ICE BofA U.S. High Yield Index is a market-capitalization-weighted index of domestic and Yankee high yield bonds. The index tracks the performance of high yield securities traded in the U.S. bond market. Returns shown are net of transaction costs beginning on July 1, 2022. You cannot invest directly in an index. Copyright 2024. ICE Data Indices, LLC. All rights reserved.
2 | Allspring Global Long/Short Equity Fund
Letter to shareholders (unaudited)
Financial market performance was mixed in January 2024 as U.S. stocks had modest gains while non-U.S. equities, particularly those in emerging markets, and fixed income assets were held back by central bank pushback on market optimism over rate cuts. Overall, optimism was supported by hints of a soft landing for the U.S. economy. Key data included a surprisingly strong gain of 353,000 jobs in January, an unemployment rate of just 3.7%, and a rise of just 3.1% in the annual Consumer Price Index1 (CPI) in January. However, that resilience helped tone down expectations of a rate cut in March to a more likely second quarter initial move.
In February, stocks were supported by positive economic data and strong corporate earnings. However, fixed income investments were under pressure as resilient inflation curbed expectations on the timing of interest rate cuts. The S&P 500 Index had solid monthly gains along with emerging market equities, which benefited from a rebound in China.
The first quarter of 2024 closed with ongoing stock market momentum and a more muted sense of confidence in fixed income markets as investors adjusted to the prospect of greater-than-expected economic strength. On the flip side, expectations on the timing of an initial Fed rate cut were pushed back from March to June and then beyond. Additionally, the number of quarter-point rate cuts forecast by the market fell from six as projected in December 2023 to two to three cuts by fiscal period-end.
Markets retreated broadly in April as U.S. annual inflation continued to resist monetary policy efforts and expectations for its downward trajectory, with an April CPI reading of 3.4%. The timing of a Fed initial rate cut came into greater question in April. Not only was there less confidence regarding when a first cut would take place but also whether any rate reductions would occur at all in 2024. Market expectations continued to recede to a possible September Fed first cut. Meanwhile, eurozone annual inflation held steady in April at 2.4%. Developed market stocks and fixed income securities of all types were in the red for April.
Don’t let short-term uncertainty derail long-term investment goals.
Periods of investment uncertainty can present challenges, but experience has taught us that maintaining long-term investment goals can be an effective way to plan for the future. To help you create a sound strategy based on your personal goals and risk tolerance, Allspring Funds offers a wide variety of mutual funds spanning many asset classes and investment styles. Although diversification cannot guarantee an investment profit or prevent losses, we believe it can be an effective way to manage investment risk and potentially smooth out overall portfolio performance. We encourage investors to know their investments and to understand that appropriate levels of risk-taking may unlock opportunities.
Thank you for choosing to invest with Allspring Funds. We appreciate your confidence in us and remain committed to helping you meet your financial needs.
Andrew Owen
President
Allspring Funds
“ The first quarter of 2024 closed with ongoing stock market momentum and a more muted sense of confidence in fixed income markets as investors adjusted to the prospect of greater-than-expected economic strength. ”
For further information about your fund, contact your investment professional, visit our website at allspringglobal.com, or call us directly at 1-800-222-8222.
1
The Consumer Price Index (CPI) is a measure of the average change over time in the prices paid by urban consumers for a market basket of consumer goods and services. You cannot invest directly in an index.
Allspring Global Long/Short Equity Fund | 3
Letter to shareholders (unaudited)
|
Beginning in July 2024, the Fund will be required by the Securities and Exchange Commission to send shareholders a paper copy of a new tailored shareholder report in place of the full shareholder report that you are now receiving. The tailored shareholder report will contain concise information about the Fund, including certain expense and performance information and fund statistics. If you wish to receive this new tailored shareholder report electronically, please follow the instructions on the back cover of this report. |
Other information that is currently included in the shareholder report, such as the Fund’s financial statements, will be available online and upon request, free of charge, in paper or electronic format. |
4 | Allspring Global Long/Short Equity Fund
This page is intentionally left blank.
Performance highlights (unaudited)
Performance highlights
| The Fund seeks long-term capital appreciation. |
| Allspring Funds Management, LLC |
| Allspring Global Investments, LLC |
| Kevin Cole, CFA†, Harindra de Silva, Ph.D., CFA, David Krider, CFA |
Average annual total returns (%) as of April 30, 2024 |
| | | | |
| | | | | | | | | |
| | | | | | | | | |
| | | | | | | | | |
| | | | | | | | | |
Institutional Class (AGAZX)6 | | | | | | | | | |
| | | | | | | | | |
MSCI World Index (Net) (USD)8 | | | | | | | | | |
Global Long/Short Equity Blended Index9 | | | | | | | | | |
ICE BofA 3-Month U.S. Treasury Bill Index10 | | | | | | | | | |
Figures quoted represent past performance, which is no guarantee of future results, and do not reflect taxes that a shareholder may pay on an investment in a fund. Investment return and principal value of an investment will fluctuate so that an investor’s shares, when redeemed, may be worth more or less than their original cost. Performance shown without sales charges would be lower if sales charges were reflected. Current performance may be lower or higher than the performance data quoted, which assumes the reinvestment of dividends and capital gains. Current month-end performance is available on the Fund’s website, allspringglobal.com.
Index returns do not include transaction costs associated with buying and selling securities, any mutual fund fees or expenses, or any taxes. It is not possible to invest directly in an index.
For Class A shares, the maximum front-end sales charge is 5.75%. For Class C shares, the maximum contingent deferred sales charge is 1.00%. Performance including a contingent deferred sales charge assumes the sales charge for the corresponding time period. Class R6 and Institutional Class shares are sold without a front-end sales charge or contingent deferred sales charge.
|
| Reflects the expense ratios as stated in the most recent prospectuses, which include the impact of 0.02% in acquired fund fees and expenses. The expense ratios shown are subject to change and may differ from the annualized expense ratios shown in the Financial Highlights of this report, which do not include acquired fund fees and expenses. |
| The manager has contractually committed through February 28, 2025, to waive fees and/or reimburse expenses to the extent necessary to cap total annual fund operating expenses after fee waivers at 1.72% for Class A, 2.47% for Class C, 1.30% for Class R6 and 1.40% for Institutional Class. Brokerage commissions, stamp duty fees, interest, taxes, acquired fund fees and expenses (if any), expenses from dividends and interest on short positions, and extraordinary expenses are excluded from the expense caps. Prior to or after the commitment expiration date, the caps may be increased or the commitment to maintain the caps may be terminated only with the approval of the Board of Trustees. Without these caps, the Fund’s returns would have been lower. The expense ratio paid by an investor is the net expense ratio (the total annual fund operating expenses after fee waivers) as stated in the prospectuses. |
| Historical performance shown for the Class A shares prior to December 16, 2022, is based on the performance of the Investor Class shares of the Fund’s predecessor, 361 Global Long/Short Equity Fund (the “Predecessor Fund”), and for the period prior to December 12, 2014, is based on the performance of a predecessor account, the Analytic Global Long/Short Equity Fund, L.P., a limited partnership that was reorganized into the Predecessor Fund on December 12, 2014 (the “Predecessor Account”). Performance of the Predecessor Account reflects the higher expenses applicable to it and returns would have been higher if adjusted to reflect Predecessor Fund expenses. The Predecessor Account was not registered under the Investment Company Act of 1940 (the “1940 Act”), and was not subject to certain restrictions imposed by the 1940 Act. If the Predecessor Account had been registered under the 1940 Act, performance may have been adversely affected. |
| Historical performance for the Class C shares prior to their inception reflects the performance of the Class A shares and is not adjusted to reflect the higher expenses applicable to the Class C shares. If these expenses had been included, returns would be lower. |
| Historical performance shown for the Class R6 shares prior to December 16, 2022 is based on the performance of Class Y shares of the Fund’s predecessor, 361 Global Long/Short Equity Fund (the “Predecessor Fund”), and for the period prior to December 12, 2014, is based on the performance of a predecessor account, the Analytic Global Long/Short Equity Fund, L.P., a limited partnership that was reorganized into the Predecessor Fund on December 12, 2014 (the “Predecessor Account”). Performance of the Predecessor Account reflects the higher expenses applicable to it and returns would have been higher if adjusted to reflect Predecessor Fund expenses. The Predecessor Account was not registered under the Investment Company Act of 1940 (the “1940 Act”), and was not subject to certain restrictions imposed by the 1940 Act. If the Predecessor Account had been registered under the 1940 Act, performance may have been adversely affected. |
| Mr. Cole became a portfolio manager of the Fund on January 24, 2024. |
CFA® and Chartered Financial Analyst® are trademarks owned by CFA Institute. |
6 | Allspring Global Long/Short Equity Fund
Performance highlights (unaudited)
Footnotes continued from previous page |
| Historical performance shown for the Institutional Class shares prior to December 16, 2022, is based on the performance of Class I shares of the Fund’s predecessor, 361 Global Long/Short Equity Fund (the “Predecessor Fund”), and for the period prior to December 12, 2014, is based on the performance of a predecessor account, the Analytic Global Long/Short Equity Fund, L.P., a limited partnership that was reorganized into the Predecessor Fund on December 12, 2014 (the “Predecessor Account”). Performance of the Predecessor Account reflects the higher expenses applicable to it and returns would have been higher if adjusted to reflect Predecessor Fund expenses. The Predecessor Account was not registered under the Investment Company Act of 1940 (the “1940 Act”) and was not subject to certain restrictions imposed by the 1940 Act. If the Predecessor Account had been registered under the 1940 Act, performance may have been adversely affected. |
| The Morgan Stanley Capital International (MSCI) All Country World Index (ACWI) (Net) is a free-float-adjusted market-capitalization-weighted index that is designed to measure the equity market performance of developed and emerging markets. Source: MSCI. MSCI makes no express or implied warranties or representations and shall have no liability whatsoever with respect to any MSCI data contained herein. The MSCI data may not be further redistributed or used as a basis for other indexes or any securities or financial products. This report is not approved, reviewed, or produced by MSCI. You cannot invest directly in an index. |
| The MSCI World Index (Net) (USD) is a free-float-adjusted market-capitalization-weighted index that is designed to measure the equity market performance of developed markets. You cannot invest directly in an index. |
| Source: Allspring Funds Management, LLC. The Global Long/Short Equity Blended Index is weighted 50% MSCI World Index (Net) (USD) and 50% ICE BofA 3-Month U.S. Treasury Bill Index. You cannot invest directly in an index. |
| The ICE BofA 3-Month U.S. Treasury Bill Index is an unmanaged index that is comprised of a single U.S. Treasury issue with approximately three months to final maturity, purchased at the beginning of each month and held for one full month. You cannot invest directly in an index. Copyright 2024. ICE Data Indices, LLC. All rights reserved. |
Investing involves risk, including the possible loss of principal. Stock values fluctuate in response to the activities of individual companies and general market and economic conditions. Foreign investments are especially volatile and can rise or fall dramatically due to differences in the political and economic conditions of the host country. Short selling is generally considered speculative, has the potential for unlimited loss, and may involve leverage. Consult the Fund’s prospectus for additional information on these and other risks.
Allspring Global Long/Short Equity Fund | 7
Performance highlights (unaudited)
Ten largest Long Positions (%) as of April 30, 20241 |
| |
| |
| |
| |
| |
CK Hutchison Holdings Ltd. | |
| |
Molson Coors Beverage Co. Class B | |
| |
| |
| Figures represent the percentage of the Fund’s net assets. Holdings are subject to change and may have changed since the date specified. |
Five largest short positions (%) as of April 30, 20241 |
| |
Ivanhoe Mines Ltd. Class A | |
| |
| |
| |
| Figures represent the percentage of the Fund’s net assets. Holdings are subject to change and may have changed since the date specified. |
Sector Allocation for Long and Short positions as of |
| | |
| | |
| | |
| | |
| | |
| | |
| | |
| | |
| | |
| | |
| | |
| | |
| Figures represent the percentage of the Fund’s long and short positions. Allocations are subject to change and may have changed since the date specified. |
Country Allocation for Long and Short positions as of
|
| | |
| | |
| | |
| | |
| | |
| | |
| | |
| | |
| | |
| | |
| | |
| | |
| | |
| | |
| | |
| | |
| Figures represent the percentage of the Fund’s long and short positions. Allocations are subject to change and may have changed since the date specified. |
8 | Allspring Global Long/Short Equity Fund
Fund expenses (unaudited)
Fund expenses
As a shareholder of the Fund, you incur two types of costs: (1) transaction costs, including sales charges (loads) on purchase payments and contingent deferred sales charges (if any) on redemptions and (2) ongoing costs, including management fees, distribution (12b-1) and/or shareholder servicing fees, and other Fund expenses. This example is intended to help you understand your ongoing costs (in dollars) of investing in the Fund and to compare these costs with the ongoing costs of investing in other mutual funds.
The example is based on an investment of $1,000 invested at the beginning of the six-month period and held for the entire period from November 1, 2023 to April 30, 2024.
The “Actual” line of the table below provides information about actual account values and actual expenses. You may use the information in this line, together with the amount you invested, to estimate the expenses that you paid over the period. Simply divide your account value by $1,000 (for example, an $8,600 account value divided by $1,000= 8.6), then multiply the result by the number in the “Actual” line under the heading entitled “Expenses paid during period” for your applicable class of shares to estimate the expenses you paid on your account during this period.
Hypothetical example for comparison purposes
The “Hypothetical” line of the table below provides information about hypothetical account values and hypothetical expenses based on the Fund’s actual expense ratio and an assumed rate of return of 5% per year before expenses, which is not the Fund’s actual return. The hypothetical account values and expenses may not be used to estimate the actual ending account balance or expenses you paid for the period. You may use this information to compare the ongoing costs of investing in the Fund and other funds. To do so, compare this 5% hypothetical example with the 5% hypothetical examples that appear in the shareholder reports of the other funds.
Please note that the expenses shown in the table are meant to highlight your ongoing costs only and do not reflect any transactional costs, such as sales charges (loads) and contingent deferred sales charges. Therefore, the “Hypothetical” line of the table is useful in comparing ongoing costs only, and will not help you determine the relative total costs of owning different funds. In addition, if these transactional costs were included, your costs would have been higher.
| Beginning
account value
11-1-2023 | Ending
account value
4-30-2024 | | Annualized net
expense ratio |
| | | | |
| | | | |
Hypothetical (5% return before expenses) | | | | |
| | | | |
| | | | |
Hypothetical (5% return before expenses) | | | | |
| | | | |
| | | | |
Hypothetical (5% return before expenses) | | | | |
| | | | |
| | | | |
Hypothetical (5% return before expenses) | | | | |
| Expenses paid is equal to the annualized net expense ratio of each class multiplied by the average account value over the period, multiplied by 182 divided by 366 (to reflect the one-half-year period). |
Allspring Global Long/Short Equity Fund | 9
Portfolio of investments—April 30, 2024 (unaudited)
| | | | | |
| | | | | | |
| | | | | | |
Fortescue Ltd. (Materials, Metals & mining) | | | | | | |
Helia Group Ltd. (Financials, Financial services) | | | | | | |
Origin Energy Ltd. (Utilities, Electric utilities) | | | | | | |
Rio Tinto Ltd. (Materials, Metals & mining) | | | | | | |
| | | | | | |
| | | | | | |
ams-OSRAM AG (Information technology, Semiconductors & semiconductor equipment)† | | | | | | |
| | | | | | |
Cogeco Communications, Inc. (Communication services, Diversified telecommunication services) | | | | | | |
Dundee Precious Metals, Inc. (Materials, Metals & mining) | | | | | | |
Empire Co. Ltd. Class A (Consumer staples, Consumer staples distribution & retail) | | | | | | |
Fairfax Financial Holdings Ltd. (Financials, Insurance) | | | | | | |
Great-West Lifeco, Inc. (Financials, Insurance) | | | | | | |
Parkland Corp. (Energy, Oil, gas & consumable fuels) | | | | | | |
Power Corp. of Canada (Financials, Insurance) | | | | | | |
Trican Well Service Ltd. (Energy, Energy equipment & services) | | | | | | |
| | | | | | |
| | | | | | |
Danske Bank AS (Financials, Banks) | | | | | | |
Novo Nordisk AS Class B (Health care, Pharmaceuticals) | | | | | | |
| | | | | | |
| | | | | | |
SEB SA (Consumer discretionary, Household durables) | | | | | | |
Teleperformance SE (Industrials, Professional services)† | | | | | | |
| | | | | | |
| | | | | | |
Daimler Truck Holding AG (Industrials, Machinery) | | | | | | |
Deutsche Bank AG (Financials, Capital markets) | | | | | | |
Heidelberg Materials AG (Materials, Construction materials) | | | | | | |
| | | | | | |
| | | | | | |
Jardine Matheson Holdings Ltd. (Industrials, Industrial conglomerates) | | | | | | |
Swire Pacific Ltd. Class A (Real estate, Real estate management & development) | | | | | | |
| | | | | | |
The accompanying notes are an integral part of these financial statements.
10 | Allspring Global Long/Short Equity Fund
Portfolio of investments—April 30, 2024 (unaudited)
| | | | | |
| | | | | | |
Alkermes PLC (Health care, Biotechnology)†# | | | | | | |
Medtronic PLC (Health care, Health care equipment & supplies)# | | | | | | |
Weatherford International PLC (Energy, Energy equipment & services)†# | | | | | | |
| | | | | | |
| | | | | | |
Banca Monte dei Paschi di Siena SpA (Financials, Banks)† | | | | | | |
| | | | | | |
Chubu Electric Power Co., Inc. (Utilities, Electric utilities) | | | | | | |
Hitachi Construction Machinery Co. Ltd. (Industrials, Machinery) | | | | | | |
Inpex Corp. (Energy, Oil, gas & consumable fuels) | | | | | | |
JFE Holdings, Inc. (Materials, Metals & mining) | | | | | | |
Kansai Electric Power Co., Inc. (Utilities, Electric utilities) | | | | | | |
Komatsu Ltd. (Industrials, Machinery) | | | | | | |
Mizuho Financial Group, Inc. (Financials, Banks) | | | | | | |
Nippon Yusen KK (Industrials, Marine transportation) | | | | | | |
Osaka Gas Co. Ltd. (Utilities, Gas utilities) | | | | | | |
Panasonic Holdings Corp. (Consumer discretionary, Household durables) | | | | | | |
SCREEN Holdings Co. Ltd. (Information technology, Semiconductors & semiconductor equipment) | | | | | | |
Tokyo Electric Power Co. Holdings, Inc. (Utilities, Electric utilities)† | | | | | | |
Tokyo Kiraboshi Financial Group, Inc. (Financials, Banks) | | | | | | |
Toyota Tsusho Corp. (Industrials, Trading companies & distributors) | | | | | | |
| | | | | | |
| | | | | | |
CNH Industrial NV (Industrials, Machinery)†# | | | | | | |
EXOR NV (Financials, Financial services) | | | | | | |
Stellantis NV (Consumer discretionary, Automobiles) | | | | | | |
| | | | | | |
| | | | | | |
Hoegh Autoliners ASA (Industrials, Marine transportation) | | | | | | |
Wallenius Wilhelmsen ASA (Industrials, Marine transportation) | | | | | | |
| | | | | | |
| | | | | | |
Jeronimo Martins SGPS SA (Consumer staples, Consumer staples distribution & retail) | | | | | | |
| | | | | | |
BW LPG Ltd. (Energy, Oil, gas & consumable fuels)144A | | | | | | |
Jardine Cycle & Carriage Ltd. (Industrials, Industrial conglomerates) | | | | | | |
Sembcorp Industries Ltd. (Utilities, Multi-utilities) | | | | | | |
Wilmar International Ltd. (Consumer staples, Food products) | | | | | | |
| | | | | | |
The accompanying notes are an integral part of these financial statements.
Allspring Global Long/Short Equity Fund | 11
Portfolio of investments—April 30, 2024 (unaudited)
| | | | | |
| | | | | | |
Betsson AB Class B (Consumer discretionary, Hotels, restaurants & leisure) | | | | | | |
Industrivarden AB Class C (Financials, Financial services) | | | | | | |
Intrum AB (Industrials, Commercial services & supplies) | | | | | | |
Volvo AB Class A (Industrials, Machinery) | | | | | | |
Volvo AB Class B (Industrials, Machinery) | | | | | | |
| | | | | | |
| | | | | | |
Adecco Group AG (Industrials, Professional services) | | | | | | |
BKW AG (Utilities, Electric utilities) | | | | | | |
Bunge Global SA (Consumer staples, Food products)# | | | | | | |
Swatch Group AG (Consumer discretionary, Textiles, apparel & luxury goods) | | | | | | |
| | | | | | |
| | | | | | |
Bank of Georgia Group plc (Financials, Banks) | | | | | | |
Barclays PLC (Financials, Banks) | | | | | | |
BT Group PLC (Communication services, Diversified telecommunication services) | | | | | | |
Centrica PLC (Utilities, Multi-utilities) | | | | | | |
CK Hutchison Holdings Ltd. (Industrials, Industrial conglomerates) | | | | | | |
Close Brothers Group plc (Financials, Banks) | | | | | | |
Coca-Cola Europacific Partners PLC (Consumer staples, Beverages)# | | | | | | |
HSBC Holdings PLC (Financials, Banks) | | | | | | |
J Sainsbury PLC (Consumer staples, Consumer staples distribution & retail) | | | | | | |
Serica Energy plc (Energy, Oil, gas & consumable fuels) | | | | | | |
Standard Chartered PLC (Financials, Banks) | | | | | | |
Unilever PLC London Stock Exchange (Consumer staples, Personal care products) | | | | | | |
Vodafone Group PLC (Communication services, Wireless telecommunication services) | | | | | | |
| | | | | | |
| | | | | | |
AbbVie, Inc. (Health care, Biotechnology)# | | | | | | |
Adobe, Inc. (Information technology, Software)†# | | | | | | |
Alphabet, Inc. Class A (Communication services, Interactive media & services)†# | | | | | | |
Alphabet, Inc. Class C (Communication services, Interactive media & services)†# | | | | | | |
Altria Group, Inc. (Consumer staples, Tobacco)# | | | | | | |
A-Mark Precious Metals, Inc. (Financials, Financial services)# | | | | | | |
Amazon.com, Inc. (Consumer discretionary, Broadline retail)†# | | | | | | |
AMC Networks, Inc. Class A (Communication services, Media)†# | | | | | | |
American Tower Corp. (Real estate, Specialized REITs)# | | | | | | |
Amphastar Pharmaceuticals, Inc. (Health care, Pharmaceuticals)†# | | | | | | |
The accompanying notes are an integral part of these financial statements.
12 | Allspring Global Long/Short Equity Fund
Portfolio of investments—April 30, 2024 (unaudited)
| | | | | |
| | | | | | |
Apple, Inc. (Information technology, Technology hardware, storage & peripherals)# | | | | | | |
Archer-Daniels-Midland Co. (Consumer staples, Food products)# | | | | | | |
Arista Networks, Inc. (Information technology, Communications equipment)†# | | | | | | |
AT&T, Inc. (Communication services, Diversified telecommunication services)# | | | | | | |
Axcelis Technologies, Inc. (Information technology, Semiconductors & semiconductor equipment)†# | | | | | | |
Bank of New York Mellon Corp. (Financials, Capital markets)# | | | | | | |
Beazer Homes USA, Inc. (Consumer discretionary, Household durables)†# | | | | | | |
BellRing Brands, Inc. (Consumer staples, Personal care products)†# | | | | | | |
Berkshire Hathaway, Inc. Class B (Financials, Financial services)†# | | | | | | |
Best Buy Co., Inc. (Consumer discretionary, Specialty retail)# | | | | | | |
Booking Holdings, Inc. (Consumer discretionary, Hotels, restaurants & leisure)# | | | | | | |
Bristol-Myers Squibb Co. (Health care, Pharmaceuticals)# | | | | | | |
Broadcom, Inc. (Information technology, Semiconductors & semiconductor equipment)# | | | | | | |
Builders FirstSource, Inc. (Industrials, Building products)†# | | | | | | |
Campbell Soup Co. (Consumer staples, Food products)# | | | | | | |
Cardinal Health, Inc. (Health care, Health care providers & services)# | | | | | | |
Cencora, Inc. (Health care, Health care providers & services)# | | | | | | |
Centene Corp. (Health care, Health care providers & services)†# | | | | | | |
Central Garden & Pet Co. (Consumer staples, Household products)†# | | | | | | |
Charter Communications, Inc. Class A (Communication services, Media)†# | | | | | | |
Cisco Systems, Inc. (Information technology, Communications equipment)# | | | | | | |
Clorox Co. (Consumer staples, Household products)# | | | | | | |
Colgate-Palmolive Co. (Consumer staples, Household products)# | | | | | | |
Comcast Corp. Class A (Communication services, Media)# | | | | | | |
Consensus Cloud Solutions, Inc. (Information technology, Software)†# | | | | | | |
Consolidated Edison, Inc. (Utilities, Multi-utilities)# | | | | | | |
Corebridge Financial, Inc. (Financials, Financial services)# | | | | | | |
Costco Wholesale Corp. (Consumer staples, Consumer staples distribution & retail)# | | | | | | |
Customers Bancorp, Inc. (Financials, Banks)†# | | | | | | |
CVS Health Corp. (Health care, Health care providers & services)# | | | | | | |
D.R. Horton, Inc. (Consumer discretionary, Household durables)# | | | | | | |
Deckers Outdoor Corp. (Consumer discretionary, Textiles, apparel & luxury goods)†# | | | | | | |
Dorian LPG Ltd. (Energy, Oil, gas & consumable fuels)# | | | | | | |
Dream Finders Homes, Inc. Class A (Consumer discretionary, Household durables)†# | | | | | | |
Dropbox, Inc. Class A (Information technology, Software)†# | | | | | | |
eBay, Inc. (Consumer discretionary, Broadline retail)# | | | | | | |
Electronic Arts, Inc. (Communication services, Entertainment)# | | | | | | |
The accompanying notes are an integral part of these financial statements.
Allspring Global Long/Short Equity Fund | 13
Portfolio of investments—April 30, 2024 (unaudited)
| | | | | |
| | | | | | |
Equinix, Inc. (Real estate, Specialized REITs)# | | | | | | |
Equity LifeStyle Properties, Inc. (Real estate, Residential REITs)# | | | | | | |
FedEx Corp. (Industrials, Air freight & logistics)# | | | | | | |
Ferguson PLC (Industrials, Trading companies & distributors)# | | | | | | |
First Citizens BancShares, Inc. Class A (Financials, Banks)# | | | | | | |
Ford Motor Co. (Consumer discretionary, Automobiles)# | | | | | | |
Franklin Resources, Inc. (Financials, Capital markets)# | | | | | | |
Genuine Parts Co. (Consumer discretionary, Distributors)# | | | | | | |
Gilead Sciences, Inc. (Health care, Biotechnology)# | | | | | | |
Huntington Ingalls Industries, Inc. (Industrials, Aerospace & defense)# | | | | | | |
Hyster-Yale Materials Handling, Inc. (Industrials, Machinery)# | | | | | | |
Incyte Corp. (Health care, Biotechnology)†# | | | | | | |
International Business Machines Corp. (Information technology, IT services)# | | | | | | |
Jabil, Inc. (Information technology, Electronic equipment, instruments & components)# | | | | | | |
James River Group Holdings Ltd. (Financials, Insurance)# | | | | | | |
Kimberly-Clark Corp. (Consumer staples, Household products)# | | | | | | |
Kraft Heinz Co. (Consumer staples, Food products)# | | | | | | |
Lennar Corp. Class A (Consumer discretionary, Household durables)# | | | | | | |
Lockheed Martin Corp. (Industrials, Aerospace & defense)# | | | | | | |
Masco Corp. (Industrials, Building products)# | | | | | | |
Medifast, Inc. (Consumer staples, Personal care products)# | | | | | | |
Meta Platforms, Inc. Class A (Communication services, Interactive media & services)# | | | | | | |
Metropolitan Bank Holding Corp. (Financials, Banks)†# | | | | | | |
Microsoft Corp. (Information technology, Software)# | | | | | | |
Molina Healthcare, Inc. (Health care, Health care providers & services)†# | | | | | | |
Molson Coors Beverage Co. Class B (Consumer staples, Beverages)# | | | | | | |
NVIDIA Corp. (Information technology, Semiconductors & semiconductor equipment)# | | | | | | |
OraSure Technologies, Inc. (Health care, Health care equipment & supplies)†# | | | | | | |
Otis Worldwide Corp. (Industrials, Machinery)# | | | | | | |
Owens Corning (Industrials, Building products)# | | | | | | |
PACCAR, Inc. (Industrials, Machinery)# | | | | | | |
Palo Alto Networks, Inc. (Information technology, Software)†# | | | | | | |
Photronics, Inc. (Information technology, Semiconductors & semiconductor equipment)†# | | | | | | |
Powell Industries, Inc. (Industrials, Electrical equipment)# | | | | | | |
PulteGroup, Inc. (Consumer discretionary, Household durables)# | | | | | | |
REV Group, Inc. (Industrials, Machinery)# | | | | | | |
Roivant Sciences Ltd. (Health care, Biotechnology)†# | | | | | | |
Solventum Corp. (Health care, Health care equipment & supplies)†# | | | | | | |
United Therapeutics Corp. (Health care, Biotechnology)†# | | | | | | |
Viatris, Inc. (Health care, Pharmaceuticals)# | | | | | | |
VICI Properties, Inc. (Real estate, Specialized REITs)# | | | | | | |
The accompanying notes are an integral part of these financial statements.
14 | Allspring Global Long/Short Equity Fund
Portfolio of investments—April 30, 2024 (unaudited)
| | | | | |
| | | | | | |
Walgreens Boots Alliance, Inc. (Consumer staples, Consumer staples distribution & retail)# | | | | | | |
Xerox Holdings Corp. (Information technology, Technology hardware, storage & peripherals)# | | | | | | |
Zscaler, Inc. (Information technology, Software)†# | | | | | | |
| | | | | | |
Total common stocks (Cost $448,171,356) | | | | | | |
| | | | | |
| | | | | | |
| | | | | | |
Bayerische Motoren Werke AG (Consumer discretionary, Automobiles) | | | | | | |
Volkswagen AG (Consumer discretionary, Automobiles) | | | | | | |
Total preferred stocks (Cost $4,935,912) | | | | | | |
| | | | | |
| | | | | | |
| | | | | | |
Constellation Software, Inc. (Information technology, Software)♦† | | | | | | |
| | | | | | |
| | | | | |
Short-term investments: 10.94% | | | | | | |
Investment companies: 10.94% | | | | | | |
Allspring Government Money Market Fund Select Class♠∞ | | | | | | |
Total short-term investments (Cost $53,058,946) | | | | | | |
Total investments in securities (Cost $506,166,214) | | | | | | |
| | | | | |
Securities sold short: (30.00)% | | | | | | |
| | | | | | |
| | | | | | |
APA Group (Utilities, Gas utilities) | | | | | | |
BrainChip Holdings Ltd. (Information technology, Software) | | | | | | |
De Grey Mining Ltd. (Materials, Metals & mining) | | | | | | |
Mineral Resources Ltd. (Materials, Metals & mining) | | | | | | |
| | | | | | |
| | | | | | |
Ballard Power Systems, Inc. (Industrials, Electrical equipment) | | | | | | |
Filo Corp. (Materials, Metals & mining) | | | | | | |
The accompanying notes are an integral part of these financial statements.
Allspring Global Long/Short Equity Fund | 15
Portfolio of investments—April 30, 2024 (unaudited)
| | | | | |
| | | | | | |
First Quantum Minerals Ltd. (Materials, Metals & mining) | | | | | | |
Ivanhoe Mines Ltd. Class A (Materials, Metals & mining) | | | | | | |
| | | | | | |
| | | | | | |
Sartorius Stedim Biotech (Health care, Life sciences tools & services) | | | | | | |
| | | | | | |
Delivery Hero SE (Consumer discretionary, Hotels, restaurants & leisure)144A | | | | | | |
MTU Aero Engines AG (Industrials, Aerospace & defense) | | | | | | |
| | | | | | |
| | | | | | |
Amplifon SpA (Health care, Health care providers & services) | | | | | | |
Salvatore Ferragamo SpA (Consumer discretionary, Textiles, apparel & luxury goods) | | | | | | |
| | | | | | |
| | | | | | |
Daiichi Sankyo Co. Ltd. (Health care, Pharmaceuticals) | | | | | | |
Dentsu Group, Inc. (Communication services, Media) | | | | | | |
Eisai Co. Ltd. (Health care, Pharmaceuticals) | | | | | | |
NIDEC Corp. (Industrials, Electrical equipment) | | | | | | |
RENOVA, Inc. (Utilities, Independent power and renewable electricity producers) | | | | | | |
Sumitomo Pharma Co. Ltd. (Health care, Pharmaceuticals) | | | | | | |
Suzuki Motor Corp. (Consumer discretionary, Automobiles) | | | | | | |
| | | | | | |
| | | | | | |
Airbus SE (Industrials, Aerospace & defense) | | | | | | |
Argenx SE (Health care, Biotechnology) | | | | | | |
OCI NV (Materials, Chemicals) | | | | | | |
| | | | | | |
| | | | | | |
NEL ASA (Industrials, Electrical equipment) | | | | | | |
| | | | | | |
Beijer Ref AB (Industrials, Trading companies & distributors) | | | | | | |
EQT AB (Financials, Capital markets) | | | | | | |
PowerCell Sweden AB (Industrials, Electrical equipment) | | | | | | |
Sagax AB Class B (Real estate, Real estate management & development) | | | | | | |
| | | | | | |
| | | | | | |
Avolta AG (Consumer discretionary, Specialty retail) | | | | | | |
The accompanying notes are an integral part of these financial statements.
16 | Allspring Global Long/Short Equity Fund
Portfolio of investments—April 30, 2024 (unaudited)
| | | | | |
| | | | | | |
IWG PLC (Real estate, Real estate management & development) | | | | | | |
Siemens Energy AG (Industrials, Electrical equipment) | | | | | | |
| | | | | | |
| | | | | | |
Croda International PLC (Materials, Chemicals) | | | | | | |
ITM Power PLC (Industrials, Electrical equipment) | | | | | | |
Legal & General Group plc (Financials, Insurance) | | | | | | |
Melrose Industries PLC (Industrials, Aerospace & defense) | | | | | | |
Ocado Group PLC (Consumer staples, Consumer staples distribution & retail) | | | | | | |
Oxford Nanopore Technologies PLC (Health care, Life sciences tools & services) | | | | | | |
Tullow Oil PLC (Energy, Oil, gas & consumable fuels) | | | | | | |
WPP PLC (Communication services, Media) | | | | | | |
| | | | | | |
| | | | | | |
23andMe Holding Co. Class A (Health care, Health care providers & services) | | | | | | |
ACELYRIN, Inc. (Health care, Biotechnology) | | | | | | |
AMC Entertainment Holdings, Inc. Class A (Communication services, Entertainment) | | | | | | |
Applied Digital Corp. (Information technology, IT services) | | | | | | |
Boeing Co. (Industrials, Aerospace & defense) | | | | | | |
Cassava Sciences, Inc. (Health care, Pharmaceuticals) | | | | | | |
Certara, Inc. (Health care, Health care technology) | | | | | | |
ChargePoint Holdings, Inc. (Industrials, Electrical equipment) | | | | | | |
Clear Channel Outdoor Holdings, Inc. (Communication services, Media) | | | | | | |
Community Health Systems, Inc. (Health care, Health care providers & services) | | | | | | |
Enovix Corp. (Industrials, Electrical equipment) | | | | | | |
Exact Sciences Corp. (Health care, Biotechnology) | | | | | | |
Freeport-McMoRan, Inc. (Materials, Metals & mining) | | | | | | |
Freyr Battery, Inc. (Industrials, Electrical equipment) | | | | | | |
FuelCell Energy, Inc. (Industrials, Electrical equipment) | | | | | | |
Globalstar, Inc. (Communication services, Diversified telecommunication services) | | | | | | |
Joby Aviation, Inc. (Industrials, Passenger airlines) | | | | | | |
Kura Sushi USA, Inc. Class A (Consumer discretionary, Hotels, restaurants & leisure) | | | | | | |
Lattice Semiconductor Corp. (Information technology, Semiconductors & semiconductor equipment) | | | | | | |
Lemonade, Inc. (Financials, Insurance) | | | | | | |
Luminar Technologies, Inc. (Consumer discretionary, Automobile components) | | | | | | |
MicroVision, Inc. (Information technology, Electronic equipment, instruments & components) | | | | | | |
The accompanying notes are an integral part of these financial statements.
Allspring Global Long/Short Equity Fund | 17
Portfolio of investments—April 30, 2024 (unaudited)
| | | | | |
| | | | | | |
Moderna, Inc. (Health care, Biotechnology) | | | | | | |
MongoDB, Inc. (Information technology, IT services) | | | | | | |
MP Materials Corp. (Materials, Metals & mining) | | | | | | |
NextDecade Corp. (Energy, Oil, gas & consumable fuels) | | | | | | |
Nikola Corp. (Industrials, Machinery) | | | | | | |
Pliant Therapeutics, Inc. (Health care, Pharmaceuticals) | | | | | | |
PureCycle Technologies, Inc. (Materials, Chemicals) | | | | | | |
QuantumScape Corp. (Consumer discretionary, Automobile components) | | | | | | |
Redfin Corp. (Real estate, Real estate management & development) | | | | | | |
Revance Therapeutics, Inc. (Health care, Pharmaceuticals) | | | | | | |
Rivian Automotive, Inc. Class A (Consumer discretionary, Automobiles) | | | | | | |
Roblox Corp. Class A (Communication services, Entertainment) | | | | | | |
Seritage Growth Properties Class A (Real estate, Real estate management & development) | | | | | | |
Solid Power, Inc. (Consumer discretionary, Automobile components) | | | | | | |
Syndax Pharmaceuticals, Inc. (Health care, Biotechnology) | | | | | | |
Targa Resources Corp. (Energy, Oil, gas & consumable fuels) | | | | | | |
Tellurian, Inc. (Energy, Oil, gas & consumable fuels) | | | | | | |
Toast, Inc. Class A (Financials, Financial services) | | | | | | |
Trade Desk, Inc. Class A (Communication services, Media) | | | | | | |
Triumph Group, Inc. (Industrials, Aerospace & defense) | | | | | | |
Unity Software, Inc. (Information technology, Software) | | | | | | |
Upstart Holdings, Inc. (Financials, Consumer finance) | | | | | | |
Virgin Galactic Holdings, Inc. (Industrials, Aerospace & defense) | | | | | | |
Wynn Resorts Ltd. (Consumer discretionary, Hotels, restaurants & leisure) | | | | | | |
| | | | | | |
Total common stocks (Cost $(162,250,172)) | | | | | | |
| | | | | | |
Preferred stocks: (0.09)% | | | | | | |
| | | | | | |
Dr Ing hc F Porsche AG (Consumer discretionary, Automobiles)144A | | | | | | |
Total preferred stocks (Cost $(482,511)) | | | | | | |
Total securities sold short (Proceeds $(162,732,683)) | | | | | | |
Other assets and liabilities, net | | | | | | |
| | | | | | |
| Non-income-earning security |
| All or a portion of this security is segregated as collateral for securities sold short. |
| The security may be resold in transactions exempt from registration, normally to qualified institutional buyers, pursuant to Rule 144A under the Securities Act of 1933. |
| The security is fair valued in accordance with procedures approved by the Board of Trustees. |
| The issuer of the security is an affiliated person of the Fund as defined in the Investment Company Act of 1940. |
| The rate represents the 7-day annualized yield at period end. |
The accompanying notes are an integral part of these financial statements.
18 | Allspring Global Long/Short Equity Fund
Portfolio of investments—April 30, 2024 (unaudited)
|
| Real estate investment trust |
Investments in affiliates
An affiliated investment is an investment in which the Fund owns at least 5% of the outstanding voting shares of the issuer or as a result of other relationships, such as the Fund and the issuer having the same investment manager. Transactions with issuers that were affiliates of the Fund at the end of the period were as follows:
| | | | | Net
change in
unrealized
gains
(losses) | | | Income
from
affiliated
securities |
| | | | | | | | |
Allspring Government Money Market Fund Select Class | | | | | | | | |
The accompanying notes are an integral part of these financial statements.
Allspring Global Long/Short Equity Fund | 19
Statement of assets and liabilities—April 30, 2024 (unaudited)
Financial statements
Statement of assets and liabilities
| |
Investments in unaffiliated securities, at value (cost $453,107,268) | |
Investments in affiliated securities, at value (cost $53,058,946) | |
Cash deposited with brokers for securities sold short | |
Foreign currency, at value (cost $700,725) | |
| |
Receivable for Fund shares sold | |
Prepaid expenses and other assets | |
| |
| |
Securities sold short, at value (proceeds $162,732,683) | |
Payable for borrowing on margin loan | |
| |
Payable for dividends on securities sold short | |
Payable for interest expense on margin loan | |
Payable for Fund shares redeemed | |
Administration fees payable | |
Distribution fees payable | |
Accrued expenses and other liabilities | |
| |
| |
| |
| |
Total distributable earnings | |
| |
Computation of net asset value and offering price per share | |
| |
Shares outstanding–Class A1 | |
Net asset value per share–Class A | |
Maximum offering price per share – Class A2 | |
| |
Shares outstanding–Class C1 | |
Net asset value per share–Class C | |
| |
Shares outstanding–Class R61 | |
Net asset value per share–Class R6 | |
Net assets–Institutional Class | |
Shares outstanding–Institutional Class1 | |
Net asset value per share–Institutional Class | |
1 The Fund has an unlimited number of authorized shares.
2 Maximum offering price is computed as 100/94.25 of net asset value. On investments of $50,000 or more, the offering price is reduced.
The accompanying notes are an integral part of these financial statements.
20 | Allspring Global Long/Short Equity Fund
Statement of operations—six months ended April 30, 2024 (unaudited)
Statement of operations
| |
Dividends (net of foreign withholdings taxes of $274,373) | |
Interest and rebate income | |
Income from affiliated securities | |
| |
| |
| |
| |
| |
| |
| |
| |
Shareholder servicing fees | |
| |
| |
| |
| |
Custody and accounting fees | |
| |
| |
Shareholder report expenses | |
Trustees’ fees and expenses | |
| |
Dividends on securities sold short | |
| |
| |
Less: Fee waivers and/or expense reimbursements | |
| |
| |
| |
Realized and unrealized gains (losses) on investments | |
Net realized gains (losses) on | |
| |
| |
Foreign currency and foreign currency translations | |
Net realized gains on investments | |
Net change in unrealized gains (losses) on | |
| |
| |
Foreign currency and foreign currency translations | |
Net change in unrealized gains (losses) on investments | |
Net realized and unrealized gains (losses) on investments | |
Net increase in net assets resulting from operations | |
The accompanying notes are an integral part of these financial statements.
Allspring Global Long/Short Equity Fund | 21
Statement of changes in net assets
Statement of changes in net assets
|
Six months ended
April 30, 2024 (unaudited) | Year ended October 31, 2023 |
| | | | |
| | | | |
Net realized gains on investments | | | | |
Net change in unrealized gains (losses) on investments | | | | |
Net increase in net assets resulting from operations | | | | |
Distributions to shareholders from | | | | |
Net investment income and net realized gains | | | | |
| | | | |
| | | | |
| | | | |
| | | | |
Total distributions to shareholders | | | | |
Capital share transactions | | | | |
Proceeds from shares sold | | | | |
| | | | |
| | | | |
| | | | |
| | | | |
| | | | |
Reinvestment of distributions | | | | |
| | | | |
| | | | |
| | | | |
| | | | |
| | | | |
Payment for shares redeemed | | | | |
| | | | |
| | | | |
| | | | |
| | | | |
Net decrease in net assets resulting from capital share transactions | | | | |
Total increase (decrease) in net assets | | | | |
| | | | |
| | | | |
| | | | |
1 For the period from December 16, 2022 (commencement of class operations) to October 31, 2023
The accompanying notes are an integral part of these financial statements.
22 | Allspring Global Long/Short Equity Fund
Statement of cash flows—six months ended April 30, 2024 (unaudited)
Statement of cash flows
Cash flows from operating activities | |
Net increase in net assets resulting from operations | |
Adjustments to reconcile net increase in net assets from operations to net cash used in operating activities | |
Purchases of long-term securities | |
Proceeds from the sales of long-term securities | |
Proceeds from securities sold short | |
Purchases to cover short securities | |
Purchases and sales of short-term securities, net | |
Decrease in receivable for dividends | |
Increase in prepaid expenses and other assets | |
Decrease in trustees’ fees and expenses payable | |
Decrease in management fee payable | |
Decrease in administration fee payable | |
Increase in distribution fees payable | |
Increase in payable for dividends on securities sold short | |
Increase in payable for interest expense on margin loan | |
Decrease in accrued expenses and other liabilities | |
Proceeds from foreign currency transactions | |
Net realized gains on unaffiliated securities | |
Net realized losses on securities sold short | |
Net realized gains on foreign currency and foreign currency translations | |
Net change in unrealized gains (losses) on unaffiliated securities | |
Net change in unrealized gains (losses) on securities sold short | |
Net change in unrealized gain (losses) on foreign currency and foreign currency translations | |
Net cash provided by operating activities | |
Cash flows from financing activities | |
Increase in margin loan borrowings, net | |
Proceeds from shares sold | |
| |
| |
Net cash used in financing activities | |
| |
Cash (including foreign currency) | |
| |
| |
Supplemental cash disclosure | |
Cash paid for dividends on securities sold short | |
Cash paid for interest expense | |
Supplemental non-cash financing disclosure | |
Reinvestment of dividends | |
The accompanying notes are an integral part of these financial statements.
Allspring Global Long/Short Equity Fund | 23
Financial highlights
(For a share outstanding throughout each period)
| Six months ended
April 30, 2024
(unaudited) | |
| | | | | |
Net asset value, beginning of period | | | | | | |
Net investment income (loss) | | | | | | |
Net realized and unrealized gains (losses) on investments | | | | | | |
Total from investment operations | | | | | | |
Distributions to shareholders from | | | | | | |
| | | | | | |
| | | | | | |
Total distributions to shareholders | | | | | | |
Net asset value, end of period | | | | | | |
| | | | | | |
Ratios to average net assets (annualized) | | | | | | |
| | | | | | |
| | | | | | |
Net investment income (loss)* | | | | | | |
| | | | | | |
| | | | | | |
Net assets, end of period (000s omitted) | | | | | | |
| Ratios include dividends on securities sold short and interest expense as follows: |
Six months ended April 30, 2024 (unaudited) | |
Year ended October 31, 20231 | |
Year ended October 31, 2022 | |
Year ended October 31, 2021 | |
Year ended October 31, 2020 | |
Year ended October 31, 2019 | |
| For the year ended October 31, 2023, the Fund was audited by KPMG LLP. The previous years were audited by another independent registered public accounting firm. |
| After the close of business on December 16, 2022, the Fund acquired the net assets of 361 Global Long/Short Equity Fund, which became the accounting and performance survivor in the transaction. The information for the periods prior to December 16, 2022 is that of 361 Global Long/Short Equity Fund Investor Class. |
| Calculated based upon average shares outstanding |
| Amount is less than $0.005. |
| Total return calculations do not include any sales charges. Returns for periods of less than one year are not annualized. |
The accompanying notes are an integral part of these financial statements.
24 | Allspring Global Long/Short Equity Fund
(For a share outstanding throughout each period)
| Six months ended
April 30, 2024
(unaudited) | |
| |
Net asset value, beginning of period | | |
| | |
Net realized and unrealized gains (losses) on investments | | |
Total from investment operations | | |
Distributions to shareholders from | | |
| | |
Net asset value, end of period | | |
| | |
Ratios to average net assets (annualized) | | |
| | |
| | |
| | |
| | |
| | |
Net assets, end of period (000s omitted) | | |
| Ratios include dividends on securities sold short and interest expense as follows: |
Six months ended April 30, 2024 (unaudited) | |
Year ended October 31, 20231 | |
| For the period from December 16, 2022 (commencement of class operations) to October 31, 2023 |
| Calculated based upon average shares outstanding |
| Total return calculations do not include any sales charges. Returns for periods of less than one year are not annualized. |
The accompanying notes are an integral part of these financial statements.
Allspring Global Long/Short Equity Fund | 25
(For a share outstanding throughout each period)
| Six months ended
April 30, 2024
(unaudited) | |
| | | | | |
Net asset value, beginning of period | | | | | | |
Net investment income (loss) | | | | | | |
Net realized and unrealized gains (losses) on investments | | | | | | |
Total from investment operations | | | | | | |
Distributions to shareholders from | | | | | | |
| | | | | | |
| | | | | | |
Total distributions to shareholders | | | | | | |
Net asset value, end of period | | | | | | |
| | | | | | |
Ratios to average net assets (annualized) | | | | | | |
| | | | | | |
| | | | | | |
Net investment income (loss)* | | | | | | |
| | | | | | |
| | | | | | |
Net assets, end of period (000s omitted) | | | | | | |
| Ratios include dividends on securities sold short and interest expense as follows: |
Six months ended April 30, 2024 (unaudited) | |
Year ended October 31, 20231 | |
Year ended October 31, 2022 | |
Year ended October 31, 2021 | |
Year ended October 31, 2020 | |
Year ended October 31, 2019 | |
| For the year ended October 31, 2023, the Fund was audited by KPMG LLP. The previous years were audited by another independent registered public accounting firm. |
| After the close of business on December 16, 2022, the Fund acquired the net assets of 361 Global Long/Short Equity Fund, which became the accounting and performance survivor in the transaction. The information for the periods prior to December 16, 2022 is that of 361 Global Long/Short Equity Fund Class Y. |
| Calculated based upon average shares outstanding |
| Returns for periods of less than one year are not annualized. |
The accompanying notes are an integral part of these financial statements.
26 | Allspring Global Long/Short Equity Fund
(For a share outstanding throughout each period)
| Six months ended
April 30, 2024
(unaudited) | |
| | | | | |
Net asset value, beginning of period | | | | | | |
Net investment income (loss) | | | | | | |
Net realized and unrealized gains (losses) on investments | | | | | | |
Total from investment operations | | | | | | |
Distributions to shareholders from | | | | | | |
| | | | | | |
| | | | | | |
Total distributions to shareholders | | | | | | |
Net asset value, end of period | | | | | | |
| | | | | | |
Ratios to average net assets (annualized) | | | | | | |
| | | | | | |
| | | | | | |
Net investment income (loss)* | | | | | | |
| | | | | | |
| | | | | | |
Net assets, end of period (000s omitted) | | | | | | |
| Ratios include dividends on securities sold short and interest expense as follows: |
Six months ended April 30, 2024 (unaudited) | |
Year ended October 31, 20231 | |
Year ended October 31, 2022 | |
Year ended October 31, 2021 | |
Year ended October 31, 2020 | |
Year ended October 31, 2019 | |
| For the year ended October 31, 2023, the Fund was audited by KPMG LLP. The previous years were audited by another independent registered public accounting firm. |
| After the close of business on December 16, 2022, the Fund acquired the net assets of 361 Global Long/Short Equity Fund, which became the accounting and performance survivor in the transaction. The information for the periods prior to December 16, 2022 is that of 361 Global Long/Short Equity Fund Class I. |
| Calculated based upon average shares outstanding |
| Returns for periods of less than one year are not annualized. |
The accompanying notes are an integral part of these financial statements.
Allspring Global Long/Short Equity Fund | 27
Notes to financial statements (unaudited)
Notes to financial statements
Allspring Funds Trust (the “Trust”), a Delaware statutory trust organized on March 10, 1999, is an open-end management investment company registered under the Investment Company Act of 1940, as amended (the “1940 Act”). As an investment company, the Trust follows the accounting and reporting guidance in Financial Accounting Standards Board (“FASB”) Accounting Standards Codification Topic 946, Financial Services – Investment Companies. These financial statements report on the Allspring Global Long/Short Equity Fund (the “Fund”) which is a diversified series of the Trust.
After the close of business on December 16, 2022, the net assets of 361 Global Long/Short Equity Fund (the “Predecessor Fund”) were acquired by the Fund, which was created to receive the net assets of the Predecessor Fund, in an exchange for shares of the Fund. Investor Class, Class Y and Class I shares of the Predecessor Fund received Class A, Class R6 and Institutional Class shares, respectively, of the Fund in the transaction. Since the Predecessor Fund contributed all of the net assets and shareholders to the newly created Allspring fund, the accounting and performance history of the Predecessor Fund has been carried forward in the financial statements contained herein.
2.
SIGNIFICANT ACCOUNTING POLICIES
The following significant accounting policies, which are consistently followed in the preparation of the financial statements of the Fund, are in conformity with U.S. generally accepted accounting principles which require management to make estimates and assumptions that affect the reported amounts of assets and liabilities, disclosure of contingent assets and liabilities at the date of the financial statements, and the reported amounts of income and expenses during the reporting period. Actual results could differ from those estimates.
All investments are valued each business day as of the close of regular trading on the New York Stock Exchange (generally 4 p.m. Eastern Time), although the Fund may deviate from this calculation time under unusual or unexpected circumstances.
Equity securities and exchange-traded funds that are listed on a foreign or domestic exchange or market are valued at the official closing price or, if none, the last sales price.
The values of securities denominated in foreign currencies are translated into U.S. dollars at rates provided by an independent foreign currency pricing source at a time each business day specified by the Valuation Committee at Allspring Funds Management, LLC (“Allspring Funds Management”).
Many securities markets and exchanges outside the U.S. close prior to the close of the New York Stock Exchange and therefore may not fully reflect trading or events that occur after the close of the principal exchange in which the foreign securities are traded, but before the close of the New York Stock Exchange. If such trading or events are expected to materially affect the value of such securities, then fair value pricing procedures implemented by Allspring Funds Management are applied. These procedures take into account multiple factors including movements in U.S. securities markets after foreign exchanges close. Foreign securities that are fair valued under these procedures are categorized as Level 2 and the application of these procedures may result in transfers between Level 1 and Level 2. Depending on market activity, such fair valuations may be frequent. Such fair value pricing may result in net asset values that are higher or lower than net asset values based on the last reported sales price or latest quoted bid price. On April 30, 2024, such fair value pricing was used in pricing certain foreign securities.
Investments in registered open-end investment companies (other than those listed on a foreign or domestic exchange or market) are valued at net asset value.
Investments which are not valued using the methods discussed above are valued at their fair value, as determined in good faith by Allspring Funds Management, which was named the valuation designee by the Board of Trustees. As the valuation designee, Allspring Funds Management is responsible for day-to-day valuation activities for the Allspring Funds. In connection with these responsibilities, Allspring Funds Management has established a Valuation Committee and has delegated to it the authority to take any actions regarding the valuation of portfolio securities that the Valuation Committee deems necessary or appropriate, including determining the fair value of portfolio securities. On a quarterly basis, the Board of Trustees receives reports of valuation actions taken by the Valuation Committee. On at least an annual basis, the Board of Trustees receives an assessment of the adequacy and effectiveness of Allspring Funds Management’s process for determining the fair value of the portfolio of investments.
Foreign currency translation
The accounting records of the Fund are maintained in U.S. dollars. The values of other assets and liabilities denominated in foreign currencies are translated into U.S. dollars at rates provided by an independent foreign currency pricing source at a time each business day specified by the Valuation Committee. Purchases and sales of securities, and income and expenses are converted at the rate of exchange on the respective dates of such transactions. Net realized foreign exchange gains or losses arise from sales of foreign currencies, currency gains or losses realized between the trade and settlement dates on securities transactions, and the difference between the amounts of dividends, interest and foreign withholding taxes recorded and the U.S. dollar equivalent of the amounts actually paid or received. Net unrealized foreign exchange gains and losses arise from changes in the fair value of assets and liabilities other than investments in securities resulting from changes in exchange rates. The changes in net assets arising from changes in exchange rates of securities and the changes in net assets resulting from changes in market prices of securities are not separately presented. Such changes are included in net realized and unrealized gains or losses from investments.
28 | Allspring Global Long/Short Equity Fund
Notes to financial statements (unaudited)
Short sales
The Fund may sell a security it does not own in anticipation of a decline in the market value of that security (short sale). When the Fund makes a short sale, it must borrow the security sold short and deliver it to the buyer. The Fund is then obligated to replace the security borrowed by purchasing the security at the market price at the time of replacement.
The Fund records the proceeds as a liability which is marked-to-market daily based upon quotations from an independent pricing service or an independent broker-dealer and any change in value is recorded as an unrealized gain or loss. Any interest or dividends accrued on such borrowed securities during the period of the loan are recorded as an expense on the Statement of Operations. To borrow the security, the Fund may be required to pay a premium, which would decrease the proceeds of the security sold. A gain, limited to the price at which the Fund sold the security short, or a loss, unlimited in size, will be recognized upon the closing of a short sale if the market price at the closing is less than or greater than, respectively, the proceeds originally received. Until the short sale is closed or the borrowed security is replaced, the Fund maintains a segregated account of cash or liquid securities, the dollar value of which is at least equal to the market value of the security at the time of the short sale.
Security transactions and income recognition
Securities transactions are recorded on a trade date basis. Realized gains or losses are recorded on the basis of identified cost.
Dividend income is recognized on the ex-dividend date, except for certain dividends from foreign securities, which are recorded as soon as the custodian verifies the ex-dividend date. Dividend income is recorded net of foreign taxes withheld where recovery of such taxes is not assured.
Interest earned on cash balances held at the custodian is recorded as interest income.
Distributions received from REIT investments may be characterized as ordinary income, capital gains, or a return of capital to the Fund based on information provided by the REIT. The proper characterization of REIT distributions is generally not known until after the end of each calendar year. As such, estimates may be used in reporting the character of income and distributions for financial statement purposes.
Distributions to shareholders
Distributions to shareholders from net investment income and any net realized gains are recorded on the ex-dividend date and paid at least annually. Such distributions are determined in accordance with income tax regulations and may differ from U.S. generally accepted accounting principles. Dividend sources are estimated at the time of declaration. The tax character of distributions is determined as of the Fund’s fiscal year end. Therefore, a portion of the Fund’s distributions made prior to the Fund’s fiscal year end may be categorized as a tax return of capital at year end.
The Fund intends to continue to qualify as a regulated investment company by distributing substantially all of its investment company taxable income and any net realized capital gains (after reduction for capital loss carryforwards) sufficient to relieve it from all, or substantially all, federal income taxes. Accordingly, no provision for federal income taxes was required.
The Fund’s income and federal excise tax returns and all financial records supporting those returns for the prior three fiscal years are subject to examination by the federal and Delaware revenue authorities. Management has analyzed the Fund’s tax positions taken on federal, state, and foreign tax returns, as applicable, for all open tax years and does not believe that there are any uncertain tax positions that require recognition of a tax liability.
As of April 30, 2024, the aggregate cost of all investments for federal income tax purposes was $349,120,890 and the unrealized gains (losses) consisted of:
As of October 31, 2023, the Fund had capital loss carryforwards which consisted of $18,699,103 in short-term capital losses.
The separate classes of shares offered by the Fund differ principally in applicable sales charges, distribution, shareholder servicing, and administration fees. Class specific expenses are charged directly to that share class. Investment income and expense, common fund-level expenses, and realized and unrealized gains (losses) on investments are allocated daily to each class of shares based on the relative proportion of net assets of each class.
Allspring Global Long/Short Equity Fund | 29
Notes to financial statements (unaudited)
3.
FAIR VALUATION MEASUREMENTS
Fair value measurements of investments are determined within a framework that has established a fair value hierarchy based upon the various data inputs utilized in determining the value of the Fund’s investments. The three-level hierarchy gives the highest priority to unadjusted quoted prices in active markets for identical assets or liabilities (Level 1) and the lowest priority to unobservable inputs (Level 3). The Fund’s investments are classified within the fair value hierarchy based on the lowest level of input that is significant to the fair value measurement. The inputs are summarized into three broad levels as follows:
•Level 1—quoted prices in active markets for identical securities
•Level 2—other significant observable inputs (including quoted prices for similar securities, interest rates, prepayment speeds, credit risk, etc.)
•Level 3—significant unobservable inputs (including the Fund’s own assumptions in determining the fair value of investments)
The inputs or methodologies used for valuing investments in securities are not necessarily an indication of the risk associated with investing in those securities.
30 | Allspring Global Long/Short Equity Fund
Notes to financial statements (unaudited)
The following is a summary of the inputs used in valuing the Fund’s assets and liabilities as of April 30, 2024:
| | Other significant
observable inputs
(Level 2) | Significant
unobservable inputs
(Level 3) | |
| | | | |
| | | | |
| | | | |
| | | | |
| | | | |
| | | | |
| | | | |
| | | | |
| | | | |
| | | | |
| | | | |
| | | | |
| | | | |
| | | | |
| | | | |
| | | | |
| | | | |
| | | | |
| | | | |
| | | | |
| | | | |
| | | | |
| | | | |
| | | | |
| | | | |
| | | | |
| | | | |
| | | | |
| | | | |
| | | | |
| | | | |
| | | | |
| | | | |
| | | | |
| | | | |
| | | | |
| | | | |
| | | | |
| | | | |
| | | | |
| | | | |
| | | | |
| | | | |
| | | | |
| | | | |
| | | | |
Additional sector, industry or geographic detail, if any, is included in the Portfolio of Investments.
At April 30, 2024, the Fund did not have any transfers into/out of Level 3.
Allspring Global Long/Short Equity Fund | 31
Notes to financial statements (unaudited)
4.
TRANSACTIONS WITH AFFILIATES
Allspring Funds Management, a wholly owned subsidiary of Allspring Global Investments Holdings, LLC, a holding company indirectly owned by certain private funds of GTCR LLC and Reverence Capital Partners, L.P., is the manager of the Fund and provides advisory and fund-level administrative services under an investment management agreement. Under the investment management agreement, Allspring Funds Management is responsible for, among other services, implementing the investment objectives and strategies of the Fund, supervising the subadviser and providing fund-level administrative services in connection with the Fund’s operations. As compensation for its services under the investment management agreement, Allspring Funds Management is entitled to receive a management fee at the following annual rate based on the Fund’s average daily net assets:
For the six months ended April 30, 2024, the management fee was equivalent to an annual rate of 1.25% of the Fund’s average daily net assets.
Allspring Funds Management has retained the services of a subadviser to provide daily portfolio management to the Fund. The fee for subadvisory services is borne by Allspring Funds Management. Allspring Global Investments, LLC, an affiliate of Allspring Funds Management and a wholly owned subsidiary of Allspring Global Investments Holdings, LLC, is the subadviser to the Fund and is entitled to receive a fee from Allspring Funds Management at an annual rate starting at 0.8125% and declining to 0.625% as the average daily net assets of the Fund increase.
Under a class-level administration agreement, Allspring Funds Management provides class-level administrative services to the Fund, which includes paying fees and expenses for services provided by the transfer agent, sub-transfer agents, omnibus account servicers and record-keepers. As compensation for its services under the class-level administration agreement, Allspring Funds Management receives an annual fee which is calculated based on the average daily net assets of each class as follows:
| Class-level
administration fee |
| |
| |
| |
| |
Waivers and/or expense reimbursements
Allspring Funds Management has contractually committed to waive and/or reimburse management and administration fees to the extent necessary to maintain certain net operating expense ratios for the Fund. When each class of the Fund has exceeded its expense cap, Allspring Funds Management will waive fees and/or reimburse expenses from fund-level expenses on a proportionate basis and then from class specific expenses. When only certain classes exceed their expense caps, waivers and/or reimbursements are applied against class specific expenses before fund-level expenses. Allspring Funds Management has contractually committed through February 28, 2025 to waive fees and/or reimburse expenses to the extent necessary to cap the Fund’s expenses. Prior to or after the commitment expiration date, the cap may be increased or the commitment to maintain the cap may be terminated only with the approval of the Board of Trustees. As of April 30, 2024, excluding expenses from dividends on securities sold short and interest expense, the contractual caps are as follows:
The Trust has adopted a distribution plan for Class C shares pursuant to Rule 12b-1 under the 1940 Act. A distribution fee is charged to Class C shares and paid to Allspring Funds Distributor, LLC (“Allspring Funds Distributor”), the principal underwriter, an affiliate of Allspring Funds Management, at an annual rate up to 0.75% of the average daily net assets of Class C shares.
In addition, Allspring Funds Distributor is entitled to receive the front-end sales charge from the purchase of Class A shares and a contingent deferred sales charge on the redemption of certain Class A shares. Allspring Funds Distributor is also entitled to receive the contingent deferred sales charges
32 | Allspring Global Long/Short Equity Fund
Notes to financial statements (unaudited)
from redemptions of Class C shares. Allspring Funds Distributor did not receive any front-end or contingent deferred sales charges from Class A or Class C shares for the six months ended April 30, 2024.
Shareholder servicing fees
The Trust has entered into contracts with one or more shareholder servicing agents, whereby Class A and Class C are charged a fee at an annual rate up to 0.25% of the average daily net assets of each respective class. A portion of these total shareholder servicing fees were paid to affiliates of the Fund.
The Fund may purchase or sell portfolio investment securities to certain affiliates pursuant to Rule 17a-7 under the 1940 Act and under procedures adopted by the Board of Trustees. The procedures have been designed to ensure that these interfund transactions, which do not incur broker commissions, are effected at current market prices. Pursuant to these procedures, the Fund did not have any interfund transactions during the six months ended April 30, 2024.
5.
INVESTMENT PORTFOLIO TRANSACTIONS
Purchases and sales of investments, excluding U.S. government obligations (if any) and short-term securities, for the six months ended April 30, 2024 were $722,284,460 and $799,492,772, respectively.
The Trust (excluding the money market funds), Allspring Master Trust and Allspring Variable Trust are parties to a $350,000,000 revolving credit agreement whereby the Fund is permitted to use bank borrowings for temporary or emergency purposes, such as to fund shareholder redemption requests. Interest under the credit agreement is charged to the Fund based on borrowing rate equal to the higher of the Federal Funds rate or the overnight bank funding rate in effect on that day plus a spread. In addition, an annual commitment fee based on the unused balance is allocated to each participating fund. For the six months ended April 30, 2024, there were no borrowings by the Fund under this agreement.
In an agreement with a prime broker, the Fund purchased or borrowed securities on margin and was charged interest based on a borrowing rate equal to the Federal Funds rate plus a spread. During the six months ended April 30, 2024, the Fund had average borrowings outstanding of $52,839,440 at a rate of 4.20% and recorded interest in the amount of $1,104,525, which represents 0.45% of its average daily net assets.
Under the Fund’s organizational documents, the officers and Trustees have been granted certain indemnification rights against certain liabilities that may arise out of performance of their duties to the Fund. The Fund has entered into a separate agreement with each Trustee that converts indemnification rights currently existing under the Fund’s organizational documents into contractual rights that cannot be changed in the future without the consent of the Trustee. Additionally, in the normal course of business, the Fund may enter into contracts with service providers that contain a variety of indemnification clauses. The Fund’s maximum exposure under these arrangements is dependent on future claims that may be made against the Fund and, therefore, cannot be estimated.
Allspring Global Long/Short Equity Fund | 33
Other information (unaudited)
Other information
A description of the policies and procedures used to determine how to vote proxies relating to portfolio securities is available without charge, upon request, by calling 1-866-259-3305, visiting our website at allspringglobal.com, or visiting the SEC website at sec.gov. Information regarding how the proxies related to portfolio securities were voted during the most recent 12-month period ended June 30 is available on the website at allspringglobal.com or by visiting the SEC website at sec.gov.
Quarterly portfolio holdings information
The Fund files its complete schedule of portfolio holdings with the SEC for the first and third quarters of each fiscal year as an exhibit to its reports on Form N-PORT. Shareholders may view the filed Form N-PORT by visiting the SEC website at sec.gov.
34 | Allspring Global Long/Short Equity Fund
Other information (unaudited)
Board of trustees and officers
Each of the Trustees and Officers listed in the table below acts in identical capacities for each fund in the Allspring family of funds, which consists of 99 mutual funds comprising the Allspring Funds Trust, Allspring Variable Trust, Allspring Master Trust and four closed-end funds (collectively the “Fund Complex”). This table should be read in conjunction with the Prospectus and the Statement of Additional Information*. The mailing address of each Trustee and Officer is 1415 Vantage Park Drive, 3rd Floor, Charlotte, NC 28203. Each Trustee and Officer serves an indefinite term, however, each Trustee serves such term until reaching the mandatory retirement age established by the Trustees.
| Position held and
length of | Principal occupations during past five years or longer | Current other
public company or
investment
company
directorships |
William R. Ebsworth
(Born 1957) | | Retired. From 1984 to 2013, equities analyst, portfolio manager, research director and chief investment officer at Fidelity Management and Research Company in Boston, Tokyo, and Hong Kong, and retired in 2013 as Chief Investment Officer of Fidelity Strategic Advisers, Inc. where he led a team of investment professionals managing client assets. Prior thereto, Board member of Hong Kong Securities Clearing Co., Hong Kong Options Clearing Corp., the Thailand International Fund, Ltd., Fidelity Investments Life Insurance Company, and Empire Fidelity Investments Life Insurance Company. Serves on the Investment Company Institute’s Board of Governors since 2022 and Executive Committee since 2023 as well as the Vice Chairman of the Governing Council of the Independent Directors Council since 2023. Audit Committee Chair and Investment Committee Chair of the Vincent Memorial Hospital Foundation (non-profit organization). Mr. Ebsworth is a CFA charterholder. | |
Jane A. Freeman
(Born 1953) | Trustee,
since 2015;
Chair Liaison,
| Retired. From 2012 to 2014 and 1999 to 2008, Chief Financial Officer of Scientific Learning Corporation. From 2008 to 2012, Ms. Freeman provided consulting services related to strategic business projects. Prior to 1999, Portfolio Manager at Rockefeller & Co. and Scudder, Stevens & Clark. Board member of the Harding Loevner Funds from 1996 to 2014, serving as both Lead Independent Director and chair of the Audit Committee. Board member of the Russell Exchange Traded Funds Trust from 2011 to 2012 and the chair of the Audit Committee. Ms. Freeman is also an inactive Chartered Financial Analyst. | |
Isaiah Harris, Jr.
(Born 1952) | Trustee,
since 2009;
Audit Committee Chair,
since 2019 | Retired. Member of the Advisory Board of CEF of East Central Florida. Chairman of the Board of CIGNA Corporation from 2009 to 2021, and Director from 2005 to 2008. From 2003 to 2011, Director of Deluxe Corporation. Prior thereto, President and CEO of BellSouth Advertising and Publishing Corp. from 2005 to 2007, President and CEO of BellSouth Enterprises from 2004 to 2005 and President of BellSouth Consumer Services from 2000 to 2003. Emeritus member of the Iowa State University Foundation Board of Governors. Emeritus Member of the Advisory board of Iowa State University School of Business. Advisory Board Member, Palm Harbor Academy (private school). Advisory Board Member, Fellowship of Christian Athletes. Mr. Harris is a certified public accountant (inactive status). | |
David F. Larcker
(Born 1950) | | Distinguished Visiting Fellow at the Hoover Institution since 2022. James Irvin Miller Professor of Accounting at the Graduate School of Business (Emeritus), Stanford University, Director of the Corporate Governance Research Initiative and Senior Faculty of The Rock Center for Corporate Governance since 2006. From 2005 to 2008, Professor of Accounting at the Graduate School of Business, Stanford University. Prior thereto, Ernst & Young Professor of Accounting at The Wharton School, University of Pennsylvania from 1985 to 2005. | |
Olivia S. Mitchell
(Born 1953) | | International Foundation of Employee Benefit Plans Professor since 1993, Wharton School of the University of Pennsylvania. Director of Wharton’s Pension Research Council and Boettner Center on Pensions & Retirement Research, and Research Associate at the National Bureau of Economic Research. Previously taught at Cornell University from 1978 to 1993. | |
Timothy J. Penny
(Born 1951) | Trustee,
since 1996;
Chair,
since 2018 | President and Chief Executive Officer of Southern Minnesota Initiative Foundation, a non-profit organization, since 2007. Vice Chair of the Economic Club of Minnesota, since 2007. Co-Chair of the Committee for a Responsible Federal Budget, since 1995. Member of the Board of Trustees of NorthStar Education Finance, Inc., a non-profit organization, from 2007-2022. Senior Fellow of the University of Minnesota Humphrey Institute from 1995 to 2017. | |
** Length of service dates reflect the Trustee’s commencement of service with the Trust’s predecessor entities, where applicable.
*** Ms. Freeman will serve as Chair Liaison through June 2024, at which time Ms. Wheelock will assume the role.
*
The Statement of Additional Information includes additional information about the Trustees and is available, without charge, upon request, by calling 1-800-222-8222 or by visiting the website at allspringglobal.com.
Allspring Global Long/Short Equity Fund | 35
Other information (unaudited)
| Position held and length of service** | Principal occupations during past five years or longer | Current other public company or investment company directorships |
James G. Polisson
(Born 1959) | Trustee,
since 2018;
Nominating and Governance Committee Chair,
since 2024 | Retired. Chief Marketing Officer, Source (ETF) UK Services, Ltd, from 2015 to 2017. From 2012 to 2015, Principal of The Polisson Group, LLC, a management consulting, corporate advisory and principal investing company. Chief Executive Officer and Managing Director at Russell Investments, Global Exchange Traded Funds from 2010 to 2012. Managing Director of Barclays Global Investors from 1998 to 2010 and Global Chief Marketing Officer for iShares and Barclays Global Investors from 2000 to 2010. Trustee of the San Francisco Mechanics’ Institute, a non- profit organization, from 2013 to 2015. Board member of the Russell Exchange Traded Fund Trust from 2011 to 2012. Director of Barclays Global Investors Holdings Deutschland GmbH from 2006 to 2009. Mr. Polisson is an attorney and has a retired status with the Massachusetts and District of Columbia Bar Associations. | |
Pamela Wheelock
(Born 1959) | Trustee,
since January 2020;
previously Trustee from
January 2018 to
| Retired. Executive and Senior Financial leadership positions in the public, private and nonprofit sectors. Interim President and CEO, McKnight Foundation, 2020. Interim Commissioner, Minnesota Department of Human Services, 2019. Chief Operating Officer, Twin Cities Habitat for Humanity, 2017-2019. Vice President for University Services, University of Minnesota, 2012- 2016. Interim President and CEO, Blue Cross and Blue Shield of Minnesota, 2011-2012. Executive Vice-President and Chief Financial Officer, Minnesota Wild, 2002-2008. Commissioner, Minnesota Department of Finance, 1999-2002. Chair of the Board of Directors of Destination Medical Center Corporation. Board member of the Minnesota Wild Foundation. | |
** Length of service dates reflect the Trustee’s commencement of service with the Trust’s predecessor entities, where applicable.
*** Ms. Freeman will serve as Chair Liaison through June 2024, at which time Ms. Wheelock will assume the role.
36 | Allspring Global Long/Short Equity Fund
Other information (unaudited)
Officers1
| Position held and
length of service | Principal occupations during past five years or longer |
| | President and Chief Executive Officer of Allspring Funds Management, LLC since 2017 and Head of Global Fund Governance of Allspring Global Investments since 2022. Prior thereto, co-president of Galliard Capital Management, LLC, an affiliate of Allspring Funds Management, LLC, from 2019 to 2022 and Head of Affiliated Managers, Allspring Global Investments, from 2014 to 2019 and Executive Vice President responsible for marketing, investments and product development for Allspring Funds Management, LLC, from 2009 to 2014. |
Jeremy DePalma
(Born 1974) | Treasurer,
since 2012
(for certain funds in
the Fund Complex);
since 2021 (for
the remaining funds in the Complex) | Senior Vice President of Allspring Funds Management, LLC since 2009. Senior Vice President of Evergreen Investment Management Company, LLC from 2008 to 2010 and head of the Fund Reporting and Control Team within Fund Administration from 2005 to 2010. |
Christopher Baker
(Born 1976) | Chief Compliance Officer,
since 2022 | Global Chief Compliance Officer for Allspring Global Investments since 2022. Prior thereto, Chief Compliance Officer for State Street Global Advisors from 2018 to 2021. Senior Compliance Officer for the State Street divisions of Alternative Investment Solutions, Sector Solutions, and Global Marketing from 2015 to 2018. From 2010 to 2015 Vice President, Global Head of Investment and Marketing Compliance for State Street Global Advisors. |
Matthew Prasse
(Born 1983) | Chief Legal Officer,
since 2022;
Secretary,
since 2021 | Senior Counsel of the Allspring Legal Department since 2021. Senior Counsel of the Wells Fargo Legal Department from 2018 to 2021. Previously, Counsel for Barings LLC from 2015 to 2018. Prior to joining Barings, Associate at Morgan, Lewis & Bockius LLP from 2008 to 2015. |
1 For those Officers with tenures at Allspring Global Investments and/or Allspring Funds Management, LLC that began prior to 2021, such tenures include years of service during which these businesses/entities were known as Wells Fargo Asset Management and Wells Fargo Funds Management, LLC, respectively.
Allspring Global Long/Short Equity Fund | 37
For more information
More information about Allspring Funds is available free upon request. To obtain literature, please write, visit the Fund’s website, or call:
Allspring Funds
P.O. Box 219967
Kansas City, MO 64121-9967
Website: allspringglobal.com
Individual investors: 1-800-222-8222
Retail investment professionals: 1-888-877-9275
Institutional investment professionals: 1-800-260-5969
This report and the financial statements contained herein are submitted for the general information of the shareholders of the Fund. If this report is used for promotional purposes, distribution of the report must be accompanied or preceded by a current prospectus. Before investing, please consider the investment objectives, risks, charges, and expenses of the investment. For a current prospectus and, if available, a summary prospectus, containing this information, call 1-800-222-8222 or visit the Fund’s website at allspringglobal.com. Read the prospectus carefully before you invest or send money.
Allspring Global InvestmentsTM is the trade name for the asset management firms of Allspring Global Investments Holdings, LLC, a holding company indirectly owned by certain private funds of GTCR LLC and Reverence Capital Partners, L.P. These firms include but are not limited to Allspring Global Investments, LLC, and Allspring Funds Management, LLC. Certain products managed by Allspring entities are distributed by Allspring Funds Distributor, LLC (a broker-dealer and Member FINRA/SIPC).
This material is for general informational and educational purposes only and is NOT intended to provide investment advice or a recommendation of any kind - including a recommendation for any specific investment, strategy, or plan.
© 2024 Allspring Global Investments Holdings, LLC. All rights reserved.
ALL-05022024-7cfrpjw6 06-24
SAR4340 04-24
Allspring International Equity Fund
The views expressed and any forward-looking statements are as of April 30, 2024, unless otherwise noted, and are those of the portfolio managers and/or Allspring Global Investments. Discussions of individual securities or the markets generally are not intended as individual recommendations. Future events or results may vary significantly from those expressed in any forward-looking statements. The views expressed are subject to change at any time in response to changing circumstances in the market. Allspring Global Investments disclaims any obligation to publicly update or revise any views expressed or forward-looking statements.
Allspring International Equity Fund | 1
Letter to shareholders (unaudited)
Dear Shareholder:
We are pleased to offer you this semi-annual report for the Allspring International Equity Fund for the six-month period that ended April 30, 2024. Globally, stocks and bonds had strongly positive returns for the period. However, markets were volatile as investors focused on persistently high inflation and the impact of aggressive central bank rate hikes. Riskier assets rallied as investors anticipated an end to the tight monetary policy.
For the period, U.S. stocks, based on the S&P 500 Index,1 returned 20.98%. International stocks, as measured by the MSCI ACWI ex USA Index (Net),2 gained 17.69% while the MSCI EM Index (Net) (USD),3 returned 15.40%. Among bond indexes, the Bloomberg U.S. Aggregate Bond Index4 advanced 4.97%, the Bloomberg Global Aggregate ex-USD Index (unhedged)5 gained 3.92%, the Bloomberg Municipal Bond Index6 returned 7.06%, and the ICE BofA U.S. High Yield Index7 gained 8.94%.
Investors remained focused on central bank monetary policies.
As the six-month period began in November, the market mood brightened as cooling inflation inspired confidence that central banks could hold off on further rate hikes. Overall annual inflation in the U.S. fell to 3.1% in November while 12-month inflation in the U.K. and the eurozone eased to 4.6% and 2.4%, respectively—far below their peak levels of mid-2022. Third quarter annualized U.S. GDP growth was raised to an estimated 5.2% while U.S. job totals rose by close to 200,000 in November, indicating a slight cooling of the labor market. All of this fresh evidence added to confidence for a U.S. soft economic landing, leading to a more buoyant mood heading into winter.
The broad year-end rally among stocks and bonds that began in November continued through December as investors became more confident that monetary policy would ease in 2024. Supporting the bubbly market mood were a series of reports confirming lower inflationary trends in the U.S. and Europe. During the period, it appeared more likely that the U.S. economy could achieve a soft landing, cooling enough to lower inflation without the pain of a recession. However, by year-end, an expectations gap developed. Capital markets priced in a total of 1.50 percentage points in federal funds rate cuts in 2024—twice as much as the three cuts of 0.25% hinted at by Fed officials.
1
The S&P 500 Index consists of 500 stocks chosen for market size, liquidity, and industry group representation. It is a market-value-weighted index with each stock’s weight in the index proportionate to its market value. You cannot invest directly in an index.
2
The Morgan Stanley Capital International (MSCI) All Country World Index (ACWI) ex USA Index (Net) is a free-float-adjusted market-capitalization-weighted index that is designed to measure the equity market performance of developed and emerging markets, excluding the U.S. Source: MSCI. MSCI makes no express or implied warranties or representations and shall have no liability whatsoever with respect to any MSCI data contained herein. The MSCI data may not be further redistributed or used as a basis for other indexes or any securities or financial products. This report is not approved, reviewed, or produced by MSCI. You cannot invest directly in an index.
3
The MSCI Emerging Markets (EM) Index (Net) (USD) is a free-float-adjusted market-capitalization-weighted index that is designed to measure the equity market performance of emerging markets. You cannot invest directly in an index.
4
The Bloomberg U.S. Aggregate Bond Index is a broad-based benchmark that measures the investment-grade, U.S.-dollar-denominated, fixed-rate taxable bond market, including Treasuries, government-related and corporate securities, mortgage-backed securities (agency fixed-rate and hybrid adjustable-rate mortgage pass-throughs), asset-backed securities, and commercial mortgage-backed securities. You cannot invest directly in an index.
5
The Bloomberg Global Aggregate ex-USD Index (unhedged) is an unmanaged index that provides a broad-based measure of the global investment-grade fixed-income markets excluding the U.S.-dollar-denominated debt market. You cannot invest directly in an index.
6
The Bloomberg Municipal Bond Index is an unmanaged index composed of long-term tax-exempt bonds with a minimum credit rating of Baa. You cannot invest directly in an index.
7
The ICE BofA U.S. High Yield Index is a market-capitalization-weighted index of domestic and Yankee high yield bonds. The index tracks the performance of high yield securities traded in the U.S. bond market. Returns shown are net of transaction costs beginning on July 1, 2022. You cannot invest directly in an index. Copyright 2024. ICE Data Indices, LLC. All rights reserved.
2 | Allspring International Equity Fund
Letter to shareholders (unaudited)
Financial market performance was mixed in January 2024 as U.S. stocks had modest gains while non-U.S. equities, particularly those in emerging markets, and fixed income assets were held back by central bank pushback on market optimism over rate cuts. Overall, optimism was supported by hints of a soft landing for the U.S. economy. Key data included a surprisingly strong gain of 353,000 jobs in January, an unemployment rate of just 3.7%, and a rise of just 3.1% in the annual Consumer Price Index1 (CPI) in January. However, that resilience helped tone down expectations of a rate cut in March to a more likely second quarter initial move.
In February, stocks were supported by positive economic data and strong corporate earnings. However, fixed income investments were under pressure as resilient inflation curbed expectations on the timing of interest rate cuts. The S&P 500 Index had solid monthly gains along with emerging market equities, which benefited from a rebound in China.
The first quarter of 2024 closed with ongoing stock market momentum and a more muted sense of confidence in fixed income markets as investors adjusted to the prospect of greater-than-expected economic strength. On the flip side, expectations on the timing of an initial Fed rate cut were pushed back from March to June and then beyond. Additionally, the number of quarter-point rate cuts forecast by the market fell from six as projected in December 2023 to two to three cuts by fiscal period-end.
Markets retreated broadly in April as U.S. annual inflation continued to resist monetary policy efforts and expectations for its downward trajectory, with an April CPI reading of 3.4%. The timing of a Fed initial rate cut came into greater question in April. Not only was there less confidence regarding when a first cut would take place but also whether any rate reductions would occur at all in 2024. Market expectations continued to recede to a possible September Fed first cut. Meanwhile, eurozone annual inflation held steady in April at 2.4%. Developed market stocks and fixed income securities of all types were in the red for April.
Don’t let short-term uncertainty derail long-term investment goals.
Periods of investment uncertainty can present challenges, but experience has taught us that maintaining long-term investment goals can be an effective way to plan for the future. To help you create a sound strategy based on your personal goals and risk tolerance, Allspring Funds offers a wide variety of mutual funds spanning many asset classes and investment styles. Although diversification cannot guarantee an investment profit or prevent losses, we believe it can be an effective way to manage investment risk and potentially smooth out overall portfolio performance. We encourage investors to know their investments and to understand that appropriate levels of risk-taking may unlock opportunities.
Thank you for choosing to invest with Allspring Funds. We appreciate your confidence in us and remain committed to helping you meet your financial needs.
Andrew Owen
President
Allspring Funds
“ The first quarter of 2024 closed with ongoing stock market momentum and a more muted sense of confidence in fixed income markets as investors adjusted to the prospect of greater-than-expected economic strength. ”
For further information about your fund, contact your investment professional, visit our website at allspringglobal.com, or call us directly at 1-800-222-8222.
1
The Consumer Price Index (CPI) is a measure of the average change over time in the prices paid by urban consumers for a market basket of consumer goods and services. You cannot invest directly in an index.
Allspring International Equity Fund | 3
Letter to shareholders (unaudited)
|
Beginning in July 2024, the Fund will be required by the Securities and Exchange Commission to send shareholders a paper copy of a new tailored shareholder report in place of the full shareholder report that you are now receiving. The tailored shareholder report will contain concise information about the Fund, including certain expense and performance information and fund statistics. If you wish to receive this new tailored shareholder report electronically, please follow the instructions on the back cover of this report. |
Other information that is currently included in the shareholder report, such as the Fund’s financial statements, will be available online and upon request, free of charge, in paper or electronic format. |
4 | Allspring International Equity Fund
This page is intentionally left blank.
Performance highlights (unaudited)
Performance highlights
| The Fund seeks long-term capital appreciation. |
| Allspring Funds Management, LLC |
| Allspring Global Investments, LLC |
| Jonathan Drexel, CFA, Paige Henderson, CFA, CFP |
Average annual total returns (%) as of April 30, 2024 |
| | | | |
| | | | | | | | | |
| | | | | | | | | |
| | | | | | | | | |
| | | | | | | | | |
Administrator Class (WFEDX) | | | | | | | | | |
Institutional Class (WFENX) | | | | | | | | | |
MSCI ACWI ex USA Index (Net)4 | | | | | | | | | |
| | | | | | | | | |
Figures quoted represent past performance, which is no guarantee of future results, and do not reflect taxes that a shareholder may pay on an investment in a fund. Investment return and principal value of an investment will fluctuate so that an investor’s shares, when redeemed, may be worth more or less than their original cost. Performance shown without sales charges would be lower if sales charges were reflected. Current performance may be lower or higher than the performance data quoted, which assumes the reinvestment of dividends and capital gains. Current month-end performance is available on the Fund’s website, allspringglobal.com.
Index returns do not include transaction costs associated with buying and selling securities, any mutual fund fees or expenses, or any taxes. It is not possible to invest directly in an index.
For Class A shares, the maximum front-end sales charge is 5.75%. For Class C shares, the maximum contingent deferred sales charge is 1.00%. Performance including a contingent deferred sales charge assumes the sales charge for the corresponding time period. Class R6, Administrator Class and Institutional Class shares are sold without a front-end sales charge or contingent deferred sales charge.
|
| Reflects the expense ratios as stated in the most recent prospectuses, which include the impact of 0.01% in acquired fund fees and expenses. The expense ratios shown are subject to change and may differ from the annualized expense ratios shown in the Financial Highlights of this report, which do not include acquired fund fees and expenses. |
| The manager has contractually committed through February 28, 2025, to waive fees and/or reimburse expenses to the extent necessary to cap total annual fund operating expenses after fee waivers at 1.14% for Class A, 1.89% for Class C, 0.79% for Class R6, 1.14% for Administrator Class and 0.84% for Institutional Class. Brokerage commissions, stamp duty fees, interest, taxes, acquired fund fees and expenses (if any), and extraordinary expenses are excluded from the expense caps. Prior to or after the commitment expiration date, the caps may be increased or the commitment to maintain the caps may be terminated only with the approval of the Board of Trustees. Without these caps, the Fund’s returns would have been lower. The expense ratio paid by an investor is the net expense ratio (the total annual fund operating expenses after fee waivers) as stated in the prospectuses. |
| Historical performance shown for the Class R6 shares prior to their inception reflects the performance of the Institutional Class shares, and includes the higher expenses applicable to the Institutional Class shares. If these expenses had not been included, returns for the Class R6 shares would be higher. |
| The Morgan Stanley Capital International (MSCI) All Country World Index (ACWI) ex USA Index (Net) is a free-float-adjusted market-capitalization-weighted index that is designed to measure the equity market performance of developed and emerging markets, excluding the U.S. Source: MSCI. MSCI makes no express or implied warranties or representations and shall have no liability whatsoever with respect to any MSCI data contained herein. The MSCI data may not be further redistributed or used as a basis for other indexes or any securities or financial products. This report is not approved, reviewed, or produced by MSCI. You cannot invest directly in an index. |
| The MSCI Europe, Australasia, Far East (EAFE) Index (Net) is a free-float-adjusted market capitalization-weighted index that is designed to measure the equity market performance of developed markets, excluding the U.S. and Canada. You cannot invest directly in an index. |
Investing involves risk, including the possible loss of principal. Stock values fluctuate in response to the activities of individual companies and general market and economic conditions. Foreign investments are especially volatile and can rise or fall dramatically due to differences in the political and economic conditions of the host country. Consult the Fund’s prospectus for additional information on these and other risks.
CFA® and Chartered Financial Analyst® are trademarks owned by CFA Institute. |
6 | Allspring International Equity Fund
Performance highlights (unaudited)
Ten largest holdings (%) as of April 30, 20241 |
| |
| |
| |
| |
| |
| |
| |
| |
| |
| |
| Figures represent the percentage of the Fund’s net assets. Holdings are subject to change and may have changed since the date specified. |
Sector allocation as of April 30, 20241 |
| Figures represent the percentage of the Fund’s long-term investments. Allocations are subject to change and may have changed since the date specified. |
Geographic allocation as of April 30, 20241 |
| Figures represent the percentage of the Fund’s long-term investments. Allocations are subject to change and may have changed since the date specified. |
Allspring International Equity Fund | 7
Fund expenses (unaudited)
Fund expenses
As a shareholder of the Fund, you incur two types of costs: (1) transaction costs, including sales charges (loads) on purchase payments and contingent deferred sales charges (if any) on redemptions and (2) ongoing costs, including management fees, distribution (12b-1) and/or shareholder servicing fees, and other Fund expenses. This example is intended to help you understand your ongoing costs (in dollars) of investing in the Fund and to compare these costs with the ongoing costs of investing in other mutual funds.
The example is based on an investment of $1,000 invested at the beginning of the six-month period and held for the entire period from November 1, 2023 to April 30, 2024.
The “Actual” line of the table below provides information about actual account values and actual expenses. You may use the information in this line, together with the amount you invested, to estimate the expenses that you paid over the period. Simply divide your account value by $1,000 (for example, an $8,600 account value divided by $1,000= 8.6), then multiply the result by the number in the “Actual” line under the heading entitled “Expenses paid during period” for your applicable class of shares to estimate the expenses you paid on your account during this period.
Hypothetical example for comparison purposes
The “Hypothetical” line of the table below provides information about hypothetical account values and hypothetical expenses based on the Fund’s actual expense ratio and an assumed rate of return of 5% per year before expenses, which is not the Fund’s actual return. The hypothetical account values and expenses may not be used to estimate the actual ending account balance or expenses you paid for the period. You may use this information to compare the ongoing costs of investing in the Fund and other funds. To do so, compare this 5% hypothetical example with the 5% hypothetical examples that appear in the shareholder reports of the other funds.
Please note that the expenses shown in the table are meant to highlight your ongoing costs only and do not reflect any transactional costs, such as sales charges (loads) and contingent deferred sales charges. Therefore, the “Hypothetical” line of the table is useful in comparing ongoing costs only, and will not help you determine the relative total costs of owning different funds. In addition, if these transactional costs were included, your costs would have been higher.
| Beginning
account value
11-1-2023 | Ending
account value
4-30-2024 | | Annualized net
expense ratio |
| | | | |
| | | | |
Hypothetical (5% return before expenses) | | | | |
| | | | |
| | | | |
Hypothetical (5% return before expenses) | | | | |
| | | | |
| | | | |
Hypothetical (5% return before expenses) | | | | |
| | | | |
| | | | |
Hypothetical (5% return before expenses) | | | | |
| | | | |
| | | | |
Hypothetical (5% return before expenses) | | | | |
| Expenses paid is equal to the annualized net expense ratio of each class multiplied by the average account value over the period, multiplied by 182 divided by 366 (to reflect the one-half-year period). |
8 | Allspring International Equity Fund
Portfolio of investments—April 30, 2024 (unaudited)
| | | | | |
| | | | | | |
| | | | | | |
Restaurant Brands International, Inc. (Consumer discretionary, Hotels, restaurants & leisure) | | | | | | |
TC Energy Corp. (Energy, Oil, gas & consumable fuels) | | | | | | |
| | | | | | |
| | | | | | |
Novo Nordisk AS Class B (Health care, Pharmaceuticals) | | | | | | |
| | | | | | |
Nordea Bank Abp Helsinki Stock Exchange (Financials, Banks) | | | | | | |
| | | | | | |
Air Liquide SA (Materials, Chemicals) | | | | | | |
AXA SA (Financials, Insurance) | | | | | | |
Capgemini SE (Information technology, IT services) | | | | | | |
L’Oreal SA (Consumer staples, Personal care products) | | | | | | |
LVMH Moet Hennessy Louis Vuitton SE (Consumer discretionary, Textiles, apparel & luxury goods) | | | | | | |
Sanofi SA (Health care, Pharmaceuticals) | | | | | | |
Schneider Electric SE (Industrials, Electrical equipment) | | | | | | |
TotalEnergies SE (Energy, Oil, gas & consumable fuels) | | | | | | |
Veolia Environnement SA (Utilities, Multi-utilities) | | | | | | |
Vinci SA (Industrials, Construction & engineering) | | | | | | |
| | | | | | |
| | | | | | |
adidas AG (Consumer discretionary, Textiles, apparel & luxury goods) | | | | | | |
Allianz SE (Financials, Insurance) | | | | | | |
Deutsche Boerse AG (Financials, Capital markets) | | | | | | |
Deutsche Post AG (Industrials, Air freight & logistics) | | | | | | |
Deutsche Telekom AG (Communication services, Diversified telecommunication services) | | | | | | |
SAP SE (Information technology, Software) | | | | | | |
Siemens AG (Industrials, Industrial conglomerates) | | | | | | |
| | | | | | |
| | | | | | |
AIA Group Ltd. (Financials, Insurance) | | | | | | |
| | | | | | |
Check Point Software Technologies Ltd. (Information technology, Software)† | | | | | | |
| | | | | | |
Asahi Group Holdings Ltd. (Consumer staples, Beverages) | | | | | | |
Nintendo Co. Ltd. (Communication services, Entertainment) | | | | | | |
ORIX Corp. (Financials, Financial services) | | | | | | |
Seven & i Holdings Co. Ltd. (Consumer staples, Consumer staples distribution & retail) | | | | | | |
Sumitomo Mitsui Financial Group, Inc. (Financials, Banks) | | | | | | |
The accompanying notes are an integral part of these financial statements.
Allspring International Equity Fund | 9
Portfolio of investments—April 30, 2024 (unaudited)
| | | | | |
| | | | | | |
Tokyo Electron Ltd. (Information technology, Semiconductors & semiconductor equipment) | | | | | | |
Toyota Motor Corp. (Consumer discretionary, Automobiles) | | | | | | |
| | | | | | |
| | | | | | |
Airbus SE (Industrials, Aerospace & defense) | | | | | | |
ASML Holding NV (Information technology, Semiconductors & semiconductor equipment) | | | | | | |
ING Groep NV (Financials, Banks) | | | | | | |
| | | | | | |
| | | | | | |
Samsung Electronics Co. Ltd. GDR (Information technology, Technology hardware, storage & peripherals) | | | | | | |
| | | | | | |
Nestle SA (Consumer staples, Food products) | | | | | | |
Novartis AG (Health care, Pharmaceuticals) | | | | | | |
Roche Holding AG (Health care, Pharmaceuticals) | | | | | | |
TE Connectivity Ltd. (Information technology, Electronic equipment, instruments & components) | | | | | | |
| | | | | | |
| | | | | | |
AstraZeneca PLC (Health care, Pharmaceuticals) | | | | | | |
BAE Systems PLC (Industrials, Aerospace & defense) | | | | | | |
Coca-Cola Europacific Partners PLC (Consumer staples, Beverages) | | | | | | |
Diageo PLC (Consumer staples, Beverages) | | | | | | |
National Grid PLC (Utilities, Multi-utilities) | | | | | | |
Rio Tinto PLC (Materials, Metals & mining) | | | | | | |
Shell PLC (Energy, Oil, gas & consumable fuels) | | | | | | |
Smith & Nephew PLC (Health care, Health care equipment & supplies) | | | | | | |
Unilever PLC London Stock Exchange (Consumer staples, Personal care products) | | | | | | |
| | | | | | |
| | | | | | |
EOG Resources, Inc. (Energy, Oil, gas & consumable fuels) | | | | | | |
Total common stocks (Cost $206,855,854) | | | | | | |
Investment companies: 2.23% | | | | | | |
| | | | | | |
| | | | | | |
Total investment companies (Cost $5,242,666) | | | | | | |
The accompanying notes are an integral part of these financial statements.
10 | Allspring International Equity Fund
Portfolio of investments—April 30, 2024 (unaudited)
| | | | | |
Short-term investments: 1.67% | | | | | | |
Investment companies: 1.67% | | | | | | |
Allspring Government Money Market Fund Select Class♠∞ | | | | | | |
Total short-term investments (Cost $4,196,726) | | | | | | |
Total investments in securities (Cost $216,295,246) | | | | | | |
Other assets and liabilities, net | | | | | | |
| | | | | | |
| Non-income-earning security |
| The issuer of the security is an affiliated person of the Fund as defined in the Investment Company Act of 1940. |
| The rate represents the 7-day annualized yield at period end. |
|
| Global depositary receipt |
Investments in affiliates
An affiliated investment is an investment in which the Fund owns at least 5% of the outstanding voting shares of the issuer or as a result of other relationships, such as the Fund and the issuer having the same investment manager. Transactions with issuers that were affiliates of the Fund at the end of the period were as follows:
| | | | | Net
change in
unrealized
gains
(losses) | | | Income
from
affiliated
securities |
| | | | | | | | |
Allspring Government Money Market Fund Select Class | | | | | | | | |
The accompanying notes are an integral part of these financial statements.
Allspring International Equity Fund | 11
Statement of assets and liabilities—April 30, 2024 (unaudited)
Financial statements
Statement of assets and liabilities
| |
Investments in unaffiliated securities, at value (cost $212,098,520) | |
Investments in affiliated securities, at value (cost $4,196,726) | |
| |
Foreign currency, at value (cost $753,424) | |
| |
Receivable for Fund shares sold | |
| |
| |
Payable for Fund shares redeemed | |
| |
Professional fees payable | |
Custody and accounting fees payable | |
Administration fees payable | |
Distribution fees payable | |
Accrued expenses and other liabilities | |
| |
| |
| |
| |
| |
| |
Computation of net asset value and offering price per share | |
| |
Shares outstanding–Class A1 | |
Net asset value per share–Class A | |
Maximum offering price per share – Class A2 | |
| |
Shares outstanding–Class C1 | |
Net asset value per share–Class C | |
| |
Shares outstanding–Class R61 | |
Net asset value per share–Class R6 | |
Net assets–Administrator Class | |
Shares outstanding–Administrator Class1 | |
Net asset value per share–Administrator Class | |
Net assets–Institutional Class | |
Shares outstanding–Institutional Class1 | |
Net asset value per share–Institutional Class | |
1 The Fund has an unlimited number of authorized shares.
2 Maximum offering price is computed as 100/94.25 of net asset value. On investments of $50,000 or more, the offering price is reduced.
The accompanying notes are an integral part of these financial statements.
12 | Allspring International Equity Fund
Statement of operations—six months ended April 30, 2024 (unaudited)
Statement of operations
| |
Dividends (net of foreign withholdings taxes of $505,699) | |
Income from affiliated securities | |
| |
| |
| |
| |
| |
| |
| |
| |
| |
| |
Shareholder servicing fees | |
| |
| |
| |
| |
| |
Custody and accounting fees | |
| |
| |
Shareholder report expenses | |
Trustees’ fees and expenses | |
| |
| |
Less: Fee waivers and/or expense reimbursements | |
| |
| |
| |
| |
| |
| |
Realized and unrealized gains (losses) on investments | |
| |
| |
Foreign currency and foreign currency translations | |
Net realized gains on investments | |
Net change in unrealized gains (losses) on | |
| |
Foreign currency and foreign currency translations | |
Net change in unrealized gains (losses) on investments | |
Net realized and unrealized gains (losses) on investments | |
Net increase in net assets resulting from operations | |
The accompanying notes are an integral part of these financial statements.
Allspring International Equity Fund | 13
Statement of changes in net assets
Statement of changes in net assets
|
Six months ended
April 30, 2024 (unaudited) | Year ended October 31, 2023 |
| | | | |
| | | | |
Net realized gains on investments | | | | |
Net change in unrealized gains (losses) on investments | | | | |
Net increase in net assets resulting from operations | | | | |
Distributions to shareholders from | | | | |
Net investment income and net realized gains | | | | |
| | | | |
| | | | |
| | | | |
| | | | |
| | | | |
| | | | |
Total distributions to shareholders | | | | |
Capital share transactions | | | | |
Proceeds from shares sold | | | | |
| | | | |
| | | | |
| | | | |
| | | | |
| | | | |
| | | | |
| | | | |
Reinvestment of distributions | | | | |
| | | | |
| | | | |
| | | | |
| | | | |
| | | | |
| | | | |
| | | | |
Payment for shares redeemed | | | | |
| | | | |
| | | | |
| | | | |
| | | | |
| | | | |
| | | | |
| | | | |
1 For the period from November 1, 2022 to June 16, 2023
The accompanying notes are an integral part of these financial statements.
14 | Allspring International Equity Fund
Statement of changes in net assets
Statement of changes in net assets
| Six months ended April 30, 2024 (unaudited) | Year ended October 31, 2023 |
| | | | |
| | | | |
| | | | |
| | | | |
| | | | |
Net decrease in net assets resulting from capital share transactions | | | | |
Total decrease in net assets | | | | |
| | | | |
| | | | |
| | | | |
2 For the period from November 1, 2022 to June 16, 2023. Effective at the close of business on June 16, 2023, Class R shares were converted to Class A shares and are no longer offered by the Fund.
The accompanying notes are an integral part of these financial statements.
Allspring International Equity Fund | 15
Financial highlights
(For a share outstanding throughout each period)
| Six months ended
April 30, 2024
(unaudited) | |
| | | | | |
Net asset value, beginning of period | | | | | | |
| | | | | | |
Net realized and unrealized gains (losses) on investments | | | | | | |
Total from investment operations | | | | | | |
Distributions to shareholders from | | | | | | |
| | | | | | |
Tax basis return of capital | | | | | | |
Total distributions to shareholders | | | | | | |
Net asset value, end of period | | | | | | |
| | | | | | |
Ratios to average net assets (annualized) | | | | | | |
| | | | | | |
| | | | | | |
| | | | | | |
| | | | | | |
| | | | | | |
Net assets, end of period (000s omitted) | | | | | | |
| Calculated based upon average shares outstanding |
| Total return calculations do not include any sales charges. Returns for periods of less than one year are not annualized. |
The accompanying notes are an integral part of these financial statements.
16 | Allspring International Equity Fund
(For a share outstanding throughout each period)
| Six months ended
April 30, 2024
(unaudited) | |
| | | | | |
Net asset value, beginning of period | | | | | | |
| | | | | | |
Net realized and unrealized gains (losses) on investments | | | | | | |
Total from investment operations | | | | | | |
Distributions to shareholders from | | | | | | |
| | | | | | |
Tax basis return of capital | | | | | | |
Total distributions to shareholders | | | | | | |
Net asset value, end of period | | | | | | |
| | | | | | |
Ratios to average net assets (annualized) | | | | | | |
| | | | | | |
| | | | | | |
| | | | | | |
| | | | | | |
| | | | | | |
Net assets, end of period (000s omitted) | | | | | | |
| Calculated based upon average shares outstanding |
| Total return calculations do not include any sales charges. Returns for periods of less than one year are not annualized. |
The accompanying notes are an integral part of these financial statements.
Allspring International Equity Fund | 17
(For a share outstanding throughout each period)
| Six months ended
April 30, 2024
(unaudited) | |
| | | | | |
Net asset value, beginning of period | | | | | | |
| | | | | | |
Net realized and unrealized gains (losses) on investments | | | | | | |
Total from investment operations | | | | | | |
Distributions to shareholders from | | | | | | |
| | | | | | |
Tax basis return of capital | | | | | | |
Total distributions to shareholders | | | | | | |
Net asset value, end of period | | | | | | |
| | | | | | |
Ratios to average net assets (annualized) | | | | | | |
| | | | | | |
| | | | | | |
| | | | | | |
| | | | | | |
| | | | | | |
Net assets, end of period (000s omitted) | | | | | | |
| Calculated based upon average shares outstanding |
| Returns for periods of less than one year are not annualized. |
The accompanying notes are an integral part of these financial statements.
18 | Allspring International Equity Fund
(For a share outstanding throughout each period)
| Six months ended
April 30, 2024
(unaudited) | |
| | | | | |
Net asset value, beginning of period | | | | | | |
| | | | | | |
Net realized and unrealized gains (losses) on investments | | | | | | |
Total from investment operations | | | | | | |
Distributions to shareholders from | | | | | | |
| | | | | | |
Tax basis return of capital | | | | | | |
Total distributions to shareholders | | | | | | |
Net asset value, end of period | | | | | | |
| | | | | | |
Ratios to average net assets (annualized) | | | | | | |
| | | | | | |
| | | | | | |
| | | | | | |
| | | | | | |
| | | | | | |
Net assets, end of period (000s omitted) | | | | | | |
| Calculated based upon average shares outstanding |
| Returns for periods of less than one year are not annualized. |
The accompanying notes are an integral part of these financial statements.
Allspring International Equity Fund | 19
(For a share outstanding throughout each period)
| Six months ended
April 30, 2024
(unaudited) | |
| | | | | |
Net asset value, beginning of period | | | | | | |
| | | | | | |
Net realized and unrealized gains (losses) on investments | | | | | | |
Total from investment operations | | | | | | |
Distributions to shareholders from | | | | | | |
| | | | | | |
Tax basis return of capital | | | | | | |
Total distributions to shareholders | | | | | | |
Net asset value, end of period | | | | | | |
| | | | | | |
Ratios to average net assets (annualized) | | | | | | |
| | | | | | |
| | | | | | |
| | | | | | |
| | | | | | |
| | | | | | |
Net assets, end of period (000s omitted) | | | | | | |
| Calculated based upon average shares outstanding |
| Returns for periods of less than one year are not annualized. |
The accompanying notes are an integral part of these financial statements.
20 | Allspring International Equity Fund
Notes to financial statements (unaudited)
Notes to financial statements
Allspring Funds Trust (the “Trust”), a Delaware statutory trust organized on March 10, 1999, is an open-end management investment company registered under the Investment Company Act of 1940, as amended (the “1940 Act”). As an investment company, the Trust follows the accounting and reporting guidance in Financial Accounting Standards Board (“FASB”) Accounting Standards Codification Topic 946, Financial Services – Investment Companies. These financial statements report on the Allspring International Equity Fund (the “Fund”) which is a diversified series of the Trust.
Effective at the close of business on June 16, 2023, Class R shares became Class A shares in a tax-free conversion. Shareholders of Class R received Class A shares at a value equal to the value of their Class R shares immediately prior to the conversion. Class R shares are no longer offered by the Fund.
2.
SIGNIFICANT ACCOUNTING POLICIES
The following significant accounting policies, which are consistently followed in the preparation of the financial statements of the Fund, are in conformity with U.S. generally accepted accounting principles which require management to make estimates and assumptions that affect the reported amounts of assets and liabilities, disclosure of contingent assets and liabilities at the date of the financial statements, and the reported amounts of income and expenses during the reporting period. Actual results could differ from those estimates.
All investments are valued each business day as of the close of regular trading on the New York Stock Exchange (generally 4 p.m. Eastern Time), although the Fund may deviate from this calculation time under unusual or unexpected circumstances.
Equity securities and exchange-traded funds that are listed on a foreign or domestic exchange or market are valued at the official closing price or, if none, the last sales price.
The values of securities denominated in foreign currencies are translated into U.S. dollars at rates provided by an independent foreign currency pricing source at a time each business day specified by the Valuation Committee at Allspring Funds Management, LLC (“Allspring Funds Management”).
Many securities markets and exchanges outside the U.S. close prior to the close of the New York Stock Exchange and therefore may not fully reflect trading or events that occur after the close of the principal exchange in which the foreign securities are traded, but before the close of the New York Stock Exchange. If such trading or events are expected to materially affect the value of such securities, then fair value pricing procedures implemented by Allspring Funds Management are applied. These procedures take into account multiple factors including movements in U.S. securities markets after foreign exchanges close. Foreign securities that are fair valued under these procedures are categorized as Level 2 and the application of these procedures may result in transfers between Level 1 and Level 2. Depending on market activity, such fair valuations may be frequent. Such fair value pricing may result in net asset values that are higher or lower than net asset values based on the last reported sales price or latest quoted bid price. On April 30, 2024, such fair value pricing was used in pricing certain foreign securities.
Investments in registered open-end investment companies (other than those listed on a foreign or domestic exchange or market) are valued at net asset value.
Investments which are not valued using the methods discussed above are valued at their fair value, as determined in good faith by Allspring Funds Management, which was named the valuation designee by the Board of Trustees. As the valuation designee, Allspring Funds Management is responsible for day-to-day valuation activities for the Allspring Funds. In connection with these responsibilities, Allspring Funds Management has established a Valuation Committee and has delegated to it the authority to take any actions regarding the valuation of portfolio securities that the Valuation Committee deems necessary or appropriate, including determining the fair value of portfolio securities. On a quarterly basis, the Board of Trustees receives reports of valuation actions taken by the Valuation Committee. On at least an annual basis, the Board of Trustees receives an assessment of the adequacy and effectiveness of Allspring Funds Management’s process for determining the fair value of the portfolio of investments.
Foreign currency translation
The accounting records of the Fund are maintained in U.S. dollars. The values of other assets and liabilities denominated in foreign currencies are translated into U.S. dollars at rates provided by an independent foreign currency pricing source at a time each business day specified by the Valuation Committee. Purchases and sales of securities, and income and expenses are converted at the rate of exchange on the respective dates of such transactions. Net realized foreign exchange gains or losses arise from sales of foreign currencies, currency gains or losses realized between the trade and settlement dates on securities transactions, and the difference between the amounts of dividends, interest and foreign withholding taxes recorded and the U.S. dollar equivalent of the amounts actually paid or received. Net unrealized foreign exchange gains and losses arise from changes in the fair value of assets and liabilities other than investments in securities resulting from changes in exchange rates. The changes in net assets arising from changes in exchange rates of securities and the changes in net assets resulting from changes in market prices of securities are not separately presented. Such changes are included in net realized and unrealized gains or losses from investments.
Security transactions and income recognition
Securities transactions are recorded on a trade date basis. Realized gains or losses are recorded on the basis of identified cost.
Allspring International Equity Fund | 21
Notes to financial statements (unaudited)
Dividend income is recognized on the ex-dividend date, except for certain dividends from foreign securities, which are recorded as soon as the custodian verifies the ex-dividend date. Dividend income is recorded net of foreign taxes withheld where recovery of such taxes is not assured.
Interest earned on cash balances held at the custodian is recorded as interest income.
Distributions to shareholders
Distributions to shareholders are recorded on the ex-dividend date and paid from net investment income quarterly and any net realized gains are paid at least annually. Such distributions are determined in accordance with income tax regulations and may differ from U.S. generally accepted accounting principles. Dividend sources are estimated at the time of declaration. The tax character of distributions is determined as of the Fund’s fiscal year end. Therefore, a portion of the Fund’s distributions made prior to the Fund’s fiscal year end may be categorized as a tax return of capital at year end.
The Fund intends to continue to qualify as a regulated investment company by distributing substantially all of its investment company taxable income and any net realized capital gains (after reduction for capital loss carryforwards) sufficient to relieve it from all, or substantially all, federal income taxes. Accordingly, no provision for federal income taxes was required.
The Fund’s income and federal excise tax returns and all financial records supporting those returns for the prior three fiscal years are subject to examination by the federal and Delaware revenue authorities. Management has analyzed the Fund’s tax positions taken on federal, state, and foreign tax returns, as applicable, for all open tax years and does not believe that there are any uncertain tax positions that require recognition of a tax liability.
As of April 30, 2024, the aggregate cost of all investments for federal income tax purposes was $218,184,514 and the unrealized gains (losses) consisted of:
As of October 31, 2023, the Fund had capital loss carryforwards which consisted of $30,200,647 in short-term capital losses and $64,967,997 in long-term capital losses.
The separate classes of shares offered by the Fund differ principally in applicable sales charges, distribution, shareholder servicing, and administration fees. Class specific expenses are charged directly to that share class. Investment income, common fund-level expenses, and realized and unrealized gains (losses) on investments are allocated daily to each class of shares based on the relative proportion of net assets of each class.
3.
FAIR VALUATION MEASUREMENTS
Fair value measurements of investments are determined within a framework that has established a fair value hierarchy based upon the various data inputs utilized in determining the value of the Fund’s investments. The three-level hierarchy gives the highest priority to unadjusted quoted prices in active markets for identical assets or liabilities (Level 1) and the lowest priority to unobservable inputs (Level 3). The Fund’s investments are classified within the fair value hierarchy based on the lowest level of input that is significant to the fair value measurement. The inputs are summarized into three broad levels as follows:
•Level 1—quoted prices in active markets for identical securities
•Level 2—other significant observable inputs (including quoted prices for similar securities, interest rates, prepayment speeds, credit risk, etc.)
•Level 3—significant unobservable inputs (including the Fund’s own assumptions in determining the fair value of investments)
The inputs or methodologies used for valuing investments in securities are not necessarily an indication of the risk associated with investing in those securities.
22 | Allspring International Equity Fund
Notes to financial statements (unaudited)
The following is a summary of the inputs used in valuing the Fund’s assets and liabilities as of April 30, 2024:
| | Other significant
observable inputs
(Level 2) | Significant
unobservable inputs
(Level 3) | |
| | | | |
| | | | |
| | | | |
| | | | |
| | | | |
| | | | |
| | | | |
| | | | |
| | | | |
| | | | |
| | | | |
| | | | |
| | | | |
| | | | |
| | | | |
| | | | |
| | | | |
| | | | |
| | | | |
| | | | |
Additional sector, industry or geographic detail, if any, is included in the Portfolio of Investments.
At April 30, 2024, the Fund did not have any transfers into/out of Level 3.
4.
TRANSACTIONS WITH AFFILIATES
Allspring Funds Management, a wholly owned subsidiary of Allspring Global Investments Holdings, LLC, a holding company indirectly owned by certain private funds of GTCR LLC and Reverence Capital Partners, L.P., is the manager of the Fund and provides advisory and fund-level administrative services under an investment management agreement. Under the investment management agreement, Allspring Funds Management is responsible for, among other services, implementing the investment objectives and strategies of the Fund, supervising the subadviser and providing fund-level administrative services in connection with the Fund’s operations. As compensation for its services under the investment management agreement, Allspring Funds Management is entitled to receive a management fee at the following annual rate based on the Fund’s average daily net assets:
For the six months ended April 30, 2024, the management fee was equivalent to an annual rate of 0.80% of the Fund’s average daily net assets.
Allspring Funds Management has retained the services of a subadviser to provide daily portfolio management to the Fund. The fee for subadvisory services is borne by Allspring Funds Management. Allspring Global Investments, LLC, an affiliate of Allspring Funds Management and a wholly owned subsidiary of Allspring Global Investments Holdings, LLC, is the subadviser to the Fund and is entitled to receive a fee from Allspring Funds Management at an annual rate starting at 0.45% and declining to 0.40% as the average daily net assets of the Fund increase.
Under a class-level administration agreement, Allspring Funds Management provides class-level administrative services to the Fund, which includes paying fees and expenses for services provided by the transfer agent, sub-transfer agents, omnibus account servicers and record-keepers. As
Allspring International Equity Fund | 23
Notes to financial statements (unaudited)
compensation for its services under the class-level administration agreement, Allspring Funds Management receives an annual fee which is calculated based on the average daily net assets of each class as follows:
| Class-level
administration fee |
| |
| |
| |
| |
| |
Waivers and/or expense reimbursements
Allspring Funds Management has contractually committed to waive and/or reimburse management and administration fees to the extent necessary to maintain certain net operating expense ratios for the Fund. When each class of the Fund has exceeded its expense cap, Allspring Funds Management will waive fees and/or reimburse expenses from fund-level expenses on a proportionate basis and then from class specific expenses. When only certain classes exceed their expense caps, waivers and/or reimbursements are applied against class specific expenses before fund-level expenses. Allspring Funds Management has contractually committed through February 28, 2025 to waive fees and/or reimburse expenses to the extent necessary to cap the Fund’s expenses. Prior to or after the commitment expiration date, the cap may be increased or the commitment to maintain the cap may be terminated only with the approval of the Board of Trustees. As of April 30, 2024, the contractual caps are as follows:
The Trust has adopted a distribution plan for Class C shares pursuant to Rule 12b-1 under the 1940 Act. A distribution fee is charged to Class C shares and paid to Allspring Funds Distributor, LLC (“Allspring Funds Distributor”), the principal underwriter, an affiliate of Allspring Funds Management, at an annual rate up to 0.75% of the average daily net assets of Class C shares.
In addition, Allspring Funds Distributor is entitled to receive the front-end sales charge from the purchase of Class A shares and a contingent deferred sales charge on the redemption of certain Class A shares. Allspring Funds Distributor is also entitled to receive the contingent deferred sales charges from redemptions of Class C shares. For the six months ended April 30, 2024, Allspring Funds Distributor received $1,744 from the sale of Class A shares. No contingent deferred sales charges were incurred by Class A and Class C shares for the six months ended April 30, 2024.
Shareholder servicing fees
The Trust has entered into contracts with one or more shareholder servicing agents, whereby Class A, Class C, and Administrator Class are charged a fee at an annual rate up to 0.25% of the average daily net assets of each respective class. A portion of these total shareholder servicing fees were paid to affiliates of the Fund.
The Fund may purchase or sell portfolio investment securities to certain affiliates pursuant to Rule 17a-7 under the 1940 Act and under procedures adopted by the Board of Trustees. The procedures have been designed to ensure that these interfund transactions, which do not incur broker commissions, are effected at current market prices. Pursuant to these procedures, the Fund did not have any interfund transactions during the six months ended April 30, 2024.
5.
INVESTMENT PORTFOLIO TRANSACTIONS
Purchases and sales of investments, excluding U.S. government obligations (if any) and short-term securities, for the six months ended April 30, 2024 were $80,292,877 and $127,044,674, respectively.
The Trust (excluding the money market funds), Allspring Master Trust and Allspring Variable Trust are parties to a $350,000,000 revolving credit agreement whereby the Fund is permitted to use bank borrowings for temporary or emergency purposes, such as to fund shareholder redemption
24 | Allspring International Equity Fund
Notes to financial statements (unaudited)
requests. Interest under the credit agreement is charged to the Fund based on a borrowing rate equal to the higher of the Federal Funds rate or the overnight bank funding rate in effect on that day plus a spread. In addition, an annual commitment fee based on the unused balance is allocated to each participating fund.
For the six months ended April 30, 2024, there were no borrowings by the Fund under the agreement.
As of the end of the period, the Fund concentrated its portfolio of investments in Europe. A fund that invests a substantial portion of its assets in any country or geographic region will be more vulnerable than a fund that invests its assets more broadly to the economic, financial, political or other developments affecting that country or region. Such developments may have a significant impact on the Fund’s investment performance causing such performance to be more volatile than the investment performance of a more geographically diversified fund.
Under the Fund’s organizational documents, the officers and Trustees have been granted certain indemnification rights against certain liabilities that may arise out of performance of their duties to the Fund. The Fund has entered into a separate agreement with each Trustee that converts indemnification rights currently existing under the Fund’s organizational documents into contractual rights that cannot be changed in the future without the consent of the Trustee. Additionally, in the normal course of business, the Fund may enter into contracts with service providers that contain a variety of indemnification clauses. The Fund’s maximum exposure under these arrangements is dependent on future claims that may be made against the Fund and, therefore, cannot be estimated.
Allspring International Equity Fund | 25
Other information (unaudited)
Other information
A description of the policies and procedures used to determine how to vote proxies relating to portfolio securities is available without charge, upon request, by calling 1-866-259-3305, visiting our website at allspringglobal.com, or visiting the SEC website at sec.gov. Information regarding how the proxies related to portfolio securities were voted during the most recent 12-month period ended June 30 is available on the website at allspringglobal.com or by visiting the SEC website at sec.gov.
Quarterly portfolio holdings information
The Fund files its complete schedule of portfolio holdings with the SEC for the first and third quarters of each fiscal year as an exhibit to its reports on Form N-PORT. Shareholders may view the filed Form N-PORT by visiting the SEC website at sec.gov.
26 | Allspring International Equity Fund
Other information (unaudited)
Board of trustees and officers
Each of the Trustees and Officers listed in the table below acts in identical capacities for each fund in the Allspring family of funds, which consists of 99 mutual funds comprising the Allspring Funds Trust, Allspring Variable Trust, Allspring Master Trust and four closed-end funds (collectively the “Fund Complex”). This table should be read in conjunction with the Prospectus and the Statement of Additional Information*. The mailing address of each Trustee and Officer is 1415 Vantage Park Drive, 3rd Floor, Charlotte, NC 28203. Each Trustee and Officer serves an indefinite term, however, each Trustee serves such term until reaching the mandatory retirement age established by the Trustees.
| Position held and
length of | Principal occupations during past five years or longer | Current other
public company or
investment
company
directorships |
William R. Ebsworth
(Born 1957) | | Retired. From 1984 to 2013, equities analyst, portfolio manager, research director and chief investment officer at Fidelity Management and Research Company in Boston, Tokyo, and Hong Kong, and retired in 2013 as Chief Investment Officer of Fidelity Strategic Advisers, Inc. where he led a team of investment professionals managing client assets. Prior thereto, Board member of Hong Kong Securities Clearing Co., Hong Kong Options Clearing Corp., the Thailand International Fund, Ltd., Fidelity Investments Life Insurance Company, and Empire Fidelity Investments Life Insurance Company. Serves on the Investment Company Institute’s Board of Governors since 2022 and Executive Committee since 2023 as well as the Vice Chairman of the Governing Council of the Independent Directors Council since 2023. Audit Committee Chair and Investment Committee Chair of the Vincent Memorial Hospital Foundation (non-profit organization). Mr. Ebsworth is a CFA charterholder. | |
Jane A. Freeman
(Born 1953) | Trustee,
since 2015;
Chair Liaison,
| Retired. From 2012 to 2014 and 1999 to 2008, Chief Financial Officer of Scientific Learning Corporation. From 2008 to 2012, Ms. Freeman provided consulting services related to strategic business projects. Prior to 1999, Portfolio Manager at Rockefeller & Co. and Scudder, Stevens & Clark. Board member of the Harding Loevner Funds from 1996 to 2014, serving as both Lead Independent Director and chair of the Audit Committee. Board member of the Russell Exchange Traded Funds Trust from 2011 to 2012 and the chair of the Audit Committee. Ms. Freeman is also an inactive Chartered Financial Analyst. | |
Isaiah Harris, Jr.
(Born 1952) | Trustee,
since 2009;
Audit Committee Chair,
since 2019 | Retired. Member of the Advisory Board of CEF of East Central Florida. Chairman of the Board of CIGNA Corporation from 2009 to 2021, and Director from 2005 to 2008. From 2003 to 2011, Director of Deluxe Corporation. Prior thereto, President and CEO of BellSouth Advertising and Publishing Corp. from 2005 to 2007, President and CEO of BellSouth Enterprises from 2004 to 2005 and President of BellSouth Consumer Services from 2000 to 2003. Emeritus member of the Iowa State University Foundation Board of Governors. Emeritus Member of the Advisory board of Iowa State University School of Business. Advisory Board Member, Palm Harbor Academy (private school). Advisory Board Member, Fellowship of Christian Athletes. Mr. Harris is a certified public accountant (inactive status). | |
David F. Larcker
(Born 1950) | | Distinguished Visiting Fellow at the Hoover Institution since 2022. James Irvin Miller Professor of Accounting at the Graduate School of Business (Emeritus), Stanford University, Director of the Corporate Governance Research Initiative and Senior Faculty of The Rock Center for Corporate Governance since 2006. From 2005 to 2008, Professor of Accounting at the Graduate School of Business, Stanford University. Prior thereto, Ernst & Young Professor of Accounting at The Wharton School, University of Pennsylvania from 1985 to 2005. | |
Olivia S. Mitchell
(Born 1953) | | International Foundation of Employee Benefit Plans Professor since 1993, Wharton School of the University of Pennsylvania. Director of Wharton’s Pension Research Council and Boettner Center on Pensions & Retirement Research, and Research Associate at the National Bureau of Economic Research. Previously taught at Cornell University from 1978 to 1993. | |
Timothy J. Penny
(Born 1951) | Trustee,
since 1996;
Chair,
since 2018 | President and Chief Executive Officer of Southern Minnesota Initiative Foundation, a non-profit organization, since 2007. Vice Chair of the Economic Club of Minnesota, since 2007. Co-Chair of the Committee for a Responsible Federal Budget, since 1995. Member of the Board of Trustees of NorthStar Education Finance, Inc., a non-profit organization, from 2007-2022. Senior Fellow of the University of Minnesota Humphrey Institute from 1995 to 2017. | |
** Length of service dates reflect the Trustee’s commencement of service with the Trust’s predecessor entities, where applicable.
*** Ms. Freeman will serve as Chair Liaison through June 2024, at which time Ms. Wheelock will assume the role.
*
The Statement of Additional Information includes additional information about the Trustees and is available, without charge, upon request, by calling 1-800-222-8222 or by visiting the website at allspringglobal.com.
Allspring International Equity Fund | 27
Other information (unaudited)
| Position held and length of service** | Principal occupations during past five years or longer | Current other public company or investment company directorships |
James G. Polisson
(Born 1959) | Trustee,
since 2018;
Nominating and Governance Committee Chair,
since 2024 | Retired. Chief Marketing Officer, Source (ETF) UK Services, Ltd, from 2015 to 2017. From 2012 to 2015, Principal of The Polisson Group, LLC, a management consulting, corporate advisory and principal investing company. Chief Executive Officer and Managing Director at Russell Investments, Global Exchange Traded Funds from 2010 to 2012. Managing Director of Barclays Global Investors from 1998 to 2010 and Global Chief Marketing Officer for iShares and Barclays Global Investors from 2000 to 2010. Trustee of the San Francisco Mechanics’ Institute, a non- profit organization, from 2013 to 2015. Board member of the Russell Exchange Traded Fund Trust from 2011 to 2012. Director of Barclays Global Investors Holdings Deutschland GmbH from 2006 to 2009. Mr. Polisson is an attorney and has a retired status with the Massachusetts and District of Columbia Bar Associations. | |
Pamela Wheelock
(Born 1959) | Trustee,
since January 2020;
previously Trustee from
January 2018 to
| Retired. Executive and Senior Financial leadership positions in the public, private and nonprofit sectors. Interim President and CEO, McKnight Foundation, 2020. Interim Commissioner, Minnesota Department of Human Services, 2019. Chief Operating Officer, Twin Cities Habitat for Humanity, 2017-2019. Vice President for University Services, University of Minnesota, 2012- 2016. Interim President and CEO, Blue Cross and Blue Shield of Minnesota, 2011-2012. Executive Vice-President and Chief Financial Officer, Minnesota Wild, 2002-2008. Commissioner, Minnesota Department of Finance, 1999-2002. Chair of the Board of Directors of Destination Medical Center Corporation. Board member of the Minnesota Wild Foundation. | |
** Length of service dates reflect the Trustee’s commencement of service with the Trust’s predecessor entities, where applicable.
*** Ms. Freeman will serve as Chair Liaison through June 2024, at which time Ms. Wheelock will assume the role.
28 | Allspring International Equity Fund
Other information (unaudited)
Officers1
| Position held and
length of service | Principal occupations during past five years or longer |
| | President and Chief Executive Officer of Allspring Funds Management, LLC since 2017 and Head of Global Fund Governance of Allspring Global Investments since 2022. Prior thereto, co-president of Galliard Capital Management, LLC, an affiliate of Allspring Funds Management, LLC, from 2019 to 2022 and Head of Affiliated Managers, Allspring Global Investments, from 2014 to 2019 and Executive Vice President responsible for marketing, investments and product development for Allspring Funds Management, LLC, from 2009 to 2014. |
Jeremy DePalma
(Born 1974) | Treasurer,
since 2012
(for certain funds in
the Fund Complex);
since 2021 (for
the remaining funds in the Complex) | Senior Vice President of Allspring Funds Management, LLC since 2009. Senior Vice President of Evergreen Investment Management Company, LLC from 2008 to 2010 and head of the Fund Reporting and Control Team within Fund Administration from 2005 to 2010. |
Christopher Baker
(Born 1976) | Chief Compliance Officer,
since 2022 | Global Chief Compliance Officer for Allspring Global Investments since 2022. Prior thereto, Chief Compliance Officer for State Street Global Advisors from 2018 to 2021. Senior Compliance Officer for the State Street divisions of Alternative Investment Solutions, Sector Solutions, and Global Marketing from 2015 to 2018. From 2010 to 2015 Vice President, Global Head of Investment and Marketing Compliance for State Street Global Advisors. |
Matthew Prasse
(Born 1983) | Chief Legal Officer,
since 2022;
Secretary,
since 2021 | Senior Counsel of the Allspring Legal Department since 2021. Senior Counsel of the Wells Fargo Legal Department from 2018 to 2021. Previously, Counsel for Barings LLC from 2015 to 2018. Prior to joining Barings, Associate at Morgan, Lewis & Bockius LLP from 2008 to 2015. |
1 For those Officers with tenures at Allspring Global Investments and/or Allspring Funds Management, LLC that began prior to 2021, such tenures include years of service during which these businesses/entities were known as Wells Fargo Asset Management and Wells Fargo Funds Management, LLC, respectively.
Allspring International Equity Fund | 29
For more information
More information about Allspring Funds is available free upon request. To obtain literature, please write, visit the Fund’s website, or call:
Allspring Funds
P.O. Box 219967
Kansas City, MO 64121-9967
Website: allspringglobal.com
Individual investors: 1-800-222-8222
Retail investment professionals: 1-888-877-9275
Institutional investment professionals: 1-800-260-5969
This report and the financial statements contained herein are submitted for the general information of the shareholders of the Fund. If this report is used for promotional purposes, distribution of the report must be accompanied or preceded by a current prospectus. Before investing, please consider the investment objectives, risks, charges, and expenses of the investment. For a current prospectus and, if available, a summary prospectus, containing this information, call 1-800-222-8222 or visit the Fund’s website at allspringglobal.com. Read the prospectus carefully before you invest or send money.
Allspring Global InvestmentsTM is the trade name for the asset management firms of Allspring Global Investments Holdings, LLC, a holding company indirectly owned by certain private funds of GTCR LLC and Reverence Capital Partners, L.P. These firms include but are not limited to Allspring Global Investments, LLC, and Allspring Funds Management, LLC. Certain products managed by Allspring entities are distributed by Allspring Funds Distributor, LLC (a broker-dealer and Member FINRA/SIPC).
This material is for general informational and educational purposes only and is NOT intended to provide investment advice or a recommendation of any kind - including a recommendation for any specific investment, strategy, or plan.
© 2024 Allspring Global Investments Holdings, LLC. All rights reserved.
ALL-05022024-sopaxxdc 06-24
SAR3311 04-24
Allspring Special Global Small Cap Fund
The views expressed and any forward-looking statements are as of April 30, 2024, unless otherwise noted, and are those of the portfolio managers and/or Allspring Global Investments. Discussions of individual securities or the markets generally are not intended as individual recommendations. Future events or results may vary significantly from those expressed in any forward-looking statements. The views expressed are subject to change at any time in response to changing circumstances in the market. Allspring Global Investments disclaims any obligation to publicly update or revise any views expressed or forward-looking statements.
Allspring Special Global Small Cap Fund | 1
Letter to shareholders (unaudited)
Dear Shareholder:
We are pleased to offer you this semi-annual report for the Allspring Special Global Small Cap Fund for the six-month period that ended April 30, 2024. Globally, stocks and bonds had strongly positive returns for the period. However, markets were volatile as investors focused on persistently high inflation and the impact of aggressive central bank rate hikes. Riskier assets rallied as investors anticipated an end to the tight monetary policy.
For the period, U.S. stocks, based on the S&P 500 Index,1 returned 20.98%. International stocks, as measured by the MSCI ACWI ex USA Index (Net),2 gained 17.69% while the MSCI EM Index (Net) (USD),3 returned 15.40%. Among bond indexes, the Bloomberg U.S. Aggregate Bond Index4 advanced 4.97%, the Bloomberg Global Aggregate ex-USD Index (unhedged)5 gained 3.92%, the Bloomberg Municipal Bond Index6 returned 7.06%, and the ICE BofA U.S. High Yield Index7 gained 8.94%.
Investors remained focused on central bank monetary policies.
As the six-month period began in November, the market mood brightened as cooling inflation inspired confidence that central banks could hold off on further rate hikes. Overall annual inflation in the U.S. fell to 3.1% in November while 12-month inflation in the U.K. and the eurozone eased to 4.6% and 2.4%, respectively—far below their peak levels of mid-2022. Third quarter annualized U.S. GDP growth was raised to an estimated 5.2% while U.S. job totals rose by close to 200,000 in November, indicating a slight cooling of the labor market. All of this fresh evidence added to confidence for a U.S. soft economic landing, leading to a more buoyant mood heading into winter.
The broad year-end rally among stocks and bonds that began in November continued through December as investors became more confident that monetary policy would ease in 2024. Supporting the bubbly market mood were a series of reports confirming lower inflationary trends in the U.S. and Europe. During the period, it appeared more likely that the U.S. economy could achieve a soft landing, cooling enough to lower inflation without the pain of a recession. However, by year-end, an expectations gap developed. Capital markets priced in a total of 1.50 percentage points in federal funds rate cuts in 2024—twice as much as the three cuts of 0.25% hinted at by Fed officials.
1
The S&P 500 Index consists of 500 stocks chosen for market size, liquidity, and industry group representation. It is a market-value-weighted index with each stock’s weight in the index proportionate to its market value. You cannot invest directly in an index.
2
The Morgan Stanley Capital International (MSCI) All Country World Index (ACWI) ex USA Index (Net) is a free-float-adjusted market-capitalization-weighted index that is designed to measure the equity market performance of developed and emerging markets, excluding the U.S. Source: MSCI. MSCI makes no express or implied warranties or representations and shall have no liability whatsoever with respect to any MSCI data contained herein. The MSCI data may not be further redistributed or used as a basis for other indexes or any securities or financial products. This report is not approved, reviewed, or produced by MSCI. You cannot invest directly in an index.
3
The MSCI Emerging Markets (EM) Index (Net) (USD) is a free-float-adjusted market-capitalization-weighted index that is designed to measure the equity market performance of emerging markets. You cannot invest directly in an index.
4
The Bloomberg U.S. Aggregate Bond Index is a broad-based benchmark that measures the investment-grade, U.S.-dollar-denominated, fixed-rate taxable bond market, including Treasuries, government-related and corporate securities, mortgage-backed securities (agency fixed-rate and hybrid adjustable-rate mortgage pass-throughs), asset-backed securities, and commercial mortgage-backed securities. You cannot invest directly in an index.
5
The Bloomberg Global Aggregate ex-USD Index (unhedged) is an unmanaged index that provides a broad-based measure of the global investment-grade fixed-income markets excluding the U.S.-dollar-denominated debt market. You cannot invest directly in an index.
6
The Bloomberg Municipal Bond Index is an unmanaged index composed of long-term tax-exempt bonds with a minimum credit rating of Baa. You cannot invest directly in an index.
7
The ICE BofA U.S. High Yield Index is a market-capitalization-weighted index of domestic and Yankee high yield bonds. The index tracks the performance of high yield securities traded in the U.S. bond market. Returns shown are net of transaction costs beginning on July 1, 2022. You cannot invest directly in an index. Copyright 2024. ICE Data Indices, LLC. All rights reserved.
2 | Allspring Special Global Small Cap Fund
Letter to shareholders (unaudited)
Financial market performance was mixed in January 2024 as U.S. stocks had modest gains while non-U.S. equities, particularly those in emerging markets, and fixed income assets were held back by central bank pushback on market optimism over rate cuts. Overall, optimism was supported by hints of a soft landing for the U.S. economy. Key data included a surprisingly strong gain of 353,000 jobs in January, an unemployment rate of just 3.7%, and a rise of just 3.1% in the annual Consumer Price Index1 (CPI) in January. However, that resilience helped tone down expectations of a rate cut in March to a more likely second quarter initial move.
In February, stocks were supported by positive economic data and strong corporate earnings. However, fixed income investments were under pressure as resilient inflation curbed expectations on the timing of interest rate cuts. The S&P 500 Index had solid monthly gains along with emerging market equities, which benefited from a rebound in China.
The first quarter of 2024 closed with ongoing stock market momentum and a more muted sense of confidence in fixed income markets as investors adjusted to the prospect of greater-than-expected economic strength. On the flip side, expectations on the timing of an initial Fed rate cut were pushed back from March to June and then beyond. Additionally, the number of quarter-point rate cuts forecast by the market fell from six as projected in December 2023 to two to three cuts by fiscal period-end.
Markets retreated broadly in April as U.S. annual inflation continued to resist monetary policy efforts and expectations for its downward trajectory, with an April CPI reading of 3.4%. The timing of a Fed initial rate cut came into greater question in April. Not only was there less confidence regarding when a first cut would take place but also whether any rate reductions would occur at all in 2024. Market expectations continued to recede to a possible September Fed first cut. Meanwhile, eurozone annual inflation held steady in April at 2.4%. Developed market stocks and fixed income securities of all types were in the red for April.
Don’t let short-term uncertainty derail long-term investment goals.
Periods of investment uncertainty can present challenges, but experience has taught us that maintaining long-term investment goals can be an effective way to plan for the future. To help you create a sound strategy based on your personal goals and risk tolerance, Allspring Funds offers a wide variety of mutual funds spanning many asset classes and investment styles. Although diversification cannot guarantee an investment profit or prevent losses, we believe it can be an effective way to manage investment risk and potentially smooth out overall portfolio performance. We encourage investors to know their investments and to understand that appropriate levels of risk-taking may unlock opportunities.
Thank you for choosing to invest with Allspring Funds. We appreciate your confidence in us and remain committed to helping you meet your financial needs.
Andrew Owen
President
Allspring Funds
“ The first quarter of 2024 closed with ongoing stock market momentum and a more muted sense of confidence in fixed income markets as investors adjusted to the prospect of greater-than-expected economic strength. ”
For further information about your fund, contact your investment professional, visit our website at allspringglobal.com, or call us directly at 1-800-222-8222.
1
The Consumer Price Index (CPI) is a measure of the average change over time in the prices paid by urban consumers for a market basket of consumer goods and services. You cannot invest directly in an index.
Allspring Special Global Small Cap Fund | 3
Letter to shareholders (unaudited)
|
Beginning in July 2024, the Fund will be required by the Securities and Exchange Commission to send shareholders a paper copy of a new tailored shareholder report in place of the full shareholder report that you are now receiving. The tailored shareholder report will contain concise information about the Fund, including certain expense and performance information and fund statistics. If you wish to receive this new tailored shareholder report electronically, please follow the instructions on the back cover of this report. |
Other information that is currently included in the shareholder report, such as the Fund’s financial statements, will be available online and upon request, free of charge, in paper or electronic format. |
4 | Allspring Special Global Small Cap Fund
This page is intentionally left blank.
Performance highlights (unaudited)
Performance highlights
| The Fund seeks long-term capital appreciation. |
| Allspring Funds Management, LLC |
| Allspring Global Investments, LLC |
| Stephen Giggie, CFA, Oleg Makhorine, Brian Martin, CFA, James M. Tringas, CFA, Bryant VanCronkhite, CFA, CPA |
Average annual total returns (%) as of April 30, 2024 |
| | | | |
| | | | | | | | | |
| | | | | | | | | |
| | | | | | | | | |
Administrator Class (EKGYX) | | | | | | | | | |
Institutional Class (EKGIX) | | | | | | | | | |
| | | | | | | | | |
MSCI World Small Cap Index (Net)4 | | | | | | | | | |
Figures quoted represent past performance, which is no guarantee of future results, and do not reflect taxes that a shareholder may pay on an investment in a fund. Investment return and principal value of an investment will fluctuate so that an investor’s shares, when redeemed, may be worth more or less than their original cost. Performance shown without sales charges would be lower if sales charges were reflected. Current performance may be lower or higher than the performance data quoted, which assumes the reinvestment of dividends and capital gains. Current month-end performance is available on the Fund’s website, allspringglobal.com.
Index returns do not include transaction costs associated with buying and selling securities, any mutual fund fees or expenses, or any taxes. It is not possible to invest directly in an index.
For Class A shares, the maximum front-end sales charge is 5.75%. For Class C shares, the maximum contingent deferred sales charge is 1.00%. Performance including a contingent deferred sales charge assumes the sales charge for the corresponding time period. Administrator Class and Institutional Class shares are sold without a front-end sales charge or contingent deferred sales charge.
|
| Reflects the expense ratios as stated in the most recent prospectuses. The expense ratios shown are subject to change and may differ from the annualized expense ratios shown in the Financial Highlights of this report. |
| The manager has contractually committed through February 28, 2025, to waive fees and/or reimburse expenses to the extent necessary to cap total annual fund operating expenses after fee waivers at 1.47% for Class A, 2.22% for Class C, 1.40% for Administrator Class and 1.15% for Institutional Class. Brokerage commissions, stamp duty fees, interest, taxes, acquired fund fees and expenses (if any), and extraordinary expenses are excluded from the expense caps. Prior to or after the commitment expiration date, the caps may be increased or the commitment to maintain the caps may be terminated only with the approval of the Board of Trustees. Without these caps, the Fund’s returns would have been lower. The expense ratio paid by an investor is the net expense ratio (the total annual fund operating expenses after fee waivers) as stated in the prospectuses. |
| The Morgan Stanley Capital International (MSCI) All Country World Index (ACWI) (Net) is a free-float-adjusted market-capitalization-weighted index that is designed to measure the equity market performance of developed and emerging markets. Source: MSCI. MSCI makes no express or implied warranties or representations and shall have no liability whatsoever with respect to any MSCI data contained herein. The MSCI data may not be further redistributed or used as a basis for other indexes or any securities or financial products. This report is not approved, reviewed, or produced by MSCI. You cannot invest directly in an index. |
| The MSCI World Small Cap Index (Net) captures small cap representation across 23 developed markets countries. The index covers approximately 14% of the free float- adjusted market capitalization in each country. You cannot invest directly in an index. |
Investing involves risk, including the possible loss of principal. Stock values fluctuate in response to the activities of individual companies and general market and economic conditions. Smaller company stocks tend to be more volatile and less liquid than those of larger companies. Foreign investments are especially volatile and can rise or fall dramatically due to differences in the political and economic conditions of the host country. Consult the Fund’s prospectus for additional information on these and other risks.
CFA® and Chartered Financial Analyst® are trademarks owned by CFA Institute. |
6 | Allspring Special Global Small Cap Fund
Performance highlights (unaudited)
Ten largest holdings (%) as of April 30, 20241 |
| |
Gibraltar Industries, Inc. | |
| |
| |
| |
| |
| |
Hanover Insurance Group, Inc. | |
| |
| |
| Figures represent the percentage of the Fund’s net assets. Holdings are subject to change and may have changed since the date specified. |
Sector allocation as of April 30, 20241 |
| Figures represent the percentage of the Fund’s long-term investments. Allocations are subject to change and may have changed since the date specified. |
Geographic allocation as of April 30, 20241 |
| Figures represent the percentage of the Fund’s long-term investments. Allocations are subject to change and may have changed since the date specified. |
Allspring Special Global Small Cap Fund | 7
Fund expenses (unaudited)
Fund expenses
As a shareholder of the Fund, you incur two types of costs: (1) transaction costs, including sales charges (loads) on purchase payments and contingent deferred sales charges (if any) on redemptions and (2) ongoing costs, including management fees, distribution (12b-1) and/or shareholder servicing fees, and other Fund expenses. This example is intended to help you understand your ongoing costs (in dollars) of investing in the Fund and to compare these costs with the ongoing costs of investing in other mutual funds.
The example is based on an investment of $1,000 invested at the beginning of the six-month period and held for the entire period from November 1, 2023 to April 30, 2024.
The “Actual” line of the table below provides information about actual account values and actual expenses. You may use the information in this line, together with the amount you invested, to estimate the expenses that you paid over the period. Simply divide your account value by $1,000 (for example, an $8,600 account value divided by $1,000= 8.6), then multiply the result by the number in the “Actual” line under the heading entitled “Expenses paid during period” for your applicable class of shares to estimate the expenses you paid on your account during this period.
Hypothetical example for comparison purposes
The “Hypothetical” line of the table below provides information about hypothetical account values and hypothetical expenses based on the Fund’s actual expense ratio and an assumed rate of return of 5% per year before expenses, which is not the Fund’s actual return. The hypothetical account values and expenses may not be used to estimate the actual ending account balance or expenses you paid for the period. You may use this information to compare the ongoing costs of investing in the Fund and other funds. To do so, compare this 5% hypothetical example with the 5% hypothetical examples that appear in the shareholder reports of the other funds.
Please note that the expenses shown in the table are meant to highlight your ongoing costs only and do not reflect any transactional costs, such as sales charges (loads) and contingent deferred sales charges. Therefore, the “Hypothetical” line of the table is useful in comparing ongoing costs only, and will not help you determine the relative total costs of owning different funds. In addition, if these transactional costs were included, your costs would have been higher.
| Beginning
account value
11-1-2023 | Ending
account value
4-30-2024 | | Annualized net
expense ratio |
| | | | |
| | | | |
Hypothetical (5% return before expenses) | | | | |
| | | | |
| | | | |
Hypothetical (5% return before expenses) | | | | |
| | | | |
| | | | |
Hypothetical (5% return before expenses) | | | | |
| | | | |
| | | | |
Hypothetical (5% return before expenses) | | | | |
| Expenses paid is equal to the annualized net expense ratio of each class multiplied by the average account value over the period, multiplied by 182 divided by 366 (to reflect the one-half-year period). |
8 | Allspring Special Global Small Cap Fund
Portfolio of investments—April 30, 2024 (unaudited)
| | | | | |
| | | | | | |
| | | | | | |
Ansell Ltd. (Health care, Health care equipment & supplies) | | | | | | |
Bapcor Ltd. (Consumer discretionary, Distributors) | | | | | | |
Domino’s Pizza Enterprises Ltd. (Consumer discretionary, Hotels, restaurants & leisure) | | | | | | |
Steadfast Group Ltd. (Financials, Insurance) | | | | | | |
| | | | | | |
| | | | | | |
Barco NV (Information technology, Electronic equipment, instruments & components) | | | | | | |
| | | | | | |
ATS Corp. (Industrials, Machinery)† | | | | | | |
Canadian Western Bank (Financials, Banks) | | | | | | |
Novanta, Inc. (Information technology, Electronic equipment, instruments & components)† | | | | | | |
Primo Water Corp. (Consumer staples, Beverages) | | | | | | |
| | | | | | |
| | | | | | |
Alten SA (Information technology, IT services) | | | | | | |
Metropole Television SA (Communication services, Media) | | | | | | |
| | | | | | |
| | | | | | |
Cancom SE (Information technology, IT services) | | | | | | |
CTS Eventim AG & Co. KGaA (Communication services, Entertainment) | | | | | | |
Gerresheimer AG (Health care, Life sciences tools & services) | | | | | | |
Krones AG (Industrials, Machinery) | | | | | | |
TAG Immobilien AG (Real estate, Real estate management & development)† | | | | | | |
| | | | | | |
| | | | | | |
Irish Residential Properties REIT PLC (Real estate, Residential REITs) | | | | | | |
| | | | | | |
GVS SpA (Industrials, Machinery)144A† | | | | | | |
Interpump Group SpA (Industrials, Machinery) | | | | | | |
| | | | | | |
| | | | | | |
Aeon Delight Co. Ltd. (Industrials, Commercial services & supplies) | | | | | | |
Daiseki Co. Ltd. (Industrials, Commercial services & supplies) | | | | | | |
DTS Corp. (Information technology, IT services) | | | | | | |
Fuji Seal International, Inc. (Materials, Containers & packaging) | | | | | | |
Horiba Ltd. (Information technology, Electronic equipment, instruments & components) | | | | | | |
MEITEC Group Holdings, Inc. (Industrials, Professional services) | | | | | | |
Nihon Parkerizing Co. Ltd. (Materials, Chemicals) | | | | | | |
The accompanying notes are an integral part of these financial statements.
Allspring Special Global Small Cap Fund | 9
Portfolio of investments—April 30, 2024 (unaudited)
| | | | | |
| | | | | | |
Orix JREIT, Inc. (Real estate, Office REITs) | | | | | | |
Taikisha Ltd. (Industrials, Construction & engineering) | | | | | | |
| | | | | | |
| | | | | | |
MYT Netherlands Parent BV ADR (Consumer discretionary, Specialty retail)† | | | | | | |
TKH Group NV (Industrials, Electrical equipment)† | | | | | | |
| | | | | | |
| | | | | | |
Atea ASA (Information technology, IT services) | | | | | | |
Elopak ASA (Materials, Containers & packaging) | | | | | | |
| | | | | | |
| | | | | | |
Viscofan SA (Consumer staples, Food products) | | | | | | |
| | | | | | |
Hexpol AB (Materials, Chemicals) | | | | | | |
Loomis AB (Industrials, Commercial services & supplies) | | | | | | |
| | | | | | |
| | | | | | |
Bossard Holding AG Class A (Industrials, Trading companies & distributors) | | | | | | |
Bucher Industries AG (Industrials, Machinery) | | | | | | |
| | | | | | |
| | | | | | |
Britvic PLC (Consumer staples, Beverages) | | | | | | |
Domino’s Pizza Group PLC (Consumer discretionary, Hotels, restaurants & leisure) | | | | | | |
Elementis PLC (Materials, Chemicals)† | | | | | | |
Lancashire Holdings Ltd. (Financials, Insurance) | | | | | | |
Nomad Foods Ltd. (Consumer staples, Food products) | | | | | | |
S4 Capital PLC (Communication services, Media)† | | | | | | |
Samarkand Group PLC (Consumer discretionary, Broadline retail)† | | | | | | |
Spectris PLC (Information technology, Electronic equipment, instruments & components) | | | | | | |
| | | | | | |
| | | | | | |
Aris Water Solutions, Inc. Class A (Industrials, Commercial services & supplies) | | | | | | |
Azenta, Inc. (Health care, Life sciences tools & services)† | | | | | | |
Balchem Corp. (Materials, Chemicals) | | | | | | |
Blackbaud, Inc. (Information technology, Software)† | | | | | | |
Brady Corp. Class A (Industrials, Commercial services & supplies) | | | | | | |
Cactus, Inc. Class A (Energy, Energy equipment & services) | | | | | | |
CBIZ, Inc. (Industrials, Professional services)† | | | | | | |
CSW Industrials, Inc. (Industrials, Building products) | | | | | | |
Denny’s Corp. (Consumer discretionary, Hotels, restaurants & leisure)† | | | | | | |
The accompanying notes are an integral part of these financial statements.
10 | Allspring Special Global Small Cap Fund
Portfolio of investments—April 30, 2024 (unaudited)
| | | | | |
| | | | | | |
E2open Parent Holdings, Inc. (Information technology, Software)† | | | | | | |
Enovis Corp. (Health care, Health care equipment & supplies)† | | | | | | |
EnPro, Inc. (Industrials, Machinery) | | | | | | |
FormFactor, Inc. (Information technology, Semiconductors & semiconductor equipment)† | | | | | | |
Gibraltar Industries, Inc. (Industrials, Building products)† | | | | | | |
Global Blue Group Holding AG (Information technology, IT services)† | | | | | | |
Globus Medical, Inc. Class A (Health care, Health care equipment & supplies)† | | | | | | |
Hanover Insurance Group, Inc. (Financials, Insurance) | | | | | | |
Helen of Troy Ltd. (Consumer discretionary, Household durables)† | | | | | | |
Holley, Inc. (Consumer discretionary, Automobile components)† | | | | | | |
Horace Mann Educators Corp. (Financials, Insurance) | | | | | | |
ICU Medical, Inc. (Health care, Health care equipment & supplies)† | | | | | | |
Innospec, Inc. (Materials, Chemicals) | | | | | | |
J & J Snack Foods Corp. (Consumer staples, Food products) | | | | | | |
Mayville Engineering Co., Inc. (Industrials, Machinery)† | | | | | | |
MSA Safety, Inc. (Industrials, Commercial services & supplies) | | | | | | |
MSC Industrial Direct Co., Inc. Class A (Industrials, Trading companies & distributors) | | | | | | |
Progress Software Corp. (Information technology, Software) | | | | | | |
Quaker Chemical Corp. (Materials, Chemicals) | | | | | | |
Quanex Building Products Corp. (Industrials, Building products) | | | | | | |
Southwestern Energy Co. (Energy, Oil, gas & consumable fuels)† | | | | | | |
Spectrum Brands Holdings, Inc. (Consumer staples, Household products) | | | | | | |
Standex International Corp. (Industrials, Machinery) | | | | | | |
Stepan Co. (Materials, Chemicals) | | | | | | |
Teradata Corp. (Information technology, Software)† | | | | | | |
UFP Technologies, Inc. (Health care, Health care equipment & supplies)† | | | | | | |
UL Solutions, Inc. Class A (Industrials, Professional services)† | | | | | | |
Varex Imaging Corp. (Health care, Health care equipment & supplies)† | | | | | | |
Watts Water Technologies, Inc. Class A (Industrials, Machinery) | | | | | | |
Wendy’s Co. (Consumer discretionary, Hotels, restaurants & leisure) | | | | | | |
Ziff Davis, Inc. (Communication services, Interactive media & services)† | | | | | | |
| | | | | | |
Total common stocks (Cost $114,547,731) | | | | | | |
| | | | | |
Short-term investments: 0.89% | | | | | | |
Investment companies: 0.89% | | | | | | |
Allspring Government Money Market Fund Select Class♠∞ | | | | | | |
Total short-term investments (Cost $1,238,673) | | | | | | |
Total investments in securities (Cost $115,786,404) | | | | | | |
Other assets and liabilities, net | | | | | | |
| | | | | | |
The accompanying notes are an integral part of these financial statements.
Allspring Special Global Small Cap Fund | 11
Portfolio of investments—April 30, 2024 (unaudited)
| Non-income-earning security |
| The security may be resold in transactions exempt from registration, normally to qualified institutional buyers, pursuant to Rule 144A under the Securities Act of 1933. |
| The issuer of the security is an affiliated person of the Fund as defined in the Investment Company Act of 1940. |
| The rate represents the 7-day annualized yield at period end. |
|
| American depositary receipt |
| Real estate investment trust |
Investments in affiliates
An affiliated investment is an investment in which the Fund owns at least 5% of the outstanding voting shares of the issuer or as a result of other relationships, such as the Fund and the issuer having the same investment manager. Transactions with issuers that were affiliates of the Fund at the end of the period were as follows:
| | | | | Net
change in
unrealized
gains
(losses) | | | Income
from
affiliated
securities |
| | | | | | | | |
Allspring Government Money Market Fund Select Class | | | | | | | | |
The accompanying notes are an integral part of these financial statements.
12 | Allspring Special Global Small Cap Fund
Statement of assets and liabilities—April 30, 2024 (unaudited)
Financial statements
Statement of assets and liabilities
| |
Investments in unaffiliated securities, at value (cost $114,547,731) | |
Investments in affiliated securities, at value (cost $1,238,673) | |
| |
Foreign currency, at value (cost $24,071) | |
Receivable for investments sold | |
| |
Receivable for Fund shares sold | |
Prepaid expenses and other assets | |
| |
| |
Payable for investments purchased | |
Payable for Fund shares redeemed | |
| |
Administration fees payable | |
| |
Accrued expenses and other liabilities | |
| |
| |
| |
| |
Total distributable earnings | |
| |
Computation of net asset value and offering price per share | |
| |
Shares outstanding–Class A1 | |
Net asset value per share–Class A | |
Maximum offering price per share – Class A2 | |
| |
Shares outstanding–Class C1 | |
Net asset value per share–Class C | |
Net assets–Administrator Class | |
Shares outstanding–Administrator Class1 | |
Net asset value per share–Administrator Class | |
Net assets–Institutional Class | |
Shares outstanding–Institutional Class1 | |
Net asset value per share–Institutional Class | |
1 The Fund has an unlimited number of authorized shares.
2 Maximum offering price is computed as 100/94.25 of net asset value. On investments of $50,000 or more, the offering price is reduced.
The accompanying notes are an integral part of these financial statements.
Allspring Special Global Small Cap Fund | 13
Statement of operations—six months ended April 30, 2024 (unaudited)
Statement of operations
| |
Dividends (net of foreign withholdings taxes of $64,278) | |
Income from affiliated securities | |
| |
| |
| |
| |
| |
| |
| |
| |
| |
Shareholder servicing fees | |
| |
| |
| |
| |
| |
Custody and accounting fees | |
| |
| |
Shareholder report expenses | |
Trustees’ fees and expenses | |
| |
| |
Less: Fee waivers and/or expense reimbursements | |
| |
| |
| |
| |
| |
| |
Realized and unrealized gains (losses) on investments | |
Net realized gains (losses) on | |
| |
Foreign currency and foreign currency translations | |
Net realized gains on investments | |
Net change in unrealized gains (losses) on | |
| |
Foreign currency and foreign currency translations | |
Net change in unrealized gains (losses) on investments | |
Net realized and unrealized gains (losses) on investments | |
Net increase in net assets resulting from operations | |
The accompanying notes are an integral part of these financial statements.
14 | Allspring Special Global Small Cap Fund
Statement of changes in net assets
Statement of changes in net assets
|
Six months ended
April 30, 2024 (unaudited) | Year ended October 31, 2023 |
| | | | |
Net investment income (loss) | | | | |
Net realized gains (losses) on investments | | | | |
Net change in unrealized gains (losses) on investments | | | | |
Net increase in net assets resulting from operations | | | | |
Distributions to shareholders from | | | | |
Net investment income and net realized gains | | | | |
| | | | |
| | | | |
| | | | |
| | | | |
Total distributions to shareholders | | | | |
Capital share transactions | | | | |
Proceeds from shares sold | | | | |
| | | | |
| | | | |
| | | | |
| | | | |
| | | | |
Reinvestment of distributions | | | | |
| | | | |
| | | | |
| | | | |
| | | | |
| | | | |
Payment for shares redeemed | | | | |
| | | | |
| | | | |
| | | | |
| | | | |
| | | | |
Net decrease in net assets resulting from capital share transactions | | | | |
Total increase (decrease) in net assets | | | | |
| | | | |
| | | | |
| | | | |
The accompanying notes are an integral part of these financial statements.
Allspring Special Global Small Cap Fund | 15
Financial highlights
(For a share outstanding throughout each period)
| Six months ended
April 30, 2024
(unaudited) | |
| | | | | |
Net asset value, beginning of period | | | | | | |
Net investment income (loss) | | | | | | |
Net realized and unrealized gains (losses) on investments | | | | | | |
Total from investment operations | | | | | | |
Distributions to shareholders from | | | | | | |
| | | | | | |
| | | | | | |
Total distributions to shareholders | | | | | | |
Net asset value, end of period | | | | | | |
| | | | | | |
Ratios to average net assets (annualized) | | | | | | |
| | | | | | |
| | | | | | |
Net investment income (loss) | | | | | | |
| | | | | | |
| | | | | | |
Net assets, end of period (000s omitted) | | | | | | |
| Calculated based upon average shares outstanding |
| Total return calculations do not include any sales charges. Returns for periods of less than one year are not annualized. |
The accompanying notes are an integral part of these financial statements.
16 | Allspring Special Global Small Cap Fund
(For a share outstanding throughout each period)
| Six months ended
April 30, 2024
(unaudited) | |
| | | | | |
Net asset value, beginning of period | | | | | | |
| | | | | | |
| | | | | | |
Net realized and unrealized gains (losses) on investments | | | | | | |
Total from investment operations | | | | | | |
Distributions to shareholders from | | | | | | |
| | | | | | |
Net asset value, end of period | | | | | | |
| | | | | | |
Ratios to average net assets (annualized) | | | | | | |
| | | | | | |
| | | | | | |
| | | | | | |
| | | | | | |
| | | | | | |
Net assets, end of period (000s omitted) | | | | | | |
| Calculated based upon average shares outstanding |
| Total return calculations do not include any sales charges. Returns for periods of less than one year are not annualized. |
| During the year ended October 31, 2020, the Fund received a payment from an affiliate which had a 0.28% impact on the total return. |
The accompanying notes are an integral part of these financial statements.
Allspring Special Global Small Cap Fund | 17
(For a share outstanding throughout each period)
| Six months ended
April 30, 2024
(unaudited) | |
| | | | | |
Net asset value, beginning of period | | | | | | |
Net investment income (loss) | | | | | | |
| | | | | | |
Net realized and unrealized gains (losses) on investments | | | | | | |
Total from investment operations | | | | | | |
Distributions to shareholders from | | | | | | |
| | | | | | |
| | | | | | |
Total distributions to shareholders | | | | | | |
Net asset value, end of period | | | | | | |
| | | | | | |
Ratios to average net assets (annualized) | | | | | | |
| | | | | | |
| | | | | | |
Net investment income (loss) | | | | | | |
| | | | | | |
| | | | | | |
Net assets, end of period (000s omitted) | | | | | | |
| Calculated based upon average shares outstanding |
| Returns for periods of less than one year are not annualized. |
| During the year ended October 31, 2020, the Fund received a payment from an affiliate which had a 0.08% impact on the total return. |
The accompanying notes are an integral part of these financial statements.
18 | Allspring Special Global Small Cap Fund
(For a share outstanding throughout each period)
| Six months ended
April 30, 2024
(unaudited) | |
| | | | | |
Net asset value, beginning of period | | | | | | |
Net investment income (loss) | | | | | | |
Net realized and unrealized gains (losses) on investments | | | | | | |
Total from investment operations | | | | | | |
Distributions to shareholders from | | | | | | |
| | | | | | |
| | | | | | |
Total distributions to shareholders | | | | | | |
Net asset value, end of period | | | | | | |
| | | | | | |
Ratios to average net assets (annualized) | | | | | | |
| | | | | | |
| | | | | | |
Net investment income (loss) | | | | | | |
| | | | | | |
| | | | | | |
Net assets, end of period (000s omitted) | | | | | | |
| Calculated based upon average shares outstanding |
| Returns for periods of less than one year are not annualized. |
The accompanying notes are an integral part of these financial statements.
Allspring Special Global Small Cap Fund | 19
Notes to financial statements (unaudited)
Notes to financial statements
Allspring Funds Trust (the “Trust”), a Delaware statutory trust organized on March 10, 1999, is an open-end management investment company registered under the Investment Company Act of 1940, as amended (the “1940 Act”). As an investment company, the Trust follows the accounting and reporting guidance in Financial Accounting Standards Board (“FASB”) Accounting Standards Codification Topic 946, Financial Services – Investment Companies. These financial statements report on the Allspring Special Global Small Cap Fund (the “Fund”) which is a diversified series of the Trust.
2.
SIGNIFICANT ACCOUNTING POLICIES
The following significant accounting policies, which are consistently followed in the preparation of the financial statements of the Fund, are in conformity with U.S. generally accepted accounting principles which require management to make estimates and assumptions that affect the reported amounts of assets and liabilities, disclosure of contingent assets and liabilities at the date of the financial statements, and the reported amounts of income and expenses during the reporting period. Actual results could differ from those estimates.
All investments are valued each business day as of the close of regular trading on the New York Stock Exchange (generally 4 p.m. Eastern Time), although the Fund may deviate from this calculation time under unusual or unexpected circumstances.
Equity securities and exchange-traded funds that are listed on a foreign or domestic exchange or market are valued at the official closing price or, if none, the last sales price.
The values of securities denominated in foreign currencies are translated into U.S. dollars at rates provided by an independent foreign currency pricing source at a time each business day specified by the Valuation Committee at Allspring Funds Management, LLC (“Allspring Funds Management”).
Many securities markets and exchanges outside the U.S. close prior to the close of the New York Stock Exchange and therefore may not fully reflect trading or events that occur after the close of the principal exchange in which the foreign securities are traded, but before the close of the New York Stock Exchange. If such trading or events are expected to materially affect the value of such securities, then fair value pricing procedures implemented by Allspring Funds Management are applied. These procedures take into account multiple factors including movements in U.S. securities markets after foreign exchanges close. Foreign securities that are fair valued under these procedures are categorized as Level 2 and the application of these procedures may result in transfers between Level 1 and Level 2. Depending on market activity, such fair valuations may be frequent. Such fair value pricing may result in net asset values that are higher or lower than net asset values based on the last reported sales price or latest quoted bid price. On April 30, 2024, such fair value pricing was used in pricing certain foreign securities.
Investments in registered open-end investment companies (other than those listed on a foreign or domestic exchange or market) are valued at net asset value.
Investments which are not valued using the methods discussed above are valued at their fair value, as determined in good faith by Allspring Funds Management, which was named the valuation designee by the Board of Trustees. As the valuation designee, Allspring Funds Management is responsible for day-to-day valuation activities for the Allspring Funds. In connection with these responsibilities, Allspring Funds Management has established a Valuation Committee and has delegated to it the authority to take any actions regarding the valuation of portfolio securities that the Valuation Committee deems necessary or appropriate, including determining the fair value of portfolio securities. On a quarterly basis, the Board of Trustees receives reports of valuation actions taken by the Valuation Committee. On at least an annual basis, the Board of Trustees receives an assessment of the adequacy and effectiveness of Allspring Funds Management’s process for determining the fair value of the portfolio of investments.
Foreign currency translation
The accounting records of the Fund are maintained in U.S. dollars. The values of other assets and liabilities denominated in foreign currencies are translated into U.S. dollars at rates provided by an independent foreign currency pricing source at a time each business day specified by the Valuation Committee. Purchases and sales of securities, and income and expenses are converted at the rate of exchange on the respective dates of such transactions. Net realized foreign exchange gains or losses arise from sales of foreign currencies, currency gains or losses realized between the trade and settlement dates on securities transactions, and the difference between the amounts of dividends, interest and foreign withholding taxes recorded and the U.S. dollar equivalent of the amounts actually paid or received. Net unrealized foreign exchange gains and losses arise from changes in the fair value of assets and liabilities other than investments in securities resulting from changes in exchange rates. The changes in net assets arising from changes in exchange rates of securities and the changes in net assets resulting from changes in market prices of securities are not separately presented. Such changes are included in net realized and unrealized gains or losses from investments.
Security transactions and income recognition
Securities transactions are recorded on a trade date basis. Realized gains or losses are recorded on the basis of identified cost.
Dividend income is recognized on the ex-dividend date, except for certain dividends from foreign securities, which are recorded as soon as the custodian verifies the ex-dividend date. Dividend income is recorded net of foreign taxes withheld where recovery of such taxes is not assured.
20 | Allspring Special Global Small Cap Fund
Notes to financial statements (unaudited)
Interest earned on cash balances held at the custodian is recorded as interest income.
Distributions received from REIT investments may be characterized as ordinary income, capital gains, or a return of capital to the Fund based on information provided by the REIT. The proper characterization of REIT distributions is generally not known until after the end of each calendar year. As such, estimates may be used in reporting the character of income and distributions for financial statement purposes.
Distributions to shareholders
Distributions to shareholders from net investment income and any net realized gains are recorded on the ex-dividend date and paid at least annually. Such distributions are determined in accordance with income tax regulations and may differ from U.S. generally accepted accounting principles. Dividend sources are estimated at the time of declaration. The tax character of distributions is determined as of the Fund’s fiscal year end. Therefore, a portion of the Fund’s distributions made prior to the Fund’s fiscal year end may be categorized as a tax return of capital at year end.
The Fund intends to continue to qualify as a regulated investment company by distributing substantially all of its investment company taxable income and any net realized capital gains (after reduction for capital loss carryforwards) sufficient to relieve it from all, or substantially all, federal income taxes. Accordingly, no provision for federal income taxes was required.
The Fund’s income and federal excise tax returns and all financial records supporting those returns for the prior three fiscal years are subject to examination by the federal and Delaware revenue authorities. Management has analyzed the Fund’s tax positions taken on federal, state, and foreign tax returns, as applicable, for all open tax years and does not believe that there are any uncertain tax positions that require recognition of a tax liability.
As of April 30, 2024, the aggregate cost of all investments for federal income tax purposes was $116,853,815 and the unrealized gains (losses) consisted of:
As of October 31, 2023, the Fund had capital loss carryforwards which consisted of $155,434 in short-term capital losses and $3,214,352 in long-term capital losses.
As of October 31, 2023, the Fund had a qualified late-year ordinary loss of $16,508 which were recognized on the first day of the current fiscal year.
The separate classes of shares offered by the Fund differ principally in applicable sales charges, distribution, shareholder servicing, and administration fees. Class specific expenses are charged directly to that share class. Investment income, common fund-level expenses, and realized and unrealized gains (losses) on investments are allocated daily to each class of shares based on the relative proportion of net assets of each class.
3.
FAIR VALUATION MEASUREMENTS
Fair value measurements of investments are determined within a framework that has established a fair value hierarchy based upon the various data inputs utilized in determining the value of the Fund’s investments. The three-level hierarchy gives the highest priority to unadjusted quoted prices in active markets for identical assets or liabilities (Level 1) and the lowest priority to unobservable inputs (Level 3). The Fund’s investments are classified within the fair value hierarchy based on the lowest level of input that is significant to the fair value measurement. The inputs are summarized into three broad levels as follows:
•Level 1—quoted prices in active markets for identical securities
•Level 2—other significant observable inputs (including quoted prices for similar securities, interest rates, prepayment speeds, credit risk, etc.)
•Level 3—significant unobservable inputs (including the Fund’s own assumptions in determining the fair value of investments)
The inputs or methodologies used for valuing investments in securities are not necessarily an indication of the risk associated with investing in those securities.
Allspring Special Global Small Cap Fund | 21
Notes to financial statements (unaudited)
The following is a summary of the inputs used in valuing the Fund’s assets and liabilities as of April 30, 2024:
| | Other significant
observable inputs
(Level 2) | Significant
unobservable inputs
(Level 3) | |
| | | | |
| | | | |
| | | | |
| | | | |
| | | | |
| | | | |
| | | | |
| | | | |
| | | | |
| | | | |
| | | | |
| | | | |
| | | | |
| | | | |
| | | | |
| | | | |
| | | | |
| | | | |
| | | | |
| | | | |
| | | | |
Additional sector, industry or geographic detail, if any, is included in the Portfolio of Investments.
At April 30, 2024, the Fund did not have any transfers into/out of Level 3.
4.
TRANSACTIONS WITH AFFILIATES
Allspring Funds Management, a wholly owned subsidiary of Allspring Global Investments Holdings, LLC, a holding company indirectly owned by certain private funds of GTCR LLC and Reverence Capital Partners, L.P., is the manager of the Fund and provides advisory and fund-level administrative services under an investment management agreement. Under the investment management agreement, Allspring Funds Management is responsible for, among other services, implementing the investment objectives and strategies of the Fund, supervising the subadviser and providing fund-level administrative services in connection with the Fund’s operations. As compensation for its services under the investment management agreement, Allspring Funds Management is entitled to receive a management fee at the following annual rate based on the Fund’s average daily net assets:
For the six months ended April 30, 2024, the management fee was equivalent to an annual rate of 0.95% of the Fund’s average daily net assets.
Allspring Funds Management has retained the services of a subadviser to provide daily portfolio management to the Fund. The fee for subadvisory services is borne by Allspring Funds Management. Allspring Investments is the subadviser to the Fund and is entitled to receive a fee from Allspring Funds Management at an annual rate starting at 0.55% and declining to 0.40% as the average daily net assets of the Fund increase.
Under a class-level administration agreement, Allspring Funds Management provides class-level administrative services to the Fund, which includes paying fees and expenses for services provided by the transfer agent, sub-transfer agents, omnibus account servicers and record-keepers. As
22 | Allspring Special Global Small Cap Fund
Notes to financial statements (unaudited)
compensation for its services under the class-level administration agreement, Allspring Funds Management receives an annual fee which is calculated based on the average daily net assets of each class as follows:
| Class-level
administration fee |
| |
| |
| |
| |
Waivers and/or expense reimbursements
Allspring Funds Management has contractually committed to waive and/or reimburse management and administration fees to the extent necessary to maintain certain net operating expense ratios for the Fund. When each class of the Fund has exceeded its expense cap, Allspring Funds Management will waive fees and/or reimburse expenses from fund-level expenses on a proportionate basis and then from class specific expenses. When only certain classes exceed their expense caps, waivers and/or reimbursements are applied against class specific expenses before fund-level expenses. Allspring Funds Management has contractually committed through February 28, 2025 to waive fees and/or reimburse expenses to the extent necessary to cap the Fund’s expenses. Prior to or after the commitment expiration date, the cap may be increased or the commitment to maintain the cap may be terminated only with the approval of the Board of Trustees. As of April 30, 2024, the contractual caps are as follows:
The Trust has adopted a distribution plan for Class C shares pursuant to Rule 12b-1 under the 1940 Act. A distribution fee is charged to Class C shares and paid to Allspring Funds Distributor, LLC (“Allspring Funds Distributor”), the principal underwriter, an affiliate of Allspring Funds Management, at an annual rate up to 0.75% of the average daily net assets of Class C shares.
In addition, Allspring Funds Distributor is entitled to receive the front-end sales charge from the purchase of Class A shares and a contingent deferred sales charge on the redemption of certain Class A shares. Allspring Funds Distributor is also entitled to receive the contingent deferred sales charges from redemptions of Class C shares. For the six months ended April 30, 2024, Allspring Funds Distributor received $241 from the sale of Class A shares. No contingent deferred sales charges were incurred by Class A and Class C shares for the six months ended April 30, 2024.
Shareholder servicing fees
The Trust has entered into contracts with one or more shareholder servicing agents, whereby Class A, Class C, and Administrator Class are charged a fee at an annual rate up to 0.25% of the average daily net assets of each respective class. A portion of these total shareholder servicing fees were paid to affiliates of the Fund.
The Fund may purchase or sell portfolio investment securities to certain affiliates pursuant to Rule 17a-7 under the 1940 Act and under procedures adopted by the Board of Trustees. The procedures have been designed to ensure that these interfund transactions, which do not incur broker commissions, are effected at current market prices. Pursuant to these procedures, the Fund did not have any interfund transactions during the six months ended April 30, 2024.
5.
INVESTMENT PORTFOLIO TRANSACTIONS
Purchases and sales of investments, excluding U.S. government obligations (if any) and short-term securities, for the six months ended April 30, 2024 were $14,558,030 and $23,691,118, respectively.
The Trust (excluding the money market funds), Allspring Master Trust and Allspring Variable Trust are parties to a $350,000,000 revolving credit agreement whereby the Fund is permitted to use bank borrowings for temporary or emergency purposes, such as to fund shareholder redemption requests. Interest under the credit agreement is charged to the Fund based on a borrowing rate equal to the higher of the Federal Funds rate or the overnight bank funding rate in effect on that day plus a spread. In addition, an annual commitment fee based on the unused balance is allocated to each participating fund.
Allspring Special Global Small Cap Fund | 23
Notes to financial statements (unaudited)
For the six months ended April 30, 2024, there were no borrowings by the Fund under the agreement.
As of the end of the period, the Fund concentrated its portfolio of investments in the industrials sector and in North America and Europe. A fund that invests a substantial portion of its assets in any sector or geographic region may be more affected by changes in that sector or geographic region than would be a fund whose investments are not heavily weighted in any sector or geographic region.
Under the Fund’s organizational documents, the officers and Trustees have been granted certain indemnification rights against certain liabilities that may arise out of performance of their duties to the Fund. The Fund has entered into a separate agreement with each Trustee that converts indemnification rights currently existing under the Fund’s organizational documents into contractual rights that cannot be changed in the future without the consent of the Trustee. Additionally, in the normal course of business, the Fund may enter into contracts with service providers that contain a variety of indemnification clauses. The Fund’s maximum exposure under these arrangements is dependent on future claims that may be made against the Fund and, therefore, cannot be estimated.
24 | Allspring Special Global Small Cap Fund
Other information (unaudited)
Other information
A description of the policies and procedures used to determine how to vote proxies relating to portfolio securities is available without charge, upon request, by calling 1-866-259-3305, visiting our website at allspringglobal.com, or visiting the SEC website at sec.gov. Information regarding how the proxies related to portfolio securities were voted during the most recent 12-month period ended June 30 is available on the website at allspringglobal.com or by visiting the SEC website at sec.gov.
Quarterly portfolio holdings information
The Fund files its complete schedule of portfolio holdings with the SEC for the first and third quarters of each fiscal year as an exhibit to its reports on Form N-PORT. Shareholders may view the filed Form N-PORT by visiting the SEC website at sec.gov.
Allspring Special Global Small Cap Fund | 25
Other information (unaudited)
Board of trustees and officers
Each of the Trustees and Officers listed in the table below acts in identical capacities for each fund in the Allspring family of funds, which consists of 99 mutual funds comprising the Allspring Funds Trust, Allspring Variable Trust, Allspring Master Trust and four closed-end funds (collectively the “Fund Complex”). This table should be read in conjunction with the Prospectus and the Statement of Additional Information*. The mailing address of each Trustee and Officer is 1415 Vantage Park Drive, 3rd Floor, Charlotte, NC 28203. Each Trustee and Officer serves an indefinite term, however, each Trustee serves such term until reaching the mandatory retirement age established by the Trustees.
| Position held and
length of | Principal occupations during past five years or longer | Current other
public company or
investment
company
directorships |
William R. Ebsworth
(Born 1957) | | Retired. From 1984 to 2013, equities analyst, portfolio manager, research director and chief investment officer at Fidelity Management and Research Company in Boston, Tokyo, and Hong Kong, and retired in 2013 as Chief Investment Officer of Fidelity Strategic Advisers, Inc. where he led a team of investment professionals managing client assets. Prior thereto, Board member of Hong Kong Securities Clearing Co., Hong Kong Options Clearing Corp., the Thailand International Fund, Ltd., Fidelity Investments Life Insurance Company, and Empire Fidelity Investments Life Insurance Company. Serves on the Investment Company Institute’s Board of Governors since 2022 and Executive Committee since 2023 as well as the Vice Chairman of the Governing Council of the Independent Directors Council since 2023. Audit Committee Chair and Investment Committee Chair of the Vincent Memorial Hospital Foundation (non-profit organization). Mr. Ebsworth is a CFA charterholder. | |
Jane A. Freeman
(Born 1953) | Trustee,
since 2015;
Chair Liaison,
| Retired. From 2012 to 2014 and 1999 to 2008, Chief Financial Officer of Scientific Learning Corporation. From 2008 to 2012, Ms. Freeman provided consulting services related to strategic business projects. Prior to 1999, Portfolio Manager at Rockefeller & Co. and Scudder, Stevens & Clark. Board member of the Harding Loevner Funds from 1996 to 2014, serving as both Lead Independent Director and chair of the Audit Committee. Board member of the Russell Exchange Traded Funds Trust from 2011 to 2012 and the chair of the Audit Committee. Ms. Freeman is also an inactive Chartered Financial Analyst. | |
Isaiah Harris, Jr.
(Born 1952) | Trustee,
since 2009;
Audit Committee Chair,
since 2019 | Retired. Member of the Advisory Board of CEF of East Central Florida. Chairman of the Board of CIGNA Corporation from 2009 to 2021, and Director from 2005 to 2008. From 2003 to 2011, Director of Deluxe Corporation. Prior thereto, President and CEO of BellSouth Advertising and Publishing Corp. from 2005 to 2007, President and CEO of BellSouth Enterprises from 2004 to 2005 and President of BellSouth Consumer Services from 2000 to 2003. Emeritus member of the Iowa State University Foundation Board of Governors. Emeritus Member of the Advisory board of Iowa State University School of Business. Advisory Board Member, Palm Harbor Academy (private school). Advisory Board Member, Fellowship of Christian Athletes. Mr. Harris is a certified public accountant (inactive status). | |
David F. Larcker
(Born 1950) | | Distinguished Visiting Fellow at the Hoover Institution since 2022. James Irvin Miller Professor of Accounting at the Graduate School of Business (Emeritus), Stanford University, Director of the Corporate Governance Research Initiative and Senior Faculty of The Rock Center for Corporate Governance since 2006. From 2005 to 2008, Professor of Accounting at the Graduate School of Business, Stanford University. Prior thereto, Ernst & Young Professor of Accounting at The Wharton School, University of Pennsylvania from 1985 to 2005. | |
Olivia S. Mitchell
(Born 1953) | | International Foundation of Employee Benefit Plans Professor since 1993, Wharton School of the University of Pennsylvania. Director of Wharton’s Pension Research Council and Boettner Center on Pensions & Retirement Research, and Research Associate at the National Bureau of Economic Research. Previously taught at Cornell University from 1978 to 1993. | |
Timothy J. Penny
(Born 1951) | Trustee,
since 1996;
Chair,
since 2018 | President and Chief Executive Officer of Southern Minnesota Initiative Foundation, a non-profit organization, since 2007. Vice Chair of the Economic Club of Minnesota, since 2007. Co-Chair of the Committee for a Responsible Federal Budget, since 1995. Member of the Board of Trustees of NorthStar Education Finance, Inc., a non-profit organization, from 2007-2022. Senior Fellow of the University of Minnesota Humphrey Institute from 1995 to 2017. | |
** Length of service dates reflect the Trustee’s commencement of service with the Trust’s predecessor entities, where applicable.
*** Ms. Freeman will serve as Chair Liaison through June 2024, at which time Ms. Wheelock will assume the role.
*
The Statement of Additional Information includes additional information about the Trustees and is available, without charge, upon request, by calling 1-800-222-8222 or by visiting the website at allspringglobal.com.
26 | Allspring Special Global Small Cap Fund
Other information (unaudited)
| Position held and length of service** | Principal occupations during past five years or longer | Current other public company or investment company directorships |
James G. Polisson
(Born 1959) | Trustee,
since 2018;
Nominating and Governance Committee Chair,
since 2024 | Retired. Chief Marketing Officer, Source (ETF) UK Services, Ltd, from 2015 to 2017. From 2012 to 2015, Principal of The Polisson Group, LLC, a management consulting, corporate advisory and principal investing company. Chief Executive Officer and Managing Director at Russell Investments, Global Exchange Traded Funds from 2010 to 2012. Managing Director of Barclays Global Investors from 1998 to 2010 and Global Chief Marketing Officer for iShares and Barclays Global Investors from 2000 to 2010. Trustee of the San Francisco Mechanics’ Institute, a non- profit organization, from 2013 to 2015. Board member of the Russell Exchange Traded Fund Trust from 2011 to 2012. Director of Barclays Global Investors Holdings Deutschland GmbH from 2006 to 2009. Mr. Polisson is an attorney and has a retired status with the Massachusetts and District of Columbia Bar Associations. | |
Pamela Wheelock
(Born 1959) | Trustee,
since January 2020;
previously Trustee from
January 2018 to
| Retired. Executive and Senior Financial leadership positions in the public, private and nonprofit sectors. Interim President and CEO, McKnight Foundation, 2020. Interim Commissioner, Minnesota Department of Human Services, 2019. Chief Operating Officer, Twin Cities Habitat for Humanity, 2017-2019. Vice President for University Services, University of Minnesota, 2012- 2016. Interim President and CEO, Blue Cross and Blue Shield of Minnesota, 2011-2012. Executive Vice-President and Chief Financial Officer, Minnesota Wild, 2002-2008. Commissioner, Minnesota Department of Finance, 1999-2002. Chair of the Board of Directors of Destination Medical Center Corporation. Board member of the Minnesota Wild Foundation. | |
** Length of service dates reflect the Trustee’s commencement of service with the Trust’s predecessor entities, where applicable.
*** Ms. Freeman will serve as Chair Liaison through June 2024, at which time Ms. Wheelock will assume the role.
Allspring Special Global Small Cap Fund | 27
Other information (unaudited)
Officers1
| Position held and
length of service | Principal occupations during past five years or longer |
| | President and Chief Executive Officer of Allspring Funds Management, LLC since 2017 and Head of Global Fund Governance of Allspring Global Investments since 2022. Prior thereto, co-president of Galliard Capital Management, LLC, an affiliate of Allspring Funds Management, LLC, from 2019 to 2022 and Head of Affiliated Managers, Allspring Global Investments, from 2014 to 2019 and Executive Vice President responsible for marketing, investments and product development for Allspring Funds Management, LLC, from 2009 to 2014. |
Jeremy DePalma
(Born 1974) | Treasurer,
since 2012
(for certain funds in
the Fund Complex);
since 2021 (for
the remaining funds in the Complex) | Senior Vice President of Allspring Funds Management, LLC since 2009. Senior Vice President of Evergreen Investment Management Company, LLC from 2008 to 2010 and head of the Fund Reporting and Control Team within Fund Administration from 2005 to 2010. |
Christopher Baker
(Born 1976) | Chief Compliance Officer,
since 2022 | Global Chief Compliance Officer for Allspring Global Investments since 2022. Prior thereto, Chief Compliance Officer for State Street Global Advisors from 2018 to 2021. Senior Compliance Officer for the State Street divisions of Alternative Investment Solutions, Sector Solutions, and Global Marketing from 2015 to 2018. From 2010 to 2015 Vice President, Global Head of Investment and Marketing Compliance for State Street Global Advisors. |
Matthew Prasse
(Born 1983) | Chief Legal Officer,
since 2022;
Secretary,
since 2021 | Senior Counsel of the Allspring Legal Department since 2021. Senior Counsel of the Wells Fargo Legal Department from 2018 to 2021. Previously, Counsel for Barings LLC from 2015 to 2018. Prior to joining Barings, Associate at Morgan, Lewis & Bockius LLP from 2008 to 2015. |
1 For those Officers with tenures at Allspring Global Investments and/or Allspring Funds Management, LLC that began prior to 2021, such tenures include years of service during which these businesses/entities were known as Wells Fargo Asset Management and Wells Fargo Funds Management, LLC, respectively.
28 | Allspring Special Global Small Cap Fund
For more information
More information about Allspring Funds is available free upon request. To obtain literature, please write, visit the Fund’s website, or call:
Allspring Funds
P.O. Box 219967
Kansas City, MO 64121-9967
Website: allspringglobal.com
Individual investors: 1-800-222-8222
Retail investment professionals: 1-888-877-9275
Institutional investment professionals: 1-800-260-5969
This report and the financial statements contained herein are submitted for the general information of the shareholders of the Fund. If this report is used for promotional purposes, distribution of the report must be accompanied or preceded by a current prospectus. Before investing, please consider the investment objectives, risks, charges, and expenses of the investment. For a current prospectus and, if available, a summary prospectus, containing this information, call 1-800-222-8222 or visit the Fund’s website at allspringglobal.com. Read the prospectus carefully before you invest or send money.
Allspring Global InvestmentsTM is the trade name for the asset management firms of Allspring Global Investments Holdings, LLC, a holding company indirectly owned by certain private funds of GTCR LLC and Reverence Capital Partners, L.P. These firms include but are not limited to Allspring Global Investments, LLC, and Allspring Funds Management, LLC. Certain products managed by Allspring entities are distributed by Allspring Funds Distributor, LLC (a broker-dealer and Member FINRA/SIPC).
This material is for general informational and educational purposes only and is NOT intended to provide investment advice or a recommendation of any kind - including a recommendation for any specific investment, strategy, or plan.
© 2024 Allspring Global Investments Holdings, LLC. All rights reserved.
ALL-05022024-gy9z2ghk 06-24
SAR4305 04-24
Allspring Special International Small Cap Fund
The views expressed and any forward-looking statements are as of April 30, 2024, unless otherwise noted, and are those of the portfolio managers and/or Allspring Global Investments. Discussions of individual securities or the markets generally are not intended as individual recommendations. Future events or results may vary significantly from those expressed in any forward-looking statements. The views expressed are subject to change at any time in response to changing circumstances in the market. Allspring Global Investments disclaims any obligation to publicly update or revise any views expressed or forward-looking statements.
Allspring Special International Small Cap Fund | 1
Letter to shareholders (unaudited)
Dear Shareholder:
We are pleased to offer you this semi-annual report for the Allspring Special International Small Cap Fund for the six-month period that ended April 30, 2024. Globally, stocks and bonds had strongly positive returns for the period. However, markets were volatile as investors focused on persistently high inflation and the impact of aggressive central bank rate hikes. Riskier assets rallied as investors anticipated an end to the tight monetary policy.
For the period, U.S. stocks, based on the S&P 500 Index,1 returned 20.98%. International stocks, as measured by the MSCI ACWI ex USA Index (Net),2 gained 17.69% while the MSCI EM Index (Net) (USD),3 returned 15.40%. Among bond indexes, the Bloomberg U.S. Aggregate Bond Index4 advanced 4.97%, the Bloomberg Global Aggregate ex-USD Index (unhedged)5 gained 3.92%, the Bloomberg Municipal Bond Index6 returned 7.06%, and the ICE BofA U.S. High Yield Index7 gained 8.94%.
Investors remained focused on central bank monetary policies.
As the six-month period began in November, the market mood brightened as cooling inflation inspired confidence that central banks could hold off on further rate hikes. Overall annual inflation in the U.S. fell to 3.1% in November while 12-month inflation in the U.K. and the eurozone eased to 4.6% and 2.4%, respectively—far below their peak levels of mid-2022. Third quarter annualized U.S. GDP growth was raised to an estimated 5.2% while U.S. job totals rose by close to 200,000 in November, indicating a slight cooling of the labor market. All of this fresh evidence added to confidence for a U.S. soft economic landing, leading to a more buoyant mood heading into winter.
The broad year-end rally among stocks and bonds that began in November continued through December as investors became more confident that monetary policy would ease in 2024. Supporting the bubbly market mood were a series of reports confirming lower inflationary trends in the U.S. and Europe. During the period, it appeared more likely that the U.S. economy could achieve a soft landing, cooling enough to lower inflation without the pain of a recession. However, by year-end, an expectations gap developed. Capital markets priced in a total of 1.50 percentage points in federal funds rate cuts in 2024—twice as much as the three cuts of 0.25% hinted at by Fed officials.
1
The S&P 500 Index consists of 500 stocks chosen for market size, liquidity, and industry group representation. It is a market-value-weighted index with each stock’s weight in the index proportionate to its market value. You cannot invest directly in an index.
2
The Morgan Stanley Capital International (MSCI) All Country World Index (ACWI) ex USA Index (Net) is a free-float-adjusted market-capitalization-weighted index that is designed to measure the equity market performance of developed and emerging markets, excluding the U.S. Source: MSCI. MSCI makes no express or implied warranties or representations and shall have no liability whatsoever with respect to any MSCI data contained herein. The MSCI data may not be further redistributed or used as a basis for other indexes or any securities or financial products. This report is not approved, reviewed, or produced by MSCI. You cannot invest directly in an index.
3
The MSCI Emerging Markets (EM) Index (Net) (USD) is a free-float-adjusted market-capitalization-weighted index that is designed to measure the equity market performance of emerging markets. You cannot invest directly in an index.
4
The Bloomberg U.S. Aggregate Bond Index is a broad-based benchmark that measures the investment-grade, U.S.-dollar-denominated, fixed-rate taxable bond market, including Treasuries, government-related and corporate securities, mortgage-backed securities (agency fixed-rate and hybrid adjustable-rate mortgage pass-throughs), asset-backed securities, and commercial mortgage-backed securities. You cannot invest directly in an index.
5
The Bloomberg Global Aggregate ex-USD Index (unhedged) is an unmanaged index that provides a broad-based measure of the global investment-grade fixed-income markets excluding the U.S.-dollar-denominated debt market. You cannot invest directly in an index.
6
The Bloomberg Municipal Bond Index is an unmanaged index composed of long-term tax-exempt bonds with a minimum credit rating of Baa. You cannot invest directly in an index.
7
The ICE BofA U.S. High Yield Index is a market-capitalization-weighted index of domestic and Yankee high yield bonds. The index tracks the performance of high yield securities traded in the U.S. bond market. Returns shown are net of transaction costs beginning on July 1, 2022. You cannot invest directly in an index. Copyright 2024. ICE Data Indices, LLC. All rights reserved.
2 | Allspring Special International Small Cap Fund
Letter to shareholders (unaudited)
Financial market performance was mixed in January 2024 as U.S. stocks had modest gains while non-U.S. equities, particularly those in emerging markets, and fixed income assets were held back by central bank pushback on market optimism over rate cuts. Overall, optimism was supported by hints of a soft landing for the U.S. economy. Key data included a surprisingly strong gain of 353,000 jobs in January, an unemployment rate of just 3.7%, and a rise of just 3.1% in the annual Consumer Price Index1 (CPI) in January. However, that resilience helped tone down expectations of a rate cut in March to a more likely second quarter initial move.
In February, stocks were supported by positive economic data and strong corporate earnings. However, fixed income investments were under pressure as resilient inflation curbed expectations on the timing of interest rate cuts. The S&P 500 Index had solid monthly gains along with emerging market equities, which benefited from a rebound in China.
The first quarter of 2024 closed with ongoing stock market momentum and a more muted sense of confidence in fixed income markets as investors adjusted to the prospect of greater-than-expected economic strength. On the flip side, expectations on the timing of an initial Fed rate cut were pushed back from March to June and then beyond. Additionally, the number of quarter-point rate cuts forecast by the market fell from six as projected in December 2023 to two to three cuts by fiscal period-end.
Markets retreated broadly in April as U.S. annual inflation continued to resist monetary policy efforts and expectations for its downward trajectory, with an April CPI reading of 3.4%. The timing of a Fed initial rate cut came into greater question in April. Not only was there less confidence regarding when a first cut would take place but also whether any rate reductions would occur at all in 2024. Market expectations continued to recede to a possible September Fed first cut. Meanwhile, eurozone annual inflation held steady in April at 2.4%. Developed market stocks and fixed income securities of all types were in the red for April.
Don’t let short-term uncertainty derail long-term investment goals.
Periods of investment uncertainty can present challenges, but experience has taught us that maintaining long-term investment goals can be an effective way to plan for the future. To help you create a sound strategy based on your personal goals and risk tolerance, Allspring Funds offers a wide variety of mutual funds spanning many asset classes and investment styles. Although diversification cannot guarantee an investment profit or prevent losses, we believe it can be an effective way to manage investment risk and potentially smooth out overall portfolio performance. We encourage investors to know their investments and to understand that appropriate levels of risk-taking may unlock opportunities.
Thank you for choosing to invest with Allspring Funds. We appreciate your confidence in us and remain committed to helping you meet your financial needs.
Andrew Owen
President
Allspring Funds
“ The first quarter of 2024 closed with ongoing stock market momentum and a more muted sense of confidence in fixed income markets as investors adjusted to the prospect of greater-than-expected economic strength. ”
For further information about your fund, contact your investment professional, visit our website at allspringglobal.com, or call us directly at 1-800-222-8222.
1
The Consumer Price Index (CPI) is a measure of the average change over time in the prices paid by urban consumers for a market basket of consumer goods and services. You cannot invest directly in an index.
Allspring Special International Small Cap Fund | 3
Letter to shareholders (unaudited)
|
Beginning in July 2024, the Fund will be required by the Securities and Exchange Commission to send shareholders a paper copy of a new tailored shareholder report in place of the full shareholder report that you are now receiving. The tailored shareholder report will contain concise information about the Fund, including certain expense and performance information and fund statistics. If you wish to receive this new tailored shareholder report electronically, please follow the instructions on the back cover of this report. |
Other information that is currently included in the shareholder report, such as the Fund’s financial statements, will be available online and upon request, free of charge, in paper or electronic format. |
4 | Allspring Special International Small Cap Fund
This page is intentionally left blank.
Performance highlights (unaudited)
Performance highlights
| The Fund seeks long-term capital appreciation. |
| Allspring Funds Management, LLC |
| Allspring Global Investments, LLC |
| Stephen Giggie, CFA, Oleg Makhorine, James Tringas, CFA, Bryant VanCronkhite, CFA, CPA |
Average annual total returns (%) as of April 30, 2024 |
| | | | |
| | | | | | | |
| | | | | | | |
| | | | | | | |
| | | | | | | |
Institutional Class (WICIX) | | | | | | | |
MSCI ACWI ex USA Index (Net)5 | | | | | | | |
MSCI World ex USA Small Cap Index (Net)6 | | | | | | | |
Figures quoted represent past performance, which is no guarantee of future results, and do not reflect taxes that a shareholder may pay on an investment in a fund. Investment return and principal value of an investment will fluctuate so that an investor’s shares, when redeemed, may be worth more or less than their original cost. Performance shown without sales charges would be lower if sales charges were reflected. Current performance may be lower or higher than the performance data quoted, which assumes the reinvestment of dividends and capital gains. Current month-end performance is available on the Fund’s website, allspringglobal.com.
Index returns do not include transaction costs associated with buying and selling securities, any mutual fund fees or expenses, or any taxes. It is not possible to invest directly in an index.
For Class A shares, the maximum front-end sales charge is 5.75%. For Class C shares, the maximum contingent deferred sales charge is 1.00%. Performance including a contingent deferred sales charge assumes the sales charge for the corresponding time period. Class R6 and Institutional Class shares are sold without a front-end sales charge or contingent deferred sales charge.
|
| Based on the inception date of the oldest Fund class. |
| Reflects the expense ratios as stated in the most recent prospectuses, which include the impact of 0.01% in acquired fund fees and expenses. The expense ratios shown are subject to change and may differ from the annualized expense ratios shown in the Financial Highlights of this report, which do not include acquired fund fees and expenses. |
| The manager has contractually committed through February 28, 2025, to waive fees and/or reimburse expenses to the extent necessary to cap total annual fund operating expenses after fee waivers at 1.37% for Class A, 2.12% for Class C, 0.95% for Class R6 and 1.05% for Institutional Class. Brokerage commissions, stamp duty fees, interest, taxes, acquired fund fees and expenses (if any), and extraordinary expenses are excluded from the expense caps. Prior to or after the commitment expiration date, the caps may be increased or the commitment to maintain the caps may be terminated only with the approval of the Board of Trustees. Without these caps, the Fund’s returns would have been lower. The expense ratio paid by an investor is the net expense ratio (the total annual fund operating expenses after fee waivers) as stated in the prospectuses. |
| Historical performance shown for the Class A shares prior to their inception reflects the performance of the Institutional Class shares and includes the higher expenses applicable to the Class A shares. |
| Historical performance shown for the Class C shares prior to their inception reflects the performance of the Institutional Class shares and includes the higher expenses applicable to the Class C shares. |
| The Morgan Stanley Capital International (MSCI) All Country World Index (ACWI) ex USA Index (Net) is a free-float-adjusted market-capitalization-weighted index that is designed to measure the equity market performance of developed and emerging markets, excluding the U.S. Source: MSCI. MSCI makes no express or implied warranties or representations and shall have no liability whatsoever with respect to any MSCI data contained herein. The MSCI data may not be further redistributed or used as a basis for other indexes or any securities or financial products. This report is not approved, reviewed, or produced by MSCI. You cannot invest directly in an index. |
| The MSCI World ex USA Small Cap Index (Net) is a free-float-adjusted market-capitalization-weighted index that is designed tomeasure the equity market performance of developed markets excluding the U.S. You cannot invest directly in an index. |
Investing involves risk, including the possible loss of principal. Stock values fluctuate in response to the activities of individual companies and general market and economic conditions. Smaller company stocks tend to be more volatile and less liquid than those of larger companies. Foreign investments are especially volatile and can rise or fall dramatically due to differences in the political and economic conditions of the host country. Consult the Fund’s prospectus for additional information on these and other risks.
CFA® and Chartered Financial Analyst® are trademarks owned by CFA Institute. |
6 | Allspring Special International Small Cap Fund
Performance highlights (unaudited)
Ten largest holdings (%) as of April 30, 20241 |
| |
| |
| |
MEITEC Group Holdings, Inc. | |
| |
| |
| |
| |
| |
| |
| Figures represent the percentage of the Fund’s net assets. Holdings are subject to change and may have changed since the date specified. |
Sector allocation as of April 30, 20241 |
| Figures represent the percentage of the Fund’s long-term investments. Allocations are subject to change and may have changed since the date specified. |
Geographic allocation as of April 30, 20241 |
| Figures represent the percentage of the Fund’s long-term investments. Allocations are subject to change and may have changed since the date specified. |
Allspring Special International Small Cap Fund | 7
Fund expenses (unaudited)
Fund expenses
As a shareholder of the Fund, you incur two types of costs: (1) transaction costs, including sales charges (loads) on purchase payments and contingent deferred sales charges (if any) on redemptions and (2) ongoing costs, including management fees, distribution (12b-1) and/or shareholder servicing fees, and other Fund expenses. This example is intended to help you understand your ongoing costs (in dollars) of investing in the Fund and to compare these costs with the ongoing costs of investing in other mutual funds.
The example is based on an investment of $1,000 invested at the beginning of the six-month period and held for the entire period from November 1, 2023 to April 30, 2024.
The “Actual” line of the table below provides information about actual account values and actual expenses. You may use the information in this line, together with the amount you invested, to estimate the expenses that you paid over the period. Simply divide your account value by $1,000 (for example, an $8,600 account value divided by $1,000= 8.6), then multiply the result by the number in the “Actual” line under the heading entitled “Expenses paid during period” for your applicable class of shares to estimate the expenses you paid on your account during this period.
Hypothetical example for comparison purposes
The “Hypothetical” line of the table below provides information about hypothetical account values and hypothetical expenses based on the Fund’s actual expense ratio and an assumed rate of return of 5% per year before expenses, which is not the Fund’s actual return. The hypothetical account values and expenses may not be used to estimate the actual ending account balance or expenses you paid for the period. You may use this information to compare the ongoing costs of investing in the Fund and other funds. To do so, compare this 5% hypothetical example with the 5% hypothetical examples that appear in the shareholder reports of the other funds.
Please note that the expenses shown in the table are meant to highlight your ongoing costs only and do not reflect any transactional costs, such as sales charges (loads) and contingent deferred sales charges. Therefore, the “Hypothetical” line of the table is useful in comparing ongoing costs only, and will not help you determine the relative total costs of owning different funds. In addition, if these transactional costs were included, your costs would have been higher.
| Beginning
account value
11-1-2023 | Ending
account value
4-30-2024 | | Annualized net
expense ratio |
| | | | |
| | | | |
Hypothetical (5% return before expenses) | | | | |
| | | | |
| | | | |
Hypothetical (5% return before expenses) | | | | |
| | | | |
| | | | |
Hypothetical (5% return before expenses) | | | | |
| | | | |
| | | | |
Hypothetical (5% return before expenses) | | | | |
| Expenses paid is equal to the annualized net expense ratio of each class multiplied by the average account value over the period, multiplied by 182 divided by 366 (to reflect the one-half-year period). |
8 | Allspring Special International Small Cap Fund
Portfolio of investments—April 30, 2024 (unaudited)
| | | | | |
| | | | | | |
| | | | | | |
Ansell Ltd. (Health care, Health care equipment & supplies) | | | | | | |
Bapcor Ltd. (Consumer discretionary, Distributors) | | | | | | |
Domino’s Pizza Enterprises Ltd. (Consumer discretionary, Hotels, restaurants & leisure) | | | | | | |
Orora Ltd. (Materials, Containers & packaging) | | | | | | |
Steadfast Group Ltd. (Financials, Insurance) | | | | | | |
| | | | | | |
| | | | | | |
Mayr Melnhof Karton AG (Materials, Containers & packaging) | | | | | | |
| | | | | | |
Azelis Group NV (Industrials, Trading companies & distributors) | | | | | | |
Barco NV (Information technology, Electronic equipment, instruments & components) | | | | | | |
| | | | | | |
| | | | | | |
ATS Corp. (Industrials, Machinery)† | | | | | | |
Canadian Western Bank (Financials, Banks) | | | | | | |
Enerplus Corp. (Energy, Oil, gas & consumable fuels) | | | | | | |
Finning International, Inc. (Industrials, Trading companies & distributors) | | | | | | |
Gildan Activewear, Inc. (Consumer discretionary, Textiles, apparel & luxury goods) | | | | | | |
PrairieSky Royalty Ltd. (Energy, Oil, gas & consumable fuels) | | | | | | |
Primo Water Corp. (Consumer staples, Beverages) | | | | | | |
| | | | | | |
| | | | | | |
Alten SA (Information technology, IT services) | | | | | | |
Metropole Television SA (Communication services, Media) | | | | | | |
| | | | | | |
| | | | | | |
Cancom SE (Information technology, IT services) | | | | | | |
CTS Eventim AG & Co. KGaA (Communication services, Entertainment) | | | | | | |
Gerresheimer AG (Health care, Life sciences tools & services) | | | | | | |
Krones AG (Industrials, Machinery) | | | | | | |
TAG Immobilien AG (Real estate, Real estate management & development)† | | | | | | |
| | | | | | |
| | | | | | |
Irish Residential Properties REIT PLC (Real estate, Residential REITs) | | | | | | |
| | | | | | |
Azimut Holding SpA (Financials, Capital markets) | | | | | | |
Buzzi SpA (Materials, Construction materials) | | | | | | |
De’ Longhi SpA (Consumer discretionary, Household durables) | | | | | | |
The accompanying notes are an integral part of these financial statements.
Allspring Special International Small Cap Fund | 9
Portfolio of investments—April 30, 2024 (unaudited)
| | | | | |
| | | | | | |
GVS SpA (Industrials, Machinery)144A† | | | | | | |
Interpump Group SpA (Industrials, Machinery) | | | | | | |
| | | | | | |
| | | | | | |
Aeon Delight Co. Ltd. (Industrials, Commercial services & supplies) | | | | | | |
Daiseki Co. Ltd. (Industrials, Commercial services & supplies) | | | | | | |
DTS Corp. (Information technology, IT services) | | | | | | |
Ezaki Glico Co. Ltd. (Consumer staples, Food products) | | | | | | |
Fuji Seal International, Inc. (Materials, Containers & packaging) | | | | | | |
Horiba Ltd. (Information technology, Electronic equipment, instruments & components) | | | | | | |
Hoshizaki Corp. (Industrials, Machinery) | | | | | | |
Kamigumi Co. Ltd. (Industrials, Transportation infrastructure) | | | | | | |
MEITEC Group Holdings, Inc. (Industrials, Professional services) | | | | | | |
MISUMI Group, Inc. (Industrials, Machinery) | | | | | | |
Nihon Parkerizing Co. Ltd. (Materials, Chemicals) | | | | | | |
Orix JREIT, Inc. (Real estate, Office REITs) | | | | | | |
PHC Holdings Corp. (Health care, Health care equipment & supplies) | | | | | | |
San-A Co. Ltd. (Consumer staples, Consumer staples distribution & retail) | | | | | | |
Shimamura Co. Ltd. (Consumer discretionary, Specialty retail) | | | | | | |
Sohgo Security Services Co. Ltd. (Industrials, Commercial services & supplies) | | | | | | |
Stanley Electric Co. Ltd. (Consumer discretionary, Automobile components) | | | | | | |
Sumitomo Warehouse Co. Ltd. (Industrials, Transportation infrastructure) | | | | | | |
Taikisha Ltd. (Industrials, Construction & engineering) | | | | | | |
| | | | | | |
| | | | | | |
Novem Group SA (Consumer discretionary, Automobile components) | | | | | | |
| | | | | | |
Aalberts NV (Industrials, Machinery) | | | | | | |
MYT Netherlands Parent BV ADR (Consumer discretionary, Specialty retail)† | | | | | | |
TKH Group NV (Industrials, Electrical equipment)† | | | | | | |
| | | | | | |
| | | | | | |
Atea ASA (Information technology, IT services) | | | | | | |
Elopak ASA (Materials, Containers & packaging) | | | | | | |
SpareBank 1 SMN (Financials, Banks) | | | | | | |
| | | | | | |
| | | | | | |
Vidrala SA (Materials, Containers & packaging) | | | | | | |
Viscofan SA (Consumer staples, Food products) | | | | | | |
| | | | | | |
The accompanying notes are an integral part of these financial statements.
10 | Allspring Special International Small Cap Fund
Portfolio of investments—April 30, 2024 (unaudited)
| | | | | |
| | | | | | |
Hexpol AB (Materials, Chemicals) | | | | | | |
Loomis AB (Industrials, Commercial services & supplies) | | | | | | |
| | | | | | |
| | | | | | |
Bossard Holding AG Class A (Industrials, Trading companies & distributors) | | | | | | |
Bucher Industries AG (Industrials, Machinery) | | | | | | |
Montana Aerospace AG (Industrials, Aerospace & defense)144A† | | | | | | |
| | | | | | |
| | | | | | |
Britvic PLC (Consumer staples, Beverages) | | | | | | |
Domino’s Pizza Group PLC (Consumer discretionary, Hotels, restaurants & leisure) | | | | | | |
Elementis PLC (Materials, Chemicals)† | | | | | | |
IMI PLC (Industrials, Machinery) | | | | | | |
Lancashire Holdings Ltd. (Financials, Insurance) | | | | | | |
Morgan Advanced Materials PLC (Industrials, Machinery) | | | | | | |
Nomad Foods Ltd. (Consumer staples, Food products) | | | | | | |
S4 Capital PLC (Communication services, Media)† | | | | | | |
Spectris PLC (Information technology, Electronic equipment, instruments & components) | | | | | | |
SSP Group PLC (Consumer discretionary, Hotels, restaurants & leisure) | | | | | | |
Tate & Lyle PLC (Consumer staples, Food products) | | | | | | |
| | | | | | |
Total common stocks (Cost $171,932,050) | | | | | | |
| | | | | |
Short-term investments: 4.59% | | | | | | |
Investment companies: 4.59% | | | | | | |
Allspring Government Money Market Fund Select Class♠∞ | | | | | | |
Total short-term investments (Cost $8,860,897) | | | | | | |
Total investments in securities (Cost $180,792,947) | | | | | | |
Other assets and liabilities, net | | | | | | |
| | | | | | |
| Non-income-earning security |
| The security may be resold in transactions exempt from registration, normally to qualified institutional buyers, pursuant to Rule 144A under the Securities Act of 1933. |
| The issuer of the security is an affiliated person of the Fund as defined in the Investment Company Act of 1940. |
| The rate represents the 7-day annualized yield at period end. |
|
| American depositary receipt |
| Real estate investment trust |
The accompanying notes are an integral part of these financial statements.
Allspring Special International Small Cap Fund | 11
Portfolio of investments—April 30, 2024 (unaudited)
Investments in affiliates
An affiliated investment is an investment in which the Fund owns at least 5% of the outstanding voting shares of the issuer or as a result of other relationships, such as the Fund and the issuer having the same investment manager. Transactions with issuers that were affiliates of the Fund at the end of the period were as follows:
| | | | | Net
change in
unrealized
gains
(losses) | | | Income
from
affiliated
securities |
| | | | | | | | |
Allspring Government Money Market Fund Select Class | | | | | | | | |
The accompanying notes are an integral part of these financial statements.
12 | Allspring Special International Small Cap Fund
Statement of assets and liabilities—April 30, 2024 (unaudited)
Financial statements
Statement of assets and liabilities
| |
Investments in unaffiliated securities, at value (cost $171,932,050) | |
Investments in affiliated securities, at value (cost $8,860,897) | |
Foreign currency, at value (cost $51,519) | |
| |
Receivable for investments sold | |
Receivable for Fund shares sold | |
Prepaid expenses and other assets | |
| |
| |
Payable for investments purchased | |
| |
Custody and accounting fees payable | |
Payable for Fund shares redeemed | |
Administration fees payable | |
Accrued expenses and other liabilities | |
| |
| |
| |
| |
| |
| |
Computation of net asset value and offering price per share | |
| |
Shares outstanding–Class A1 | |
Net asset value per share–Class A | |
Maximum offering price per share – Class A2 | |
| |
Shares outstanding–Class C1 | |
Net asset value per share–Class C | |
| |
Shares outstanding–Class R61 | |
Net asset value per share–Class R6 | |
Net assets–Institutional Class | |
Shares outstanding–Institutional Class1 | |
Net asset value per share–Institutional Class | |
1 The Fund has an unlimited number of authorized shares.
2 Maximum offering price is computed as 100/94.25 of net asset value. On investments of $50,000 or more, the offering price is reduced.
The accompanying notes are an integral part of these financial statements.
Allspring Special International Small Cap Fund | 13
Statement of operations—six months ended April 30, 2024 (unaudited)
Statement of operations
| |
Dividends (net of foreign withholdings taxes of $253,339) | |
Income from affiliated securities | |
| |
| |
| |
| |
| |
| |
| |
| |
Shareholder servicing fees | |
| |
| |
Custody and accounting fees | |
| |
| |
Shareholder report expenses | |
Trustees’ fees and expenses | |
| |
| |
Less: Fee waivers and/or expense reimbursements | |
| |
| |
| |
| |
| |
Realized and unrealized gains (losses) on investments | |
Net realized gains (losses) on | |
| |
Foreign currency and foreign currency translations | |
Forward foreign currency contracts | |
Net realized losses on investments | |
Net change in unrealized gains (losses) on | |
| |
Foreign currency and foreign currency translations | |
Net change in unrealized gains (losses) on investments | |
Net realized and unrealized gains (losses) on investments | |
Net increase in net assets resulting from operations | |
The accompanying notes are an integral part of these financial statements.
14 | Allspring Special International Small Cap Fund
Statement of changes in net assets
Statement of changes in net assets
|
Six months ended
April 30, 2024 (unaudited) | Year ended October 31, 2023 |
| | | | |
| | | | |
Net realized losses on investments | | | | |
Net change in unrealized gains (losses) on investments | | | | |
Net increase in net assets resulting from operations | | | | |
Distributions to shareholders from | | | | |
Net investment income and net realized gains | | | | |
| | | | |
| | | | |
| | | | |
| | | | |
Total distributions to shareholders | | | | |
Capital share transactions | | | | |
Proceeds from shares sold | | | | |
| | | | |
| | | | |
| | | | |
| | | | |
Reinvestment of distributions | | | | |
| | | | |
| | | | |
| | | | |
| | | | |
| | | | |
Payment for shares redeemed | | | | |
| | | | |
| | | | |
| | | | |
| | | | |
Net increase (decrease) in net assets resulting from capital share transactions | | | | |
Total increase in net assets | | | | |
| | | | |
| | | | |
| | | | |
The accompanying notes are an integral part of these financial statements.
Allspring Special International Small Cap Fund | 15
Financial highlights
(For a share outstanding throughout each period)
| Six months ended
April 30, 2024
(unaudited) | |
| | |
Net asset value, beginning of period | | | |
| | | |
Net realized and unrealized gains (losses) on investments | | | |
Total from investment operations | | | |
Distributions to shareholders from | | | |
| | | |
Net asset value, end of period | | | |
| | | |
Ratios to average net assets (annualized) | | | |
| | | |
| | | |
| | | |
| | | |
| | | |
Net assets, end of period (000s omitted) | | | |
| For the period from June 1, 2022 (commencement of class operations) to October 31, 2022 |
| Calculated based upon average shares outstanding |
| Total return calculations do not include any sales charges. Returns for periods of less than one year are not annualized. |
The accompanying notes are an integral part of these financial statements.
16 | Allspring Special International Small Cap Fund
(For a share outstanding throughout each period)
| Six months ended
April 30, 2024
(unaudited) | |
| | |
Net asset value, beginning of period | | | |
| | | |
Net realized and unrealized gains (losses) on investments | | | |
Total from investment operations | | | |
Distributions to shareholders from | | | |
| | | |
Net asset value, end of period | | | |
| | | |
Ratios to average net assets (annualized) | | | |
| | | |
| | | |
| | | |
| | | |
| | | |
Net assets, end of period (000s omitted) | | | |
| For the period from June 1, 2022 (commencement of class operations) to October 31, 2022 |
| Calculated based upon average shares outstanding |
| Amount is less than $0.005. |
| Total return calculations do not include any sales charges. Returns for periods of less than one year are not annualized. |
The accompanying notes are an integral part of these financial statements.
Allspring Special International Small Cap Fund | 17
(For a share outstanding throughout each period)
| Six months ended
April 30, 2024
(unaudited) | |
| | | | | |
Net asset value, beginning of period | | | | | | |
| | | | | | |
Net realized and unrealized gains (losses) on investments | | | | | | |
Total from investment operations | | | | | | |
Distributions to shareholders from | | | | | | |
| | | | | | |
| | | | | | |
Total distributions to shareholders | | | | | | |
Net asset value, end of period | | | | | | |
| | | | | | |
Ratios to average net assets (annualized) | | | | | | |
| | | | | | |
| | | | | | |
| | | | | | |
| | | | | | |
| | | | | | |
Net assets, end of period (000s omitted) | | | | | | |
| For the period from May 31, 2019 (commencement of class operations) to October 31, 2019 |
| Calculated based upon average shares outstanding |
| Returns for periods of less than one year are not annualized. |
The accompanying notes are an integral part of these financial statements.
18 | Allspring Special International Small Cap Fund
(For a share outstanding throughout each period)
| Six months ended
April 30, 2024
(unaudited) | |
| | | | | |
Net asset value, beginning of period | | | | | | |
| | | | | | |
Net realized and unrealized gains (losses) on investments | | | | | | |
Total from investment operations | | | | | | |
Distributions to shareholders from | | | | | | |
| | | | | | |
| | | | | | |
Total distributions to shareholders | | | | | | |
Net asset value, end of period | | | | | | |
| | | | | | |
Ratios to average net assets (annualized) | | | | | | |
| | | | | | |
| | | | | | |
| | | | | | |
| | | | | | |
| | | | | | |
Net assets, end of period (000s omitted) | | | | | | |
| For the period from May 31, 2019 (commencement of class operations) to October 31, 2019 |
| Calculated based upon average shares outstanding |
| Returns for periods of less than one year are not annualized. |
The accompanying notes are an integral part of these financial statements.
Allspring Special International Small Cap Fund | 19
Notes to financial statements (unaudited)
Notes to financial statements
Allspring Funds Trust (the “Trust”), a Delaware statutory trust organized on March 10, 1999, is an open-end management investment company registered under the Investment Company Act of 1940, as amended (the “1940 Act”). As an investment company, the Trust follows the accounting and reporting guidance in Financial Accounting Standards Board (“FASB”) Accounting Standards Codification Topic 946, Financial Services – Investment Companies. These financial statements report on the Allspring Special International Small Cap Fund (the “Fund”) which is a diversified series of the Trust.
2.
SIGNIFICANT ACCOUNTING POLICIES
The following significant accounting policies, which are consistently followed in the preparation of the financial statements of the Fund, are in conformity with U.S. generally accepted accounting principles which require management to make estimates and assumptions that affect the reported amounts of assets and liabilities, disclosure of contingent assets and liabilities at the date of the financial statements, and the reported amounts of income and expenses during the reporting period. Actual results could differ from those estimates.
All investments are valued each business day as of the close of regular trading on the New York Stock Exchange (generally 4 p.m. Eastern Time), although the Fund may deviate from this calculation time under unusual or unexpected circumstances.
Equity securities and exchange-traded funds that are listed on a foreign or domestic exchange or market are valued at the official closing price or, if none, the last sales price.
The values of securities denominated in foreign currencies are translated into U.S. dollars at rates provided by an independent foreign currency pricing source at a time each business day specified by the Valuation Committee at Allspring Funds Management, LLC (“Allspring Funds Management”).
Many securities markets and exchanges outside the U.S. close prior to the close of the New York Stock Exchange and therefore may not fully reflect trading or events that occur after the close of the principal exchange in which the foreign securities are traded, but before the close of the New York Stock Exchange. If such trading or events are expected to materially affect the value of such securities, then fair value pricing procedures implemented by Allspring Funds Management are applied. These procedures take into account multiple factors including movements in U.S. securities markets after foreign exchanges close. Foreign securities that are fair valued under these procedures are categorized as Level 2 and the application of these procedures may result in transfers between Level 1 and Level 2. Depending on market activity, such fair valuations may be frequent. Such fair value pricing may result in net asset values that are higher or lower than net asset values based on the last reported sales price or latest quoted bid price. On April 30, 2024, such fair value pricing was used in pricing certain foreign securities.
Forward foreign currency contracts are recorded at the forward rate provided by an independent foreign currency pricing source at a time each business day specified by the Valuation Committee at Allspring Funds Management, LLC.
Investments in registered open-end investment companies (other than those listed on a foreign or domestic exchange or market) are valued at net asset value.
Investments which are not valued using the methods discussed above are valued at their fair value, as determined in good faith by Allspring Funds Management, which was named the valuation designee by the Board of Trustees. As the valuation designee, Allspring Funds Management is responsible for day-to-day valuation activities for the Allspring Funds. In connection with these responsibilities, Allspring Funds Management has established a Valuation Committee and has delegated to it the authority to take any actions regarding the valuation of portfolio securities that the Valuation Committee deems necessary or appropriate, including determining the fair value of portfolio securities. On a quarterly basis, the Board of Trustees receives reports of valuation actions taken by the Valuation Committee. On at least an annual basis, the Board of Trustees receives an assessment of the adequacy and effectiveness of Allspring Funds Management’s process for determining the fair value of the portfolio of investments.
Foreign currency translation
The accounting records of the Fund are maintained in U.S. dollars. The values of other assets and liabilities denominated in foreign currencies are translated into U.S. dollars at rates provided by an independent foreign currency pricing source at a time each business day specified by the Valuation Committee. Purchases and sales of securities, and income and expenses are converted at the rate of exchange on the respective dates of such transactions. Net realized foreign exchange gains or losses arise from sales of foreign currencies, currency gains or losses realized between the trade and settlement dates on securities transactions, and the difference between the amounts of dividends, interest and foreign withholding taxes recorded and the U.S. dollar equivalent of the amounts actually paid or received. Net unrealized foreign exchange gains and losses arise from changes in the fair value of assets and liabilities other than investments in securities resulting from changes in exchange rates. The changes in net assets arising from changes in exchange rates of securities and the changes in net assets resulting from changes in market prices of securities are not separately presented. Such changes are included in net realized and unrealized gains or losses from investments.
Forward foreign currency contracts
A forward foreign currency contract is an agreement between two parties to purchase or sell a specific currency for an agreed-upon price at a future date. The Fund enters into forward foreign currency contracts to facilitate transactions in foreign-denominated securities and to attempt to minimize the
20 | Allspring Special International Small Cap Fund
Notes to financial statements (unaudited)
risk to the Fund from adverse changes in the relationship between currencies. Forward foreign currency contracts are recorded at the forward rate and marked-to-market daily. When the contracts are closed, realized gains and losses arising from such transactions are recorded as realized gains or losses on forward foreign currency contracts. The Fund is subject to foreign currency risk and may be exposed to risks if the counterparties to the contracts are unable to meet the terms of their contracts or if the value of the foreign currency changes unfavorably. The Fund’s maximum risk of loss from counterparty credit risk is the unrealized gains on the contracts. This risk may be mitigated if there is a master netting arrangement between the Fund and the counterparty.
Security transactions and income recognition
Securities transactions are recorded on a trade date basis. Realized gains or losses are recorded on the basis of identified cost.
Dividend income is recognized on the ex-dividend date, except for certain dividends from foreign securities, which are recorded as soon as the custodian verifies the ex-dividend date. Dividend income is recorded net of foreign taxes withheld where recovery of such taxes is not assured.
Distributions received from REIT investments may be characterized as ordinary income, capital gains, or a return of capital to the Fund based on information provided by the REIT. The proper characterization of REIT distributions is generally not known until after the end of each calendar year. As such, estimates may be used in reporting the character of income and distributions for financial statement purposes.
Distributions to shareholders
Distributions to shareholders from net investment income and any net realized gains are recorded on the ex-dividend date and paid at least annually. Such distributions are determined in accordance with income tax regulations and may differ from U.S. generally accepted accounting principles. Dividend sources are estimated at the time of declaration. The tax character of distributions is determined as of the Fund’s fiscal year end. Therefore, a portion of the Fund’s distributions made prior to the Fund’s fiscal year end may be categorized as a tax return of capital at year end.
The Fund intends to continue to qualify as a regulated investment company by distributing substantially all of its investment company taxable income and any net realized capital gains (after reduction for capital loss carryforwards) sufficient to relieve it from all, or substantially all, federal income taxes. Accordingly, no provision for federal income taxes was required.
The Fund’s income and federal excise tax returns and all financial records supporting those returns for the prior three fiscal years are subject to examination by the federal and Delaware revenue authorities. Management has analyzed the Fund’s tax positions taken on federal, state, and foreign tax returns, as applicable, for all open tax years and does not believe that there are any uncertain tax positions that require recognition of a tax liability.
As of April 30, 2024, the aggregate cost of all investments for federal income tax purposes was $188,416,341 and the unrealized gains (losses) consisted of:
As of October 31, 2023, the Fund had capital loss carryforwards which consisted of $2,628,466 in long-term capital losses.
The separate classes of shares offered by the Fund differ principally in applicable sales charges, distribution, shareholder servicing, and administration fees. Class specific expenses are charged directly to that share class. Investment income, common fund-level expenses, and realized and unrealized gains (losses) on investments are allocated daily to each class of shares based on the relative proportion of net assets of each class.
3.
FAIR VALUATION MEASUREMENTS
Fair value measurements of investments are determined within a framework that has established a fair value hierarchy based upon the various data inputs utilized in determining the value of the Fund’s investments. The three-level hierarchy gives the highest priority to unadjusted quoted prices in active markets for identical assets or liabilities (Level 1) and the lowest priority to unobservable inputs (Level 3). The Fund’s investments are classified within the fair value hierarchy based on the lowest level of input that is significant to the fair value measurement. The inputs are summarized into three broad levels as follows:
•Level 1—quoted prices in active markets for identical securities
•Level 2—other significant observable inputs (including quoted prices for similar securities, interest rates, prepayment speeds, credit risk, etc.)
•Level 3—significant unobservable inputs (including the Fund’s own assumptions in determining the fair value of investments)
The inputs or methodologies used for valuing investments in securities are not necessarily an indication of the risk associated with investing in those securities.
Allspring Special International Small Cap Fund | 21
Notes to financial statements (unaudited)
The following is a summary of the inputs used in valuing the Fund’s assets and liabilities as of April 30, 2024:
| | Other significant
observable inputs
(Level 2) | Significant
unobservable inputs
(Level 3) | |
| | | | |
| | | | |
| | | | |
| | | | |
| | | | |
| | | | |
| | | | |
| | | | |
| | | | |
| | | | |
| | | | |
| | | | |
| | | | |
| | | | |
| | | | |
| | | | |
| | | | |
| | | | |
| | | | |
| | | | |
| | | | |
| | | | |
Additional sector, industry or geographic detail, if any, is included in the Portfolio of Investments.
At April 30, 2024, the Fund did not have any transfers into/out of Level 3.
4.
TRANSACTIONS WITH AFFILIATES
Allspring Funds Management, a wholly owned subsidiary of Allspring Global Investments Holdings, LLC, a holding company indirectly owned by certain private funds of GTCR LLC and Reverence Capital Partners, L.P., is the manager of the Fund and provides advisory and fund-level administrative services under an investment management agreement. Under the investment management agreement, Allspring Funds Management is responsible for, among other services, implementing the investment objectives and strategies of the Fund, supervising the subadviser and providing fund-level administrative services in connection with the Fund’s operations. As compensation for its services under the investment management agreement, Allspring Funds Management is entitled to receive a management fee at the following annual rate based on the Fund’s average daily net assets:
For the six months ended April 30, 2024, the management fee was equivalent to an annual rate of 0.95% of the Fund’s average daily net assets.
Allspring Funds Management has retained the services of a subadviser to provide daily portfolio management to the Fund. The fee for subadvisory services is borne by Allspring Funds Management. Allspring Global Investments, LLC, an affiliate of Allspring Funds Management and a wholly owned subsidiary of Allspring Global Investments Holdings, LLC, is the subadviser to the Fund and is entitled to receive a fee from Allspring Funds Management at an annual rate starting at 0.55% and declining to 0.40% as the average daily net assets of the Fund increase.
Under a class-level administration agreement, Allspring Funds Management provides class-level administrative services to the Fund, which includes paying fees and expenses for services provided by the transfer agent, sub-transfer agents, omnibus account servicers and record-keepers. As
22 | Allspring Special International Small Cap Fund
Notes to financial statements (unaudited)
compensation for its services under the class-level administration agreement, Allspring Funds Management receives an annual fee which is calculated based on the average daily net assets of each class as follows:
| Class-level
administration fee |
| |
| |
| |
| |
Waivers and/or expense reimbursements
Allspring Funds Management has contractually committed to waive and/or reimburse management and administration fees to the extent necessary to maintain certain net operating expense ratios for the Fund. When each class of the Fund has exceeded its expense cap, Allspring Funds Management will waive fees and/or reimburse expenses from fund-level expenses on a proportionate basis and then from class specific expenses. When only certain classes exceed their expense caps, waivers and/or reimbursements are applied against class specific expenses before fund-level expenses. Allspring Funds Management has contractually committed through February 28, 2025 to waive fees and/or reimburse expenses to the extent necessary to cap the Fund’s expenses. Prior to or after the commitment expiration date, the cap may be increased or the commitment to maintain the cap may be terminated only with the approval of the Board of Trustees. As of April 30, 2024, the contractual caps are as follows:
The Trust has adopted a distribution plan for Class C shares pursuant to Rule 12b-1 under the 1940 Act. A distribution fee is charged to Class C shares and paid to Allspring Funds Distributor, LLC (“Allspring Funds Distributor”), the principal underwriter, an affiliate of Allspring Funds Management, at an annual rate up to 0.75% of the average daily net assets of Class C shares.
In addition, Allspring Funds Distributor is entitled to receive the front-end sales charge from the purchase of Class A shares and a contingent deferred sales charge on the redemption of certain Class A shares. Allspring Funds Distributor is also entitled to receive the contingent deferred sales charges from redemptions of Class C shares. For the six months ended April 30, 2024, Allspring Funds Distributor received $4 from the sale of Class A shares. No contingent deferred sales charges were incurred by Class A and Class C shares for the six months ended April 30, 2024.
Shareholder servicing fees
The Trust has entered into contracts with one or more shareholder servicing agents, whereby Class A and Class C are charged a fee at an annual rate up to 0.25% of the average daily net assets of each respective class. A portion of these total shareholder servicing fees were paid to affiliates of the Fund.
The Fund may purchase or sell portfolio investment securities to certain affiliates pursuant to Rule 17a-7 under the 1940 Act and under procedures adopted by the Board of Trustees. The procedures have been designed to ensure that these interfund transactions, which do not incur broker commissions, are effected at current market prices. Pursuant to these procedures, the Fund did not have any interfund transactions during the six months ended April 30, 2024.
5.
INVESTMENT PORTFOLIO TRANSACTIONS
Purchases and sales of investments, excluding U.S. government obligations (if any) and short-term securities, for the six months ended April 30, 2024 were $38,399,666 and $42,727,194, respectively.
6.
DERIVATIVE TRANSACTIONS
During the six months ended April 30, 2024, the Fund entered into forward foreign currency contracts for economic hedging purposes. The Fund had average contract amounts of $21,689 in forward foreign currency contracts to buy during the six months ended April 30, 2024.
The fair value, realized gains or losses and change in unrealized gains or losses, if any, on derivative instruments are reflected in the corresponding financial statement captions.
Allspring Special International Small Cap Fund | 23
Notes to financial statements (unaudited)
The Trust (excluding the money market funds), Allspring Master Trust and Allspring Variable Trust are parties to a $350,000,000 revolving credit agreement whereby the Fund is permitted to use bank borrowings for temporary or emergency purposes, such as to fund shareholder redemption requests. Interest under the credit agreement is charged to the Fund based on a borrowing rate equal to the higher of the Federal Funds rate or the overnight bank funding rate in effect on that day plus a spread. In addition, an annual commitment fee based on the unused balance is allocated to each participating fund.
For the six months ended April 30, 2024, there were no borrowings by the Fund under the agreement.
As of the end of the period, the Fund concentrated its portfolio of investments in Europe and Japan and the industrials sector. A fund that invests a substantial portion of its assets in any geographic region or sector may be more affected by changes in that geographic region or sector than would be a fund whose investments are not heavily weighted in any geographic region or sector.
Under the Fund’s organizational documents, the officers and Trustees have been granted certain indemnification rights against certain liabilities that may arise out of performance of their duties to the Fund. The Fund has entered into a separate agreement with each Trustee that converts indemnification rights currently existing under the Fund’s organizational documents into contractual rights that cannot be changed in the future without the consent of the Trustee. Additionally, in the normal course of business, the Fund may enter into contracts with service providers that contain a variety of indemnification clauses. The Fund’s maximum exposure under these arrangements is dependent on future claims that may be made against the Fund and, therefore, cannot be estimated.
24 | Allspring Special International Small Cap Fund
Other information (unaudited)
Other information
A description of the policies and procedures used to determine how to vote proxies relating to portfolio securities is available without charge, upon request, by calling 1-866-259-3305, visiting our website at allspringglobal.com, or visiting the SEC website at sec.gov. Information regarding how the proxies related to portfolio securities were voted during the most recent 12-month period ended June 30 is available on the website at allspringglobal.com or by visiting the SEC website at sec.gov.
Quarterly portfolio holdings information
The Fund files its complete schedule of portfolio holdings with the SEC for the first and third quarters of each fiscal year as an exhibit to its reports on Form N-PORT. Shareholders may view the filed Form N-PORT by visiting the SEC website at sec.gov.
Allspring Special International Small Cap Fund | 25
Other information (unaudited)
Board of trustees and officers
Each of the Trustees and Officers listed in the table below acts in identical capacities for each fund in the Allspring family of funds, which consists of 99 mutual funds comprising the Allspring Funds Trust, Allspring Variable Trust, Allspring Master Trust and four closed-end funds (collectively the “Fund Complex”). This table should be read in conjunction with the Prospectus and the Statement of Additional Information*. The mailing address of each Trustee and Officer is 1415 Vantage Park Drive, 3rd Floor, Charlotte, NC 28203. Each Trustee and Officer serves an indefinite term, however, each Trustee serves such term until reaching the mandatory retirement age established by the Trustees.
| Position held and
length of | Principal occupations during past five years or longer | Current other
public company or
investment
company
directorships |
William R. Ebsworth
(Born 1957) | | Retired. From 1984 to 2013, equities analyst, portfolio manager, research director and chief investment officer at Fidelity Management and Research Company in Boston, Tokyo, and Hong Kong, and retired in 2013 as Chief Investment Officer of Fidelity Strategic Advisers, Inc. where he led a team of investment professionals managing client assets. Prior thereto, Board member of Hong Kong Securities Clearing Co., Hong Kong Options Clearing Corp., the Thailand International Fund, Ltd., Fidelity Investments Life Insurance Company, and Empire Fidelity Investments Life Insurance Company. Serves on the Investment Company Institute’s Board of Governors since 2022 and Executive Committee since 2023 as well as the Vice Chairman of the Governing Council of the Independent Directors Council since 2023. Audit Committee Chair and Investment Committee Chair of the Vincent Memorial Hospital Foundation (non-profit organization). Mr. Ebsworth is a CFA charterholder. | |
Jane A. Freeman
(Born 1953) | Trustee,
since 2015;
Chair Liaison,
| Retired. From 2012 to 2014 and 1999 to 2008, Chief Financial Officer of Scientific Learning Corporation. From 2008 to 2012, Ms. Freeman provided consulting services related to strategic business projects. Prior to 1999, Portfolio Manager at Rockefeller & Co. and Scudder, Stevens & Clark. Board member of the Harding Loevner Funds from 1996 to 2014, serving as both Lead Independent Director and chair of the Audit Committee. Board member of the Russell Exchange Traded Funds Trust from 2011 to 2012 and the chair of the Audit Committee. Ms. Freeman is also an inactive Chartered Financial Analyst. | |
Isaiah Harris, Jr.
(Born 1952) | Trustee,
since 2009;
Audit Committee Chair,
since 2019 | Retired. Member of the Advisory Board of CEF of East Central Florida. Chairman of the Board of CIGNA Corporation from 2009 to 2021, and Director from 2005 to 2008. From 2003 to 2011, Director of Deluxe Corporation. Prior thereto, President and CEO of BellSouth Advertising and Publishing Corp. from 2005 to 2007, President and CEO of BellSouth Enterprises from 2004 to 2005 and President of BellSouth Consumer Services from 2000 to 2003. Emeritus member of the Iowa State University Foundation Board of Governors. Emeritus Member of the Advisory board of Iowa State University School of Business. Advisory Board Member, Palm Harbor Academy (private school). Advisory Board Member, Fellowship of Christian Athletes. Mr. Harris is a certified public accountant (inactive status). | |
David F. Larcker
(Born 1950) | | Distinguished Visiting Fellow at the Hoover Institution since 2022. James Irvin Miller Professor of Accounting at the Graduate School of Business (Emeritus), Stanford University, Director of the Corporate Governance Research Initiative and Senior Faculty of The Rock Center for Corporate Governance since 2006. From 2005 to 2008, Professor of Accounting at the Graduate School of Business, Stanford University. Prior thereto, Ernst & Young Professor of Accounting at The Wharton School, University of Pennsylvania from 1985 to 2005. | |
Olivia S. Mitchell
(Born 1953) | | International Foundation of Employee Benefit Plans Professor since 1993, Wharton School of the University of Pennsylvania. Director of Wharton’s Pension Research Council and Boettner Center on Pensions & Retirement Research, and Research Associate at the National Bureau of Economic Research. Previously taught at Cornell University from 1978 to 1993. | |
Timothy J. Penny
(Born 1951) | Trustee,
since 1996;
Chair,
since 2018 | President and Chief Executive Officer of Southern Minnesota Initiative Foundation, a non-profit organization, since 2007. Vice Chair of the Economic Club of Minnesota, since 2007. Co-Chair of the Committee for a Responsible Federal Budget, since 1995. Member of the Board of Trustees of NorthStar Education Finance, Inc., a non-profit organization, from 2007-2022. Senior Fellow of the University of Minnesota Humphrey Institute from 1995 to 2017. | |
** Length of service dates reflect the Trustee’s commencement of service with the Trust’s predecessor entities, where applicable.
*** Ms. Freeman will serve as Chair Liaison through June 2024, at which time Ms. Wheelock will assume the role.
*
The Statement of Additional Information includes additional information about the Trustees and is available, without charge, upon request, by calling 1-800-222-8222 or by visiting the website at allspringglobal.com.
26 | Allspring Special International Small Cap Fund
Other information (unaudited)
| Position held and length of service** | Principal occupations during past five years or longer | Current other public company or investment company directorships |
James G. Polisson
(Born 1959) | Trustee,
since 2018;
Nominating and Governance Committee Chair,
since 2024 | Retired. Chief Marketing Officer, Source (ETF) UK Services, Ltd, from 2015 to 2017. From 2012 to 2015, Principal of The Polisson Group, LLC, a management consulting, corporate advisory and principal investing company. Chief Executive Officer and Managing Director at Russell Investments, Global Exchange Traded Funds from 2010 to 2012. Managing Director of Barclays Global Investors from 1998 to 2010 and Global Chief Marketing Officer for iShares and Barclays Global Investors from 2000 to 2010. Trustee of the San Francisco Mechanics’ Institute, a non- profit organization, from 2013 to 2015. Board member of the Russell Exchange Traded Fund Trust from 2011 to 2012. Director of Barclays Global Investors Holdings Deutschland GmbH from 2006 to 2009. Mr. Polisson is an attorney and has a retired status with the Massachusetts and District of Columbia Bar Associations. | |
Pamela Wheelock
(Born 1959) | Trustee,
since January 2020;
previously Trustee from
January 2018 to
| Retired. Executive and Senior Financial leadership positions in the public, private and nonprofit sectors. Interim President and CEO, McKnight Foundation, 2020. Interim Commissioner, Minnesota Department of Human Services, 2019. Chief Operating Officer, Twin Cities Habitat for Humanity, 2017-2019. Vice President for University Services, University of Minnesota, 2012- 2016. Interim President and CEO, Blue Cross and Blue Shield of Minnesota, 2011-2012. Executive Vice-President and Chief Financial Officer, Minnesota Wild, 2002-2008. Commissioner, Minnesota Department of Finance, 1999-2002. Chair of the Board of Directors of Destination Medical Center Corporation. Board member of the Minnesota Wild Foundation. | |
** Length of service dates reflect the Trustee’s commencement of service with the Trust’s predecessor entities, where applicable.
*** Ms. Freeman will serve as Chair Liaison through June 2024, at which time Ms. Wheelock will assume the role.
Allspring Special International Small Cap Fund | 27
Other information (unaudited)
Officers1
| Position held and
length of service | Principal occupations during past five years or longer |
| | President and Chief Executive Officer of Allspring Funds Management, LLC since 2017 and Head of Global Fund Governance of Allspring Global Investments since 2022. Prior thereto, co-president of Galliard Capital Management, LLC, an affiliate of Allspring Funds Management, LLC, from 2019 to 2022 and Head of Affiliated Managers, Allspring Global Investments, from 2014 to 2019 and Executive Vice President responsible for marketing, investments and product development for Allspring Funds Management, LLC, from 2009 to 2014. |
Jeremy DePalma
(Born 1974) | Treasurer,
since 2012
(for certain funds in
the Fund Complex);
since 2021 (for
the remaining funds in the Complex) | Senior Vice President of Allspring Funds Management, LLC since 2009. Senior Vice President of Evergreen Investment Management Company, LLC from 2008 to 2010 and head of the Fund Reporting and Control Team within Fund Administration from 2005 to 2010. |
Christopher Baker
(Born 1976) | Chief Compliance Officer,
since 2022 | Global Chief Compliance Officer for Allspring Global Investments since 2022. Prior thereto, Chief Compliance Officer for State Street Global Advisors from 2018 to 2021. Senior Compliance Officer for the State Street divisions of Alternative Investment Solutions, Sector Solutions, and Global Marketing from 2015 to 2018. From 2010 to 2015 Vice President, Global Head of Investment and Marketing Compliance for State Street Global Advisors. |
Matthew Prasse
(Born 1983) | Chief Legal Officer,
since 2022;
Secretary,
since 2021 | Senior Counsel of the Allspring Legal Department since 2021. Senior Counsel of the Wells Fargo Legal Department from 2018 to 2021. Previously, Counsel for Barings LLC from 2015 to 2018. Prior to joining Barings, Associate at Morgan, Lewis & Bockius LLP from 2008 to 2015. |
1 For those Officers with tenures at Allspring Global Investments and/or Allspring Funds Management, LLC that began prior to 2021, such tenures include years of service during which these businesses/entities were known as Wells Fargo Asset Management and Wells Fargo Funds Management, LLC, respectively.
28 | Allspring Special International Small Cap Fund
For more information
More information about Allspring Funds is available free upon request. To obtain literature, please write, visit the Fund’s website, or call:
Allspring Funds
P.O. Box 219967
Kansas City, MO 64121-9967
Website: allspringglobal.com
Individual investors: 1-800-222-8222
Retail investment professionals: 1-888-877-9275
Institutional investment professionals: 1-800-260-5969
This report and the financial statements contained herein are submitted for the general information of the shareholders of the Fund. If this report is used for promotional purposes, distribution of the report must be accompanied or preceded by a current prospectus. Before investing, please consider the investment objectives, risks, charges, and expenses of the investment. For a current prospectus and, if available, a summary prospectus, containing this information, call 1-800-222-8222 or visit the Fund’s website at allspringglobal.com. Read the prospectus carefully before you invest or send money.
Allspring Global InvestmentsTM is the trade name for the asset management firms of Allspring Global Investments Holdings, LLC, a holding company indirectly owned by certain private funds of GTCR LLC and Reverence Capital Partners, L.P. These firms include but are not limited to Allspring Global Investments, LLC, and Allspring Funds Management, LLC. Certain products managed by Allspring entities are distributed by Allspring Funds Distributor, LLC (a broker-dealer and Member FINRA/SIPC).
This material is for general informational and educational purposes only and is NOT intended to provide investment advice or a recommendation of any kind - including a recommendation for any specific investment, strategy, or plan.
© 2024 Allspring Global Investments Holdings, LLC. All rights reserved.
ALL-05022024-t3tczm3u 06-24
SAR4338 04-24
Allspring U.S.
Long/Short Equity Fund
The views expressed and any forward-looking statements are as of April 30, 2024, unless otherwise noted, and are those of the portfolio managers and/or Allspring Global Investments. Discussions of individual securities or the markets generally are not intended as individual recommendations. Future events or results may vary significantly from those expressed in any forward-looking statements. The views expressed are subject to change at any time in response to changing circumstances in the market. Allspring Global Investments disclaims any obligation to publicly update or revise any views expressed or forward-looking statements.
Allspring U.S. Long/Short Equity Fund | 1
Letter to shareholders (unaudited)
Dear Shareholder:
We are pleased to offer you this semi-annual report for the Allspring U.S. Long/Short Equity Fund for the six-month period that ended April 30, 2024. Globally, stocks and bonds had strongly positive returns for the period. However, markets were volatile as investors focused on persistently high inflation and the impact of aggressive central bank rate hikes. Riskier assets rallied as investors anticipated an end to the tight monetary policy.
For the period, U.S. stocks, based on the S&P 500 Index,1 returned 20.98%. International stocks, as measured by the MSCI ACWI ex USA Index (Net),2 gained 17.69% while the MSCI EM Index (Net) (USD),3 returned 15.40%. Among bond indexes, the Bloomberg U.S. Aggregate Bond Index4 advanced 4.97%, the Bloomberg Global Aggregate ex-USD Index (unhedged)5 gained 3.92%, the Bloomberg Municipal Bond Index6 returned 7.06%, and the ICE BofA U.S. High Yield Index7 gained 8.94%.
Investors remained focused on central bank monetary policies.
As the six-month period began in November, the market mood brightened as cooling inflation inspired confidence that central banks could hold off on further rate hikes. Overall annual inflation in the U.S. fell to 3.1% in November while 12-month inflation in the U.K. and the eurozone eased to 4.6% and 2.4%, respectively—far below their peak levels of mid-2022. Third quarter annualized U.S. GDP growth was raised to an estimated 5.2% while U.S. job totals rose by close to 200,000 in November, indicating a slight cooling of the labor market. All of this fresh evidence added to confidence for a U.S. soft economic landing, leading to a more buoyant mood heading into winter.
The broad year-end rally among stocks and bonds that began in November continued through December as investors became more confident that monetary policy would ease in 2024. Supporting the bubbly market mood were a series of reports confirming lower inflationary trends in the U.S. and Europe. During the period, it appeared more likely that the U.S. economy could achieve a soft landing, cooling enough to lower inflation without the pain of a recession. However, by year-end, an expectations gap developed. Capital markets priced in a total of 1.50 percentage points in federal funds rate cuts in 2024—twice as much as the three cuts of 0.25% hinted at by Fed officials.
1
The S&P 500 Index consists of 500 stocks chosen for market size, liquidity, and industry group representation. It is a market-value-weighted index with each stock’s weight in the index proportionate to its market value. You cannot invest directly in an index.
2
The Morgan Stanley Capital International (MSCI) All Country World Index (ACWI) ex USA Index (Net) is a free-float-adjusted market-capitalization-weighted index that is designed to measure the equity market performance of developed and emerging markets, excluding the U.S. Source: MSCI. MSCI makes no express or implied warranties or representations and shall have no liability whatsoever with respect to any MSCI data contained herein. The MSCI data may not be further redistributed or used as a basis for other indexes or any securities or financial products. This report is not approved, reviewed, or produced by MSCI. You cannot invest directly in an index.
3
The MSCI Emerging Markets (EM) Index (Net) (USD) is a free-float-adjusted market-capitalization-weighted index that is designed to measure the equity market performance of emerging markets. You cannot invest directly in an index.
4
The Bloomberg U.S. Aggregate Bond Index is a broad-based benchmark that measures the investment-grade, U.S.-dollar-denominated, fixed-rate taxable bond market, including Treasuries, government-related and corporate securities, mortgage-backed securities (agency fixed-rate and hybrid adjustable-rate mortgage pass-throughs), asset-backed securities, and commercial mortgage-backed securities. You cannot invest directly in an index.
5
The Bloomberg Global Aggregate ex-USD Index (unhedged) is an unmanaged index that provides a broad-based measure of the global investment-grade fixed-income markets excluding the U.S.-dollar-denominated debt market. You cannot invest directly in an index.
6
The Bloomberg Municipal Bond Index is an unmanaged index composed of long-term tax-exempt bonds with a minimum credit rating of Baa. You cannot invest directly in an index.
7
The ICE BofA U.S. High Yield Index is a market-capitalization-weighted index of domestic and Yankee high yield bonds. The index tracks the performance of high yield securities traded in the U.S. bond market. Returns shown are net of transaction costs beginning on July 1, 2022. You cannot invest directly in an index. Copyright 2024. ICE Data Indices, LLC. All rights reserved.
2 | Allspring U.S. Long/Short Equity Fund
Letter to shareholders (unaudited)
Financial market performance was mixed in January 2024 as U.S. stocks had modest gains while non-U.S. equities, particularly those in emerging markets, and fixed income assets were held back by central bank pushback on market optimism over rate cuts. Overall, optimism was supported by hints of a soft landing for the U.S. economy. Key data included a surprisingly strong gain of 353,000 jobs in January, an unemployment rate of just 3.7%, and a rise of just 3.1% in the annual Consumer Price Index1 (CPI) in January. However, that resilience helped tone down expectations of a rate cut in March to a more likely second quarter initial move.
In February, stocks were supported by positive economic data and strong corporate earnings. However, fixed income investments were under pressure as resilient inflation curbed expectations on the timing of interest rate cuts. The S&P 500 Index had solid monthly gains along with emerging market equities, which benefited from a rebound in China.
The first quarter of 2024 closed with ongoing stock market momentum and a more muted sense of confidence in fixed income markets as investors adjusted to the prospect of greater-than-expected economic strength. On the flip side, expectations on the timing of an initial Fed rate cut were pushed back from March to June and then beyond. Additionally, the number of quarter-point rate cuts forecast by the market fell from six as projected in December 2023 to two to three cuts by fiscal period-end.
Markets retreated broadly in April as U.S. annual inflation continued to resist monetary policy efforts and expectations for its downward trajectory, with an April CPI reading of 3.4%. The timing of a Fed initial rate cut came into greater question in April. Not only was there less confidence regarding when a first cut would take place but also whether any rate reductions would occur at all in 2024. Market expectations continued to recede to a possible September Fed first cut. Meanwhile, eurozone annual inflation held steady in April at 2.4%. Developed market stocks and fixed income securities of all types were in the red for April.
Don’t let short-term uncertainty derail long-term investment goals.
Periods of investment uncertainty can present challenges, but experience has taught us that maintaining long-term investment goals can be an effective way to plan for the future. To help you create a sound strategy based on your personal goals and risk tolerance, Allspring Funds offers a wide variety of mutual funds spanning many asset classes and investment styles. Although diversification cannot guarantee an investment profit or prevent losses, we believe it can be an effective way to manage investment risk and potentially smooth out overall portfolio performance. We encourage investors to know their investments and to understand that appropriate levels of risk-taking may unlock opportunities.
Thank you for choosing to invest with Allspring Funds. We appreciate your confidence in us and remain committed to helping you meet your financial needs.
Andrew Owen
President
Allspring Funds
“ The first quarter of 2024 closed with ongoing stock market momentum and a more muted sense of confidence in fixed income markets as investors adjusted to the prospect of greater-than-expected economic strength. ”
For further information about your fund, contact your investment professional, visit our website at allspringglobal.com, or call us directly at 1-800-222-8222.
1
The Consumer Price Index (CPI) is a measure of the average change over time in the prices paid by urban consumers for a market basket of consumer goods and services. You cannot invest directly in an index.
Allspring U.S. Long/Short Equity Fund | 3
Performance highlights (unaudited)
Performance highlights
| The Fund seeks long-term capital appreciation. |
| Allspring Funds Management, LLC |
| Allspring Global Investments, LLC |
| Ryan Brown, CFA, Kevin Cole, CFA†, Harindra de Silva, Ph.D., CFA |
Average annual total returns (%) as of April 30, 2024 |
| | | | |
| | | | | | | | | |
| | | | | | | | | |
| | | | | | | | | |
| | | | | | | | | |
| | | | | | | | | |
| | | | | | | | | |
| | | | | | | | | |
| | | | | | | | | |
ICE BofA 3-Month U.S. Treasury Bill Index10 | | | | | | | | | |
Figures quoted represent past performance, which is no guarantee of future results, and do not reflect taxes that a shareholder may pay on an investment in a fund. Investment return and principal value of an investment will fluctuate so that an investor’s shares, when redeemed, may be worth more or less than their original cost. Performance shown without sales charges would be lower if sales charges were reflected. Current performance may be lower or higher than the performance data quoted, which assumes the reinvestment of dividends and capital gains. Current month-end performance is available on the Fund’s website, allspringglobal.com.
Index returns do not include transaction costs associated with buying and selling securities, any mutual fund fees or expenses, or any taxes. It is not possible to invest directly in an index.
For Class A shares, the maximum front-end sales charge is 5.75%. For Class C shares, the maximum contingent deferred sales charge is 1.00%. Performance including a contingent deferred sales charge assumes the sales charge for the corresponding time period. Class R6 and Institutional Class shares are sold without a front-end sales charge or contingent deferred sales charge.
|
| Based on the inception date of the oldest Fund class. |
| Reflects the expense ratios as stated in the most recent prospectuses, which include the impact of 0.01% in acquired fund fees and expenses. The expense ratios shown are subject to change and may differ from the annualized expense ratios shown in the Financial Highlights of this report, which do not include acquired fund fees and expenses. |
| The manager has contractually committed through February 28, 2025, to waive fees and/or reimburse expenses to the extent necessary to cap total annual fund operating expenses after fee waivers at 1.57% for Class A, 2.32% for Class C, 1.15% for Class R6 and 1.25% for Institutional Class. Brokerage commissions, stamp duty fees, interest, taxes, acquired fund fees and expenses (if any), expenses from dividends and interest on short positions, and extraordinary expenses are excluded from the expense caps. Prior to or after the commitment expiration date, the caps may be increased or the commitment to maintain the caps may be terminated only with the approval of the Board of Trustees. Without these caps, the Fund’s returns would have been lower. The expense ratio paid by an investor is the net expense ratio (the total annual fund operating expenses after fee waivers) as stated in the prospectuses. |
| Historical performance shown for the Class A shares prior to December 16, 2022 is based on the performance of the Investor Class shares of the Fund’s predecessor, 361 Domestic Long/Short Equity Fund. |
| Historical performance for the Class C shares prior to their inception reflects the performance of the Class A shares and is not adjusted to reflect the higher expenses applicable to the Class C shares. If these expenses had been included, returns would be lower. |
| Historical performance shown for the Class R6 shares prior to their inception reflects the performance of the Institutional Class shares, and includes the higher expenses applicable to the Institutional Class shares. If these expenses had not been included, returns for the Class R6 shares would be higher. Historical performance prior to December 16, 2022 is based on the performance of Class I shares of the Fund’s predecessor, 361 Domestic Long/Short Equity Fund. |
| Historical performance shown for the Institutional Class shares prior to December 16, 2022 is based on the performance of Class I shares of the Fund’s predecessor, 361 Domestic Long/Short Equity Fund. |
| The Russell 3000® Index measures the performance of the 3,000 largest U.S. companies based on total market capitalization, which represents approximately 98% of the investable U.S. equity market. You cannot invest directly in an index. |
| Mr. Cole became a portfolio manager of the Fund on January 24, 2024. |
CFA® and Chartered Financial Analyst® are trademarks owned by CFA Institute. |
4 | Allspring U.S. Long/Short Equity Fund
Performance highlights (unaudited)
Footnotes continued from previous page |
| The Morgan Stanley Capital International (MSCI) USA Index (Net) (USD) is a free-float-adjusted market-capitalization-weighted index that is designed to measure large- and mid-cap U.S. equity market performance. Source: MSCI. MSCI makes no express or implied warranties or representations and shall have no liability whatsoever with respect to any MSCI data contained herein. The MSCI data may not be further redistributed or used as a basis for other indices or any securities or financial products. This report is not approved, reviewed, or produced by MSCI. You cannot invest directly in an index. |
| Source: Allspring Funds Management, LLC. The U.S. Long/Short Equity Blended Index is composed 50% of the MSCI USA Index (Net) (USD) and 50% of the ICE BofA 3-Month U.S. Treasury Bill Index. You cannot invest directly in an index. |
| The ICE BofA 3-Month U.S. Treasury Bill Index is an unmanaged index that is comprised of a single U.S. Treasury issue with approximately three months to final maturity, purchased at the beginning of each month and held for one full month. You cannot invest directly in an index. Copyright 2024. ICE Data Indices, LLC. All rights reserved. |
Investing involves risk, including the possible loss of principal. Stock values fluctuate in response to the activities of individual companies and general market and economic conditions. Short selling is generally considered speculative, has the potential for unlimited loss, and may involve leverage. Consult the Fund’s prospectus for additional information on these and other risks.
Allspring U.S. Long/Short Equity Fund | 5
Performance highlights (unaudited)
Ten largest Long Positions (%) as of April 30, 20241 |
| |
Texas Roadhouse, Inc. Class A | |
| |
| |
| |
| |
| |
| |
| |
| |
| Figures represent the percentage of the Fund’s net assets. Holdings are subject to change and may have changed since the date specified. |
Five largest short positions (%) as of April 30, 20241 |
| |
| |
| |
| |
| |
| Figures represent the percentage of the Fund’s net assets. Holdings are subject to change and may have changed since the date specified. |
Sector Allocation for Long and Short positions as of |
| | |
| | |
| | |
| | |
| | |
| | |
| | |
| | |
| | |
| | |
| | |
| | |
| Figures represent the percentage of the Fund’s long and short positions. Allocations are subject to change and may have changed since the date specified. |
6 | Allspring U.S. Long/Short Equity Fund
Fund expenses (unaudited)
Fund expenses
As a shareholder of the Fund, you incur two types of costs: (1) transaction costs, including sales charges (loads) on purchase payments and contingent deferred sales charges (if any) on redemptions and (2) ongoing costs, including management fees, distribution (12b-1) and/or shareholder servicing fees, and other Fund expenses. This example is intended to help you understand your ongoing costs (in dollars) of investing in the Fund and to compare these costs with the ongoing costs of investing in other mutual funds.
The example is based on an investment of $1,000 invested at the beginning of the six-month period and held for the entire period from November 1, 2023 to April 30, 2024.
The “Actual” line of the table below provides information about actual account values and actual expenses. You may use the information in this line, together with the amount you invested, to estimate the expenses that you paid over the period. Simply divide your account value by $1,000 (for example, an $8,600 account value divided by $1,000= 8.6), then multiply the result by the number in the “Actual” line under the heading entitled “Expenses paid during period” for your applicable class of shares to estimate the expenses you paid on your account during this period.
Hypothetical example for comparison purposes
The “Hypothetical” line of the table below provides information about hypothetical account values and hypothetical expenses based on the Fund’s actual expense ratio and an assumed rate of return of 5% per year before expenses, which is not the Fund’s actual return. The hypothetical account values and expenses may not be used to estimate the actual ending account balance or expenses you paid for the period. You may use this information to compare the ongoing costs of investing in the Fund and other funds. To do so, compare this 5% hypothetical example with the 5% hypothetical examples that appear in the shareholder reports of the other funds.
Please note that the expenses shown in the table are meant to highlight your ongoing costs only and do not reflect any transactional costs, such as sales charges (loads) and contingent deferred sales charges. Therefore, the “Hypothetical” line of the table is useful in comparing ongoing costs only, and will not help you determine the relative total costs of owning different funds. In addition, if these transactional costs were included, your costs would have been higher.
| Beginning
account value
11-1-2023 | Ending
account value
4-30-2024 | | Annualized net
expense ratio |
| | | | |
| | | | |
Hypothetical (5% return before expenses) | | | | |
| | | | |
| | | | |
Hypothetical (5% return before expenses) | | | | |
| | | | |
| | | | |
Hypothetical (5% return before expenses) | | | | |
| | | | |
| | | | |
Hypothetical (5% return before expenses) | | | | |
| Expenses paid is equal to the annualized net expense ratio of each class multiplied by the average account value over the period, multiplied by 182 divided by 366 (to reflect the one-half-year period). |
Allspring U.S. Long/Short Equity Fund | 7
Portfolio of investments—April 30, 2024 (unaudited)
| | | | | |
| | | | | | |
Communication services: 2.51% | | | | | | |
| | | | | | |
| | | | | | |
Interactive media & services: 1.33% | | | | | | |
| | | | | | |
| | | | | | |
| | | | | | |
Meta Platforms, Inc. Class A# | | | | | | |
| | | | | | |
| | | | | | |
Consumer discretionary: 12.50% | | | | | | |
Automobile components: 0.48% | | | | | | |
| | | | | | |
| | | | | | |
| | | | | | |
| | | | | | |
| | | | | | |
| | | | | | |
| | | | | | |
| | | | | | |
| | | | | | |
| | | | | | |
| | | | | | |
| | | | | | |
| | | | | | |
| | | | | | |
| | | | | | |
| | | | | | |
| | | | | | |
Diversified consumer services: 0.30% | | | | | | |
| | | | | | |
Hotels, restaurants & leisure: 3.54% | | | | | | |
Chipotle Mexican Grill, Inc.†# | | | | | | |
Texas Roadhouse, Inc. Class A# | | | | | | |
| | | | | | |
| | | | | | |
| | | | | | |
The accompanying notes are an integral part of these financial statements.
8 | Allspring U.S. Long/Short Equity Fund
Portfolio of investments—April 30, 2024 (unaudited)
| | | | | |
| | | | | | |
| | | | | | |
| | | | | | |
| | | | | | |
| | | | | | |
| | | | | | |
| | | | | | |
| | | | | | |
| | | | | | |
Consumer staples distribution & retail: 2.00% | | | | | | |
| | | | | | |
| | | | | | |
| | | | | | |
| | | | | | |
| | | | | | |
Archer-Daniels-Midland Co.# | | | | | | |
| | | | | | |
| | | | | | |
| | | | | | |
| | | | | | |
| | | | | | |
| | | | | | |
Household products: 5.45% | | | | | | |
Church & Dwight Co., Inc.# | | | | | | |
| | | | | | |
| | | | | | |
| | | | | | |
| | | | | | |
| | | | | | |
Personal care products: 0.38% | | | | | | |
| | | | | | |
| | | | | | |
Energy equipment & services: 0.05% | | | | | | |
| | | | | | |
Oil, gas & consumable fuels: 3.36% | | | | | | |
| | | | | | |
| | | | | | |
| | | | | | |
Excelerate Energy, Inc. Class A# | | | | | | |
| | | | | | |
| | | | | | |
Marathon Petroleum Corp.# | | | | | | |
The accompanying notes are an integral part of these financial statements.
Allspring U.S. Long/Short Equity Fund | 9
Portfolio of investments—April 30, 2024 (unaudited)
| | | | | |
Oil, gas & consumable fuels(continued) | | | | | | |
| | | | | | |
| | | | | | |
| | | | | | |
| | | | | | |
| | | | | | |
| | | | | | |
Bank of NT Butterfield & Son Ltd.# | | | | | | |
First Citizens BancShares, Inc. Class A# | | | | | | |
| | | | | | |
| | | | | | |
| | | | | | |
Ameriprise Financial, Inc.# | | | | | | |
Cboe Global Markets, Inc.# | | | | | | |
| | | | | | |
Virtu Financial, Inc. Class A# | | | | | | |
| | | | | | |
| | | | | | |
| | | | | | |
| | | | | | |
Financial services: 3.03% | | | | | | |
Apollo Global Management, Inc.# | | | | | | |
Berkshire Hathaway, Inc. Class B†# | | | | | | |
| | | | | | |
Equitable Holdings, Inc.# | | | | | | |
Jack Henry & Associates, Inc.# | | | | | | |
| | | | | | |
| | | | | | |
| | | | | | |
| | | | | | |
| | | | | | |
Arch Capital Group Ltd.†# | | | | | | |
Hartford Financial Services Group, Inc.# | | | | | | |
James River Group Holdings Ltd.# | | | | | | |
Kinsale Capital Group, Inc.# | | | | | | |
| | | | | | |
Reinsurance Group of America, Inc.# | | | | | | |
| | | | | | |
Universal Insurance Holdings, Inc.# | | | | | | |
| | | | | | |
White Mountains Insurance Group Ltd.# | | | | | | |
Willis Towers Watson PLC# | | | | | | |
| | | | | | |
The accompanying notes are an integral part of these financial statements.
10 | Allspring U.S. Long/Short Equity Fund
Portfolio of investments—April 30, 2024 (unaudited)
| | | | | |
Mortgage real estate investment trusts (REITs): 0.24% | | | | | | |
| | | | | | |
| | | | | | |
| | | | | | |
ACADIA Pharmaceuticals, Inc.†# | | | | | | |
| | | | | | |
Catalyst Pharmaceuticals, Inc.†# | | | | | | |
| | | | | | |
| | | | | | |
Neurocrine Biosciences, Inc.†# | | | | | | |
Vertex Pharmaceuticals, Inc.†# | | | | | | |
| | | | | | |
Health care equipment & supplies: 0.43% | | | | | | |
GE HealthCare Technologies, Inc.# | | | | | | |
| | | | | | |
| | | | | | |
Tactile Systems Technology, Inc.†# | | | | | | |
| | | | | | |
| | | | | | |
Health care providers & services: 4.69% | | | | | | |
| | | | | | |
| | | | | | |
| | | | | | |
| | | | | | |
| | | | | | |
| | | | | | |
| | | | | | |
Molina Healthcare, Inc.†# | | | | | | |
Universal Health Services, Inc. Class B# | | | | | | |
| | | | | | |
Life sciences tools & services: 1.10% | | | | | | |
| | | | | | |
| | | | | | |
Amphastar Pharmaceuticals, Inc.†# | | | | | | |
Amylyx Pharmaceuticals, Inc.†# | | | | | | |
Bristol-Myers Squibb Co.# | | | | | | |
| | | | | | |
| | | | | | |
| | | | | | |
Phibro Animal Health Corp. Class A# | | | | | | |
Royalty Pharma PLC Class A# | | | | | | |
| | | | | | |
| | | | | | |
The accompanying notes are an integral part of these financial statements.
Allspring U.S. Long/Short Equity Fund | 11
Portfolio of investments—April 30, 2024 (unaudited)
| | | | | |
| | | | | | |
Aerospace & defense: 1.21% | | | | | | |
| | | | | | |
| | | | | | |
Huntington Ingalls Industries, Inc.# | | | | | | |
| | | | | | |
| | | | | | |
| | | | | | |
Builders FirstSource, Inc.†# | | | | | | |
| | | | | | |
| | | | | | |
Construction & engineering: 2.38% | | | | | | |
| | | | | | |
| | | | | | |
| | | | | | |
| | | | | | |
Electrical equipment: 0.48% | | | | | | |
| | | | | | |
| | | | | | |
| | | | | | |
| | | | | | |
| | | | | | |
Allison Transmission Holdings, Inc.# | | | | | | |
| | | | | | |
| | | | | | |
Hyster-Yale Materials Handling, Inc.# | | | | | | |
| | | | | | |
| | | | | | |
| | | | | | |
Professional services: 2.22% | | | | | | |
Booz Allen Hamilton Holding Corp.# | | | | | | |
CACI International, Inc. Class A†# | | | | | | |
| | | | | | |
| | | | | | |
| | | | | | |
Science Applications International Corp.# | | | | | | |
| | | | | | |
Trading companies & distributors: 1.60% | | | | | | |
Core & Main, Inc. Class A†# | | | | | | |
WESCO International, Inc.# | | | | | | |
| | | | | | |
| | | | | | |
The accompanying notes are an integral part of these financial statements.
12 | Allspring U.S. Long/Short Equity Fund
Portfolio of investments—April 30, 2024 (unaudited)
| | | | | |
Information technology: 25.83% | | | | | | |
Communications equipment: 1.80% | | | | | | |
| | | | | | |
Motorola Solutions, Inc.# | | | | | | |
| | | | | | |
Electronic equipment, instruments & components: 1.40% | | | | | | |
Arrow Electronics, Inc.†# | | | | | | |
| | | | | | |
| | | | | | |
| | | | | | |
| | | | | | |
| | | | | | |
| | | | | | |
| | | | | | |
| | | | | | |
Cognizant Technology Solutions Corp. Class A# | | | | | | |
| | | | | | |
| | | | | | |
| | | | | | |
| | | | | | |
Semiconductors & semiconductor equipment: 8.75% | | | | | | |
Allegro MicroSystems, Inc.†# | | | | | | |
| | | | | | |
| | | | | | |
| | | | | | |
Credo Technology Group Holding Ltd.†# | | | | | | |
| | | | | | |
| | | | | | |
Microchip Technology, Inc.# | | | | | | |
Monolithic Power Systems, Inc.# | | | | | | |
| | | | | | |
| | | | | | |
| | | | | | |
| | | | | | |
| | | | | | |
| | | | | | |
Skyworks Solutions, Inc.# | | | | | | |
SMART Global Holdings, Inc.†# | | | | | | |
| | | | | | |
| | | | | | |
| | | | | | |
Cadence Design Systems, Inc.†# | | | | | | |
| | | | | | |
| | | | | | |
| | | | | | |
| | | | | | |
The accompanying notes are an integral part of these financial statements.
Allspring U.S. Long/Short Equity Fund | 13
Portfolio of investments—April 30, 2024 (unaudited)
| | | | | |
| | | | | | |
| | | | | | |
Palantir Technologies, Inc. Class A†# | | | | | | |
| | | | | | |
| | | | | | |
| | | | | | |
Smartsheet, Inc. Class A†# | | | | | | |
| | | | | | |
| | | | | | |
| | | | | | |
| | | | | | |
Technology hardware, storage & peripherals: 3.17% | | | | | | |
| | | | | | |
Hewlett Packard Enterprise Co.# | | | | | | |
| | | | | | |
| | | | | | |
Pure Storage, Inc. Class A†# | | | | | | |
Super Micro Computer, Inc.†# | | | | | | |
| | | | | | |
| | | | | | |
Construction materials: 0.19% | | | | | | |
| | | | | | |
| | | | | | |
Real estate management & development: 0.65% | | | | | | |
CBRE Group, Inc. Class A†# | | | | | | |
| | | | | | |
Jones Lang LaSalle, Inc.†# | | | | | | |
| | | | | | |
| | | | | | |
Residential REITs : 0.62% | | | | | | |
Apartment Income REIT Corp.# | | | | | | |
Specialized REITs : 0.57% | | | | | | |
| | | | | | |
| | | | | | |
| | | | | | |
| | | | | | |
Electric utilities: 1.67% | | | | | | |
Genie Energy Ltd. Class B# | | | | | | |
| | | | | | |
| | | | | | |
| | | | | | |
| | | | | | |
| | | | | | |
The accompanying notes are an integral part of these financial statements.
14 | Allspring U.S. Long/Short Equity Fund
Portfolio of investments—April 30, 2024 (unaudited)
| | | | | |
Independent power and renewable electricity producers: 0.05% | | | | | | |
| | | | | | |
Total common stocks (Cost $20,542,185) | | | | | | |
| | | | | |
Short-term investments: 12.13% | | | | | | |
Investment companies: 12.13% | | | | | | |
Allspring Government Money Market Fund Select Class♠∞ | | | | | | |
Total short-term investments (Cost $2,815,349) | | | | | | |
Total investments in securities (Cost $23,357,534) | | | | | | |
| | | | | |
Securities sold short: (27.95)% | | | | | | |
| | | | | | |
Communication services: (1.28)% | | | | | | |
Diversified telecommunication services: (0.08)% | | | | | | |
| | | | | | |
| | | | | | |
AMC Entertainment Holdings, Inc. Class A | | | | | | |
| | | | | | |
| | | | | | |
| | | | | | |
Interactive media & services: (0.27)% | | | | | | |
| | | | | | |
ZoomInfo Technologies, Inc. | | | | | | |
| | | | | | |
| | | | | | |
| | | | | | |
Consumer discretionary: (7.68)% | | | | | | |
Automobile components: (0.69)% | | | | | | |
| | | | | | |
| | | | | | |
| | | | | | |
Rivian Automotive, Inc. Class A | | | | | | |
| | | | | | |
Hotels, restaurants & leisure: (1.46)% | | | | | | |
| | | | | | |
Caesars Entertainment, Inc. | | | | | | |
| | | | | | |
| | | | | | |
| | | | | | |
The accompanying notes are an integral part of these financial statements.
Allspring U.S. Long/Short Equity Fund | 15
Portfolio of investments—April 30, 2024 (unaudited)
| | | | | |
Hotels, restaurants & leisure(continued) | | | | | | |
Planet Fitness, Inc. Class A | | | | | | |
Red Robin Gourmet Burgers, Inc. | | | | | | |
| | | | | | |
Household durables: (1.65)% | | | | | | |
| | | | | | |
| | | | | | |
| | | | | | |
| | | | | | |
| | | | | | |
| | | | | | |
| | | | | | |
Leisure products: (1.09)% | | | | | | |
| | | | | | |
| | | | | | |
| | | | | | |
Peloton Interactive, Inc. Class A | | | | | | |
| | | | | | |
Specialty retail: (1.43)% | | | | | | |
| | | | | | |
| | | | | | |
| | | | | | |
| | | | | | |
| | | | | | |
Textiles, apparel & luxury goods: (0.77)% | | | | | | |
| | | | | | |
| | | | | | |
| | | | | | |
| | | | | | |
Consumer staples: (0.37)% | | | | | | |
Consumer staples distribution & retail : (0.10)% | | | | | | |
Walgreens Boots Alliance, Inc. | | | | | | |
Household products: (0.05)% | | | | | | |
Spectrum Brands Holdings, Inc. | | | | | | |
Personal care products: (0.22)% | | | | | | |
| | | | | | |
| | | | | | |
Energy equipment & services: (0.04)% | | | | | | |
SEACOR Marine Holdings, Inc. | | | | | | |
Oil, gas & consumable fuels: (0.91)% | | | | | | |
| | | | | | |
The accompanying notes are an integral part of these financial statements.
16 | Allspring U.S. Long/Short Equity Fund
Portfolio of investments—April 30, 2024 (unaudited)
| | | | | |
Oil, gas & consumable fuels(continued) | | | | | | |
| | | | | | |
| | | | | | |
| | | | | | |
| | | | | | |
| | | | | | |
PNC Financial Services Group, Inc. | | | | | | |
Prosperity Bancshares, Inc. | | | | | | |
| | | | | | |
| | | | | | |
| | | | | | |
| | | | | | |
Coinbase Global, Inc. Class A | | | | | | |
Consumer finance: (0.13)% | | | | | | |
| | | | | | |
Financial services: (0.42)% | | | | | | |
| | | | | | |
| | | | | | |
F&G Annuities & Life, Inc. | | | | | | |
Mortgage real estate investment trusts (REITs): (0.11)% | | | | | | |
| | | | | | |
| | | | | | |
| | | | | | |
| | | | | | |
Bioxcel Therapeutics, Inc. | | | | | | |
| | | | | | |
| | | | | | |
| | | | | | |
| | | | | | |
| | | | | | |
| | | | | | |
| | | | | | |
| | | | | | |
| | | | | | |
Health care equipment & supplies: (0.48)% | | | | | | |
| | | | | | |
| | | | | | |
| | | | | | |
Tandem Diabetes Care, Inc. | | | | | | |
| | | | | | |
The accompanying notes are an integral part of these financial statements.
Allspring U.S. Long/Short Equity Fund | 17
Portfolio of investments—April 30, 2024 (unaudited)
| | | | | |
Health care providers & services: (0.41)% | | | | | | |
| | | | | | |
| | | | | | |
| | | | | | |
Health care technology: (0.11)% | | | | | | |
| | | | | | |
| | | | | | |
| | | | | | |
| | | | | | |
Aerospace & defense: (1.58)% | | | | | | |
| | | | | | |
| | | | | | |
| | | | | | |
| | | | | | |
| | | | | | |
| | | | | | |
| | | | | | |
Virgin Galactic Holdings, Inc. | | | | | | |
| | | | | | |
Building products: (1.07)% | | | | | | |
| | | | | | |
Commercial services & supplies: (0.15)% | | | | | | |
Performant Financial Corp. | | | | | | |
Electrical equipment: (0.41)% | | | | | | |
| | | | | | |
Ground transportation: (0.18)% | | | | | | |
| | | | | | |
| | | | | | |
| | | | | | |
| | | | | | |
| | | | | | |
Stanley Black & Decker, Inc. | | | | | | |
| | | | | | |
| | | | | | |
Professional services: (0.35)% | | | | | | |
| | | | | | |
| | | | | | |
| | | | | | |
Trading companies & distributors: (0.77)% | | | | | | |
| | | | | | |
The accompanying notes are an integral part of these financial statements.
18 | Allspring U.S. Long/Short Equity Fund
Portfolio of investments—April 30, 2024 (unaudited)
| | | | | |
Information technology: (2.01)% | | | | | | |
Communications equipment: (0.37)% | | | | | | |
| | | | | | |
Electronic equipment, instruments & components: (0.21)% | | | | | | |
| | | | | | |
| | | | | | |
| | | | | | |
| | | | | | |
Semiconductors & semiconductor equipment: (0.76)% | | | | | | |
| | | | | | |
| | | | | | |
| | | | | | |
| | | | | | |
| | | | | | |
| | | | | | |
| | | | | | |
| | | | | | |
SoundHound AI, Inc. Class A | | | | | | |
| | | | | | |
| | | | | | |
| | | | | | |
| | | | | | |
| | | | | | |
| | | | | | |
International Flavors & Fragrances, Inc. | | | | | | |
| | | | | | |
| | | | | | |
PureCycle Technologies, Inc. | | | | | | |
| | | | | | |
Containers & packaging: (0.67)% | | | | | | |
Ardagh Metal Packaging SA | | | | | | |
| | | | | | |
| | | | | | |
| | | | | | |
| | | | | | |
| | | | | | |
| | | | | | |
Health care REITs: (0.33)% | | | | | | |
Medical Properties Trust, Inc. | | | | | | |
Industrial REITs : (0.06)% | | | | | | |
Rexford Industrial Realty, Inc. | | | | | | |
The accompanying notes are an integral part of these financial statements.
Allspring U.S. Long/Short Equity Fund | 19
Portfolio of investments—April 30, 2024 (unaudited)
| | | | | |
Real estate management & development: (0.87)% | | | | | | |
Howard Hughes Holdings, Inc. | | | | | | |
Zillow Group, Inc. Class A | | | | | | |
Zillow Group, Inc. Class C | | | | | | |
| | | | | | |
| | | | | | |
| | | | | | |
| | | | | | |
Independent power and renewable electricity producers: (0.19)% | | | | | | |
| | | | | | |
Brookfield Renewable Corp. Class A | | | | | | |
| | | | | | |
Total common stocks (Cost $(7,076,276)) | | | | | | |
Total securities sold short (proceeds $(7,076,276)) | | | | | | |
Other assets and liabilities, net | | | | | | |
| | | | | | |
| Non-income-earning security |
| All or a portion of this security is segregated as collateral for securities sold short. |
| The issuer of the security is an affiliated person of the Fund as defined in the Investment Company Act of 1940. |
| The rate represents the 7-day annualized yield at period end. |
|
| Real estate investment trust |
Investments in affiliates
An affiliated investment is an investment in which the Fund owns at least 5% of the outstanding voting shares of the issuer or as a result of other relationships, such as the Fund and the issuer having the same investment manager. Transactions with issuers that were affiliates of the Fund at the end of the period were as follows:
| | | | | Net
change in
unrealized
gains
(losses) | | | Income
from
affiliated
securities |
| | | | | | | | |
Allspring Government Money Market Fund Select Class | | | | | | | | |
The accompanying notes are an integral part of these financial statements.
20 | Allspring U.S. Long/Short Equity Fund
Statement of assets and liabilities—April 30, 2024 (unaudited)
Financial statements
Statement of assets and liabilities
| |
Investments in unaffiliated securities, at value (cost $20,542,185) | |
Investments in affiliated securities, at value (cost $2,815,349) | |
Cash deposited with brokers for securities sold short | |
| |
Prepaid expenses and other assets | |
| |
| |
Securities sold short, at value (proceeds $7,076,276) | |
Payable for borrowing on margin loan | |
Payable for interest expense on margin loan | |
Payable for dividends on securities sold short | |
Administration fees payable | |
| |
Distribution fees payable | |
Accrued expenses and other liabilities | |
| |
| |
| |
| |
Total distributable earnings | |
| |
Computation of net asset value and offering price per share | |
| |
Shares outstanding–Class A1 | |
Net asset value per share–Class A | |
Maximum offering price per share – Class A2 | |
| |
Shares outstanding–Class C1 | |
Net asset value per share–Class C | |
| |
Shares outstanding–Class R61 | |
Net asset value per share–Class R6 | |
Net assets–Institutional Class | |
Shares outstanding–Institutional Class1 | |
Net asset value per share–Institutional Class | |
1 The Fund has an unlimited number of authorized shares.
2 Maximum offering price is computed as 100/94.25 of net asset value. On investments of $50,000 or more, the offering price is reduced.
The accompanying notes are an integral part of these financial statements.
Allspring U.S. Long/Short Equity Fund | 21
Statement of operations—six months ended April 30, 2024 (unaudited)
Statement of operations
| |
Dividends (net of foreign withholdings taxes of $113) | |
Interest and rebate income | |
Income from affiliated securities | |
| |
| |
| |
| |
| |
| |
| |
| |
Shareholder servicing fees | |
| |
| |
| |
| |
Custody and accounting fees | |
| |
| |
Shareholder report expenses | |
Trustees’ fees and expenses | |
| |
Dividends on securities sold short | |
| |
| |
Less: Fee waivers and/or expense reimbursements | |
| |
| |
| |
| |
| |
Realized and unrealized gains (losses) on investments | |
Net realized gains (losses) on | |
| |
| |
Net realized gains on investments | |
Net change in unrealized gains (losses) on | |
| |
| |
Net change in unrealized gains (losses) on investments | |
Net realized and unrealized gains (losses) on investments | |
Net increase in net assets resulting from operations | |
The accompanying notes are an integral part of these financial statements.
22 | Allspring U.S. Long/Short Equity Fund
Statement of changes in net assets
Statement of changes in net assets
|
Six months ended
April 30, 2024 (unaudited) | Year ended October 31, 2023 |
| | | | |
| | | | |
Net realized gains (losses) on investments | | | | |
Net change in unrealized gains (losses) on investments | | | | |
Net increase (decrease) in net assets resulting from operations | | | | |
Distributions to shareholders from | | | | |
Net investment income and net realized gains | | | | |
| | | | |
| | | | |
Total distributions to shareholders | | | | |
Capital share transactions | | | | |
Proceeds from shares sold | | | | |
| | | | |
| | | | |
| | | | |
| | | | |
| | | | |
Reinvestment of distributions | | | | |
| | | | |
| | | | |
| | | | |
Payment for shares redeemed | | | | |
| | | | |
| | | | |
| | | | |
Net increase (decrease) in net assets resulting from capital share transactions | | | | |
Total increase in net assets | | | | |
| | | | |
| | | | |
| | | | |
1 After the close of business on December 16, 2022, the Fund acquired the net assets of 361 Domestic Long/Short Equity Fund which became the accounting and performance survivor in the transaction. The information for Class A and Institutional Class for the periods prior to December 16, 2022 is that of 361 Domestic Long/Short Equity Fund Investor Class and Class I shares, respectively.
2 For the period from December 16, 2022 (commencement of class operations) to October 31, 2023
The accompanying notes are an integral part of these financial statements.
Allspring U.S. Long/Short Equity Fund | 23
Statement of cash flows—six months ended April 30, 2024 (unaudited)
Statement of cash flows
Cash flows from operating activities | |
Net increase in net assets resulting from operations | |
Adjustments to reconcile net increase in net assets from operations to net cash used in operating activities | |
Purchases of long-term securities | |
Proceeds from the sales of long-term securities | |
Proceeds from securities sold short | |
Purchases to cover short securities | |
Purchases and sales of short-term securities, net | |
Increase in receivable for dividends | |
Decrease in receivable from manager | |
Decrease in prepaid expenses and other assets | |
Increase in management fee payable | |
Increase in administration fee payable | |
Increase in distribution fees payable | |
Increase in payable for dividends on securities sold short | |
Increase in payable for interest expense on margin loan | |
Increase in accrued expenses and other liabilities | |
Net realized gains on unaffiliated securities | |
Net realized losses on securities sold short | |
Net change in unrealized gains (losses) on unaffiliated securities | |
Net change in unrealized gains (losses) on securities sold short | |
Net cash provided by operating activities | |
Cash flows from financing activities | |
Increase in margin loan borrowings, net | |
Proceeds from shares sold | |
| |
Net cash provided in financing activities | |
| |
| |
| |
| |
Supplemental cash disclosure | |
Cash paid for dividends on securities sold short | |
Cash paid for interest expense | |
The accompanying notes are an integral part of these financial statements.
24 | Allspring U.S. Long/Short Equity Fund
Financial highlights
(For a share outstanding throughout each period)
| Six months ended
April 30, 2024
(unaudited) | |
| | | | | |
Net asset value, beginning of period | | | | | | |
Net investment income (loss) | | | | | | |
Net realized and unrealized gains (losses) on investments | | | | | | |
Total from investment operations | | | | | | |
Distributions to shareholders from | | | | | | |
| | | | | | |
Net asset value, end of period | | | | | | |
| | | | | | |
Ratios to average net assets (annualized) | | | | | | |
| | | | | | |
| | | | | | |
Net investment income (loss)* | | | | | | |
| | | | | | |
| | | | | | |
Net assets, end of period (000s omitted) | | | | | | |
| Ratios include dividends on securities sold short and interest expense as follows: |
Six months ended April 30, 2024 (unaudited) | |
Year ended October 31, 20231 | |
Year ended October 31, 2022 | |
Year ended October 31, 2021 | |
Year ended October 31, 2020 | |
Year ended October 31, 2019 | |
| After the close of business on December 16, 2022, the Fund acquired the net assets of 361 Domestic Long/Short Equity Fund, which became the accounting and performance survivor in the transaction. The information for the periods prior to December 16, 2022 is that of 361 Domestic Long/Short Equity Fund Investor Class. |
| Beginning with the year ended October 31, 2023, the Fund was audited by KPMG LLP. The previous years were audited by another independent registered public accounting firm. |
| Calculated based upon average shares outstanding |
| Total return calculations do not include any sales charges. Returns for periods of less than one year are not annualized. |
The accompanying notes are an integral part of these financial statements.
Allspring U.S. Long/Short Equity Fund | 25
(For a share outstanding throughout each period)
| Six months ended
April 30, 2024
(unaudited) | |
| |
Net asset value, beginning of period | | |
| | |
Net realized and unrealized gains (losses) on investments | | |
Total from investment operations | | |
Net asset value, end of period | | |
| | |
Ratios to average net assets (annualized) | | |
| | |
| | |
| | |
| | |
| | |
Net assets, end of period (000s omitted) | | |
| Ratios include dividends on securities sold short and interest expense as follows: |
Six months ended April 30, 2024 (unaudited) | |
Year ended October 31, 20231 | |
| For the period from December 16, 2022 (commencement of class operations) to October 31, 2023 |
| Calculated based upon average shares outstanding |
| Amount is more than $(0.005). |
| Returns for periods of less than one year are not annualized. |
The accompanying notes are an integral part of these financial statements.
26 | Allspring U.S. Long/Short Equity Fund
(For a share outstanding throughout each period)
| Six months ended
April 30, 2024
(unaudited) | |
| |
Net asset value, beginning of period | | |
| | |
Net realized and unrealized gains (losses) on investments | | |
Total from investment operations | | |
Net asset value, end of period | | |
| | |
Ratios to average net assets (annualized) | | |
| | |
| | |
| | |
| | |
| | |
Net assets, end of period (000s omitted) | | |
| Ratios include dividends on securities sold short and interest expense as follows: |
Six months ended April 30, 2024 (unaudited) | |
Year ended October 31, 20231 | |
| For the period from December 16, 2022 (commencement of class operations) to October 31, 2023 |
| Calculated based upon average shares outstanding |
| Returns for periods of less than one year are not annualized. |
The accompanying notes are an integral part of these financial statements.
Allspring U.S. Long/Short Equity Fund | 27
(For a share outstanding throughout each period)
| Six months ended
April 30, 2024
(unaudited) | |
| | | | | |
Net asset value, beginning of period | | | | | | |
Net investment income (loss) | | | | | | |
Net realized and unrealized gains (losses) on investments | | | | | | |
Total from investment operations | | | | | | |
Distributions to shareholders from | | | | | | |
| | | | | | |
| | | | | | |
Total distributions to shareholders | | | | | | |
Net asset value, end of period | | | | | | |
| | | | | | |
Ratios to average net assets (annualized) | | | | | | |
| | | | | | |
| | | | | | |
Net investment income (loss)* | | | | | | |
| | | | | | |
| | | | | | |
Net assets, end of period (000s omitted) | | | | | | |
| Ratios include dividends on securities sold short and interest expense as follows: |
Six months ended April 30, 2024 (unaudited) | |
Year ended October 31, 20231 | |
Year ended October 31, 2022 | |
Year ended October 31, 2021 | |
Year ended October 31, 2020 | |
Year ended October 31, 2019 | |
| After the close of business on December 16, 2022, the Fund acquired the net assets of 361 Domestic Long/Short Equity Fund, which became the accounting and performance survivor in the transaction. The information for the periods prior to December 16, 2022 is that of 361 Domestic Long/Short Equity Fund Class I. |
| Beginning with the year ended October 31, 2023, the Fund was audited by KPMG LLP. The previous years were audited by another independent registered public accounting firm. |
| Calculated based upon average shares outstanding |
| Amount is less than $0.005. |
| Returns for periods of less than one year are not annualized. |
The accompanying notes are an integral part of these financial statements.
28 | Allspring U.S. Long/Short Equity Fund
Notes to financial statements (unaudited)
Notes to financial statements
Allspring Funds Trust (the “Trust”), a Delaware statutory trust organized on March 10, 1999, is an open-end management investment company registered under the Investment Company Act of 1940, as amended (the “1940 Act”). As an investment company, the Trust follows the accounting and reporting guidance in Financial Accounting Standards Board (“FASB”) Accounting Standards Codification Topic 946, Financial Services – Investment Companies. These financial statements report on the Allspring U.S. Long/Short Equity Fund (the “Fund”) which is a diversified series of the Trust.
After the close of business on December 16, 2022, the net assets of 361 Domestic Long/Short Equity Fund (the “Predecessor Fund”) were acquired by the Fund, which was created to receive the net assets of the Predecessor Fund, in an exchange for shares of the Fund. Investor Class and Class I shares of the Predecessor Fund received Class A and Institutional Class shares, respectively, of the Fund in the transaction. Since the Predecessor Fund contributed all of the net assets and shareholders to the newly created Allspring fund, the accounting and performance history of the Predecessor Fund has been carried forward in the financial statements contained herein.
2.
SIGNIFICANT ACCOUNTING POLICIES
The following significant accounting policies, which are consistently followed in the preparation of the financial statements of the Fund, are in conformity with U.S. generally accepted accounting principles which require management to make estimates and assumptions that affect the reported amounts of assets and liabilities, disclosure of contingent assets and liabilities at the date of the financial statements, and the reported amounts of income and expenses during the reporting period. Actual results could differ from those estimates.
All investments are valued each business day as of the close of regular trading on the New York Stock Exchange (generally 4 p.m. Eastern Time), although the Fund may deviate from this calculation time under unusual or unexpected circumstances.
Equity securities and exchange-traded funds that are listed on a foreign or domestic exchange or market are valued at the official closing price or, if none, the last sales price.
Investments in registered open-end investment companies (other than those listed on a foreign or domestic exchange or market) are valued at net asset value.
Investments which are not valued using the methods discussed above are valued at their fair value, as determined in good faith by Allspring Funds Management, LLC (“Allspring Funds Management”), which was named the valuation designee by the Board of Trustees. As the valuation designee, Allspring Funds Management is responsible for day-to-day valuation activities for the Allspring Funds. In connection with these responsibilities, Allspring Funds Management has established a Valuation Committee and has delegated to it the authority to take any actions regarding the valuation of portfolio securities that the Valuation Committee deems necessary or appropriate, including determining the fair value of portfolio securities. On a quarterly basis, the Board of Trustees receives reports of valuation actions taken by the Valuation Committee. On at least an annual basis, the Board of Trustees receives an assessment of the adequacy and effectiveness of Allspring Funds Management’s process for determining the fair value of the portfolio of investments.
The Fund may sell a security it does not own in anticipation of a decline in the market value of that security (short sale). When the Fund makes a short sale, it must borrow the security sold short and deliver it to the buyer. The Fund is then obligated to replace the security borrowed by purchasing the security at the market price at the time of replacement.
The Fund records the proceeds as a liability which is marked-to-market daily based upon quotations from an independent pricing service or an independent broker-dealer and any change in value is recorded as an unrealized gain or loss. Any interest or dividends accrued on such borrowed securities during the period of the loan are recorded as an expense on the Statement of Operations. To borrow the security, the Fund may be required to pay a premium, which would decrease the proceeds of the security sold. A gain, limited to the price at which the Fund sold the security short, or a loss, unlimited in size, will be recognized upon the closing of a short sale if the market price at the closing is less than or greater than, respectively, the proceeds originally received. Until the short sale is closed or the borrowed security is replaced, the Fund maintains a segregated account of cash or liquid securities, the dollar value of which is at least equal to the market value of the security at the time of the short sale.
Security transactions and income recognition
Securities transactions are recorded on a trade date basis. Realized gains or losses are recorded on the basis of identified cost.
Dividend income is recognized on the ex-dividend date. Dividend income is recorded net of foreign taxes withheld where recovery of such taxes is not assured.
Interest earned on cash balances held at the custodian is recorded as interest income.
Distributions received from REIT investments may be characterized as ordinary income, capital gains, or a return of capital to the Fund based on information provided by the REIT. The proper characterization of REIT distributions is generally not known until after the end of each calendar year. As such, estimates may be used in reporting the character of income and distributions for financial statement purposes.
Allspring U.S. Long/Short Equity Fund | 29
Notes to financial statements (unaudited)
Distributions to shareholders
Distributions to shareholders from net investment income and any net realized gains are recorded on the ex-dividend date and paid at least annually. Such distributions are determined in accordance with income tax regulations and may differ from U.S. generally accepted accounting principles. Dividend sources are estimated at the time of declaration. The tax character of distributions is determined as of the Fund’s fiscal year end. Therefore, a portion of the Fund’s distributions made prior to the Fund’s fiscal year end may be categorized as a tax return of capital at year end.
The Fund intends to continue to qualify as a regulated investment company by distributing substantially all of its investment company taxable income and any net realized capital gains (after reduction for capital loss carryforwards) sufficient to relieve it from all, or substantially all, federal income taxes. Accordingly, no provision for federal income taxes was required.
The Fund’s income and federal excise tax returns and all financial records supporting those returns for the prior three fiscal years are subject to examination by the federal and Delaware revenue authorities. Management has analyzed the Fund’s tax positions taken on federal, state, and foreign tax returns, as applicable, for all open tax years and does not believe that there are any uncertain tax positions that require recognition of a tax liability.
As of April 30, 2024, the aggregate cost of all investments for federal income tax purposes was $16,417,506 and the unrealized gains (losses) consisted of:
As of October 31, 2023, the Fund had capital loss carryforwards which consisted of $831,468 in short-term capital losses and $19,010 in long-term capital losses.
The separate classes of shares offered by the Fund differ principally in applicable sales charges, distribution, shareholder servicing, and administration fees. Class specific expenses are charged directly to that share class. Investment income and expense, common fund-level expenses, and realized and unrealized gains (losses) on investments are allocated daily to each class of shares based on the relative proportion of net assets of each class.
3.
FAIR VALUATION MEASUREMENTS
Fair value measurements of investments are determined within a framework that has established a fair value hierarchy based upon the various data inputs utilized in determining the value of the Fund’s investments. The three-level hierarchy gives the highest priority to unadjusted quoted prices in active markets for identical assets or liabilities (Level 1) and the lowest priority to unobservable inputs (Level 3). The Fund’s investments are classified within the fair value hierarchy based on the lowest level of input that is significant to the fair value measurement. The inputs are summarized into three broad levels as follows:
•Level 1—quoted prices in active markets for identical securities
•Level 2—other significant observable inputs (including quoted prices for similar securities, interest rates, prepayment speeds, credit risk, etc.)
•Level 3—significant unobservable inputs (including the Fund’s own assumptions in determining the fair value of investments)
The inputs or methodologies used for valuing investments in securities are not necessarily an indication of the risk associated with investing in those securities.
30 | Allspring U.S. Long/Short Equity Fund
Notes to financial statements (unaudited)
The following is a summary of the inputs used in valuing the Fund’s assets and liabilities as of April 30, 2024:
| | Other significant
observable inputs
(Level 2) | Significant
unobservable inputs
(Level 3) | |
| | | | |
| | | | |
| | | | |
| | | | |
| | | | |
| | | | |
| | | | |
| | | | |
| | | | |
| | | | |
| | | | |
| | | | |
| | | | |
| | | | |
| | | | |
| | | | |
| | | | |
|
| | | | |
| | | | |
| | | | |
| | | | |
| | | | |
| | | | |
| | | | |
| | | | |
| | | | |
| | | | |
| | | | |
| | | | |
| | | | |
| | | | |
Additional sector, industry or geographic detail, if any, is included in the Portfolio of Investments.
At April 30, 2024, the Fund did not have any transfers into/out of Level 3.
4.
TRANSACTIONS WITH AFFILIATES
Allspring Funds Management, a wholly owned subsidiary of Allspring Global Investments Holdings, LLC, a holding company indirectly owned by certain private funds of GTCR LLC and Reverence Capital Partners, L.P., is the manager of the Fund and provides advisory and fund-level administrative services under an investment management agreement. Under the investment management agreement, Allspring Funds Management is responsible for, among other services, implementing the investment objectives and strategies of the Fund, supervising the subadviser and providing fund-level administrative services in connection with the Fund’s operations. As compensation for its services under the investment management agreement, Allspring Funds Management is entitled to receive a management fee at the following annual rate based on the Fund’s average daily net assets:
For the six months ended April 30, 2024, the management fee was equivalent to an annual rate of 1.10% of the Fund’s average daily net assets.
Allspring U.S. Long/Short Equity Fund | 31
Notes to financial statements (unaudited)
Allspring Funds Management has retained the services of a subadviser to provide daily portfolio management to the Fund. The fee for subadvisory services is borne by Allspring Funds Management. Allspring Global Investments, LLC, an affiliate of Allspring Funds Management and a wholly owned subsidiary of Allspring Global Investments Holdings, LLC, is the subadviser to the Fund and is entitled to receive a fee from Allspring Funds Management at an annual rate starting at 0.715% and declining to 0.550% as the average daily net assets of the Fund increase.
Under a class-level administration agreement, Allspring Funds Management provides class-level administrative services to the Fund, which includes paying fees and expenses for services provided by the transfer agent, sub-transfer agents, omnibus account servicers and record-keepers. As compensation for its services under the class-level administration agreement, Allspring Funds Management receives an annual fee which is calculated based on the average daily net assets of each class as follows:
| Class-level
administration fee |
| |
| |
| |
| |
Waivers and/or expense reimbursements
Allspring Funds Management has contractually committed to waive and/or reimburse management and administration fees to the extent necessary to maintain certain net operating expense ratios for the Fund. When each class of the Fund has exceeded its expense cap, Allspring Funds Management will waive fees and/or reimburse expenses from fund-level expenses on a proportionate basis and then from class specific expenses. When only certain classes exceed their expense caps, waivers and/or reimbursements are applied against class specific expenses before fund-level expenses. Allspring Funds Management has contractually committed through February 28, 2025 to waive fees and/or reimburse expenses to the extent necessary to cap the Fund’s expenses. Prior to or after the commitment expiration date, the cap may be increased or the commitment to maintain the cap may be terminated only with the approval of the Board of Trustees. As of April 30, 2024, excluding expenses from dividends on securities sold short and interest expense, the contractual caps are as follows:
The Trust has adopted a distribution plan for Class C shares pursuant to Rule 12b-1 under the 1940 Act. A distribution fee is charged to Class C shares and paid to Allspring Funds Distributor, LLC (“Allspring Funds Distributor”), the principal underwriter, an affiliate of Allspring Funds Management, at an annual rate up to 0.75% of the average daily net assets of Class C shares.
In addition, Allspring Funds Distributor is entitled to receive the front-end sales charge from the purchase of Class A shares and a contingent deferred sales charge on the redemption of certain Class A shares. Allspring Funds Distributor is also entitled to receive the contingent deferred sales charges from redemptions of Class C shares. Allspring Funds Distributor did not receive any front-end or contingent deferred sales charges from Class A or Class C shares for the six months ended April 30, 2024.
Shareholder servicing fees
The Trust has entered into contracts with one or more shareholder servicing agents, whereby Class A and Class C are charged a fee at an annual rate up to 0.25% of the average daily net assets of each respective class. A portion of these total shareholder servicing fees were paid to affiliates of the Fund.
The Fund may purchase or sell portfolio investment securities to certain affiliates pursuant to Rule 17a-7 under the 1940 Act and under procedures adopted by the Board of Trustees. The procedures have been designed to ensure that these interfund transactions, which do not incur broker commissions, are effected at current market prices. Pursuant to these procedures, the Fund did not have any interfund transactions during the six months ended April 30, 2024.
5.
INVESTMENT PORTFOLIO TRANSACTIONS
Purchases and sales of investments, excluding U.S. government obligations (if any) and short-term securities, for the six months ended April 30, 2024 were $32,851,285 and $35,046,382, respectively.
32 | Allspring U.S. Long/Short Equity Fund
Notes to financial statements (unaudited)
The Trust (excluding the money market funds), Allspring Master Trust and Allspring Variable Trust are parties to a $350,000,000 revolving credit agreement whereby the Fund is permitted to use bank borrowings for temporary or emergency purposes, such as to fund shareholder redemption requests. Interest under the credit agreement is charged to the Fund based on borrowing rate equal to the higher of the Federal Funds rate or the overnight bank funding rate in effect on that day plus a spread. In addition, an annual commitment fee based on the unused balance is allocated to each participating fund. For the six months ended April 30, 2024, there were no borrowings by the Fund under this agreement.
In an agreement with a prime broker, the Fund purchased or borrowed securities on margin and was charged interest based on a borrowing rate equal to the Federal Funds rate plus a spread. During the six months ended April 30, 2024, the Fund had average borrowings outstanding of $2,112,331 at a rate of 6.18% and recorded interest in the amount of $64,928, which represents 0.57% of its average daily net assets.
Under the Fund’s organizational documents, the officers and Trustees have been granted certain indemnification rights against certain liabilities that may arise out of performance of their duties to the Fund. The Fund has entered into a separate agreement with each Trustee that converts indemnification rights currently existing under the Fund’s organizational documents into contractual rights that cannot be changed in the future without the consent of the Trustee. Additionally, in the normal course of business, the Fund may enter into contracts with service providers that contain a variety of indemnification clauses. The Fund’s maximum exposure under these arrangements is dependent on future claims that may be made against the Fund and, therefore, cannot be estimated.
At the meeting held on May 28-30, 2024, the Board of Trustees of the Fund approved the Fund’s liquidation. The Fund closed to new investors and to additional investments from existing shareholders with certain exceptions on June 3, 2024. The liquidation of the Fund is expected to occur after close of business on or about July 26, 2024.
Allspring U.S. Long/Short Equity Fund | 33
Other information (unaudited)
Other information
A description of the policies and procedures used to determine how to vote proxies relating to portfolio securities is available without charge, upon request, by calling 1-866-259-3305, visiting our website at allspringglobal.com, or visiting the SEC website at sec.gov. Information regarding how the proxies related to portfolio securities were voted during the most recent 12-month period ended June 30 is available on the website at allspringglobal.com or by visiting the SEC website at sec.gov.
Quarterly portfolio holdings information
The Fund files its complete schedule of portfolio holdings with the SEC for the first and third quarters of each fiscal year as an exhibit to its reports on Form N-PORT. Shareholders may view the filed Form N-PORT by visiting the SEC website at sec.gov.
34 | Allspring U.S. Long/Short Equity Fund
Other information (unaudited)
Board of trustees and officers
Each of the Trustees and Officers listed in the table below acts in identical capacities for each fund in the Allspring family of funds, which consists of 99 mutual funds comprising the Allspring Funds Trust, Allspring Variable Trust, Allspring Master Trust and four closed-end funds (collectively the “Fund Complex”). This table should be read in conjunction with the Prospectus and the Statement of Additional Information*. The mailing address of each Trustee and Officer is 1415 Vantage Park Drive, 3rd Floor, Charlotte, NC 28203. Each Trustee and Officer serves an indefinite term, however, each Trustee serves such term until reaching the mandatory retirement age established by the Trustees.
| Position held and
length of | Principal occupations during past five years or longer | Current other
public company or
investment
company
directorships |
William R. Ebsworth
(Born 1957) | | Retired. From 1984 to 2013, equities analyst, portfolio manager, research director and chief investment officer at Fidelity Management and Research Company in Boston, Tokyo, and Hong Kong, and retired in 2013 as Chief Investment Officer of Fidelity Strategic Advisers, Inc. where he led a team of investment professionals managing client assets. Prior thereto, Board member of Hong Kong Securities Clearing Co., Hong Kong Options Clearing Corp., the Thailand International Fund, Ltd., Fidelity Investments Life Insurance Company, and Empire Fidelity Investments Life Insurance Company. Serves on the Investment Company Institute’s Board of Governors since 2022 and Executive Committee since 2023 as well as the Vice Chairman of the Governing Council of the Independent Directors Council since 2023. Audit Committee Chair and Investment Committee Chair of the Vincent Memorial Hospital Foundation (non-profit organization). Mr. Ebsworth is a CFA charterholder. | |
Jane A. Freeman
(Born 1953) | Trustee,
since 2015;
Chair Liaison,
| Retired. From 2012 to 2014 and 1999 to 2008, Chief Financial Officer of Scientific Learning Corporation. From 2008 to 2012, Ms. Freeman provided consulting services related to strategic business projects. Prior to 1999, Portfolio Manager at Rockefeller & Co. and Scudder, Stevens & Clark. Board member of the Harding Loevner Funds from 1996 to 2014, serving as both Lead Independent Director and chair of the Audit Committee. Board member of the Russell Exchange Traded Funds Trust from 2011 to 2012 and the chair of the Audit Committee. Ms. Freeman is also an inactive Chartered Financial Analyst. | |
Isaiah Harris, Jr.
(Born 1952) | Trustee,
since 2009;
Audit Committee Chair,
since 2019 | Retired. Member of the Advisory Board of CEF of East Central Florida. Chairman of the Board of CIGNA Corporation from 2009 to 2021, and Director from 2005 to 2008. From 2003 to 2011, Director of Deluxe Corporation. Prior thereto, President and CEO of BellSouth Advertising and Publishing Corp. from 2005 to 2007, President and CEO of BellSouth Enterprises from 2004 to 2005 and President of BellSouth Consumer Services from 2000 to 2003. Emeritus member of the Iowa State University Foundation Board of Governors. Emeritus Member of the Advisory board of Iowa State University School of Business. Advisory Board Member, Palm Harbor Academy (private school). Advisory Board Member, Fellowship of Christian Athletes. Mr. Harris is a certified public accountant (inactive status). | |
David F. Larcker
(Born 1950) | | Distinguished Visiting Fellow at the Hoover Institution since 2022. James Irvin Miller Professor of Accounting at the Graduate School of Business (Emeritus), Stanford University, Director of the Corporate Governance Research Initiative and Senior Faculty of The Rock Center for Corporate Governance since 2006. From 2005 to 2008, Professor of Accounting at the Graduate School of Business, Stanford University. Prior thereto, Ernst & Young Professor of Accounting at The Wharton School, University of Pennsylvania from 1985 to 2005. | |
Olivia S. Mitchell
(Born 1953) | | International Foundation of Employee Benefit Plans Professor since 1993, Wharton School of the University of Pennsylvania. Director of Wharton’s Pension Research Council and Boettner Center on Pensions & Retirement Research, and Research Associate at the National Bureau of Economic Research. Previously taught at Cornell University from 1978 to 1993. | |
Timothy J. Penny
(Born 1951) | Trustee,
since 1996;
Chair,
since 2018 | President and Chief Executive Officer of Southern Minnesota Initiative Foundation, a non-profit organization, since 2007. Vice Chair of the Economic Club of Minnesota, since 2007. Co-Chair of the Committee for a Responsible Federal Budget, since 1995. Member of the Board of Trustees of NorthStar Education Finance, Inc., a non-profit organization, from 2007-2022. Senior Fellow of the University of Minnesota Humphrey Institute from 1995 to 2017. | |
** Length of service dates reflect the Trustee’s commencement of service with the Trust’s predecessor entities, where applicable.
*** Ms. Freeman will serve as Chair Liaison through June 2024, at which time Ms. Wheelock will assume the role.
*
The Statement of Additional Information includes additional information about the Trustees and is available, without charge, upon request, by calling 1-800-222-8222 or by visiting the website at allspringglobal.com.
Allspring U.S. Long/Short Equity Fund | 35
Other information (unaudited)
| Position held and length of service** | Principal occupations during past five years or longer | Current other public company or investment company directorships |
James G. Polisson
(Born 1959) | Trustee,
since 2018;
Nominating and Governance Committee Chair,
since 2024 | Retired. Chief Marketing Officer, Source (ETF) UK Services, Ltd, from 2015 to 2017. From 2012 to 2015, Principal of The Polisson Group, LLC, a management consulting, corporate advisory and principal investing company. Chief Executive Officer and Managing Director at Russell Investments, Global Exchange Traded Funds from 2010 to 2012. Managing Director of Barclays Global Investors from 1998 to 2010 and Global Chief Marketing Officer for iShares and Barclays Global Investors from 2000 to 2010. Trustee of the San Francisco Mechanics’ Institute, a non- profit organization, from 2013 to 2015. Board member of the Russell Exchange Traded Fund Trust from 2011 to 2012. Director of Barclays Global Investors Holdings Deutschland GmbH from 2006 to 2009. Mr. Polisson is an attorney and has a retired status with the Massachusetts and District of Columbia Bar Associations. | |
Pamela Wheelock
(Born 1959) | Trustee,
since January 2020;
previously Trustee from
January 2018 to
| Retired. Executive and Senior Financial leadership positions in the public, private and nonprofit sectors. Interim President and CEO, McKnight Foundation, 2020. Interim Commissioner, Minnesota Department of Human Services, 2019. Chief Operating Officer, Twin Cities Habitat for Humanity, 2017-2019. Vice President for University Services, University of Minnesota, 2012- 2016. Interim President and CEO, Blue Cross and Blue Shield of Minnesota, 2011-2012. Executive Vice-President and Chief Financial Officer, Minnesota Wild, 2002-2008. Commissioner, Minnesota Department of Finance, 1999-2002. Chair of the Board of Directors of Destination Medical Center Corporation. Board member of the Minnesota Wild Foundation. | |
** Length of service dates reflect the Trustee’s commencement of service with the Trust’s predecessor entities, where applicable.
*** Ms. Freeman will serve as Chair Liaison through June 2024, at which time Ms. Wheelock will assume the role.
36 | Allspring U.S. Long/Short Equity Fund
Other information (unaudited)
Officers1
| Position held and
length of service | Principal occupations during past five years or longer |
| | President and Chief Executive Officer of Allspring Funds Management, LLC since 2017 and Head of Global Fund Governance of Allspring Global Investments since 2022. Prior thereto, co-president of Galliard Capital Management, LLC, an affiliate of Allspring Funds Management, LLC, from 2019 to 2022 and Head of Affiliated Managers, Allspring Global Investments, from 2014 to 2019 and Executive Vice President responsible for marketing, investments and product development for Allspring Funds Management, LLC, from 2009 to 2014. |
Jeremy DePalma
(Born 1974) | Treasurer,
since 2012
(for certain funds in
the Fund Complex);
since 2021 (for
the remaining funds in the Complex) | Senior Vice President of Allspring Funds Management, LLC since 2009. Senior Vice President of Evergreen Investment Management Company, LLC from 2008 to 2010 and head of the Fund Reporting and Control Team within Fund Administration from 2005 to 2010. |
Christopher Baker
(Born 1976) | Chief Compliance Officer,
since 2022 | Global Chief Compliance Officer for Allspring Global Investments since 2022. Prior thereto, Chief Compliance Officer for State Street Global Advisors from 2018 to 2021. Senior Compliance Officer for the State Street divisions of Alternative Investment Solutions, Sector Solutions, and Global Marketing from 2015 to 2018. From 2010 to 2015 Vice President, Global Head of Investment and Marketing Compliance for State Street Global Advisors. |
Matthew Prasse
(Born 1983) | Chief Legal Officer,
since 2022;
Secretary,
since 2021 | Senior Counsel of the Allspring Legal Department since 2021. Senior Counsel of the Wells Fargo Legal Department from 2018 to 2021. Previously, Counsel for Barings LLC from 2015 to 2018. Prior to joining Barings, Associate at Morgan, Lewis & Bockius LLP from 2008 to 2015. |
1 For those Officers with tenures at Allspring Global Investments and/or Allspring Funds Management, LLC that began prior to 2021, such tenures include years of service during which these businesses/entities were known as Wells Fargo Asset Management and Wells Fargo Funds Management, LLC, respectively.
Allspring U.S. Long/Short Equity Fund | 37
For more information
More information about Allspring Funds is available free upon request. To obtain literature, please write, visit the Fund’s website, or call:
Allspring Funds
P.O. Box 219967
Kansas City, MO 64121-9967
Website: allspringglobal.com
Individual investors: 1-800-222-8222
Retail investment professionals: 1-888-877-9275
Institutional investment professionals: 1-800-260-5969
This report and the financial statements contained herein are submitted for the general information of the shareholders of the Fund. If this report is used for promotional purposes, distribution of the report must be accompanied or preceded by a current prospectus. Before investing, please consider the investment objectives, risks, charges, and expenses of the investment. For a current prospectus and, if available, a summary prospectus, containing this information, call 1-800-222-8222 or visit the Fund’s website at allspringglobal.com. Read the prospectus carefully before you invest or send money.
Allspring Global InvestmentsTM is the trade name for the asset management firms of Allspring Global Investments Holdings, LLC, a holding company indirectly owned by certain private funds of GTCR LLC and Reverence Capital Partners, L.P. These firms include but are not limited to Allspring Global Investments, LLC, and Allspring Funds Management, LLC. Certain products managed by Allspring entities are distributed by Allspring Funds Distributor, LLC (a broker-dealer and Member FINRA/SIPC).
This material is for general informational and educational purposes only and is NOT intended to provide investment advice or a recommendation of any kind - including a recommendation for any specific investment, strategy, or plan.
© 2024 Allspring Global Investments Holdings, LLC. All rights reserved.
ALL-05022024-hz1r4yhh 06-24
SAR4341 04-24
ITEM 2. CODE OF ETHICS
Not applicable.
ITEM 3. AUDIT COMMITTEE FINANCIAL EXPERT
Not applicable.
ITEM 4. PRINCIPAL ACCOUNTANT FEES AND SERVICES
Not applicable.
ITEM 5. AUDIT COMMITTEE OF LISTED REGISTRANTS
Not applicable.
ITEM 6. INVESTMENTS
A Portfolio of Investments for the series of Allspring Funds Trust is included as part of the report to shareholders filed under Item 1 of this Form.
ITEM 7. DISCLOSURE OF PROXY VOTING POLICIES AND PROCEDURES FOR CLOSED-END MANAGEMENT INVESTMENT COMPANIES
Not applicable.
ITEM 8. PORTFOLIO MANAGERS OF CLOSED-END MANAGEMENT INVESTMENT COMPANIES
Not applicable.
ITEM 9. PURCHASES OF EQUITY SECURITIES BY CLOSED-END MANAGEMENT INVESTMENT COMPANY AND AFFILIATED PURCHASERS
Not applicable.
ITEM 10. SUBMISSION OF MATTERS TO A VOTE OF SECURITY HOLDERS
There have been no material changes to the procedures by which shareholders may recommend nominees to the registrant’s Board of Trustees that have been implemented since the registrant’s last provided disclosure in response to the requirements of this Item.
ITEM 11. CONTROLS AND PROCEDURES
(a) The President and Treasurer have concluded that the Allspring Funds Trust disclosure controls and procedures (as defined in Rule 30a-3(c) under the Investment Company Act of 1940) provide reasonable assurances that material information relating to the registrant is made known to them by the appropriate persons, based on their evaluation of these controls and procedures as of a date within 90 days of the filing of this report.
3
(b) There were no significant changes in the registrant’s internal control over financial reporting (as defined in Rule 30a-3(d) under the Investment Company Act of 1940) that occurred during the period covered by this report that materially affected, or is reasonably likely to materially affect, the registrant’s internal control over financial reporting.
ITEM 12. DISCLOSURES OF SECURITIES LENDING ACTIVITES FOR CLOSED-END MANAGEMENT INVESTMENT COMPANIES
Not applicable.
ITEM 13. EXHIBITS
(a)(1) Not applicable.
(a)(2) Certifications pursuant to Section 302 of the Sarbanes-Oxley Act of 2002.
(a)(3) Not applicable.
(a)(4) Not applicable.
(b) Certifications pursuant to Section 906 of the Sarbanes-Oxley Act of 2002.
4
SIGNATURES
Pursuant to the requirements of the Securities Exchange Act of 1934 and the Investment Company Act of 1940, the registrant has duly caused this report to be signed on its behalf by the undersigned, thereunto duly authorized.
| | |
| Allspring Funds Trust |
| |
| By: | | /s/ Andrew Owen |
| | Andrew Owen |
| | President |
|
| Date: June 26, 2024 |
Pursuant to the requirements of the Securities Exchange Act of 1934 and the Investment Company Act of 1940, this report has been signed below by the following persons on behalf of the registrant and in the capacities and on the date indicated.
| | |
| Allspring Funds Trust |
| |
| By: | | /s/ Andrew Owen |
| | Andrew Owen |
| | President |
|
| Date: June 26, 2024 |
| |
| By: | | /s/Jeremy DePalma |
| | Jeremy DePalma |
| | Treasurer |
|
Date: June 26, 2024 |
1