
UNITED STATES
SECURITIES AND EXCHANGE COMMISSION
Washington, D.C. 20549
FORM N-CSR
CERTIFIED SHAREHOLDER REPORT OF REGISTERED
MANAGEMENT INVESTMENT COMPANIES
Investment Company Act file number: 811-09253
Allspring Funds Trust
(Exact name of registrant as specified in charter)
1415 Vantage Park Drive, 3rd Floor, Charlotte, NC 28203
(Address of principal executive offices) (Zip code)
Matthew Prasse
Allspring Funds Management, LLC
1415 Vantage Park Drive, 3rd Floor, Charlotte, NC 28203
(Name and address of agent for service)
Registrant’s telephone number, including area code: 800-222-8222
Date of fiscal year end: March 31
Registrant is making a filing for 8 of its series: Allspring Managed Account CoreBuilder® Shares – Series EPI, Allspring Disciplined Small Cap Fund, Allspring Discovery Innovation Fund, Allspring Discovery Small Cap Growth Fund, Allspring Index Fund, Allspring Precious Metals Fund, Allspring Special Small Cap Value Fund and Allspring Utility and Telecommunications Fund
Date of reporting period: March 31, 2024
ITEM 1. REPORT TO STOCKHOLDERS

Notice to Shareholders |
Beginning in July 2024, the Fund will be required by the Securities and Exchange Commission to send shareholders a paper copy of a new tailored shareholder report in place of the full shareholder report that you are now receiving. The tailored shareholder report will contain concise information about the Fund, including certain expense and performance information and fund statistics. If you wish to receive this new tailored shareholder report electronically, please follow the instructions on the back cover of this report. |
Other information that is currently included in the shareholder report, such as the Fund’s financial statements, will be available online and upon request, free of charge, in paper or electronic format. |
Investment objective | The Fund seeks long-term total return, consisting of capital appreciation and current income. |
Manager | Allspring Funds Management, LLC |
Subadviser | Allspring Global Investments, LLC |
Portfolio managers | Petros N. Bocray, CFA, FRM, Neville Javeri, CFA, Megan Miller, CFA |
Average annual total returns (%) as of March 31, 2024 | ||||
Expense ratios1 (%) | ||||
Inception date | Since inception | Gross | Net2 | |
Allspring Managed Account CoreBuilder® Shares - Series EPI (AEPIX) | 6-8-2023 | 16.81 | 0.21 | 0.00 |
S&P 500 Index3 | – | 24.68 * | – | – |
* | Based on the Fund’s inception date. |
1 | Reflects the expense ratios as stated in the most recent prospectus. The expense ratios shown are subject to change and may differ from the annualized expense ratios shown in the Financial Highlights of this report. |
2 | Generally, no ordinary fees or expenses are charged to the Fund. Allspring Funds Management, LLC has contractually committed to irrevocably absorb and pay or reimburse all ordinary operating expenses of the Fund, except portfolio transactions or other investment related costs (e.g., commissions), fees payable for services provided by the Fund’s securities lending agent (if any), interest, taxes, leverage expenses and other expenses not incurred in the ordinary course of the Fund’s business. This commitment has an indefinite term. |
3 | The S&P 500 Index consists of 500 stocks chosen for market size, liquidity, and industry group representation. It is a market-value-weighted index with each stock’s weight in the index proportionate to its market value. You cannot invest directly in an index. |
CFA® and Chartered Financial Analyst® are trademarks owned by CFA Institute. |
Growth of $10,000 investment as of March 31, 20241 |
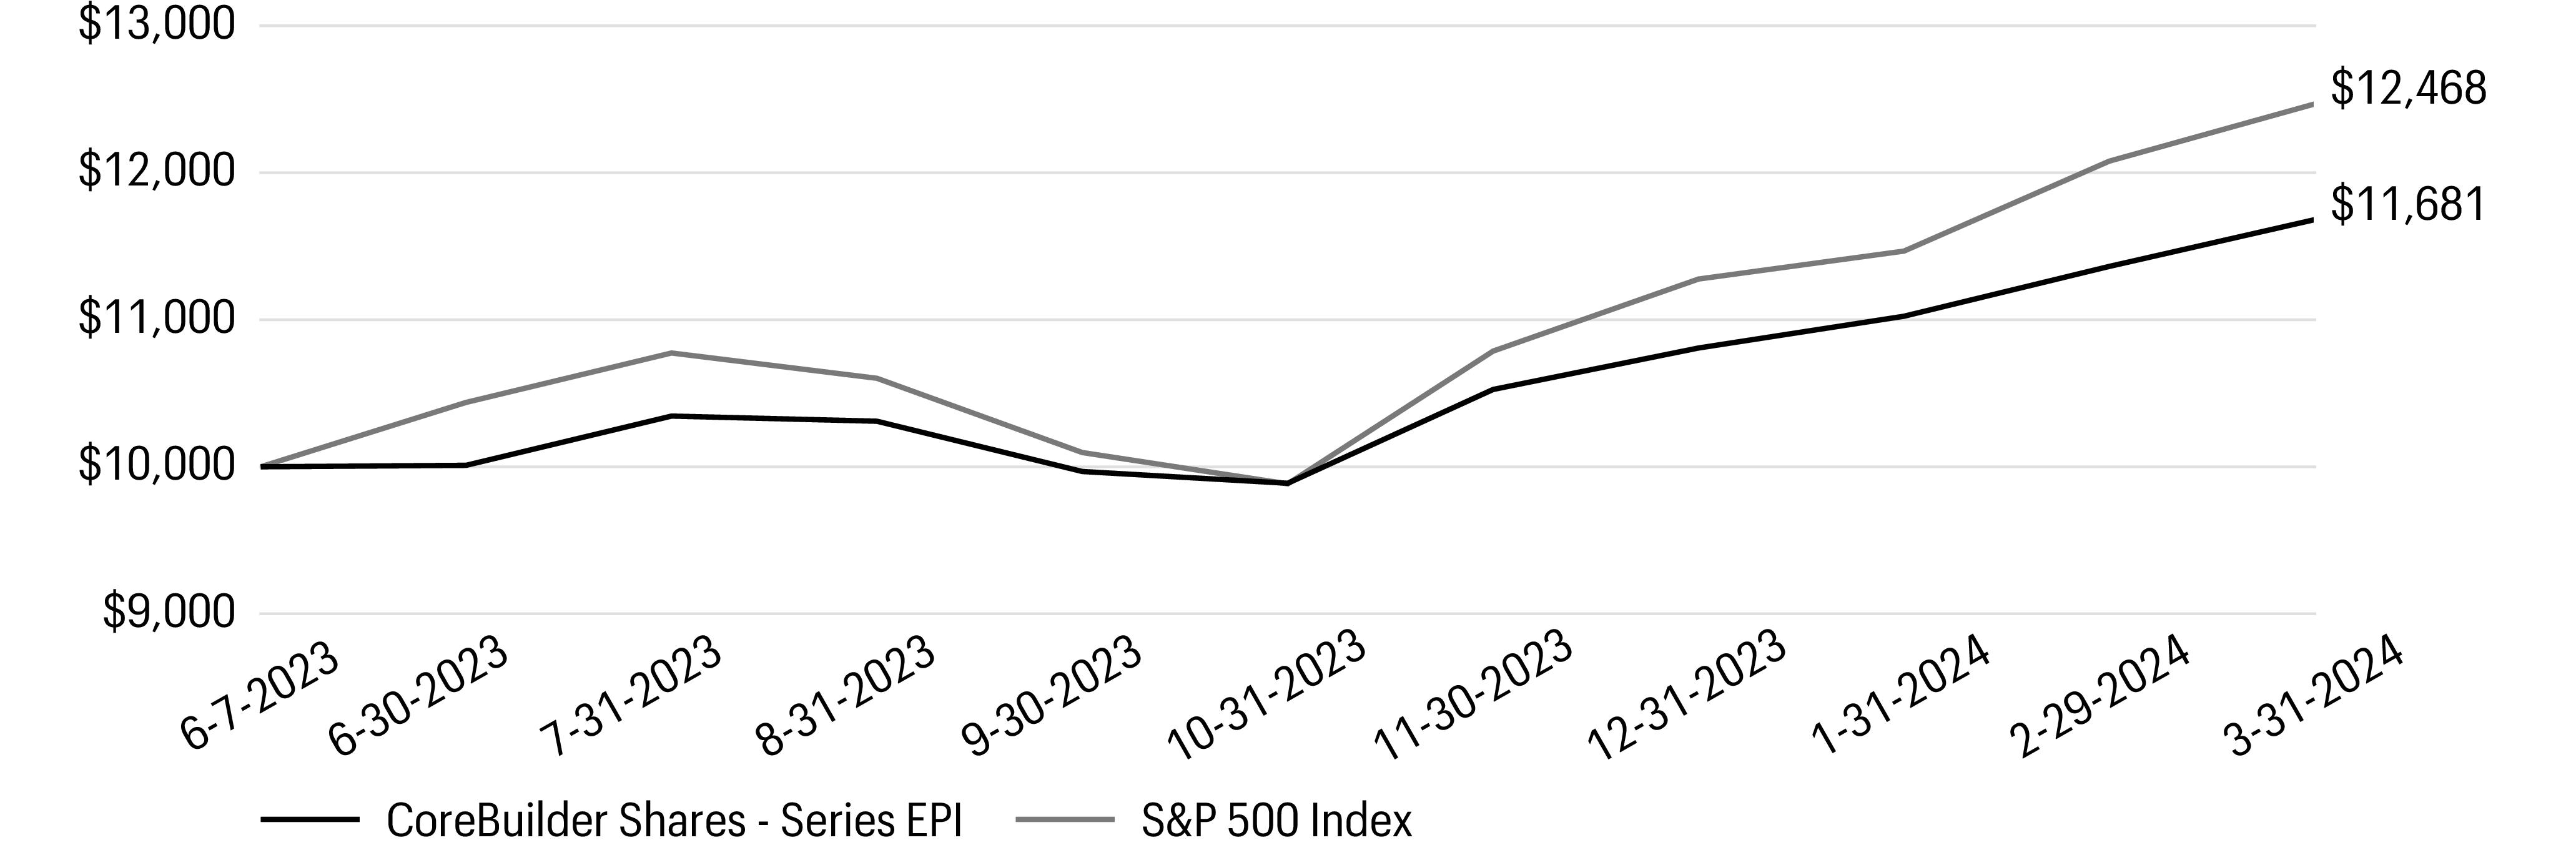
1 | The chart compares the performance of the Fund since June 8, 2023 with the S&P 500 Index. The chart assumes a hypothetical investment of $10,000 investment and reflects all operating expenses of the Fund. |
Ten largest holdings (%) as of March 31, 20241 | |
Microsoft Corp. | 8.90 |
Apple, Inc. | 6.78 |
Alphabet, Inc. Class C | 5.83 |
Meta Platforms, Inc. Class A | 4.43 |
Broadcom, Inc. | 4.06 |
JPMorgan Chase & Co. | 3.11 |
Eli Lilly & Co. | 2.95 |
UnitedHealth Group, Inc. | 2.77 |
Lam Research Corp. | 2.54 |
Suncor Energy, Inc. | 2.51 |
1 | Figures represent the percentage of the Fund’s net assets. Holdings are subject to change and may have changed since the date specified. |
Sector allocation as of March 31, 20241 |
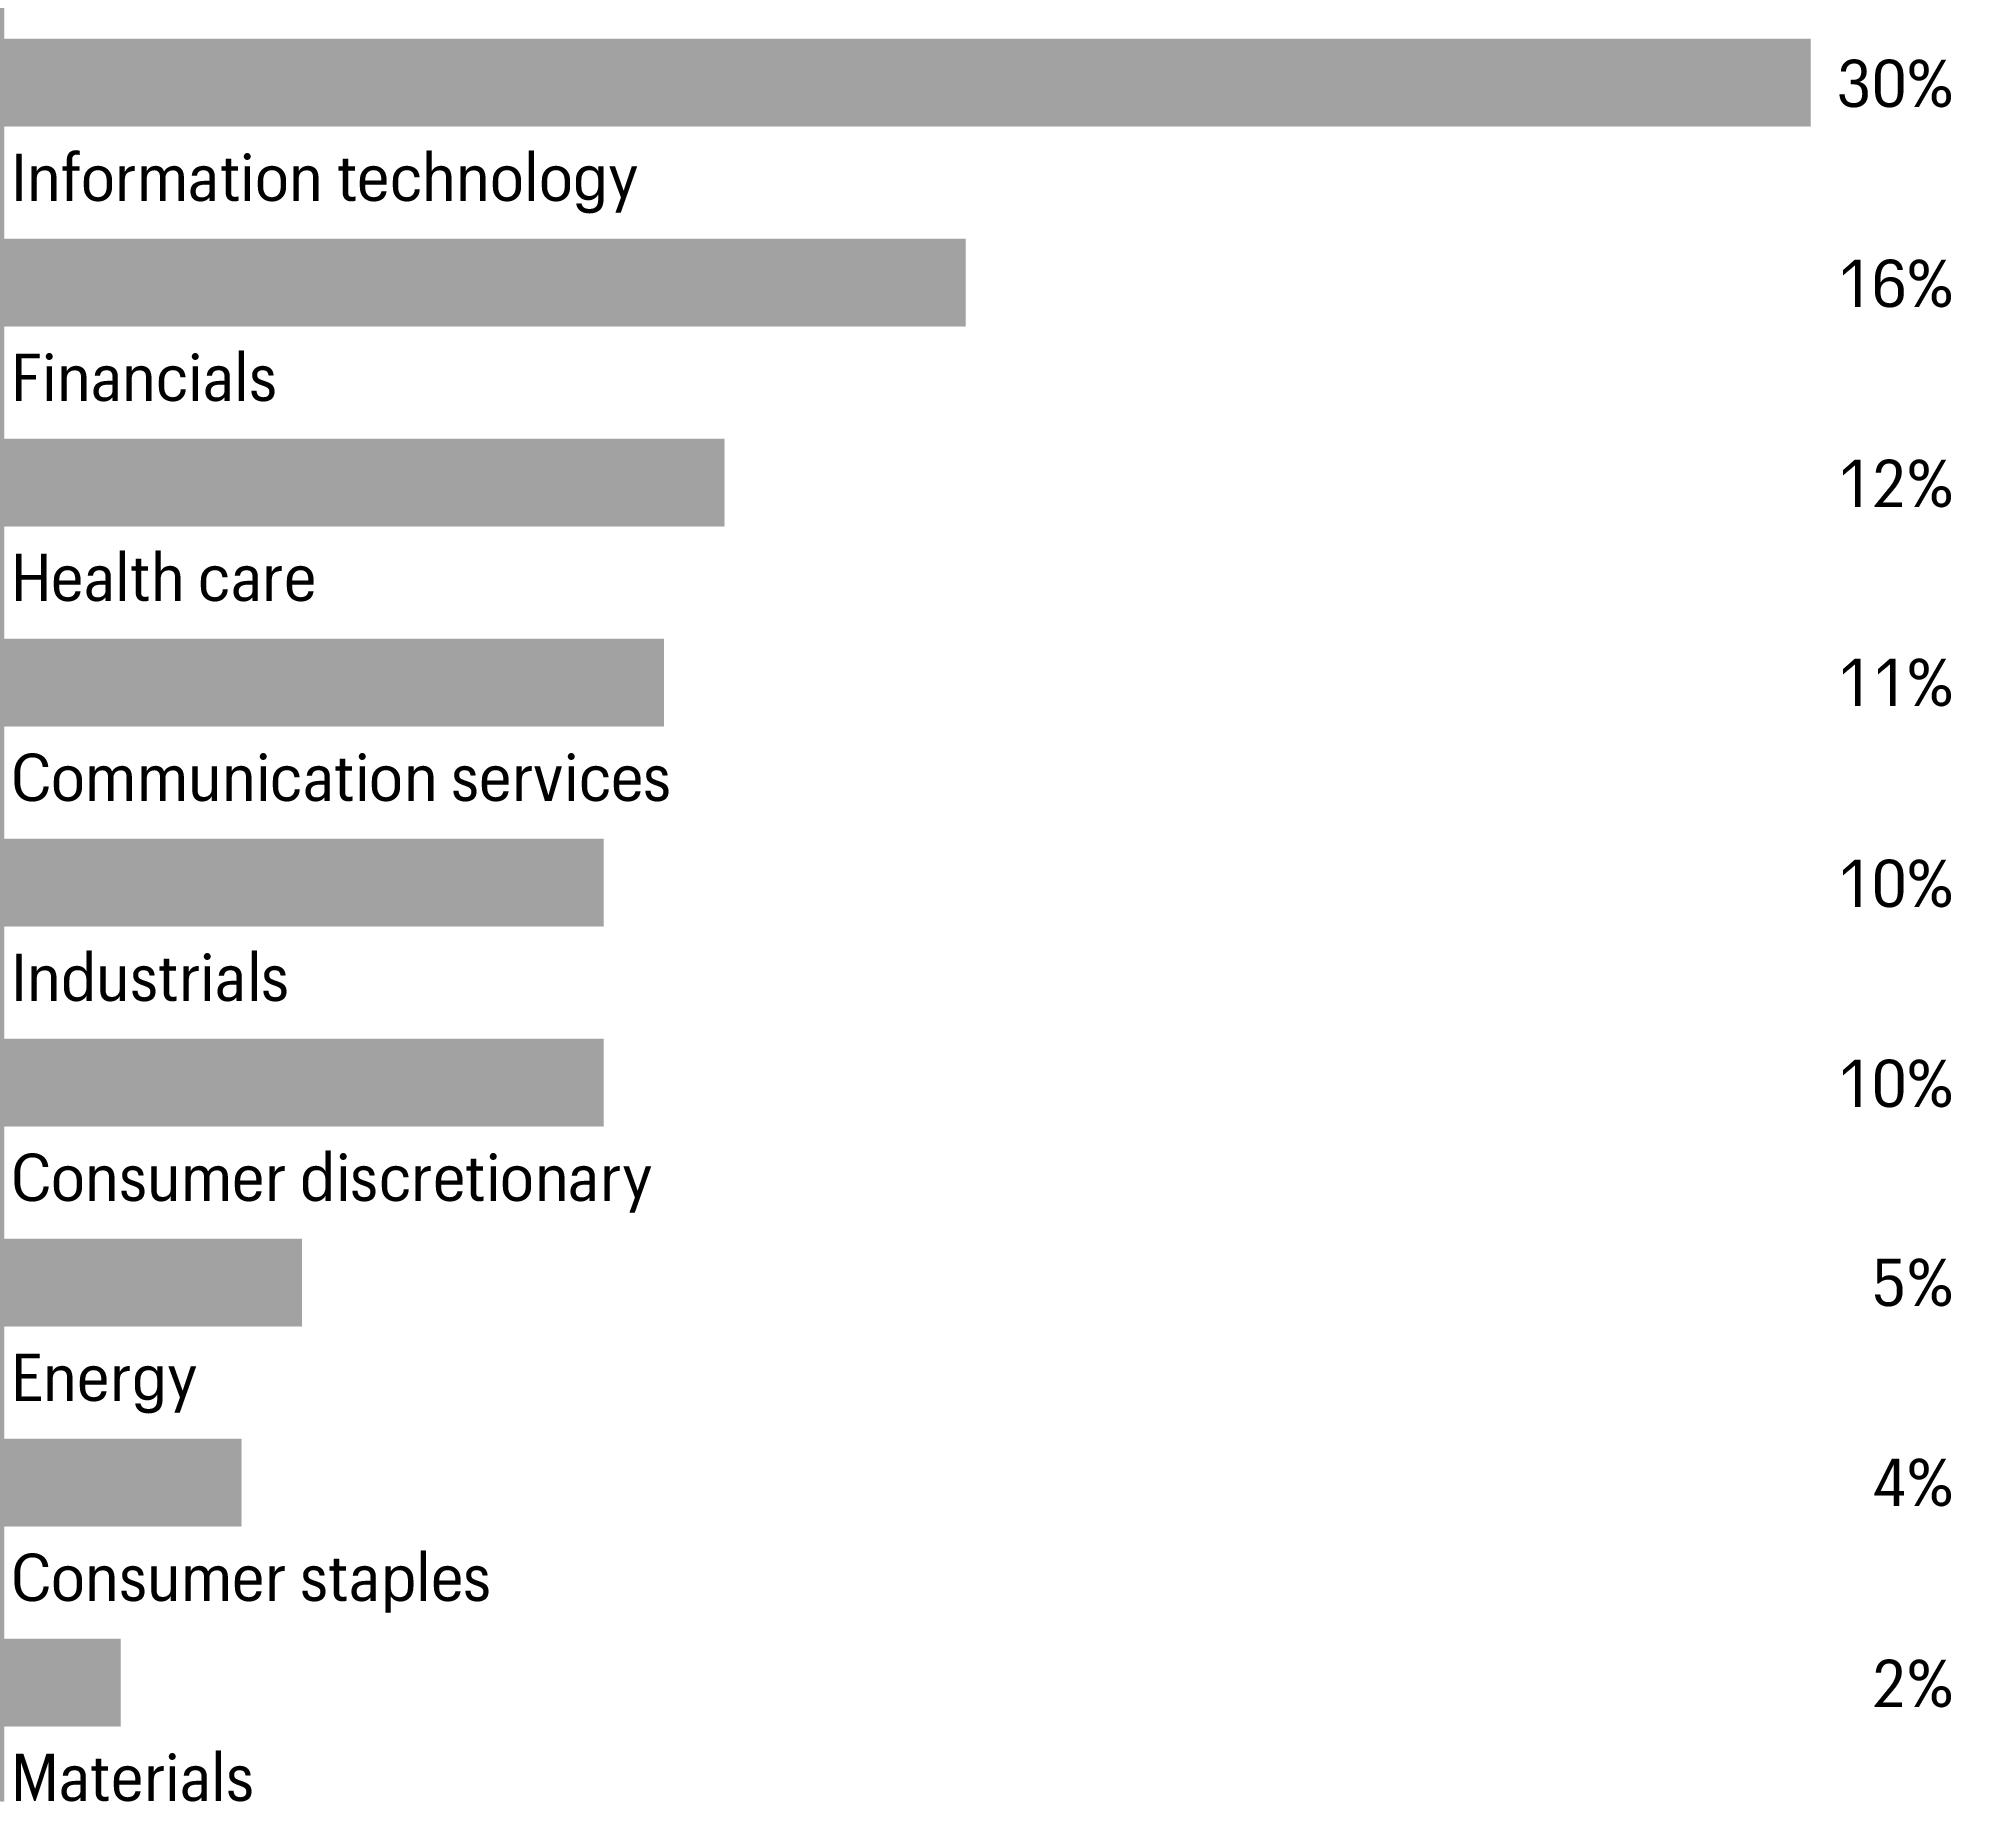
1 | Figures represent the percentage of the Fund’s long-term investments. Allocations are subject to change and may have changed since the date specified. |
Beginning account value 10-1-2023 | Ending account value 3-31-2024 | Expenses paid during the period1 | Annualized net expense ratio | |
Actual | $1,000.00 | $1,171.81 | $0.43 * | 0.08 %* |
Hypothetical (5% return before expenses) | $1,000.00 | $1,024.47 | $0.40 * | 0.08 %* |
1 | Expenses paid is equal to the annualized net expense ratio multiplied by the average account value over the period, multiplied by 182 divided by 366 (to reflect the one-half-year period). |
* | Generally, no ordinary fees or expenses are charged to the Fund. Allspring Funds Management, LLC has contractually committed to irrevocably absorb and pay or reimburse all ordinary operating expenses of the Fund, except portfolio transactions or other investment related costs (e.g., commissions), fees payable for services provided by the Fund’s securities lending agent (if any), interest, taxes, leverage expenses and other expenses not incurred in the ordinary course of the Fund’s business. This commitment has an indefinite term. |
Shares | Value | |||||
Common stocks: 97.54% | ||||||
Communication services: 11.26% | ||||||
Entertainment: 1.00% | ||||||
Electronic Arts, Inc.# | 239 | $31,708 | ||||
Interactive media & services: 10.26% | ||||||
Alphabet, Inc. Class C†# | 1,212 | 184,539 | ||||
Meta Platforms, Inc. Class A# | 289 | 140,333 | ||||
324,872 | ||||||
Consumer discretionary: 9.49% | ||||||
Hotels, restaurants & leisure: 6.13% | ||||||
Booking Holdings, Inc.# | 20 | 72,557 | ||||
Hilton Worldwide Holdings, Inc.# | 187 | 39,889 | ||||
McDonald’s Corp.# | 160 | 45,112 | ||||
Starbucks Corp.# | 402 | 36,739 | ||||
194,297 | ||||||
Household durables: 1.67% | ||||||
Garmin Ltd.# | 356 | 52,998 | ||||
Specialty retail: 1.69% | ||||||
Home Depot, Inc.# | 139 | 53,321 | ||||
Consumer staples: 3.55% | ||||||
Consumer staples distribution & retail : 1.04% | ||||||
Target Corp.# | 186 | 32,961 | ||||
Food products: 1.26% | ||||||
Mondelez International, Inc. Class A# | 569 | 39,830 | ||||
Personal care products: 1.25% | ||||||
Unilever PLC ADR# | 792 | 39,751 | ||||
Energy: 4.97% | ||||||
Oil, gas & consumable fuels: 4.97% | ||||||
Suncor Energy, Inc.# | 2,157 | 79,615 | ||||
TotalEnergies SE ADR# | 1,132 | 77,915 | ||||
157,530 | ||||||
Financials: 15.68% | ||||||
Banks: 8.08% | ||||||
Citigroup, Inc.# | 992 | 62,734 | ||||
JPMorgan Chase & Co.# | 492 | 98,547 | ||||
Regions Financial Corp.# | 2,215 | 46,604 | ||||
Toronto-Dominion Bank# | 797 | 48,123 | ||||
256,008 | ||||||
Shares | Value | |||||
Capital markets: 3.55% | ||||||
BlackRock, Inc.# | 57 | $47,521 | ||||
Blackstone, Inc.# | 494 | 64,897 | ||||
112,418 | ||||||
Financial services: 2.09% | ||||||
Visa, Inc. Class A# | 237 | 66,142 | ||||
Insurance: 1.96% | ||||||
Manulife Financial Corp.# | 2,490 | 62,225 | ||||
Health care: 11.27% | ||||||
Biotechnology: 1.78% | ||||||
AbbVie, Inc.# | 310 | 56,451 | ||||
Health care providers & services: 2.77% | ||||||
UnitedHealth Group, Inc.# | 177 | 87,562 | ||||
Life sciences tools & services: 1.41% | ||||||
Thermo Fisher Scientific, Inc.# | 77 | 44,753 | ||||
Pharmaceuticals: 5.31% | ||||||
Eli Lilly & Co.# | 120 | 93,355 | ||||
Merck & Co., Inc.# | 567 | 74,816 | ||||
168,171 | ||||||
Industrials: 9.97% | ||||||
Aerospace & defense: 3.26% | ||||||
Boeing Co.†# | 266 | 51,335 | ||||
RTX Corp.# | 533 | 51,984 | ||||
103,319 | ||||||
Air freight & logistics: 1.30% | ||||||
United Parcel Service, Inc. Class B# | 278 | 41,319 | ||||
Commercial services & supplies: 1.60% | ||||||
Waste Management, Inc.# | 238 | 50,730 | ||||
Electrical equipment: 2.48% | ||||||
Eaton Corp. PLC# | 251 | 78,482 | ||||
Ground transportation: 1.33% | ||||||
Union Pacific Corp.# | 171 | 42,054 | ||||
Information technology: 29.07% | ||||||
Communications equipment: 1.55% | ||||||
Cisco Systems, Inc.# | 981 | 48,962 | ||||
Electronic equipment, instruments & components: 1.27% | ||||||
TE Connectivity Ltd.# | 278 | 40,377 | ||||
IT services: 1.01% | ||||||
Cognizant Technology Solutions Corp. Class A# | 437 | 32,028 | ||||
Shares | Value | |||||
Semiconductors & semiconductor equipment: 8.26% | ||||||
Advanced Micro Devices, Inc.†# | 291 | $52,522 | ||||
Broadcom, Inc.# | 97 | 128,565 | ||||
Lam Research Corp.# | 83 | 80,640 | ||||
261,727 | ||||||
Software: 10.20% | ||||||
Adobe, Inc.†# | 82 | 41,377 | ||||
Microsoft Corp.# | 670 | 281,882 | ||||
323,259 | ||||||
Technology hardware, storage & peripherals: 6.78% | ||||||
Apple, Inc.# | 1,252 | 214,693 | ||||
Materials: 2.28% | ||||||
Chemicals: 2.28% | ||||||
Celanese Corp.# | 420 | 72,181 | ||||
Total common stocks (Cost $2,583,498) | 3,090,129 | |||||
Yield | ||||||
Short-term investments: 2.69% | ||||||
Investment companies: 2.69% | ||||||
Allspring Government Money Market Fund Select Class♠∞ | 5.25 % | 85,237 | 85,237 | |||
Total short-term investments (Cost $85,237) | 85,237 | |||||
Total investments in securities (Cost $2,668,735) | 100.23 % | 3,175,366 | ||||
Other assets and liabilities, net | (0.23 ) | (7,301 ) | ||||
Total net assets | 100.00 % | $3,168,065 | ||||
# | All or a portion of this security is segregated as collateral for investments in derivative instruments. |
† | Non-income-earning security |
♠ | The issuer of the security is an affiliated person of the Fund as defined in the Investment Company Act of 1940. |
∞ | The rate represents the 7-day annualized yield at period end. |
Abbreviations: | |
ADR | American depositary receipt |
Value, beginning of period | Purchases | Sales proceeds | Net realized gains (losses) | Net change in unrealized gains (losses) | Value, end of period | Shares, end of period | Income from affiliated securities | |
Short-term investments | ||||||||
Allspring Government Money Market Fund Select Class | $0 | $3,105,632 | $(3,020,395 ) | $0 | $0 | $85,237 | 85,237 | $5,403 |
Description | Counterparty | Number of contracts | Notional amount | Exercise price | Expiration date | Value |
Call | ||||||
E-Mini S&P 500 | Morgan Stanley Co. | (18 ) | $(955,800 ) | $531.00 | 4-5-2024 | $(1,350 ) |
E-Mini S&P 500 | Morgan Stanley Co. | (12 ) | (666,000 ) | 555.00 | 4-5-2024 | (36 ) |
E-Mini S&P 500 | Morgan Stanley Co. | (26 ) | (1,380,600 ) | 531.00 | 4-12-2024 | (5,304 ) |
E-Mini S&P 500 | Morgan Stanley Co. | (22 ) | (1,188,000 ) | 540.00 | 4-19-2024 | (1,892 ) |
E-Mini S&P 500 | Morgan Stanley Co. | (3 ) | (169,500 ) | 565.00 | 4-19-2024 | (9 ) |
E-Mini S&P 500 | Morgan Stanley Co. | (8 ) | (452,000 ) | 565.00 | 4-26-2024 | (32 ) |
E-Mini S&P 500 | Morgan Stanley Co. | (9 ) | (485,100 ) | 539.00 | 4-26-2024 | (1,526 ) |
Invesco QQQ Trust, Series 1 | Morgan Stanley Co. | (1 ) | (45,800 ) | 458.00 | 4-12-2024 | (91 ) |
Invesco QQQ Trust, Series 1 | Morgan Stanley Co. | (7 ) | (322,000 ) | 460.00 | 4-26-2024 | (1,641 ) |
iShares Russell 2000 ETF | Morgan Stanley Co. | (9 ) | (196,200 ) | 218.00 | 4-5-2024 | (162 ) |
iShares Russell 2000 ETF | Morgan Stanley Co. | (10 ) | (213,000 ) | 213.00 | 4-12-2024 | (2,090 ) |
iShares Russell 2000 ETF | Morgan Stanley Co. | (11 ) | (237,600 ) | 216.00 | 4-19-2024 | (1,914 ) |
iShares Russell 2000 ETF | Morgan Stanley Co. | (7 ) | (153,300 ) | 219.00 | 4-26-2024 | (1,043 ) |
SPDR Dow Jones Industrial Average ETF | Morgan Stanley Co. | (2 ) | (83,000 ) | 415.00 | 4-12-2024 | (12 ) |
SPDR Dow Jones Industrial Average ETF | Morgan Stanley Co. | (5 ) | (210,000 ) | 420.00 | 4-19-2024 | (28 ) |
$(17,130 ) |
Assets | |
Investments in unaffiliated securities, at value (cost $2,583,498) | $3,090,129 |
Investments in affiliated securities, at value (cost $85,237) | 85,237 |
Cash | 154,289 |
Receivable for investments sold | 11,137 |
Receivable from manager | 5,897 |
Receivable for dividends | 3,243 |
Prepaid expenses and other assets | 2,000 |
Total assets | 3,351,932 |
Liabilities | |
Payable for investments purchased | 159,510 |
Written options, at value (premiums received $17,009) | 17,130 |
Payable for dividends on securities sold short | 1,150 |
Accrued expenses and other liabilities | 6,077 |
Total liabilities | 183,867 |
Total net assets | $3,168,065 |
Net assets consist of | |
Paid-in capital | $2,802,619 |
Total distributable earnings | 365,446 |
Total net assets | $3,168,065 |
Computation of net asset value per share | |
Net assets | $3,168,065 |
Shares outstanding1 | 139,864 |
Net asset value per share | $22.65 |
Investment income | |
Dividends (net of foreign withholdings taxes of $1,499) | $37,899 |
Income from affiliated securities | 5,403 |
Interest | 721 |
Total investment income | 44,023 |
Expenses | |
Custody and accounting fees | 1,865 |
Professional fees | 53,888 |
Registration fees | 33,908 |
Shareholder report expenses | 3,660 |
Trustees’ fees and expenses | 17,329 |
Dividends on securities sold short | 1,150 |
Other fees and expenses | 4,039 |
Total expenses | 115,839 |
Less: Fee waivers and/or expense reimbursements | (114,689 ) |
Net expenses | 1,150 |
Net investment income | 42,873 |
Realized and unrealized gains (losses) on investments | |
Net realized gains (losses) on | |
Unaffiliated securities | (8,974 ) |
Foreign currency and foreign currency translations | 31 |
Written options | (86,000 ) |
Net realized losses on investments | (94,943 ) |
Net change in unrealized gains (losses) on | |
Unaffiliated securities | 506,631 |
Written options | (121 ) |
Net change in unrealized gains (losses) on investments | 506,510 |
Net realized and unrealized gains (losses) on investments | 411,567 |
Net increase in net assets resulting from operations | $454,440 |
YEAR ENDED March 31, 20241 | ||
Operations | ||
Net investment income | $42,873 | |
Net realized losses on investments | (94,943 ) | |
Net change in unrealized gains (losses) on investments | 506,510 | |
Net increase in net assets resulting from operations | 454,440 | |
Distributions to shareholders from | ||
Net investment income and net realized gains | (88,994 ) | |
Capital share transactions | Shares | |
Proceeds from shares sold | 139,825 | 2,801,800 |
Reinvestment of distributions | 39 | 819 |
Net increase in net assets resulting from capital share transactions | 2,802,619 | |
Total increase in net assets | 3,168,065 | |
Net assets | ||
Beginning of period | 0 | |
End of period | $3,168,065 | |
Year ended March 31 | |
20241 | |
Net asset value, beginning of period | $20.00 |
Net investment income | 0.32 2 |
Net realized and unrealized gains (losses) on investments | 2.98 |
Total from investment operations | 3.30 |
Distributions to shareholders from | |
Net investment income | (0.30 ) |
Net realized gains | (0.35 ) |
Total distributions to shareholders | (0.65 ) |
Net asset value, end of period | $22.65 |
Total return3 | 16.81 % |
Ratios to average net assets (annualized) | |
Gross expenses* | 5.18 % |
Net expenses*,4 | 0.05 % |
Net investment income* | 1.92 % |
Supplemental data | |
Portfolio turnover rate | 11 % |
Net assets, end of period (000s omitted) | $3,168 |
* | Ratios include dividends on securities sold short as follows: |
Year ended March 31, 2024 | 0.05% |
1 | For the period from June 8, 2023 (commencement of operations) to March 31, 2024 |
2 | Calculated based upon average shares outstanding |
3 | Returns for periods of less than one year are not annualized. |
4 | The manager has contractually committed to irrevocably absorb and pay or reimburse all ordinary operating expenses of the Fund, except portfolio transactions or other investment-related costs (e.g., commissions), fees payable for services provided by the Fund’s securities lending agent (if any), interest, taxes, leverage expenses, and other expenses not incurred in the ordinary course of the Fund’s business. This commitment has an indefinite term. |
Gross unrealized gains | $554,847 |
Gross unrealized losses | (48,643 ) |
Net unrealized gains | $506,204 |
Quoted prices (Level 1) | Other significant observable inputs (Level 2) | Significant unobservable inputs (Level 3) | Total | |
Assets | ||||
Investments in: | ||||
Common stocks | ||||
Communication services | $356,580 | $0 | $0 | $356,580 |
Consumer discretionary | 300,616 | 0 | 0 | 300,616 |
Consumer staples | 112,542 | 0 | 0 | 112,542 |
Energy | 157,530 | 0 | 0 | 157,530 |
Financials | 496,793 | 0 | 0 | 496,793 |
Health care | 356,937 | 0 | 0 | 356,937 |
Industrials | 315,904 | 0 | 0 | 315,904 |
Information technology | 921,046 | 0 | 0 | 921,046 |
Materials | 72,181 | 0 | 0 | 72,181 |
Short-term investments | ||||
Investment companies | 85,237 | 0 | 0 | 85,237 |
Total assets | $3,175,366 | $0 | $0 | $3,175,366 |
Liabilities | ||||
Written options | $17,130 | $0 | $0 | $17,130 |
Total liabilities | $17,130 | $0 | $0 | $17,130 |
Counterparty | Gross amounts of liabilities in the Statement of Assets and Liabilities | Amounts subject to netting agreements | Collateral pledged1 | Net amount of liabilities |
Morgan Stanley Co. | $17,130 | $0 | $(17,130 ) | $0 |
1 | Collateral pledged within this table is limited to the collateral for the net transaction with the counterparty. |
Undistributed ordinary income | Unrealized gains | Post-October capital losses deferred |
$3,338 | $506,083 | $(143,975 ) |
Allspring Funds Trust:

March 31, 2024.
Name and year of birth | Position held and length of service* | Principal occupations during past five years or longer | Current other public company or investment company directorships |
William R. Ebsworth (Born 1957) | Trustee, since 2015 | Retired. From 1984 to 2013, equities analyst, portfolio manager, research director and chief investment officer at Fidelity Management and Research Company in Boston, Tokyo, and Hong Kong, and retired in 2013 as Chief Investment Officer of Fidelity Strategic Advisers, Inc. where he led a team of investment professionals managing client assets. Prior thereto, Board member of Hong Kong Securities Clearing Co., Hong Kong Options Clearing Corp., the Thailand International Fund, Ltd., Fidelity Investments Life Insurance Company, and Empire Fidelity Investments Life Insurance Company. Serves on the Investment Company Institute’s Board of Governors since 2022 and Executive Committee since 2023 as well as the Vice Chairman of the Governing Council of the Independent Directors Council since 2023. Audit Committee Chair and Investment Committee Chair of the Vincent Memorial Hospital Foundation (non-profit organization). Mr. Ebsworth is a CFA charterholder. | N/A |
Jane A. Freeman (Born 1953) | Trustee, since 2015; Chair Liaison, since January 2018# | Retired. From 2012 to 2014 and 1999 to 2008, Chief Financial Officer of Scientific Learning Corporation. From 2008 to 2012, Ms. Freeman provided consulting services related to strategic business projects. Prior to 1999, Portfolio Manager at Rockefeller & Co. and Scudder, Stevens & Clark. Board member of the Harding Loevner Funds from 1996 to 2014, serving as both Lead Independent Director and chair of the Audit Committee. Board member of the Russell Exchange Traded Funds Trust from 2011 to 2012 and the chair of the Audit Committee. Ms. Freeman is also an inactive Chartered Financial Analyst. | N/A |
Isaiah Harris, Jr. (Born 1952) | Trustee, since 2009; Audit Committee Chair, since 2019 | Retired. Member of the Advisory Board of CEF of East Central Florida. Chairman of the Board of CIGNA Corporation from 2009 to 2021, and Director from 2005 to 2008. From 2003 to 2011, Director of Deluxe Corporation. Prior thereto, President and CEO of BellSouth Advertising and Publishing Corp. from 2005 to 2007, President and CEO of BellSouth Enterprises from 2004 to 2005 and President of BellSouth Consumer Services from 2000 to 2003. Emeritus member of the Iowa State University Foundation Board of Governors. Emeritus Member of the Advisory board of Iowa State University School of Business. Advisory Board Member, Palm Harbor Academy (private school). Advisory Board Member, Fellowship of Christian Athletes. Mr. Harris is a certified public accountant (inactive status). | N/A |
David F. Larcker (Born 1950) | Trustee, since 2009 | Distinguished Visiting Fellow at the Hoover Institution since 2022. James Irvin Miller Professor of Accounting at the Graduate School of Business (Emeritus), Stanford University, Director of the Corporate Governance Research Initiative and Senior Faculty of The Rock Center for Corporate Governance since 2006. From 2005 to 2008, Professor of Accounting at the Graduate School of Business, Stanford University. Prior thereto, Ernst & Young Professor of Accounting at The Wharton School, University of Pennsylvania from 1985 to 2005. | N/A |
Olivia S. Mitchell (Born 1953) | Trustee, since 2006; Nominating and Governance Committee Chair, since 2018 | International Foundation of Employee Benefit Plans Professor since 1993, Wharton School of the University of Pennsylvania. Director of Wharton’s Pension Research Council and Boettner Center on Pensions & Retirement Research, and Research Associate at the National Bureau of Economic Research. Previously taught at Cornell University from 1978 to 1993. | N/A |
Name and year of birth | Position held and length of service* | Principal occupations during past five years or longer | Current other public company or investment company directorships |
Timothy J. Penny (Born 1951) | Trustee, since 1996; Chair, since 2018 | President and Chief Executive Officer of Southern Minnesota Initiative Foundation, a non-profit organization, since 2007. Vice Chair of the Economic Club of Minnesota, since 2007. Co-Chair of the Committee for a Responsible Federal Budget, since 1995. Member of the Board of Trustees of NorthStar Education Finance, Inc., a non-profit organization, from 2007-2022. Senior Fellow of the University of Minnesota Humphrey Institute from 1995 to 2017. | N/A |
James G. Polisson (Born 1959) | Trustee, since 2018 | Retired. Chief Marketing Officer, Source (ETF) UK Services, Ltd, from 2015 to 2017. From 2012 to 2015, Principal of The Polisson Group, LLC, a management consulting, corporate advisory and principal investing company. Chief Executive Officer and Managing Director at Russell Investments, Global Exchange Traded Funds from 2010 to 2012. Managing Director of Barclays Global Investors from 1998 to 2010 and Global Chief Marketing Officer for iShares and Barclays Global Investors from 2000 to 2010. Trustee of the San Francisco Mechanics’ Institute, a non- profit organization, from 2013 to 2015. Board member of the Russell Exchange Traded Fund Trust from 2011 to 2012. Director of Barclays Global Investors Holdings Deutschland GmbH from 2006 to 2009. Mr. Polisson is an attorney and has a retired status with the Massachusetts and District of Columbia Bar Associations. | N/A |
Pamela Wheelock (Born 1959) | Trustee, since January 2020; previously Trustee from January 2018 to July 2019# | Retired. Executive and Senior Financial leadership positions in the public, private and nonprofit sectors. Interim President and CEO, McKnight Foundation, 2020. Interim Commissioner, Minnesota Department of Human Services, 2019. Chief Operating Officer, Twin Cities Habitat for Humanity, 2017-2019. Vice President for University Services, University of Minnesota, 2012- 2016. Interim President and CEO, Blue Cross and Blue Shield of Minnesota, 2011-2012. Executive Vice-President and Chief Financial Officer, Minnesota Wild, 2002-2008. Commissioner, Minnesota Department of Finance, 1999-2002. Chair of the Board of Directors of Destination Medical Center Corporation. Board member of the Minnesota Wild Foundation. | N/A |
Name and year of birth | Position held and length of service | Principal occupations during past five years or longer |
Andrew Owen (Born 1960) | President, since 2017 | President and Chief Executive Officer of Allspring Funds Management, LLC since 2017 and Head of Global Fund Governance of Allspring Global Investments since 2022. Prior thereto, co-president of Galliard Capital Management, LLC, an affiliate of Allspring Funds Management, LLC, from 2019 to 2022 and Head of Affiliated Managers, Allspring Global Investments, from 2014 to 2019 and Executive Vice President responsible for marketing, investments and product development for Allspring Funds Management, LLC, from 2009 to 2014. |
Jeremy DePalma (Born 1974) | Treasurer, since 2012 (for certain funds in the Fund Complex); since 2021 (for the remaining funds in the Complex) | Senior Vice President of Allspring Funds Management, LLC since 2009. Senior Vice President of Evergreen Investment Management Company, LLC from 2008 to 2010 and head of the Fund Reporting and Control Team within Fund Administration from 2005 to 2010. |
Christopher Baker (Born 1976) | Chief Compliance Officer, since 2022 | Global Chief Compliance Officer for Allspring Global Investments since 2022. Prior thereto, Chief Compliance Officer for State Street Global Advisors from 2018 to 2021. Senior Compliance Officer for the State Street divisions of Alternative Investment Solutions, Sector Solutions, and Global Marketing from 2015 to 2018. From 2010 to 2015 Vice President, Global Head of Investment and Marketing Compliance for State Street Global Advisors. |
Matthew Prasse (Born 1983) | Chief Legal Officer, since 2022; Secretary, since 2021 | Senior Counsel of the Allspring Legal Department since 2021. Senior Counsel of the Wells Fargo Legal Department from 2018 to 2021. Previously, Counsel for Barings LLC from 2015 to 2018. Prior to joining Barings, Associate at Morgan, Lewis & Bockius LLP from 2008 to 2015. |
Attn: Managed Account Services
P.O. Box 1450
Milwaukee, WI 53201

AR4905 03-24
2 | |
6 | |
10 | |
11 | |
22 | |
23 | |
24 | |
25 | |
29 | |
34 | |
35 |

Allspring Funds

President
Allspring Funds
Notice to Shareholders |
Beginning in July 2024, the Fund will be required by the Securities and Exchange Commission to send shareholders a paper copy of a new tailored shareholder report in place of the full shareholder report that you are now receiving. The tailored shareholder report will contain concise information about the Fund, including certain expense and performance information and fund statistics. If you wish to receive this new tailored shareholder report electronically, please follow the instructions on the back cover of this report. |
Other information that is currently included in the shareholder report, such as the Fund’s financial statements, will be available online and upon request, free of charge, in paper or electronic format. |
Investment objective | The Fund seeks long-term capital appreciation. |
Manager | Allspring Funds Management, LLC |
Subadviser | Allspring Global Investments, LLC |
Portfolio managers | Justin P. Carr, CFA, Robert M. Wicentowski, CFA |
Average annual total returns (%) as of March 31, 2024 | |||||||||
Including sales charge | Excluding sales charge | Expense ratios1 (%) | |||||||
Inception date | 1 year | 5 year | 10 year | 1 year | 5 year | 10 year | Gross | Net2 | |
Class A (WDSAX)3 | 7-31-2018 | 18.74 | 9.35 | 7.50 | 25.98 | 10.66 | 8.14 | 2.08 | 0.92 |
Class R6 (WSCJX)4 | 10-31-2016 | – | – | – | 26.46 | 10.74 | 8.31 | 1.66 | 0.50 |
Administrator Class (NVSOX) | 8-1-1993 | – | – | – | 26.03 | 10.45 | 8.03 | 2.01 | 0.85 |
Institutional Class (WSCOX)5 | 10-31-2014 | – | – | – | 26.30 | 10.70 | 8.27 | 1.76 | 0.60 |
Russell 2000® Index6 | – | – | – | – | 19.71 | 8.10 | 7.58 | – | – |
1 | Reflects the expense ratios as stated in the most recent prospectuses. The expense ratios shown are subject to change and may differ from the annualized expense ratios shown in the Financial Highlights of this report. |
2 | The manager has contractually committed through July 31, 2024, to waive fees and/or reimburse expenses to the extent necessary to cap total annual fund operating expenses after fee waivers at 0.92% for Class A, 0.50% for Class R6, 0.85% for Administrator Class and 0.60% for Institutional Class. Brokerage commissions, stamp duty fees, interest, taxes, acquired fund fees and expenses (if any), and extraordinary expenses are excluded from the expense caps. Prior to or after the commitment expiration date, the caps may be increased or the commitment to maintain the caps may be terminated only with the approval of the Board of Trustees. Without these caps, the Fund’s returns would have been lower. The expense ratio paid by an investor is the net expense ratio (the total annual fund operating expenses after fee waivers) as stated in the prospectuses. |
3 | Historical performance shown for the Class A shares prior to their inception reflects the performance of the Administrator Class shares, and is adjusted to reflect the higher expenses and sales charges of the Class A shares. |
4 | Historical performance shown for the Class R6 shares prior to their inception reflects the performance of the Institutional Class shares, and includes the higher expenses applicable to the Institutional Class shares. If these expenses had not been included, returns for the Class R6 shares would be higher. |
5 | Historical performance shown for the Institutional Class shares prior to their inception reflects the performance of the Administrator Class shares, and includes the higher expenses applicable to the Administrator Class shares. If these expenses had not been included, returns for the Institutional Class shares would be higher. |
6 | The Russell 2000® Index measures the performance of the 2,000 smallest companies in the Russell 3000® Index, which represents approximately 8% of the total market capitalization of the Russell 3000® Index. You cannot invest directly in an index. |
CFA® and Chartered Financial Analyst® are trademarks owned by CFA Institute. |
Growth of $10,000 investment as of March 31, 20241 |

1 | The chart compares the performance of Class A shares for the most recent ten years with the Russell 2000® Index. The chart assumes a hypothetical investment of $10,000 in Class A shares and reflects all operating expenses and assumes the maximum initial sales charge of 5.75%. |
Ten largest holdings (%) as of March 31, 20241 | |
Super Micro Computer, Inc. | 1.63 |
Jackson Financial, Inc. Class A | 0.95 |
Taylor Morrison Home Corp. | 0.92 |
Modine Manufacturing Co. | 0.91 |
Applied Industrial Technologies, Inc. | 0.88 |
Atkore, Inc. | 0.87 |
e.l.f. Beauty, Inc. | 0.86 |
Comfort Systems USA, Inc. | 0.83 |
Fabrinet | 0.81 |
Academy Sports & Outdoors, Inc. | 0.78 |
1 | Figures represent the percentage of the Fund’s net assets. Holdings are subject to change and may have changed since the date specified. |
Sector allocation as of March 31, 20241 |

1 | Figures represent the percentage of the Fund’s long-term investments. Allocations are subject to change and may have changed since the date specified. |
Beginning account value 10-1-2023 | Ending account value 3-31-2024 | Expenses paid during the period1 | Annualized net expense ratio | |
Class A | ||||
Actual | $1,000.00 | $1,221.98 | $4.64 | 0.84 % |
Hypothetical (5% return before expenses) | $1,000.00 | $1,020.69 | $4.22 | 0.84 % |
Class R6 | ||||
Actual | $1,000.00 | $1,224.80 | $2.77 | 0.50 % |
Hypothetical (5% return before expenses) | $1,000.00 | $1,022.38 | $2.51 | 0.50 % |
Administrator Class | ||||
Actual | $1,000.00 | $1,221.99 | $4.64 | 0.84 % |
Hypothetical (5% return before expenses) | $1,000.00 | $1,020.69 | $4.22 | 0.84 % |
Institutional Class | ||||
Actual | $1,000.00 | $1,223.39 | $3.32 | 0.60 % |
Hypothetical (5% return before expenses) | $1,000.00 | $1,021.88 | $3.02 | 0.60 % |
1 | Expenses paid is equal to the annualized net expense ratio of each class multiplied by the average account value over the period, multiplied by 182 divided by 366 (to reflect the one-half-year period). |
Shares | Value | |||||
Common stocks: 97.06% | ||||||
Communication services: 2.00% | ||||||
Diversified telecommunication services: 0.37% | ||||||
Bandwidth, Inc. Class A† | 12,094 | $220,837 | ||||
Entertainment: 0.32% | ||||||
Cinemark Holdings, Inc.† | 3,402 | 61,134 | ||||
Vivid Seats, Inc. Class A† | 22,307 | 133,619 | ||||
194,753 | ||||||
Interactive media & services: 0.74% | ||||||
Cargurus, Inc.† | 13,431 | 309,987 | ||||
Yelp, Inc.† | 2,219 | 87,429 | ||||
ZipRecruiter, Inc. Class A† | 4,229 | 48,591 | ||||
446,007 | ||||||
Media: 0.57% | ||||||
Magnite, Inc.† | 18,361 | 197,381 | ||||
TEGNA, Inc. | 10,025 | 149,773 | ||||
347,154 | ||||||
Consumer discretionary: 10.40% | ||||||
Automobile components: 1.28% | ||||||
Holley, Inc.† | 50,356 | 224,588 | ||||
Modine Manufacturing Co.† | 5,729 | 545,343 | ||||
769,931 | ||||||
Diversified consumer services: 1.00% | ||||||
Perdoceo Education Corp. | 11,108 | 195,057 | ||||
Stride, Inc.† | 6,505 | 410,140 | ||||
605,197 | ||||||
Hotels, restaurants & leisure: 2.10% | ||||||
Bloomin’ Brands, Inc. | 13,703 | 393,002 | ||||
Brinker International, Inc.† | 8,240 | 409,363 | ||||
Hilton Grand Vacations, Inc.† | 4,097 | 193,420 | ||||
International Game Technology PLC | 10,258 | 231,728 | ||||
United Parks & Resorts, Inc.† | 749 | 42,101 | ||||
1,269,614 | ||||||
Household durables: 2.79% | ||||||
Helen of Troy Ltd.† | 777 | 89,541 | ||||
KB Home | 5,076 | 359,787 | ||||
M/I Homes, Inc.† | 2,722 | 370,981 | ||||
Meritage Homes Corp. | 1,738 | 304,950 | ||||
Taylor Morrison Home Corp.† | 8,930 | 555,178 | ||||
1,680,437 | ||||||
Specialty retail: 3.23% | ||||||
Academy Sports & Outdoors, Inc. | 6,972 | 470,889 | ||||
Shares | Value | |||||
Specialty retail(continued) | ||||||
American Eagle Outfitters, Inc. | 2,318 | $59,781 | ||||
Asbury Automotive Group, Inc.† | 1,561 | 368,052 | ||||
Group 1 Automotive, Inc. | 1,051 | 307,134 | ||||
Hibbett, Inc. | 3,411 | 261,999 | ||||
Signet Jewelers Ltd. | 1,555 | 155,609 | ||||
Urban Outfitters, Inc.† | 7,433 | 322,741 | ||||
1,946,205 | ||||||
Consumer staples: 3.26% | ||||||
Beverages: 0.64% | ||||||
Coca-Cola Consolidated, Inc. | 336 | 284,394 | ||||
Duckhorn Portfolio, Inc.† | 10,724 | 99,840 | ||||
384,234 | ||||||
Consumer staples distribution & retail : 0.41% | ||||||
Andersons, Inc. | 4,302 | 246,806 | ||||
Food products: 0.63% | ||||||
Simply Good Foods Co.† | 4,592 | 156,266 | ||||
Vital Farms, Inc.† | 9,646 | 224,269 | ||||
380,535 | ||||||
Personal care products: 1.58% | ||||||
BellRing Brands, Inc.† | 6,447 | 380,567 | ||||
e.l.f. Beauty, Inc.† | 2,667 | 522,812 | ||||
Medifast, Inc. | 1,391 | 53,303 | ||||
956,682 | ||||||
Energy: 6.68% | ||||||
Energy equipment & services: 2.13% | ||||||
Helix Energy Solutions Group, Inc.† | 13,471 | 146,025 | ||||
Liberty Energy, Inc. | 18,458 | 382,450 | ||||
Noble Corp. PLC | 2,311 | 112,060 | ||||
Patterson-UTI Energy, Inc. | 26,184 | 312,637 | ||||
Seadrill Ltd.† | 1,717 | 86,365 | ||||
U.S. Silica Holdings, Inc.† | 7,387 | 91,673 | ||||
Weatherford International PLC† | 1,340 | 154,663 | ||||
1,285,873 | ||||||
Oil, gas & consumable fuels: 4.55% | ||||||
California Resources Corp. | 7,062 | 389,116 | ||||
Chord Energy Corp. | 901 | 160,594 | ||||
CVR Energy, Inc. | 4,952 | 176,588 | ||||
International Seaways, Inc. | 5,935 | 315,742 | ||||
Matador Resources Co. | 1,320 | 88,136 | ||||
Par Pacific Holdings, Inc.† | 5,646 | 209,241 | ||||
PBF Energy, Inc. Class A | 6,752 | 388,713 | ||||
Peabody Energy Corp. | 13,937 | 338,112 | ||||
Shares | Value | |||||
Oil, gas & consumable fuels(continued) | ||||||
Scorpio Tankers, Inc. | 5,102 | $365,048 | ||||
Vital Energy, Inc.† | 5,988 | 314,610 | ||||
2,745,900 | ||||||
Financials: 15.16% | ||||||
Banks: 7.45% | ||||||
Axos Financial, Inc.† | 6,207 | 335,426 | ||||
Bancorp, Inc.† | 6,156 | 205,980 | ||||
Bank of NT Butterfield & Son Ltd. | 7,974 | 255,088 | ||||
CrossFirst Bankshares, Inc.† | 7,450 | 103,108 | ||||
Customers Bancorp, Inc.† | 6,557 | 347,914 | ||||
Enterprise Financial Services Corp. | 2,544 | 103,185 | ||||
Financial Institutions, Inc. | 5,117 | 96,302 | ||||
First BanCorp | 17,954 | 314,913 | ||||
First Financial Corp. | 4,246 | 162,749 | ||||
Hancock Whitney Corp. | 6,631 | 305,291 | ||||
Hanmi Financial Corp. | 10,037 | 159,789 | ||||
Hilltop Holdings, Inc. | 6,536 | 204,708 | ||||
Mercantile Bank Corp. | 2,705 | 104,116 | ||||
OFG Bancorp | 9,182 | 337,989 | ||||
Pathward Financial, Inc. | 2,768 | 139,729 | ||||
Preferred Bank | 3,297 | 253,111 | ||||
Republic Bancorp, Inc. Class A | 4,300 | 219,300 | ||||
UMB Financial Corp. | 3,682 | 320,297 | ||||
Westamerica BanCorp | 4,513 | 220,595 | ||||
WSFS Financial Corp. | 6,790 | 306,501 | ||||
4,496,091 | ||||||
Capital markets: 1.53% | ||||||
Artisan Partners Asset Management, Inc. Class A | 3,429 | 156,945 | ||||
Evercore, Inc. Class A | 428 | 82,429 | ||||
StoneX Group, Inc.† | 2,225 | 156,328 | ||||
Victory Capital Holdings, Inc. Class A | 6,764 | 286,997 | ||||
Virtus Investment Partners, Inc. | 966 | 239,549 | ||||
922,248 | ||||||
Consumer finance: 0.62% | ||||||
Bread Financial Holdings, Inc. | 2,242 | 83,492 | ||||
Enova International, Inc.† | 3,984 | 250,315 | ||||
Green Dot Corp. Class A† | 4,662 | 43,496 | ||||
377,303 | ||||||
Financial services: 4.16% | ||||||
Essent Group Ltd. | 6,215 | 369,855 | ||||
Evertec, Inc. | 7,427 | 296,337 | ||||
Federal Agricultural Mortgage Corp. Class C | 1,903 | 374,663 | ||||
Jackson Financial, Inc. Class A | 8,640 | 571,449 | ||||
Marqeta, Inc. Class A† | 27,435 | 163,513 | ||||
Merchants Bancorp | 4,054 | 175,052 | ||||
Shares | Value | |||||
Financial services(continued) | ||||||
MGIC Investment Corp. | 9,246 | $206,740 | ||||
NMI Holdings, Inc. Class A† | 4,586 | 148,311 | ||||
Radian Group, Inc. | 6,034 | 201,958 | ||||
2,507,878 | ||||||
Insurance: 1.40% | ||||||
CNO Financial Group, Inc. | 10,202 | 280,351 | ||||
Employers Holdings, Inc. | 3,000 | 136,170 | ||||
Genworth Financial, Inc. Class A† | 35,077 | 225,545 | ||||
Skyward Specialty Insurance Group, Inc.† | 5,348 | 200,069 | ||||
842,135 | ||||||
Health care: 14.75% | ||||||
Biotechnology: 6.84% | ||||||
4D Molecular Therapeutics, Inc.† | 2,009 | 64,007 | ||||
ACADIA Pharmaceuticals, Inc.† | 3,264 | 60,351 | ||||
ADMA Biologics, Inc.† | 15,626 | 103,132 | ||||
Alkermes PLC† | 8,751 | 236,890 | ||||
Amicus Therapeutics, Inc.† | 9,980 | 117,564 | ||||
Arcturus Therapeutics Holdings, Inc.† | 4,501 | 151,999 | ||||
Arcus Biosciences, Inc.† | 7,516 | 141,902 | ||||
Ardelyx, Inc.† | 8,887 | 64,875 | ||||
Arrowhead Pharmaceuticals, Inc.† | 1,906 | 54,512 | ||||
Blueprint Medicines Corp.† | 1,338 | 126,923 | ||||
Bridgebio Pharma, Inc.† | 2,652 | 82,000 | ||||
CareDx, Inc.† | 10,800 | 114,372 | ||||
Caribou Biosciences, Inc.† | 24,782 | 127,379 | ||||
Catalyst Pharmaceuticals, Inc.† | 10,154 | 161,855 | ||||
Cytokinetics, Inc.† | 1,811 | 126,969 | ||||
Denali Therapeutics, Inc.† | 3,580 | 73,462 | ||||
Dynavax Technologies Corp.† | 12,671 | 157,247 | ||||
Entrada Therapeutics, Inc.† | 6,953 | 98,524 | ||||
Halozyme Therapeutics, Inc.† | 7,381 | 300,259 | ||||
Insmed, Inc.† | 2,000 | 54,260 | ||||
Intellia Therapeutics, Inc.† | 5,173 | 142,309 | ||||
Janux Therapeutics, Inc.† | 3,688 | 138,853 | ||||
Kiniksa Pharmaceuticals Ltd. Class A† | 9,007 | 177,708 | ||||
Krystal Biotech, Inc.† | 835 | 148,571 | ||||
Madrigal Pharmaceuticals, Inc.† | 221 | 59,016 | ||||
MiMedx Group, Inc.† | 16,409 | 126,349 | ||||
Nuvalent, Inc. Class A† | 1,300 | 97,617 | ||||
Prothena Corp. PLC† | 1,219 | 30,195 | ||||
Relay Therapeutics, Inc.† | 5,560 | 46,148 | ||||
REVOLUTION Medicines, Inc.† | 1,870 | 60,270 | ||||
Ultragenyx Pharmaceutical, Inc.† | 1,255 | 58,596 | ||||
Vaxcyte, Inc.† | 2,101 | 143,519 | ||||
Veracyte, Inc.† | 5,398 | 119,620 | ||||
Shares | Value | |||||
Biotechnology(continued) | ||||||
Viking Therapeutics, Inc.† | 2,155 | $176,710 | ||||
Voyager Therapeutics, Inc.† | 19,855 | 184,850 | ||||
4,128,813 | ||||||
Health care equipment & supplies: 1.98% | ||||||
Axonics, Inc.† | 2,060 | 142,078 | ||||
Embecta Corp. | 4,925 | 65,355 | ||||
Haemonetics Corp.† | 999 | 85,265 | ||||
Inmode Ltd.† | 4,415 | 95,408 | ||||
Lantheus Holdings, Inc.† | 4,567 | 284,250 | ||||
LivaNova PLC† | 5,398 | 301,964 | ||||
Merit Medical Systems, Inc.† | 2,339 | 177,179 | ||||
Omnicell, Inc.† | 1,415 | 41,361 | ||||
1,192,860 | ||||||
Health care providers & services: 2.79% | ||||||
Accolade, Inc.† | 4,799 | 50,294 | ||||
Addus HomeCare Corp.† | 2,860 | 295,553 | ||||
Alignment Healthcare, Inc.† | 22,991 | 114,035 | ||||
Castle Biosciences, Inc.† | 6,309 | 139,744 | ||||
Guardant Health, Inc.† | 7,699 | 158,830 | ||||
Hims & Hers Health, Inc.† | 7,047 | 109,017 | ||||
NeoGenomics, Inc.† | 12,345 | 194,063 | ||||
Privia Health Group, Inc.† | 5,211 | 102,084 | ||||
Progyny, Inc.† | 3,624 | 138,256 | ||||
Select Medical Holdings Corp. | 3,814 | 114,992 | ||||
Tenet Healthcare Corp.† | 2,544 | 267,400 | ||||
1,684,268 | ||||||
Health care technology: 0.18% | ||||||
Schrodinger, Inc.† | 3,895 | 105,165 | ||||
Life sciences tools & services: 0.24% | ||||||
Quanterix Corp.† | 6,156 | 145,035 | ||||
Pharmaceuticals: 2.72% | ||||||
Amneal Pharmaceuticals, Inc.† | 29,449 | 178,461 | ||||
Amphastar Pharmaceuticals, Inc.† | 4,465 | 196,058 | ||||
ANI Pharmaceuticals, Inc.† | 3,656 | 252,739 | ||||
Arvinas, Inc.† | 7,305 | 301,550 | ||||
Collegium Pharmaceutical, Inc.† | 3,223 | 125,117 | ||||
Corcept Therapeutics, Inc.† | 11,170 | 281,372 | ||||
Harmony Biosciences Holdings, Inc.† | 9,118 | 306,183 | ||||
1,641,480 | ||||||
Shares | Value | |||||
Industrials: 18.39% | ||||||
Aerospace & defense: 0.95% | ||||||
Moog, Inc. Class A | 2,060 | $328,879 | ||||
V2X, Inc.† | 5,229 | 244,247 | ||||
573,126 | ||||||
Building products: 1.75% | ||||||
Griffon Corp. | 4,956 | 363,473 | ||||
Janus International Group, Inc.† | 25,017 | 378,507 | ||||
Simpson Manufacturing Co., Inc. | 1,520 | 311,874 | ||||
1,053,854 | ||||||
Commercial services & supplies: 0.77% | ||||||
ACCO Brands Corp. | 9,417 | 52,829 | ||||
Brink’s Co. | 1,282 | 118,431 | ||||
Cimpress PLC† | 2,118 | 187,464 | ||||
Ennis, Inc. | 5,229 | 107,247 | ||||
465,971 | ||||||
Construction & engineering: 2.42% | ||||||
Comfort Systems USA, Inc. | 1,583 | 502,935 | ||||
EMCOR Group, Inc. | 768 | 268,954 | ||||
MYR Group, Inc.† | 1,307 | 231,012 | ||||
Primoris Services Corp. | 8,676 | 369,337 | ||||
Sterling Infrastructure, Inc.† | 819 | 90,344 | ||||
1,462,582 | ||||||
Electrical equipment: 2.87% | ||||||
Array Technologies, Inc.† | 9,334 | 139,170 | ||||
Atkore, Inc. | 2,767 | 526,726 | ||||
Encore Wire Corp. | 1,415 | 371,834 | ||||
Fluence Energy, Inc.† | 4,410 | 76,469 | ||||
NEXTracker, Inc. Class A† | 4,623 | 260,136 | ||||
Powell Industries, Inc. | 2,532 | 360,304 | ||||
1,734,639 | ||||||
Ground transportation: 0.72% | ||||||
ArcBest Corp. | 3,052 | 434,910 | ||||
Machinery: 2.71% | ||||||
Alamo Group, Inc. | 588 | 134,258 | ||||
Blue Bird Corp.† | 6,253 | 239,740 | ||||
Enerpac Tool Group Corp. | 5,006 | 178,514 | ||||
Hillenbrand, Inc. | 2,809 | 141,264 | ||||
Mueller Industries, Inc. | 5,459 | 294,404 | ||||
Shyft Group, Inc. | 8,242 | 102,366 | ||||
Tennant Co. | 1,499 | 182,293 | ||||
Terex Corp. | 5,073 | 326,701 | ||||
Titan International, Inc.† | 2,669 | 33,256 | ||||
1,632,796 | ||||||
Shares | Value | |||||
Marine transportation: 0.55% | ||||||
Costamare, Inc. | 9,579 | $108,722 | ||||
Matson, Inc. | 1,990 | 223,676 | ||||
332,398 | ||||||
Professional services: 2.44% | ||||||
CBIZ, Inc.† | 1,425 | 111,863 | ||||
ExlService Holdings, Inc.† | 5,577 | 177,349 | ||||
Insperity, Inc. | 2,818 | 308,881 | ||||
Kelly Services, Inc. Class A | 7,504 | 187,900 | ||||
Legalzoom.com, Inc.† | 19,141 | 255,341 | ||||
Parsons Corp.† | 1,694 | 140,517 | ||||
TriNet Group, Inc. | 2,184 | 289,358 | ||||
1,471,209 | ||||||
Trading companies & distributors: 3.21% | ||||||
Applied Industrial Technologies, Inc. | 2,683 | 530,027 | ||||
Boise Cascade Co. | 2,898 | 444,466 | ||||
GMS, Inc.† | 3,208 | 312,267 | ||||
H&E Equipment Services, Inc. | 1,771 | 113,663 | ||||
Rush Enterprises, Inc. Class A | 6,991 | 374,158 | ||||
WESCO International, Inc. | 934 | 159,975 | ||||
1,934,556 | ||||||
Information technology: 14.02% | ||||||
Communications equipment: 0.09% | ||||||
Calix, Inc.† | 1,624 | 53,852 | ||||
Electronic equipment, instruments & components: 3.34% | ||||||
Arlo Technologies, Inc.† | 32,011 | 404,939 | ||||
Bel Fuse, Inc. Class B | 2,450 | 147,759 | ||||
Fabrinet† | 2,577 | 487,105 | ||||
Mirion Technologies, Inc.† | 28,770 | 327,115 | ||||
Sanmina Corp.† | 6,774 | 421,207 | ||||
TTM Technologies, Inc.† | 14,568 | 227,989 | ||||
2,016,114 | ||||||
IT services: 0.63% | ||||||
Fastly, Inc. Class A† | 5,949 | 77,159 | ||||
Perficient, Inc.† | 1,845 | 103,855 | ||||
Squarespace, Inc. Class A† | 5,494 | 200,201 | ||||
381,215 | ||||||
Semiconductors & semiconductor equipment: 3.83% | ||||||
ACM Research, Inc. Class A† | 13,434 | 391,467 | ||||
Amkor Technology, Inc. | 9,782 | 315,372 | ||||
Axcelis Technologies, Inc.† | 2,482 | 276,792 | ||||
Diodes, Inc.† | 1,403 | 98,911 | ||||
Onto Innovation, Inc.† | 980 | 177,458 | ||||
Photronics, Inc.† | 11,865 | 336,017 | ||||
Shares | Value | |||||
Semiconductors & semiconductor equipment(continued) | ||||||
Rambus, Inc.† | 4,970 | $307,196 | ||||
SMART Global Holdings, Inc.† | 15,549 | 409,250 | ||||
2,312,463 | ||||||
Software: 4.50% | ||||||
Adeia, Inc. | 19,200 | 209,664 | ||||
Amplitude, Inc. Class A† | 7,570 | 82,362 | ||||
Appfolio, Inc. Class A† | 694 | 171,238 | ||||
C3.ai, Inc. Class A† | 2,299 | 62,234 | ||||
Clear Secure, Inc. Class A | 11,249 | 239,266 | ||||
eGain Corp.† | 14,239 | 91,842 | ||||
Freshworks, Inc. Class A† | 7,994 | 145,571 | ||||
Intapp, Inc.† | 6,610 | 226,723 | ||||
InterDigital, Inc. | 3,011 | 320,551 | ||||
LiveRamp Holdings, Inc.† | 6,519 | 224,905 | ||||
Olo, Inc. Class A† | 23,029 | 126,429 | ||||
PagerDuty, Inc.† | 3,942 | 89,405 | ||||
Sprout Social, Inc. Class A† | 885 | 52,843 | ||||
SPS Commerce, Inc.† | 1,718 | 317,658 | ||||
Tenable Holdings, Inc.† | 2,156 | 106,571 | ||||
Zeta Global Holdings Corp. Class A† | 22,685 | 247,947 | ||||
2,715,209 | ||||||
Technology hardware, storage & peripherals: 1.63% | ||||||
Super Micro Computer, Inc.† | 971 | 980,739 | ||||
Materials: 4.88% | ||||||
Chemicals: 2.10% | ||||||
Hawkins, Inc. | 1,927 | 147,994 | ||||
Koppers Holdings, Inc. | 5,764 | 318,000 | ||||
Minerals Technologies, Inc. | 3,245 | 244,283 | ||||
Orion SA | 11,741 | 276,148 | ||||
Quaker Chemical Corp. | 858 | 176,104 | ||||
Tronox Holdings PLC | 5,939 | 103,042 | ||||
1,265,571 | ||||||
Containers & packaging: 0.31% | ||||||
O-I Glass, Inc.† | 11,196 | 185,742 | ||||
Metals & mining: 1.99% | ||||||
Arch Resources, Inc. | 771 | 123,969 | ||||
Commercial Metals Co. | 5,540 | 325,586 | ||||
Constellium SE† | 13,936 | 308,125 | ||||
Radius Recycling, Inc. Class A | 4,306 | 90,986 | ||||
Ryerson Holding Corp. | 4,302 | 144,117 | ||||
SunCoke Energy, Inc. | 18,848 | 212,417 | ||||
1,205,200 | ||||||
Paper & forest products: 0.48% | ||||||
Clearwater Paper Corp.† | 6,604 | 288,793 | ||||
Shares | Value | |||||
Real estate: 5.23% | ||||||
Diversified REITs: 0.95% | ||||||
Broadstone Net Lease, Inc. | 15,840 | $248,213 | ||||
Essential Properties Realty Trust, Inc. | 12,140 | 323,652 | ||||
571,865 | ||||||
Health care REITs: 0.35% | ||||||
CareTrust REIT, Inc. | 6,176 | 150,509 | ||||
National Health Investors, Inc. | 989 | 62,139 | ||||
212,648 | ||||||
Hotel & resort REITs: 1.26% | ||||||
Braemar Hotels & Resorts, Inc. | 34,427 | 68,854 | ||||
DiamondRock Hospitality Co. | 26,865 | 258,173 | ||||
RLJ Lodging Trust | 6,802 | 80,400 | ||||
Ryman Hospitality Properties, Inc. | 3,048 | 352,379 | ||||
759,806 | ||||||
Real estate management & development: 0.95% | ||||||
Forestar Group, Inc.† | 8,515 | 342,218 | ||||
Newmark Group, Inc. Class A | 21,147 | 234,520 | ||||
576,738 | ||||||
Residential REITs : 0.67% | ||||||
BRT Apartments Corp. | 11,891 | 199,769 | ||||
NexPoint Residential Trust, Inc. | 6,303 | 202,893 | ||||
402,662 | ||||||
Retail REITs : 0.59% | ||||||
Getty Realty Corp. | 3,651 | 99,855 | ||||
Urban Edge Properties | 14,720 | 254,214 | ||||
354,069 | ||||||
Specialized REITs : 0.46% | ||||||
Uniti Group, Inc. | 46,866 | 276,510 | ||||
Utilities: 2.29% | ||||||
Electric utilities: 0.63% | ||||||
Otter Tail Corp. | 4,420 | 381,888 | ||||
Gas utilities: 0.78% | ||||||
Brookfield Infrastructure Corp. Class A | 3,556 | 128,158 | ||||
New Jersey Resources Corp. | 5,124 | 219,871 | ||||
Southwest Gas Holdings, Inc. | 1,640 | 124,853 | ||||
472,882 | ||||||
Independent power and renewable electricity producers: 0.25% | ||||||
Clearway Energy, Inc. Class A | 6,915 | 148,742 | ||||
Shares | Value | |||||
Multi-utilities: 0.39% | ||||||
Black Hills Corp. | 1,486 | $81,136 | ||||
Northwestern Energy Group, Inc. | 3,039 | 154,776 | ||||
235,912 | ||||||
Water utilities: 0.24% | ||||||
Consolidated Water Co. Ltd. | 4,834 | 141,684 | ||||
Total common stocks (Cost $50,153,135) | 58,559,786 | |||||
Expiration date | ||||||
Rights: 0.00% | ||||||
Health care: 0.00% | ||||||
Biotechnology: 0.00% | ||||||
Aduro Biotech, Inc.♦† | 10-2-2030 | 4,415 | 0 | |||
Life sciences tools & services: 0.00% | ||||||
OmniAb, Inc. $12.50 Earnout shares♦† | 11-2-2027 | 104 | 0 | |||
OmniAb, Inc. $15.00 Earnout shares♦† | 11-2-2027 | 104 | 0 | |||
Total rights (Cost $0) | 0 | |||||
Yield | ||||||
Short-term investments: 2.73% | ||||||
Investment companies: 2.73% | ||||||
Allspring Government Money Market Fund Select Class♠∞ | 5.25 % | 1,643,149 | 1,643,149 | |||
Total short-term investments (Cost $1,643,149) | 1,643,149 | |||||
Total investments in securities (Cost $51,796,284) | 99.79 % | 60,202,935 | ||||
Other assets and liabilities, net | 0.21 | 129,499 | ||||
Total net assets | 100.00 % | $60,332,434 | ||||
† | Non-income-earning security |
♦ | The security is fair valued in accordance with procedures approved by the Board of Trustees. |
♠ | The issuer of the security is an affiliated person of the Fund as defined in the Investment Company Act of 1940. |
∞ | The rate represents the 7-day annualized yield at period end. |
Abbreviations: | |
REIT | Real estate investment trust |
Value, beginning of period | Purchases | Sales proceeds | Net realized gains (losses) | Net change in unrealized gains (losses) | Value, end of period | Shares, end of period | Income from affiliated securities | |
Short-term investments | ||||||||
Allspring Government Money Market Fund Select Class | $292,998 | $40,751,356 | $(39,401,205 ) | $0 | $0 | $1,643,149 | 1,643,149 | $37,015 |
Description | Number of contracts | Expiration date | Notional cost | Notional value | Unrealized gains | Unrealized losses |
Long | ||||||
Micro E-Mini Russell 2000 Index | 157 | 6-21-2024 | $1,624,726 | $1,684,532 | $59,806 | $0 |
Assets | |
Investments in unaffiliated securities, at value (cost $50,153,135) | $58,559,786 |
Investments in affiliated securities, at value (cost $1,643,149) | 1,643,149 |
Cash | 16,550 |
Cash at broker segregated for futures contracts | 117,650 |
Receivable for dividends | 61,383 |
Receivable for Fund shares sold | 43,171 |
Receivable for daily variation margin on open futures contracts | 5,887 |
Receivable from manager | 2,031 |
Prepaid expenses and other assets | 30,320 |
Total assets | 60,479,927 |
Liabilities | |
Payable for Fund shares redeemed | 109,254 |
Professional fees payable | 15,139 |
Custody and accounting fees payable | 8,729 |
Administration fees payable | 3,112 |
Accrued expenses and other liabilities | 11,259 |
Total liabilities | 147,493 |
Total net assets | $60,332,434 |
Net assets consist of | |
Paid-in capital | $49,871,080 |
Total distributable earnings | 10,461,354 |
Total net assets | $60,332,434 |
Computation of net asset value and offering price per share | |
Net assets–Class A | $1,251,515 |
Shares outstanding–Class A1 | 92,803 |
Net asset value per share–Class A | $13.49 |
Maximum offering price per share – Class A2 | $14.31 |
Net assets–Class R6 | $40,212,598 |
Shares outstanding–Class R61 | 3,030,051 |
Net asset value per share–Class R6 | $13.27 |
Net assets–Administrator Class | $17,312,036 |
Shares outstanding–Administrator Class1 | 1,298,839 |
Net asset value per share–Administrator Class | $13.33 |
Net assets–Institutional Class | $1,556,285 |
Shares outstanding–Institutional Class1 | 117,071 |
Net asset value per share–Institutional Class | $13.29 |
Investment income | |
Dividends (net of foreign withholdings taxes of $1,540) | $349,089 |
Income from affiliated securities | 37,015 |
Interest | 2,615 |
Total investment income | 388,719 |
Expenses | |
Management fee | 134,231 |
Administration fees | |
Class A | 1,562 |
Class R6 | 2,865 |
Administrator Class | 20,017 |
Institutional Class | 1,462 |
Shareholder servicing fees | |
Class A | 1,936 |
Administrator Class | 38,485 |
Custody and accounting fees | 1,199 |
Professional fees | 73,252 |
Registration fees | 60,672 |
Shareholder report expenses | 26,480 |
Trustees’ fees and expenses | 23,333 |
Other fees and expenses | 19,928 |
Total expenses | 405,422 |
Less: Fee waivers and/or expense reimbursements | |
Fund-level | (155,729 ) |
Class A | (2,390 ) |
Administrator Class | (54,120 ) |
Institutional Class | (1,462 ) |
Net expenses | 191,721 |
Net investment income | 196,998 |
Realized and unrealized gains (losses) on investments | |
Net realized gains on | |
Unaffiliated securities | 1,838,994 |
Futures contracts | 101,852 |
Net realized gains on investments | 1,940,846 |
Net change in unrealized gains (losses) on | |
Unaffiliated securities | 6,517,411 |
Futures contracts | 52,123 |
Net change in unrealized gains (losses) on investments | 6,569,534 |
Net realized and unrealized gains (losses) on investments | 8,510,380 |
Net increase in net assets resulting from operations | $8,707,378 |
Year ended March 31, 2024 | Year ended March 31, 2023 | |||
Operations | ||||
Net investment income | $196,998 | $74,660 | ||
Net realized gains on investments | 1,940,846 | 1,231,396 | ||
Net change in unrealized gains (losses) on investments | 6,569,534 | (3,123,590 ) | ||
Net increase (decrease) in net assets resulting from operations | 8,707,378 | (1,817,534 ) | ||
Distributions to shareholders from | ||||
Net investment income and net realized gains | ||||
Class A | (21,801 ) | (607 ) | ||
Class R6 | (703,060 ) | (827 ) | ||
Administrator Class | (388,225 ) | (36,866 ) | ||
Institutional Class | (36,761 ) | (6,230 ) | ||
Total distributions to shareholders | (1,149,847 ) | (44,530 ) | ||
Capital share transactions | Shares | Shares | ||
Proceeds from shares sold | ||||
Class A | 51,043 | 611,403 | 15,260 | 157,891 |
Class R6 | 3,134,791 | 37,786,354 | 2,502 | 25,730 |
Administrator Class | 39,518 | 467,511 | 90,405 | 976,883 |
Institutional Class | 45,964 | 511,716 | 8,916 | 97,686 |
39,376,984 | 1,258,190 | |||
Reinvestment of distributions | ||||
Class A | 1,861 | 21,801 | 56 | 607 |
Class R6 | 60,802 | 703,060 | 78 | 827 |
Administrator Class | 33,286 | 385,705 | 3,445 | 36,618 |
Institutional Class | 3,178 | 36,761 | 590 | 6,230 |
1,147,327 | 44,282 | |||
Payment for shares redeemed | ||||
Class A | (12,764 ) | (152,376 ) | (18,692 ) | (204,318 ) |
Class R6 | (183,935 ) | (2,281,091 ) | (4,449 ) | (44,697 ) |
Administrator Class | (161,280 ) | (1,867,622 ) | (493,159 ) | (5,220,002 ) |
Institutional Class | (14,583 ) | (170,863 ) | (28,806 ) | (301,809 ) |
(4,471,952 ) | (5,770,826 ) | |||
Net increase (decrease) in net assets resulting from capital share transactions | 36,052,359 | (4,468,354 ) | ||
Total increase (decrease) in net assets | 43,609,890 | (6,330,418 ) | ||
Net assets | ||||
Beginning of period | 16,722,544 | 23,052,962 | ||
End of period | $60,332,434 | $16,722,544 | ||
Year ended March 31 | |||||
Class A | 2024 | 2023 | 2022 | 2021 | 2020 |
Net asset value, beginning of period | $10.98 | $11.82 | $11.67 | $6.12 | $8.39 |
Net investment income (loss) | 0.07 1 | 0.04 | 0.01 1 | (0.05 )1 | (0.00 )1,2 |
Net realized and unrealized gains (losses) on investments | 2.73 | (0.86 ) | 0.14 | 5.60 | (2.22 ) |
Total from investment operations | 2.80 | (0.82 ) | 0.15 | 5.55 | (2.22 ) |
Distributions to shareholders from | |||||
Net investment income | (0.01 ) | (0.01 ) | 0.00 | 0.00 | (0.05 ) |
Net realized gains | (0.28 ) | (0.01 ) | 0.00 | 0.00 | 0.00 |
Total distributions to shareholders | (0.29 ) | (0.02 ) | 0.00 | 0.00 | (0.05 ) |
Net asset value, end of period | $13.49 | $10.98 | $11.82 | $11.67 | $6.12 |
Total return3 | 25.98 % | (7.01 )% | 1.29 % | 90.69 % | (26.67 )% |
Ratios to average net assets (annualized) | |||||
Gross expenses | 1.81 % | 2.10 % | 1.74 % | 1.81 % | 1.40 % |
Net expenses | 0.87 % | 0.91 % | 0.91 % | 0.93 % | 0.93 % |
Net investment income (loss) | 0.62 % | 0.35 % | 0.05 % | (0.53 )% | (0.05 )% |
Supplemental data | |||||
Portfolio turnover rate | 57 % | 53 % | 39 % | 48 % | 67 % |
Net assets, end of period (000s omitted) | $1,252 | $578 | $662 | $991 | $102 |
1 | Calculated based upon average shares outstanding |
2 | Amount is more than $(0.005). |
3 | Total return calculations do not include any sales charges. |
Year ended March 31 | |||||
Class R6 | 2024 | 2023 | 2022 | 2021 | 2020 |
Net asset value, beginning of period | $10.78 | $11.64 | $11.45 | $6.15 | $8.50 |
Net investment income | 0.10 1 | 0.08 1 | 0.06 1 | 0.04 1 | 0.08 1 |
Net realized and unrealized gains (losses) on investments | 2.70 | (0.89 ) | 0.14 | 5.51 | (2.35 ) |
Total from investment operations | 2.80 | (0.81 ) | 0.20 | 5.55 | (2.27 ) |
Distributions to shareholders from | |||||
Net investment income | (0.03 ) | (0.04 ) | (0.01 ) | (0.25 ) | (0.08 ) |
Net realized gains | (0.28 ) | (0.01 ) | 0.00 | 0.00 | 0.00 |
Total distributions to shareholders | (0.31 ) | (0.05 ) | (0.01 ) | (0.25 ) | (0.08 ) |
Net asset value, end of period | $13.27 | $10.78 | $11.64 | $11.45 | $6.15 |
Total return | 26.46 % | (6.98 )% | 1.76 % | 90.71 % | (27.03 )% |
Ratios to average net assets (annualized) | |||||
Gross expenses | 1.07 % | 1.67 % | 1.32 % | 1.42 % | 0.89 % |
Net expenses | 0.50 % | 0.50 % | 0.50 % | 0.50 % | 0.50 % |
Net investment income | 0.84 % | 0.76 % | 0.49 % | 0.51 % | 0.95 % |
Supplemental data | |||||
Portfolio turnover rate | 57 % | 53 % | 39 % | 48 % | 67 % |
Net assets, end of period (000s omitted) | $40,213 | $198 | $236 | $155 | $141 |
1 | Calculated based upon average shares outstanding |
Year ended March 31 | |||||
Administrator Class | 2024 | 2023 | 2022 | 2021 | 2020 |
Net asset value, beginning of period | $10.85 | $11.73 | $11.59 | $6.10 | $8.40 |
Net investment income | 0.08 1 | 0.06 | 0.02 | 0.02 | 0.02 1 |
Net realized and unrealized gains (losses) on investments | 2.69 | (0.91 ) | 0.14 | 5.47 | (2.27 ) |
Total from investment operations | 2.77 | (0.85 ) | 0.16 | 5.49 | (2.25 ) |
Distributions to shareholders from | |||||
Net investment income | (0.01 ) | (0.02 ) | (0.02 ) | (0.00 )2 | (0.05 ) |
Net realized gains | (0.28 ) | (0.01 ) | 0.00 | 0.00 | 0.00 |
Total distributions to shareholders | (0.29 ) | (0.03 ) | (0.02 ) | (0.00 )2 | (0.05 ) |
Net asset value, end of period | $13.33 | $10.85 | $11.73 | $11.59 | $6.10 |
Total return | 26.03 % | (7.28 )% | 1.37 % | 90.04 % | (26.99 )% |
Ratios to average net assets (annualized) | |||||
Gross expenses | 1.77 % | 2.01 % | 1.67 % | 1.75 % | 1.25 % |
Net expenses | 0.85 % | 0.85 % | 0.85 % | 0.85 % | 0.85 % |
Net investment income | 0.66 % | 0.40 % | 0.12 % | 0.17 % | 0.27 % |
Supplemental data | |||||
Portfolio turnover rate | 57 % | 53 % | 39 % | 48 % | 67 % |
Net assets, end of period (000s omitted) | $17,312 | $15,055 | $20,963 | $24,318 | $17,049 |
1 | Calculated based upon average shares outstanding |
2 | Amount is less than $0.005. |
Year ended March 31 | |||||
Institutional Class | 2024 | 2023 | 2022 | 2021 | 2020 |
Net asset value, beginning of period | $10.80 | $11.71 | $11.60 | $6.10 | $8.48 |
Net investment income | 0.11 1 | 0.07 1 | 0.04 1 | 0.04 1 | 0.06 1 |
Net realized and unrealized gains (losses) on investments | 2.68 | (0.90 ) | 0.16 | 5.47 | (2.28 ) |
Total from investment operations | 2.79 | (0.83 ) | 0.20 | 5.51 | (2.22 ) |
Distributions to shareholders from | |||||
Net investment income | (0.02 ) | (0.07 ) | (0.09 ) | (0.01 ) | (0.16 ) |
Net realized gains | (0.28 ) | (0.01 ) | 0.00 | 0.00 | 0.00 |
Total distributions to shareholders | (0.30 ) | (0.08 ) | (0.09 ) | (0.01 ) | (0.16 ) |
Net asset value, end of period | $13.29 | $10.80 | $11.71 | $11.60 | $6.10 |
Total return | 26.30 % | (7.09 )% | 1.68 % | 90.34 % | (26.80 )% |
Ratios to average net assets (annualized) | |||||
Gross expenses | 1.48 % | 1.76 % | 1.42 % | 1.51 % | 0.94 % |
Net expenses | 0.60 % | 0.60 % | 0.60 % | 0.60 % | 0.60 % |
Net investment income | 0.91 % | 0.65 % | 0.36 % | 0.47 % | 0.69 % |
Supplemental data | |||||
Portfolio turnover rate | 57 % | 53 % | 39 % | 48 % | 67 % |
Net assets, end of period (000s omitted) | $1,556 | $891 | $1,192 | $1,708 | $1,586 |
1 | Calculated based upon average shares outstanding |
Gross unrealized gains | $9,338,168 |
Gross unrealized losses | (1,068,525 ) |
Net unrealized gains | $8,269,643 |
Quoted prices (Level 1) | Other significant observable inputs (Level 2) | Significant unobservable inputs (Level 3) | Total | |
Assets | ||||
Investments in: | ||||
Common stocks | ||||
Communication services | $1,208,751 | $0 | $0 | $1,208,751 |
Consumer discretionary | 6,271,384 | 0 | 0 | 6,271,384 |
Consumer staples | 1,968,257 | 0 | 0 | 1,968,257 |
Energy | 4,031,773 | 0 | 0 | 4,031,773 |
Financials | 9,145,655 | 0 | 0 | 9,145,655 |
Health care | 8,897,621 | 0 | 0 | 8,897,621 |
Industrials | 11,096,041 | 0 | 0 | 11,096,041 |
Information technology | 8,459,592 | 0 | 0 | 8,459,592 |
Materials | 2,945,306 | 0 | 0 | 2,945,306 |
Real estate | 3,154,298 | 0 | 0 | 3,154,298 |
Utilities | 1,381,108 | 0 | 0 | 1,381,108 |
Rights | ||||
Health care | 0 | 0 | 0 | 0 |
Short-term investments | ||||
Investment companies | 1,643,149 | 0 | 0 | 1,643,149 |
60,202,935 | 0 | 0 | 60,202,935 | |
Futures contracts | 59,806 | 0 | 0 | 59,806 |
Total assets | $60,262,741 | $0 | $0 | $60,262,741 |
Average daily net assets | Management fee |
First $1 billion | 0.500 % |
Next $4 billion | 0.475 |
Next $5 billion | 0.440 |
Over $10 billion | 0.430 |
Class-level administration fee | |
Class A | 0.20 % |
Class R6 | 0.03 |
Administrator Class | 0.13 |
Institutional Class | 0.13 |
EXPENSE RATIO CAPS | |
Class A | 0.92 % |
Class R6 | 0.50 |
Administrator Class | 0.85 |
Institutional Class | 0.60 |
Year ended March 31 | ||
2024 | 2023 | |
Ordinary income | $92,651 | $35,189 |
Long-term capital gain | 1,057,196 | 9,341 |
Undistributed ordinary income | Undistributed long-term gain | Unrealized gains |
$771,452 | $1,420,259 | $8,269,643 |
Allspring Funds Trust:

March 31, 2024.
Name and year of birth | Position held and length of service* | Principal occupations during past five years or longer | Current other public company or investment company directorships |
William R. Ebsworth (Born 1957) | Trustee, since 2015 | Retired. From 1984 to 2013, equities analyst, portfolio manager, research director and chief investment officer at Fidelity Management and Research Company in Boston, Tokyo, and Hong Kong, and retired in 2013 as Chief Investment Officer of Fidelity Strategic Advisers, Inc. where he led a team of investment professionals managing client assets. Prior thereto, Board member of Hong Kong Securities Clearing Co., Hong Kong Options Clearing Corp., the Thailand International Fund, Ltd., Fidelity Investments Life Insurance Company, and Empire Fidelity Investments Life Insurance Company. Serves on the Investment Company Institute’s Board of Governors since 2022 and Executive Committee since 2023 as well as the Vice Chairman of the Governing Council of the Independent Directors Council since 2023. Audit Committee Chair and Investment Committee Chair of the Vincent Memorial Hospital Foundation (non-profit organization). Mr. Ebsworth is a CFA charterholder. | N/A |
Jane A. Freeman (Born 1953) | Trustee, since 2015; Chair Liaison, since January 2018# | Retired. From 2012 to 2014 and 1999 to 2008, Chief Financial Officer of Scientific Learning Corporation. From 2008 to 2012, Ms. Freeman provided consulting services related to strategic business projects. Prior to 1999, Portfolio Manager at Rockefeller & Co. and Scudder, Stevens & Clark. Board member of the Harding Loevner Funds from 1996 to 2014, serving as both Lead Independent Director and chair of the Audit Committee. Board member of the Russell Exchange Traded Funds Trust from 2011 to 2012 and the chair of the Audit Committee. Ms. Freeman is also an inactive Chartered Financial Analyst. | N/A |
Isaiah Harris, Jr. (Born 1952) | Trustee, since 2009; Audit Committee Chair, since 2019 | Retired. Member of the Advisory Board of CEF of East Central Florida. Chairman of the Board of CIGNA Corporation from 2009 to 2021, and Director from 2005 to 2008. From 2003 to 2011, Director of Deluxe Corporation. Prior thereto, President and CEO of BellSouth Advertising and Publishing Corp. from 2005 to 2007, President and CEO of BellSouth Enterprises from 2004 to 2005 and President of BellSouth Consumer Services from 2000 to 2003. Emeritus member of the Iowa State University Foundation Board of Governors. Emeritus Member of the Advisory board of Iowa State University School of Business. Advisory Board Member, Palm Harbor Academy (private school). Advisory Board Member, Fellowship of Christian Athletes. Mr. Harris is a certified public accountant (inactive status). | N/A |
David F. Larcker (Born 1950) | Trustee, since 2009 | Distinguished Visiting Fellow at the Hoover Institution since 2022. James Irvin Miller Professor of Accounting at the Graduate School of Business (Emeritus), Stanford University, Director of the Corporate Governance Research Initiative and Senior Faculty of The Rock Center for Corporate Governance since 2006. From 2005 to 2008, Professor of Accounting at the Graduate School of Business, Stanford University. Prior thereto, Ernst & Young Professor of Accounting at The Wharton School, University of Pennsylvania from 1985 to 2005. | N/A |
Olivia S. Mitchell (Born 1953) | Trustee, since 2006; Nominating and Governance Committee Chair, since 2018 | International Foundation of Employee Benefit Plans Professor since 1993, Wharton School of the University of Pennsylvania. Director of Wharton’s Pension Research Council and Boettner Center on Pensions & Retirement Research, and Research Associate at the National Bureau of Economic Research. Previously taught at Cornell University from 1978 to 1993. | N/A |
Name and year of birth | Position held and length of service* | Principal occupations during past five years or longer | Current other public company or investment company directorships |
Timothy J. Penny (Born 1951) | Trustee, since 1996; Chair, since 2018 | President and Chief Executive Officer of Southern Minnesota Initiative Foundation, a non-profit organization, since 2007. Vice Chair of the Economic Club of Minnesota, since 2007. Co-Chair of the Committee for a Responsible Federal Budget, since 1995. Member of the Board of Trustees of NorthStar Education Finance, Inc., a non-profit organization, from 2007-2022. Senior Fellow of the University of Minnesota Humphrey Institute from 1995 to 2017. | N/A |
James G. Polisson (Born 1959) | Trustee, since 2018 | Retired. Chief Marketing Officer, Source (ETF) UK Services, Ltd, from 2015 to 2017. From 2012 to 2015, Principal of The Polisson Group, LLC, a management consulting, corporate advisory and principal investing company. Chief Executive Officer and Managing Director at Russell Investments, Global Exchange Traded Funds from 2010 to 2012. Managing Director of Barclays Global Investors from 1998 to 2010 and Global Chief Marketing Officer for iShares and Barclays Global Investors from 2000 to 2010. Trustee of the San Francisco Mechanics’ Institute, a non- profit organization, from 2013 to 2015. Board member of the Russell Exchange Traded Fund Trust from 2011 to 2012. Director of Barclays Global Investors Holdings Deutschland GmbH from 2006 to 2009. Mr. Polisson is an attorney and has a retired status with the Massachusetts and District of Columbia Bar Associations. | N/A |
Pamela Wheelock (Born 1959) | Trustee, since January 2020; previously Trustee from January 2018 to July 2019# | Retired. Executive and Senior Financial leadership positions in the public, private and nonprofit sectors. Interim President and CEO, McKnight Foundation, 2020. Interim Commissioner, Minnesota Department of Human Services, 2019. Chief Operating Officer, Twin Cities Habitat for Humanity, 2017-2019. Vice President for University Services, University of Minnesota, 2012- 2016. Interim President and CEO, Blue Cross and Blue Shield of Minnesota, 2011-2012. Executive Vice-President and Chief Financial Officer, Minnesota Wild, 2002-2008. Commissioner, Minnesota Department of Finance, 1999-2002. Chair of the Board of Directors of Destination Medical Center Corporation. Board member of the Minnesota Wild Foundation. | N/A |
Name and year of birth | Position held and length of service | Principal occupations during past five years or longer |
Andrew Owen (Born 1960) | President, since 2017 | President and Chief Executive Officer of Allspring Funds Management, LLC since 2017 and Head of Global Fund Governance of Allspring Global Investments since 2022. Prior thereto, co-president of Galliard Capital Management, LLC, an affiliate of Allspring Funds Management, LLC, from 2019 to 2022 and Head of Affiliated Managers, Allspring Global Investments, from 2014 to 2019 and Executive Vice President responsible for marketing, investments and product development for Allspring Funds Management, LLC, from 2009 to 2014. |
Jeremy DePalma (Born 1974) | Treasurer, since 2012 (for certain funds in the Fund Complex); since 2021 (for the remaining funds in the Complex) | Senior Vice President of Allspring Funds Management, LLC since 2009. Senior Vice President of Evergreen Investment Management Company, LLC from 2008 to 2010 and head of the Fund Reporting and Control Team within Fund Administration from 2005 to 2010. |
Christopher Baker (Born 1976) | Chief Compliance Officer, since 2022 | Global Chief Compliance Officer for Allspring Global Investments since 2022. Prior thereto, Chief Compliance Officer for State Street Global Advisors from 2018 to 2021. Senior Compliance Officer for the State Street divisions of Alternative Investment Solutions, Sector Solutions, and Global Marketing from 2015 to 2018. From 2010 to 2015 Vice President, Global Head of Investment and Marketing Compliance for State Street Global Advisors. |
Matthew Prasse (Born 1983) | Chief Legal Officer, since 2022; Secretary, since 2021 | Senior Counsel of the Allspring Legal Department since 2021. Senior Counsel of the Wells Fargo Legal Department from 2018 to 2021. Previously, Counsel for Barings LLC from 2015 to 2018. Prior to joining Barings, Associate at Morgan, Lewis & Bockius LLP from 2008 to 2015. |

P.O. Box 219967
Kansas City, MO 64121-9967

AR4335 03-24
2 | |
6 | |
10 | |
11 | |
14 | |
15 | |
16 | |
17 | |
21 | |
26 | |
27 |

Allspring Funds

President
Allspring Funds
Notice to Shareholders |
Beginning in July 2024, the Fund will be required by the Securities and Exchange Commission to send shareholders a paper copy of a new tailored shareholder report in place of the full shareholder report that you are now receiving. The tailored shareholder report will contain concise information about the Fund, including certain expense and performance information and fund statistics. If you wish to receive this new tailored shareholder report electronically, please follow the instructions on the back cover of this report. |
Other information that is currently included in the shareholder report, such as the Fund’s financial statements, will be available online and upon request, free of charge, in paper or electronic format. |
Investment objective | The Fund seeks long-term capital appreciation. |
Manager | Allspring Funds Management, LLC |
Subadviser | Allspring Global Investments, LLC |
Portfolio managers | Nicholas Birk†, Michael T. Smith , CFA, Christopher J. Warner, CFA |
Average annual total returns (%) as of March 31, 2024 | |||||||||
Including sales charge | Excluding sales charge | Expense ratios1 (%) | |||||||
Inception date | 1 year | 5 year | 10 year | 1 year | 5 year | 10 year | Gross | Net2 | |
Class A (WFSTX) | 9-18-2000 | 21.77 | 11.19 | 14.34 | 29.24 | 12.51 | 15.02 | 1.30 | 1.22 |
Class C (WFTCX) | 9-18-2000 | 27.26 | 11.67 | 14.35 | 28.26 | 11.67 | 14.35 | 2.05 | 1.97 |
Administrator Class (WFTDX) | 7-30-2010 | – | – | – | 29.24 | 12.57 | 15.12 | 1.23 | 1.15 |
Institutional Class (WFTIX)3 | 10-31-2016 | – | – | – | 29.66 | 12.87 | 15.32 | 0.98 | 0.90 |
S&P 500 Index4 | – | – | – | – | 29.88 | 15.05 | 12.96 | – | – |
Russell 3000® Growth Index 5 | – | – | – | – | 37.95 | 17.82 | 15.43 | – | – |
1 | Reflects the expense ratios as stated in the most recent prospectuses. The expense ratios shown are subject to change and may differ from the annualized expense ratios shown in the Financial Highlights of this report. |
2 | The manager has contractually committed through July 31, 2024, to waive fees and/or reimburse expenses to the extent necessary to cap total annual fund operating expenses after fee waivers at 1.22% for Class A, 1.97% for Class C, 1.15% for Administrator Class and 0.90% for Institutional Class. Brokerage commissions, stamp duty fees, interest, taxes, acquired fund fees and expenses (if any), and extraordinary expenses are excluded from the expense caps. Prior to or after the commitment expiration date, the caps may be increased or the commitment to maintain the caps may be terminated only with the approval of the Board of Trustees. Without these caps, the Fund’s returns would have been lower. The expense ratio paid by an investor is the net expense ratio (the total annual fund operating expenses after fee waivers) as stated in the prospectuses. |
3 | Historical performance shown for the Institutional Class shares prior to their inception reflects the performance of the Administrator Class shares, and includes the higher expenses applicable to the Administrator Class shares. If these expenses had not been included, returns for the Institutional Class shares would be higher. |
4 | The S&P 500 Index consists of 500 stocks chosen for market size, liquidity, and industry group representation. It is a market-value-weighted index with each stock’s weight in the index proportionate to its market value. You cannot invest directly in an index. Effective August 1, 2023, the Fund has changed its primary benchmark from the Russell 3000® Growth Index to the S&P 500 Index to more accurately reflect the revised strategy of the Fund. |
5 | The Russell 3000® Growth Index measures the performance of those Russell 3000® Index companies with higher price/book ratios and higher forecasted growth values. You cannot invest directly in an index. |
† | Mr. Birk became a portfolio manager of the Fund on January 24, 2024. |
CFA® and Chartered Financial Analyst® are trademarks owned by CFA Institute. | |
Growth of $10,000 investment as of March 31, 20241 |
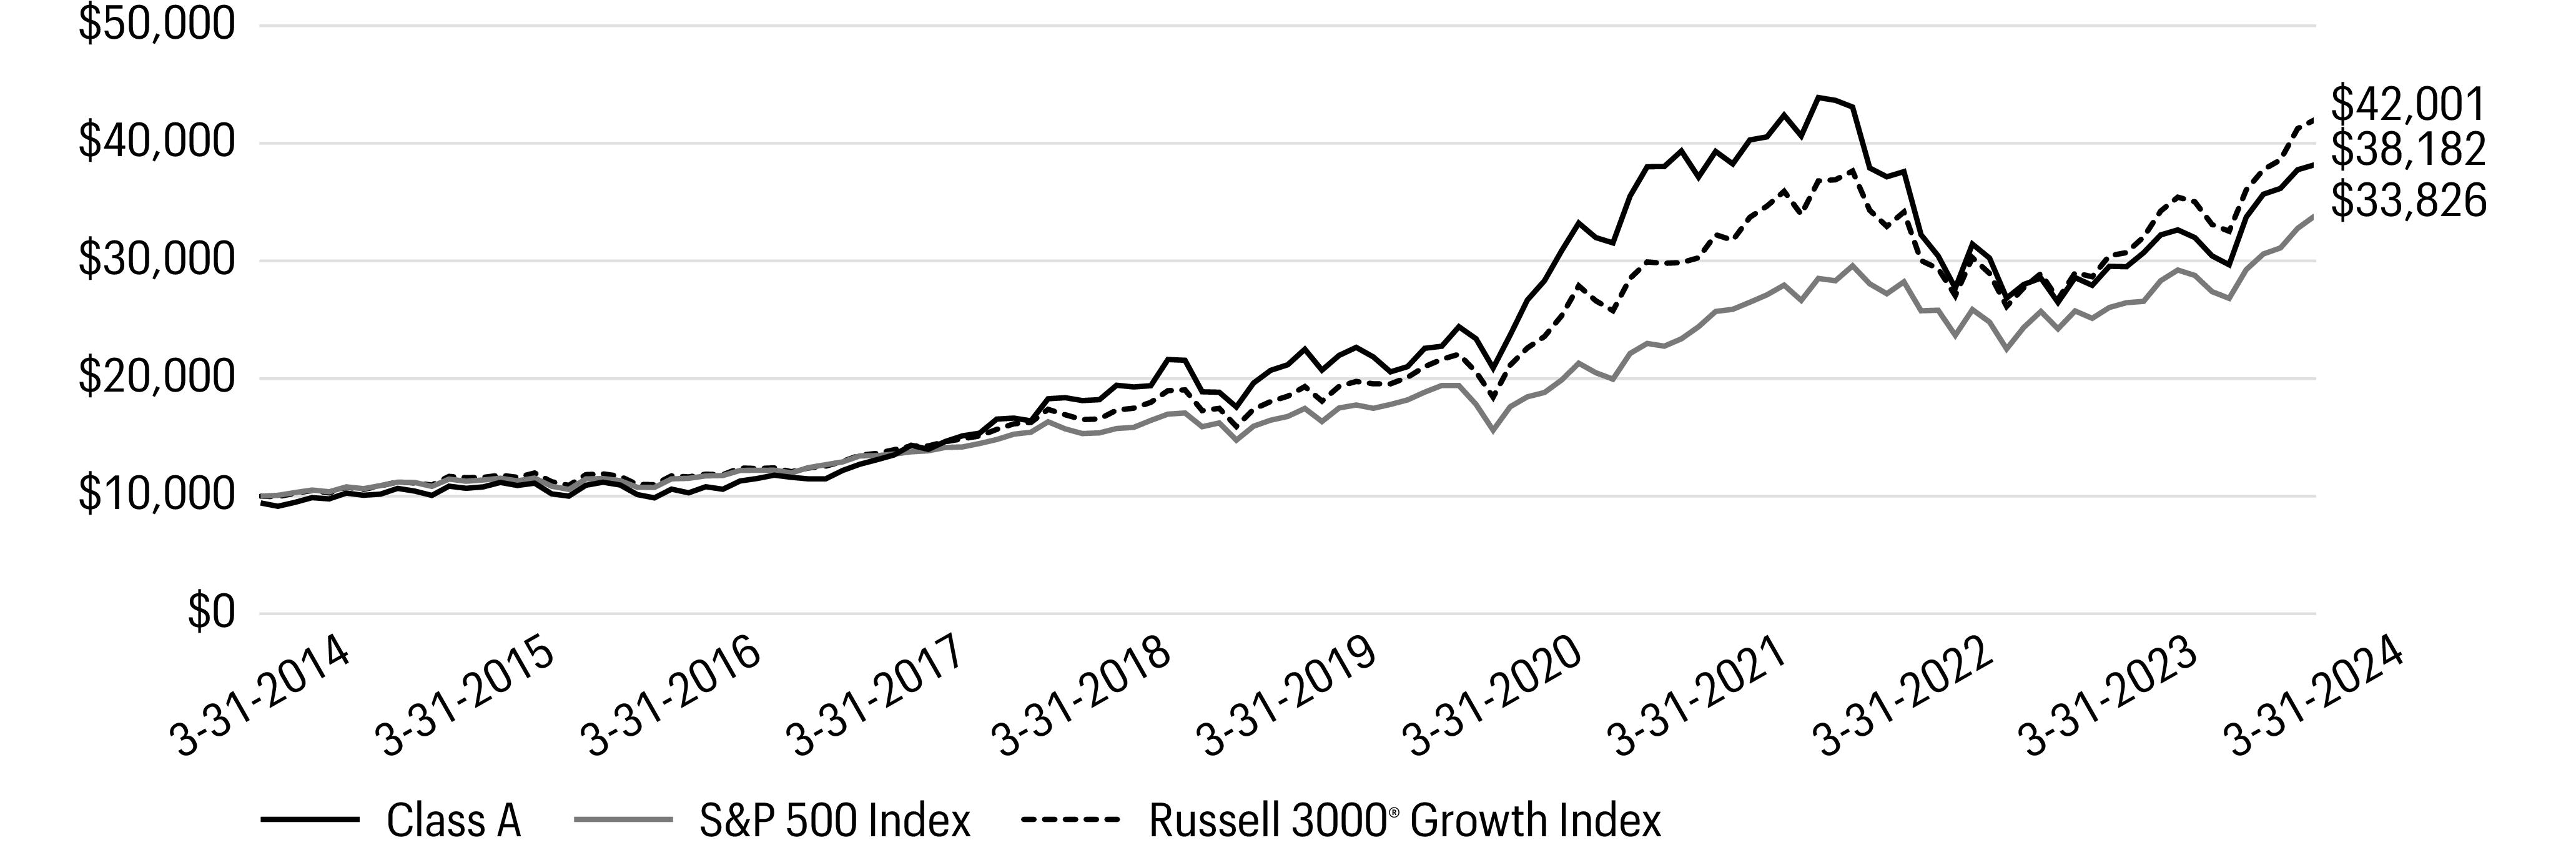
1 | The chart compares the performance of Class A shares for the most recent ten years with the S&P 500 Index and Russell 3000® Growth Index. The chart assumes a hypothetical investment of $10,000 in Class A shares and reflects all operating expenses and assumes the maximum initial sales charge of 5.75%. |
Ten largest holdings (%) as of March 31, 20241 | |
Chipotle Mexican Grill, Inc. | 3.25 |
Axon Enterprise, Inc. | 3.17 |
Trade Desk, Inc. Class A | 3.04 |
Copart, Inc. | 3.03 |
KLA Corp. | 3.02 |
Waste Connections, Inc. | 2.98 |
Viper Energy, Inc. | 2.96 |
Global-E Online Ltd. | 2.93 |
Motorola Solutions, Inc. | 2.93 |
Veeva Systems, Inc. Class A | 2.92 |
1 | Figures represent the percentage of the Fund’s net assets. Holdings are subject to change and may have changed since the date specified. |
Sector allocation as of March 31, 20241 |
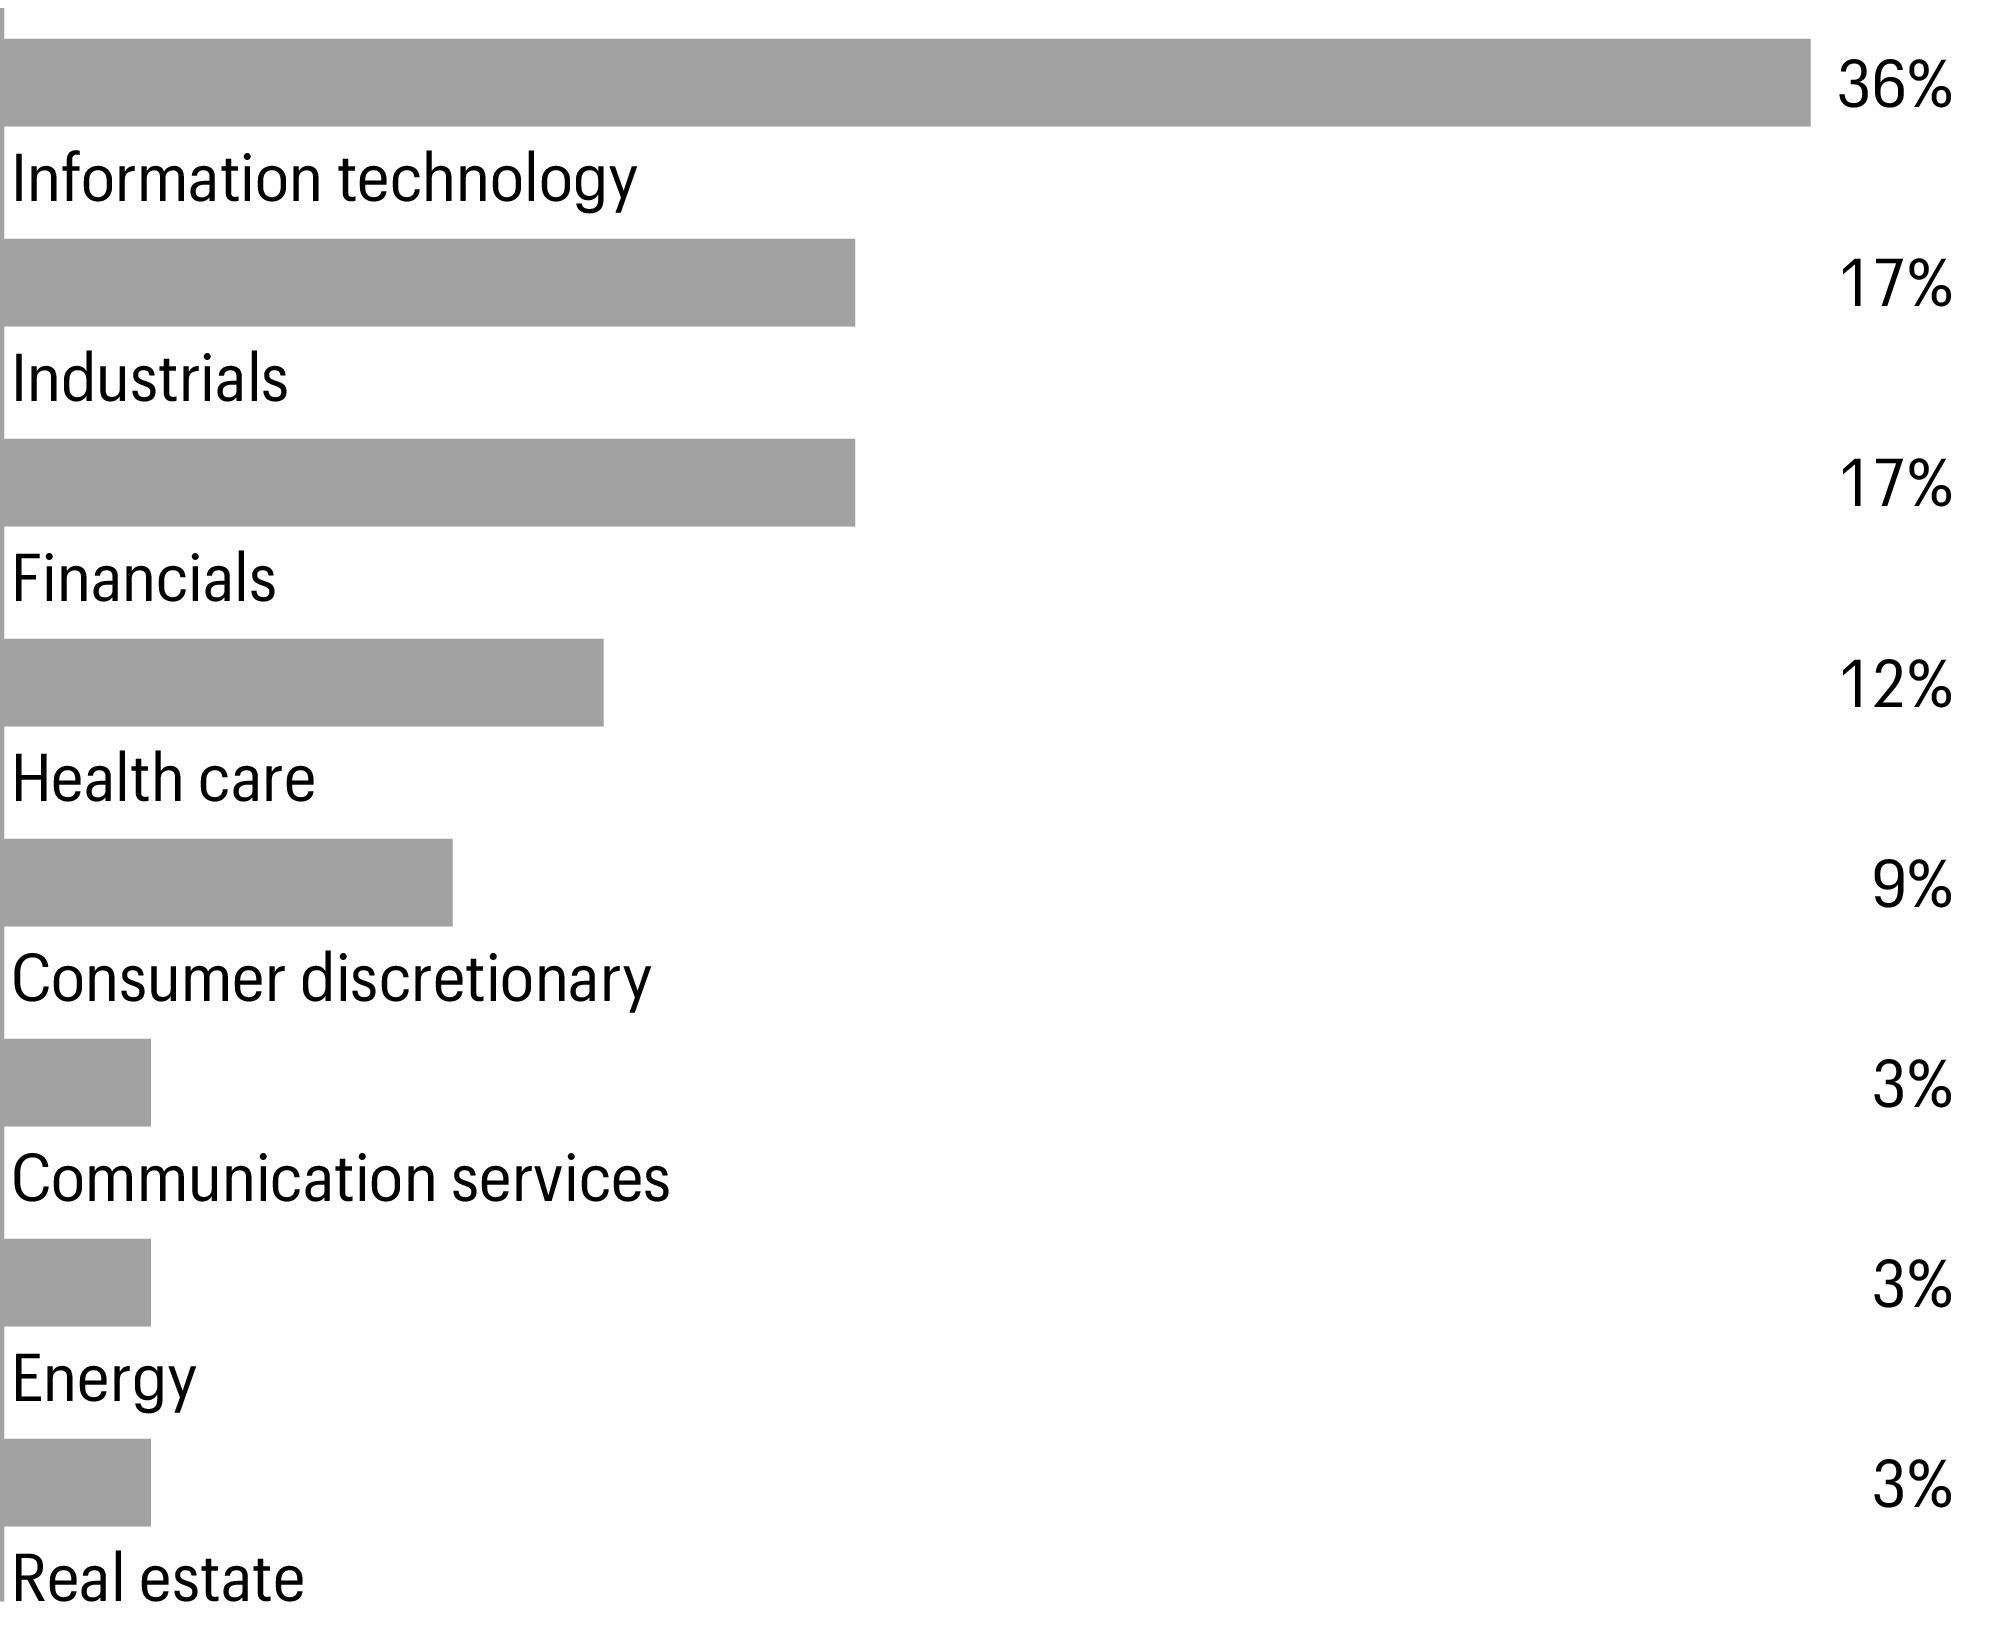
1 | Figures represent the percentage of the Fund’s long-term investments. Allocations are subject to change and may have changed since the date specified. |
Beginning account value 10-1-2023 | Ending account value 3-31-2024 | Expenses paid during the period1 | Annualized net expense ratio | |
Class A | ||||
Actual | $1,000.00 | $1,254.60 | $6.50 | 1.16 % |
Hypothetical (5% return before expenses) | $1,000.00 | $1,019.10 | $5.82 | 1.16 % |
Class C | ||||
Actual | $1,000.00 | $1,249.41 | $11.02 | 1.97 % |
Hypothetical (5% return before expenses) | $1,000.00 | $1,015.07 | $9.87 | 1.97 % |
Administrator Class | ||||
Actual | $1,000.00 | $1,253.85 | $6.44 | 1.15 % |
Hypothetical (5% return before expenses) | $1,000.00 | $1,019.15 | $5.77 | 1.15 % |
Institutional Class | ||||
Actual | $1,000.00 | $1,256.49 | $5.05 | 0.90 % |
Hypothetical (5% return before expenses) | $1,000.00 | $1,020.39 | $4.52 | 0.90 % |
1 | Expenses paid is equal to the annualized net expense ratio of each class multiplied by the average account value over the period, multiplied by 182 divided by 366 (to reflect the one-half-year period). |
Shares | Value | |||||
Common stocks: 98.02% | ||||||
Communication services: 3.04% | ||||||
Media: 3.04% | ||||||
Trade Desk, Inc. Class A† | 159,354 | $13,930,727 | ||||
Consumer discretionary: 8.93% | ||||||
Broadline retail: 5.68% | ||||||
Global-E Online Ltd.† | 369,298 | 13,423,982 | ||||
MercadoLibre, Inc.† | 8,351 | 12,626,378 | ||||
26,050,360 | ||||||
Hotels, restaurants & leisure: 3.25% | ||||||
Chipotle Mexican Grill, Inc.† | 5,121 | 14,885,569 | ||||
Energy: 2.96% | ||||||
Oil, gas & consumable fuels: 2.96% | ||||||
Viper Energy, Inc. | 353,227 | 13,585,110 | ||||
Financials: 16.35% | ||||||
Capital markets: 11.07% | ||||||
Morningstar, Inc. | 38,026 | 11,726,078 | ||||
MSCI, Inc. | 23,198 | 13,001,319 | ||||
S&P Global, Inc. | 30,615 | 13,025,152 | ||||
Tradeweb Markets, Inc. Class A | 124,614 | 12,981,040 | ||||
50,733,589 | ||||||
Financial services: 5.28% | ||||||
Jack Henry & Associates, Inc. | 68,311 | 11,867,670 | ||||
Visa, Inc. Class A | 44,271 | 12,355,151 | ||||
24,222,821 | ||||||
Health care: 11.37% | ||||||
Health care equipment & supplies: 5.69% | ||||||
DexCom, Inc.† | 95,405 | 13,232,674 | ||||
Intuitive Surgical, Inc.† | 32,216 | 12,857,083 | ||||
26,089,757 | ||||||
Health care technology: 2.92% | ||||||
Veeva Systems, Inc. Class A† | 57,875 | 13,409,059 | ||||
Life sciences tools & services: 2.76% | ||||||
Bio-Techne Corp. | 179,801 | 12,656,192 | ||||
Industrials: 17.03% | ||||||
Aerospace & defense: 3.17% | ||||||
Axon Enterprise, Inc.† | 46,501 | 14,549,233 | ||||
Commercial services & supplies: 8.65% | ||||||
Copart, Inc.† | 239,733 | 13,885,336 | ||||
Shares | Value | |||||
Commercial services & supplies(continued) | ||||||
Rollins, Inc. | 261,530 | $12,100,993 | ||||
Waste Connections, Inc. | 79,423 | 13,661,550 | ||||
39,647,879 | ||||||
Ground transportation: 2.71% | ||||||
Old Dominion Freight Line, Inc. | 56,668 | 12,427,859 | ||||
Professional services: 2.50% | ||||||
Paylocity Holding Corp.† | 66,655 | 11,455,328 | ||||
Information technology: 35.57% | ||||||
Communications equipment: 2.93% | ||||||
Motorola Solutions, Inc. | 37,764 | 13,405,465 | ||||
IT services: 5.34% | ||||||
Gartner, Inc.† | 25,598 | 12,201,798 | ||||
Globant SA† | 60,802 | 12,275,924 | ||||
24,477,722 | ||||||
Semiconductors & semiconductor equipment: 8.37% | ||||||
Advanced Micro Devices, Inc.† | 70,947 | 12,805,224 | ||||
KLA Corp. | 19,813 | 13,840,767 | ||||
Monolithic Power Systems, Inc. | 17,318 | 11,731,560 | ||||
38,377,551 | ||||||
Software: 18.93% | ||||||
Cadence Design Systems, Inc.† | 40,460 | 12,594,389 | ||||
CCC Intelligent Solutions Holdings, Inc.† | 1,023,735 | 12,243,871 | ||||
Crowdstrike Holdings, Inc. Class A† | 41,520 | 13,310,897 | ||||
Fair Isaac Corp.† | 9,482 | 11,848,802 | ||||
HubSpot, Inc.† | 20,940 | 13,120,166 | ||||
ServiceNow, Inc.† | 15,361 | 11,711,226 | ||||
Tyler Technologies, Inc.† | 28,196 | 11,983,582 | ||||
86,812,933 | ||||||
Real estate: 2.77% | ||||||
Industrial REITs : 2.77% | ||||||
Rexford Industrial Realty, Inc. | 252,655 | 12,708,547 | ||||
Total common stocks (Cost $340,678,652) | 449,425,701 | |||||
Yield | Shares | Value | ||||
Short-term investments: 2.12% | ||||||
Investment companies: 2.12% | ||||||
Allspring Government Money Market Fund Select Class♠∞ | 5.25 % | 9,735,222 | $9,735,222 | |||
Total short-term investments (Cost $9,735,222) | 9,735,222 | |||||
Total investments in securities (Cost $350,413,874) | 100.14 % | 459,160,923 | ||||
Other assets and liabilities, net | (0.14 ) | (632,055 ) | ||||
Total net assets | 100.00 % | $458,528,868 | ||||
† | Non-income-earning security |
♠ | The issuer of the security is an affiliated person of the Fund as defined in the Investment Company Act of 1940. |
∞ | The rate represents the 7-day annualized yield at period end. |
Abbreviations: | |
REIT | Real estate investment trust |
Value, beginning of period | Purchases | Sales proceeds | Net realized gains (losses) | Net change in unrealized gains (losses) | Value, end of period | Shares, end of period | Income from affiliated securities | |
Short-term investments | ||||||||
Allspring Government Money Market Fund Select Class | $9,241,903 | $85,118,487 | $(84,625,168 ) | $0 | $0 | $9,735,222 | 9,735,222 | $232,206 |
Assets | |
Investments in unaffiliated securities, at value (cost $340,678,652) | $449,425,701 |
Investments in affiliated securities, at value (cost $9,735,222) | 9,735,222 |
Cash | 4 |
Receivable for dividends | 216,322 |
Receivable for Fund shares sold | 97,217 |
Prepaid expenses and other assets | 67,909 |
Total assets | 459,542,375 |
Liabilities | |
Payable for Fund shares redeemed | 451,461 |
Management fee payable | 274,057 |
Shareholder servicing fees payable | 90,699 |
Administration fees payable | 75,722 |
Distribution fee payable | 3,155 |
Accrued expenses and other liabilities | 118,413 |
Total liabilities | 1,013,507 |
Total net assets | $458,528,868 |
Net assets consist of | |
Paid-in capital | $318,187,940 |
Total distributable earnings | 140,340,928 |
Total net assets | $458,528,868 |
Computation of net asset value and offering price per share | |
Net assets–Class A | $421,216,905 |
Shares outstanding–Class A1 | 36,367,848 |
Net asset value per share–Class A | $11.58 |
Maximum offering price per share – Class A2 | $12.29 |
Net assets–Class C | $4,941,499 |
Shares outstanding–Class C1 | 930,001 |
Net asset value per share–Class C | $5.31 |
Net assets–Administrator Class | $2,133,764 |
Shares outstanding–Administrator Class1 | 174,967 |
Net asset value per share–Administrator Class | $12.20 |
Net assets–Institutional Class | $30,236,700 |
Shares outstanding–Institutional Class1 | 2,402,361 |
Net asset value per share–Institutional Class | $12.59 |
Investment income | |
Dividends (net of foreign withholdings taxes of $3,406) | $1,822,032 |
Income from affiliated securities | 232,206 |
Interest | 803 |
Total investment income | 2,055,041 |
Expenses | |
Management fee | 3,349,901 |
Administration fees | |
Class A | 771,660 |
Class C | 9,922 |
Administrator Class | 6,042 |
Institutional Class | 36,123 |
Shareholder servicing fees | |
Class A | 952,974 |
Class C | 12,208 |
Administrator Class | 11,574 |
Distribution fee | |
Class C | 36,625 |
Custody and accounting fees | 1,822 |
Professional fees | 82,762 |
Registration fees | 69,994 |
Shareholder report expenses | 21,428 |
Trustees’ fees and expenses | 28,160 |
Other fees and expenses | 12,852 |
Total expenses | 5,404,047 |
Less: Fee waivers and/or expense reimbursements | |
Fund-level | (341,906 ) |
Class A | (126,704 ) |
Administrator Class | (52 ) |
Net expenses | 4,935,385 |
Net investment loss | (2,880,344 ) |
Realized and unrealized gains (losses) on investments | |
Net realized gains (losses) on | |
Unaffiliated securities | 76,213,756 |
Foreign currency and foreign currency translations | (60 ) |
Net realized gains on investments | 76,213,696 |
Net change in unrealized gains (losses) on | |
Unaffiliated securities | 35,647,424 |
Foreign currency and foreign currency translations | (113 ) |
Net change in unrealized gains (losses) on investments | 35,647,311 |
Net realized and unrealized gains (losses) on investments | 111,861,007 |
Net increase in net assets resulting from operations | $108,980,663 |
Year ended March 31, 2024 | Year ended March 31, 2023 | |||
Operations | ||||
Net investment loss | $(2,880,344 ) | $(3,521,868 ) | ||
Net realized gains (losses) on investments | 76,213,696 | (34,236,670 ) | ||
Net change in unrealized gains (losses) on investments | 35,647,311 | (95,863,238 ) | ||
Net increase (decrease) in net assets resulting from operations | 108,980,663 | (133,621,776 ) | ||
Distributions to shareholders from | ||||
Net investment income and net realized gains | ||||
Class A | 0 | (77,771,985 ) | ||
Class C | 0 | (2,125,424 ) | ||
Administrator Class | 0 | (1,410,630 ) | ||
Institutional Class | 0 | (6,753,501 ) | ||
Total distributions to shareholders | 0 | (88,061,540 ) | ||
Capital share transactions | Shares | Shares | ||
Proceeds from shares sold | ||||
Class A | 920,920 | 9,278,823 | 852,022 | 8,699,357 |
Class C | 75,380 | 354,165 | 61,306 | 290,149 |
Administrator Class | 97,107 | 970,367 | 83,471 | 914,122 |
Institutional Class | 345,876 | 3,893,797 | 348,109 | 3,826,959 |
14,497,152 | 13,730,587 | |||
Reinvestment of distributions | ||||
Class A | 0 | 0 | 8,944,591 | 74,508,445 |
Class C | 0 | 0 | 549,256 | 2,120,127 |
Administrator Class | 0 | 0 | 158,499 | 1,390,039 |
Institutional Class | 0 | 0 | 741,739 | 6,690,485 |
0 | 84,709,096 | |||
Payment for shares redeemed | ||||
Class A | (5,027,609 ) | (50,794,826 ) | (5,446,007 ) | (54,863,931 ) |
Class C | (458,289 ) | (2,079,586 ) | (452,426 ) | (2,496,526 ) |
Administrator Class | (590,318 ) | (5,682,812 ) | (245,670 ) | (2,560,384 ) |
Institutional Class | (929,837 ) | (9,892,255 ) | (2,392,279 ) | (26,303,223 ) |
(68,449,479 ) | (86,224,064 ) | |||
Net increase (decrease) in net assets resulting from capital share transactions | (53,952,327 ) | 12,215,619 | ||
Total increase (decrease) in net assets | 55,028,336 | (209,467,697 ) | ||
Net assets | ||||
Beginning of period | 403,500,532 | 612,968,229 | ||
End of period | $458,528,868 | $403,500,532 | ||
Year ended March 31 | |||||
Class A | 2024 | 2023 | 2022 | 2021 | 2020 |
Net asset value, beginning of period | $8.96 | $14.58 | $18.55 | $12.08 | $13.33 |
Net investment loss | (0.07 )1 | (0.09 )1 | (0.19 )1 | (0.16 ) | (0.11 ) |
Net realized and unrealized gains (losses) on investments | 2.69 | (3.21 ) | 1.04 | 9.44 | (0.01 ) |
Total from investment operations | 2.62 | (3.30 ) | 0.85 | 9.28 | (0.12 ) |
Distributions to shareholders from | |||||
Net realized gains | 0.00 | (2.32 ) | (4.82 ) | (2.81 ) | (1.13 ) |
Net asset value, end of period | $11.58 | $8.96 | $14.58 | $18.55 | $12.08 |
Total return2 | 29.24 % | (21.42 )% | 1.26 % | 77.67 % | (1.31 )% |
Ratios to average net assets (annualized) | |||||
Gross expenses | 1.30 % | 1.34 % | 1.34 % | 1.35 % | 1.39 % |
Net expenses | 1.19 % | 1.25 % | 1.33 % | 1.34 % | 1.37 % |
Net investment loss | (0.70 )% | (0.81 )% | (1.02 )% | (0.98 )% | (0.80 )% |
Supplemental data | |||||
Portfolio turnover rate | 75 % | 117 % | 93 % | 146 % | 149 % |
Net assets, end of period (000s omitted) | $421,217 | $362,754 | $526,555 | $575,422 | $344,949 |
1 | Calculated based upon average shares outstanding |
2 | Total return calculations do not include any sales charges. |
Year ended March 31 | |||||
Class C | 2024 | 2023 | 2022 | 2021 | 2020 |
Net asset value, beginning of period | $4.14 | $8.51 | $12.64 | $8.80 | $10.09 |
Net investment loss | (0.07 )1 | (0.09 )1 | (0.21 )1 | (0.17 ) | (0.16 )1 |
Net realized and unrealized gains (losses) on investments | 1.24 | (1.96 ) | 0.90 | 6.82 | (0.00 )2 |
Total from investment operations | 1.17 | (2.05 ) | 0.69 | 6.65 | (0.16 ) |
Distributions to shareholders from | |||||
Net realized gains | 0.00 | (2.32 ) | (4.82 ) | (2.81 ) | (1.13 ) |
Net asset value, end of period | $5.31 | $4.14 | $8.51 | $12.64 | $8.80 |
Total return3 | 28.26 % | (22.09 )% | 0.51 % | 76.67 % | (2.15 )% |
Ratios to average net assets (annualized) | |||||
Gross expenses | 2.05 % | 2.08 % | 2.09 % | 2.10 % | 2.14 % |
Net expenses | 1.97 % | 2.02 % | 2.09 % | 2.10 % | 2.13 % |
Net investment loss | (1.49 )% | (1.57 )% | (1.79 )% | (1.75 )% | (1.57 )% |
Supplemental data | |||||
Portfolio turnover rate | 75 % | 117 % | 93 % | 146 % | 149 % |
Net assets, end of period (000s omitted) | $4,941 | $5,441 | $9,822 | $12,017 | $8,035 |
1 | Calculated based upon average shares outstanding |
2 | Amount is more than $(0.005). |
3 | Total return calculations do not include any sales charges. |
Year ended March 31 | |||||
Administrator Class | 2024 | 2023 | 2022 | 2021 | 2020 |
Net asset value, beginning of period | $9.44 | $15.17 | $19.13 | $12.40 | $13.65 |
Net investment loss | (0.07 )1 | (0.08 )1 | (0.18 )1 | (0.16 ) | (0.10 )1 |
Net realized and unrealized gains (losses) on investments | 2.83 | (3.33 ) | 1.04 | 9.70 | (0.02 ) |
Total from investment operations | 2.76 | (3.41 ) | 0.86 | 9.54 | (0.12 ) |
Distributions to shareholders from | |||||
Net realized gains | 0.00 | (2.32 ) | (4.82 ) | (2.81 ) | (1.13 ) |
Net asset value, end of period | $12.20 | $9.44 | $15.17 | $19.13 | $12.40 |
Total return | 29.24 % | (21.30 )% | 1.28 % | 77.92 % | (1.28 )% |
Ratios to average net assets (annualized) | |||||
Gross expenses | 1.23 % | 1.26 % | 1.27 % | 1.27 % | 1.31 % |
Net expenses | 1.15 % | 1.19 % | 1.26 % | 1.27 % | 1.28 % |
Net investment loss | (0.74 )% | (0.74 )% | (0.95 )% | (0.91 )% | (0.71 )% |
Supplemental data | |||||
Portfolio turnover rate | 75 % | 117 % | 93 % | 146 % | 149 % |
Net assets, end of period (000s omitted) | $2,134 | $6,305 | $10,192 | $9,636 | $11,873 |
1 | Calculated based upon average shares outstanding |
Year ended March 31 | |||||
Institutional Class | 2024 | 2023 | 2022 | 2021 | 2020 |
Net asset value, beginning of period | $9.71 | $15.48 | $19.39 | $12.51 | $13.73 |
Net investment loss | (0.04 )1 | (0.06 )1 | (0.13 ) | (0.12 ) | (0.07 ) |
Net realized and unrealized gains (losses) on investments | 2.92 | (3.39 ) | 1.04 | 9.81 | (0.02 ) |
Total from investment operations | 2.88 | (3.45 ) | 0.91 | 9.69 | (0.09 ) |
Distributions to shareholders from | |||||
Net realized gains | 0.00 | (2.32 ) | (4.82 ) | (2.81 ) | (1.13 ) |
Net asset value, end of period | $12.59 | $9.71 | $15.48 | $19.39 | $12.51 |
Total return | 29.66 % | (21.13 )% | 1.53 % | 78.30 % | (1.05 )% |
Ratios to average net assets (annualized) | |||||
Gross expenses | 0.98 % | 1.01 % | 1.01 % | 1.02 % | 1.06 % |
Net expenses | 0.90 % | 0.95 % | 1.01 % | 1.02 % | 1.03 % |
Net investment loss | (0.41 )% | (0.50 )% | (0.71 )% | (0.66 )% | (0.47 )% |
Supplemental data | |||||
Portfolio turnover rate | 75 % | 117 % | 93 % | 146 % | 149 % |
Net assets, end of period (000s omitted) | $30,237 | $29,001 | $66,399 | $85,664 | $48,504 |
1 | Calculated based upon average shares outstanding |
Gross unrealized gains | $107,512,127 |
Gross unrealized losses | (451,770 ) |
Net unrealized gains | $107,060,357 |
Paid-in capital | Total distributable earnings |
$(3,147,987 ) | $3,147,987 |
Quoted prices (Level 1) | Other significant observable inputs (Level 2) | Significant unobservable inputs (Level 3) | Total | |
Assets | ||||
Investments in: | ||||
Common stocks | ||||
Communication services | $13,930,727 | $0 | $0 | $13,930,727 |
Consumer discretionary | 40,935,929 | 0 | 0 | 40,935,929 |
Energy | 13,585,110 | 0 | 0 | 13,585,110 |
Financials | 74,956,410 | 0 | 0 | 74,956,410 |
Health care | 52,155,008 | 0 | 0 | 52,155,008 |
Industrials | 78,080,299 | 0 | 0 | 78,080,299 |
Information technology | 163,073,671 | 0 | 0 | 163,073,671 |
Real estate | 12,708,547 | 0 | 0 | 12,708,547 |
Short-term investments | ||||
Investment companies | 9,735,222 | 0 | 0 | 9,735,222 |
Total assets | $459,160,923 | $0 | $0 | $459,160,923 |
Average daily net assets | Management fee |
First $500 million | 0.800 % |
Next $500 million | 0.750 |
Next $1 billion | 0.700 |
Next $2 billion | 0.675 |
Next $1 billion | 0.650 |
Next $3 billion | 0.640 |
Next $2 billion | 0.615 |
Next $2 billion | 0.605 |
Next $4 billion | 0.580 |
Over $16 billion | 0.555 |
Class-level administration fee | |
Class A | 0.20 % |
Class C | 0.20 |
Administrator Class | 0.13 |
Institutional Class | 0.13 |
EXPENSE RATIO CAPS | |
Class A | 1.22 % |
Class C | 1.97 |
Administrator Class | 1.15 |
Institutional Class | 0.90 |
Year ended March 31 | ||
2024 | 2023 | |
Long-term capital gain | $0 | $88,061,540 |
Undistributed long-term gain | Unrealized gains | Late-year ordinary losses deferred |
$33,783,663 | $107,058,706 | $(501,441 ) |
Allspring Funds Trust:

Name and year of birth | Position held and length of service* | Principal occupations during past five years or longer | Current other public company or investment company directorships |
William R. Ebsworth (Born 1957) | Trustee, since 2015 | Retired. From 1984 to 2013, equities analyst, portfolio manager, research director and chief investment officer at Fidelity Management and Research Company in Boston, Tokyo, and Hong Kong, and retired in 2013 as Chief Investment Officer of Fidelity Strategic Advisers, Inc. where he led a team of investment professionals managing client assets. Prior thereto, Board member of Hong Kong Securities Clearing Co., Hong Kong Options Clearing Corp., the Thailand International Fund, Ltd., Fidelity Investments Life Insurance Company, and Empire Fidelity Investments Life Insurance Company. Serves on the Investment Company Institute’s Board of Governors since 2022 and Executive Committee since 2023 as well as the Vice Chairman of the Governing Council of the Independent Directors Council since 2023. Audit Committee Chair and Investment Committee Chair of the Vincent Memorial Hospital Foundation (non-profit organization). Mr. Ebsworth is a CFA charterholder. | N/A |
Jane A. Freeman (Born 1953) | Trustee, since 2015; Chair Liaison, since January 2018# | Retired. From 2012 to 2014 and 1999 to 2008, Chief Financial Officer of Scientific Learning Corporation. From 2008 to 2012, Ms. Freeman provided consulting services related to strategic business projects. Prior to 1999, Portfolio Manager at Rockefeller & Co. and Scudder, Stevens & Clark. Board member of the Harding Loevner Funds from 1996 to 2014, serving as both Lead Independent Director and chair of the Audit Committee. Board member of the Russell Exchange Traded Funds Trust from 2011 to 2012 and the chair of the Audit Committee. Ms. Freeman is also an inactive Chartered Financial Analyst. | N/A |
Isaiah Harris, Jr. (Born 1952) | Trustee, since 2009; Audit Committee Chair, since 2019 | Retired. Member of the Advisory Board of CEF of East Central Florida. Chairman of the Board of CIGNA Corporation from 2009 to 2021, and Director from 2005 to 2008. From 2003 to 2011, Director of Deluxe Corporation. Prior thereto, President and CEO of BellSouth Advertising and Publishing Corp. from 2005 to 2007, President and CEO of BellSouth Enterprises from 2004 to 2005 and President of BellSouth Consumer Services from 2000 to 2003. Emeritus member of the Iowa State University Foundation Board of Governors. Emeritus Member of the Advisory board of Iowa State University School of Business. Advisory Board Member, Palm Harbor Academy (private school). Advisory Board Member, Fellowship of Christian Athletes. Mr. Harris is a certified public accountant (inactive status). | N/A |
David F. Larcker (Born 1950) | Trustee, since 2009 | Distinguished Visiting Fellow at the Hoover Institution since 2022. James Irvin Miller Professor of Accounting at the Graduate School of Business (Emeritus), Stanford University, Director of the Corporate Governance Research Initiative and Senior Faculty of The Rock Center for Corporate Governance since 2006. From 2005 to 2008, Professor of Accounting at the Graduate School of Business, Stanford University. Prior thereto, Ernst & Young Professor of Accounting at The Wharton School, University of Pennsylvania from 1985 to 2005. | N/A |
Olivia S. Mitchell (Born 1953) | Trustee, since 2006; Nominating and Governance Committee Chair, since 2018 | International Foundation of Employee Benefit Plans Professor since 1993, Wharton School of the University of Pennsylvania. Director of Wharton’s Pension Research Council and Boettner Center on Pensions & Retirement Research, and Research Associate at the National Bureau of Economic Research. Previously taught at Cornell University from 1978 to 1993. | N/A |
Name and year of birth | Position held and length of service* | Principal occupations during past five years or longer | Current other public company or investment company directorships |
Timothy J. Penny (Born 1951) | Trustee, since 1996; Chair, since 2018 | President and Chief Executive Officer of Southern Minnesota Initiative Foundation, a non-profit organization, since 2007. Vice Chair of the Economic Club of Minnesota, since 2007. Co-Chair of the Committee for a Responsible Federal Budget, since 1995. Member of the Board of Trustees of NorthStar Education Finance, Inc., a non-profit organization, from 2007-2022. Senior Fellow of the University of Minnesota Humphrey Institute from 1995 to 2017. | N/A |
James G. Polisson (Born 1959) | Trustee, since 2018 | Retired. Chief Marketing Officer, Source (ETF) UK Services, Ltd, from 2015 to 2017. From 2012 to 2015, Principal of The Polisson Group, LLC, a management consulting, corporate advisory and principal investing company. Chief Executive Officer and Managing Director at Russell Investments, Global Exchange Traded Funds from 2010 to 2012. Managing Director of Barclays Global Investors from 1998 to 2010 and Global Chief Marketing Officer for iShares and Barclays Global Investors from 2000 to 2010. Trustee of the San Francisco Mechanics’ Institute, a non- profit organization, from 2013 to 2015. Board member of the Russell Exchange Traded Fund Trust from 2011 to 2012. Director of Barclays Global Investors Holdings Deutschland GmbH from 2006 to 2009. Mr. Polisson is an attorney and has a retired status with the Massachusetts and District of Columbia Bar Associations. | N/A |
Pamela Wheelock (Born 1959) | Trustee, since January 2020; previously Trustee from January 2018 to July 2019# | Retired. Executive and Senior Financial leadership positions in the public, private and nonprofit sectors. Interim President and CEO, McKnight Foundation, 2020. Interim Commissioner, Minnesota Department of Human Services, 2019. Chief Operating Officer, Twin Cities Habitat for Humanity, 2017-2019. Vice President for University Services, University of Minnesota, 2012- 2016. Interim President and CEO, Blue Cross and Blue Shield of Minnesota, 2011-2012. Executive Vice-President and Chief Financial Officer, Minnesota Wild, 2002-2008. Commissioner, Minnesota Department of Finance, 1999-2002. Chair of the Board of Directors of Destination Medical Center Corporation. Board member of the Minnesota Wild Foundation. | N/A |
Name and year of birth | Position held and length of service | Principal occupations during past five years or longer |
Andrew Owen (Born 1960) | President, since 2017 | President and Chief Executive Officer of Allspring Funds Management, LLC since 2017 and Head of Global Fund Governance of Allspring Global Investments since 2022. Prior thereto, co-president of Galliard Capital Management, LLC, an affiliate of Allspring Funds Management, LLC, from 2019 to 2022 and Head of Affiliated Managers, Allspring Global Investments, from 2014 to 2019 and Executive Vice President responsible for marketing, investments and product development for Allspring Funds Management, LLC, from 2009 to 2014. |
Jeremy DePalma (Born 1974) | Treasurer, since 2012 (for certain funds in the Fund Complex); since 2021 (for the remaining funds in the Complex) | Senior Vice President of Allspring Funds Management, LLC since 2009. Senior Vice President of Evergreen Investment Management Company, LLC from 2008 to 2010 and head of the Fund Reporting and Control Team within Fund Administration from 2005 to 2010. |
Christopher Baker (Born 1976) | Chief Compliance Officer, since 2022 | Global Chief Compliance Officer for Allspring Global Investments since 2022. Prior thereto, Chief Compliance Officer for State Street Global Advisors from 2018 to 2021. Senior Compliance Officer for the State Street divisions of Alternative Investment Solutions, Sector Solutions, and Global Marketing from 2015 to 2018. From 2010 to 2015 Vice President, Global Head of Investment and Marketing Compliance for State Street Global Advisors. |
Matthew Prasse (Born 1983) | Chief Legal Officer, since 2022; Secretary, since 2021 | Senior Counsel of the Allspring Legal Department since 2021. Senior Counsel of the Wells Fargo Legal Department from 2018 to 2021. Previously, Counsel for Barings LLC from 2015 to 2018. Prior to joining Barings, Associate at Morgan, Lewis & Bockius LLP from 2008 to 2015. |

P.O. Box 219967
Kansas City, MO 64121-9967

AR1600 03-24
2 | |
6 | |
10 | |
11 | |
15 | |
16 | |
17 | |
18 | |
23 | |
28 | |
29 |

Allspring Funds

President
Allspring Funds
Notice to Shareholders |
Beginning in July 2024, the Fund will be required by the Securities and Exchange Commission to send shareholders a paper copy of a new tailored shareholder report in place of the full shareholder report that you are now receiving. The tailored shareholder report will contain concise information about the Fund, including certain expense and performance information and fund statistics. If you wish to receive this new tailored shareholder report electronically, please follow the instructions on the back cover of this report. |
Other information that is currently included in the shareholder report, such as the Fund’s financial statements, will be available online and upon request, free of charge, in paper or electronic format. |
Investment objective | The Fund seeks long-term capital appreciation. |
Manager | Allspring Funds Management, LLC |
Subadviser | Allspring Global Investments, LLC |
Portfolio managers | Michael T. Smith, CFA, Christopher J. Warner, CFA |
Average annual total returns (%) as of March 31, 2024 | |||||||||
Including sales charge | Excluding sales charge | Expense ratios1 (%) | |||||||
Inception date | 1 year | 5 year | 10 year | 1 year | 5 year | 10 year | Gross | Net2 | |
Class A (EGWAX) | 6-5-1995 | 4.67 | 4.64 | 6.69 | 11.07 | 5.88 | 7.32 | 1.50 | 1.22 |
Class C (EGWCX) | 7-30-2010 | 9.25 | 5.10 | 6.70 | 10.25 | 5.10 | 6.70 | 2.25 | 1.97 |
Class R6 (EGWRX)3 | 5-29-2020 | – | – | – | 11.59 | 6.31 | 7.73 | 1.08 | 0.80 |
Administrator Class (EGWDX) | 7-30-2010 | – | – | – | 11.23 | 6.26 | 7.61 | 1.43 | 1.15 |
Institutional Class (EGRYX) | 11-19-1997 | – | – | – | 11.50 | 6.23 | 7.69 | 1.18 | 0.90 |
Russell 2000® Growth Index4 | – | – | – | – | 20.35 | 7.38 | 7.89 | – | – |
1 | Reflects the expense ratios as stated in the most recent prospectuses. The expense ratios shown are subject to change and may differ from the annualized expense ratios shown in the Financial Highlights of this report. |
2 | The manager has contractually committed through July 31, 2024, to waive fees and/or reimburse expenses to the extent necessary to cap total annual fund operating expenses after fee waivers at 1.22% for Class A, 1.97% for Class C, 0.80% for Class R6, 1.15% for Administrator Class and 0.90% for Institutional Class. Brokerage commissions, stamp duty fees, interest, taxes, acquired fund fees and expenses (if any), and extraordinary expenses are excluded from the expense caps. Prior to or after the commitment expiration date, the caps may be increased or the commitment to maintain the caps may be terminated only with the approval of the Board of Trustees. Without these caps, the Fund’s returns would have been lower. The expense ratio paid by an investor is the net expense ratio (the total annual fund operating expenses after fee waivers) as stated in the prospectuses. |
3 | Historical performance shown for the Class R6 shares prior to their inception reflects the performance of the Institutional Class shares, and includes the higher expenses applicable to the Institutional Class shares. If these expenses had not been included, returns for the Class R6 shares would be higher. |
4 | The Russell 2000® Growth Index measures the performance of those Russell 2000 companies with higher price/book ratios and higher forecasted growth values. You cannot invest directly in an index. |
CFA® and Chartered Financial Analyst® are trademarks owned by CFA Institute. |
Growth of $10,000 investment as of March 31, 20241 |
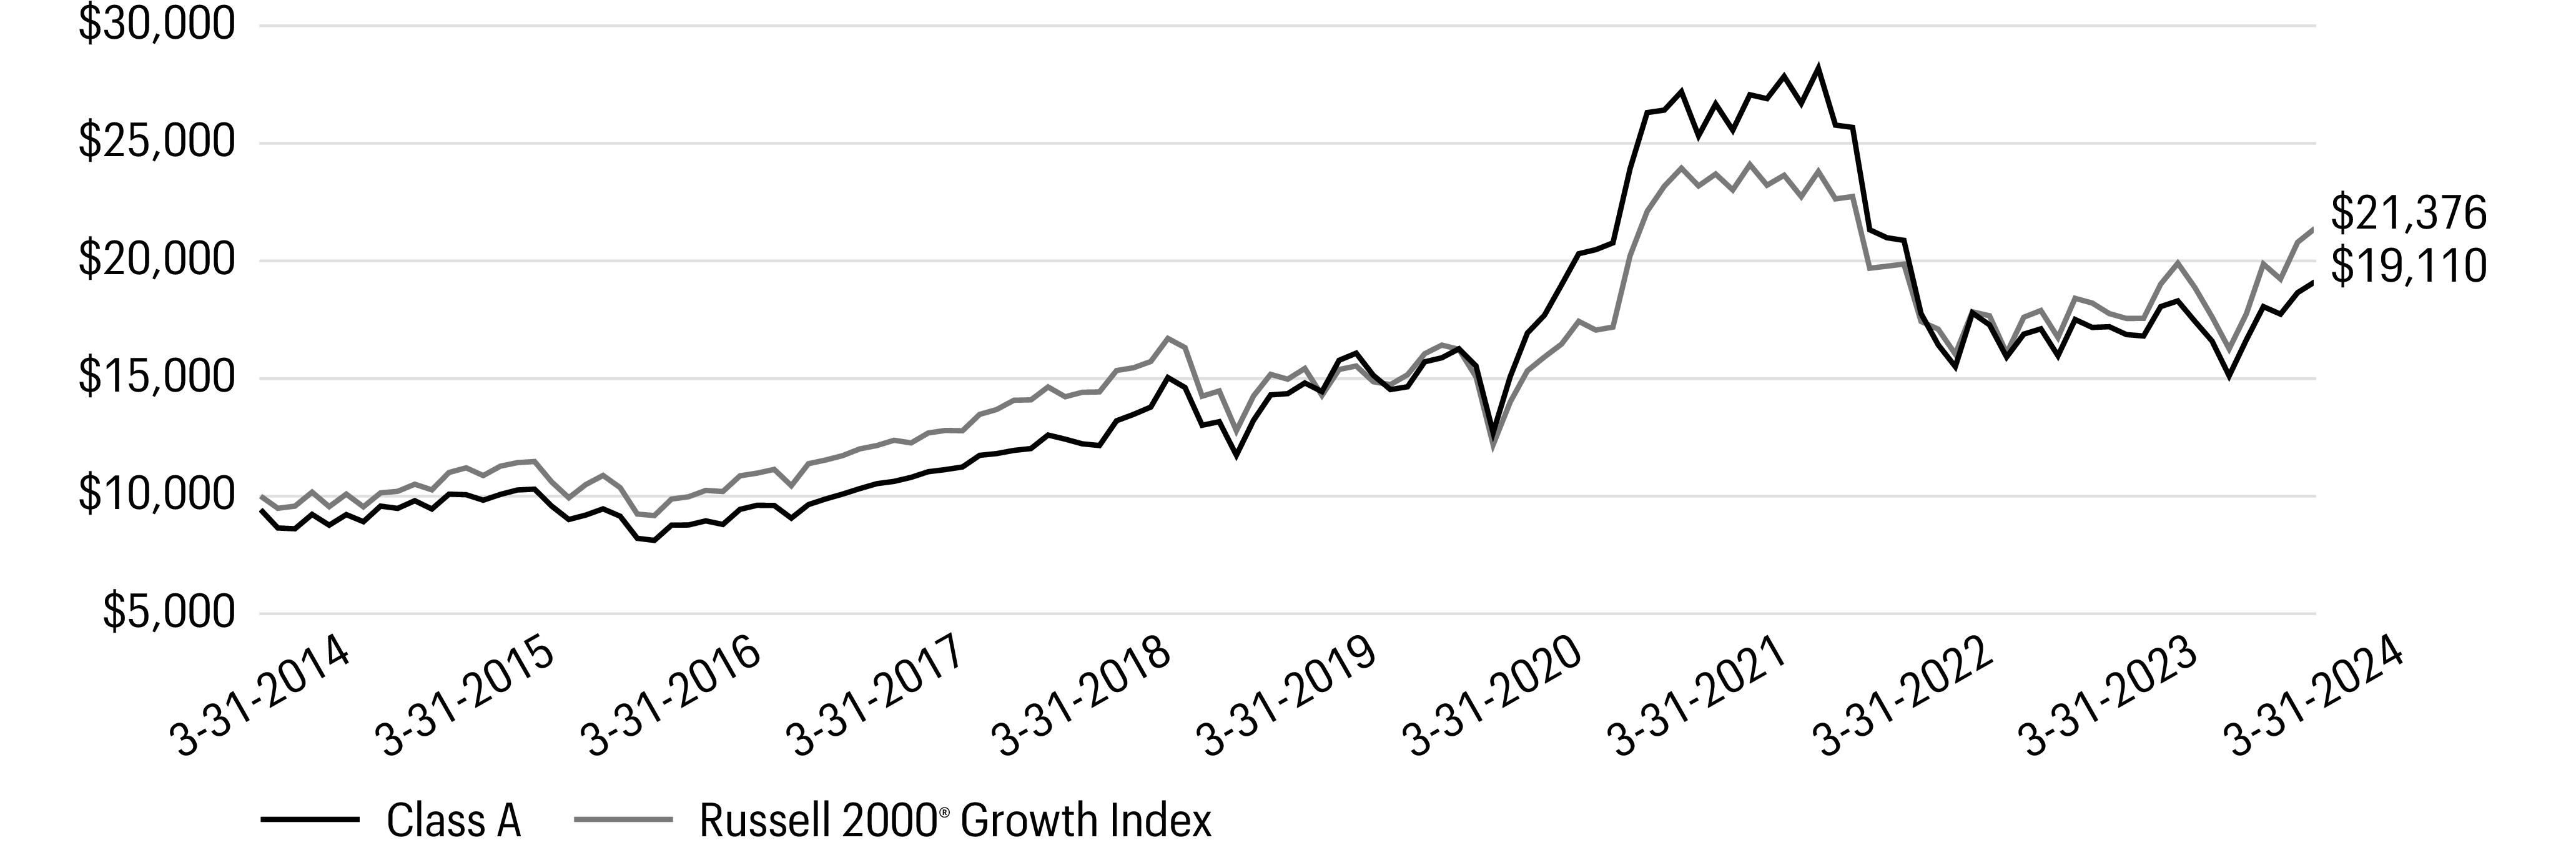
1 | The chart compares the performance of Class A shares for the most recent ten years with the Russell 2000® Growth Index. The chart assumes a hypothetical investment of $10,000 in Class A shares and reflects all operating expenses and assumes the maximum initial sales charge of 5.75%. |
Ten largest holdings (%) as of March 31, 20241 | |
Casella Waste Systems, Inc. Class A | 3.00 |
Applied Industrial Technologies, Inc. | 2.63 |
Tetra Tech, Inc. | 2.59 |
HealthEquity, Inc. | 2.37 |
CCC Intelligent Solutions Holdings, Inc. | 2.09 |
Morningstar, Inc. | 2.06 |
Novanta, Inc. | 2.03 |
SiteOne Landscape Supply, Inc. | 2.01 |
Vertiv Holdings Co. | 1.99 |
AAON, Inc. | 1.99 |
1 | Figures represent the percentage of the Fund’s net assets. Holdings are subject to change and may have changed since the date specified. |
Sector allocation as of March 31, 20241 |
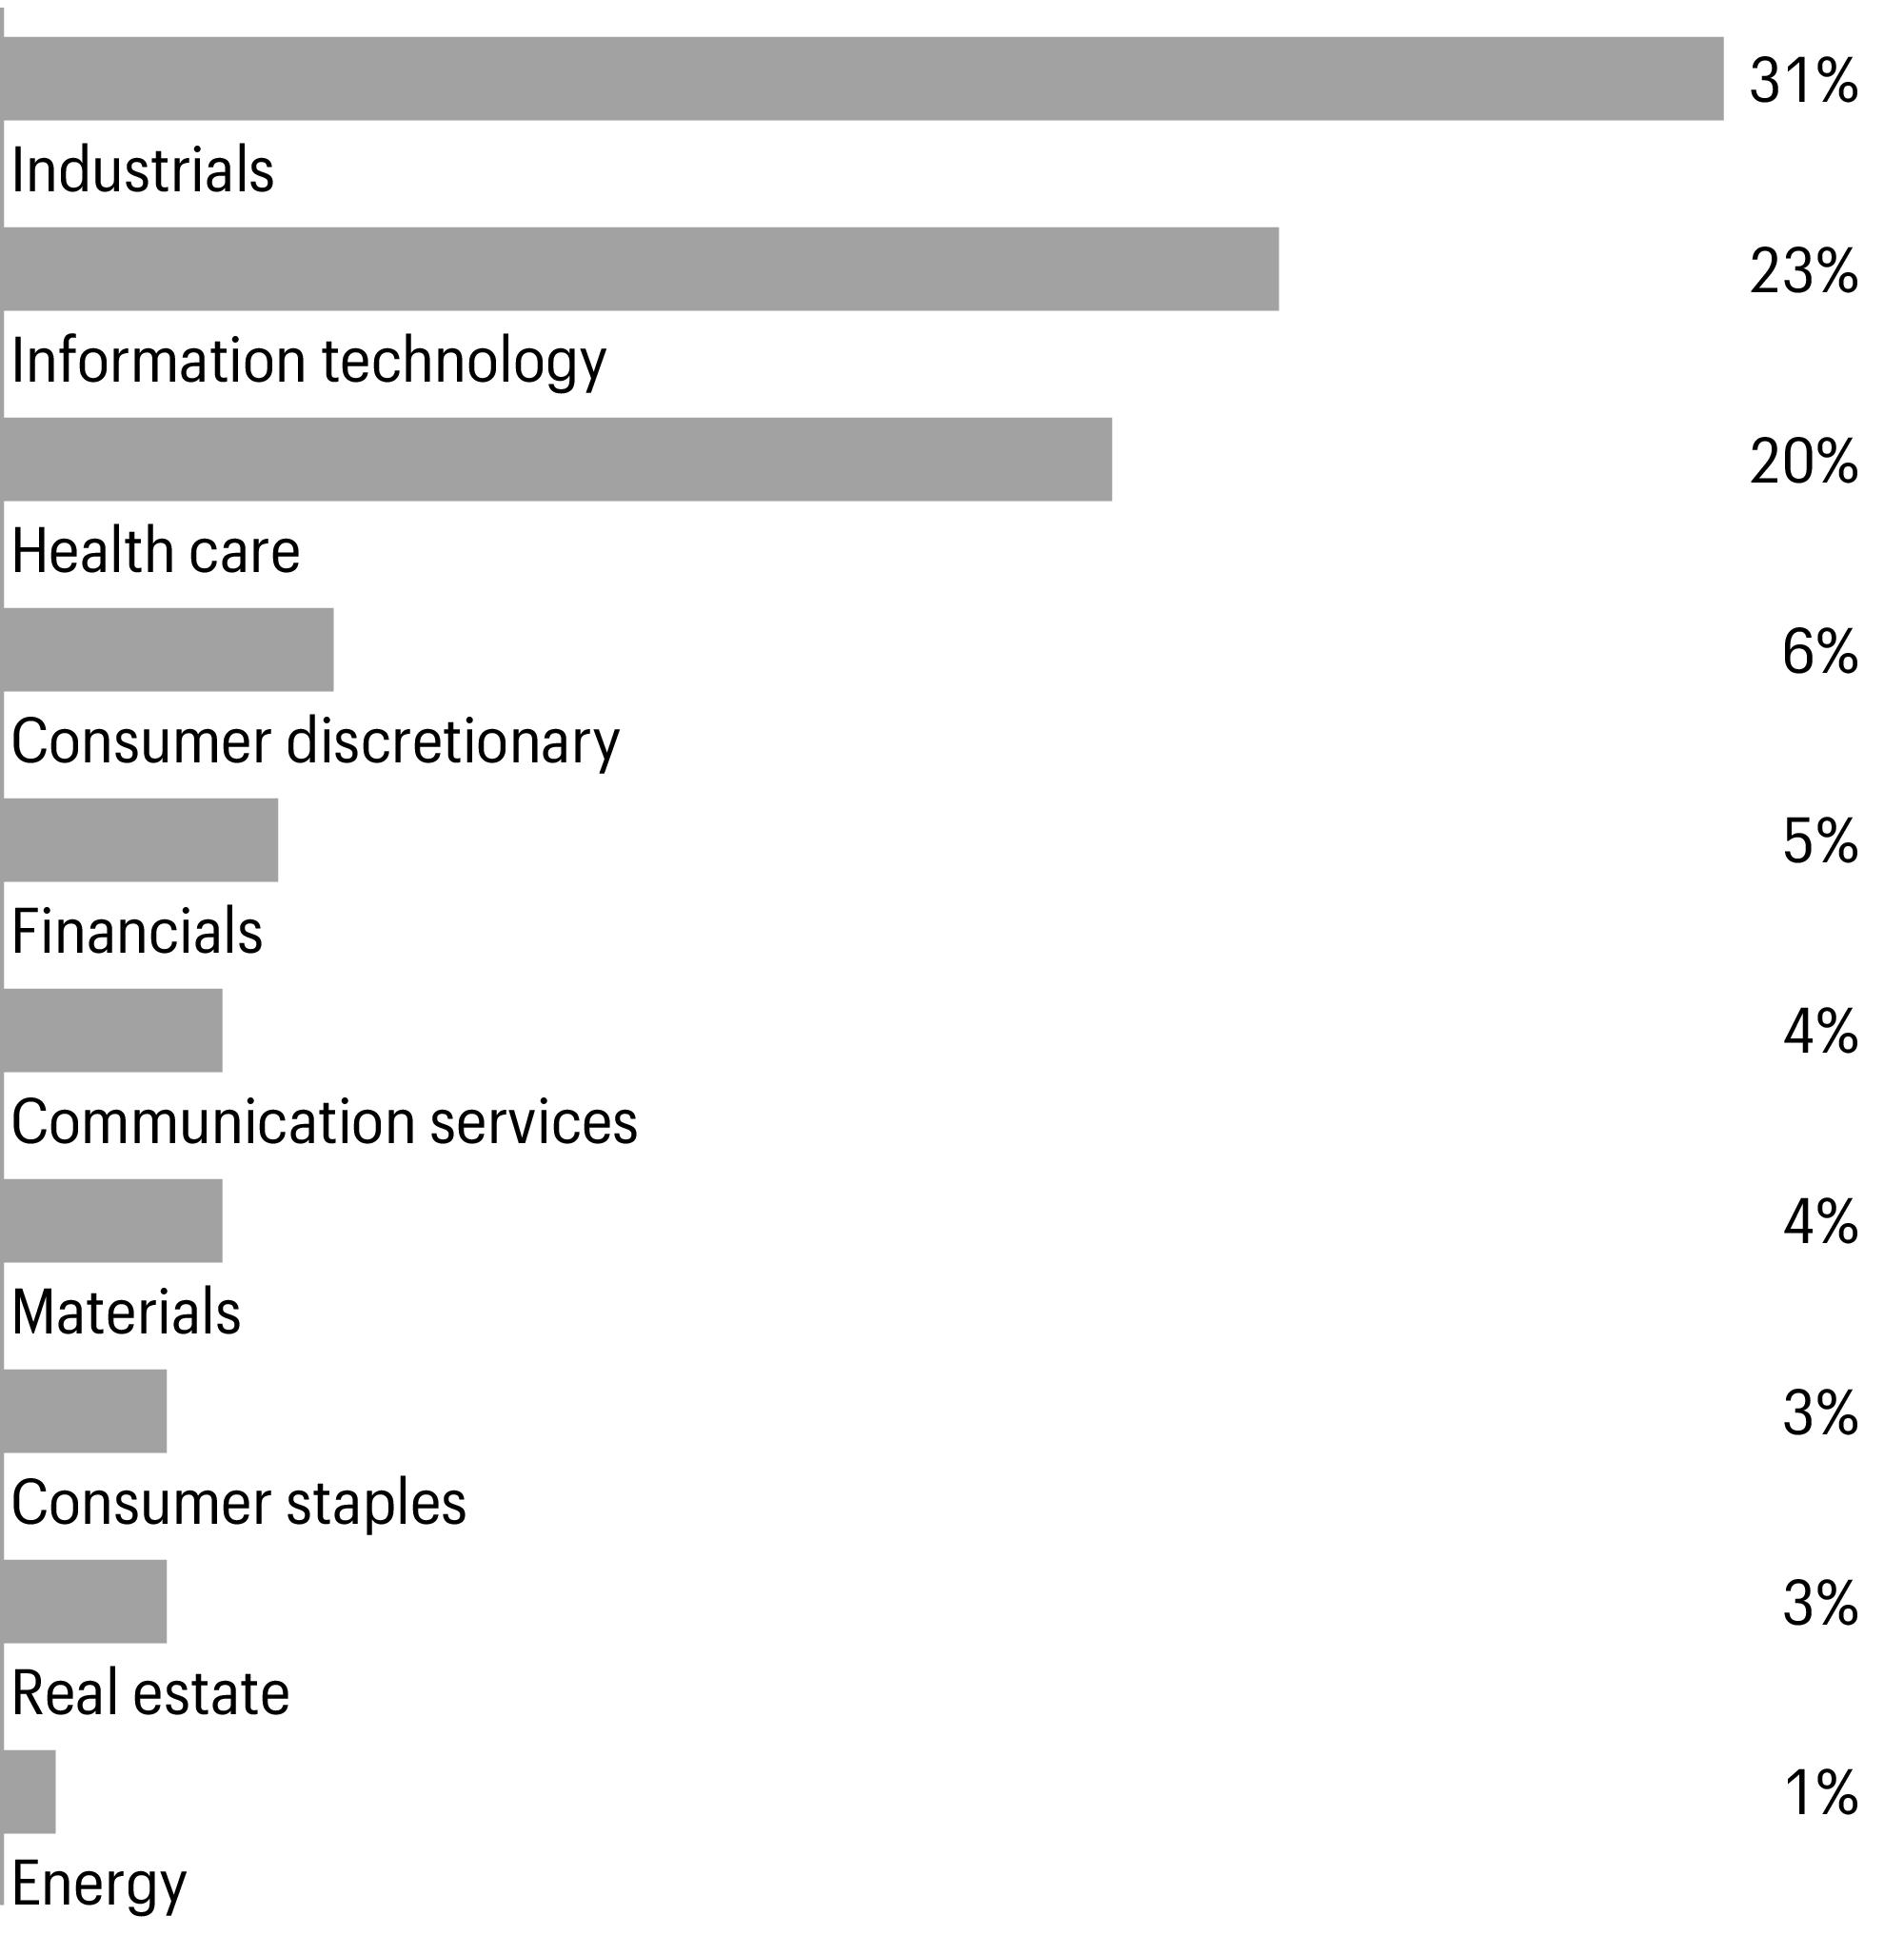
1 | Figures represent the percentage of the Fund’s long-term investments. Allocations are subject to change and may have changed since the date specified. |
Beginning account value 10-1-2023 | Ending account value 3-31-2024 | Expenses paid during the period1 | Annualized net expense ratio | |
Class A | ||||
Actual | $1,000.00 | $1,151.52 | $6.47 | 1.21 % |
Hypothetical (5% return before expenses) | $1,000.00 | $1,018.85 | $6.07 | 1.21 % |
Class C | ||||
Actual | $1,000.00 | $1,147.71 | $10.52 | 1.97 % |
Hypothetical (5% return before expenses) | $1,000.00 | $1,015.07 | $9.87 | 1.97 % |
Class R6 | ||||
Actual | $1,000.00 | $1,154.28 | $4.29 | 0.80 % |
Hypothetical (5% return before expenses) | $1,000.00 | $1,020.89 | $4.02 | 0.80 % |
Administrator Class | ||||
Actual | $1,000.00 | $1,153.00 | $6.16 | 1.15 % |
Hypothetical (5% return before expenses) | $1,000.00 | $1,019.15 | $5.77 | 1.15 % |
Institutional Class | ||||
Actual | $1,000.00 | $1,154.23 | $4.82 | 0.90 % |
Hypothetical (5% return before expenses) | $1,000.00 | $1,020.39 | $4.52 | 0.90 % |
1 | Expenses paid is equal to the annualized net expense ratio of each class multiplied by the average account value over the period, multiplied by 182 divided by 366 (to reflect the one-half-year period). |
Shares | Value | |||||
Common stocks: 97.35% | ||||||
Communication services: 4.02% | ||||||
Entertainment: 2.68% | ||||||
Liberty Media Corp.-Liberty Live Class C† | 28,727 | $1,258,817 | ||||
TKO Group Holdings, Inc. | 13,058 | 1,128,342 | ||||
2,387,159 | ||||||
Interactive media & services: 1.34% | ||||||
IAC, Inc.† | 22,359 | 1,192,629 | ||||
Consumer discretionary: 5.88% | ||||||
Broadline retail: 1.11% | ||||||
Global-E Online Ltd.† | 27,325 | 993,264 | ||||
Hotels, restaurants & leisure: 1.28% | ||||||
Wingstop, Inc. | 3,109 | 1,139,137 | ||||
Household durables: 1.28% | ||||||
Taylor Morrison Home Corp.† | 18,336 | 1,139,949 | ||||
Leisure products: 1.41% | ||||||
Games Workshop Group PLC | 9,895 | 1,253,893 | ||||
Specialty retail: 0.80% | ||||||
Wayfair, Inc. Class A† | 10,451 | 709,414 | ||||
Consumer staples: 2.91% | ||||||
Beverages: 1.62% | ||||||
Celsius Holdings, Inc.† | 17,339 | 1,437,750 | ||||
Personal care products: 1.29% | ||||||
Coty, Inc. Class A† | 96,316 | 1,151,939 | ||||
Energy: 1.34% | ||||||
Energy equipment & services: 1.34% | ||||||
Noble Corp. PLC | 24,531 | 1,189,508 | ||||
Financials: 5.21% | ||||||
Capital markets: 2.83% | ||||||
Morningstar, Inc. | 5,949 | 1,834,493 | ||||
Sprott, Inc. | 18,439 | 681,505 | ||||
2,515,998 | ||||||
Financial services: 2.38% | ||||||
Shift4 Payments, Inc. Class A† | 16,814 | 1,110,901 | ||||
StoneCo Ltd. Class A† | 60,906 | 1,011,649 | ||||
2,122,550 | ||||||
Health care: 19.77% | ||||||
Biotechnology: 5.00% | ||||||
Ascendis Pharma AS ADR† | 4,625 | 699,161 | ||||
Geron Corp.† | 128,786 | 424,994 | ||||
Shares | Value | |||||
Biotechnology(continued) | ||||||
Halozyme Therapeutics, Inc.† | 27,591 | $1,122,402 | ||||
Krystal Biotech, Inc.† | 4,115 | 732,182 | ||||
Natera, Inc.† | 16,087 | 1,471,317 | ||||
4,450,056 | ||||||
Health care equipment & supplies: 7.09% | ||||||
Axonics, Inc.† | 16,992 | 1,171,938 | ||||
Inspire Medical Systems, Inc.† | 3,312 | 711,385 | ||||
iRhythm Technologies, Inc.† | 12,570 | 1,458,120 | ||||
Lantheus Holdings, Inc.† | 15,409 | 959,056 | ||||
Shockwave Medical, Inc.† | 3,907 | 1,272,236 | ||||
TransMedics Group, Inc.† | 9,904 | 732,302 | ||||
6,305,037 | ||||||
Health care providers & services: 4.83% | ||||||
Ensign Group, Inc. | 5,863 | 729,475 | ||||
HealthEquity, Inc.† | 25,834 | 2,108,829 | ||||
Option Care Health, Inc.† | 43,529 | 1,459,963 | ||||
4,298,267 | ||||||
Life sciences tools & services: 2.85% | ||||||
MaxCyte, Inc.† | 106,600 | 446,654 | ||||
Repligen Corp.† | 4,639 | 853,205 | ||||
Stevanato Group SpA | 38,553 | 1,237,551 | ||||
2,537,410 | ||||||
Industrials: 29.77% | ||||||
Aerospace & defense: 1.22% | ||||||
AAR Corp.† | 18,169 | 1,087,778 | ||||
Building products: 3.64% | ||||||
AAON, Inc. | 20,058 | 1,767,110 | ||||
Advanced Drainage Systems, Inc. | 8,550 | 1,472,652 | ||||
3,239,762 | ||||||
Commercial services & supplies: 6.35% | ||||||
Casella Waste Systems, Inc. Class A† | 26,967 | 2,666,227 | ||||
Tetra Tech, Inc. | 12,484 | 2,305,920 | ||||
Vestis Corp. | 35,209 | 678,477 | ||||
5,650,624 | ||||||
Electrical equipment: 2.57% | ||||||
Shoals Technologies Group, Inc. Class A† | 46,168 | 516,158 | ||||
Vertiv Holdings Co. | 21,645 | 1,767,747 | ||||
2,283,905 | ||||||
Ground transportation: 1.83% | ||||||
Saia, Inc.† | 2,787 | 1,630,395 | ||||
Shares | Value | |||||
Machinery: 4.61% | ||||||
Esab Corp. | 13,158 | $1,454,880 | ||||
ESCO Technologies, Inc. | 10,994 | 1,176,908 | ||||
RBC Bearings, Inc.† | 5,449 | 1,473,137 | ||||
4,104,925 | ||||||
Professional services: 4.38% | ||||||
ICF International, Inc. | 9,146 | 1,377,662 | ||||
Parsons Corp.† | 17,060 | 1,415,127 | ||||
Paylocity Holding Corp.† | 6,443 | 1,107,294 | ||||
3,900,083 | ||||||
Trading companies & distributors: 5.17% | ||||||
Applied Industrial Technologies, Inc. | 11,860 | 2,342,943 | ||||
SiteOne Landscape Supply, Inc.† | 10,231 | 1,785,821 | ||||
Xometry, Inc. Class A† | 27,794 | 469,441 | ||||
4,598,205 | ||||||
Information technology: 22.34% | ||||||
Electronic equipment, instruments & components: 4.90% | ||||||
Littelfuse, Inc. | 4,335 | 1,050,587 | ||||
Nayax Ltd.† | 29,388 | 774,006 | ||||
nLight, Inc.† | 56,157 | 730,041 | ||||
Novanta, Inc.† | 10,329 | 1,805,200 | ||||
4,359,834 | ||||||
IT services: 2.11% | ||||||
Endava PLC ADR† | 16,116 | 613,052 | ||||
Globant SA† | 6,271 | 1,266,115 | ||||
1,879,167 | ||||||
Semiconductors & semiconductor equipment: 4.55% | ||||||
Impinj, Inc.† | 10,061 | 1,291,933 | ||||
indie Semiconductor, Inc. Class A† | 64,793 | 458,735 | ||||
Lattice Semiconductor Corp.† | 9,936 | 777,293 | ||||
Onto Innovation, Inc.† | 8,377 | 1,516,907 | ||||
4,044,868 | ||||||
Software: 10.78% | ||||||
Appfolio, Inc. Class A† | 4,728 | 1,166,587 | ||||
BILL Holdings, Inc.† | 9,940 | 683,077 | ||||
CCC Intelligent Solutions Holdings, Inc.† | 155,448 | 1,859,158 | ||||
Clearwater Analytics Holdings, Inc. Class A† | 65,477 | 1,158,288 | ||||
Descartes Systems Group, Inc.† | 15,708 | 1,437,753 | ||||
Sprout Social, Inc. Class A† | 24,879 | 1,485,525 | ||||
SPS Commerce, Inc.† | 3,542 | 654,916 | ||||
Workiva, Inc.† | 13,571 | 1,150,821 | ||||
9,596,125 | ||||||
Shares | Value | |||||
Materials: 3.29% | ||||||
Chemicals: 0.62% | ||||||
Aspen Aerogels, Inc.† | 31,283 | $550,581 | ||||
Metals & mining: 2.67% | ||||||
ATI, Inc.† | 29,502 | 1,509,617 | ||||
Carpenter Technology Corp. | 12,164 | 868,753 | ||||
2,378,370 | ||||||
Real estate: 2.82% | ||||||
Industrial REITs : 1.36% | ||||||
Rexford Industrial Realty, Inc. | 24,039 | 1,209,162 | ||||
Real estate management & development: 1.46% | ||||||
DigitalBridge Group, Inc. | 67,660 | 1,303,808 | ||||
Total common stocks (Cost $64,734,137) | 86,641,552 | |||||
Yield | ||||||
Short-term investments: 2.85% | ||||||
Investment companies: 2.85% | ||||||
Allspring Government Money Market Fund Select Class♠∞ | 5.25 % | 2,540,272 | 2,540,272 | |||
Total short-term investments (Cost $2,540,272) | 2,540,272 | |||||
Total investments in securities (Cost $67,274,409) | 100.20 % | 89,181,824 | ||||
Other assets and liabilities, net | (0.20 ) | (176,553 ) | ||||
Total net assets | 100.00 % | $89,005,271 | ||||
† | Non-income-earning security |
♠ | The issuer of the security is an affiliated person of the Fund as defined in the Investment Company Act of 1940. |
∞ | The rate represents the 7-day annualized yield at period end. |
Abbreviations: | |
ADR | American depositary receipt |
REIT | Real estate investment trust |
Value, beginning of period | Purchases | Sales proceeds | Net realized gains (losses) | Net change in unrealized gains (losses) | Value, end of period | Shares, end of period | Income from affiliated securities | |
Short-term investments | ||||||||
Allspring Government Money Market Fund Select Class | $3,883,609 | $32,058,844 | $(33,402,181 ) | $0 | $0 | $2,540,272 | 2,540,272 | $136,227 |
Assets | |
Investments in unaffiliated securities, at value (cost $64,734,137) | $86,641,552 |
Investments in affiliated securities, at value (cost $2,540,272) | 2,540,272 |
Cash | 3,430 |
Foreign currency, at value (cost $378) | 350 |
Receivable for investments sold | 1,573,786 |
Receivable for dividends | 28,130 |
Receivable for Fund shares sold | 15,351 |
Prepaid expenses and other assets | 88,378 |
Total assets | 90,891,249 |
Liabilities | |
Payable for investments purchased | 1,627,541 |
Payable for Fund shares redeemed | 172,963 |
Management fee payable | 30,333 |
Administration fees payable | 13,496 |
Distribution fee payable | 186 |
Accrued expenses and other liabilities | 41,459 |
Total liabilities | 1,885,978 |
Total net assets | $89,005,271 |
Net assets consist of | |
Paid-in capital | $93,225,633 |
Total distributable loss | (4,220,362 ) |
Total net assets | $89,005,271 |
Computation of net asset value and offering price per share | |
Net assets–Class A | $69,920,198 |
Shares outstanding–Class A1 | 5,574,999 |
Net asset value per share–Class A | $12.54 |
Maximum offering price per share – Class A2 | $13.31 |
Net assets–Class C | $300,095 |
Shares outstanding–Class C1 | 30,647 |
Net asset value per share–Class C | $9.79 |
Net assets–Class R6 | $3,566,137 |
Shares outstanding–Class R61 | 216,611 |
Net asset value per share–Class R6 | $16.46 |
Net assets–Administrator Class | $267,358 |
Shares outstanding–Administrator Class1 | 16,977 |
Net asset value per share–Administrator Class | $15.75 |
Net assets–Institutional Class | $14,951,483 |
Shares outstanding–Institutional Class1 | 912,325 |
Net asset value per share–Institutional Class | $16.39 |
Investment income | |
Dividends (net of foreign withholdings taxes of $1,156) | $378,109 |
Income from affiliated securities | 136,227 |
Interest | 18 |
Total investment income | 514,354 |
Expenses | |
Management fee | 855,728 |
Administration fees | |
Class A | 139,259 |
Class C | 689 |
Class R6 | 524 |
Administrator Class | 375 |
Institutional Class | 38,405 |
Shareholder servicing fees | |
Class A | 171,886 |
Class C | 831 |
Administrator Class | 722 |
Distribution fee | |
Class C | 2,494 |
Custody and accounting fees | 9,608 |
Professional fees | 80,614 |
Registration fees | 69,422 |
Shareholder report expenses | 35,406 |
Trustees’ fees and expenses | 22,906 |
Other fees and expenses | 15,945 |
Total expenses | 1,444,814 |
Less: Fee waivers and/or expense reimbursements | |
Fund-level | (302,447 ) |
Class A | (14,681 ) |
Class C | (71 ) |
Class R6 | (425 ) |
Administrator Class | (40 ) |
Net expenses | 1,127,150 |
Net investment loss | (612,796 ) |
Realized and unrealized gains (losses) on investments | |
Net realized losses on | |
Unaffiliated securities | (4,851,876 ) |
Foreign currency and foreign currency translations | (984 ) |
Net realized losses on investments | (4,852,860 ) |
Net change in unrealized gains (losses) on | |
Unaffiliated securities | 15,378,202 |
Foreign currency and foreign currency translations | 16 |
Net change in unrealized gains (losses) on investments | 15,378,218 |
Net realized and unrealized gains (losses) on investments | 10,525,358 |
Net increase in net assets resulting from operations | $9,912,562 |
Year ended March 31, 2024 | Year ended March 31, 2023 | |||
Operations | ||||
Net investment loss | $(612,796 ) | $(875,638 ) | ||
Net realized losses on investments | (4,852,860 ) | (20,669,864 ) | ||
Net change in unrealized gains (losses) on investments | 15,378,218 | (2,931,845 ) | ||
Net increase (decrease) in net assets resulting from operations | 9,912,562 | (24,477,347 ) | ||
Distributions to shareholders from | ||||
Net investment income and net realized gains | ||||
Class A | 0 | (5,519,827 ) | ||
Class C | 0 | (45,155 ) | ||
Class R6 | 0 | (108,808 ) | ||
Administrator Class | 0 | (20,581 ) | ||
Institutional Class | 0 | (1,746,787 ) | ||
Total distributions to shareholders | 0 | (7,441,158 ) | ||
Capital share transactions | Shares | Shares | ||
Proceeds from shares sold | ||||
Class A | 164,782 | 1,879,636 | 171,589 | 1,959,895 |
Class C | 3,779 | 35,399 | 3,700 | 35,148 |
Class R6 | 187,538 | 2,914,052 | 97,894 | 1,465,007 |
Administrator Class | 1,039 | 14,855 | 5,272 | 76,430 |
Institutional Class | 363,491 | 5,283,417 | 981,253 | 14,156,439 |
10,127,359 | 17,692,919 | |||
Reinvestment of distributions | ||||
Class A | 0 | 0 | 500,006 | 5,395,069 |
Class C | 0 | 0 | 5,306 | 45,155 |
Class R6 | 0 | 0 | 7,722 | 108,808 |
Administrator Class | 0 | 0 | 1,465 | 19,840 |
Institutional Class | 0 | 0 | 124,264 | 1,744,660 |
0 | 7,313,532 | |||
Payment for shares redeemed | ||||
Class A | (1,116,204 ) | (12,602,956 ) | (970,262 ) | (11,385,102 ) |
Class C | (21,929 ) | (190,560 ) | (26,378 ) | (253,923 ) |
Class R6 | (80,177 ) | (1,208,038 ) | (110,816 ) | (1,602,419 ) |
Administrator Class | (8,901 ) | (125,734 ) | (9,494 ) | (148,800 ) |
Institutional Class | (1,928,680 ) | (29,392,318 ) | (581,429 ) | (8,777,481 ) |
(43,519,606 ) | (22,167,725 ) | |||
Net increase (decrease) in net assets resulting from capital share transactions | (33,392,247 ) | 2,838,726 | ||
Total decrease in net assets | (23,479,685 ) | (29,079,779 ) | ||
Net assets | ||||
Beginning of period | 112,484,956 | 141,564,735 | ||
End of period | $89,005,271 | $112,484,956 | ||
Year ended March 31 | |||||
Class A | 2024 | 2023 | 2022 | 2021 | 2020 |
Net asset value, beginning of period | $11.29 | $14.82 | $21.39 | $11.00 | $13.28 |
Net investment loss | (0.08 )1 | (0.10 )1 | (0.21 )1 | (0.18 )1 | (0.10 )1 |
Net realized and unrealized gains (losses) on investments | 1.33 | (2.55 ) | (2.94 ) | 11.09 | (1.27 ) |
Total from investment operations | 1.25 | (2.65 ) | (3.15 ) | 10.91 | (1.37 ) |
Distributions to shareholders from | |||||
Net realized gains | 0.00 | (0.88 ) | (3.42 ) | (0.52 ) | (0.91 ) |
Net asset value, end of period | $12.54 | $11.29 | $14.82 | $21.39 | $11.00 |
Total return2 | 11.07 % | (17.58 )% | (17.57 )% | 99.31 % | (11.52 )% |
Ratios to average net assets (annualized) | |||||
Gross expenses | 1.54 % | 1.51 % | 1.44 % | 1.47 % | 1.52 % |
Net expenses | 1.22 % | 1.23 % | 1.23 % | 1.23 % | 1.23 % |
Net investment loss | (0.71 )% | (0.88 )% | (1.03 )% | (0.99 )% | (0.74 )% |
Supplemental data | |||||
Portfolio turnover rate | 48 % | 44 % | 55 % | 55 % | 63 % |
Net assets, end of period (000s omitted) | $69,920 | $73,660 | $101,163 | $132,937 | $66,472 |
1 | Calculated based upon average shares outstanding |
2 | Total return calculations do not include any sales charges. |
Year ended March 31 | |||||
Class C | 2024 | 2023 | 2022 | 2021 | 2020 |
Net asset value, beginning of period | $8.88 | $11.99 | $18.08 | $9.39 | $11.55 |
Net investment loss | (0.13 )1 | (0.15 )1 | (0.31 )1 | (0.28 )1 | (0.18 )1 |
Payment from affiliate | 0.00 | 0.00 | 0.00 | 0.01 | 0.00 |
Net realized and unrealized gains (losses) on investments | 1.04 | (2.08 ) | (2.36 ) | 9.48 | (1.07 ) |
Total from investment operations | 0.91 | (2.23 ) | (2.67 ) | 9.21 | (1.25 ) |
Distributions to shareholders from | |||||
Net realized gains | 0.00 | (0.88 ) | (3.42 ) | (0.52 ) | (0.91 ) |
Net asset value, end of period | $9.79 | $8.88 | $11.99 | $18.08 | $9.39 |
Total return2 | 10.25 % | (18.25 )% | (18.16 )% | 98.22 %3 | (12.30 )% |
Ratios to average net assets (annualized) | |||||
Gross expenses | 2.26 % | 2.18 % | 2.18 % | 2.20 % | 2.26 % |
Net expenses | 1.97 % | 1.97 % | 1.98 % | 1.98 % | 1.98 % |
Net investment loss | (1.46 )% | (1.62 )% | (1.79 )% | (1.74 )% | (1.49 )% |
Supplemental data | |||||
Portfolio turnover rate | 48 % | 44 % | 55 % | 55 % | 63 % |
Net assets, end of period (000s omitted) | $300 | $433 | $793 | $1,569 | $395 |
1 | Calculated based upon average shares outstanding |
2 | Total return calculations do not include any sales charges. |
3 | During the year ended March 31, 2021, the Fund received a payment from an affiliate which had an impact of 0.09% on the total return. |
Year ended March 31 | ||||
Class R6 | 2024 | 2023 | 2022 | 20211 |
Net asset value, beginning of period | $14.75 | $18.95 | $26.29 | $17.87 |
Net investment loss | (0.04 )2 | (0.07 )2 | (0.14 )2 | (0.11 )2 |
Net realized and unrealized gains (losses) on investments | 1.75 | (3.25 ) | (3.78 ) | 9.05 |
Total from investment operations | 1.71 | (3.32 ) | (3.92 ) | 8.94 |
Distributions to shareholders from | ||||
Net realized gains | 0.00 | (0.88 ) | (3.42 ) | (0.52 ) |
Net asset value, end of period | $16.46 | $14.75 | $18.95 | $26.29 |
Total return3 | 11.59 % | (17.28 )% | (17.21 )% | 50.11 % |
Ratios to average net assets (annualized) | ||||
Gross expenses | 1.12 % | 1.09 % | 1.02 % | 1.03 % |
Net expenses | 0.80 % | 0.80 % | 0.80 % | 0.80 % |
Net investment loss | (0.28 )% | (0.45 )% | (0.58 )% | (0.54 )% |
Supplemental data | ||||
Portfolio turnover rate | 48 % | 44 % | 55 % | 55 % |
Net assets, end of period (000s omitted) | $3,566 | $1,612 | $2,169 | $454 |
1 | For the period from May 29, 2020 (commencement of class operations) to March 31, 2021 |
2 | Calculated based upon average shares outstanding |
3 | Returns for periods of less than one year are not annualized. |
Year ended March 31 | |||||
Administrator Class | 2024 | 2023 | 2022 | 2021 | 2020 |
Net asset value, beginning of period | $14.16 | $18.26 | $25.54 | $12.91 | $15.43 |
Net investment loss | (0.09 )1 | (0.12 )1 | (0.22 )1 | (0.20 )1 | (0.11 )1 |
Payment from affiliate | 0.00 | 0.00 | 0.00 | 0.11 | 0.00 |
Net realized and unrealized gains (losses) on investments | 1.68 | (3.10 ) | (3.64 ) | 13.24 | (1.50 ) |
Total from investment operations | 1.59 | (3.22 ) | (3.86 ) | 13.15 | (1.61 ) |
Distributions to shareholders from | |||||
Net realized gains | 0.00 | (0.88 ) | (3.42 ) | (0.52 ) | (0.91 ) |
Net asset value, end of period | $15.75 | $14.16 | $18.26 | $25.54 | $12.91 |
Total return | 11.23 % | (17.39 )%2 | (17.49 )% | 101.97 %3 | (11.52 )% |
Ratios to average net assets (annualized) | |||||
Gross expenses | 1.46 % | 1.43 % | 1.37 % | 1.39 % | 1.44 % |
Net expenses | 1.15 % | 1.15 % | 1.15 % | 1.15 % | 1.15 % |
Net investment loss | (0.64 )% | (0.79 )% | (0.95 )% | (0.90 )% | (0.66 )% |
Supplemental data | |||||
Portfolio turnover rate | 48 % | 44 % | 55 % | 55 % | 63 % |
Net assets, end of period (000s omitted) | $267 | $352 | $504 | $391 | $93 |
1 | Calculated based upon average shares outstanding |
2 | During the year ended March 31, 2023, the Fund received payments from a service provider which had a 0.18% impact on the total return. |
3 | During the year ended March 31, 2021, the Fund received a payment from an affiliate which had an impact of 0.89% on the total return. |
Year ended March 31 | |||||
Institutional Class | 2024 | 2023 | 2022 | 2021 | 2020 |
Net asset value, beginning of period | $14.70 | $18.91 | $26.26 | $13.39 | $15.94 |
Net investment loss | (0.06 )1 | (0.08 )1 | (0.17 )1 | (0.15 )1 | (0.07 )1 |
Net realized and unrealized gains (losses) on investments | 1.75 | (3.25 ) | (3.76 ) | 13.54 | (1.57 ) |
Total from investment operations | 1.69 | (3.33 ) | (3.93 ) | 13.39 | (1.64 ) |
Distributions to shareholders from | |||||
Net realized gains | 0.00 | (0.88 ) | (3.42 ) | (0.52 ) | (0.91 ) |
Net asset value, end of period | $16.39 | $14.70 | $18.91 | $26.26 | $13.39 |
Total return | 11.50 % | (17.37 )% | (17.27 )% | 100.11 % | (11.29 )% |
Ratios to average net assets (annualized) | |||||
Gross expenses | 1.20 % | 1.18 % | 1.12 % | 1.14 % | 1.19 % |
Net expenses | 0.90 % | 0.90 % | 0.90 % | 0.90 % | 0.90 % |
Net investment loss | (0.39 )% | (0.53 )% | (0.69 )% | (0.66 )% | (0.41 )% |
Supplemental data | |||||
Portfolio turnover rate | 48 % | 44 % | 55 % | 55 % | 63 % |
Net assets, end of period (000s omitted) | $14,951 | $36,428 | $36,936 | $19,311 | $7,980 |
1 | Calculated based upon average shares outstanding |
Gross unrealized gains | $25,433,204 |
Gross unrealized losses | (4,227,865 ) |
Net unrealized gains | $21,205,339 |
Paid-in capital | Total distributable loss |
$(666,128 ) | $666,128 |
Quoted prices (Level 1) | Other significant observable inputs (Level 2) | Significant unobservable inputs (Level 3) | Total | |
Assets | ||||
Investments in: | ||||
Common stocks | ||||
Communication services | $3,579,788 | $0 | $0 | $3,579,788 |
Consumer discretionary | 5,235,657 | 0 | 0 | 5,235,657 |
Consumer staples | 2,589,689 | 0 | 0 | 2,589,689 |
Energy | 1,189,508 | 0 | 0 | 1,189,508 |
Financials | 4,638,548 | 0 | 0 | 4,638,548 |
Health care | 17,590,770 | 0 | 0 | 17,590,770 |
Industrials | 26,495,677 | 0 | 0 | 26,495,677 |
Information technology | 19,879,994 | 0 | 0 | 19,879,994 |
Materials | 2,928,951 | 0 | 0 | 2,928,951 |
Real estate | 2,512,970 | 0 | 0 | 2,512,970 |
Short-term investments | ||||
Investment companies | 2,540,272 | 0 | 0 | 2,540,272 |
Total assets | $89,181,824 | $0 | $0 | $89,181,824 |
Average daily net assets | Management fee |
First $500 million | 0.850 % |
Next $500 million | 0.825 |
Next $1 billion | 0.800 |
Next $1 billion | 0.775 |
Next $1 billion | 0.750 |
Next $1 billion | 0.730 |
Next $5 billion | 0.720 |
Over $10 billion | 0.710 |
Class-level administration fee | |
Class A | 0.20 % |
Class C | 0.20 |
Class R6 | 0.03 |
Administrator Class | 0.13 |
Institutional Class | 0.13 |
EXPENSE RATIO CAPS | |
Class A | 1.22 % |
Class C | 1.97 |
Class R6 | 0.80 |
Administrator Class | 1.15 |
Institutional Class | 0.90 |
Year ended March 31 | ||
2024 | 2023 | |
Long-term capital gain | $0 | $7,441,158 |
Unrealized gains | Late-year ordinary losses deferred | Capital loss carryforward |
$21,205,302 | $(140,385 ) | $(25,277,883 ) |
Allspring Funds Trust:

Name and year of birth | Position held and length of service* | Principal occupations during past five years or longer | Current other public company or investment company directorships |
William R. Ebsworth (Born 1957) | Trustee, since 2015 | Retired. From 1984 to 2013, equities analyst, portfolio manager, research director and chief investment officer at Fidelity Management and Research Company in Boston, Tokyo, and Hong Kong, and retired in 2013 as Chief Investment Officer of Fidelity Strategic Advisers, Inc. where he led a team of investment professionals managing client assets. Prior thereto, Board member of Hong Kong Securities Clearing Co., Hong Kong Options Clearing Corp., the Thailand International Fund, Ltd., Fidelity Investments Life Insurance Company, and Empire Fidelity Investments Life Insurance Company. Serves on the Investment Company Institute’s Board of Governors since 2022 and Executive Committee since 2023 as well as the Vice Chairman of the Governing Council of the Independent Directors Council since 2023. Audit Committee Chair and Investment Committee Chair of the Vincent Memorial Hospital Foundation (non-profit organization). Mr. Ebsworth is a CFA charterholder. | N/A |
Jane A. Freeman (Born 1953) | Trustee, since 2015; Chair Liaison, since January 2018# | Retired. From 2012 to 2014 and 1999 to 2008, Chief Financial Officer of Scientific Learning Corporation. From 2008 to 2012, Ms. Freeman provided consulting services related to strategic business projects. Prior to 1999, Portfolio Manager at Rockefeller & Co. and Scudder, Stevens & Clark. Board member of the Harding Loevner Funds from 1996 to 2014, serving as both Lead Independent Director and chair of the Audit Committee. Board member of the Russell Exchange Traded Funds Trust from 2011 to 2012 and the chair of the Audit Committee. Ms. Freeman is also an inactive Chartered Financial Analyst. | N/A |
Isaiah Harris, Jr. (Born 1952) | Trustee, since 2009; Audit Committee Chair, since 2019 | Retired. Member of the Advisory Board of CEF of East Central Florida. Chairman of the Board of CIGNA Corporation from 2009 to 2021, and Director from 2005 to 2008. From 2003 to 2011, Director of Deluxe Corporation. Prior thereto, President and CEO of BellSouth Advertising and Publishing Corp. from 2005 to 2007, President and CEO of BellSouth Enterprises from 2004 to 2005 and President of BellSouth Consumer Services from 2000 to 2003. Emeritus member of the Iowa State University Foundation Board of Governors. Emeritus Member of the Advisory board of Iowa State University School of Business. Advisory Board Member, Palm Harbor Academy (private school). Advisory Board Member, Fellowship of Christian Athletes. Mr. Harris is a certified public accountant (inactive status). | N/A |
David F. Larcker (Born 1950) | Trustee, since 2009 | Distinguished Visiting Fellow at the Hoover Institution since 2022. James Irvin Miller Professor of Accounting at the Graduate School of Business (Emeritus), Stanford University, Director of the Corporate Governance Research Initiative and Senior Faculty of The Rock Center for Corporate Governance since 2006. From 2005 to 2008, Professor of Accounting at the Graduate School of Business, Stanford University. Prior thereto, Ernst & Young Professor of Accounting at The Wharton School, University of Pennsylvania from 1985 to 2005. | N/A |
Olivia S. Mitchell (Born 1953) | Trustee, since 2006; Nominating and Governance Committee Chair, since 2018 | International Foundation of Employee Benefit Plans Professor since 1993, Wharton School of the University of Pennsylvania. Director of Wharton’s Pension Research Council and Boettner Center on Pensions & Retirement Research, and Research Associate at the National Bureau of Economic Research. Previously taught at Cornell University from 1978 to 1993. | N/A |
Name and year of birth | Position held and length of service* | Principal occupations during past five years or longer | Current other public company or investment company directorships |
Timothy J. Penny (Born 1951) | Trustee, since 1996; Chair, since 2018 | President and Chief Executive Officer of Southern Minnesota Initiative Foundation, a non-profit organization, since 2007. Vice Chair of the Economic Club of Minnesota, since 2007. Co-Chair of the Committee for a Responsible Federal Budget, since 1995. Member of the Board of Trustees of NorthStar Education Finance, Inc., a non-profit organization, from 2007-2022. Senior Fellow of the University of Minnesota Humphrey Institute from 1995 to 2017. | N/A |
James G. Polisson (Born 1959) | Trustee, since 2018 | Retired. Chief Marketing Officer, Source (ETF) UK Services, Ltd, from 2015 to 2017. From 2012 to 2015, Principal of The Polisson Group, LLC, a management consulting, corporate advisory and principal investing company. Chief Executive Officer and Managing Director at Russell Investments, Global Exchange Traded Funds from 2010 to 2012. Managing Director of Barclays Global Investors from 1998 to 2010 and Global Chief Marketing Officer for iShares and Barclays Global Investors from 2000 to 2010. Trustee of the San Francisco Mechanics’ Institute, a non- profit organization, from 2013 to 2015. Board member of the Russell Exchange Traded Fund Trust from 2011 to 2012. Director of Barclays Global Investors Holdings Deutschland GmbH from 2006 to 2009. Mr. Polisson is an attorney and has a retired status with the Massachusetts and District of Columbia Bar Associations. | N/A |
Pamela Wheelock (Born 1959) | Trustee, since January 2020; previously Trustee from January 2018 to July 2019# | Retired. Executive and Senior Financial leadership positions in the public, private and nonprofit sectors. Interim President and CEO, McKnight Foundation, 2020. Interim Commissioner, Minnesota Department of Human Services, 2019. Chief Operating Officer, Twin Cities Habitat for Humanity, 2017-2019. Vice President for University Services, University of Minnesota, 2012- 2016. Interim President and CEO, Blue Cross and Blue Shield of Minnesota, 2011-2012. Executive Vice-President and Chief Financial Officer, Minnesota Wild, 2002-2008. Commissioner, Minnesota Department of Finance, 1999-2002. Chair of the Board of Directors of Destination Medical Center Corporation. Board member of the Minnesota Wild Foundation. | N/A |
Name and year of birth | Position held and length of service | Principal occupations during past five years or longer |
Andrew Owen (Born 1960) | President, since 2017 | President and Chief Executive Officer of Allspring Funds Management, LLC since 2017 and Head of Global Fund Governance of Allspring Global Investments since 2022. Prior thereto, co-president of Galliard Capital Management, LLC, an affiliate of Allspring Funds Management, LLC, from 2019 to 2022 and Head of Affiliated Managers, Allspring Global Investments, from 2014 to 2019 and Executive Vice President responsible for marketing, investments and product development for Allspring Funds Management, LLC, from 2009 to 2014. |
Jeremy DePalma (Born 1974) | Treasurer, since 2012 (for certain funds in the Fund Complex); since 2021 (for the remaining funds in the Complex) | Senior Vice President of Allspring Funds Management, LLC since 2009. Senior Vice President of Evergreen Investment Management Company, LLC from 2008 to 2010 and head of the Fund Reporting and Control Team within Fund Administration from 2005 to 2010. |
Christopher Baker (Born 1976) | Chief Compliance Officer, since 2022 | Global Chief Compliance Officer for Allspring Global Investments since 2022. Prior thereto, Chief Compliance Officer for State Street Global Advisors from 2018 to 2021. Senior Compliance Officer for the State Street divisions of Alternative Investment Solutions, Sector Solutions, and Global Marketing from 2015 to 2018. From 2010 to 2015 Vice President, Global Head of Investment and Marketing Compliance for State Street Global Advisors. |
Matthew Prasse (Born 1983) | Chief Legal Officer, since 2022; Secretary, since 2021 | Senior Counsel of the Allspring Legal Department since 2021. Senior Counsel of the Wells Fargo Legal Department from 2018 to 2021. Previously, Counsel for Barings LLC from 2015 to 2018. Prior to joining Barings, Associate at Morgan, Lewis & Bockius LLP from 2008 to 2015. |

P.O. Box 219967
Kansas City, MO 64121-9967

AR4308 03-24
2 | |
6 | |
10 | |
11 | |
26 | |
27 | |
29 | |
30 | |
33 | |
38 | |
39 |

Allspring Funds

President
Allspring Funds
Notice to Shareholders |
Beginning in July 2024, the Fund will be required by the Securities and Exchange Commission to send shareholders a paper copy of a new tailored shareholder report in place of the full shareholder report that you are now receiving. The tailored shareholder report will contain concise information about the Fund, including certain expense and performance information and fund statistics. If you wish to receive this new tailored shareholder report electronically, please follow the instructions on the back cover of this report. |
Other information that is currently included in the shareholder report, such as the Fund’s financial statements, will be available online and upon request, free of charge, in paper or electronic format. |
Investment objective | The Fund seeks to replicate the total returns of the S&P 500 Index, before fees and expenses. |
Manager | Allspring Funds Management, LLC |
Subadviser | Allspring Global Investments, LLC |
Portfolio managers | John R. Campbell, CFA, David Neal, CFA, Robert M. Wicentowski, CFA |
Average annual total returns (%) as of March 31, 2024 | |||||||||
Including sales charge | Excluding sales charge | Expense ratios1 (%) | |||||||
Inception date | 1 year | 5 year | 10 year | 1 year | 5 year | 10 year | Gross | Net2 | |
Class A (WFILX) | 11-4-1998 | 21.88 | 13.13 | 11.75 | 29.31 | 14.47 | 12.41 | 0.63 | 0.44 |
Class C (WFINX) | 4-30-1999 | 27.34 | 13.64 | 11.75 | 28.34 | 13.64 | 11.75 | 1.38 | 1.19 |
Administrator Class (WFIOX) | 2-14-1985 | – | – | – | 29.57 | 14.70 | 12.65 | 0.41 | 0.25 |
S&P 500 Index3 | – | – | – | – | 29.88 | 15.05 | 12.96 | – | – |
1 | Reflects the expense ratios as stated in the most recent prospectuses. The expense ratios shown are subject to change and may differ from the annualized expense ratios shown in the Financial Highlights of this report. |
2 | The manager has contractually committed through September 30, 2024, to waive fees and/or reimburse expenses to the extent necessary to cap total annual fund operating expenses after fee waivers at 0.44% for Class A, 1.19% for Class C and 0.25% for Administrator Class. Brokerage commissions, stamp duty fees, interest, taxes, acquired fund fees and expenses (if any), and extraordinary expenses are excluded from the expense caps. Prior to or after the commitment expiration date, the caps may be increased or the commitment to maintain the caps may be terminated only with the approval of the Board of Trustees. Without these caps, the Fund’s returns would have been lower. The expense ratio paid by an investor is the net expense ratio (the total annual fund operating expenses after fee waivers) as stated in the prospectuses. |
3 | The S&P 500 Index consists of 500 stocks chosen for market size, liquidity, and industry group representation. It is a market-value-weighted index with each stock’s weight in the index proportionate to its market value. You cannot invest directly in an index. |
CFA® and Chartered Financial Analyst® are trademarks owned by CFA Institute. |
Growth of $10,000 investment as of March 31, 20241 |
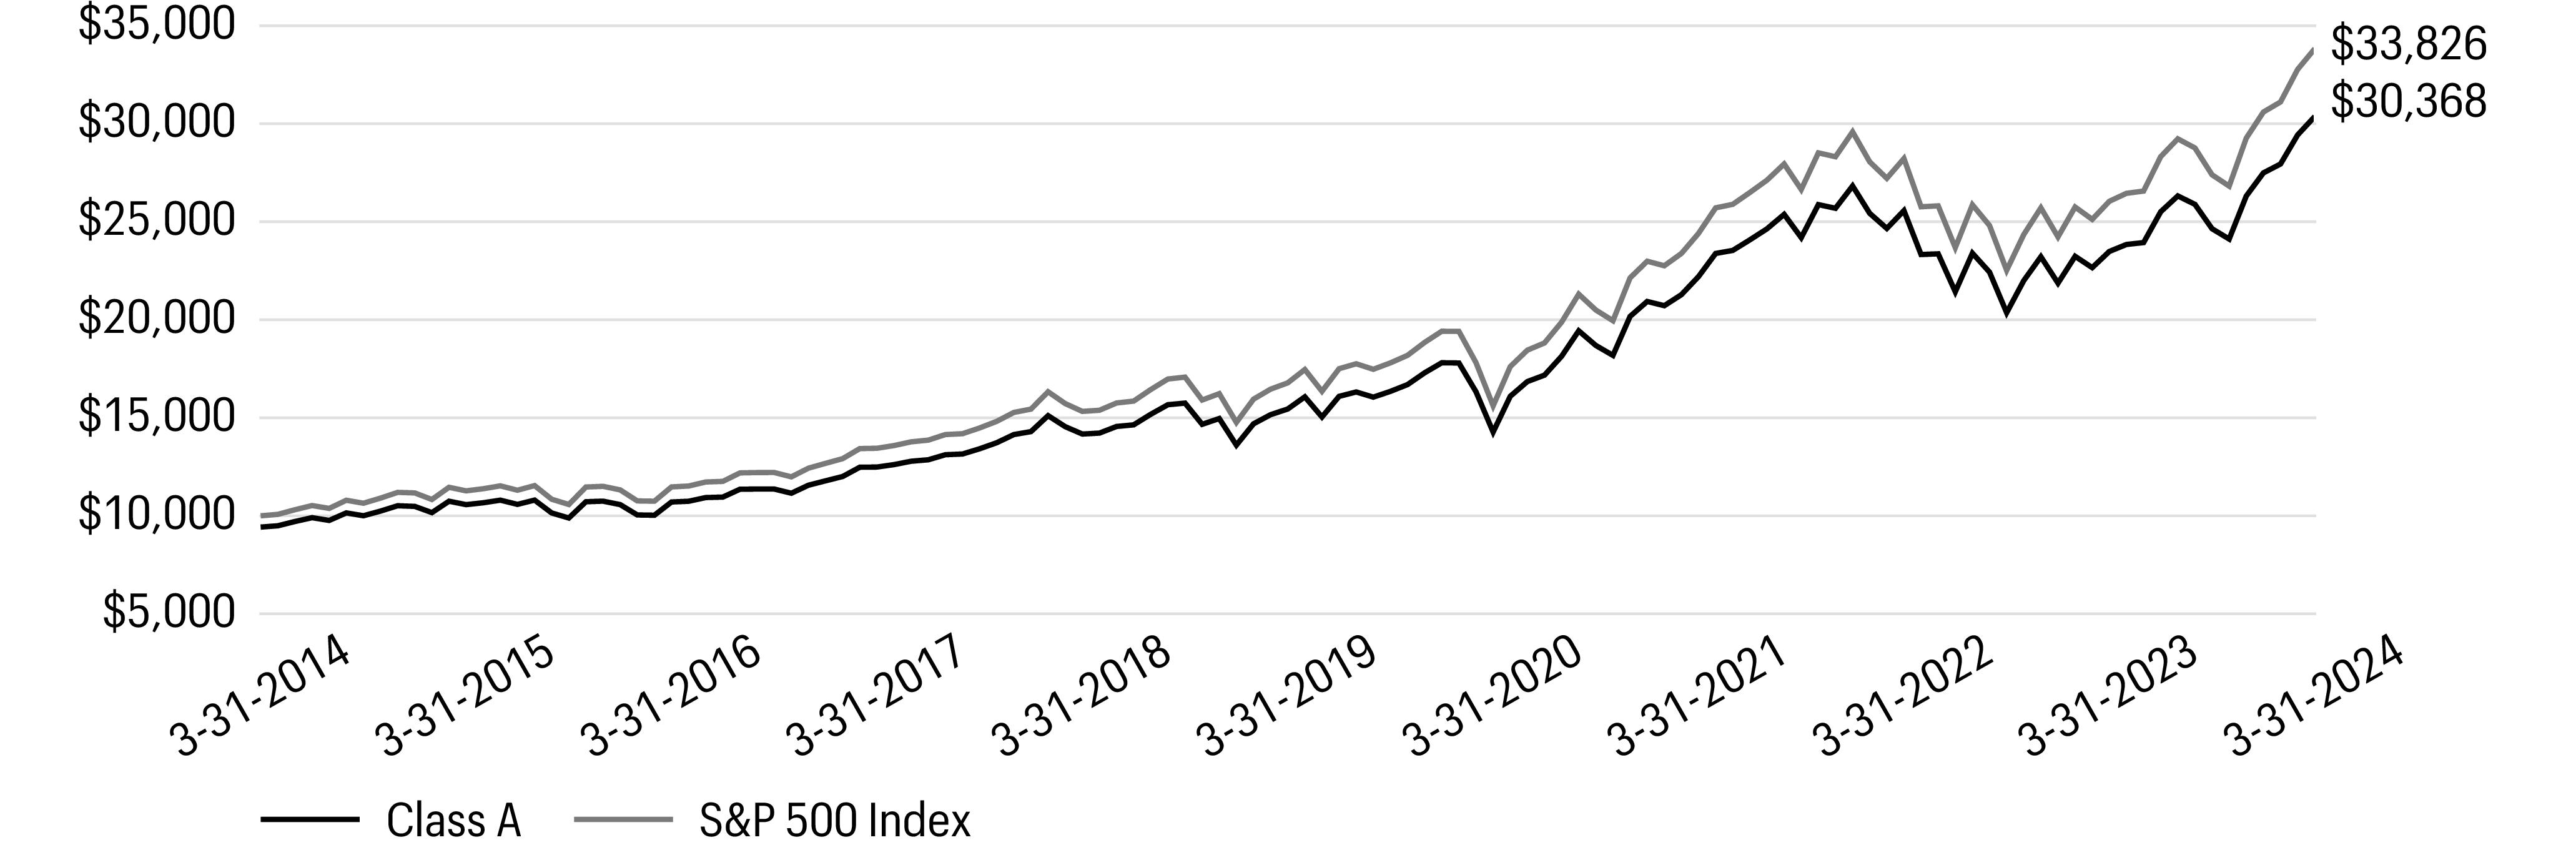
1 | The chart compares the performance of Class A shares for the most recent ten years with the S&P 500 Index. The chart assumes a hypothetical investment of $10,000 in Class A shares and reflects all operating expenses and assumes the maximum initial sales charge of 5.75%. |
Ten largest holdings (%) as of March 31, 20241 | |
Microsoft Corp. | 6.95 |
Apple, Inc. | 5.53 |
NVIDIA Corp. | 4.96 |
Amazon.com, Inc. | 3.66 |
Meta Platforms, Inc. Class A | 2.37 |
Alphabet, Inc. Class A | 1.98 |
Berkshire Hathaway, Inc. Class B | 1.70 |
Alphabet, Inc. Class C | 1.67 |
Eli Lilly & Co. | 1.38 |
Broadcom, Inc. | 1.30 |
1 | Figures represent the percentage of the Fund’s net assets. Holdings are subject to change and may have changed since the date specified. |
Sector allocation as of March 31, 20241 |
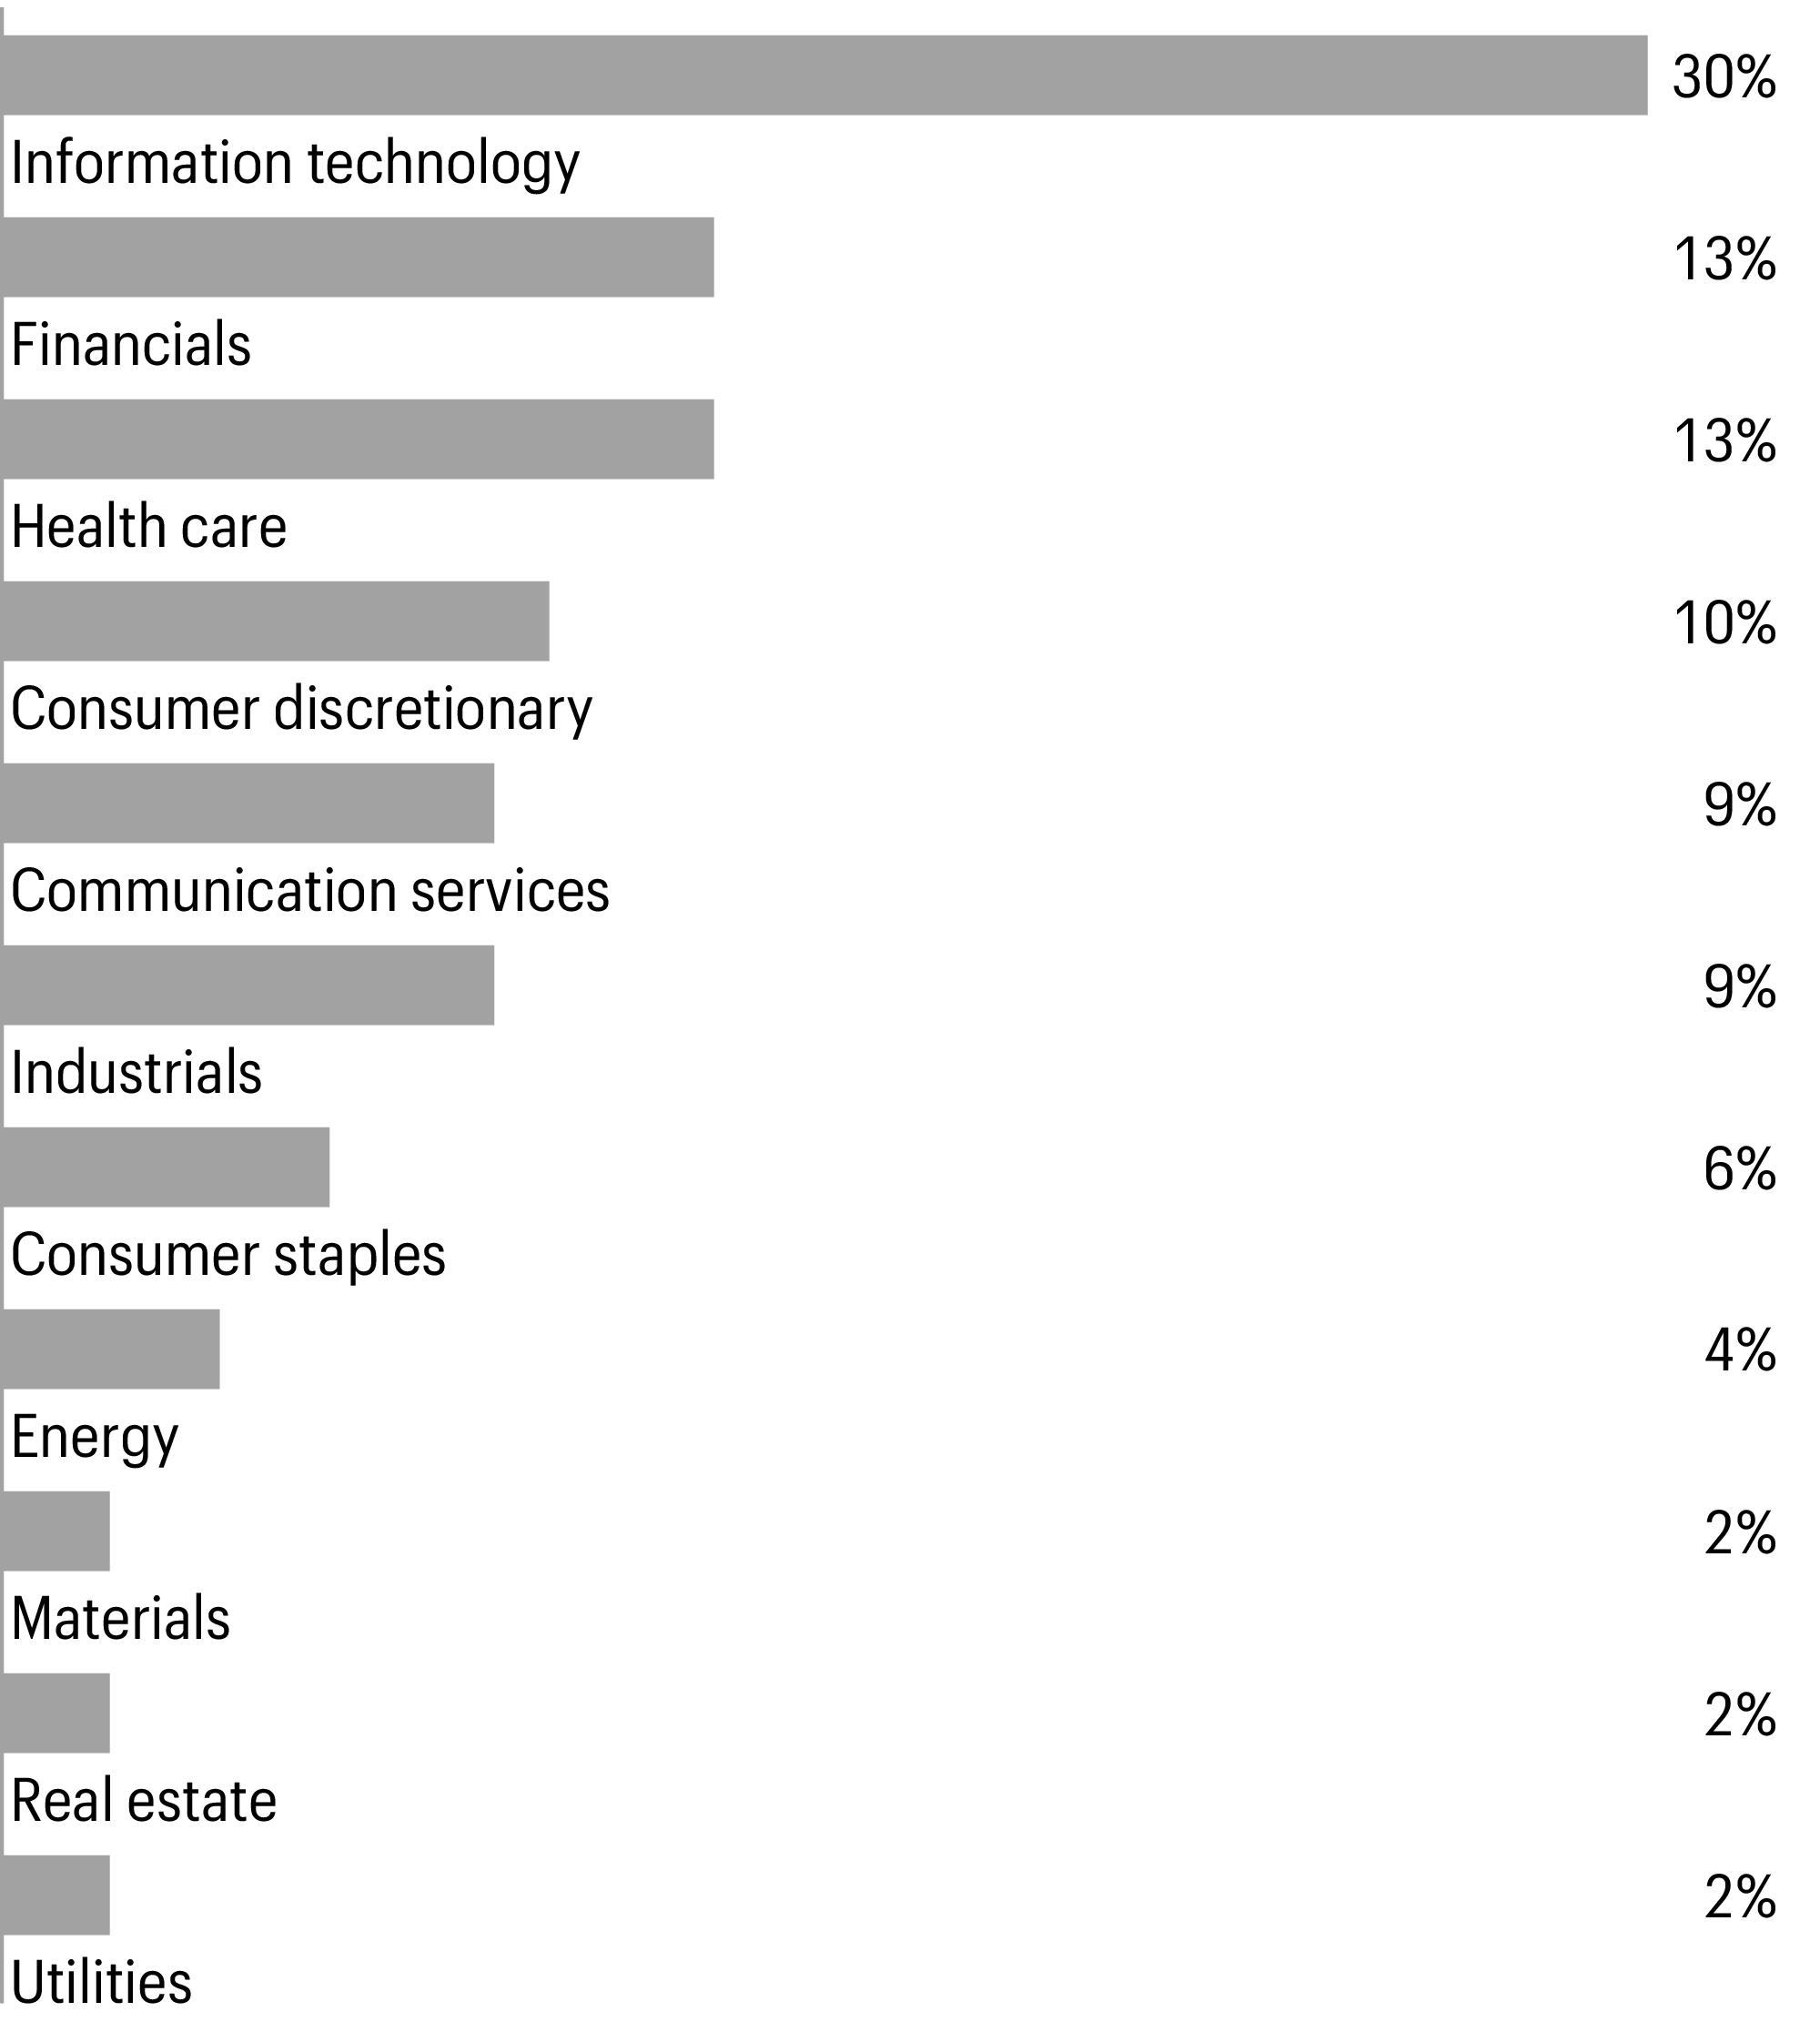
1 | Figures represent the percentage of the Fund’s long-term investments. Allocations are subject to change and may have changed since the date specified. |
Beginning account value 10-1-2023 | Ending account value 3-31-2024 | Expenses paid during the period1 | Annualized net expense ratio | |
Class A | ||||
Actual | $1,000.00 | $1,232.26 | $2.28 | 0.41 % |
Hypothetical (5% return before expenses) | $1,000.00 | $1,022.83 | $2.06 | 0.41 % |
Class C | ||||
Actual | $1,000.00 | $1,227.57 | $6.59 | 1.19 % |
Hypothetical (5% return before expenses) | $1,000.00 | $1,018.95 | $5.97 | 1.19 % |
Administrator Class | ||||
Actual | $1,000.00 | $1,233.34 | $1.39 | 0.25 % |
Hypothetical (5% return before expenses) | $1,000.00 | $1,023.62 | $1.26 | 0.25 % |
1 | Expenses paid is equal to the annualized net expense ratio of each class multiplied by the average account value over the period, multiplied by 182 divided by 366 (to reflect the one-half-year period). |
Shares | Value | |||||
Common stocks: 97.94% | ||||||
Communication services: 8.77% | ||||||
Diversified telecommunication services: 0.67% | ||||||
AT&T, Inc. | 202,232 | $3,559,283 | ||||
Verizon Communications, Inc. | 118,915 | 4,989,673 | ||||
8,548,956 | ||||||
Entertainment: 1.29% | ||||||
Electronic Arts, Inc. | 6,881 | 912,902 | ||||
Live Nation Entertainment, Inc.† | 4,013 | 424,455 | ||||
Netflix, Inc.† | 12,240 | 7,433,719 | ||||
Take-Two Interactive Software, Inc.† | 4,485 | 665,978 | ||||
Walt Disney Co. | 51,882 | 6,348,282 | ||||
Warner Bros Discovery, Inc.† | 62,765 | 547,938 | ||||
16,333,274 | ||||||
Interactive media & services: 6.04% | ||||||
Alphabet, Inc. Class A† | 166,679 | 25,156,861 | ||||
Alphabet, Inc. Class C† | 139,548 | 21,247,578 | ||||
Match Group, Inc.† | 7,688 | 278,921 | ||||
Meta Platforms, Inc. Class A | 62,227 | 30,216,187 | ||||
76,899,547 | ||||||
Media: 0.58% | ||||||
Charter Communications, Inc. Class A† | 2,793 | 811,730 | ||||
Comcast Corp. Class A | 112,074 | 4,858,408 | ||||
Fox Corp. Class A | 6,768 | 211,635 | ||||
Fox Corp. Class B | 3,731 | 106,781 | ||||
Interpublic Group of Cos., Inc. | 10,833 | 353,481 | ||||
News Corp. Class A | 10,749 | 281,409 | ||||
News Corp. Class B | 3,243 | 87,756 | ||||
Omnicom Group, Inc. | 5,600 | 541,856 | ||||
Paramount Global Class B | 13,646 | 160,613 | ||||
7,413,669 | ||||||
Wireless telecommunication services: 0.19% | ||||||
T-Mobile U.S., Inc. | 14,771 | 2,410,923 | ||||
Consumer discretionary: 10.13% | ||||||
Automobile components: 0.07% | ||||||
Aptiv PLC† | 7,892 | 628,598 | ||||
BorgWarner, Inc. | 6,499 | 225,775 | ||||
854,373 | ||||||
Automobiles: 1.31% | ||||||
Ford Motor Co. | 110,387 | 1,465,939 | ||||
General Motors Co. | 32,652 | 1,480,768 | ||||
Tesla, Inc.† | 78,369 | 13,776,487 | ||||
16,723,194 | ||||||
Shares | Value | |||||
Broadline retail: 3.74% | ||||||
Amazon.com, Inc.† | 258,543 | $46,635,986 | ||||
eBay, Inc. | 14,680 | 774,810 | ||||
Etsy, Inc.† | 3,387 | 232,755 | ||||
47,643,551 | ||||||
Distributors: 0.12% | ||||||
Genuine Parts Co. | 3,965 | 614,298 | ||||
LKQ Corp. | 7,569 | 404,260 | ||||
Pool Corp. | 1,094 | 441,429 | ||||
1,459,987 | ||||||
Hotels, restaurants & leisure: 2.01% | ||||||
Airbnb, Inc. Class A† | 12,319 | 2,032,142 | ||||
Booking Holdings, Inc. | 987 | 3,580,718 | ||||
Caesars Entertainment, Inc.† | 6,101 | 266,858 | ||||
Carnival Corp.† | 28,496 | 465,625 | ||||
Chipotle Mexican Grill, Inc.† | 776 | 2,255,653 | ||||
Darden Restaurants, Inc. | 3,377 | 564,465 | ||||
Domino’s Pizza, Inc. | 987 | 490,421 | ||||
Expedia Group, Inc.† | 3,699 | 509,537 | ||||
Hilton Worldwide Holdings, Inc. | 7,132 | 1,521,327 | ||||
Las Vegas Sands Corp. | 10,445 | 540,006 | ||||
Marriott International, Inc. Class A | 6,978 | 1,760,619 | ||||
McDonald’s Corp. | 20,516 | 5,784,486 | ||||
MGM Resorts International† | 7,729 | 364,886 | ||||
Norwegian Cruise Line Holdings Ltd.† | 12,033 | 251,851 | ||||
Royal Caribbean Cruises Ltd.† | 6,673 | 927,614 | ||||
Starbucks Corp. | 32,023 | 2,926,582 | ||||
Wynn Resorts Ltd. | 2,695 | 275,510 | ||||
Yum! Brands, Inc. | 7,948 | 1,101,990 | ||||
25,620,290 | ||||||
Household durables: 0.38% | ||||||
D.R. Horton, Inc. | 8,447 | 1,389,954 | ||||
Garmin Ltd. | 4,329 | 644,458 | ||||
Lennar Corp. Class A | 6,991 | 1,202,312 | ||||
Mohawk Industries, Inc.† | 1,495 | 195,681 | ||||
NVR, Inc.† | 90 | 728,997 | ||||
PulteGroup, Inc. | 5,999 | 723,599 | ||||
4,885,001 | ||||||
Leisure products: 0.02% | ||||||
Hasbro, Inc. | 3,689 | 208,502 | ||||
Specialty retail: 2.02% | ||||||
AutoZone, Inc.† | 489 | 1,541,157 | ||||
Bath & Body Works, Inc. | 6,391 | 319,678 | ||||
Best Buy Co., Inc. | 5,422 | 444,766 | ||||
CarMax, Inc.† | 4,467 | 389,120 | ||||
Shares | Value | |||||
Specialty retail(continued) | ||||||
Home Depot, Inc. | 28,150 | $10,798,340 | ||||
Lowe’s Cos., Inc. | 16,267 | 4,143,693 | ||||
O’Reilly Automotive, Inc.† | 1,671 | 1,886,358 | ||||
Ross Stores, Inc. | 9,522 | 1,397,449 | ||||
TJX Cos., Inc. | 32,235 | 3,269,274 | ||||
Tractor Supply Co. | 3,058 | 800,340 | ||||
Ulta Beauty, Inc.† | 1,374 | 718,437 | ||||
25,708,612 | ||||||
Textiles, apparel & luxury goods: 0.46% | ||||||
Deckers Outdoor Corp.† | 726 | 683,355 | ||||
lululemon athletica, Inc.† | 3,248 | 1,268,831 | ||||
NIKE, Inc. Class B | 34,428 | 3,235,544 | ||||
Ralph Lauren Corp. | 1,104 | 207,287 | ||||
Tapestry, Inc. | 6,487 | 308,003 | ||||
VF Corp. | 9,348 | 143,398 | ||||
5,846,418 | ||||||
Consumer staples: 5.84% | ||||||
Beverages: 1.38% | ||||||
Brown-Forman Corp. Class B | 5,114 | 263,985 | ||||
Coca-Cola Co. | 110,056 | 6,733,226 | ||||
Constellation Brands, Inc. Class A | 4,550 | 1,236,508 | ||||
Keurig Dr Pepper, Inc. | 29,458 | 903,477 | ||||
Molson Coors Beverage Co. Class B | 5,237 | 352,188 | ||||
Monster Beverage Corp.† | 20,894 | 1,238,596 | ||||
PepsiCo, Inc. | 38,875 | 6,803,514 | ||||
17,531,494 | ||||||
Consumer staples distribution & retail: 1.82% | ||||||
Costco Wholesale Corp. | 12,550 | 9,194,506 | ||||
Dollar General Corp. | 6,208 | 968,820 | ||||
Dollar Tree, Inc.† | 5,854 | 779,460 | ||||
Kroger Co. | 18,720 | 1,069,474 | ||||
Sysco Corp. | 14,081 | 1,143,096 | ||||
Target Corp. | 13,058 | 2,314,008 | ||||
Walgreens Boots Alliance, Inc. | 20,245 | 439,114 | ||||
Walmart, Inc. | 121,075 | 7,285,083 | ||||
23,193,561 | ||||||
Food products: 0.78% | ||||||
Archer-Daniels-Midland Co. | 15,086 | 947,552 | ||||
Bunge Global SA | 4,109 | 421,255 | ||||
Campbell Soup Co. | 5,565 | 247,364 | ||||
Conagra Brands, Inc. | 13,520 | 400,733 | ||||
General Mills, Inc. | 16,062 | 1,123,858 | ||||
Hershey Co. | 4,239 | 824,486 | ||||
Hormel Foods Corp. | 8,197 | 285,993 | ||||
J M Smucker Co. | 3,002 | 377,862 | ||||
Shares | Value | |||||
Food products(continued) | ||||||
Kellanova | 7,460 | $427,383 | ||||
Kraft Heinz Co. | 22,550 | 832,095 | ||||
Lamb Weston Holdings, Inc. | 4,083 | 434,962 | ||||
McCormick & Co., Inc. | 7,112 | 546,273 | ||||
Mondelez International, Inc. Class A | 38,084 | 2,665,880 | ||||
Tyson Foods, Inc. Class A | 8,099 | 475,654 | ||||
10,011,350 | ||||||
Household products: 1.21% | ||||||
Church & Dwight Co., Inc. | 6,969 | 726,936 | ||||
Clorox Co. | 3,510 | 537,416 | ||||
Colgate-Palmolive Co. | 23,288 | 2,097,085 | ||||
Kimberly-Clark Corp. | 9,528 | 1,232,447 | ||||
Procter & Gamble Co. | 66,553 | 10,798,224 | ||||
15,392,108 | ||||||
Personal care products: 0.16% | ||||||
Estee Lauder Cos., Inc. Class A | 6,588 | 1,015,540 | ||||
Kenvue, Inc. | 48,748 | 1,046,132 | ||||
2,061,672 | ||||||
Tobacco: 0.49% | ||||||
Altria Group, Inc. | 49,878 | 2,175,679 | ||||
Philip Morris International, Inc. | 43,910 | 4,023,034 | ||||
6,198,713 | ||||||
Energy: 3.87% | ||||||
Energy equipment & services: 0.33% | ||||||
Baker Hughes Co. | 28,309 | 948,352 | ||||
Halliburton Co. | 25,176 | 992,438 | ||||
Schlumberger NV | 40,373 | 2,212,844 | ||||
4,153,634 | ||||||
Oil, gas & consumable fuels: 3.54% | ||||||
APA Corp. | 10,216 | 351,226 | ||||
Chevron Corp. | 49,058 | 7,738,409 | ||||
ConocoPhillips | 33,322 | 4,241,224 | ||||
Coterra Energy, Inc. | 21,275 | 593,147 | ||||
Devon Energy Corp. | 18,122 | 909,362 | ||||
Diamondback Energy, Inc. | 5,062 | 1,003,137 | ||||
EOG Resources, Inc. | 16,494 | 2,108,593 | ||||
EQT Corp. | 11,634 | 431,272 | ||||
Exxon Mobil Corp. | 112,317 | 13,055,728 | ||||
Hess Corp. | 7,786 | 1,188,455 | ||||
Kinder Morgan, Inc. | 54,696 | 1,003,125 | ||||
Marathon Oil Corp. | 16,553 | 469,112 | ||||
Marathon Petroleum Corp. | 10,409 | 2,097,413 | ||||
Occidental Petroleum Corp. | 18,616 | 1,209,854 | ||||
ONEOK, Inc. | 16,477 | 1,320,961 | ||||
Shares | Value | |||||
Oil, gas & consumable fuels(continued) | ||||||
Phillips 66 | 12,162 | $1,986,541 | ||||
Pioneer Natural Resources Co. | 6,608 | 1,734,600 | ||||
Targa Resources Corp. | 6,307 | 706,321 | ||||
Valero Energy Corp. | 9,629 | 1,643,574 | ||||
Williams Cos., Inc. | 34,408 | 1,340,880 | ||||
45,132,934 | ||||||
Financials: 12.89% | ||||||
Banks: 3.30% | ||||||
Bank of America Corp. | 194,735 | 7,384,351 | ||||
Citigroup, Inc. | 53,828 | 3,404,083 | ||||
Citizens Financial Group, Inc. | 13,187 | 478,556 | ||||
Comerica, Inc. | 3,731 | 205,168 | ||||
Fifth Third Bancorp | 19,265 | 716,851 | ||||
Huntington Bancshares, Inc. | 40,965 | 571,462 | ||||
JPMorgan Chase & Co. | 81,770 | 16,378,531 | ||||
KeyCorp | 26,490 | 418,807 | ||||
M&T Bank Corp. | 4,699 | 683,423 | ||||
PNC Financial Services Group, Inc. | 11,258 | 1,819,293 | ||||
Regions Financial Corp. | 26,135 | 549,880 | ||||
Truist Financial Corp. | 37,724 | 1,470,481 | ||||
U.S. Bancorp | 44,039 | 1,968,543 | ||||
Wells Fargo & Co. | 101,791 | 5,899,806 | ||||
41,949,235 | ||||||
Capital markets: 2.75% | ||||||
Ameriprise Financial, Inc. | 2,834 | 1,242,539 | ||||
Bank of New York Mellon Corp. | 21,477 | 1,237,505 | ||||
BlackRock, Inc. | 3,955 | 3,297,283 | ||||
Blackstone, Inc. | 20,346 | 2,672,854 | ||||
Cboe Global Markets, Inc. | 2,986 | 548,618 | ||||
Charles Schwab Corp. | 42,093 | 3,045,008 | ||||
CME Group, Inc. | 10,182 | 2,192,083 | ||||
FactSet Research Systems, Inc. | 1,077 | 489,378 | ||||
Franklin Resources, Inc. | 8,489 | 238,626 | ||||
Goldman Sachs Group, Inc. | 9,224 | 3,852,772 | ||||
Intercontinental Exchange, Inc. | 16,196 | 2,225,816 | ||||
Invesco Ltd. | 12,714 | 210,925 | ||||
MarketAxess Holdings, Inc. | 1,072 | 235,036 | ||||
Moody’s Corp. | 4,451 | 1,749,376 | ||||
Morgan Stanley | 35,434 | 3,336,465 | ||||
MSCI, Inc. | 2,237 | 1,253,727 | ||||
Nasdaq, Inc. | 10,748 | 678,199 | ||||
Northern Trust Corp. | 5,802 | 515,914 | ||||
Raymond James Financial, Inc. | 5,321 | 683,323 | ||||
S&P Global, Inc. | 9,088 | 3,866,490 | ||||
State Street Corp. | 8,540 | 660,313 | ||||
T Rowe Price Group, Inc. | 6,333 | 772,119 | ||||
35,004,369 | ||||||
Shares | Value | |||||
Consumer finance: 0.53% | ||||||
American Express Co. | 16,175 | $3,682,886 | ||||
Capital One Financial Corp. | 10,759 | 1,601,907 | ||||
Discover Financial Services | 7,073 | 927,200 | ||||
Synchrony Financial | 11,507 | 496,182 | ||||
6,708,175 | ||||||
Financial services: 4.19% | ||||||
Berkshire Hathaway, Inc. Class B† | 51,461 | 21,640,380 | ||||
Corpay, Inc.† | 2,042 | 630,039 | ||||
Fidelity National Information Services, Inc. | 16,758 | 1,243,108 | ||||
Fiserv, Inc.† | 16,976 | 2,713,104 | ||||
Global Payments, Inc. | 7,365 | 984,406 | ||||
Jack Henry & Associates, Inc. | 2,061 | 358,057 | ||||
Mastercard, Inc. Class A | 23,335 | 11,237,436 | ||||
PayPal Holdings, Inc.† | 30,313 | 2,030,668 | ||||
Visa, Inc. Class A | 44,734 | 12,484,365 | ||||
53,321,563 | ||||||
Insurance: 2.12% | ||||||
Aflac, Inc. | 14,889 | 1,278,370 | ||||
Allstate Corp. | 7,425 | 1,284,599 | ||||
American International Group, Inc. | 19,857 | 1,552,222 | ||||
Aon PLC Class A | 5,663 | 1,889,856 | ||||
Arch Capital Group Ltd.† | 10,494 | 970,065 | ||||
Arthur J Gallagher & Co. | 6,132 | 1,533,245 | ||||
Assurant, Inc. | 1,469 | 276,525 | ||||
Brown & Brown, Inc. | 6,681 | 584,855 | ||||
Chubb Ltd. | 11,463 | 2,970,407 | ||||
Cincinnati Financial Corp. | 4,441 | 551,439 | ||||
Everest Group Ltd. | 1,228 | 488,130 | ||||
Globe Life, Inc. | 2,422 | 281,848 | ||||
Hartford Financial Services Group, Inc. | 8,443 | 870,051 | ||||
Loews Corp. | 5,154 | 403,507 | ||||
Marsh & McLennan Cos., Inc. | 13,916 | 2,866,418 | ||||
MetLife, Inc. | 17,363 | 1,286,772 | ||||
Principal Financial Group, Inc. | 6,204 | 535,467 | ||||
Progressive Corp. | 16,555 | 3,423,905 | ||||
Prudential Financial, Inc. | 10,211 | 1,198,771 | ||||
Travelers Cos., Inc. | 6,454 | 1,485,324 | ||||
W R Berkley Corp. | 5,732 | 506,938 | ||||
Willis Towers Watson PLC | 2,900 | 797,500 | ||||
27,036,214 | ||||||
Health care: 12.16% | ||||||
Biotechnology: 1.89% | ||||||
AbbVie, Inc. | 49,937 | 9,093,528 | ||||
Amgen, Inc. | 15,132 | 4,302,330 | ||||
Biogen, Inc.† | 4,098 | 883,652 | ||||
Gilead Sciences, Inc. | 35,242 | 2,581,476 | ||||
Shares | Value | |||||
Biotechnology(continued) | ||||||
Incyte Corp.† | 5,261 | $299,719 | ||||
Moderna, Inc.† | 9,382 | 999,746 | ||||
Regeneron Pharmaceuticals, Inc.† | 2,988 | 2,875,920 | ||||
Vertex Pharmaceuticals, Inc.† | 7,289 | 3,046,875 | ||||
24,083,246 | ||||||
Health care equipment & supplies: 2.52% | ||||||
Abbott Laboratories | 49,103 | 5,581,047 | ||||
Align Technology, Inc.† | 2,015 | 660,759 | ||||
Baxter International, Inc. | 14,363 | 613,874 | ||||
Becton Dickinson & Co. | 8,171 | 2,021,914 | ||||
Boston Scientific Corp.† | 41,436 | 2,837,952 | ||||
Cooper Cos., Inc. | 5,621 | 570,307 | ||||
Dentsply Sirona, Inc. | 5,992 | 198,874 | ||||
DexCom, Inc.† | 10,904 | 1,512,385 | ||||
Edwards Lifesciences Corp.† | 17,154 | 1,639,236 | ||||
GE HealthCare Technologies, Inc. | 11,978 | 1,088,920 | ||||
Hologic, Inc.† | 6,639 | 517,576 | ||||
IDEXX Laboratories, Inc.† | 2,349 | 1,268,295 | ||||
Insulet Corp.† | 1,975 | 338,515 | ||||
Intuitive Surgical, Inc.† | 9,965 | 3,976,932 | ||||
Medtronic PLC | 37,608 | 3,277,537 | ||||
ResMed, Inc. | 4,160 | 823,805 | ||||
STERIS PLC | 2,795 | 628,372 | ||||
Stryker Corp. | 9,564 | 3,422,669 | ||||
Teleflex, Inc. | 1,329 | 300,580 | ||||
Zimmer Biomet Holdings, Inc. | 5,911 | 780,134 | ||||
32,059,683 | ||||||
Health care providers & services: 2.58% | ||||||
Cardinal Health, Inc. | 6,880 | 769,872 | ||||
Cencora, Inc. | 4,683 | 1,137,922 | ||||
Centene Corp.† | 15,117 | 1,186,382 | ||||
Cigna Group | 8,273 | 3,004,671 | ||||
CVS Health Corp. | 35,594 | 2,838,977 | ||||
DaVita, Inc.† | 1,524 | 210,388 | ||||
Elevance Health, Inc. | 6,646 | 3,446,217 | ||||
HCA Healthcare, Inc. | 5,602 | 1,868,435 | ||||
Henry Schein, Inc.† | 3,675 | 277,536 | ||||
Humana, Inc. | 3,457 | 1,198,611 | ||||
Laboratory Corp. of America Holdings | 2,401 | 524,523 | ||||
McKesson Corp. | 3,717 | 1,995,472 | ||||
Molina Healthcare, Inc.† | 1,640 | 673,761 | ||||
Quest Diagnostics, Inc. | 3,140 | 417,965 | ||||
UnitedHealth Group, Inc. | 26,161 | 12,941,847 | ||||
Universal Health Services, Inc. Class B | 1,726 | 314,926 | ||||
32,807,505 | ||||||
Shares | Value | |||||
Life sciences tools & services: 1.38% | ||||||
Agilent Technologies, Inc. | 8,288 | $1,205,987 | ||||
Bio-Rad Laboratories, Inc. Class A† | 592 | 204,755 | ||||
Bio-Techne Corp. | 4,446 | 312,954 | ||||
Charles River Laboratories International, Inc.† | 1,451 | 393,149 | ||||
Danaher Corp. | 18,601 | 4,645,042 | ||||
Illumina, Inc.† | 4,492 | 616,841 | ||||
IQVIA Holdings, Inc.† | 5,162 | 1,305,418 | ||||
Mettler-Toledo International, Inc.† | 608 | 809,424 | ||||
Revvity, Inc. | 3,490 | 366,450 | ||||
Thermo Fisher Scientific, Inc. | 10,928 | 6,351,463 | ||||
Waters Corp.† | 1,672 | 575,553 | ||||
West Pharmaceutical Services, Inc. | 2,093 | 828,221 | ||||
17,615,257 | ||||||
Pharmaceuticals: 3.79% | ||||||
Bristol-Myers Squibb Co. | 57,552 | 3,121,045 | ||||
Catalent, Inc.† | 5,112 | 288,572 | ||||
Eli Lilly & Co. | 22,554 | 17,546,110 | ||||
Johnson & Johnson | 68,088 | 10,770,841 | ||||
Merck & Co., Inc. | 71,673 | 9,457,252 | ||||
Pfizer, Inc. | 159,704 | 4,431,786 | ||||
Viatris, Inc. | 33,932 | 405,148 | ||||
Zoetis, Inc. | 12,986 | 2,197,361 | ||||
48,218,115 | ||||||
Industrials: 8.62% | ||||||
Aerospace & defense: 1.46% | ||||||
Axon Enterprise, Inc.† | 1,992 | 623,257 | ||||
Boeing Co.† | 16,222 | 3,130,684 | ||||
General Dynamics Corp. | 6,422 | 1,814,151 | ||||
Howmet Aerospace, Inc. | 11,064 | 757,109 | ||||
Huntington Ingalls Industries, Inc. | 1,120 | 326,446 | ||||
L3Harris Technologies, Inc. | 5,361 | 1,142,429 | ||||
Lockheed Martin Corp. | 6,083 | 2,766,974 | ||||
Northrop Grumman Corp. | 3,989 | 1,909,375 | ||||
RTX Corp. | 37,528 | 3,660,106 | ||||
Textron, Inc. | 5,544 | 531,836 | ||||
TransDigm Group, Inc. | 1,573 | 1,937,307 | ||||
18,599,674 | ||||||
Air freight & logistics: 0.45% | ||||||
CH Robinson Worldwide, Inc. | 3,299 | 251,186 | ||||
Expeditors International of Washington, Inc. | 4,112 | 499,896 | ||||
FedEx Corp. | 6,503 | 1,884,179 | ||||
United Parcel Service, Inc. Class B | 20,457 | 3,040,524 | ||||
5,675,785 | ||||||
Building products: 0.50% | ||||||
A O Smith Corp. | 3,474 | 310,784 | ||||
Shares | Value | |||||
Building products(continued) | ||||||
Allegion PLC | 2,483 | $334,485 | ||||
Builders FirstSource, Inc.† | 3,489 | 727,631 | ||||
Carrier Global Corp. | 23,631 | 1,373,670 | ||||
Johnson Controls International PLC | 19,276 | 1,259,109 | ||||
Masco Corp. | 6,216 | 490,318 | ||||
Trane Technologies PLC | 6,436 | 1,932,087 | ||||
6,428,084 | ||||||
Commercial services & supplies: 0.58% | ||||||
Cintas Corp. | 2,437 | 1,674,292 | ||||
Copart, Inc.† | 24,715 | 1,431,493 | ||||
Republic Services, Inc. | 5,785 | 1,107,480 | ||||
Rollins, Inc. | 7,941 | 367,430 | ||||
Veralto Corp. | 6,203 | 549,958 | ||||
Waste Management, Inc. | 10,367 | 2,209,726 | ||||
7,340,379 | ||||||
Construction & engineering: 0.08% | ||||||
Quanta Services, Inc. | 4,109 | 1,067,518 | ||||
Electrical equipment: 0.66% | ||||||
AMETEK, Inc. | 6,528 | 1,193,971 | ||||
Eaton Corp. PLC | 11,294 | 3,531,408 | ||||
Emerson Electric Co. | 16,170 | 1,834,001 | ||||
Generac Holdings, Inc.† | 1,738 | 219,231 | ||||
Hubbell, Inc. | 1,517 | 629,631 | ||||
Rockwell Automation, Inc. | 3,241 | 944,201 | ||||
8,352,443 | ||||||
Ground transportation: 1.10% | ||||||
CSX Corp. | 55,893 | 2,071,954 | ||||
J.B. Hunt Transport Services, Inc. | 2,306 | 459,470 | ||||
Norfolk Southern Corp. | 6,389 | 1,628,364 | ||||
Old Dominion Freight Line, Inc. | 5,062 | 1,110,147 | ||||
Uber Technologies, Inc.† | 58,205 | 4,481,203 | ||||
Union Pacific Corp. | 17,247 | 4,241,555 | ||||
13,992,693 | ||||||
Industrial conglomerates: 0.86% | ||||||
3M Co. | 15,633 | 1,658,192 | ||||
General Electric Co. | 30,783 | 5,403,340 | ||||
Honeywell International, Inc. | 18,646 | 3,827,092 | ||||
10,888,624 | ||||||
Machinery: 1.80% | ||||||
Caterpillar, Inc. | 14,399 | 5,276,226 | ||||
Cummins, Inc. | 3,855 | 1,135,876 | ||||
Deere & Co. | 7,365 | 3,025,100 | ||||
Dover Corp. | 3,957 | 701,141 | ||||
Shares | Value | |||||
Machinery(continued) | ||||||
Fortive Corp. | 9,919 | $853,232 | ||||
IDEX Corp. | 2,139 | 521,959 | ||||
Illinois Tool Works, Inc. | 7,691 | 2,063,726 | ||||
Ingersoll Rand, Inc. | 11,449 | 1,087,083 | ||||
Nordson Corp. | 1,535 | 421,419 | ||||
Otis Worldwide Corp. | 11,468 | 1,138,428 | ||||
PACCAR, Inc. | 14,795 | 1,832,952 | ||||
Parker-Hannifin Corp. | 3,632 | 2,018,629 | ||||
Pentair PLC | 4,675 | 399,432 | ||||
Snap-on, Inc. | 1,493 | 442,256 | ||||
Stanley Black & Decker, Inc. | 4,336 | 424,624 | ||||
Westinghouse Air Brake Technologies Corp. | 5,067 | 738,161 | ||||
Xylem, Inc. | 6,819 | 881,288 | ||||
22,961,532 | ||||||
Passenger airlines: 0.16% | ||||||
American Airlines Group, Inc.† | 18,506 | 284,067 | ||||
Delta Air Lines, Inc. | 18,112 | 867,022 | ||||
Southwest Airlines Co. | 16,876 | 492,610 | ||||
United Airlines Holdings, Inc.† | 9,278 | 444,231 | ||||
2,087,930 | ||||||
Professional services: 0.66% | ||||||
Automatic Data Processing, Inc. | 11,619 | 2,901,729 | ||||
Broadridge Financial Solutions, Inc. | 3,331 | 682,389 | ||||
Ceridian HCM Holding, Inc.† | 4,416 | 292,383 | ||||
Equifax, Inc. | 3,487 | 932,842 | ||||
Jacobs Solutions, Inc. | 3,554 | 546,356 | ||||
Leidos Holdings, Inc. | 3,889 | 509,809 | ||||
Paychex, Inc. | 9,058 | 1,112,322 | ||||
Paycom Software, Inc. | 1,359 | 270,455 | ||||
Robert Half, Inc. | 2,945 | 233,480 | ||||
Verisk Analytics, Inc. | 4,101 | 966,729 | ||||
8,448,494 | ||||||
Trading companies & distributors: 0.31% | ||||||
Fastenal Co. | 16,185 | 1,248,511 | ||||
United Rentals, Inc. | 1,900 | 1,370,109 | ||||
WW Grainger, Inc. | 1,249 | 1,270,608 | ||||
3,889,228 | ||||||
Information technology: 28.95% | ||||||
Communications equipment: 0.79% | ||||||
Arista Networks, Inc.† | 7,127 | 2,066,688 | ||||
Cisco Systems, Inc. | 114,932 | 5,736,256 | ||||
F5, Inc.† | 1,663 | 315,288 | ||||
Juniper Networks, Inc. | 9,105 | 337,431 | ||||
Motorola Solutions, Inc. | 4,694 | 1,666,276 | ||||
10,121,939 | ||||||
Shares | Value | |||||
Electronic equipment, instruments & components: 0.60% | ||||||
Amphenol Corp. Class A | 16,966 | $1,957,028 | ||||
CDW Corp. | 3,789 | 969,151 | ||||
Corning, Inc. | 21,718 | 715,825 | ||||
Jabil, Inc. | 3,608 | 483,292 | ||||
Keysight Technologies, Inc.† | 4,940 | 772,517 | ||||
TE Connectivity Ltd. | 8,734 | 1,268,526 | ||||
Teledyne Technologies, Inc.† | 1,335 | 573,142 | ||||
Trimble, Inc.† | 7,036 | 452,837 | ||||
Zebra Technologies Corp. Class A† | 1,453 | 437,992 | ||||
7,630,310 | ||||||
IT services: 1.14% | ||||||
Accenture PLC Class A | 17,734 | 6,146,782 | ||||
Akamai Technologies, Inc.† | 4,266 | 463,970 | ||||
Cognizant Technology Solutions Corp. Class A | 14,086 | 1,032,363 | ||||
EPAM Systems, Inc.† | 1,632 | 450,693 | ||||
Gartner, Inc.† | 2,205 | 1,051,057 | ||||
International Business Machines Corp. | 25,880 | 4,942,045 | ||||
VeriSign, Inc.† | 2,493 | 472,449 | ||||
14,559,359 | ||||||
Semiconductors & semiconductor equipment: 10.04% | ||||||
Advanced Micro Devices, Inc.† | 45,701 | 8,248,573 | ||||
Analog Devices, Inc. | 14,024 | 2,773,807 | ||||
Applied Materials, Inc. | 23,534 | 4,853,417 | ||||
Broadcom, Inc. | 12,447 | 16,497,378 | ||||
Enphase Energy, Inc.† | 3,840 | 464,563 | ||||
First Solar, Inc.† | 3,022 | 510,114 | ||||
Intel Corp. | 119,586 | 5,282,114 | ||||
KLA Corp. | 3,825 | 2,672,030 | ||||
Lam Research Corp. | 3,708 | 3,602,582 | ||||
Microchip Technology, Inc. | 15,284 | 1,371,128 | ||||
Micron Technology, Inc. | 31,223 | 3,680,879 | ||||
Monolithic Power Systems, Inc. | 1,358 | 919,936 | ||||
NVIDIA Corp. | 69,862 | 63,124,509 | ||||
NXP Semiconductors NV | 7,291 | 1,806,491 | ||||
ON Semiconductor Corp.† | 12,087 | 888,999 | ||||
Qorvo, Inc.† | 2,731 | 313,601 | ||||
QUALCOMM, Inc. | 31,565 | 5,343,954 | ||||
Skyworks Solutions, Inc. | 4,532 | 490,906 | ||||
Teradyne, Inc. | 4,324 | 487,877 | ||||
Texas Instruments, Inc. | 25,718 | 4,480,333 | ||||
127,813,191 | ||||||
Software: 10.49% | ||||||
Adobe, Inc.† | 12,784 | 6,450,807 | ||||
ANSYS, Inc.† | 2,458 | 853,319 | ||||
Autodesk, Inc.† | 6,050 | 1,575,541 | ||||
Cadence Design Systems, Inc.† | 7,695 | 2,395,300 | ||||
Shares | Value | |||||
Software(continued) | ||||||
Fair Isaac Corp.† | 703 | $878,476 | ||||
Fortinet, Inc.† | 18,027 | 1,231,424 | ||||
Gen Digital, Inc. | 15,853 | 355,107 | ||||
Intuit, Inc. | 7,918 | 5,146,700 | ||||
Microsoft Corp. | 210,164 | 88,420,198 | ||||
Oracle Corp. | 45,096 | 5,664,509 | ||||
Palo Alto Networks, Inc.† | 8,918 | 2,533,871 | ||||
PTC, Inc.† | 3,381 | 638,806 | ||||
Roper Technologies, Inc. | 3,021 | 1,694,298 | ||||
Salesforce, Inc. | 27,379 | 8,246,007 | ||||
ServiceNow, Inc.† | 5,798 | 4,420,395 | ||||
Synopsys, Inc.† | 4,314 | 2,465,451 | ||||
Tyler Technologies, Inc.† | 1,191 | 506,187 | ||||
133,476,396 | ||||||
Technology hardware, storage & peripherals: 5.89% | ||||||
Apple, Inc. | 410,556 | 70,402,143 | ||||
Hewlett Packard Enterprise Co. | 36,769 | 651,914 | ||||
HP, Inc. | 24,664 | 745,346 | ||||
NetApp, Inc. | 5,827 | 611,660 | ||||
Seagate Technology Holdings PLC | 5,511 | 512,799 | ||||
Super Micro Computer, Inc.† | 1,424 | 1,438,283 | ||||
Western Digital Corp.† | 9,171 | 625,829 | ||||
74,987,974 | ||||||
Materials: 2.32% | ||||||
Chemicals: 1.54% | ||||||
Air Products & Chemicals, Inc. | 6,288 | 1,523,394 | ||||
Albemarle Corp. | 3,319 | 437,245 | ||||
Celanese Corp. | 2,833 | 486,879 | ||||
CF Industries Holdings, Inc. | 5,404 | 449,667 | ||||
Corteva, Inc. | 19,849 | 1,144,692 | ||||
Dow, Inc. | 19,864 | 1,150,722 | ||||
DuPont de Nemours, Inc. | 12,165 | 932,691 | ||||
Eastman Chemical Co. | 3,318 | 332,530 | ||||
Ecolab, Inc. | 7,178 | 1,657,400 | ||||
FMC Corp. | 3,529 | 224,797 | ||||
International Flavors & Fragrances, Inc. | 7,220 | 620,848 | ||||
Linde PLC | 13,715 | 6,368,149 | ||||
LyondellBasell Industries NV Class A | 7,240 | 740,507 | ||||
Mosaic Co. | 9,244 | 300,060 | ||||
PPG Industries, Inc. | 6,669 | 966,338 | ||||
Sherwin-Williams Co. | 6,661 | 2,313,565 | ||||
19,649,484 | ||||||
Construction materials: 0.17% | ||||||
Martin Marietta Materials, Inc. | 1,748 | 1,073,167 | ||||
Vulcan Materials Co. | 3,758 | 1,025,633 | ||||
2,098,800 | ||||||
Shares | Value | |||||
Containers & packaging: 0.21% | ||||||
Amcor PLC | 40,880 | $388,769 | ||||
Avery Dennison Corp. | 2,278 | 508,564 | ||||
Ball Corp. | 8,918 | 600,716 | ||||
International Paper Co. | 9,787 | 381,889 | ||||
Packaging Corp. of America | 2,516 | 477,486 | ||||
Westrock Co. | 7,268 | 359,403 | ||||
2,716,827 | ||||||
Metals & mining: 0.40% | ||||||
Freeport-McMoRan, Inc. | 40,559 | 1,907,084 | ||||
Newmont Corp.-U.S. Exchange Traded Shares | 32,597 | 1,168,277 | ||||
Nucor Corp. | 6,953 | 1,375,999 | ||||
Steel Dynamics, Inc. | 4,302 | 637,685 | ||||
5,089,045 | ||||||
Real estate: 2.23% | ||||||
Health care REITs: 0.18% | ||||||
Healthpeak Properties, Inc. | 20,023 | 375,431 | ||||
Ventas, Inc. | 11,381 | 495,529 | ||||
Welltower, Inc. | 15,654 | 1,462,710 | ||||
2,333,670 | ||||||
Hotel & resort REITs: 0.03% | ||||||
Host Hotels & Resorts, Inc. | 19,953 | 412,628 | ||||
Industrial REITs : 0.27% | ||||||
Prologis, Inc. | 26,134 | 3,403,169 | ||||
Office REITs : 0.07% | ||||||
Alexandria Real Estate Equities, Inc. | 4,454 | 574,165 | ||||
Boston Properties, Inc. | 4,084 | 266,726 | ||||
840,891 | ||||||
Real estate management & development: 0.15% | ||||||
CBRE Group, Inc. Class A† | 8,411 | 817,886 | ||||
CoStar Group, Inc.† | 11,550 | 1,115,730 | ||||
1,933,616 | ||||||
Residential REITs : 0.27% | ||||||
AvalonBay Communities, Inc. | 4,012 | 744,467 | ||||
Camden Property Trust | 3,020 | 297,168 | ||||
Equity Residential | 9,762 | 616,080 | ||||
Essex Property Trust, Inc. | 1,816 | 444,575 | ||||
Invitation Homes, Inc. | 16,270 | 579,375 | ||||
Mid-America Apartment Communities, Inc. | 3,301 | 434,345 | ||||
UDR, Inc. | 8,559 | 320,192 | ||||
3,436,202 | ||||||
Retail REITs : 0.28% | ||||||
Federal Realty Investment Trust | 2,078 | 212,205 | ||||
Shares | Value | |||||
Retail REITs (continued) | ||||||
Kimco Realty Corp. | 18,841 | $369,472 | ||||
Realty Income Corp. | 23,522 | 1,272,540 | ||||
Regency Centers Corp. | 4,646 | 281,362 | ||||
Simon Property Group, Inc. | 9,218 | 1,442,525 | ||||
3,578,104 | ||||||
Specialized REITs : 0.98% | ||||||
American Tower Corp. | 13,185 | 2,605,224 | ||||
Crown Castle, Inc. | 12,267 | 1,298,217 | ||||
Digital Realty Trust, Inc. | 8,566 | 1,233,847 | ||||
Equinix, Inc. | 2,655 | 2,191,251 | ||||
Extra Space Storage, Inc. | 5,976 | 878,472 | ||||
Iron Mountain, Inc. | 8,259 | 662,454 | ||||
Public Storage | 4,476 | 1,298,309 | ||||
SBA Communications Corp. | 3,051 | 661,152 | ||||
VICI Properties, Inc. | 29,261 | 871,685 | ||||
Weyerhaeuser Co. | 20,640 | 741,182 | ||||
12,441,793 | ||||||
Utilities: 2.16% | ||||||
Electric utilities: 1.45% | ||||||
Alliant Energy Corp. | 7,218 | 363,787 | ||||
American Electric Power Co., Inc. | 14,874 | 1,280,652 | ||||
Constellation Energy Corp. | 9,033 | 1,669,750 | ||||
Duke Energy Corp. | 21,807 | 2,108,955 | ||||
Edison International | 10,849 | 767,350 | ||||
Entergy Corp. | 5,981 | 632,072 | ||||
Evergy, Inc. | 6,497 | 346,810 | ||||
Eversource Energy | 9,880 | 590,528 | ||||
Exelon Corp. | 28,155 | 1,057,783 | ||||
FirstEnergy Corp. | 14,607 | 564,122 | ||||
NextEra Energy, Inc. | 58,031 | 3,708,761 | ||||
NRG Energy, Inc. | 6,386 | 432,268 | ||||
PG&E Corp. | 60,345 | 1,011,382 | ||||
Pinnacle West Capital Corp. | 3,207 | 239,659 | ||||
PPL Corp. | 20,849 | 573,973 | ||||
Southern Co. | 30,847 | 2,212,964 | ||||
Xcel Energy, Inc. | 15,608 | 838,930 | ||||
18,399,746 | ||||||
Gas utilities: 0.04% | ||||||
Atmos Energy Corp. | 4,266 | 507,099 | ||||
Independent power and renewable electricity producers: 0.03% | ||||||
AES Corp. | 18,940 | 339,594 | ||||
Multi-utilities: 0.59% | ||||||
Ameren Corp. | 7,437 | 550,041 | ||||
CenterPoint Energy, Inc. | 17,854 | 508,660 | ||||
CMS Energy Corp. | 8,328 | 502,512 | ||||
Shares | Value | |||||
Multi-utilities(continued) | ||||||
Consolidated Edison, Inc. | 9,764 | $886,669 | ||||
Dominion Energy, Inc. | 23,668 | 1,164,229 | ||||
DTE Energy Co. | 5,839 | 654,785 | ||||
NiSource, Inc. | 11,693 | 323,428 | ||||
Public Service Enterprise Group, Inc. | 14,094 | 941,197 | ||||
Sempra | 17,800 | 1,278,574 | ||||
WEC Energy Group, Inc. | 8,922 | 732,675 | ||||
7,542,770 | ||||||
Water utilities: 0.05% | ||||||
American Water Works Co., Inc. | 5,507 | 673,011 | ||||
Total common stocks (Cost $290,482,033) | 1,246,753,127 | |||||
Yield | ||||||
Short-term investments: 1.84% | ||||||
Investment companies: 1.84% | ||||||
Allspring Government Money Market Fund Select Class♠∞ | 5.25 % | 23,506,827 | 23,506,827 | |||
Total short-term investments (Cost $23,506,827) | 23,506,827 | |||||
Total investments in securities (Cost $313,988,860) | 99.78 % | 1,270,259,954 | ||||
Other assets and liabilities, net | 0.22 | 2,744,197 | ||||
Total net assets | 100.00 % | $1,273,004,151 | ||||
† | Non-income-earning security |
♠ | The issuer of the security is an affiliated person of the Fund as defined in the Investment Company Act of 1940. |
∞ | The rate represents the 7-day annualized yield at period end. |
Abbreviations: | |
REIT | Real estate investment trust |
Value, beginning of period | Purchases | Sales proceeds | Net realized gains (losses) | Net change in unrealized gains (losses) | Value, end of period | Shares, end of period | Income from affiliated securities | |
Short-term investments | ||||||||
Allspring Government Money Market Fund Select Class | $9,092,232 | $104,018,077 | $(89,603,482 ) | $0 | $0 | $23,506,827 | 23,506,827 | $863,062 |
Description | Number of contracts | Expiration date | Notional cost | Notional value | Unrealized gains | Unrealized losses |
Long | ||||||
E-Mini S&P 500 Index | 99 | 6-21-2024 | $25,947,448 | $26,277,075 | $329,627 | $0 |
Assets | |
Investments in unaffiliated securities, at value (cost $290,482,033) | $1,246,753,127 |
Investments in affiliated securities, at value (cost $23,506,827) | 23,506,827 |
Cash | 284,327 |
Cash at broker segregated for futures contracts | 1,664,201 |
Receivable for dividends | 907,153 |
Receivable for Fund shares sold | 487,289 |
Receivable from manager | 34,766 |
Receivable for daily variation margin on open futures contracts | 1,237 |
Prepaid expenses and other assets | 412,642 |
Total assets | 1,274,051,569 |
Liabilities | |
Payable for Fund shares redeemed | 455,497 |
Shareholder servicing fee payable | 215,182 |
Administration fees payable | 189,452 |
Payable for investments purchased | 56,527 |
Trustees’ fees and expenses payable | 5,504 |
Distribution fee payable | 5,290 |
Accrued expenses and other liabilities | 119,966 |
Total liabilities | 1,047,418 |
Total net assets | $1,273,004,151 |
Net assets consist of | |
Paid-in capital | $275,343,637 |
Total distributable earnings | 997,660,514 |
Total net assets | $1,273,004,151 |
Computation of net asset value and offering price per share | |
Net assets–Class A | $865,570,531 |
Shares outstanding–Class A1 | 17,394,576 |
Net asset value per share–Class A | $49.76 |
Maximum offering price per share – Class A2 | $52.80 |
Net assets–Class C | $8,158,449 |
Shares outstanding–Class C1 | 159,252 |
Net asset value per share–Class C | $51.23 |
Net assets–Administrator Class | $399,275,171 |
Shares outstanding–Administrator Class1 | 7,773,034 |
Net asset value per share–Administrator Class | $51.37 |
Year Ended March 31, 20241 | Year Ended May 31, 2023 | |
Investment income | ||
Dividends (net of foreign withholdings taxes of $4,613 and $5,566, respectively) | $14,546,816 | $18,032,298 |
Income from affiliated securities | 863,062 | 557,908 |
Interest | 61,615 | 39,238 |
Total investment income | 15,471,493 | 18,629,444 |
Expenses | ||
Management fee | 1,409,768 | 1,585,708 |
Administration fees | ||
Class A | 1,308,576 | 1,504,230 |
Class C | 13,557 | 18,193 |
Administrator Class | 394,025 | 446,686 |
Shareholder servicing fees | ||
Class A | 1,628,261 | 1,790,750 |
Class C | 16,811 | 21,610 |
Administrator Class | 288,825 | 313,525 |
Distribution fee | ||
Class C | 50,299 | 64,607 |
Custody and accounting fees | 29,115 | 42,743 |
Professional fees | 72,690 | 82,895 |
Registration fees | 45,661 | 44,023 |
Shareholder report expenses | 20,835 | 73,693 |
Trustees’ fees and expenses | 23,938 | 24,093 |
Other fees and expenses | 21,558 | 34,792 |
Total expenses | 5,323,919 | 6,047,548 |
Less: Fee waivers and/or expense reimbursements | ||
Fund-level | (1,358,308 ) | (1,597,422 ) |
Class A | (386,189 ) | (285,888 ) |
Class C | (2,321 ) | (2,686 ) |
Administrator Class | (3,085 ) | (503 ) |
Net expenses | 3,574,016 | 4,161,049 |
Net investment income | 11,897,477 | 14,468,395 |
Year Ended March 31, 20241 | Year Ended May 31, 2023 | |
Realized and unrealized gains (losses) on investments | ||
Net realized gain (losses) on | ||
Unaffiliated securities | $74,187,479 | $45,332,839 |
Futures contracts | 4,904,295 | (870,611 ) |
Net realized gains on investments | 79,091,774 | 44,462,228 |
Net change in unrealized gains (losses) on | ||
Unaffiliated securities | 187,784,782 | (36,262,143 ) |
Futures contracts | (494,161 ) | 823,788 |
Net change in unrealized gains (losses) on investments | 187,290,621 | (35,438,355 ) |
Net realized and unrealized gains (losses) on investments | 266,382,395 | 9,023,873 |
Net increase in net assets resulting from operations | $278,279,872 | $23,492,268 |
Year ended March 31, 20241 | Year ended May 31, 2023 | Year ended May 31, 2022 | ||||
Operations | ||||||
Net investment income | $11,897,477 | $14,468,395 | $12,547,735 | |||
Net realized gains on investments | 79,091,774 | 44,462,228 | 112,329,479 | |||
Net change in unrealized gains (losses) on investments | 187,290,621 | (35,438,355 ) | (127,015,918 ) | |||
Net increase (decrease) in net assets resulting from operations | 278,279,872 | 23,492,268 | (2,138,704 ) | |||
Distributions to shareholders from | ||||||
Net investment income and net realized gains | ||||||
Class A | (58,094,954 ) | (66,804,712 ) | (77,882,126 ) | |||
Class C | (511,857 ) | (709,270 ) | (1,006,598 ) | |||
Administrator Class | (26,486,605 ) | (31,911,691 ) | (38,543,455 ) | |||
Total distributions to shareholders | (85,093,416 ) | (99,425,673 ) | (117,432,179 ) | |||
Capital share transactions | Shares | Shares | Shares | |||
Proceeds from shares sold | ||||||
Class A | 479,699 | 21,998,416 | 343,612 | 14,395,854 | 434,540 | 22,338,966 |
Class C | 14,663 | 687,302 | 14,778 | 630,451 | 20,668 | 1,096,073 |
Administrator Class | 544,497 | 25,679,986 | 630,351 | 27,092,159 | 541,048 | 28,070,542 |
48,365,704 | 42,118,464 | 51,505,581 | ||||
Reinvestment of distributions | ||||||
Class A | 1,275,952 | 56,439,623 | 1,593,378 | 64,771,802 | 1,474,352 | 75,486,719 |
Class C | 11,005 | 498,041 | 14,928 | 622,969 | 16,134 | 841,241 |
Administrator Class | 539,862 | 24,668,270 | 714,595 | 29,898,702 | 682,313 | 35,905,912 |
81,605,934 | 95,293,473 | 112,233,872 | ||||
Payment for shares redeemed | ||||||
Class A | (1,543,727 ) | (70,446,303 ) | (1,723,965 ) | (72,102,795 ) | (1,599,593 ) | (81,454,786 ) |
Class C | (45,511 ) | (2,174,639 ) | (77,218 ) | (3,317,859 ) | (54,965 ) | (2,849,529 ) |
Administrator Class | (1,348,411 ) | (63,064,682 ) | (1,224,463 ) | (52,955,693 ) | (1,365,467 ) | (70,021,494 ) |
(135,685,624 ) | (128,376,347 ) | (154,325,809 ) | ||||
Net increase (decrease) in net assets resulting from capital share transactions | (5,713,986 ) | 9,035,590 | 9,413,644 | |||
Total increase (decrease) in net assets | 187,472,470 | (66,897,815 ) | (110,157,239 ) | |||
Net assets | ||||||
Beginning of period | 1,085,531,681 | 1,152,429,496 | 1,262,586,735 | |||
End of period | $1,273,004,151 | $1,085,531,681 | $1,152,429,496 | |||
Year ended March 31 20241 | Year ended May 31 | |||||
Class A | 2023 | 2022 | 2021 | 2020 | 2019 | |
Net asset value, beginning of period | $42.33 | $45.49 | $50.17 | $41.27 | $49.48 | $63.35 |
Net investment income | 0.45 2 | 0.55 2 | 0.46 | 0.48 | 0.65 | 0.82 |
Net realized and unrealized gains (losses) on investments | 10.45 | 0.36 | (0.33 ) | 14.92 | 5.82 | 0.54 |
Total from investment operations | 10.90 | 0.91 | 0.13 | 15.40 | 6.47 | 1.36 |
Distributions to shareholders from | ||||||
Net investment income | (0.54 ) | (0.53 ) | (0.46 ) | (0.57 ) | (0.67 ) | (0.90 ) |
Net realized gains | (2.93 ) | (3.54 ) | (4.35 ) | (5.93 ) | (14.01 ) | (14.33 ) |
Total distributions to shareholders | (3.47 ) | (4.07 ) | (4.81 ) | (6.50 ) | (14.68 ) | (15.23 ) |
Net asset value, end of period | $49.76 | $42.33 | $45.49 | $50.17 | $41.27 | $49.48 |
Total return3 | 26.86 % | 2.45 % | (0.74 )% | 39.71 % | 12.02 % | 3.32 % |
Ratios to average net assets (annualized) | ||||||
Gross expenses | 0.62 % | 0.64 % | 0.63 %* | 0.65 %* | 0.67 %* | 0.65 %* |
Net expenses | 0.42 % | 0.45 % | 0.44 %* | 0.44 %* | 0.44 %* | 0.45 %* |
Net investment income | 1.19 % | 1.30 % | 0.92 %* | 1.08 %* | 1.47 %* | 1.51 %* |
Supplemental data | ||||||
Portfolio turnover rate | 2 % | 2 % | 2 %4 | 4 %4 | 3 %4 | 4 %4 |
Net assets, end of period (000s omitted) | $865,571 | $727,314 | $771,925 | $835,781 | $660,101 | $676,511 |
* | Ratios include net expenses allocated from the affiliated Master Portfolio which were as follows: |
Year ended May 31, 2022 | 0.11% |
Year ended May 31, 2021 | 0.11% |
Year ended May 31, 2020 | 0.12% |
Year ended May 31, 2019 | 0.11% |
1 | For the ten months ended March 31, 2024. The Fund changed its fiscal year end from May 31 to March 31, effective March 31, 2024. |
2 | Calculated based upon average shares outstanding |
3 | Total return calculations do not include any sales charges. Returns for periods of less than one year are not annualized. |
4 | Portfolio turnover rate is calculated by multiplying the affiliated Master Portfolio’s percentage of the Fund’s total investment in securities at the end of the period by the affiliated Master Portfolio’s portfolio turnover rate. |
Year ended March 31 20241 | Year ended May 31 | |||||
Class C | 2023 | 2022 | 2021 | 2020 | 2019 | |
Net asset value, beginning of period | $43.44 | $46.50 | $51.19 | $41.90 | $50.02 | $63.67 |
Net investment income | 0.16 2 | 0.23 2 | 0.08 2 | 0.16 2 | 0.30 | 0.46 2 |
Net realized and unrealized gains (losses) on investments | 10.74 | 0.40 | (0.37 ) | 15.21 | 5.84 | 0.52 |
Total from investment operations | 10.90 | 0.63 | (0.29 ) | 15.37 | 6.14 | 0.98 |
Distributions to shareholders from | ||||||
Net investment income | (0.18 ) | (0.15 ) | (0.05 ) | (0.15 ) | (0.25 ) | (0.30 ) |
Net realized gains | (2.93 ) | (3.54 ) | (4.35 ) | (5.93 ) | (14.01 ) | (14.33 ) |
Total distributions to shareholders | (3.11 ) | (3.69 ) | (4.40 ) | (6.08 ) | (14.26 ) | (14.63 ) |
Net asset value, end of period | $51.23 | $43.44 | $46.50 | $51.19 | $41.90 | $50.02 |
Total return3 | 26.06 % | 1.69 % | (1.48 )% | 38.83 % | 11.17 % | 2.54 % |
Ratios to average net assets (annualized) | ||||||
Gross expenses | 1.36 % | 1.38 % | 1.37 %* | 1.40 %* | 1.42 %* | 1.39 %* |
Net expenses | 1.19 % | 1.20 % | 1.20 %* | 1.20 %* | 1.20 %* | 1.20 %* |
Net investment income | 0.42 % | 0.54 % | 0.16 %* | 0.34 %* | 0.72 %* | 0.77 %* |
Supplemental data | ||||||
Portfolio turnover rate | 2 % | 2 % | 2 %4 | 4 %4 | 3 %4 | 4 %4 |
Net assets, end of period (000s omitted) | $8,158 | $7,780 | $10,538 | $12,530 | $16,103 | $19,146 |
* | Ratios include net expenses allocated from the affiliated Master Portfolio which were as follows: |
Year ended May 31, 2022 | 0.11% |
Year ended May 31, 2021 | 0.11% |
Year ended May 31, 2020 | 0.12% |
Year ended May 31, 2019 | 0.11% |
1 | For the ten months ended March 31, 2024. The Fund changed its fiscal year end from May 31 to March 31, effective March 31, 2024. |
2 | Calculated based upon average shares outstanding |
3 | Total return calculations do not include any sales charges. Returns for periods of less than one year are not annualized. |
4 | Portfolio turnover rate is calculated by multiplying the affiliated Master Portfolio’s percentage of the Fund’s total investment in securities at the end of the period by the affiliated Master Portfolio’s portfolio turnover rate. |
Year ended March 31 20241 | Year ended May 31 | |||||
Administrator Class | 2023 | 2022 | 2021 | 2020 | 2019 | |
Net asset value, beginning of period | $43.60 | $46.73 | $51.41 | $42.15 | $50.24 | $64.04 |
Net investment income | 0.53 2 | 0.65 2 | 0.58 | 0.58 | 0.81 | 1.02 2 |
Net realized and unrealized gains (losses) on investments | 10.79 | 0.37 | (0.36 ) | 15.26 | 5.85 | 0.48 |
Total from investment operations | 11.32 | 1.02 | 0.22 | 15.84 | 6.66 | 1.50 |
Distributions to shareholders from | ||||||
Net investment income | (0.62 ) | (0.61 ) | (0.55 ) | (0.65 ) | (0.74 ) | (0.97 ) |
Net realized gains | (2.93 ) | (3.54 ) | (4.35 ) | (5.93 ) | (14.01 ) | (14.33 ) |
Total distributions to shareholders | (3.55 ) | (4.15 ) | (4.90 ) | (6.58 ) | (14.75 ) | (15.30 ) |
Net asset value, end of period | $51.37 | $43.60 | $46.73 | $51.41 | $42.15 | $50.24 |
Total return3 | 27.07 % | 2.65 % | (0.55 )% | 39.97 % | 12.25 % | 3.52 % |
Ratios to average net assets (annualized) | ||||||
Gross expenses | 0.39 % | 0.40 % | 0.37 %* | 0.42 %* | 0.44 %* | 0.41 %* |
Net expenses | 0.25 % | 0.25 % | 0.25 %* | 0.25 %* | 0.25 %* | 0.25 %* |
Net investment income | 1.36 % | 1.49 % | 1.11 %* | 1.28 %* | 1.67 %* | 1.72 %* |
Supplemental data | ||||||
Portfolio turnover rate | 2 % | 2 % | 2 %4 | 4 %4 | 3 %4 | 4 %4 |
Net assets, end of period (000s omitted) | $399,275 | $350,438 | $369,967 | $414,276 | $343,609 | $460,934 |
* | Ratios include net expenses allocated from the affiliated Master Portfolio which were as follows: |
Year ended May 31, 2022 | 0.11% |
Year ended May 31, 2021 | 0.11% |
Year ended May 31, 2020 | 0.12% |
Year ended May 31, 2019 | 0.11% |
1 | For the ten months ended March 31, 2024. The Fund changed its fiscal year end from May 31 to March 31, effective March 31, 2024. |
2 | Calculated based upon average shares outstanding |
3 | Returns for periods of less than one year are not annualized. |
4 | Portfolio turnover rate is calculated by multiplying the affiliated Master Portfolio’s percentage of the Fund’s total investment in securities at the end of the period by the affiliated Master Portfolio’s portfolio turnover rate. |
Gross unrealized gains | $970,296,551 |
Gross unrealized losses | (14,136,967 ) |
Net unrealized gains | $956,159,584 |
Paid-in capital | Total distributable earnings |
$(4,909 ) | $4,909 |
Quoted prices (Level 1) | Other significant observable inputs (Level 2) | Significant unobservable inputs (Level 3) | Total | |
Assets | ||||
Investments in: | ||||
Common stocks | ||||
Communication services | $111,606,369 | $0 | $0 | $111,606,369 |
Consumer discretionary | 128,949,928 | 0 | 0 | 128,949,928 |
Consumer staples | 74,388,898 | 0 | 0 | 74,388,898 |
Energy | 49,286,568 | 0 | 0 | 49,286,568 |
Financials | 164,019,556 | 0 | 0 | 164,019,556 |
Health care | 154,783,806 | 0 | 0 | 154,783,806 |
Industrials | 109,732,384 | 0 | 0 | 109,732,384 |
Information technology | 368,589,169 | 0 | 0 | 368,589,169 |
Materials | 29,554,156 | 0 | 0 | 29,554,156 |
Real estate | 28,380,073 | 0 | 0 | 28,380,073 |
Utilities | 27,462,220 | 0 | 0 | 27,462,220 |
Short-term investments | ||||
Investment companies | 23,506,827 | 0 | 0 | 23,506,827 |
1,270,259,954 | 0 | 0 | 1,270,259,954 | |
Futures contracts | 329,627 | 0 | 0 | 329,627 |
Total assets | $1,270,589,581 | $0 | $0 | $1,270,589,581 |
Average daily net assets | Management fee |
First $1 billion | 0.150 % |
Next $4 billion | 0.125 |
Next $5 billion | 0.090 |
Over $10 billion | 0.080 |
Class-level administration fee | |
Class A | 0.20 % |
Class C | 0.20 |
Administrator Class | 0.13 |
EXPENSE RATIO CAPS | |
Class A | 0.44 % |
Class C | 1.19 |
Administrator Class | 0.25 |
Year ended May 31 | |||
Year ended March 31, 2024 | 2023 | 2022 | |
Ordinary income | $14,361,041 | $14,252,909 | $18,177,161 |
Long-term capital gain | 70,732,375 | 85,172,764 | 99,255,018 |
Undistributed ordinary income | Undistributed long-term gain | Unrealized gains |
$10,995,608 | $30,515,624 | $956,159,584 |
Allspring Funds Trust:

March 31, 2024.
Name and year of birth | Position held and length of service* | Principal occupations during past five years or longer | Current other public company or investment company directorships |
William R. Ebsworth (Born 1957) | Trustee, since 2015 | Retired. From 1984 to 2013, equities analyst, portfolio manager, research director and chief investment officer at Fidelity Management and Research Company in Boston, Tokyo, and Hong Kong, and retired in 2013 as Chief Investment Officer of Fidelity Strategic Advisers, Inc. where he led a team of investment professionals managing client assets. Prior thereto, Board member of Hong Kong Securities Clearing Co., Hong Kong Options Clearing Corp., the Thailand International Fund, Ltd., Fidelity Investments Life Insurance Company, and Empire Fidelity Investments Life Insurance Company. Serves on the Investment Company Institute’s Board of Governors since 2022 and Executive Committee since 2023 as well as the Vice Chairman of the Governing Council of the Independent Directors Council since 2023. Audit Committee Chair and Investment Committee Chair of the Vincent Memorial Hospital Foundation (non-profit organization). Mr. Ebsworth is a CFA charterholder. | N/A |
Jane A. Freeman (Born 1953) | Trustee, since 2015; Chair Liaison, since January 2018# | Retired. From 2012 to 2014 and 1999 to 2008, Chief Financial Officer of Scientific Learning Corporation. From 2008 to 2012, Ms. Freeman provided consulting services related to strategic business projects. Prior to 1999, Portfolio Manager at Rockefeller & Co. and Scudder, Stevens & Clark. Board member of the Harding Loevner Funds from 1996 to 2014, serving as both Lead Independent Director and chair of the Audit Committee. Board member of the Russell Exchange Traded Funds Trust from 2011 to 2012 and the chair of the Audit Committee. Ms. Freeman is also an inactive Chartered Financial Analyst. | N/A |
Isaiah Harris, Jr. (Born 1952) | Trustee, since 2009; Audit Committee Chair, since 2019 | Retired. Member of the Advisory Board of CEF of East Central Florida. Chairman of the Board of CIGNA Corporation from 2009 to 2021, and Director from 2005 to 2008. From 2003 to 2011, Director of Deluxe Corporation. Prior thereto, President and CEO of BellSouth Advertising and Publishing Corp. from 2005 to 2007, President and CEO of BellSouth Enterprises from 2004 to 2005 and President of BellSouth Consumer Services from 2000 to 2003. Emeritus member of the Iowa State University Foundation Board of Governors. Emeritus Member of the Advisory board of Iowa State University School of Business. Advisory Board Member, Palm Harbor Academy (private school). Advisory Board Member, Fellowship of Christian Athletes. Mr. Harris is a certified public accountant (inactive status). | N/A |
David F. Larcker (Born 1950) | Trustee, since 2009 | Distinguished Visiting Fellow at the Hoover Institution since 2022. James Irvin Miller Professor of Accounting at the Graduate School of Business (Emeritus), Stanford University, Director of the Corporate Governance Research Initiative and Senior Faculty of The Rock Center for Corporate Governance since 2006. From 2005 to 2008, Professor of Accounting at the Graduate School of Business, Stanford University. Prior thereto, Ernst & Young Professor of Accounting at The Wharton School, University of Pennsylvania from 1985 to 2005. | N/A |
Olivia S. Mitchell (Born 1953) | Trustee, since 2006; Nominating and Governance Committee Chair, since 2018 | International Foundation of Employee Benefit Plans Professor since 1993, Wharton School of the University of Pennsylvania. Director of Wharton’s Pension Research Council and Boettner Center on Pensions & Retirement Research, and Research Associate at the National Bureau of Economic Research. Previously taught at Cornell University from 1978 to 1993. | N/A |
Name and year of birth | Position held and length of service* | Principal occupations during past five years or longer | Current other public company or investment company directorships |
Timothy J. Penny (Born 1951) | Trustee, since 1996; Chair, since 2018 | President and Chief Executive Officer of Southern Minnesota Initiative Foundation, a non-profit organization, since 2007. Vice Chair of the Economic Club of Minnesota, since 2007. Co-Chair of the Committee for a Responsible Federal Budget, since 1995. Member of the Board of Trustees of NorthStar Education Finance, Inc., a non-profit organization, from 2007-2022. Senior Fellow of the University of Minnesota Humphrey Institute from 1995 to 2017. | N/A |
James G. Polisson (Born 1959) | Trustee, since 2018 | Retired. Chief Marketing Officer, Source (ETF) UK Services, Ltd, from 2015 to 2017. From 2012 to 2015, Principal of The Polisson Group, LLC, a management consulting, corporate advisory and principal investing company. Chief Executive Officer and Managing Director at Russell Investments, Global Exchange Traded Funds from 2010 to 2012. Managing Director of Barclays Global Investors from 1998 to 2010 and Global Chief Marketing Officer for iShares and Barclays Global Investors from 2000 to 2010. Trustee of the San Francisco Mechanics’ Institute, a non- profit organization, from 2013 to 2015. Board member of the Russell Exchange Traded Fund Trust from 2011 to 2012. Director of Barclays Global Investors Holdings Deutschland GmbH from 2006 to 2009. Mr. Polisson is an attorney and has a retired status with the Massachusetts and District of Columbia Bar Associations. | N/A |
Pamela Wheelock (Born 1959) | Trustee, since January 2020; previously Trustee from January 2018 to July 2019# | Retired. Executive and Senior Financial leadership positions in the public, private and nonprofit sectors. Interim President and CEO, McKnight Foundation, 2020. Interim Commissioner, Minnesota Department of Human Services, 2019. Chief Operating Officer, Twin Cities Habitat for Humanity, 2017-2019. Vice President for University Services, University of Minnesota, 2012- 2016. Interim President and CEO, Blue Cross and Blue Shield of Minnesota, 2011-2012. Executive Vice-President and Chief Financial Officer, Minnesota Wild, 2002-2008. Commissioner, Minnesota Department of Finance, 1999-2002. Chair of the Board of Directors of Destination Medical Center Corporation. Board member of the Minnesota Wild Foundation. | N/A |
Name and year of birth | Position held and length of service | Principal occupations during past five years or longer |
Andrew Owen (Born 1960) | President, since 2017 | President and Chief Executive Officer of Allspring Funds Management, LLC since 2017 and Head of Global Fund Governance of Allspring Global Investments since 2022. Prior thereto, co-president of Galliard Capital Management, LLC, an affiliate of Allspring Funds Management, LLC, from 2019 to 2022 and Head of Affiliated Managers, Allspring Global Investments, from 2014 to 2019 and Executive Vice President responsible for marketing, investments and product development for Allspring Funds Management, LLC, from 2009 to 2014. |
Jeremy DePalma (Born 1974) | Treasurer, since 2012 (for certain funds in the Fund Complex); since 2021 (for the remaining funds in the Complex) | Senior Vice President of Allspring Funds Management, LLC since 2009. Senior Vice President of Evergreen Investment Management Company, LLC from 2008 to 2010 and head of the Fund Reporting and Control Team within Fund Administration from 2005 to 2010. |
Christopher Baker (Born 1976) | Chief Compliance Officer, since 2022 | Global Chief Compliance Officer for Allspring Global Investments since 2022. Prior thereto, Chief Compliance Officer for State Street Global Advisors from 2018 to 2021. Senior Compliance Officer for the State Street divisions of Alternative Investment Solutions, Sector Solutions, and Global Marketing from 2015 to 2018. From 2010 to 2015 Vice President, Global Head of Investment and Marketing Compliance for State Street Global Advisors. |
Matthew Prasse (Born 1983) | Chief Legal Officer, since 2022; Secretary, since 2021 | Senior Counsel of the Allspring Legal Department since 2021. Senior Counsel of the Wells Fargo Legal Department from 2018 to 2021. Previously, Counsel for Barings LLC from 2015 to 2018. Prior to joining Barings, Associate at Morgan, Lewis & Bockius LLP from 2008 to 2015. |

P.O. Box 219967
Kansas City, MO 64121-9967

AR3329 03-24
2 | |
6 | |
9 | |
10 | |
13 | |
14 | |
15 | |
16 | |
20 | |
25 | |
26 |

Allspring Funds

President
Allspring Funds
Notice to Shareholders |
Beginning in July 2024, the Fund will be required by the Securities and Exchange Commission to send shareholders a paper copy of a new tailored shareholder report in place of the full shareholder report that you are now receiving. The tailored shareholder report will contain concise information about the Fund, including certain expense and performance information and fund statistics. If you wish to receive this new tailored shareholder report electronically, please follow the instructions on the back cover of this report. |
Other information that is currently included in the shareholder report, such as the Fund’s financial statements, will be available online and upon request, free of charge, in paper or electronic format. |
Investment objective | The Fund seeks long-term capital appreciation. |
Manager | Allspring Funds Management, LLC |
Subadviser | Allspring Global Investments, LLC |
Portfolio managers | Michael Bradshaw, CFA, Oleg Makhorine |
Average annual total returns (%) as of March 31, 2024 | |||||||||
Including sales charge | Excluding sales charge | Expense ratios1 (%) | |||||||
Inception date | 1 year | 5 year | 10 year | 1 year | 5 year | 10 year | Gross | Net2 | |
Class A (EKWAX) | 1-20-1998 | -6.72 | 6.86 | 2.85 | -1.04 ♠ | 8.13 | 3.46 | 1.18 | 1.09 |
Class C (EKWCX) | 1-29-1998 | -2.77 | 7.32 | 2.84 | -1.77 | 7.32 | 2.84 | 1.93 | 1.84 |
Administrator Class (EKWDX) | 7-30-2010 | – | – | – | -0.88 ♠ | 8.28 | 3.60 | 1.11 | 0.95 |
Institutional Class (EKWYX) | 2-29-2000 | – | – | – | -0.73 | 8.45 | 3.76 | 0.86 | 0.79 |
FTSE Gold Mines Index3 | – | – | – | – | -1.14 | 7.66 | 4.15 | – | – |
S&P 500 Index4 | – | – | – | – | 29.88 | 15.05 | 12.96 | – | – |
♠ | Total return differs from the return in the Financial Highlights in this report. The total return presented is calculated based on the Net Asset Value (NAV) at which the shareholder transactions were processed. The NAV and total return presented in the Financial Highlights reflects certain adjustments made to the net assets of the Fund that are necessary under U.S. generally accepted accounting principles. |
1 | Reflects the expense ratios as stated in the most recent prospectuses. The expense ratios shown are subject to change and may differ from the annualized expense ratios shown in the Financial Highlights of this report. |
2 | The manager has contractually committed through July 31, 2024, to waive fees and/or reimburse expenses to the extent necessary to cap total annual fund operating expenses after fee waivers at 1.09% for Class A, 1.84% for Class C, 0.95% for Administrator Class and 0.79% for Institutional Class. Brokerage commissions, stamp duty fees, interest, taxes, acquired fund fees and expenses (if any), and extraordinary expenses are excluded from the expense caps. Prior to or after the commitment expiration date, the caps may be increased or the commitment to maintain the caps may be terminated only with the approval of the Board of Trustees. Without these caps, the Fund’s returns would have been lower. The expense ratio paid by an investor is the net expense ratio (the total annual fund operating expenses after fee waivers) as stated in the prospectuses. |
3 | FTSE Gold Mines Index is an unmanaged, open-ended index designed to reflect the performance of the worldwide market in the shares of companies whose principal activity is the mining of gold. You cannot invest directly in an index. |
4 | The S&P 500 Index consists of 500 stocks chosen for market size, liquidity, and industry group representation. It is a market-value-weighted index with each stock’s weight in the index proportionate to its market value. You cannot invest directly in an index. |
CFA® and Chartered Financial Analyst® are trademarks owned by CFA Institute. |
Growth of $10,000 investment as of March 31, 20241 |
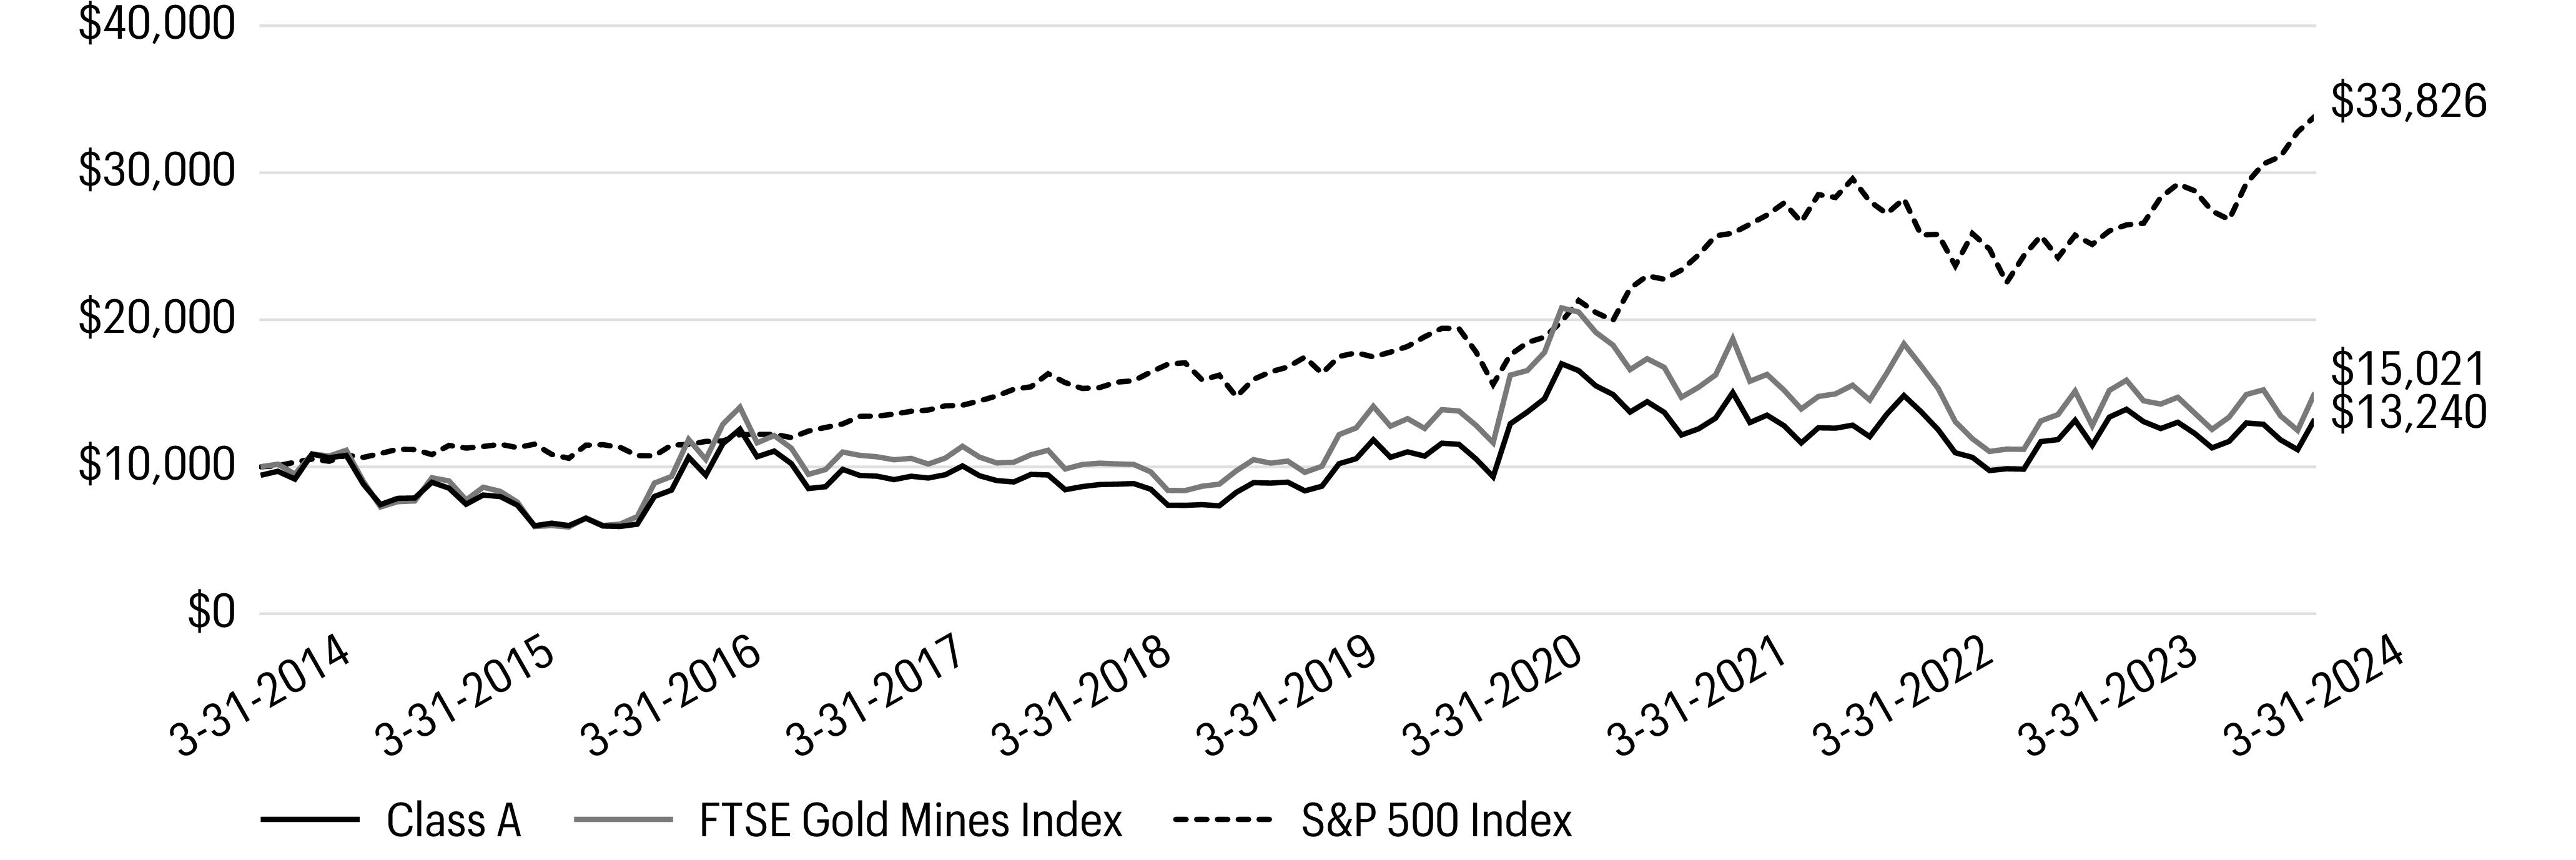
1 | The chart compares the performance of Class A shares for the most recent ten years with the FTSE Gold Mines Index and S&P 500 Index. The chart assumes a hypothetical investment of $10,000 in Class A shares and reflects all operating expenses and assumes the maximum initial sales charge of 5.75%. |
Ten largest holdings (%) as of March 31, 20241 | |
Agnico Eagle Mines Ltd. | 6.70 |
Gold Bullion | 5.89 |
Wheaton Precious Metals Corp.-U.S. Exchange Traded Shares | 5.71 |
Gold Fields Ltd. | 5.29 |
Alamos Gold, Inc. Class A | 5.21 |
Lundin Gold, Inc. | 5.19 |
Franco-Nevada Corp.-Legend Shares | 4.76 |
Kinross Gold Corp. | 4.72 |
Barrick Gold Corp. | 4.65 |
Northern Star Resources Ltd. | 4.60 |
1 | Figures represent the percentage of the Fund’s net assets. Holdings are subject to change and may have changed since the date specified. |
Country allocation as of March 31, 20241 |

1 | Figures represent the percentage of the Fund’s long-term investments. Allocations are subject to change and may have changed since the date specified. |
Beginning account value 10-1-2023 | Ending account value 3-31-2024 | Consolidated expenses paid during the period1 | Annualized net expense ratio | |
Class A | ||||
Actual | $1,000.00 | $1,173.06 | $5.78 | 1.07 % |
Hypothetical (5% return before expenses) | $1,000.00 | $1,019.54 | $5.37 | 1.07 % |
Class C | ||||
Actual | $1,000.00 | $1,168.82 | $9.92 | 1.84 % |
Hypothetical (5% return before expenses) | $1,000.00 | $1,015.71 | $9.22 | 1.84 % |
Administrator Class | ||||
Actual | $1,000.00 | $1,174.09 | $5.14 | 0.95 % |
Hypothetical (5% return before expenses) | $1,000.00 | $1,020.14 | $4.77 | 0.95 % |
Institutional Class | ||||
Actual | $1,000.00 | $1,174.98 | $4.27 | 0.79 % |
Hypothetical (5% return before expenses) | $1,000.00 | $1,020.94 | $3.97 | 0.79 % |
1 | Consolidated expenses paid is equal to the annualized net expense ratio of each class multiplied by the average account value over the period, multiplied by 182 divided by 366 (to reflect the one-half-year period). |
Shares | Value | |||||
Common stocks: 92.78% | ||||||
Australia: 4.92% | ||||||
Evolution Mining Ltd. (Materials, Metals & mining) | 400,000 | $933,163 | ||||
Northern Star Resources Ltd. (Materials, Metals & mining) | 1,415,412 | 13,346,452 | ||||
14,279,615 | ||||||
Canada: 66.37% | ||||||
Agnico Eagle Mines Ltd. (Materials, Metals & mining) | 325,807 | 19,427,434 | ||||
Agnico Eagle Mines Ltd.-Legend Shares (Materials, Metals & mining)† | 35,000 | 2,087,750 | ||||
Agnico Eagle Mines Ltd.-U.S. Exchange Traded Shares (Materials, Metals & mining) | 115,664 | 6,899,358 | ||||
Alamos Gold, Inc. Class A (Materials, Metals & mining) | 1,023,980 | 15,096,438 | ||||
Artemis Gold, Inc. (Materials, Metals & mining)† | 1,400,000 | 8,392,455 | ||||
Ascot Resources Ltd. (Materials, Metals & mining)† | 2,650,000 | 1,467,277 | ||||
B2Gold Corp. (Materials, Metals & mining) | 4,200,000 | 11,007,346 | ||||
Barrick Gold Corp. (Materials, Metals & mining) | 810,723 | 13,490,431 | ||||
Centerra Gold, Inc. (Materials, Metals & mining) | 350,000 | 2,067,107 | ||||
Centerra Gold, Inc.-Legend Shares (Materials, Metals & mining)† | 250,000 | 1,476,505 | ||||
Dundee Precious Metals, Inc. (Materials, Metals & mining) | 1,050,000 | 7,984,201 | ||||
Franco-Nevada Corp.-Legend Shares (Materials, Metals & mining)144A† | 115,948 | 13,815,664 | ||||
Kinross Gold Corp. (Materials, Metals & mining) | 2,232,484 | 13,696,012 | ||||
Lundin Gold, Inc. (Materials, Metals & mining) | 1,070,000 | 15,040,272 | ||||
MAG Silver Corp. (Materials, Metals & mining)† | 210,000 | 2,215,422 | ||||
MAG Silver Corp.-Legend Shares (Materials, Metals & mining)† | 100,000 | 1,054,963 | ||||
OceanaGold Corp. (Materials, Metals & mining) | 2,200,000 | 4,969,916 | ||||
Orla Mining Ltd. (Materials, Metals & mining)† | 300,000 | 1,136,171 | ||||
Osisko Gold Royalties Ltd. (Materials, Metals & mining) | 325,000 | 5,333,690 | ||||
Osisko Mining, Inc. (Materials, Metals & mining)† | 1,150,000 | 2,360,193 | ||||
Pan American Silver Corp. (Materials, Metals & mining) | 47,940 | 722,701 | ||||
Pan American Silver Corp.-U.S. Exchange Traded Shares (Materials, Metals & mining) | 400,000 | 6,032,000 | ||||
Reunion Gold Corp. (Materials, Metals & mining)† | 2,500,000 | 858,219 | ||||
SilverCrest Metals, Inc. (Materials, Metals & mining)† | 400,000 | 2,666,568 | ||||
Skeena Resources Ltd. (Materials, Metals & mining)† | 500,000 | 2,299,657 | ||||
Torex Gold Resources, Inc. (Materials, Metals & mining)† | 275,000 | 4,048,208 | ||||
Torex Gold Resources, Inc.-Legend Shares (Materials, Metals & mining)144A† | 185,000 | 2,723,340 | ||||
Torex Gold Resources, Inc.-Legend Shares (Materials, Metals & mining)† | 266,250 | 3,919,401 | ||||
Triple Flag Precious Metals Corp. (Materials, Metals & mining) | 210,000 | 3,033,997 | ||||
Wheaton Precious Metals Corp. (Materials, Metals & mining) | 12,950 | 609,952 | ||||
Wheaton Precious Metals Corp.-U.S. Exchange Traded Shares (Materials, Metals & mining) | 351,000 | 16,542,630 | ||||
192,475,278 | ||||||
South Africa: 5.29% | ||||||
Gold Fields Ltd. ADR (Materials, Metals & mining) | 965,000 | 15,333,850 | ||||
Shares | Value | |||||
United Kingdom: 6.64% | ||||||
Anglogold Ashanti PLC (Materials, Metals & mining) | 300,591 | $6,673,120 | ||||
Endeavour Mining PLC (Materials, Metals & mining) | 620,000 | 12,596,361 | ||||
19,269,481 | ||||||
United States: 9.56% | ||||||
Newmont Corp.-Toronto Exchange Traded Shares (Materials, Metals & mining) | 131,348 | 4,708,766 | ||||
Newmont Corp.-U.S. Exchange Traded Shares (Materials, Metals & mining) | 274,719 | 9,845,929 | ||||
Royal Gold, Inc. (Materials, Metals & mining) | 108,036 | 13,159,865 | ||||
27,714,560 | ||||||
Total common stocks (Cost $161,386,050) | 269,072,784 | |||||
Expiration date | ||||||
Rights: 0.00% | ||||||
Canada: 0.00% | ||||||
Kinross Gold Corp. (Materials, Metals & mining)♦† | 3-1-2032 | 75,000 | 0 | |||
Total rights (Cost $0) | 0 | |||||
Warrants: 0.00% | ||||||
Canada: 0.00% | ||||||
Calibre Mining Corp. (Materials, Metals & mining)♦† | 9-20-2024 | 250,000 | 0 | |||
Total warrants (Cost $0) | 0 | |||||
Troy Ounces | ||||||
Commodities: 5.89% | ||||||
Gold Bullion* | 7,690 | 17,086,170 | ||||
Total commodities (Cost $4,532,552) | 17,086,170 | |||||
Yield | Shares | |||||
Short-term investments: 1.07% | ||||||
Investment companies: 1.07% | ||||||
Allspring Government Money Market Fund Select Class♠∞ | 5.25 % | 3,103,866 | 3,103,866 | |||
Total short-term investments (Cost $3,103,866) | 3,103,866 | |||||
Total investments in securities (Cost $169,022,468) | 99.74 % | 289,262,820 | ||||
Other assets and liabilities, net | 0.26 | 758,020 | ||||
Total net assets | 100.00 % | $290,020,840 | ||||
† | Non-income-earning security |
144A | The security may be resold in transactions exempt from registration, normally to qualified institutional buyers, pursuant to Rule 144A under the Securities Act of 1933. |
♦ | The security is fair valued in accordance with procedures approved by the Board of Trustees. |
* | Represents an investment held in Special Investments (Cayman) SPC, the consolidated entity. |
♠ | The issuer of the security is an affiliated person of the Fund as defined in the Investment Company Act of 1940. |
∞ | The rate represents the 7-day annualized yield at period end. |
Abbreviations: | |
ADR | American depositary receipt |
Value, beginning of period | Purchases | Sales proceeds | Net realized gains (losses) | Net change in unrealized gains (losses) | Value, end of period | Shares, end of period | Income from affiliated securities | |
Short-term investments | ||||||||
Allspring Government Money Market Fund Select Class | $9,767,739 | $59,379,227 | $(66,043,100 ) | $0 | $0 | $3,103,866 | 3,103,866 | $382,343 |
Assets | |
Investments in unaffiliated securities, at value (cost $161,386,050) | $269,072,784 |
Investments in affiliated securities, at value (cost $3,103,866) | 3,103,866 |
Investments in commodities, at value (cost $4,532,552) | 17,086,170 |
Cash | 499,600 |
Foreign currency, at value (cost $131,245) | 130,960 |
Receivable for Fund shares sold | 553,784 |
Receivable for dividends | 171,994 |
Prepaid expenses and other assets | 110,357 |
Total assets | 290,729,515 |
Liabilities | |
Payable for Fund shares redeemed | 428,808 |
Management fee payable | 115,502 |
Administration fees payable | 38,877 |
Shareholder servicing fee payable | 36,640 |
Distribution fee payable | 4,104 |
Accrued expenses and other liabilities | 84,744 |
Total liabilities | 708,675 |
Total net assets | $290,020,840 |
Net assets consist of | |
Paid-in capital | $308,419,164 |
Total distributable loss | (18,398,324 ) |
Total net assets | $290,020,840 |
Computation of net asset value and offering price per share | |
Net assets–Class A | $150,702,712 |
Shares outstanding–Class A1 | 3,157,689 |
Net asset value per share–Class A | $47.73 |
Maximum offering price per share – Class A2 | $50.64 |
Net assets–Class C | $6,901,108 |
Shares outstanding–Class C1 | 165,547 |
Net asset value per share–Class C | $41.69 |
Net assets–Administrator Class | $25,370,292 |
Shares outstanding–Administrator Class1 | 526,119 |
Net asset value per share–Administrator Class | $48.22 |
Net assets–Institutional Class | $107,046,728 |
Shares outstanding–Institutional Class1 | 2,195,914 |
Net asset value per share–Institutional Class | $48.75 |
Investment income | |
Dividends (net of foreign withholdings taxes of $657,381) | $5,364,467 |
Income from affiliated securities | 382,343 |
Interest | 4,276 |
Total investment income | 5,751,086 |
Expenses | |
Management fee | 1,888,401 |
Administration fees | |
Class A | 302,870 |
Class C | 15,525 |
Administrator Class | 32,964 |
Institutional Class | 140,545 |
Shareholder servicing fees | |
Class A | 373,510 |
Class C | 19,128 |
Administrator Class | 63,211 |
Distribution fee | |
Class C | 57,357 |
Custody and accounting fees | 17,028 |
Professional fees | 99,078 |
Registration fees | 54,025 |
Shareholder report expenses | 41,561 |
Trustees’ fees and expenses | 22,922 |
Transfer agent fees | 768 |
Other fees and expenses | 18,090 |
Total expenses | 3,146,983 |
Less: Fee waivers and/or expense reimbursements | |
Fund-level | (229,247 ) |
Class A | (41,932 ) |
Class C | (1,412 ) |
Administrator Class | (22,147 ) |
Net expenses | 2,852,245 |
Net investment income | 2,898,841 |
Realized and unrealized gains (losses) on investments | |
Net realized gains (losses) on | |
Unaffiliated securities | 4,686,291 |
Foreign currency and foreign currency translations | (32,578 ) |
Net realized gains on investments | 4,653,713 |
Net change in unrealized gains (losses) on | |
Unaffiliated securities | (15,754,854 ) |
Commodities | 1,928,967 |
Foreign currency and foreign currency translations | (347 ) |
Net change in unrealized gains (losses) on investments | (13,826,234 ) |
Net realized and unrealized gains (losses) on investments | (9,172,521 ) |
Net decrease in net assets resulting from operations | $(6,273,680 ) |
Year ended March 31, 2024 | Year ended March 31, 2023 | |||
Operations | ||||
Net investment income | $2,898,841 | $2,878,976 | ||
Net realized gains (losses) on investments | 4,653,713 | (119,568 ) | ||
Net change in unrealized gains (losses) on investments | (13,826,234 ) | (49,373,054 ) | ||
Net decrease in net assets resulting from operations | (6,273,680 ) | (46,613,646 ) | ||
Distributions to shareholders from | ||||
Net investment income and net realized gains | ||||
Class A | 0 | (2,956,684 ) | ||
Class C | 0 | (144,308 ) | ||
Administrator Class | 0 | (443,165 ) | ||
Institutional Class | 0 | (2,106,907 ) | ||
Total distributions to shareholders | 0 | (5,651,064 ) | ||
Capital share transactions | Shares | Shares | ||
Proceeds from shares sold | ||||
Class A | 470,707 | 21,597,117 | 584,270 | 26,451,279 |
Class C | 35,765 | 1,467,795 | 23,913 | 948,346 |
Administrator Class | 348,028 | 16,287,825 | 405,456 | 17,875,345 |
Institutional Class | 1,106,753 | 51,089,559 | 910,151 | 40,502,765 |
90,442,296 | 85,777,735 | |||
Reinvestment of distributions | ||||
Class A | 0 | 0 | 66,225 | 2,743,689 |
Class C | 0 | 0 | 3,934 | 143,766 |
Administrator Class | 0 | 0 | 10,504 | 438,944 |
Institutional Class | 0 | 0 | 41,254 | 1,739,258 |
0 | 5,065,657 | |||
Payment for shares redeemed | ||||
Class A | (787,027 ) | (35,732,422 ) | (994,493 ) | (41,172,521 ) |
Class C | (88,253 ) | (3,493,289 ) | (63,233 ) | (2,396,577 ) |
Administrator Class | (341,891 ) | (15,493,592 ) | (350,294 ) | (15,010,210 ) |
Institutional Class | (1,255,413 ) | (56,632,220 ) | (1,135,668 ) | (48,911,874 ) |
(111,351,523 ) | (107,491,182 ) | |||
Net decrease in net assets resulting from capital share transactions | (20,909,227 ) | (16,647,790 ) | ||
Total decrease in net assets | (27,182,907 ) | (68,912,500 ) | ||
Net assets | ||||
Beginning of period | 317,203,747 | 386,116,247 | ||
End of period | $290,020,840 | $317,203,747 | ||
Year ended March 31 | |||||
Class A | 2024 | 2023 | 2022 | 2021 | 2020 |
Net asset value, beginning of period | $48.22 | $54.61 | $46.95 | $35.30 | $33.94 |
Net investment income (loss) | 0.41 1 | 0.38 1 | 0.27 1 | 0.08 | (0.03 )1 |
Net realized and unrealized gains (losses) on investments | (0.90 ) | (5.91 ) | 8.03 | 12.35 | 1.44 |
Total from investment operations | (0.49 ) | (5.53 ) | 8.30 | 12.43 | 1.41 |
Distributions to shareholders from | |||||
Net investment income | 0.00 | (0.86 ) | (0.64 ) | (0.78 ) | (0.05 ) |
Net asset value, end of period | $47.73 | $48.22 | $54.61 | $46.95 | $35.30 |
Total return2 | (1.02 )% | (9.87 )% | 17.96 % | 34.95 % | 4.13 % |
Ratios to average net assets (annualized) | |||||
Gross expenses | 1.19 % | 1.19 % | 1.18 % | 1.17 % | 1.20 % |
Net expenses | 1.08 % | 1.09 % | 1.09 % | 1.09 % | 1.09 % |
Net investment income (loss) | 0.91 % | 0.89 % | 0.55 % | 0.12 % | (0.08 )% |
Supplemental data | |||||
Portfolio turnover rate3 | 11 % | 9 % | 15 % | 22 % | 25 % |
Net assets, end of period (000s omitted) | $150,703 | $167,511 | $208,497 | $193,949 | $147,020 |
1 | Calculated based upon average shares outstanding |
2 | Total return calculations do not include any sales charges. |
3 | Portfolio turnover rate includes the purchases and sales transactions of its wholly-owned subsidiary. |
Year ended March 31 | |||||
Class C | 2024 | 2023 | 2022 | 2021 | 2020 |
Net asset value, beginning of period | $42.44 | $48.30 | $41.35 | $30.87 | $29.88 |
Net investment income (loss) | 0.05 1 | 0.05 1 | (0.09 )1 | (0.32 )1 | (0.29 )1 |
Net realized and unrealized gains (losses) on investments | (0.80 ) | (5.25 ) | 7.13 | 10.80 | 1.28 |
Total from investment operations | (0.75 ) | (5.20 ) | 7.04 | 10.48 | 0.99 |
Distributions to shareholders from | |||||
Net investment income | 0.00 | (0.66 ) | (0.09 ) | 0.00 | 0.00 |
Net asset value, end of period | $41.69 | $42.44 | $48.30 | $41.35 | $30.87 |
Total return2 | (1.77 )% | (10.56 )% | 17.07 % | 33.95 % | 3.31 % |
Ratios to average net assets (annualized) | |||||
Gross expenses | 1.94 % | 1.94 % | 1.93 % | 1.92 % | 1.95 % |
Net expenses | 1.84 % | 1.84 % | 1.84 % | 1.84 % | 1.84 % |
Net investment income (loss) | 0.12 % | 0.13 % | (0.21 )% | (0.68 )% | (0.83 )% |
Supplemental data | |||||
Portfolio turnover rate3 | 11 % | 9 % | 15 % | 22 % | 25 % |
Net assets, end of period (000s omitted) | $6,901 | $9,253 | $12,241 | $12,039 | $11,834 |
1 | Calculated based upon average shares outstanding |
2 | Total return calculations do not include any sales charges. |
3 | Portfolio turnover rate includes the purchases and sales transactions of its wholly-owned subsidiary. |
Year ended March 31 | |||||
Administrator Class | 2024 | 2023 | 2022 | 2021 | 2020 |
Net asset value, beginning of period | $48.66 | $55.06 | $47.36 | $35.66 | $34.29 |
Net investment income | 0.46 1 | 0.47 1 | 0.38 1 | 0.17 1 | 0.02 1 |
Net realized and unrealized gains (losses) on investments | (0.90 ) | (5.98 ) | 8.05 | 12.47 | 1.45 |
Total from investment operations | (0.44 ) | (5.51 ) | 8.43 | 12.64 | 1.47 |
Distributions to shareholders from | |||||
Net investment income | 0.00 | (0.89 ) | (0.73 ) | (0.94 ) | (0.10 ) |
Net asset value, end of period | $48.22 | $48.66 | $55.06 | $47.36 | $35.66 |
Total return | (0.90 )% | (9.75 )% | 18.13 % | 35.13 % | 4.24 % |
Ratios to average net assets (annualized) | |||||
Gross expenses | 1.12 % | 1.11 % | 1.10 % | 1.09 % | 1.12 % |
Net expenses | 0.95 % | 0.95 % | 0.95 % | 0.95 % | 0.95 % |
Net investment income | 1.02 % | 1.07 % | 0.78 % | 0.31 % | 0.06 % |
Supplemental data | |||||
Portfolio turnover rate2 | 11 % | 9 % | 15 % | 22 % | 25 % |
Net assets, end of period (000s omitted) | $25,370 | $25,300 | $25,016 | $13,976 | $7,994 |
1 | Calculated based upon average shares outstanding |
2 | Portfolio turnover rate includes the purchases and sales transactions of its wholly-owned subsidiary. |
Year ended March 31 | |||||
Institutional Class | 2024 | 2023 | 2022 | 2021 | 2020 |
Net asset value, beginning of period | $49.11 | $55.50 | $47.74 | $35.96 | $34.57 |
Net investment income | 0.54 1 | 0.64 | 0.50 | 0.24 | 0.09 1 |
Net realized and unrealized gains (losses) on investments | (0.90 ) | (6.11 ) | 8.07 | 12.59 | 1.46 |
Total from investment operations | (0.36 ) | (5.47 ) | 8.57 | 12.83 | 1.55 |
Distributions to shareholders from | |||||
Net investment income | 0.00 | (0.92 ) | (0.81 ) | (1.05 ) | (0.16 ) |
Net asset value, end of period | $48.75 | $49.11 | $55.50 | $47.74 | $35.96 |
Total return | (0.73 )% | (9.59 )% | 18.30 % | 35.34 % | 4.43 % |
Ratios to average net assets (annualized) | |||||
Gross expenses | 0.87 % | 0.86 % | 0.85 % | 0.84 % | 0.87 % |
Net expenses | 0.79 % | 0.79 % | 0.79 % | 0.79 % | 0.79 % |
Net investment income | 1.18 % | 1.18 % | 0.85 % | 0.37 % | 0.22 % |
Supplemental data | |||||
Portfolio turnover rate2 | 11 % | 9.00 % | 15 % | 22 % | 25 % |
Net assets, end of period (000s omitted) | $107,047 | $115,140 | $140,363 | $127,406 | $107,907 |
1 | Calculated based upon average shares outstanding |
2 | Portfolio turnover rate includes the purchases and sales transactions of its wholly-owned subsidiary. |
Gross unrealized gains | $118,168,164 |
Gross unrealized losses | (7,673,308 ) |
Net unrealized gains | $110,494,856 |
Quoted prices (Level 1) | Other significant observable inputs (Level 2) | Significant unobservable inputs (Level 3) | Total | |
Assets | ||||
Investments in: | ||||
Common stocks | ||||
Australia | $14,279,615 | $0 | $0 | $14,279,615 |
Canada | 167,397,655 | 25,077,623 | 0 | 192,475,278 |
South Africa | 15,333,850 | 0 | 0 | 15,333,850 |
United Kingdom | 19,269,481 | 0 | 0 | 19,269,481 |
United States | 27,714,560 | 0 | 0 | 27,714,560 |
Rights | ||||
Canada | 0 | 0 | 0 | 0 |
Warrants | ||||
Canada | 0 | 0 | 0 | 0 |
Commodities | 17,086,170 | 0 | 0 | 17,086,170 |
Short-term investments | ||||
Investment companies | 3,103,866 | 0 | 0 | 3,103,866 |
Total assets | $264,185,197 | $25,077,623 | $0 | $289,262,820 |
Average daily net assets | Management fee |
First $500 million | 0.650 % |
Next $500 million | 0.600 |
Next $1 billion | 0.550 |
Next $2 billion | 0.525 |
Next $1 billion | 0.500 |
Next $5 billion | 0.490 |
Over $10 billion | 0.480 |
Class-level administration fee | |
Class A | 0.20 % |
Class C | 0.20 |
Administrator Class | 0.13 |
Institutional Class | 0.13 |
EXPENSE RATIO CAPS | |
Class A | 1.09 % |
Class C | 1.84 |
Administrator Class | 0.95 |
Institutional Class | 0.79 |
Undistributed ordinary income | Unrealized gains | Capital loss carryforward |
$3,145,058 | $110,494,283 | $(132,029,961 ) |
Allspring Funds Trust:

Creditable foreign taxes paid | Per share amount | Foreign income as % of ordinary income distributions |
$645,246 | $0.1067 | 80 % |
Name and year of birth | Position held and length of service* | Principal occupations during past five years or longer | Current other public company or investment company directorships |
William R. Ebsworth (Born 1957) | Trustee, since 2015 | Retired. From 1984 to 2013, equities analyst, portfolio manager, research director and chief investment officer at Fidelity Management and Research Company in Boston, Tokyo, and Hong Kong, and retired in 2013 as Chief Investment Officer of Fidelity Strategic Advisers, Inc. where he led a team of investment professionals managing client assets. Prior thereto, Board member of Hong Kong Securities Clearing Co., Hong Kong Options Clearing Corp., the Thailand International Fund, Ltd., Fidelity Investments Life Insurance Company, and Empire Fidelity Investments Life Insurance Company. Serves on the Investment Company Institute’s Board of Governors since 2022 and Executive Committee since 2023 as well as the Vice Chairman of the Governing Council of the Independent Directors Council since 2023. Audit Committee Chair and Investment Committee Chair of the Vincent Memorial Hospital Foundation (non-profit organization). Mr. Ebsworth is a CFA charterholder. | N/A |
Jane A. Freeman (Born 1953) | Trustee, since 2015; Chair Liaison, since January 2018# | Retired. From 2012 to 2014 and 1999 to 2008, Chief Financial Officer of Scientific Learning Corporation. From 2008 to 2012, Ms. Freeman provided consulting services related to strategic business projects. Prior to 1999, Portfolio Manager at Rockefeller & Co. and Scudder, Stevens & Clark. Board member of the Harding Loevner Funds from 1996 to 2014, serving as both Lead Independent Director and chair of the Audit Committee. Board member of the Russell Exchange Traded Funds Trust from 2011 to 2012 and the chair of the Audit Committee. Ms. Freeman is also an inactive Chartered Financial Analyst. | N/A |
Isaiah Harris, Jr. (Born 1952) | Trustee, since 2009; Audit Committee Chair, since 2019 | Retired. Member of the Advisory Board of CEF of East Central Florida. Chairman of the Board of CIGNA Corporation from 2009 to 2021, and Director from 2005 to 2008. From 2003 to 2011, Director of Deluxe Corporation. Prior thereto, President and CEO of BellSouth Advertising and Publishing Corp. from 2005 to 2007, President and CEO of BellSouth Enterprises from 2004 to 2005 and President of BellSouth Consumer Services from 2000 to 2003. Emeritus member of the Iowa State University Foundation Board of Governors. Emeritus Member of the Advisory board of Iowa State University School of Business. Advisory Board Member, Palm Harbor Academy (private school). Advisory Board Member, Fellowship of Christian Athletes. Mr. Harris is a certified public accountant (inactive status). | N/A |
David F. Larcker (Born 1950) | Trustee, since 2009 | Distinguished Visiting Fellow at the Hoover Institution since 2022. James Irvin Miller Professor of Accounting at the Graduate School of Business (Emeritus), Stanford University, Director of the Corporate Governance Research Initiative and Senior Faculty of The Rock Center for Corporate Governance since 2006. From 2005 to 2008, Professor of Accounting at the Graduate School of Business, Stanford University. Prior thereto, Ernst & Young Professor of Accounting at The Wharton School, University of Pennsylvania from 1985 to 2005. | N/A |
Olivia S. Mitchell (Born 1953) | Trustee, since 2006; Nominating and Governance Committee Chair, since 2018 | International Foundation of Employee Benefit Plans Professor since 1993, Wharton School of the University of Pennsylvania. Director of Wharton’s Pension Research Council and Boettner Center on Pensions & Retirement Research, and Research Associate at the National Bureau of Economic Research. Previously taught at Cornell University from 1978 to 1993. | N/A |
Name and year of birth | Position held and length of service* | Principal occupations during past five years or longer | Current other public company or investment company directorships |
Timothy J. Penny (Born 1951) | Trustee, since 1996; Chair, since 2018 | President and Chief Executive Officer of Southern Minnesota Initiative Foundation, a non-profit organization, since 2007. Vice Chair of the Economic Club of Minnesota, since 2007. Co-Chair of the Committee for a Responsible Federal Budget, since 1995. Member of the Board of Trustees of NorthStar Education Finance, Inc., a non-profit organization, from 2007-2022. Senior Fellow of the University of Minnesota Humphrey Institute from 1995 to 2017. | N/A |
James G. Polisson (Born 1959) | Trustee, since 2018 | Retired. Chief Marketing Officer, Source (ETF) UK Services, Ltd, from 2015 to 2017. From 2012 to 2015, Principal of The Polisson Group, LLC, a management consulting, corporate advisory and principal investing company. Chief Executive Officer and Managing Director at Russell Investments, Global Exchange Traded Funds from 2010 to 2012. Managing Director of Barclays Global Investors from 1998 to 2010 and Global Chief Marketing Officer for iShares and Barclays Global Investors from 2000 to 2010. Trustee of the San Francisco Mechanics’ Institute, a non- profit organization, from 2013 to 2015. Board member of the Russell Exchange Traded Fund Trust from 2011 to 2012. Director of Barclays Global Investors Holdings Deutschland GmbH from 2006 to 2009. Mr. Polisson is an attorney and has a retired status with the Massachusetts and District of Columbia Bar Associations. | N/A |
Pamela Wheelock (Born 1959) | Trustee, since January 2020; previously Trustee from January 2018 to July 2019# | Retired. Executive and Senior Financial leadership positions in the public, private and nonprofit sectors. Interim President and CEO, McKnight Foundation, 2020. Interim Commissioner, Minnesota Department of Human Services, 2019. Chief Operating Officer, Twin Cities Habitat for Humanity, 2017-2019. Vice President for University Services, University of Minnesota, 2012- 2016. Interim President and CEO, Blue Cross and Blue Shield of Minnesota, 2011-2012. Executive Vice-President and Chief Financial Officer, Minnesota Wild, 2002-2008. Commissioner, Minnesota Department of Finance, 1999-2002. Chair of the Board of Directors of Destination Medical Center Corporation. Board member of the Minnesota Wild Foundation. | N/A |
Name and year of birth | Position held and length of service | Principal occupations during past five years or longer |
Andrew Owen (Born 1960) | President, since 2017 | President and Chief Executive Officer of Allspring Funds Management, LLC since 2017 and Head of Global Fund Governance of Allspring Global Investments since 2022. Prior thereto, co-president of Galliard Capital Management, LLC, an affiliate of Allspring Funds Management, LLC, from 2019 to 2022 and Head of Affiliated Managers, Allspring Global Investments, from 2014 to 2019 and Executive Vice President responsible for marketing, investments and product development for Allspring Funds Management, LLC, from 2009 to 2014. |
Jeremy DePalma (Born 1974) | Treasurer, since 2012 (for certain funds in the Fund Complex); since 2021 (for the remaining funds in the Complex) | Senior Vice President of Allspring Funds Management, LLC since 2009. Senior Vice President of Evergreen Investment Management Company, LLC from 2008 to 2010 and head of the Fund Reporting and Control Team within Fund Administration from 2005 to 2010. |
Christopher Baker (Born 1976) | Chief Compliance Officer, since 2022 | Global Chief Compliance Officer for Allspring Global Investments since 2022. Prior thereto, Chief Compliance Officer for State Street Global Advisors from 2018 to 2021. Senior Compliance Officer for the State Street divisions of Alternative Investment Solutions, Sector Solutions, and Global Marketing from 2015 to 2018. From 2010 to 2015 Vice President, Global Head of Investment and Marketing Compliance for State Street Global Advisors. |
Matthew Prasse (Born 1983) | Chief Legal Officer, since 2022; Secretary, since 2021 | Senior Counsel of the Allspring Legal Department since 2021. Senior Counsel of the Wells Fargo Legal Department from 2018 to 2021. Previously, Counsel for Barings LLC from 2015 to 2018. Prior to joining Barings, Associate at Morgan, Lewis & Bockius LLP from 2008 to 2015. |

P.O. Box 219967
Kansas City, MO 64121-9967

AR0654 03-24
2 | |
6 | |
10 | |
11 | |
19 | |
20 | |
22 | |
24 | |
29 | |
34 | |
35 |

Allspring Funds

President
Allspring Funds
Notice to Shareholders |
Beginning in July 2024, the Fund will be required by the Securities and Exchange Commission to send shareholders a paper copy of a new tailored shareholder report in place of the full shareholder report that you are now receiving. The tailored shareholder report will contain concise information about the Fund, including certain expense and performance information and fund statistics. If you wish to receive this new tailored shareholder report electronically, please follow the instructions on the back cover of this report. |
Other information that is currently included in the shareholder report, such as the Fund’s financial statements, will be available online and upon request, free of charge, in paper or electronic format. |
This Fund is currently closed to most new investors.* | |
Investment objective | The Fund seeks long-term capital appreciation. |
Manager | Allspring Funds Management, LLC |
Subadviser | Allspring Global Investments, LLC |
Portfolio managers | Brian Martin, CFA, James M. Tringas, CFA, Bryant VanCronkhite, CFA, CPA |
Average annual total returns (%) as of March 31, 2024 | |||||||||
Including sales charge | Excluding sales charge | Expense ratios1 (%) | |||||||
Inception date | 1 year | 5 year | 10 year | 1 year | 5 year | 10 year | Gross | Net2 | |
Class A (ESPAX) | 5-7-1993 | 16.26 | 8.51 | 7.60 | 23.35 | 9.81 | 8.24 | 1.25 | 1.25 |
Class C (ESPCX) | 12-12-2000 | 21.48 | 9.01 | 7.60 | 22.48 | 9.01 | 7.60 | 2.00 | 2.00 |
Class R6 (ESPRX)3 | 10-31-2014 | – | – | – | 23.88 | 10.28 | 8.70 | 0.83 | 0.83 |
Administrator Class (ESPIX) | 7-23-1996 | – | – | – | 23.47 | 9.90 | 8.36 | 1.18 | 1.18 |
Institutional Class (ESPNX) | 7-30-2010 | – | – | – | 23.77 | 10.17 | 8.62 | 0.93 | 0.93 |
Russell 2000® Value Index4 | – | – | – | – | 18.75 | 8.17 | 6.87 | – | – |
1 | Reflects the expense ratios as stated in the most recent prospectuses. The expense ratios shown are subject to change and may differ from the annualized expense ratios shown in the Financial Highlights of this report. |
2 | The manager has contractually committed through July 31, 2024, to waive fees and/or reimburse expenses to the extent necessary to cap total annual fund operating expenses after fee waivers at 1.31% for Class A, 2.06% for Class C, 0.89% for Class R6, 1.20% for Administrator Class and 0.94% for Institutional Class. Brokerage commissions, stamp duty fees, interest, taxes, acquired fund fees and expenses (if any), and extraordinary expenses are excluded from the expense caps. Prior to or after the commitment expiration date, the caps may be increased or the commitment to maintain the caps may be terminated only with the approval of the Board of Trustees. Without these caps, the Fund’s returns would have been lower. The expense ratio paid by an investor is the net expense ratio (the total annual fund operating expenses after fee waivers) as stated in the prospectuses. |
3 | Historical performance shown for the Class R6 shares prior to their inception reflects the performance of the Institutional Class shares, and includes the higher expenses applicable to the Institutional Class shares. If these expenses had not been included, returns for the Class R6 shares would be higher. |
4 | The Russell 2000® Value Index measures the performance of those Russell 2000 companies with lower price/book ratios and lower forecasted growth values. You cannot invest directly in an index. |
* | Please see the Fund’s current Statement of Additional Information for further details. |
CFA® and Chartered Financial Analyst® are trademarks owned by CFA Institute. | |
Growth of $10,000 investment as of March 31, 20241 |
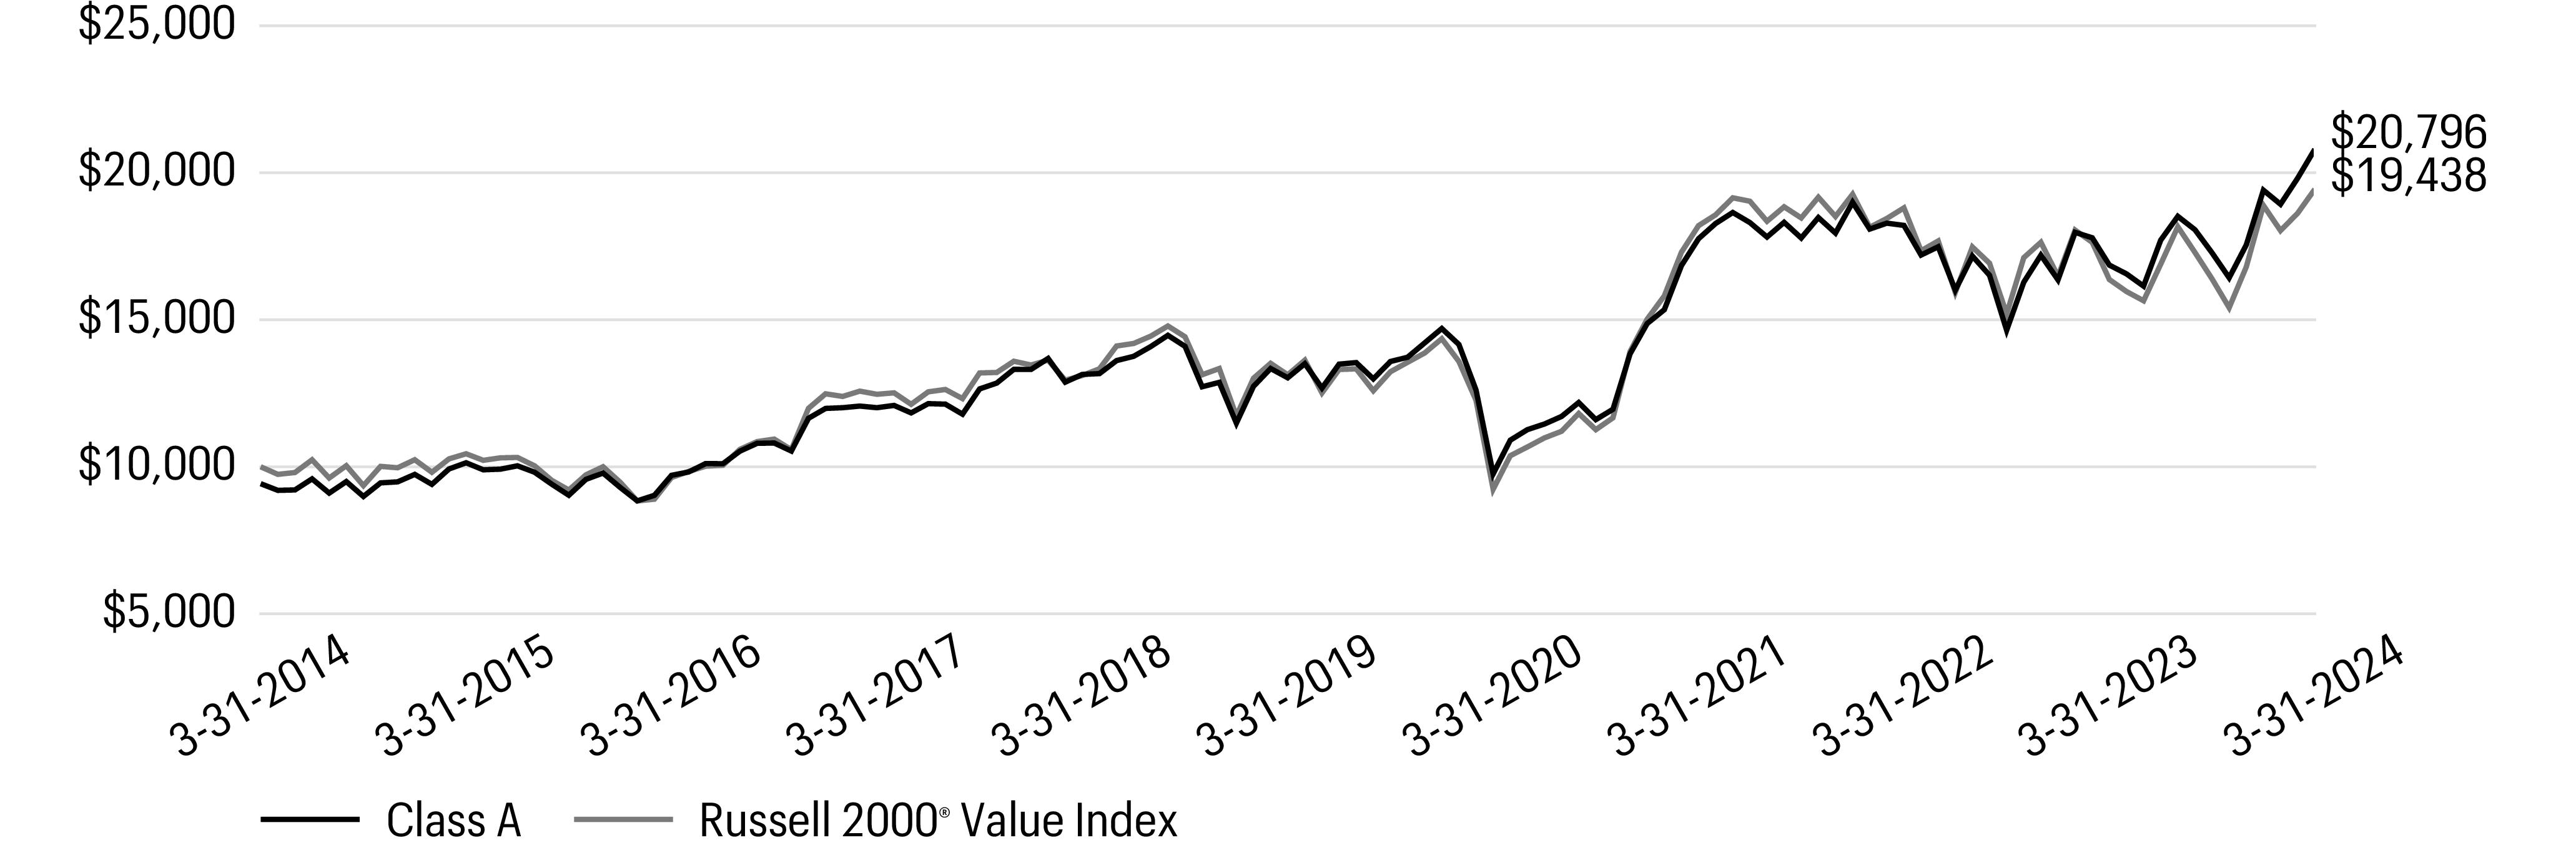
1 | The chart compares the performance of Class A shares for the most recent ten years with the Russell 2000® Value Index. The chart assumes a hypothetical investment of $10,000 in Class A shares and reflects all operating expenses and assumes the maximum initial sales charge of 5.75%. |
Ten largest holdings (%) as of March 31, 20241 | |
Mueller Industries, Inc. | 3.47 |
Innospec, Inc. | 3.44 |
Eagle Materials, Inc. | 2.96 |
Franklin Electric Co., Inc. | 2.91 |
J & J Snack Foods Corp. | 2.60 |
Avient Corp. | 2.47 |
UMB Financial Corp. | 2.29 |
Spectrum Brands Holdings, Inc. | 2.07 |
Enstar Group Ltd. | 1.72 |
CSW Industrials, Inc. | 1.71 |
1 | Figures represent the percentage of the Fund’s net assets. Holdings are subject to change and may have changed since the date specified. |
Sector allocation as of March 31, 20241 |

1 | Figures represent the percentage of the Fund’s long-term investments. Allocations are subject to change and may have changed since the date specified. |
Beginning account value 10-1-2023 | Ending account value 3-31-2024 | Expenses paid during the period1 | Annualized net expense ratio | |
Class A | ||||
Actual | $1,000.00 | $1,203.74 | $6.79 | 1.24 % |
Hypothetical (5% return before expenses) | $1,000.00 | $1,018.70 | $6.22 | 1.24 % |
Class C | ||||
Actual | $1,000.00 | $1,199.40 | $10.77 | 1.97 % |
Hypothetical (5% return before expenses) | $1,000.00 | $1,015.07 | $9.87 | 1.97 % |
Class R6 | ||||
Actual | $1,000.00 | $1,206.21 | $4.50 | 0.82 % |
Hypothetical (5% return before expenses) | $1,000.00 | $1,020.79 | $4.12 | 0.82 % |
Administrator Class | ||||
Actual | $1,000.00 | $1,204.52 | $6.36 | 1.16 % |
Hypothetical (5% return before expenses) | $1,000.00 | $1,019.10 | $5.82 | 1.16 % |
Institutional Class | ||||
Actual | $1,000.00 | $1,205.84 | $5.05 | 0.92 % |
Hypothetical (5% return before expenses) | $1,000.00 | $1,020.29 | $4.62 | 0.92 % |
1 | Expenses paid is equal to the annualized net expense ratio of each class multiplied by the average account value over the period, multiplied by 182 divided by 366 (to reflect the one-half-year period). |
Shares | Value | |||||
Common stocks: 95.66% | ||||||
Communication services: 0.64% | ||||||
Interactive media & services: 0.35% | ||||||
Ziff Davis, Inc.† | 325,600 | $20,525,824 | ||||
Media: 0.29% | ||||||
DallasNews Corp. | 426,597 | 1,629,601 | ||||
Thryv Holdings, Inc.† | 708,300 | 15,745,509 | ||||
17,375,110 | ||||||
Consumer discretionary: 4.90% | ||||||
Automobile components: 0.87% | ||||||
Atmus Filtration Technologies, Inc.†# | 791,915 | 25,539,259 | ||||
Holley, Inc.† | 5,839,852 | 26,045,740 | ||||
51,584,999 | ||||||
Hotels, restaurants & leisure: 1.79% | ||||||
Denny’s Corp.♠† | 4,776,612 | 42,798,443 | ||||
Dine Brands Global, Inc. | 760,943 | 35,368,631 | ||||
Jack in the Box, Inc. | 405,446 | 27,764,942 | ||||
105,932,016 | ||||||
Household durables: 1.17% | ||||||
Helen of Troy Ltd.†# | 581,793 | 67,045,825 | ||||
Landsea Homes Corp.† | 143,409 | 2,083,733 | ||||
69,129,558 | ||||||
Textiles, apparel & luxury goods: 1.07% | ||||||
Delta Apparel, Inc.♠† | 602,202 | 1,800,584 | ||||
Levi Strauss & Co. Class A | 1,015,948 | 20,308,800 | ||||
Steven Madden Ltd. | 981,000 | 41,476,680 | ||||
63,586,064 | ||||||
Consumer staples: 8.91% | ||||||
Beverages: 0.93% | ||||||
Primo Water Corp. | 3,026,689 | 55,116,007 | ||||
Food products: 4.24% | ||||||
J & J Snack Foods Corp.♠ | 1,067,524 | 154,321,269 | ||||
Nomad Foods Ltd. | 3,735,728 | 73,070,840 | ||||
Tootsie Roll Industries, Inc. | 751,515 | 24,071,029 | ||||
251,463,138 | ||||||
Household products: 3.58% | ||||||
Central Garden & Pet Co.† | 685,044 | 29,340,434 | ||||
Central Garden & Pet Co. Class A† | 1,636,712 | 60,427,407 | ||||
Spectrum Brands Holdings, Inc. | 1,377,087 | 122,574,514 | ||||
212,342,355 | ||||||
Shares | Value | |||||
Personal care products: 0.16% | ||||||
Edgewell Personal Care Co. | 236,500 | $9,138,360 | ||||
Energy: 6.73% | ||||||
Energy equipment & services: 1.74% | ||||||
Forum Energy Technologies, Inc.† | 204,844 | 4,092,783 | ||||
Liberty Energy, Inc. | 1,669,871 | 34,599,727 | ||||
Patterson-UTI Energy, Inc. | 5,378,748 | 64,222,252 | ||||
102,914,762 | ||||||
Oil, gas & consumable fuels: 4.99% | ||||||
Berry Corp. | 2,162,286 | 17,406,402 | ||||
Chord Energy Corp. | 377,812 | 67,341,211 | ||||
Magnolia Oil & Gas Corp. Class A | 2,585,100 | 67,083,345 | ||||
Nordic American Tankers Ltd. | 3,283,911 | 12,872,931 | ||||
Northern Oil & Gas, Inc. | 1,115,370 | 44,257,882 | ||||
SM Energy Co. | 509,600 | 25,403,560 | ||||
Southwestern Energy Co.† | 8,127,280 | 61,604,782 | ||||
295,970,113 | ||||||
Financials: 19.16% | ||||||
Banks: 7.61% | ||||||
Associated Banc-Corp. | 2,201,056 | 47,344,715 | ||||
First Hawaiian, Inc. | 1,157,358 | 25,415,582 | ||||
Hancock Whitney Corp. | 1,624,888 | 74,809,844 | ||||
Renasant Corp. | 1,183,957 | 37,081,533 | ||||
SouthState Corp. | 920,395 | 78,261,187 | ||||
UMB Financial Corp. | 1,560,749 | 135,769,555 | ||||
Webster Financial Corp.# | 1,032,063 | 52,397,838 | ||||
451,080,254 | ||||||
Capital markets: 1.18% | ||||||
B Riley Financial, Inc.# | 219,007 | 4,636,378 | ||||
GlassBridge Enterprises, Inc.♠† | 1,527 | 30,540 | ||||
MidCap Financial Investment Corp. | 1,845,286 | 27,753,101 | ||||
New Mountain Finance Corp. | 2,523,650 | 31,974,646 | ||||
Pershing Square Tontine Holdings Ltd.♦† | 1,415,995 | 1 | ||||
Westwood Holdings Group, Inc.♠ | 469,383 | 5,782,799 | ||||
70,177,465 | ||||||
Financial services: 2.44% | ||||||
Compass Diversified Holdings (Acquired 12-18-2023, cost $75,189,000)♦†˃ | 3,550,000 | 85,448,500 | ||||
Euronet Worldwide, Inc.† | 315,500 | 34,682,915 | ||||
Jackson Financial, Inc. Class A# | 367,993 | 24,339,057 | ||||
144,470,472 | ||||||
Insurance: 5.31% | ||||||
CNO Financial Group, Inc. | 232,100 | 6,378,108 | ||||
Enstar Group Ltd.† | 329,202 | 102,302,814 | ||||
Shares | Value | |||||
Insurance(continued) | ||||||
Hanover Insurance Group, Inc. | 636,777 | $86,709,924 | ||||
ProAssurance Corp. | 1,060,900 | 13,643,174 | ||||
Stewart Information Services Corp. | 1,341,002 | 87,245,590 | ||||
White Mountains Insurance Group Ltd. | 10,460 | 18,768,378 | ||||
315,047,988 | ||||||
Mortgage real estate investment trusts (REITs): 2.62% | ||||||
AGNC Investment Corp. | 5,769,842 | 57,121,436 | ||||
Apollo Commercial Real Estate Finance, Inc. | 1,744,770 | 19,436,738 | ||||
New York Mortgage Trust, Inc. | 3,009,901 | 21,671,287 | ||||
Two Harbors Investment Corp. | 4,295,486 | 56,872,234 | ||||
155,101,695 | ||||||
Health care: 4.30% | ||||||
Health care equipment & supplies: 1.44% | ||||||
Enovis Corp.† | 520,400 | 32,498,980 | ||||
Haemonetics Corp.†# | 240,631 | 20,537,856 | ||||
Varex Imaging Corp.† | 1,786,438 | 32,334,528 | ||||
85,371,364 | ||||||
Health care providers & services: 1.07% | ||||||
Patterson Cos., Inc. | 1,438,351 | 39,770,405 | ||||
Premier, Inc. Class A | 1,071,337 | 23,676,548 | ||||
63,446,953 | ||||||
Life sciences tools & services: 0.53% | ||||||
Azenta, Inc.† | 521,241 | 31,420,407 | ||||
Pharmaceuticals: 1.26% | ||||||
Perrigo Co. PLC | 475,351 | 15,301,549 | ||||
Prestige Consumer Healthcare, Inc.† | 819,126 | 59,435,782 | ||||
74,737,331 | ||||||
Industrials: 28.61% | ||||||
Building products: 7.17% | ||||||
CSW Industrials, Inc. | 432,600 | 101,487,960 | ||||
Griffon Corp. | 796,404 | 58,408,269 | ||||
Janus International Group, Inc.† | 3,943,602 | 59,666,698 | ||||
Quanex Building Products Corp.♠ | 2,169,680 | 83,380,802 | ||||
Simpson Manufacturing Co., Inc. | 197,331 | 40,488,375 | ||||
UFP Industries, Inc. | 665,359 | 81,845,811 | ||||
425,277,915 | ||||||
Commercial services & supplies: 2.35% | ||||||
ACCO Brands Corp. | 4,653,918 | 26,108,480 | ||||
Custom Truck One Source, Inc.† | 3,475,000 | 20,224,500 | ||||
Ennis, Inc. | 1,291,481 | 26,488,275 | ||||
Matthews International Corp. Class A | 480,464 | 14,932,821 | ||||
Shares | Value | |||||
Commercial services & supplies(continued) | ||||||
Stericycle, Inc.†# | 169,400 | $8,935,850 | ||||
Viad Corp.♠† | 1,081,308 | 42,700,853 | ||||
139,390,779 | ||||||
Construction & engineering: 1.96% | ||||||
API Group Corp.†# | 1,964,767 | 77,156,400 | ||||
MDU Resources Group, Inc. | 1,542,874 | 38,880,425 | ||||
116,036,825 | ||||||
Electrical equipment: 1.19% | ||||||
Atkore, Inc.# | 372,269 | 70,865,127 | ||||
Ground transportation: 0.77% | ||||||
Werner Enterprises, Inc. | 1,162,729 | 45,485,959 | ||||
Machinery: 11.30% | ||||||
Alamo Group, Inc. | 328,307 | 74,962,337 | ||||
Columbus McKinnon Corp. | 784,807 | 35,025,936 | ||||
Douglas Dynamics, Inc.♠ | 1,937,221 | 46,725,771 | ||||
Franklin Electric Co., Inc. | 1,613,469 | 172,334,624 | ||||
Gates Industrial Corp. PLC† | 2,780,537 | 49,243,310 | ||||
Hillman Group† | 3,622,900 | 38,547,656 | ||||
Hillman Solutions Corp.† | 2,271,762 | 24,171,548 | ||||
Mayville Engineering Co., Inc.♠† | 1,617,824 | 23,183,418 | ||||
Mueller Industries, Inc. | 3,811,880 | 205,574,688 | ||||
669,769,288 | ||||||
Professional services: 3.20% | ||||||
CBIZ, Inc.† | 657,461 | 51,610,689 | ||||
Concentrix Corp.# | 238,500 | 15,793,470 | ||||
Korn Ferry | 1,129,582 | 74,281,312 | ||||
Maximus, Inc. | 571,100 | 47,915,290 | ||||
189,600,761 | ||||||
Trading companies & distributors: 0.67% | ||||||
Air Lease Corp. | 690,900 | 35,539,896 | ||||
Custom Truck One Source, Inc.† | 751,809 | 4,375,528 | ||||
39,915,424 | ||||||
Information technology: 4.60% | ||||||
Electronic equipment, instruments & components: 1.94% | ||||||
Belden, Inc. | 1,086,178 | 100,590,944 | ||||
IPG Photonics Corp.†# | 50,000 | 4,534,500 | ||||
Knowles Corp.† | 601,207 | 9,679,433 | ||||
114,804,877 | ||||||
IT services: 1.45% | ||||||
Global Blue Group Holding AG† | 4,536,904 | 23,773,377 | ||||
Shares | Value | |||||
IT services(continued) | ||||||
Kyndryl Holdings, Inc.† | 2,337,689 | $50,868,113 | ||||
Perficient, Inc.† | 206,100 | 11,601,369 | ||||
86,242,859 | ||||||
Semiconductors & semiconductor equipment: 0.18% | ||||||
Diodes, Inc.† | 150,000 | 10,575,000 | ||||
Software: 0.70% | ||||||
E2open Parent Holdings, Inc.† | 3,141,845 | 13,949,791 | ||||
Pagaya Technologies Ltd. Class A† | 1,029,718 | 10,400,152 | ||||
Progress Software Corp.# | 255,100 | 13,599,381 | ||||
Synchronoss Technologies, Inc.† | 458,357 | 3,827,281 | ||||
41,776,605 | ||||||
Technology hardware, storage & peripherals: 0.33% | ||||||
Diebold Nixdorf, Inc.† | 559,200 | 19,258,848 | ||||
Materials: 15.92% | ||||||
Chemicals: 9.59% | ||||||
Avient Corp. | 3,370,184 | 146,265,986 | ||||
Ecovyst, Inc.† | 4,155,014 | 46,328,406 | ||||
Innospec, Inc.♠ | 1,583,394 | 204,162,822 | ||||
Mativ Holdings, Inc.♠ | 3,363,846 | 63,072,112 | ||||
Minerals Technologies, Inc. | 362,356 | 27,278,160 | ||||
NewMarket Corp. | 128,281 | 81,409,688 | ||||
568,517,174 | ||||||
Construction materials: 2.96% | ||||||
Eagle Materials, Inc. | 646,873 | 175,787,738 | ||||
Containers & packaging: 3.37% | ||||||
Myers Industries, Inc. | 1,713,677 | 39,705,896 | ||||
Silgan Holdings, Inc. | 1,900,065 | 92,267,157 | ||||
TriMas Corp.♠ | 2,533,325 | 67,715,777 | ||||
199,688,830 | ||||||
Real estate: 0.99% | ||||||
Residential REITs : 0.42% | ||||||
Elme Communities | 1,784,009 | 24,833,405 | ||||
Retail REITs : 0.57% | ||||||
Agree Realty Corp. | 595,200 | 33,997,824 | ||||
Utilities: 0.90% | ||||||
Electric utilities: 0.50% | ||||||
IDACORP, Inc. | 319,768 | 29,703,250 | ||||
Independent power and renewable electricity producers: 0.40% | ||||||
Talen Energy Corp.† | 253,400 | 23,908,290 | ||||
Total common stocks (Cost $4,270,806,553) | 5,671,369,013 | |||||
Shares | Value | |||||
Investment companies: 0.67% | ||||||
Exchange-traded funds: 0.67% | ||||||
iShares Russell 2000 Value ETF# | 250,000 | $39,702,500 | ||||
Total investment companies (Cost $37,502,932) | 39,702,500 | |||||
Expiration date | ||||||
Rights: 0.00% | ||||||
Financials: 0.00% | ||||||
Capital markets: 0.00% | ||||||
Pershing Square Holdings Ltd.♦† | 9-23-2033 | 353,998 | 0 | |||
Total rights (Cost $0) | 0 | |||||
Yield | ||||||
Short-term investments: 3.62% | ||||||
Investment companies: 3.62% | ||||||
Allspring Government Money Market Fund Select Class♠∞ | 5.25 % | 214,698,626 | 214,698,626 | |||
Total short-term investments (Cost $214,698,626) | 214,698,626 | |||||
Total investments in securities (Cost $4,523,008,111) | 99.95 % | 5,925,770,139 | ||||
Other assets and liabilities, net | 0.05 | 3,191,365 | ||||
Total net assets | 100.00 % | $5,928,961,504 | ||||
† | Non-income-earning security |
# | All or a portion of this security is segregated as collateral for investments in derivative instruments. |
♠ | The issuer of the security is an affiliated person of the Fund as defined in the Investment Company Act of 1940. |
♦ | The security is fair valued in accordance with procedures approved by the Board of Trustees. |
˃ | Restricted security as to resale, excluding Rule 144A securities. The Fund held restricted securities with an aggregate current value of $85,448,500 (original aggregate cost of $75,189,000), representing 1.44% of its net assets as of period end. The restriction expires on June 18, 2024. |
∞ | The rate represents the 7-day annualized yield at period end. |
Abbreviations: | |
REIT | Real estate investment trust |
Value, beginning of period | Purchases | Sales proceeds | Net realized gains (losses) | Net change in unrealized gains (losses) | Value, end of period | Shares, end of period | Income from affiliated securities | |
Common stocks | ||||||||
Delta Apparel, Inc.† | $6,624,222 | $0 | $0 | $0 | $(4,823,638 ) | $1,800,584 | 602,202 | $0 |
Denny’s Corp.† | 51,381,890 | 2,252,000 | (415,416 ) | (41,175 ) | (10,378,856 ) | 42,798,443 | 4,776,612 | 0 |
Douglas Dynamics, Inc. | 59,953,870 | 1,866,451 | (184,998 ) | (51,677 ) | (14,857,875 ) | 46,725,771 | 1,937,221 | 2,267,926 |
GlassBridge Enterprises, Inc.† | 13,758 | 0 | 0 | 0 | 16,782 | 30,540 | 1,527 | 0 |
Innospec, Inc. | 175,472,681 | 0 | (14,268,882 ) | 1,703,173 | 41,255,850 | 204,162,822 | 1,583,394 | 2,366,104 |
J & J Snack Foods Corp. | 153,057,456 | 7,857,192 | (3,047,961 ) | (280,937 ) | (3,264,481 ) | 154,321,269 | 1,067,524 | 3,002,680 |
Mativ Holdings, Inc. | 67,950,618 | 4,863,371 | (2,204,032 ) | (1,233,939 ) | (6,303,906 ) | 63,072,112 | 3,363,846 | 2,247,552 |
Mayville Engineering Co., Inc.† | 24,609,406 | 624,010 | (1,048,604 ) | (214,655 ) | (786,739 ) | 23,183,418 | 1,617,824 | 0 |
Quanex Building Products Corp. | 60,272,804 | 0 | (20,202,181 ) | 5,046,808 | 38,263,371 | 83,380,802 | 2,169,680 | 817,370 |
TriMas Corp. | 59,828,319 | 10,371,126 | (554,026 ) | (88,595 ) | (1,841,047 ) | 67,715,777 | 2,533,325 | 360,697 |
Viad Corp.† | 22,644,911 | 84,210 | (249,136 ) | (151,684 ) | 20,372,552 | 42,700,853 | 1,081,308 | 0 |
Westwood Holdings Group, Inc. | 5,007,316 | 251,188 | (29,152 ) | (134,443 ) | 687,890 | 5,782,799 | 469,383 | 274,820 |
Short-term investments | ||||||||
Allspring Government Money Market Fund Select Class | 151,876,865 | 1,048,135,916 | (985,314,155 ) | 0 | 0 | 214,698,626 | 214,698,626 | 7,784,610 |
Investments in affiliates no longer held at end of period | ||||||||
Tupperware Brands Corp.† | 2,254,605 | 0 | (1,245,629 ) | (18,292,322 ) | 17,283,346 | 0 | 0 | 0 |
$(13,739,446 ) | $75,623,249 | $950,373,816 | $19,121,759 | |||||
Value, beginning of period | Purchases | Sales proceeds | Net realized gains (losses) | Net change in unrealized gains (losses) | Value, end of period | Shares, end of period | Income from affiliated securities | |
Common stocks | ||||||||
Central Garden & Pet Co.† | $32,984,401 | $247,726 | $(8,653,141 ) | $891,834 | $3,869,614 | $29,340,434 | 685,044 | $0 |
CSW Industrials, Inc. | 117,654,677 | 0 | (72,810,298 ) | 45,972,768 | 10,670,813 | 101,487,960 | 432,600 | 463,818 |
DallasNews Corp. | 1,929,759 | 0 | (249,193 ) | (186,042 ) | 135,077 | 1,629,601 | 426,597 | 277,822 |
Dine Brands Global, Inc. | 62,245,237 | 5,825,528 | (12,102,788 ) | (7,488,198 ) | (13,111,148 ) | 35,368,631 | 760,943 | 1,990,618 |
Ennis, Inc. | 26,434,670 | 842,265 | (61,575 ) | (2,673 ) | (724,412 ) | 26,488,275 | 1,291,481 | 1,267,652 |
Mueller Industries, Inc. | 182,532,697 | 16,274,649 | (67,644,975 ) | 33,615,352 | 40,796,965 | 205,574,688 | 3,811,880 | 2,747,996 |
† | Non-income-earning security |
Description | Counterparty | Number of contracts | Notional amount | Exercise price | Expiration date | Value |
Call | ||||||
API Group Corp. | Bank of America Securities, Inc. | (500 ) | $(2,000,000 ) | $40.00 | 4-19-2024 | $(35,000 ) |
Atkore, Inc. | Bank of America Securities, Inc. | (200 ) | (3,500,000 ) | 175.00 | 4-19-2024 | (340,000 ) |
Atkore, Inc. | Bank of America Securities, Inc. | (250 ) | (4,500,000 ) | 180.00 | 5-17-2024 | (467,500 ) |
Description | Counterparty | Number of contracts | Notional amount | Exercise price | Expiration date | Value |
Call (continued) | ||||||
Atkore, Inc. | Bank of America Securities, Inc. | (100 ) | $(2,000,000 ) | $200.00 | 5-17-2024 | $(82,000 ) |
B Riley Financial, Inc. | Bank of America Securities, Inc. | (250 ) | (750,000 ) | 30.00 | 4-19-2024 | (11,875 ) |
B Riley Financial, Inc. | Bank of America Securities, Inc. | (250 ) | (500,000 ) | 20.00 | 4-19-2024 | (71,250 ) |
B Riley Financial, Inc. | Bank of America Securities, Inc. | (250 ) | (437,500 ) | 17.50 | 4-19-2024 | (105,000 ) |
B Riley Financial, Inc. | Bank of America Securities, Inc. | (250 ) | (562,500 ) | 22.50 | 4-19-2024 | (43,750 ) |
B Riley Financial, Inc. | Bank of America Securities, Inc. | (250 ) | (625,000 ) | 25.00 | 4-19-2024 | (29,375 ) |
Haemonetics Corp. | Bank of America Securities, Inc. | (250 ) | (2,250,000 ) | 90.00 | 5-17-2024 | (74,375 ) |
IPG Photonics Corp. | Bank of America Securities, Inc. | (500 ) | (4,500,000 ) | 90.00 | 4-19-2024 | (112,500 ) |
iShares Russell 2000 Value ETF | Bank of America Securities, Inc. | (100 ) | (1,550,000 ) | 155.00 | 4-19-2024 | (53,500 ) |
iShares Russell 2000 Value ETF | Bank of America Securities, Inc. | (100 ) | (1,560,000 ) | 156.00 | 4-19-2024 | (46,000 ) |
iShares Russell 2000 Value ETF | Bank of America Securities, Inc. | (100 ) | (1,600,000 ) | 160.00 | 4-19-2024 | (23,500 ) |
Jackson Financial, Inc. | Bank of America Securities, Inc. | (250 ) | (1,625,000 ) | 65.00 | 4-19-2024 | (64,375 ) |
Put | ||||||
Atmus Filtration Technologies, Inc. | Bank of America Securities, Inc. | 1,000 | 2,250,000 | 22.50 | 4-19-2024 | (1 ) |
Concentrix Corp. | Bank of America Securities, Inc. | 250 | 1,625,000 | 65.00 | 4-19-2024 | (45,625 ) |
Helen of Troy Ltd. | Bank of America Securities, Inc. | 100 | 1,050,000 | 105.00 | 5-17-2024 | (31,500 ) |
IPG Photonics Corp. | Bank of America Securities, Inc. | 100 | 850,000 | 85.00 | 5-17-2024 | (24,500 ) |
Progress Software Corp. | Bank of America Securities, Inc. | 750 | 3,937,500 | 52.50 | 4-19-2024 | (56,250 ) |
Stericycle, Inc. | Bank of America Securities, Inc. | 750 | 3,750,000 | 50.00 | 5-17-2024 | (82,500 ) |
Webster Financial Corp. | Bank of America Securities, Inc. | 500 | 2,250,000 | 45.00 | 4-19-2024 | (11,250 ) |
$(1,811,626 ) |
Assets | |
Investments in unaffiliated securities, at value (cost $3,592,208,958) | $4,975,396,323 |
Investments in affiliated securities, at value (cost $930,799,153) | 950,373,816 |
Cash | 3,233,930 |
Cash at broker segregated for written options | 15,712,500 |
Receivable for investments sold | 14,554,541 |
Receivable for Fund shares sold | 10,748,384 |
Receivable for dividends | 8,260,474 |
Prepaid expenses and other assets | 331,996 |
Total assets | 5,978,611,964 |
Liabilities | |
Payable for investments purchased | 37,859,918 |
Payable for Fund shares redeemed | 5,471,323 |
Management fee payable | 3,714,217 |
Written options, at value (premiums received $1,806,271) | 1,811,626 |
Administration fees payable | 486,767 |
Distribution fees payable | 3,489 |
Accrued expenses and other liabilities | 303,120 |
Total liabilities | 49,650,460 |
Total net assets | $5,928,961,504 |
Net assets consist of | |
Paid-in capital | $4,377,078,276 |
Total distributable earnings | 1,551,883,228 |
Total net assets | $5,928,961,504 |
Computation of net asset value and offering price per share | |
Net assets–Class A | $800,715,910 |
Shares outstanding–Class A1 | 18,631,408 |
Net asset value per share–Class A | $42.98 |
Maximum offering price per share – Class A2 | $45.60 |
Net assets–Class C | $5,679,989 |
Shares outstanding–Class C1 | 150,945 |
Net asset value per share–Class C | $37.63 |
Net assets–Class R6 | $2,338,678,405 |
Shares outstanding–Class R61 | 52,807,041 |
Net asset value per share–Class R6 | $44.29 |
Net assets–Administrator Class | $110,129,809 |
Shares outstanding–Administrator Class1 | 2,487,048 |
Net asset value per share–Administrator Class | $44.28 |
Net assets–Institutional Class | $2,673,757,391 |
Shares outstanding–Institutional Class1 | 60,354,429 |
Net asset value per share–Institutional Class | $44.30 |
Investment income | |
Dividends (net of foreign withholdings taxes of $170,301) | $88,060,616 |
Income from affiliated securities | 19,121,759 |
Interest | 7,233,499 |
Total investment income | 114,415,874 |
Expenses | |
Management fee | 40,889,178 |
Administration fees | |
Class A | 1,484,302 |
Class C | 12,434 |
Class R | 5,875 1 |
Class R6 | 583,720 |
Administrator Class | 134,709 |
Institutional Class | 3,228,293 |
Shareholder servicing fees | |
Class A | 1,833,817 |
Class C | 15,158 |
Class R | 6,994 1 |
Administrator Class | 251,200 |
Distribution fees | |
Class C | 45,466 |
Class R | 6,981 1 |
Custody and accounting fees | 121,392 |
Professional fees | 111,131 |
Registration fees | 152,338 |
Shareholder report expenses | 379,934 |
Trustees’ fees and expenses | 19,295 |
Other fees and expenses | 133,667 |
Total expenses | 49,415,884 |
Less: Fee waivers and/or expense reimbursements | |
Fund-level | (30,857 ) |
Class A | (5,278 ) |
Class C | (9 ) |
Administrator Class | (4,455 ) |
Net expenses | 49,375,285 |
Net investment income | 65,040,589 |
Realized and unrealized gains (losses) on investments | |
Net realized gains (losses) on | |
Unaffiliated securities | $259,509,950 |
Affiliated securities | (13,739,446 ) |
Written options | 8,215,024 |
Net realized gains on investments | 253,985,528 |
Net change in unrealized gains (losses) on | |
Unaffiliated securities | 765,834,738 |
Affiliated securities | 75,623,249 |
Written options | (436,347 ) |
Net change in unrealized gains (losses) on investments | 841,021,640 |
Net realized and unrealized gains (losses) on investments | 1,095,007,168 |
Net increase in net assets resulting from operations | $1,160,047,757 |
Year ended March 31, 2024 | Year ended March 31, 2023 | |||
Operations | ||||
Net investment income | $65,040,589 | $59,055,638 | ||
Net realized gains on investments | 253,985,528 | 14,005,466 | ||
Net change in unrealized gains (losses) on investments | 841,021,640 | (492,996,900 ) | ||
Net increase (decrease) in net assets resulting from operations | 1,160,047,757 | (419,935,796 ) | ||
Distributions to shareholders from | ||||
Net investment income and net realized gains | ||||
Class A | (15,641,507 ) | (42,591,589 ) | ||
Class C | (86,765 ) | (463,826 ) | ||
Class R | 0 1 | (726,448 ) | ||
Class R6 | (52,465,865 ) | (100,176,931 ) | ||
Administrator Class | (2,337,336 ) | (6,550,499 ) | ||
Institutional Class | (59,235,312 ) | (155,567,068 ) | ||
Total distributions to shareholders | (129,766,785 ) | (306,076,361 ) | ||
Capital share transactions | Shares | Shares | ||
Proceeds from shares sold | ||||
Class A | 3,353,477 | 126,333,088 | 3,144,073 | 115,444,516 |
Class C | 1,545 | 50,636 | 8,201 | 261,543 |
Class R | 23,411 1 | 838,700 1 | 77,769 | 2,911,756 |
Class R6 | 18,425,245 | 714,955,626 | 10,101,086 | 381,018,452 |
Administrator Class | 434,619 | 16,752,122 | 403,179 | 15,229,744 |
Institutional Class | 14,408,302 | 559,097,838 | 22,900,867 | 864,224,769 |
1,418,028,010 | 1,379,090,780 | |||
Reinvestment of distributions | ||||
Class A | 372,630 | 14,366,027 | 1,122,650 | 39,439,381 |
Class C | 2,620 | 86,729 | 14,894 | 457,404 |
Class R | 0 1 | 0 1 | 20,361 | 726,448 |
Class R6 | 1,110,921 | 44,335,106 | 2,638,058 | 95,564,223 |
Administrator Class | 58,128 | 2,312,242 | 178,990 | 6,477,362 |
Institutional Class | 1,306,213 | 52,101,206 | 3,335,094 | 120,823,133 |
113,201,310 | 263,487,951 | |||
Payment for shares redeemed | ||||
Class A | (5,740,842 ) | (214,886,910 ) | (3,531,086 ) | (129,875,544 ) |
Class C | (81,391 ) | (2,669,978 ) | (94,383 ) | (3,023,154 ) |
Class R | (12,815 )1 | (455,723 )1 | (96,511 ) | (3,584,025 ) |
Class R6 | (11,977,861 ) | (467,288,743 ) | (9,526,745 ) | (365,341,881 ) |
Administrator Class | (892,507 ) | (34,925,241 ) | (933,530 ) | (35,066,154 ) |
Institutional Class | (29,696,777 ) | (1,145,260,279 ) | (27,975,810 ) | (1,063,646,250 ) |
(1,865,486,874 ) | (1,600,537,008 ) | |||
Year ended March 31, 2024 | Year ended March 31, 2023 | |||
Shares | Shares | |||
Share conversions | ||||
Class A | 378,410 2 | $13,972,673 2 | 0 | $0 |
Class R | (372,456 )2 | (13,972,673 )2 | 0 | 0 |
0 | 0 | |||
Net increase (decrease) in net assets resulting from capital share transactions | (334,257,554 ) | 42,041,723 | ||
Total increase (decrease) in net assets | 696,023,418 | (683,970,434 ) | ||
Net assets | ||||
Beginning of period | 5,232,938,086 | 5,916,908,520 | ||
End of period | $5,928,961,504 | $5,232,938,086 | ||
Year ended March 31 | |||||
Class A | 2024 | 2023 | 2022 | 2021 | 2020 |
Net asset value, beginning of period | $35.59 | $40.81 | $42.37 | $23.39 | $31.74 |
Net investment income | 0.34 1 | 0.29 | 0.07 | 0.14 1 | 0.24 |
Net realized and unrealized gains (losses) on investments | 7.88 | (3.35 ) | 1.07 | 18.98 | (8.00 ) |
Total from investment operations | 8.22 | (3.06 ) | 1.14 | 19.12 | (7.76 ) |
Distributions to shareholders from | |||||
Net investment income | (0.34 ) | (0.25 ) | (0.10 ) | (0.13 ) | (0.28 ) |
Net realized gains | (0.49 ) | (1.91 ) | (2.60 ) | (0.01 ) | (0.31 ) |
Total distributions to shareholders | (0.83 ) | (2.16 ) | (2.70 ) | (0.14 ) | (0.59 ) |
Net asset value, end of period | $42.98 | $35.59 | $40.81 | $42.37 | $23.39 |
Total return2 | 23.35 % | (7.41 )% | 2.56 % | 81.92 % | (25.08 )% |
Ratios to average net assets (annualized) | |||||
Gross expenses | 1.24 % | 1.26 % | 1.24 % | 1.27 % | 1.27 % |
Net expenses | 1.24 % | 1.26 % | 1.24 % | 1.27 % | 1.27 % |
Net investment income | 0.92 % | 0.82 % | 0.17 % | 0.43 % | 0.75 % |
Supplemental data | |||||
Portfolio turnover rate | 21 % | 22 % | 28 % | 40 % | 39 % |
Net assets, end of period (000s omitted) | $800,716 | $721,397 | $797,067 | $797,193 | $381,058 |
1 | Calculated based upon average shares outstanding |
2 | Total return calculations do not include any sales charges. |
Year ended March 31 | |||||
Class C | 2024 | 2023 | 2022 | 2021 | 2020 |
Net asset value, beginning of period | $31.19 | $36.04 | $37.90 | $20.99 | $28.49 |
Net investment income (loss) | 0.06 1 | 0.02 1 | (0.22 )1 | (0.08 )1 | (0.01 )1 |
Net realized and unrealized gains (losses) on investments | 6.87 | (2.96 ) | 0.96 | 17.00 | (7.18 ) |
Total from investment operations | 6.93 | (2.94 ) | 0.74 | 16.92 | (7.19 ) |
Distributions to shareholders from | |||||
Net realized gains | (0.49 ) | (1.91 ) | (2.60 ) | (0.01 ) | (0.31 ) |
Net asset value, end of period | $37.63 | $31.19 | $36.04 | $37.90 | $20.99 |
Total return2 | 22.48 % | (8.11 )% | 1.79 % | 80.71 % | (25.65 )% |
Ratios to average net assets (annualized) | |||||
Gross expenses | 1.98 % | 2.01 % | 1.99 % | 2.01 % | 2.02 % |
Net expenses | 1.98 % | 2.01 % | 1.99 % | 2.01 % | 2.02 % |
Net investment income (loss) | 0.19 % | 0.06 % | (0.58 )% | (0.29 )% | (0.04 )% |
Supplemental data | |||||
Portfolio turnover rate | 21 % | 22 % | 28 % | 40 % | 39 % |
Net assets, end of period (000s omitted) | $5,680 | $7,116 | $10,792 | $14,063 | $11,419 |
1 | Calculated based upon average shares outstanding |
2 | Total return calculations do not include any sales charges. |
Year ended March 31 | |||||
Class R6 | 2024 | 2023 | 2022 | 2021 | 2020 |
Net asset value, beginning of period | $36.67 | $41.98 | $43.51 | $24.00 | $32.55 |
Net investment income | 0.52 1 | 0.46 | 0.26 1 | 0.28 | 0.37 |
Net realized and unrealized gains (losses) on investments | 8.11 | (3.45 ) | 1.10 | 19.49 | (8.17 ) |
Total from investment operations | 8.63 | (2.99 ) | 1.36 | 19.77 | (7.80 ) |
Distributions to shareholders from | |||||
Net investment income | (0.52 ) | (0.41 ) | (0.29 ) | (0.25 ) | (0.44 ) |
Net realized gains | (0.49 ) | (1.91 ) | (2.60 ) | (0.01 ) | (0.31 ) |
Total distributions to shareholders | (1.01 ) | (2.32 ) | (2.89 ) | (0.26 ) | (0.75 ) |
Net asset value, end of period | $44.29 | $36.67 | $41.98 | $43.51 | $24.00 |
Total return | 23.88 % | (7.02 )% | 2.99 % | 82.77 % | (24.78 )% |
Ratios to average net assets (annualized) | |||||
Gross expenses | 0.82 % | 0.83 % | 0.81 % | 0.84 % | 0.84 % |
Net expenses | 0.82 % | 0.83 % | 0.81 % | 0.84 % | 0.84 % |
Net investment income | 1.34 % | 1.25 % | 0.59 % | 0.84 % | 1.12 % |
Supplemental data | |||||
Portfolio turnover rate | 21 % | 22 % | 28 % | 40 % | 39 % |
Net assets, end of period (000s omitted) | $2,338,678 | $1,659,115 | $1,764,529 | $1,598,341 | $580,535 |
1 | Calculated based upon average shares outstanding |
Year ended March 31 | |||||
Administrator Class | 2024 | 2023 | 2022 | 2021 | 2020 |
Net asset value, beginning of period | $36.67 | $41.96 | $43.50 | $24.00 | $32.55 |
Net investment income | 0.39 1 | 0.35 1 | 0.11 1 | 0.16 1 | 0.26 1 |
Net realized and unrealized gains (losses) on investments | 8.10 | (3.46 ) | 1.09 | 19.48 | (8.18 ) |
Total from investment operations | 8.49 | (3.11 ) | 1.20 | 19.64 | (7.92 ) |
Distributions to shareholders from | |||||
Net investment income | (0.39 ) | (0.27 ) | (0.14 ) | (0.13 ) | (0.32 ) |
Net realized gains | (0.49 ) | (1.91 ) | (2.60 ) | (0.01 ) | (0.31 ) |
Total distributions to shareholders | (0.88 ) | (2.18 ) | (2.74 ) | (0.14 ) | (0.63 ) |
Net asset value, end of period | $44.28 | $36.67 | $41.96 | $43.50 | $24.00 |
Total return | 23.47 % | (7.33 )% | 2.62 % | 82.13 % | (25.03 )% |
Ratios to average net assets (annualized) | |||||
Gross expenses | 1.16 % | 1.17 % | 1.16 % | 1.19 % | 1.19 % |
Net expenses | 1.16 % | 1.17 % | 1.16 % | 1.18 % | 1.19 % |
Net investment income | 1.00 % | 0.91 % | 0.26 % | 0.51 % | 0.79 % |
Supplemental data | |||||
Portfolio turnover rate | 21 % | 22 % | 28 % | 40 % | 39 % |
Net assets, end of period (000s omitted) | $110,130 | $105,846 | $135,870 | $196,801 | $105,286 |
1 | Calculated based upon average shares outstanding |
Year ended March 31 | |||||
Institutional Class | 2024 | 2023 | 2022 | 2021 | 2020 |
Net asset value, beginning of period | $36.68 | $41.98 | $43.52 | $24.01 | $32.56 |
Net investment income | 0.48 1 | 0.44 | 0.22 1 | 0.25 1 | 0.31 |
Net realized and unrealized gains (losses) on investments | 8.11 | (3.46 ) | 1.08 | 19.50 | (8.14 ) |
Total from investment operations | 8.59 | (3.02 ) | 1.30 | 19.75 | (7.83 ) |
Distributions to shareholders from | |||||
Net investment income | (0.48 ) | (0.37 ) | (0.24 ) | (0.23 ) | (0.41 ) |
Net realized gains | (0.49 ) | (1.91 ) | (2.60 ) | (0.01 ) | (0.31 ) |
Total distributions to shareholders | (0.97 ) | (2.28 ) | (2.84 ) | (0.24 ) | (0.72 ) |
Net asset value, end of period | $44.30 | $36.68 | $41.98 | $43.52 | $24.01 |
Total return | 23.77 % | (7.11 )% | 2.87 % | 82.59 % | (24.85 )% |
Ratios to average net assets (annualized) | |||||
Gross expenses | 0.92 % | 0.93 % | 0.91 % | 0.94 % | 0.94 % |
Net expenses | 0.92 % | 0.93 % | 0.91 % | 0.93 % | 0.94 % |
Net investment income | 1.25 % | 1.14 % | 0.49 % | 0.77 % | 1.07 % |
Supplemental data | |||||
Portfolio turnover rate | 21 % | 22 % | 28 % | 40 % | 39 % |
Net assets, end of period (000s omitted) | $2,673,757 | $2,726,372 | $3,193,721 | $3,102,741 | $1,465,398 |
1 | Calculated based upon average shares outstanding |
Gross unrealized gains | $1,784,032,844 |
Gross unrealized losses | (425,460,162 ) |
Net unrealized gains | $1,358,572,682 |
Quoted prices (Level 1) | Other significant observable inputs (Level 2) | Significant unobservable inputs (Level 3) | Total | |
Assets | ||||
Investments in: | ||||
Common stocks | ||||
Communication services | $37,900,934 | $0 | $0 | $37,900,934 |
Consumer discretionary | 290,232,637 | 0 | 0 | 290,232,637 |
Consumer staples | 528,059,860 | 0 | 0 | 528,059,860 |
Energy | 398,884,875 | 0 | 0 | 398,884,875 |
Financials | 1,050,398,833 | 85,479,041 | 0 | 1,135,877,874 |
Health care | 254,976,055 | 0 | 0 | 254,976,055 |
Industrials | 1,696,342,078 | 0 | 0 | 1,696,342,078 |
Information technology | 272,658,189 | 0 | 0 | 272,658,189 |
Materials | 943,993,742 | 0 | 0 | 943,993,742 |
Real estate | 58,831,229 | 0 | 0 | 58,831,229 |
Utilities | 53,611,540 | 0 | 0 | 53,611,540 |
Investment companies | 39,702,500 | 0 | 0 | 39,702,500 |
Rights | ||||
Financials | 0 | 0 | 0 | 0 |
Short-term investments | ||||
Investment companies | 214,698,626 | 0 | 0 | 214,698,626 |
Total assets | $5,840,291,098 | $85,479,041 | $0 | $5,925,770,139 |
Liabilities | ||||
Written options | $1,811,625 | $1 | $0 | $1,811,626 |
Total liabilities | $1,811,625 | $1 | $0 | $1,811,626 |
Average daily net assets | Management fee |
First $500 million | 0.850 % |
Next $500 million | 0.825 |
Next $1 billion | 0.800 |
Next $1 billion | 0.775 |
Next $1 billion | 0.750 |
Next $1 billion | 0.730 |
Next $5 billion | 0.720 |
Over $10 billion | 0.710 |
Class-level administration fee | |
Class A | 0.20 % |
Class C | 0.20 |
Class R | 0.21 |
Class R6 | 0.03 |
Administrator Class | 0.13 |
Institutional Class | 0.13 |
EXPENSE RATIO CAPS | |
Class A | 1.31 % |
Class C | 2.06 |
Class R6 | 0.89 |
Administrator Class | 1.20 |
Institutional Class | 0.94 |
Counterparty | Gross amounts of liabilities in the Statement of Assets and Liabilities | Amounts subject to netting agreements | Collateral pledged1 | Net amount of liabilities |
Bank of America Securities, Inc. | $1,811,626 | $0 | $(1,811,626 ) | $0 |
1 | Collateral pledged within this table is limited to the collateral for the net transaction with the counterparty. |
Year ended March 31 | ||
2024 | 2023 | |
Ordinary income | $69,614,745 | $59,275,487 |
Long-term capital gain | 60,152,040 | 246,800,875 |
Undistributed ordinary income | Undistributed long-term gain | Unrealized gains |
$31,801,995 | $161,530,253 | $1,358,572,682 |
Allspring Funds Trust:

March 31, 2024.
Name and year of birth | Position held and length of service* | Principal occupations during past five years or longer | Current other public company or investment company directorships |
William R. Ebsworth (Born 1957) | Trustee, since 2015 | Retired. From 1984 to 2013, equities analyst, portfolio manager, research director and chief investment officer at Fidelity Management and Research Company in Boston, Tokyo, and Hong Kong, and retired in 2013 as Chief Investment Officer of Fidelity Strategic Advisers, Inc. where he led a team of investment professionals managing client assets. Prior thereto, Board member of Hong Kong Securities Clearing Co., Hong Kong Options Clearing Corp., the Thailand International Fund, Ltd., Fidelity Investments Life Insurance Company, and Empire Fidelity Investments Life Insurance Company. Serves on the Investment Company Institute’s Board of Governors since 2022 and Executive Committee since 2023 as well as the Vice Chairman of the Governing Council of the Independent Directors Council since 2023. Audit Committee Chair and Investment Committee Chair of the Vincent Memorial Hospital Foundation (non-profit organization). Mr. Ebsworth is a CFA charterholder. | N/A |
Jane A. Freeman (Born 1953) | Trustee, since 2015; Chair Liaison, since January 2018# | Retired. From 2012 to 2014 and 1999 to 2008, Chief Financial Officer of Scientific Learning Corporation. From 2008 to 2012, Ms. Freeman provided consulting services related to strategic business projects. Prior to 1999, Portfolio Manager at Rockefeller & Co. and Scudder, Stevens & Clark. Board member of the Harding Loevner Funds from 1996 to 2014, serving as both Lead Independent Director and chair of the Audit Committee. Board member of the Russell Exchange Traded Funds Trust from 2011 to 2012 and the chair of the Audit Committee. Ms. Freeman is also an inactive Chartered Financial Analyst. | N/A |
Isaiah Harris, Jr. (Born 1952) | Trustee, since 2009; Audit Committee Chair, since 2019 | Retired. Member of the Advisory Board of CEF of East Central Florida. Chairman of the Board of CIGNA Corporation from 2009 to 2021, and Director from 2005 to 2008. From 2003 to 2011, Director of Deluxe Corporation. Prior thereto, President and CEO of BellSouth Advertising and Publishing Corp. from 2005 to 2007, President and CEO of BellSouth Enterprises from 2004 to 2005 and President of BellSouth Consumer Services from 2000 to 2003. Emeritus member of the Iowa State University Foundation Board of Governors. Emeritus Member of the Advisory board of Iowa State University School of Business. Advisory Board Member, Palm Harbor Academy (private school). Advisory Board Member, Fellowship of Christian Athletes. Mr. Harris is a certified public accountant (inactive status). | N/A |
David F. Larcker (Born 1950) | Trustee, since 2009 | Distinguished Visiting Fellow at the Hoover Institution since 2022. James Irvin Miller Professor of Accounting at the Graduate School of Business (Emeritus), Stanford University, Director of the Corporate Governance Research Initiative and Senior Faculty of The Rock Center for Corporate Governance since 2006. From 2005 to 2008, Professor of Accounting at the Graduate School of Business, Stanford University. Prior thereto, Ernst & Young Professor of Accounting at The Wharton School, University of Pennsylvania from 1985 to 2005. | N/A |
Olivia S. Mitchell (Born 1953) | Trustee, since 2006; Nominating and Governance Committee Chair, since 2018 | International Foundation of Employee Benefit Plans Professor since 1993, Wharton School of the University of Pennsylvania. Director of Wharton’s Pension Research Council and Boettner Center on Pensions & Retirement Research, and Research Associate at the National Bureau of Economic Research. Previously taught at Cornell University from 1978 to 1993. | N/A |
Name and year of birth | Position held and length of service* | Principal occupations during past five years or longer | Current other public company or investment company directorships |
Timothy J. Penny (Born 1951) | Trustee, since 1996; Chair, since 2018 | President and Chief Executive Officer of Southern Minnesota Initiative Foundation, a non-profit organization, since 2007. Vice Chair of the Economic Club of Minnesota, since 2007. Co-Chair of the Committee for a Responsible Federal Budget, since 1995. Member of the Board of Trustees of NorthStar Education Finance, Inc., a non-profit organization, from 2007-2022. Senior Fellow of the University of Minnesota Humphrey Institute from 1995 to 2017. | N/A |
James G. Polisson (Born 1959) | Trustee, since 2018 | Retired. Chief Marketing Officer, Source (ETF) UK Services, Ltd, from 2015 to 2017. From 2012 to 2015, Principal of The Polisson Group, LLC, a management consulting, corporate advisory and principal investing company. Chief Executive Officer and Managing Director at Russell Investments, Global Exchange Traded Funds from 2010 to 2012. Managing Director of Barclays Global Investors from 1998 to 2010 and Global Chief Marketing Officer for iShares and Barclays Global Investors from 2000 to 2010. Trustee of the San Francisco Mechanics’ Institute, a non- profit organization, from 2013 to 2015. Board member of the Russell Exchange Traded Fund Trust from 2011 to 2012. Director of Barclays Global Investors Holdings Deutschland GmbH from 2006 to 2009. Mr. Polisson is an attorney and has a retired status with the Massachusetts and District of Columbia Bar Associations. | N/A |
Pamela Wheelock (Born 1959) | Trustee, since January 2020; previously Trustee from January 2018 to July 2019# | Retired. Executive and Senior Financial leadership positions in the public, private and nonprofit sectors. Interim President and CEO, McKnight Foundation, 2020. Interim Commissioner, Minnesota Department of Human Services, 2019. Chief Operating Officer, Twin Cities Habitat for Humanity, 2017-2019. Vice President for University Services, University of Minnesota, 2012- 2016. Interim President and CEO, Blue Cross and Blue Shield of Minnesota, 2011-2012. Executive Vice-President and Chief Financial Officer, Minnesota Wild, 2002-2008. Commissioner, Minnesota Department of Finance, 1999-2002. Chair of the Board of Directors of Destination Medical Center Corporation. Board member of the Minnesota Wild Foundation. | N/A |
Name and year of birth | Position held and length of service | Principal occupations during past five years or longer |
Andrew Owen (Born 1960) | President, since 2017 | President and Chief Executive Officer of Allspring Funds Management, LLC since 2017 and Head of Global Fund Governance of Allspring Global Investments since 2022. Prior thereto, co-president of Galliard Capital Management, LLC, an affiliate of Allspring Funds Management, LLC, from 2019 to 2022 and Head of Affiliated Managers, Allspring Global Investments, from 2014 to 2019 and Executive Vice President responsible for marketing, investments and product development for Allspring Funds Management, LLC, from 2009 to 2014. |
Jeremy DePalma (Born 1974) | Treasurer, since 2012 (for certain funds in the Fund Complex); since 2021 (for the remaining funds in the Complex) | Senior Vice President of Allspring Funds Management, LLC since 2009. Senior Vice President of Evergreen Investment Management Company, LLC from 2008 to 2010 and head of the Fund Reporting and Control Team within Fund Administration from 2005 to 2010. |
Christopher Baker (Born 1976) | Chief Compliance Officer, since 2022 | Global Chief Compliance Officer for Allspring Global Investments since 2022. Prior thereto, Chief Compliance Officer for State Street Global Advisors from 2018 to 2021. Senior Compliance Officer for the State Street divisions of Alternative Investment Solutions, Sector Solutions, and Global Marketing from 2015 to 2018. From 2010 to 2015 Vice President, Global Head of Investment and Marketing Compliance for State Street Global Advisors. |
Matthew Prasse (Born 1983) | Chief Legal Officer, since 2022; Secretary, since 2021 | Senior Counsel of the Allspring Legal Department since 2021. Senior Counsel of the Wells Fargo Legal Department from 2018 to 2021. Previously, Counsel for Barings LLC from 2015 to 2018. Prior to joining Barings, Associate at Morgan, Lewis & Bockius LLP from 2008 to 2015. |

P.O. Box 219967
Kansas City, MO 64121-9967

AR0637 03-24
2 | |
6 | |
10 | |
11 | |
13 | |
14 | |
15 | |
16 | |
20 | |
24 | |
25 |

Allspring Funds

President
Allspring Funds
Notice to Shareholders |
Beginning in July 2024, the Fund will be required by the Securities and Exchange Commission to send shareholders a paper copy of a new tailored shareholder report in place of the full shareholder report that you are now receiving. The tailored shareholder report will contain concise information about the Fund, including certain expense and performance information and fund statistics. If you wish to receive this new tailored shareholder report electronically, please follow the instructions on the back cover of this report. |
Other information that is currently included in the shareholder report, such as the Fund’s financial statements, will be available online and upon request, free of charge, in paper or electronic format. |
Investment objective | The Fund seeks total return, consisting of current income and capital appreciation. |
Manager | Allspring Funds Management, LLC |
Subadviser | Allspring Global Investments, LLC |
Portfolio managers | Kent Newcomb, CFA, Andy Smith, CFA†, Jack Spudich, CFA |
Average annual total returns (%) as of March 31, 2024 | |||||||||
Including sales charge | Excluding sales charge | Expense ratios1 (%) | |||||||
Inception date | 1 year | 5 year | 10 year | 1 year | 5 year | 10 year | Gross | Net2 | |
Class A (EVUAX) | 1-4-1994 | -4.08 | 3.96 | 6.04 | 1.77 | 5.19 | 6.67 | 1.14 | 1.04 |
Class C (EVUCX) | 9-2-1994 | -0.02 | 4.40 | 6.02 | 0.98 | 4.40 | 6.02 | 1.89 | 1.79 |
Administrator Class (EVUDX) | 7-30-2010 | – | – | – | 1.87 | 5.33 | 6.83 | 1.07 | 0.92 |
Institutional Class (EVUYX) | 2-28-1994 | – | – | – | 2.06 | 5.53 | 7.01 | 0.82 | 0.72 |
S&P 500 Utilities Index3 | – | – | – | – | 0.42 | 5.87 | 8.35 | – | – |
S&P 500 Index4 | – | – | – | – | 29.88 | 15.05 | 12.96 | – | – |
1 | Reflects the expense ratios as stated in the most recent prospectuses. The expense ratios shown are subject to change and may differ from the annualized expense ratios shown in the Financial Highlights of this report. |
2 | The manager has contractually committed through July 31, 2024, to waive fees and/or reimburse expenses to the extent necessary to cap total annual fund operating expenses after fee waivers at 1.04% for Class A, 1.79% for Class C, 0.92% for Administrator Class and 0.72% for Institutional Class. Brokerage commissions, stamp duty fees, interest, taxes, acquired fund fees and expenses (if any), and extraordinary expenses are excluded from the expense caps. Prior to or after the commitment expiration date, the caps may be increased or the commitment to maintain the caps may be terminated only with the approval of the Board of Trustees. Without these caps, the Fund’s returns would have been lower. The expense ratio paid by an investor is the net expense ratio (the total annual fund operating expenses after fee waivers) as stated in the prospectuses. |
3 | The S&P 500 Utilities Index is a market-value-weighted index that measures the performance of all stocks within the utilities sector of the S&P 500 Index. You cannot invest directly in an index. |
4 | The S&P 500 Index consists of 500 stocks chosen for market size, liquidity, and industry group representation. It is a market-value-weighted index with each stock’s weight in the index proportionate to its market value. You cannot invest directly in an index. |
† | Mr. Smith became a portfolio manager of the Fund on January 24, 2024. |
CFA® and Chartered Financial Analyst® are trademarks owned by CFA Institute. | |
Growth of $10,000 investment as of March 31, 20241 |

1 | The chart compares the performance of Class A shares for the most recent ten years with the S&P 500 Utilities Index and S&P 500 Index. The chart assumes a hypothetical investment of $10,000 in Class A shares and reflects all operating expenses and assumes the maximum initial sales charge of 5.75%. |
Ten largest holdings (%) as of March 31, 20241 | |
NextEra Energy, Inc. | 11.08 |
Southern Co. | 5.39 |
Constellation Energy Corp. | 5.20 |
Sempra | 4.79 |
Duke Energy Corp. | 4.74 |
American Electric Power Co., Inc. | 4.49 |
DTE Energy Co. | 3.82 |
CMS Energy Corp. | 3.36 |
Exelon Corp. | 3.35 |
Atmos Energy Corp. | 3.32 |
1 | Figures represent the percentage of the Fund’s net assets. Holdings are subject to change and may have changed since the date specified. |
Sector allocation as of March 31, 20241 |
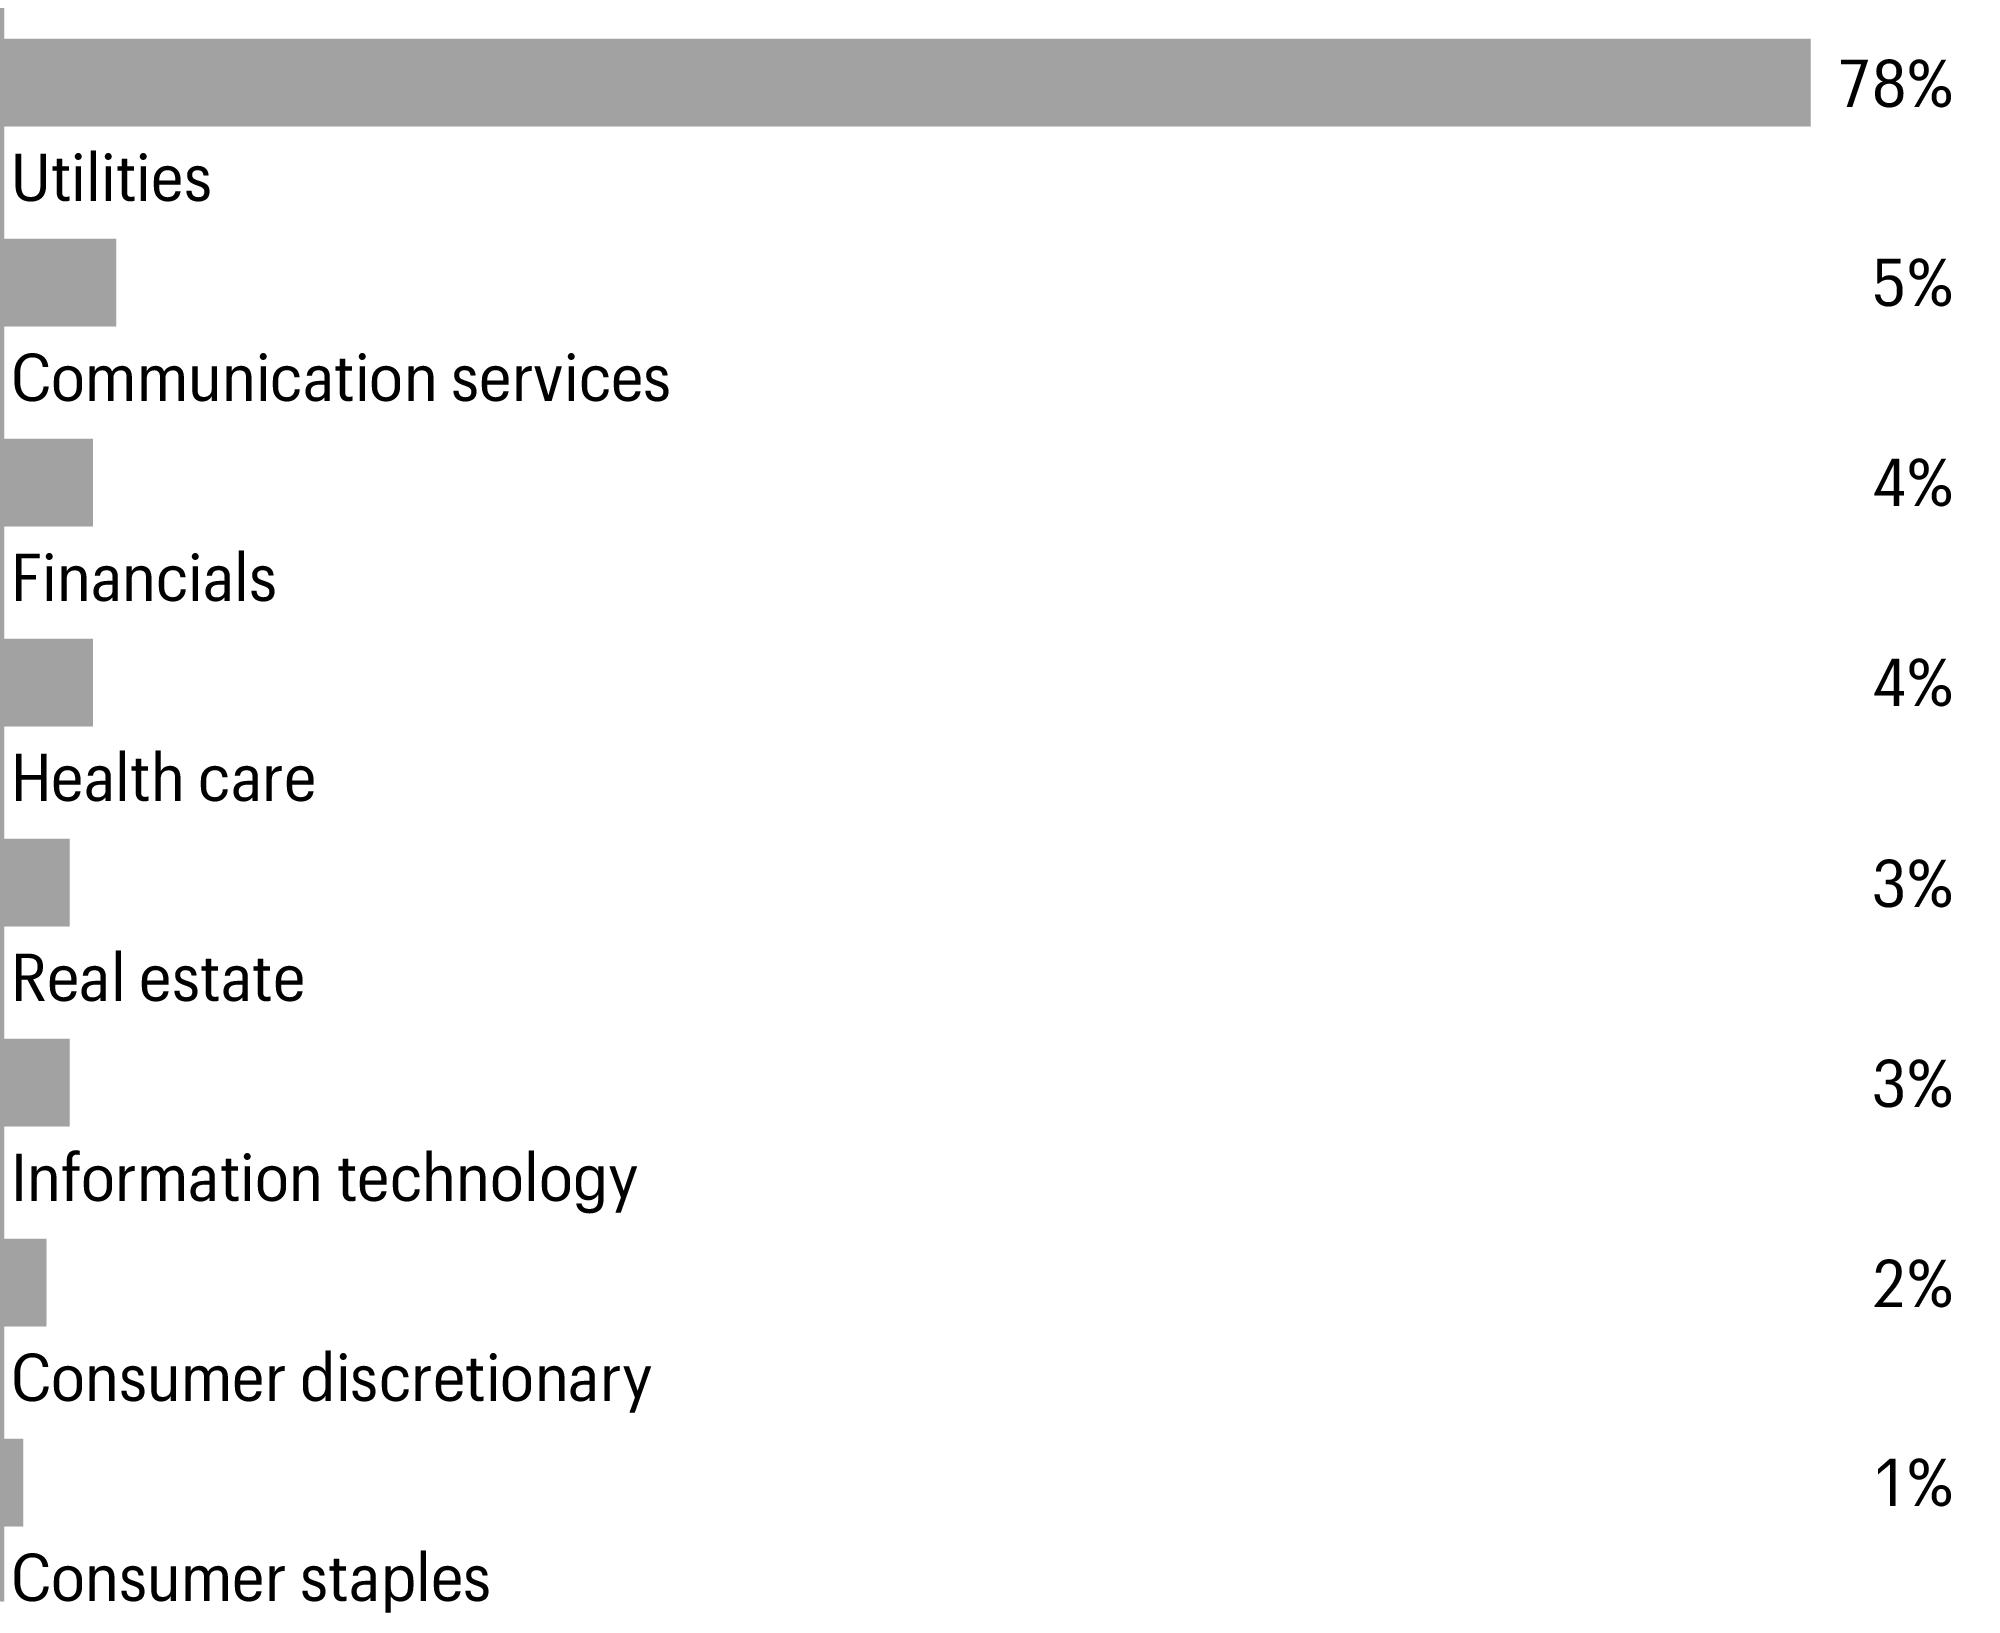
1 | Figures represent the percentage of the Fund’s long-term investments. Allocations are subject to change and may have changed since the date specified. |
Beginning account value 10-1-2023 | Ending account value 3-31-2024 | Expenses paid during the period1 | Annualized net expense ratio | |
Class A | ||||
Actual | $1,000.00 | $1,126.40 | $5.18 | 0.98 % |
Hypothetical (5% return before expenses) | $1,000.00 | $1,019.99 | $4.92 | 0.98 % |
Class C | ||||
Actual | $1,000.00 | $1,122.28 | $9.45 | 1.79 % |
Hypothetical (5% return before expenses) | $1,000.00 | $1,015.96 | $8.97 | 1.79 % |
Administrator Class | ||||
Actual | $1,000.00 | $1,127.24 | $4.87 | 0.92 % |
Hypothetical (5% return before expenses) | $1,000.00 | $1,020.29 | $4.62 | 0.92 % |
Institutional Class | ||||
Actual | $1,000.00 | $1,127.67 | $3.81 | 0.72 % |
Hypothetical (5% return before expenses) | $1,000.00 | $1,021.28 | $3.62 | 0.72 % |
1 | Expenses paid is equal to the annualized net expense ratio of each class multiplied by the average account value over the period, multiplied by 182 divided by 366 (to reflect the one-half-year period). |
Shares | Value | |||||
Common stocks: 98.62% | ||||||
Communication services: 5.30% | ||||||
Diversified telecommunication services: 2.71% | ||||||
Verizon Communications, Inc. | 203,563 | $8,541,503 | ||||
Media: 2.59% | ||||||
Comcast Corp. Class A | 188,988 | 8,192,630 | ||||
Consumer discretionary: 1.91% | ||||||
Specialty retail: 1.91% | ||||||
Home Depot, Inc. | 15,715 | 6,028,274 | ||||
Consumer staples: 1.24% | ||||||
Consumer staples distribution & retail : 1.24% | ||||||
Target Corp. | 22,069 | 3,910,848 | ||||
Financials: 3.78% | ||||||
Financial services: 3.78% | ||||||
Mastercard, Inc. Class A | 12,533 | 6,035,517 | ||||
Visa, Inc. Class A | 21,235 | 5,926,264 | ||||
11,961,781 | ||||||
Health care: 3.54% | ||||||
Biotechnology: 1.82% | ||||||
Amgen, Inc. | 20,226 | 5,750,656 | ||||
Health care providers & services: 1.72% | ||||||
UnitedHealth Group, Inc. | 10,974 | 5,428,838 | ||||
Information technology: 2.61% | ||||||
Communications equipment: 2.61% | ||||||
Cisco Systems, Inc. | 165,199 | 8,245,082 | ||||
Real estate: 2.83% | ||||||
Specialized REITs : 2.83% | ||||||
American Tower Corp. | 45,216 | 8,934,230 | ||||
Utilities: 77.41% | ||||||
Electric utilities: 44.47% | ||||||
Alliant Energy Corp. | 124,985 | 6,299,244 | ||||
American Electric Power Co., Inc. | 164,853 | 14,193,843 | ||||
Constellation Energy Corp. | 88,850 | 16,423,923 | ||||
Duke Energy Corp. | 154,624 | 14,953,687 | ||||
Entergy Corp. | 73,946 | 7,814,613 | ||||
Eversource Energy | 69,109 | 4,130,645 | ||||
Exelon Corp. | 281,434 | 10,573,476 | ||||
FirstEnergy Corp. | 166,523 | 6,431,118 | ||||
NextEra Energy, Inc. | 547,753 | 35,006,894 | ||||
Southern Co. | 237,076 | 17,007,832 | ||||
Xcel Energy, Inc. | 141,622 | 7,612,183 | ||||
140,447,458 | ||||||
Shares | Value | |||||
Gas utilities: 3.32% | ||||||
Atmos Energy Corp. | 88,150 | $10,478,390 | ||||
Multi-utilities: 27.23% | ||||||
Ameren Corp. | 141,152 | 10,439,602 | ||||
CenterPoint Energy, Inc. | 361,174 | 10,289,847 | ||||
CMS Energy Corp. | 175,649 | 10,598,661 | ||||
Dominion Energy, Inc. | 186,455 | 9,171,721 | ||||
DTE Energy Co. | 107,679 | 12,075,123 | ||||
Public Service Enterprise Group, Inc. | 138,290 | 9,235,006 | ||||
Sempra | 210,565 | 15,124,884 | ||||
WEC Energy Group, Inc. | 110,408 | 9,066,705 | ||||
86,001,549 | ||||||
Water utilities: 2.39% | ||||||
American Water Works Co., Inc. | 61,932 | 7,568,710 | ||||
Total common stocks (Cost $201,213,600) | 311,489,949 | |||||
Yield | ||||||
Short-term investments: 1.32% | ||||||
Investment companies: 1.32% | ||||||
Allspring Government Money Market Fund Select Class♠∞ | 5.25 % | 4,173,904 | 4,173,904 | |||
Total short-term investments (Cost $4,173,904) | 4,173,904 | |||||
Total investments in securities (Cost $205,387,504) | 99.94 % | 315,663,853 | ||||
Other assets and liabilities, net | 0.06 | 182,078 | ||||
Total net assets | 100.00 % | $315,845,931 | ||||
♠ | The issuer of the security is an affiliated person of the Fund as defined in the Investment Company Act of 1940. |
∞ | The rate represents the 7-day annualized yield at period end. |
Abbreviations: | |
REIT | Real estate investment trust |
Value, beginning of period | Purchases | Sales proceeds | Net realized gains (losses) | Net change in unrealized gains (losses) | Value, end of period | Shares, end of period | Income from affiliated securities | |
Short-term investments | ||||||||
Allspring Government Money Market Fund Select Class | $3,987,005 | $60,015,703 | $(59,828,804 ) | $0 | $0 | $4,173,904 | 4,173,904 | $234,495 |
Assets | |
Investments in unaffiliated securities, at value (cost $201,213,600) | $311,489,949 |
Investments in affiliated securities, at value (cost $4,173,904) | 4,173,904 |
Cash | 239,979 |
Receivable for dividends | 339,228 |
Receivable for Fund shares sold | 38,193 |
Prepaid expenses and other assets | 53,999 |
Total assets | 316,335,252 |
Liabilities | |
Payable for Fund shares redeemed | 181,153 |
Management fee payable | 121,700 |
Shareholder servicing fee payable | 59,090 |
Administration fees payable | 50,376 |
Distribution fee payable | 1,325 |
Accrued expenses and other liabilities | 75,677 |
Total liabilities | 489,321 |
Total net assets | $315,845,931 |
Net assets consist of | |
Paid-in capital | $202,491,132 |
Total distributable earnings | 113,354,799 |
Total net assets | $315,845,931 |
Computation of net asset value and offering price per share | |
Net assets–Class A | $280,957,223 |
Shares outstanding–Class A1 | 16,448,380 |
Net asset value per share–Class A | $17.08 |
Maximum offering price per share – Class A2 | $18.12 |
Net assets–Class C | $2,155,707 |
Shares outstanding–Class C1 | 125,332 |
Net asset value per share–Class C | $17.20 |
Net assets–Administrator Class | $2,676,122 |
Shares outstanding–Administrator Class1 | 156,350 |
Net asset value per share–Administrator Class | $17.12 |
Net assets–Institutional Class | $30,056,879 |
Shares outstanding–Institutional Class1 | 1,761,918 |
Net asset value per share–Institutional Class | $17.06 |
Investment income | |
Dividends | $10,977,171 |
Income from affiliated securities | 234,495 |
Interest | 115 |
Total investment income | 11,211,781 |
Expenses | |
Management fee | 2,194,079 |
Administration fees | |
Class A | 584,577 |
Class C | 6,022 |
Administrator Class | 6,783 |
Institutional Class | 53,134 |
Shareholder servicing fees | |
Class A | 720,790 |
Class C | 7,392 |
Administrator Class | 13,045 |
Distribution fee | |
Class C | 21,959 |
Custody and accounting fees | 10,005 |
Professional fees | 82,288 |
Registration fees | 66,794 |
Shareholder report expenses | 46,846 |
Trustees’ fees and expenses | 22,751 |
Other fees and expenses | 10,372 |
Total expenses | 3,846,837 |
Less: Fee waivers and/or expense reimbursements | |
Fund-level | (440,931 ) |
Class A | (86,532 ) |
Class C | (44 ) |
Administrator Class | (2,537 ) |
Net expenses | 3,316,793 |
Net investment income | 7,894,988 |
Realized and unrealized gains (losses) on investments | |
Net realized gains on investments | 9,918,152 |
Net change in unrealized gains (losses) on investments | (14,545,679 ) |
Net realized and unrealized gains (losses) on investments | (4,627,527 ) |
Net increase in net assets resulting from operations | $3,267,461 |
Year ended March 31, 2024 | Year ended March 31, 2023 | |||
Operations | ||||
Net investment income | $7,894,988 | $7,633,239 | ||
Net realized gains on investments | 9,918,152 | 5,466,729 | ||
Net change in unrealized gains (losses) on investments | (14,545,679 ) | (51,532,523 ) | ||
Net increase (decrease) in net assets resulting from operations | 3,267,461 | (38,432,555 ) | ||
Distributions to shareholders from | ||||
Net investment income and net realized gains | ||||
Class A | (16,146,446 ) | (34,647,628 ) | ||
Class C | (131,226 ) | (452,433 ) | ||
Administrator Class | (299,643 ) | (746,991 ) | ||
Institutional Class | (2,265,777 ) | (7,988,969 ) | ||
Total distributions to shareholders | (18,843,092 ) | (43,836,021 ) | ||
Capital share transactions | Shares | Shares | ||
Proceeds from shares sold | ||||
Class A | 202,279 | 3,402,327 | 567,314 | 11,393,388 |
Class C | 2,624 | 44,571 | 96,311 | 1,962,630 |
Administrator Class | 21,345 | 371,583 | 110,693 | 2,290,942 |
Institutional Class | 555,197 | 9,331,280 | 1,031,081 | 20,941,432 |
13,149,761 | 36,588,392 | |||
Reinvestment of distributions | ||||
Class A | 919,295 | 15,262,980 | 1,772,009 | 32,801,515 |
Class C | 7,314 | 122,138 | 24,186 | 449,470 |
Administrator Class | 17,956 | 298,875 | 40,151 | 745,417 |
Institutional Class | 135,536 | 2,251,288 | 429,815 | 7,960,567 |
17,935,281 | 41,956,969 | |||
Payment for shares redeemed | ||||
Class A | (2,765,733 ) | (46,583,380 ) | (1,902,224 ) | (36,626,328 ) |
Class C | (118,550 ) | (2,020,306 ) | (97,108 ) | (1,868,400 ) |
Administrator Class | (234,930 ) | (3,856,946 ) | (144,989 ) | (2,765,351 ) |
Institutional Class | (2,642,953 ) | (45,114,653 ) | (1,436,434 ) | (27,459,910 ) |
(97,575,285 ) | (68,719,989 ) | |||
Net increase (decrease) in net assets resulting from capital share transactions | (66,490,243 ) | 9,825,372 | ||
Total decrease in net assets | (82,065,874 ) | (72,443,204 ) | ||
Net assets | ||||
Beginning of period | 397,911,805 | 470,355,009 | ||
End of period | $315,845,931 | $397,911,805 | ||
Year ended March 31 | |||||
Class A | 2024 | 2023 | 2022 | 2021 | 2020 |
Net asset value, beginning of period | $17.77 | $21.48 | $21.47 | $20.19 | $24.03 |
Net investment income | 0.39 1 | 0.33 | 0.33 | 0.34 | 0.34 |
Net realized and unrealized gains (losses) on investments | (0.12 ) | (2.03 ) | 2.40 | 3.82 | 0.02 |
Total from investment operations | 0.27 | (1.70 ) | 2.73 | 4.16 | 0.36 |
Distributions to shareholders from | |||||
Net investment income | (0.39 ) | (0.33 ) | (0.32 ) | (0.35 ) | (0.34 ) |
Net realized gains | (0.57 ) | (1.68 ) | (2.40 ) | (2.53 ) | (3.86 ) |
Total distributions to shareholders | (0.96 ) | (2.01 ) | (2.72 ) | (2.88 ) | (4.20 ) |
Net asset value, end of period | $17.08 | $17.77 | $21.48 | $21.47 | $20.19 |
Total return2 | 1.77 % | (8.15 )% | 13.62 % | 21.23 % | 0.04 % |
Ratios to average net assets (annualized) | |||||
Gross expenses | 1.17 % | 1.15 % | 1.16 % | 1.17 % | 1.17 % |
Net expenses | 1.01 % | 1.04 % | 1.04 % | 1.04 % | 1.09 % |
Net investment income | 2.31 % | 1.69 % | 1.52 % | 1.58 % | 1.42 % |
Supplemental data | |||||
Portfolio turnover rate | 1 % | 4 % | 11 % | 20 % | 49 % |
Net assets, end of period (000s omitted) | $280,957 | $321,507 | $379,164 | $363,540 | $319,200 |
1 | Calculated based upon average shares outstanding |
2 | Total return calculations do not include any sales charges. |
Year ended March 31 | |||||
Class C | 2024 | 2023 | 2022 | 2021 | 2020 |
Net asset value, beginning of period | $17.88 | $21.60 | $21.57 | $20.25 | $24.06 |
Net investment income | 0.26 1 | 0.19 1 | 0.17 1 | 0.17 1 | 0.16 1 |
Net realized and unrealized gains (losses) on investments | (0.12 ) | (2.05 ) | 2.40 | 3.85 | 0.01 |
Total from investment operations | 0.14 | (1.86 ) | 2.57 | 4.02 | 0.17 |
Distributions to shareholders from | |||||
Net investment income | (0.25 ) | (0.18 ) | (0.14 ) | (0.17 ) | (0.12 ) |
Net realized gains | (0.57 ) | (1.68 ) | (2.40 ) | (2.53 ) | (3.86 ) |
Total distributions to shareholders | (0.82 ) | (1.86 ) | (2.54 ) | (2.70 ) | (3.98 ) |
Net asset value, end of period | $17.20 | $17.88 | $21.60 | $21.57 | $20.25 |
Total return2 | 0.98 % | (8.83 )% | 12.75 % | 20.34 % | (0.73 )% |
Ratios to average net assets (annualized) | |||||
Gross expenses | 1.91 % | 1.89 % | 1.90 % | 1.91 % | 1.92 % |
Net expenses | 1.79 % | 1.80 % | 1.80 % | 1.80 % | 1.86 % |
Net investment income | 1.55 % | 0.94 % | 0.77 % | 0.80 % | 0.63 % |
Supplemental data | |||||
Portfolio turnover rate | 1 % | 4 % | 11 % | 20 % | 49 % |
Net assets, end of period (000s omitted) | $2,156 | $4,183 | $4,548 | $6,379 | $10,274 |
1 | Calculated based upon average shares outstanding |
2 | Total return calculations do not include any sales charges. |
Year ended March 31 | |||||
Administrator Class | 2024 | 2023 | 2022 | 2021 | 2020 |
Net asset value, beginning of period | $17.81 | $21.52 | $21.51 | $20.22 | $24.05 |
Net investment income | 0.41 1 | 0.35 | 0.37 | 0.37 | 0.36 |
Net realized and unrealized gains (losses) on investments | (0.12 ) | (2.03 ) | 2.39 | 3.83 | 0.04 |
Total from investment operations | 0.29 | (1.68 ) | 2.76 | 4.20 | 0.40 |
Distributions to shareholders from | |||||
Net investment income | (0.41 ) | (0.35 ) | (0.35 ) | (0.38 ) | (0.37 ) |
Net realized gains | (0.57 ) | (1.68 ) | (2.40 ) | (2.53 ) | (3.86 ) |
Total distributions to shareholders | (0.98 ) | (2.03 ) | (2.75 ) | (2.91 ) | (4.23 ) |
Net asset value, end of period | $17.12 | $17.81 | $21.52 | $21.51 | $20.22 |
Total return | 1.87 % | (8.01 )% | 13.76 % | 21.39 % | 0.20 % |
Ratios to average net assets (annualized) | |||||
Gross expenses | 1.10 % | 1.07 % | 1.08 % | 1.09 % | 1.09 % |
Net expenses | 0.92 % | 0.92 % | 0.92 % | 0.92 % | 0.94 % |
Net investment income | 2.45 % | 1.82 % | 1.63 % | 1.70 % | 1.49 % |
Supplemental data | |||||
Portfolio turnover rate | 1 % | 4 % | 11 % | 20 % | 49 % |
Net assets, end of period (000s omitted) | $2,676 | $6,267 | $7,447 | $3,054 | $2,449 |
1 | Calculated based upon average shares outstanding |
Year ended March 31 | |||||
Institutional Class | 2024 | 2023 | 2022 | 2021 | 2020 |
Net asset value, beginning of period | $17.76 | $21.46 | $21.46 | $20.18 | $24.01 |
Net investment income | 0.44 1 | 0.39 1 | 0.40 | 0.43 | 0.44 |
Net realized and unrealized gains (losses) on investments | (0.12 ) | (2.02 ) | 2.39 | 3.80 | 0.01 |
Total from investment operations | 0.32 | (1.63 ) | 2.79 | 4.23 | 0.45 |
Distributions to shareholders from | |||||
Net investment income | (0.45 ) | (0.39 ) | (0.39 ) | (0.42 ) | (0.42 ) |
Net realized gains | (0.57 ) | (1.68 ) | (2.40 ) | (2.53 ) | (3.86 ) |
Total distributions to shareholders | (1.02 ) | (2.07 ) | (2.79 ) | (2.95 ) | (4.28 ) |
Net asset value, end of period | $17.06 | $17.76 | $21.46 | $21.46 | $20.18 |
Total return | 2.06 % | (7.80 )% | 13.94 % | 21.62 % | 0.42 % |
Ratios to average net assets (annualized) | |||||
Gross expenses | 0.85 % | 0.82 % | 0.83 % | 0.84 % | 0.84 % |
Net expenses | 0.72 % | 0.72 % | 0.72 % | 0.72 % | 0.75 % |
Net investment income | 2.60 % | 2.02 % | 1.84 % | 1.92 % | 1.76 % |
Supplemental data | |||||
Portfolio turnover rate | 1 % | 4 % | 11 % | 20 % | 49 % |
Net assets, end of period (000s omitted) | $30,057 | $65,955 | $79,196 | $65,644 | $45,888 |
1 | Calculated based upon average shares outstanding |
Gross unrealized gains | $116,142,760 |
Gross unrealized losses | (5,889,145 ) |
Net unrealized gains | $110,253,615 |
Quoted prices (Level 1) | Other significant observable inputs (Level 2) | Significant unobservable inputs (Level 3) | Total | |
Assets | ||||
Investments in: | ||||
Common stocks | ||||
Communication services | $16,734,133 | $0 | $0 | $16,734,133 |
Consumer discretionary | 6,028,274 | 0 | 0 | 6,028,274 |
Consumer staples | 3,910,848 | 0 | 0 | 3,910,848 |
Financials | 11,961,781 | 0 | 0 | 11,961,781 |
Health care | 11,179,494 | 0 | 0 | 11,179,494 |
Information technology | 8,245,082 | 0 | 0 | 8,245,082 |
Real estate | 8,934,230 | 0 | 0 | 8,934,230 |
Utilities | 244,496,107 | 0 | 0 | 244,496,107 |
Short-term investments | ||||
Investment companies | 4,173,904 | 0 | 0 | 4,173,904 |
Total assets | $315,663,853 | $0 | $0 | $315,663,853 |
Average daily net assets | Management fee |
First $500 million | 0.650 % |
Next $500 million | 0.600 |
Next $1 billion | 0.550 |
Next $2 billion | 0.525 |
Next $1 billion | 0.500 |
Next $5 billion | 0.490 |
Over $10 billion | 0.480 |
Class-level administration fee | |
Class A | 0.20 % |
Class C | 0.20 |
Administrator Class | 0.13 |
Institutional Class | 0.13 |
EXPENSE RATIO CAPS | |
Class A | 1.04 % |
Class C | 1.79 |
Administrator Class | 0.92 |
Institutional Class | 0.72 |
Year ended March 31 | ||
2024 | 2023 | |
Ordinary income | $7,840,742 | $7,584,760 |
Long-term capital gain | 11,002,350 | 36,251,261 |
Undistributed ordinary income | Undistributed long-term gain | Unrealized gains |
$263,686 | $2,842,228 | $110,253,615 |
Allspring Funds Trust:

March 31, 2024.
Name and year of birth | Position held and length of service* | Principal occupations during past five years or longer | Current other public company or investment company directorships |
William R. Ebsworth (Born 1957) | Trustee, since 2015 | Retired. From 1984 to 2013, equities analyst, portfolio manager, research director and chief investment officer at Fidelity Management and Research Company in Boston, Tokyo, and Hong Kong, and retired in 2013 as Chief Investment Officer of Fidelity Strategic Advisers, Inc. where he led a team of investment professionals managing client assets. Prior thereto, Board member of Hong Kong Securities Clearing Co., Hong Kong Options Clearing Corp., the Thailand International Fund, Ltd., Fidelity Investments Life Insurance Company, and Empire Fidelity Investments Life Insurance Company. Serves on the Investment Company Institute’s Board of Governors since 2022 and Executive Committee since 2023 as well as the Vice Chairman of the Governing Council of the Independent Directors Council since 2023. Audit Committee Chair and Investment Committee Chair of the Vincent Memorial Hospital Foundation (non-profit organization). Mr. Ebsworth is a CFA charterholder. | N/A |
Jane A. Freeman (Born 1953) | Trustee, since 2015; Chair Liaison, since January 2018# | Retired. From 2012 to 2014 and 1999 to 2008, Chief Financial Officer of Scientific Learning Corporation. From 2008 to 2012, Ms. Freeman provided consulting services related to strategic business projects. Prior to 1999, Portfolio Manager at Rockefeller & Co. and Scudder, Stevens & Clark. Board member of the Harding Loevner Funds from 1996 to 2014, serving as both Lead Independent Director and chair of the Audit Committee. Board member of the Russell Exchange Traded Funds Trust from 2011 to 2012 and the chair of the Audit Committee. Ms. Freeman is also an inactive Chartered Financial Analyst. | N/A |
Isaiah Harris, Jr. (Born 1952) | Trustee, since 2009; Audit Committee Chair, since 2019 | Retired. Member of the Advisory Board of CEF of East Central Florida. Chairman of the Board of CIGNA Corporation from 2009 to 2021, and Director from 2005 to 2008. From 2003 to 2011, Director of Deluxe Corporation. Prior thereto, President and CEO of BellSouth Advertising and Publishing Corp. from 2005 to 2007, President and CEO of BellSouth Enterprises from 2004 to 2005 and President of BellSouth Consumer Services from 2000 to 2003. Emeritus member of the Iowa State University Foundation Board of Governors. Emeritus Member of the Advisory board of Iowa State University School of Business. Advisory Board Member, Palm Harbor Academy (private school). Advisory Board Member, Fellowship of Christian Athletes. Mr. Harris is a certified public accountant (inactive status). | N/A |
David F. Larcker (Born 1950) | Trustee, since 2009 | Distinguished Visiting Fellow at the Hoover Institution since 2022. James Irvin Miller Professor of Accounting at the Graduate School of Business (Emeritus), Stanford University, Director of the Corporate Governance Research Initiative and Senior Faculty of The Rock Center for Corporate Governance since 2006. From 2005 to 2008, Professor of Accounting at the Graduate School of Business, Stanford University. Prior thereto, Ernst & Young Professor of Accounting at The Wharton School, University of Pennsylvania from 1985 to 2005. | N/A |
Olivia S. Mitchell (Born 1953) | Trustee, since 2006; Nominating and Governance Committee Chair, since 2018 | International Foundation of Employee Benefit Plans Professor since 1993, Wharton School of the University of Pennsylvania. Director of Wharton’s Pension Research Council and Boettner Center on Pensions & Retirement Research, and Research Associate at the National Bureau of Economic Research. Previously taught at Cornell University from 1978 to 1993. | N/A |
Name and year of birth | Position held and length of service* | Principal occupations during past five years or longer | Current other public company or investment company directorships |
Timothy J. Penny (Born 1951) | Trustee, since 1996; Chair, since 2018 | President and Chief Executive Officer of Southern Minnesota Initiative Foundation, a non-profit organization, since 2007. Vice Chair of the Economic Club of Minnesota, since 2007. Co-Chair of the Committee for a Responsible Federal Budget, since 1995. Member of the Board of Trustees of NorthStar Education Finance, Inc., a non-profit organization, from 2007-2022. Senior Fellow of the University of Minnesota Humphrey Institute from 1995 to 2017. | N/A |
James G. Polisson (Born 1959) | Trustee, since 2018 | Retired. Chief Marketing Officer, Source (ETF) UK Services, Ltd, from 2015 to 2017. From 2012 to 2015, Principal of The Polisson Group, LLC, a management consulting, corporate advisory and principal investing company. Chief Executive Officer and Managing Director at Russell Investments, Global Exchange Traded Funds from 2010 to 2012. Managing Director of Barclays Global Investors from 1998 to 2010 and Global Chief Marketing Officer for iShares and Barclays Global Investors from 2000 to 2010. Trustee of the San Francisco Mechanics’ Institute, a non- profit organization, from 2013 to 2015. Board member of the Russell Exchange Traded Fund Trust from 2011 to 2012. Director of Barclays Global Investors Holdings Deutschland GmbH from 2006 to 2009. Mr. Polisson is an attorney and has a retired status with the Massachusetts and District of Columbia Bar Associations. | N/A |
Pamela Wheelock (Born 1959) | Trustee, since January 2020; previously Trustee from January 2018 to July 2019# | Retired. Executive and Senior Financial leadership positions in the public, private and nonprofit sectors. Interim President and CEO, McKnight Foundation, 2020. Interim Commissioner, Minnesota Department of Human Services, 2019. Chief Operating Officer, Twin Cities Habitat for Humanity, 2017-2019. Vice President for University Services, University of Minnesota, 2012- 2016. Interim President and CEO, Blue Cross and Blue Shield of Minnesota, 2011-2012. Executive Vice-President and Chief Financial Officer, Minnesota Wild, 2002-2008. Commissioner, Minnesota Department of Finance, 1999-2002. Chair of the Board of Directors of Destination Medical Center Corporation. Board member of the Minnesota Wild Foundation. | N/A |
Name and year of birth | Position held and length of service | Principal occupations during past five years or longer |
Andrew Owen (Born 1960) | President, since 2017 | President and Chief Executive Officer of Allspring Funds Management, LLC since 2017 and Head of Global Fund Governance of Allspring Global Investments since 2022. Prior thereto, co-president of Galliard Capital Management, LLC, an affiliate of Allspring Funds Management, LLC, from 2019 to 2022 and Head of Affiliated Managers, Allspring Global Investments, from 2014 to 2019 and Executive Vice President responsible for marketing, investments and product development for Allspring Funds Management, LLC, from 2009 to 2014. |
Jeremy DePalma (Born 1974) | Treasurer, since 2012 (for certain funds in the Fund Complex); since 2021 (for the remaining funds in the Complex) | Senior Vice President of Allspring Funds Management, LLC since 2009. Senior Vice President of Evergreen Investment Management Company, LLC from 2008 to 2010 and head of the Fund Reporting and Control Team within Fund Administration from 2005 to 2010. |
Christopher Baker (Born 1976) | Chief Compliance Officer, since 2022 | Global Chief Compliance Officer for Allspring Global Investments since 2022. Prior thereto, Chief Compliance Officer for State Street Global Advisors from 2018 to 2021. Senior Compliance Officer for the State Street divisions of Alternative Investment Solutions, Sector Solutions, and Global Marketing from 2015 to 2018. From 2010 to 2015 Vice President, Global Head of Investment and Marketing Compliance for State Street Global Advisors. |
Matthew Prasse (Born 1983) | Chief Legal Officer, since 2022; Secretary, since 2021 | Senior Counsel of the Allspring Legal Department since 2021. Senior Counsel of the Wells Fargo Legal Department from 2018 to 2021. Previously, Counsel for Barings LLC from 2015 to 2018. Prior to joining Barings, Associate at Morgan, Lewis & Bockius LLP from 2008 to 2015. |

P.O. Box 219967
Kansas City, MO 64121-9967

AR134 03-24
ITEM 2. CODE OF ETHICS
(a) As of the end of the period covered by the report, Allspring Funds Trust has adopted a code of ethics that applies to its President and Treasurer. A copy of the code of ethics is filed as an exhibit to this Form N-CSR.
(c) During the period covered by this report, there were no amendments to the provisions of the code of ethics adopted in Item 2(a) above.
(d) During the period covered by this report, there were no implicit or explicit waivers to the provisions of the code of ethics adopted in Item 2(a) above.
ITEM 3. AUDIT COMMITTEE FINANCIAL EXPERT
The Board of Trustees of Allspring Funds Trust has determined that Isaiah Harris is an audit committee financial expert, as defined in Item 3 of Form N-CSR. Mr. Harris is independent for purposes of Item 3 of Form N-CSR.
ITEM 4. PRINCIPAL ACCOUNTANT FEES AND SERVICES
(a), (b), (c), (d) The following table presents aggregate fees billed in each of the last two fiscal years for services rendered to the registrant by the registrant’s principal accountant. These fees were billed to the registrant and were approved by the registrant’s audit committee.
| Fiscal year ended March 31, 2024 | Fiscal year ended March 31, 2023 | |||||||
Audit fees | $ | 324,040 | $ | 298,660 | ||||
Audit-related fees | — | — | ||||||
Tax fees (1) | $ | 45,050 | $ | 37,390 | ||||
All other fees | — | — | ||||||
| $ | 369,090 | $ | 336,050 | |||||
| (1) | Tax fees consist of fees for tax compliance, tax advice, tax planning and excise tax. |
(e)(1) The Chair of the Audit Committees is authorized to pre-approve: (1) audit services for the mutual funds of Allspring Funds Trust; (2) non-audit tax or compliance consulting or training services provided to the Funds by the independent auditors (“Auditors”) if the fees for any particular engagement are not anticipated to exceed $50,000; and (3) non-audit tax or compliance consulting or training services provided by the Auditors to a Fund’s investment adviser and its controlling entities (where pre-approval is required because the engagement relates directly to the operations and financial reporting of the Fund) if the fee to the Auditors for any particular engagement is not anticipated to exceed $50,000. For any such pre-approval sought from the Chair, Management shall prepare a brief description of the proposed services.
If the Chair approves of such service, he or she shall sign the statement prepared by Management. Such written statement shall be presented to the full Committees at their next regularly scheduled meetings.
(e)(2) Not applicable.
(f) Not applicable.
(g) Not applicable.
(h) Not applicable.
(i) Not applicable.
(j) Not applicable.
ITEM 5. AUDIT COMMITTEE OF LISTED REGISTRANTS
Not applicable.
ITEM 6. INVESTMENTS
A Portfolio of Investments for the series of Allspring Funds Trust is included as part of the report to shareholders filed under Item 1 of this Form.
ITEM 7. DISCLOSURE OF PROXY VOTING POLICIES AND PROCEDURES FOR CLOSED-END MANAGEMENT INVESTMENT COMPANIES
Not applicable.
ITEM 8. PORTFOLIO MANAGERS OF CLOSED-END MANAGEMENT INVESTMENT COMPANIES
Not applicable.
ITEM 9. PURCHASES OF EQUITY SECURITIES BY CLOSED-END MANAGEMENT INVESTMENT COMPANY AND AFFILIATED PURCHASERS
Not applicable.
ITEM 10. SUBMISSION OF MATTERS TO A VOTE OF SECURITY HOLDERS
There have been no material changes to the procedures by which shareholders may recommend nominees to the registrant’s Board of Trustees that have been implemented since the registrant’s last provided disclosure in response to the requirements of this Item.
ITEM 11. CONTROLS AND PROCEDURES
(a) The President and Treasurer have concluded that the Allspring Funds Trust disclosure controls and procedures (as defined in Rule 30a-3(c) under the Investment Company Act of 1940) provide reasonable assurances that material information relating to the registrant is made known to them by the appropriate persons based on their evaluation of these controls and procedures as of a date within 90 days of the filing of this report.
(b) There were no significant changes in the registrant’s internal control over financial reporting (as defined in Rule 30a-3(d) under the Investment Company Act of 1940) that occurred during the period covered by this report that materially affected, or is reasonably likely to materially affect, the registrant’s internal control over financial reporting.
ITEM 12. DISCLOSURES OF SECURITIES LENDING ACTIVITES FOR CLOSED-END MANAGEMENT INVESTMENT COMPANIES
Not applicable.
ITEM 13. EXHIBITS
(a)(1) Code of Ethics.
(a)(2) Certifications pursuant to Section 302 of the Sarbanes-Oxley Act of 2002.
(a)(3) Not applicable.
(a)(4) Not applicable.
(b) Certifications pursuant to Section 906 of the Sarbanes-Oxley Act of 2002.
SIGNATURES
Pursuant to the requirements of the Securities Exchange Act of 1934 and the Investment Company Act of 1940, the registrant has duly caused this report to be signed on its behalf by the undersigned, thereunto duly authorized.
| Allspring Funds Trust | ||
| By: | /s/ Andrew Owen | |
| Andrew Owen | ||
| President | ||
| Date: May 23, 2024 | ||
Pursuant to the requirements of the Securities Exchange Act of 1934 and the Investment Company Act of 1940, this report has been signed below by the following persons on behalf of the registrant and in the capacities and on the date indicated.
| Allspring Funds Trust | ||
| By: | /s/ Andrew Owen | |
| Andrew Owen | ||
| President | ||
| Date: May 23, 2024 | ||
| By: | /s/Jeremy DePalma | |
| Jeremy DePalma | ||
| Treasurer | ||
| Date: May 23, 2024 | ||