
UNITED STATES
SECURITIES AND EXCHANGE COMMISSION
Washington, D.C. 20549
FORM N-CSR
CERTIFIED SHAREHOLDER REPORT OF REGISTERED
MANAGEMENT INVESTMENT COMPANIES
Investment Company Act file number: 811-09253
Allspring Funds Trust
(Exact name of registrant as specified in charter)
1415 Vantage Park Drive, 3rd Floor, Charlotte, NC 28203
(Address of principal executive offices) (Zip code)
Matthew Prasse
Allspring Funds Management, LLC
1415 Vantage Park Drive, 3rd Floor, Charlotte, NC 28203
(Name and address of agent for service)
Registrant’s telephone number, including area code: 800-222-8222
Date of fiscal year end: April 30
Registrant is making a filing for 13 of its series: Allspring Absolute Return Fund, Allspring Asset Allocation Fund, Allspring Core Bond Fund, Allspring Emerging Growth Fund, Allspring Large Cap Value Fund, Allspring Small Company Growth Fund, Allspring Small Company Value Fund, Allspring Spectrum Aggressive Growth Fund, Allspring Spectrum Conservative Growth Fund, Allspring Spectrum Growth Fund, Allspring Spectrum Income Allocation Fund, Allspring Spectrum Moderate Growth Fund and Allspring Real Return Fund.
Date of reporting period: April 30, 2024
ITEM 1. REPORT TO STOCKHOLDERS
2 | |
6 | |
10 | |
11 | |
13 | |
14 | |
16 | |
18 | |
23 | |
28 | |
30 | |
34 | |
35 | |
40 | |
41 | |
42 | |
43 | |
44 | |
50 | |
51 |

Allspring Funds

President
Allspring Funds
Notice to Shareholders |
At a meeting held on November 13-15, 2023, the Board of Trustees approved a number of changes to the Fund. These changes include: |
• A change in the Fund’s principal investment strategy to no longer invest substantially all of its assets in the GMO Benchmark-Free Allocation Fund; |
• the adoption of a fund-of-funds structure whereby the Fund will employ a multi-asset, multi-style investment approach across equity, fixed income, and alternative investments, including commodities, by investing in various affiliated mutual funds as well as affiliated and unaffiliated exchange-traded funds; and |
• the addition of Allspring Global Investments, LLC and Allspring Global Investments (UK) Limited as sub-advisers to the Fund. |
• Changes to the Fund’s investment strategy will be implemented to seek to achieve more consistent focus on both long- term returns and downside management. The Fund will continue to be managed as a globally diversified multi-asset investment strategy; however, the risk/return profile will change due to more dynamic risk management. |
These changes became effective on March 11, 2024. |
Notice to Shareholders |
Beginning in July 2024, the Fund will be required by the Securities and Exchange Commission to send shareholders a paper copy of a new tailored shareholder report in place of the full shareholder report that you are now receiving. The tailored shareholder report will contain concise information about the Fund, including certain expense and performance information and fund statistics. If you wish to receive this new tailored shareholder report electronically, please follow the instructions on the back cover of this report. |
Other information that is currently included in the shareholder report, such as the Fund’s financial statements, will be available online and upon request, free of charge, in paper or electronic format. |
Investment objective | The Fund seeks a positive total return. |
Manager | Allspring Funds Management, LLC |
Subadvisers | Allspring Global Investments, LLC |
Allspring Global Investments (UK) Ltd | |
Portfolio managers | Rushabh Amin†, Petros Bocray, CFA†, Travis Keshemberg, CFA†, Matthias Scheiber, CFA† |
Average annual total returns (%) as of April 30, 2024 | |||||||||
Including sales charge | Excluding sales charge | Expense ratios1 (%) | |||||||
Inception date | 1 year | 5 year | 10 year | 1 year | 5 year | 10 year | Gross | Net2 | |
Class A (WARAX) | 3-1-2012 | 2.05 | 1.13 | 1.35 | 8.28 | 2.34 | 1.95 | 1.14 | 1.14 |
Class C (WARCX) | 3-1-2012 | 6.47 | 1.64 | 1.36 | 7.47 | 1.64 | 1.36 | 1.89 | 1.89 |
Class R6 (WARRX)3 | 10-31-2014 | – | – | – | 8.79 | 2.78 | 2.39 | 0.72 | 0.72 |
Administrator Class (WARDX) | 3-1-2012 | – | – | – | 8.49 | 2.57 | 2.11 | 1.07 | 1.02 |
Institutional Class (WABIX) | 11-30-2012 | – | – | – | 8.77 | 2.73 | 2.32 | 0.82 | 0.78 |
MSCI ACWI (Net)4 | – | – | – | – | 17.46 | 9.44 | 8.19 | – | – |
Absolute Return Blended Index5 | – | – | – | – | 6.07 | 4.38 | 4.30 | – | – |
Bloomberg U.S. TIPS Index6 | – | – | – | – | -1.35 | 2.07 | 1.90 | – | – |
Bloomberg Global Aggregate Index Hedged (USD)7 | – | – | – | – | 1.94 | 0.46 | 1.97 | – | – |
1 | Reflects the expense ratios as stated in the most recent prospectuses, which include the impact of 0.45% in acquired fund fees and expenses. Net expenses from affiliated master portfolios are included in the acquired fund fees and expense amount. The expense ratios shown are subject to change and may differ from the annualized expense ratios shown in the Financial Highlights of this report, which do not include acquired fund fees and expenses. |
2 | The manager has contractually committed through August 31, 2025, to waive fees and/or reimburse expenses to the extent necessary to cap total annual fund operating expenses after fee waivers at 0.70% for Class A, 1.45% for Class C, 0.28% for Class R6, 0.57% for Administrator Class and 0.33% for Institutional Class. Brokerage commissions, stamp duty fees, interest, taxes, acquired fund fees and expenses (if any), and extraordinary expenses are excluded from the expense caps. Prior to or after the commitment expiration date, the caps may be increased or the commitment to maintain the caps may be terminated only with the approval of the Board of Trustees. Without these caps, the Fund’s returns would have been lower. The expense ratio paid by an investor is the net expense ratio (the total annual fund operating expenses after fee waivers) as stated in the prospectuses. |
3 | Historical performance shown for the Class R6 shares prior to their inception reflects the performance of the Institutional Class shares, and includes the higher expenses applicable to the Institutional Class shares. If these expenses had not been included, returns for the Class R6 shares would be higher. |
4 | The Morgan Stanley Capital International (MSCI) All Country World Index (ACWI) (Net) is a free-float-adjusted market-capitalization-weighted index that is designed to measure the equity market performance of developed and emerging markets. Source: MSCI. MSCI makes no express or implied warranties or representations and shall have no liability whatsoever with respect to any MSCI data contained herein. The MSCI data may not be further redistributed or used as a basis for other indexes or any securities or financial products. This report is not approved, reviewed, or produced by MSCI. You cannot invest directly in an index. |
5 | Source: Allspring Funds Management, LLC. The Absolute Return Blended Index is comprised of 35% MSCI ACWI (Net), 35% Bloomberg U.S. TIPS Index and 30% Bloomberg Global Aggregate Index Hedged (USD). You cannot invest directly in an index. |
6 | The Bloomberg U.S. Treasury Inflation-Protected Securities (TIPS) Index is an index of inflation-indexed-linked U.S. Treasury securities. You cannot invest directly in an index. |
† | Mr. Amin, Mr. Bocray, Mr. Keshemberg and Mr. Scheiber became portfolio managers of the Fund on March 11, 2024. |
CFA® and Chartered Financial Analyst® are trademarks owned by CFA Institute. | |
Growth of $10,000 investment as of April 30, 20241 |
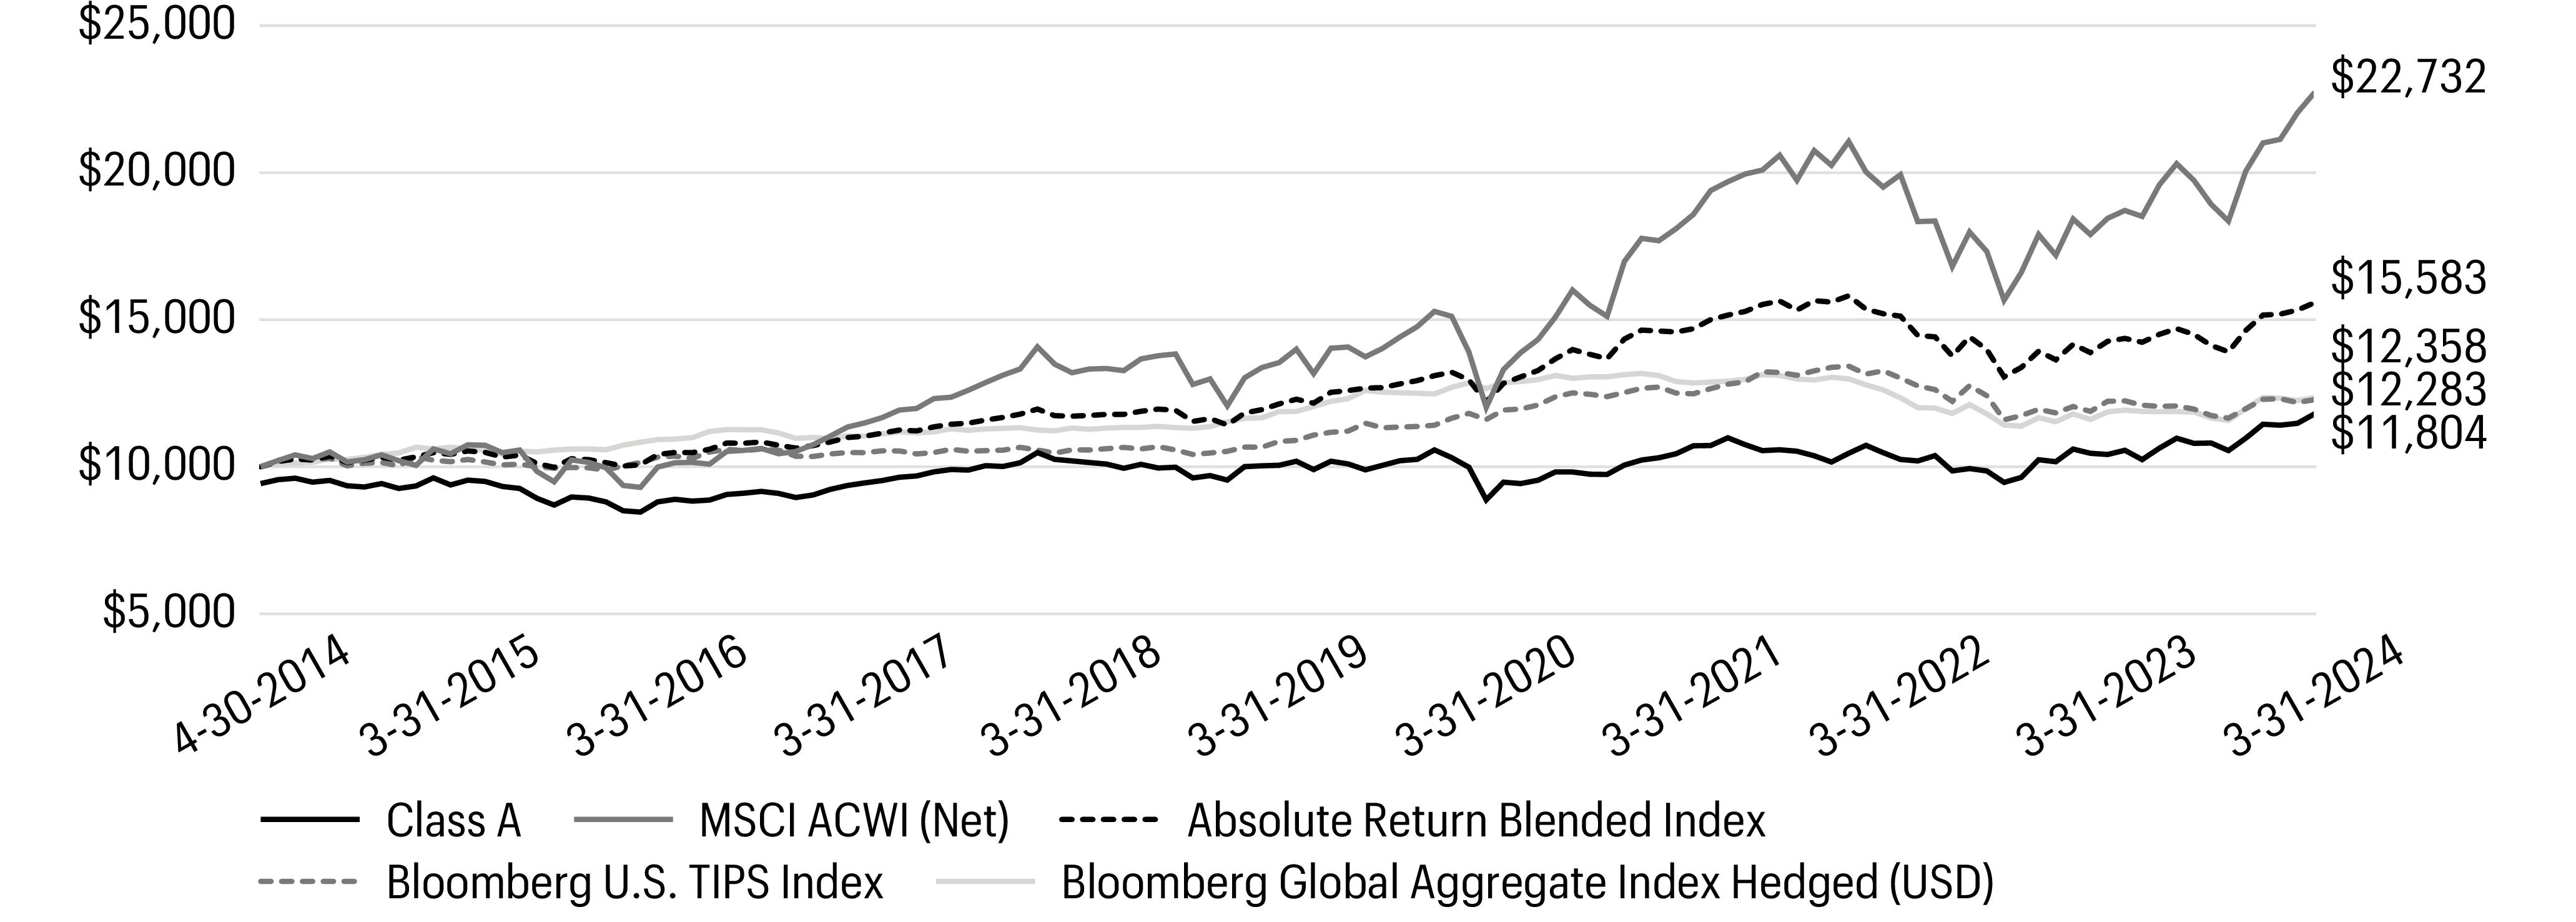
1 | The chart compares the performance of Class A shares for the most recent ten years with the MSCI ACWI (Net), Absolute Return Blended Index, Bloomberg U.S. TIPS Index and Bloomberg Global Aggregate Index Hedged (USD). The chart assumes a hypothetical investment of $10,000 in Class A shares and reflects all operating expenses and assumes the maximum initial sales charge of 5.75%. |
Footnotes continued from previous page | |
7 | The Bloomberg Global Aggregate Index Hedged (USD) is a measure of global investment-grade debt performance with currency exposure hedged to USD. This multicurrency benchmark includes Treasury, government-related, corporate, and securitized fixed-rate bonds from both developed and emerging market issuers. You cannot invest directly in an index. |
Ten largest holdings (%) as of April 30, 20241 | |
Allspring Macro Strategies Portfolio | 46.71 |
Allspring Alternative Risk Premia Fund Class R6 | 12.17 |
Allspring Disciplined Large Cap Portfolio | 11.69 |
Allspring Income Plus Fund Institutional Class | 9.56 |
Allspring Disciplined International Developed Markets Portfolio | 8.23 |
Allspring Short-Term High Income Fund Institutional Class | 3.00 |
Allspring Emerging Markets Equity Income Fund Class R6 | 2.99 |
Allspring Special International Small Cap Fund Class R6 | 2.92 |
Allspring Special Mid Cap Value Fund Class R6 | 1.48 |
Allspring Disciplined Small Cap Fund Class R6 | 1.47 |
1 | Figures represent the percentage of the Fund’s net assets. Holdings are subject to change and may have changed since the date specified. |
PORTFOLIO COMPOSITION AS OF April 30, 20241 |
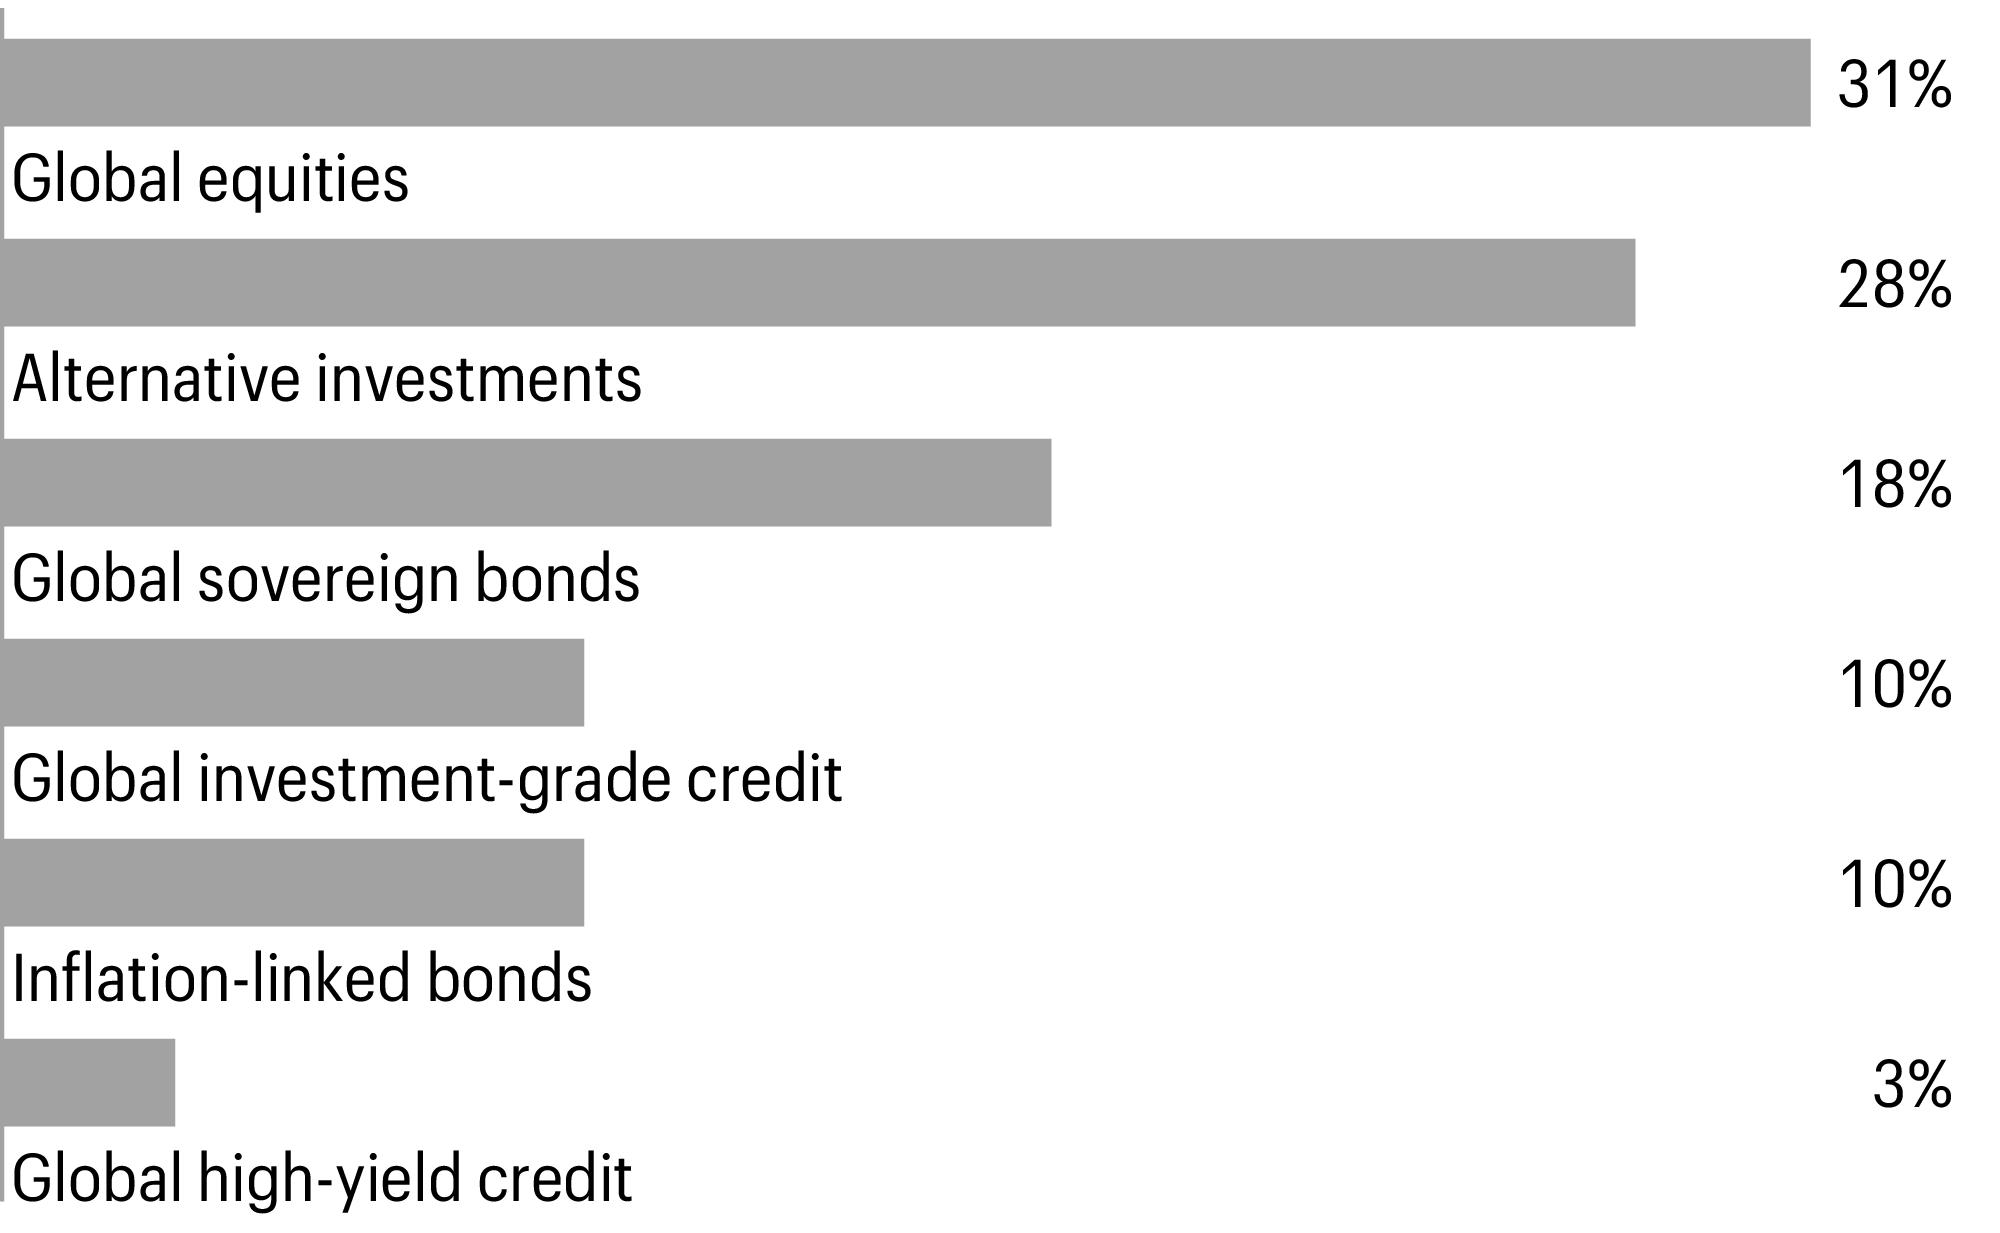
1 | Figures represent the percentage of the Fund’s long-term investments. Allocations are subject to change and may have changed since the date specified. |
Allspring Absolute Return Fund (excluding GMO Benchmark-Free Allocation Fund and its underlying fund expenses) | Beginning account value 11-1-2023 | Ending account value 4-30-2024 | Expenses paid during the period1, 2 | Annualized net expense ratio2 |
Class A | ||||
Actual | $1,000.00 | $1,083.82 | $3.63 | 0.70 % |
Hypothetical (5% return before expenses) | $1,000.00 | $1,021.38 | $3.52 | 0.70 % |
Class C | ||||
Actual | $1,000.00 | $1,079.85 | $7.50 | 1.45 % |
Hypothetical (5% return before expenses) | $1,000.00 | $1,017.65 | $7.27 | 1.45 % |
Class R6 | ||||
Actual | $1,000.00 | $1,086.88 | $1.45 | 0.28 % |
Hypothetical (5% return before expenses) | $1,000.00 | $1,023.47 | $1.41 | 0.28 % |
Administrator Class | ||||
Actual | $1,000.00 | $1,084.85 | $2.95 | 0.57 % |
Hypothetical (5% return before expenses) | $1,000.00 | $1,022.03 | $2.87 | 0.57 % |
Institutional Class | ||||
Actual | $1,000.00 | $1,086.67 | $1.71 | 0.33 % |
Hypothetical (5% return before expenses) | $1,000.00 | $1,023.22 | $1.66 | 0.33 % |
1 | Expenses paid is equal to the annualized net expense ratio of each class multiplied by the average account value over the period, multiplied by 182 divided by 366 (to reflect the one-half-year period). |
2 | Amounts do not reflect expenses allocated from the affiliated Master Portfolios in which the Fund invests. |
Shares | Value | |||||
Investment companies: 100.22% | ||||||
Affiliated master portfolios: 66.63% | ||||||
Allspring Disciplined International Developed Markets Portfolio | $54,595,202 | |||||
Allspring Disciplined Large Cap Portfolio | 77,542,465 | |||||
Allspring Macro Strategies Portfolio | 309,812,592 | |||||
441,950,259 | ||||||
Alternative investment funds: 12.17% | ||||||
Allspring Alternative Risk Premia Fund Class R6♠ | 9,891,884 | 80,717,777 | ||||
Bond funds: 12.56% | ||||||
Allspring Income Plus Fund Institutional Class♠ | 7,373,365 | 63,410,935 | ||||
Allspring Short-Term High Income Fund Institutional Class♠ | 2,558,172 | 19,902,579 | ||||
83,313,514 | ||||||
Stock funds: 8.86% | ||||||
Allspring Disciplined Small Cap Fund Class R6♠ | 781,988 | 9,712,294 | ||||
Allspring Emerging Markets Equity Income Fund Class R6♠ | 1,718,400 | 19,813,148 | ||||
Allspring Special International Small Cap Fund Class R6♠ | 1,738,822 | 19,370,480 | ||||
Allspring Special Mid Cap Value Fund Class R6♠ | 204,612 | 9,833,657 | ||||
58,729,579 | ||||||
Total investment companies (Cost $676,739,836) | 664,711,129 | |||||
Total investments in securities (Cost $676,739,836) | 100.22 % | 664,711,129 | ||||
Other assets and liabilities, net | (0.22 ) | (1,438,690 ) | ||||
Total net assets | 100.00 % | $663,272,439 | ||||
♠ | The issuer of the security is an affiliated person of the Fund as defined in the Investment Company Act of 1940. |
Value, beginning of period | Purchases | Sales proceeds | Net realized gains (losses) on affiliated Underlying Funds | Net change in unrealized gains (losses) on affiliated Underlying Funds | Value, end of period | |
Investment companies | ||||||
Allspring Alternative Risk Premia Fund Class R6 | $0 | $80,025,000 | $0 | $0 | $692,777 | $80,717,777 |
Allspring Disciplined Small Cap Fund Class R6 | 0 | 9,923,742 | 0 | 0 | (211,448 ) | 9,712,294 |
Allspring Emerging Markets Equity Income Fund Class R6 | 0 | 19,880,848 | 0 | 0 | (67,700 ) | 19,813,148 |
Allspring Income Plus Fund Institutional Class | 0 | 64,293,385 | 0 | 0 | (882,450 ) | 63,410,935 |
Allspring Short Term-High Income Fund Institutional Class | 0 | 19,979,031 | 0 | 0 | (76,452 ) | 19,902,579 |
Allspring Special International Fund Class R6 | 0 | 19,822,486 | 0 | 0 | (452,006 ) | 19,370,480 |
Allspring Special Mid Cap Value Fund Class R6 | 0 | 9,923,743 | 0 | 0 | (90,086 ) | 9,833,657 |
Affiliated securities no longer held at end of period | ||||||
GMO Benchmark-Free Allocation Fund Class MF | 1,053,736,128 | 61,372,875 | (1,160,269,303 ) | 108,374,212 | (63,213,912 ) | 0 |
$108,374,212 | $(64,301,277 ) | $222,760,870 |
Shares, end of period | Dividends from affiliated Underlying Funds | |
Investment companies | ||
Allspring Alternative Risk Premia Fund Class R6 | 9,891,884 | $0 |
Allspring Disciplined Small Cap Fund Class R6 | 781,988 | 0 |
Allspring Emerging Markets Equity Income Fund Class R6 | 1,718,400 | 58,362 |
Allspring Income Plus Fund Institutional Class | 7,373,365 | 421,495 |
Allspring Short Term-High Income Fund Institutional Class | 2,558,172 | 54,273 |
Allspring Special International Fund Class R6 | 1,738,822 | 0 |
Allspring Special Mid Cap Value Fund Class R6 | 204,612 | 0 |
Affiliated securities no longer held at end of period | ||
GMO Benchmark-Free Allocation Fund Class MF | 0 | 53,048,013 |
$53,582,143 |
% of ownership, beginning of period | % of ownership, end of period | Net realized gains (losses) on investments allocated from affiliated Master Portfolios | Net change in unrealized gains (losses) on investments allocated from affiliated Master Portfolios | Interest allocated from affiliated Master Portfolios | Dividends allocated from affiliated Master Portfolios | Affiliated Income Allocated from affiliated Master Portfolios | Value, end of period | |
Allspring Disciplined International Developed Markets Portfolio | 0.00 % | 18.41 % | $7,142 | $(1,770,321 ) | $311 | $433,295 | $15,420 | $54,595,202 |
Allspring Disciplined Large Cap Portfolio | 0.00 | 22.50 | 562,367 | (2,322,633 ) | 342 | 98,009 | 18,832 | 77,542,465 |
Allspring Macro Strategies Portfolio | 0.00 | 100.00 | (3,215,195 ) | (6,848,388 ) | 1,000,901 | 76,398 | 1,544,524 | 309,812,592 |
$(2,645,686 ) | $(10,941,342 ) | $1,001,554 | $607,702 | $1,578,776 | $441,950,259 |
Assets | |
Investments in affiliated Master Portfolio, at value (cost $452,891,601) | $441,950,259 |
Investments in affiliated Underlying Funds, at value (cost $223,848,235) | 222,760,870 |
Receivable for Fund shares sold | 185,701 |
Receivable for dividends | 98,957 |
Prepaid expenses and other assets | 13,213 |
Total assets | 665,009,000 |
Liabilities | |
Payable for Fund shares redeemed | 1,004,942 |
Shareholder report expenses payable | 315,540 |
Management fee payable | 109,895 |
Payable for investments purchased | 102,272 |
Administration fees payable | 86,644 |
Distribution fees payable | 11,726 |
Accrued expenses and other liabilities | 105,542 |
Total liabilities | 1,736,561 |
Total net assets | $663,272,439 |
Net assets consist of | |
Paid-in capital | $1,006,053,234 |
Total distributable loss | (342,780,795 ) |
Total net assets | $663,272,439 |
Computation of net asset value and offering price per share | |
Net assets–Class A | $232,307,724 |
Shares outstanding–Class A1 | 21,367,142 |
Net asset value per share–Class A | $10.87 |
Maximum offering price per share – Class A2 | $11.53 |
Net assets–Class C | $18,351,603 |
Shares outstanding–Class C1 | 1,642,761 |
Net asset value per share–Class C | $11.17 |
Net assets–Class R6 | $42,227,293 |
Shares outstanding–Class R61 | 3,874,278 |
Net asset value per share–Class R6 | $10.90 |
Net assets–Administrator Class | $14,591,253 |
Shares outstanding–Administrator Class1 | 1,320,692 |
Net asset value per share–Administrator Class | $11.05 |
Net assets–Institutional Class | $355,794,566 |
Shares outstanding–Institutional Class1 | 32,626,618 |
Net asset value per share–Institutional Class | $10.91 |
Investment income | |
Dividends from affiliated investment companies | $53,582,143 |
Affiliated income allocated from affiliated Master Portfolios | 1,578,776 |
Interest allocated from affiliated Master Portfolios | 1,001,554 |
Dividends allocated from affiliated Master Portfolios (net of foreign withholding taxes of $78,515) | 607,702 |
Interest | 516,027 |
Dividends | 98,956 |
Expenses allocated from affiliated Master Portfolios | (290,582 ) |
Total investment income | 57,094,576 |
Expenses | |
Management fee | 2,153,372 |
Administration fees | |
Class A | 545,201 |
Class C | 48,508 |
Class R | 38 1 |
Class R6 | 12,341 |
Administrator Class | 22,418 |
Institutional Class | 788,752 |
Shareholder servicing fees | |
Class A | 675,653 |
Class C | 59,780 |
Class R | 45 1 |
Administrator Class | 42,286 |
Distribution fees | |
Class C | 179,174 |
Class R | 34 1 |
Custody and accounting fees | 24,808 |
Professional fees | 64,929 |
Registration fees | 70,803 |
Shareholder report expenses | 4 |
Trustees’ fees and expenses | 25,002 |
Other fees and expenses | 25,099 |
Total expenses | 4,738,247 |
Less: Fee waivers and/or expense reimbursements | |
Fund-level | (5,674 ) |
Class A | (1,234 ) |
Class C | (39 ) |
Administrator Class | (8,991 ) |
Institutional Class | (278,777 ) |
Net expenses | 4,443,532 |
Net investment income | 52,651,044 |
Realized and unrealized gains (losses) on investments | |
Net realized gains (losses) on | |
Investments allocated from affiliated Master Portfolios | $(2,645,686 ) |
Affiliated Underlying Funds | 108,374,212 |
Net realized gains on investments | 105,728,526 |
Net change in unrealized gains (losses) on | |
Investments allocated from affiliated Master Portfolios | (10,941,342 ) |
Affiliated Underlying Funds | (64,301,277 ) |
Net change in unrealized gains (losses) on investments | (75,242,619 ) |
Net realized and unrealized gains (losses) on investments | 30,485,907 |
Net increase in net assets resulting from operations | $83,136,951 |
Year ended April 30, 2024 | Year ended April 30, 2023 | |||
Operations | ||||
Net investment income | $52,651,044 | $28,939,453 | ||
Net realized gains on investments | 105,728,526 | 2,136,897 | ||
Net change in unrealized gains (losses) on investments | (75,242,619 ) | 2,371,266 | ||
Net increase in net assets resulting from operations | 83,136,951 | 33,447,616 | ||
Distributions to shareholders from | ||||
Net investment income and net realized gains | ||||
Class A | (7,522,188 ) | (6,719,824 ) | ||
Class C | (259,692 ) | 0 | ||
Class R | 0 1 | (2,678 ) | ||
Class R6 | (1,532,904 ) | (108,458 ) | ||
Administrator Class | (497,944 ) | (376,429 ) | ||
Institutional Class | (19,126,562 ) | (20,031,988 ) | ||
Total distributions to shareholders | (28,939,290 ) | (27,239,377 ) | ||
Capital share transactions | Shares | Shares | ||
Proceeds from shares sold | ||||
Class A | 1,489,003 | 15,703,302 | 3,729,620 | 37,413,303 |
Class C | 50,974 | 557,313 | 245,682 | 2,488,851 |
Class R | 0 1 | 0 1 | 212 | 2,157 |
Class R6 | 4,577,504 | 47,818,947 | 59,556 | 598,463 |
Administrator Class | 82,810 | 887,958 | 194,104 | 1,981,679 |
Institutional Class | 4,608,538 | 49,340,066 | 13,180,027 | 132,816,423 |
114,307,586 | 175,300,876 | |||
Reinvestment of distributions | ||||
Class A | 620,124 | 6,746,947 | 603,481 | 5,986,532 |
Class C | 22,103 | 247,771 | 0 | 0 |
Class R | 0 1 | 0 1 | 55 | 567 |
Class R6 | 2,172 | 23,652 | 3,522 | 35,004 |
Administrator Class | 42,885 | 473,875 | 35,692 | 359,419 |
Institutional Class | 1,515,771 | 16,521,906 | 1,584,576 | 15,734,837 |
24,014,151 | 22,116,359 | |||
Payment for shares redeemed | ||||
Class A | (8,401,189 ) | (90,198,828 ) | (8,596,591 ) | (86,304,096 ) |
Class C | (1,313,800 ) | (14,232,029 ) | (3,130,552 ) | (31,500,444 ) |
Class R | 0 1 | 0 1 | (19 ) | (199 ) |
Class R6 | (1,097,236 ) | (11,958,345 ) | (696,767 ) | (6,988,934 ) |
Administrator Class | (583,574 ) | (6,360,498 ) | (1,613,354 ) | (16,464,413 ) |
Institutional Class | (44,431,054 ) | (479,012,580 ) | (34,029,605 ) | (340,305,290 ) |
(601,762,280 ) | (481,563,376 ) | |||
Year ended April 30, 2024 | Year ended April 30, 2023 | |||
Shares | Shares | |||
Share conversions | ||||
Class A | 12,992 2 | $135,235 2 | 0 | $0 |
Class R | (12,620 )2 | (135,235 )2 | 0 | 0 |
0 | 0 | |||
Net decrease in net assets resulting from capital share transactions | (463,440,543 ) | (284,146,141 ) | ||
Total decrease in net assets | (409,242,882 ) | (277,937,902 ) | ||
Net assets | ||||
Beginning of period | 1,072,515,321 | 1,350,453,223 | ||
End of period | $663,272,439 | $1,072,515,321 | ||
Year ended April 30 | |||||
Class A | 2024 | 2023 | 2022 | 2021 | 2020 |
Net asset value, beginning of period | $10.32 | $10.20 | $11.07 | $10.11 | $11.15 |
Net investment income | 0.56 1 | 0.24 1 | 0.17 1 | 0.22 | 0.29 1 |
Net realized and unrealized gains (losses) on investments | 0.29 | 0.11 | (0.70 ) | 1.09 | (1.04 ) |
Total from investment operations | 0.85 | 0.35 | (0.53 ) | 1.31 | (0.75 ) |
Distributions to shareholders from | |||||
Net investment income | (0.30 ) | (0.23 ) | (0.34 ) | (0.35 ) | (0.29 ) |
Net asset value, end of period | $10.87 | $10.32 | $10.20 | $11.07 | $10.11 |
Total return2 | 8.28 % | 3.55 % | (4.89 )% | 13.16 % | (6.99 )% |
Ratios to average net assets (annualized) | |||||
Gross expenses | 0.70 %*,^ | 0.71 %^ | 0.70 %^ | 0.69 %^ | 0.69 %^ |
Net expenses | 0.70 %*,^ | 0.70 %^ | 0.70 %^ | 0.69 %^ | 0.69 %^ |
Net investment income | 5.25 % | 2.36 % | 1.62 % | 2.33 % | 2.68 % |
Supplemental data | |||||
Portfolio turnover rate | 47 % | 8 % | 6 % | 5 % | 4 % |
Net assets, end of period (000s omitted) | $232,308 | $285,240 | $325,369 | $353,134 | $297,590 |
* | Including net expenses allocated from the affiliated Master Portfolios, the expense ratios would be increased by the following amounts: |
Year ended April 30, 2024 | 0.04% |
^ | Ratios do not include net expenses of GMO Benchmark-Free Allocation Fund, Class MF. Including net expenses allocated from GMO Benchmark-Free Allocation Fund, Class MF, the ratios would be increased by the following amounts: |
Year ended April 30, 2024 | 0.71% |
Year ended April 30, 2023 | 0.69% |
Year ended April 30, 2022 | 0.70% |
Year ended April 30, 2021 | 0.67% |
Year ended April 30, 2020 | 0.61% |
1 | Calculated based upon average shares outstanding |
2 | Total return calculations do not include any sales charges. |
Year ended April 30 | |||||
Class C | 2024 | 2023 | 2022 | 2021 | 2020 |
Net asset value, beginning of period | $10.51 | $10.22 | $10.90 | $9.95 | $10.96 |
Net investment income | 0.46 1 | 0.13 1 | 0.06 1 | 0.12 1 | 0.12 |
Payment from affiliate | 0.00 | 0.00 | 0.00 | 0.05 | 0.00 |
Net realized and unrealized gains (losses) on investments | 0.33 | 0.16 | (0.67 ) | 1.08 | (0.95 ) |
Total from investment operations | 0.79 | 0.29 | (0.61 ) | 1.25 | (0.83 ) |
Distributions to shareholders from | |||||
Net investment income | (0.13 ) | 0.00 | (0.07 ) | (0.30 ) | (0.18 ) |
Net asset value, end of period | $11.17 | $10.51 | $10.22 | $10.90 | $9.95 |
Total return2 | 7.47 % | 2.84 % | (5.59 )% | 12.66 %3 | (7.73 )% |
Ratios to average net assets (annualized) | |||||
Gross expenses | 1.44 %*,^ | 1.45 %^ | 1.43 %^ | 1.44 %^ | 1.44 %^ |
Net expenses | 1.44 %*,^ | 1.45 %^ | 1.43 %^ | 1.44 %^ | 1.44 %^ |
Net investment income | 4.24 % | 1.34 % | 0.61 % | 1.18 % | 1.71 % |
Supplemental data | |||||
Portfolio turnover rate | 47 % | 8 % | 6 % | 5 % | 4 % |
Net assets, end of period (000s omitted) | $18,352 | $30,295 | $58,948 | $131,690 | $254,485 |
* | Including net expenses allocated from the affiliated Master Portfolios, the expense ratios would be increased by the following amounts: |
Year ended April 30, 2024 | 0.04% |
^ | Ratios do not include net expenses of GMO Benchmark-Free Allocation Fund, Class MF. Including net expenses allocated from GMO Benchmark-Free Allocation Fund, Class MF, the ratios would be increased by the following amounts: |
Year ended April 30, 2024 | 0.71% |
Year ended April 30, 2023 | 0.69% |
Year ended April 30, 2022 | 0.70% |
Year ended April 30, 2021 | 0.67% |
Year ended April 30, 2020 | 0.61% |
1 | Calculated based upon average shares outstanding |
2 | Total return calculations do not include any sales charges. |
3 | During the year ended April 30, 2021, the Fund received a payment from an affiliate that had an impact of 0.53% on total return. |
Year ended April 30 | |||||
Class R6 | 2024 | 2023 | 2022 | 2021 | 2020 |
Net asset value, beginning of period | $10.35 | $10.23 | $11.10 | $10.11 | $11.15 |
Net investment income | 0.70 1 | 0.19 1 | 0.21 1 | 0.28 | 0.35 |
Net realized and unrealized gains (losses) on investments | 0.21 | 0.21 | (0.70 ) | 1.08 | (1.05 ) |
Total from investment operations | 0.91 | 0.40 | (0.49 ) | 1.36 | (0.70 ) |
Distributions to shareholders from | |||||
Net investment income | (0.36 ) | (0.28 ) | (0.38 ) | (0.37 ) | (0.34 ) |
Net asset value, end of period | $10.90 | $10.35 | $10.23 | $11.10 | $10.11 |
Total return | 8.79 % | 3.99 % | (4.50 )% | 13.62 % | (6.57 )% |
Ratios to average net assets (annualized) | |||||
Gross expenses | 0.28 %*,^ | 0.27 %^ | 0.27 %^ | 0.26 %^ | 0.26 %^ |
Net expenses | 0.28 %*,^ | 0.27 %^ | 0.27 %^ | 0.26 %^ | 0.26 %^ |
Net investment income | 6.51 % | 1.89 % | 1.91 % | 2.63 % | 3.05 % |
Supplemental data | |||||
Portfolio turnover rate | 47 % | 8 % | 6 % | 5 % | 4 % |
Net assets, end of period (000s omitted) | $42,227 | $4,057 | $10,494 | $17,332 | $25,363 |
* | Including net expenses allocated from the affiliated Master Portfolios, the expense ratios would be increased by the following amounts: |
Year ended April 30, 2024 | 0.04% |
^ | Ratios do not include net expenses of GMO Benchmark-Free Allocation Fund, Class MF. Including net expenses allocated from GMO Benchmark-Free Allocation Fund, Class MF, the ratios would be increased by the following amounts: |
Year ended April 30, 2024 | 0.71% |
Year ended April 30, 2023 | 0.69% |
Year ended April 30, 2022 | 0.70% |
Year ended April 30, 2021 | 0.67% |
Year ended April 30, 2020 | 0.61% |
1 | Calculated based upon average shares outstanding |
Year ended April 30 | |||||
Administrator Class | 2024 | 2023 | 2022 | 2021 | 2020 |
Net asset value, beginning of period | $10.48 | $10.32 | $11.18 | $10.15 | $11.18 |
Net investment income | 0.58 1 | 0.23 1 | 0.17 1 | 0.24 1 | 0.27 1 |
Payment from affiliate | 0.00 | 0.00 | 0.00 | 0.06 | 0.00 |
Net realized and unrealized gains (losses) on investments | 0.31 | 0.15 | (0.70 ) | 1.08 | (1.01 ) |
Total from investment operations | 0.89 | 0.38 | (0.53 ) | 1.38 | (0.74 ) |
Distributions to shareholders from | |||||
Net investment income | (0.32 ) | (0.22 ) | (0.33 ) | (0.35 ) | (0.29 ) |
Net asset value, end of period | $11.05 | $10.48 | $10.32 | $11.18 | $10.15 |
Total return | 8.49 % | 3.75 % | (4.81 )% | 13.76 %2 | (6.85 )% |
Ratios to average net assets (annualized) | |||||
Gross expenses | 0.62 %*,^ | 0.62 %^ | 0.61 %^ | 0.61 %^ | 0.61 %^ |
Net expenses | 0.57 %*,^ | 0.57 %^ | 0.57 %^ | 0.57 %^ | 0.57 %^ |
Net investment income | 5.39 % | 2.26 % | 1.60 % | 2.20 % | 2.42 % |
Supplemental data | |||||
Portfolio turnover rate | 47 % | 8 % | 6 % | 5 % | 4 % |
Net assets, end of period (000s omitted) | $14,591 | $18,641 | $32,644 | $40,694 | $60,846 |
* | Including net expenses allocated from the affiliated Master Portfolios, the expense ratios would be increased by the following amounts: |
Year ended April 30, 2024 | 0.04% |
^ | Ratios do not include net expenses of GMO Benchmark-Free Allocation Fund, Class MF. Including net expenses allocated from GMO Benchmark-Free Allocation Fund, Class MF, the ratios would be increased by the following amounts: |
Year ended April 30, 2024 | 0.71% |
Year ended April 30, 2023 | 0.69% |
Year ended April 30, 2022 | 0.70% |
Year ended April 30, 2021 | 0.67% |
Year ended April 30, 2020 | 0.61% |
1 | Calculated based upon average shares outstanding |
2 | During the year ended April 30, 2021, the Fund received a payment from an affiliate that had an impact of 0.62% on total return. |
Year ended April 30 | |||||
Institutional Class | 2024 | 2023 | 2022 | 2021 | 2020 |
Net asset value, beginning of period | $10.35 | $10.23 | $11.10 | $10.11 | $11.15 |
Net investment income | 0.59 1 | 0.26 1 | 0.21 1 | 0.26 1 | 0.33 1 |
Net realized and unrealized gains (losses) on investments | 0.32 | 0.13 | (0.71 ) | 1.09 | (1.04 ) |
Total from investment operations | 0.91 | 0.39 | (0.50 ) | 1.35 | (0.71 ) |
Distributions to shareholders from | |||||
Net investment income | (0.35 ) | (0.27 ) | (0.37 ) | (0.36 ) | (0.33 ) |
Net asset value, end of period | $10.91 | $10.35 | $10.23 | $11.10 | $10.11 |
Total return | 8.77 % | 3.97 % | (4.59 )% | 13.57 % | (6.65 )% |
Ratios to average net assets (annualized) | |||||
Gross expenses | 0.38 %*,^ | 0.38 %^ | 0.37 %^ | 0.36 %^ | 0.36 %^ |
Net expenses | 0.33 %*,^ | 0.33 %^ | 0.33 %^ | 0.33 %^ | 0.33 %^ |
Net investment income | 5.58 % | 2.56 % | 1.90 % | 2.43 % | 3.00 % |
Supplemental data | |||||
Portfolio turnover rate | 47 % | 8 % | 6 % | 5 % | 4 % |
Net assets, end of period (000s omitted) | $355,795 | $734,148 | $922,867 | $1,188,488 | $1,664,020 |
* | Including net expenses allocated from the affiliated Master Portfolios, the expense ratios would be increased by the following amounts: |
Year ended April 30, 2024 | 0.04% |
^ | Ratios do not include net expenses of GMO Benchmark-Free Allocation Fund, Class MF. Including net expenses allocated from GMO Benchmark-Free Allocation Fund, Class MF, the ratios would be increased by the following amounts: |
Year ended April 30, 2024 | 0.71% |
Year ended April 30, 2023 | 0.69% |
Year ended April 30, 2022 | 0.70% |
Year ended April 30, 2021 | 0.67% |
Year ended April 30, 2020 | 0.61% |
1 | Calculated based upon average shares outstanding |
Gross unrealized gains | $37,229,756 |
Gross unrealized losses | (43,490,483 ) |
Net unrealized losses | $(6,260,727 ) |
Paid-in capital | Total distributable loss |
$7,162 | $(7,162 ) |
Quoted prices (Level 1) | Other significant observable inputs (Level 2) | Significant unobservable inputs (Level 3) | Total | |
Assets | ||||
Investments in: | ||||
Investment companies | $222,760,870 | $0 | $0 | $222,760,870 |
Investments measured at net asset value* | 441,950,259 | |||
Total assets | $222,760,870 | $0 | $0 | $664,711,129 |
* | Investments that are measured at fair value using the net asset value per share (or its equivalent) as a practical expedient have not been categorized in the fair value hierarchy. The fair value amount presented in the table is intended to permit reconciliation of the fair value hierarchy to the amounts presented in the Statement of Assets and Liabilities. The Fund’s investments in the affiliated Master Portfolios are valued at $441,950,259. Each affiliated Master Portfolio does not have a redemption period notice, can be redeemed daily and does not have any unfunded commitments. |
Affiliated Master Portfolio | Investment objective |
Allspring Disciplined International Developed Markets Portfolio | Seeks long-term capital appreciation |
Allspring Disciplined Large Cap Portfolio | Seeks long-term capital appreciation |
Allspring Macro Strategies Portfolio | Seeks long-term capital appreciation |
Average daily net assets | Management fee |
First $1 billion | 0.225 % |
Next $4 billion | 0.200 |
Next $5 billion | 0.175 |
Next $10 billion | 0.165 |
Over $20 billion | 0.160 |
Class-level administration fee | |
Class A | 0.20 % |
Class C | 0.20 |
Class R | 0.21 |
Class R6 | 0.03 |
Administrator Class | 0.13 |
Institutional Class | 0.13 |
EXPENSE RATIO CAPS | |
Class A | 0.70 % |
Class C | 1.45 |
Class R6 | 0.28 |
Administrator Class | 0.57 |
Institutional Class | 0.33 |
Purchases at cost | Sales proceeds | ||
U.S. government | Non-U.S. government | U.S. government | Non-U.S. government |
$79,499,321 | $336,798,234 | $0 | $1,169,187,748 |
Undistributed ordinary income | Unrealized losses | Capital loss carryforward |
$55,970,063 | $(6,260,727 ) | $(392,490,131 ) |
Allspring Funds Trust:

Investment objective | The Portfolio seeks long-term capital appreciation. |
Adviser | Allspring Funds Management, LLC |
Subadvisers | Allspring Global Investments, LLC |
Allspring Global Investments (UK) Limited | |
Portfolio managers | Rushabh Amin, Petros N. Bocray, CFA, FRM, Travis L. Keshemberg, CFA, CIPM, FRM, Matthias Scheiber, CFA |
Average annual total returns (%) as of April 30, 2024 | ||
Inception date | Since inception | |
Allspring Macro Strategies Portfolio | 3-11-2024 | -2.53 |
Bloomberg Global Aggregate Index 1 | – | -3.31 * |
Macro Strategies Blended Index2 | – | -2.44 * |
Bloomberg U.S. TIPS Index3 | – | -1.57 * |
* | Based on the Portfolio’s inception date. |
1 | The Bloomberg Global Aggregate Index is a measure of global investment-grade debt performance. This multicurrency benchmark includes Treasury, government- related, corporate, and securitized fixed-rate bonds from both developed and emerging market issuers. You cannot invest directly in an index. |
2 | Source: Allspring Funds Management, LLC. The Macro Strategies Blended Index is composed of 50% of the Bloomberg Global Aggregate Index and 50% of the Bloomberg U.S. TIPS Index. You cannot invest directly in an index. |
3 | The Bloomberg U.S. Treasury Inflation-Protected Securities (TIPS) Index is an index of inflation-indexed-linked U.S. Treasury securities. You cannot invest directly in an index. |
CFA® and Chartered Financial Analyst® are trademarks owned by CFA Institute. |
Growth of $10,000 investment as of April 30, 20241 |
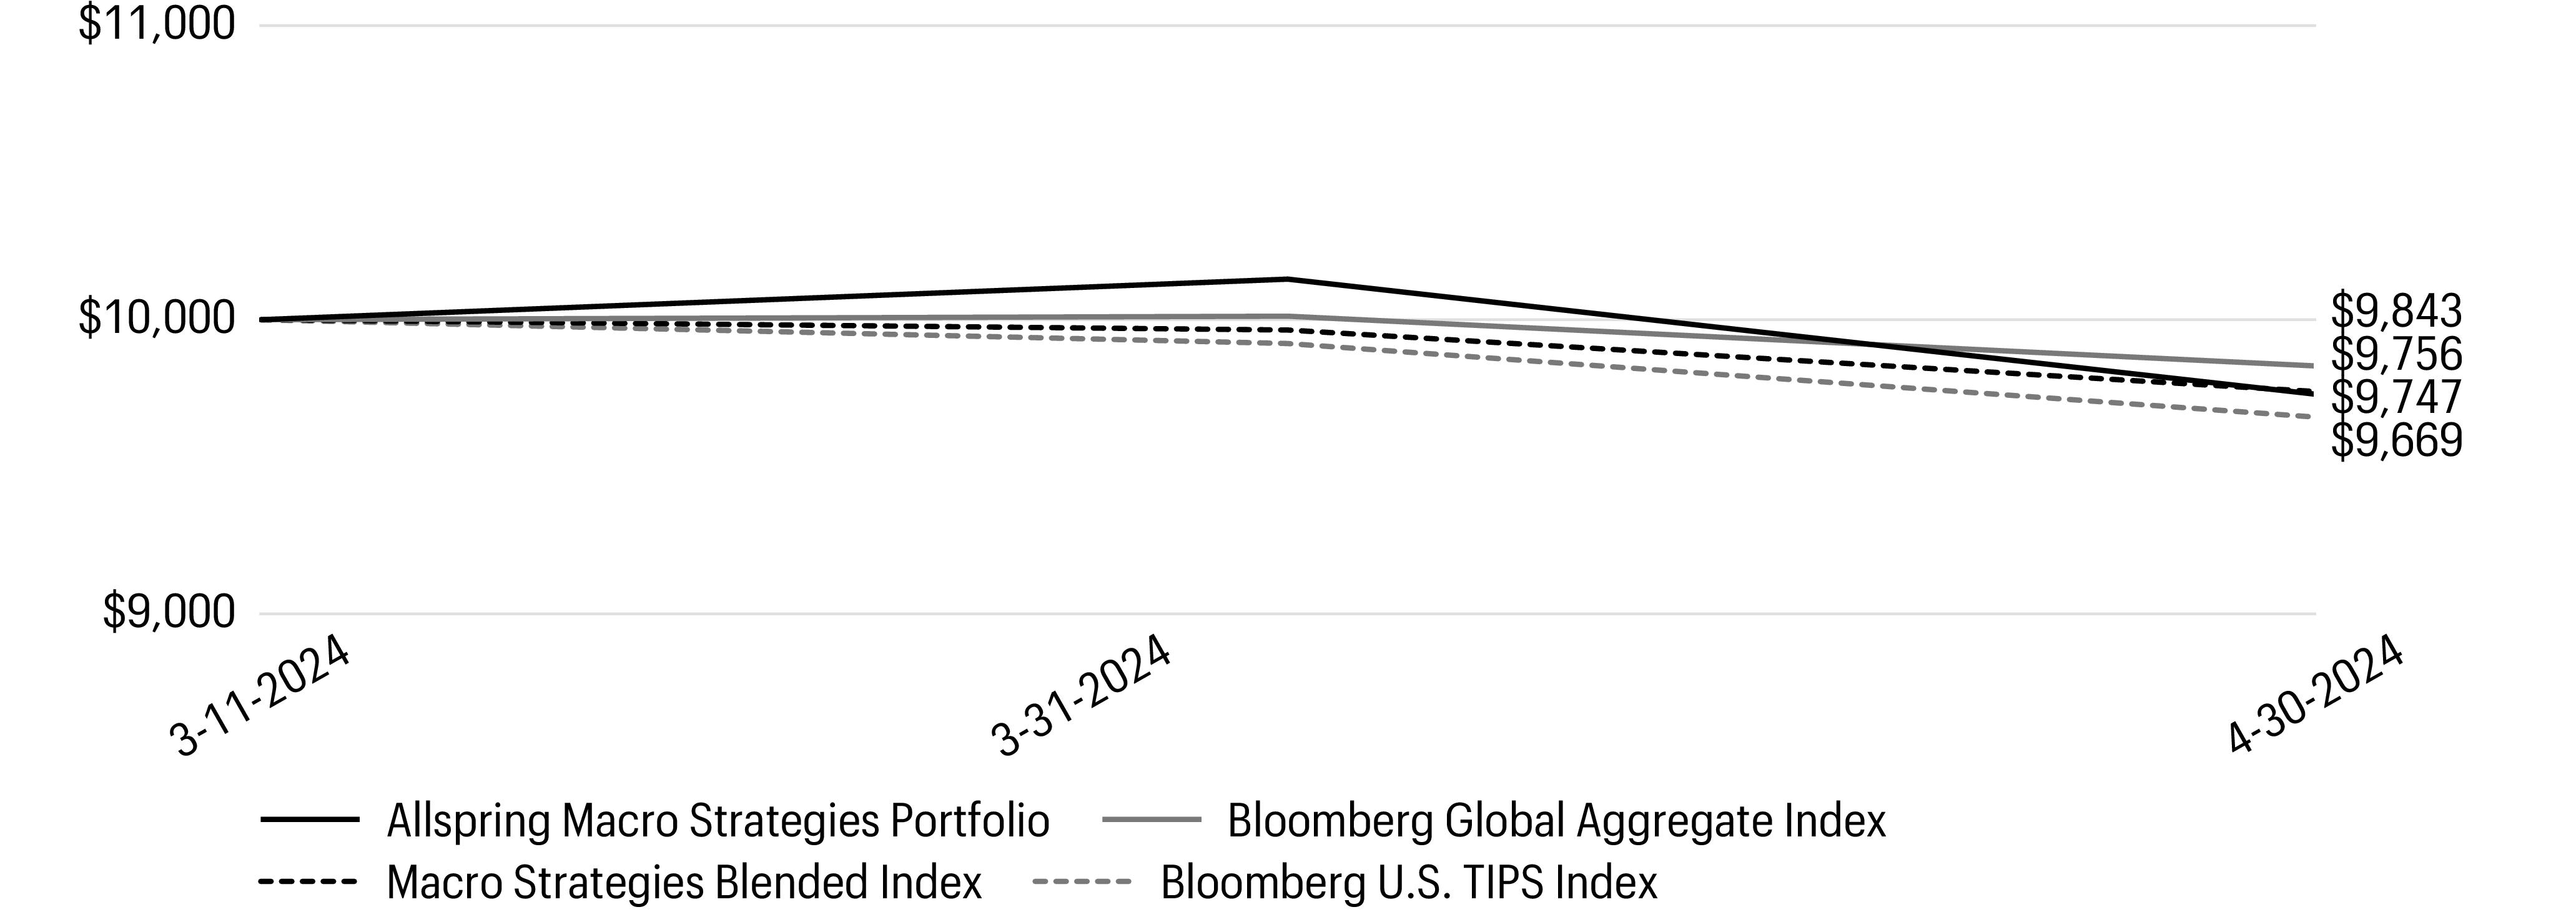
1 | The chart compares the performance of the Portfolio since inception with the Bloomberg Global Aggregate Index, Macro Strategies Blended Index and Bloomberg U.S. TIPS Index. The chart assumes a hypothetical investment of $10,000 investment and reflects all operating expenses of the Portfolio. |
Ten largest holdings (%) as of April 30, 20241 | |
TIPS, 2.00%, 1-15-2026 | 2.58 |
TIPS, 0.50%, 1-15-2028 | 2.57 |
TIPS, 0.13%, 7-15-2031 | 2.56 |
TIPS, 0.13%, 1-15-2032 | 2.56 |
TIPS, 2.38%, 10-15-2028 | 2.54 |
TIPS, 3.63%, 4-15-2028 | 2.53 |
TIPS, 0.75%, 2-15-2042 | 2.50 |
TIPS, 0.13%, 10-15-2026 | 1.69 |
TIPS, 3.88%, 4-15-2029 | 1.67 |
TIPS, 0.13%, 10-15-2025 | 1.32 |
1 | Figures represent the percentage of the Portfolio’s net assets. Holdings are subject to change and may have changed since the date specified. |
PORTFOLIO COMPOSITION AS OF April 30, 20241 |
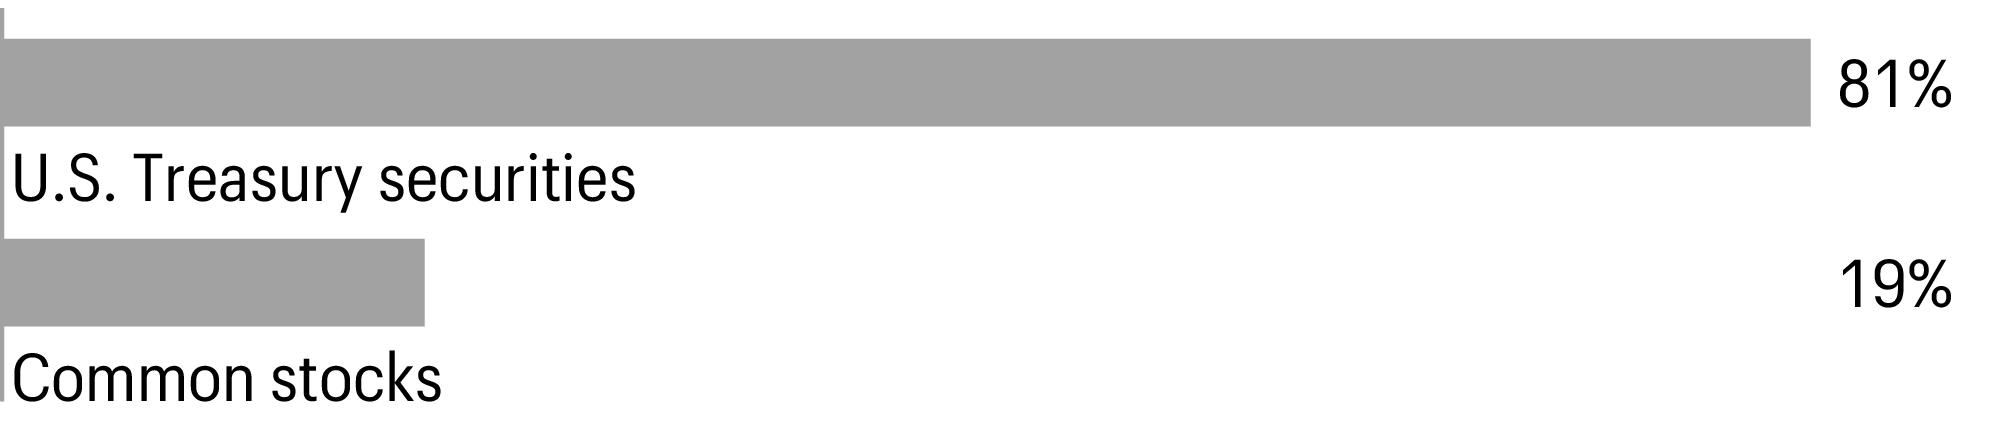
1 | Figures represent the percentage of the Portfolio’s long-term investments. Allocations are subject to change and may have changed since the date specified. |
Beginning account value 11-1-2023 | Ending account value 4-30-2024 | Consolidated expenses paid during the period1 | Annualized net expense ratio | |
Actual | $1,000.00 | $1,000.00 | $0.65 | 0.47 % |
Hypothetical (5% return before expenses) | $1,000.00 | $1,022.53 | $2.36 | 0.47 % |
1 | Consolidated expenses paid is equal to the annualized net expense ratio multiplied by the average account value over the period, multiplied by 182 divided by 366 (to reflect the one-half-year period). |
Shares | Value | |||||
Common stocks: 5.85% | ||||||
Real estate: 5.85% | ||||||
Health care REITs: 0.38% | ||||||
Welltower, Inc. | 12,412 | $1,182,616 | ||||
Industrial REITs : 0.84% | ||||||
Prologis, Inc. | 17,827 | 1,819,245 | ||||
Terreno Realty Corp. | 14,534 | 789,923 | ||||
2,609,168 | ||||||
Office REITs : 0.27% | ||||||
Alexandria Real Estate Equities, Inc. | 7,267 | 842,027 | ||||
Residential REITs : 1.28% | ||||||
American Homes 4 Rent Class A | 19,755 | 707,229 | ||||
Apartment Income REIT Corp. | 6,714 | 257,683 | ||||
Camden Property Trust | 6,322 | 630,177 | ||||
Invitation Homes, Inc. | 20,856 | 713,275 | ||||
Mid-America Apartment Communities, Inc. | 4,865 | 632,450 | ||||
Sun Communities, Inc. | 9,243 | 1,028,931 | ||||
3,969,745 | ||||||
Retail REITs : 0.41% | ||||||
Federal Realty Investment Trust | 4,925 | 513,037 | ||||
Simon Property Group, Inc. | 5,342 | 750,712 | ||||
1,263,749 | ||||||
Specialized REITs : 2.67% | ||||||
American Tower Corp. | 10,222 | 1,753,686 | ||||
Crown Castle, Inc. | 4,164 | 390,500 | ||||
CubeSmart | 5,659 | 228,850 | ||||
Equinix, Inc. | 2,482 | 1,764,975 | ||||
Extra Space Storage, Inc. | 6,759 | 907,599 | ||||
Four Corners Property Trust, Inc. | 15,121 | 354,587 | ||||
Gaming & Leisure Properties, Inc. | 8,877 | 379,314 | ||||
Iron Mountain, Inc. | 10,522 | 815,665 | ||||
SBA Communications Corp. Class A | 5,182 | 964,474 | ||||
VICI Properties, Inc. | 24,452 | 698,105 | ||||
8,257,755 | ||||||
Total common stocks (Cost $19,914,071) | 18,125,060 | |||||
Interest rate | Maturity date | Principal | ||||
U.S. Treasury securities: 25.45% | ||||||
TIPS | 0.13 % | 10-15-2025 | $ | 4,220,997 | 4,087,142 | |
TIPS | 0.13 | 7-15-2026 | 116,493 | 111,009 | ||
TIPS | 0.13 | 10-15-2026 | 5,518,141 | 5,227,296 | ||
TIPS | 0.13 | 4-15-2027 | 120,876 | 112,857 | ||
TIPS | 0.13 | 1-15-2031 | 4,481,431 | 3,893,647 | ||
Interest rate | Maturity date | Principal | Value | |||
U.S. Treasury securities(continued) | ||||||
TIPS | 0.13 % | 7-15-2031 | $ | 9,191,423 | $7,929,672 | |
TIPS | 0.13 | 1-15-2032 | 9,312,243 | 7,917,137 | ||
TIPS | 0.13 | 2-15-2052 | 6,887,919 | 3,732,420 | ||
TIPS | 0.38 | 1-15-2027 | 115,598 | 109,335 | ||
TIPS | 0.38 | 7-15-2027 | 114,152 | 107,490 | ||
TIPS | 0.50 | 1-15-2028 | 8,540,666 | 7,977,377 | ||
TIPS | 0.75 | 2-15-2042 | 10,229,446 | 7,751,497 | ||
TIPS | 1.63 | 10-15-2027 | 115,211 | 112,741 | ||
TIPS | 1.75 | 1-15-2028 | 118,479 | 115,893 | ||
TIPS | 2.00 | 1-15-2026 | 8,081,796 | 7,999,969 | ||
TIPS | 2.13 | 2-15-2041 | 680,054 | 657,023 | ||
TIPS | 2.38 | 1-15-2027 | 107,696 | 107,449 | ||
TIPS | 2.38 | 10-15-2028 | 7,840,310 | 7,884,902 | ||
TIPS | 3.63 | 4-15-2028 | 7,500,475 | 7,850,260 | ||
TIPS | 3.88 | 4-15-2029 | 4,812,666 | 5,167,542 | ||
Total U.S. Treasury securities (Cost $80,314,688) | 78,852,658 | |||||
Yield | Shares | |||||
Short-term investments: 45.46% | ||||||
Investment companies: 45.46% | ||||||
Allspring Government Money Market Fund Select Class♠∞* | 5.23 | 140,821,444 | 140,821,444 | |||
Total short-term investments (Cost $140,821,444) | 140,821,444 | |||||
Total investments in securities (Cost $241,050,203) | 76.76 % | 237,799,162 | ||||
Other assets and liabilities, net | 23.24 | 72,013,430 | ||||
Total net assets | 100.00 % | $309,812,592 | ||||
♠ | The issuer of the security is an affiliated person of the Portfolio as defined in the Investment Company Act of 1940. |
∞ | The rate represents the 7-day annualized yield at period end. |
* | A portion of the holding represents an investment held in Macro Strategies Special Investments (Cayman) Ltd., the consolidated entity. |
Abbreviations: | |
REIT | Real estate investment trust |
TIPS | Treasury Inflation-Protected Securities |
Value, beginning of period | Purchases | Sales proceeds | Net realized gains (losses) | Net change in unrealized gains (losses) | Value, end of period | Shares, end of period | Income from affiliated securities | |
Short-term investments | ||||||||
Allspring Government Money Market Fund Select Class | $0 | $532,043,929 | $(391,222,485 ) | $0 | $0 | $140,821,444 | 140,821,444 | $1,544,524 |
Currency to be received | Currency to be delivered | Counterparty | Settlement date | Unrealized gains | Unrealized losses | ||
USD | 10,588,823 | AUD | 16,241,000 | Morgan Stanley Co. | 5-15-2024 | $63,776 | $0 |
USD | 42,387,899 | AUD | 65,142,000 | Morgan Stanley Co. | 5-15-2024 | 172,356 | 0 |
AUD | 607,000 | USD | 394,800 | Morgan Stanley Co. | 5-15-2024 | 0 | (1,431 ) |
AUD | 3,433,000 | USD | 2,232,864 | Morgan Stanley Co. | 5-15-2024 | 0 | (8,095 ) |
USD | 8,693,738 | BRL | 44,232,000 | Morgan Stanley Co. | 5-15-2024 | 185,893 | 0 |
BRL | 3,833,000 | USD | 740,433 | Morgan Stanley Co. | 5-15-2024 | 0 | (3,171 ) |
USD | 18,114,568 | CAD | 24,796,000 | Morgan Stanley Co. | 5-15-2024 | 98,798 | 0 |
USD | 10,490,095 | CAD | 14,429,000 | Morgan Stanley Co. | 5-15-2024 | 6,568 | 0 |
CAD | 1,511,000 | USD | 1,101,447 | Morgan Stanley Co. | 5-15-2024 | 0 | (3,615 ) |
CAD | 682,000 | USD | 497,806 | Morgan Stanley Co. | 5-15-2024 | 0 | (2,292 ) |
CAD | 808,000 | USD | 589,775 | Morgan Stanley Co. | 5-15-2024 | 0 | (2,715 ) |
USD | 15,708,412 | CHF | 14,289,000 | Morgan Stanley Co. | 5-15-2024 | 143,381 | 0 |
CHF | 10,816,000 | USD | 11,890,418 | Morgan Stanley Co. | 5-15-2024 | 0 | (108,532 ) |
CHF | 1,004,000 | USD | 1,108,178 | Morgan Stanley Co. | 5-15-2024 | 0 | (14,519 ) |
CHF | 775,000 | USD | 850,065 | Morgan Stanley Co. | 5-15-2024 | 0 | (5,856 ) |
CHF | 359,000 | USD | 393,772 | Morgan Stanley Co. | 5-15-2024 | 0 | (2,713 ) |
USD | 7,240,006 | CLP | 6,900,305,000 | Morgan Stanley Co. | 5-15-2024 | 53,926 | 0 |
USD | 12,672,496 | CZK | 300,015,000 | Morgan Stanley Co. | 5-15-2024 | 0 | (56,280 ) |
CZK | 19,580,000 | USD | 826,828 | Morgan Stanley Co. | 5-15-2024 | 3,896 | 0 |
CZK | 10,055,000 | USD | 427,984 | Morgan Stanley Co. | 5-15-2024 | 0 | (1,379 ) |
USD | 15,942,084 | EUR | 14,817,000 | Morgan Stanley Co. | 5-15-2024 | 121,897 | 0 |
EUR | 943,000 | USD | 1,006,973 | Morgan Stanley Co. | 5-15-2024 | 0 | (127 ) |
EUR | 487,000 | USD | 521,989 | Morgan Stanley Co. | 5-15-2024 | 0 | (2,016 ) |
USD | 13,478,468 | GBP | 10,737,000 | Morgan Stanley Co. | 5-15-2024 | 61,198 | 0 |
GBP | 690,000 | USD | 857,739 | Morgan Stanley Co. | 5-15-2024 | 4,505 | 0 |
GBP | 322,000 | USD | 402,245 | Morgan Stanley Co. | 5-15-2024 | 135 | 0 |
USD | 8,272,380 | HUF | 3,012,378,000 | Morgan Stanley Co. | 5-15-2024 | 64,969 | 0 |
USD | 25,412,952 | IDR | 414,691,087,000 | Morgan Stanley Co. | 5-15-2024 | 0 | (84,794 ) |
IDR | 24,027,969,000 | USD | 1,481,470 | Morgan Stanley Co. | 5-15-2024 | 0 | (4,084 ) |
IDR | 12,446,551,000 | USD | 768,761 | Morgan Stanley Co. | 5-15-2024 | 0 | (3,471 ) |
USD | 33,462,411 | INR | 2,792,639,000 | Morgan Stanley Co. | 5-15-2024 | 4,944 | 0 |
INR | 202,572,000 | USD | 2,430,145 | Morgan Stanley Co. | 5-15-2024 | 0 | (3,212 ) |
INR | 85,903,000 | USD | 1,031,125 | Morgan Stanley Co. | 5-15-2024 | 0 | (1,956 ) |
USD | 12,628,600 | JPY | 1,921,372,000 | Morgan Stanley Co. | 5-15-2024 | 422,348 | 0 |
JPY | 1,756,409,000 | USD | 11,544,348 | Morgan Stanley Co. | 5-15-2024 | 0 | (386,087 ) |
JPY | 107,980,000 | USD | 700,851 | Morgan Stanley Co. | 5-15-2024 | 0 | (14,866 ) |
MXN | 188,476,000 | USD | 11,362,395 | Morgan Stanley Co. | 5-15-2024 | 0 | (381,145 ) |
USD | 9,559,964 | NOK | 103,583,000 | Morgan Stanley Co. | 5-15-2024 | 232,404 | 0 |
NOK | 9,277,000 | USD | 844,359 | Morgan Stanley Co. | 5-15-2024 | 0 | (8,973 ) |
USD | 11,720,673 | NZD | 19,605,000 | Morgan Stanley Co. | 5-15-2024 | 168,488 | 0 |
NZD | 1,259,000 | USD | 755,751 | Morgan Stanley Co. | 5-15-2024 | 0 | (13,889 ) |
NZD | 646,000 | USD | 383,504 | Morgan Stanley Co. | 5-15-2024 | 0 | (2,851 ) |
PLN | 42,544,000 | USD | 10,703,432 | Morgan Stanley Co. | 5-15-2024 | 0 | (216,397 ) |
USD | 922,287 | PLN | 3,724,000 | Morgan Stanley Co. | 5-15-2024 | 4,326 | 0 |
USD | 10,786,717 | SEK | 115,502,000 | Morgan Stanley Co. | 5-15-2024 | 300,533 | 0 |
USD | 42,509,195 | SEK | 455,716,000 | Morgan Stanley Co. | 5-15-2024 | 1,135,695 | 0 |
SEK | 10,403,000 | USD | 954,354 | Morgan Stanley Co. | 5-15-2024 | 0 | (9,888 ) |
SEK | 19,288,000 | USD | 1,769,449 | Morgan Stanley Co. | 5-15-2024 | 0 | (18,332 ) |
ZAR | 59,000 | USD | 3,135 | Morgan Stanley Co. | 5-15-2024 | 0 | (4 ) |
USD | 13,229,636 | KRW | 18,018,896,000 | Morgan Stanley Co. | 5-16-2024 | 183,573 | 0 |
Currency to be received | Currency to be delivered | Counterparty | Settlement date | Unrealized gains | Unrealized losses | ||
KRW | 1,088,344,000 | USD | 792,589 | Morgan Stanley Co. | 5-16-2024 | $0 | $(4,605 ) |
KRW | 549,496,000 | USD | 399,727 | Morgan Stanley Co. | 5-16-2024 | 0 | (1,880 ) |
$3,433,609 | $(1,369,175 ) | ||||||
Description | Number of contracts | Expiration date | Notional cost | Notional value | Unrealized gains | Unrealized losses |
Long | ||||||
LME Copper Futures** | 41 | 5-13-2024 | $9,480,034 | $10,151,323 | $671,289 | $0 |
LME Lead Futures** | 6 | 5-13-2024 | 328,569 | 328,412 | 0 | (157 ) |
LME Primary Aluminum Futures** | 142 | 5-13-2024 | 8,523,389 | 9,108,200 | 584,811 | 0 |
LME Zinc Futures** | 7 | 5-13-2024 | 499,924 | 511,844 | 11,920 | 0 |
CAC 40 Index | 140 | 5-17-2024 | 11,870,762 | 11,886,160 | 15,398 | 0 |
Light Sweet Crude Oil Futures** | 24 | 5-21-2024 | 2,036,959 | 1,966,320 | 0 | (70,639 ) |
Brent Crude Oil Futures** | 34 | 5-31-2024 | 3,018,569 | 2,935,220 | 0 | (83,349 ) |
NY Harbor ULSD Futures** | 48 | 5-31-2024 | 5,359,541 | 5,095,642 | 0 | (263,899 ) |
10-Year Euro BUND Index | 467 | 6-6-2024 | 65,907,015 | 64,829,616 | 0 | (1,077,399 ) |
Gas Oil Futures** | 28 | 6-12-2024 | 2,214,874 | 2,173,500 | 0 | (41,374 ) |
TOPIX Index | 229 | 6-13-2024 | 39,221,426 | 39,886,060 | 664,634 | 0 |
Euro Futures | 199 | 6-17-2024 | 27,167,737 | 26,612,519 | 0 | (555,218 ) |
10-Year U.S. Treasury Notes | 1,181 | 6-18-2024 | 131,299,623 | 126,883,688 | 0 | (4,415,935 ) |
Bloomberg Commodity Index** | 1 | 6-18-2024 | 9,844 | 10,167 | 323 | 0 |
S&P ASX Share Price Index 200 | 122 | 6-20-2024 | 15,300,056 | 15,183,949 | 0 | (116,107 ) |
S&P/TSX 60 Index | 116 | 6-20-2024 | 22,249,146 | 22,000,944 | 0 | (248,202 ) |
DAX Index | 25 | 6-21-2024 | 12,168,977 | 12,069,371 | 0 | (99,606 ) |
E-Mini Energy Select Sector Futures | 133 | 6-21-2024 | 13,731,056 | 13,100,500 | 0 | (630,556 ) |
E-Mini NASDAQ 100 Index | 102 | 6-21-2024 | 37,321,450 | 35,845,350 | 0 | (1,476,100 ) |
E-Mini S&P 500 Index | 312 | 6-21-2024 | 81,312,632 | 79,045,200 | 0 | (2,267,432 ) |
FTSE 100 Index | 149 | 6-21-2024 | 14,459,402 | 15,189,738 | 730,336 | 0 |
Henry Hub Natural Gas Futures** | 128 | 6-26-2024 | 2,990,186 | 2,968,320 | 0 | (21,866 ) |
Long Gilt Futures | 1,000 | 6-26-2024 | 121,748,189 | 119,681,915 | 0 | (2,066,274 ) |
Live Cattle Futures** | 3 | 6-28-2024 | 209,080 | 209,970 | 890 | 0 |
Number 2 Cotton Futures** | 20 | 7-9-2024 | 820,009 | 784,300 | 0 | (35,709 ) |
Corn Futures** | 77 | 7-12-2024 | 1,693,337 | 1,719,988 | 26,651 | 0 |
Soybean Futures** | 116 | 7-12-2024 | 6,725,551 | 6,745,400 | 19,849 | 0 |
Soybean Meal Futures** | 124 | 7-12-2024 | 4,169,362 | 4,363,560 | 194,198 | 0 |
Wheat Futures** | 83 | 7-12-2024 | 2,345,073 | 2,503,488 | 158,415 | 0 |
Cocoa Futures** | 40 | 7-16-2024 | 4,148,308 | 3,713,200 | 0 | (435,108 ) |
Short | ||||||
LME Copper Futures** | (29 ) | 5-13-2024 | (6,650,627 ) | (7,180,204 ) | 0 | (529,577 ) |
LME Lead Futures** | (82 ) | 5-13-2024 | (4,268,194 ) | (4,488,291 ) | 0 | (220,097 ) |
LME Nickel Futures** | (17 ) | 5-13-2024 | (1,808,577 ) | (1,948,404 ) | 0 | (139,827 ) |
LME Primary Aluminum Futures** | (82 ) | 5-13-2024 | (4,748,457 ) | (5,259,665 ) | 0 | (511,208 ) |
LME Zinc Futures** | (54 ) | 5-13-2024 | (3,399,024 ) | (3,948,507 ) | 0 | (549,483 ) |
Reformulated Gasoline Blendstock for Oxygen Blending Futures** | (34 ) | 5-31-2024 | (3,964,101 ) | (3,843,034 ) | 121,067 | 0 |
Lean Hogs Futures** | (64 ) | 6-14-2024 | (2,579,804 ) | (2,623,360 ) | 0 | (43,556 ) |
10-Year Australian Bond | (269 ) | 6-17-2024 | (20,023,259 ) | (19,609,360 ) | 413,899 | 0 |
New Zealand Dollar Futures | (676 ) | 6-17-2024 | (40,846,271 ) | (39,867,100 ) | 979,171 | 0 |
Swiss Franc Futures | (214 ) | 6-17-2024 | (30,473,760 ) | (29,259,150 ) | 1,214,610 | 0 |
Ultra Long Term U.S. Treasury Bond | (208 ) | 6-18-2024 | (26,252,930 ) | (24,869,000 ) | 1,383,930 | 0 |
Description | Number of contracts | Expiration date | Notional cost | Notional value | Unrealized gains | Unrealized losses |
Short (continued) | ||||||
10-Year Canadian Bond | (197 ) | 6-19-2024 | $(17,036,035 ) | $(16,741,387 ) | $294,648 | $0 |
E-Mini Russell 2000 Index | (184 ) | 6-21-2024 | (18,045,614 ) | (18,267,520 ) | 0 | (221,906 ) |
Euro STOXX 50 Index | (166 ) | 6-21-2024 | (8,794,401 ) | (8,675,295 ) | 119,106 | 0 |
MSCI Emerging Markets Index | (443 ) | 6-21-2024 | (23,122,735 ) | (23,080,300 ) | 42,435 | 0 |
U.S. Real Estate Futures | (526 ) | 6-21-2024 | (17,963,906 ) | (16,726,800 ) | 1,237,106 | 0 |
Gold 100 Troy Ounces Futures** | (30 ) | 6-26-2024 | (6,619,538 ) | (6,908,700 ) | 0 | (289,162 ) |
Number 11 World Sugar Futures** | (164 ) | 6-28-2024 | (3,537,438 ) | (3,565,229 ) | 0 | (27,791 ) |
Hard Red Winter Wheat Futures** | (2 ) | 7-12-2024 | (63,167 ) | (63,525 ) | 0 | (358 ) |
Soybean Oil Futures** | (30 ) | 7-12-2024 | (838,323 ) | (774,180 ) | 64,143 | 0 |
C Coffee Futures** | (9 ) | 7-19-2024 | (727,476 ) | (731,194 ) | 0 | (3,718 ) |
Silver Futures** | (16 ) | 7-29-2024 | (2,276,696 ) | (2,132,320 ) | 144,376 | 0 |
$9,093,205 | $(16,441,613 ) |
** | Represents an investment held in Macro Strategies Special Investments (Cayman) Ltd., the consolidated entity. |
Assets | |
Investments in unaffiliated securities, at value (cost $100,228,759) | $96,977,718 |
Investments in affiliated securities, at value (cost $140,821,444) | 140,821,444 |
Cash at broker segregated for futures contracts | 71,794,000 |
Receivable for daily variation margin on open futures contracts | 3,730,800 |
Unrealized gains on forward foreign currency contracts | 3,433,609 |
Receivable for interest | 897,679 |
Total assets | 317,655,250 |
Liabilities | |
Payable for daily variation margin on open futures contracts | 5,315,105 |
Unrealized losses on forward foreign currency contracts | 1,369,175 |
Cash collateral due to broker for forward foreign currency contracts | 300,000 |
Advisory fee payable | 100,843 |
Overdraft due to custodian bank | 6,889 |
Accrued expenses and other liabilities | 750,646 |
Total liabilities | 7,842,658 |
Total net assets | $309,812,592 |
Investment income | |
Income from affiliated securities | $1,544,524 |
Interest | 1,028,378 |
Dividends | 76,398 |
Total investment income | 2,649,300 |
Expenses | |
Advisory fee | 173,733 |
Custody and accounting fees | 1,598 |
Professional fees | 54,444 |
Interest holder report expenses | 2,055 |
Trustees’ fees and expenses | 3,014 |
Other fees and expenses | 2,603 |
Total expenses | 237,447 |
Net investment income | 2,411,853 |
Realized and unrealized gains (losses) on investments | |
Net realized gains (losses) on | |
Unaffiliated securities | 62,107 |
Foreign currency and foreign currency translations | (510 ) |
Forward foreign currency contracts | 1,058,528 |
Futures contracts | (3,068,533 ) |
Net realized losses on investments | (1,948,408 ) |
Net change in unrealized gains (losses) on | |
Unaffiliated securities | (3,251,041 ) |
Foreign currency and foreign currency translations | 150 |
Forward foreign currency contracts | 2,064,434 |
Futures contracts | (7,348,408 ) |
Net change in unrealized gains (losses) on investments | (8,534,865 ) |
Net realized and unrealized gains (losses) on investments | (10,483,273 ) |
Net decrease in net assets resulting from operations | $(8,071,420 ) |
Year Ended April 30, 20241 | ||
Operations | ||
Net investment income | $2,411,853 | |
Net realized losses on investments | (1,948,408 ) | |
Net change in unrealized gains (losses) on investments | (8,534,865 ) | |
Net decrease in net assets resulting from operations | (8,071,420 ) | |
Capital transactions | ||
Transactions in investors’ beneficial interests | ||
Contributions | 431,572,633 | |
Withdrawals | (113,688,621 ) | |
Net increase in net assets resulting from capital transactions | 317,884,012 | |
Total increase in net assets | 309,812,592 | |
Net assets | ||
Beginning of period | 0 | |
End of period | $309,812,592 | |
Year ended April 30 | |
20241 | |
Total return2 | (2.53 )% |
Ratios to average net assets (annualized) | |
Expenses | 0.47 % |
Net investment income | 4.76 % |
Supplemental data | |
Portfolio turnover rate | 1 % |
1 | For the period from March 11, 2024 (commencement of operations) to April 30, 2024 |
2 | Returns for periods of less than one year are not annualized. |
Gross unrealized gains | $380,511 |
Gross unrealized losses | (3,968,577 ) |
Net unrealized losses | $(3,588,066 ) |
Quoted prices (Level 1) | Other significant observable inputs (Level 2) | Significant unobservable inputs (Level 3) | Total | |
Assets | ||||
Investments in: | ||||
Common stocks | ||||
Real estate | $18,125,060 | $0 | $0 | $18,125,060 |
U.S. Treasury securities | 78,852,658 | 0 | 0 | 78,852,658 |
Short-term investments | ||||
Investment companies | 140,821,444 | 0 | 0 | 140,821,444 |
237,799,162 | 0 | 0 | 237,799,162 | |
Forward foreign currency contracts | 0 | 3,433,609 | 0 | 3,433,609 |
Futures contracts | 9,093,205 | 0 | 0 | 9,093,205 |
Total assets | $246,892,367 | $3,433,609 | $0 | $250,325,976 |
Liabilities | ||||
Forward foreign currency contracts | $0 | $1,369,175 | $0 | $1,369,175 |
Futures contracts | 16,441,613 | 0 | 0 | 16,441,613 |
Total liabilities | $16,441,613 | $1,369,175 | $0 | $17,810,788 |
Average daily net assets | Advisory fee |
First $1 billion | 0.350 % |
Next $4 billion | 0.325 |
Over $5 billion | 0.300 |
Purchases at cost | Sales proceeds | ||
U.S. government | Non-U.S. government | U.S. government | Non-U.S. government |
$79,499,321 | $20,682,905 | $0 | $830,941 |
Forward foreign currency contracts | |
Average contract amounts to buy | $13,350,604 |
Average contract amounts to sell | 36,722,320 |
Futures contracts | |
Average notional balance on long futures | $98,811,027 |
Average notional balance on short futures | 39,015,560 |
Interest rate risk | Commodity risk | Equity risk | Foreign currency risk | Total | |
Asset derivatives | |||||
Forward foreign currency contracts | $0 | $0 | $0 | $3,433,609 | $3,433,609 |
Futures contracts | 2,092,477 * | 1,997,932 * | 2,809,015 * | 2,193,781 * | 9,093,205 |
$2,092,477 | $1,997,932 | $2,809,015 | $5,627,390 | $12,526,814 | |
Liability derivatives | |||||
Forward foreign currency contracts | $0 | $0 | $0 | $1,369,175 | $1,369,175 |
Futures contracts | 7,559,608 * | 3,266,878 * | 5,059,909 * | 555,218 * | 16,441,613 |
$7,559,608 | $3,266,878 | $5,059,909 | $1,924,393 | $17,810,788 | |
* | Amount represents the cumulative unrealized gains (losses) as reported in the table following the Consolidated Portfolio of Investments. For futures contracts, only the current day’s variation margin as of April 30, 2024 is reported separately on the Consolidated Statement of Assets and Liabilities. |
INTEREST RATE RISK | Commodity risk | Equity risk | Foreign currency risk | TOTAL | |
Net realized gains (losses) on derivatives | |||||
Forward foreign currency contracts | $0 | $0 | $0 | $1,058,528 | $1,058,528 |
Futures contracts | (4,791,893 ) | 721,641 | 556,026 | 445,693 | (3,068,533 ) |
$(4,791,893 ) | $721,641 | $556,026 | $1,504,221 | $(2,010,005 ) | |
Net change in unrealized gains (losses) on derivatives | |||||
Forward foreign currency contracts | $0 | $0 | $0 | $2,064,434 | $2,064,434 |
Futures contracts | (5,467,131 ) | (1,268,946 ) | (2,250,894 ) | 1,638,563 | (7,348,408 ) |
$(5,467,131 ) | $(1,268,946 ) | $(2,250,894 ) | $3,702,997 | $(5,283,974 ) | |
Counterparty | Gross amounts of assets in the Consolidated Statement of Assets and Liabilities | Amounts subject to netting agreements | Collateral received | Net amount of assets |
Morgan Stanley Co. | $3,433,609 | $(1,369,175 ) | $0 | $2,064,434 |
Counterparty | Gross amounts of liabilities in the Consolidated Statement of Assets and Liabilities | Amounts subject to netting agreements | Collateral pledged | Net amount of liabilities |
Morgan Stanley Co. | $1,369,175 | $(1,369,175 ) | $0 | $0 |
Allspring Master Trust:
Name and year of birth | Position held and length of service** | Principal occupations during past five years or longer | Current other public company or investment company directorships |
William R. Ebsworth (Born 1957) | Trustee, since 2015 | Retired. From 1984 to 2013, equities analyst, portfolio manager, research director and chief investment officer at Fidelity Management and Research Company in Boston, Tokyo, and Hong Kong, and retired in 2013 as Chief Investment Officer of Fidelity Strategic Advisers, Inc. where he led a team of investment professionals managing client assets. Prior thereto, Board member of Hong Kong Securities Clearing Co., Hong Kong Options Clearing Corp., the Thailand International Fund, Ltd., Fidelity Investments Life Insurance Company, and Empire Fidelity Investments Life Insurance Company. Serves on the Investment Company Institute’s Board of Governors since 2022 and Executive Committee since 2023 as well as the Vice Chairman of the Governing Council of the Independent Directors Council since 2023. Audit Committee Chair and Investment Committee Chair of the Vincent Memorial Hospital Foundation (non-profit organization). Mr. Ebsworth is a CFA charterholder. | N/A |
Jane A. Freeman (Born 1953) | Trustee, since 2015; Chair Liaison, since January 2018*** | Retired. From 2012 to 2014 and 1999 to 2008, Chief Financial Officer of Scientific Learning Corporation. From 2008 to 2012, Ms. Freeman provided consulting services related to strategic business projects. Prior to 1999, Portfolio Manager at Rockefeller & Co. and Scudder, Stevens & Clark. Board member of the Harding Loevner Funds from 1996 to 2014, serving as both Lead Independent Director and chair of the Audit Committee. Board member of the Russell Exchange Traded Funds Trust from 2011 to 2012 and the chair of the Audit Committee. Ms. Freeman is also an inactive Chartered Financial Analyst. | N/A |
Isaiah Harris, Jr. (Born 1952) | Trustee, since 2009; Audit Committee Chair, since 2019 | Retired. Member of the Advisory Board of CEF of East Central Florida. Chairman of the Board of CIGNA Corporation from 2009 to 2021, and Director from 2005 to 2008. From 2003 to 2011, Director of Deluxe Corporation. Prior thereto, President and CEO of BellSouth Advertising and Publishing Corp. from 2005 to 2007, President and CEO of BellSouth Enterprises from 2004 to 2005 and President of BellSouth Consumer Services from 2000 to 2003. Emeritus member of the Iowa State University Foundation Board of Governors. Emeritus Member of the Advisory board of Iowa State University School of Business. Advisory Board Member, Palm Harbor Academy (private school). Advisory Board Member, Fellowship of Christian Athletes. Mr. Harris is a certified public accountant (inactive status). | N/A |
David F. Larcker (Born 1950) | Trustee, since 2009 | Distinguished Visiting Fellow at the Hoover Institution since 2022. James Irvin Miller Professor of Accounting at the Graduate School of Business (Emeritus), Stanford University, Director of the Corporate Governance Research Initiative and Senior Faculty of The Rock Center for Corporate Governance since 2006. From 2005 to 2008, Professor of Accounting at the Graduate School of Business, Stanford University. Prior thereto, Ernst & Young Professor of Accounting at The Wharton School, University of Pennsylvania from 1985 to 2005. | N/A |
Olivia S. Mitchell (Born 1953) | Trustee, since 2006 | International Foundation of Employee Benefit Plans Professor since 1993, Wharton School of the University of Pennsylvania. Director of Wharton’s Pension Research Council and Boettner Center on Pensions & Retirement Research, and Research Associate at the National Bureau of Economic Research. Previously taught at Cornell University from 1978 to 1993. | N/A |
Timothy J. Penny (Born 1951) | Trustee, since 1996; Chair, since 2018 | President and Chief Executive Officer of Southern Minnesota Initiative Foundation, a non-profit organization, since 2007. Vice Chair of the Economic Club of Minnesota, since 2007. Co-Chair of the Committee for a Responsible Federal Budget, since 1995. Member of the Board of Trustees of NorthStar Education Finance, Inc., a non-profit organization, from 2007-2022. Senior Fellow of the University of Minnesota Humphrey Institute from 1995 to 2017. | N/A |
Name and year of birth | Position held and length of service** | Principal occupations during past five years or longer | Current other public company or investment company directorships |
James G. Polisson (Born 1959) | Trustee, since 2018; Nominating and Governance Committee Chair, since 2024 | Retired. Chief Marketing Officer, Source (ETF) UK Services, Ltd, from 2015 to 2017. From 2012 to 2015, Principal of The Polisson Group, LLC, a management consulting, corporate advisory and principal investing company. Chief Executive Officer and Managing Director at Russell Investments, Global Exchange Traded Funds from 2010 to 2012. Managing Director of Barclays Global Investors from 1998 to 2010 and Global Chief Marketing Officer for iShares and Barclays Global Investors from 2000 to 2010. Trustee of the San Francisco Mechanics’ Institute, a non- profit organization, from 2013 to 2015. Board member of the Russell Exchange Traded Fund Trust from 2011 to 2012. Director of Barclays Global Investors Holdings Deutschland GmbH from 2006 to 2009. Mr. Polisson is an attorney and has a retired status with the Massachusetts and District of Columbia Bar Associations. | N/A |
Pamela Wheelock (Born 1959) | Trustee, since January 2020; previously Trustee from January 2018 to July 2019*** | Retired. Executive and Senior Financial leadership positions in the public, private and nonprofit sectors. Interim President and CEO, McKnight Foundation, 2020. Interim Commissioner, Minnesota Department of Human Services, 2019. Chief Operating Officer, Twin Cities Habitat for Humanity, 2017-2019. Vice President for University Services, University of Minnesota, 2012- 2016. Interim President and CEO, Blue Cross and Blue Shield of Minnesota, 2011-2012. Executive Vice-President and Chief Financial Officer, Minnesota Wild, 2002-2008. Commissioner, Minnesota Department of Finance, 1999-2002. Chair of the Board of Directors of Destination Medical Center Corporation. Board member of the Minnesota Wild Foundation. | N/A |
Name and year of birth | Position held and length of service | Principal occupations during past five years or longer |
Andrew Owen (Born 1960) | President, since 2017 | President and Chief Executive Officer of Allspring Funds Management, LLC since 2017 and Head of Global Fund Governance of Allspring Global Investments since 2022. Prior thereto, co-president of Galliard Capital Management, LLC, an affiliate of Allspring Funds Management, LLC, from 2019 to 2022 and Head of Affiliated Managers, Allspring Global Investments, from 2014 to 2019 and Executive Vice President responsible for marketing, investments and product development for Allspring Funds Management, LLC, from 2009 to 2014. |
Jeremy DePalma (Born 1974) | Treasurer, since 2012 (for certain funds in the Fund Complex); since 2021 (for the remaining funds in the Complex) | Senior Vice President of Allspring Funds Management, LLC since 2009. Senior Vice President of Evergreen Investment Management Company, LLC from 2008 to 2010 and head of the Fund Reporting and Control Team within Fund Administration from 2005 to 2010. |
Christopher Baker (Born 1976) | Chief Compliance Officer, since 2022 | Global Chief Compliance Officer for Allspring Global Investments since 2022. Prior thereto, Chief Compliance Officer for State Street Global Advisors from 2018 to 2021. Senior Compliance Officer for the State Street divisions of Alternative Investment Solutions, Sector Solutions, and Global Marketing from 2015 to 2018. From 2010 to 2015 Vice President, Global Head of Investment and Marketing Compliance for State Street Global Advisors. |
Matthew Prasse (Born 1983) | Chief Legal Officer, since 2022; Secretary, since 2021 | Senior Counsel of the Allspring Legal Department since 2021. Senior Counsel of the Wells Fargo Legal Department from 2018 to 2021. Previously, Counsel for Barings LLC from 2015 to 2018. Prior to joining Barings, Associate at Morgan, Lewis & Bockius LLP from 2008 to 2015. |

P.O. Box 219967
Kansas City, MO 64121-9967

AR3355 04-24
2 | |
6 | |
10 | |
11 | |
14 | |
15 | |
17 | |
19 | |
23 | |
30 | |
33 |

Allspring Funds

President
Allspring Funds
Notice to Shareholders |
Beginning in July 2024, the Fund will be required by the Securities and Exchange Commission to send shareholders a paper copy of a new tailored shareholder report in place of the full shareholder report that you are now receiving. The tailored shareholder report will contain concise information about the Fund, including certain expense and performance information and fund statistics. If you wish to receive this new tailored shareholder report electronically, please follow the instructions on the back cover of this report. |
Other information that is currently included in the shareholder report, such as the Fund’s financial statements, will be available online and upon request, free of charge, in paper or electronic format. |
Investment objective | The Fund seeks long-term total return, consisting of capital appreciation and current income. |
Manager | Allspring Funds Management, LLC |
Subadviser | Allspring Global Investments, LLC |
Portfolio managers | Petros N. Bocray, CFA, FRM, Travis L. Keshemberg, CFA, CIPM, FRM, David Kowalske, Jr.† |
Average annual total returns (%) as of April 30, 2024 | |||||||||
Including sales charge | Excluding sales charge | Expense ratios1 (%) | |||||||
Inception date | 1 year | 5 year | 10 year | 1 year | 5 year | 10 year | Gross | Net2 | |
Class A (EAAFX) | 7-29-1996 | 4.69 | 4.98 | 3.67 | 11.05 | 6.22 | 4.28 | 1.19 | 1.12 |
Class C (EACFX) | 10-3-2002 | 9.23 | 5.56 | 3.72 | 10.23 | 5.56 | 3.72 | 1.94 | 1.87 |
Administrator Class (EAIFX) | 10-3-2002 | – | – | – | 11.30 | 6.79 | 4.66 | 1.12 | 0.95 |
Institutional Class (EAAIX) | 11-30-2012 | – | – | – | 11.51 | 6.57 | 4.66 | 0.87 | 0.80 |
Russell 3000® Index3 | – | – | – | – | 22.30 | 12.43 | 11.81 | – | – |
Bloomberg U.S. Aggregate Bond Index4 | – | – | – | – | -1.47 | -0.16 | 1.20 | – | – |
Asset Allocation Blended Index5 | – | – | – | – | 11.08 | 6.76 | 6.23 | – | – |
MSCI ACWI ex USA Index (Net)6 | – | – | – | – | 9.32 | 5.03 | 3.93 | – | – |
1 | Reflects the expense ratios as stated in the most recent prospectuses, which include the impact of 0.44% in acquired fund fees and expenses. The expense ratios shown are subject to change and may differ from the annualized expense ratios shown in the Financial Highlights of this report, which do not include acquired fund fees and expenses. |
2 | The manager has contractually committed through September 30, 2025, to waive fees and/or reimburse expenses to the extent necessary to cap total annual fund operating expenses after fee waivers at 1.12% for Class A, 1.87% for Class C, 0.95% for Administrator Class and 0.80% for Institutional Class. Brokerage commissions, stamp duty fees, interest, taxes, acquired fund fees and expenses (if any) from funds in which the affiliated master portfolios and funds invest and from money market funds, and extraordinary expenses are excluded from the expense caps. All other acquired fund fees and expenses from the affiliated master portfolios and funds are included in the expense caps. Prior to or after the commitment expiration date, the caps may be increased or the commitment to maintain the caps may be terminated only with the approval of the Board of Trustees. Without these caps, the Fund’s returns would have been lower. The expense ratio paid by an investor is the net expense ratio (the total annual fund operating expenses after fee waivers) as stated in the prospectuses. |
3 | The Russell 3000® Index measures the performance of the 3,000 largest U.S. companies based on total market capitalization, which represents approximately 98% of the investable U.S. equity market. You cannot invest directly in an index. |
4 | The Bloomberg U.S. Aggregate Bond Index is a broad-based benchmark that measures the investment-grade, U.S.–dollar–denominated, fixed-rate taxable bond market, including Treasuries, government-related and corporate securities, mortgage-backed securities (agency fixed-rate and hybrid adjustable-rate mortgage pass-throughs), asset-backed securities, and commercial mortgage-backed securities. You cannot invest directly in an index. |
5 | Source: Allspring Funds Management, LLC. The Asset Allocation Blended Index is composed of the 45% Russell 3000® Index, 35% of the Bloomberg U.S. Aggregate Bond Index and 20% of the MSCI ACWI ex USA Index (Net). Prior to June 16, 2018, it was comprised of 65% of the MSCI ACWI Index (Net) and 35% of the Bloomberg U.S. Aggregate Bond Index. You cannot invest directly in an index. |
6 | The Morgan Stanley Capital International (MSCI) All Country World Index (ACWI) ex USA Index (Net) is a free-float-adjusted market-capitalization-weighted index that is designed to measure the equity market performance of developed and emerging markets, excluding the U.S. Source: MSCI. MSCI makes no express or implied warranties or representations and shall have no liability whatsoever with respect to any MSCI data contained herein. The MSCI data may not be further redistributed or used as a basis for other indexes or any securities or financial products. This report is not approved, reviewed, or produced by MSCI. You cannot invest directly in an index. |
† | Mr. Kowalske became a portfolio manager of the Fund effective January 16, 2024. |
CFA® and Chartered Financial Analyst® are trademarks owned by CFA Institute. | |
Growth of $10,000 investment as of April 30, 20241 |
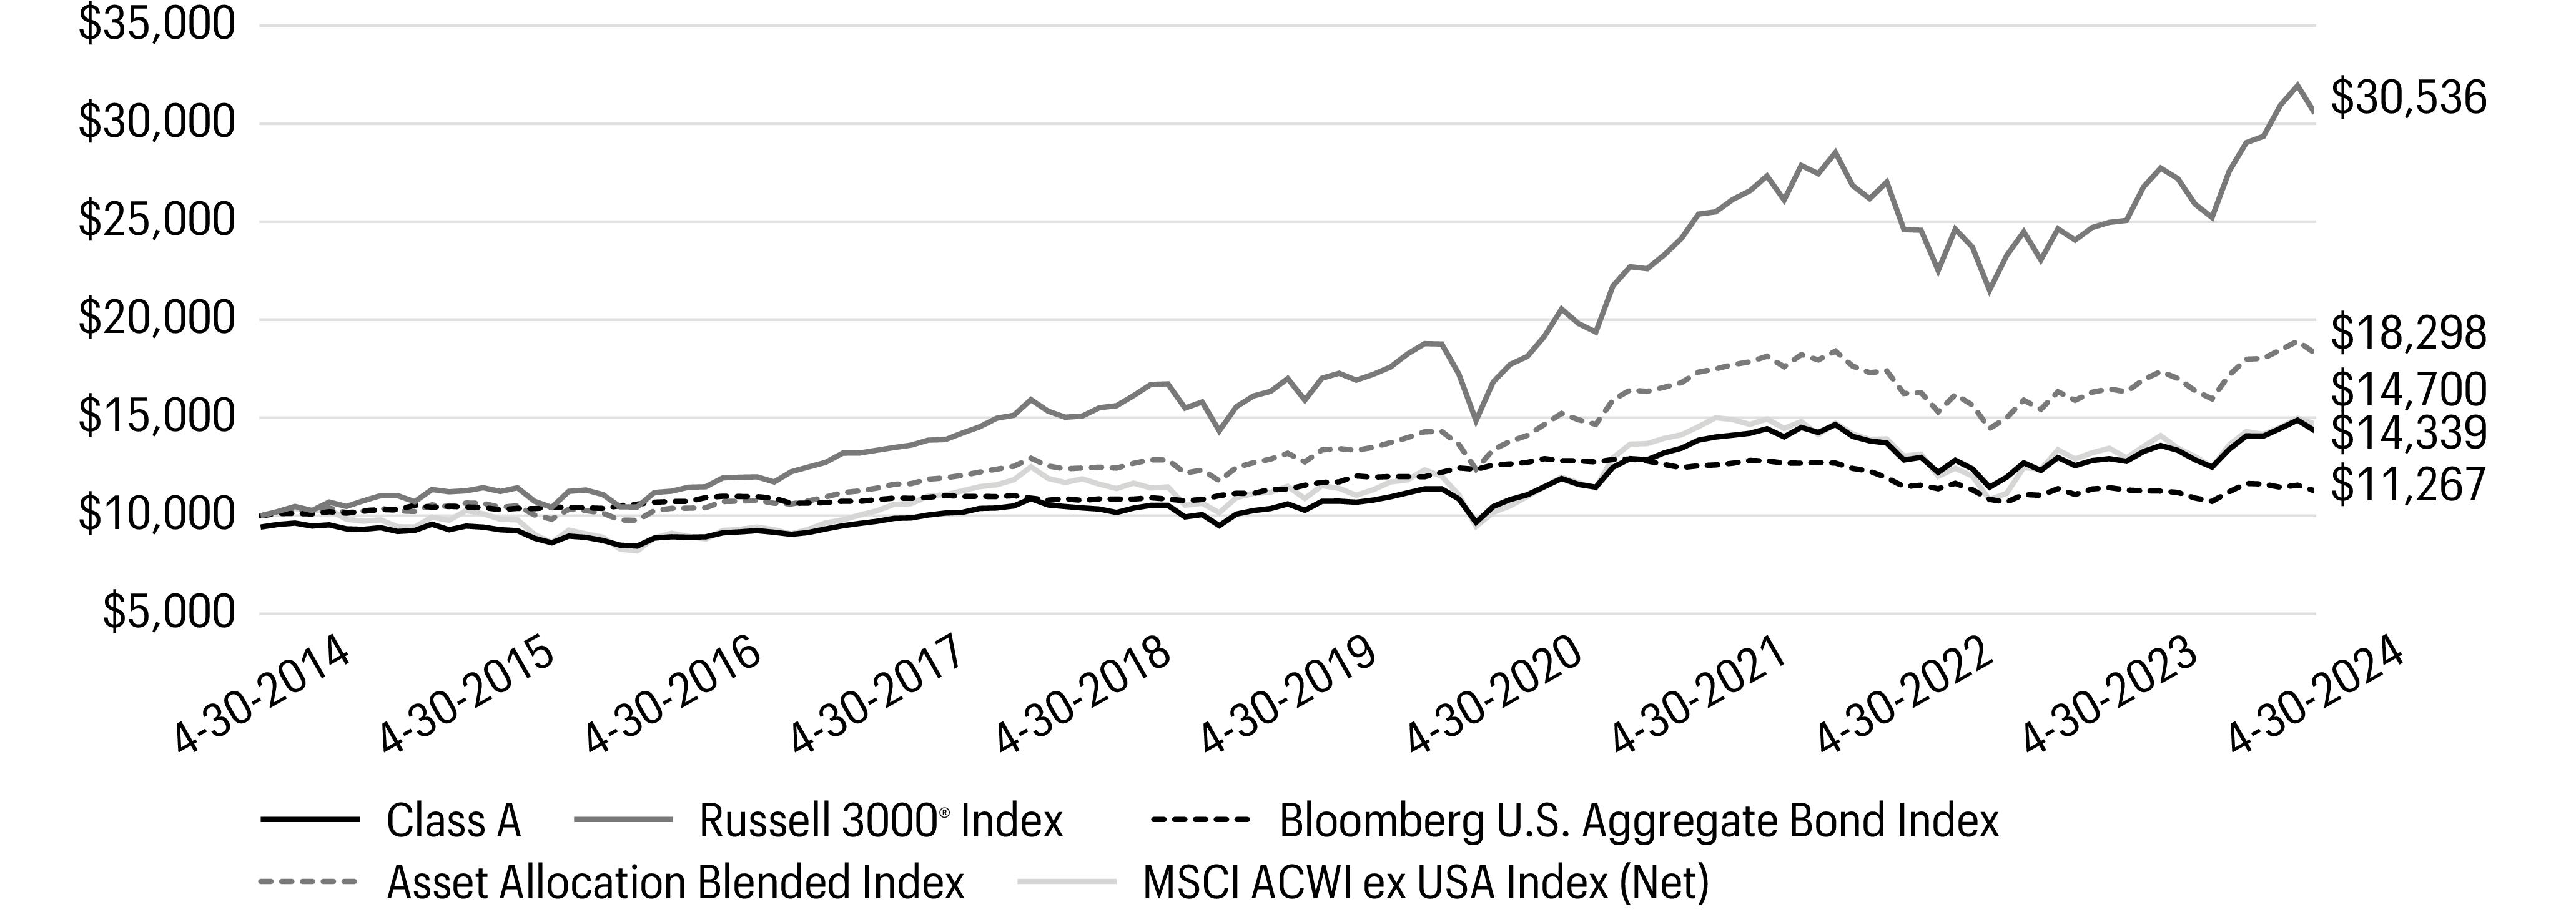
1 | The chart compares the performance of Class A shares for the most recent ten years with the Russell 3000® Index, Bloomberg U.S. Aggregate Bond Index, Asset Allocation Blended Index and MSCI ACWI ex USA Index (Net). The chart assumes a hypothetical investment of $10,000 in Class A shares and reflects all operating expenses and assumes the maximum initial sales charge of 5.75%. |
Ten largest holdings (%) as of April 30, 20241 | |
Allspring Managed Fixed Income Portfolio | 22.03 |
Allspring Disciplined U.S. Core Fund Class R6 | 13.59 |
Allspring Large Company Value Portfolio | 11.56 |
Allspring Disciplined International Developed Markets Portfolio | 10.32 |
Allspring Diversified Large Cap Growth Portfolio | 8.21 |
Allspring Core Bond Portfolio | 6.17 |
iShares Core MSCI EAFE ETF | 3.98 |
Allspring Large Cap Value Portfolio | 3.47 |
Allspring Real Return Portfolio | 3.43 |
Allspring Emerging Markets Equity Income Fund Class R6 | 2.82 |
1 | Figures represent the percentage of the Fund’s net assets. Holdings are subject to change and may have changed since the date specified. |
Allocation (%) as of April 30, 2024 | ||
Neutral allocation | Effective allocation1 | |
Stock Funds | 65 | 49 |
Bond Funds | 35 | 41 |
International Equity Funds | 0 | 20 |
Effective Cash | 0 | (10 ) |
1 | Effective allocation reflects the effect of the tactical futures overlay that may be in place. Effective cash, if any, represents the net offset to such future positions. Effective allocations are subject to change and may have changed since the date specified. |
Beginning account value 11-1-2023 | Ending account value 4-30-2024 | Expenses paid during the period1, 2 | Annualized net expense ratio2 | |
Class A | ||||
Actual | $1,000.00 | $1,148.57 | $5.07 | 0.95 % |
Hypothetical (5% return before expenses) | $1,000.00 | $1,020.14 | $4.77 | 0.95 % |
Class C | ||||
Actual | $1,000.00 | $1,144.25 | $9.01 | 1.69 % |
Hypothetical (5% return before expenses) | $1,000.00 | $1,016.46 | $8.47 | 1.69 % |
Administrator Class | ||||
Actual | $1,000.00 | $1,149.84 | $3.90 | 0.73 % |
Hypothetical (5% return before expenses) | $1,000.00 | $1,021.23 | $3.67 | 0.73 % |
Institutional Class | ||||
Actual | $1,000.00 | $1,150.41 | $3.37 | 0.63 % |
Hypothetical (5% return before expenses) | $1,000.00 | $1,021.73 | $3.17 | 0.63 % |
1 | Expenses paid is equal to the annualized net expense ratio of each class multiplied by the average account value over the period, multiplied by 182 divided by 366 (to reflect the one-half-year period). |
2 | Amounts reflect net expenses allocated from the affiliated Master Portfolios in which the Fund invests. |
Shares | Value | |||||
Investment companies: 98.63% | ||||||
Affiliated master portfolios: 70.11% | ||||||
Allspring Core Bond Portfolio | $90,701,809 | |||||
Allspring Disciplined International Developed Markets Portfolio | 151,795,020 | |||||
Allspring Diversified Large Cap Growth Portfolio | 120,660,450 | |||||
Allspring Emerging Growth Portfolio | 16,129,421 | |||||
Allspring Large Cap Value Portfolio | 50,987,644 | |||||
Allspring Large Company Value Portfolio | 170,027,065 | |||||
Allspring Managed Fixed Income Portfolio | 323,932,016 | |||||
Allspring Real Return Portfolio | 50,483,555 | |||||
Allspring Small Company Growth Portfolio | 16,399,321 | |||||
Allspring Small Company Value Portfolio | 39,632,229 | |||||
1,030,748,530 | ||||||
Exchange-traded funds: 9.30% | ||||||
Energy Select Sector SPDR Fund | 212,332 | 19,857,289 | ||||
iShares Core MSCI EAFE ETF | 814,170 | 58,457,406 | ||||
iShares Core U.S. Aggregate Bond ETF | 189,937 | 18,087,700 | ||||
iShares Russell 1000 Growth ETF | 124,962 | 40,342,732 | ||||
136,745,127 | ||||||
Stock funds: 19.22% | ||||||
Allspring Disciplined U.S. Core Fund Class R6♠ | 9,384,351 | 199,886,672 | ||||
Allspring Emerging Markets Equity Fund Class R6♠ | 1,632,798 | 41,277,140 | ||||
Allspring Emerging Markets Equity Income Fund Class R6♠ | 3,591,357 | 41,408,345 | ||||
282,572,157 | ||||||
Total investment companies (Cost $1,343,824,270) | 1,450,065,814 | |||||
Total investments in securities (Cost $1,343,824,270) | 98.63 % | 1,450,065,814 | ||||
Other assets and liabilities, net | 1.37 | 20,173,525 | ||||
Total net assets | 100.00 % | $1,470,239,339 | ||||
♠ | The issuer of the security is an affiliated person of the Fund as defined in the Investment Company Act of 1940. |
Value, beginning of period | Purchases | Sales proceeds | Net realized gains (losses) on affiliated Underlying Funds | Net change in unrealized gains (losses) on affiliated Underlying Funds | Value, end of period | |
Investment companies | ||||||
Allspring Disciplined U.S. Core Fund Class R6 | $179,645,604 | $36,999,023 | $(45,720,348 ) | $1,402,576 | $27,559,817 | $199,886,672 |
Allspring Emerging Markets Equity Fund Class R6 | 16,968,005 | 24,518,853 | (2,325,815 ) | 67,203 | 2,048,894 | 41,277,140 |
Allspring Emerging Markets Equity Income Fund Class R6 | 16,835,136 | 24,266,080 | (4,730,201 ) | 318,535 | 4,718,795 | 41,408,345 |
$1,788,314 | $34,327,506 | $282,572,157 |
Shares, end of period | Dividends from affiliated Underlying Funds | Net realized gains on capital gain distributions from affiliated Underlying Funds | |
Investment companies | |||
Allspring Disciplined U.S. Core Fund Class R6 | 9,384,351 | $2,047,383 | $13,382,094 |
Allspring Emerging Markets Equity Fund Class R6 | 1,632,798 | 493,359 | 0 |
Allspring Emerging Markets Equity Income Fund Class R6 | 3,591,357 | 488,762 | 0 |
$3,029,504 | $13,382,094 |
% of ownership, beginning of period | % of ownership, end of period | Net realized gains (losses) on investments allocated from affiliated Master Portfolios | Net change in unrealized gains (losses) on investments allocated from affiliated Master Portfolios | Interest allocated from affiliated Master Portfolios | Dividends allocated from affiliated Master Portfolios | Affiliated Income Allocated from affiliated Master Portfolios | Value, end of period | |
Allspring Core Bond Portfolio | 1.74 % | 1.81 % | $(3,385,760 ) | $(141,174 ) | $3,310,048 | $0 | $135,151 | $90,701,809 |
Allspring Disciplined International Developed Markets Portfolio | 85.71 | 51.18 | 938,416 | 11,373,079 | 6,667 | 3,067,185 | 160,483 | 151,795,020 |
Allspring Diversified Large Cap Growth Portfolio | 83.71 | 99.99 | 31,855,800 | (2,618,932 ) | 2,646 | 826,365 | 63,856 | 120,660,450 |
Allspring Emerging Growth Portfolio | 4.37 | 5.81 | 236,696 | 831,645 | 147 | 16,878 | 12,815 | 16,129,421 |
Allspring Factor Enhanced Emerging Markets Equity Portfolio | 16.43 | 0.00 | 859,537 | (159,722 ) | 1,101 | 297,636 | 19,077 | 0 |
Allspring Factor Enhanced International Equity Portfolio | 9.71 | 0.00 | 6,397,730 | (4,114,843 ) | 2,494 | 233,191 | 60,638 | 0 |
Allspring Large Cap Value Portfolio | 17.53 | 21.19 | 12,038,336 | (4,440,832 ) | 403 | 892,833 | 54,442 | 50,987,644 |
Allspring Large Company Value Portfolio | 84.18 | 99.99 | 13,322,153 | 16,713,306 | 14,391 | 2,820,206 | 138,083 | 170,027,065 |
Allspring Managed Fixed Income Portfolio | 81.08 | 99.99 | (7,179,073 ) | (1,687,896 ) | 10,790,789 | 0 | 191,245 | 323,932,016 |
Allspring Real Return Portfolio | 21.28 | 21.18 | (1,241,831 ) | 488,123 | 1,210,262 | 140,228 | 419,402 | 50,483,555 |
Allspring Small Company Growth Portfolio | 2.02 | 3.09 | 1,550,040 | 472,386 | 0 | 56,340 | 19,797 | 16,399,321 |
Allspring Small Company Value Portfolio | 6.72 | 5.53 | 2,163,978 | 4,355,429 | 90 | 651,102 | 16,719 | 39,632,229 |
$57,556,022 | $21,070,569 | $15,339,038 | $9,001,964 | $1,291,708 | $1,030,748,530 |
Description | Number of contracts | Expiration date | Notional cost | Notional value | Unrealized gains | Unrealized losses |
Long | ||||||
TOPIX Index | 254 | 6-13-2024 | $43,425,533 | $44,240,434 | $814,901 | $0 |
Euro Futures | 334 | 6-17-2024 | 45,760,853 | 44,666,238 | 0 | (1,094,615 ) |
S&P/TSX 60 Index | 78 | 6-20-2024 | 14,864,006 | 14,793,738 | 0 | (70,268 ) |
E-Mini NASDAQ 100 Index | 126 | 6-21-2024 | 46,100,000 | 44,279,550 | 0 | (1,820,450 ) |
E-Mini Russell 1000 Growth Index | 186 | 6-21-2024 | 31,304,561 | 30,431,460 | 0 | (873,101 ) |
E-Mini S&P 500 Index | 262 | 6-21-2024 | 67,641,735 | 66,377,700 | 0 | (1,264,035 ) |
Long Gilt Futures | 858 | 6-26-2024 | 103,668,978 | 102,687,083 | 0 | (981,895 ) |
Description | Number of contracts | Expiration date | Notional cost | Notional value | Unrealized gains | Unrealized losses |
Short | ||||||
New Zealand Dollar Futures | (736 ) | 6-17-2024 | $(45,247,924 ) | $(43,405,600 ) | $1,842,324 | $0 |
Swiss Franc Futures | (319 ) | 6-17-2024 | (45,890,787 ) | (43,615,275 ) | 2,275,512 | 0 |
10-Year U.S. Treasury Notes | (375 ) | 6-18-2024 | (40,508,454 ) | (40,289,062 ) | 219,392 | 0 |
Canadian Dollar Futures | (607 ) | 6-18-2024 | (44,105,903 ) | (44,144,075 ) | 0 | (38,172 ) |
Ultra Long Term U.S. Treasury Bond | (117 ) | 6-18-2024 | (14,773,836 ) | (13,988,813 ) | 785,023 | 0 |
E-Mini Russell 1000 Value Index | (369 ) | 6-21-2024 | (31,920,681 ) | (31,287,510 ) | 633,171 | 0 |
E-Mini Russell 2000 Index | (301 ) | 6-21-2024 | (29,454,727 ) | (29,883,280 ) | 0 | (428,553 ) |
Euro STOXX 50 Index | (557 ) | 6-21-2024 | (29,508,936 ) | (29,109,272 ) | 399,664 | 0 |
MSCI Emerging Markets Index | (882 ) | 6-21-2024 | (46,150,839 ) | (45,952,200 ) | 198,639 | 0 |
$7,168,626 | $(6,571,089 ) |
Assets | |
Investments in affiliated Master Portfolio, at value (cost $976,274,391) | $1,030,748,530 |
Investments in unaffiliated securities, at value (cost $134,964,993) | 136,745,127 |
Investments in affiliated Underlying Funds, at value (cost $232,584,886) | 282,572,157 |
Cash | 30,790 |
Cash at broker segregated for futures contracts | 19,498,102 |
Receivable for daily variation margin on open futures contracts | 4,683,630 |
Receivable for investments sold | 1,071,099 |
Receivable for Fund shares sold | 107,624 |
Prepaid expenses and other assets | 132,211 |
Total assets | 1,475,589,270 |
Liabilities | |
Payable for daily variation margin on open futures contracts | 3,576,597 |
Payable for Fund shares redeemed | 947,800 |
Shareholder servicing fees payable | 272,494 |
Administration fees payable | 228,374 |
Management fee payable | 215,060 |
Distribution fees payable | 11,401 |
Trustees’ fees and expenses payable | 1,114 |
Accrued expenses and other liabilities | 97,091 |
Total liabilities | 5,349,931 |
Total net assets | $1,470,239,339 |
Net assets consist of | |
Paid-in capital | $1,296,552,749 |
Total distributable earnings | 173,686,590 |
Total net assets | $1,470,239,339 |
Computation of net asset value and offering price per share | |
Net assets–Class A | $1,157,318,196 |
Shares outstanding–Class A1 | 82,252,752 |
Net asset value per share–Class A | $14.07 |
Maximum offering price per share – Class A2 | $14.93 |
Net assets–Class C | $18,069,333 |
Shares outstanding–Class C1 | 1,279,914 |
Net asset value per share–Class C | $14.12 |
Net assets–Administrator Class | $130,116,251 |
Shares outstanding–Administrator Class1 | 8,925,526 |
Net asset value per share–Administrator Class | $14.58 |
Net assets–Institutional Class | $164,735,559 |
Shares outstanding–Institutional Class1 | 11,645,065 |
Net asset value per share–Institutional Class | $14.15 |
Year Ended April 30, 20241 | Year Ended May 31, 2023 | |
Investment income | ||
Interest allocated from affiliated Master Portfolios | $15,339,038 | $16,196,175 |
Dividends allocated from affiliated Master Portfolios (net of foreign withholding taxes of $749,721 and $792,352, respectively) | 9,001,964 | 13,055,349 |
Dividends from unaffiliated securities | 3,612,517 | 2,831,731 |
Dividends from affiliated Underlying Funds | 3,029,504 | 3,390,367 |
Affiliated income allocated from affiliated Master Portfolios | 1,291,708 | 624,823 |
Interest | 633,041 | 178,042 |
Expenses allocated from affiliated Master Portfolios | (4,417,356 ) | (5,387,349 ) |
Waivers allocated from affiliated Master Portfolios | 456,103 | 621,670 |
Total investment income | 28,946,519 | 31,510,808 |
Expenses | ||
Management fee | 3,455,524 | 3,877,758 |
Administration fees | ||
Class A | 2,054,200 | 2,413,958 |
Class C | 32,553 | 49,327 |
Class R | 241 2 | 4,773 |
Administrator Class | 43,147 | 19,707 |
Institutional Class | 196,637 | 241,327 |
Shareholder servicing fees | ||
Class A | 2,554,954 | 2,869,585 |
Class C | 40,402 | 58,443 |
Class R | 279 2 | 5,548 |
Administrator Class | 82,616 | 37,522 |
Distribution fees | ||
Class C | 120,924 | 174,713 |
Class R | 268 2 | 5,414 |
Custody and accounting fees | 284 | 38,379 |
Professional fees | 60,270 | 21,301 |
Registration fees | 77,186 | 74,577 |
Shareholder report expenses | 83,160 | 76,106 |
Trustees’ fees and expenses | 24,302 | 21,213 |
Other fees and expenses | 37,319 | 21,600 |
Total expenses | 8,864,266 | 10,011,251 |
Less: Fee waivers and/or expense reimbursements | ||
Fund-level | (1,233,540 ) | (688,020 ) |
Class A | (7,764 ) | (192,135 ) |
Class C | (205 ) | (2,001 ) |
Year Ended April 30, 20241 | Year Ended May 31, 2023 | |
Administrator Class | (48,418 ) | (17,337 ) |
Institutional Class | 0 | (30,853 ) |
Net expenses | 7,574,339 | 9,080,905 |
Net investment income | 21,372,180 | 22,429,903 |
Realized and unrealized gains (losses) on investments | ||
Net realized gain (losses) on | ||
Investments allocated from affiliated Master Portfolios | $57,556,022 | $(14,680,399 ) |
Affiliated Underlying Funds | 1,788,314 | (7,526,006 ) |
Unaffiliated securities | 862,242 | (8,776,157 ) |
Foreign currency and foreign currency translations | 7,641 | (33,635 ) |
Futures contracts | 3,176,364 | (9,923,487 ) |
Capital gain distributions from affiliated Underlying Funds | 13,382,094 | 20,934,054 |
Net realized gains (losses) on investments | 76,772,677 | (20,005,630 ) |
Net change in unrealized gains (losses) on | ||
Investments allocated from affiliated Master Portfolios | 21,070,569 | (27,672,688 ) |
Affiliated Underlying Funds | 34,327,506 | (17,338,473 ) |
Unaffiliated securities | 1,818,581 | 6,805,373 |
Foreign currency and foreign currency translations | 0 | (1,883 ) |
Futures contracts | (5,882,650 ) | 6,282,467 |
Net change in unrealized gains (losses) on investments | 51,334,006 | (31,925,204 ) |
Net realized and unrealized gains (losses) on investments | 128,106,683 | (51,930,834 ) |
Net increase (decrease) in net assets resulting from operations | $149,478,863 | $(29,500,931 ) |
Year ended April 30, 20241 | Year ended May 31, 2023 | Year ended May 31, 2022 | ||||
Operations | ||||||
Net investment income | $21,372,180 | $22,429,903 | $21,071,267 | |||
Net realized gains (losses) on investments | 76,772,677 | (20,005,630 ) | 83,811,245 | |||
Net change in unrealized gains (losses) on investments | 51,334,006 | (31,925,204 ) | (226,564,977 ) | |||
Net increase (decrease) in net assets resulting from operations | 149,478,863 | (29,500,931 ) | (121,682,465 ) | |||
Distributions to shareholders from | ||||||
Net investment income and net realized gains | ||||||
Class A | 0 | (59,268,484 ) | (202,891,728 ) | |||
Class C | 0 | (417,954 ) | (5,423,558 ) | |||
Class R | 0 2 | (104,644 ) | (467,417 ) | |||
Administrator Class | 0 | (824,492 ) | (3,106,447 ) | |||
Institutional Class | 0 | (9,997,099 ) | (36,625,295 ) | |||
Tax basis return of capital | ||||||
Class A | 0 | (10,824,660 ) | 0 | |||
Class C | 0 | (221,191 ) | 0 | |||
Class R | 0 2 | (21,404 ) | 0 | |||
Administrator Class | 0 | (142,749 ) | 0 | |||
Institutional Class | 0 | (1,748,098 ) | 0 | |||
Total distributions to shareholders | 0 | (83,570,775 ) | (248,514,445 ) | |||
Capital share transactions | Shares | Shares | Shares | |||
Proceeds from shares sold | ||||||
Class A | 941,719 | 12,673,108 | 1,813,537 | 23,018,937 | 2,611,398 | 40,863,057 |
Class C | 91,177 | 1,229,599 | 124,931 | 1,564,255 | 182,136 | 2,833,723 |
Class R | 335 2 | 4,290 2 | 22,912 | 291,574 | 12,849 | 202,101 |
Administrator Class | 83,622 | 1,224,645 | 26,450 | 347,283 | 52,285 | 846,945 |
Institutional Class | 1,051,624 | 14,223,541 | 1,188,690 | 15,093,300 | 1,834,135 | 29,224,220 |
29,355,183 | 40,315,349 | 73,970,046 | ||||
Reinvestment of distributions | ||||||
Class A | 0 | 0 | 5,117,002 | 63,358,699 | 12,001,744 | 182,452,406 |
Class C | 0 | 0 | 49,303 | 621,218 | 357,553 | 5,298,942 |
Class R | 0 2 | 0 2 | 9,646 | 119,256 | 29,730 | 449,906 |
Administrator Class | 0 | 0 | 68,903 | 881,772 | 183,747 | 2,863,149 |
Institutional Class | 0 | 0 | 736,589 | 9,131,361 | 1,858,632 | 28,382,924 |
0 | 74,112,306 | 219,447,327 | ||||
Payment for shares redeemed | ||||||
Class A | (10,772,093 ) | (144,189,376 ) | (13,420,146 ) | (169,645,607 ) | (12,061,446 ) | (190,070,003 ) |
Class C | (510,997 ) | (6,917,930 ) | (1,018,638 ) | (12,896,313 ) | (1,380,131 ) | (21,542,495 ) |
Class R | (7,336 )2 | (93,180 )2 | (66,642 ) | (856,905 ) | (32,919 ) | (483,592 ) |
Administrator Class | (455,372 ) | (6,576,285 ) | (417,160 ) | (5,415,295 ) | (366,341 ) | (5,897,327 ) |
Institutional Class | (2,703,275 ) | (36,093,681 ) | (4,693,101 ) | (59,574,954 ) | (3,378,156 ) | (52,642,800 ) |
(193,870,452 ) | (248,389,074 ) | (270,636,217 ) | ||||
Year ended April 30, 20241 | Year ended May 31, 2023 | Year ended May 31, 2022 | ||||
Shares | Shares | Shares | ||||
Net asset value of shares issued in acquisition | ||||||
Class A | 4,553,347 | $64,444,454 | 0 | $0 | 0 | $0 |
Class C | 217,210 | 3,088,665 | 0 | 0 | 0 | 0 |
Administrator Class | 8,298,795 | 121,642,998 | 0 | 0 | 0 | 0 |
189,176,117 | 0 | 0 | ||||
Share conversions | ||||||
Class A | 170,297 | 2,215,824 | 0 | 0 | 0 | 0 |
Class R | (170,723 )3 | (2,215,824 )3 | 0 | 0 | 0 | 0 |
0 | 0 | 0 | ||||
Net increase (decrease) in net assets resulting from capital share transactions | 24,660,848 | (133,961,419 ) | 22,781,156 | |||
Total increase (decrease) in net assets | 174,139,711 | (247,033,125 ) | (347,415,754 ) | |||
Net assets | ||||||
Beginning of period | 1,296,099,628 | 1,543,132,753 | 1,890,548,507 | |||
End of period | $1,470,239,339 | $1,296,099,628 | $1,543,132,753 | |||
Year ended April 30 20241 | Year ended May 31 | Year ended April 30 | ||||
Class A | 2023 | 2022 | 2021 | 20202 | 2020 | |
Net asset value, beginning of period | $12.54 | $13.56 | $16.90 | $13.57 | $13.12 | $13.49 |
Net investment income | 0.21 3 | 0.20 3 | 0.18 3 | 0.18 3 | 0.02 | 0.21 3 |
Payment from affiliate | 0.00 | 0.00 | 0.00 | 0.00 4 | 0.00 | 0.00 |
Net realized and unrealized gains (losses) on investments | 1.32 | (0.43 ) | (1.20 ) | 3.75 | 0.43 | (0.36 ) |
Total from investment operations | 1.53 | (0.23 ) | (1.02 ) | 3.93 | 0.45 | (0.15 ) |
Distributions to shareholders from | ||||||
Net investment income | 0.00 | (0.30 ) | (0.18 ) | (0.41 ) | 0.00 | (0.06 ) |
Net realized gains | 0.00 | (0.37 ) | (2.14 ) | (0.19 ) | 0.00 | (0.16 ) |
Tax basis return of capital | 0.00 | (0.12 ) | 0.00 | 0.00 | 0.00 | 0.00 |
Total distributions to shareholders | 0.00 | (0.79 ) | (2.32 ) | (0.60 ) | 0.00 | (0.22 ) |
Net asset value, end of period | $14.07 | $12.54 | $13.56 | $16.90 | $13.57 | $13.12 |
Total return5 | 12.20 % | (1.54 )% | (7.42 )% | 29.45 %6 | 3.43 % | (1.26 )% |
Ratios to average net assets (annualized) | ||||||
Gross expenses | 1.08 %* | 1.11 %* | 1.09 %* | 1.14 %* | 1.21 %* | 1.22 %* |
Net expenses | 0.98 %* | 1.04 %* | 1.04 %* | 1.04 %* | 1.05 %* | 1.05 %* |
Net investment income | 1.71 %* | 1.60 %* | 1.15 %* | 1.19 %* | 1.22 %* | 1.54 %* |
Supplemental data | ||||||
Portfolio turnover rate7 | 104 % | 106 % | 111 % | 137 % | 13 % | 109 % |
Net assets, end of period (000s omitted) | $1,157,318 | $1,095,066 | $1,272,420 | $1,542,707 | $1,287,856 | $1,253,699 |
* | Ratios include only the net expenses allocated from the affiliated Master Portfolios and do not include expenses from any other affiliated Underlying Funds. Net expenses allocated from the affiliated Master Portfolios included in the ratios were as follows: |
Year ended April 30, 20241 | 0.32% |
Year ended May 31, 2023 | 0.35% |
Year ended May 31, 2022 | 0.34% |
Year ended May 31, 2021 | 0.38% |
Year ended May 31, 20202 | 0.45% |
Year ended April 30, 2020 | 0.45% |
1 | For the eleven months ended April 30, 2024. The Fund changed its fiscal year end from May 31 to April 30, effective April 30, 2024. |
2 | For the one month ended May 31, 2020. The Fund changed its fiscal year end from April 30 to May 31, effective May 31, 2020. |
3 | Calculated based upon average shares outstanding |
4 | Amount is less than $0.005. |
5 | Total return calculations do not include any sales charges. Returns for periods of less than one year are not annualized. |
6 | For year ended May 31, 2021, the Fund received a payment from an affiliate that had an impact of less than 0.005% on total return. |
7 | Portfolio turnover rate is calculated by multiplying the Fund’s ownership percentage in the respective affiliated Master Portfolio by the corresponding affiliated Master Portfolio’s purchases and sales. These purchases and sales amounts are aggregated with the direct purchases and sales in the affiliated Underlying Funds and unaffiliated securities and included in the portfolio turnover calculation. |
Year ended April 30 20241 | Year ended May 31 | Year ended April 30 | ||||
Class C | 2023 | 2022 | 2021 | 20202 | 2020 | |
Net asset value, beginning of period | $12.66 | $13.34 | $16.60 | $13.01 | $12.58 | $12.99 |
Net investment income | 0.12 3 | 0.11 3 | 0.06 3 | 0.06 3 | 0.01 3 | 0.11 3 |
Payment from affiliate | 0.00 | 0.00 | 0.00 | 0.17 | 0.00 | 0.00 |
Net realized and unrealized gains (losses) on investments | 1.34 | (0.42 ) | (1.18 ) | 3.54 | 0.42 | (0.36 ) |
Total from investment operations | 1.46 | (0.31 ) | (1.12 ) | 3.77 | 0.43 | (0.25 ) |
Distributions to shareholders from | ||||||
Net realized gains | 0.00 | (0.25 ) | (2.14 ) | (0.18 ) | 0.00 | (0.16 ) |
Tax basis return of capital | 0.00 | (0.12 ) | 0.00 | 0.00 | 0.00 | 0.00 |
Total distributions to shareholders | 0.00 | (0.37 ) | (2.14 ) | (0.18 ) | 0.00 | (0.16 ) |
Net asset value, end of period | $14.12 | $12.66 | $13.34 | $16.60 | $13.01 | $12.58 |
Total return4 | 11.53 % | (2.34 )% | (8.08 )% | 29.19 %5 | 3.42 % | (2.02 )% |
Ratios to average net assets (annualized) | ||||||
Gross expenses | 1.83 %* | 1.85 %* | 1.83 %* | 1.89 %* | 1.96 %* | 1.97 %* |
Net expenses | 1.72 %* | 1.79 %* | 1.78 %* | 1.79 %* | 1.79 %* | 1.80 %* |
Net investment income | 0.97 %* | 0.83 %* | 0.38 %* | 0.43 %* | 0.47 %* | 0.82 %* |
Supplemental data | ||||||
Portfolio turnover rate6 | 104 % | 106 % | 111 % | 137 % | 13 % | 109 % |
Net assets, end of period (000s omitted) | $18,069 | $18,774 | $31,038 | $52,586 | $118,081 | $120,029 |
* | Ratios include only the net expenses allocated from the affiliated Master Portfolios and do not include expenses from any other affiliated Underlying Funds. Net expenses allocated from the affiliated Master Portfolios included in the ratios were as follows: |
Year ended April 30, 20241 | 0.32% |
Year ended May 31, 2023 | 0.35% |
Year ended May 31, 2022 | 0.34% |
Year ended May 31, 2021 | 0.39% |
Year ended May 31, 20202 | 0.44% |
Year ended April 30, 2020 | 0.45% |
1 | For the eleven months ended April 30, 2024. The Fund changed its fiscal year end from May 31 to April 30, effective April 30, 2024. |
2 | For the one month ended May 31, 2020. The Fund changed its fiscal year end from April 30 to May 31, effective May 31, 2020. |
3 | Calculated based upon average shares outstanding |
4 | Total return calculations do not include any sales charges. Returns for periods of less than one year are not annualized. |
5 | For year ended May 31, 2021, the Fund received a payment from an affiliate which had a 1.29% impact on the total return. |
6 | Portfolio turnover rate is calculated by multiplying the Fund’s ownership percentage in the respective affiliated Master Portfolio by the corresponding affiliated Master Portfolio’s purchases and sales. These purchases and sales amounts are aggregated with the direct purchases and sales in the affiliated Underlying Funds and unaffiliated securities and included in the portfolio turnover calculation. |
Year ended April 30 20241 | Year ended May 31 | Year ended April 30 | ||||
Administrator Class | 2023 | 2022 | 2021 | 20202 | 2020 | |
Net asset value, beginning of period | $12.97 | $13.89 | $17.25 | $13.75 | $13.29 | $13.66 |
Net investment income | 0.24 3 | 0.23 3 | 0.21 3 | 0.21 3 | 0.02 3 | 0.24 3 |
Payment from affiliate | 0.00 | 0.00 | 0.00 | 0.12 | 0.00 | 0.00 |
Net realized and unrealized gains (losses) on investments | 1.37 | (0.31 ) | (1.22 ) | 3.81 | 0.44 | (0.37 ) |
Total from investment operations | 1.61 | (0.08 ) | (1.01 ) | 4.14 | 0.46 | (0.13 ) |
Distributions to shareholders from | ||||||
Net investment income | 0.00 | (0.33 ) | (0.21 ) | (0.45 ) | 0.00 | (0.08 ) |
Net realized gains | 0.00 | (0.39 ) | (2.14 ) | (0.19 ) | 0.00 | (0.16 ) |
Tax basis return of capital | 0.00 | (0.12 ) | 0.00 | 0.00 | 0.00 | 0.00 |
Total distributions to shareholders | 0.00 | (0.84 ) | (2.35 ) | (0.64 ) | 0.00 | (0.24 ) |
Net asset value, end of period | $14.58 | $12.97 | $13.89 | $17.25 | $13.75 | $13.29 |
Total return4 | 12.41 % | (0.39 )%5 | (7.21 )% | 30.62 %6 | 3.46 % | (1.08 )% |
Ratios to average net assets (annualized) | ||||||
Gross expenses | 1.00 %* | 1.02 %* | 1.01 %* | 1.06 %* | 1.13 %* | 1.14 %* |
Net expenses | 0.76 %* | 0.86 %* | 0.86 %* | 0.87 %* | 0.86 %* | 0.86 %* |
Net investment income | 1.79 %* | 1.78 %* | 1.32 %* | 1.36 %* | 1.40 %* | 1.74 %* |
Supplemental data | ||||||
Portfolio turnover rate7 | 104 % | 106 % | 111 % | 137 % | 13 % | 109 % |
Net assets, end of period (000s omitted) | $130,116 | $12,949 | $18,332 | $25,026 | $21,628 | $21,316 |
* | Ratios include only the net expenses allocated from the affiliated Master Portfolios and do not include expenses from any other affiliated Underlying Funds. Net expenses allocated from the affiliated Master Portfolios included in the ratios were as follows: |
Year ended April 30, 20241 | 0.32% |
Year ended May 31, 2023 | 0.35% |
Year ended May 31, 2022 | 0.34% |
Year ended May 31, 2021 | 0.38% |
Year ended May 31, 20202 | 0.45% |
Year ended April 30, 2020 | 0.44% |
1 | For the eleven months ended April 30, 2024. The Fund changed its fiscal year end from May 31 to April 30, effective April 30, 2024. |
2 | For the one month ended May 31, 2020. The Fund changed its fiscal year end from April 30 to May 31, effective May 31, 2020. |
3 | Calculated based upon average shares outstanding |
4 | Returns for periods of less than one year are not annualized. |
5 | During the year ended May 31, 2023, the Fund received payments from a service provider which had a 1.28% impact on the total return. |
6 | For year ended May 31, 2021, the Fund received a payment from an affiliate which had a 0.90% impact on the total return. |
7 | Portfolio turnover rate is calculated by multiplying the Fund’s ownership percentage in the respective affiliated Master Portfolio by the corresponding affiliated Master Portfolio’s purchases and sales. These purchases and sales amounts are aggregated with the direct purchases and sales in the affiliated Underlying Funds and unaffiliated securities and included in the portfolio turnover calculation. |
Year ended April 30 20241 | Year ended May 31 | Year ended April 30 | ||||
Institutional Class | 2023 | 2022 | 2021 | 20202 | 2020 | |
Net asset value, beginning of period | $12.57 | $13.60 | $16.94 | $13.61 | $13.14 | $13.52 |
Net investment income | 0.25 3 | 0.25 3 | 0.24 3 | 0.24 | 0.02 3 | 0.26 3 |
Net realized and unrealized gains (losses) on investments | 1.33 | (0.44 ) | (1.20 ) | 3.74 | 0.45 | (0.38 ) |
Total from investment operations | 1.58 | (0.19 ) | (0.96 ) | 3.98 | 0.47 | (0.12 ) |
Distributions to shareholders from | ||||||
Net investment income | 0.00 | (0.35 ) | (0.24 ) | (0.46 ) | 0.00 | (0.10 ) |
Net realized gains | 0.00 | (0.37 ) | (2.14 ) | (0.19 ) | 0.00 | (0.16 ) |
Tax basis return of capital | 0.00 | (0.12 ) | 0.00 | 0.00 | 0.00 | 0.00 |
Total distributions to shareholders | 0.00 | (0.84 ) | (2.38 ) | (0.65 ) | 0.00 | (0.26 ) |
Net asset value, end of period | $14.15 | $12.57 | $13.60 | $16.94 | $13.61 | $13.14 |
Total return4 | 12.57 % | (1.21 )% | (7.10 )% | 29.76 % | 3.58 % | (1.01 )% |
Ratios to average net assets (annualized) | ||||||
Gross expenses | 0.76 %* | 0.78 %* | 0.76 %* | 0.81 %* | 0.88 %* | 0.89 %* |
Net expenses | 0.66 %* | 0.71 %* | 0.71 %* | 0.71 %* | 0.72 %* | 0.72 %* |
Net investment income | 2.04 %* | 1.92 %* | 1.48 %* | 1.52 %* | 1.55 %* | 1.88 %* |
Supplemental data | ||||||
Portfolio turnover rate5 | 104 % | 106 % | 111 % | 137 % | 13 % | 109 % |
Net assets, end of period (000s omitted) | $164,736 | $167,088 | $218,479 | $266,822 | $231,652 | $227,529 |
* | Ratios include only the net expenses allocated from the affiliated Master Portfolios and do not include expenses from any other affiliated Underlying Funds. Net expenses allocated from the affiliated Master Portfolios included in the ratios were as follows: |
Year ended April 30, 20241 | 0.32% |
Year ended May 31, 2023 | 0.35% |
Year ended May 31, 2022 | 0.34% |
Year ended May 31, 2021 | 0.38% |
Year ended May 31, 20202 | 0.45% |
Year ended April 30, 2020 | 0.45% |
1 | For the eleven months ended April 30, 2024. The Fund changed its fiscal year end from May 31 to April 30, effective April 30, 2024. |
2 | For the one month ended May 31, 2020. The Fund changed its fiscal year end from April 30 to May 31, effective May 31, 2020. |
3 | Calculated based upon average shares outstanding |
4 | Returns for periods of less than one year are not annualized. |
5 | Portfolio turnover rate is calculated by multiplying the Fund’s ownership percentage in the respective affiliated Master Portfolio by the corresponding affiliated Master Portfolio’s purchases and sales. These purchases and sales amounts are aggregated with the direct purchases and sales in the affiliated Underlying Funds and unaffiliated securities and included in the portfolio turnover calculation. |
Gross unrealized gains | $133,595,648 |
Gross unrealized losses | (20,654,969 ) |
Net unrealized gains | $112,940,679 |
Paid-in capital | Total distributable earnings |
$(3,106,717 ) | $3,106,717 |
Quoted prices (Level 1) | Other significant observable inputs (Level 2) | Significant unobservable inputs (Level 3) | Total | |
Assets | ||||
Investments in: | ||||
Investment companies | $419,317,284 | $0 | $0 | $419,317,284 |
Investments measured at net asset value* | 1,030,748,530 | |||
419,317,284 | 0 | 0 | 1,450,065,814 | |
Futures contracts | 7,168,626 | 0 | 0 | 7,168,626 |
Total assets | $426,485,910 | $0 | $0 | $1,457,234,440 |
Liabilities | ||||
Futures contracts | $6,571,089 | $0 | $0 | $6,571,089 |
Total liabilities | $6,571,089 | $0 | $0 | $6,571,089 |
* | Investments that are measured at fair value using the net asset value per share (or its equivalent) as a practical expedient have not been categorized in the fair value hierarchy. The fair value amount presented in the table is intended to permit reconciliation of the fair value hierarchy to the amounts presented in the Statement of Assets and Liabilities. The Fund’s investments in the affiliated Master Portfolios are valued at $1,030,748,530. Each affiliated Master Portfolio does not have a redemption period notice, can be redeemed daily and does not have any unfunded commitments. |
Affiliated Master Portfolio | Investment objective |
Allspring Core Bond Portfolio | Seeks total return, consisting of income and capital appreciation |
Allspring Disciplined International Developed Markets Portfolio | Seeks long-term capital appreciation |
Allspring Diversified Large Cap Growth Portfolio | Seeks long-term capital appreciation |
Allspring Emerging Growth Portfolio | Seeks long-term capital appreciation |
Allspring Factor Enhanced Emerging Markets Equity Portfolio * | Seeks long-term capital appreciation |
Allspring Factor Enhanced International Equity Portfolio * | Seeks long-term capital appreciation |
Allspring Large Cap Value Portfolio | Seeks maximum long-term total return (current income and capital appreciation), consistent with minimizing risk to principal |
Allspring Large Company Value Portfolio | Seeks long-term capital appreciation |
Allspring Managed Fixed Income Portfolio | Seeks consistent fixed-income returns |
Allspring Real Return Portfolio | Seeks returns that exceed the rate of inflation over the long-term |
Allspring Small Company Growth Portfolio | Seeks long-term capital appreciation |
Allspring Small Company Value Portfolio | Seeks long-term capital appreciation |
Average daily net assets | Management fee |
First $500 million | 0.300 % |
Next $500 million | 0.280 |
Next $2 billion | 0.260 |
Next $2 billion | 0.240 |
Next $5 billion | 0.230 |
Over $10 billion | 0.220 |
Class-level administration fee | |
Class A | 0.20 % |
Class C | 0.20 |
Class R | 0.21 |
Administrator Class | 0.13 |
Institutional Class | 0.13 |
EXPENSE RATIO CAPS | |
Class A | 1.12 % |
Class C | 1.87 |
Administrator Class | 0.95 |
Institutional Class | 0.80 |
Purchases at cost | Sales proceeds | |||
U.S. government | Non-U.S. government | U.S. government | Non-U.S. government | |
Year ended April 30, 2024 | $367,615,517 | $990,248,507 | $350,878,237 | $1,057,593,343 |
Year ended May 31, 2023 | 257,512,113 | 1,170,878,198 | 261,898,706 | 1,300,949,694 |
Interest rate risk | Equity risk | Foreign currency risk | Total | |
Asset derivatives | ||||
Futures contracts | $1,004,415 * | $2,046,375 * | $4,117,836 * | $7,168,626 |
Liability derivatives | ||||
Futures contracts | $981,895 * | $4,456,407 * | $1,132,787 * | $6,571,089 |
* | Amount represents the cumulative unrealized gains (losses) as reported in the table following the Portfolio of Investments. For futures contracts, only the current day’s variation margin as of April 30, 2024 is reported separately on the Statement of Assets and Liabilities. |
INTEREST RATE RISK | Equity risk | Foreign currency risk | TOTAL | |
Net realized gains (losses) on derivatives | ||||
Futures contracts | $(7,387 ) | $9,435,573 | $(6,251,822 ) | $3,176,364 |
Net change in unrealized gains (losses) on derivatives | ||||
Futures contracts | $(133,896 ) | $(10,802,782 ) | $5,054,028 | $(5,882,650 ) |
Interest rate risk | Equity risk | Foreign currency risk | Total | |
Net realized gains (losses) on derivatives | ||||
Futures contracts | $(145,110 ) | $(3,851,601 ) | $(5,926,776 ) | $(9,923,487 ) |
Net change in unrealized gains (losses) on derivatives | ||||
Futures contracts | $108,058 | $8,630,221 | $(2,455,812 ) | $6,282,467 |
Net investment income | $23,842,147 |
Net realized and unrealized gains (losses) on investments | 143,818,255 |
Net increase in net assets resulting from operations | $167,660,402 |
Year ended May 31 | |||
Year ended April 30, 2024 | 2023 | 2022 | |
Ordinary income | $0 | $31,441,236 | $145,194,955 |
Long-term capital gain | 0 | 39,171,437 | 103,319,490 |
Tax basis return of capital | 0 | 12,958,102 | 0 |
Undistributed ordinary income | Undistributed long-term gain | Unrealized gains |
$21,745,343 | $39,000,568 | $112,940,679 |
Allspring Funds Trust:

Name and year of birth | Position held and length of service** | Principal occupations during past five years or longer | Current other public company or investment company directorships |
William R. Ebsworth (Born 1957) | Trustee, since 2015 | Retired. From 1984 to 2013, equities analyst, portfolio manager, research director and chief investment officer at Fidelity Management and Research Company in Boston, Tokyo, and Hong Kong, and retired in 2013 as Chief Investment Officer of Fidelity Strategic Advisers, Inc. where he led a team of investment professionals managing client assets. Prior thereto, Board member of Hong Kong Securities Clearing Co., Hong Kong Options Clearing Corp., the Thailand International Fund, Ltd., Fidelity Investments Life Insurance Company, and Empire Fidelity Investments Life Insurance Company. Serves on the Investment Company Institute’s Board of Governors since 2022 and Executive Committee since 2023 as well as the Vice Chairman of the Governing Council of the Independent Directors Council since 2023. Audit Committee Chair and Investment Committee Chair of the Vincent Memorial Hospital Foundation (non-profit organization). Mr. Ebsworth is a CFA charterholder. | N/A |
Jane A. Freeman (Born 1953) | Trustee, since 2015; Chair Liaison, since January 2018*** | Retired. From 2012 to 2014 and 1999 to 2008, Chief Financial Officer of Scientific Learning Corporation. From 2008 to 2012, Ms. Freeman provided consulting services related to strategic business projects. Prior to 1999, Portfolio Manager at Rockefeller & Co. and Scudder, Stevens & Clark. Board member of the Harding Loevner Funds from 1996 to 2014, serving as both Lead Independent Director and chair of the Audit Committee. Board member of the Russell Exchange Traded Funds Trust from 2011 to 2012 and the chair of the Audit Committee. Ms. Freeman is also an inactive Chartered Financial Analyst. | N/A |
Isaiah Harris, Jr. (Born 1952) | Trustee, since 2009; Audit Committee Chair, since 2019 | Retired. Member of the Advisory Board of CEF of East Central Florida. Chairman of the Board of CIGNA Corporation from 2009 to 2021, and Director from 2005 to 2008. From 2003 to 2011, Director of Deluxe Corporation. Prior thereto, President and CEO of BellSouth Advertising and Publishing Corp. from 2005 to 2007, President and CEO of BellSouth Enterprises from 2004 to 2005 and President of BellSouth Consumer Services from 2000 to 2003. Emeritus member of the Iowa State University Foundation Board of Governors. Emeritus Member of the Advisory board of Iowa State University School of Business. Advisory Board Member, Palm Harbor Academy (private school). Advisory Board Member, Fellowship of Christian Athletes. Mr. Harris is a certified public accountant (inactive status). | N/A |
David F. Larcker (Born 1950) | Trustee, since 2009 | Distinguished Visiting Fellow at the Hoover Institution since 2022. James Irvin Miller Professor of Accounting at the Graduate School of Business (Emeritus), Stanford University, Director of the Corporate Governance Research Initiative and Senior Faculty of The Rock Center for Corporate Governance since 2006. From 2005 to 2008, Professor of Accounting at the Graduate School of Business, Stanford University. Prior thereto, Ernst & Young Professor of Accounting at The Wharton School, University of Pennsylvania from 1985 to 2005. | N/A |
Olivia S. Mitchell (Born 1953) | Trustee, since 2006 | International Foundation of Employee Benefit Plans Professor since 1993, Wharton School of the University of Pennsylvania. Director of Wharton’s Pension Research Council and Boettner Center on Pensions & Retirement Research, and Research Associate at the National Bureau of Economic Research. Previously taught at Cornell University from 1978 to 1993. | N/A |
Timothy J. Penny (Born 1951) | Trustee, since 1996; Chair, since 2018 | President and Chief Executive Officer of Southern Minnesota Initiative Foundation, a non-profit organization, since 2007. Vice Chair of the Economic Club of Minnesota, since 2007. Co-Chair of the Committee for a Responsible Federal Budget, since 1995. Member of the Board of Trustees of NorthStar Education Finance, Inc., a non-profit organization, from 2007-2022. Senior Fellow of the University of Minnesota Humphrey Institute from 1995 to 2017. | N/A |
Name and year of birth | Position held and length of service** | Principal occupations during past five years or longer | Current other public company or investment company directorships |
James G. Polisson (Born 1959) | Trustee, since 2018; Nominating and Governance Committee Chair, since 2024 | Retired. Chief Marketing Officer, Source (ETF) UK Services, Ltd, from 2015 to 2017. From 2012 to 2015, Principal of The Polisson Group, LLC, a management consulting, corporate advisory and principal investing company. Chief Executive Officer and Managing Director at Russell Investments, Global Exchange Traded Funds from 2010 to 2012. Managing Director of Barclays Global Investors from 1998 to 2010 and Global Chief Marketing Officer for iShares and Barclays Global Investors from 2000 to 2010. Trustee of the San Francisco Mechanics’ Institute, a non- profit organization, from 2013 to 2015. Board member of the Russell Exchange Traded Fund Trust from 2011 to 2012. Director of Barclays Global Investors Holdings Deutschland GmbH from 2006 to 2009. Mr. Polisson is an attorney and has a retired status with the Massachusetts and District of Columbia Bar Associations. | N/A |
Pamela Wheelock (Born 1959) | Trustee, since January 2020; previously Trustee from January 2018 to July 2019*** | Retired. Executive and Senior Financial leadership positions in the public, private and nonprofit sectors. Interim President and CEO, McKnight Foundation, 2020. Interim Commissioner, Minnesota Department of Human Services, 2019. Chief Operating Officer, Twin Cities Habitat for Humanity, 2017-2019. Vice President for University Services, University of Minnesota, 2012- 2016. Interim President and CEO, Blue Cross and Blue Shield of Minnesota, 2011-2012. Executive Vice-President and Chief Financial Officer, Minnesota Wild, 2002-2008. Commissioner, Minnesota Department of Finance, 1999-2002. Chair of the Board of Directors of Destination Medical Center Corporation. Board member of the Minnesota Wild Foundation. | N/A |
Name and year of birth | Position held and length of service | Principal occupations during past five years or longer |
Andrew Owen (Born 1960) | President, since 2017 | President and Chief Executive Officer of Allspring Funds Management, LLC since 2017 and Head of Global Fund Governance of Allspring Global Investments since 2022. Prior thereto, co-president of Galliard Capital Management, LLC, an affiliate of Allspring Funds Management, LLC, from 2019 to 2022 and Head of Affiliated Managers, Allspring Global Investments, from 2014 to 2019 and Executive Vice President responsible for marketing, investments and product development for Allspring Funds Management, LLC, from 2009 to 2014. |
Jeremy DePalma (Born 1974) | Treasurer, since 2012 (for certain funds in the Fund Complex); since 2021 (for the remaining funds in the Complex) | Senior Vice President of Allspring Funds Management, LLC since 2009. Senior Vice President of Evergreen Investment Management Company, LLC from 2008 to 2010 and head of the Fund Reporting and Control Team within Fund Administration from 2005 to 2010. |
Christopher Baker (Born 1976) | Chief Compliance Officer, since 2022 | Global Chief Compliance Officer for Allspring Global Investments since 2022. Prior thereto, Chief Compliance Officer for State Street Global Advisors from 2018 to 2021. Senior Compliance Officer for the State Street divisions of Alternative Investment Solutions, Sector Solutions, and Global Marketing from 2015 to 2018. From 2010 to 2015 Vice President, Global Head of Investment and Marketing Compliance for State Street Global Advisors. |
Matthew Prasse (Born 1983) | Chief Legal Officer, since 2022; Secretary, since 2021 | Senior Counsel of the Allspring Legal Department since 2021. Senior Counsel of the Wells Fargo Legal Department from 2018 to 2021. Previously, Counsel for Barings LLC from 2015 to 2018. Prior to joining Barings, Associate at Morgan, Lewis & Bockius LLP from 2008 to 2015. |

P.O. Box 219967
Kansas City, MO 64121-9967

AR4312 04-24
2 | |
6 | |
10 | |
11 | |
12 | |
13 | |
15 | |
17 | |
22 | |
26 | |
27 | |
56 | |
57 | |
58 | |
59 | |
60 | |
64 | |
65 |

Allspring Funds

President
Allspring Funds
Notice to Shareholders |
Beginning in July 2024, the Fund will be required by the Securities and Exchange Commission to send shareholders a paper copy of a new tailored shareholder report in place of the full shareholder report that you are now receiving. The tailored shareholder report will contain concise information about the Fund, including certain expense and performance information and fund statistics. If you wish to receive this new tailored shareholder report electronically, please follow the instructions on the back cover of this report. |
Other information that is currently included in the shareholder report, such as the Fund’s financial statements, will be available online and upon request, free of charge, in paper or electronic format. |
Investment objective | The Fund seeks total return, consisting of income and capital appreciation. |
Manager | Allspring Funds Management, LLC |
Subadviser for the affiliated master portfolio* | Allspring Global Investments, LLC |
Portfolio managers | Maulik Bhansali, CFA, Jarad Vasquez |
Average annual total returns (%) as of April 30, 2024 | |||||||||
Including sales charge | Excluding sales charge | Expense ratios1 (%) | |||||||
Inception date | 1 year | 5 year | 10 year | 1 year | 5 year | 10 year | Gross | Net2 | |
Class A (MBFAX) | 10-31-2001 | -5.81 | -1.21 | 0.47 | -1.34 | -0.29 | 0.94 | 0.83 | 0.70 |
Class C (MBFCX) | 10-31-2001 | -3.13 | -1.04 | 0.35 | -2.13 | -1.04 | 0.35 | 1.58 | 1.45 |
Class R6 (WTRIX) | 11-30-2012 | – | – | – | -0.94 | 0.12 | 1.35 | 0.46 | 0.33 |
Administrator Class (MNTRX) | 6-30-1997 | – | – | – | -1.24 | -0.22 | 1.02 | 0.78 | 0.65 |
Institutional Class (MBFIX) | 10-31-2001 | – | – | – | -0.99 | 0.07 | 1.31 | 0.51 | 0.38 |
Bloomberg U.S. Aggregate Bond Index3 | – | – | – | – | -1.47 | -0.16 | 1.20 | – | – |
1 | Reflects the expense ratios as stated in the most recent prospectuses. The expense ratios shown are subject to change and may differ from the annualized expense ratios shown in the Financial Highlights of this report. |
2 | The manager has contractually committed through September 30, 2024, to waive fees and/or reimburse expenses to the extent necessary to cap total annual fund operating expenses after fee waivers at 0.70% for Class A, 1.45% for Class C, 0.33% for Class R6, 0.65% for Administrator Class and 0.38% for Institutional Class. Brokerage commissions, stamp duty fees, interest, taxes, acquired fund fees and expenses (if any) from funds in which the affiliated master portfolio invests, and extraordinary expenses are excluded from the expense caps. Net expenses from the affiliated master portfolio are included in the expense caps. Prior to or after the commitment expiration date, the caps may be increased or the commitment to maintain the caps may be terminated only with the approval of the Board of Trustees. Without these caps, the Fund’s returns would have been lower. The expense ratio paid by an investor is the net expense ratio (the total annual fund operating expenses after fee waivers) as stated in the prospectuses. |
3 | The Bloomberg U.S. Aggregate Bond Index is a broad-based benchmark that measures the investment-grade, U.S.–dollar–denominated, fixed-rate taxable bond market, including Treasuries, government-related and corporate securities, mortgage-backed securities (agency fixed-rate and hybrid adjustable-rate mortgage pass-throughs), asset-backed securities, and commercial mortgage-backed securities. You cannot invest directly in an index. |
* | The Fund is a feeder fund in a master-feeder structure that invests substantially all of its assets in a single affiliated master portfolio of the Allspring Master Trust with a substantially identical investment objective and substantially similar investment strategies. References to the investment activities of the Fund are intended to refer to the investment activities of the affiliated master portfolio in which it invests. |
CFA® and Chartered Financial Analyst® are trademarks owned by CFA Institute. | |
Growth of $10,000 investment as of April 30, 20241 |
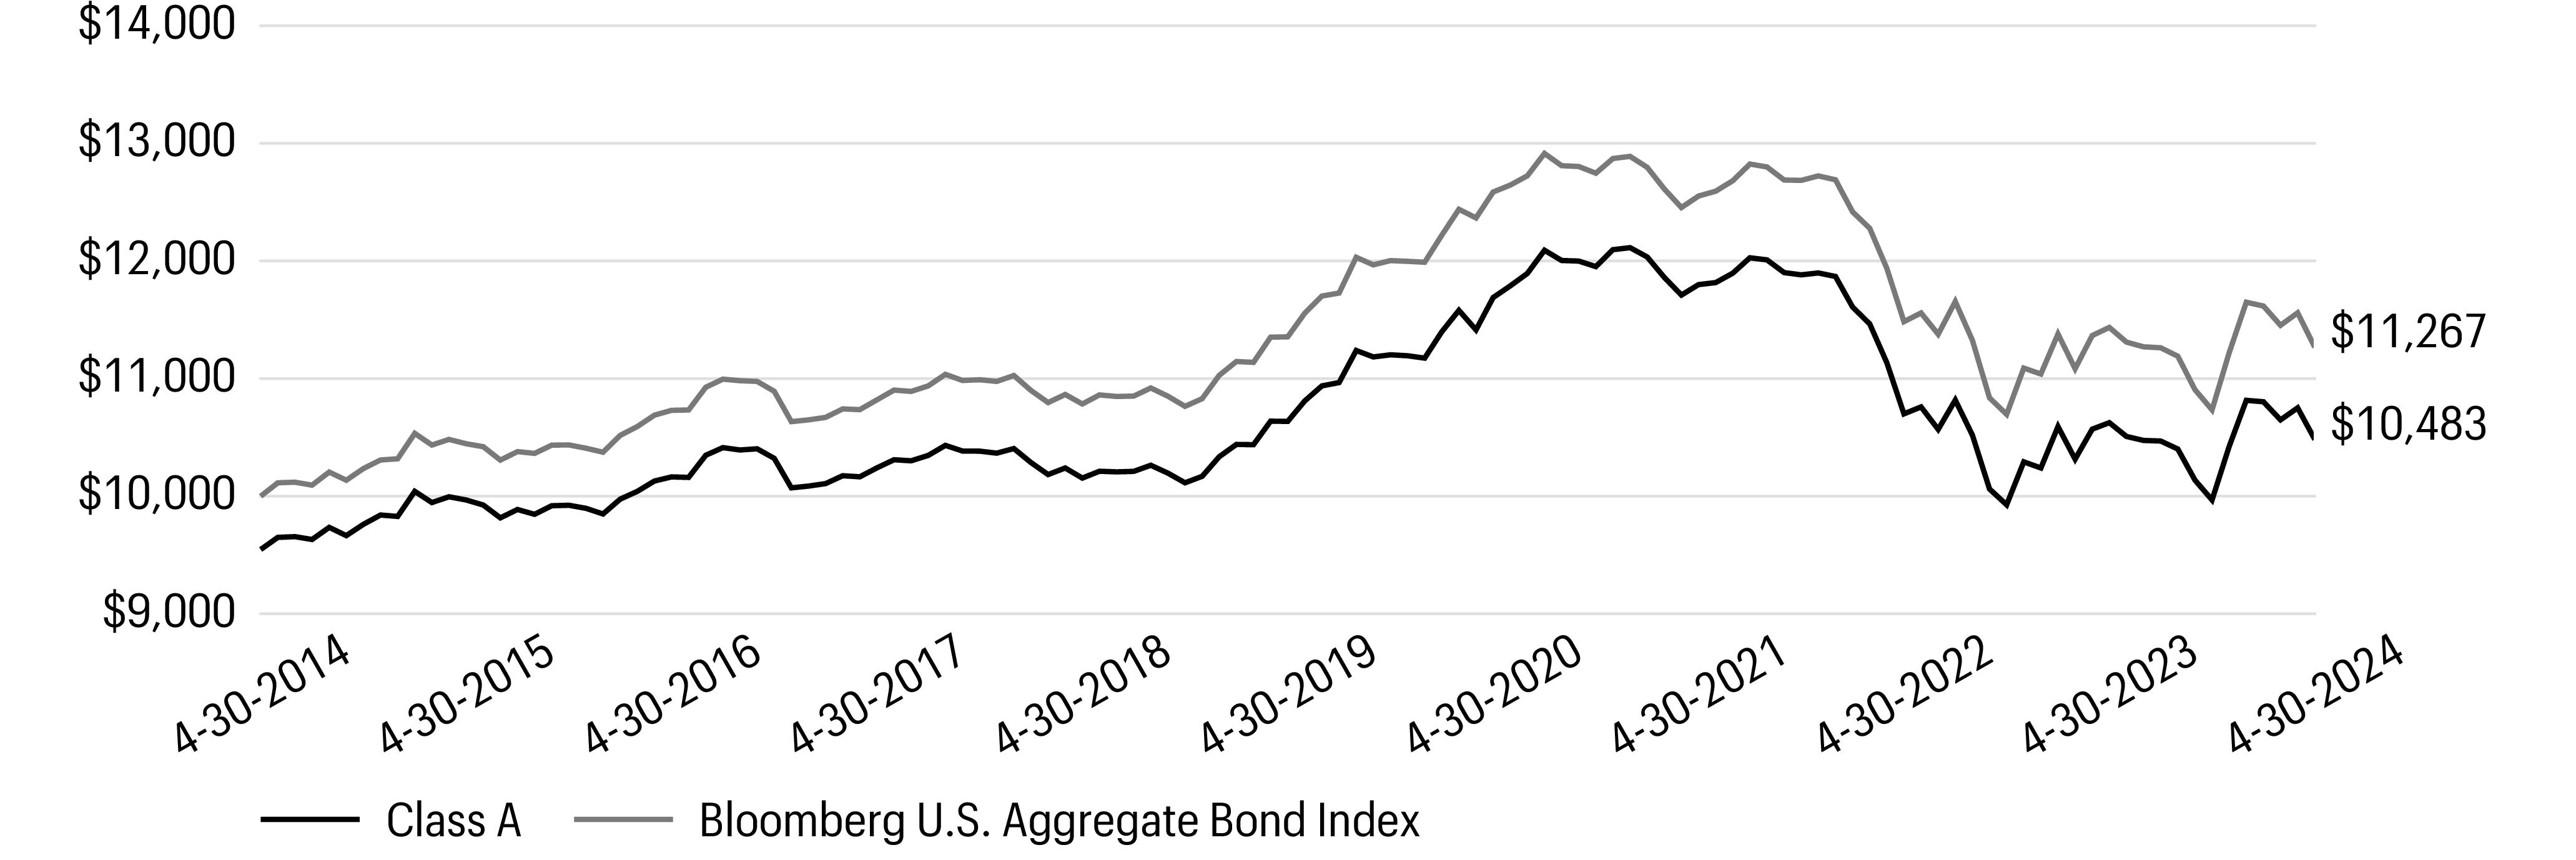
1 | The chart compares the performance of Class A shares for the most recent ten years with the Bloomberg U.S. Aggregate Bond Index. The chart assumes a hypothetical investment of $10,000 in Class A shares and reflects all operating expenses and assumes the maximum initial sales charge of 4.50%. |
Ten largest holdings (%) as of April 30, 20241 | |
U.S. Treasury Notes, 4.63%, 4-30-2029 | 2.54 |
FNMA, 6.00%, 5-15-2054 | 2.23 |
U.S. Treasury Bonds, 4.25%, 2-15-2054 | 2.04 |
U.S. Treasury Notes, 0.75%, 4-30-2026 | 1.93 |
GNMA, 6.50%, 5-15-2054 | 1.66 |
U.S. Treasury Bonds, 1.75%, 8-15-2041 | 1.54 |
U.S. Treasury Notes, 0.63%, 11-30-2027 | 1.50 |
FNMA, 6.50%, 5-15-2054 | 1.49 |
U.S. Treasury Bonds, 1.13%, 8-15-2040 | 1.48 |
U.S. Treasury Notes, 1.25%, 4-30-2028 | 1.38 |
1 | Each holding represents the Fund’s allocable portion of the affiliated master portfolio security. Figures represent each holding as a percentage of the Fund’s net assets. Holdings are subject to change and may have changed since the date specified. |
Portfolio allocation as of April 30, 20241 |
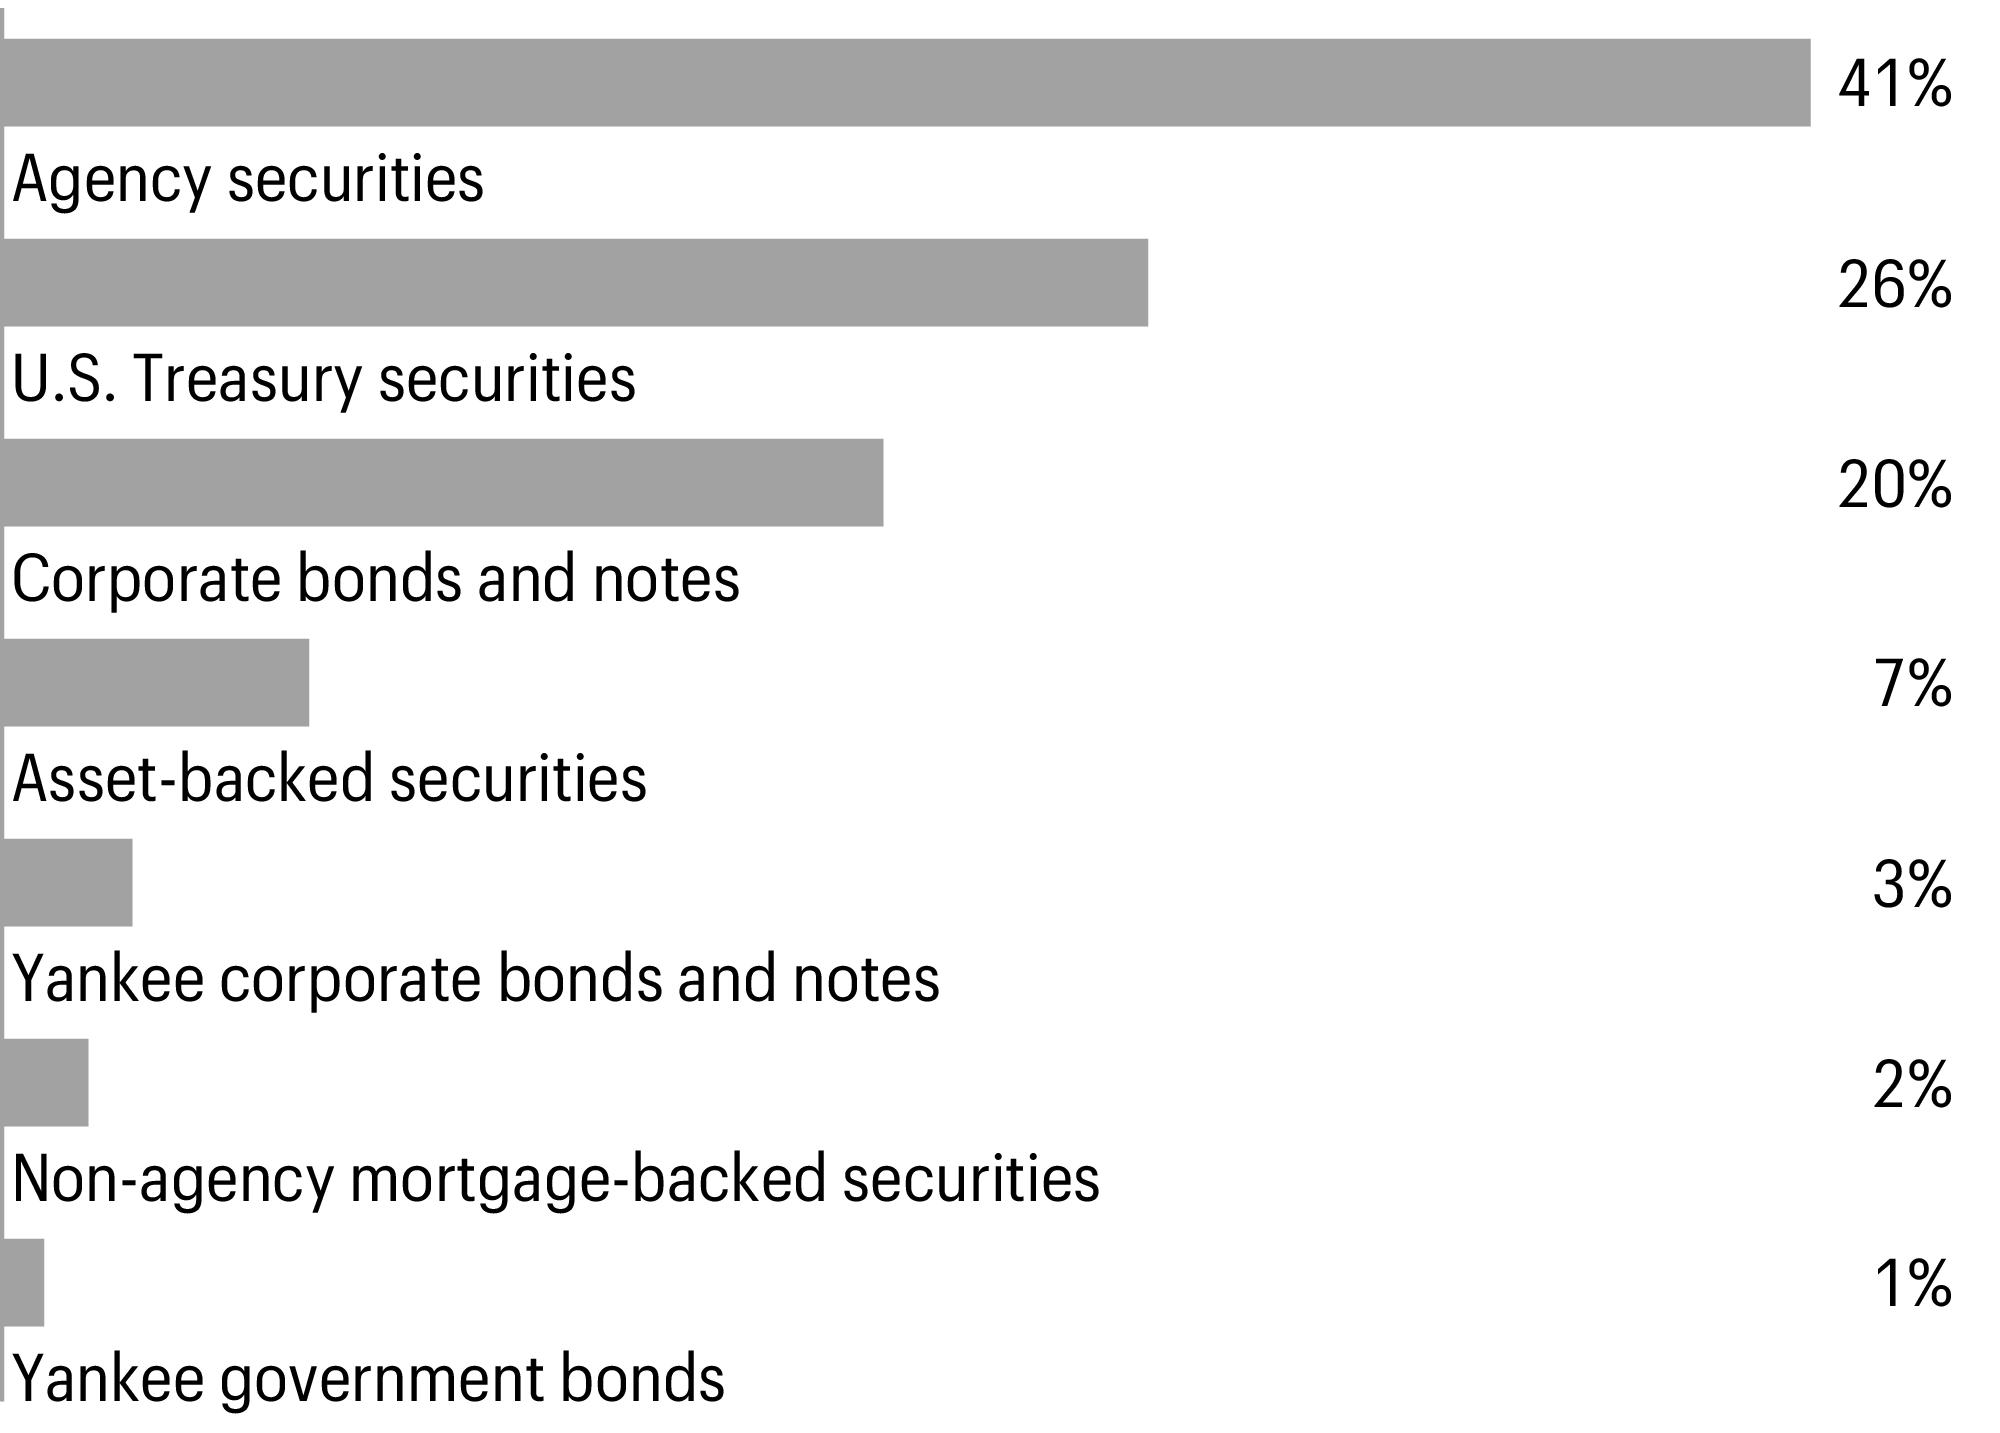
1 | Figures represent the portfolio allocation of the affiliated master portfolio as a percentage of the long-term investments of the affiliated master portfolio. Allocations are subject to change and may have changed since the date specified. |
Beginning account value 11-1-2023 | Ending account value 4-30-2024 | Expenses paid during the period1, 2 | Annualized net expense ratio | |
Class A | ||||
Actual | $1,000.00 | $1,051.71 | $3.57 | 0.70 % |
Hypothetical (5% return before expenses) | $1,000.00 | $1,021.38 | $3.52 | 0.70 % |
Class C | ||||
Actual | $1,000.00 | $1,047.18 | $7.38 | 1.45 % |
Hypothetical (5% return before expenses) | $1,000.00 | $1,017.65 | $7.27 | 1.45 % |
Class R6 | ||||
Actual | $1,000.00 | $1,053.49 | $1.68 | 0.33 % |
Hypothetical (5% return before expenses) | $1,000.00 | $1,023.22 | $1.66 | 0.33 % |
Administrator Class | ||||
Actual | $1,000.00 | $1,051.81 | $3.32 | 0.65 % |
Hypothetical (5% return before expenses) | $1,000.00 | $1,021.63 | $3.27 | 0.65 % |
Institutional Class | ||||
Actual | $1,000.00 | $1,054.24 | $1.94 | 0.38 % |
Hypothetical (5% return before expenses) | $1,000.00 | $1,022.97 | $1.91 | 0.38 % |
1 | Expenses paid is equal to the annualized net expense ratio of each class multiplied by the average account value over the period, multiplied by 182 divided by 366 (to reflect the one-half-year period). |
2 | Amounts reflect net expenses allocated from the affiliated Master Portfolio in which the Fund invests. |
Value | ||||||
Investment companies: 100.35% | ||||||
Affiliated master portfolio: 100.35% | ||||||
Allspring Core Bond Portfolio | $4,847,758,520 | |||||
Total investment companies (Cost $5,081,243,982) | 4,847,758,520 | |||||
Total investments in securities (Cost $5,081,243,982) | 100.35 % | 4,847,758,520 | ||||
Other assets and liabilities, net | (0.35 ) | (16,942,808 ) | ||||
Total net assets | 100.00 % | $4,830,815,712 | ||||
% of ownership, beginning of period | % of ownership, end of period | Net realized gains (losses) on investments allocated from affiliated Master Portfolio | Net change in unrealized gains (losses) on investments allocated from affiliated Master Portfolio | Affiliated Income Allocated from affiliated Master Portfolio | Interest allocated from affiliated Master Portfolio | Value, end of period | |
Allspring Core Bond Portfolio | 95.76 % | 96.77 % | $(182,272,819 ) | $7,473,247 | $7,609,806 | $185,034,905 | $4,847,758,520 |
Assets | |
Investments in affiliated Master Portfolio, at value (cost $5,081,243,982) | $4,847,758,520 |
Receivable for Fund shares sold | 10,813,343 |
Receivable from manager | 161,889 |
Prepaid expenses and other assets | 183,233 |
Total assets | 4,858,916,985 |
Liabilities | |
Payable for Fund shares redeemed | 25,461,769 |
Dividends payable | 2,169,372 |
Administration fees payable | 274,894 |
Distribution fees payable | 4,373 |
Accrued expenses and other liabilities | 190,865 |
Total liabilities | 28,101,273 |
Total net assets | $4,830,815,712 |
Net assets consist of | |
Paid-in capital | $5,757,760,174 |
Total distributable loss | (926,944,462 ) |
Total net assets | $4,830,815,712 |
Computation of net asset value and offering price per share | |
Net assets–Class A | $271,187,961 |
Shares outstanding–Class A1 | 24,674,123 |
Net asset value per share–Class A | $10.99 |
Maximum offering price per share – Class A2 | $11.51 |
Net assets–Class C | $7,136,797 |
Shares outstanding–Class C1 | 656,272 |
Net asset value per share–Class C | $10.87 |
Net assets–Class R6 | $1,494,333,946 |
Shares outstanding–Class R61 | 139,637,992 |
Net asset value per share–Class R6 | $10.70 |
Net assets–Administrator Class | $193,393,978 |
Shares outstanding–Administrator Class1 | 18,052,888 |
Net asset value per share–Administrator Class | $10.71 |
Net assets–Institutional Class | $2,864,763,030 |
Shares outstanding–Institutional Class1 | 267,774,976 |
Net asset value per share–Institutional Class | $10.70 |
Year Ended April 30, 20241 | Year Ended May 31, 2023 | |
Investment income | ||
Interest allocated from affiliated Master Portfolio (net of foreign withholding taxes of $0 and $5,742, respectively) | $185,034,905 | $144,333,199 |
Affiliated income allocated from affiliated Master Portfolio | 7,609,806 | 3,703,917 |
Interest | 5 | 0 |
Expenses allocated from affiliated Master Portfolio | (15,039,584 ) | (15,654,739 ) |
Waivers allocated from affiliated Master Portfolio | 1,159,276 | 314,456 |
Total investment income | 178,764,408 | 132,696,833 |
Expenses | ||
Management fee | 2,099,176 | 2,150,423 |
Administration fees | ||
Class A | 371,781 | 464,295 |
Class C | 9,498 | 11,044 |
Class R | 109 2 | 2,175 |
Class R4 | 34 2 | 1,322 |
Class R6 | 400,063 | 435,096 |
Administrator Class | 119,160 | 100,773 |
Institutional Class | 1,994,259 | 1,959,724 |
Shareholder servicing fees | ||
Class A | 615,548 | 725,461 |
Class C | 15,740 | 17,256 |
Class R | 104 2 | 2,398 |
Class R4 | 42 2 | 1,650 |
Administrator Class | 293,613 | 237,099 |
Distribution fees | ||
Class C | 47,218 | 51,767 |
Class R | 104 2 | 2,406 |
Custody and accounting fees | 37,419 | 140,021 |
Professional fees | 58,801 | 45,094 |
Registration fees | 146,666 | 135,647 |
Shareholder report expenses | 63,392 | 283,230 |
Trustees’ fees and expenses | 21,778 | 23,208 |
Other fees and expenses | 52,288 | 42,453 |
Total expenses | 6,346,793 | 6,832,542 |
Less: Fee waivers and/or expense reimbursements | ||
Fund-level | (3,760,197 ) | (2,586,221 ) |
Class A | (2,215 ) | 0 |
Class R4 | 0 2 | (412 ) |
Class R6 | 0 | (385,379 ) |
Year Ended April 30, 20241 | Year Ended May 31, 2023 | |
Administrator Class | (279 ) | 0 |
Institutional Class | 0 | (676,805 ) |
Net expenses | 2,584,102 | 3,183,725 |
Net investment income | 176,180,306 | 129,513,108 |
Realized and unrealized gains (losses) on investments | ||
Net realized losses on investments allocated from affiliated Master Portfolio | (182,272,819 ) | (312,035,594 ) |
Net change in unrealized gains (losses) on investments allocated from affiliated Master Portfolio | 7,473,247 | 85,016,436 |
Net realized and unrealized gains (losses) on investments | (174,799,572 ) | (227,019,158 ) |
Net increase (decrease) in net assets resulting from operations | $1,380,734 | $(97,506,050 ) |
Year ended April 30, 20241 | Year ended May 31, 2023 | Year ended May 31, 2022 | ||||
Operations | ||||||
Net investment income | $176,180,306 | $129,513,108 | $62,869,235 | |||
Net realized losses on investments | (182,272,819 ) | (312,035,594 ) | (160,127,410 ) | |||
Net change in unrealized gains (losses) on investments | 7,473,247 | 85,016,436 | (336,112,120 ) | |||
Net increase (decrease) in net assets resulting from operations | 1,380,734 | (97,506,050 ) | (433,370,295 ) | |||
Distributions to shareholders from | ||||||
Net investment income and net realized gains | ||||||
Class A | (9,712,170 ) | (7,675,142 ) | (6,433,689 ) | |||
Class C | (201,046 ) | (131,223 ) | (110,382 ) | |||
Class R | (2,333 )2 | (34,090 ) | (26,649 ) | |||
Class R4 | (1,594 )2 | (48,723 ) | (36,787 ) | |||
Class R6 | (57,542,491 ) | (44,157,011 ) | (39,431,641 ) | |||
Administrator Class | (4,826,674 ) | (2,554,745 ) | (4,031,398 ) | |||
Institutional Class | (106,334,309 ) | (74,306,035 ) | (58,058,159 ) | |||
Total distributions to shareholders | (178,620,617 ) | (128,906,969 ) | (108,128,705 ) | |||
Capital share transactions | Shares | Shares | Shares | |||
Proceeds from shares sold | ||||||
Class A | 3,775,381 | 42,217,288 | 3,547,996 | 40,597,860 | 3,702,453 | 48,486,367 |
Class C | 230,161 | 2,548,056 | 203,641 | 2,319,261 | 108,019 | 1,407,245 |
Class R | 2,735 2 | 30,355 2 | 9,751 | 109,924 | 34,646 | 423,424 |
Class R4 | 247 2 | 2,744 2 | 81,024 | 891,840 | 28,978 | 375,499 |
Class R6 | 41,123,495 | 447,263,936 | 48,253,518 | 536,236,583 | 35,298,112 | 443,259,488 |
Administrator Class | 13,960,930 | 151,000,798 | 1,484,991 | 16,856,217 | 2,796,248 | 36,167,197 |
Institutional Class | 94,350,577 | 1,027,044,433 | 95,825,733 | 1,072,136,843 | 81,429,382 | 1,025,963,187 |
1,670,107,610 | 1,669,148,528 | 1,556,082,407 | ||||
Reinvestment of distributions | ||||||
Class A | 814,015 | 9,094,710 | 629,058 | 7,205,833 | 459,521 | 6,030,239 |
Class C | 18,095 | 200,099 | 11,516 | 130,427 | 8,369 | 109,235 |
Class R | 0 2 | 0 2 | 2,140 | 23,904 | 1,429 | 18,254 |
Class R4 | 0 2 | 0 2 | 4,370 | 48,723 | 2,874 | 36,727 |
Class R6 | 3,607,558 | 39,257,749 | 3,183,589 | 35,516,927 | 2,565,625 | 32,770,856 |
Administrator Class | 434,982 | 4,743,442 | 207,042 | 2,323,885 | 297,680 | 3,811,913 |
Institutional Class | 9,600,161 | 104,449,143 | 6,456,679 | 72,012,292 | 4,290,277 | 54,802,544 |
157,745,143 | 117,261,991 | 97,579,768 | ||||
Payment for shares redeemed | ||||||
Class A | (4,012,900 ) | (44,818,619 ) | (7,212,437 ) | (82,273,020 ) | (4,763,948 ) | (62,340,443 ) |
Class C | (199,174 ) | (2,203,392 ) | (264,946 ) | (3,003,853 ) | (467,425 ) | (6,084,370 ) |
Class R | (2,903 )2 | (32,239 )2 | (17,679 ) | (198,692 ) | (43,328 ) | (536,185 ) |
Class R4 | (2,032 )2 | (22,570 )2 | (144,850 ) | (1,619,238 ) | (33,896 ) | (428,263 ) |
Year ended April 30, 20241 | Year ended May 31, 2023 | Year ended May 31, 2022 | ||||
Shares | Shares | Shares | ||||
Class R6 | (37,838,638 ) | $(411,501,397 ) | (59,239,090 ) | $(658,796,705 ) | (48,563,677 ) | $(619,916,699 ) |
Administrator Class | (2,661,233 ) | (28,819,058 ) | (10,522,094 ) | (119,107,953 ) | (4,352,230 ) | (55,087,181 ) |
Institutional Class | (73,252,492 ) | (797,810,765 ) | (74,572,722 ) | (831,757,832 ) | (86,745,436 ) | (1,095,982,497 ) |
(1,285,208,040 ) | (1,696,757,293 ) | (1,840,375,638 ) | ||||
Share conversions | ||||||
Class A | 114,873 | 1,307,735 | 0 | 0 | 0 | 0 |
Class R | (117,853 )3 | (1,307,735 )3 | 0 | 0 | 0 | 0 |
Class R4 | (72,695 )3 | (806,720 )3 | 0 | 0 | 0 | 0 |
Institutional Class | 72,800 | 806,720 | 0 | 0 | 0 | 0 |
0 | 0 | 0 | ||||
Net increase (decrease) in net assets resulting from capital share transactions | 542,644,713 | 89,653,226 | (186,713,463 ) | |||
Total increase (decrease) in net assets | 365,404,830 | (136,759,793 ) | (728,212,463 ) | |||
Net assets | ||||||
Beginning of period | 4,465,410,882 | 4,602,170,675 | 5,330,383,138 | |||
End of period | $4,830,815,712 | $4,465,410,882 | $4,602,170,675 | |||
Year ended April 30 20241 | Year ended May 31 | |||||
Class A | 2023 | 2022 | 2021 | 2020 | 2019 | |
Net asset value, beginning of period | $11.42 | $12.01 | $13.43 | $14.17 | $13.28 | $12.86 |
Net investment income | 0.40 2 | 0.31 2 | 0.12 | 0.12 2 | 0.25 | 0.32 |
Net realized and unrealized gains (losses) on investments | (0.43 ) | (0.59 ) | (1.30 ) | (0.06 ) | 0.93 | 0.42 |
Total from investment operations | (0.03 ) | (0.28 ) | (1.18 ) | 0.06 | 1.18 | 0.74 |
Distributions to shareholders from | ||||||
Net investment income | (0.40 ) | (0.30 ) | (0.12 ) | (0.15 ) | (0.26 ) | (0.32 ) |
Net realized gains | 0.00 | (0.01 ) | (0.12 ) | (0.65 ) | (0.03 ) | 0.00 |
Total distributions to shareholders | (0.40 ) | (0.31 ) | (0.24 ) | (0.80 ) | (0.29 ) | (0.32 ) |
Net asset value, end of period | $10.99 | $11.42 | $12.01 | $13.43 | $14.17 | $13.28 |
Total return3 | (0.23 )% | (2.33 )% | (8.95 )% | 0.31 % | 9.03 % | 5.87 % |
Ratios to average net assets (annualized)* | ||||||
Gross expenses | 0.79 % | 0.83 % | 0.82 % | 0.82 % | 0.82 % | 0.83 % |
Net expenses | 0.70 % | 0.77 % | 0.78 % | 0.78 % | 0.78 % | 0.78 % |
Net investment income | 3.88 % | 2.66 % | 0.91 % | 0.87 % | 1.85 % | 2.50 % |
Supplemental data | ||||||
Portfolio turnover rate4 | 350 % | 384 % | 432 % | 457 % | 603 % | 577 % |
Net assets, end of period (000s omitted) | $271,188 | $273,980 | $324,431 | $370,882 | $299,642 | $302,246 |
* | Ratios include net expenses allocated from the affiliated Master Portfolio which were as follows: |
Year ended April 30, 20241 | 0.33% |
Year ended May 31, 2023 | 0.36% |
Year ended May 31, 2022 | 0.36% |
Year ended May 31, 2021 | 0.35% |
Year ended May 31, 2020 | 0.35% |
Year ended May 31, 2019 | 0.35% |
1 | For the eleven months ended April 30, 2024. The Fund changed its fiscal year end from May 31 to April 30, effective April 30, 2024. |
2 | Calculated based upon average shares outstanding |
3 | Total return calculations do not include any sales charges. Returns for periods of less than one year are not annualized. |
4 | Portfolio turnover rate is calculated by multiplying the affiliated Master Portfolio’s percentage of the Fund’s total investment in securities at the end of the period by the affiliated Master Portfolio’s portfolio turnover rate. |
Year ended April 30 20241 | Year ended May 31 | |||||
Class C | 2023 | 2022 | 2021 | 2020 | 2019 | |
Net asset value, beginning of period | $11.30 | $11.88 | $13.29 | $14.03 | $13.15 | $12.74 |
Net investment income | 0.32 2 | 0.22 2 | 0.05 | 0.03 | 0.15 | 0.23 |
Net realized and unrealized gains (losses) on investments | (0.43 ) | (0.58 ) | (1.32 ) | (0.07 ) | 0.92 | 0.40 |
Total from investment operations | (0.11 ) | (0.36 ) | (1.27 ) | (0.04 ) | 1.07 | 0.63 |
Distributions to shareholders from | ||||||
Net investment income | (0.32 ) | (0.21 ) | (0.02 ) | (0.05 ) | (0.16 ) | (0.22 ) |
Net realized gains | 0.00 | (0.01 ) | (0.12 ) | (0.65 ) | (0.03 ) | 0.00 |
Total distributions to shareholders | (0.32 ) | (0.22 ) | (0.14 ) | (0.70 ) | (0.19 ) | (0.22 ) |
Net asset value, end of period | $10.87 | $11.30 | $11.88 | $13.29 | $14.03 | $13.15 |
Total return3 | (0.96 )% | (3.03 )% | (9.65 )% | (0.45 )% | 8.22 % | 5.04 % |
Ratios to average net assets (annualized)* | ||||||
Gross expenses | 1.54 % | 1.58 % | 1.57 % | 1.57 % | 1.57 % | 1.58 % |
Net expenses | 1.45 % | 1.52 % | 1.53 % | 1.53 % | 1.53 % | 1.53 % |
Net investment income | 3.13 % | 1.92 % | 0.13 % | 0.16 % | 1.11 % | 1.75 % |
Supplemental data | ||||||
Portfolio turnover rate4 | 350 % | 384 % | 432 % | 457 % | 603 % | 577 % |
Net assets, end of period (000s omitted) | $7,137 | $6,863 | $7,806 | $13,399 | $27,971 | $34,494 |
* | Ratios include net expenses allocated from the affiliated Master Portfolio which were as follows: |
Year ended April 30, 20241 | 0.33% |
Year ended May 31, 2023 | 0.36% |
Year ended May 31, 2022 | 0.36% |
Year ended May 31, 2021 | 0.35% |
Year ended May 31, 2020 | 0.35% |
Year ended May 31, 2019 | 0.35% |
1 | For the eleven months ended April 30, 2024. The Fund changed its fiscal year end from May 31 to April 30, effective April 30, 2024. |
2 | Calculated based upon average shares outstanding |
3 | Total return calculations do not include any sales charges. Returns for periods of less than one year are not annualized. |
4 | Portfolio turnover rate is calculated by multiplying the affiliated Master Portfolio’s percentage of the Fund’s total investment in securities at the end of the period by the affiliated Master Portfolio’s portfolio turnover rate. |
Year ended April 30 20241 | Year ended May 31 | |||||
Class R6 | 2023 | 2022 | 2021 | 2020 | 2019 | |
Net asset value, beginning of period | $11.12 | $11.69 | $13.08 | $13.82 | $12.95 | $12.54 |
Net investment income | 0.42 2 | 0.34 2 | 0.17 | 0.18 2 | 0.30 | 0.37 |
Net realized and unrealized gains (losses) on investments | (0.41 ) | (0.56 ) | (1.27 ) | (0.06 ) | 0.91 | 0.41 |
Total from investment operations | 0.01 | (0.22 ) | (1.10 ) | 0.12 | 1.21 | 0.78 |
Distributions to shareholders from | ||||||
Net investment income | (0.43 ) | (0.34 ) | (0.17 ) | (0.21 ) | (0.31 ) | (0.37 ) |
Net realized gains | 0.00 | (0.01 ) | (0.12 ) | (0.65 ) | (0.03 ) | 0.00 |
Total distributions to shareholders | (0.43 ) | (0.35 ) | (0.29 ) | (0.86 ) | (0.34 ) | (0.37 ) |
Net asset value, end of period | $10.70 | $11.12 | $11.69 | $13.08 | $13.82 | $12.95 |
Total return3 | 0.09 % | (1.90 )% | (8.61 )% | 0.70 % | 9.42 % | 6.31 % |
Ratios to average net assets (annualized)* | ||||||
Gross expenses | 0.42 % | 0.45 % | 0.44 % | 0.44 % | 0.44 % | 0.45 % |
Net expenses | 0.33 % | 0.37 % | 0.37 % | 0.37 % | 0.37 % | 0.37 % |
Net investment income | 4.26 % | 3.06 % | 1.32 % | 1.29 % | 2.26 % | 2.92 % |
Supplemental data | ||||||
Portfolio turnover rate4 | 350 % | 384 % | 432 % | 457 % | 603 % | 577 % |
Net assets, end of period (000s omitted) | $1,494,334 | $1,476,551 | $1,643,353 | $1,978,164 | $2,545,332 | $2,513,644 |
* | Ratios include net expenses allocated from the affiliated Master Portfolio which were as follows: |
Year ended April 30, 20241 | 0.33% |
Year ended May 31, 2023 | 0.36% |
Year ended May 31, 2022 | 0.36% |
Year ended May 31, 2021 | 0.35% |
Year ended May 31, 2020 | 0.35% |
Year ended May 31, 2019 | 0.35% |
1 | For the eleven months ended April 30, 2024. The Fund changed its fiscal year end from May 31 to April 30, effective April 30, 2024. |
2 | Calculated based upon average shares outstanding |
3 | Returns for periods of less than one year are not annualized. |
4 | Portfolio turnover rate is calculated by multiplying the affiliated Master Portfolio’s percentage of the Fund’s total investment in securities at the end of the period by the affiliated Master Portfolio’s portfolio turnover rate. |
Year ended April 30 20241 | Year ended May 31 | |||||
Administrator Class | 2023 | 2022 | 2021 | 2020 | 2019 | |
Net asset value, beginning of period | $11.13 | $11.70 | $13.09 | $13.83 | $12.96 | $12.56 |
Net investment income | 0.40 2 | 0.29 2 | 0.13 | 0.13 | 0.26 | 0.33 2 |
Net realized and unrealized gains (losses) on investments | (0.42 ) | (0.55 ) | (1.27 ) | (0.06 ) | 0.90 | 0.40 |
Total from investment operations | (0.02 ) | (0.26 ) | (1.14 ) | 0.07 | 1.16 | 0.73 |
Distributions to shareholders from | ||||||
Net investment income | (0.40 ) | (0.30 ) | (0.13 ) | (0.16 ) | (0.26 ) | (0.33 ) |
Net realized gains | 0.00 | (0.01 ) | (0.12 ) | (0.65 ) | (0.03 ) | 0.00 |
Total distributions to shareholders | (0.40 ) | (0.31 ) | (0.25 ) | (0.81 ) | (0.29 ) | (0.33 ) |
Net asset value, end of period | $10.71 | $11.13 | $11.70 | $13.09 | $13.83 | $12.96 |
Total return3 | (0.19 )% | (2.22 )% | (8.90 )% | 0.37 % | 9.14 % | 5.87 % |
Ratios to average net assets (annualized)* | ||||||
Gross expenses | 0.74 % | 0.76 % | 0.74 % | 0.76 % | 0.76 % | 0.76 % |
Net expenses | 0.65 % | 0.70 % | 0.69 % | 0.70 % | 0.70 % | 0.70 % |
Net investment income | 4.00 % | 2.60 % | 0.99 % | 0.95 % | 1.92 % | 2.58 % |
Supplemental data | ||||||
Portfolio turnover rate4 | 350 % | 384 % | 432 % | 457 % | 603 % | 577 % |
Net assets, end of period (000s omitted) | $193,394 | $70,352 | $177,305 | $214,796 | $218,522 | $205,825 |
* | Ratios include net expenses allocated from the affiliated Master Portfolio which were as follows: |
Year ended April 30, 20241 | 0.33% |
Year ended May 31, 2023 | 0.36% |
Year ended May 31, 2022 | 0.36% |
Year ended May 31, 2021 | 0.35% |
Year ended May 31, 2020 | 0.35% |
Year ended May 31, 2019 | 0.35% |
1 | For the eleven months ended April 30, 2024. The Fund changed its fiscal year end from May 31 to April 30, effective April 30, 2024. |
2 | Calculated based upon average shares outstanding |
3 | Returns for periods of less than one year are not annualized. |
4 | Portfolio turnover rate is calculated by multiplying the affiliated Master Portfolio’s percentage of the Fund’s total investment in securities at the end of the period by the affiliated Master Portfolio’s portfolio turnover rate. |
Year ended April 30 20241 | Year ended May 31 | |||||
Institutional Class | 2023 | 2022 | 2021 | 2020 | 2019 | |
Net asset value, beginning of period | $11.12 | $11.69 | $13.07 | $13.82 | $12.94 | $12.54 |
Net investment income | 0.42 2 | 0.34 2 | 0.16 | 0.17 | 0.29 | 0.36 |
Net realized and unrealized gains (losses) on investments | (0.42 ) | (0.57 ) | (1.26 ) | (0.07 ) | 0.92 | 0.40 |
Total from investment operations | 0.00 | (0.23 ) | (1.10 ) | 0.10 | 1.21 | 0.76 |
Distributions to shareholders from | ||||||
Net investment income | (0.42 ) | (0.33 ) | (0.16 ) | (0.20 ) | (0.30 ) | (0.36 ) |
Net realized gains | 0.00 | (0.01 ) | (0.12 ) | (0.65 ) | (0.03 ) | 0.00 |
Total distributions to shareholders | (0.42 ) | (0.34 ) | (0.28 ) | (0.85 ) | (0.33 ) | (0.36 ) |
Net asset value, end of period | $10.70 | $11.12 | $11.69 | $13.07 | $13.82 | $12.94 |
Total return3 | 0.04 % | (1.95 )% | (8.59 )% | 0.58 % | 9.45 % | 6.18 % |
Ratios to average net assets (annualized)* | ||||||
Gross expenses | 0.47 % | 0.50 % | 0.49 % | 0.49 % | 0.49 % | 0.50 % |
Net expenses | 0.38 % | 0.41 % | 0.42 % | 0.42 % | 0.42 % | 0.42 % |
Net investment income | 4.21 % | 3.05 % | 1.27 % | 1.22 % | 2.21 % | 2.86 % |
Supplemental data | ||||||
Portfolio turnover rate4 | 350 % | 384 % | 432 % | 457 % | 603 % | 577 % |
Net assets, end of period (000s omitted) | $2,864,763 | $2,635,520 | $2,446,260 | $2,749,647 | $2,365,421 | $2,343,238 |
* | Ratios include net expenses allocated from the affiliated Master Portfolio which were as follows: |
Year ended April 30, 20241 | 0.33% |
Year ended May 31, 2023 | 0.36% |
Year ended May 31, 2022 | 0.36% |
Year ended May 31, 2021 | 0.35% |
Year ended May 31, 2020 | 0.35% |
Year ended May 31, 2019 | 0.35% |
1 | For the eleven months ended April 30, 2024. The Fund changed its fiscal year end from May 31 to April 30, effective April 30, 2024. |
2 | Calculated based upon average shares outstanding |
3 | Returns for periods of less than one year are not annualized. |
4 | Portfolio turnover rate is calculated by multiplying the affiliated Master Portfolio’s percentage of the Fund’s total investment in securities at the end of the period by the affiliated Master Portfolio’s portfolio turnover rate. |
Gross unrealized gains | $0 |
Gross unrealized losses | (243,418,282 ) |
Net unrealized losses | $(243,418,282 ) |
Affiliated Master Portfolio | Investment objective | Fair value of affiliated Master Portfolio |
Allspring Core Bond Portfolio | Seeks total return, consisting of income and capital appreciation | $4,847,758,520 |
Average daily net assets | Management fee |
First $5 billion | 0.050 % |
Next $5 billion | 0.040 |
Over $10 billion | 0.030 |
Class-level administration fee | |
Class A | 0.15 % |
Class C | 0.15 |
Class R | 0.16 |
Class R4 | 0.08 |
Class R6 | 0.03 |
Administrator Class | 0.10 |
Institutional Class | 0.08 |
EXPENSE RATIO CAPS | |
Class A | 0.70 % |
Class C | 1.45 |
Class R6 | 0.33 |
Administrator Class | 0.65 |
Institutional Class | 0.38 |
Purchases at cost | Sales proceeds | |||
U.S. government | Non-U.S. government | U.S. government | Non-U.S. government | |
Year ended April 30, 2024 | $15,324,912,611 | $2,216,640,667 | $14,578,554,371 | $2,161,417,487 |
Year ended May 31, 2023 | 10,190,491,365 | 7,095,020,558 | 10,258,158,874 | 6,737,323,863 |
Year ended May 31 | |||
Year ended April 30, 2024 | 2023 | 2022 | |
Ordinary income | $178,620,617 | $128,906,969 | $80,688,093 |
Long-term capital gain | 0 | 0 | 27,440,612 |
Undistributed ordinary income | Unrealized losses | Capital loss carryforward |
$2,401,837 | $(243,418,282 ) | $(683,758,645 ) |
Allspring Funds Trust:

Interest rate | Maturity date | Principal | Value | |||
Agency securities: 42.97% | ||||||
FHLB | 1.25 % | 9-30-2031 | $ | 8,020,000 | $6,594,149 | |
FHLMC¤ | 0.00 | 12-14-2029 | 6,390,000 | 4,871,919 | ||
FHLMC | 2.00 | 6-1-2040 | 8,582,010 | 7,009,337 | ||
FHLMC | 2.00 | 7-1-2040 | 8,837,521 | 7,216,416 | ||
FHLMC | 2.00 | 8-1-2040 | 9,182,441 | 7,496,438 | ||
FHLMC | 2.00 | 11-1-2040 | 12,168,699 | 9,942,938 | ||
FHLMC | 2.00 | 12-1-2040 | 3,033,791 | 2,480,799 | ||
FHLMC | 2.00 | 1-1-2041 | 2,326,923 | 1,901,422 | ||
FHLMC | 2.00 | 2-1-2041 | 2,384,991 | 1,948,917 | ||
FHLMC | 2.00 | 4-1-2041 | 4,559,835 | 3,732,000 | ||
FHLMC | 2.00 | 7-1-2041 | 4,421,779 | 3,599,775 | ||
FHLMC | 2.00 | 11-1-2041 | 4,637,273 | 3,750,278 | ||
FHLMC | 2.00 | 1-1-2042 | 3,056,299 | 2,471,687 | ||
FHLMC | 2.00 | 2-1-2047 | 2,054,079 | 1,572,513 | ||
FHLMC | 2.00 | 12-1-2051 | 1,368,136 | 1,047,398 | ||
FHLMC | 2.50 | 4-1-2042 | 1,610,382 | 1,346,051 | ||
FHLMC | 2.50 | 5-1-2042 | 5,872,779 | 4,903,956 | ||
FHLMC | 2.50 | 6-1-2042 | 2,108,070 | 1,758,568 | ||
FHLMC | 2.50 | 8-1-2043 | 5,343,562 | 4,477,541 | ||
FHLMC | 2.50 | 6-1-2046 | 6,366,532 | 5,334,737 | ||
FHLMC | 2.50 | 9-1-2051 | 9,988,788 | 8,085,806 | ||
FHLMC | 2.50 | 2-1-2052 | 1,042,939 | 837,724 | ||
FHLMC | 2.50 | 3-1-2052 | 3,447,963 | 2,759,262 | ||
FHLMC | 3.00 | 4-1-2040 | 2,614,285 | 2,276,195 | ||
FHLMC | 3.00 | 4-1-2043 | 3,058,071 | 2,625,871 | ||
FHLMC | 3.00 | 8-1-2043 | 4,692,588 | 4,029,378 | ||
FHLMC | 3.00 | 2-1-2045 | 7,213,745 | 6,193,407 | ||
FHLMC | 3.00 | 4-1-2045 | 11,367,564 | 9,760,855 | ||
FHLMC | 3.00 | 5-1-2045 | 3,848,486 | 3,281,863 | ||
FHLMC | 3.00 | 9-1-2046 | 5,385,087 | 4,578,541 | ||
FHLMC | 3.00 | 2-1-2047 | 5,098,291 | 4,350,054 | ||
FHLMC | 3.00 | 8-1-2048 | 9,473,848 | 8,026,058 | ||
FHLMC | 3.00 | 9-1-2033 | 1,813,507 | 1,670,158 | ||
FHLMC | 3.00 | 5-1-2043 | 7,486,735 | 6,451,999 | ||
FHLMC | 3.00 | 1-1-2046 | 3,756,776 | 3,226,063 | ||
FHLMC | 3.00 | 1-1-2047 | 3,892,002 | 3,305,062 | ||
FHLMC | 3.00 | 4-1-2047 | 22,549,229 | 19,141,971 | ||
FHLMC | 4.00 | 4-1-2037 | 1,006,317 | 954,168 | ||
FHLMC | 4.00 | 7-1-2049 | 6,871,284 | 6,316,121 | ||
FHLMC | 4.00 | 3-1-2050 | 10,408,835 | 9,620,091 | ||
FHLMC | 4.50 | 6-1-2039 | 162,709 | 156,462 | ||
FHLMC | 4.50 | 7-1-2039 | 189,156 | 182,172 | ||
FHLMC STRIPS Series 264 Class 30 | 3.00 | 7-15-2042 | 4,839,955 | 4,249,643 | ||
FHLMC STRIPS Series 271 Class F5 (30 Day Average U.S. SOFR+0.61%)± | 5.94 | 8-15-2042 | 1,474,919 | 1,447,471 | ||
FHLMC STRIPS Series 272 Class F1 (30 Day Average U.S. SOFR+0.61%)± | 5.94 | 8-15-2042 | 2,329,448 | 2,286,356 | ||
Interest rate | Maturity date | Principal | Value | |||
Agency securities(continued) | ||||||
FHLMC STRIPS Series 280 Class F1 (30 Day Average U.S. SOFR+0.61%)± | 5.94 % | 9-15-2042 | $ | 2,357,482 | $2,313,546 | |
FHLMC (30 Day Average U.S. SOFR+2.14%)± | 3.97 | 8-1-2052 | 2,872,130 | 2,668,037 | ||
FHLMC (30 Day Average U.S. SOFR+2.21%)± | 5.13 | 8-1-2053 | 1,763,129 | 1,726,358 | ||
FHLMC (30 Day Average U.S. SOFR+2.30%)± | 5.18 | 6-1-2053 | 1,520,665 | 1,491,153 | ||
FHLMC (30 Day Average U.S. SOFR+2.31%)± | 4.19 | 5-1-2053 | 8,467,494 | 8,125,907 | ||
FHLMC (RFUCCT1Y+1.60%)± | 7.16 | 9-1-2043 | 121,050 | 124,848 | ||
FHLMC (RFUCCT1Y+1.61%)± | 7.45 | 10-1-2043 | 337,871 | 344,298 | ||
FHLMC (RFUCCT1Y+1.63%)± | 3.41 | 2-1-2050 | 3,241,997 | 3,196,994 | ||
FHLMC (RFUCCT1Y+1.63%)± | 7.19 | 11-1-2043 | 260,955 | 263,934 | ||
FHLMC (RFUCCT1Y+1.64%)± | 3.13 | 11-1-2048 | 2,386,250 | 2,355,473 | ||
FHLMC (RFUCCT1Y+1.64%)± | 5.50 | 3-1-2049 | 1,741,402 | 1,771,665 | ||
FHLMC (RFUCCT1Y+1.64%)± | 6.20 | 4-1-2048 | 4,237,673 | 4,300,611 | ||
FHLMC (RFUCCT1Y+1.64%)± | 6.82 | 8-1-2043 | 325,726 | 328,628 | ||
FHLMC (RFUCCT1Y+1.64%)± | 6.87 | 9-1-2045 | 2,917,544 | 2,964,140 | ||
FHLMC (RFUCCT1Y+1.64%)± | 6.88 | 7-1-2043 | 195,119 | 197,501 | ||
FHLMC (RFUCCT1Y+1.65%)± | 7.03 | 10-1-2043 | 333,698 | 338,814 | ||
FHLMC (RFUCCT1Y+1.65%)± | 7.11 | 3-1-2043 | 293,885 | 296,847 | ||
FHLMC (RFUCCT1Y+1.68%)± | 6.79 | 9-1-2047 | 3,448,681 | 3,479,280 | ||
FHLMC (RFUCCT1Y+1.68%)± | 7.51 | 2-1-2043 | 454,371 | 463,469 | ||
FHLMC (RFUCCT1Y+1.73%)± | 5.97 | 1-1-2044 | 699,694 | 712,338 | ||
FHLMC (RFUCCT1Y+1.77%)± | 7.46 | 9-1-2042 | 293,449 | 300,604 | ||
FHLMC Series 1897 Class K | 7.00 | 9-15-2026 | 54 | 53 | ||
FHLMC Series 3693 Class FC (30 Day Average U.S. SOFR+0.61%)± | 5.94 | 7-15-2040 | 1,863,216 | 1,850,441 | ||
FHLMC Series 3919 Class FA (30 Day Average U.S. SOFR+0.61%)± | 5.94 | 9-15-2041 | 1,770,098 | 1,757,093 | ||
FHLMC Series 3951 Class FN (30 Day Average U.S. SOFR+0.56%)± | 5.89 | 11-15-2041 | 1,377,623 | 1,364,605 | ||
FHLMC Series 3958 Class AF (30 Day Average U.S. SOFR+0.56%)± | 5.89 | 11-15-2041 | 1,705,821 | 1,689,900 | ||
FHLMC Series 3975 Class FA (30 Day Average U.S. SOFR+0.60%)± | 5.93 | 12-15-2041 | 1,637,617 | 1,625,856 | ||
FHLMC Series 3990 Class FG (30 Day Average U.S. SOFR+0.56%)± | 5.89 | 1-15-2042 | 2,011,122 | 1,993,068 | ||
FHLMC Series 4047 Class CX | 3.50 | 5-15-2042 | 4,821,431 | 4,201,559 | ||
FHLMC Series 4059 Class FP (30 Day Average U.S. SOFR+0.56%)± | 5.89 | 6-15-2042 | 2,222,311 | 2,200,182 | ||
FHLMC Series 4091 Class BX | 3.25 | 10-15-2041 | 2,545,749 | 2,272,037 | ||
FHLMC Series 4091 Class MX | 3.25 | 2-15-2042 | 2,120,058 | 1,880,079 | ||
FHLMC Series 4091 Class EX | 3.38 | 7-15-2042 | 1,579,023 | 1,410,121 | ||
FHLMC Series 4117 Class HB | 2.50 | 10-15-2042 | 1,660,000 | 1,377,767 | ||
FHLMC Series 4122 Class FP (30 Day Average U.S. SOFR+0.51%)± | 5.84 | 10-15-2042 | 3,133,650 | 3,067,171 | ||
FHLMC Series 4205 Class PA | 1.75 | 5-15-2043 | 1,538,684 | 1,256,260 | ||
FHLMC Series 4240 Class FA (30 Day Average U.S. SOFR+0.61%)± | 5.94 | 8-15-2043 | 4,274,488 | 4,188,434 | ||
FHLMC Series 4286 Class VF (30 Day Average U.S. SOFR+0.56%)± | 5.89 | 12-15-2043 | 3,389,659 | 3,321,723 | ||
FHLMC Series 4446 Class CP | 2.25 | 3-15-2045 | 2,011,318 | 1,693,986 | ||
FHLMC Series 4582 Class HA | 3.00 | 9-15-2045 | 7,974,214 | 7,210,616 | ||
Interest rate | Maturity date | Principal | Value | |||
Agency securities(continued) | ||||||
FHLMC Series 4587 Class AF (30 Day Average U.S. SOFR+0.46%)± | 5.79 % | 6-15-2046 | $ | 2,742,113 | $2,731,098 | |
FHLMC Series 4604 Class FB (30 Day Average U.S. SOFR+0.51%)± | 5.84 | 8-15-2046 | 4,683,789 | 4,621,968 | ||
FHLMC Series 4614 Class FG (30 Day Average U.S. SOFR+0.61%)± | 5.94 | 9-15-2046 | 1,959,909 | 1,917,499 | ||
FHLMC Series 4620 Class LF (30 Day Average U.S. SOFR+0.51%)± | 5.84 | 10-15-2046 | 2,602,130 | 2,572,022 | ||
FHLMC Series 4628 Class KF (30 Day Average U.S. SOFR+0.61%)± | 5.94 | 1-15-2055 | 2,328,210 | 2,269,091 | ||
FHLMC Series 4719 Class LM | 3.00 | 9-15-2047 | 1,712,010 | 1,460,614 | ||
FHLMC Series 4719 Class LA | 3.50 | 9-15-2047 | 2,260,565 | 1,990,823 | ||
FHLMC Series 4742 Class PA | 3.00 | 10-15-2047 | 3,579,784 | 3,112,432 | ||
FHLMC Series 4753 Class BD | 3.00 | 1-15-2048 | 1,904,599 | 1,591,150 | ||
FHLMC Series 4793 Class FD (30 Day Average U.S. SOFR+0.41%)± | 5.74 | 6-15-2048 | 636,923 | 616,524 | ||
FHLMC Series 4826 Class KF (30 Day Average U.S. SOFR+0.41%)± | 5.74 | 9-15-2048 | 1,374,582 | 1,335,005 | ||
FHLMC Series 4857 Class JA | 3.35 | 1-15-2049 | 7,110,339 | 6,521,151 | ||
FHLMC Series 4880 Class DA | 3.00 | 5-15-2050 | 2,960,597 | 2,591,616 | ||
FHLMC Series 4903 Class NF (30 Day Average U.S. SOFR+0.51%)± | 5.84 | 8-25-2049 | 1,402,166 | 1,370,158 | ||
FHLMC Series 4927 Class BG | 3.00 | 11-25-2049 | 3,082,061 | 2,706,271 | ||
FHLMC Series 4937 Class MD | 2.50 | 10-25-2049 | 3,125,157 | 2,622,396 | ||
FHLMC Series 4940 Class AG | 3.00 | 5-15-2040 | 2,202,714 | 1,997,002 | ||
FHLMC Series 4941 Class GA | 2.00 | 12-15-2047 | 1,774,142 | 1,420,417 | ||
FHLMC Series 4954 Class LB | 2.50 | 2-25-2050 | 1,577,674 | 1,322,641 | ||
FHLMC Series 4957 Class MY | 3.00 | 2-25-2050 | 1,883,000 | 1,481,738 | ||
FHLMC Series 4979 Class UC | 1.50 | 6-25-2050 | 5,750,703 | 4,458,431 | ||
FHLMC Series 4993 Class KF (30 Day Average U.S. SOFR+0.56%)± | 5.89 | 7-25-2050 | 12,306,342 | 12,011,912 | ||
FHLMC Series 5004 Class FM (30 Day Average U.S. SOFR+0.46%)± | 5.79 | 8-25-2050 | 2,586,838 | 2,507,790 | ||
FHLMC Series 5020 Class ET | 3.50 | 10-25-2050 | 2,604,154 | 2,275,214 | ||
FHLMC Series 5058 Class BC | 5.00 | 11-25-2050 | 1,997,231 | 1,896,146 | ||
FHLMC Series 5091 Class AB | 1.50 | 3-25-2051 | 5,512,723 | 4,260,745 | ||
FHLMC Series 5092 Class HE | 2.00 | 2-25-2051 | 3,166,542 | 2,555,133 | ||
FHLMC Series 5116 Class PB | 2.25 | 2-25-2051 | 3,227,639 | 2,699,946 | ||
FHLMC Series 5118 Class CA | 1.50 | 10-15-2033 | 2,796,228 | 2,413,084 | ||
FHLMC Series 5119 Class AB | 1.50 | 8-25-2049 | 3,117,067 | 2,369,014 | ||
FHLMC Series 5119 Class QF (30 Day Average U.S. SOFR+0.20%)± | 5.53 | 6-25-2051 | 3,702,699 | 3,524,294 | ||
FHLMC Series 5143 Class GA | 2.00 | 6-25-2049 | 1,855,417 | 1,460,164 | ||
FHLMC Series 5159 Class UA | 2.50 | 12-25-2048 | 3,423,753 | 2,928,192 | ||
FHLMC Series 5178 Class TP | 2.50 | 4-25-2049 | 4,268,074 | 3,566,650 | ||
FHLMC Series 5182 Class D | 2.50 | 11-25-2043 | 13,035,109 | 11,557,456 | ||
FHLMC Series 5182 Class M | 2.50 | 5-25-2049 | 2,532,712 | 2,155,330 | ||
FHLMC Series 5184 Class AB | 2.50 | 5-25-2048 | 1,909,441 | 1,647,805 | ||
FHLMC Series 5201 Class CA | 2.50 | 7-25-2048 | 3,730,573 | 3,236,609 | ||
FHLMC Series 5202 Class BH | 2.00 | 12-25-2047 | 2,081,462 | 1,812,225 | ||
FHLMC Series 5202 Class LA | 2.50 | 5-25-2049 | 3,871,507 | 3,251,804 | ||
FHLMC Series 5202 Class TA | 2.50 | 12-25-2048 | 6,252,315 | 5,501,322 | ||
Interest rate | Maturity date | Principal | Value | |||
Agency securities(continued) | ||||||
FHLMC Series 5202 Class MB | 3.00 % | 11-25-2048 | $ | 5,260,841 | $4,589,751 | |
FHLMC Series 5206 Class CA | 3.00 | 2-25-2047 | 2,484,659 | 2,169,111 | ||
FHLMC Series 5206 Class CD | 3.50 | 5-25-2049 | 3,943,567 | 3,500,573 | ||
FHLMC Series 5207 Class PA | 3.00 | 6-25-2051 | 4,145,198 | 3,593,907 | ||
FHLMC Series 5209 Class EA | 3.00 | 8-25-2050 | 3,263,469 | 2,857,837 | ||
FHLMC Series 5209 Class EJ | 3.00 | 8-25-2050 | 3,263,469 | 2,857,837 | ||
FHLMC Series 5210 Class DC | 3.00 | 9-25-2051 | 3,025,340 | 2,703,907 | ||
FHLMC Series 5214 Class BY | 3.00 | 4-25-2052 | 3,164,518 | 2,428,419 | ||
FHLMC Series 5217 Class CD | 2.50 | 7-25-2049 | 3,023,673 | 2,697,433 | ||
FHLMC Series 5220 Class QK | 3.50 | 9-25-2050 | 6,122,501 | 5,597,297 | ||
FHLMC Series 5228 Class TN | 3.50 | 7-25-2039 | 2,912,307 | 2,677,745 | ||
FHLMC Series 5300 Class C | 2.00 | 9-25-2047 | 4,925,671 | 4,410,506 | ||
FHLMC Series 5335 Class FB (30 Day Average U.S. SOFR+0.81%)± | 6.14 | 10-15-2039 | 5,183,112 | 5,186,760 | ||
FHLMC Series 5338 Class FH (30 Day Average U.S. SOFR+0.41%)± | 5.74 | 4-15-2045 | 5,095,075 | 4,955,021 | ||
FHLMC Series 5386 Class DM | 2.00 | 3-25-2044 | 3,473,606 | 2,326,085 | ||
FHLMC Series 5396 Class HF (30 Day Average U.S. SOFR+0.95%)± | 6.28 | 4-25-2054 | 6,799,065 | 6,849,086 | ||
FHLMC Series 5399 Class FB (30 Day Average U.S. SOFR+0.90%)± | 6.23 | 4-25-2054 | 4,370,977 | 4,366,128 | ||
FNMA | 1.50 | 7-1-2051 | 16,231,509 | 11,658,294 | ||
FNMA | 1.52 | 8-21-2035 | 8,018,000 | 5,455,621 | ||
FNMA | 1.90 | 1-25-2036 | 7,437,000 | 5,262,875 | ||
FNMA | 2.00 | 6-1-2040 | 2,916,776 | 2,382,844 | ||
FNMA | 2.00 | 7-1-2040 | 8,707,277 | 7,111,825 | ||
FNMA | 2.00 | 9-1-2040 | 9,805,627 | 8,007,480 | ||
FNMA | 2.00 | 10-1-2040 | 13,188,202 | 10,756,296 | ||
FNMA | 2.00 | 11-1-2040 | 8,604,220 | 7,026,863 | ||
FNMA | 2.00 | 12-1-2040 | 53,573,843 | 43,760,256 | ||
FNMA | 2.00 | 1-1-2041 | 18,420,854 | 15,043,715 | ||
FNMA | 2.00 | 2-1-2041 | 10,288,990 | 8,409,933 | ||
FNMA | 2.00 | 4-1-2041 | 3,891,862 | 3,182,531 | ||
FNMA | 2.00 | 5-1-2041 | 20,008,801 | 16,357,272 | ||
FNMA | 2.00 | 6-1-2041 | 1,659,128 | 1,357,225 | ||
FNMA | 2.00 | 7-1-2041 | 18,483,201 | 15,051,118 | ||
FNMA | 2.00 | 10-1-2041 | 6,736,735 | 5,526,122 | ||
FNMA | 2.00 | 11-1-2041 | 5,643,313 | 4,580,540 | ||
FNMA | 2.00 | 1-1-2042 | 4,539,072 | 3,671,816 | ||
FNMA | 2.00 | 2-1-2042 | 34,037,848 | 27,590,041 | ||
FNMA | 2.00 | 4-1-2042 | 3,508,327 | 2,858,962 | ||
FNMA | 2.00 | 4-1-2046 | 10,330,173 | 7,946,819 | ||
FNMA | 2.00 | 1-1-2047 | 1,894,869 | 1,453,506 | ||
FNMA | 2.00 | 3-1-2047 | 13,857,664 | 10,626,263 | ||
FNMA | 2.50 | 12-1-2040 | 6,073,901 | 5,149,441 | ||
FNMA | 2.50 | 5-1-2041 | 6,534,705 | 5,528,890 | ||
FNMA | 2.50 | 8-1-2041 | 3,622,793 | 3,053,662 | ||
FNMA | 2.50 | 2-1-2042 | 3,722,078 | 3,152,458 | ||
FNMA | 2.50 | 4-1-2042 | 8,119,973 | 6,788,063 | ||
Interest rate | Maturity date | Principal | Value | |||
Agency securities(continued) | ||||||
FNMA | 2.50 % | 5-1-2042 | $ | 4,846,642 | $4,047,671 | |
FNMA | 2.50 | 6-1-2042 | 4,389,106 | 3,665,563 | ||
FNMA | 2.50 | 5-1-2046 | 1,885,296 | 1,526,829 | ||
FNMA | 2.50 | 12-1-2047 | 8,908,728 | 7,520,871 | ||
FNMA | 2.50 | 10-1-2050 | 5,831,747 | 4,728,725 | ||
FNMA | 2.50 | 3-1-2052 | 4,087,234 | 3,280,747 | ||
FNMA | 3.00 | 11-1-2039 | 2,163,697 | 1,973,148 | ||
FNMA | 3.00 | 5-1-2040 | 6,073,854 | 5,264,734 | ||
FNMA | 3.00 | 11-1-2042 | 3,208,922 | 2,755,383 | ||
FNMA | 3.00 | 1-1-2043 | 3,589,231 | 3,163,082 | ||
FNMA | 3.00 | 2-1-2043 | 16,066,730 | 13,597,742 | ||
FNMA | 3.00 | 7-1-2043 | 2,574,276 | 2,210,371 | ||
FNMA | 3.00 | 8-1-2043 | 3,504,496 | 3,009,102 | ||
FNMA | 3.00 | 9-1-2043 | 2,735,485 | 2,350,326 | ||
FNMA | 3.00 | 12-1-2043 | 3,342,791 | 2,870,810 | ||
FNMA | 3.00 | 2-1-2044 | 3,383,077 | 2,905,450 | ||
FNMA | 3.00 | 10-1-2044 | 17,244,207 | 14,809,391 | ||
FNMA | 3.00 | 2-1-2045 | 5,493,750 | 4,718,117 | ||
FNMA | 3.00 | 10-1-2046 | 12,519,566 | 10,690,390 | ||
FNMA | 3.00 | 11-1-2046 | 10,034,784 | 8,527,069 | ||
FNMA | 3.00 | 12-1-2046 | 13,877,237 | 11,773,381 | ||
FNMA | 3.00 | 1-1-2047 | 9,893,945 | 8,394,627 | ||
FNMA | 3.00 | 2-1-2047 | 16,774,213 | 14,353,209 | ||
FNMA | 3.00 | 9-1-2047 | 1,635,492 | 1,386,972 | ||
FNMA | 3.00 | 1-1-2048 | 5,075,490 | 4,299,416 | ||
FNMA | 3.00 | 2-1-2048 | 2,390,310 | 2,029,789 | ||
FNMA | 3.00 | 4-1-2048 | 10,974,221 | 9,424,803 | ||
FNMA | 3.00 | 8-1-2048 | 2,917,541 | 2,505,643 | ||
FNMA | 3.00 | 12-1-2048 | 6,229,788 | 5,280,449 | ||
FNMA | 3.00 | 1-1-2049 | 10,518,561 | 9,009,635 | ||
FNMA | 3.00 | 2-1-2049 | 5,920,256 | 5,022,694 | ||
FNMA | 3.00 | 10-1-2049 | 41,748,730 | 35,854,477 | ||
FNMA | 3.00 | 2-1-2050 | 61,498,825 | 52,288,288 | ||
FNMA | 3.00 | 5-1-2050 | 12,736,052 | 11,008,509 | ||
FNMA | 3.00 | 7-1-2050 | 17,495,301 | 14,842,889 | ||
FNMA | 3.00 | 4-1-2052 | 13,978,725 | 11,748,901 | ||
FNMA | 3.00 | 7-1-2052 | 2,601,328 | 2,235,003 | ||
FNMA | 3.00 | 10-1-2052 | 17,365,213 | 14,566,141 | ||
FNMA | 3.00 | 2-1-2055 | 1,884,105 | 1,580,373 | ||
FNMA | 3.00 | 7-1-2060 | 23,823,400 | 19,330,518 | ||
FNMA | 3.00 | 8-1-2042 | 2,270,699 | 1,951,072 | ||
FNMA | 3.00 | 3-1-2047 | 1,996,698 | 1,680,699 | ||
FNMA | 3.50 | 10-1-2037 | 1,957,078 | 1,820,014 | ||
FNMA | 3.50 | 6-1-2041 | 2,758,167 | 2,522,958 | ||
FNMA | 3.50 | 3-1-2042 | 2,103,686 | 1,886,244 | ||
FNMA | 3.50 | 4-1-2042 | 4,430,447 | 3,972,476 | ||
FNMA | 3.50 | 5-1-2042 | 1,258,275 | 1,138,464 | ||
FNMA | 3.50 | 6-1-2042 | 2,291,176 | 2,073,036 | ||
Interest rate | Maturity date | Principal | Value | |||
Agency securities(continued) | ||||||
FNMA | 3.50 % | 11-1-2042 | $ | 1,798,770 | $1,612,803 | |
FNMA | 3.50 | 8-1-2043 | 15,905,573 | 14,192,023 | ||
FNMA | 3.50 | 12-1-2043 | 8,457,584 | 7,546,354 | ||
FNMA | 3.50 | 1-1-2044 | 1,268,197 | 1,147,385 | ||
FNMA | 3.50 | 4-1-2047 | 11,504,997 | 10,257,858 | ||
FNMA | 3.50 | 6-1-2049 | 7,833,979 | 6,888,105 | ||
FNMA | 3.50 | 1-1-2050 | 3,584,128 | 3,143,594 | ||
FNMA | 3.50 | 2-1-2050 | 2,589,343 | 2,314,172 | ||
FNMA | 3.50 | 4-1-2050 | 12,899,691 | 11,364,698 | ||
FNMA | 3.50 | 7-1-2050 | 11,884,415 | 10,523,568 | ||
FNMA | 3.50 | 5-1-2037 | 1,983,121 | 1,852,780 | ||
FNMA | 3.50 | 7-1-2045 | 33,409,474 | 29,573,059 | ||
FNMA | 4.00 | 1-1-2027 | 4,522,605 | 4,456,920 | ||
FNMA | 4.00 | 9-1-2033 | 1,172,862 | 1,121,888 | ||
FNMA | 4.00 | 3-1-2035 | 11,047,194 | 10,864,204 | ||
FNMA | 4.00 | 10-1-2037 | 805,336 | 770,870 | ||
FNMA | 4.00 | 6-1-2038 | 1,526,317 | 1,466,416 | ||
FNMA | 4.00 | 4-1-2045 | 19,262,839 | 17,648,552 | ||
FNMA | 4.00 | 9-1-2045 | 526,831 | 487,878 | ||
FNMA | 4.00 | 1-1-2046 | 3,777,890 | 3,498,603 | ||
FNMA | 4.00 | 1-1-2047 | 1,829,281 | 1,691,613 | ||
FNMA | 4.00 | 2-1-2047 | 1,484,287 | 1,372,579 | ||
FNMA | 4.00 | 4-1-2047 | 974,960 | 895,871 | ||
FNMA | 4.00 | 10-1-2047 | 744,950 | 689,411 | ||
FNMA | 4.00 | 7-1-2048 | 12,106,618 | 11,074,250 | ||
FNMA | 4.00 | 12-1-2048 | 1,894,086 | 1,753,977 | ||
FNMA | 4.00 | 5-1-2049 | 1,954,093 | 1,801,289 | ||
FNMA | 4.50 | 6-1-2041 | 163,637 | 155,521 | ||
FNMA | 4.50 | 3-1-2043 | 1,993,787 | 1,894,946 | ||
FNMA | 4.50 | 10-1-2045 | 3,206,110 | 3,031,294 | ||
FNMA | 4.50 | 2-1-2046 | 88,202 | 83,300 | ||
FNMA | 4.50 | 7-1-2048 | 3,135,302 | 2,950,865 | ||
FNMA | 4.50 | 11-1-2048 | 1,326,746 | 1,262,098 | ||
FNMA | 6.00 | 2-1-2029 | 824 | 836 | ||
FNMA | 6.00 | 3-1-2033 | 12,547 | 12,740 | ||
FNMA | 6.00 | 11-1-2033 | 4,391 | 4,460 | ||
FNMA | 6.00 | 7-1-2053 | 321,308 | 318,521 | ||
FNMA%% | 6.00 | 5-15-2054 | 112,900,000 | 111,850,394 | ||
FNMA%% | 6.50 | 5-15-2054 | 74,100,000 | 74,658,787 | ||
FNMA | 7.00 | 1-1-2054 | 28,990,725 | 29,773,289 | ||
FNMA | 7.50 | 1-1-2054 | 15,808,350 | 16,419,772 | ||
FNMA Interest STRIPS Series 414 Class A35 | 3.50 | 10-25-2042 | 4,338,212 | 3,881,946 | ||
FNMA Principal STRIPS¤ | 0.00 | 11-15-2030 | 18,777,000 | 13,559,663 | ||
FNMA (30 Day Average U.S. SOFR+2.12%)± | 3.96 | 8-1-2052 | 2,045,233 | 1,907,690 | ||
FNMA (30 Day Average U.S. SOFR+2.12%)± | 4.12 | 9-1-2052 | 4,052,080 | 3,900,840 | ||
FNMA (30 Day Average U.S. SOFR+2.12%)± | 4.14 | 7-1-2052 | 4,542,383 | 4,256,524 | ||
FNMA (30 Day Average U.S. SOFR+2.12%)± | 4.63 | 8-1-2052 | 4,929,244 | 4,710,063 | ||
FNMA (30 Day Average U.S. SOFR+2.13%)± | 4.14 | 10-1-2052 | 10,470,698 | 10,080,410 | ||
Interest rate | Maturity date | Principal | Value | |||
Agency securities(continued) | ||||||
FNMA (30 Day Average U.S. SOFR+2.13%)± | 4.21 % | 11-1-2052 | $ | 3,509,631 | $3,381,728 | |
FNMA (30 Day Average U.S. SOFR+2.13%)± | 4.36 | 7-1-2052 | 5,289,599 | 5,083,014 | ||
FNMA (30 Day Average U.S. SOFR+2.13%)± | 4.62 | 8-1-2052 | 5,896,728 | 5,707,020 | ||
FNMA (30 Day Average U.S. SOFR+2.13%)± | 4.65 | 8-1-2052 | 4,805,834 | 4,655,234 | ||
FNMA (RFUCCT1Y+1.56%)± | 6.72 | 6-1-2043 | 231,275 | 234,402 | ||
FNMA (RFUCCT1Y+1.58%)± | 5.72 | 6-1-2045 | 1,322,984 | 1,348,074 | ||
FNMA (RFUCCT1Y+1.58%)± | 5.92 | 1-1-2046 | 3,178,513 | 3,237,095 | ||
FNMA (RFUCCT1Y+1.58%)± | 7.20 | 10-1-2043 | 676,799 | 688,656 | ||
FNMA (RFUCCT1Y+1.60%)± | 3.06 | 3-1-2050 | 4,640,709 | 4,624,643 | ||
FNMA (RFUCCT1Y+1.61%)± | 2.78 | 6-1-2050 | 2,193,918 | 2,001,213 | ||
FNMA (RFUCCT1Y+1.65%)± | 7.33 | 1-1-2043 | 134,653 | 136,537 | ||
FNMA Series 2010-107 Class FB (30 Day Average U.S. SOFR+0.52%)± | 5.85 | 9-25-2040 | 1,340,732 | 1,327,230 | ||
FNMA Series 2011-111 Class DB | 4.00 | 11-25-2041 | 2,737,782 | 2,537,956 | ||
FNMA Series 2011-117 Class FA (30 Day Average U.S. SOFR+0.56%)± | 5.89 | 11-25-2041 | 3,634,528 | 3,599,724 | ||
FNMA Series 2011-127 Class FC (30 Day Average U.S. SOFR+0.56%)± | 5.89 | 12-25-2041 | 1,669,876 | 1,653,321 | ||
FNMA Series 2011-142 Class EF (30 Day Average U.S. SOFR+0.61%)± | 5.94 | 1-25-2042 | 1,895,230 | 1,881,393 | ||
FNMA Series 2012-12 Class FA (30 Day Average U.S. SOFR+0.61%)± | 5.94 | 2-25-2042 | 1,649,523 | 1,637,277 | ||
FNMA Series 2012-133 Class JF (30 Day Average U.S. SOFR+0.46%)± | 5.79 | 12-25-2042 | 1,944,733 | 1,895,127 | ||
FNMA Series 2012-151 Class NX | 1.50 | 1-25-2043 | 1,768,309 | 1,439,378 | ||
FNMA Series 2012-35 Class FL (30 Day Average U.S. SOFR+0.61%)± | 5.94 | 4-25-2042 | 1,357,576 | 1,347,357 | ||
FNMA Series 2012-47 Class JF (30 Day Average U.S. SOFR+0.61%)± | 5.94 | 5-25-2042 | 2,233,884 | 2,217,161 | ||
FNMA Series 2012-9 Class FA (30 Day Average U.S. SOFR+0.61%)± | 5.94 | 2-25-2042 | 1,268,095 | 1,258,499 | ||
FNMA Series 2012-9 Class WF (30 Day Average U.S. SOFR+0.61%)± | 5.94 | 2-25-2042 | 1,315,706 | 1,305,566 | ||
FNMA Series 2013-11 Class AP | 1.50 | 1-25-2043 | 5,201,175 | 4,582,342 | ||
FNMA Series 2013-15 Class FA (30 Day Average U.S. SOFR+0.46%)± | 5.79 | 3-25-2043 | 2,332,282 | 2,273,036 | ||
FNMA Series 2013-43 Class BP | 1.75 | 5-25-2043 | 2,061,234 | 1,687,185 | ||
FNMA Series 2014-17 Class DY | 3.50 | 4-25-2044 | 3,273,000 | 2,831,634 | ||
FNMA Series 2014-25 Class EL | 3.00 | 5-25-2044 | 2,201,059 | 1,932,902 | ||
FNMA Series 2014-74 Class PC | 2.50 | 6-25-2044 | 1,886,167 | 1,709,001 | ||
FNMA Series 2015-20 Class EF (30 Day Average U.S. SOFR+0.46%)± | 5.79 | 4-25-2045 | 5,494,839 | 5,349,820 | ||
FNMA Series 2015-26 Class GF (30 Day Average U.S. SOFR+0.41%)± | 5.74 | 5-25-2045 | 3,411,457 | 3,319,021 | ||
FNMA Series 2015-32 Class FA (30 Day Average U.S. SOFR+0.41%)± | 5.74 | 5-25-2045 | 2,097,792 | 2,036,695 | ||
FNMA Series 2015-48 Class FB (30 Day Average U.S. SOFR+0.41%)± | 5.74 | 7-25-2045 | 2,534,463 | 2,461,946 | ||
Interest rate | Maturity date | Principal | Value | |||
Agency securities(continued) | ||||||
FNMA Series 2015-8 Class AP | 2.00 % | 3-25-2045 | $ | 4,308,621 | $3,666,900 | |
FNMA Series 2015-84 Class PA | 1.70 | 8-25-2033 | 6,016,857 | 5,384,567 | ||
FNMA Series 2016-11 Class FG (30 Day Average U.S. SOFR+0.46%)± | 5.79 | 3-25-2046 | 1,817,815 | 1,792,029 | ||
FNMA Series 2016-19 Class FD (30 Day Average U.S. SOFR+0.51%)± | 5.84 | 4-25-2046 | 7,793,690 | 7,697,831 | ||
FNMA Series 2016-22 Class FA (30 Day Average U.S. SOFR+0.51%)± | 5.84 | 4-25-2046 | 3,458,506 | 3,410,022 | ||
FNMA Series 2016-45 Class PB | 3.00 | 7-25-2046 | 1,859,157 | 1,355,848 | ||
FNMA Series 2016-48 Class MA | 2.00 | 6-25-2038 | 6,167,098 | 5,511,383 | ||
FNMA Series 2016-57 Class PC | 1.75 | 6-25-2046 | 13,181,365 | 10,668,286 | ||
FNMA Series 2016-69 Class BF (30 Day Average U.S. SOFR+0.51%)± | 5.84 | 10-25-2046 | 2,775,208 | 2,743,367 | ||
FNMA Series 2016-75 Class FE (30 Day Average U.S. SOFR+0.51%)± | 5.84 | 10-25-2046 | 2,150,078 | 2,125,948 | ||
FNMA Series 2016-78 Class FA (30 Day Average U.S. SOFR+0.51%)± | 5.84 | 3-25-2044 | 1,387,597 | 1,368,253 | ||
FNMA Series 2016-79 Class FH (30 Day Average U.S. SOFR+0.51%)± | 5.84 | 11-25-2046 | 2,141,598 | 2,117,647 | ||
FNMA Series 2016-82 Class FE (30 Day Average U.S. SOFR+0.51%)± | 5.84 | 11-25-2046 | 4,898,893 | 4,846,120 | ||
FNMA Series 2016-82 Class FH (30 Day Average U.S. SOFR+0.51%)± | 5.84 | 11-25-2046 | 4,376,735 | 4,316,915 | ||
FNMA Series 2016-84 Class FB (30 Day Average U.S. SOFR+0.51%)± | 5.84 | 11-25-2046 | 2,075,857 | 2,046,918 | ||
FNMA Series 2016-86 Class FE (30 Day Average U.S. SOFR+0.51%)± | 5.84 | 11-25-2046 | 5,313,639 | 5,237,697 | ||
FNMA Series 2016-88 Class CF (30 Day Average U.S. SOFR+0.56%)± | 5.89 | 12-25-2046 | 3,765,002 | 3,720,601 | ||
FNMA Series 2016-91 Class AF (30 Day Average U.S. SOFR+0.51%)± | 5.84 | 12-25-2046 | 2,038,866 | 2,033,079 | ||
FNMA Series 2017-12 Class FD (30 Day Average U.S. SOFR+0.51%)± | 5.84 | 3-25-2047 | 2,309,482 | 2,283,201 | ||
FNMA Series 2017-13 Class PA | 3.00 | 8-25-2046 | 1,888,672 | 1,676,809 | ||
FNMA Series 2017-23 Class FA (30 Day Average U.S. SOFR+0.51%)± | 5.84 | 4-25-2047 | 2,423,093 | 2,390,732 | ||
FNMA Series 2017-26 Class FA (30 Day Average U.S. SOFR+0.46%)± | 5.79 | 4-25-2047 | 5,949,264 | 5,878,057 | ||
FNMA Series 2017-30 Class FA (30 Day Average U.S. SOFR+0.46%)± | 5.79 | 5-25-2047 | 1,881,400 | 1,833,374 | ||
FNMA Series 2017-78 Class FC (30 Day Average U.S. SOFR+0.46%)± | 5.79 | 10-25-2047 | 2,555,377 | 2,486,521 | ||
FNMA Series 2017-79 Class FB (30 Day Average U.S. SOFR+0.36%)± | 5.69 | 10-25-2047 | 4,619,027 | 4,587,863 | ||
FNMA Series 2017-9 Class BF (30 Day Average U.S. SOFR+0.51%)± | 5.84 | 3-25-2047 | 2,629,860 | 2,599,728 | ||
FNMA Series 2017-9 Class DF (30 Day Average U.S. SOFR+0.51%)± | 5.84 | 3-25-2047 | 1,857,410 | 1,836,346 | ||
FNMA Series 2018-14 Class KC | 3.00 | 3-25-2048 | 2,223,403 | 2,035,528 | ||
Interest rate | Maturity date | Principal | Value | |||
Agency securities(continued) | ||||||
FNMA Series 2018-36 Class FD (30 Day Average U.S. SOFR+0.36%)± | 5.69 % | 6-25-2048 | $ | 4,805,160 | $4,764,775 | |
FNMA Series 2018-38 Class MA | 3.30 | 6-25-2048 | 3,519,344 | 3,206,899 | ||
FNMA Series 2018-45 Class TM | 3.00 | 6-25-2048 | 2,918,053 | 2,509,805 | ||
FNMA Series 2018-55 Class GA | 3.38 | 8-25-2048 | 2,776,454 | 2,527,861 | ||
FNMA Series 2018-64 Class A | 3.00 | 9-25-2048 | 2,388,759 | 2,005,398 | ||
FNMA Series 2018-8 Class KL | 2.50 | 3-25-2047 | 2,274,968 | 1,935,644 | ||
FNMA Series 2018-85 Class EA | 3.50 | 12-25-2048 | 1,812,997 | 1,686,328 | ||
FNMA Series 2019-13 Class PE | 3.00 | 3-25-2049 | 1,775,239 | 1,538,221 | ||
FNMA Series 2019-15 Class FA (30 Day Average U.S. SOFR+0.61%)± | 5.94 | 4-25-2049 | 1,278,830 | 1,252,929 | ||
FNMA Series 2019-25 Class PA | 3.00 | 5-25-2048 | 4,750,628 | 4,219,100 | ||
FNMA Series 2019-41 Class FG (30 Day Average U.S. SOFR+0.61%)± | 5.94 | 8-25-2059 | 3,359,168 | 3,283,230 | ||
FNMA Series 2019-43 Class FC (30 Day Average U.S. SOFR+0.51%)± | 5.84 | 8-25-2049 | 2,510,032 | 2,450,769 | ||
FNMA Series 2019-67 Class FB (30 Day Average U.S. SOFR+0.56%)± | 5.89 | 11-25-2049 | 1,299,143 | 1,269,654 | ||
FNMA Series 2020-12 Class FL (30 Day Average U.S. SOFR+0.56%)± | 5.89 | 3-25-2050 | 2,674,580 | 2,590,626 | ||
FNMA Series 2020-37 Class DA | 1.50 | 6-25-2050 | 1,873,621 | 1,580,588 | ||
FNMA Series 2020-45 Class JL | 3.00 | 7-25-2040 | 3,880,125 | 3,437,019 | ||
FNMA Series 2020-48 Class AB | 2.00 | 7-25-2050 | 3,068,693 | 2,435,818 | ||
FNMA Series 2020-48 Class DA | 2.00 | 7-25-2050 | 6,881,584 | 5,545,330 | ||
FNMA Series 2020-57 Class LJ | 2.00 | 8-25-2050 | 3,273,000 | 2,212,761 | ||
FNMA Series 2020-59 Class NC | 3.00 | 8-25-2040 | 2,962,216 | 2,611,068 | ||
FNMA Series 2021-22 Class MN | 2.75 | 10-25-2050 | 3,297,257 | 2,836,037 | ||
FNMA Series 2021-26 Class BD | 1.75 | 5-25-2051 | 1,913,130 | 1,614,584 | ||
FNMA Series 2021-27 Class EC | 1.50 | 5-25-2051 | 9,046,992 | 7,024,559 | ||
FNMA Series 2021-33 Class AV | 2.50 | 3-25-2048 | 1,381,826 | 974,718 | ||
FNMA Series 2021-42 Class AC | 2.00 | 2-25-2051 | 2,615,889 | 2,155,220 | ||
FNMA Series 2021-42 Class DC | 2.00 | 11-25-2050 | 6,406,079 | 5,231,478 | ||
FNMA Series 2021-73 Class DJ | 2.00 | 3-25-2049 | 3,638,177 | 2,957,466 | ||
FNMA Series 2021-73 Class A | 2.50 | 11-25-2049 | 3,961,885 | 3,330,591 | ||
FNMA Series 2021-76 Class KB | 1.25 | 11-25-2051 | 1,587,506 | 1,248,787 | ||
FNMA Series 2021-78 Class ND | 1.50 | 11-25-2051 | 5,009,372 | 3,896,784 | ||
FNMA Series 2021-86 Class MA | 2.50 | 11-25-2047 | 5,586,405 | 4,821,782 | ||
FNMA Series 2021-91 Class AB | 2.50 | 9-25-2049 | 3,334,397 | 2,818,608 | ||
FNMA Series 2021-95 Class MA | 2.50 | 4-25-2050 | 4,231,664 | 3,484,422 | ||
FNMA Series 2021-96 Class AH | 2.50 | 3-25-2049 | 3,690,937 | 3,099,668 | ||
FNMA Series 2022-11 Class D | 3.00 | 1-25-2050 | 2,228,964 | 1,955,032 | ||
FNMA Series 2022-18 Class DL | 3.25 | 7-25-2046 | 4,901,728 | 4,387,145 | ||
FNMA Series 2022-28 Class CA | 2.00 | 1-25-2048 | 3,126,983 | 2,761,097 | ||
FNMA Series 2022-3 Class N | 2.00 | 10-25-2047 | 10,155,624 | 8,578,946 | ||
FNMA Series 2022-4 Class MH | 3.00 | 9-25-2048 | 3,862,538 | 3,436,683 | ||
FNMA Series 2022-49 Class NQ | 3.00 | 2-25-2052 | 1,860,000 | 1,563,062 | ||
FNMA Series 2022-89 Class AY | 3.00 | 2-25-2048 | 3,870,259 | 3,069,079 | ||
FNMA Series 2022-9 Class DJ | 3.25 | 3-25-2049 | 2,630,028 | 2,339,952 | ||
Interest rate | Maturity date | Principal | Value | |||
Agency securities(continued) | ||||||
FNMA Series 2023-14 Class EJ | 2.75 % | 4-25-2049 | $ | 3,508,113 | $3,097,343 | |
FNMA Series 2023-37 Class FG (30 Day Average U.S. SOFR+0.41%)± | 5.74 | 8-25-2050 | 9,221,540 | 8,947,378 | ||
FNMA Series 2023-37 Class FH (30 Day Average U.S. SOFR+0.51%)± | 5.84 | 1-25-2050 | 5,595,758 | 5,466,585 | ||
FNMA Series 2023-38 Class FC (30 Day Average U.S. SOFR+0.66%)± | 5.99 | 6-25-2040 | 3,590,780 | 3,560,591 | ||
FNMA Series 2024-26 Class KY | 3.00 | 12-25-2043 | 3,099,583 | 2,458,355 | ||
GNMA | 2.50 | 12-20-2037 | 3,964,865 | 3,495,290 | ||
GNMA | 2.50 | 6-20-2038 | 7,446,516 | 6,554,748 | ||
GNMA | 3.00 | 6-20-2043 | 3,961,307 | 3,392,607 | ||
GNMA | 3.00 | 8-20-2043 | 1,283,342 | 1,099,094 | ||
GNMA | 3.00 | 10-20-2046 | 588,566 | 502,851 | ||
GNMA | 3.00 | 12-20-2046 | 1,999,581 | 1,710,554 | ||
GNMA | 3.00 | 1-20-2047 | 2,167,058 | 1,852,066 | ||
GNMA | 3.00 | 3-20-2047 | 2,195,866 | 1,879,917 | ||
GNMA | 3.00 | 4-20-2047 | 2,996,647 | 2,563,332 | ||
GNMA | 3.00 | 5-20-2047 | 533,147 | 455,498 | ||
GNMA | 3.00 | 7-20-2047 | 2,162,477 | 1,850,609 | ||
GNMA | 3.00 | 9-20-2047 | 1,732,209 | 1,477,094 | ||
GNMA | 3.00 | 11-15-2047 | 10,121,048 | 8,845,743 | ||
GNMA | 3.00 | 11-20-2047 | 795,569 | 680,926 | ||
GNMA | 3.00 | 12-20-2047 | 172,405 | 145,892 | ||
GNMA | 3.00 | 1-20-2048 | 1,342,331 | 1,144,846 | ||
GNMA | 3.00 | 2-20-2048 | 895,715 | 765,095 | ||
GNMA | 3.00 | 3-20-2048 | 352,673 | 302,003 | ||
GNMA | 3.00 | 10-20-2050 | 8,517,498 | 7,269,229 | ||
GNMA | 3.50 | 1-20-2048 | 2,177,736 | 1,940,650 | ||
GNMA | 4.00 | 3-20-2048 | 545,380 | 496,680 | ||
GNMA | 4.00 | 4-20-2048 | 2,033,091 | 1,851,550 | ||
GNMA | 4.50 | 8-15-2047 | 390,382 | 370,172 | ||
GNMA | 4.50 | 2-20-2049 | 2,631,057 | 2,419,361 | ||
GNMA | 6.00 | 1-20-2053 | 4,467,823 | 4,512,655 | ||
GNMA%% | 6.50 | 5-15-2054 | 82,200,000 | 83,225,731 | ||
GNMA Series 2010-163 Class NC | 4.00 | 12-20-2040 | 2,854,955 | 2,724,230 | ||
GNMA Series 2013-152 Class HA | 2.50 | 6-20-2043 | 3,050,378 | 2,689,756 | ||
GNMA Series 2014-181 Class L | 3.00 | 12-20-2044 | 1,976,655 | 1,701,123 | ||
GNMA Series 2015-144 Class CA | 2.50 | 10-20-2045 | 3,204,763 | 2,691,278 | ||
GNMA Series 2015-161 Class GF (U.S. SOFR 1 Month+0.41%)± | 5.73 | 11-20-2045 | 1,734,607 | 1,688,813 | ||
GNMA Series 2016-136 Class A | 3.00 | 7-20-2044 | 1,801,691 | 1,529,434 | ||
GNMA Series 2016-93 Class AB | 1.75 | 7-20-2044 | 3,584,821 | 2,751,848 | ||
GNMA Series 2016-99 Class TL | 2.00 | 4-16-2044 | 5,227,323 | 4,049,702 | ||
GNMA Series 2017-139 Class GA | 3.00 | 9-20-2047 | 7,240,604 | 6,311,589 | ||
GNMA Series 2017-167 Class BQ | 2.50 | 8-20-2044 | 2,228,686 | 1,988,766 | ||
GNMA Series 2018-65 Class DC | 3.50 | 5-20-2048 | 2,433,839 | 2,105,144 | ||
GNMA Series 2020-133 Class GA | 1.00 | 9-20-2050 | 3,831,113 | 3,137,563 | ||
GNMA Series 2020-138 Class LE | 1.50 | 9-20-2050 | 8,839,169 | 6,749,511 | ||
GNMA Series 2021-215 Class GA | 2.00 | 12-20-2051 | 2,075,663 | 1,716,126 | ||
Interest rate | Maturity date | Principal | Value | |||
Agency securities(continued) | ||||||
GNMA Series 2021-227 Class E | 2.50 % | 7-20-2050 | $ | 14,271,628 | $11,905,069 | |
GNMA Series 2021-27 Class BD | 5.00 | 2-20-2051 | 2,247,900 | 2,134,127 | ||
GNMA Series 2021-27 Class CW±± | 5.00 | 2-20-2051 | 1,324,965 | 1,240,740 | ||
GNMA Series 2021-27 Class NT | 5.00 | 2-20-2051 | 2,693,376 | 2,478,280 | ||
GNMA Series 2021-27 Class Q | 5.00 | 2-20-2051 | 2,361,499 | 2,180,007 | ||
GNMA Series 2021-8 Class CY | 5.00 | 1-20-2051 | 856,346 | 818,767 | ||
GNMA Series 2022-107 Class C | 2.50 | 6-20-2051 | 11,062,889 | 8,776,057 | ||
GNMA Series 2022-153 Class KA | 4.00 | 12-20-2049 | 3,194,804 | 3,004,467 | ||
GNMA Series 2022-191 Class B | 4.00 | 6-20-2041 | 14,145,835 | 12,637,026 | ||
GNMA Series 2022-191 Class BY | 4.00 | 8-20-2041 | 15,226,534 | 13,631,323 | ||
GNMA Series 2022-197 Class LF (30 Day Average U.S. SOFR+0.70%)± | 6.03 | 11-20-2052 | 9,892,481 | 9,708,767 | ||
GNMA Series 2022-205 Class A | 2.00 | 9-20-2051 | 4,080,188 | 3,113,391 | ||
GNMA Series 2022-31 Class GH | 2.50 | 12-20-2049 | 7,136,411 | 6,067,870 | ||
GNMA Series 2022-34 Class DN | 3.50 | 9-20-2041 | 5,973,521 | 5,374,335 | ||
GNMA Series 2022-5 Class BA | 2.00 | 10-20-2049 | 14,490,977 | 11,907,833 | ||
GNMA Series 2022-50 Class CA | 3.00 | 3-20-2052 | 11,211,132 | 9,580,861 | ||
GNMA Series 2022-66 Class CG | 3.50 | 4-20-2052 | 6,593,912 | 6,019,925 | ||
GNMA Series 2022-84 Class A | 2.50 | 1-20-2052 | 3,944,701 | 3,165,462 | ||
GNMA Series 2023-196 Class E | 3.00 | 9-20-2048 | 4,764,121 | 4,301,196 | ||
GNMA Series 2024-45 Class BD | 2.00 | 3-20-2054 | 2,553,207 | 2,202,989 | ||
Total agency securities (Cost $2,252,243,331) | 2,152,674,982 | |||||
Asset-backed securities: 6.91% | ||||||
Ally Auto Receivables Trust Series 2022-3 Class A4 | 5.07 | 6-15-2031 | 1,860,000 | 1,842,261 | ||
American Express Credit Account Master Trust Series 2024-2 Class A | 5.24 | 4-15-2031 | 20,335,000 | 20,379,989 | ||
AmeriCredit Automobile Receivables Trust Series 2022-2 Class A3 | 4.38 | 4-18-2028 | 3,567,000 | 3,536,290 | ||
AmeriCredit Automobile Receivables Trust Series 2023-1 Class A3 | 5.62 | 11-18-2027 | 1,745,000 | 1,752,681 | ||
AmeriCredit Automobile Receivables Trust Series 2023-2 Class A3 | 5.81 | 5-18-2028 | 3,502,000 | 3,509,804 | ||
BA Credit Card Trust Series 2023-A2 Class A2 | 4.98 | 11-15-2028 | 14,708,000 | 14,583,782 | ||
BMW Vehicle Lease Trust Series 2023-1 Class A4 | 5.07 | 6-25-2026 | 2,481,000 | 2,465,584 | ||
Capital One Prime Auto Receivables Trust Series 2023-1 Class A3 | 4.87 | 2-15-2028 | 6,556,000 | 6,490,659 | ||
Chase Auto Owner Trust Series 2022-AA Class A4144A | 3.99 | 3-27-2028 | 2,419,000 | 2,345,928 | ||
College Avenue Student Loans LLC Series 2017-A Class A1 (U.S. SOFR 1 Month+1.76%)144A± | 7.08 | 11-26-2046 | 1,144,785 | 1,154,361 | ||
College Avenue Student Loans LLC Series 2018-A Class A2144A | 4.13 | 12-26-2047 | 996,781 | 942,819 | ||
College Avenue Student Loans LLC Series 2019-A Class A2144A | 3.28 | 12-28-2048 | 1,693,569 | 1,556,445 | ||
Discover Card Execution Note Trust Series 2023-A1 Class A | 4.31 | 3-15-2028 | 5,494,000 | 5,381,680 | ||
Discover Card Execution Note Trust Series 2023-A2 Class A | 4.93 | 6-15-2028 | 15,637,000 | 15,479,667 | ||
Ford Credit Auto Lease Trust Series 2024-A Class A4 | 5.05 | 6-15-2027 | 1,926,000 | 1,904,970 | ||
Ford Credit Auto Owner Trust Series 2022-D Class A4 | 5.30 | 3-15-2028 | 1,673,000 | 1,664,411 | ||
Ford Credit Auto Owner Trust Series 2023-A Class A3 | 4.65 | 2-15-2028 | 7,598,000 | 7,502,476 | ||
Ford Credit Auto Owner Trust Series 2024-1 Class A144A | 4.87 | 8-15-2036 | 5,471,000 | 5,353,659 | ||
GM Financial Automobile Leasing Trust Series 2023-2 Class A4 | 5.09 | 5-20-2027 | 2,343,000 | 2,325,054 | ||
GM Financial Automobile Leasing Trust Series 2023-3 Class A4 | 5.44 | 8-20-2027 | 1,557,000 | 1,553,566 | ||
GM Financial Consumer Automobile Receivables Trust Series 2022-4 Class A3 | 4.82 | 8-16-2027 | 3,022,000 | 3,000,979 | ||
Interest rate | Maturity date | Principal | Value | |||
Asset-backed securities(continued) | ||||||
GM Financial Consumer Automobile Receivables Trust Series 2024-2 Class A4 | 5.04 % | 9-17-2029 | $ | 3,486,000 | $3,448,186 | |
GM Financial Consumer Automobile Receivables Trust Series 2024-2 Class A3 | 5.10 | 3-16-2029 | 5,731,000 | 5,688,000 | ||
GM Financial Revolving Receivables Trust Series 2024-1 Class A144A | 4.98 | 12-11-2036 | 2,770,000 | 2,723,031 | ||
Hyundai Auto Lease Securitization Trust Series 2023-B Class A4144A | 5.17 | 4-15-2027 | 3,749,000 | 3,720,852 | ||
Hyundai Auto Lease Securitization Trust Series 2023-C Class A4144A | 5.84 | 9-15-2027 | 2,612,000 | 2,620,863 | ||
Hyundai Auto Receivables Trust Series 2021-C Class A4 | 1.03 | 12-15-2027 | 2,976,000 | 2,817,843 | ||
Hyundai Auto Receivables Trust Series 2022-A Class A3 | 2.22 | 10-15-2026 | 4,114,954 | 4,030,428 | ||
Hyundai Auto Receivables Trust Series 2022-A Class A4 | 2.35 | 4-17-2028 | 1,708,000 | 1,623,595 | ||
Hyundai Auto Receivables Trust Series 2023-A Class A4 | 4.48 | 7-17-2028 | 3,320,000 | 3,248,293 | ||
Hyundai Auto Receivables Trust Series 2023-B Class A3 | 5.48 | 4-17-2028 | 2,010,000 | 2,009,498 | ||
Mercedes-Benz Auto Receivables Trust Series 2022-1 Class A4 | 5.25 | 2-15-2029 | 3,874,000 | 3,855,105 | ||
Navient Private Education Loan Trust Series 2014-AA Class A3 (U.S. SOFR 1 Month+1.71%)144A± | 7.04 | 10-15-2031 | 1,081,885 | 1,084,130 | ||
Navient Private Education Loan Trust Series 2016-AA Class A2B (U.S. SOFR 1 Month+2.26%)144A± | 7.59 | 12-15-2045 | 576,472 | 580,727 | ||
Navient Private Education Refinance Loan Trust Series 2018-CA Class A2144A | 3.52 | 6-16-2042 | 42,799 | 42,597 | ||
Navient Private Education Refinance Loan Trust Series 2018-DA Class A2A144A | 4.00 | 12-15-2059 | 2,146,206 | 2,079,622 | ||
Navient Private Education Refinance Loan Trust Series 2019-A Class A2A144A | 3.42 | 1-15-2043 | 1,801,771 | 1,750,009 | ||
Navient Private Education Refinance Loan Trust Series 2019-CA Class A2144A | 3.13 | 2-15-2068 | 1,721,656 | 1,657,906 | ||
Navient Private Education Refinance Loan Trust Series 2019-D Class A2A144A | 3.01 | 12-15-2059 | 4,659,767 | 4,379,682 | ||
Navient Private Education Refinance Loan Trust Series 2019-FA Class A2144A | 2.60 | 8-15-2068 | 2,490,320 | 2,313,055 | ||
Navient Private Education Refinance Loan Trust Series 2020-GA Class A144A | 1.17 | 9-16-2069 | 2,074,260 | 1,854,154 | ||
Navient Private Education Refinance Loan Trust Series 2021-BA Class A144A | 0.94 | 7-15-2069 | 1,091,059 | 941,768 | ||
Navient Private Education Refinance Loan Trust Series 2021-CA Class A144A | 1.06 | 10-15-2069 | 4,568,516 | 3,963,280 | ||
Navient Private Education Refinance Loan Trust Series 2021-EA Class A144A | 0.97 | 12-16-2069 | 6,343,349 | 5,420,620 | ||
Navient Private Education Refinance Loan Trust Series 2021-FA Class A144A | 1.11 | 2-18-2070 | 4,127,680 | 3,471,497 | ||
Navient Private Education Refinance Loan Trust Series 2022-A Class A144A | 2.23 | 7-15-2070 | 3,009,258 | 2,620,612 | ||
Navient Student Loan Trust Series 2021-3A Class A1A144A | 1.77 | 8-25-2070 | 4,219,551 | 3,641,971 | ||
Nelnet Student Loan Trust Series 2004-3 Class A5 (90 Day Average U.S. SOFR+0.44%)± | 5.79 | 10-27-2036 | 820,863 | 809,530 | ||
Nelnet Student Loan Trust Series 2004-4 Class A5 (90 Day Average U.S. SOFR+0.42%)± | 5.77 | 1-25-2037 | 2,116,021 | 2,099,820 | ||
Interest rate | Maturity date | Principal | Value | |||
Asset-backed securities(continued) | ||||||
Nelnet Student Loan Trust Series 2005-1 Class A5 (90 Day Average U.S. SOFR+0.37%)± | 5.72 % | 10-25-2033 | $ | 7,070,952 | $6,991,198 | |
Nelnet Student Loan Trust Series 2005-2 Class A5 (90 Day Average U.S. SOFR+0.36%)± | 5.71 | 3-23-2037 | 6,900,028 | 6,826,994 | ||
Nelnet Student Loan Trust Series 2005-3 Class A5 (90 Day Average U.S. SOFR+0.38%)± | 5.73 | 12-24-2035 | 5,091,079 | 5,035,546 | ||
Nelnet Student Loan Trust Series 2005-4 Class A4 (90 Day Average U.S. SOFR+0.44%)± | 5.79 | 3-22-2032 | 1,386,916 | 1,337,528 | ||
Nissan Auto Lease Trust Series 2023-B Class A4 | 5.61 | 11-15-2027 | 3,476,000 | 3,470,010 | ||
Nissan Auto Lease Trust Series 2024-A Class A4 | 4.97 | 9-15-2028 | 2,019,000 | 1,992,088 | ||
Nissan Auto Receivables Owner Trust Series 2022-B Class A4 | 4.45 | 11-15-2029 | 2,437,000 | 2,382,751 | ||
PenFed Auto Receivables Owner Trust Series 2022-A Class A3144A | 3.96 | 4-15-2026 | 2,303,899 | 2,289,406 | ||
PenFed Auto Receivables Owner Trust Series 2022-A Class A4144A | 4.18 | 12-15-2028 | 1,743,000 | 1,713,943 | ||
Santander Drive Auto Receivables Trust Series 2022-2 Class A3 | 2.98 | 10-15-2026 | 509,136 | 508,513 | ||
Santander Drive Auto Receivables Trust Series 2022-3 Class A3 | 3.40 | 12-15-2026 | 832,200 | 829,395 | ||
Santander Drive Auto Receivables Trust Series 2022-4 Class A3 | 4.14 | 2-16-2027 | 2,203,930 | 2,194,889 | ||
Santander Drive Auto Receivables Trust Series 2022-5 Class A3 | 4.11 | 8-17-2026 | 1,162,534 | 1,160,280 | ||
Santander Drive Auto Receivables Trust Series 2022-6 Class A3 | 4.49 | 11-16-2026 | 3,698,595 | 3,688,231 | ||
Santander Drive Auto Receivables Trust Series 2022-7 Class A3 | 5.75 | 4-15-2027 | 1,934,585 | 1,934,531 | ||
Santander Drive Auto Receivables Trust Series 2024-1 Class A3 | 5.25 | 4-17-2028 | 3,508,000 | 3,488,589 | ||
SBNA Auto Lease Trust Series 2024-A Class A4144A | 5.24 | 1-22-2029 | 5,312,000 | 5,274,524 | ||
SBNA Auto Lease Trust Series 2024-A Class A3144A | 5.39 | 11-20-2026 | 3,882,000 | 3,867,125 | ||
SBNA Auto Receivables Trust Series 2024-A Class A4144A | 5.21 | 4-16-2029 | 1,116,000 | 1,102,690 | ||
SBNA Auto Receivables Trust Series 2024-A Class A3144A | 5.32 | 12-15-2028 | 2,598,000 | 2,578,898 | ||
SFS Auto Receivables Securitization Trust Series 2024-1A Class A4144A | 4.94 | 1-21-2031 | 971,000 | 953,363 | ||
SFS Auto Receivables Securitization Trust Series 2024-1A Class A3144A | 4.95 | 5-21-2029 | 5,724,000 | 5,648,569 | ||
SMB Private Education Loan Trust Series 2016-B Class A2A144A | 2.43 | 2-17-2032 | 390,070 | 382,623 | ||
SMB Private Education Loan Trust Series 2016-C Class A2B (U.S. SOFR 1 Month+1.21%)144A± | 6.54 | 9-15-2034 | 328,353 | 328,418 | ||
SMB Private Education Loan Trust Series 2020-B Class A1A144A | 1.29 | 7-15-2053 | 1,580,784 | 1,430,351 | ||
SMB Private Education Loan Trust Series 2021-A Class APT1144A | 1.07 | 1-15-2053 | 5,672,628 | 4,949,414 | ||
SoFi Professional Loan Program LLC Series 2017-D Class A2FX144A | 2.65 | 9-25-2040 | 65,876 | 63,326 | ||
SoFi Professional Loan Program LLC Series 2020-C Class AFX144A | 1.95 | 2-15-2046 | 355,724 | 321,670 | ||
SoFi Professional Loan Program LLC Series 2021-B Class AFX144A | 1.14 | 2-15-2047 | 3,216,270 | 2,688,576 | ||
Synchrony Card Funding LLC Series 2023-A1 Class A | 5.54 | 7-15-2029 | 9,010,000 | 9,010,045 | ||
T-Mobile U.S. Trust Series 2022-1A Class A144A | 4.91 | 5-22-2028 | 3,719,000 | 3,695,218 | ||
T-Mobile U.S. Trust Series 2024-1A Class A144A | 5.05 | 9-20-2029 | 5,829,000 | 5,779,752 | ||
Toyota Auto Receivables Owner Trust Series 2022-D Class A4 | 5.43 | 4-17-2028 | 2,132,000 | 2,127,815 | ||
Toyota Auto Receivables Owner Trust Series 2023-B Class A3 | 4.71 | 2-15-2028 | 4,376,000 | 4,320,053 | ||
Toyota Auto Receivables Owner Trust Series 2023-C Class A3 | 5.16 | 4-17-2028 | 5,998,000 | 5,964,313 | ||
Verizon Master Trust Series 2022-2 Class A | 1.53 | 7-20-2028 | 3,146,000 | 3,053,990 | ||
Verizon Master Trust Series 2022-4 Class A | 3.40 | 11-20-2028 | 6,085,000 | 5,948,434 | ||
Interest rate | Maturity date | Principal | Value | |||
Asset-backed securities(continued) | ||||||
Verizon Master Trust Series 2022-6 Class A | 3.67 % | 1-22-2029 | $ | 4,554,000 | $4,447,693 | |
Verizon Master Trust Series 2023-1 Class A | 4.49 | 1-22-2029 | 6,417,000 | 6,306,054 | ||
Verizon Master Trust Series 2023-2 Class A | 4.89 | 4-13-2028 | 2,391,000 | 2,374,612 | ||
Verizon Master Trust Series 2023-4 Class A1A | 5.16 | 6-20-2029 | 11,813,000 | 11,727,983 | ||
Verizon Master Trust Series 2024-1 Class A1A | 5.00 | 12-20-2028 | 8,712,000 | 8,635,487 | ||
Volkswagen Auto Loan Enhanced Trust Series 2023-1 Class A3 | 5.02 | 6-20-2028 | 5,050,000 | 5,006,096 | ||
WF Card Issuance Trust Series 2024-A1 Class A | 4.94 | 2-15-2029 | 11,097,000 | 10,998,661 | ||
World Omni Select Auto Trust Series 2023-A Class A2A | 5.92 | 3-15-2027 | 2,198,518 | 2,200,644 | ||
Total asset-backed securities (Cost $354,853,304) | 346,254,028 | |||||
Corporate bonds and notes: 21.02% | ||||||
Basic materials: 0.49% | ||||||
Chemicals: 0.22% | ||||||
Dow Chemical Co. | 5.15 | 2-15-2034 | 3,715,000 | 3,572,676 | ||
Dow Chemical Co. | 5.60 | 2-15-2054 | 2,777,000 | 2,627,349 | ||
LYB International Finance III LLC | 5.50 | 3-1-2034 | 5,108,000 | 4,958,723 | ||
11,158,748 | ||||||
Mining: 0.27% | ||||||
Glencore Funding LLC144A | 5.37 | 4-4-2029 | 7,442,000 | 7,308,579 | ||
Glencore Funding LLC144A | 5.63 | 4-4-2034 | 6,497,000 | 6,285,449 | ||
13,594,028 | ||||||
Communications: 1.88% | ||||||
Internet: 0.14% | ||||||
Meta Platforms, Inc. | 5.60 | 5-15-2053 | 3,471,000 | 3,442,323 | ||
Meta Platforms, Inc. | 5.75 | 5-15-2063 | 3,471,000 | 3,458,985 | ||
6,901,308 | ||||||
Media: 0.36% | ||||||
Charter Communications Operating LLC/Charter Communications Operating Capital | 3.50 | 6-1-2041 | 946,000 | 605,254 | ||
Charter Communications Operating LLC/Charter Communications Operating Capital | 3.50 | 3-1-2042 | 4,621,000 | 2,922,970 | ||
Charter Communications Operating LLC/Charter Communications Operating Capital | 3.90 | 6-1-2052 | 1,343,000 | 807,676 | ||
Charter Communications Operating LLC/Charter Communications Operating Capital | 5.25 | 4-1-2053 | 2,317,000 | 1,739,264 | ||
Charter Communications Operating LLC/Charter Communications Operating Capital | 5.50 | 4-1-2063 | 963,000 | 715,993 | ||
Charter Communications Operating LLC/Charter Communications Operating Capital | 6.15 | 11-10-2026 | 3,817,000 | 3,826,391 | ||
Comcast Corp. | 2.99 | 11-1-2063 | 2,059,000 | 1,171,283 | ||
Comcast Corp. | 4.05 | 11-1-2052 | 1,775,000 | 1,339,818 | ||
Comcast Corp. | 5.35 | 11-15-2027 | 3,617,000 | 3,635,089 | ||
Discovery Communications LLC | 4.00 | 9-15-2055 | 1,925,000 | 1,207,333 | ||
17,971,071 | ||||||
Interest rate | Maturity date | Principal | Value | |||
Telecommunications: 1.38% | ||||||
AT&T, Inc. | 3.50 % | 6-1-2041 | $ | 1,759,000 | $1,304,297 | |
AT&T, Inc. | 3.50 | 9-15-2053 | 2,729,000 | 1,799,134 | ||
AT&T, Inc. | 3.55 | 9-15-2055 | 2,725,000 | 1,777,241 | ||
AT&T, Inc. | 3.65 | 9-15-2059 | 1,723,000 | 1,117,780 | ||
AT&T, Inc. | 3.80 | 12-1-2057 | 4,955,000 | 3,343,084 | ||
AT&T, Inc. | 5.40 | 2-15-2034 | 9,459,000 | 9,241,858 | ||
Cisco Systems, Inc. | 4.80 | 2-26-2027 | 5,570,000 | 5,523,060 | ||
Cisco Systems, Inc. | 4.85 | 2-26-2029 | 5,570,000 | 5,500,490 | ||
Cisco Systems, Inc. | 4.95 | 2-26-2031 | 3,713,000 | 3,651,940 | ||
Cisco Systems, Inc. | 5.05 | 2-26-2034 | 6,498,000 | 6,355,976 | ||
Cisco Systems, Inc. | 5.30 | 2-26-2054 | 2,785,000 | 2,679,802 | ||
T-Mobile USA, Inc. | 1.50 | 2-15-2026 | 1,233,000 | 1,147,107 | ||
T-Mobile USA, Inc. | 2.25 | 2-15-2026 | 3,844,000 | 3,624,070 | ||
T-Mobile USA, Inc. | 2.55 | 2-15-2031 | 2,752,000 | 2,282,281 | ||
T-Mobile USA, Inc. | 3.75 | 4-15-2027 | 5,855,000 | 5,579,117 | ||
T-Mobile USA, Inc. | 5.05 | 7-15-2033 | 4,569,000 | 4,376,939 | ||
T-Mobile USA, Inc. | 5.15 | 4-15-2034 | 1,839,000 | 1,770,656 | ||
T-Mobile USA, Inc. | 5.75 | 1-15-2034 | 1,465,000 | 1,475,415 | ||
Verizon Communications, Inc. | 2.36 | 3-15-2032 | 2,814,000 | 2,245,185 | ||
Verizon Communications, Inc. | 2.65 | 11-20-2040 | 2,306,000 | 1,540,786 | ||
Verizon Communications, Inc. | 5.50 | 2-23-2054 | 3,341,000 | 3,172,904 | ||
69,509,122 | ||||||
Consumer, cyclical: 1.28% | ||||||
Airlines: 0.12% | ||||||
Delta Air Lines, Inc./SkyMiles IP Ltd.144A | 4.75 | 10-20-2028 | 6,042,000 | 5,849,154 | ||
Auto manufacturers: 0.86% | ||||||
Ford Motor Co. | 3.25 | 2-12-2032 | 3,520,000 | 2,846,237 | ||
Ford Motor Credit Co. LLC | 2.90 | 2-10-2029 | 9,367,000 | 8,086,135 | ||
Ford Motor Credit Co. LLC | 4.00 | 11-13-2030 | 5,127,000 | 4,468,104 | ||
General Motors Financial Co., Inc. | 2.70 | 6-10-2031 | 2,971,000 | 2,407,434 | ||
General Motors Financial Co., Inc. | 5.55 | 7-15-2029 | 3,730,000 | 3,670,979 | ||
General Motors Financial Co., Inc. | 5.95 | 4-4-2034 | 2,238,000 | 2,189,017 | ||
Hyundai Capital America144A | 1.30 | 1-8-2026 | 3,471,000 | 3,217,733 | ||
Hyundai Capital America144A | 5.50 | 3-30-2026 | 1,877,000 | 1,865,287 | ||
Hyundai Capital America144A | 5.60 | 3-30-2028 | 5,726,000 | 5,693,103 | ||
Hyundai Capital America144A | 5.70 | 6-26-2030 | 1,829,000 | 1,819,427 | ||
Hyundai Capital America144A | 5.95 | 9-21-2026 | 5,103,000 | 5,120,114 | ||
Hyundai Capital America144A | 6.50 | 1-16-2029 | 1,669,000 | 1,719,302 | ||
43,102,872 | ||||||
Retail: 0.30% | ||||||
Lowe’s Cos., Inc. | 4.25 | 4-1-2052 | 4,458,000 | 3,446,173 | ||
Lowe’s Cos., Inc. | 5.63 | 4-15-2053 | 893,000 | 851,823 | ||
Lowe’s Cos., Inc. | 5.75 | 7-1-2053 | 2,779,000 | 2,700,376 | ||
Lowe’s Cos., Inc. | 5.85 | 4-1-2063 | 917,000 | 887,623 | ||
McDonald’s Corp. | 4.70 | 12-9-2035 | 3,149,000 | 2,934,628 | ||
Interest rate | Maturity date | Principal | Value | |||
Retail(continued) | ||||||
McDonald’s Corp. | 4.80 % | 8-14-2028 | $ | 2,783,000 | $2,737,569 | |
McDonald’s Corp. | 5.45 | 8-14-2053 | 1,713,000 | 1,632,511 | ||
15,190,703 | ||||||
Consumer, non-cyclical: 3.40% | ||||||
Agriculture: 0.70% | ||||||
BAT Capital Corp. | 4.39 | 8-15-2037 | 2,224,000 | 1,825,588 | ||
BAT Capital Corp. | 4.54 | 8-15-2047 | 5,269,000 | 3,942,815 | ||
Bunge Ltd. Finance Corp. | 1.63 | 8-17-2025 | 1,888,000 | 1,792,989 | ||
Philip Morris International, Inc. | 4.88 | 2-15-2028 | 7,115,000 | 6,993,476 | ||
Philip Morris International, Inc. | 4.88 | 2-13-2029 | 4,022,000 | 3,926,229 | ||
Philip Morris International, Inc. | 5.00 | 11-17-2025 | 3,886,000 | 3,855,695 | ||
Philip Morris International, Inc. | 5.25 | 9-7-2028 | 3,951,000 | 3,932,173 | ||
Philip Morris International, Inc. | 5.25 | 2-13-2034 | 2,558,000 | 2,467,575 | ||
Philip Morris International, Inc. | 5.38 | 2-15-2033 | 1,307,000 | 1,281,000 | ||
Philip Morris International, Inc. | 5.50 | 9-7-2030 | 2,577,000 | 2,571,609 | ||
Philip Morris International, Inc. | 5.63 | 9-7-2033 | 1,561,000 | 1,552,175 | ||
Philip Morris International, Inc. | 5.75 | 11-17-2032 | 933,000 | 939,329 | ||
35,080,653 | ||||||
Beverages: 0.57% | ||||||
Anheuser-Busch Cos. LLC/Anheuser-Busch InBev Worldwide, Inc. | 4.70 | 2-1-2036 | 11,657,000 | 10,851,003 | ||
Anheuser-Busch InBev Worldwide, Inc. | 4.38 | 4-15-2038 | 2,381,000 | 2,109,819 | ||
Anheuser-Busch InBev Worldwide, Inc. | 5.80 | 1-23-2059 | 1,373,000 | 1,394,411 | ||
Constellation Brands, Inc. | 5.25 | 11-15-2048 | 3,821,000 | 3,453,896 | ||
Keurig Dr Pepper, Inc. | 4.50 | 4-15-2052 | 2,587,000 | 2,106,222 | ||
Keurig Dr Pepper, Inc. | 5.30 | 3-15-2034 | 4,500,000 | 4,381,668 | ||
PepsiCo, Inc. | 3.90 | 7-18-2032 | 4,604,000 | 4,216,310 | ||
28,513,329 | ||||||
Biotechnology: 0.13% | ||||||
Amgen, Inc. | 5.65 | 3-2-2053 | 6,539,000 | 6,275,356 | ||
Cosmetics/Personal Care: 0.04% | ||||||
Haleon U.S. Capital LLC | 3.63 | 3-24-2032 | 2,452,000 | 2,153,589 | ||
Food: 0.11% | ||||||
Nestle Capital Corp.144A | 4.88 | 3-12-2034 | 2,871,000 | 2,779,909 | ||
Nestle Capital Corp.144A | 5.10 | 3-12-2054 | 2,871,000 | 2,679,294 | ||
5,459,203 | ||||||
Healthcare-services: 0.80% | ||||||
CommonSpirit Health | 3.35 | 10-1-2029 | 1,721,000 | 1,550,499 | ||
HCA, Inc. | 4.13 | 6-15-2029 | 9,832,000 | 9,135,674 | ||
HCA, Inc. | 4.63 | 3-15-2052 | 1,754,000 | 1,373,821 | ||
HCA, Inc. | 5.25 | 6-15-2049 | 1,240,000 | 1,073,012 | ||
HCA, Inc. | 5.90 | 6-1-2053 | 6,224,000 | 5,863,670 | ||
UnitedHealth Group, Inc. | 3.05 | 5-15-2041 | 861,000 | 623,002 | ||
UnitedHealth Group, Inc. | 4.60 | 4-15-2027 | 3,834,000 | 3,770,138 | ||
Interest rate | Maturity date | Principal | Value | |||
Healthcare-services(continued) | ||||||
UnitedHealth Group, Inc. | 4.70 % | 4-15-2029 | $ | 2,874,000 | $2,811,119 | |
UnitedHealth Group, Inc. | 4.90 | 4-15-2031 | 3,834,000 | 3,730,193 | ||
UnitedHealth Group, Inc. | 5.00 | 4-15-2034 | 2,878,000 | 2,783,889 | ||
UnitedHealth Group, Inc. | 5.38 | 4-15-2054 | 1,916,000 | 1,819,983 | ||
UnitedHealth Group, Inc. | 5.50 | 4-15-2064 | 956,000 | 907,171 | ||
UnitedHealth Group, Inc. | 5.88 | 2-15-2053 | 4,441,000 | 4,521,723 | ||
39,963,894 | ||||||
Pharmaceuticals: 1.05% | ||||||
AbbVie, Inc. | 3.20 | 11-21-2029 | 6,843,000 | 6,172,718 | ||
AbbVie, Inc. | 4.05 | 11-21-2039 | 1,944,000 | 1,647,026 | ||
AbbVie, Inc. | 4.25 | 11-21-2049 | 2,039,000 | 1,666,104 | ||
AbbVie, Inc. | 4.50 | 5-14-2035 | 4,026,000 | 3,716,312 | ||
AbbVie, Inc. | 4.55 | 3-15-2035 | 4,580,000 | 4,252,425 | ||
AbbVie, Inc. | 4.80 | 3-15-2027 | 4,641,000 | 4,585,157 | ||
AbbVie, Inc. | 4.80 | 3-15-2029 | 4,641,000 | 4,556,422 | ||
AbbVie, Inc. | 4.95 | 3-15-2031 | 2,785,000 | 2,731,719 | ||
AbbVie, Inc. | 5.05 | 3-15-2034 | 4,641,000 | 4,525,803 | ||
AbbVie, Inc. | 5.40 | 3-15-2054 | 2,785,000 | 2,696,357 | ||
AstraZeneca Finance LLC | 5.00 | 2-26-2034 | 3,753,000 | 3,650,780 | ||
Bristol-Myers Squibb Co. | 5.65 | 2-22-2064 | 2,787,000 | 2,667,524 | ||
CVS Health Corp. | 5.05 | 3-25-2048 | 2,223,000 | 1,896,209 | ||
Eli Lilly & Co. | 4.70 | 2-9-2034 | 3,686,000 | 3,528,690 | ||
Eli Lilly & Co. | 5.00 | 2-9-2054 | 2,777,000 | 2,582,467 | ||
Eli Lilly & Co. | 5.10 | 2-9-2064 | 1,852,000 | 1,719,394 | ||
52,595,107 | ||||||
Energy: 0.86% | ||||||
Oil & gas: 0.41% | ||||||
BP Capital Markets America, Inc. | 4.70 | 4-10-2029 | 4,614,000 | 4,511,487 | ||
BP Capital Markets America, Inc. | 4.99 | 4-10-2034 | 4,629,000 | 4,470,038 | ||
Diamondback Energy, Inc. | 5.15 | 1-30-2030 | 3,465,000 | 3,398,557 | ||
Diamondback Energy, Inc. | 5.20 | 4-18-2027 | 1,856,000 | 1,842,525 | ||
Diamondback Energy, Inc. | 5.40 | 4-18-2034 | 3,504,000 | 3,405,052 | ||
Diamondback Energy, Inc. | 5.75 | 4-18-2054 | 1,862,000 | 1,777,575 | ||
Diamondback Energy, Inc. | 5.90 | 4-18-2064 | 932,000 | 886,586 | ||
20,291,820 | ||||||
Pipelines: 0.45% | ||||||
Energy Transfer LP | 5.30 | 4-15-2047 | 3,899,000 | 3,369,699 | ||
Energy Transfer LP | 5.40 | 10-1-2047 | 1,392,000 | 1,221,475 | ||
Energy Transfer LP | 5.95 | 5-15-2054 | 4,647,000 | 4,379,656 | ||
MPLX LP | 4.95 | 3-14-2052 | 4,413,000 | 3,688,396 | ||
MPLX LP | 5.00 | 3-1-2033 | 5,509,000 | 5,180,983 | ||
ONEOK, Inc. | 6.63 | 9-1-2053 | 4,740,000 | 4,943,871 | ||
22,784,080 | ||||||
Interest rate | Maturity date | Principal | Value | |||
Financial: 6.71% | ||||||
Banks: 4.75% | ||||||
Bank of America Corp. (U.S. SOFR+0.96%)± | 1.73 % | 7-22-2027 | $ | 12,570,000 | $11,532,192 | |
Bank of America Corp. (U.S. SOFR+1.34%)± | 5.93 | 9-15-2027 | 10,018,000 | 10,064,597 | ||
Bank of America Corp. (U.S. SOFR+1.57%)± | 5.82 | 9-15-2029 | 2,793,000 | 2,809,433 | ||
Bank of America Corp. (U.S. SOFR+1.84%)± | 5.87 | 9-15-2034 | 3,725,000 | 3,731,775 | ||
Bank of America Corp. (U.S. SOFR+1.91%)± | 5.29 | 4-25-2034 | 1,597,000 | 1,538,284 | ||
Bank of America Corp. (U.S. SOFR 3 Month+1.30%)± | 3.42 | 12-20-2028 | 12,843,000 | 11,904,055 | ||
Citigroup, Inc. (U.S. SOFR+2.06%)± | 5.83 | 2-13-2035 | 2,038,000 | 1,961,489 | ||
Citigroup, Inc. (U.S. SOFR+2.66%)± | 6.17 | 5-25-2034 | 4,363,000 | 4,330,016 | ||
Citizens Financial Group, Inc. (U.S. SOFR+2.01%)± | 5.84 | 1-23-2030 | 4,627,000 | 4,531,543 | ||
Citizens Financial Group, Inc. (U.S. SOFR+2.33%)± | 6.65 | 4-25-2035 | 2,239,000 | 2,245,260 | ||
Goldman Sachs Bank USA (U.S. SOFR+0.78%)± | 5.28 | 3-18-2027 | 10,207,000 | 10,139,701 | ||
HSBC USA, Inc. | 5.29 | 3-4-2027 | 13,999,000 | 13,951,355 | ||
JPMorgan Chase & Co. (U.S. SOFR+0.93%)± | 5.57 | 4-22-2028 | 13,971,000 | 13,959,987 | ||
JPMorgan Chase & Co. (U.S. SOFR+1.16%)± | 5.58 | 4-22-2030 | 11,550,000 | 11,539,762 | ||
JPMorgan Chase & Co. (U.S. SOFR+1.49%)± | 5.77 | 4-22-2035 | 7,454,000 | 7,458,985 | ||
M&T Bank Corp. (U.S. SOFR+2.26%)± | 6.08 | 3-13-2032 | 2,783,000 | 2,719,040 | ||
Morgan Stanley Bank NA (U.S. SOFR+1.08%)± | 4.95 | 1-14-2028 | 9,408,000 | 9,267,133 | ||
Morgan Stanley (U.S. SOFR+1.01%)± | 5.65 | 4-13-2028 | 3,730,000 | 3,733,659 | ||
Morgan Stanley (U.S. SOFR+1.26%)± | 5.66 | 4-18-2030 | 12,585,000 | 12,587,672 | ||
Morgan Stanley (U.S. SOFR+1.58%)± | 5.83 | 4-19-2035 | 13,096,000 | 13,090,723 | ||
Morgan Stanley (U.S. SOFR+1.59%)± | 5.16 | 4-20-2029 | 1,817,000 | 1,787,307 | ||
Morgan Stanley (U.S. SOFR+1.63%)± | 5.45 | 7-20-2029 | 3,632,000 | 3,609,788 | ||
Morgan Stanley (U.S. SOFR+1.73%)± | 5.47 | 1-18-2035 | 3,326,000 | 3,235,788 | ||
Morgan Stanley (U.S. SOFR+2.56%)± | 6.34 | 10-18-2033 | 6,255,000 | 6,487,404 | ||
Santander Holdings USA, Inc. (U.S. SOFR+3.28%)± | 7.66 | 11-9-2031 | 3,705,000 | 3,962,442 | ||
Truist Financial Corp. (U.S. SOFR+1.62%)± | 5.44 | 1-24-2030 | 4,636,000 | 4,541,309 | ||
Truist Financial Corp. (U.S. SOFR+1.92%)± | 5.71 | 1-24-2035 | 2,782,000 | 2,699,895 | ||
Truist Financial Corp. (U.S. SOFR+2.45%)± | 7.16 | 10-30-2029 | 6,407,000 | 6,708,615 | ||
Wells Fargo & Co. (U.S. SOFR+1.07%)± | 5.71 | 4-22-2028 | 11,175,000 | 11,182,770 | ||
Wells Fargo & Co. (U.S. SOFR+1.50%)± | 5.20 | 1-23-2030 | 18,694,000 | 18,330,026 | ||
Wells Fargo & Co. (U.S. SOFR+1.74%)± | 5.57 | 7-25-2029 | 1,827,000 | 1,821,165 | ||
Wells Fargo & Co. (U.S. SOFR+1.79%)± | 6.30 | 10-23-2029 | 2,815,000 | 2,883,852 | ||
Wells Fargo & Co. (U.S. SOFR+2.06%)± | 6.49 | 10-23-2034 | 7,471,000 | 7,778,296 | ||
Wells Fargo & Co. (U.S. SOFR+2.10%)± | 4.90 | 7-25-2033 | 10,265,000 | 9,637,361 | ||
237,762,679 | ||||||
Diversified financial services: 0.17% | ||||||
BlackRock Funding, Inc. | 4.70 | 3-14-2029 | 928,000 | 910,315 | ||
BlackRock Funding, Inc. | 5.00 | 3-14-2034 | 2,690,000 | 2,612,083 | ||
BlackRock Funding, Inc. | 5.25 | 3-14-2054 | 930,000 | 877,866 | ||
Capital One Financial Corp. (U.S. SOFR+3.07%)± | 7.62 | 10-30-2031 | 3,705,000 | 3,986,951 | ||
8,387,215 | ||||||
Insurance: 0.31% | ||||||
Aon North America, Inc. | 5.13 | 3-1-2027 | 926,000 | 919,670 | ||
Aon North America, Inc. | 5.15 | 3-1-2029 | 8,361,000 | 8,249,106 | ||
Interest rate | Maturity date | Principal | Value | |||
Insurance(continued) | ||||||
Aon North America, Inc. | 5.45 % | 3-1-2034 | $ | 4,637,000 | $4,535,261 | |
Aon North America, Inc. | 5.75 | 3-1-2054 | 1,854,000 | 1,792,317 | ||
15,496,354 | ||||||
Real estate: 0.04% | ||||||
CBRE Services, Inc. | 5.50 | 4-1-2029 | 1,855,000 | 1,832,187 | ||
REITS: 1.44% | ||||||
Agree LP | 2.00 | 6-15-2028 | 3,432,000 | 2,969,200 | ||
Agree LP | 2.60 | 6-15-2033 | 781,000 | 595,329 | ||
Agree LP | 4.80 | 10-1-2032 | 1,721,000 | 1,580,967 | ||
American Homes 4 Rent LP | 3.63 | 4-15-2032 | 3,159,000 | 2,701,955 | ||
American Homes 4 Rent LP | 4.30 | 4-15-2052 | 1,415,000 | 1,056,266 | ||
American Tower Corp. | 2.95 | 1-15-2051 | 915,000 | 552,349 | ||
American Tower Corp. | 3.13 | 1-15-2027 | 1,548,000 | 1,450,694 | ||
American Tower Corp. | 5.50 | 3-15-2028 | 3,655,000 | 3,636,614 | ||
American Tower Corp. | 5.90 | 11-15-2033 | 5,465,000 | 5,502,883 | ||
Brixmor Operating Partnership LP | 2.50 | 8-16-2031 | 3,021,000 | 2,419,810 | ||
Crown Castle, Inc. | 2.10 | 4-1-2031 | 3,105,000 | 2,456,646 | ||
Crown Castle, Inc. | 2.90 | 4-1-2041 | 1,675,000 | 1,121,410 | ||
Crown Castle, Inc. | 5.10 | 5-1-2033 | 2,684,000 | 2,534,665 | ||
Crown Castle, Inc. | 5.80 | 3-1-2034 | 5,672,000 | 5,618,315 | ||
Essex Portfolio LP | 2.55 | 6-15-2031 | 1,629,000 | 1,320,541 | ||
Invitation Homes Operating Partnership LP | 2.00 | 8-15-2031 | 544,000 | 420,440 | ||
Invitation Homes Operating Partnership LP | 4.15 | 4-15-2032 | 3,144,000 | 2,800,382 | ||
Realty Income Corp. | 2.10 | 3-15-2028 | 1,773,000 | 1,562,016 | ||
Realty Income Corp. | 2.20 | 6-15-2028 | 1,692,000 | 1,484,614 | ||
Realty Income Corp. | 2.85 | 12-15-2032 | 2,286,000 | 1,844,295 | ||
Realty Income Corp. | 3.40 | 1-15-2030 | 1,893,000 | 1,687,366 | ||
Realty Income Corp. | 4.90 | 7-15-2033 | 2,721,000 | 2,555,862 | ||
Realty Income Corp. | 5.13 | 2-15-2034 | 5,807,000 | 5,522,189 | ||
Realty Income Corp. | 5.63 | 10-13-2032 | 1,387,000 | 1,378,204 | ||
Regency Centers LP | 2.95 | 9-15-2029 | 4,326,000 | 3,803,589 | ||
Regency Centers LP | 5.25 | 1-15-2034 | 3,709,000 | 3,546,219 | ||
Store Capital LLC | 2.70 | 12-1-2031 | 1,098,000 | 848,970 | ||
Store Capital LLC | 2.75 | 11-18-2030 | 2,794,000 | 2,230,611 | ||
Store Capital LLC | 4.50 | 3-15-2028 | 1,815,000 | 1,689,636 | ||
Store Capital LLC | 4.63 | 3-15-2029 | 2,015,000 | 1,871,452 | ||
Sun Communities Operating LP | 4.20 | 4-15-2032 | 4,106,000 | 3,595,327 | ||
72,358,816 | ||||||
Industrial: 2.06% | ||||||
Aerospace/defense: 0.82% | ||||||
Boeing Co. | 3.75 | 2-1-2050 | 1,166,000 | 751,747 | ||
Boeing Co. | 5.81 | 5-1-2050 | 4,842,000 | 4,284,799 | ||
Boeing Co.144A%% | 6.26 | 5-1-2027 | 2,907,000 | 2,916,203 | ||
Boeing Co.144A%% | 6.30 | 5-1-2029 | 3,873,000 | 3,888,385 | ||
Boeing Co.144A%% | 6.39 | 5-1-2031 | 2,907,000 | 2,920,058 | ||
Interest rate | Maturity date | Principal | Value | |||
Aerospace/defense(continued) | ||||||
Boeing Co.144A%% | 6.53 % | 5-1-2034 | $ | 3,863,000 | $3,890,816 | |
Boeing Co.144A%% | 6.86 | 5-1-2054 | 2,907,000 | 2,914,876 | ||
Boeing Co.144A%% | 7.01 | 5-1-2064 | 1,939,000 | 1,940,762 | ||
Lockheed Martin Corp. | 4.80 | 8-15-2034 | 3,825,000 | 3,656,987 | ||
Lockheed Martin Corp. | 5.20 | 2-15-2064 | 2,674,000 | 2,482,558 | ||
Northrop Grumman Corp. | 4.40 | 5-1-2030 | 2,106,000 | 2,004,140 | ||
Northrop Grumman Corp. | 5.20 | 6-1-2054 | 478,000 | 439,080 | ||
RTX Corp. | 6.10 | 3-15-2034 | 4,728,000 | 4,887,380 | ||
RTX Corp. | 6.40 | 3-15-2054 | 3,782,000 | 4,056,288 | ||
41,034,079 | ||||||
Building materials: 0.10% | ||||||
Carrier Global Corp. | 5.90 | 3-15-2034 | 3,663,000 | 3,742,426 | ||
Carrier Global Corp. | 6.20 | 3-15-2054 | 1,283,000 | 1,337,541 | ||
5,079,967 | ||||||
Electronics: 0.18% | ||||||
Honeywell International, Inc. | 5.00 | 3-1-2035 | 5,741,000 | 5,572,545 | ||
Honeywell International, Inc. | 5.25 | 3-1-2054 | 1,914,000 | 1,814,198 | ||
Honeywell International, Inc. | 5.35 | 3-1-2064 | 1,914,000 | 1,815,035 | ||
9,201,778 | ||||||
Environmental control: 0.03% | ||||||
Waste Management, Inc. | 4.88 | 2-15-2034 | 1,814,000 | 1,744,123 | ||
Machinery-construction & mining: 0.20% | ||||||
Caterpillar Financial Services Corp. | 4.50 | 1-8-2027 | 4,589,000 | 4,515,324 | ||
Caterpillar Financial Services Corp. | 4.85 | 2-27-2029 | 5,570,000 | 5,493,937 | ||
10,009,261 | ||||||
Machinery-diversified: 0.57% | ||||||
John Deere Capital Corp. | 4.15 | 9-15-2027 | 3,659,000 | 3,545,859 | ||
John Deere Capital Corp. | 4.50 | 1-8-2027 | 6,422,000 | 6,318,396 | ||
John Deere Capital Corp. | 4.50 | 1-16-2029 | 6,422,000 | 6,246,468 | ||
John Deere Capital Corp. | 4.95 | 7-14-2028 | 1,456,000 | 1,443,915 | ||
John Deere Capital Corp. | 5.10 | 4-11-2034 | 4,640,000 | 4,556,100 | ||
John Deere Capital Corp. | 5.15 | 9-8-2026 | 6,365,000 | 6,353,609 | ||
28,464,347 | ||||||
Transportation: 0.16% | ||||||
Burlington Northern Santa Fe LLC | 4.45 | 1-15-2053 | 733,000 | 610,915 | ||
Burlington Northern Santa Fe LLC | 5.20 | 4-15-2054 | 1,947,000 | 1,822,035 | ||
Crowley Conro LLC | 4.18 | 8-15-2043 | 2,261,181 | 1,984,011 | ||
Union Pacific Corp. | 2.38 | 5-20-2031 | 1,744,000 | 1,452,087 | ||
Union Pacific Corp. | 2.80 | 2-14-2032 | 2,367,000 | 1,996,356 | ||
7,865,404 | ||||||
Interest rate | Maturity date | Principal | Value | |||
Technology: 2.14% | ||||||
Computers: 0.10% | ||||||
Apple, Inc. | 2.38 % | 2-8-2041 | $ | 1,334,000 | $896,145 | |
Apple, Inc. | 2.65 | 5-11-2050 | 1,454,000 | 897,231 | ||
Apple, Inc. | 2.65 | 2-8-2051 | 1,123,000 | 689,040 | ||
Apple, Inc. | 3.95 | 8-8-2052 | 3,510,000 | 2,765,112 | ||
5,247,528 | ||||||
Semiconductors: 1.25% | ||||||
Analog Devices, Inc. | 5.05 | 4-1-2034 | 3,723,000 | 3,651,432 | ||
Analog Devices, Inc. | 5.30 | 4-1-2054 | 3,352,000 | 3,188,938 | ||
Broadcom, Inc.144A | 2.45 | 2-15-2031 | 2,869,000 | 2,357,924 | ||
Broadcom, Inc. | 3.15 | 11-15-2025 | 2,150,000 | 2,071,393 | ||
Broadcom, Inc.144A | 4.93 | 5-15-2037 | 2,621,000 | 2,393,546 | ||
Intel Corp. | 2.80 | 8-12-2041 | 1,577,000 | 1,062,729 | ||
Intel Corp. | 5.00 | 2-21-2031 | 2,787,000 | 2,720,155 | ||
Intel Corp. | 5.15 | 2-21-2034 | 3,709,000 | 3,574,432 | ||
Intel Corp. | 5.60 | 2-21-2054 | 2,784,000 | 2,619,770 | ||
Intel Corp. | 5.63 | 2-10-2043 | 1,052,000 | 1,022,510 | ||
Intel Corp. | 5.70 | 2-10-2053 | 3,657,000 | 3,492,032 | ||
Intel Corp. | 5.90 | 2-10-2063 | 2,557,000 | 2,489,125 | ||
KLA Corp. | 3.30 | 3-1-2050 | 1,502,000 | 1,028,972 | ||
KLA Corp. | 4.70 | 2-1-2034 | 3,705,000 | 3,524,219 | ||
Marvell Technology, Inc. | 5.75 | 2-15-2029 | 2,730,000 | 2,742,613 | ||
Marvell Technology, Inc. | 5.95 | 9-15-2033 | 2,730,000 | 2,746,200 | ||
Micron Technology, Inc. | 5.38 | 4-15-2028 | 9,186,000 | 9,148,332 | ||
Micron Technology, Inc. | 5.88 | 2-9-2033 | 1,079,000 | 1,084,736 | ||
QUALCOMM, Inc. | 6.00 | 5-20-2053 | 4,132,000 | 4,336,989 | ||
Texas Instruments, Inc. | 4.85 | 2-8-2034 | 1,840,000 | 1,783,540 | ||
Texas Instruments, Inc. | 5.00 | 3-14-2053 | 4,036,000 | 3,696,455 | ||
Texas Instruments, Inc. | 5.15 | 2-8-2054 | 1,852,000 | 1,735,938 | ||
62,471,980 | ||||||
Software: 0.79% | ||||||
Adobe, Inc. | 4.80 | 4-4-2029 | 4,653,000 | 4,602,870 | ||
Adobe, Inc. | 4.85 | 4-4-2027 | 3,723,000 | 3,704,854 | ||
Adobe, Inc. | 4.95 | 4-4-2034 | 5,555,000 | 5,419,194 | ||
Intuit, Inc. | 5.13 | 9-15-2028 | 3,636,000 | 3,625,912 | ||
Intuit, Inc. | 5.20 | 9-15-2033 | 3,634,000 | 3,586,733 | ||
Intuit, Inc. | 5.25 | 9-15-2026 | 4,550,000 | 4,559,239 | ||
Intuit, Inc. | 5.50 | 9-15-2053 | 3,644,000 | 3,563,084 | ||
Oracle Corp. | 4.00 | 7-15-2046 | 3,184,000 | 2,358,886 | ||
VMware LLC | 1.00 | 8-15-2024 | 5,701,000 | 5,620,097 | ||
VMware LLC | 1.40 | 8-15-2026 | 2,568,000 | 2,335,286 | ||
39,376,155 | ||||||
Utilities: 2.20% | ||||||
Electric: 2.20% | ||||||
American Transmission Systems, Inc.144A | 2.65 | 1-15-2032 | 1,140,000 | 921,720 | ||
Interest rate | Maturity date | Principal | Value | |||
Electric(continued) | ||||||
Baltimore Gas & Electric Co. | 2.25 % | 6-15-2031 | $ | 2,448,000 | $2,005,349 | |
Baltimore Gas & Electric Co. | 5.40 | 6-1-2053 | 2,742,000 | 2,583,744 | ||
CenterPoint Energy Houston Electric LLC | 5.15 | 3-1-2034 | 2,225,000 | 2,159,213 | ||
CenterPoint Energy Houston Electric LLC | 5.20 | 10-1-2028 | 2,736,000 | 2,726,952 | ||
CenterPoint Energy Houston Electric LLC Series AH | 3.60 | 3-1-2052 | 1,807,000 | 1,280,161 | ||
Consolidated Edison Co. of New York, Inc. | 3.20 | 12-1-2051 | 548,000 | 353,991 | ||
Consolidated Edison Co. of New York, Inc. | 5.50 | 3-15-2034 | 5,574,000 | 5,556,333 | ||
Consolidated Edison Co. of New York, Inc. | 5.90 | 11-15-2053 | 1,831,000 | 1,840,349 | ||
Consumers Energy Co. | 2.50 | 5-1-2060 | 1,488,000 | 788,276 | ||
DTE Electric Co. | 2.95 | 3-1-2050 | 2,857,000 | 1,794,155 | ||
DTE Electric Co. | 5.20 | 3-1-2034 | 1,848,000 | 1,795,858 | ||
DTE Electric Co. Series B | 3.65 | 3-1-2052 | 1,308,000 | 930,006 | ||
DTE Energy Co.%% | 5.85 | 6-1-2034 | 2,627,000 | 2,612,155 | ||
Duke Energy Carolinas LLC | 2.55 | 4-15-2031 | 1,117,000 | 936,411 | ||
Duke Energy Carolinas LLC | 2.85 | 3-15-2032 | 3,040,000 | 2,541,615 | ||
Duke Energy Carolinas LLC | 3.55 | 3-15-2052 | 2,213,000 | 1,520,475 | ||
Duke Energy Carolinas LLC | 4.95 | 1-15-2033 | 1,865,000 | 1,794,996 | ||
Duke Energy Carolinas LLC | 5.35 | 1-15-2053 | 3,669,000 | 3,413,562 | ||
Duke Energy Carolinas LLC | 5.40 | 1-15-2054 | 1,834,000 | 1,722,592 | ||
Duke Energy Corp. | 3.50 | 6-15-2051 | 506,000 | 334,185 | ||
Duke Energy Florida LLC | 2.40 | 12-15-2031 | 2,440,000 | 1,991,243 | ||
Duke Energy Progress LLC | 2.50 | 8-15-2050 | 2,469,000 | 1,386,983 | ||
Duke Energy Progress LLC | 5.25 | 3-15-2033 | 1,821,000 | 1,786,800 | ||
Entergy Arkansas LLC | 2.65 | 6-15-2051 | 2,204,000 | 1,252,385 | ||
Entergy Arkansas LLC | 5.15 | 1-15-2033 | 3,671,000 | 3,566,094 | ||
Eversource Energy | 5.85 | 4-15-2031 | 3,724,000 | 3,707,629 | ||
Eversource Energy | 5.95 | 7-15-2034 | 2,235,000 | 2,218,799 | ||
FirstEnergy Pennsylvania Electric Co.144A | 3.25 | 3-15-2028 | 2,384,000 | 2,186,022 | ||
FirstEnergy Pennsylvania Electric Co.144A | 4.30 | 1-15-2029 | 2,877,000 | 2,722,536 | ||
FirstEnergy Pennsylvania Electric Co.144A | 5.15 | 3-30-2026 | 1,836,000 | 1,809,326 | ||
FirstEnergy Pennsylvania Electric Co.144A | 5.20 | 4-1-2028 | 2,754,000 | 2,720,623 | ||
Jersey Central Power & Light Co.144A | 2.75 | 3-1-2032 | 2,688,000 | 2,183,196 | ||
MidAmerican Energy Co. | 2.70 | 8-1-2052 | 2,121,000 | 1,237,049 | ||
Mississippi Power Co. Series 12-A | 4.25 | 3-15-2042 | 1,246,000 | 1,001,968 | ||
Mississippi Power Co. Series B | 3.10 | 7-30-2051 | 2,934,000 | 1,809,621 | ||
Northern States Power Co. | 5.40 | 3-15-2054 | 2,048,000 | 1,942,519 | ||
NSTAR Electric Co. | 3.10 | 6-1-2051 | 616,000 | 396,328 | ||
Pacific Gas & Electric Co. | 3.50 | 8-1-2050 | 928,000 | 595,184 | ||
Pacific Gas & Electric Co. | 3.95 | 12-1-2047 | 5,572,000 | 3,906,922 | ||
Pacific Gas & Electric Co. | 4.20 | 6-1-2041 | 1,421,000 | 1,092,178 | ||
Pacific Gas & Electric Co. | 4.75 | 2-15-2044 | 823,000 | 663,919 | ||
Pacific Gas & Electric Co. | 4.95 | 7-1-2050 | 7,824,000 | 6,363,430 | ||
Pacific Gas & Electric Co. | 5.80 | 5-15-2034 | 4,267,000 | 4,166,313 | ||
PECO Energy Co. | 2.85 | 9-15-2051 | 2,952,000 | 1,796,713 | ||
Public Service Co. of Oklahoma Series K | 3.15 | 8-15-2051 | 1,656,000 | 1,036,778 | ||
Public Service Electric & Gas Co. | 1.90 | 8-15-2031 | 4,205,000 | 3,337,718 | ||
Public Service Electric & Gas Co. | 2.05 | 8-1-2050 | 679,000 | 357,377 | ||
Public Service Electric & Gas Co. | 2.70 | 5-1-2050 | 1,144,000 | 696,152 | ||
Interest rate | Maturity date | Principal | Value | |||
Electric(continued) | ||||||
Public Service Enterprise Group, Inc. | 5.20 % | 4-1-2029 | $ | 2,791,000 | $2,739,360 | |
Public Service Enterprise Group, Inc. | 5.45 | 4-1-2034 | 3,150,000 | 3,063,441 | ||
Public Service Enterprise Group, Inc. | 5.88 | 10-15-2028 | 3,752,000 | 3,788,264 | ||
Southern California Edison Co. Series C | 4.13 | 3-1-2048 | 1,844,000 | 1,404,794 | ||
Virginia Electric & Power Co. | 2.95 | 11-15-2051 | 2,448,000 | 1,491,063 | ||
110,030,825 | ||||||
Total corporate bonds and notes (Cost $1,094,970,485) | 1,052,756,735 | |||||
Municipal obligations: 0.30% | ||||||
Nevada: 0.08% | ||||||
Airport revenue: 0.08% | ||||||
County of Clark Department of Aviation Series C | 6.82 | 7-1-2045 | 3,365,000 | 3,728,618 | ||
New York: 0.09% | ||||||
Airport revenue: 0.09% | ||||||
Port Authority of New York & New Jersey | 4.46 | 10-1-2062 | 5,505,000 | 4,694,806 | ||
Ohio: 0.03% | ||||||
Education revenue: 0.03% | ||||||
Ohio State University Series A | 4.80 | 6-1-2111 | 1,957,000 | 1,656,131 | ||
Texas: 0.10% | ||||||
Education revenue: 0.02% | ||||||
Board of Regents of the University of Texas System Series B | 2.44 | 8-15-2049 | 1,695,000 | 1,013,232 | ||
Transportation revenue: 0.08% | ||||||
North Texas Tollway Authority Series B | 6.72 | 1-1-2049 | 3,609,000 | 4,056,260 | ||
5,069,492 | ||||||
Total municipal obligations (Cost $17,119,837) | 15,149,047 | |||||
Non-agency mortgage-backed securities: 1.88% | ||||||
Angel Oak Mortgage Trust Series 2020-2 Class A1A144A±± | 2.53 | 1-26-2065 | 1,104,941 | 1,012,894 | ||
Angel Oak Mortgage Trust Series 2020-5 Class A1144A±± | 1.37 | 5-25-2065 | 387,506 | 357,688 | ||
Angel Oak Mortgage Trust Series 2021-6 Class A1144A±± | 1.46 | 9-25-2066 | 2,404,344 | 1,919,290 | ||
Bank5 Trust Series 2024-5YR6 Class A3%% | 6.23 | 5-15-2057 | 4,339,000 | 4,419,061 | ||
BBCMS Mortgage Trust Series 2018-C2 Class ASB | 4.24 | 12-15-2051 | 988,308 | 954,539 | ||
BMO Mortgage Trust Series 2024-5C4 Class A3%% | 6.53 | 5-15-2057 | 3,678,000 | 3,789,118 | ||
Bunker Hill Loan Depositary Trust Series 2019-2 Class A1144A±± | 2.88 | 7-25-2049 | 1,405,166 | 1,311,060 | ||
Bunker Hill Loan Depositary Trust Series 2019-3 Class A1144A±± | 2.72 | 11-25-2059 | 707,957 | 685,121 | ||
BX Commercial Mortgage Trust Series 2021-VOLT Class A (U.S. SOFR 1 Month+0.81%)144A± | 6.14 | 9-15-2036 | 10,912,000 | 10,802,880 | ||
BX Commercial Mortgage Trust Series 2021-XL2 Class A (U.S. SOFR 1 Month+0.80%)144A± | 6.12 | 10-15-2038 | 3,601,975 | 3,568,206 | ||
CFCRE Commercial Mortgage Trust Series 2017-C8 Class ASB | 3.37 | 6-15-2050 | 943,118 | 916,021 | ||
COLT Mortgage Loan Trust Series 2021-2 Class A1144A±± | 0.92 | 8-25-2066 | 3,311,485 | 2,626,014 | ||
COLT Mortgage Loan Trust Series 2021-4 Class A1144A±± | 1.40 | 10-25-2066 | 3,413,730 | 2,748,234 | ||
COMM Mortgage Trust Series 2014-UBS4 Class A4 | 3.42 | 8-10-2047 | 2,415,275 | 2,411,372 | ||
Interest rate | Maturity date | Principal | Value | |||
Non-agency mortgage-backed securities(continued) | ||||||
COMM Mortgage Trust Series 2015-LC23 Class A3 | 3.52 % | 10-10-2048 | $ | 1,901,886 | $1,859,056 | |
EQUS Mortgage Trust Series 2021-EQAZ Class A (U.S. SOFR 1 Month+0.87%)144A± | 6.19 | 10-15-2038 | 2,716,946 | 2,693,172 | ||
GS Mortgage Securities Trust Series 2015-GC32 Class A3 | 3.50 | 7-10-2048 | 1,702,843 | 1,656,924 | ||
GS Mortgage Securities Trust Series 2020-GSA2 Class A4 | 1.72 | 12-12-2053 | 5,595,000 | 4,487,319 | ||
Impact Funding Affordable Multifamily Housing Mortgage Loan Trust Series 2010-1 Class A1144A | 5.31 | 1-25-2051 | 1,615,898 | 1,590,084 | ||
JP Morgan Chase Commercial Mortgage Securities Trust Series 2016-JP4 Class A3 | 3.39 | 12-15-2049 | 1,080,000 | 1,019,688 | ||
JPMBB Commercial Mortgage Securities Trust Series 2014-C23 Class A4 | 3.67 | 9-15-2047 | 934,929 | 931,348 | ||
JPMBB Commercial Mortgage Securities Trust Series 2015-C28 Class A3 | 2.91 | 10-15-2048 | 5,566,736 | 5,468,099 | ||
JPMBB Commercial Mortgage Securities Trust Series 2015-C30 Class A5 | 3.82 | 7-15-2048 | 3,008,000 | 2,894,122 | ||
Med Trust Series 2021-MDLN Class A (U.S. SOFR 1 Month+1.06%)144A± | 6.39 | 11-15-2038 | 1,200,240 | 1,194,989 | ||
MFA Trust Series 2021-NQM2 Class A1144A±± | 1.03 | 11-25-2064 | 1,300,527 | 1,105,684 | ||
Morgan Stanley Capital I Trust Series 2020-HR8 Class A3 | 1.79 | 7-15-2053 | 3,030,000 | 2,454,066 | ||
New Residential Mortgage Loan Trust Series 2019-NQM4 Class A1144A±± | 2.49 | 9-25-2059 | 671,186 | 612,013 | ||
STAR Trust Series 2021-1 Class A1144A±± | 1.22 | 5-25-2065 | 1,112,335 | 962,787 | ||
Starwood Mortgage Residential Trust Series 2020-1 Class A1144A±± | 2.28 | 2-25-2050 | 231,454 | 215,077 | ||
Starwood Mortgage Residential Trust Series 2020-3 Class A1144A±± | 1.49 | 4-25-2065 | 979,214 | 919,412 | ||
Starwood Mortgage Residential Trust Series 2020-INV1 Class A1144A±± | 1.03 | 11-25-2055 | 812,215 | 744,697 | ||
Starwood Mortgage Residential Trust Series 2021-4 Class A1144A±± | 1.16 | 8-25-2056 | 3,041,800 | 2,492,231 | ||
Verus Securitization Trust Series 2019-4 Class A1144A±± | 3.64 | 11-25-2059 | 958,468 | 925,415 | ||
Verus Securitization Trust Series 2019-INV3 Class A1144A±± | 3.69 | 11-25-2059 | 400,542 | 386,789 | ||
Verus Securitization Trust Series 2020-2 Class A1144A±± | 2.23 | 5-25-2060 | 302,096 | 298,802 | ||
Verus Securitization Trust Series 2021-1 Class A1144A±± | 0.82 | 1-25-2066 | 1,512,253 | 1,306,520 | ||
Verus Securitization Trust Series 2021-2 Class A1144A±± | 1.03 | 2-25-2066 | 2,783,462 | 2,376,310 | ||
Verus Securitization Trust Series 2021-3 Class A1144A±± | 1.05 | 6-25-2066 | 2,247,907 | 1,859,993 | ||
Verus Securitization Trust Series 2021-4 Class A1144A±± | 0.94 | 7-25-2066 | 2,857,501 | 2,207,098 | ||
Verus Securitization Trust Series 2021-5 Class A1144A±± | 1.01 | 9-25-2066 | 7,069,671 | 5,780,494 | ||
Verus Securitization Trust Series 2021-7 Class A1144A±± | 1.83 | 10-25-2066 | 3,102,060 | 2,650,840 | ||
Verus Securitization Trust Series 2021-8 Class A1144A±± | 1.82 | 11-25-2066 | 3,015,155 | 2,591,689 | ||
Verus Securitization Trust Series 2021-R1 Class A1144A±± | 0.82 | 10-25-2063 | 1,231,900 | 1,106,232 | ||
Verus Securitization Trust Series 2021-R3 Class A1144A±± | 1.02 | 4-25-2064 | 1,305,934 | 1,148,600 | ||
Visio Trust Series 2020-1R Class A1144A | 1.31 | 11-25-2055 | 919,667 | 846,661 | ||
Total non-agency mortgage-backed securities (Cost $104,028,153) | 94,307,709 | |||||
U.S. Treasury securities: 27.33% | ||||||
U.S. Treasury Bonds | 1.13 | 5-15-2040 | 5,206,000 | 3,065,236 | ||
U.S. Treasury Bonds | 1.13 | 8-15-2040 | 126,786,000 | 73,892,466 | ||
U.S. Treasury Bonds | 1.38 | 11-15-2040 | 23,448,000 | 14,209,854 | ||
Interest rate | Maturity date | Principal | Value | |||
U.S. Treasury securities(continued) | ||||||
U.S. Treasury Bonds | 1.75 % | 8-15-2041 | $ | 121,188,000 | $76,949,646 | |
U.S. Treasury Bonds | 1.88 | 2-15-2041 | 35,688,000 | 23,455,101 | ||
U.S. Treasury Bonds | 2.00 | 11-15-2041 | 76,742,000 | 50,697,684 | ||
U.S. Treasury Bonds | 2.25 | 5-15-2041 | 47,795,000 | 33,307,141 | ||
U.S. Treasury Bonds | 2.38 | 2-15-2042 | 12,685,000 | 8,893,870 | ||
U.S. Treasury Bonds | 2.38 | 5-15-2051 | 38,452,000 | 24,257,805 | ||
U.S. Treasury Bonds | 2.88 | 5-15-2052 | 13,255,000 | 9,327,689 | ||
U.S. Treasury Bonds | 3.13 | 11-15-2041 | 309,000 | 245,148 | ||
U.S. Treasury Bonds | 3.63 | 2-15-2053 | 5,771,000 | 4,715,087 | ||
U.S. Treasury Bonds | 3.88 | 5-15-2043 | 39,063,000 | 34,065,683 | ||
U.S. Treasury Bonds | 4.25 | 2-15-2054 | 111,664,000 | 102,224,902 | ||
U.S. Treasury Bonds | 4.50 | 2-15-2044 | 34,432,000 | 32,688,880 | ||
U.S. Treasury Bonds | 4.75 | 11-15-2053 | 9,617,000 | 9,567,412 | ||
U.S. Treasury Notes | 0.38 | 7-31-2027 | 34,288,000 | 29,714,034 | ||
U.S. Treasury Notes | 0.50 | 8-31-2027 | 32,154,000 | 27,898,619 | ||
U.S. Treasury Notes | 0.63 | 7-31-2026 | 8,942,000 | 8,120,454 | ||
U.S. Treasury Notes | 0.63 | 11-30-2027 | 86,847,000 | 74,963,209 | ||
U.S. Treasury Notes## | 0.75 | 4-30-2026 | 105,071,000 | 96,587,337 | ||
U.S. Treasury Notes | 0.75 | 1-31-2028 | 4,573,000 | 3,941,533 | ||
U.S. Treasury Notes | 1.13 | 10-31-2026 | 47,913,000 | 43,651,363 | ||
U.S. Treasury Notes | 1.13 | 8-31-2028 | 29,299,000 | 25,165,094 | ||
U.S. Treasury Notes | 1.25 | 4-30-2028 | 79,025,000 | 68,924,617 | ||
U.S. Treasury Notes | 1.25 | 9-30-2028 | 4,024,000 | 3,466,456 | ||
U.S. Treasury Notes | 1.50 | 8-15-2026 | 24,320,000 | 22,499,800 | ||
U.S. Treasury Notes | 1.88 | 2-28-2027 | 9,378,000 | 8,635,819 | ||
U.S. Treasury Notes | 2.00 | 11-15-2026 | 49,584,000 | 46,140,236 | ||
U.S. Treasury Notes | 2.38 | 3-31-2029 | 16,662,000 | 14,948,938 | ||
U.S. Treasury Notes | 2.75 | 7-31-2027 | 4,337,000 | 4,065,260 | ||
U.S. Treasury Notes | 3.25 | 6-30-2029 | 60,945,000 | 56,819,309 | ||
U.S. Treasury Notes | 3.63 | 3-31-2030 | 10,272,000 | 9,695,404 | ||
U.S. Treasury Notes | 3.88 | 12-31-2029 | 39,572,000 | 37,907,194 | ||
U.S. Treasury Notes | 4.00 | 2-15-2034 | 42,501,000 | 40,243,134 | ||
U.S. Treasury Notes | 4.13 | 1-31-2025 | 2,792,000 | 2,767,870 | ||
U.S. Treasury Notes | 4.13 | 3-31-2029 | 66,955,000 | 65,207,893 | ||
U.S. Treasury Notes | 4.38 | 10-31-2024 | 1,068,000 | 1,062,775 | ||
U.S. Treasury Notes | 4.50 | 11-30-2024 | 224,000 | 222,891 | ||
U.S. Treasury Notes | 4.50 | 3-31-2026 | 6,866,000 | 6,797,072 | ||
U.S. Treasury Notes | 4.50 | 4-15-2027 | 9,000 | 8,909 | ||
U.S. Treasury Notes | 4.63 | 2-28-2026 | 7,620,000 | 7,561,064 | ||
U.S. Treasury Notes## | 4.63 | 4-30-2029 | 127,599,000 | 127,110,536 | ||
U.S. Treasury Notes | 4.63 | 4-30-2031 | 9,122,000 | 9,079,241 | ||
U.S. Treasury Notes | 4.88 | 4-30-2026 | 24,116,000 | 24,043,464 | ||
Total U.S. Treasury securities (Cost $1,440,137,531) | 1,368,813,129 | |||||
Interest rate | Maturity date | Principal | Value | |||
Yankee corporate bonds and notes: 3.55% | ||||||
Basic materials: 0.14% | ||||||
Mining: 0.14% | ||||||
Anglo American Capital PLC144A | 4.75 % | 3-16-2052 | $ | 3,319,000 | $2,726,615 | |
Anglo American Capital PLC144A | 5.75 | 4-5-2034 | 4,190,000 | 4,137,356 | ||
6,863,971 | ||||||
Consumer, non-cyclical: 0.57% | ||||||
Commercial services: 0.02% | ||||||
Adani International Container Terminal Pvt Ltd.144A | 3.00 | 2-16-2031 | 1,231,520 | 1,023,999 | ||
Food: 0.18% | ||||||
JBS USA Holding Lux SARL/JBS USA Food Co./JBS Lux Co. SARL144A | 7.25 | 11-15-2053 | 9,000,000 | 9,255,078 | ||
Healthcare-products: 0.09% | ||||||
DH Europe Finance II Sarl | 2.20 | 11-15-2024 | 4,503,000 | 4,421,624 | ||
Pharmaceuticals: 0.28% | ||||||
Pfizer Investment Enterprises Pte. Ltd. | 4.75 | 5-19-2033 | 5,449,000 | 5,190,658 | ||
Pfizer Investment Enterprises Pte. Ltd. | 5.30 | 5-19-2053 | 5,780,000 | 5,390,067 | ||
Pfizer Investment Enterprises Pte. Ltd. | 5.34 | 5-19-2063 | 3,665,000 | 3,362,130 | ||
13,942,855 | ||||||
Energy: 0.61% | ||||||
Oil & gas: 0.34% | ||||||
Aker BP ASA144A | 5.60 | 6-13-2028 | 4,793,000 | 4,779,991 | ||
Aker BP ASA144A | 6.00 | 6-13-2033 | 5,907,000 | 5,894,593 | ||
Petroleos Mexicanos | 2.38 | 4-15-2025 | 362,900 | 354,584 | ||
Petroleos Mexicanos | 2.46 | 12-15-2025 | 1,613,000 | 1,526,952 | ||
TotalEnergies Capital SA | 5.15 | 4-5-2034 | 1,852,000 | 1,824,878 | ||
TotalEnergies Capital SA | 5.49 | 4-5-2054 | 1,853,000 | 1,803,011 | ||
TotalEnergies Capital SA | 5.64 | 4-5-2064 | 925,000 | 903,277 | ||
17,087,286 | ||||||
Pipelines: 0.27% | ||||||
Enbridge, Inc. | 5.63 | 4-5-2034 | 2,777,000 | 2,716,971 | ||
Enbridge, Inc. | 5.95 | 4-5-2054 | 925,000 | 895,709 | ||
Enbridge, Inc. | 6.00 | 11-15-2028 | 2,750,000 | 2,795,281 | ||
Enbridge, Inc. | 6.20 | 11-15-2030 | 2,750,000 | 2,832,097 | ||
Galaxy Pipeline Assets Bidco Ltd.144A | 2.16 | 3-31-2034 | 3,115,178 | 2,598,726 | ||
Galaxy Pipeline Assets Bidco Ltd.144A | 2.63 | 3-31-2036 | 2,354,000 | 1,846,427 | ||
13,685,211 | ||||||
Financial: 2.20% | ||||||
Banks: 2.17% | ||||||
Banco Bilbao Vizcaya Argentaria SA (1 Year Treasury Constant Maturity+1.95%)± | 6.03 | 3-13-2035 | 3,600,000 | 3,523,026 | ||
Banco Bilbao Vizcaya Argentaria SA (1 Year Treasury Constant Maturity+3.30%)± | 7.88 | 11-15-2034 | 3,800,000 | 4,070,695 | ||
Interest rate | Maturity date | Principal | Value | |||
Banks(continued) | ||||||
Banco Santander SA | 6.61 % | 11-7-2028 | $ | 2,800,000 | $2,904,618 | |
Banco Santander SA | 6.94 | 11-7-2033 | 7,000,000 | 7,489,504 | ||
Banco Santander SA (1 Year Treasury Constant Maturity+1.45%)± | 5.54 | 3-14-2030 | 6,400,000 | 6,272,750 | ||
Banco Santander SA (1 Year Treasury Constant Maturity+1.65%)± | 6.53 | 11-7-2027 | 2,800,000 | 2,845,164 | ||
Barclays PLC (U.S. SOFR+1.49%)± | 5.67 | 3-12-2028 | 5,560,000 | 5,520,937 | ||
Barclays PLC (U.S. SOFR+1.74%)± | 5.69 | 3-12-2030 | 5,560,000 | 5,486,364 | ||
Barclays PLC (U.S. SOFR+2.62%)± | 6.69 | 9-13-2034 | 4,136,000 | 4,282,459 | ||
BNP Paribas SA (U.S. SOFR+1.52%)144A± | 5.18 | 1-9-2030 | 5,495,000 | 5,387,999 | ||
BNP Paribas SA (U.S. SOFR+1.87%)144A± | 5.89 | 12-5-2034 | 5,407,000 | 5,461,530 | ||
Danske Bank AS (1 Year Treasury Constant Maturity+1.40%)144A± | 5.71 | 3-1-2030 | 4,740,000 | 4,680,882 | ||
Deutsche Bank AG (U.S. SOFR+2.26%)± | 3.74 | 1-7-2033 | 7,107,000 | 5,712,024 | ||
ING Groep NV (U.S. SOFR+1.44%)± | 5.34 | 3-19-2030 | 4,715,000 | 4,619,387 | ||
Lloyds Banking Group PLC (1 Year Treasury Constant Maturity+1.38%)± | 5.46 | 1-5-2028 | 11,012,000 | 10,915,704 | ||
Lloyds Banking Group PLC (1 Year Treasury Constant Maturity+1.75%)± | 5.68 | 1-5-2035 | 5,495,000 | 5,360,076 | ||
Societe Generale SA (1 Year Treasury Constant Maturity+1.75%)144A± | 5.63 | 1-19-2030 | 4,628,000 | 4,522,058 | ||
Societe Generale SA (1 Year Treasury Constant Maturity+2.95%)144A± | 7.13 | 1-19-2055 | 2,025,000 | 1,933,437 | ||
UBS AG | 5.65 | 9-11-2028 | 4,277,000 | 4,296,639 | ||
UBS Group AG144A | 4.28 | 1-9-2028 | 4,010,000 | 3,803,225 | ||
UBS Group AG (1 Year Treasury Constant Maturity+1.77%)144A± | 5.70 | 2-8-2035 | 2,004,000 | 1,943,244 | ||
UBS Group AG (1 Year Treasury Constant Maturity+2.00%)144A± | 6.30 | 9-22-2034 | 2,739,000 | 2,780,421 | ||
UBS Group AG (U.S. SOFR+1.73%)144A± | 3.09 | 5-14-2032 | 2,908,000 | 2,407,950 | ||
UBS Group AG (U.S. SOFR+3.73%)144A± | 4.19 | 4-1-2031 | 2,774,000 | 2,529,468 | ||
108,749,561 | ||||||
REITS: 0.03% | ||||||
Trust Fibra Uno144A | 6.39 | 1-15-2050 | 1,883,000 | 1,458,107 | ||
Utilities: 0.03% | ||||||
Electric: 0.03% | ||||||
Israel Electric Corp. Ltd.144A | 3.75 | 2-22-2032 | 1,561,000 | 1,262,834 | ||
Total yankee corporate bonds and notes (Cost $182,097,529) | 177,750,526 | |||||
Yankee government bonds: 0.76% | ||||||
Australia: 0.12% | ||||||
Export Finance & Insurance Corp.144A | 4.63 | 10-26-2027 | 6,151,000 | 6,071,841 | ||
Bermuda: 0.04% | ||||||
Bermuda144A | 5.00 | 7-15-2032 | 1,940,000 | 1,829,420 | ||
Israel: 0.20% | ||||||
Israel | 3.88 | 7-3-2050 | 1,283,000 | 882,073 | ||
Israel | 5.50 | 3-12-2034 | 5,374,000 | 5,085,148 | ||
Interest rate | Maturity date | Principal | Value | |||
Israel(continued) | ||||||
Israel | 5.75 % | 3-12-2054 | $ | 594,000 | $535,455 | |
Israel | 4.50 | 1-17-2033 | 4,019,000 | 3,588,324 | ||
10,091,000 | ||||||
Mexico: 0.34% | ||||||
Mexico | 2.66 | 5-24-2031 | 2,923,000 | 2,369,754 | ||
Mexico | 3.25 | 4-16-2030 | 1,412,000 | 1,224,442 | ||
Mexico | 4.60 | 1-23-2046 | 3,637,000 | 2,768,048 | ||
Mexico | 4.60 | 2-10-2048 | 1,825,000 | 1,378,290 | ||
Mexico | 3.50 | 2-12-2034 | 10,310,000 | 8,254,462 | ||
Mexico | 6.34 | 5-4-2053 | 1,039,000 | 966,510 | ||
16,961,506 | ||||||
Panama: 0.02% | ||||||
Panama | 4.50 | 4-16-2050 | 471,000 | 301,630 | ||
Panama | 6.85 | 3-28-2054 | 627,000 | 545,076 | ||
846,706 | ||||||
Paraguay: 0.04% | ||||||
Paraguay144A | 5.40 | 3-30-2050 | 2,726,000 | 2,269,395 | ||
Total yankee government bonds (Cost $39,480,574) | 38,069,868 | |||||
Yield | Shares | |||||
Short-term investments: 1.85% | ||||||
Investment companies: 1.85% | ||||||
Allspring Government Money Market Fund Select Class♠∞## | 5.23 | 92,880,101 | 92,880,101 | |||
Total short-term investments (Cost $92,880,101) | 92,880,101 | |||||
Total investments in securities (Cost $5,577,810,845) | 106.57 % | 5,338,656,125 | ||||
Other assets and liabilities, net | (6.57 ) | (329,298,235 ) | ||||
Total net assets | 100.00 % | $5,009,357,890 | ||||
¤ | The security is issued in zero coupon form with no periodic interest payments. |
± | Variable rate investment. The rate shown is the rate in effect at period end. |
%% | The security is purchased on a when-issued basis. |
±± | The coupon of the security is adjusted based on the principal and/or interest payments received from the underlying pool of mortgages as well as the credit quality and the actual prepayment speed of the underlying mortgages. The rate shown is the rate in effect at period end. |
144A | The security may be resold in transactions exempt from registration, normally to qualified institutional buyers, pursuant to Rule 144A under the Securities Act of 1933. |
## | All or a portion of this security is segregated as collateral for when-issued securities. |
♠ | The issuer of the security is an affiliated person of the Portfolio as defined in the Investment Company Act of 1940. |
∞ | The rate represents the 7-day annualized yield at period end. |
Abbreviations: | |
FHLB | Federal Home Loan Bank |
FHLMC | Federal Home Loan Mortgage Corporation |
FNMA | Federal National Mortgage Association |
GNMA | Government National Mortgage Association |
RFUCCT1Y | Refinitiv USD IBOR Consumer Cash Fallbacks Term 1-year |
SOFR | Secured Overnight Financing Rate |
STRIPS | Separate trading of registered interest and principal securities |
Value, beginning of period | Purchases | Sales proceeds | Net realized gains (losses) | Net change in unrealized gains (losses) | Value, end of period | Shares, end of period | Income from affiliated securities | |
Short-term investments | ||||||||
Allspring Government Money Market Fund Select Class | $117,290,523 | $3,010,110,738 | $(3,034,521,160 ) | $0 | $0 | $92,880,101 | 92,880,101 | $7,907,083 |
Assets | |
Investments in unaffiliated securities, at value (cost $5,484,930,744) | $5,245,776,024 |
Investments in affiliated securities, at value (cost $92,880,101) | 92,880,101 |
Cash | 3,708,332 |
Segregated cash for when-issued securities | 1,570,000 |
Receivable for investments sold | 162,865,145 |
Receivable for interest | 29,221,626 |
Principal paydown receivable | 596,443 |
Prepaid expenses and other assets | 48,111 |
Total assets | 5,536,665,782 |
Liabilities | |
Payable for when-issued transactions | 302,041,188 |
Payable for investments purchased | 223,843,916 |
Advisory fee payable | 1,319,255 |
Accrued expenses and other liabilities | 103,533 |
Total liabilities | 527,307,892 |
Total net assets | $5,009,357,890 |
Year Ended April 30, 20241 | Year Ended May 31, 2023 | |
Investment income | ||
Interest (net of foreign withholding taxes of $0 and $5,992, respectively) | $192,205,069 | $151,508,682 |
Income from affiliated securities | 7,907,083 | 3,887,580 |
Total investment income | 200,112,152 | 155,396,262 |
Expenses | ||
Advisory fee | 15,230,641 | 15,815,926 |
Custody and accounting fees | 138,299 | 288,524 |
Professional fees | 94,494 | 134,101 |
Interest holder report expenses | 9,277 | 33,891 |
Trustees’ fees and expenses | 21,767 | 27,688 |
Other fees and expenses | 133,157 | 137,594 |
Total expenses | 15,627,635 | 16,437,724 |
Less: Fee waivers and/or expense reimbursements | (1,204,798 ) | (329,616 ) |
Net expenses | 14,422,837 | 16,108,108 |
Net investment income | 185,689,315 | 139,288,154 |
Realized and unrealized gains (losses) on investments | ||
Net realized gain (losses) on | ||
Unaffiliated securities | (192,463,998 ) | (329,727,799 ) |
Affiliated securities | 0 | (81 ) |
Securities sold short | 255,348 | 0 |
Net realized losses on investments | (192,208,650 ) | (329,727,880 ) |
Net change in unrealized gains (losses) on | ||
Unaffiliated securities | 10,038,835 | 89,960,355 |
Securities sold short | (204,688 ) | 204,688 |
Net change in unrealized gains (losses) on investments | 9,834,147 | 90,165,043 |
Net realized and unrealized gains (losses) on investments | (182,374,503 ) | (239,562,837 ) |
Net increase (decrease) in net assets resulting from operations | $3,314,812 | $(100,274,683 ) |
Year ended April 30, 20241 | Year ended May 31, 2023 | Year ended May 31, 2022 | ||||
Operations | ||||||
Net investment income | $185,689,315 | $139,288,154 | $71,113,325 | |||
Net realized losses on investments | (192,208,650 ) | (329,727,880 ) | (167,999,743 ) | |||
Net change in unrealized gains (losses) on investments | 9,834,147 | 90,165,043 | (357,074,109 ) | |||
Net increase (decrease) in net assets resulting from operations | 3,314,812 | (100,274,683 ) | (453,960,527 ) | |||
Capital transactions | ||||||
Transactions in investors’ beneficial interests | ||||||
Contributions | 764,324,836 | 747,955,348 | 733,615,538 | |||
Withdrawals | (421,264,999 ) | (843,243,755 ) | (1,063,241,380 ) | |||
Net increase (decrease) in net assets resulting from capital share transactions | 343,059,837 | (95,288,407 ) | (329,625,842 ) | |||
Total increase (decrease) in net assets | 346,374,649 | (195,563,090 ) | (783,586,369 ) | |||
Net assets | ||||||
Beginning of period | 4,662,983,241 | 4,858,546,331 | 5,642,132,700 | |||
End of period | $5,009,357,890 | $4,662,983,241 | $4,858,546,331 | |||
Year ended April 30 20241 | Year ended May 31 | |||||
2023 | 2022 | 2021 | 2020 | 2019 | ||
Total return2 | 0.09 % | (1.88 )% | (8.55 )% | 0.65 % | 9.49 % | 6.30 % |
Ratios to average net assets (annualized) | ||||||
Gross expenses | 0.36 % | 0.36 % | 0.36 % | 0.35 % | 0.35 % | 0.35 % |
Net expenses3 | 0.33 % | 0.36 % | 0.36 % | 0.35 % | 0.35 % | 0.35 % |
Net investment income | 4.25 % | 3.08 % | 1.33 % | 1.30 % | 2.28 % | 2.93 % |
Supplemental Data | ||||||
Portfolio turnover rate | 349 % | 384 % | 432 % | 457 % | 603 % | 577 % |
1 | For the eleven months ended April 30, 2024. The Portfolio changed its fiscal year end from May 31 to April 30, effective April 30, 2024. |
2 | Returns for periods of less than one year are not annualized. |
3 | Net expense ratios reflect voluntary waivers, if any. |
Gross unrealized gains | $8,327,381 |
Gross unrealized losses | (262,235,720 ) |
Net unrealized losses | $(253,908,339 ) |
Quoted prices (Level 1) | Other significant observable inputs (Level 2) | Significant unobservable inputs (Level 3) | Total | |
Assets | ||||
Investments in: | ||||
Agency securities | $0 | $2,152,674,982 | $0 | $2,152,674,982 |
Asset-backed securities | 0 | 346,254,028 | 0 | 346,254,028 |
Corporate bonds and notes | 0 | 1,052,756,735 | 0 | 1,052,756,735 |
Municipal obligations | 0 | 15,149,047 | 0 | 15,149,047 |
Non-agency mortgage-backed securities | 0 | 94,307,709 | 0 | 94,307,709 |
U.S. Treasury securities | 1,368,813,129 | 0 | 0 | 1,368,813,129 |
Yankee corporate bonds and notes | 0 | 177,750,526 | 0 | 177,750,526 |
Yankee government bonds | 0 | 38,069,868 | 0 | 38,069,868 |
Short-term investments | ||||
Investment companies | 92,880,101 | 0 | 0 | 92,880,101 |
Total assets | $1,461,693,230 | $3,876,962,895 | $0 | $5,338,656,125 |
Average daily net assets | Advisory fee |
First $500 million | 0.400 % |
Next $500 million | 0.375 |
Next $2 billion | 0.350 |
Next $2 billion | 0.325 |
Next $5 billion | 0.300 |
Over $10 billion | 0.290 |
Purchases at cost | Sales proceeds | |||
U.S. government | Non-U.S. government | U.S. government | Non-U.S. government | |
Year ended April 30, 2024 | $15,926,471,361 | $2,284,471,306 | $15,150,815,836 | $2,228,793,676 |
Year ended May 31, 2023 | 10,700,380,474 | 7,437,782,992 | 10,771,433,780 | 7,064,558,280 |
Allspring Master Trust:
Name and year of birth | Position held and length of service** | Principal occupations during past five years or longer | Current other public company or investment company directorships |
William R. Ebsworth (Born 1957) | Trustee, since 2015 | Retired. From 1984 to 2013, equities analyst, portfolio manager, research director and chief investment officer at Fidelity Management and Research Company in Boston, Tokyo, and Hong Kong, and retired in 2013 as Chief Investment Officer of Fidelity Strategic Advisers, Inc. where he led a team of investment professionals managing client assets. Prior thereto, Board member of Hong Kong Securities Clearing Co., Hong Kong Options Clearing Corp., the Thailand International Fund, Ltd., Fidelity Investments Life Insurance Company, and Empire Fidelity Investments Life Insurance Company. Serves on the Investment Company Institute’s Board of Governors since 2022 and Executive Committee since 2023 as well as the Vice Chairman of the Governing Council of the Independent Directors Council since 2023. Audit Committee Chair and Investment Committee Chair of the Vincent Memorial Hospital Foundation (non-profit organization). Mr. Ebsworth is a CFA charterholder. | N/A |
Jane A. Freeman (Born 1953) | Trustee, since 2015; Chair Liaison, since January 2018*** | Retired. From 2012 to 2014 and 1999 to 2008, Chief Financial Officer of Scientific Learning Corporation. From 2008 to 2012, Ms. Freeman provided consulting services related to strategic business projects. Prior to 1999, Portfolio Manager at Rockefeller & Co. and Scudder, Stevens & Clark. Board member of the Harding Loevner Funds from 1996 to 2014, serving as both Lead Independent Director and chair of the Audit Committee. Board member of the Russell Exchange Traded Funds Trust from 2011 to 2012 and the chair of the Audit Committee. Ms. Freeman is also an inactive Chartered Financial Analyst. | N/A |
Isaiah Harris, Jr. (Born 1952) | Trustee, since 2009; Audit Committee Chair, since 2019 | Retired. Member of the Advisory Board of CEF of East Central Florida. Chairman of the Board of CIGNA Corporation from 2009 to 2021, and Director from 2005 to 2008. From 2003 to 2011, Director of Deluxe Corporation. Prior thereto, President and CEO of BellSouth Advertising and Publishing Corp. from 2005 to 2007, President and CEO of BellSouth Enterprises from 2004 to 2005 and President of BellSouth Consumer Services from 2000 to 2003. Emeritus member of the Iowa State University Foundation Board of Governors. Emeritus Member of the Advisory board of Iowa State University School of Business. Advisory Board Member, Palm Harbor Academy (private school). Advisory Board Member, Fellowship of Christian Athletes. Mr. Harris is a certified public accountant (inactive status). | N/A |
David F. Larcker (Born 1950) | Trustee, since 2009 | Distinguished Visiting Fellow at the Hoover Institution since 2022. James Irvin Miller Professor of Accounting at the Graduate School of Business (Emeritus), Stanford University, Director of the Corporate Governance Research Initiative and Senior Faculty of The Rock Center for Corporate Governance since 2006. From 2005 to 2008, Professor of Accounting at the Graduate School of Business, Stanford University. Prior thereto, Ernst & Young Professor of Accounting at The Wharton School, University of Pennsylvania from 1985 to 2005. | N/A |
Olivia S. Mitchell (Born 1953) | Trustee, since 2006 | International Foundation of Employee Benefit Plans Professor since 1993, Wharton School of the University of Pennsylvania. Director of Wharton’s Pension Research Council and Boettner Center on Pensions & Retirement Research, and Research Associate at the National Bureau of Economic Research. Previously taught at Cornell University from 1978 to 1993. | N/A |
Timothy J. Penny (Born 1951) | Trustee, since 1996; Chair, since 2018 | President and Chief Executive Officer of Southern Minnesota Initiative Foundation, a non-profit organization, since 2007. Vice Chair of the Economic Club of Minnesota, since 2007. Co-Chair of the Committee for a Responsible Federal Budget, since 1995. Member of the Board of Trustees of NorthStar Education Finance, Inc., a non-profit organization, from 2007-2022. Senior Fellow of the University of Minnesota Humphrey Institute from 1995 to 2017. | N/A |
Name and year of birth | Position held and length of service** | Principal occupations during past five years or longer | Current other public company or investment company directorships |
James G. Polisson (Born 1959) | Trustee, since 2018; Nominating and Governance Committee Chair, since 2024 | Retired. Chief Marketing Officer, Source (ETF) UK Services, Ltd, from 2015 to 2017. From 2012 to 2015, Principal of The Polisson Group, LLC, a management consulting, corporate advisory and principal investing company. Chief Executive Officer and Managing Director at Russell Investments, Global Exchange Traded Funds from 2010 to 2012. Managing Director of Barclays Global Investors from 1998 to 2010 and Global Chief Marketing Officer for iShares and Barclays Global Investors from 2000 to 2010. Trustee of the San Francisco Mechanics’ Institute, a non- profit organization, from 2013 to 2015. Board member of the Russell Exchange Traded Fund Trust from 2011 to 2012. Director of Barclays Global Investors Holdings Deutschland GmbH from 2006 to 2009. Mr. Polisson is an attorney and has a retired status with the Massachusetts and District of Columbia Bar Associations. | N/A |
Pamela Wheelock (Born 1959) | Trustee, since January 2020; previously Trustee from January 2018 to July 2019*** | Retired. Executive and Senior Financial leadership positions in the public, private and nonprofit sectors. Interim President and CEO, McKnight Foundation, 2020. Interim Commissioner, Minnesota Department of Human Services, 2019. Chief Operating Officer, Twin Cities Habitat for Humanity, 2017-2019. Vice President for University Services, University of Minnesota, 2012- 2016. Interim President and CEO, Blue Cross and Blue Shield of Minnesota, 2011-2012. Executive Vice-President and Chief Financial Officer, Minnesota Wild, 2002-2008. Commissioner, Minnesota Department of Finance, 1999-2002. Chair of the Board of Directors of Destination Medical Center Corporation. Board member of the Minnesota Wild Foundation. | N/A |
Name and year of birth | Position held and length of service | Principal occupations during past five years or longer |
Andrew Owen (Born 1960) | President, since 2017 | President and Chief Executive Officer of Allspring Funds Management, LLC since 2017 and Head of Global Fund Governance of Allspring Global Investments since 2022. Prior thereto, co-president of Galliard Capital Management, LLC, an affiliate of Allspring Funds Management, LLC, from 2019 to 2022 and Head of Affiliated Managers, Allspring Global Investments, from 2014 to 2019 and Executive Vice President responsible for marketing, investments and product development for Allspring Funds Management, LLC, from 2009 to 2014. |
Jeremy DePalma (Born 1974) | Treasurer, since 2012 (for certain funds in the Fund Complex); since 2021 (for the remaining funds in the Complex) | Senior Vice President of Allspring Funds Management, LLC since 2009. Senior Vice President of Evergreen Investment Management Company, LLC from 2008 to 2010 and head of the Fund Reporting and Control Team within Fund Administration from 2005 to 2010. |
Christopher Baker (Born 1976) | Chief Compliance Officer, since 2022 | Global Chief Compliance Officer for Allspring Global Investments since 2022. Prior thereto, Chief Compliance Officer for State Street Global Advisors from 2018 to 2021. Senior Compliance Officer for the State Street divisions of Alternative Investment Solutions, Sector Solutions, and Global Marketing from 2015 to 2018. From 2010 to 2015 Vice President, Global Head of Investment and Marketing Compliance for State Street Global Advisors. |
Matthew Prasse (Born 1983) | Chief Legal Officer, since 2022; Secretary, since 2021 | Senior Counsel of the Allspring Legal Department since 2021. Senior Counsel of the Wells Fargo Legal Department from 2018 to 2021. Previously, Counsel for Barings LLC from 2015 to 2018. Prior to joining Barings, Associate at Morgan, Lewis & Bockius LLP from 2008 to 2015. |

P.O. Box 219967
Kansas City, MO 64121-9967

AR0940 04-24
2 | |
6 | |
10 | |
11 | |
12 | |
13 | |
15 | |
16 | |
21 | |
25 | |
26 | |
31 | |
32 | |
33 | |
34 | |
35 | |
38 | |
39 |

Allspring Funds

President
Allspring Funds
Notice to Shareholders |
Beginning in July 2024, the Fund will be required by the Securities and Exchange Commission to send shareholders a paper copy of a new tailored shareholder report in place of the full shareholder report that you are now receiving. The tailored shareholder report will contain concise information about the Fund, including certain expense and performance information and fund statistics. If you wish to receive this new tailored shareholder report electronically, please follow the instructions on the back cover of this report. |
Other information that is currently included in the shareholder report, such as the Fund’s financial statements, will be available online and upon request, free of charge, in paper or electronic format. |
Notice to Shareholders |
At a meeting held on May 28-30, 2024, the Board of Trustees of the Fund approved a proposal to collapse the master- feeder structure under which the Fund invests 100% of its assets in the Allspring Emerging Growth Portfolio. On or about September 13, 2024, the Fund will begin to invest substantially all of its assets directly in a portfolio of securities based on the Fund’s existing investment strategy. For additional details regarding this and related changes, please consult the Fund’s prospectuses, summary prospectuses and statement of additional information. |
Investment objective | The Fund seeks long-term capital appreciation. |
Manager | Allspring Funds Management, LLC |
Subadviser for the affiliated master portfolio* | Allspring Global Investments, LLC |
Portfolio managers | Robert Gruendyke, CFA, David Nazaret, CFA, Thomas C. Ognar, CFA†, Michael T. Smith, CFA††, Christopher J. Warner, CFA†† |
Average annual total returns (%) as of April 30, 2024 | |||||||||
Including sales charge | Excluding sales charge | Expense ratios1 (%) | |||||||
Inception date | 1 year | 5 year | 10 year | 1 year | 5 year | 10 year | Gross | Net2 | |
Class A (WEMAX) | 3-31-2008 | -1.49 | 2.89 | 7.55 | 4.51 | 4.12 | 8.19 | 1.39 | 1.22 |
Class C (WEMCX) | 3-31-2008 | 2.55 | 3.35 | 7.57 | 3.55 | 3.35 | 7.57 | 2.14 | 1.97 |
Class R6 (WEGRX)3 | 7-31-2018 | – | – | – | 4.82 | 4.53 | 8.67 | 0.97 | 0.80 |
Administrator Class (WFGDX) | 1-31-2007 | – | – | – | 4.51 | 4.20 | 8.30 | 1.32 | 1.15 |
Institutional Class (WEMIX) | 3-31-2008 | – | – | – | 4.76 | 4.49 | 8.62 | 1.07 | 0.85 |
Russell 3000® Index4 | – | – | – | – | 22.30 | 12.43 | 11.81 | – | – |
Russell 2000® Growth Index5 | – | – | – | – | 12.39 | 5.04 | 7.60 | – | – |
1 | Reflects the expense ratios as stated in the most recent prospectuses. The expense ratios shown are subject to change and may differ from the annualized expense ratios shown in the Financial Highlights of this report. |
2 | The manager has contractually committed through September 30, 2024, to waive fees and/or reimburse expenses to the extent necessary to cap total annual fund operating expenses after fee waivers at 1.22% for Class A, 1.97% for Class C, 0.80% for Class R6, 1.15% for Administrator Class and 0.85% for Institutional Class. Brokerage commissions, stamp duty fees, interest, taxes, acquired fund fees and expenses (if any) from funds in which the affiliated master portfolio invests, and extraordinary expenses are excluded from the expense caps. Net expenses from the affiliated master portfolio are included in the expense caps. Prior to or after the commitment expiration date, the caps may be increased or the commitment to maintain the caps may be terminated only with the approval of the Board of Trustees. Without these caps, the Fund’s returns would have been lower. The expense ratio paid by an investor is the net expense ratio (the total annual fund operating expenses after fee waivers) as stated in the prospectuses. |
3 | Historical performance shown for the Class R6 shares prior to their inception reflects the performance of the Institutional Class shares, and includes the higher expenses applicable to the Institutional Class shares. If these expenses had not been included, returns for the Class R6 shares would be higher. |
4 | The Russell 3000® Index measures the performance of the 3,000 largest U.S. companies based on total market capitalization, which represents approximately 98% of the investable U.S. equity market. You cannot invest directly in an index. |
5 | The Russell 2000® Growth Index measures the performance of those Russell 2000 companies with higher price/book ratios and higher forecasted growth values. You cannot invest directly in an index. |
* | The Fund is a feeder fund in a master-feeder structure that invests substantially all of its assets in a single affiliated master portfolio of the Allspring Master Trust with a substantially identical investment objective and substantially similar investment strategies. References to the investment activities of the Fund are intended to refer to the investment activities of the affiliated master portfolio in which it invests. |
† | Mr. Ognar has announced his intention to retire from Allspring Global Investments, LLC in August 2025. He will continue to serve as a portfolio manager of the Fund until July 26, 2024. |
†† | Mr. Smith and Mr. Warner became portfolio managers of the Fund on May 31, 2024. |
CFA® and Chartered Financial Analyst® are trademarks owned by CFA Institute. | |
Growth of $10,000 investment as of April 30, 20241 |
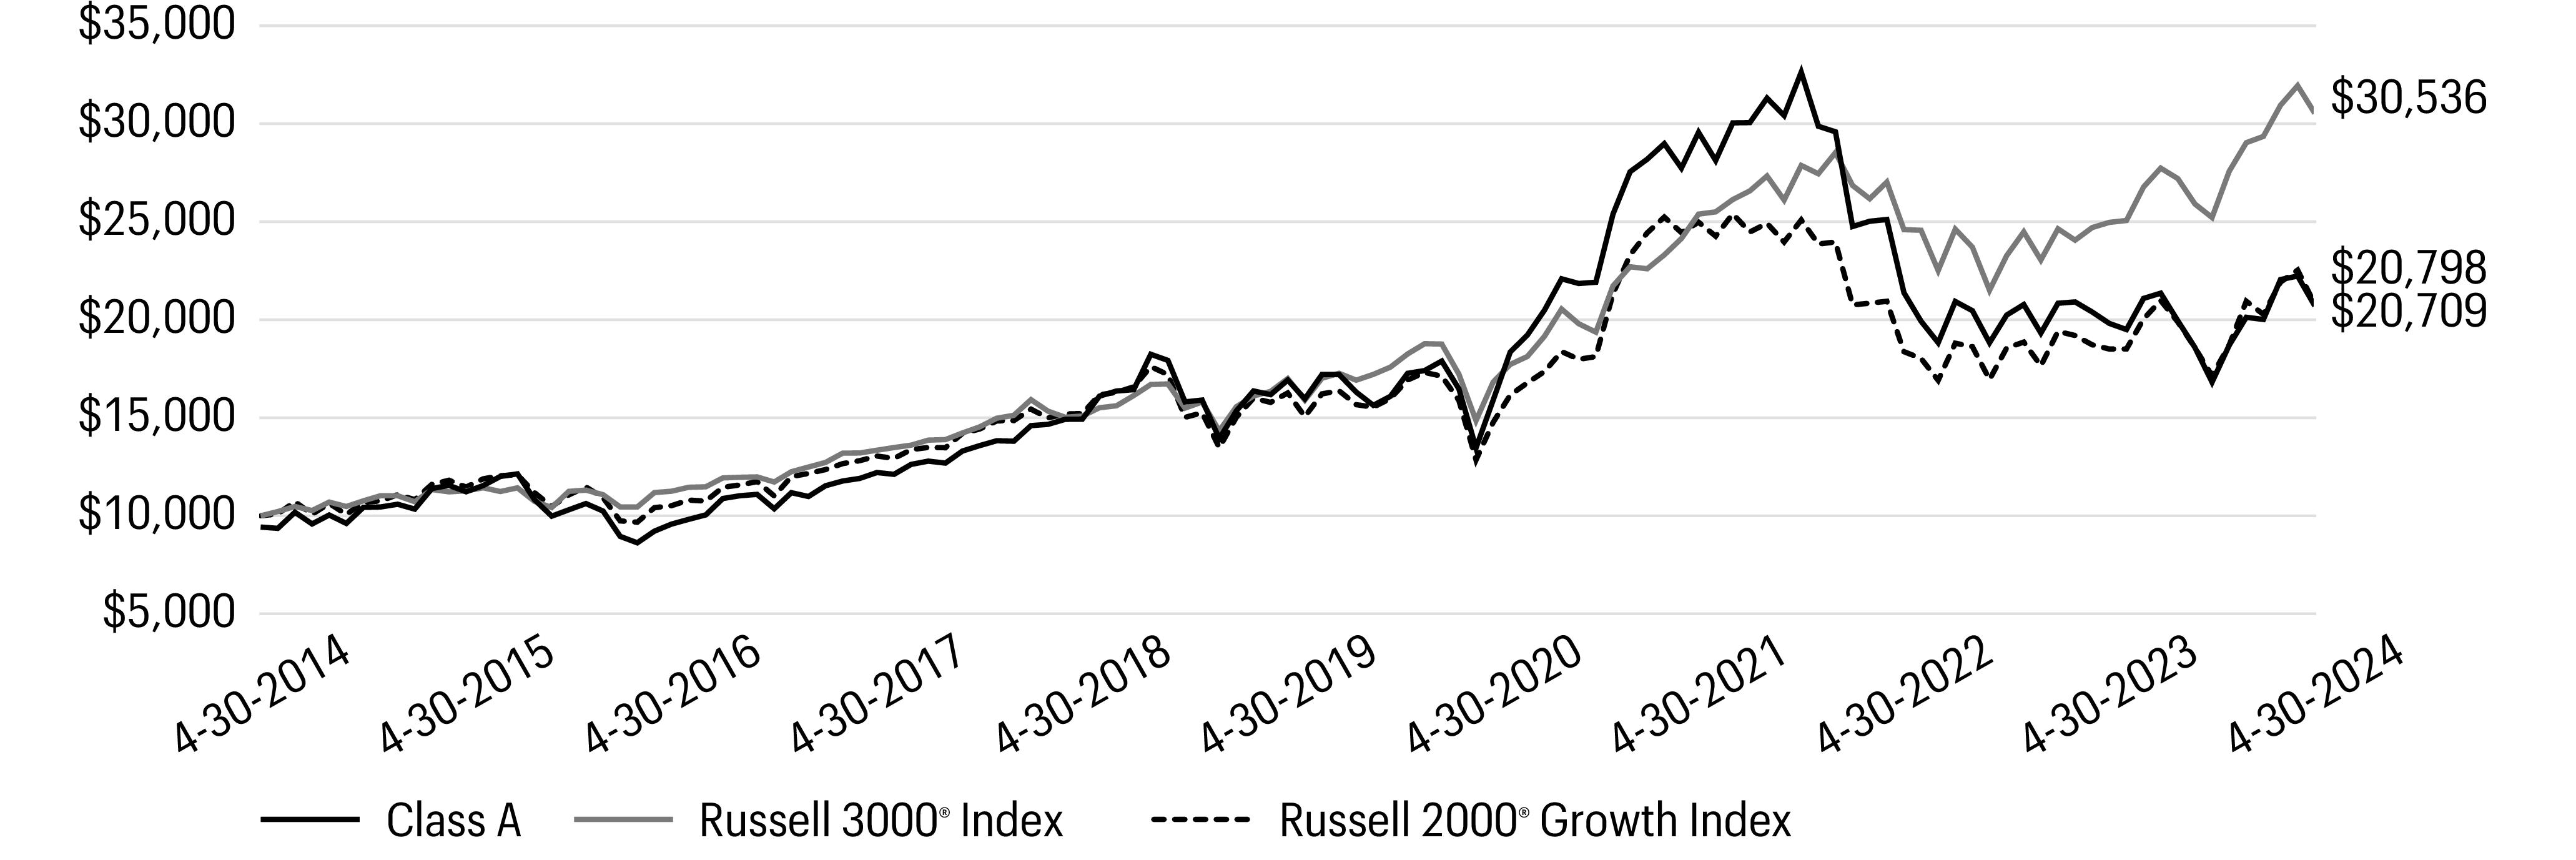
1 | The chart compares the performance of Class A shares for the most recent ten years with the Russell 3000® Index and Russell 2000® Growth Index. The chart assumes a hypothetical investment of $10,000 in Class A shares and reflects all operating expenses and assumes the maximum initial sales charge of 5.75%. |
Ten largest holdings (%) as of April 30, 20241 | |
TransMedics Group, Inc. | 3.46 |
CyberArk Software Ltd. | 3.19 |
SPS Commerce, Inc. | 2.89 |
Casella Waste Systems, Inc. Class A | 2.88 |
e.l.f. Beauty, Inc. | 2.78 |
SPX Technologies, Inc. | 2.74 |
RadNet, Inc. | 2.72 |
BellRing Brands, Inc. | 2.45 |
Boot Barn Holdings, Inc. | 2.37 |
Comfort Systems USA, Inc. | 2.35 |
1 | Each holding represents the Fund’s allocable portion of the affiliated master portfolio security. Figures represent each holding as a percentage of the Fund’s net assets. Holdings are subject to change and may have changed since the date specified. |
Sector allocation as of April 30, 20241 |
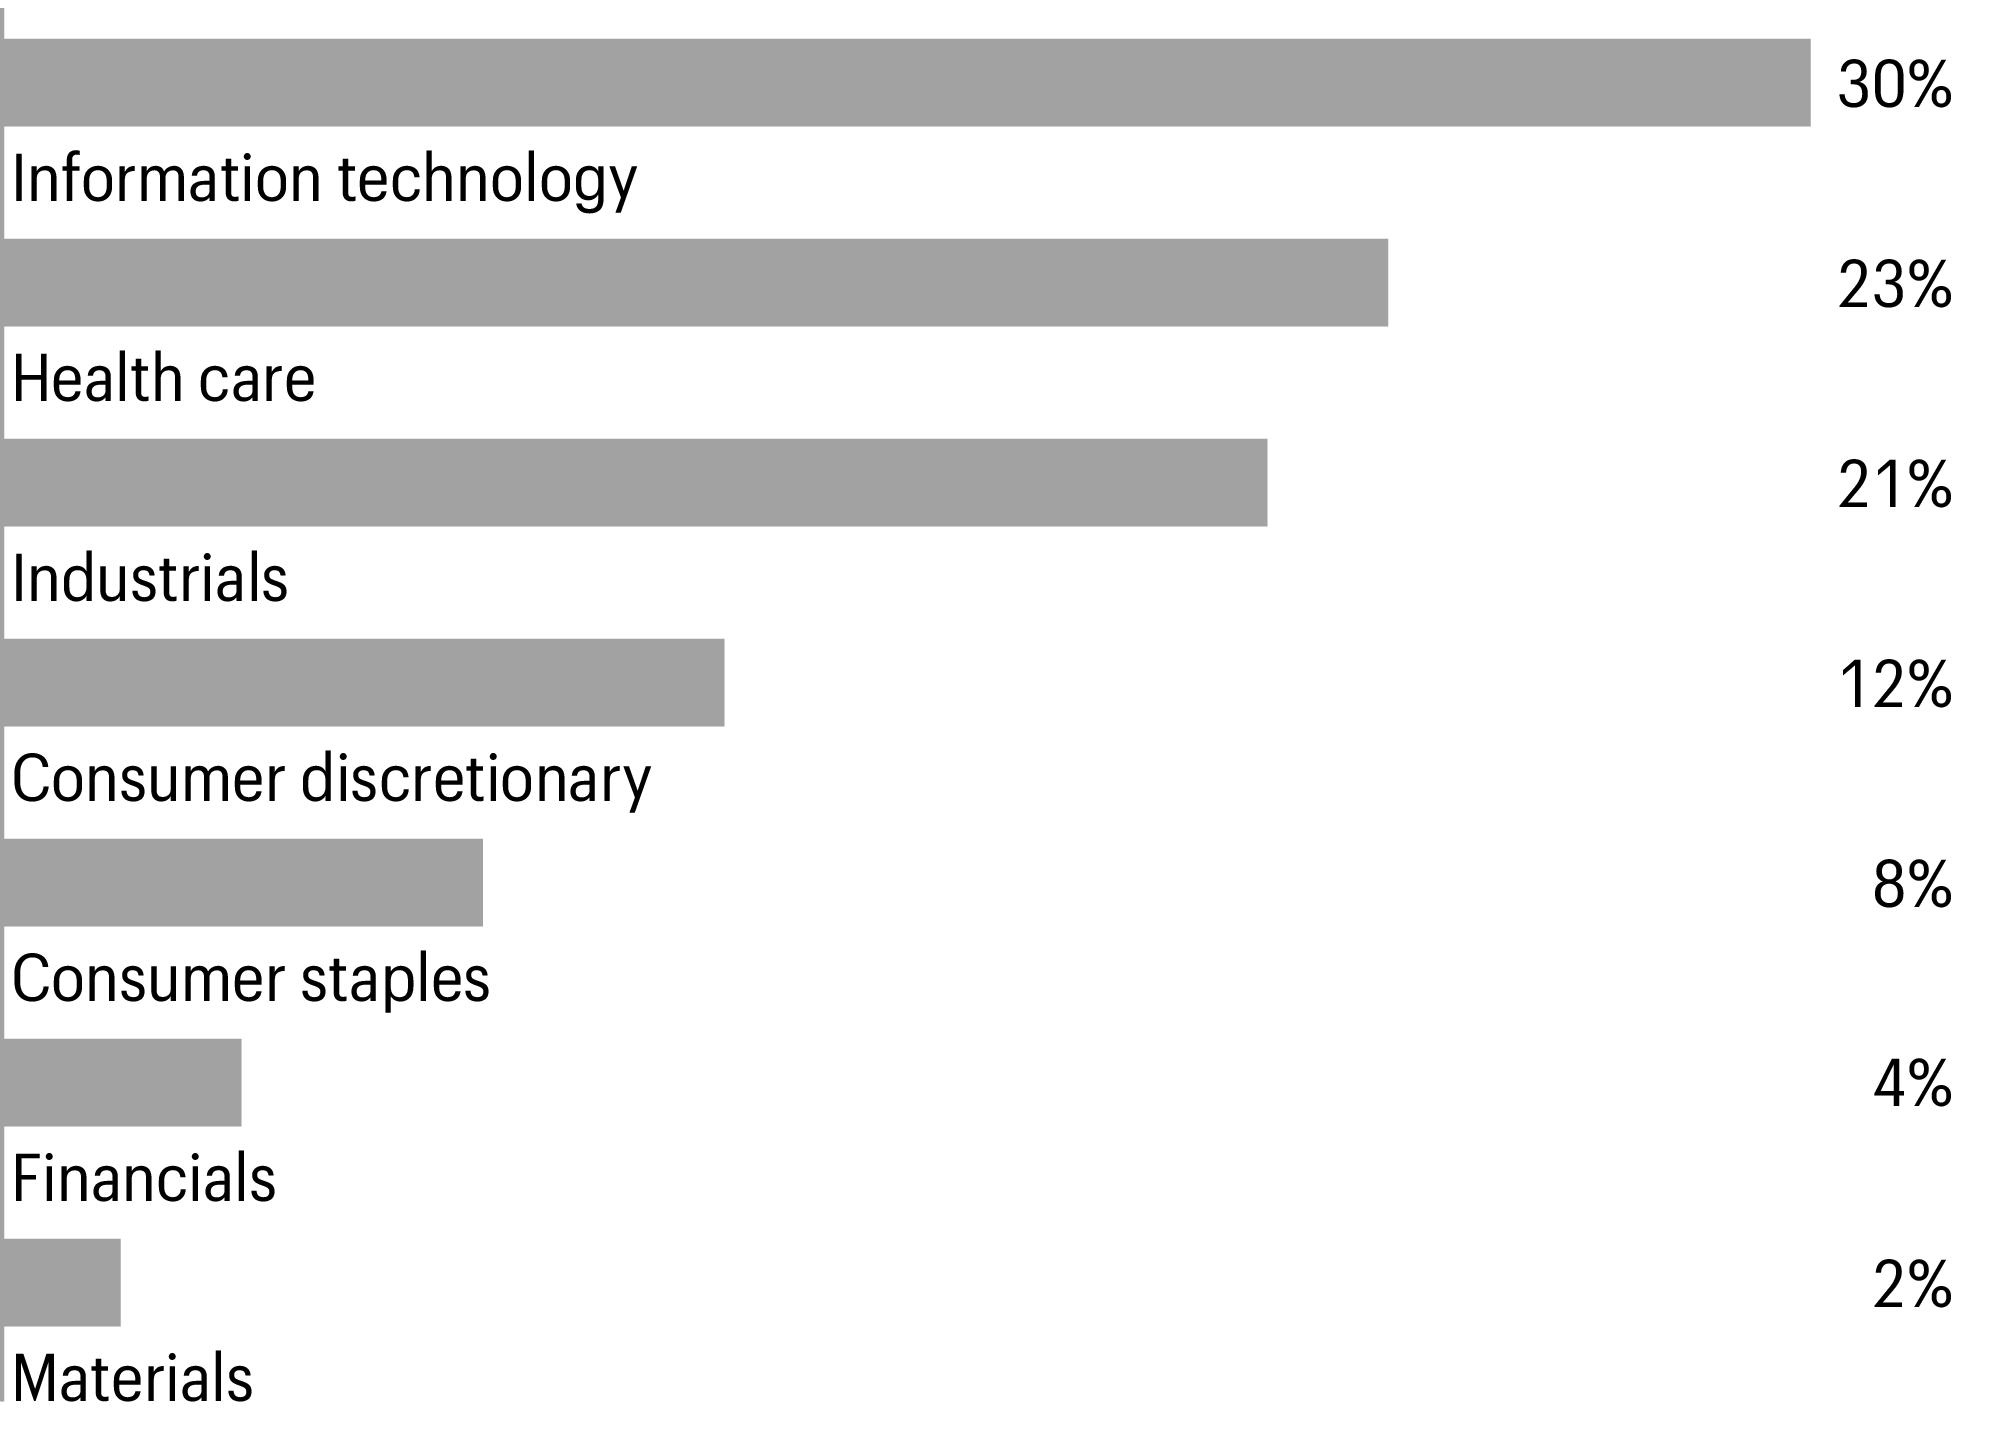
1 | Figures represent the sector allocation of the affiliated master portfolio as a percentage of the long-term investments of the affiliated master portfolio. Allocations are subject to change and may have changed since the date specified. |
Beginning account value 11-1-2023 | Ending account value 4-30-2024 | Expenses paid during the period1, 2 | Annualized net expense ratio | |
Class A | ||||
Actual | $1,000.00 | $1,231.38 | $6.60 | 1.19 % |
Hypothetical (5% return before expenses) | $1,000.00 | $1,018.95 | $5.97 | 1.19 % |
Class C | ||||
Actual | $1,000.00 | $1,225.62 | $11.18 | 2.02 % |
Hypothetical (5% return before expenses) | $1,000.00 | $1,014.82 | $10.12 | 2.02 % |
Class R6 | ||||
Actual | $1,000.00 | $1,232.28 | $4.72 | 0.85 % |
Hypothetical (5% return before expenses) | $1,000.00 | $1,020.64 | $4.27 | 0.85 % |
Administrator Class | ||||
Actual | $1,000.00 | $1,230.86 | $6.66 | 1.20 % |
Hypothetical (5% return before expenses) | $1,000.00 | $1,018.90 | $6.02 | 1.20 % |
Institutional Class | ||||
Actual | $1,000.00 | $1,232.97 | $5.00 | 0.90 % |
Hypothetical (5% return before expenses) | $1,000.00 | $1,020.39 | $4.52 | 0.90 % |
1 | Expenses paid is equal to the annualized net expense ratio of each class multiplied by the average account value over the period, multiplied by 182 divided by 366 (to reflect the one-half-year period). |
2 | Amounts reflect net expenses allocated from the affiliated Master Portfolio in which the Fund invests. |
Value | ||||||
Investment companies: 100.00% | ||||||
Affiliated master portfolio: 100.00% | ||||||
Allspring Emerging Growth Portfolio | $244,040,541 | |||||
Total investment companies (Cost $154,830,462) | 244,040,541 | |||||
Total investments in securities (Cost $154,830,462) | 100.00 % | 244,040,541 | ||||
Other assets and liabilities, net | (0.00 ) | (10,104 ) | ||||
Total net assets | 100.00 % | $244,030,437 | ||||
% of ownership, beginning of period | % of ownership, end of period | Net realized gains (losses) on investments allocated from affiliated Master Portfolio | Net change in unrealized gains (losses) on investments allocated from affiliated Master Portfolio | Dividends allocated from affiliated Master Portfolio | Interest allocated from affiliated Master Portfolio | Affiliated Income Allocated from affiliated Master Portfolio | Value, end of period | |
Allspring Emerging Growth Portfolio | 89.59 % | 87.86 % | $(1,846,187 ) | $20,768,417 | $317,222 | $2,802 | $247,192 | $244,040,541 |
Assets | |
Investments in affiliated Master Portfolio, at value (cost $154,830,462) | $244,040,541 |
Receivable for Fund shares sold | 299,765 |
Receivable from manager | 31,463 |
Prepaid expenses and other assets | 121,914 |
Total assets | 244,493,683 |
Liabilities | |
Payable for Fund shares redeemed | 361,393 |
Administration fees payable | 30,403 |
Shareholder servicing fee payable | 27,152 |
Distribution fee payable | 441 |
Accrued expenses and other liabilities | 43,857 |
Total liabilities | 463,246 |
Total net assets | $244,030,437 |
Net assets consist of | |
Paid-in capital | $173,319,155 |
Total distributable earnings | 70,711,282 |
Total net assets | $244,030,437 |
Computation of net asset value and offering price per share | |
Net assets–Class A | $113,793,042 |
Shares outstanding–Class A1 | 12,294,281 |
Net asset value per share–Class A | $9.26 |
Maximum offering price per share – Class A2 | $9.82 |
Net assets–Class C | $731,932 |
Shares outstanding–Class C1 | 114,213 |
Net asset value per share–Class C | $6.41 |
Net assets–Class R6 | $41,171,285 |
Shares outstanding–Class R61 | 3,643,733 |
Net asset value per share–Class R6 | $11.30 |
Net assets–Administrator Class | $13,917,174 |
Shares outstanding–Administrator Class1 | 1,396,306 |
Net asset value per share–Administrator Class | $9.97 |
Net assets–Institutional Class | $74,417,004 |
Shares outstanding–Institutional Class1 | 6,633,661 |
Net asset value per share–Institutional Class | $11.22 |
Year Ended April 30, 20241 | Year Ended May 31, 2023 | |
Investment income | ||
Dividends allocated from affiliated Master Portfolio | $317,222 | $725,681 |
Affiliated income allocated from affiliated Master Portfolio | 247,192 | 205,658 |
Interest allocated from affiliated Master Portfolio | 2,802 | 0 |
Securities lending income allocated from affiliated Master Portfolio | 0 | 94,322 |
Expenses allocated from affiliated Master Portfolio | (2,120,599 ) | (2,655,116 ) |
Waivers allocated from affiliated Master Portfolio | 1,484 | 10,637 |
Total investment income | (1,551,899 ) | (1,618,818 ) |
Expenses | ||
Management fee | 126,942 | 157,446 |
Administration fees | ||
Class A | 217,239 | 271,091 |
Class C | 1,523 | 2,885 |
Class R6 | 10,533 | 8,036 |
Administrator Class | 17,370 | 22,046 |
Institutional Class | 125,496 | 182,888 |
Shareholder servicing fees | ||
Class A | 270,091 | 322,288 |
Class C | 1,891 | 3,412 |
Administrator Class | 33,310 | 42,191 |
Distribution fee | ||
Class C | 5,673 | 10,235 |
Custody and accounting fees | 3 | 18,500 |
Professional fees | 50,407 | 39,056 |
Registration fees | 48,880 | 48,327 |
Shareholder report expenses | 35,457 | 27,128 |
Trustees’ fees and expenses | 21,705 | 21,093 |
Other fees and expenses | 6,187 | 6,519 |
Total expenses | 972,707 | 1,183,141 |
Less: Fee waivers and/or expense reimbursements | ||
Fund-level | (330,285 ) | (346,428 ) |
Class A | (48,908 ) | (20,861 ) |
Class R6 | 0 | (3,152 ) |
Year Ended April 30, 20241 | Year Ended May 31, 2023 | |
Administrator Class | (14 ) | (1,664 ) |
Institutional Class | (44,633 ) | (84,913 ) |
Net expenses | 548,867 | 726,123 |
Net investment loss | (2,100,766 ) | (2,344,941 ) |
Realized and unrealized gains (losses) on investments | ||
Net realized losses on investments allocated from affiliated Master Portfolio | (1,846,187 ) | (5,001,838 ) |
Net change in unrealized gains (losses) on investments allocated from affiliated Master Portfolio | 20,768,417 | 1,055,644 |
Net realized and unrealized gains (losses) on investments | 18,922,230 | (3,946,194 ) |
Net increase (decrease) in net assets resulting from operations | $16,821,464 | $(6,291,135 ) |
Year ended April 30, 20241 | Year ended May 31, 2023 | Year ended May 31, 2022 | ||||
Operations | ||||||
Net investment loss | $(2,100,766 ) | $(2,344,941 ) | $(5,137,253 ) | |||
Net realized gains (losses) on investments | (1,846,187 ) | (5,001,838 ) | 232,050,592 | |||
Net change in unrealized gains (losses) on investments | 20,768,417 | 1,055,644 | (327,135,019 ) | |||
Net increase (decrease) in net assets resulting from operations | 16,821,464 | (6,291,135 ) | (100,221,680 ) | |||
Net investment income and net realized gains | ||||||
Class A | 0 | 0 | (62,681,311 ) | |||
Class C | 0 | 0 | (1,233,291 ) | |||
Class R6 | 0 | 0 | (5,898,804 ) | |||
Administrator Class | 0 | 0 | (7,999,256 ) | |||
Institutional Class | 0 | 0 | (61,664,834 ) | |||
Total distributions to shareholders | 0 | 0 | (139,477,496 ) | |||
Capital share transactions | Shares | Shares | Shares | |||
Proceeds from shares sold | ||||||
Class A | 214,905 | 1,960,909 | 411,868 | 3,634,624 | 422,522 | 6,066,711 |
Class C | 11,206 | 70,979 | 4,232 | 26,812 | 97,992 | 1,394,743 |
Class R6 | 1,456,816 | 16,086,477 | 728,487 | 8,110,513 | 1,375,088 | 22,705,246 |
Administrator Class | 132,497 | 1,283,507 | 169,603 | 1,635,469 | 159,434 | 2,285,979 |
Institutional Class | 1,349,570 | 14,593,003 | 1,811,034 | 19,525,541 | 5,047,859 | 87,194,049 |
33,994,875 | 32,932,959 | 119,646,728 | ||||
Reinvestment of distributions | ||||||
Class A | 0 | 0 | 0 | 0 | 4,788,131 | 60,617,734 |
Class C | 0 | 0 | 0 | 0 | 138,107 | 1,233,291 |
Class R6 | 0 | 0 | 0 | 0 | 125,710 | 1,924,617 |
Administrator Class | 0 | 0 | 0 | 0 | 585,228 | 7,964,955 |
Institutional Class | 0 | 0 | 0 | 0 | 4,040,376 | 61,494,520 |
0 | 0 | 133,235,117 | ||||
Payment for shares redeemed | ||||||
Class A | (1,796,403 ) | (16,157,052 ) | (1,671,745 ) | (14,944,143 ) | (1,754,937 ) | (23,706,994 ) |
Class C | (54,138 ) | (330,532 ) | (127,934 ) | (770,829 ) | (117,521 ) | (1,197,540 ) |
Class R6 | (494,747 ) | (5,425,197 ) | (270,345 ) | (2,758,578 ) | (330,224 ) | (6,538,508 ) |
Administrator Class | (378,152 ) | (3,653,592 ) | (372,127 ) | (3,604,407 ) | (413,854 ) | (5,802,034 ) |
Institutional Class | (6,462,577 ) | (70,878,959 ) | (4,697,411 ) | (50,099,244 ) | (26,013,236 ) | (552,947,062 ) |
(96,445,332 ) | (72,177,201 ) | (590,192,138 ) | ||||
Net decrease in net assets resulting from capital share transactions | (62,450,457 ) | (39,244,242 ) | (337,310,293 ) | |||
Total decrease in net assets | (45,628,993 ) | (45,535,377 ) | (577,009,469 ) | |||
Net assets | ||||||
Beginning of period | 289,659,430 | 335,194,807 | 912,204,276 | |||
End of period | $244,030,437 | $289,659,430 | $335,194,807 | |||
Year ended April 30 20241 | Year ended May 31 | |||||
Class A | 2023 | 2022 | 2021 | 2020 | 2019 | |
Net asset value, beginning of period | $8.72 | $8.91 | $18.05 | $14.71 | $13.51 | $17.04 |
Net investment loss | (0.08 )2 | (0.08 )2 | (0.16 )2 | (0.20 )2 | (0.17 ) | (0.16 )2 |
Net realized and unrealized gains (losses) on investments | 0.62 | (0.11 ) | (3.47 ) | 7.69 | 2.13 | (0.19 ) |
Total from investment operations | 0.54 | (0.19 ) | (3.63 ) | 7.49 | 1.96 | (0.35 ) |
Distributions to shareholders from | ||||||
Net realized gains | 0.00 | 0.00 | (5.51 ) | (4.15 ) | (0.76 ) | (3.18 ) |
Net asset value, end of period | $9.26 | $8.72 | $8.91 | $18.05 | $14.71 | $13.51 |
Total return3 | 6.19 % | (2.13 )% | (29.16 )% | 53.22 % | 14.97 % | (0.84 )% |
Ratios to average net assets (annualized)* | ||||||
Gross expenses | 1.40 % | 1.40 % | 1.36 % | 1.35 % | 1.36 % | 1.35 % |
Net expenses | 1.23 % | 1.27 % | 1.26 % | 1.27 % | 1.27 % | 1.29 % |
Net investment loss | (1.00 )% | (0.95 )% | (1.10 )% | (1.12 )% | (1.08 )% | (1.06 )% |
Supplemental data | ||||||
Portfolio turnover rate4 | 79 % | 70 % | 51 % | 48 % | 55 % | 71 % |
Net assets, end of period (000s omitted) | $113,793 | $121,019 | $134,825 | $210,838 | $148,866 | $145,898 |
* | Ratios include net expenses allocated from the affiliated Master Portfolio which were as follows: |
Year ended April 30, 20241 | 0.84% |
Year ended May 31, 2023 | 0.84% |
Year ended May 31, 2022 | 0.82% |
Year ended May 31, 2021 | 0.81% |
Year ended May 31, 2020 | 0.81% |
Year ended May 31, 2019 | 0.81% |
1 | For the eleven months ended April 30, 2024. The Fund changed its fiscal year end from May 31 to April 30, effective April 30, 2024. |
2 | Calculated based upon average shares outstanding |
3 | Total return calculations do not include any sales charges. Returns for periods of less than one year are not annualized. |
4 | Portfolio turnover rate is calculated by multiplying the affiliated Master Portfolio’s percentage of the Fund’s total investment in securities at the end of the period by the affiliated Master Portfolio’s portfolio turnover rate. |
Year ended April 30 20241 | Year ended May 31 | |||||
Class C | 2023 | 2022 | 2021 | 2020 | 2019 | |
Net asset value, beginning of period | $6.08 | $6.26 | $14.41 | $12.40 | $11.58 | $15.19 |
Net investment loss | (0.10 )2 | (0.11 )2 | (0.20 )2 | (0.28 )2 | (0.21 )2 | (0.25 )2 |
Net realized and unrealized gains (losses) on investments | 0.43 | (0.07 ) | (2.44 ) | 6.44 | 1.79 | (0.18 ) |
Total from investment operations | 0.33 | (0.18 ) | (2.64 ) | 6.16 | 1.58 | (0.43 ) |
Distributions to shareholders from | ||||||
Net realized gains | 0.00 | 0.00 | (5.51 ) | (4.15 ) | (0.76 ) | (3.18 ) |
Net asset value, end of period | $6.41 | $6.08 | $6.26 | $14.41 | $12.40 | $11.58 |
Total return3 | 5.43 % | (2.88 )% | (29.71 )% | 52.19 % | 14.16 % | (1.55 )% |
Ratios to average net assets (annualized)* | ||||||
Gross expenses | 2.15 % | 2.14 % | 2.10 % | 2.10 % | 2.11 % | 2.10 % |
Net expenses | 2.02 % | 2.03 % | 2.03 % | 2.03 % | 2.03 % | 2.04 % |
Net investment loss | (1.80 )% | (1.70 )% | (1.86 )% | (1.89 )% | (1.84 )% | (1.78 )% |
Supplemental data | ||||||
Portfolio turnover rate4 | 79 % | 70 % | 51 % | 48 % | 55 % | 71 % |
Net assets, end of period (000s omitted) | $732 | $956 | $1,758 | $2,338 | $1,599 | $1,761 |
* | Ratios include net expenses allocated from the affiliated Master Portfolio which were as follows: |
Year ended April 30, 20241 | 0.83% |
Year ended May 31, 2023 | 0.84% |
Year ended May 31, 2022 | 0.82% |
Year ended May 31, 2021 | 0.81% |
Year ended May 31, 2020 | 0.81% |
Year ended May 31, 2019 | 0.81% |
1 | For the eleven months ended April 30, 2024. The Fund changed its fiscal year end from May 31 to April 30, effective April 30, 2024. |
2 | Calculated based upon average shares outstanding |
3 | Total return calculations do not include any sales charges. Returns for periods of less than one year are not annualized. |
4 | Portfolio turnover rate is calculated by multiplying the affiliated Master Portfolio’s percentage of the Fund’s total investment in securities at the end of the period by the affiliated Master Portfolio’s portfolio turnover rate. |
Year ended April 30 20241 | Year ended May 31 | |||||
Class R6 | 2023 | 2022 | 2021 | 2020 | 20192 | |
Net asset value, beginning of period | $10.61 | $10.79 | $20.64 | $16.34 | $14.86 | $18.70 |
Net investment loss | (0.06 )3 | (0.06 )3 | (0.10 ) | (0.14 ) | (0.10 )3 | (0.07 )3 |
Net realized and unrealized gains (losses) on investments | 0.75 | (0.12 ) | (4.24 ) | 8.59 | 2.34 | (0.59 ) |
Total from investment operations | 0.69 | (0.18 ) | (4.34 ) | 8.45 | 2.24 | (0.66 ) |
Distributions to shareholders from | ||||||
Net realized gains | 0.00 | 0.00 | (5.51 ) | (4.15 ) | (0.76 ) | (3.18 ) |
Net asset value, end of period | $11.30 | $10.61 | $10.79 | $20.64 | $16.34 | $14.86 |
Total return4 | 6.50 % | (1.67 )% | (28.91 )% | 53.85 % | 15.51 % | (2.35 )% |
Ratios to average net assets (annualized)* | ||||||
Gross expenses | 0.98 % | 0.97 % | 0.94 % | 0.92 % | 0.93 % | 0.92 % |
Net expenses | 0.85 % | 0.85 % | 0.85 % | 0.85 % | 0.85 % | 0.85 % |
Net investment loss | (0.63 )% | (0.52 )% | (0.68 )% | (0.68 )% | (0.67 )% | (0.51 )% |
Supplemental data | ||||||
Portfolio turnover rate5 | 79 % | 70 % | 51 % | 48 % | 55 % | 71 % |
Net assets, end of period (000s omitted) | $41,171 | $28,458 | $23,999 | $21,729 | $19,458 | $22 |
* | Ratios include net expenses allocated from the affiliated Master Portfolio which were as follows: |
Year ended April 30, 20241 | 0.84% |
Year ended May 31, 2023 | 0.84% |
Year ended May 31, 2022 | 0.83% |
Year ended May 31, 2021 | 0.81% |
Year ended May 31, 2020 | 0.81% |
Year ended May 31, 20192 | 0.81% |
1 | For the eleven months ended April 30, 2024. The Fund changed its fiscal year end from May 31 to April 30, effective April 30, 2024. |
2 | For the period from July 31, 2018 (commencement of class operations) to May 31, 2019 |
3 | Calculated based upon average shares outstanding |
4 | Returns for periods of less than one year are not annualized. |
5 | Portfolio turnover rate is calculated by multiplying the affiliated Master Portfolio’s percentage of the Fund’s total investment in securities at the end of the period by the affiliated Master Portfolio’s portfolio turnover rate. |
Year ended April 30 20241 | Year ended May 31 | |||||
Administrator Class | 2023 | 2022 | 2021 | 2020 | 2019 | |
Net asset value, beginning of period | $9.39 | $9.58 | $18.98 | $15.31 | $14.02 | $17.54 |
Net investment loss | (0.09 )2 | (0.08 )2 | (0.17 )2 | (0.20 )2 | (0.14 )2 | (0.15 )2 |
Net realized and unrealized gains (losses) on investments | 0.67 | (0.11 ) | (3.72 ) | 8.02 | 2.19 | (0.19 ) |
Total from investment operations | 0.58 | (0.19 ) | (3.89 ) | 7.82 | 2.05 | (0.34 ) |
Distributions to shareholders from | ||||||
Net realized gains | 0.00 | 0.00 | (5.51 ) | (4.15 ) | (0.76 ) | (3.18 ) |
Net asset value, end of period | $9.97 | $9.39 | $9.58 | $18.98 | $15.31 | $14.02 |
Total return3 | 6.18 % | (1.98 )% | (29.09 )% | 53.31 % | 15.07 % | (0.75 )% |
Ratios to average net assets (annualized)* | ||||||
Gross expenses | 1.33 % | 1.32 % | 1.28 % | 1.27 % | 1.28 % | 1.27 % |
Net expenses | 1.20 % | 1.20 % | 1.20 % | 1.20 % | 1.20 % | 1.20 % |
Net investment loss | (0.98 )% | (0.87 )% | (1.04 )% | (1.05 )% | (1.01 )% | (0.94 )% |
Supplemental data | ||||||
Portfolio turnover rate4 | 79 % | 70 % | 51 % | 48 % | 55 % | 71 % |
Net assets, end of period (000s omitted) | $13,917 | $15,418 | $17,676 | $28,730 | $21,250 | $23,549 |
* | Ratios include net expenses allocated from the affiliated Master Portfolio which were as follows: |
Year ended April 30, 20241 | 0.84% |
Year ended May 31, 2023 | 0.84% |
Year ended May 31, 2022 | 0.82% |
Year ended May 31, 2021 | 0.81% |
Year ended May 31, 2020 | 0.81% |
Year ended May 31, 2019 | 0.81% |
1 | For the eleven months ended April 30, 2024. The Fund changed its fiscal year end from May 31 to April 30, effective April 30, 2024. |
2 | Calculated based upon average shares outstanding |
3 | Returns for periods of less than one year are not annualized. |
4 | Portfolio turnover rate is calculated by multiplying the affiliated Master Portfolio’s percentage of the Fund’s total investment in securities at the end of the period by the affiliated Master Portfolio’s portfolio turnover rate. |
Year ended April 30 20241 | Year ended May 31 | |||||
Institutional Class | 2023 | 2022 | 2021 | 2020 | 2019 | |
Net asset value, beginning of period | $10.54 | $10.72 | $20.55 | $16.29 | $14.83 | $18.30 |
Net investment loss | (0.07 )2 | (0.06 )2 | (0.14 )2 | (0.15 ) | (0.11 )2 | (0.13 ) |
Net realized and unrealized gains (losses) on investments | 0.75 | (0.12 ) | (4.18 ) | 8.56 | 2.33 | (0.16 ) |
Total from investment operations | 0.68 | (0.18 ) | (4.32 ) | 8.41 | 2.22 | (0.29 ) |
Distributions to shareholders from | ||||||
Net realized gains | 0.00 | 0.00 | (5.51 ) | (4.15 ) | (0.76 ) | (3.18 ) |
Net asset value, end of period | $11.22 | $10.54 | $10.72 | $20.55 | $16.29 | $14.83 |
Total return3 | 6.45 % | (1.68 )% | (28.95 )% | 53.75 % | 15.40 % | (0.42 )% |
Ratios to average net assets (annualized)* | ||||||
Gross expenses | 1.08 % | 1.07 % | 1.02 % | 1.02 % | 1.03 % | 1.02 % |
Net expenses | 0.90 % | 0.90 % | 0.90 % | 0.90 % | 0.90 % | 0.90 % |
Net investment loss | (0.67 )% | (0.57 )% | (0.75 )% | (0.75 )% | (0.71 )% | (0.67 )% |
Supplemental data | ||||||
Portfolio turnover rate4 | 79 % | 70 % | 51 % | 48 % | 55 % | 71 % |
Net assets, end of period (000s omitted) | $74,417 | $123,809 | $156,936 | $648,569 | $471,512 | $578,073 |
* | Ratios include net expenses allocated from the affiliated Master Portfolio which were as follows: |
Year ended April 30, 20241 | 0.83% |
Year ended May 31, 2023 | 0.84% |
Year ended May 31, 2022 | 0.82% |
Year ended May 31, 2021 | 0.81% |
Year ended May 31, 2020 | 0.81% |
Year ended May 31, 2019 | 0.81% |
1 | For the eleven months ended April 30, 2024. The Fund changed its fiscal year end from May 31 to April 30, effective April 30, 2024. |
2 | Calculated based upon average shares outstanding |
3 | Returns for periods of less than one year are not annualized. |
4 | Portfolio turnover rate is calculated by multiplying the affiliated Master Portfolio’s percentage of the Fund’s total investment in securities at the end of the period by the affiliated Master Portfolio’s portfolio turnover rate. |
Gross unrealized gains | $89,663,167 |
Gross unrealized losses | (0 ) |
Net unrealized gains | $89,663,167 |
Paid-in capital | Total distributable earnings |
$(2,100,766 ) | $2,100,766 |
Affiliated Master Portfolio | Investment objective | Fair value of affiliated Master Portfolio |
Allspring Emerging Growth Portfolio | Seek long-term capital appreciation | $244,040,541 |
Average daily net assets | Management fee |
First $5 billion | 0.050 % |
Next $5 billion | 0.040 |
Over $10 billion | 0.030 |
Class-level administration fee | |
Class A | 0.20 % |
Class C | 0.20 |
Class R6 | 0.03 |
Administrator Class | 0.13 |
Institutional Class | 0.13 |
EXPENSE RATIO CAPS | |
Class A | 1.27 % |
Class C | 2.02 |
Class R6 | 0.85 |
Administrator Class | 1.20 |
Institutional Class | 0.90 |
Unrealized gains | Capital loss carryforward |
$89,663,167 | $(18,951,885 ) |
Date | Value of securities issued | Cash | Realized gains (losses) | % of the Fund |
08-27-2021 | $348,404,897 | $1,817,058 | $176,872,468 | 39.45 % |
Allspring Funds Trust:

Shares | Value | |||||
Common stocks: 98.31% | ||||||
Communication services: 0.32% | ||||||
Interactive media & services: 0.32% | ||||||
EverQuote, Inc. Class A† | 44,200 | $891,514 | ||||
Consumer discretionary: 11.40% | ||||||
Automobile components: 1.15% | ||||||
Modine Manufacturing Co.† | 34,432 | 3,189,436 | ||||
Diversified consumer services: 3.66% | ||||||
Bright Horizons Family Solutions, Inc.† | 51,260 | 5,316,175 | ||||
Duolingo, Inc.† | 21,486 | 4,850,464 | ||||
10,166,639 | ||||||
Hotels, restaurants & leisure: 2.99% | ||||||
Dutch Bros, Inc. Class A† | 93,232 | 2,625,413 | ||||
First Watch Restaurant Group, Inc.† | 160,810 | 4,103,872 | ||||
Wingstop, Inc. | 4,104 | 1,579,178 | ||||
8,308,463 | ||||||
Specialty retail: 3.60% | ||||||
American Eagle Outfitters, Inc. | 42,296 | 1,026,101 | ||||
Boot Barn Holdings, Inc.† | 61,898 | 6,590,280 | ||||
Wayfair, Inc. Class A† | 47,800 | 2,397,170 | ||||
10,013,551 | ||||||
Consumer staples: 7.83% | ||||||
Beverages: 0.50% | ||||||
Celsius Holdings, Inc.† | 19,239 | 1,371,164 | ||||
Consumer staples distribution & retail : 0.43% | ||||||
Chefs’ Warehouse, Inc.† | 36,359 | 1,202,756 | ||||
Food products: 1.67% | ||||||
Freshpet, Inc.† | 43,735 | 4,638,971 | ||||
Personal care products: 5.23% | ||||||
BellRing Brands, Inc.† | 123,151 | 6,794,241 | ||||
e.l.f. Beauty, Inc.† | 47,546 | 7,727,651 | ||||
14,521,892 | ||||||
Financials: 4.18% | ||||||
Insurance: 4.18% | ||||||
Kinsale Capital Group, Inc. | 13,983 | 5,079,325 | ||||
Palomar Holdings, Inc.† | 25,900 | 2,037,553 | ||||
Skyward Specialty Insurance Group, Inc.† | 128,900 | 4,501,188 | ||||
11,618,066 | ||||||
Health care: 22.48% | ||||||
Biotechnology: 6.06% | ||||||
Apellis Pharmaceuticals, Inc.† | 36,280 | 1,603,213 | ||||
Shares | Value | |||||
Biotechnology(continued) | ||||||
Biohaven Ltd.† | 28,400 | $1,101,920 | ||||
Cytokinetics, Inc.† | 17,300 | 1,060,836 | ||||
Immunocore Holdings PLC ADR† | 27,904 | 1,648,568 | ||||
Immunovant, Inc.† | 20,716 | 568,447 | ||||
Krystal Biotech, Inc.† | 18,833 | 2,883,709 | ||||
Soleno Therapeutics, Inc.† | 32,546 | 1,453,504 | ||||
Vaxcyte, Inc.† | 13,906 | 842,008 | ||||
Vericel Corp.† | 123,851 | 5,681,046 | ||||
16,843,251 | ||||||
Health care equipment & supplies: 8.34% | ||||||
Glaukos Corp.† | 59,354 | 5,697,984 | ||||
Inspire Medical Systems, Inc.† | 3,600 | 869,976 | ||||
PROCEPT BioRobotics Corp.† | 62,454 | 3,308,813 | ||||
RxSight, Inc.† | 58,215 | 3,034,748 | ||||
Shockwave Medical, Inc.† | 1,943 | 641,559 | ||||
TransMedics Group, Inc.† | 101,985 | 9,599,848 | ||||
23,152,928 | ||||||
Health care providers & services: 5.59% | ||||||
Ensign Group, Inc. | 13,139 | 1,555,132 | ||||
HealthEquity, Inc.† | 54,574 | 4,306,434 | ||||
PACS Group, Inc.† | 84,418 | 2,107,918 | ||||
RadNet, Inc.† | 155,664 | 7,549,704 | ||||
15,519,188 | ||||||
Life sciences tools & services: 0.30% | ||||||
CryoPort, Inc.† | 51,540 | 834,433 | ||||
Pharmaceuticals: 2.19% | ||||||
Intra-Cellular Therapies, Inc.† | 17,900 | 1,285,399 | ||||
Ligand Pharmaceuticals, Inc.† | 32,585 | 2,277,365 | ||||
Structure Therapeutics, Inc. ADR† | 15,441 | 608,993 | ||||
Tarsus Pharmaceuticals, Inc.† | 60,904 | 1,914,213 | ||||
6,085,970 | ||||||
Industrials: 20.54% | ||||||
Aerospace & defense: 0.51% | ||||||
AeroVironment, Inc.† | 8,917 | 1,424,847 | ||||
Building products: 2.86% | ||||||
AZEK Co., Inc.† | 78,692 | 3,591,503 | ||||
Zurn Elkay Water Solutions Corp. | 139,155 | 4,352,768 | ||||
7,944,271 | ||||||
Commercial services & supplies: 3.66% | ||||||
Casella Waste Systems, Inc. Class A† | 88,585 | 8,008,084 | ||||
Cimpress PLC† | 25,254 | 2,153,408 | ||||
10,161,492 | ||||||
Shares | Value | |||||
Construction & engineering: 3.51% | ||||||
Comfort Systems USA, Inc. | 21,093 | $6,526,385 | ||||
Construction Partners, Inc. Class A† | 46,817 | 2,417,630 | ||||
Sterling Infrastructure, Inc.† | 8,000 | 812,800 | ||||
9,756,815 | ||||||
Electrical equipment: 0.40% | ||||||
NEXTracker, Inc. Class A† | 25,753 | 1,101,971 | ||||
Ground transportation: 1.11% | ||||||
ArcBest Corp. | 15,502 | 1,719,327 | ||||
Marten Transport Ltd. | 33,855 | 572,827 | ||||
Saia, Inc.† | 2,016 | 800,009 | ||||
3,092,163 | ||||||
Machinery: 3.25% | ||||||
ESCO Technologies, Inc. | 13,891 | 1,409,242 | ||||
SPX Technologies, Inc.† | 62,633 | 7,629,326 | ||||
9,038,568 | ||||||
Professional services: 1.90% | ||||||
ASGN, Inc.† | 31,267 | 3,015,702 | ||||
Legalzoom.com, Inc.† | 82,603 | 987,106 | ||||
Paycor HCM, Inc.† | 72,532 | 1,259,881 | ||||
5,262,689 | ||||||
Trading companies & distributors: 3.34% | ||||||
Applied Industrial Technologies, Inc. | 31,307 | 5,737,008 | ||||
SiteOne Landscape Supply, Inc.† | 22,522 | 3,533,476 | ||||
9,270,484 | ||||||
Information technology: 29.92% | ||||||
Electronic equipment, instruments & components: 2.69% | ||||||
Celestica, Inc.† | 32,200 | 1,395,226 | ||||
Fabrinet† | 15,732 | 2,722,737 | ||||
Novanta, Inc.† | 21,368 | 3,344,092 | ||||
7,462,055 | ||||||
IT services: 2.62% | ||||||
Globant SA† | 11,895 | 2,124,328 | ||||
Wix.com Ltd.† | 43,403 | 5,159,315 | ||||
7,283,643 | ||||||
Semiconductors & semiconductor equipment: 6.14% | ||||||
ACM Research, Inc. Class A† | 110,122 | 2,810,313 | ||||
Allegro MicroSystems, Inc.† | 187,365 | 5,562,867 | ||||
Credo Technology Group Holding Ltd.† | 113,560 | 2,029,317 | ||||
Onto Innovation, Inc.† | 19,640 | 3,643,024 | ||||
Shares | Value | |||||
Semiconductors & semiconductor equipment(continued) | ||||||
PDF Solutions, Inc.† | 21,458 | $645,457 | ||||
Silicon Laboratories, Inc.† | 19,596 | 2,380,718 | ||||
17,071,696 | ||||||
Software: 18.47% | ||||||
Braze, Inc. Class A† | 95,084 | 3,984,020 | ||||
Clearwater Analytics Holdings, Inc. Class A† | 155,665 | 2,456,394 | ||||
CyberArk Software Ltd.† | 37,065 | 8,867,801 | ||||
Descartes Systems Group, Inc.† | 51,833 | 4,809,584 | ||||
DoubleVerify Holdings, Inc.† | 46,537 | 1,363,534 | ||||
Five9, Inc.† | 62,670 | 3,607,912 | ||||
JFrog Ltd.† | 153,906 | 6,137,771 | ||||
PowerSchool Holdings, Inc. Class A† | 104,204 | 1,804,813 | ||||
PROS Holdings, Inc.† | 40,954 | 1,341,244 | ||||
Sprout Social, Inc. Class A† | 83,672 | 4,221,252 | ||||
SPS Commerce, Inc.† | 46,081 | 8,012,103 | ||||
Varonis Systems, Inc.† | 100,945 | 4,416,344 | ||||
Workiva, Inc.† | 3,514 | 276,903 | ||||
51,299,675 | ||||||
Materials: 1.64% | ||||||
Construction materials: 0.50% | ||||||
Summit Materials, Inc. Class A† | 35,600 | 1,384,840 | ||||
Metals & mining: 1.14% | ||||||
ATI, Inc.† | 53,004 | 3,164,339 | ||||
Total common stocks (Cost $189,765,530) | 273,077,770 | |||||
Yield | ||||||
Short-term investments: 1.80% | ||||||
Investment companies: 1.80% | ||||||
Allspring Government Money Market Fund Select Class♠∞ | 5.23 % | 4,982,153 | 4,982,153 | |||
Total short-term investments (Cost $4,982,153) | 4,982,153 | |||||
Total investments in securities (Cost $194,747,683) | 100.11 % | 278,059,923 | ||||
Other assets and liabilities, net | (0.11 ) | (292,610 ) | ||||
Total net assets | 100.00 % | $277,767,313 | ||||
† | Non-income-earning security |
♠ | The issuer of the security is an affiliated person of the Portfolio as defined in the Investment Company Act of 1940. |
∞ | The rate represents the 7-day annualized yield at period end. |
Abbreviations: | |
ADR | American depositary receipt |
Value, beginning of period | Purchases | Sales proceeds | Net realized gains (losses) | Net change in unrealized gains (losses) | Value, end of period | Shares, end of period | Income from affiliated securities | |
Short-term investments | ||||||||
Allspring Government Money Market Fund Select Class | $9,781,514 | $114,951,636 | $(119,750,997 ) | $0 | $0 | $4,982,153 | 4,982,153 | $277,301 |
Assets | |
Investments in unaffiliated securities, at value (cost $189,765,530) | $273,077,770 |
Investments in affiliated securities, at value (cost $4,982,153) | 4,982,153 |
Cash | 364 |
Receivable for investments sold | 3,614,825 |
Receivable for dividends | 14,023 |
Prepaid expenses and other assets | 9,992 |
Total assets | 281,699,127 |
Liabilities | |
Payable for investments purchased | 3,715,465 |
Advisory fee payable | 189,409 |
Accrued expenses and other liabilities | 26,940 |
Total liabilities | 3,931,814 |
Total net assets | $277,767,313 |
Year Ended April 30, 20241 | Year Ended May 31, 2023 | |
Investment income | ||
Dividends | $356,740 | $807,272 |
Income from affiliated securities | 277,301 | 228,871 |
Interest | 3,143 | 38 |
Securities lending income (including from affiliate), net | 0 | 104,981 |
Total investment income | 637,184 | 1,141,162 |
Expenses | ||
Advisory fee | 2,282,104 | 2,803,445 |
Custody and accounting fees | 3 | 57,825 |
Professional fees | 61,543 | 50,291 |
Interest holder report expenses | 6,537 | 10,561 |
Trustees’ fees and expenses | 21,512 | 24,280 |
Other fees and expenses | 11,990 | 8,846 |
Total expenses | 2,383,689 | 2,955,248 |
Less: Fee waivers and/or expense reimbursements | (1,677 ) | (11,837 ) |
Net expenses | 2,382,012 | 2,943,411 |
Net investment loss | (1,744,828 ) | (1,802,249 ) |
Realized and unrealized gains (losses) on investments | ||
Net realized gains on | ||
Unaffiliated securities | 2,698,168 | 5,257,703 |
Affiliated securities | 0 | 182 |
Net realized gains on investments | 2,698,168 | 5,257,885 |
Net change in unrealized gains (losses) on investments | 18,987,879 | (9,158,116 ) |
Net realized and unrealized gains (losses) on investments | 21,686,047 | (3,900,231 ) |
Net increase (decrease) in net assets resulting from operations | $19,941,219 | $(5,702,480 ) |
Year ended April 30, 20241 | Year ended May 31, 2023 | Year ended May 31, 2022 | ||||
Operations | ||||||
Net investment loss | $(1,744,828 ) | $(1,802,249 ) | $(4,149,201 ) | |||
Net realized gains on investments | 2,698,168 | 5,257,885 | 254,745,270 | |||
Net change in unrealized gains (losses) on investments | 18,987,879 | (9,158,116 ) | (361,893,191 ) | |||
Net increase (decrease) in net assets resulting from operations | 19,941,219 | (5,702,480 ) | (111,297,122 ) | |||
Capital transactions | ||||||
Transactions in investors’ beneficial interests | ||||||
Contributions | 19,681,287 | 16,642,379 | 75,769,980 | |||
Withdrawals | (85,995,028 ) | (58,772,131 ) | (550,022,954 ) | |||
Net decrease in net assets resulting from capital share transactions | (66,313,741 ) | (42,129,752 ) | (474,252,974 ) | |||
Total decrease in net assets | (46,372,522 ) | (47,832,232 ) | (585,550,096 ) | |||
Net assets | ||||||
Beginning of period | 324,139,835 | 371,972,067 | 957,522,163 | |||
End of period | $277,767,313 | $324,139,835 | $371,972,067 | |||
Year ended April 30 20241 | Year ended May 31 | |||||
2023 | 2022 | 2021 | 2020 | 2019 | ||
Total return2 | 6.49 % | (1.62 )% | (28.85 )% | 53.94 % | 15.49 % | (0.28 )% |
Ratios to average net assets (annualized) | ||||||
Gross expenses | 0.84 % | 0.84 % | 0.82 % | 0.81 % | 0.81 % | 0.81 % |
Net expenses3 | 0.84 % | 0.84 % | 0.82 % | 0.81 % | 0.81 % | 0.81 % |
Net investment loss | (0.61 )% | (0.51 )% | (0.67 )% | (0.66 )% | (0.62 )% | (0.57 )% |
Supplemental Data | ||||||
Portfolio turnover rate | 79 % | 70 % | 51 % | 48 % | 55 % | 71 % |
1 | For the eleven months ended April 30, 2024. The Portfolio changed its fiscal year end from May 31 to April 30, effective April 30, 2024. |
2 | Returns for periods of less than one year are not annualized. |
3 | Net expense ratios reflect voluntary waivers, if any. |
Gross unrealized gains | $89,198,889 |
Gross unrealized losses | (6,134,776 ) |
Net unrealized gains | $83,064,113 |
Quoted prices (Level 1) | Other significant observable inputs (Level 2) | Significant unobservable inputs (Level 3) | Total | |
Assets | ||||
Investments in: | ||||
Common stocks | ||||
Communication services | $891,514 | $0 | $0 | $891,514 |
Consumer discretionary | 31,678,089 | 0 | 0 | 31,678,089 |
Consumer staples | 21,734,783 | 0 | 0 | 21,734,783 |
Financials | 11,618,066 | 0 | 0 | 11,618,066 |
Health care | 62,435,770 | 0 | 0 | 62,435,770 |
Industrials | 57,053,300 | 0 | 0 | 57,053,300 |
Information technology | 83,117,069 | 0 | 0 | 83,117,069 |
Materials | 4,549,179 | 0 | 0 | 4,549,179 |
Short-term investments | ||||
Investment companies | 4,982,153 | 0 | 0 | 4,982,153 |
Total assets | $278,059,923 | $0 | $0 | $278,059,923 |
Average daily net assets | Advisory fee |
First $500 million | 0.800 % |
Next $500 million | 0.775 |
Next $1 billion | 0.750 |
Next $1 billion | 0.725 |
Next $1 billion | 0.700 |
Over $4 billion | 0.680 |
Allspring Master Trust:
Name and year of birth | Position held and length of service** | Principal occupations during past five years or longer | Current other public company or investment company directorships |
William R. Ebsworth (Born 1957) | Trustee, since 2015 | Retired. From 1984 to 2013, equities analyst, portfolio manager, research director and chief investment officer at Fidelity Management and Research Company in Boston, Tokyo, and Hong Kong, and retired in 2013 as Chief Investment Officer of Fidelity Strategic Advisers, Inc. where he led a team of investment professionals managing client assets. Prior thereto, Board member of Hong Kong Securities Clearing Co., Hong Kong Options Clearing Corp., the Thailand International Fund, Ltd., Fidelity Investments Life Insurance Company, and Empire Fidelity Investments Life Insurance Company. Serves on the Investment Company Institute’s Board of Governors since 2022 and Executive Committee since 2023 as well as the Vice Chairman of the Governing Council of the Independent Directors Council since 2023. Audit Committee Chair and Investment Committee Chair of the Vincent Memorial Hospital Foundation (non-profit organization). Mr. Ebsworth is a CFA charterholder. | N/A |
Jane A. Freeman (Born 1953) | Trustee, since 2015; Chair Liaison, since January 2018*** | Retired. From 2012 to 2014 and 1999 to 2008, Chief Financial Officer of Scientific Learning Corporation. From 2008 to 2012, Ms. Freeman provided consulting services related to strategic business projects. Prior to 1999, Portfolio Manager at Rockefeller & Co. and Scudder, Stevens & Clark. Board member of the Harding Loevner Funds from 1996 to 2014, serving as both Lead Independent Director and chair of the Audit Committee. Board member of the Russell Exchange Traded Funds Trust from 2011 to 2012 and the chair of the Audit Committee. Ms. Freeman is also an inactive Chartered Financial Analyst. | N/A |
Isaiah Harris, Jr. (Born 1952) | Trustee, since 2009; Audit Committee Chair, since 2019 | Retired. Member of the Advisory Board of CEF of East Central Florida. Chairman of the Board of CIGNA Corporation from 2009 to 2021, and Director from 2005 to 2008. From 2003 to 2011, Director of Deluxe Corporation. Prior thereto, President and CEO of BellSouth Advertising and Publishing Corp. from 2005 to 2007, President and CEO of BellSouth Enterprises from 2004 to 2005 and President of BellSouth Consumer Services from 2000 to 2003. Emeritus member of the Iowa State University Foundation Board of Governors. Emeritus Member of the Advisory board of Iowa State University School of Business. Advisory Board Member, Palm Harbor Academy (private school). Advisory Board Member, Fellowship of Christian Athletes. Mr. Harris is a certified public accountant (inactive status). | N/A |
David F. Larcker (Born 1950) | Trustee, since 2009 | Distinguished Visiting Fellow at the Hoover Institution since 2022. James Irvin Miller Professor of Accounting at the Graduate School of Business (Emeritus), Stanford University, Director of the Corporate Governance Research Initiative and Senior Faculty of The Rock Center for Corporate Governance since 2006. From 2005 to 2008, Professor of Accounting at the Graduate School of Business, Stanford University. Prior thereto, Ernst & Young Professor of Accounting at The Wharton School, University of Pennsylvania from 1985 to 2005. | N/A |
Olivia S. Mitchell (Born 1953) | Trustee, since 2006 | International Foundation of Employee Benefit Plans Professor since 1993, Wharton School of the University of Pennsylvania. Director of Wharton’s Pension Research Council and Boettner Center on Pensions & Retirement Research, and Research Associate at the National Bureau of Economic Research. Previously taught at Cornell University from 1978 to 1993. | N/A |
Timothy J. Penny (Born 1951) | Trustee, since 1996; Chair, since 2018 | President and Chief Executive Officer of Southern Minnesota Initiative Foundation, a non-profit organization, since 2007. Vice Chair of the Economic Club of Minnesota, since 2007. Co-Chair of the Committee for a Responsible Federal Budget, since 1995. Member of the Board of Trustees of NorthStar Education Finance, Inc., a non-profit organization, from 2007-2022. Senior Fellow of the University of Minnesota Humphrey Institute from 1995 to 2017. | N/A |
Name and year of birth | Position held and length of service** | Principal occupations during past five years or longer | Current other public company or investment company directorships |
James G. Polisson (Born 1959) | Trustee, since 2018; Nominating and Governance Committee Chair, since 2024 | Retired. Chief Marketing Officer, Source (ETF) UK Services, Ltd, from 2015 to 2017. From 2012 to 2015, Principal of The Polisson Group, LLC, a management consulting, corporate advisory and principal investing company. Chief Executive Officer and Managing Director at Russell Investments, Global Exchange Traded Funds from 2010 to 2012. Managing Director of Barclays Global Investors from 1998 to 2010 and Global Chief Marketing Officer for iShares and Barclays Global Investors from 2000 to 2010. Trustee of the San Francisco Mechanics’ Institute, a non- profit organization, from 2013 to 2015. Board member of the Russell Exchange Traded Fund Trust from 2011 to 2012. Director of Barclays Global Investors Holdings Deutschland GmbH from 2006 to 2009. Mr. Polisson is an attorney and has a retired status with the Massachusetts and District of Columbia Bar Associations. | N/A |
Pamela Wheelock (Born 1959) | Trustee, since January 2020; previously Trustee from January 2018 to July 2019*** | Retired. Executive and Senior Financial leadership positions in the public, private and nonprofit sectors. Interim President and CEO, McKnight Foundation, 2020. Interim Commissioner, Minnesota Department of Human Services, 2019. Chief Operating Officer, Twin Cities Habitat for Humanity, 2017-2019. Vice President for University Services, University of Minnesota, 2012- 2016. Interim President and CEO, Blue Cross and Blue Shield of Minnesota, 2011-2012. Executive Vice-President and Chief Financial Officer, Minnesota Wild, 2002-2008. Commissioner, Minnesota Department of Finance, 1999-2002. Chair of the Board of Directors of Destination Medical Center Corporation. Board member of the Minnesota Wild Foundation. | N/A |
Name and year of birth | Position held and length of service | Principal occupations during past five years or longer |
Andrew Owen (Born 1960) | President, since 2017 | President and Chief Executive Officer of Allspring Funds Management, LLC since 2017 and Head of Global Fund Governance of Allspring Global Investments since 2022. Prior thereto, co-president of Galliard Capital Management, LLC, an affiliate of Allspring Funds Management, LLC, from 2019 to 2022 and Head of Affiliated Managers, Allspring Global Investments, from 2014 to 2019 and Executive Vice President responsible for marketing, investments and product development for Allspring Funds Management, LLC, from 2009 to 2014. |
Jeremy DePalma (Born 1974) | Treasurer, since 2012 (for certain funds in the Fund Complex); since 2021 (for the remaining funds in the Complex) | Senior Vice President of Allspring Funds Management, LLC since 2009. Senior Vice President of Evergreen Investment Management Company, LLC from 2008 to 2010 and head of the Fund Reporting and Control Team within Fund Administration from 2005 to 2010. |
Christopher Baker (Born 1976) | Chief Compliance Officer, since 2022 | Global Chief Compliance Officer for Allspring Global Investments since 2022. Prior thereto, Chief Compliance Officer for State Street Global Advisors from 2018 to 2021. Senior Compliance Officer for the State Street divisions of Alternative Investment Solutions, Sector Solutions, and Global Marketing from 2015 to 2018. From 2010 to 2015 Vice President, Global Head of Investment and Marketing Compliance for State Street Global Advisors. |
Matthew Prasse (Born 1983) | Chief Legal Officer, since 2022; Secretary, since 2021 | Senior Counsel of the Allspring Legal Department since 2021. Senior Counsel of the Wells Fargo Legal Department from 2018 to 2021. Previously, Counsel for Barings LLC from 2015 to 2018. Prior to joining Barings, Associate at Morgan, Lewis & Bockius LLP from 2008 to 2015. |

P.O. Box 219967
Kansas City, MO 64121-9967

AR3326 04-24

2 | |
6 | |
10 | |
11 | |
12 | |
13 | |
15 | |
16 | |
21 | |
25 | |
26 | |
30 | |
31 | |
32 | |
33 | |
34 | |
37 | |
38 |

Allspring Funds

President
Allspring Funds
Notice to Shareholders |
At a meeting held November 13-15, 2023, the Board of Trustees approved a number of changes to the Allspring C&B Large Cap Value Fund (the “Fund”) and the Allspring C&B Large Cap Value Portfolio, the master portfolio in which the Fund invests substantially all of its assets, including: |
• Change the Fund’s name to the Allspring Large Cap Value Fund and the master portfolio’s name to the Allspring Large Cap Value Portfolio; |
• Modify the Fund’s and the master portfolio’s principal investment strategy to allow it to invest up to 20% of its total assets in equity securities of foreign issuers through ADRs and similar investments; and |
• Switch the master portfolio’s sub-adviser from Cooke & Bieler, L.P. to Allspring Global Investments, LLC. |
These changes became effective on March 4, 2024. |
Notice to Shareholders |
Beginning in July 2024, the Fund will be required by the Securities and Exchange Commission to send shareholders a papercopy of a new tailored shareholder report in place of the full shareholder report that you are now receiving. The tailored shareholder report will contain concise information about the Fund, including certain expense and performance information and fund statistics. If you wish to receive this new tailored shareholder report electronically, please follow the instructions on the back cover of this report. |
Other information that is currently included in the shareholder report, such as the Fund’s financial statements, will be available online and upon request, free of charge, in paper or electronic format. |
Investment objective | The Fund seeks maximum long-term total return (current income and capital appreciation), consistent with minimizing risk to principal. |
Manager | Allspring Funds Management, LLC |
Subadviser for the affiliated master portfolio* | Allspring Global Investments, LLC |
Portfolio managers | James Tringas, CFA†, Bryant VanCronkhite†, Shane Zweck, CFA† |
Average annual total returns (%) as of April 30, 2024 | |||||||||
Including sales charge | Excluding sales charge | Expense ratios1 (%) | |||||||
Inception date | 1 year | 5 year | 10 year | 1 year | 5 year | 10 year | Gross | Net2 | |
Class A (CBEAX) | 7-26-2004 | 7.94 | 8.41 | 8.67 | 14.50 | 9.69 | 9.32 | 1.21 | 1.01 |
Class C (CBECX) | 7-26-2004 | 12.58 | 8.85 | 8.66 | 13.58 | 8.85 | 8.66 | 1.96 | 1.76 |
Class R6 (CBEJX)3 | 10-31-2016 | – | – | – | 14.97 | 10.16 | 9.76 | 0.79 | 0.59 |
Administrator Class (CBLLX) | 7-26-2004 | – | – | – | 14.58 | 9.78 | 9.44 | 1.14 | 0.94 |
Institutional Class (CBLSX) | 7-26-2004 | – | – | – | 14.93 | 10.05 | 9.70 | 0.89 | 0.69 |
Russell 3000® Index4 | – | – | – | – | 22.30 | 12.43 | 11.81 | – | – |
Russell 1000® Value Index5 | – | – | – | – | 13.42 | 8.60 | 8.43 | – | – |
1 | Reflects the expense ratios as stated in the most recent prospectuses. The expense ratios shown are subject to change and may differ from the annualized expense ratios shown in the Financial Highlights of this report. |
2 | The manager has contractually committed through September 30, 2024, to waive fees and/or reimburse expenses to the extent necessary to cap total annual fund operating expenses after fee waivers at 1.01% for Class A, 1.76% for Class C, 0.59% for Class R6, 0.94% for Administrator Class and 0.69% for Institutional Class. Brokerage commissions, stamp duty fees, interest, taxes, acquired fund fees and expenses (if any) from funds in which the underlying affiliated master portfolios and funds invest and from money market funds, and extraordinary expenses are excluded from the expense caps. All other acquired fund fees and expenses from the affiliated master portfolios and funds are included in the expense caps. Prior to or after the commitment expiration date, the caps may be increased or the commitment to maintain the caps may be terminated only with the approval of the Board of Trustees. Without these caps, the Fund’s returns would have been lower. The expense ratio paid by an investor is the net expense ratio (the total annual fund operating expenses after fee waivers) as stated in the prospectuses. |
3 | Historical performance shown for the Class R6 shares prior to their inception reflects the performance of the Institutional Class shares, and includes the higher expenses applicable to the Institutional Class shares. If these expenses had not been included, returns for the Class R6 shares would be higher. |
4 | The Russell 3000® Index measures the performance of the 3,000 largest U.S. companies based on total market capitalization, which represents approximately 98% of the investable U.S. equity market. You cannot invest directly in an index. |
5 | The Russell 1000® Value Index measures the performance of those Russell 1000 companies with lower price/book ratios and lower forecasted growth values. You cannot invest directly in an index. |
* | The Fund is a feeder fund in a master-feeder structure that invests substantially all of its assets in a single affiliated master portfolio of the Allspring Master Trust with a substantially identical investment objective and substantially similar investment strategies. References to the investment activities of the Fund are intended to refer to the investment activities of the affiliated master portfolio in which it invests. |
† | Mr. Tringas, Mr. VanCronkhite and Mr. Zweck became portfolio managers of the Fund on March 4, 2024. |
CFA® and Chartered Financial Analyst® are trademarks owned by CFA Institute. | |
Growth of $10,000 investment as of April 30, 20241 |
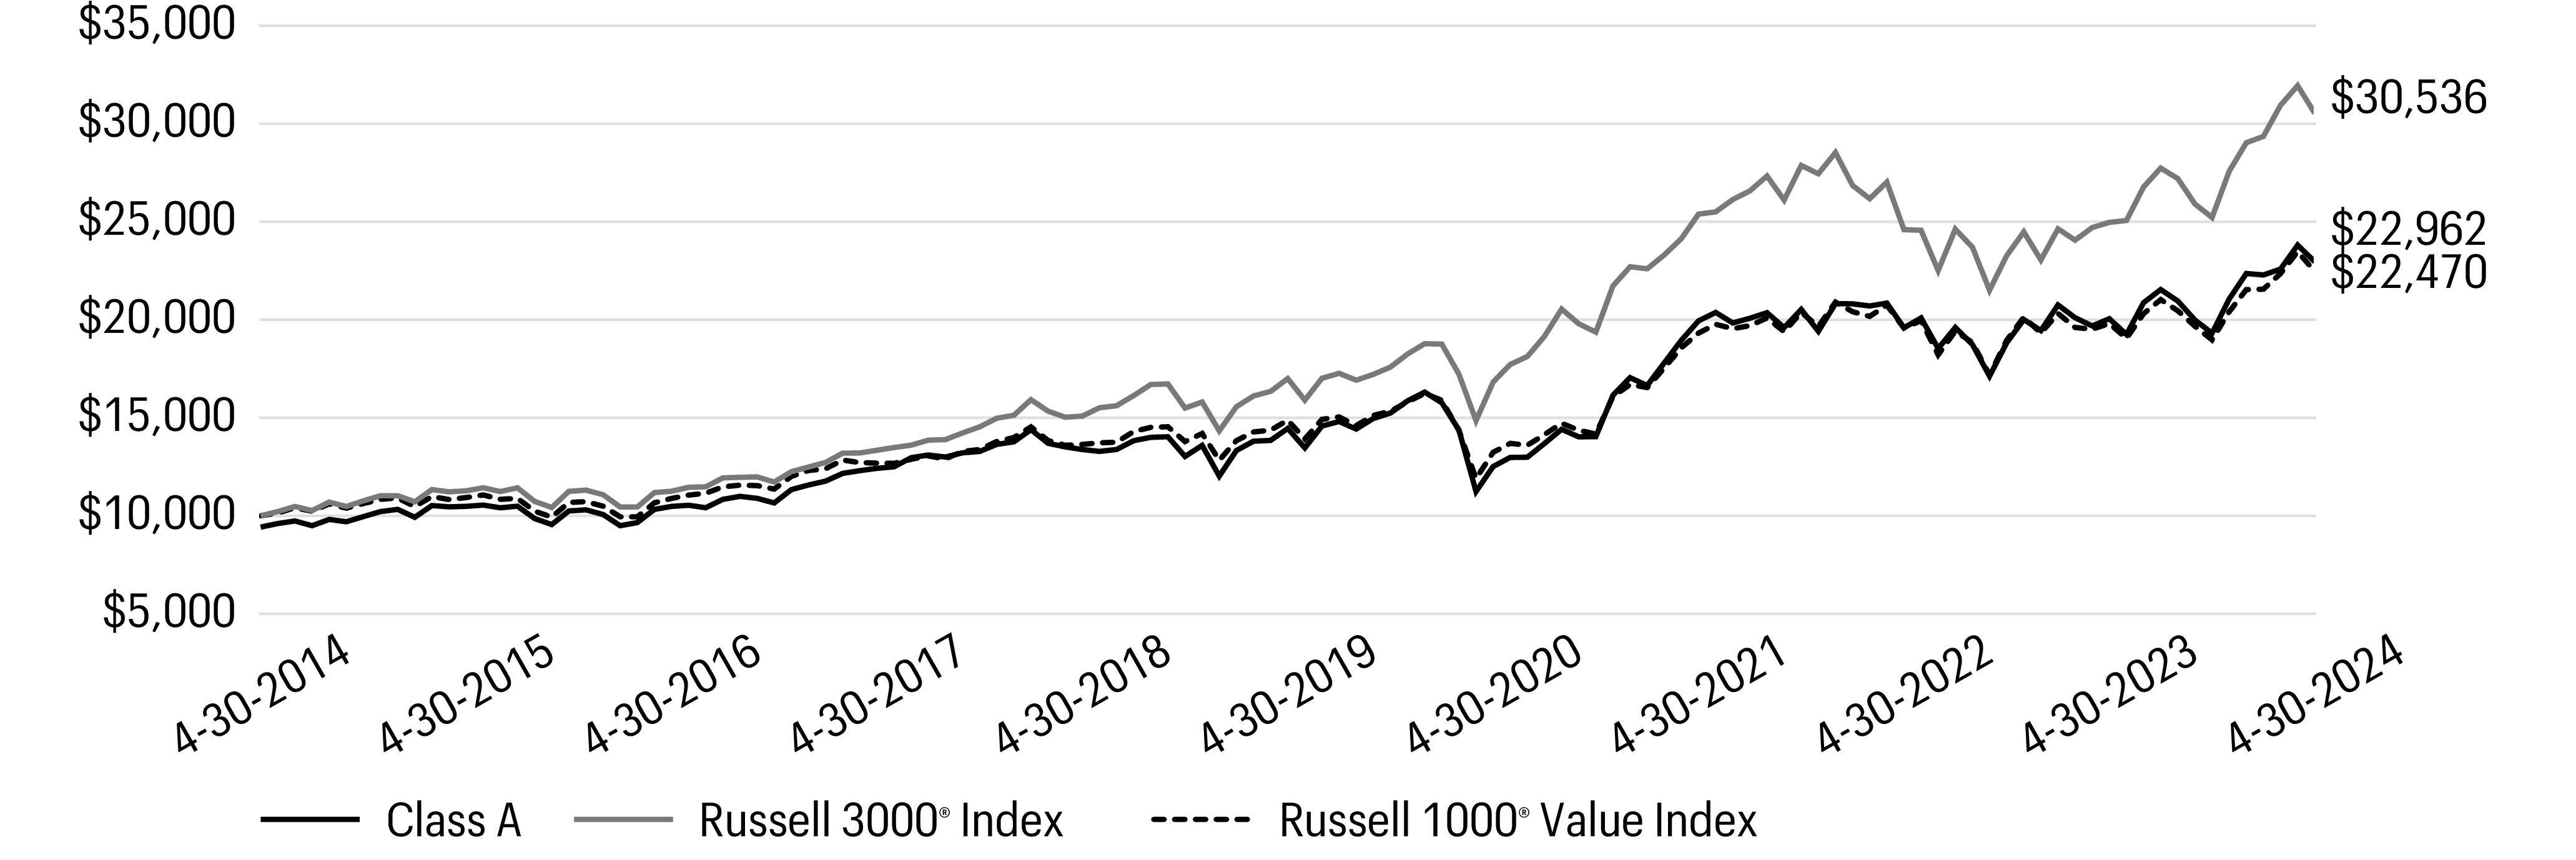
1 | The chart compares the performance of Class A shares for the most recent ten years with the Russell 3000® Index and Russell 1000® Value Index. The chart assumes a hypothetical investment of $10,000 in Class A shares and reflects all operating expenses and assumes the maximum initial sales charge of 5.75%. |
Ten largest holdings (%) as of April 30, 20241 | |
AerCap Holdings NV | 3.83 |
Berkshire Hathaway, Inc. Class B | 3.73 |
NextEra Energy, Inc. | 3.62 |
Alphabet, Inc. Class C | 3.54 |
JPMorgan Chase & Co. | 3.36 |
Citigroup, Inc. | 3.34 |
Intercontinental Exchange, Inc. | 3.20 |
General Motors Co. | 3.05 |
Cigna Group | 3.03 |
Walmart, Inc. | 3.01 |
1 | Each holding represents the Fund’s allocable portion of the affiliated master portfolio security. Figures represent each holding as a percentage of the Fund’s net assets. Holdings are subject to change and may have changed since the date specified. |
Sector allocation as of April 30, 20241 |
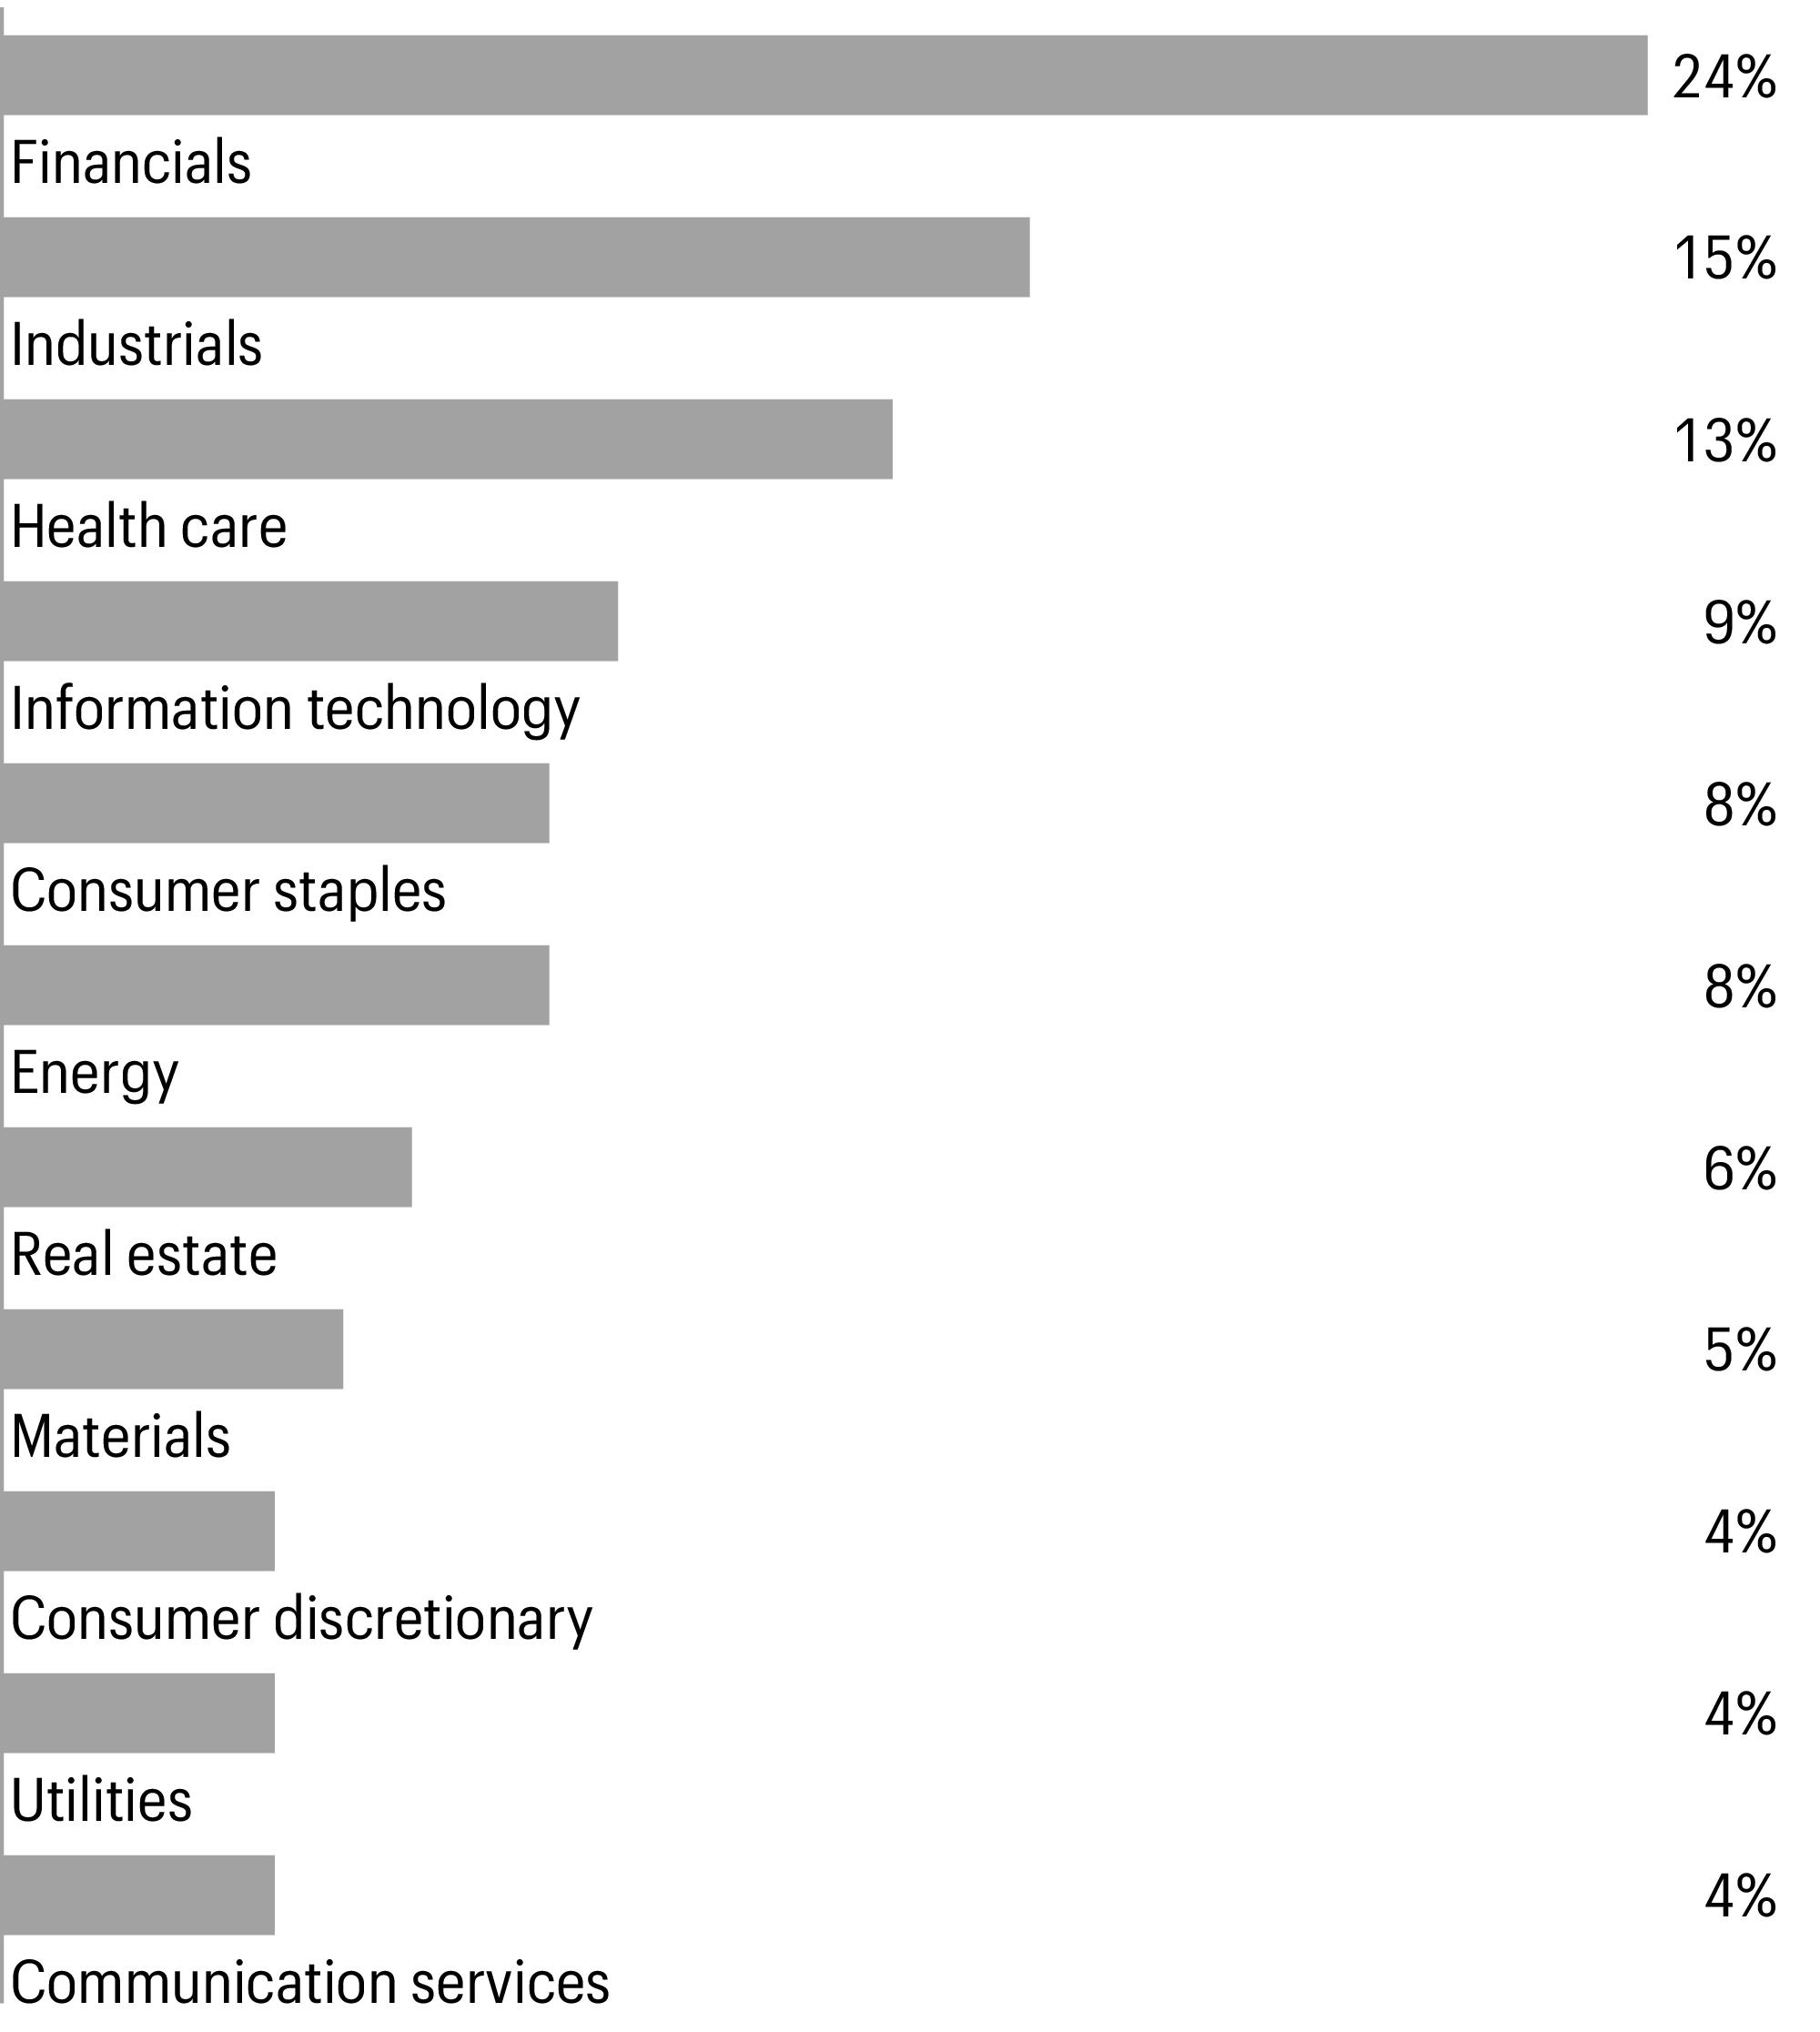
1 | Figures represent the sector allocation of the affiliated master portfolio as a percentage of the long-term investments of the affiliated master portfolio. These amounts are subject to change and may have changed since the date specified. |
Beginning account value 11-1-2023 | Ending account value 4-30-2024 | Expenses paid during the period1, 2 | Annualized net expense ratio2 | |
Class A | ||||
Actual | $1,000.00 | $1,188.60 | $5.44 | 1.00 % |
Hypothetical (5% return before expenses) | $1,000.00 | $1,019.89 | $5.02 | 1.00 % |
Class C | ||||
Actual | $1,000.00 | $1,182.91 | $9.77 | 1.80 % |
Hypothetical (5% return before expenses) | $1,000.00 | $1,015.91 | $9.02 | 1.80 % |
Class R6 | ||||
Actual | $1,000.00 | $1,191.11 | $3.43 | 0.63 % |
Hypothetical (5% return before expenses) | $1,000.00 | $1,021.73 | $3.17 | 0.63 % |
Administrator Class | ||||
Actual | $1,000.00 | $1,189.22 | $4.90 | 0.90 % |
Hypothetical (5% return before expenses) | $1,000.00 | $1,020.39 | $4.52 | 0.90 % |
Institutional Class | ||||
Actual | $1,000.00 | $1,190.78 | $3.98 | 0.73 % |
Hypothetical (5% return before expenses) | $1,000.00 | $1,021.23 | $3.67 | 0.73 % |
1 | Expenses paid is equal to the annualized net expense ratio of each class multiplied by the average account value over the period, multiplied by 182 divided by 366 (to reflect the one-half-year period). |
2 | Amounts reflect net expenses allocated from the affiliated Master Portfolio in which the Fund invests. |
Value | ||||||
Investment companies: 100.00% | ||||||
Affiliated master portfolio: 100.00% | ||||||
Allspring Large Cap Value Portfolio | $189,660,441 | |||||
Total investment companies (Cost $179,174,767) | 189,660,441 | |||||
Total investments in securities (Cost $179,174,767) | 100.00 % | 189,660,441 | ||||
Other assets and liabilities, net | 0.00 | 4,586 | ||||
Total net assets | 100.00 % | $189,665,027 | ||||
% of ownership, beginning of period | % of ownership, end of period | Net realized gains (losses) on investments allocated from affiliated Master Portfolio | Net change in unrealized gains (losses) on investments allocated from affiliated Master Portfolio | Dividends allocated from affiliated Master Portfolio | Interest allocated from affiliated Master Portfolio | Affiliated Income Allocated from affiliated Master Portfolio | Value, end of period | |
Allspring Large Cap Value Portfolio | 78.60 % | 78.81 % | $48,040,681 | $(14,723,111 ) | $3,957,753 | $1,893 | $239,962 | $189,660,441 |
Assets | |
Investments in affiliated Master Portfolio, at value (cost $179,174,767) | $189,660,441 |
Receivable for Fund shares sold | 63,935 |
Receivable from manager | 25,146 |
Prepaid expenses and other assets | 133,945 |
Total assets | 189,883,467 |
Liabilities | |
Payable for Fund shares redeemed | 161,160 |
Administration fees payable | 24,187 |
Shareholder servicing fees payable | 17,882 |
Distribution fee payable | 1,934 |
Accrued expenses and other liabilities | 13,277 |
Total liabilities | 218,440 |
Total net assets | $189,665,027 |
Net assets consist of | |
Paid-in capital | $141,852,800 |
Total distributable earnings | 47,812,227 |
Total net assets | $189,665,027 |
Computation of net asset value and offering price per share | |
Net assets–Class A | $79,213,994 |
Shares outstanding–Class A1 | 6,488,077 |
Net asset value per share–Class A | $12.21 |
Maximum offering price per share – Class A2 | $12.95 |
Net assets–Class C | $3,066,349 |
Shares outstanding–Class C1 | 256,120 |
Net asset value per share–Class C | $11.97 |
Net assets–Class R6 | $14,101,715 |
Shares outstanding–Class R61 | 1,147,699 |
Net asset value per share–Class R6 | $12.29 |
Net assets–Administrator Class | $3,665,042 |
Shares outstanding–Administrator Class1 | 298,895 |
Net asset value per share–Administrator Class | $12.26 |
Net assets–Institutional Class | $89,617,927 |
Shares outstanding–Institutional Class1 | 7,288,963 |
Net asset value per share–Institutional Class | $12.30 |
Year Ended April 30, 20241 | Year Ended May 31, 2023 | |
Investment income | ||
Dividends allocated from affiliated Master Portfolio (net of foreign withholding taxes of $91,993 and $107,495, respectively) | $3,957,753 | $4,755,544 |
Affiliated income allocated from affiliated Master Portfolio | 239,962 | 148,872 |
Interest allocated from affiliated Master Portfolio | 1,893 | 201 |
Expenses allocated from affiliated Master Portfolio | (1,289,377 ) | (1,571,119 ) |
Waivers allocated from affiliated Master Portfolio | 113,334 | 145,978 |
Total investment income | 3,023,565 | 3,479,476 |
Expenses | ||
Management fee | 92,835 | 111,328 |
Administration fees | ||
Class A | 147,335 | 178,189 |
Class C | 6,252 | 8,343 |
Class R6 | 4,309 | 5,862 |
Administrator Class | 4,627 | 6,606 |
Institutional Class | 118,671 | 141,971 |
Shareholder servicing fees | ||
Class A | 183,373 | 212,130 |
Class C | 7,695 | 9,930 |
Administrator Class | 8,890 | 12,703 |
Distribution fee | ||
Class C | 23,092 | 29,772 |
Custody and accounting fees | 4,734 | 7,535 |
Professional fees | 54,686 | 45,318 |
Registration fees | 33,651 | 36,664 |
Shareholder report expenses | 31,231 | 30,584 |
Trustees’ fees and expenses | 21,778 | 21,908 |
Other fees and expenses | 5,040 | 4,517 |
Total expenses | 748,199 | 863,360 |
Less: Fee waivers and/or expense reimbursements | ||
Fund-level | (282,383 ) | (290,386 ) |
Class A | (23,358 ) | (8,079 ) |
Class C | 0 | (226 ) |
Year Ended April 30, 20241 | Year Ended May 31, 2023 | |
Administrator Class | (1,540 ) | (484 ) |
Institutional Class | 0 | (6,438 ) |
Net expenses | 440,918 | 557,747 |
Net investment income | 2,582,647 | 2,921,729 |
Realized and unrealized gains (losses) on investments | ||
Net realized gains on investments allocated from affiliated Master Portfolio | 48,040,681 | 19,848,834 |
Net change in unrealized gains (losses) on investments allocated from affiliated Master Portfolio | (14,723,111 ) | (33,458,109 ) |
Net realized and unrealized gains (losses) on investments | 33,317,570 | (13,609,275 ) |
Net increase (decrease) in net assets resulting from operations | $35,900,217 | $(10,687,546 ) |
Year ended April 30, 20241 | Year ended May 31, 2023 | Year ended May 31, 2022 | ||||
Operations | ||||||
Net investment income | $2,582,647 | $2,921,729 | $2,669,791 | |||
Net realized gains on investments | 48,040,681 | 19,848,834 | 47,346,569 | |||
Net change in unrealized losses on investments | (14,723,111 ) | (33,458,109 ) | (53,785,190 ) | |||
Net increase (decrease) in net assets resulting from operations | 35,900,217 | (10,687,546 ) | (3,768,830 ) | |||
Distributions to shareholders from | ||||||
Net investment income and net realized gains | ||||||
Class A | (9,124,267 ) | (16,304,617 ) | (12,919,436 ) | |||
Class C | (388,100 ) | (740,826 ) | (535,250 ) | |||
Class R6 | (1,876,212 ) | (3,797,016 ) | (6,057,662 ) | |||
Administrator Class | (416,660 ) | (1,047,406 ) | (841,849 ) | |||
Institutional Class | (11,051,054 ) | (21,328,025 ) | (17,599,026 ) | |||
Total distributions to shareholders | (22,856,293 ) | (43,217,890 ) | (37,953,223 ) | |||
Capital share transactions | Shares | Shares | Shares | |||
Proceeds from shares sold | ||||||
Class A | 308,556 | 3,739,064 | 415,820 | 5,265,311 | 989,891 | 15,969,277 |
Class C | 28,639 | 335,449 | 96,897 | 1,168,445 | 43,159 | 682,181 |
Class R6 | 119,132 | 1,497,539 | 123,974 | 1,716,518 | 349,706 | 5,728,171 |
Administrator Class | 3,874 | 48,053 | 3,961 | 50,313 | 55,766 | 954,376 |
Institutional Class | 1,297,021 | 15,938,036 | 1,322,276 | 17,070,664 | 1,764,097 | 28,100,206 |
21,558,141 | 25,271,251 | 51,434,211 | ||||
Reinvestment of distributions | ||||||
Class A | 764,770 | 8,999,261 | 1,348,065 | 16,067,784 | 845,770 | 12,689,368 |
Class C | 33,783 | 388,100 | 63,426 | 740,826 | 36,313 | 535,250 |
Class R6 | 93,000 | 1,104,050 | 148,681 | 1,785,702 | 80,021 | 1,208,696 |
Administrator Class | 18,230 | 215,408 | 53,517 | 639,939 | 34,924 | 525,330 |
Institutional Class | 925,698 | 10,990,717 | 1,765,170 | 21,195,384 | 1,158,450 | 17,489,868 |
21,697,536 | 40,429,635 | 32,448,512 | ||||
Payment for shares redeemed | ||||||
Class A | (1,289,111 ) | (15,627,452 ) | (1,910,541 ) | (24,861,078 ) | (946,956 ) | (15,053,324 ) |
Class C | (113,065 ) | (1,339,865 ) | (134,315 ) | (1,653,300 ) | (76,840 ) | (1,207,888 ) |
Class R6 | (402,689 ) | (4,941,445 ) | (510,778 ) | (6,892,525 ) | (1,596,640 ) | (24,419,329 ) |
Administrator Class | (94,720 ) | (1,180,768 ) | (89,944 ) | (1,125,103 ) | (34,305 ) | (524,769 ) |
Institutional Class | (3,447,189 ) | (42,694,554 ) | (3,362,511 ) | (44,116,398 ) | (3,201,272 ) | (51,615,218 ) |
(65,784,084 ) | (78,648,404 ) | (92,820,528 ) | ||||
Net decrease in net assets resulting from capital share transactions | (22,528,407 ) | (12,947,518 ) | (8,937,805 ) | |||
Total decrease in net assets | (9,484,483 ) | (66,852,954 ) | (50,659,858 ) | |||
Net assets | ||||||
Beginning of period | 199,149,510 | 266,002,464 | 316,662,322 | |||
End of period | $189,665,027 | $199,149,510 | $266,002,464 | |||
Year ended April 30 20241 | Year ended May 31 | |||||
Class A | 2023 | 2022 | 2021 | 2020 | 2019 | |
Net asset value, beginning of period | $11.52 | $14.82 | $17.16 | $11.49 | $13.01 | $13.91 |
Net investment income | 0.14 2 | 0.15 2 | 0.11 | 0.10 | 0.12 | 0.11 |
Net realized and unrealized gains (losses) on investments | 2.00 | (0.71 ) | (0.34 ) | 6.29 | (0.33 ) | 0.02 |
Total from investment operations | 2.14 | (0.56 ) | (0.23 ) | 6.39 | (0.21 ) | 0.13 |
Distributions to shareholders from | ||||||
Net investment income | (0.16 ) | (0.14 ) | (0.11 ) | (0.11 ) | (0.13 ) | (0.12 ) |
Net realized gains | (1.29 ) | (2.60 ) | (2.00 ) | (0.61 ) | (1.18 ) | (0.91 ) |
Total distributions to shareholders | (1.45 ) | (2.74 ) | (2.11 ) | (0.72 ) | (1.31 ) | (1.03 ) |
Net asset value, end of period | $12.21 | $11.52 | $14.82 | $17.16 | $11.49 | $13.01 |
Total return3 | 19.27 % | (4.19 )% | (1.37 )% | 56.98 % | (3.61 )% | 1.33 % |
Ratios to average net assets (annualized)* | ||||||
Gross expenses | 1.22 % | 1.22 % | 1.19 % | 1.24 % | 1.27 % | 1.23 % |
Net expenses | 1.03 % | 1.08 % | 1.07 % | 1.07 % | 1.07 % | 1.08 % |
Net investment income | 1.22 % | 1.13 % | 0.69 % | 0.73 % | 0.92 % | 0.83 % |
Supplemental data | ||||||
Portfolio turnover rate4 | 98 % | 29 % | 32 % | 38 % | 33 % | 47 % |
Net assets, end of period (000s omitted) | $79,214 | $77,198 | $101,496 | $102,332 | $70,680 | $79,172 |
* | Ratios include net expenses allocated from the affiliated Master Portfolio which were as follows: |
Year ended April 30, 20241 | 0.63% |
Year ended May 31, 2023 | 0.64% |
Year ended May 31, 2022 | 0.64% |
Year ended May 31, 2021 | 0.64% |
Year ended May 31, 2020 | 0.64% |
Year ended May 31, 2019 | 0.65% |
1 | For the eleven months ended April 30, 2024. The Fund changed its fiscal year end from May 31 to April 30, effective April 30, 2024. |
2 | Calculated based upon average shares outstanding |
3 | Total return calculations do not include any sales charges. Returns for periods of less than one year are not annualized. |
4 | Portfolio turnover rate is calculated by multiplying the affiliated Master Portfolio’s percentage of the Fund’s total investment in securities at the end of the period by the affiliated Master Portfolio’s portfolio turnover rate. |
Year ended April 30 20241 | Year ended May 31 | |||||
Class C | 2023 | 2022 | 2021 | 2020 | 2019 | |
Net asset value, beginning of period | $11.32 | $14.61 | $16.97 | $11.36 | $12.87 | $13.75 |
Net investment income (loss) | 0.05 2 | 0.05 2 | (0.01 ) | (0.03 ) | 0.02 2 | 0.01 2 |
Net realized and unrealized gains (losses) on investments | 1.96 | (0.69 ) | (0.35 ) | 6.25 | (0.35 ) | 0.03 |
Total from investment operations | 2.01 | (0.64 ) | (0.36 ) | 6.22 | (0.33 ) | 0.04 |
Distributions to shareholders from | ||||||
Net investment income | (0.07 ) | (0.05 ) | 0.00 | 0.00 | 0.00 | (0.01 ) |
Net realized gains | (1.29 ) | (2.60 ) | (2.00 ) | (0.61 ) | (1.18 ) | (0.91 ) |
Total distributions to shareholders | (1.36 ) | (2.65 ) | (2.00 ) | (0.61 ) | (1.18 ) | (0.92 ) |
Net asset value, end of period | $11.97 | $11.32 | $14.61 | $16.97 | $11.36 | $12.87 |
Total return3 | 18.40 % | (4.85 )% | (2.22 )% | 55.94 % | (4.41 )% | 0.61 % |
Ratios to average net assets (annualized)* | ||||||
Gross expenses | 1.95 % | 1.97 % | 1.94 % | 1.99 % | 2.02 % | 1.97 % |
Net expenses | 1.81 % | 1.83 % | 1.83 % | 1.83 % | 1.83 % | 1.83 % |
Net investment income (loss) | 0.45 % | 0.36 % | (0.08 )% | (0.04 )% | 0.16 % | 0.07 % |
Supplemental data | ||||||
Portfolio turnover rate4 | 98 % | 29 % | 32 % | 38 % | 33 % | 47 % |
Net assets, end of period (000s omitted) | $3,066 | $3,471 | $4,103 | $4,719 | $3,576 | $5,098 |
* | Ratios include net expenses allocated from the affiliated Master Portfolio which were as follows: |
Year ended April 30, 20241 | 0.63% |
Year ended May 31, 2023 | 0.64% |
Year ended May 31, 2022 | 0.64% |
Year ended May 31, 2021 | 0.64% |
Year ended May 31, 2020 | 0.64% |
Year ended May 31, 2019 | 0.65% |
1 | For the eleven months ended April 30, 2024. The Fund changed its fiscal year end from May 31 to April 30, effective April 30, 2024. |
2 | Calculated based upon average shares outstanding |
3 | Total return calculations do not include any sales charges. Returns for periods of less than one year are not annualized. |
4 | Portfolio turnover rate is calculated by multiplying the affiliated Master Portfolio’s percentage of the Fund’s total investment in securities at the end of the period by the affiliated Master Portfolio’s portfolio turnover rate. |
Year ended April 30 20241 | Year ended May 31 | |||||
Class R6 | 2023 | 2022 | 2021 | 2020 | 2019 | |
Net asset value, beginning of period | $11.59 | $14.90 | $17.24 | $11.53 | $13.06 | $13.97 |
Net investment income | 0.18 2 | 0.20 2 | 0.18 2 | 0.16 2 | 0.18 2 | 0.18 2 |
Net realized and unrealized gains (losses) on investments | 2.03 | (0.70 ) | (0.34 ) | 6.32 | (0.33 ) | 0.00 3 |
Total from investment operations | 2.21 | (0.50 ) | (0.16 ) | 6.48 | (0.15 ) | 0.18 |
Distributions to shareholders from | ||||||
Net investment income | (0.22 ) | (0.21 ) | (0.18 ) | (0.16 ) | (0.20 ) | (0.18 ) |
Net realized gains | (1.29 ) | (2.60 ) | (2.00 ) | (0.61 ) | (1.18 ) | (0.91 ) |
Total distributions to shareholders | (1.51 ) | (2.81 ) | (2.18 ) | (0.77 ) | (1.38 ) | (1.09 ) |
Net asset value, end of period | $12.29 | $11.59 | $14.90 | $17.24 | $11.53 | $13.06 |
Total return4 | 19.73 % | (3.75 )% | (0.98 )% | 57.75 % | (3.25 )% | 1.74 % |
Ratios to average net assets (annualized)* | ||||||
Gross expenses | 0.79 % | 0.78 % | 0.76 % | 0.82 % | 0.84 % | 0.79 % |
Net expenses | 0.64 % | 0.65 % | 0.65 % | 0.65 % | 0.65 % | 0.65 % |
Net investment income | 1.63 % | 1.55 % | 1.11 % | 1.14 % | 1.33 % | 1.27 % |
Supplemental data | ||||||
Portfolio turnover rate5 | 98 % | 29 % | 32 % | 38 % | 33 % | 47 % |
Net assets, end of period (000s omitted) | $14,102 | $15,505 | $23,487 | $47,301 | $37,859 | $68,366 |
* | Ratios include net expenses allocated from the affiliated Master Portfolio which were as follows: |
Year ended April 30, 20241 | 0.63% |
Year ended May 31, 2023 | 0.64% |
Year ended May 31, 2022 | 0.64% |
Year ended May 31, 2021 | 0.64% |
Year ended May 31, 2020 | 0.64% |
Year ended May 31, 2019 | 0.65% |
1 | For the eleven months ended April 30, 2024. The Fund changed its fiscal year end from May 31 to April 30, effective April 30, 2024. |
2 | Calculated based upon average shares outstanding |
3 | Amount is less than $0.005. |
4 | Returns for periods of less than one year are not annualized. |
5 | Portfolio turnover rate is calculated by multiplying the affiliated Master Portfolio’s percentage of the Fund’s total investment in securities at the end of the period by the affiliated Master Portfolio’s portfolio turnover rate. |
Year ended April 30 20241 | Year ended May 31 | |||||
Administrator Class | 2023 | 2022 | 2021 | 2020 | 2019 | |
Net asset value, beginning of period | $11.55 | $14.86 | $17.20 | $11.51 | $13.03 | $13.92 |
Net investment income | 0.15 2 | 0.16 2 | 0.12 2 | 0.11 2 | 0.13 2 | 0.12 2 |
Net realized and unrealized gains (losses) on investments | 2.02 | (0.72 ) | (0.33 ) | 6.30 | (0.33 ) | 0.02 |
Total from investment operations | 2.17 | (0.56 ) | (0.21 ) | 6.41 | (0.20 ) | 0.14 |
Distributions to shareholders from | ||||||
Net investment income | (0.17 ) | (0.15 ) | (0.13 ) | (0.11 ) | (0.14 ) | (0.12 ) |
Net realized gains | (1.29 ) | (2.60 ) | (2.00 ) | (0.61 ) | (1.18 ) | (0.91 ) |
Total distributions to shareholders | (1.46 ) | (2.75 ) | (2.13 ) | (0.72 ) | (1.32 ) | (1.03 ) |
Net asset value, end of period | $12.26 | $11.55 | $14.86 | $17.20 | $11.51 | $13.03 |
Total return3 | 19.44 % | (4.18 )% | (1.29 )% | 57.12 % | (3.56 )% | 1.44 % |
Ratios to average net assets (annualized)* | ||||||
Gross expenses | 1.14 % | 1.14 % | 1.11 % | 1.17 % | 1.19 % | 1.15 % |
Net expenses | 0.95 % | 1.00 % | 0.99 % | 0.99 % | 0.99 % | 1.00 % |
Net investment income | 1.32 % | 1.21 % | 0.76 % | 0.81 % | 1.00 % | 0.90 % |
Supplemental data | ||||||
Portfolio turnover rate4 | 98 % | 29 % | 32 % | 38 % | 33 % | 47 % |
Net assets, end of period (000s omitted) | $3,665 | $4,292 | $6,001 | $5,980 | $6,167 | $9,274 |
* | Ratios include net expenses allocated from the affiliated Master Portfolio which were as follows: |
Year ended April 30, 20241 | 0.63% |
Year ended May 31, 2023 | 0.64% |
Year ended May 31, 2022 | 0.64% |
Year ended May 31, 2021 | 0.64% |
Year ended May 31, 2020 | 0.64% |
Year ended May 31, 2019 | 0.65% |
1 | For the eleven months ended April 30, 2024. The Fund changed its fiscal year end from May 31 to April 30, effective April 30, 2024. |
2 | Calculated based upon average shares outstanding |
3 | Returns for periods of less than one year are not annualized. |
4 | Portfolio turnover rate is calculated by multiplying the affiliated Master Portfolio’s percentage of the Fund’s total investment in securities at the end of the period by the affiliated Master Portfolio’s portfolio turnover rate. |
Year ended April 30 20241 | Year ended May 31 | |||||
Institutional Class | 2023 | 2022 | 2021 | 2020 | 2019 | |
Net asset value, beginning of period | $11.59 | $14.90 | $17.24 | $11.53 | $13.05 | $13.96 |
Net investment income | 0.17 2 | 0.19 2 | 0.16 | 0.15 | 0.16 | 0.14 |
Net realized and unrealized gains (losses) on investments | 2.03 | (0.71 ) | (0.34 ) | 6.32 | (0.33 ) | 0.02 |
Total from investment operations | 2.20 | (0.52 ) | (0.18 ) | 6.47 | (0.17 ) | 0.16 |
Distributions to shareholders from | ||||||
Net investment income | (0.20 ) | (0.19 ) | (0.16 ) | (0.15 ) | (0.17 ) | (0.16 ) |
Net realized gains | (1.29 ) | (2.60 ) | (2.00 ) | (0.61 ) | (1.18 ) | (0.91 ) |
Total distributions to shareholders | (1.49 ) | (2.79 ) | (2.16 ) | (0.76 ) | (1.35 ) | (1.07 ) |
Net asset value, end of period | $12.30 | $11.59 | $14.90 | $17.24 | $11.53 | $13.05 |
Total return3 | 19.69 % | (3.92 )% | (1.08 )% | 57.58 % | (3.33 )% | 1.64 % |
Ratios to average net assets (annualized)* | ||||||
Gross expenses | 0.89 % | 0.89 % | 0.86 % | 0.91 % | 0.94 % | 0.90 % |
Net expenses | 0.74 % | 0.75 % | 0.75 % | 0.75 % | 0.75 % | 0.75 % |
Net investment income | 1.53 % | 1.45 % | 1.01 % | 1.05 % | 1.25 % | 1.17 % |
Supplemental data | ||||||
Portfolio turnover rate4 | 98 % | 29 % | 32 % | 38 % | 33 % | 47 % |
Net assets, end of period (000s omitted) | $89,618 | $98,683 | $130,915 | $156,330 | $96,838 | $108,613 |
* | Ratios include net expenses allocated from the affiliated Master Portfolio which were as follows: |
Year ended April 30, 20241 | 0.63% |
Year ended May 31, 2023 | 0.64% |
Year ended May 31, 2022 | 0.64% |
Year ended May 31, 2021 | 0.64% |
Year ended May 31, 2020 | 0.64% |
Year ended May 31, 2019 | 0.65% |
1 | For the eleven months ended April 30, 2024. The Fund changed its fiscal year end from May 31 to April 30, effective April 30, 2024. |
2 | Calculated based upon average shares outstanding |
3 | Returns for periods of less than one year are not annualized. |
4 | Portfolio turnover rate is calculated by multiplying the affiliated Master Portfolio’s percentage of the Fund’s total investment in securities at the end of the period by the affiliated Master Portfolio’s portfolio turnover rate. |
Gross unrealized gains | $11,162,487 |
Gross unrealized losses | (0 ) |
Net unrealized gains | $11,162,487 |
Affiliated Master Portfolio | Investment objective | Fair value of affiliated Master Portfolio |
Allspring Large Cap Value Portfolio | Seeks maximum long-term total return (current income and capital appreciation), consistent with minimizing risk to principal | $189,660,441 |
Average daily net assets | Management fee |
First $5 billion | 0.050 % |
Next $5 billion | 0.040 |
Over $10 billion | 0.030 |
Class-level administration fee | |
Class A | 0.20 % |
Class C | 0.20 |
Class R6 | 0.03 |
Administrator Class | 0.13 |
Institutional Class | 0.13 |
EXPENSE RATIO CAPS | Prior to March 4, 2024 | |
Class A | 1.01 % | 1.07 % |
Class C | 1.76 | 1.82 |
Class R6 | 0.59 | 0.65 |
Administrator Class | 0.94 | 1.00 |
Institutional Class | 0.69 | 0.75 |
Year ended May 31 | |||
Year ended April 30, 2024 | 2023 | 2022 | |
Ordinary income | $4,146,303 | $4,141,234 | $4,587,798 |
Long-term capital gain | 18,709,990 | 39,076,656 | 33,365,425 |
Undistributed ordinary income | Undistributed long-term gain | Unrealized gains |
$5,431,121 | $31,218,619 | $11,162,487 |
Allspring Funds Trust:

Shares | Value | |||||
Common stocks: 97.91% | ||||||
Communication services: 3.54% | ||||||
Interactive media & services: 3.54% | ||||||
Alphabet, Inc. Class C† | 51,793 | $8,527,200 | ||||
Consumer discretionary: 4.19% | ||||||
Automobiles: 3.05% | ||||||
General Motors Co. | 164,827 | 7,339,747 | ||||
Household durables: 1.14% | ||||||
D.R. Horton, Inc. | 19,221 | 2,738,800 | ||||
Consumer staples: 7.98% | ||||||
Beverages: 2.21% | ||||||
Keurig Dr Pepper, Inc. | 157,563 | 5,309,873 | ||||
Consumer staples distribution & retail : 3.01% | ||||||
Walmart, Inc. | 122,022 | 7,242,006 | ||||
Personal care products: 2.76% | ||||||
Unilever PLC ADR | 128,343 | 6,654,584 | ||||
Energy: 7.81% | ||||||
Oil, gas & consumable fuels: 7.81% | ||||||
ConocoPhillips | 54,784 | 6,881,966 | ||||
EOG Resources, Inc. | 38,154 | 5,041,288 | ||||
Exxon Mobil Corp. | 58,094 | 6,870,777 | ||||
18,794,031 | ||||||
Financials: 23.60% | ||||||
Banks: 9.59% | ||||||
Bank of America Corp. | 187,904 | 6,954,327 | ||||
Citigroup, Inc. | 131,146 | 8,043,184 | ||||
JPMorgan Chase & Co. | 42,114 | 8,074,939 | ||||
23,072,450 | ||||||
Capital markets: 3.20% | ||||||
Intercontinental Exchange, Inc. | 59,770 | 7,695,985 | ||||
Financial services: 7.90% | ||||||
Berkshire Hathaway, Inc. Class B† | 22,618 | 8,973,239 | ||||
Fiserv, Inc.† | 40,357 | 6,161,303 | ||||
Visa, Inc. Class A | 14,444 | 3,879,803 | ||||
19,014,345 | ||||||
Insurance: 2.91% | ||||||
Allstate Corp. | 5,537 | 941,622 | ||||
American International Group, Inc. | 80,594 | 6,069,534 | ||||
7,011,156 | ||||||
Shares | Value | |||||
Health care: 13.29% | ||||||
Biotechnology: 1.44% | ||||||
Vertex Pharmaceuticals, Inc.† | 8,816 | $3,463,013 | ||||
Health care equipment & supplies: 3.13% | ||||||
Globus Medical, Inc. Class A† | 53,213 | 2,649,475 | ||||
Medtronic PLC | 60,694 | 4,870,087 | ||||
7,519,562 | ||||||
Health care providers & services: 5.94% | ||||||
Cigna Group | 20,425 | 7,292,542 | ||||
Humana, Inc. | 11,289 | 3,410,294 | ||||
Laboratory Corp. of America Holdings | 17,842 | 3,592,843 | ||||
14,295,679 | ||||||
Pharmaceuticals: 2.78% | ||||||
Merck & Co., Inc. | 51,835 | 6,698,119 | ||||
Industrials: 14.68% | ||||||
Aerospace & defense: 4.17% | ||||||
L3Harris Technologies, Inc. | 25,384 | 5,433,445 | ||||
RTX Corp. | 45,251 | 4,593,882 | ||||
10,027,327 | ||||||
Commercial services & supplies: 1.50% | ||||||
Waste Management, Inc. | 17,370 | 3,613,307 | ||||
Ground transportation: 2.88% | ||||||
Canadian Pacific Kansas City Ltd. | 88,284 | 6,924,114 | ||||
Industrial conglomerates: 1.56% | ||||||
Honeywell International, Inc. | 19,516 | 3,761,319 | ||||
Machinery: 0.74% | ||||||
Caterpillar, Inc. | 5,364 | 1,794,634 | ||||
Trading companies & distributors: 3.83% | ||||||
AerCap Holdings NV† | 109,056 | 9,214,141 | ||||
Information technology: 8.84% | ||||||
IT services: 3.48% | ||||||
Accenture PLC Class A | 14,124 | 4,250,053 | ||||
International Business Machines Corp. | 24,775 | 4,117,605 | ||||
8,367,658 | ||||||
Semiconductors & semiconductor equipment: 2.53% | ||||||
NXP Semiconductors NV | 23,765 | 6,088,355 | ||||
Software: 2.83% | ||||||
Cadence Design Systems, Inc.† | 8,481 | 2,337,618 | ||||
Microsoft Corp. | 11,475 | 4,467,562 | ||||
6,805,180 | ||||||
Shares | Value | |||||
Materials: 4.86% | ||||||
Chemicals: 3.68% | ||||||
CF Industries Holdings, Inc. | 53,435 | $4,219,762 | ||||
Sherwin-Williams Co. | 15,464 | 4,633,169 | ||||
8,852,931 | ||||||
Construction materials: 1.18% | ||||||
Vulcan Materials Co. | 11,030 | 2,841,659 | ||||
Real estate: 5.50% | ||||||
Office REITs : 1.07% | ||||||
Boston Properties, Inc. | 41,719 | 2,581,989 | ||||
Real estate management & development: 2.93% | ||||||
CBRE Group, Inc. Class A† | 81,216 | 7,056,858 | ||||
Specialized REITs : 1.50% | ||||||
Public Storage | 13,885 | 3,602,463 | ||||
Utilities: 3.62% | ||||||
Electric utilities: 3.62% | ||||||
NextEra Energy, Inc. | 130,197 | 8,719,293 | ||||
Total common stocks (Cost $213,470,633) | 235,627,778 | |||||
Yield | ||||||
Short-term investments: 1.70% | ||||||
Investment companies: 1.70% | ||||||
Allspring Government Money Market Fund Select Class♠∞ | 5.23 % | 4,084,378 | 4,084,378 | |||
Total short-term investments (Cost $4,084,378) | 4,084,378 | |||||
Total investments in securities (Cost $217,555,011) | 99.61 % | 239,712,156 | ||||
Other assets and liabilities, net | 0.39 | 937,695 | ||||
Total net assets | 100.00 % | $240,649,851 | ||||
† | Non-income-earning security |
♠ | The issuer of the security is an affiliated person of the Portfolio as defined in the Investment Company Act of 1940. |
∞ | The rate represents the 7-day annualized yield at period end. |
Abbreviations: | |
ADR | American depositary receipt |
REIT | Real estate investment trust |
Value, beginning of period | Purchases | Sales proceeds | Net realized gains (losses) | Net change in unrealized gains (losses) | Value, end of period | Shares, end of period | Income from affiliated securities | |
Short-term investments | ||||||||
Allspring Government Money Market Fund Select Class | $5,079,661 | $86,166,904 | $(87,162,187 ) | $0 | $0 | $4,084,378 | 4,084,378 | $304,069 |
Assets | |
Investments in unaffiliated securities, at value (cost $213,470,633) | $235,627,778 |
Investments in affiliated securities, at value (cost $4,084,378) | 4,084,378 |
Cash | 18 |
Receivable for investments sold | 2,192,783 |
Receivable for dividends | 74,580 |
Total assets | 241,979,537 |
Liabilities | |
Payable for investments purchased | 1,199,415 |
Advisory fee payable | 106,863 |
Accrued expenses and other liabilities | 23,408 |
Total liabilities | 1,329,686 |
Total net assets | $240,649,851 |
Year Ended April 30, 20241 | Year Ended May 31, 2023 | |
Investment income | ||
Dividends (net of foreign withholdings taxes of $116,580 and $135,740, respectively) | $5,013,862 | $6,000,256 |
Income from affiliated securities | 304,069 | 188,085 |
Interest | 2,389 | 254 |
Total investment income | 5,320,320 | 6,188,595 |
Expenses | ||
Advisory fee | 1,529,553 | 1,827,068 |
Custody and accounting fees | 2,696 | 29,694 |
Professional fees | 58,845 | 62,168 |
Interest holder report expenses | 6,779 | 19,945 |
Trustees’ fees and expenses | 21,512 | 25,708 |
Other fees and expenses | 14,949 | 18,697 |
Total expenses | 1,634,334 | 1,983,280 |
Less: Fee waivers and/or expense reimbursements | (143,769 ) | (184,321 ) |
Net expenses | 1,490,565 | 1,798,959 |
Net investment income | 3,829,755 | 4,389,636 |
Realized and unrealized gains (losses) on investments | ||
Net realized gain (losses) on | ||
Unaffiliated securities | 60,108,077 | 24,842,175 |
Affiliated securities | 0 | (16 ) |
Foreign currency and foreign currency translations | (39 ) | 0 |
Net realized gains on investments | 60,108,038 | 24,842,159 |
Net change in unrealized gains (losses) on | ||
Unaffiliated securities | (17,635,151 ) | (41,838,078 ) |
Foreign currency and foreign currency translations | (14 ) | 0 |
Net change in unrealized gains (losses) on investments | (17,635,165 ) | (41,838,078 ) |
Net realized and unrealized gains (losses) on investments | 42,472,873 | (16,995,919 ) |
Net increase (decrease) in net assets resulting from operations | $46,302,628 | $(12,606,283 ) |
Year ended April 30, 20241 | Year ended May 31, 2023 | Year ended May 31, 2022 | ||||
Operations | ||||||
Net investment income | $3,829,755 | $4,389,636 | $4,228,372 | |||
Net realized gains on investments | 60,108,038 | 24,842,159 | 59,295,012 | |||
Net change in unrealized losses on investments | (17,635,165 ) | (41,838,078 ) | (67,362,442 ) | |||
Net increase (decrease) in net assets resulting from operations | 46,302,628 | (12,606,283 ) | (3,839,058 ) | |||
Capital transactions | ||||||
Transactions in investors’ beneficial interests | ||||||
Contributions | 8,601,975 | 9,137,304 | 20,407,586 | |||
Withdrawals | (67,469,900 ) | (76,376,645 ) | (94,906,626 ) | |||
Net decrease in net assets resulting from capital share transactions | (58,867,925 ) | (67,239,341 ) | (74,499,040 ) | |||
Total decrease in net assets | (12,565,297 ) | (79,845,624 ) | (78,338,098 ) | |||
Net assets | ||||||
Beginning of period | 253,215,148 | 333,060,772 | 411,398,870 | |||
End of period | $240,649,851 | $253,215,148 | $333,060,772 | |||
Year ended April 30 20241 | Year ended May 31 | |||||
2023 | 2022 | 2021 | 2020 | 2019 | ||
Total return2 | 19.77 % | (3.77 )% | (1.05 )% | 57.96 % | (3.40 )% | 1.80 % |
Ratios to average net assets (annualized) | ||||||
Gross expenses | 0.69 % | 0.71 % | 0.69 % | 0.68 % | 0.68 % | 0.67 % |
Net expenses3 | 0.63 % | 0.64 % | 0.64 % | 0.64 % | 0.64 % | 0.67 % |
Net investment income | 1.63 % | 1.56 % | 1.12 % | 1.16 % | 1.36 % | 1.27 % |
Supplemental Data | ||||||
Portfolio turnover rate | 98 % | 29 % | 32 % | 38 % | 33 % | 47 % |
1 | For the eleven months ended April 30, 2024. The Portfolio changed its fiscal year end from May 31 to April 30, effective April 30, 2024. |
2 | Returns for periods of less than one year are not annualized. |
3 | Net expense ratios reflect voluntary waivers, if any. |
Gross unrealized gains | $28,471,749 |
Gross unrealized losses | (7,371,157 ) |
Net unrealized gains | $21,100,592 |
Quoted prices (Level 1) | Other significant observable inputs (Level 2) | Significant unobservable inputs (Level 3) | Total | |
Assets | ||||
Investments in: | ||||
Common stocks | ||||
Communication services | $8,527,200 | $0 | $0 | $8,527,200 |
Consumer discretionary | 10,078,547 | 0 | 0 | 10,078,547 |
Consumer staples | 19,206,463 | 0 | 0 | 19,206,463 |
Energy | 18,794,031 | 0 | 0 | 18,794,031 |
Financials | 56,793,936 | 0 | 0 | 56,793,936 |
Health care | 31,976,373 | 0 | 0 | 31,976,373 |
Industrials | 35,334,842 | 0 | 0 | 35,334,842 |
Information technology | 21,261,193 | 0 | 0 | 21,261,193 |
Materials | 11,694,590 | 0 | 0 | 11,694,590 |
Real estate | 13,241,310 | 0 | 0 | 13,241,310 |
Utilities | 8,719,293 | 0 | 0 | 8,719,293 |
Short-term investments | ||||
Investment companies | 4,084,378 | 0 | 0 | 4,084,378 |
Total assets | $239,712,156 | $0 | $0 | $239,712,156 |
Average daily net assets | Advisory fee |
First $500 million | 0.650 % |
Next $500 million | 0.625 |
Next $1 billion | 0.600 |
Next $2 billion | 0.575 |
Next $4 billion | 0.550 |
Next $4 billion | 0.525 |
Next $4 billion | 0.500 |
Over $16 billion | 0.475 |
Allspring Master Trust:
April 30, 2024.
Name and year of birth | Position held and length of service** | Principal occupations during past five years or longer | Current other public company or investment company directorships |
William R. Ebsworth (Born 1957) | Trustee, since 2015 | Retired. From 1984 to 2013, equities analyst, portfolio manager, research director and chief investment officer at Fidelity Management and Research Company in Boston, Tokyo, and Hong Kong, and retired in 2013 as Chief Investment Officer of Fidelity Strategic Advisers, Inc. where he led a team of investment professionals managing client assets. Prior thereto, Board member of Hong Kong Securities Clearing Co., Hong Kong Options Clearing Corp., the Thailand International Fund, Ltd., Fidelity Investments Life Insurance Company, and Empire Fidelity Investments Life Insurance Company. Serves on the Investment Company Institute’s Board of Governors since 2022 and Executive Committee since 2023 as well as the Vice Chairman of the Governing Council of the Independent Directors Council since 2023. Audit Committee Chair and Investment Committee Chair of the Vincent Memorial Hospital Foundation (non-profit organization). Mr. Ebsworth is a CFA charterholder. | N/A |
Jane A. Freeman (Born 1953) | Trustee, since 2015; Chair Liaison, since January 2018*** | Retired. From 2012 to 2014 and 1999 to 2008, Chief Financial Officer of Scientific Learning Corporation. From 2008 to 2012, Ms. Freeman provided consulting services related to strategic business projects. Prior to 1999, Portfolio Manager at Rockefeller & Co. and Scudder, Stevens & Clark. Board member of the Harding Loevner Funds from 1996 to 2014, serving as both Lead Independent Director and chair of the Audit Committee. Board member of the Russell Exchange Traded Funds Trust from 2011 to 2012 and the chair of the Audit Committee. Ms. Freeman is also an inactive Chartered Financial Analyst. | N/A |
Isaiah Harris, Jr. (Born 1952) | Trustee, since 2009; Audit Committee Chair, since 2019 | Retired. Member of the Advisory Board of CEF of East Central Florida. Chairman of the Board of CIGNA Corporation from 2009 to 2021, and Director from 2005 to 2008. From 2003 to 2011, Director of Deluxe Corporation. Prior thereto, President and CEO of BellSouth Advertising and Publishing Corp. from 2005 to 2007, President and CEO of BellSouth Enterprises from 2004 to 2005 and President of BellSouth Consumer Services from 2000 to 2003. Emeritus member of the Iowa State University Foundation Board of Governors. Emeritus Member of the Advisory board of Iowa State University School of Business. Advisory Board Member, Palm Harbor Academy (private school). Advisory Board Member, Fellowship of Christian Athletes. Mr. Harris is a certified public accountant (inactive status). | N/A |
David F. Larcker (Born 1950) | Trustee, since 2009 | Distinguished Visiting Fellow at the Hoover Institution since 2022. James Irvin Miller Professor of Accounting at the Graduate School of Business (Emeritus), Stanford University, Director of the Corporate Governance Research Initiative and Senior Faculty of The Rock Center for Corporate Governance since 2006. From 2005 to 2008, Professor of Accounting at the Graduate School of Business, Stanford University. Prior thereto, Ernst & Young Professor of Accounting at The Wharton School, University of Pennsylvania from 1985 to 2005. | N/A |
Olivia S. Mitchell (Born 1953) | Trustee, since 2006 | International Foundation of Employee Benefit Plans Professor since 1993, Wharton School of the University of Pennsylvania. Director of Wharton’s Pension Research Council and Boettner Center on Pensions & Retirement Research, and Research Associate at the National Bureau of Economic Research. Previously taught at Cornell University from 1978 to 1993. | N/A |
Timothy J. Penny (Born 1951) | Trustee, since 1996; Chair, since 2018 | President and Chief Executive Officer of Southern Minnesota Initiative Foundation, a non-profit organization, since 2007. Vice Chair of the Economic Club of Minnesota, since 2007. Co-Chair of the Committee for a Responsible Federal Budget, since 1995. Member of the Board of Trustees of NorthStar Education Finance, Inc., a non-profit organization, from 2007-2022. Senior Fellow of the University of Minnesota Humphrey Institute from 1995 to 2017. | N/A |
Name and year of birth | Position held and length of service** | Principal occupations during past five years or longer | Current other public company or investment company directorships |
James G. Polisson (Born 1959) | Trustee, since 2018; Nominating and Governance Committee Chair, since 2024 | Retired. Chief Marketing Officer, Source (ETF) UK Services, Ltd, from 2015 to 2017. From 2012 to 2015, Principal of The Polisson Group, LLC, a management consulting, corporate advisory and principal investing company. Chief Executive Officer and Managing Director at Russell Investments, Global Exchange Traded Funds from 2010 to 2012. Managing Director of Barclays Global Investors from 1998 to 2010 and Global Chief Marketing Officer for iShares and Barclays Global Investors from 2000 to 2010. Trustee of the San Francisco Mechanics’ Institute, a non- profit organization, from 2013 to 2015. Board member of the Russell Exchange Traded Fund Trust from 2011 to 2012. Director of Barclays Global Investors Holdings Deutschland GmbH from 2006 to 2009. Mr. Polisson is an attorney and has a retired status with the Massachusetts and District of Columbia Bar Associations. | N/A |
Pamela Wheelock (Born 1959) | Trustee, since January 2020; previously Trustee from January 2018 to July 2019*** | Retired. Executive and Senior Financial leadership positions in the public, private and nonprofit sectors. Interim President and CEO, McKnight Foundation, 2020. Interim Commissioner, Minnesota Department of Human Services, 2019. Chief Operating Officer, Twin Cities Habitat for Humanity, 2017-2019. Vice President for University Services, University of Minnesota, 2012- 2016. Interim President and CEO, Blue Cross and Blue Shield of Minnesota, 2011-2012. Executive Vice-President and Chief Financial Officer, Minnesota Wild, 2002-2008. Commissioner, Minnesota Department of Finance, 1999-2002. Chair of the Board of Directors of Destination Medical Center Corporation. Board member of the Minnesota Wild Foundation. | N/A |
Name and year of birth | Position held and length of service | Principal occupations during past five years or longer |
Andrew Owen (Born 1960) | President, since 2017 | President and Chief Executive Officer of Allspring Funds Management, LLC since 2017 and Head of Global Fund Governance of Allspring Global Investments since 2022. Prior thereto, co-president of Galliard Capital Management, LLC, an affiliate of Allspring Funds Management, LLC, from 2019 to 2022 and Head of Affiliated Managers, Allspring Global Investments, from 2014 to 2019 and Executive Vice President responsible for marketing, investments and product development for Allspring Funds Management, LLC, from 2009 to 2014. |
Jeremy DePalma (Born 1974) | Treasurer, since 2012 (for certain funds in the Fund Complex); since 2021 (for the remaining funds in the Complex) | Senior Vice President of Allspring Funds Management, LLC since 2009. Senior Vice President of Evergreen Investment Management Company, LLC from 2008 to 2010 and head of the Fund Reporting and Control Team within Fund Administration from 2005 to 2010. |
Christopher Baker (Born 1976) | Chief Compliance Officer, since 2022 | Global Chief Compliance Officer for Allspring Global Investments since 2022. Prior thereto, Chief Compliance Officer for State Street Global Advisors from 2018 to 2021. Senior Compliance Officer for the State Street divisions of Alternative Investment Solutions, Sector Solutions, and Global Marketing from 2015 to 2018. From 2010 to 2015 Vice President, Global Head of Investment and Marketing Compliance for State Street Global Advisors. |
Matthew Prasse (Born 1983) | Chief Legal Officer, since 2022; Secretary, since 2021 | Senior Counsel of the Allspring Legal Department since 2021. Senior Counsel of the Wells Fargo Legal Department from 2018 to 2021. Previously, Counsel for Barings LLC from 2015 to 2018. Prior to joining Barings, Associate at Morgan, Lewis & Bockius LLP from 2008 to 2015. |
P.O. Box 219967
Kansas City, MO 64121-9967

AR1863 04-24
2 | |
6 | |
10 | |
11 | |
12 | |
13 | |
15 | |
16 | |
21 | |
25 | |
26 | |
41 | |
42 | |
43 | |
44 | |
45 | |
53 |

Allspring Funds

President
Allspring Funds
Notice to Shareholders |
Beginning in July 2024, the Fund will be required by the Securities and Exchange Commission to send shareholders a paper copy of a new tailored shareholder report in place of the full shareholder report that you are now receiving. The tailored shareholder report will contain concise information about the Fund, including certain expense and performance information and fund statistics. If you wish to receive this new tailored shareholder report electronically, please follow the instructions on the back cover of this report. |
Other information that is currently included in the shareholder report, such as the Fund’s financial statements, will be available online and upon request, free of charge, in paper or electronic format. |
Investment objective | The Fund seeks returns that exceed the rate of inflation over the long-term. |
Manager | Allspring Funds Management, LLC |
Subadvisers for the affiliated master portfolio* | Allspring Global Investments, LLC Allspring Global Investments (UK) Limited† |
Portfolio managers | Rushabh Amin††, Petros N. Bocray, CFA, FRM, Travis L. Keshemberg, CFA, CIPM, FRM, Matthias Scheiber, CFA†† |
Average annual total returns (%) as of April 30, 2024 | |||||||||
Including sales charge | Excluding sales charge | Expense ratios1 (%) | |||||||
Inception date | 1 year | 5 year | 10 year | 1 year | 5 year | 10 year | Gross | Net2 | |
Class A (IPBAX) | 2-28-2003 | -4.31 | 1.61 | 1.81 | 0.20 | 2.55 | 2.28 | 1.08 | 0.77 |
Class C (IPBCX) | 2-28-2003 | -1.54 | 1.79 | 1.67 | -0.54 | 1.79 | 1.67 | 1.83 | 1.52 |
Class R6 (IPBJX)3 | 10-31-2016 | – | – | – | 0.54 | 2.94 | 2.64 | 0.71 | 0.40 |
Administrator Class (IPBIX) | 2-28-2003 | – | – | – | 0.33 | 2.74 | 2.49 | 1.03 | 0.60 |
Institutional Class (IPBNX)4 | 10-31-2016 | – | – | – | 0.49 | 2.89 | 2.60 | 0.76 | 0.45 |
Russell 3000® Index5 | – | – | – | – | 22.30 | 12.43 | 11.81 | – | – |
Bloomberg U.S. Aggregate Bond Index6 | – | – | – | – | -1.47 | -0.16 | 1.20 | – | – |
Real Return Blended Index7 | – | – | – | – | 2.66 | 2.89 | 2.31 | – | – |
Russell 1000® Index8 | – | – | – | – | 22.82 | 12.87 | 12.14 | – | – |
Bloomberg U.S. TIPS Index9 | – | – | – | – | -1.35 | 2.07 | 1.90 | – | – |
1 | Reflects the expense ratios as stated in the most recent prospectuses. The expense ratios shown are subject to change and may differ from the annualized expense ratios shown in the Financial Highlights of this report. |
2 | The manager has contractually committed through September 30, 2025, to waive fees and/or reimburse expenses to the extent necessary to cap total annual fund operating expenses after fee waivers at 0.77% for Class A, 1.52% for Class C, 0.40% for Class R6, 0.60% for Administrator Class and 0.45% for Institutional Class. Brokerage commissions, stamp duty fees, interest, taxes, acquired fund fees and expenses (if any) from funds in which the underlying affiliated master portfolios and funds invest and from money market funds, and extraordinary expenses are excluded from the expense caps. All other acquired fund fees and expenses from the affiliated master portfolios and funds are included in the expense caps. Prior to or after the commitment expiration date, the caps may be increased or the commitment to maintain the caps may be terminated only with the approval of the Board of Trustees. Without these caps, the Fund’s returns would have been lower. The expense ratio paid by an investor is the net expense ratio (the total annual fund operating expenses after fee waivers) as stated in the prospectuses. |
3 | Historical performance shown for the Class R6 shares prior to their inception reflects the performance of the Administrator Class shares, and is not adjusted to reflect the Class R6 expenses. If these expenses had been included, returns for the Class R6 shares would be higher. |
4 | Historical performance shown for the Institutional Class shares prior to their inception reflects the performance of the Administrator Class shares, and includes the higher expenses applicable to the Administrator Class shares. If these expenses had not been included, returns for the Institutional Class shares would be higher. |
5 | The Russell 3000® Index measures the performance of the 3,000 largest U.S. companies based on total market capitalization, which represents approximately 98% of the investable U.S. equity market. You cannot invest directly in an index. |
* | The Fund is a feeder fund in a master-feeder structure that invests substantially all of its assets in a single affiliated master portfolio of the Allspring Master Trust with a substantially identical investment objective and substantially similar investment strategies. References to the investment activities of the Fund are intended to refer to the investment activities of the affiliated master portfolio in which it invests. |
† | Allspring Global Investments (UK) Limited became a subadviser effective December 1, 2023. |
†† | Mr. Amin and Mr. Scheiber became portfolio managers of the Fund on December 1, 2023. |
CFA® and Chartered Financial Analyst® are trademarks owned by CFA Institute. | |
Growth of $10,000 investment as of April 30, 20241 |
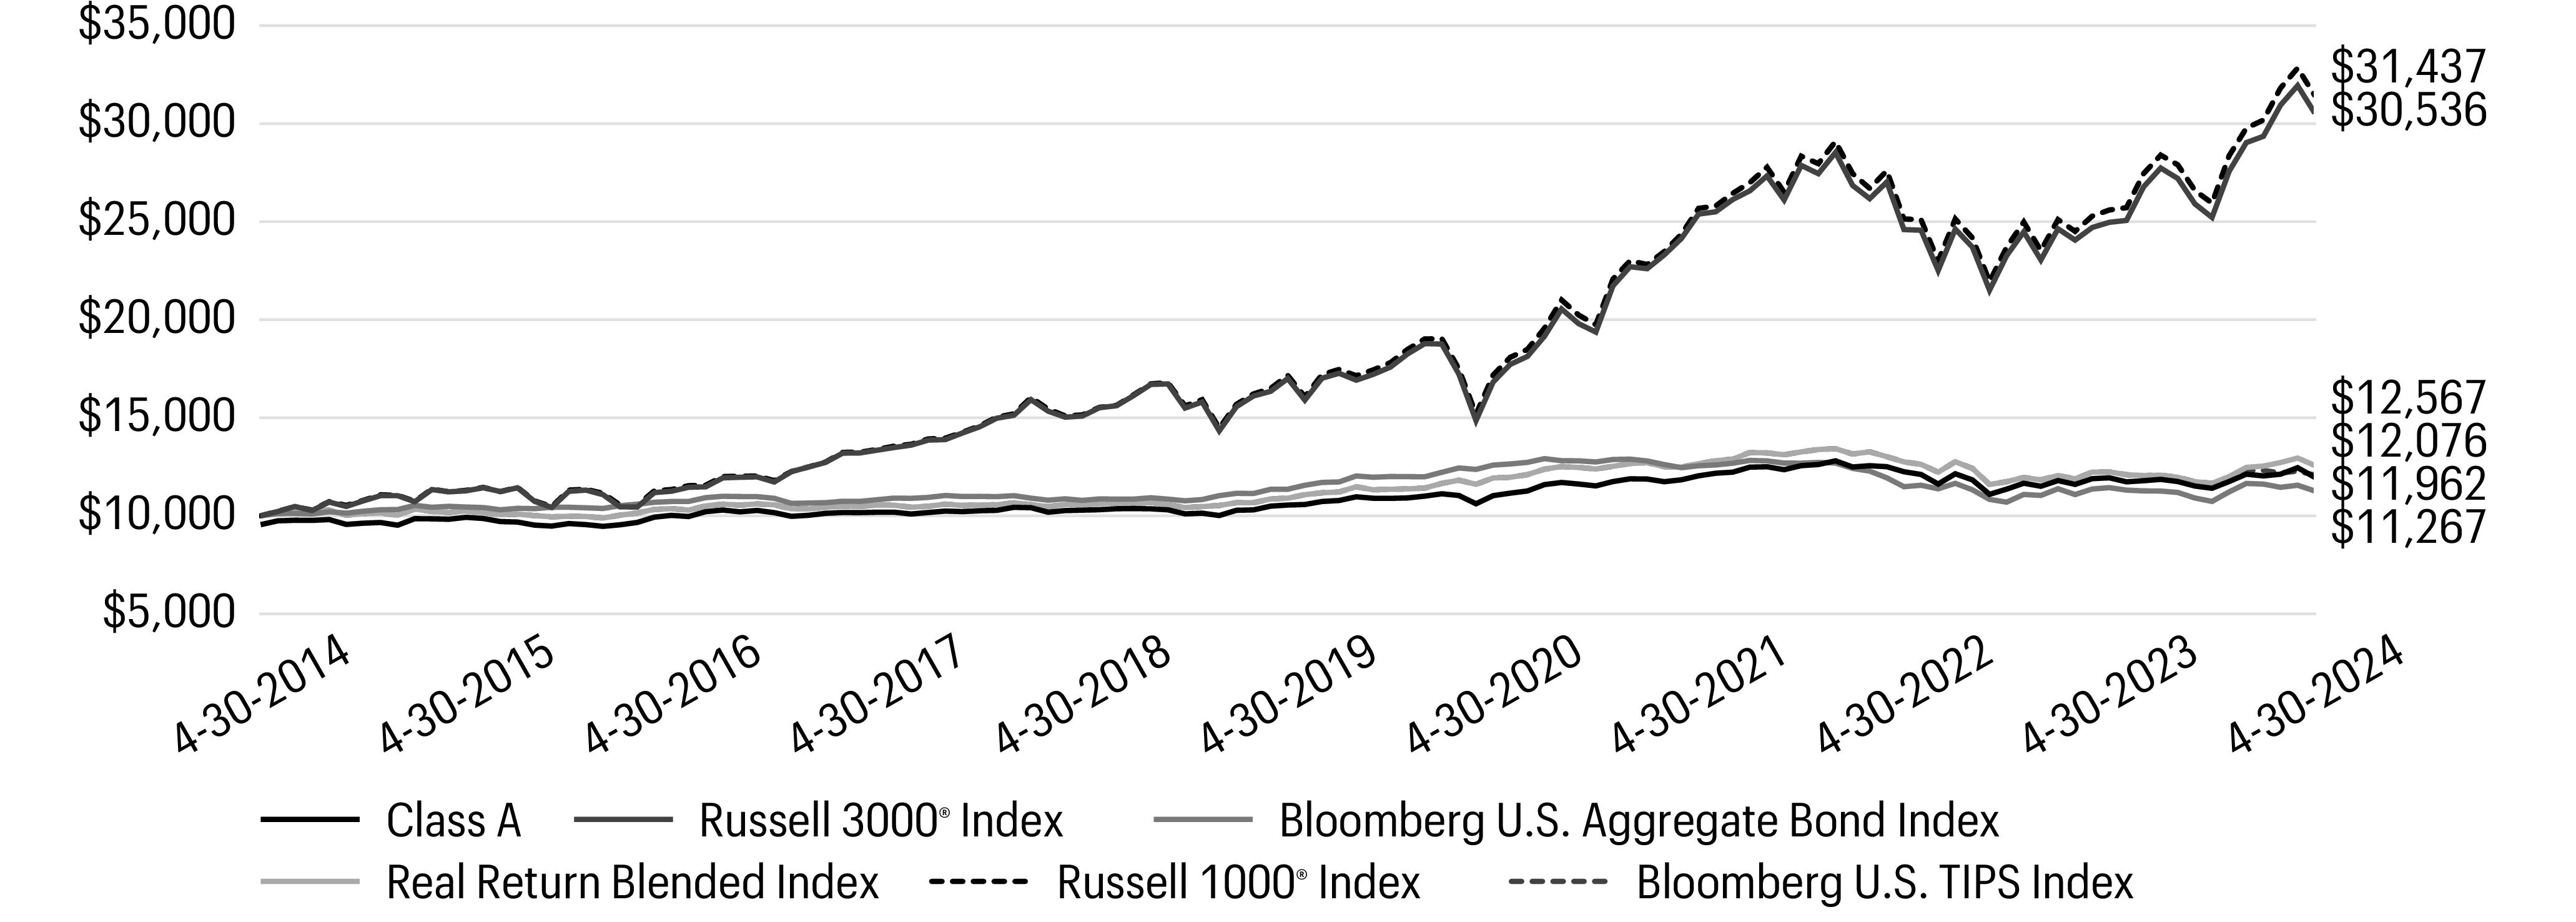
1 | The chart compares the performance of Class A shares for the most recent ten years with the Russell 3000® Index, Bloomberg U.S. Aggregate Bond Index, Real Return Blended Index, Russell 1000® Index and Bloomberg U.S. TIPS Index. The chart assumes a hypothetical investment of $10,000 in Class A shares and reflects all operating expenses and assumes the maximum initial sales charge of 4.50%. |
Footnotes continued from previous page | |
6 | The Bloomberg U.S. Aggregate Bond Index is a broad-based benchmark that measures the investment-grade, U.S.–dollar–denominated, fixed-rate taxable bond market, including Treasuries, government-related and corporate securities, mortgage-backed securities (agency fixed-rate and hybrid adjustable-rate mortgage pass-throughs), asset-backed securities, and commercial mortgage-backed securities. You cannot invest directly in an index. |
7 | Source: Allspring Funds Management, LLC. The Real Return Blended Index is composed 40% of the Russell 1000® Index, 35% of the Bloomberg U.S. Treasury Inflation Protected Securities (TIPS) Index and 25% of the Bloomberg U.S. Aggregate Bond Index. You cannot invest directly in an index. |
8 | The Russell 1000® Index measures the performance of the 1,000 largest companies in the Russell 3000® Index, which represents approximately 92% of the total market capitalization of the Russell 3000® Index. You cannot invest directly in an index. |
9 | The Bloomberg U.S. Treasury Inflation-Protected Securities (TIPS) Index is an index of inflation-indexed-linked U.S. Treasury securities. You cannot invest directly in an index. |
Ten largest holdings (%) as of April 30, 20241 | |
TIPS, 0.13%, 4-15-2026 | 2.01 |
TIPS, 0.13%, 1-15-2030 | 1.88 |
TIPS, 1.38%, 7-15-2033 | 1.80 |
TIPS, 1.63%, 10-15-2027 | 1.77 |
TIPS, 0.13%, 7-15-2026 | 1.76 |
TIPS, 0.13%, 7-15-2030 | 1.69 |
TIPS, 0.63%, 1-15-2026 | 1.66 |
TIPS, 0.88%, 1-15-2029 | 1.16 |
TIPS, 0.25%, 7-15-2029 | 0.90 |
TIPS, 2.00%, 1-15-2026 | 0.86 |
1 | Each holding represents the Fund’s allocable portion of the affiliated master portfolio security. Figures represent each holding as a percentage of the Fund’s net assets. Holdings are subject to change and may have changed since the date specified. |
Portfolio allocation as of April 30, 20241 |
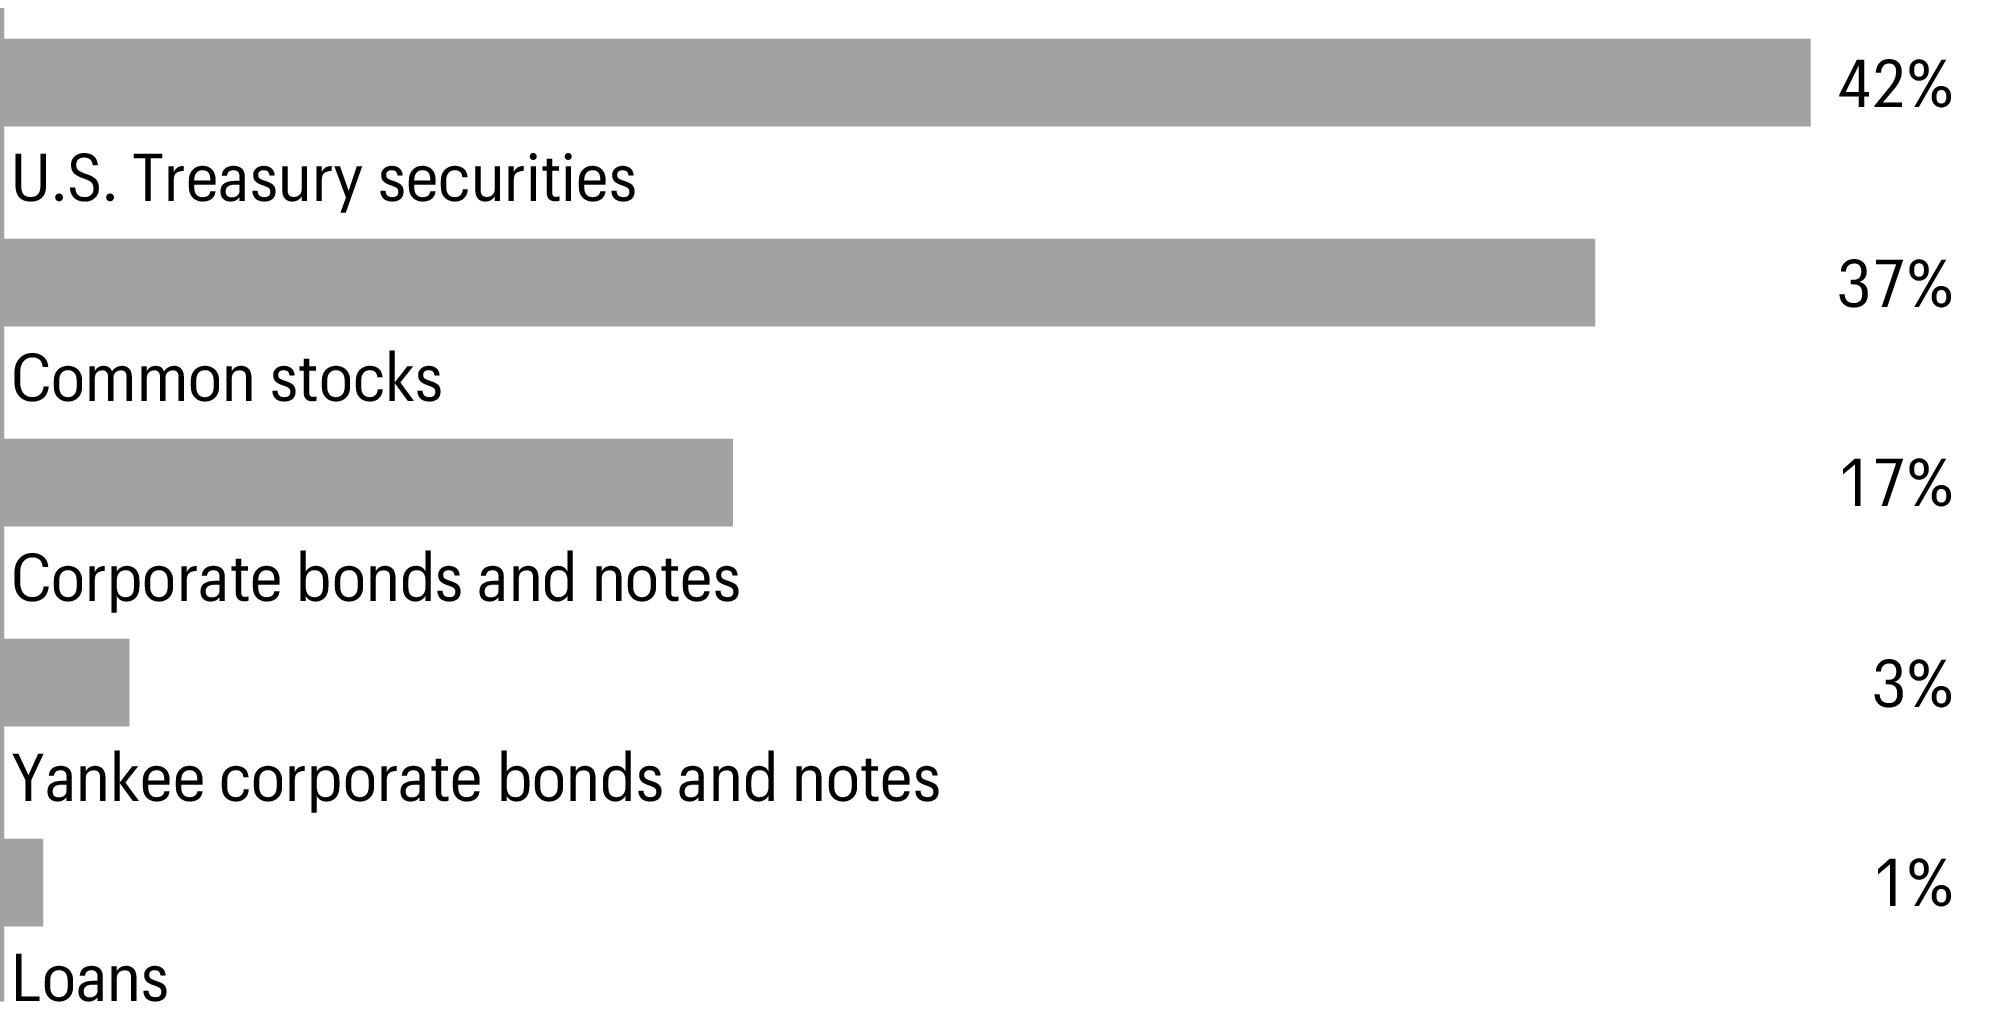
1 | Figures represent the portfolio allocation of the affiliated master portfolio as a percentage of the long-term investments of the affiliated master portfolio. Allocations are subject to change and may have changed since the date specified. |
Beginning account value 11-1-2023 | Ending account value 4-30-2024 | Expenses paid during the period1, 2 | Annualized net expense ratio2 | |
Class A | ||||
Actual | $1,000.00 | $1,048.87 | $3.82 | 0.75 % |
Hypothetical (5% return before expenses) | $1,000.00 | $1,021.13 | $3.77 | 0.75 % |
Class C | ||||
Actual | $1,000.00 | $1,045.35 | $7.73 | 1.52 % |
Hypothetical (5% return before expenses) | $1,000.00 | $1,017.31 | $7.62 | 1.52 % |
Class R6 | ||||
Actual | $1,000.00 | $1,050.94 | $2.04 | 0.40 % |
Hypothetical (5% return before expenses) | $1,000.00 | $1,022.87 | $2.01 | 0.40 % |
Administrator Class | ||||
Actual | $1,000.00 | $1,049.01 | $3.06 | 0.60 % |
Hypothetical (5% return before expenses) | $1,000.00 | $1,021.88 | $3.02 | 0.60 % |
Institutional Class | ||||
Actual | $1,000.00 | $1,050.71 | $2.29 | 0.45 % |
Hypothetical (5% return before expenses) | $1,000.00 | $1,022.63 | $2.26 | 0.45 % |
1 | Expenses paid is equal to the annualized net expense ratio of each class multiplied by the average account value over the period, multiplied by 182 divided by 366 (to reflect the one-half-year period). |
2 | Amounts reflect net expenses allocated from the affiliated Master Portfolio in which the Fund invests. |
Value | ||||||
Investment companies: 99.99% | ||||||
Affiliated master portfolio: 99.99% | ||||||
Allspring Real Return Portfolio | $72,785,721 | |||||
Total investment companies (Cost $73,898,535) | 72,785,721 | |||||
Total investments in securities (Cost $73,898,535) | 99.99 % | 72,785,721 | ||||
Other assets and liabilities, net | 0.01 | 8,650 | ||||
Total net assets | 100.00 % | $72,794,371 | ||||
% of ownership, beginning of period | % of ownership, end of period | Net realized gains (losses) on investments allocated from affiliated Master Portfolio | Net change in unrealized gains (losses) on investments allocated from affiliated Master Portfolio | Interest allocated from affiliated Master Portfolio | Dividends allocated from affiliated Master Portfolio | Affiliated Income Allocated from affiliated Master Portfolio | Value, end of period | |
Allspring Real Return Portfolio | 37.67 % | 30.54 % | $(3,789,090 ) | $3,101,127 | $1,944,147 | $225,036 | $656,547 | $72,785,721 |
Assets | |
Investments in affiliated Master Portfolio, at value (cost $73,898,535) | $72,785,721 |
Receivable for Fund shares sold | 42,556 |
Receivable from manager | 28,840 |
Prepaid expenses and other assets | 78,593 |
Total assets | 72,935,710 |
Liabilities | |
Payable for Fund shares redeemed | 118,636 |
Shareholder report expenses payable | 8,903 |
Professional fees payable | 7,920 |
Administration fees payable | 4,340 |
Distribution fee payable | 418 |
Accrued expenses and other liabilities | 1,122 |
Total liabilities | 141,339 |
Total net assets | $72,794,371 |
Net assets consist of | |
Paid-in capital | $78,803,819 |
Total distributable loss | (6,009,448 ) |
Total net assets | $72,794,371 |
Computation of net asset value and offering price per share | |
Net assets–Class A | $11,591,998 |
Shares outstanding–Class A1 | 1,220,092 |
Net asset value per share–Class A | $9.50 |
Maximum offering price per share – Class A2 | $9.95 |
Net assets–Class C | $668,322 |
Shares outstanding–Class C1 | 71,802 |
Net asset value per share–Class C | $9.31 |
Net assets–Class R6 | $31,768,421 |
Shares outstanding–Class R61 | 3,301,499 |
Net asset value per share–Class R6 | $9.62 |
Net assets–Administrator Class | $7,347,174 |
Shares outstanding–Administrator Class1 | 755,594 |
Net asset value per share–Administrator Class | $9.72 |
Net assets–Institutional Class | $21,418,456 |
Shares outstanding–Institutional Class1 | 2,226,950 |
Net asset value per share–Institutional Class | $9.62 |
Year Ended April 30, 20241 | Year Ended May 31, 2023 | |
Investment income | ||
Interest allocated from affiliated Master Portfolio | $1,944,147 | $3,684,700 |
Affiliated income allocated from affiliated Master Portfolio | 656,547 | 26,614 |
Dividends allocated from affiliated Master Portfolio (net of foreign withholding taxes of $2,879 and $4,059, respectively) | 225,036 | 284,403 |
Expenses allocated from affiliated Master Portfolio | (310,725 ) | (400,943 ) |
Waivers allocated from affiliated Master Portfolio | 48,067 | 83,606 |
Total investment income | 2,563,072 | 3,678,380 |
Expenses | ||
Management fee | 33,777 | 40,736 |
Administration fees | ||
Class A | 16,653 | 24,441 |
Class C | 1,250 | 2,525 |
Class R6 | 6,893 | 3,739 |
Administrator Class | 8,915 | 14,170 |
Institutional Class | 19,042 | 30,386 |
Shareholder servicing fees | ||
Class A | 27,585 | 38,189 |
Class C | 2,059 | 3,945 |
Administrator Class | 21,447 | 34,344 |
Distribution fee | ||
Class C | 6,168 | 11,834 |
Custody and accounting fees | 1,610 | 3,858 |
Professional fees | 57,169 | 51,170 |
Registration fees | 68,377 | 74,500 |
Shareholder report expenses | 31,609 | 35,425 |
Trustees’ fees and expenses | 21,778 | 22,896 |
Other fees and expenses | 11,932 | 6,558 |
Total expenses | 336,264 | 398,716 |
Less: Fee waivers and/or expense reimbursements | ||
Fund-level | (229,671 ) | (251,381 ) |
Class A | (2,635 ) | (174 ) |
Class R6 | (6,069 ) | 0 |
Year Ended April 30, 20241 | Year Ended May 31, 2023 | |
Administrator Class | (10,255 ) | (15,591 ) |
Institutional Class | (1,423 ) | 0 |
Net expenses | 86,211 | 131,570 |
Net investment income | 2,476,861 | 3,546,810 |
Realized and unrealized gains (losses) on investments | ||
Net realized losses on investments allocated from affiliated Master Portfolio | (3,789,090 ) | (569,850 ) |
Net change in unrealized gains (losses) on investments allocated from affiliated Master Portfolio | 3,101,127 | (5,808,663 ) |
Net realized and unrealized gains (losses) on investments | (687,963 ) | (6,378,513 ) |
Net increase (decrease) in net assets resulting from operations | $1,788,898 | $(2,831,703 ) |
Year ended April 30, 20241 | Year ended May 31, 2023 | Year ended May 31, 2022 | ||||
Operations | ||||||
Net investment income | $2,476,861 | $3,546,810 | $4,090,448 | |||
Net realized gains (losses) on investments | (3,789,090 ) | (569,850 ) | 935,582 | |||
Net change in unrealized gains (losses) on investments | 3,101,127 | (5,808,663 ) | (6,398,528 ) | |||
Net increase (decrease) in net assets resulting from operations | 1,788,898 | (2,831,703 ) | (1,372,498 ) | |||
Distributions to shareholders from | ||||||
Net investment income and net realized gains | ||||||
Class A | (360,454 ) | (686,543 ) | (836,596 ) | |||
Class C | (21,838 ) | (58,742 ) | (65,210 ) | |||
Class R6 | (757,028 ) | (631,554 ) | (755,640 ) | |||
Administrator Class | (292,876 ) | (629,068 ) | (640,606 ) | |||
Institutional Class | (857,539 ) | (1,775,616 ) | (1,520,901 ) | |||
Total distributions to shareholders | (2,289,735 ) | (3,781,523 ) | (3,818,953 ) | |||
Capital share transactions | Shares | Shares | Shares | |||
Proceeds from shares sold | ||||||
Class A | 222,156 | 2,127,669 | 216,818 | 2,123,638 | 791,258 | 8,668,328 |
Class C | 2,635 | 24,955 | 20,544 | 198,706 | 91,579 | 986,457 |
Class R6 | 2,434,075 | 23,246,263 | 737,592 | 7,332,284 | 486,424 | 5,304,807 |
Administrator Class | 150,145 | 1,450,621 | 314,479 | 3,161,931 | 894,909 | 9,920,837 |
Institutional Class | 419,214 | 4,043,367 | 1,603,544 | 15,812,126 | 4,023,778 | 44,177,808 |
30,892,875 | 28,628,685 | 69,058,237 | ||||
Reinvestment of distributions | ||||||
Class A | 29,681 | 282,160 | 58,661 | 574,829 | 63,937 | 691,464 |
Class C | 2,345 | 21,838 | 6,058 | 58,298 | 6,087 | 64,531 |
Class R6 | 78,526 | 757,028 | 63,670 | 631,451 | 60,586 | 663,004 |
Administrator Class | 28,851 | 280,636 | 60,525 | 604,578 | 55,532 | 610,960 |
Institutional Class | 89,105 | 857,512 | 179,364 | 1,775,461 | 139,813 | 1,520,105 |
2,199,174 | 3,644,617 | 3,550,064 | ||||
Payment for shares redeemed | ||||||
Class A | (371,423 ) | (3,528,531 ) | (646,932 ) | (6,291,558 ) | (408,579 ) | (4,414,389 ) |
Class C | (79,810 ) | (742,540 ) | (48,172 ) | (457,734 ) | (40,714 ) | (429,356 ) |
Class R6 | (836,809 ) | (8,044,771 ) | (539,506 ) | (5,392,372 ) | (2,460,305 ) | (27,125,717 ) |
Administrator Class | (772,215 ) | (7,491,678 ) | (472,903 ) | (4,663,703 ) | (691,012 ) | (7,672,910 ) |
Institutional Class | (2,041,785 ) | (19,779,739 ) | (2,205,751 ) | (21,830,616 ) | (956,389 ) | (10,220,364 ) |
(39,587,259 ) | (38,635,983 ) | (49,862,736 ) | ||||
Net increase (decrease) in net assets resulting from capital share transactions | (6,495,210 ) | (6,362,681 ) | 22,745,565 | |||
Total increase (decrease) in net assets | (6,996,047 ) | (12,975,907 ) | 17,554,114 | |||
Net assets | ||||||
Beginning of period | 79,790,418 | 92,766,325 | 75,212,211 | |||
End of period | $72,794,371 | $79,790,418 | $92,766,325 | |||
Year ended April 30 20241 | Year ended May 31 | |||||
Class A | 2023 | 2022 | 2021 | 2020 | 2019 | |
Net asset value, beginning of period | $9.60 | $10.35 | $10.93 | $10.22 | $9.89 | $9.87 |
Net investment income | 0.30 2 | 0.40 2 | 0.56 2 | 0.22 | 0.12 | 0.15 |
Net realized and unrealized gains (losses) on investments | (0.12 ) | (0.72 ) | (0.60 ) | 0.70 | 0.42 | 0.09 |
Total from investment operations | 0.18 | (0.32 ) | (0.04 ) | 0.92 | 0.54 | 0.24 |
Distributions to shareholders from | ||||||
Net investment income | (0.28 ) | (0.43 ) | (0.54 ) | (0.21 ) | (0.21 ) | (0.19 ) |
Net realized gains | 0.00 | 0.00 | 0.00 | 0.00 | 0.00 | (0.03 ) |
Total distributions to shareholders | (0.28 ) | (0.43 ) | (0.54 ) | (0.21 ) | (0.21 ) | (0.22 ) |
Net asset value, end of period | $9.50 | $9.60 | $10.35 | $10.93 | $10.22 | $9.89 |
Total return3 | 1.95 % | (3.10 )% | (0.52 )% | 9.10 % | 5.48 % | 2.56 % |
Ratios to average net assets (annualized)* | ||||||
Gross expenses | 1.12 % | 1.09 % | 1.07 % | 1.29 % | 1.43 % | 1.16 % |
Net expenses | 0.76 % | 0.78 % | 0.78 % | 0.78 % | 0.78 % | 0.77 % |
Net investment income | 3.45 % | 4.12 % | 5.13 % | 2.09 % | 1.79 % | 1.95 % |
Supplemental data | ||||||
Portfolio turnover rate4 | 47 % | 22 % | 31 % | 20 % | 24 % | 39 % |
Net assets, end of period (000s omitted) | $11,592 | $12,861 | $17,713 | $13,825 | $13,196 | $17,716 |
* | Ratios include net expenses allocated from the affiliated Master Portfolio which were as follows: |
Year ended April 30, 20241 | 0.39% |
Year ended May 31, 2023 | 0.39% |
Year ended May 31, 2022 | 0.39% |
Year ended May 31, 2021 | 0.39% |
Year ended May 31, 2020 | 0.39% |
Year ended May 31, 2019 | 0.39% |
1 | For the eleven months ended April 30, 2024. The Fund changed its fiscal year end from May 31 to April 30, effective April 30, 2024. |
2 | Calculated based upon average shares outstanding |
3 | Total return calculations do not include any sales charges. Returns for periods of less than one year are not annualized. |
4 | Portfolio turnover rate is calculated by multiplying the affiliated Master Portfolio’s percentage of the Fund’s total investment in securities at the end of the period by the affiliated Master Portfolio’s portfolio turnover rate. |
Year ended April 30 20241 | Year ended May 31 | |||||
Class C | 2023 | 2022 | 2021 | 2020 | 2019 | |
Net asset value, beginning of period | $9.41 | $10.16 | $10.74 | $10.06 | $9.73 | $9.73 |
Net investment income | 0.24 2 | 0.32 2 | 0.47 2 | 0.12 2 | 0.11 2 | 0.10 2 |
Net realized and unrealized gains (losses) on investments | (0.12 ) | (0.71 ) | (0.59 ) | 0.71 | 0.35 | 0.07 |
Total from investment operations | 0.12 | (0.39 ) | (0.12 ) | 0.83 | 0.46 | 0.17 |
Distributions to shareholders from | ||||||
Net investment income | (0.22 ) | (0.36 ) | (0.46 ) | (0.15 ) | (0.13 ) | (0.14 ) |
Net realized gains | 0.00 | 0.00 | 0.00 | 0.00 | 0.00 | (0.03 ) |
Total distributions to shareholders | (0.22 ) | (0.36 ) | (0.46 ) | (0.15 ) | (0.13 ) | (0.17 ) |
Net asset value, end of period | $9.31 | $9.41 | $10.16 | $10.74 | $10.06 | $9.73 |
Total return3 | 1.29 % | (3.89 )% | (1.26 )% | 8.27 % | 4.77 % | 1.79 % |
Ratios to average net assets (annualized)* | ||||||
Gross expenses | 1.86 % | 1.84 % | 1.81 % | 2.06 % | 2.18 % | 1.91 % |
Net expenses | 1.52 % | 1.53 % | 1.53 % | 1.53 % | 1.53 % | 1.52 % |
Net investment income | 2.81 % | 3.32 % | 4.42 % | 1.17 % | 1.09 % | 1.08 % |
Supplemental data | ||||||
Portfolio turnover rate4 | 47 % | 22 % | 31 % | 20 % | 24 % | 39 % |
Net assets, end of period (000s omitted) | $668 | $1,380 | $1,709 | $1,195 | $1,714 | $2,553 |
* | Ratios include net expenses allocated from the affiliated Master Portfolio which were as follows: |
Year ended April 30, 20241 | 0.39% |
Year ended May 31, 2023 | 0.39% |
Year ended May 31, 2022 | 0.39% |
Year ended May 31, 2021 | 0.39% |
Year ended May 31, 2020 | 0.39% |
Year ended May 31, 2019 | 0.39% |
1 | For the eleven months ended April 30, 2024. The Fund changed its fiscal year end from May 31 to April 30, effective April 30, 2024. |
2 | Calculated based upon average shares outstanding |
3 | Total return calculations do not include any sales charges. Returns for periods of less than one year are not annualized. |
4 | Portfolio turnover rate is calculated by multiplying the affiliated Master Portfolio’s percentage of the Fund’s total investment in securities at the end of the period by the affiliated Master Portfolio’s portfolio turnover rate. |
Year ended April 30 20241 | Year ended May 31 | |||||
Class R6 | 2023 | 2022 | 2021 | 2020 | 2019 | |
Net asset value, beginning of period | $9.72 | $10.47 | $11.05 | $10.33 | $9.99 | $9.96 |
Net investment income | 0.32 2 | 0.46 2 | 0.63 2 | 0.29 | 0.22 | 0.23 2 |
Net realized and unrealized gains (losses) on investments | (0.11 ) | (0.74 ) | (0.63 ) | 0.69 | 0.37 | 0.06 |
Total from investment operations | 0.21 | (0.28 ) | 0.00 | 0.98 | 0.59 | 0.29 |
Distributions to shareholders from | ||||||
Net investment income | (0.31 ) | (0.47 ) | (0.58 ) | (0.26 ) | (0.25 ) | (0.23 ) |
Net realized gains | 0.00 | 0.00 | 0.00 | 0.00 | 0.00 | (0.03 ) |
Total distributions to shareholders | (0.31 ) | (0.47 ) | (0.58 ) | (0.26 ) | (0.25 ) | (0.26 ) |
Net asset value, end of period | $9.62 | $9.72 | $10.47 | $11.05 | $10.33 | $9.99 |
Total return3 | 2.24 % | (2.68 )% | (0.15 )% | 9.52 % | 5.94 % | 2.99 % |
Ratios to average net assets (annualized)* | ||||||
Gross expenses | 0.77 % | 0.71 % | 0.68 % | 0.85 % | 1.05 % | 0.82 % |
Net expenses | 0.40 % | 0.40 % | 0.40 % | 0.40 % | 0.40 % | 0.39 % |
Net investment income | 3.67 % | 4.68 % | 5.68 % | 2.70 % | 2.08 % | 2.34 % |
Supplemental data | ||||||
Portfolio turnover rate4 | 47 % | 22 % | 31 % | 20 % | 24 % | 39 % |
Net assets, end of period (000s omitted) | $31,768 | $15,796 | $14,282 | $36,202 | $18,224 | $14,358 |
* | Ratios include net expenses allocated from the affiliated Master Portfolio which were as follows: |
Year ended April 30, 20241 | 0.39% |
Year ended May 31, 2023 | 0.39% |
Year ended May 31, 2022 | 0.39% |
Year ended May 31, 2021 | 0.39% |
Year ended May 31, 2020 | 0.39% |
Year ended May 31, 2019 | 0.39% |
1 | For the eleven months ended April 30, 2024. The Fund changed its fiscal year end from May 31 to April 30, effective April 30, 2024. |
2 | Calculated based upon average shares outstanding |
3 | Returns for periods of less than one year are not annualized. |
4 | Portfolio turnover rate is calculated by multiplying the affiliated Master Portfolio’s percentage of the Fund’s total investment in securities at the end of the period by the affiliated Master Portfolio’s portfolio turnover rate. |
Year ended April 30 20241 | Year ended May 31 | |||||
Administrator Class | 2023 | 2022 | 2021 | 2020 | 2019 | |
Net asset value, beginning of period | $9.81 | $10.55 | $11.12 | $10.38 | $10.03 | $9.99 |
Net investment income | 0.33 2 | 0.42 2 | 0.60 2 | 0.25 2 | 0.20 2 | 0.21 2 |
Net realized and unrealized gains (losses) on investments | (0.13 ) | (0.72 ) | (0.63 ) | 0.71 | 0.36 | 0.06 |
Total from investment operations | 0.20 | (0.30 ) | (0.03 ) | 0.96 | 0.56 | 0.27 |
Distributions to shareholders from | ||||||
Net investment income | (0.29 ) | (0.44 ) | (0.54 ) | (0.22 ) | (0.21 ) | (0.20 ) |
Net realized gains | 0.00 | 0.00 | 0.00 | 0.00 | 0.00 | (0.03 ) |
Total distributions to shareholders | (0.29 ) | (0.44 ) | (0.54 ) | (0.22 ) | (0.21 ) | (0.23 ) |
Net asset value, end of period | $9.72 | $9.81 | $10.55 | $11.12 | $10.38 | $10.03 |
Total return3 | 2.04 % | (2.87 )% | (0.36 )% | 9.31 % | 5.67 % | 2.78 % |
Ratios to average net assets (annualized)* | ||||||
Gross expenses | 1.06 % | 1.02 % | 0.99 % | 1.23 % | 1.37 % | 1.10 % |
Net expenses | 0.60 % | 0.60 % | 0.60 % | 0.60 % | 0.60 % | 0.59 % |
Net investment income | 3.67 % | 4.24 % | 5.42 % | 2.26 % | 1.92 % | 2.15 % |
Supplemental data | ||||||
Portfolio turnover rate4 | 47 % | 22 % | 31 % | 20 % | 24 % | 39 % |
Net assets, end of period (000s omitted) | $7,347 | $13,227 | $15,267 | $13,203 | $13,544 | $13,562 |
* | Ratios include net expenses allocated from the affiliated Master Portfolio which were as follows: |
Year ended April 30, 20241 | 0.39% |
Year ended May 31, 2023 | 0.39% |
Year ended May 31, 2022 | 0.39% |
Year ended May 31, 2021 | 0.39% |
Year ended May 31, 2020 | 0.39% |
Year ended May 31, 2019 | 0.39% |
1 | For the eleven months ended April 30, 2024. The Fund changed its fiscal year end from May 31 to April 30, effective April 30, 2024. |
2 | Calculated based upon average shares outstanding |
3 | Returns for periods of less than one year are not annualized. |
4 | Portfolio turnover rate is calculated by multiplying the affiliated Master Portfolio’s percentage of the Fund’s total investment in securities at the end of the period by the affiliated Master Portfolio’s portfolio turnover rate. |
Year ended April 30 20241 | Year ended May 31 | |||||
Institutional Class | 2023 | 2022 | 2021 | 2020 | 2019 | |
Net asset value, beginning of period | $9.71 | $10.47 | $11.05 | $10.33 | $9.99 | $9.97 |
Net investment income | 0.34 2 | 0.44 2 | 0.63 2 | 0.26 | 0.21 | 0.22 |
Net realized and unrealized gains (losses) on investments | (0.12 ) | (0.74 ) | (0.64 ) | 0.71 | 0.37 | 0.05 |
Total from investment operations | 0.22 | (0.30 ) | (0.01 ) | 0.97 | 0.58 | 0.27 |
Distributions to shareholders from | ||||||
Net investment income | (0.31 ) | (0.46 ) | (0.57 ) | (0.25 ) | (0.24 ) | (0.22 ) |
Net realized gains | 0.00 | 0.00 | 0.00 | 0.00 | 0.00 | (0.03 ) |
Total distributions to shareholders | (0.31 ) | (0.46 ) | (0.57 ) | (0.25 ) | (0.24 ) | (0.25 ) |
Net asset value, end of period | $9.62 | $9.71 | $10.47 | $11.05 | $10.33 | $9.99 |
Total return3 | 2.30 % | (2.83 )% | (0.19 )% | 9.46 % | 5.88 % | 2.84 % |
Ratios to average net assets (annualized)* | ||||||
Gross expenses | 0.80 % | 0.76 % | 0.74 % | 0.95 % | 1.10 % | 0.84 % |
Net expenses | 0.45 % | 0.45 % | 0.45 % | 0.45 % | 0.45 % | 0.44 % |
Net investment income | 3.80 % | 4.42 % | 5.76 % | 2.37 % | 2.09 % | 2.20 % |
Supplemental data | ||||||
Portfolio turnover rate4 | 47 % | 22 % | 31 % | 20 % | 24 % | 39 % |
Net assets, end of period (000s omitted) | $21,418 | $36,525 | $43,796 | $10,787 | $10,587 | $11,094 |
* | Ratios include net expenses allocated from the affiliated Master Portfolio which were as follows: |
Year ended April 30, 20241 | 0.39% |
Year ended May 31, 2023 | 0.39% |
Year ended May 31, 2022 | 0.39% |
Year ended May 31, 2021 | 0.39% |
Year ended May 31, 2020 | 0.39% |
Year ended May 31, 2019 | 0.39% |
1 | For the eleven months ended April 30, 2024. The Fund changed its fiscal year end from May 31 to April 30, effective April 30, 2024. |
2 | Calculated based upon average shares outstanding |
3 | Returns for periods of less than one year are not annualized. |
4 | Portfolio turnover rate is calculated by multiplying the affiliated Master Portfolio’s percentage of the Fund’s total investment in securities at the end of the period by the affiliated Master Portfolio’s portfolio turnover rate. |
Gross unrealized gains | $0 |
Gross unrealized losses | (547,001 ) |
Net unrealized losses | $(547,001 ) |
Paid-in capital | Total distributable loss |
$(3,372 ) | $3,372 |
Affiliated Master Portfolio | Investment objective | Fair value of affiliated Master Portfolio |
Allspring Real Return Portfolio | Seeks returns that exceed the rate of inflation over the long-term | $72,785,721 |
Average daily net assets | Management fee |
First $5 billion | 0.050 % |
Next $5 billion | 0.040 |
Over $10 billion | 0.030 |
Class-level administration fee | |
Class A | 0.15 % |
Class C | 0.15 |
Class R6 | 0.03 |
Administrator Class | 0.10 |
Institutional Class | 0.08 |
EXPENSE RATIO CAPS | |
Class A | 0.77 % |
Class C | 1.52 |
Class R6 | 0.40 |
Administrator Class | 0.60 |
Institutional Class | 0.45 |
Purchases at cost | Sales proceeds | |||
U.S. government | Non-U.S. government | U.S. government | Non-U.S. government | |
Year ended April 30, 2024 | $6,839,188 | $17,405,309 | $37,681,428 | $16,244,087 |
Year ended May 31, 2023 | 10,575,401 | 6,686,365 | 10,805,388 | 8,588,668 |
Undistributed ordinary income | Unrealized losses | Capital loss carryforward |
$497,909 | $(547,001 ) | $(5,960,356 ) |
Allspring Funds Trust:

Shares | Value | |||||
Common stocks: 17.37% | ||||||
Communication services: 0.68% | ||||||
Entertainment: 0.25% | ||||||
Electronic Arts, Inc. | 3,303 | $418,887 | ||||
ROBLOX Corp. Class A† | 547 | 19,451 | ||||
Spotify Technology SA† | 569 | 159,570 | ||||
597,908 | ||||||
Interactive media & services: 0.24% | ||||||
Alphabet, Inc. Class A† | 1,413 | 230,008 | ||||
Alphabet, Inc. Class C† | 799 | 131,548 | ||||
Meta Platforms, Inc. Class A | 488 | 209,923 | ||||
571,479 | ||||||
Media: 0.19% | ||||||
Comcast Corp. Class A | 2,167 | 82,584 | ||||
Fox Corp. Class B | 6,370 | 182,692 | ||||
Trade Desk, Inc. Class A† | 2,298 | 190,389 | ||||
455,665 | ||||||
Consumer discretionary: 0.98% | ||||||
Broadline retail: 0.40% | ||||||
Amazon.com, Inc.† | 4,725 | 826,875 | ||||
Coupang, Inc.† | 5,726 | 128,835 | ||||
955,710 | ||||||
Distributors: 0.28% | ||||||
Genuine Parts Co. | 3,148 | 494,897 | ||||
LKQ Corp. | 1,520 | 65,558 | ||||
Pool Corp. | 287 | 104,046 | ||||
664,501 | ||||||
Hotels, restaurants & leisure: 0.17% | ||||||
Booking Holdings, Inc. | 50 | 172,601 | ||||
Chipotle Mexican Grill, Inc.† | 59 | 186,416 | ||||
Las Vegas Sands Corp. | 1,121 | 49,728 | ||||
Wynn Resorts Ltd. | 67 | 6,141 | ||||
414,886 | ||||||
Leisure products: 0.01% | ||||||
Polaris, Inc. | 137 | 11,667 | ||||
Specialty retail: 0.12% | ||||||
Best Buy Co., Inc. | 3,276 | 241,244 | ||||
Murphy USA, Inc. | 46 | 19,036 | ||||
O’Reilly Automotive, Inc.† | 17 | 17,225 | ||||
Wayfair, Inc. Class A† | 232 | 11,635 | ||||
289,140 | ||||||
Shares | Value | |||||
Consumer staples: 0.30% | ||||||
Beverages: 0.00% | ||||||
Constellation Brands, Inc. Class A | 5 | $1,267 | ||||
Consumer staples distribution & retail : 0.01% | ||||||
Kroger Co. | 365 | 20,214 | ||||
Food products: 0.29% | ||||||
Archer-Daniels-Midland Co. | 6,208 | 364,161 | ||||
Bunge Global SA | 84 | 8,548 | ||||
Ingredion, Inc. | 2,771 | 317,529 | ||||
690,238 | ||||||
Energy: 1.86% | ||||||
Energy equipment & services: 0.34% | ||||||
Baker Hughes Co. | 9,496 | 309,760 | ||||
Schlumberger NV | 9,817 | 466,111 | ||||
TechnipFMC PLC | 1,642 | 42,068 | ||||
817,939 | ||||||
Oil, gas & consumable fuels: 1.52% | ||||||
APA Corp. | 478 | 15,028 | ||||
Cheniere Energy, Inc. | 2,451 | 386,817 | ||||
Chevron Corp. | 1,846 | 297,704 | ||||
ConocoPhillips | 2,884 | 362,288 | ||||
Devon Energy Corp. | 2,856 | 146,170 | ||||
EOG Resources, Inc. | 846 | 111,782 | ||||
Exxon Mobil Corp. | 5,728 | 677,451 | ||||
Marathon Petroleum Corp. | 2,477 | 450,121 | ||||
Occidental Petroleum Corp. | 892 | 58,997 | ||||
Ovintiv, Inc. | 1,700 | 87,244 | ||||
Phillips 66 | 1,652 | 236,583 | ||||
Targa Resources Corp. | 107 | 12,204 | ||||
Texas Pacific Land Corp. | 761 | 438,564 | ||||
Valero Energy Corp. | 2,092 | 334,448 | ||||
3,615,401 | ||||||
Financials: 1.26% | ||||||
Banks: 0.05% | ||||||
NU Holdings Ltd. Class A† | 10,815 | 117,451 | ||||
Capital markets: 0.03% | ||||||
Charles Schwab Corp. | 690 | 51,026 | ||||
KKR & Co., Inc. | 102 | 9,493 | ||||
60,519 | ||||||
Consumer finance: 0.08% | ||||||
American Express Co. | 813 | 190,266 | ||||
Capital One Financial Corp. | 29 | 4,160 | ||||
194,426 | ||||||
Shares | Value | |||||
Financial services: 0.91% | ||||||
Apollo Global Management, Inc. | 3,336 | $361,556 | ||||
Block, Inc.† | 1,359 | 99,207 | ||||
Fiserv, Inc.† | 3,445 | 525,948 | ||||
Mastercard, Inc. Class A | 1,502 | 677,702 | ||||
PayPal Holdings, Inc.† | 2,738 | 185,965 | ||||
Toast, Inc. Class A† | 2,820 | 66,637 | ||||
Visa, Inc. Class A | 923 | 247,927 | ||||
2,164,942 | ||||||
Insurance: 0.19% | ||||||
Allstate Corp. | 617 | 104,927 | ||||
Arch Capital Group Ltd.† | 840 | 78,573 | ||||
Progressive Corp. | 1,292 | 269,059 | ||||
452,559 | ||||||
Health care: 0.76% | ||||||
Biotechnology: 0.02% | ||||||
AbbVie, Inc. | 322 | 52,370 | ||||
Health care providers & services: 0.22% | ||||||
Cigna Group | 754 | 269,208 | ||||
Elevance Health, Inc. | 466 | 246,318 | ||||
515,526 | ||||||
Pharmaceuticals: 0.52% | ||||||
Bristol-Myers Squibb Co. | 1,393 | 61,208 | ||||
Eli Lilly & Co. | 703 | 549,113 | ||||
Johnson & Johnson | 284 | 41,064 | ||||
Merck & Co., Inc. | 4,058 | 524,375 | ||||
Pfizer, Inc. | 2,614 | 66,971 | ||||
1,242,731 | ||||||
Industrials: 1.72% | ||||||
Aerospace & defense: 0.36% | ||||||
Boeing Co.† | 351 | 58,912 | ||||
General Dynamics Corp. | 1,780 | 511,020 | ||||
Lockheed Martin Corp. | 618 | 287,327 | ||||
857,259 | ||||||
Building products: 0.06% | ||||||
Builders FirstSource, Inc.† | 844 | 154,300 | ||||
Construction & engineering: 0.21% | ||||||
EMCOR Group, Inc. | 1,374 | 490,752 | ||||
Electrical equipment: 0.00% | ||||||
GE Vernova, Inc.† | 39 | 5,995 | ||||
Shares | Value | |||||
Ground transportation: 0.07% | ||||||
Uber Technologies, Inc.† | 1,858 | $123,129 | ||||
Union Pacific Corp. | 199 | 47,195 | ||||
170,324 | ||||||
Machinery: 0.73% | ||||||
AGCO Corp. | 638 | 72,853 | ||||
Allison Transmission Holdings, Inc. | 202 | 14,857 | ||||
Caterpillar, Inc. | 1,126 | 376,726 | ||||
Cummins, Inc. | 1,131 | 319,496 | ||||
Deere & Co. | 1,007 | 394,150 | ||||
PACCAR, Inc. | 3,089 | 327,774 | ||||
Westinghouse Air Brake Technologies Corp. | 1,510 | 243,231 | ||||
1,749,087 | ||||||
Trading companies & distributors: 0.29% | ||||||
Core & Main, Inc. Class A† | 2,471 | 139,537 | ||||
Ferguson PLC | 623 | 130,768 | ||||
United Rentals, Inc. | 69 | 46,091 | ||||
WESCO International, Inc. | 571 | 87,220 | ||||
WW Grainger, Inc. | 302 | 278,248 | ||||
681,864 | ||||||
Information technology: 2.23% | ||||||
Communications equipment: 0.08% | ||||||
Arista Networks, Inc.† | 776 | 199,090 | ||||
Electronic equipment, instruments & components: 0.02% | ||||||
Jabil, Inc. | 375 | 44,010 | ||||
Semiconductors & semiconductor equipment: 1.08% | ||||||
Advanced Micro Devices, Inc.† | 767 | 121,477 | ||||
Analog Devices, Inc. | 111 | 22,268 | ||||
Applied Materials, Inc. | 1,831 | 363,728 | ||||
Broadcom, Inc. | 236 | 306,864 | ||||
Lam Research Corp. | 78 | 69,764 | ||||
Microchip Technology, Inc. | 1,484 | 136,498 | ||||
Monolithic Power Systems, Inc. | 122 | 81,658 | ||||
NVIDIA Corp. | 1,059 | 914,997 | ||||
NXP Semiconductors NV | 493 | 126,302 | ||||
ON Semiconductor Corp.† | 474 | 33,256 | ||||
QUALCOMM, Inc. | 2,374 | 393,728 | ||||
2,570,540 | ||||||
Software: 0.65% | ||||||
Adobe, Inc.† | 96 | 44,432 | ||||
Intuit, Inc. | 74 | 46,296 | ||||
Microsoft Corp. | 3,203 | 1,247,024 | ||||
Palantir Technologies, Inc. Class A† | 2,116 | 46,488 | ||||
Shares | Value | |||||
Software(continued) | ||||||
Salesforce, Inc. | 501 | $134,739 | ||||
Synopsys, Inc.† | 40 | 21,224 | ||||
1,540,203 | ||||||
Technology hardware, storage & peripherals: 0.40% | ||||||
Apple, Inc. | 5,617 | 956,744 | ||||
Materials: 2.01% | ||||||
Chemicals: 0.26% | ||||||
CF Industries Holdings, Inc. | 358 | 28,271 | ||||
Corteva, Inc. | 2,099 | 113,619 | ||||
Dow, Inc. | 1,704 | 96,958 | ||||
LyondellBasell Industries NV Class A | 1,257 | 125,662 | ||||
Westlake Corp. | 1,848 | 272,321 | ||||
636,831 | ||||||
Metals & mining: 1.75% | ||||||
Agnico Eagle Mines Ltd. | 2,401 | 152,050 | ||||
Agnico Eagle Mines Ltd.-U.S. Exchange Traded Shares | 4,000 | 253,400 | ||||
Alamos Gold, Inc. Class A | 11,200 | 164,748 | ||||
Alcoa Corp. | 101 | 3,549 | ||||
Anglogold Ashanti PLC | 2,900 | 66,671 | ||||
Artemis Gold, Inc.† | 13,200 | 86,009 | ||||
B2Gold Corp. | 30,000 | 75,836 | ||||
Barrick Gold Corp. | 15,356 | 255,524 | ||||
Centerra Gold, Inc. | 7,800 | 47,481 | ||||
Dundee Precious Metals, Inc. | 11,000 | 83,260 | ||||
Endeavour Mining PLC | 6,780 | 141,692 | ||||
Evolution Mining Ltd. | 5,000 | 12,894 | ||||
Franco-Nevada Corp. | 1,300 | 156,493 | ||||
Freeport-McMoRan, Inc. | 10,768 | 537,754 | ||||
Gold Fields Ltd. ADR | 10,440 | 168,815 | ||||
Kinross Gold Corp. | 31,000 | 199,964 | ||||
Lundin Gold, Inc. | 10,600 | 144,064 | ||||
MAG Silver Corp.† | 1,100 | 13,528 | ||||
Newmont Corp. | 8,000 | 325,120 | ||||
Northern Star Resources Ltd. | 15,000 | 142,181 | ||||
Nucor Corp. | 1,654 | 278,749 | ||||
OceanaGold Corp. | 30,000 | 64,940 | ||||
Osisko Gold Royalties Ltd. | 3,300 | 50,699 | ||||
Osisko Mining, Inc.† | 4,000 | 8,833 | ||||
Pan American Silver Corp. | 479 | 8,834 | ||||
Pan American Silver Corp.-U.S. Exchange Traded Shares | 4,300 | 79,292 | ||||
Royal Gold, Inc. | 1,300 | 156,169 | ||||
SilverCrest Metals, Inc.† | 2,000 | 16,373 | ||||
Steel Dynamics, Inc. | 703 | 91,474 | ||||
Torex Gold Resources, Inc.† | 7,500 | 105,691 | ||||
Shares | Value | |||||
Metals & mining(continued) | ||||||
Triple Flag Precious Metals Corp. | 2,000 | $32,252 | ||||
Wheaton Precious Metals Corp. | 4,600 | 239,648 | ||||
4,163,987 | ||||||
Real estate: 5.57% | ||||||
Health care REITs: 0.32% | ||||||
Welltower, Inc. | 7,939 | 756,428 | ||||
Industrial REITs : 0.76% | ||||||
Prologis, Inc. | 12,871 | 1,313,485 | ||||
Terreno Realty Corp. | 9,296 | 505,238 | ||||
1,818,723 | ||||||
Office REITs : 0.23% | ||||||
Alexandria Real Estate Equities, Inc. | 4,648 | 538,564 | ||||
Real estate management & development: 0.16% | ||||||
CBRE Group, Inc. Class A† | 3,231 | 280,742 | ||||
CoStar Group, Inc.† | 725 | 66,359 | ||||
Jones Lang LaSalle, Inc.† | 171 | 30,900 | ||||
378,001 | ||||||
Residential REITs : 1.07% | ||||||
American Homes 4 Rent Class A | 12,635 | 452,333 | ||||
Apartment Income REIT Corp. | 4,327 | 166,070 | ||||
Camden Property Trust | 4,072 | 405,897 | ||||
Invitation Homes, Inc. | 13,339 | 456,194 | ||||
Mid-America Apartment Communities, Inc. | 3,134 | 407,420 | ||||
Sun Communities, Inc. | 5,912 | 658,124 | ||||
2,546,038 | ||||||
Retail REITs : 0.44% | ||||||
Federal Realty Investment Trust | 3,150 | 328,135 | ||||
Simon Property Group, Inc. | 5,126 | 720,357 | ||||
1,048,492 | ||||||
Specialized REITs : 2.59% | ||||||
American Tower Corp. | 8,036 | 1,378,656 | ||||
Crown Castle, Inc. | 2,682 | 251,518 | ||||
CubeSmart | 3,647 | 147,485 | ||||
Equinix, Inc. | 1,835 | 1,304,887 | ||||
Extra Space Storage, Inc. | 4,323 | 580,492 | ||||
Four Corners Property Trust, Inc. | 9,745 | 228,520 | ||||
Gaming & Leisure Properties, Inc. | 5,721 | 244,458 | ||||
Iron Mountain, Inc. | 6,730 | 521,710 | ||||
Public Storage | 231 | 59,933 | ||||
SBA Communications Corp. Class A | 3,327 | 619,221 | ||||
Shares | Value | |||||
Specialized REITs (continued) | ||||||
VICI Properties, Inc. | 15,853 | $452,603 | ||||
Weyerhaeuser Co. | 12,921 | 389,827 | ||||
6,179,310 | ||||||
Total common stocks (Cost $35,924,178) | 41,393,081 | |||||
Interest rate | Maturity date | Principal | ||||
Corporate bonds and notes: 7.71% | ||||||
Communications: 0.58% | ||||||
Advertising: 0.07% | ||||||
Outfront Media Capital LLC/Outfront Media Capital Corp.144A | 5.00 % | 8-15-2027 | $ | 175,000 | 166,560 | |
Internet: 0.22% | ||||||
Arches Buyer, Inc.144A | 4.25 | 6-1-2028 | 300,000 | 257,248 | ||
Gen Digital, Inc.144A | 6.75 | 9-30-2027 | 275,000 | 276,023 | ||
533,271 | ||||||
Media: 0.29% | ||||||
CCO Holdings LLC/CCO Holdings Capital Corp.144A | 5.13 | 5-1-2027 | 300,000 | 281,152 | ||
Sirius XM Radio, Inc.144A | 5.00 | 8-1-2027 | 437,000 | 412,699 | ||
693,851 | ||||||
Consumer, cyclical: 2.93% | ||||||
Airlines: 0.35% | ||||||
American Airlines, Inc./AAdvantage Loyalty IP Ltd.144A | 5.50 | 4-20-2026 | 258,000 | 255,007 | ||
Hawaiian Airlines Pass-Through Certificates Series 2013-1 Class A | 3.90 | 1-15-2026 | 150,147 | 140,581 | ||
Hawaiian Brand Intellectual Property Ltd./HawaiianMiles Loyalty Ltd.144A | 5.75 | 1-20-2026 | 327,000 | 306,690 | ||
Mileage Plus Holdings LLC/Mileage Plus Intellectual Property Assets Ltd.144A | 6.50 | 6-20-2027 | 123,500 | 123,709 | ||
825,987 | ||||||
Apparel: 0.11% | ||||||
Hanesbrands, Inc.144A | 4.88 | 5-15-2026 | 155,000 | 149,917 | ||
Michael Kors USA, Inc.144A | 4.25 | 11-1-2024 | 110,000 | 108,160 | ||
258,077 | ||||||
Auto manufacturers: 0.08% | ||||||
Ford Motor Credit Co. LLC | 4.13 | 8-17-2027 | 200,000 | 187,847 | ||
Auto parts & equipment: 0.12% | ||||||
Adient Global Holdings Ltd.144A | 4.88 | 8-15-2026 | 220,000 | 211,547 | ||
American Axle & Manufacturing, Inc. | 6.50 | 4-1-2027 | 80,000 | 79,210 | ||
290,757 | ||||||
Distribution/wholesale: 0.14% | ||||||
G-III Apparel Group Ltd.144A | 7.88 | 8-15-2025 | 330,000 | 331,610 | ||
Interest rate | Maturity date | Principal | Value | |||
Entertainment: 0.92% | ||||||
CCM Merger, Inc.144A | 6.38 % | 5-1-2026 | $ | 145,000 | $144,649 | |
Cedar Fair LP/Canada’s Wonderland Co./Magnum Management Corp./Millennium Op144A | 5.50 | 5-1-2025 | 375,000 | 375,000 | ||
Churchill Downs, Inc.144A | 5.50 | 4-1-2027 | 360,000 | 350,537 | ||
Cinemark USA, Inc.144A | 5.88 | 3-15-2026 | 105,000 | 103,677 | ||
Cinemark USA, Inc.144A | 8.75 | 5-1-2025 | 252,000 | 252,000 | ||
Live Nation Entertainment, Inc.144A | 6.50 | 5-15-2027 | 335,000 | 335,658 | ||
SeaWorld Parks & Entertainment, Inc.144A | 8.75 | 5-1-2025 | 250,000 | 250,000 | ||
Six Flags Theme Parks, Inc.144A | 7.00 | 7-1-2025 | 380,000 | 380,827 | ||
2,192,348 | ||||||
Home builders: 0.34% | ||||||
Taylor Morrison Communities, Inc.144A | 5.75 | 1-15-2028 | 290,000 | 281,969 | ||
Tri Pointe Group, Inc./Tri Pointe Homes, Inc. | 5.88 | 6-15-2024 | 535,000 | 534,382 | ||
816,351 | ||||||
Housewares: 0.20% | ||||||
Newell Brands, Inc. | 5.70 | 4-1-2026 | 490,000 | 482,187 | ||
Leisure time: 0.33% | ||||||
Carnival Holdings Bermuda Ltd.144A | 10.38 | 5-1-2028 | 180,000 | 195,168 | ||
NCL Corp. Ltd.144A | 8.13 | 1-15-2029 | 45,000 | 46,865 | ||
NCL Corp. Ltd.144A | 8.38 | 2-1-2028 | 295,000 | 307,637 | ||
Viking Cruises Ltd.144A | 5.88 | 9-15-2027 | 120,000 | 116,348 | ||
VOC Escrow Ltd.144A | 5.00 | 2-15-2028 | 120,000 | 114,441 | ||
780,459 | ||||||
Retail: 0.34% | ||||||
Bath & Body Works, Inc.144A | 9.38 | 7-1-2025 | 294,000 | 304,264 | ||
Dave & Buster’s, Inc.144A | 7.63 | 11-1-2025 | 350,000 | 352,268 | ||
Raising Cane’s Restaurants LLC144A | 9.38 | 5-1-2029 | 145,000 | 155,514 | ||
812,046 | ||||||
Consumer, non-cyclical: 0.67% | ||||||
Commercial services: 0.36% | ||||||
Allied Universal Holdco LLC/Allied Universal Finance Corp.144A | 6.63 | 7-15-2026 | 64,000 | 63,831 | ||
CoreCivic, Inc. | 8.25 | 4-15-2029 | 195,000 | 201,492 | ||
GEO Group, Inc.144A | 8.63 | 4-15-2029 | 115,000 | 116,421 | ||
Prime Security Services Borrower LLC/Prime Finance, Inc.144A | 5.75 | 4-15-2026 | 320,000 | 315,975 | ||
Sabre Global, Inc.144A | 11.25 | 12-15-2027 | 170,000 | 158,882 | ||
856,601 | ||||||
Food: 0.23% | ||||||
B&G Foods, Inc.144A | 8.00 | 9-15-2028 | 195,000 | 202,069 | ||
Performance Food Group, Inc.144A | 6.88 | 5-1-2025 | 355,000 | 355,000 | ||
557,069 | ||||||
Interest rate | Maturity date | Principal | Value | |||
Healthcare-services: 0.06% | ||||||
Tenet Healthcare Corp. | 4.63 % | 6-15-2028 | $ | 70,000 | $65,872 | |
U.S. Acute Care Solutions LLC144A | 6.38 | 3-1-2026 | 75,000 | 75,937 | ||
141,809 | ||||||
Pharmaceuticals: 0.02% | ||||||
AdaptHealth LLC144A | 6.13 | 8-1-2028 | 60,000 | 56,268 | ||
Energy: 1.43% | ||||||
Energy-alternate sources: 0.05% | ||||||
TerraForm Power Operating LLC144A | 5.00 | 1-31-2028 | 125,000 | 116,646 | ||
Oil & gas: 0.50% | ||||||
Aethon United BR LP/Aethon United Finance Corp.144A | 8.25 | 2-15-2026 | 145,000 | 145,937 | ||
Antero Resources Corp.144A | 7.63 | 2-1-2029 | 160,000 | 163,878 | ||
Antero Resources Corp.144A | 8.38 | 7-15-2026 | 390,000 | 400,679 | ||
Civitas Resources, Inc.144A | 8.38 | 7-1-2028 | 110,000 | 114,750 | ||
Hilcorp Energy I LP/Hilcorp Finance Co.144A | 6.25 | 11-1-2028 | 140,000 | 137,941 | ||
Nabors Industries, Inc.144A | 7.38 | 5-15-2027 | 140,000 | 138,748 | ||
Range Resources Corp. | 8.25 | 1-15-2029 | 90,000 | 93,771 | ||
1,195,704 | ||||||
Oil & gas services: 0.21% | ||||||
Archrock Partners LP/Archrock Partners Finance Corp.144A | 6.88 | 4-1-2027 | 110,000 | 109,733 | ||
Oceaneering International, Inc. | 6.00 | 2-1-2028 | 325,000 | 319,662 | ||
USA Compression Partners LP/USA Compression Finance Corp.144A | 7.13 | 3-15-2029 | 55,000 | 54,648 | ||
484,043 | ||||||
Pipelines: 0.67% | ||||||
Antero Midstream Partners LP/Antero Midstream Finance Corp.144A | 5.75 | 1-15-2028 | 110,000 | 107,658 | ||
Antero Midstream Partners LP/Antero Midstream Finance Corp.144A | 7.88 | 5-15-2026 | 105,000 | 106,908 | ||
Buckeye Partners LP144A | 4.13 | 3-1-2025 | 35,000 | 34,244 | ||
EQM Midstream Partners LP | 4.00 | 8-1-2024 | 65,000 | 64,516 | ||
EQM Midstream Partners LP144A | 7.50 | 6-1-2027 | 160,000 | 163,012 | ||
Hess Midstream Operations LP144A | 5.63 | 2-15-2026 | 225,000 | 222,472 | ||
Kinetik Holdings LP144A | 6.63 | 12-15-2028 | 165,000 | 165,794 | ||
Tallgrass Energy Partners LP/Tallgrass Energy Finance Corp.144A | 6.00 | 3-1-2027 | 360,000 | 350,666 | ||
Venture Global LNG, Inc.144A | 8.13 | 6-1-2028 | 380,000 | 388,538 | ||
1,603,808 | ||||||
Financial: 1.05% | ||||||
Banks: 0.01% | ||||||
Citigroup, Inc. Series X (5 Year Treasury Constant Maturity+3.42%)ʊ± | 3.88 | 2-18-2026 | 25,000 | 23,467 | ||
Interest rate | Maturity date | Principal | Value | |||
Diversified financial services: 0.69% | ||||||
Aircastle Ltd. Series A (5 Year Treasury Constant Maturity+4.41%)144Aʊ± | 5.25 % | 6-15-2026 | $ | 140,000 | $132,276 | |
Enact Holdings, Inc.144A | 6.50 | 8-15-2025 | 405,000 | 404,636 | ||
Encore Capital Group, Inc.144A | 9.25 | 4-1-2029 | 200,000 | 204,329 | ||
Nationstar Mortgage Holdings, Inc.144A | 6.00 | 1-15-2027 | 215,000 | 210,676 | ||
OneMain Finance Corp. | 7.13 | 3-15-2026 | 220,000 | 222,002 | ||
PRA Group, Inc.144A | 7.38 | 9-1-2025 | 145,000 | 144,329 | ||
United Wholesale Mortgage LLC144A | 5.50 | 11-15-2025 | 325,000 | 319,689 | ||
1,637,937 | ||||||
Insurance: 0.02% | ||||||
AmWINS Group, Inc.144A | 6.38 | 2-15-2029 | 55,000 | 54,334 | ||
REITS: 0.33% | ||||||
Brandywine Operating Partnership LP | 3.95 | 11-15-2027 | 65,000 | 58,184 | ||
Iron Mountain, Inc.144A | 5.25 | 3-15-2028 | 300,000 | 287,042 | ||
Ladder Capital Finance Holdings LLLP/Ladder Capital Finance Corp.144A | 5.25 | 10-1-2025 | 95,000 | 93,451 | ||
MPT Operating Partnership LP/MPT Finance Corp. | 5.25 | 8-1-2026 | 97,000 | 88,350 | ||
Service Properties Trust | 7.50 | 9-15-2025 | 255,000 | 256,882 | ||
783,909 | ||||||
Industrial: 0.70% | ||||||
Aerospace/defense: 0.10% | ||||||
TransDigm, Inc.144A | 6.38 | 3-1-2029 | 240,000 | 238,167 | ||
Electrical components & equipment: 0.17% | ||||||
WESCO Distribution, Inc.144A | 6.38 | 3-15-2029 | 170,000 | 168,878 | ||
WESCO Distribution, Inc.144A | 7.13 | 6-15-2025 | 230,000 | 230,152 | ||
399,030 | ||||||
Machinery-diversified: 0.10% | ||||||
TK Elevator U.S. Newco, Inc.144A | 5.25 | 7-15-2027 | 250,000 | 239,142 | ||
Packaging & containers: 0.12% | ||||||
Ardagh Metal Packaging Finance USA LLC/Ardagh Metal Packaging Finance PLC144A | 6.00 | 6-15-2027 | 305,000 | 295,654 | ||
Trucking & leasing: 0.21% | ||||||
Fortress Transportation & Infrastructure Investors LLC144A | 6.50 | 10-1-2025 | 505,000 | 505,000 | ||
Technology: 0.07% | ||||||
Software: 0.07% | ||||||
SS&C Technologies, Inc.144A | 5.50 | 9-30-2027 | 170,000 | 165,243 | ||
Utilities: 0.28% | ||||||
Electric: 0.28% | ||||||
NSG Holdings LLC/NSG Holdings, Inc.144A | 7.75 | 12-15-2025 | 67,758 | 67,081 | ||
Interest rate | Maturity date | Principal | Value | |||
Electric(continued) | ||||||
Pattern Energy Operations LP/Pattern Energy Operations, Inc.144A | 4.50 % | 8-15-2028 | $ | 215,000 | $192,243 | |
Vistra Operations Co. LLC144A | 5.63 | 2-15-2027 | 412,000 | 400,855 | ||
660,179 | ||||||
Total corporate bonds and notes (Cost $18,466,497) | 18,385,361 | |||||
Loans: 0.30% | ||||||
Communications: 0.03% | ||||||
Media: 0.03% | ||||||
DirecTV Financing LLC (U.S. SOFR 1 Month+5.00%)± | 10.43 | 8-2-2027 | 55,775 | 56,043 | ||
Consumer, cyclical: 0.18% | ||||||
Airlines: 0.09% | ||||||
Mileage Plus Holdings LLC (U.S. SOFR 3 Month+5.25%)± | 10.73 | 6-21-2027 | 110,500 | 113,320 | ||
SkyMiles IP Ltd. (U.S. SOFR 3 Month+3.75%)± | 9.07 | 10-20-2027 | 92,294 | 95,072 | ||
208,392 | ||||||
Auto parts & equipment: 0.02% | ||||||
First Brands Group LLC (U.S. SOFR 3 Month+5.00%)± | 10.59 | 3-30-2027 | 59,859 | 57,075 | ||
Leisure time: 0.05% | ||||||
Carnival Corp. (U.S. SOFR 1 Month+2.75%)± | 8.07 | 8-8-2027 | 114,456 | 115,029 | ||
Retail: 0.02% | ||||||
Petco Health & Wellness Co., Inc. (U.S. SOFR 3 Month+3.25%)± | 8.82 | 3-3-2028 | 60,000 | 51,710 | ||
Financial: 0.04% | ||||||
Insurance: 0.04% | ||||||
Asurion LLC (U.S. SOFR 1 Month+3.25%)± | 8.68 | 12-23-2026 | 103,784 | 101,334 | ||
Utilities: 0.05% | ||||||
Electric: 0.05% | ||||||
Constellation Renewables LLC (U.S. SOFR 3 Month+2.50%)± | 8.10 | 12-15-2027 | 114,242 | 114,131 | ||
Total loans (Cost $710,225) | 703,714 | |||||
U.S. Treasury securities: 19.74% | ||||||
TIPS | 0.13 | 4-15-2025 | 114,111 | 111,180 | ||
TIPS | 0.13 | 4-15-2026 | 5,016,259 | 4,780,989 | ||
TIPS | 0.13 | 7-15-2026 | 4,394,386 | 4,187,511 | ||
TIPS | 0.13 | 1-15-2030 | 5,064,864 | 4,492,130 | ||
TIPS | 0.13 | 7-15-2030 | 4,574,216 | 4,032,049 | ||
TIPS | 0.13 | 1-15-2031 | 500,585 | 434,929 | ||
TIPS | 0.13 | 7-15-2031 | 1,701,687 | 1,468,088 | ||
TIPS | 0.13 | 2-15-2051 | 595,855 | 329,131 | ||
TIPS | 0.25 | 7-15-2029 | 2,377,363 | 2,154,182 | ||
TIPS | 0.25 | 2-15-2050 | 193,088 | 112,897 | ||
TIPS | 0.63 | 1-15-2026 | 4,093,558 | 3,958,087 | ||
TIPS | 0.88 | 1-15-2029 | 2,942,856 | 2,759,430 | ||
TIPS | 1.00 | 2-15-2048 | 1,440,616 | 1,062,604 | ||
Interest rate | Maturity date | Principal | Value | |||
U.S. Treasury securities(continued) | ||||||
TIPS | 1.00 % | 2-15-2049 | $ | 1,498,071 | $1,097,212 | |
TIPS | 1.38 | 7-15-2033 | 4,632,865 | 4,300,926 | ||
TIPS | 1.38 | 2-15-2044 | 1,437,761 | 1,195,884 | ||
TIPS | 1.50 | 2-15-2053 | 1,247,293 | 1,009,837 | ||
TIPS | 1.63 | 10-15-2027 | 4,309,928 | 4,217,536 | ||
TIPS | 2.00 | 1-15-2026 | 2,071,253 | 2,050,282 | ||
TIPS | 2.13 | 2-15-2040 | 1,378,051 | 1,332,392 | ||
TIPS | 2.13 | 2-15-2041 | 1,905,569 | 1,841,034 | ||
TIPS | 3.88 | 4-15-2029 | 113,239 | 121,589 | ||
Total U.S. Treasury securities (Cost $52,191,186) | 47,049,899 | |||||
Yankee corporate bonds and notes: 1.25% | ||||||
Consumer, cyclical: 0.50% | ||||||
Airlines: 0.22% | ||||||
Air Canada Pass-Through Trust Series 2020-1 Class C144A | 10.50 | 7-15-2026 | 475,000 | 515,375 | ||
Leisure time: 0.28% | ||||||
Carnival Corp.144A | 7.63 | 3-1-2026 | 200,000 | 201,241 | ||
Royal Caribbean Cruises Ltd.144A | 5.38 | 7-15-2027 | 485,000 | 471,985 | ||
673,226 | ||||||
Energy: 0.24% | ||||||
Pipelines: 0.24% | ||||||
Northriver Midstream Finance LP144A | 5.63 | 2-15-2026 | 580,000 | 567,762 | ||
Financial: 0.20% | ||||||
Banks: 0.09% | ||||||
Intesa Sanpaolo SpA (5 Year USD Swap Rate+5.46%)144Aʊ± | 7.70 | 9-17-2025 | 200,000 | 198,244 | ||
Diversified financial services: 0.11% | ||||||
Macquarie Airfinance Holdings Ltd.144A | 6.40 | 3-26-2029 | 30,000 | 29,913 | ||
Macquarie Airfinance Holdings Ltd.144A | 8.38 | 5-1-2028 | 225,000 | 236,216 | ||
266,129 | ||||||
Industrial: 0.11% | ||||||
Electronics: 0.03% | ||||||
Sensata Technologies BV144A | 4.00 | 4-15-2029 | 75,000 | 67,146 | ||
Packaging & containers: 0.08% | ||||||
Trivium Packaging Finance BV144A | 5.50 | 8-15-2026 | 200,000 | 196,549 | ||
Technology: 0.09% | ||||||
Software: 0.09% | ||||||
Open Text Corp.144A | 6.90 | 12-1-2027 | 215,000 | 219,531 | ||
Interest rate | Maturity date | Principal | Value | |||
Utilities: 0.11% | ||||||
Electric: 0.11% | ||||||
Drax Finco PLC144A | 6.63 % | 11-1-2025 | $ | 150,000 | $150,000 | |
Emera, Inc. Series 16-A (3 Month LIBOR+5.44%)± | 6.75 | 6-15-2076 | 115,000 | 113,689 | ||
263,689 | ||||||
Total yankee corporate bonds and notes (Cost $2,885,325) | 2,967,651 | |||||
Yield | Shares | |||||
Short-term investments: 45.25% | ||||||
Investment companies: 45.25% | ||||||
Allspring Government Money Market Fund Select Class♠∞* | 5.23 | 107,853,407 | 107,853,407 | |||
Total short-term investments (Cost $107,853,407) | 107,853,407 | |||||
Total investments in securities (Cost $218,030,818) | 91.62 % | 218,353,113 | ||||
Other assets and liabilities, net | 8.38 | 19,961,506 | ||||
Total net assets | 100.00 % | $238,314,619 | ||||
† | Non-income-earning security |
144A | The security may be resold in transactions exempt from registration, normally to qualified institutional buyers, pursuant to Rule 144A under the Securities Act of 1933. |
ʊ | Security is perpetual in nature and has no stated maturity date. The date shown reflects the next call date. |
± | Variable rate investment. The rate shown is the rate in effect at period end. |
♠ | The issuer of the security is an affiliated person of the Portfolio as defined in the Investment Company Act of 1940. |
∞ | The rate represents the 7-day annualized yield at period end. |
* | A portion of the holding represents an investment held in Real Return Special Investments (Cayman) Ltd., the consolidated entity. |
Abbreviations: | |
ADR | American depositary receipt |
LIBOR | London Interbank Offered Rate |
REIT | Real estate investment trust |
SOFR | Secured Overnight Financing Rate |
TIPS | Treasury Inflation-Protected Securities |
Value, beginning of period | Purchases | Sales proceeds | Net realized gains (losses) | Net change in unrealized gains (losses) | Value, end of period | Shares, end of period | Income from affiliated securities | |
Short-term investments | ||||||||
Allspring Government Money Market Fund Select Class | $2,535,840 | $264,867,637 | $(159,550,070 ) | $0 | $0 | $107,853,407 | 107,853,407 | $2,723,159 |
Currency to be received | Currency to be delivered | Counterparty | Settlement date | Unrealized gains | Unrealized losses | ||
USD | 815,628 | AUD | 1,251,000 | Morgan Stanley Inc. | 5-15-2024 | $4,913 | $0 |
USD | 580,015 | BRL | 2,951,000 | Morgan Stanley Inc. | 5-15-2024 | 12,402 | 0 |
Currency to be received | Currency to be delivered | Counterparty | Settlement date | Unrealized gains | Unrealized losses | ||
USD | 1,077,552 | CAD | 1,475,000 | Morgan Stanley Inc. | 5-15-2024 | $5,877 | $0 |
USD | 908,052 | CHF | 826,000 | Morgan Stanley Inc. | 5-15-2024 | 8,288 | 0 |
USD | 339,129 | CLP | 323,217,000 | Morgan Stanley Inc. | 5-15-2024 | 2,526 | 0 |
USD | 901,814 | CZK | 21,350,000 | Morgan Stanley Inc. | 5-15-2024 | 0 | (4,005 ) |
USD | 1,145,868 | EUR | 1,065,000 | Morgan Stanley Inc. | 5-15-2024 | 8,762 | 0 |
USD | 898,816 | GBP | 716,000 | Morgan Stanley Inc. | 5-15-2024 | 4,081 | 0 |
USD | 526,911 | HUF | 191,874,000 | Morgan Stanley Inc. | 5-15-2024 | 4,138 | 0 |
USD | 1,514,552 | IDR | 24,714,615,000 | Morgan Stanley Inc. | 5-15-2024 | 0 | (5,054 ) |
USD | 2,232,566 | INR | 186,321,000 | Morgan Stanley Inc. | 5-15-2024 | 330 | 0 |
USD | 895,215 | JPY | 136,202,000 | Morgan Stanley Inc. | 5-15-2024 | 29,939 | 0 |
MXN | 14,601,000 | USD | 880,230 | Morgan Stanley Inc. | 5-15-2024 | 0 | (29,527 ) |
USD | 637,743 | NOK | 6,910,000 | Morgan Stanley Inc. | 5-15-2024 | 15,504 | 0 |
USD | 829,803 | NZD | 1,388,000 | Morgan Stanley Inc. | 5-15-2024 | 11,929 | 0 |
PLN | 3,103,000 | USD | 780,668 | Morgan Stanley Inc. | 5-15-2024 | 0 | (15,783 ) |
USD | 719,662 | SEK | 7,706,000 | Morgan Stanley Inc. | 5-15-2024 | 20,051 | 0 |
USD | 943,677 | KRW | 1,285,298,000 | Morgan Stanley Inc. | 5-16-2024 | 13,094 | 0 |
$141,834 | $(54,369 ) | ||||||
Description | Number of contracts | Expiration date | Notional cost | Notional value | Unrealized gains | Unrealized losses |
Long | ||||||
LME Copper Futures** | 2 | 5-13-2024 | $461,061 | $495,187 | $34,126 | $0 |
LME Primary Aluminum Futures** | 18 | 5-13-2024 | 1,042,933 | 1,154,560 | 111,627 | 0 |
LME Zinc Futures** | 5 | 5-13-2024 | 317,520 | 365,603 | 48,083 | 0 |
CAC 40 Index | 9 | 5-17-2024 | 763,120 | 764,110 | 990 | 0 |
Light Sweet Crude Oil Futures** | 2 | 5-21-2024 | 169,747 | 163,860 | 0 | (5,887 ) |
Brent Crude Oil Futures** | 2 | 5-31-2024 | 179,445 | 172,660 | 0 | (6,785 ) |
NY Harbor ULSD Futures** | 4 | 5-31-2024 | 446,629 | 424,637 | 0 | (21,992 ) |
10-Year Euro BUND Index | 21 | 6-6-2024 | 2,963,698 | 2,915,250 | 0 | (48,448 ) |
Gas Oil Futures** | 1 | 6-12-2024 | 79,103 | 77,625 | 0 | (1,478 ) |
TOPIX Index | 60 | 6-13-2024 | 10,262,912 | 10,450,496 | 187,584 | 0 |
Euro Futures | 70 | 6-17-2024 | 9,591,035 | 9,361,187 | 0 | (229,848 ) |
LME Copper Futures** | 3 | 6-17-2024 | 646,988 | 745,904 | 98,916 | 0 |
LME Nickel Futures** | 3 | 6-17-2024 | 330,603 | 345,042 | 14,439 | 0 |
10-Year U.S. Treasury Notes | 1,056 | 6-18-2024 | 116,190,591 | 113,454,000 | 0 | (2,736,591 ) |
S&P ASX Share Price Index 200 | 8 | 6-20-2024 | 995,945 | 995,669 | 0 | (276 ) |
S&P/TSX 60 Index | 17 | 6-20-2024 | 3,246,244 | 3,224,276 | 0 | (21,968 ) |
DAX Index | 2 | 6-21-2024 | 959,874 | 965,550 | 5,676 | 0 |
E-Mini Energy Select Sector Futures | 48 | 6-21-2024 | 4,955,617 | 4,728,000 | 0 | (227,617 ) |
E-Mini NASDAQ 100 Index | 29 | 6-21-2024 | 10,610,317 | 10,191,325 | 0 | (418,992 ) |
E-Mini Russell 2000 Index | 7 | 6-21-2024 | 738,098 | 694,960 | 0 | (43,138 ) |
E-Mini S&P 500 Index | 417 | 6-21-2024 | 108,204,263 | 105,646,950 | 0 | (2,557,313 ) |
Euro STOXX 50 Index | 18 | 6-21-2024 | 936,842 | 940,695 | 3,853 | 0 |
FTSE 100 Index | 10 | 6-21-2024 | 961,800 | 1,019,445 | 57,645 | 0 |
MSCI Emerging Markets Index | 14 | 6-21-2024 | 734,757 | 729,400 | 0 | (5,357 ) |
Henry Hub Natural Gas Futures** | 25 | 6-26-2024 | 584,379 | 579,750 | 0 | (4,629 ) |
Long Gilt Futures | 215 | 6-26-2024 | 26,027,810 | 25,731,612 | 0 | (296,198 ) |
Corn Futures** | 21 | 7-12-2024 | 461,820 | 469,088 | 7,268 | 0 |
Hard Red Winter Wheat Futures** | 2 | 7-12-2024 | 58,283 | 63,525 | 5,242 | 0 |
Soybean Futures** | 21 | 7-12-2024 | 1,217,557 | 1,221,150 | 3,593 | 0 |
Description | Number of contracts | Expiration date | Notional cost | Notional value | Unrealized gains | Unrealized losses |
Long (continued) | ||||||
Soybean Meal Futures** | 28 | 7-12-2024 | $941,469 | $985,320 | $43,851 | $0 |
Soybean Oil Futures** | 2 | 7-12-2024 | 55,904 | 51,612 | 0 | (4,292 ) |
Wheat Futures** | 20 | 7-12-2024 | 565,078 | 603,250 | 38,172 | 0 |
Cocoa Futures** | 7 | 7-16-2024 | 725,954 | 649,810 | 0 | (76,144 ) |
Short | ||||||
LME Copper Futures** | (11 ) | 5-13-2024 | (2,342,735 ) | (2,723,526 ) | 0 | (380,791 ) |
LME Lead Futures** | (7 ) | 5-13-2024 | (356,004 ) | (383,147 ) | 0 | (27,143 ) |
LME Nickel Futures** | (4 ) | 5-13-2024 | (425,449 ) | (458,448 ) | 0 | (32,999 ) |
LME Primary Aluminum Futures** | (13 ) | 5-13-2024 | (723,810 ) | (833,849 ) | 0 | (110,039 ) |
LME Zinc Futures** | (9 ) | 5-13-2024 | (550,969 ) | (658,085 ) | 0 | (107,116 ) |
Reformulated Gasoline Blendstock for Oxygen Blending Futures** | (6 ) | 5-31-2024 | (699,547 ) | (678,182 ) | 21,365 | 0 |
Lean Hogs Futures** | (13 ) | 6-14-2024 | (528,078 ) | (532,870 ) | 0 | (4,792 ) |
10-Year Australian Bond | (43 ) | 6-17-2024 | (3,235,098 ) | (3,134,582 ) | 100,516 | 0 |
Australian Dollar Futures | (219 ) | 6-17-2024 | (14,282,229 ) | (14,217,480 ) | 64,749 | 0 |
New Zealand Dollar Futures | (239 ) | 6-17-2024 | (14,438,485 ) | (14,095,025 ) | 343,460 | 0 |
Swedish Krona Futures | (77 ) | 6-17-2024 | (14,462,156 ) | (14,024,780 ) | 437,376 | 0 |
Swiss Franc Futures | (68 ) | 6-17-2024 | (9,771,476 ) | (9,297,300 ) | 474,176 | 0 |
10-Year U.S. Treasury Notes | (34 ) | 6-18-2024 | (3,738,971 ) | (3,652,875 ) | 86,096 | 0 |
Canadian Dollar Futures | (98 ) | 6-18-2024 | (7,120,887 ) | (7,127,050 ) | 0 | (6,163 ) |
Ultra Long Term U.S. Treasury Bond | (73 ) | 6-18-2024 | (9,193,597 ) | (8,728,063 ) | 465,534 | 0 |
10-Year Canadian Bond | (34 ) | 6-19-2024 | (2,958,395 ) | (2,889,376 ) | 69,019 | 0 |
E-Mini Russell 2000 Index | (61 ) | 6-21-2024 | (5,969,230 ) | (6,056,080 ) | 0 | (86,850 ) |
Euro STOXX 50 Index | (139 ) | 6-21-2024 | (7,363,987 ) | (7,264,253 ) | 99,734 | 0 |
MSCI Emerging Markets Index | (233 ) | 6-21-2024 | (12,191,071 ) | (12,139,300 ) | 51,771 | 0 |
U.S. Real Estate Futures | (546 ) | 6-21-2024 | (19,044,538 ) | (17,362,800 ) | 1,681,738 | 0 |
Gold 100 Troy Ounces Futures** | (5 ) | 6-26-2024 | (1,092,883 ) | (1,151,450 ) | 0 | (58,567 ) |
Live Cattle Futures** | (20 ) | 6-28-2024 | (1,472,080 ) | (1,399,800 ) | 72,280 | 0 |
Number 11 World Sugar Futures** | (1 ) | 6-28-2024 | (21,546 ) | (21,739 ) | 0 | (193 ) |
Number 2 Cotton Futures** | (7 ) | 7-9-2024 | (295,831 ) | (274,505 ) | 21,326 | 0 |
C Coffee Futures** | (4 ) | 7-19-2024 | (323,323 ) | (324,975 ) | 0 | (1,652 ) |
Silver Futures** | (4 ) | 7-29-2024 | (574,586 ) | (533,080 ) | 41,506 | 0 |
$4,691,711 | $(7,523,258 ) |
** | Represents an investment held in Real Return Special Investments (Cayman) Ltd., the consolidated entity. |
Assets | |
Investments in unaffiliated securities, at value (cost $110,177,411) | $110,499,706 |
Investments in affiliated securities, at value (cost $107,853,407) | 107,853,407 |
Cash | 139 |
Cash at broker segregated for futures contracts | 20,575,700 |
Foreign currency, at value (cost $24,277) | 24,361 |
Receivable for daily variation margin on open futures contracts | 1,797,020 |
Receivable for dividends and interest | 984,548 |
Unrealized gains on forward foreign currency contracts | 141,834 |
Prepaid expenses and other assets | 1,724 |
Total assets | 241,878,439 |
Liabilities | |
Payable for daily variation margin on open futures contracts | 2,968,015 |
Payable for investments purchased | 101,354 |
Unrealized losses on forward foreign currency contracts | 54,369 |
Advisory fee payable | 53,728 |
Cash collateral due to broker for forward foreign currency contracts | 10,000 |
Accrued expenses and other liabilities | 376,354 |
Total liabilities | 3,563,820 |
Total net assets | $238,314,619 |
Year Ended April 30, 20241 | Year Ended May 31, 2023 | |
Investment income | ||
Interest | $5,885,203 | $9,622,312 |
Income from affiliated securities | 2,723,159 | 71,486 |
Dividends (net of foreign withholdings taxes of $9,061 and $10,736, respectively) | 699,009 | 753,157 |
Total investment income | 9,307,371 | 10,446,955 |
Expenses | ||
Advisory fee | 834,872 | 864,264 |
Custody and accounting fees | 8,477 | 31,990 |
Professional fees | 85,852 | 101,129 |
Interest holder report expenses | 157 | 25,112 |
Trustees’ fees and expenses | 21,510 | 27,209 |
Other fees and expenses | 13,148 | 13,684 |
Total expenses | 964,016 | 1,063,388 |
Less: Fee waivers and/or expense reimbursements | (150,016 ) | (220,731 ) |
Net expenses | 814,000 | 842,657 |
Net investment income | 8,493,371 | 9,604,298 |
Realized and unrealized gains (losses) on investments | ||
Net realized gain (losses) on | ||
Unaffiliated securities | (8,594,832 ) | 219,406 |
Affiliated securities | 0 | (36 ) |
Foreign currency and foreign currency translations | (2,776 ) | (727 ) |
Forward foreign currency contracts | 23,159 | 0 |
Futures contracts | 858,040 | 311,107 |
Net realized gains (losses) on investments | (7,716,409 ) | 529,750 |
Net change in unrealized gains (losses) on | ||
Unaffiliated securities | 7,440,225 | (15,915,117 ) |
Foreign currency and foreign currency translations | 278 | (287 ) |
Forward foreign currency contracts | 87,465 | 0 |
Futures contracts | (2,795,963 ) | (90,057 ) |
Net change in unrealized gains (losses) on investments | 4,732,005 | (16,005,461 ) |
Net realized and unrealized gains (losses) on investments | (2,984,404 ) | (15,475,711 ) |
Net increase (decrease) in net assets resulting from operations | $5,508,967 | $(5,871,413 ) |
Year ended April 30, 20241 | Year ended May 31, 2023 | Year ended May 31, 2022 | ||||
Operations | ||||||
Net investment income | $8,493,371 | $9,604,298 | $12,910,301 | |||
Net realized gains (losses) on investments | (7,716,409 ) | 529,750 | 2,843,667 | |||
Net change in unrealized gains (losses) on investments | 4,732,005 | (16,005,461 ) | (16,501,133 ) | |||
Net increase (decrease) in net assets resulting from operations | 5,508,967 | (5,871,413 ) | (747,165 ) | |||
Capital transactions | ||||||
Transactions in investors’ beneficial interests | ||||||
Contributions | 81,881,639 | 41,232,899 | 73,678,375 | |||
Withdrawals | (60,836,515 ) | (55,196,249 ) | (80,677,859 ) | |||
Net increase (decrease) in net assets resulting from capital share transactions | 21,045,124 | (13,963,350 ) | (6,999,484 ) | |||
Total increase (decrease) in net assets | 26,554,091 | (19,834,763 ) | (7,746,649 ) | |||
Net assets | ||||||
Beginning of period | 211,760,528 | 231,595,291 | 239,341,940 | |||
End of period | $238,314,619 | $211,760,528 | $231,595,291 | |||
Year ended April 30 20241 | Year ended May 31 | |||||
2023 | 2022 | 2021 | 2020 | 2019 | ||
Total return2 | 2.30 % | (2.73 )% | (0.14 )% | 9.58 % | 5.92 % | 2.99 % |
Ratios to average net assets (annualized) | ||||||
Gross expenses | 0.46 % | 0.49 % | 0.48 % | 0.47 % | 0.45 % | 0.45 % |
Net expenses3 | 0.39 % | 0.39 % | 0.39 % | 0.39 % | 0.39 % | 0.40 % |
Net investment income | 4.07 % | 4.45 % | 5.54 % | 2.57 % | 2.16 % | 2.29 % |
Supplemental Data | ||||||
Portfolio turnover rate | 49 % | 22 % | 31 % | 20 % | 24 % | 39 % |
1 | For the eleven months ended April 30, 2024. The Portfolio changed its fiscal year end from May 31 to April 30, effective April 30, 2024. |
2 | Returns for periods of less than one year are not annualized. |
3 | Net expense ratios reflect voluntary waivers, if any. |
Gross unrealized gains | $6,258,092 |
Gross unrealized losses | (6,664,553 ) |
Net unrealized losses | $(406,461 ) |
Quoted prices (Level 1) | Other significant observable inputs (Level 2) | Significant unobservable inputs (Level 3) | Total | |
Assets | ||||
Investments in: | ||||
Common stocks | ||||
Communication services | $1,625,052 | $0 | $0 | $1,625,052 |
Consumer discretionary | 2,335,904 | 0 | 0 | 2,335,904 |
Consumer staples | 711,719 | 0 | 0 | 711,719 |
Energy | 4,433,340 | 0 | 0 | 4,433,340 |
Financials | 2,989,897 | 0 | 0 | 2,989,897 |
Health care | 1,810,627 | 0 | 0 | 1,810,627 |
Industrials | 4,109,581 | 0 | 0 | 4,109,581 |
Information technology | 5,310,587 | 0 | 0 | 5,310,587 |
Materials | 4,645,743 | 155,075 | 0 | 4,800,818 |
Real estate | 13,265,556 | 0 | 0 | 13,265,556 |
Corporate bonds and notes | 0 | 18,385,361 | 0 | 18,385,361 |
Loans | 0 | 703,714 | 0 | 703,714 |
U.S. Treasury securities | 47,049,899 | 0 | 0 | 47,049,899 |
Yankee corporate bonds and notes | 0 | 2,967,651 | 0 | 2,967,651 |
Short-term investments | ||||
Investment companies | 107,853,407 | 0 | 0 | 107,853,407 |
196,141,312 | 22,211,801 | 0 | 218,353,113 | |
Forward foreign currency contracts | 0 | 141,834 | 0 | 141,834 |
Futures contracts | 4,691,711 | 0 | 0 | 4,691,711 |
Total assets | $200,833,023 | $22,353,635 | $0 | $223,186,658 |
Liabilities | ||||
Forward foreign currency contracts | $0 | $54,369 | $0 | $54,369 |
Futures contracts | 7,523,258 | 0 | 0 | 7,523,258 |
Total liabilities | $7,523,258 | $54,369 | $0 | $7,577,627 |
Average daily net assets | Advisory fee |
First $500 million | 0.400 % |
Next $500 million | 0.375 |
Next $2 billion | 0.350 |
Next $2 billion | 0.325 |
Next $5 billion | 0.300 |
Over $10 billion | 0.290 |
Purchases at cost | Sales proceeds | |||
U.S. government | Non-U.S. government | U.S. government | Non-U.S. government | |
Year ended April 30, 2024 | $21,152,846 | $55,965,677 | $116,544,465 | $55,048,007 |
Year ended May 31, 2023 | 28,075,861 | 18,535,675 | 28,686,438 | 23,052,071 |
Forward foreign currency contracts | |
Average contract amounts to buy | $2,390,760 |
Average contract amounts to sell | 3,749,859 |
Futures contracts | |
Average notional balance on long futures | $101,404,762 |
Average notional balance on short futures | 33,903,748 |
Interest rate risk | Commodity risk | Equity risk | Foreign currency risk | Total | |
Asset derivatives | |||||
Forward foreign currency contracts | $0 | $0 | $0 | $141,834 | $141,834 |
Futures contracts | 721,165 * | 561,794 * | 2,088,991 * | 1,319,761 * | 4,691,711 |
$721,165 | $561,794 | $2,088,991 | $1,461,595 | $4,833,545 | |
Liability derivatives | |||||
Forward foreign currency contracts | $0 | $0 | $0 | $54,369 | $54,369 |
Futures contracts | 3,081,237 * | 844,499 * | 3,361,511 * | 236,011 * | 7,523,258 |
$3,081,237 | $844,499 | $3,361,511 | $290,380 | $7,577,627 | |
* | Amount represents the cumulative unrealized gains (losses) as reported in the table following the Consolidated Portfolio of Investments. For futures contracts, only the current day’s variation margin as of April 30, 2024 is reported separately on the Consolidated Statement of Assets and Liabilities. |
INTEREST RATE RISK | Commodity risk | Equity risk | Foreign currency risk | TOTAL | |
Net realized gains (losses) on derivatives | |||||
Forward foreign currency contracts | $0 | $0 | $0 | $23,159 | $23,159 |
Futures contracts | (2,955,926 ) | (898,095 ) | 4,410,685 | 301,376 | 858,040 |
$(2,955,926 ) | $(898,095 ) | $4,410,685 | $324,535 | $881,199 | |
Net change in unrealized gains (losses) on derivatives | |||||
Forward foreign currency contracts | $0 | $0 | $0 | $87,465 | $87,465 |
Futures contracts | (2,324,488 ) | (282,705 ) | (1,272,520 ) | 1,083,750 | (2,795,963 ) |
$(2,324,488 ) | $(282,705 ) | $(1,272,520 ) | $1,171,215 | $(2,708,498 ) | |
Interest rate risk | Total | |
Net realized gains (losses) on derivatives | ||
Futures contracts | $311,107 | $311,107 |
Net change in unrealized gains (losses) on derivatives | ||
Futures contracts | $(90,057 ) | $(90,057 ) |
Counterparty | Gross amounts of assets in the Consolidated Statement of Assets and Liabilities | Amounts subject to netting agreements | Collateral received | Net amount of assets |
Morgan Stanley Inc. | $141,834 | $(54,369 ) | $0 | $87,465 |
Counterparty | Gross amounts of liabilities in the Consolidated Statement of Assets and Liabilities | Amounts subject to netting agreements | Collateral pledged | Net amount of liabilities |
Morgan Stanley Inc. | $54,369 | $(54,369 ) | $0 | $0 |
Allspring Master Trust:
Name and year of birth | Position held and length of service** | Principal occupations during past five years or longer | Current other public company or investment company directorships |
William R. Ebsworth (Born 1957) | Trustee, since 2015 | Retired. From 1984 to 2013, equities analyst, portfolio manager, research director and chief investment officer at Fidelity Management and Research Company in Boston, Tokyo, and Hong Kong, and retired in 2013 as Chief Investment Officer of Fidelity Strategic Advisers, Inc. where he led a team of investment professionals managing client assets. Prior thereto, Board member of Hong Kong Securities Clearing Co., Hong Kong Options Clearing Corp., the Thailand International Fund, Ltd., Fidelity Investments Life Insurance Company, and Empire Fidelity Investments Life Insurance Company. Serves on the Investment Company Institute’s Board of Governors since 2022 and Executive Committee since 2023 as well as the Vice Chairman of the Governing Council of the Independent Directors Council since 2023. Audit Committee Chair and Investment Committee Chair of the Vincent Memorial Hospital Foundation (non-profit organization). Mr. Ebsworth is a CFA charterholder. | N/A |
Jane A. Freeman (Born 1953) | Trustee, since 2015; Chair Liaison, since January 2018*** | Retired. From 2012 to 2014 and 1999 to 2008, Chief Financial Officer of Scientific Learning Corporation. From 2008 to 2012, Ms. Freeman provided consulting services related to strategic business projects. Prior to 1999, Portfolio Manager at Rockefeller & Co. and Scudder, Stevens & Clark. Board member of the Harding Loevner Funds from 1996 to 2014, serving as both Lead Independent Director and chair of the Audit Committee. Board member of the Russell Exchange Traded Funds Trust from 2011 to 2012 and the chair of the Audit Committee. Ms. Freeman is also an inactive Chartered Financial Analyst. | N/A |
Isaiah Harris, Jr. (Born 1952) | Trustee, since 2009; Audit Committee Chair, since 2019 | Retired. Member of the Advisory Board of CEF of East Central Florida. Chairman of the Board of CIGNA Corporation from 2009 to 2021, and Director from 2005 to 2008. From 2003 to 2011, Director of Deluxe Corporation. Prior thereto, President and CEO of BellSouth Advertising and Publishing Corp. from 2005 to 2007, President and CEO of BellSouth Enterprises from 2004 to 2005 and President of BellSouth Consumer Services from 2000 to 2003. Emeritus member of the Iowa State University Foundation Board of Governors. Emeritus Member of the Advisory board of Iowa State University School of Business. Advisory Board Member, Palm Harbor Academy (private school). Advisory Board Member, Fellowship of Christian Athletes. Mr. Harris is a certified public accountant (inactive status). | N/A |
David F. Larcker (Born 1950) | Trustee, since 2009 | Distinguished Visiting Fellow at the Hoover Institution since 2022. James Irvin Miller Professor of Accounting at the Graduate School of Business (Emeritus), Stanford University, Director of the Corporate Governance Research Initiative and Senior Faculty of The Rock Center for Corporate Governance since 2006. From 2005 to 2008, Professor of Accounting at the Graduate School of Business, Stanford University. Prior thereto, Ernst & Young Professor of Accounting at The Wharton School, University of Pennsylvania from 1985 to 2005. | N/A |
Olivia S. Mitchell (Born 1953) | Trustee, since 2006 | International Foundation of Employee Benefit Plans Professor since 1993, Wharton School of the University of Pennsylvania. Director of Wharton’s Pension Research Council and Boettner Center on Pensions & Retirement Research, and Research Associate at the National Bureau of Economic Research. Previously taught at Cornell University from 1978 to 1993. | N/A |
Timothy J. Penny (Born 1951) | Trustee, since 1996; Chair, since 2018 | President and Chief Executive Officer of Southern Minnesota Initiative Foundation, a non-profit organization, since 2007. Vice Chair of the Economic Club of Minnesota, since 2007. Co-Chair of the Committee for a Responsible Federal Budget, since 1995. Member of the Board of Trustees of NorthStar Education Finance, Inc., a non-profit organization, from 2007-2022. Senior Fellow of the University of Minnesota Humphrey Institute from 1995 to 2017. | N/A |
Name and year of birth | Position held and length of service** | Principal occupations during past five years or longer | Current other public company or investment company directorships |
James G. Polisson (Born 1959) | Trustee, since 2018; Nominating and Governance Committee Chair, since 2024 | Retired. Chief Marketing Officer, Source (ETF) UK Services, Ltd, from 2015 to 2017. From 2012 to 2015, Principal of The Polisson Group, LLC, a management consulting, corporate advisory and principal investing company. Chief Executive Officer and Managing Director at Russell Investments, Global Exchange Traded Funds from 2010 to 2012. Managing Director of Barclays Global Investors from 1998 to 2010 and Global Chief Marketing Officer for iShares and Barclays Global Investors from 2000 to 2010. Trustee of the San Francisco Mechanics’ Institute, a non- profit organization, from 2013 to 2015. Board member of the Russell Exchange Traded Fund Trust from 2011 to 2012. Director of Barclays Global Investors Holdings Deutschland GmbH from 2006 to 2009. Mr. Polisson is an attorney and has a retired status with the Massachusetts and District of Columbia Bar Associations. | N/A |
Pamela Wheelock (Born 1959) | Trustee, since January 2020; previously Trustee from January 2018 to July 2019*** | Retired. Executive and Senior Financial leadership positions in the public, private and nonprofit sectors. Interim President and CEO, McKnight Foundation, 2020. Interim Commissioner, Minnesota Department of Human Services, 2019. Chief Operating Officer, Twin Cities Habitat for Humanity, 2017-2019. Vice President for University Services, University of Minnesota, 2012- 2016. Interim President and CEO, Blue Cross and Blue Shield of Minnesota, 2011-2012. Executive Vice-President and Chief Financial Officer, Minnesota Wild, 2002-2008. Commissioner, Minnesota Department of Finance, 1999-2002. Chair of the Board of Directors of Destination Medical Center Corporation. Board member of the Minnesota Wild Foundation. | N/A |
Name and year of birth | Position held and length of service | Principal occupations during past five years or longer |
Andrew Owen (Born 1960) | President, since 2017 | President and Chief Executive Officer of Allspring Funds Management, LLC since 2017 and Head of Global Fund Governance of Allspring Global Investments since 2022. Prior thereto, co-president of Galliard Capital Management, LLC, an affiliate of Allspring Funds Management, LLC, from 2019 to 2022 and Head of Affiliated Managers, Allspring Global Investments, from 2014 to 2019 and Executive Vice President responsible for marketing, investments and product development for Allspring Funds Management, LLC, from 2009 to 2014. |
Jeremy DePalma (Born 1974) | Treasurer, since 2012 (for certain funds in the Fund Complex); since 2021 (for the remaining funds in the Complex) | Senior Vice President of Allspring Funds Management, LLC since 2009. Senior Vice President of Evergreen Investment Management Company, LLC from 2008 to 2010 and head of the Fund Reporting and Control Team within Fund Administration from 2005 to 2010. |
Christopher Baker (Born 1976) | Chief Compliance Officer, since 2022 | Global Chief Compliance Officer for Allspring Global Investments since 2022. Prior thereto, Chief Compliance Officer for State Street Global Advisors from 2018 to 2021. Senior Compliance Officer for the State Street divisions of Alternative Investment Solutions, Sector Solutions, and Global Marketing from 2015 to 2018. From 2010 to 2015 Vice President, Global Head of Investment and Marketing Compliance for State Street Global Advisors. |
Matthew Prasse (Born 1983) | Chief Legal Officer, since 2022; Secretary, since 2021 | Senior Counsel of the Allspring Legal Department since 2021. Senior Counsel of the Wells Fargo Legal Department from 2018 to 2021. Previously, Counsel for Barings LLC from 2015 to 2018. Prior to joining Barings, Associate at Morgan, Lewis & Bockius LLP from 2008 to 2015. |

P.O. Box 219967
Kansas City, MO 64121-9967

AR1753 04-24
2 | |
6 | |
10 | |
11 | |
12 | |
13 | |
15 | |
16 | |
21 | |
25 | |
26 | |
32 | |
33 | |
34 | |
35 | |
36 | |
39 | |
40 |

Allspring Funds

President
Allspring Funds
Notice to Shareholders |
Beginning in July 2024, the Fund will be required by the Securities and Exchange Commission to send shareholders a paper copy of a new tailored shareholder report in place of the full shareholder report that you are now receiving. The tailored shareholder report will contain concise information about the Fund, including certain expense and performance information and fund statistics. If you wish to receive this new tailored shareholder report electronically, please follow the instructions on the back cover of this report. |
Other information that is currently included in the shareholder report, such as the Fund’s financial statements, will be available online and upon request, free of charge, in paper or electronic format. |
Investment objective | The Fund seeks long-term capital appreciation. |
Manager | Allspring Funds Management, LLC |
Subadviser for the affiliated master portfolio* | Peregrine Capital Management, LLC |
Portfolio managers | William A. Grierson, CFA, Paul E. von Kuster, CFA, Allison Lewis, CFA†, Ryan H. Smith, CFA, Samuel D. Smith, CFA |
Average annual total returns (%) as of April 30, 2024 | |||||||||
Including sales charge | Excluding sales charge | Expense ratios1 (%) | |||||||
Inception date | 1 year | 5 year | 10 year | 1 year | 5 year | 10 year | Gross | Net2 | |
Class A (WFSAX) | 1-30-2004 | 6.55 | 5.69 | 7.50 | 13.05 | 6.95 | 8.13 | 1.35 | 1.28 |
Class C (WSMCX) | 1-30-2004 | 11.17 | 6.16 | 7.50 | 12.17 | 6.16 | 7.50 | 2.10 | 2.03 |
Class R6 (WSCRX)3 | 10-31-2014 | – | – | – | 13.54 | 7.41 | 8.61 | 0.93 | 0.86 |
Administrator Class (NVSCX) | 11-11-1994 | – | – | – | 13.16 | 7.06 | 8.27 | 1.28 | 1.19 |
Institutional Class (WSCGX) | 3-31-2008 | – | – | – | 13.41 | 7.33 | 8.54 | 1.03 | 0.94 |
Russell 3000® Index4 | – | – | – | – | 22.30 | 12.43 | 11.81 | – | – |
Russell 2000® Growth Index5 | – | – | – | – | 12.39 | 5.04 | 7.60 | – | – |
1 | Reflects the expense ratios as stated in the most recent prospectuses. The expense ratios shown are subject to change and may differ from the annualized expense ratios shown in the Financial Highlights of this report. |
2 | The manager has contractually committed through September 30, 2024, to waive fees and/or reimburse expenses to the extent necessary to cap total annual fund operating expenses after fee waivers at 1.28% for Class A, 2.03% for Class C, 0.86% for Class R6, 1.19% for Administrator Class and 0.94% for Institutional Class. Brokerage commissions, stamp duty fees, interest, taxes, acquired fund fees and expenses (if any) from funds in which the underlying affiliated master portfolios and funds invest and from money market funds, and extraordinary expenses are excluded from the expense caps. All other acquired fund fees and expenses from the affiliated master portfolios and funds are included in the expense caps. Prior to or after the commitment expiration date, the caps may be increased or the commitment to maintain the caps may be terminated only with the approval of the Board of Trustees. Without these caps, the Fund’s returns would have been lower. The expense ratio paid by an investor is the net expense ratio (the total annual fund operating expenses after fee waivers) as stated in the prospectuses. |
3 | Historical performance shown for the Class R6 shares prior to their inception reflects the performance of the Institutional Class shares, and includes the higher expenses applicable to the Institutional Class shares. If these expenses had not been included, returns for the Class R6 shares would be higher. |
4 | The Russell 3000® Index measures the performance of the 3,000 largest U.S. companies based on total market capitalization, which represents approximately 98% of the investable U.S. equity market. You cannot invest directly in an index. |
5 | The Russell 2000® Growth Index measures the performance of those Russell 2000 companies with higher price/book ratios and higher forecasted growth values. You cannot invest directly in an index. |
* | The Fund is a feeder fund in a master-feeder structure that invests substantially all of its assets in a single affiliated master portfolio of the Allspring Master Trust with a substantially identical investment objective and substantially similar investment strategies. References to the investment activities of the Fund are intended to refer to the investment activities of the affiliated master portfolio in which it invests. |
† | Ms. Lewis became portfolio manager of the Fund on June 30, 2023. |
CFA® and Chartered Financial Analyst® are trademarks owned by CFA Institute. | |
Growth of $10,000 investment as of April 30, 20241 |
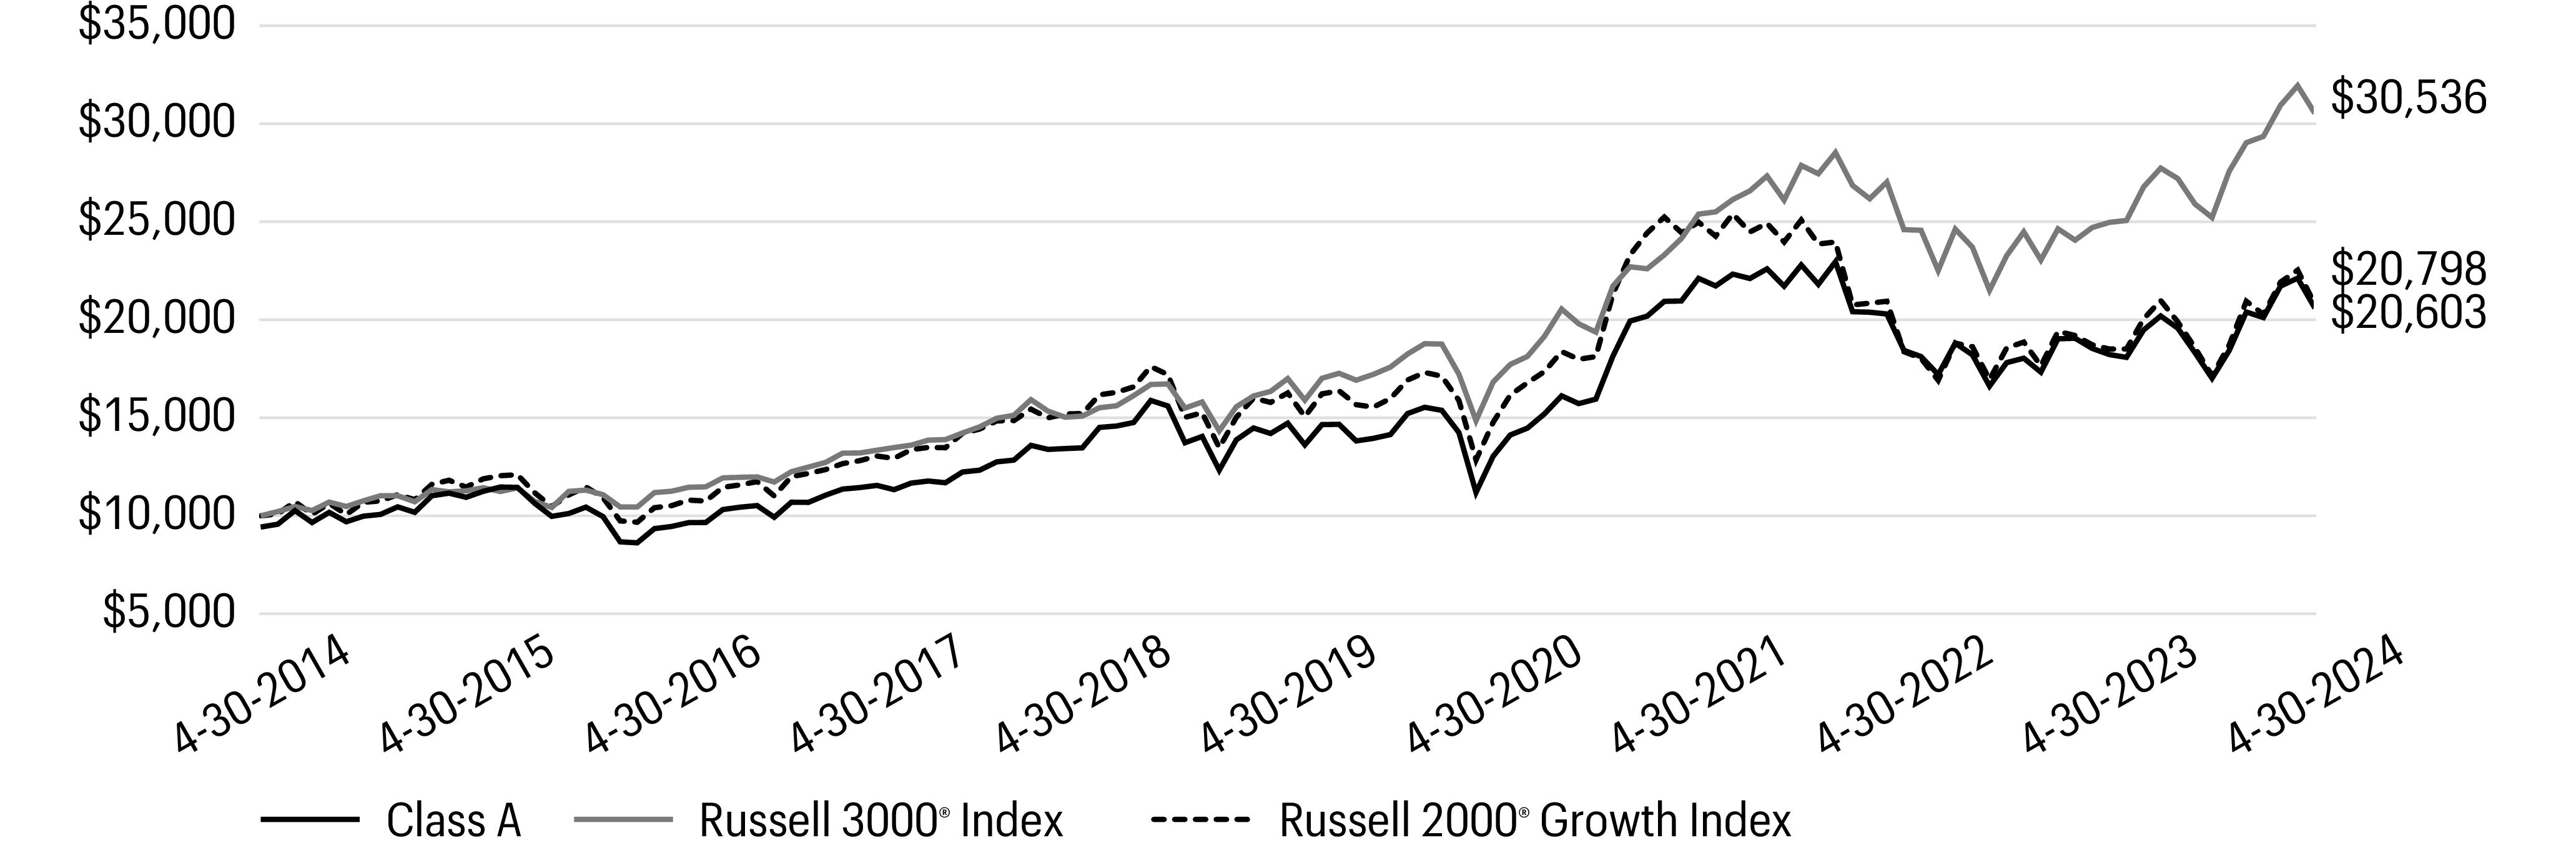
1 | The chart compares the performance of Class A shares for the most recent ten years with the Russell 3000® Index and Russell 2000® Growth Index. The chart assumes a hypothetical investment of $10,000 in Class A shares and reflects all operating expenses and assumes the maximum initial sales charge of 5.75%. |
Ten largest holdings (%) as of April 30, 20241 | |
PTC, Inc. | 1.73 |
ICON PLC | 1.66 |
e.l.f. Beauty, Inc. | 1.47 |
Element Solutions, Inc. | 1.44 |
KBR, Inc. | 1.43 |
ICF International, Inc. | 1.43 |
Stifel Financial Corp. | 1.40 |
Avantor, Inc. | 1.40 |
FTI Consulting, Inc. | 1.35 |
SS&C Technologies Holdings, Inc. | 1.35 |
1 | Each holding represents the Fund’s allocable portion of the affiliated master portfolio security. Figures represent each holding as a percentage of the Fund’s net assets. Holdings are subject to change and may have changed since the date specified. |
Sector allocation as of April 30, 20241 |
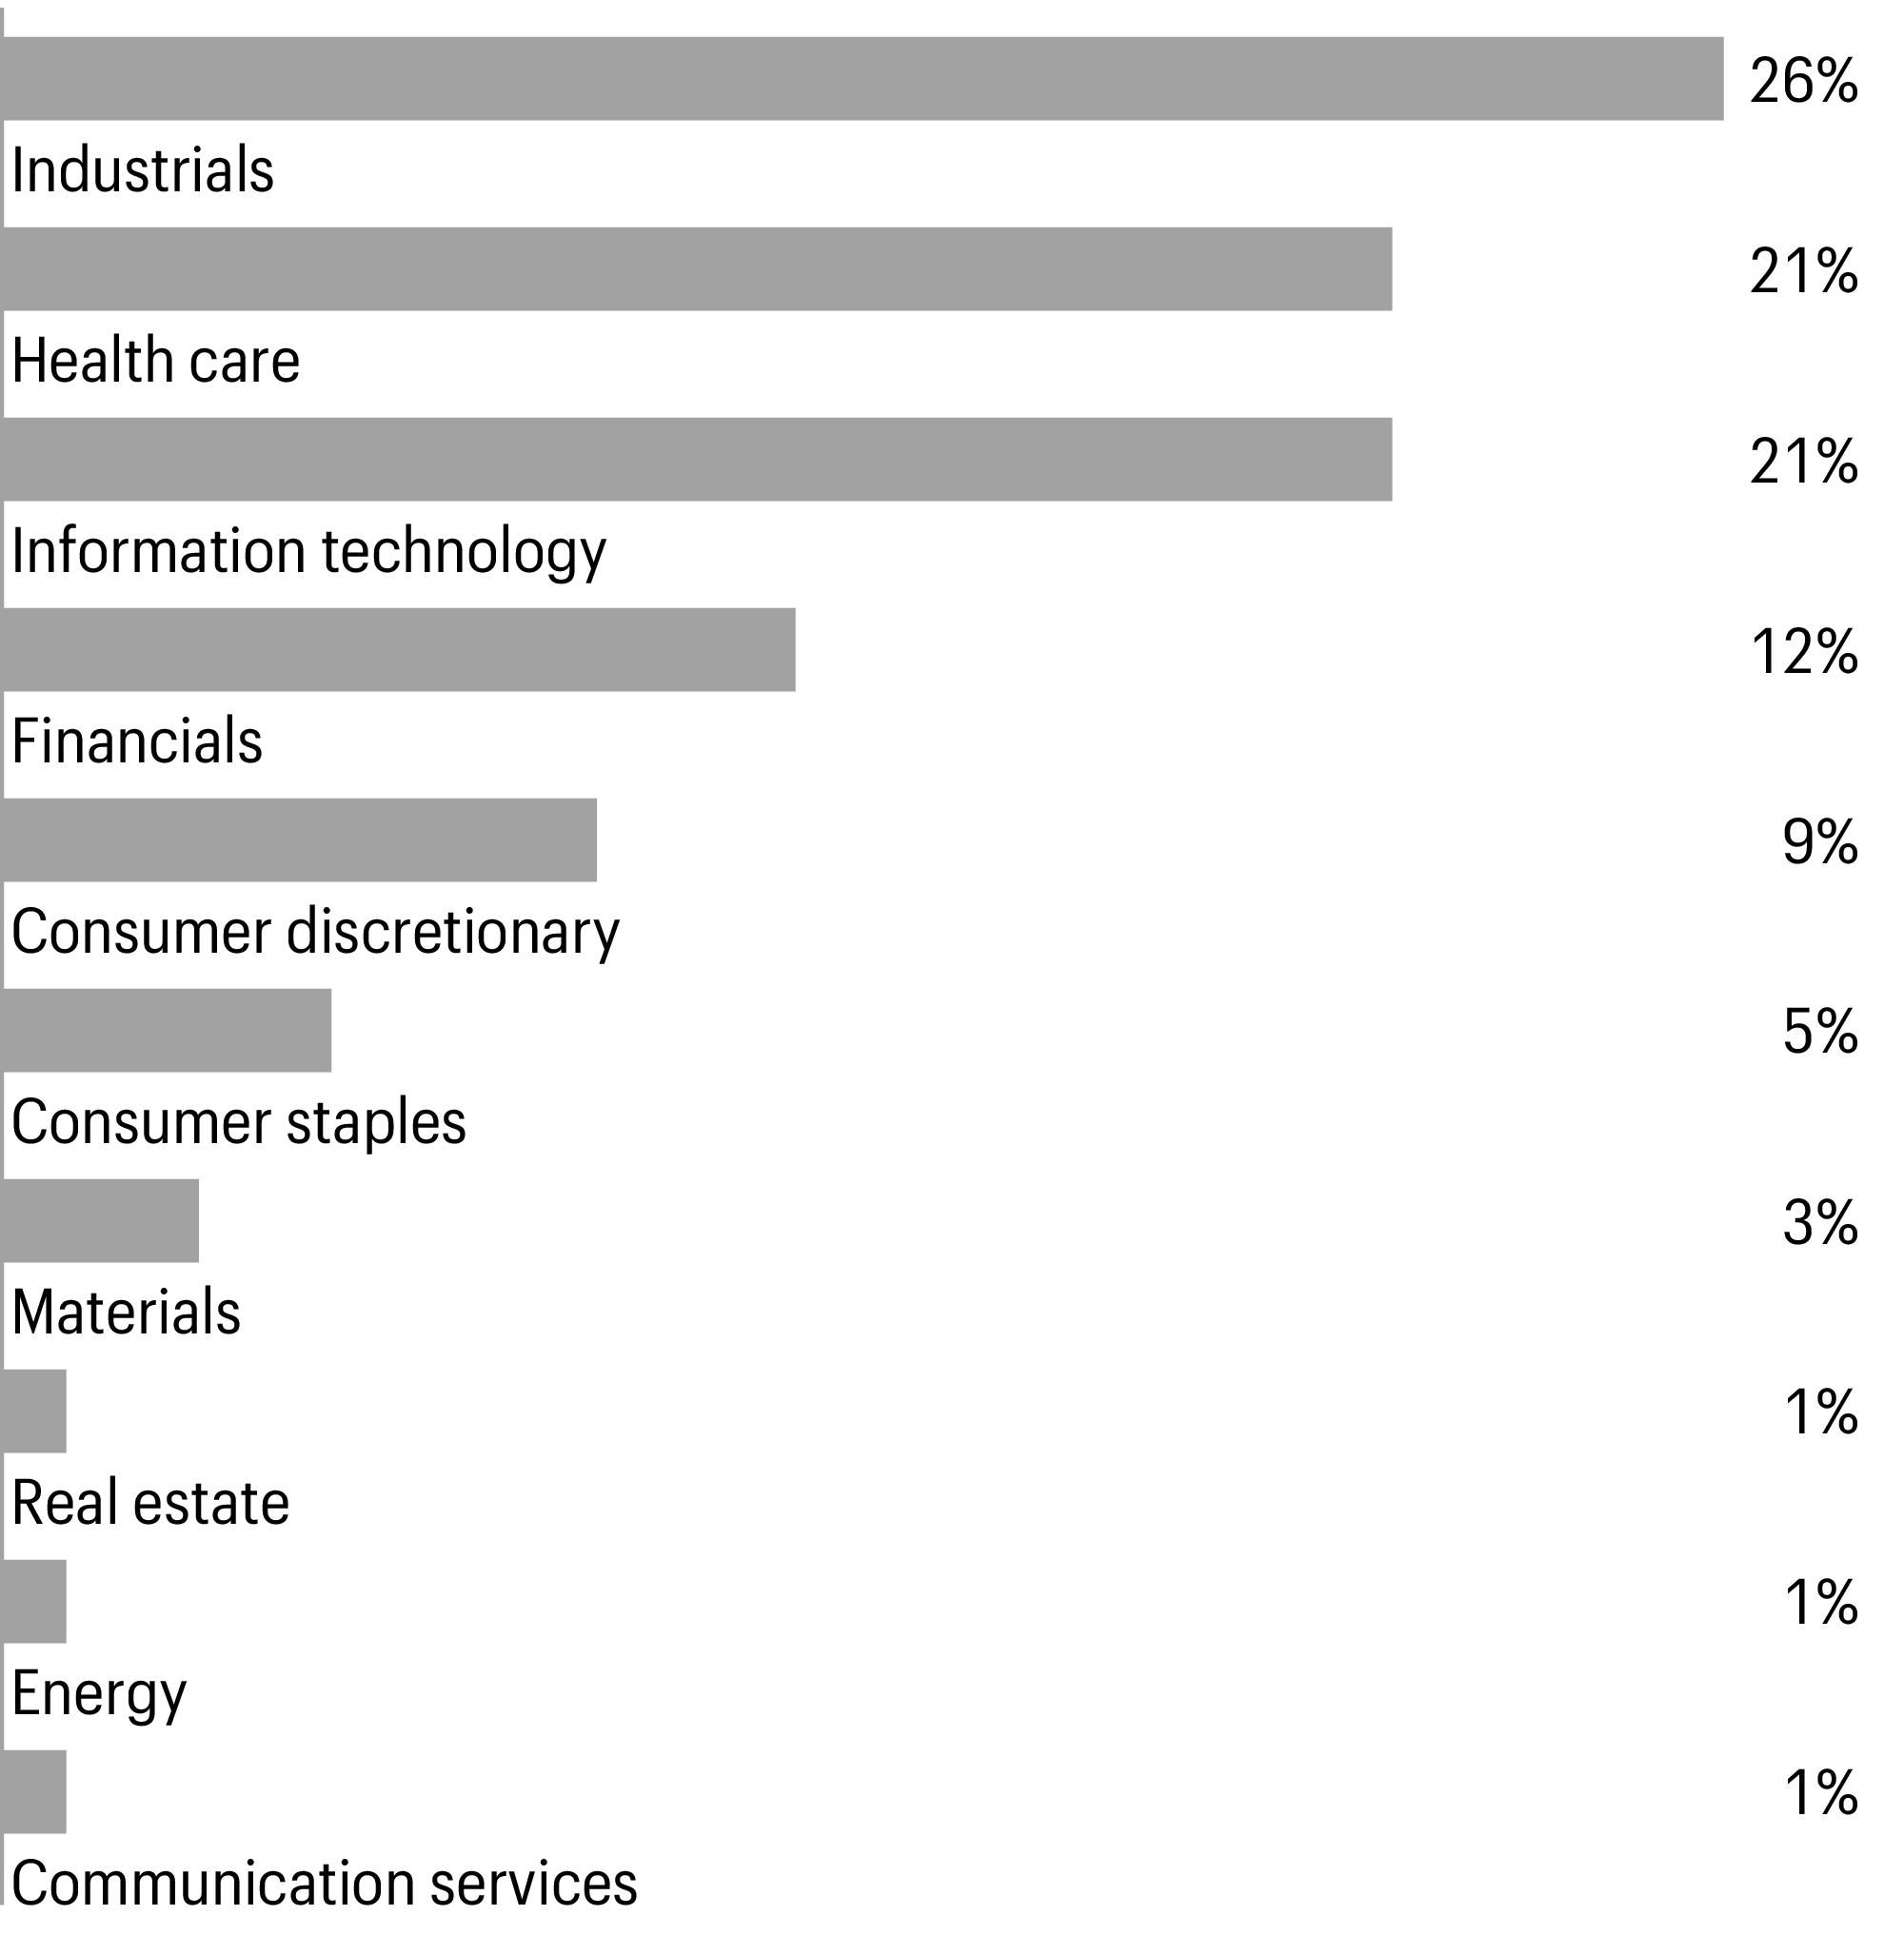
1 | Figures represent the sector allocation of the affiliated master portfolio as a percentage of the long-term investments of the affiliated master portfolio. Allocations are subject to change and may have changed since the date specified. |
* | This security was no longer held at the end of the reporting period. |
Beginning account value 11-1-2023 | Ending account value 4-30-2024 | Expenses paid during the period1 | Annualized net expense ratio | |
Class A | ||||
Actual | $1,000.00 | $1,210.78 | $6.98 | 1.27 % |
Hypothetical (5% return before expenses) | $1,000.00 | $1,018.55 | $6.37 | 1.27 % |
Class C | ||||
Actual | $1,000.00 | $1,206.03 | $11.13 | 2.03 % |
Hypothetical (5% return before expenses) | $1,000.00 | $1,014.77 | $10.17 | 2.03 % |
Class R6 | ||||
Actual | $1,000.00 | $1,213.17 | $4.73 | 0.86 % |
Hypothetical (5% return before expenses) | $1,000.00 | $1,020.59 | $4.32 | 0.86 % |
Administrator Class | ||||
Actual | $1,000.00 | $1,211.46 | $6.54 | 1.19 % |
Hypothetical (5% return before expenses) | $1,000.00 | $1,018.95 | $5.97 | 1.19 % |
Institutional Class | ||||
Actual | $1,000.00 | $1,212.58 | $5.17 | 0.94 % |
Hypothetical (5% return before expenses) | $1,000.00 | $1,020.19 | $4.72 | 0.94 % |
1 | Expenses paid is equal to the annualized net expense ratio of each class multiplied by the average account value over the period, multiplied by 182 divided by 366 (to reflect the one-half-year period). |
Value | ||||||
Investment companies: 99.96% | ||||||
Affiliated master portfolio: 99.96% | ||||||
Allspring Small Company Growth Portfolio | $515,021,748 | |||||
Total investment companies (Cost $377,372,672) | 515,021,748 | |||||
Total investments in securities (Cost $377,372,672) | 99.96 % | 515,021,748 | ||||
Other assets and liabilities, net | 0.04 | 225,420 | ||||
Total net assets | 100.00 % | $515,247,168 | ||||
% of ownership, beginning of period | % of ownership, end of period | Net realized gains (losses) on investments allocated from affiliated Master Portfolio | Net change in unrealized gains (losses) on investments allocated from affiliated Master Portfolio | Dividends allocated from affiliated Master Portfolio | Interest allocated from affiliated Master Portfolio | Affiliated Income Allocated from affiliated Master Portfolio | Value, end of period | |
Allspring Small Company Growth Portfolio | 97.57 % | 96.91 % | $56,352,735 | $18,577,530 | $2,195,448 | $414 | $805,615 | $515,021,748 |
Assets | |
Investments in affiliated Master Portfolio, at value (cost $377,372,672) | $515,021,748 |
Receivable for Fund shares sold | 767,462 |
Receivable from manager | 22,206 |
Prepaid expenses and other assets | 92,342 |
Total assets | 515,903,758 |
Liabilities | |
Payable for Fund shares redeemed | 547,053 |
Administration fees payable | 47,679 |
Distribution fee payable | 669 |
Accrued expenses and other liabilities | 61,189 |
Total liabilities | 656,590 |
Total net assets | $515,247,168 |
Net assets consist of | |
Paid-in capital | $343,811,573 |
Total distributable earnings | 171,435,595 |
Total net assets | $515,247,168 |
Computation of net asset value and offering price per share | |
Net assets–Class A | $47,404,605 |
Shares outstanding–Class A1 | 1,590,220 |
Net asset value per share–Class A | $29.81 |
Maximum offering price per share – Class A2 | $31.63 |
Net assets–Class C | $1,052,061 |
Shares outstanding–Class C1 | 55,445 |
Net asset value per share–Class C | $18.97 |
Net assets–Class R6 | $135,323,080 |
Shares outstanding–Class R61 | 3,704,818 |
Net asset value per share–Class R6 | $36.53 |
Net assets–Administrator Class | $41,454,143 |
Shares outstanding–Administrator Class1 | 1,245,781 |
Net asset value per share–Administrator Class | $33.28 |
Net assets–Institutional Class | $290,013,279 |
Shares outstanding–Institutional Class1 | 8,032,700 |
Net asset value per share–Institutional Class | $36.10 |
Year Ended April 30, 20241 | Year Ended May 31, 2023 | |
Investment income | ||
Dividends allocated from affiliated Master Portfolio (net of foreign withholding taxes of $7,584 and $6,617, respectively) | $2,195,448 | $2,933,185 |
Affiliated income allocated from affiliated Master Portfolio | 805,615 | 707,998 |
Interest allocated from affiliated Master Portfolio | 414 | 398 |
Expenses allocated from affiliated Master Portfolio | (4,567,158 ) | (5,827,191 ) |
Waivers allocated from affiliated Master Portfolio | 108 | 0 |
Total investment income | (1,565,573 ) | (2,185,610 ) |
Expenses | ||
Management fee | 278,633 | 356,726 |
Administration fees | ||
Class A | 73,729 | 64,801 |
Class C | 2,807 | 7,587 |
Class R6 | 45,180 | 66,248 |
Administrator Class | 49,579 | 54,011 |
Institutional Class | 429,508 | 541,590 |
Shareholder servicing fees | ||
Class A | 91,854 | 77,145 |
Class C | 3,458 | 8,958 |
Administrator Class | 95,320 | 103,719 |
Distribution fee | ||
Class C | 10,239 | 26,648 |
Custody and accounting fees | 596 | 24,275 |
Professional fees | 53,122 | 42,482 |
Registration fees | 36,927 | 40,234 |
Shareholder report expenses | 35,759 | 65,109 |
Trustees’ fees and expenses | 21,682 | 21,093 |
Other fees and expenses | 6,519 | 8,608 |
Total expenses | 1,234,912 | 1,509,234 |
Less: Fee waivers and/or expense reimbursements | ||
Fund-level | (385,858 ) | (356,704 ) |
Class A | (1,493 ) | (4,859 ) |
Class R6 | 0 | (33,037 ) |
Year Ended April 30, 20241 | Year Ended May 31, 2023 | |
Administrator Class | (7,536 ) | (14,446 ) |
Institutional Class | (55,428 ) | (146,183 ) |
Net expenses | 784,597 | 954,005 |
Net investment loss | (2,350,170 ) | (3,139,615 ) |
Realized and unrealized gains (losses) on investments | ||
Net realized gains on investments allocated from affiliated Master Portfolio | 56,352,735 | 29,634,010 |
Net change in unrealized gains (losses) on investments allocated from affiliated Master Portfolio | 18,577,530 | (31,050,649 ) |
Net realized and unrealized gains (losses) on investments | 74,930,265 | (1,416,639 ) |
Net increase (decrease) in net assets resulting from operations | $72,580,095 | $(4,556,254 ) |
Year ended April 30, 20241 | Year ended May 31, 2023 | Year ended May 31, 2022 | ||||
Operations | ||||||
Net investment loss | $(2,350,170 ) | $(3,139,615 ) | $(5,624,754 ) | |||
Net realized gains on investments | 56,352,735 | 29,634,010 | 234,292,155 | |||
Net change in unrealized gains (losses) on investments | 18,577,530 | (31,050,649 ) | (380,610,924 ) | |||
Net increase (decrease) in net assets resulting from operations | 72,580,095 | (4,556,254 ) | (151,943,523 ) | |||
Distributions to shareholders from | ||||||
Net investment income and net realized gains | ||||||
Class A | (2,703,387 ) | (2,956,608 ) | (25,935,297 ) | |||
Class C | (117,461 ) | (524,720 ) | (5,561,323 ) | |||
Class R6 | (6,463,913 ) | (18,290,276 ) | (100,466,883 ) | |||
Administrator Class | (2,267,303 ) | (3,736,177 ) | (21,521,432 ) | |||
Institutional Class | (13,806,826 ) | (31,910,643 ) | (248,029,970 ) | |||
Total distributions to shareholders | (25,358,890 ) | (57,418,424 ) | (401,514,905 ) | |||
Capital share transactions | Shares | Shares | Shares | |||
Proceeds from shares sold | ||||||
Class A | 842,346 | 24,265,972 | 226,653 | 6,618,593 | 600,158 | 33,843,292 |
Class C | 9,840 | 189,937 | 8,202 | 151,573 | 89,397 | 4,393,866 |
Class R6 | 957,721 | 34,307,783 | 939,968 | 32,682,134 | 837,876 | 41,916,286 |
Administrator Class | 99,121 | 3,258,303 | 179,672 | 5,855,715 | 132,770 | 6,666,051 |
Institutional Class | 3,523,064 | 123,219,015 | 5,808,569 | 199,389,086 | 8,331,378 | 426,789,587 |
185,241,010 | 244,697,101 | 513,609,082 | ||||
Reinvestment of distributions | ||||||
Class A | 55,967 | 1,584,996 | 94,538 | 2,624,367 | 643,072 | 23,980,172 |
Class C | 5,523 | 99,858 | 27,185 | 501,841 | 206,792 | 5,422,079 |
Class R6 | 169,253 | 5,864,620 | 535,212 | 17,897,479 | 2,119,772 | 93,248,751 |
Administrator Class | 71,657 | 2,265,077 | 121,376 | 3,732,301 | 525,535 | 21,483,861 |
Institutional Class | 239,889 | 8,218,581 | 460,271 | 15,239,567 | 3,043,545 | 132,759,448 |
18,033,132 | 39,995,555 | 276,894,311 | ||||
Payment for shares redeemed | ||||||
Class A | (343,265 ) | (10,054,357 ) | (637,477 ) | (18,452,346 ) | (611,917 ) | (25,389,359 ) |
Class C | (84,851 ) | (1,609,184 ) | (188,144 ) | (3,694,553 ) | (200,817 ) | (6,158,661 ) |
Class R6 | (3,933,361 ) | (140,189,062 ) | (1,131,878 ) | (39,699,243 ) | (2,783,941 ) | (175,259,458 ) |
Administrator Class | (230,979 ) | (7,555,474 ) | (242,658 ) | (7,818,670 ) | (366,235 ) | (17,779,520 ) |
Institutional Class | (8,090,744 ) | (277,115,411 ) | (7,571,990 ) | (262,535,497 ) | (9,833,729 ) | (544,346,151 ) |
(436,523,488 ) | (332,200,309 ) | (768,933,149 ) | ||||
Net increase (decrease) in net assets resulting from capital share transactions | (233,249,346 ) | (47,507,653 ) | 21,570,244 | |||
Total decrease in net assets | (186,028,141 ) | (109,482,331 ) | (531,888,184 ) | |||
Net assets | ||||||
Beginning of period | 701,275,309 | 810,757,640 | 1,342,645,824 | |||
End of period | $515,247,168 | $701,275,309 | $810,757,640 | |||
Year ended April 30 20241 | Year ended May 31 | |||||
Class A | 2023 | 2022 | 2021 | 2020 | 2019 | |
Net asset value, beginning of period | $27.83 | $30.93 | $61.44 | $46.62 | $48.98 | $56.66 |
Net investment loss | (0.19 )2 | (0.23 )2 | (0.47 )2 | (0.47 )2 | (0.34 )2 | (0.36 ) |
Net realized and unrealized gains (losses) on investments | 0.36 | 0.15 | (5.55 ) | 24.27 | 2.49 | (3.22 ) |
Total from investment operations | 0.17 | (0.08 ) | (6.02 ) | 23.80 | 2.15 | (3.58 ) |
Distributions to shareholders from | ||||||
Net realized gains | 1.81 | (3.02 ) | (24.49 ) | (8.98 ) | (4.51 ) | (4.10 ) |
Net asset value, end of period | $29.81 | $27.83 | $30.93 | $61.44 | $46.62 | $48.98 |
Total return3 | 13.94 % | (0.22 )% | (16.59 )% | 53.84 % | 3.70 % | (6.13 )% |
Ratios to average net assets (annualized)* | ||||||
Gross expenses | 1.35 % | 1.36 % | 1.34 % | 1.33 % | 1.32 % | 1.31 % |
Net expenses | 1.28 % | 1.29 % | 1.29 % | 1.29 % | 1.32 % | 1.31 % |
Net investment loss | (0.72 )% | (0.78 )% | (1.04 )% | (0.85 )% | (0.69 )% | (0.63 )% |
Supplemental data | ||||||
Portfolio turnover rate4 | 40 % | 37 % | 61 % | 44 % | 41 % | 54 % |
Net assets, end of period (000s omitted) | $47,405 | $28,813 | $41,795 | $44,249 | $36,534 | $64,182 |
* | Ratios include net expenses allocated from the affiliated Master Portfolio which were as follows: |
Year ended April 30, 20241 | 0.82% |
Year ended May 31, 2023 | 0.82% |
Year ended May 31, 2022 | 0.81% |
Year ended May 31, 2021 | 0.79% |
Year ended May 31, 2020 | 0.78% |
Year ended May 31, 2019 | 0.78% |
1 | For the eleven months ended April 30, 2024. The Fund changed its fiscal year end from May 31 to April 30, effective April 30, 2024. |
2 | Calculated based upon average shares outstanding |
3 | Total return calculations do not include any sales charges. Returns for periods of less than one year are not annualized. |
4 | Portfolio turnover rate is calculated by multiplying the affiliated Master Portfolio’s percentage of the Fund’s total investment in securities at the end of the period by the affiliated Master Portfolio’s portfolio turnover rate. |
Year ended April 30 20241 | Year ended May 31 | |||||
Class C | 2023 | 2022 | 2021 | 2020 | 2019 | |
Net asset value, beginning of period | $18.45 | $21.67 | $50.65 | $39.84 | $42.75 | $50.38 |
Net investment loss | (0.26 )2 | (0.32 )2 | (0.60 )2 | (0.75 )2 | (0.61 )2 | (0.66 )2 |
Net realized and unrealized gains (losses) on investments | (1.03 ) | 0.12 | (3.89 ) | 20.54 | 2.21 | (2.87 ) |
Total from investment operations | (1.29 ) | (0.20 ) | (4.49 ) | 19.79 | 1.60 | (3.53 ) |
Distributions to shareholders from | ||||||
Net realized gains | 1.81 | (3.02 ) | (24.49 ) | (8.98 ) | (4.51 ) | (4.10 ) |
Net asset value, end of period | $18.97 | $18.45 | $21.67 | $50.65 | $39.84 | $42.75 |
Total return3 | 13.09 % | (0.92 )% | (17.25 )% | 52.86 % | 2.92 % | (6.82 )% |
Ratios to average net assets (annualized)* | ||||||
Gross expenses | 2.08 % | 2.09 % | 2.08 % | 2.08 % | 2.07 % | 2.06 % |
Net expenses | 2.03 % | 2.04 % | 2.04 % | 2.04 % | 2.07 % | 2.06 % |
Net investment loss | (1.49 )% | (1.56 )% | (1.71 )% | (1.60 )% | (1.44 )% | (1.38 )% |
Supplemental data | ||||||
Portfolio turnover rate4 | 40 % | 37 % | 61 % | 44 % | 41 % | 54 % |
Net assets, end of period (000s omitted) | $1,052 | $2,305 | $6,018 | $9,235 | $9,336 | $13,968 |
* | Ratios include net expenses allocated from the affiliated Master Portfolio which were as follows: |
Year ended April 30, 20241 | 0.82% |
Year ended May 31, 2023 | 0.82% |
Year ended May 31, 2022 | 0.81% |
Year ended May 31, 2021 | 0.79% |
Year ended May 31, 2020 | 0.78% |
Year ended May 31, 2019 | 0.78% |
1 | For the eleven months ended April 30, 2024. The Fund changed its fiscal year end from May 31 to April 30, effective April 30, 2024. |
2 | Calculated based upon average shares outstanding |
3 | Total return calculations do not include any sales charges. Returns for periods of less than one year are not annualized. |
4 | Portfolio turnover rate is calculated by multiplying the affiliated Master Portfolio’s percentage of the Fund’s total investment in securities at the end of the period by the affiliated Master Portfolio’s portfolio turnover rate. |
Year ended April 30 20241 | Year ended May 31 | |||||
Class R6 | 2023 | 2022 | 2021 | 2020 | 2019 | |
Net asset value, beginning of period | $33.60 | $36.55 | $67.95 | $50.64 | $52.65 | $60.31 |
Net investment loss | (0.10 )2 | (0.12 )2 | (0.26 )2 | (0.17 ) | (0.14 )2 | (0.12 ) |
Net realized and unrealized gains (losses) on investments | 1.22 | 0.19 | (6.65 ) | 26.46 | 2.64 | (3.44 ) |
Total from investment operations | 1.12 | 0.07 | (6.91 ) | 26.29 | 2.50 | (3.56 ) |
Distributions to shareholders from | ||||||
Net realized gains | 1.81 | (3.02 ) | (24.49 ) | (8.98 ) | (4.51 ) | (4.10 ) |
Net asset value, end of period | $36.53 | $33.60 | $36.55 | $67.95 | $50.64 | $52.65 |
Total return3 | 14.38 % | 0.24 % | (16.24 )% | 54.53 % | 4.12 % | (5.73 )% |
Ratios to average net assets (annualized)* | ||||||
Gross expenses | 0.93 % | 0.92 % | 0.91 % | 0.90 % | 0.90 % | 0.88 % |
Net expenses | 0.86 % | 0.86 % | 0.86 % | 0.86 % | 0.89 % | 0.88 % |
Net investment loss | (0.31 )% | (0.35 )% | (0.48 )% | (0.41 )% | (0.27 )% | (0.20 )% |
Supplemental data | ||||||
Portfolio turnover rate4 | 40 % | 37 % | 61 % | 44 % | 41 % | 54 % |
Net assets, end of period (000s omitted) | $135,323 | $218,785 | $225,464 | $407,311 | $462,050 | $564,516 |
* | Ratios include net expenses allocated from the affiliated Master Portfolio which were as follows: |
Year ended April 30, 20241 | 0.82% |
Year ended May 31, 2023 | 0.82% |
Year ended May 31, 2022 | 0.81% |
Year ended May 31, 2021 | 0.79% |
Year ended May 31, 2020 | 0.78% |
Year ended May 31, 2019 | 0.78% |
1 | For the eleven months ended April 30, 2024. The Fund changed its fiscal year end from May 31 to April 30, effective April 30, 2024. |
2 | Calculated based upon average shares outstanding |
3 | Returns for periods of less than one year are not annualized. |
4 | Portfolio turnover rate is calculated by multiplying the affiliated Master Portfolio’s percentage of the Fund’s total investment in securities at the end of the period by the affiliated Master Portfolio’s portfolio turnover rate. |
Year ended April 30 20241 | Year ended May 31 | |||||
Administrator Class | 2023 | 2022 | 2021 | 2020 | 2019 | |
Net asset value, beginning of period | $30.85 | $33.92 | $64.98 | $48.87 | $51.10 | $58.85 |
Net investment loss | (0.19 )2 | (0.22 )2 | (0.47 )2 | (0.44 )2 | (0.29 )2 | (0.29 )2 |
Net realized and unrealized gains (losses) on investments | 0.81 | 0.17 | (6.10 ) | 25.53 | 2.57 | (3.36 ) |
Total from investment operations | 0.62 | (0.05 ) | (6.57 ) | 25.09 | 2.28 | (3.65 ) |
Distributions to shareholders from | ||||||
Net realized gains | 1.81 | (3.02 ) | (24.49 ) | (8.98 ) | (4.51 ) | (4.10 ) |
Net asset value, end of period | $33.28 | $30.85 | $33.92 | $64.98 | $48.87 | $51.10 |
Total return3 | 14.04 % | (0.11 )% | (16.52 )% | 54.02 % | 3.80 % | (6.02 )% |
Ratios to average net assets (annualized)* | ||||||
Gross expenses | 1.28 % | 1.27 % | 1.26 % | 1.25 % | 1.24 % | 1.23 % |
Net expenses | 1.19 % | 1.19 % | 1.19 % | 1.19 % | 1.20 % | 1.20 % |
Net investment loss | (0.64 )% | (0.68 )% | (0.93 )% | (0.74 )% | (0.57 )% | (0.51 )% |
Supplemental data | ||||||
Portfolio turnover rate4 | 40 % | 37 % | 61 % | 44 % | 41 % | 54 % |
Net assets, end of period (000s omitted) | $41,454 | $40,293 | $42,317 | $62,092 | $55,917 | $87,850 |
* | Ratios include net expenses allocated from the affiliated Master Portfolio which were as follows: |
Year ended April 30, 20241 | 0.82% |
Year ended May 31, 2023 | 0.82% |
Year ended May 31, 2022 | 0.81% |
Year ended May 31, 2021 | 0.79% |
Year ended May 31, 2020 | 0.78% |
Year ended May 31, 2019 | 0.78% |
1 | For the eleven months ended April 30, 2024. The Fund changed its fiscal year end from May 31 to April 30, effective April 30, 2024. |
2 | Calculated based upon average shares outstanding |
3 | Returns for periods of less than one year are not annualized. |
4 | Portfolio turnover rate is calculated by multiplying the affiliated Master Portfolio’s percentage of the Fund’s total investment in securities at the end of the period by the affiliated Master Portfolio’s portfolio turnover rate. |
Year ended April 30 20241 | Year ended May 31 | |||||
Institutional Class | 2023 | 2022 | 2021 | 2020 | 2019 | |
Net asset value, beginning of period | $33.26 | $36.24 | $67.62 | $50.47 | $52.51 | $60.20 |
Net investment loss | (0.13 )2 | (0.15 )2 | (0.27 )2 | (0.29 ) | (0.17 )2 | (0.15 ) |
Net realized and unrealized gains (losses) on investments | 1.16 | 0.19 | (6.62 ) | 26.42 | 2.64 | (3.44 ) |
Total from investment operations | 1.03 | 0.04 | (6.89 ) | 26.13 | 2.47 | (3.59 ) |
Distributions to shareholders from | ||||||
Net realized gains | 1.81 | (3.02 ) | (24.49 ) | (8.98 ) | (4.51 ) | (4.10 ) |
Net asset value, end of period | $36.10 | $33.26 | $36.24 | $67.62 | $50.47 | $52.51 |
Total return3 | 14.26 % | 0.16 % | (16.31 )% | 54.39 % | 4.07 % | (5.77 )% |
Ratios to average net assets (annualized)* | ||||||
Gross expenses | 1.03 % | 1.03 % | 1.01 % | 1.00 % | 1.00 % | 0.98 % |
Net expenses | 0.94 % | 0.94 % | 0.94 % | 0.94 % | 0.95 % | 0.95 % |
Net investment loss | (0.41 )% | (0.43 )% | (0.51 )% | (0.49 )% | (0.32 )% | (0.26 )% |
Supplemental data | ||||||
Portfolio turnover rate4 | 40 % | 37 % | 61 % | 44 % | 41 % | 54 % |
Net assets, end of period (000s omitted) | $290,013 | $411,080 | $495,163 | $819,760 | $793,581 | $1,047,883 |
* | Ratios include net expenses allocated from the affiliated Master Portfolio which were as follows: |
Year ended April 30, 20241 | 0.82% |
Year ended May 31, 2023 | 0.82% |
Year ended May 31, 2022 | 0.81% |
Year ended May 31, 2021 | 0.79% |
Year ended May 31, 2020 | 0.78% |
Year ended May 31, 2019 | 0.78% |
1 | For the eleven months ended April 30, 2024. The Fund changed its fiscal year end from May 31 to April 30, effective April 30, 2024. |
2 | Calculated based upon average shares outstanding |
3 | Returns for periods of less than one year are not annualized. |
4 | Portfolio turnover rate is calculated by multiplying the affiliated Master Portfolio’s percentage of the Fund’s total investment in securities at the end of the period by the affiliated Master Portfolio’s portfolio turnover rate. |
Gross unrealized gains | $126,941,831 |
Gross unrealized losses | (0 ) |
Net unrealized gains | $126,941,831 |
Paid-in capital | Total distributable earnings |
$(2,480,322 ) | $2,480,322 |
Affiliated Master Portfolio | Investment objective | Fair value of affiliated Master Portfolio |
Allspring Small Company Growth Portfolio | Seek long-term capital appreciation | $515,021,748 |
Average daily net assets | Management fee |
First $5 billion | 0.050 % |
Next $5 billion | 0.040 |
Over $10 billion | 0.030 |
Class-level administration fee | |
Class A | 0.20 % |
Class C | 0.20 |
Class R6 | 0.03 |
Administrator Class | 0.13 |
Institutional Class | 0.13 |
EXPENSE RATIO CAPS | |
Class A | 1.28 % |
Class C | 2.03 |
Class R6 | 0.86 |
Administrator Class | 1.19 |
Institutional Class | 0.94 |
Year ended May 31 | |||
Year ended April 30, 2024 | 2023 | 2022 | |
Ordinary income | $0 | $0 | $41,089,472 |
Long-term capital gain | 25,358,890 | 57,418,424 | 360,425,433 |
Undistributed long-term gain | Unrealized gains | Late-year ordinary losses deferred |
$45,314,109 | $126,941,831 | $(820,345 ) |
Allspring Funds Trust:

Shares | Value | |||||
Common stocks: 97.87% | ||||||
Communication services: 0.48% | ||||||
Entertainment: 0.48% | ||||||
Lions Gate Entertainment Corp. Class B† | 267,861 | $2,525,929 | ||||
Consumer discretionary: 9.22% | ||||||
Automobile components: 1.67% | ||||||
Modine Manufacturing Co.† | 46,568 | 4,313,594 | ||||
Patrick Industries, Inc. | 43,749 | 4,571,333 | ||||
8,884,927 | ||||||
Broadline retail: 0.82% | ||||||
Ollie’s Bargain Outlet Holdings, Inc.† | 59,569 | 4,356,877 | ||||
Hotels, restaurants & leisure: 2.04% | ||||||
Bowlero Corp. Class A | 128,767 | 1,513,012 | ||||
International Game Technology PLC | 279,990 | 5,527,003 | ||||
Papa John’s International, Inc. | 61,125 | 3,770,801 | ||||
10,810,816 | ||||||
Household durables: 0.78% | ||||||
Skyline Champion Corp.† | 55,456 | 4,158,645 | ||||
Specialty retail: 3.23% | ||||||
Academy Sports & Outdoors, Inc. | 77,028 | 4,490,732 | ||||
Boot Barn Holdings, Inc.† | 38,492 | 4,098,243 | ||||
Burlington Stores, Inc.† | 17,614 | 3,169,463 | ||||
Five Below, Inc.† | 28,834 | 4,219,568 | ||||
Monro, Inc. | 44,207 | 1,204,641 | ||||
17,182,647 | ||||||
Textiles, apparel & luxury goods: 0.68% | ||||||
On Holding AG Class A† | 112,912 | 3,584,956 | ||||
Consumer staples: 4.50% | ||||||
Consumer staples distribution & retail : 1.21% | ||||||
Performance Food Group Co.† | 94,474 | 6,412,895 | ||||
Food products: 1.38% | ||||||
Lamb Weston Holdings, Inc. | 58,371 | 4,864,639 | ||||
SunOpta, Inc.† | 380,413 | 2,491,705 | ||||
7,356,344 | ||||||
Personal care products: 1.91% | ||||||
e.l.f. Beauty, Inc.† | 48,234 | 7,839,472 | ||||
Oddity Tech Ltd. Class A† | 71,135 | 2,314,733 | ||||
10,154,205 | ||||||
Energy: 1.28% | ||||||
Energy equipment & services: 0.79% | ||||||
ChampionX Corp. | 124,788 | 4,189,133 | ||||
Shares | Value | |||||
Oil, gas & consumable fuels: 0.49% | ||||||
APA Corp. | 83,044 | $2,610,904 | ||||
Financials: 11.41% | ||||||
Banks: 0.98% | ||||||
Triumph Financial, Inc.† | 74,019 | 5,207,977 | ||||
Capital markets: 2.95% | ||||||
Evercore, Inc. Class A | 29,349 | 5,326,844 | ||||
Stifel Financial Corp. | 93,208 | 7,449,183 | ||||
Virtu Financial, Inc. Class A | 133,438 | 2,895,605 | ||||
15,671,632 | ||||||
Financial services: 3.23% | ||||||
Essent Group Ltd. | 97,442 | 5,161,502 | ||||
Flywire Corp.† | 190,068 | 3,896,394 | ||||
Shift4 Payments, Inc. Class A† | 59,037 | 3,415,881 | ||||
WEX, Inc.† | 22,211 | 4,692,296 | ||||
17,166,073 | ||||||
Insurance: 4.25% | ||||||
BRP Group, Inc. Class A† | 259,786 | 6,920,699 | ||||
Palomar Holdings, Inc.† | 58,961 | 4,638,462 | ||||
Ryan Specialty Holdings, Inc. | 118,917 | 5,867,365 | ||||
Skyward Specialty Insurance Group, Inc.† | 148,356 | 5,180,591 | ||||
22,607,117 | ||||||
Health care: 20.75% | ||||||
Biotechnology: 8.07% | ||||||
ADMA Biologics, Inc.† | 408,771 | 2,665,187 | ||||
Amicus Therapeutics, Inc.† | 348,298 | 3,479,497 | ||||
Apellis Pharmaceuticals, Inc.† | 44,227 | 1,954,391 | ||||
Blueprint Medicines Corp.† | 44,441 | 4,059,241 | ||||
Cytokinetics, Inc.† | 60,389 | 3,703,053 | ||||
Dynavax Technologies Corp.† | 250,434 | 2,847,435 | ||||
Insmed, Inc.† | 138,065 | 3,412,967 | ||||
Ionis Pharmaceuticals, Inc.† | 56,360 | 2,325,414 | ||||
Kiniksa Pharmaceuticals Ltd. Class A† | 112,230 | 2,100,946 | ||||
Myriad Genetics, Inc.† | 143,160 | 2,801,641 | ||||
Neurocrine Biosciences, Inc.† | 31,730 | 4,364,144 | ||||
Sarepta Therapeutics, Inc.† | 16,466 | 2,085,584 | ||||
SpringWorks Therapeutics, Inc.† | 58,007 | 2,708,347 | ||||
Syndax Pharmaceuticals, Inc.† | 92,972 | 1,964,498 | ||||
Ultragenyx Pharmaceutical, Inc.† | 56,662 | 2,410,401 | ||||
42,882,746 | ||||||
Health care equipment & supplies: 4.67% | ||||||
CONMED Corp. | 44,604 | 3,032,180 | ||||
Glaukos Corp.† | 41,897 | 4,022,112 | ||||
Haemonetics Corp.† | 56,455 | 5,191,037 | ||||
Inari Medical, Inc.† | 84,443 | 3,153,102 | ||||
Shares | Value | |||||
Health care equipment & supplies(continued) | ||||||
iRhythm Technologies, Inc.† | 30,420 | $3,333,424 | ||||
Neogen Corp.† | 268,864 | 3,315,093 | ||||
TransMedics Group, Inc.† | 29,235 | 2,751,890 | ||||
24,798,838 | ||||||
Health care providers & services: 2.10% | ||||||
HealthEquity, Inc.† | 52,259 | 4,123,758 | ||||
Privia Health Group, Inc.† | 135,269 | 2,488,949 | ||||
U.S. Physical Therapy, Inc. | 45,078 | 4,575,868 | ||||
11,188,575 | ||||||
Health care technology: 1.37% | ||||||
Evolent Health, Inc. Class A† | 143,289 | 3,974,837 | ||||
Phreesia, Inc.† | 158,993 | 3,297,514 | ||||
7,272,351 | ||||||
Life sciences tools & services: 3.97% | ||||||
Avantor, Inc.† | 306,472 | 7,425,817 | ||||
Azenta, Inc.† | 45,674 | 2,396,058 | ||||
BioLife Solutions, Inc.† | 139,480 | 2,446,479 | ||||
ICON PLC† | 29,682 | 8,841,674 | ||||
21,110,028 | ||||||
Pharmaceuticals: 0.57% | ||||||
Axsome Therapeutics, Inc.† | 41,059 | 3,028,512 | ||||
Industrials: 25.02% | ||||||
Aerospace & defense: 1.25% | ||||||
AAR Corp.† | 48,397 | 3,346,169 | ||||
Kratos Defense & Security Solutions, Inc.† | 184,658 | 3,290,605 | ||||
6,636,774 | ||||||
Air freight & logistics: 0.57% | ||||||
GXO Logistics, Inc.† | 60,550 | 3,006,913 | ||||
Building products: 2.52% | ||||||
Advanced Drainage Systems, Inc. | 33,640 | 5,281,480 | ||||
AZEK Co., Inc.† | 84,667 | 3,864,202 | ||||
Zurn Elkay Water Solutions Corp. | 136,124 | 4,257,959 | ||||
13,403,641 | ||||||
Commercial services & supplies: 1.85% | ||||||
Montrose Environmental Group, Inc.† | 105,827 | 4,595,008 | ||||
Openlane, Inc.† | 166,923 | 2,867,737 | ||||
RB Global, Inc. | 33,338 | 2,386,334 | ||||
9,849,079 | ||||||
Shares | Value | |||||
Construction & engineering: 2.07% | ||||||
Dycom Industries, Inc.† | 42,754 | $5,986,415 | ||||
MYR Group, Inc.† | 30,240 | 5,027,400 | ||||
11,013,815 | ||||||
Electrical equipment: 1.57% | ||||||
Atkore, Inc. | 26,763 | 4,691,554 | ||||
Generac Holdings, Inc.† | 26,972 | 3,667,113 | ||||
8,358,667 | ||||||
Ground transportation: 1.09% | ||||||
Knight-Swift Transportation Holdings, Inc. | 73,113 | 3,380,014 | ||||
Schneider National, Inc. Class B | 117,145 | 2,422,559 | ||||
5,802,573 | ||||||
Machinery: 3.40% | ||||||
Chart Industries, Inc.† | 30,468 | 4,389,220 | ||||
Flowserve Corp. | 79,055 | 3,728,234 | ||||
SPX Technologies, Inc.† | 52,224 | 6,361,406 | ||||
Wabash National Corp. | 154,840 | 3,578,352 | ||||
18,057,212 | ||||||
Marine transportation: 0.79% | ||||||
Kirby Corp.† | 38,313 | 4,181,098 | ||||
Professional services: 8.09% | ||||||
ASGN, Inc.† | 71,920 | 6,936,684 | ||||
FTI Consulting, Inc.† | 33,675 | 7,200,725 | ||||
ICF International, Inc. | 52,503 | 7,575,658 | ||||
KBR, Inc. | 117,335 | 7,619,735 | ||||
SS&C Technologies Holdings, Inc. | 116,298 | 7,197,683 | ||||
Verra Mobility Corp.† | 274,565 | 6,474,243 | ||||
43,004,728 | ||||||
Trading companies & distributors: 1.82% | ||||||
Boise Cascade Co. | 31,591 | 4,178,542 | ||||
Core & Main, Inc. Class A† | 96,867 | 5,470,079 | ||||
9,648,621 | ||||||
Information technology: 20.74% | ||||||
Communications equipment: 1.43% | ||||||
Ciena Corp.† | 105,307 | 4,868,343 | ||||
Lumentum Holdings, Inc.† | 62,965 | 2,755,348 | ||||
7,623,691 | ||||||
Electronic equipment, instruments & components: 2.67% | ||||||
Advanced Energy Industries, Inc. | 40,491 | 3,880,657 | ||||
Itron, Inc.† | 42,782 | 3,941,078 | ||||
Shares | Value | |||||
Electronic equipment, instruments & components(continued) | ||||||
PAR Technology Corp.† | 72,471 | $3,064,074 | ||||
Rogers Corp.† | 27,720 | 3,301,175 | ||||
14,186,984 | ||||||
Semiconductors & semiconductor equipment: 2.65% | ||||||
FormFactor, Inc.† | 67,779 | 3,022,266 | ||||
Onto Innovation, Inc.† | 22,101 | 4,099,514 | ||||
Synaptics, Inc.† | 30,797 | 2,770,498 | ||||
Teradyne, Inc. | 36,220 | 4,213,110 | ||||
14,105,388 | ||||||
Software: 13.20% | ||||||
BILL Holdings, Inc.† | 38,203 | 2,382,339 | ||||
Box, Inc. Class A† | 231,924 | 6,034,663 | ||||
Confluent, Inc. Class A† | 141,454 | 3,977,687 | ||||
CyberArk Software Ltd.† | 23,913 | 5,721,185 | ||||
DoubleVerify Holdings, Inc.† | 90,791 | 2,660,176 | ||||
HashiCorp, Inc. Class A† | 133,742 | 4,341,265 | ||||
Jamf Holding Corp.† | 240,074 | 4,674,241 | ||||
JFrog Ltd.† | 130,314 | 5,196,922 | ||||
LiveRamp Holdings, Inc.† | 106,677 | 3,425,398 | ||||
Nutanix, Inc. Class A† | 80,733 | 4,900,493 | ||||
PagerDuty, Inc.† | 164,049 | 3,274,418 | ||||
PowerSchool Holdings, Inc. Class A† | 185,394 | 3,211,024 | ||||
PTC, Inc.† | 51,709 | 9,175,245 | ||||
Sprout Social, Inc. Class A† | 73,668 | 3,716,551 | ||||
Varonis Systems, Inc.† | 108,357 | 4,740,619 | ||||
Zuora, Inc. Class A† | 275,188 | 2,713,354 | ||||
70,145,580 | ||||||
Technology hardware, storage & peripherals: 0.79% | ||||||
Pure Storage, Inc. Class A† | 82,755 | 4,170,852 | ||||
Materials: 3.03% | ||||||
Chemicals: 2.27% | ||||||
Element Solutions, Inc. | 330,080 | 7,634,751 | ||||
Orion SA | 187,329 | 4,432,204 | ||||
12,066,955 | ||||||
Metals & mining: 0.76% | ||||||
Steel Dynamics, Inc. | 30,862 | 4,015,763 | ||||
Real estate: 1.44% | ||||||
Hotel & resort REITs: 0.79% | ||||||
Ryman Hospitality Properties, Inc. | 39,766 | 4,194,518 | ||||
Real estate management & development: 0.65% | ||||||
DigitalBridge Group, Inc. | 210,311 | 3,457,513 | ||||
Total common stocks (Cost $329,552,985) | 520,092,492 | |||||
Yield | Shares | Value | ||||
Short-term investments: 2.19% | ||||||
Investment companies: 2.19% | ||||||
Allspring Government Money Market Fund Select Class♠∞ | 5.23 % | 11,643,722 | $11,643,722 | |||
Total short-term investments (Cost $11,643,722) | 11,643,722 | |||||
Total investments in securities (Cost $341,196,707) | 100.06 % | 531,736,214 | ||||
Other assets and liabilities, net | (0.06 ) | (315,145 ) | ||||
Total net assets | 100.00 % | $531,421,069 | ||||
† | Non-income-earning security |
♠ | The issuer of the security is an affiliated person of the Portfolio as defined in the Investment Company Act of 1940. |
∞ | The rate represents the 7-day annualized yield at period end. |
Abbreviations: | |
REIT | Real estate investment trust |
Value, beginning of period | Purchases | Sales proceeds | Net realized gains (losses) | Net change in unrealized gains (losses) | Value, end of period | Shares, end of period | Income from affiliated securities | |
Short-term investments | ||||||||
Allspring Government Money Market Fund Select Class | $22,796,664 | $148,805,761 | $(159,958,703 ) | $0 | $0 | $11,643,722 | 11,643,722 | $828,730 |
Assets | |
Investments in unaffiliated securities, at value (cost $329,552,985) | $520,092,492 |
Investments in affiliated securities, at value (cost $11,643,722) | 11,643,722 |
Receivable for dividends | 69,935 |
Prepaid expenses and other assets | 4,117 |
Total assets | 531,810,266 |
Liabilities | |
Advisory fee payable | 355,785 |
Accrued expenses and other liabilities | 33,412 |
Total liabilities | 389,197 |
Total net assets | $531,421,069 |
Year Ended April 30, 20241 | Year Ended May 31, 2023 | |
Investment income | ||
Dividends (net of foreign withholdings taxes of $7,814 and $6,787, respectively) | $2,260,309 | $3,008,361 |
Income from affiliated securities | 828,730 | 726,054 |
Interest | 424 | 408 |
Total investment income | 3,089,463 | 3,734,823 |
Expenses | ||
Advisory fee | 4,554,403 | 5,792,866 |
Custody and accounting fees | 5,645 | 45,908 |
Professional fees | 58,832 | 61,872 |
Interest holder report expenses | 2,341 | 16,477 |
Trustees’ fees and expenses | 21,511 | 22,389 |
Other fees and expenses | 54,871 | 38,269 |
Total expenses | 4,697,603 | 5,977,781 |
Less: Fee waivers and/or expense reimbursements | (112 ) | 0 |
Net expenses | 4,697,491 | 5,977,781 |
Net investment loss | (1,608,028 ) | (2,242,958 ) |
Realized and unrealized gains (losses) on investments | ||
Unaffiliated securities | 57,215,365 | 29,813,537 |
Affiliated securities | 0 | 561 |
Net realized gains on investments | 57,215,365 | 29,814,098 |
Net change in unrealized gains (losses) on investments | 20,269,586 | (30,986,997 ) |
Net realized and unrealized gains (losses) on investments | 77,484,951 | (1,172,899 ) |
Net increase (decrease) in net assets resulting from operations | $75,876,923 | $(3,415,857 ) |
Year ended April 30, 20241 | Year ended May 31, 2023 | Year ended May 31, 2022 | ||||
Operations | ||||||
Net investment loss | $(1,608,028 ) | $(2,242,958 ) | $(4,263,313 ) | |||
Net realized gains on investments | 57,215,365 | 29,814,098 | 238,329,906 | |||
Net change in unrealized gains (losses) on investments | 20,269,586 | (30,986,997 ) | (388,267,734 ) | |||
Net increase (decrease) in net assets resulting from operations | 75,876,923 | (3,415,857 ) | (154,201,141 ) | |||
Capital transactions | ||||||
Transactions in investors’ beneficial interests | ||||||
Contributions | 70,264,222 | 99,599,958 | 222,703,095 | |||
Withdrawals | (332,276,622 ) | (207,887,653 ) | (617,532,776 ) | |||
Net decrease in net assets resulting from capital share transactions | (262,012,400 ) | (108,287,695 ) | (394,829,681 ) | |||
Total decrease in net assets | (186,135,477 ) | (111,703,552 ) | (549,030,822 ) | |||
Net assets | ||||||
Beginning of period | 717,556,546 | 829,260,098 | 1,378,290,920 | |||
End of period | $531,421,069 | $717,556,546 | $829,260,098 | |||
Year ended April 30 20241 | Year ended May 31 | |||||
2023 | 2022 | 2021 | 2020 | 2019 | ||
Total return2 | 14.36 % | 0.24 % | (16.28 )% | 54.64 % | 4.08 % | (5.64 )% |
Ratios to average net assets (annualized) | ||||||
Gross expenses | 0.82 % | 0.82 % | 0.81 % | 0.79 % | 0.78 % | 0.78 % |
Net expenses3 | 0.82 % | 0.82 % | 0.81 % | 0.79 % | 0.78 % | 0.78 % |
Net investment loss | (0.28 )% | (0.31 )% | (0.42 )% | (0.34 )% | (0.16 )% | (0.09 )% |
Supplemental Data | ||||||
Portfolio turnover rate | 40 % | 37 % | 61 % | 44 % | 41 % | 54 % |
1 | For the eleven months ended April 30, 2024. The Portfolio changed its fiscal year end from May 31 to April 30, effective April 30, 2024. |
2 | Returns for periods of less than one year are not annualized. |
3 | Net expense ratios reflect voluntary waivers, if any. |
Gross unrealized gains | $211,956,719 |
Gross unrealized losses | (39,344,857 ) |
Net unrealized gains | $172,611,862 |
Quoted prices (Level 1) | Other significant observable inputs (Level 2) | Significant unobservable inputs (Level 3) | Total | |
Assets | ||||
Investments in: | ||||
Common stocks | ||||
Communication services | $2,525,929 | $0 | $0 | $2,525,929 |
Consumer discretionary | 48,978,868 | 0 | 0 | 48,978,868 |
Consumer staples | 23,923,444 | 0 | 0 | 23,923,444 |
Energy | 6,800,037 | 0 | 0 | 6,800,037 |
Financials | 60,652,799 | 0 | 0 | 60,652,799 |
Health care | 110,281,050 | 0 | 0 | 110,281,050 |
Industrials | 132,963,121 | 0 | 0 | 132,963,121 |
Information technology | 110,232,495 | 0 | 0 | 110,232,495 |
Materials | 16,082,718 | 0 | 0 | 16,082,718 |
Real estate | 7,652,031 | 0 | 0 | 7,652,031 |
Short-term investments | ||||
Investment companies | 11,643,722 | 0 | 0 | 11,643,722 |
Total assets | $531,736,214 | $0 | $0 | $531,736,214 |
Average daily net assets | Advisory fee |
First $500 million | 0.800 % |
Next $500 million | 0.775 |
Next $1 billion | 0.750 |
Next $1 billion | 0.725 |
Next $1 billion | 0.700 |
Over $4 billion | 0.680 |
Allspring Master Trust:
April 30, 2024.
Name and year of birth | Position held and length of service** | Principal occupations during past five years or longer | Current other public company or investment company directorships |
William R. Ebsworth (Born 1957) | Trustee, since 2015 | Retired. From 1984 to 2013, equities analyst, portfolio manager, research director and chief investment officer at Fidelity Management and Research Company in Boston, Tokyo, and Hong Kong, and retired in 2013 as Chief Investment Officer of Fidelity Strategic Advisers, Inc. where he led a team of investment professionals managing client assets. Prior thereto, Board member of Hong Kong Securities Clearing Co., Hong Kong Options Clearing Corp., the Thailand International Fund, Ltd., Fidelity Investments Life Insurance Company, and Empire Fidelity Investments Life Insurance Company. Serves on the Investment Company Institute’s Board of Governors since 2022 and Executive Committee since 2023 as well as the Vice Chairman of the Governing Council of the Independent Directors Council since 2023. Audit Committee Chair and Investment Committee Chair of the Vincent Memorial Hospital Foundation (non-profit organization). Mr. Ebsworth is a CFA charterholder. | N/A |
Jane A. Freeman (Born 1953) | Trustee, since 2015; Chair Liaison, since January 2018*** | Retired. From 2012 to 2014 and 1999 to 2008, Chief Financial Officer of Scientific Learning Corporation. From 2008 to 2012, Ms. Freeman provided consulting services related to strategic business projects. Prior to 1999, Portfolio Manager at Rockefeller & Co. and Scudder, Stevens & Clark. Board member of the Harding Loevner Funds from 1996 to 2014, serving as both Lead Independent Director and chair of the Audit Committee. Board member of the Russell Exchange Traded Funds Trust from 2011 to 2012 and the chair of the Audit Committee. Ms. Freeman is also an inactive Chartered Financial Analyst. | N/A |
Isaiah Harris, Jr. (Born 1952) | Trustee, since 2009; Audit Committee Chair, since 2019 | Retired. Member of the Advisory Board of CEF of East Central Florida. Chairman of the Board of CIGNA Corporation from 2009 to 2021, and Director from 2005 to 2008. From 2003 to 2011, Director of Deluxe Corporation. Prior thereto, President and CEO of BellSouth Advertising and Publishing Corp. from 2005 to 2007, President and CEO of BellSouth Enterprises from 2004 to 2005 and President of BellSouth Consumer Services from 2000 to 2003. Emeritus member of the Iowa State University Foundation Board of Governors. Emeritus Member of the Advisory board of Iowa State University School of Business. Advisory Board Member, Palm Harbor Academy (private school). Advisory Board Member, Fellowship of Christian Athletes. Mr. Harris is a certified public accountant (inactive status). | N/A |
David F. Larcker (Born 1950) | Trustee, since 2009 | Distinguished Visiting Fellow at the Hoover Institution since 2022. James Irvin Miller Professor of Accounting at the Graduate School of Business (Emeritus), Stanford University, Director of the Corporate Governance Research Initiative and Senior Faculty of The Rock Center for Corporate Governance since 2006. From 2005 to 2008, Professor of Accounting at the Graduate School of Business, Stanford University. Prior thereto, Ernst & Young Professor of Accounting at The Wharton School, University of Pennsylvania from 1985 to 2005. | N/A |
Olivia S. Mitchell (Born 1953) | Trustee, since 2006 | International Foundation of Employee Benefit Plans Professor since 1993, Wharton School of the University of Pennsylvania. Director of Wharton’s Pension Research Council and Boettner Center on Pensions & Retirement Research, and Research Associate at the National Bureau of Economic Research. Previously taught at Cornell University from 1978 to 1993. | N/A |
Timothy J. Penny (Born 1951) | Trustee, since 1996; Chair, since 2018 | President and Chief Executive Officer of Southern Minnesota Initiative Foundation, a non-profit organization, since 2007. Vice Chair of the Economic Club of Minnesota, since 2007. Co-Chair of the Committee for a Responsible Federal Budget, since 1995. Member of the Board of Trustees of NorthStar Education Finance, Inc., a non-profit organization, from 2007-2022. Senior Fellow of the University of Minnesota Humphrey Institute from 1995 to 2017. | N/A |
Name and year of birth | Position held and length of service** | Principal occupations during past five years or longer | Current other public company or investment company directorships |
James G. Polisson (Born 1959) | Trustee, since 2018; Nominating and Governance Committee Chair, since 2024 | Retired. Chief Marketing Officer, Source (ETF) UK Services, Ltd, from 2015 to 2017. From 2012 to 2015, Principal of The Polisson Group, LLC, a management consulting, corporate advisory and principal investing company. Chief Executive Officer and Managing Director at Russell Investments, Global Exchange Traded Funds from 2010 to 2012. Managing Director of Barclays Global Investors from 1998 to 2010 and Global Chief Marketing Officer for iShares and Barclays Global Investors from 2000 to 2010. Trustee of the San Francisco Mechanics’ Institute, a non- profit organization, from 2013 to 2015. Board member of the Russell Exchange Traded Fund Trust from 2011 to 2012. Director of Barclays Global Investors Holdings Deutschland GmbH from 2006 to 2009. Mr. Polisson is an attorney and has a retired status with the Massachusetts and District of Columbia Bar Associations. | N/A |
Pamela Wheelock (Born 1959) | Trustee, since January 2020; previously Trustee from January 2018 to July 2019*** | Retired. Executive and Senior Financial leadership positions in the public, private and nonprofit sectors. Interim President and CEO, McKnight Foundation, 2020. Interim Commissioner, Minnesota Department of Human Services, 2019. Chief Operating Officer, Twin Cities Habitat for Humanity, 2017-2019. Vice President for University Services, University of Minnesota, 2012- 2016. Interim President and CEO, Blue Cross and Blue Shield of Minnesota, 2011-2012. Executive Vice-President and Chief Financial Officer, Minnesota Wild, 2002-2008. Commissioner, Minnesota Department of Finance, 1999-2002. Chair of the Board of Directors of Destination Medical Center Corporation. Board member of the Minnesota Wild Foundation. | N/A |
Name and year of birth | Position held and length of service | Principal occupations during past five years or longer |
Andrew Owen (Born 1960) | President, since 2017 | President and Chief Executive Officer of Allspring Funds Management, LLC since 2017 and Head of Global Fund Governance of Allspring Global Investments since 2022. Prior thereto, co-president of Galliard Capital Management, LLC, an affiliate of Allspring Funds Management, LLC, from 2019 to 2022 and Head of Affiliated Managers, Allspring Global Investments, from 2014 to 2019 and Executive Vice President responsible for marketing, investments and product development for Allspring Funds Management, LLC, from 2009 to 2014. |
Jeremy DePalma (Born 1974) | Treasurer, since 2012 (for certain funds in the Fund Complex); since 2021 (for the remaining funds in the Complex) | Senior Vice President of Allspring Funds Management, LLC since 2009. Senior Vice President of Evergreen Investment Management Company, LLC from 2008 to 2010 and head of the Fund Reporting and Control Team within Fund Administration from 2005 to 2010. |
Christopher Baker (Born 1976) | Chief Compliance Officer, since 2022 | Global Chief Compliance Officer for Allspring Global Investments since 2022. Prior thereto, Chief Compliance Officer for State Street Global Advisors from 2018 to 2021. Senior Compliance Officer for the State Street divisions of Alternative Investment Solutions, Sector Solutions, and Global Marketing from 2015 to 2018. From 2010 to 2015 Vice President, Global Head of Investment and Marketing Compliance for State Street Global Advisors. |
Matthew Prasse (Born 1983) | Chief Legal Officer, since 2022; Secretary, since 2021 | Senior Counsel of the Allspring Legal Department since 2021. Senior Counsel of the Wells Fargo Legal Department from 2018 to 2021. Previously, Counsel for Barings LLC from 2015 to 2018. Prior to joining Barings, Associate at Morgan, Lewis & Bockius LLP from 2008 to 2015. |

P.O. Box 219967
Kansas City, MO 64121-9967

AR1848 04-24
2 | |
6 | |
10 | |
11 | |
12 | |
13 | |
15 | |
17 | |
22 | |
26 | |
27 | |
34 | |
35 | |
36 | |
37 | |
38 | |
41 | |
42 |

Allspring Funds

President
Allspring Funds
Notice to Shareholders |
Beginning in July 2024, the Fund will be required by the Securities and Exchange Commission to send shareholders a paper copy of a new tailored shareholder report in place of the full shareholder report that you are now receiving. The tailored shareholder report will contain concise information about the Fund, including certain expense and performance information and fund statistics. If you wish to receive this new tailored shareholder report electronically, please follow the instructions on the back cover of this report. |
Other information that is currently included in the shareholder report, such as the Fund’s financial statements, will be available online and upon request, free of charge, in paper or electronic format. |
Investment objective | The Fund seeks long-term capital appreciation. |
Manager | Allspring Funds Management, LLC |
Subadviser for the affiliated master portfolio* | Allspring Global Investments, LLC |
Portfolio managers | Jeff Goverman, Gustaf Little, Garth R. Nisbet, CFA |
Average annual total returns (%) as of April 30, 2024 | |||||||||
Including sales charge | Excluding sales charge | Expense ratios1 (%) | |||||||
Inception date | 1 year | 5 year | 10 year | 1 year | 5 year | 10 year | Gross | Net2 | |
Class A (SCVAX) | 1-31-2002 | 10.38 | 7.35 | 6.70 | 17.11 | 8.63 | 7.33 | 1.31 | 1.15 |
Class C (SCVFX) | 8-30-2002 | 15.20 | 7.84 | 6.71 | 16.20 | 7.84 | 6.71 | 2.06 | 1.90 |
Class R6 (SCVJX)3 | 10-31-2016 | – | – | – | 17.57 | 9.06 | 7.75 | 0.89 | 0.75 |
Administrator Class (SCVIX) | 1-31-2002 | – | – | – | 17.22 | 8.72 | 7.46 | 1.24 | 1.05 |
Institutional Class (SCVNX) | 7-30-2010 | – | – | – | 17.45 | 8.94 | 7.68 | 0.99 | 0.85 |
Russell 3000® Index4 | – | – | – | – | 22.30 | 12.43 | 11.81 | – | – |
Russell 2000® Value Index5 | – | – | – | – | 14.03 | 5.96 | 6.45 | – | – |
1 | Reflects the expense ratios as stated in the most recent prospectuses. The expense ratios shown are subject to change and may differ from the annualized expense ratios shown in the Financial Highlights of this report. |
2 | The manager has contractually committed through September 30, 2025, to waive fees and/or reimburse expenses to the extent necessary to cap total annual fund operating expenses after fee waivers at 1.15% for Class A, 1.90% for Class C, 0.75% for Class R6, 1.05% for Administrator Class and 0.85% for Institutional Class. Brokerage commissions, stamp duty fees, interest, taxes, acquired fund fees and expenses (if any) from funds in which the affiliated master portfolio invests, and extraordinary expenses are excluded from the expense caps. Net expenses from the affiliated master portfolio are included in the expense caps. Prior to or after the commitment expiration date, the caps may be increased or the commitment to maintain the caps may be terminated only with the approval of the Board of Trustees. Without these caps, the Fund’s returns would have been lower. The expense ratio paid by an investor is the net expense ratio (the total annual fund operating expenses after fee waivers) as stated in the prospectuses. |
3 | Historical performance shown for the Class R6 shares prior to their inception reflects the performance of the Institutional Class shares, and includes the higher expenses applicable to the Institutional Class shares. If these expenses had not been included, returns for the Class R6 shares would be higher. |
4 | The Russell 3000® Index measures the performance of the 3,000 largest U.S. companies based on total market capitalization, which represents approximately 98% of the investable U.S. equity market. You cannot invest directly in an index. |
5 | The Russell 2000® Value Index measures the performance of those Russell 2000 companies with lower price/book ratios and lower forecasted growth values. You cannot invest directly in an index. |
* | The Fund is a feeder fund in a master-feeder structure that invests substantially all of its assets in a single affiliated master portfolio of the Allspring Master Trust with a substantially identical investment objective and substantially similar investment strategies. References to the investment activities of the Fund are intended to refer to the investment activities of the affiliated master portfolio in which it invests. |
CFA® and Chartered Financial Analyst® are trademarks owned by CFA Institute. | |
Growth of $10,000 investment as of April 30, 20241 |
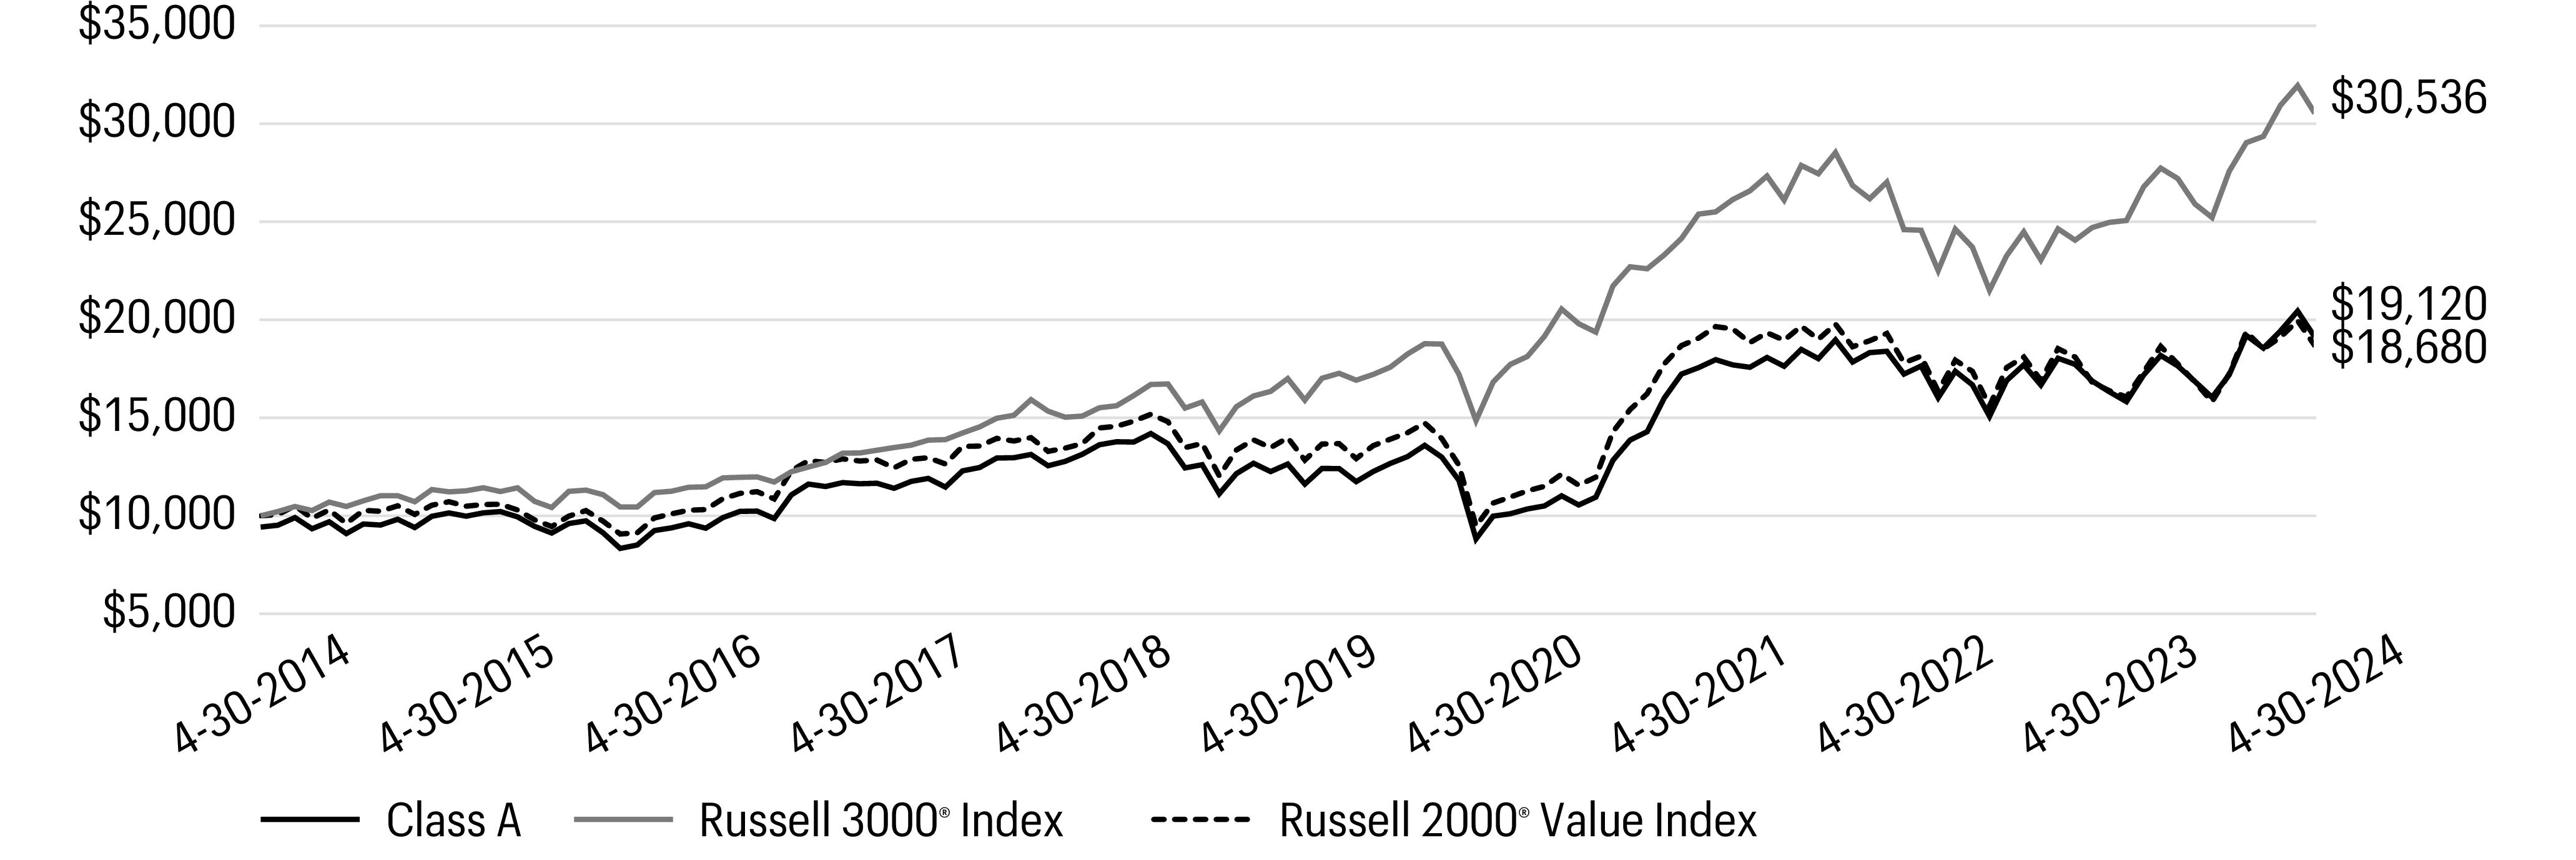
1 | The chart compares the performance of Class A shares for the most recent ten years with the Russell 3000® Index and Russell 2000® Value Index. The chart assumes a hypothetical investment of $10,000 in Class A shares and reflects all operating expenses and assumes the maximum initial sales charge of 5.75%. |
Ten largest holdings (%) as of April 30, 20241 | |
Piper Sandler Cos. | 1.34 |
Stifel Financial Corp. | 1.33 |
Jackson Financial, Inc. Class A | 1.22 |
Ameris Bancorp | 1.15 |
Civitas Resources, Inc. | 1.15 |
OFG Bancorp | 1.14 |
Synovus Financial Corp. | 1.13 |
Wintrust Financial Corp. | 1.12 |
SM Energy Co. | 1.12 |
Atlantic Union Bankshares Corp. | 1.12 |
1 | Each holding represents the Fund’s allocable portion of the affiliated master portfolio security. Figures represent each holding as a percentage of the Fund’s net assets. Holdings are subject to change and may have changed since the date specified. |
Sector allocation as of April 30, 20241 |
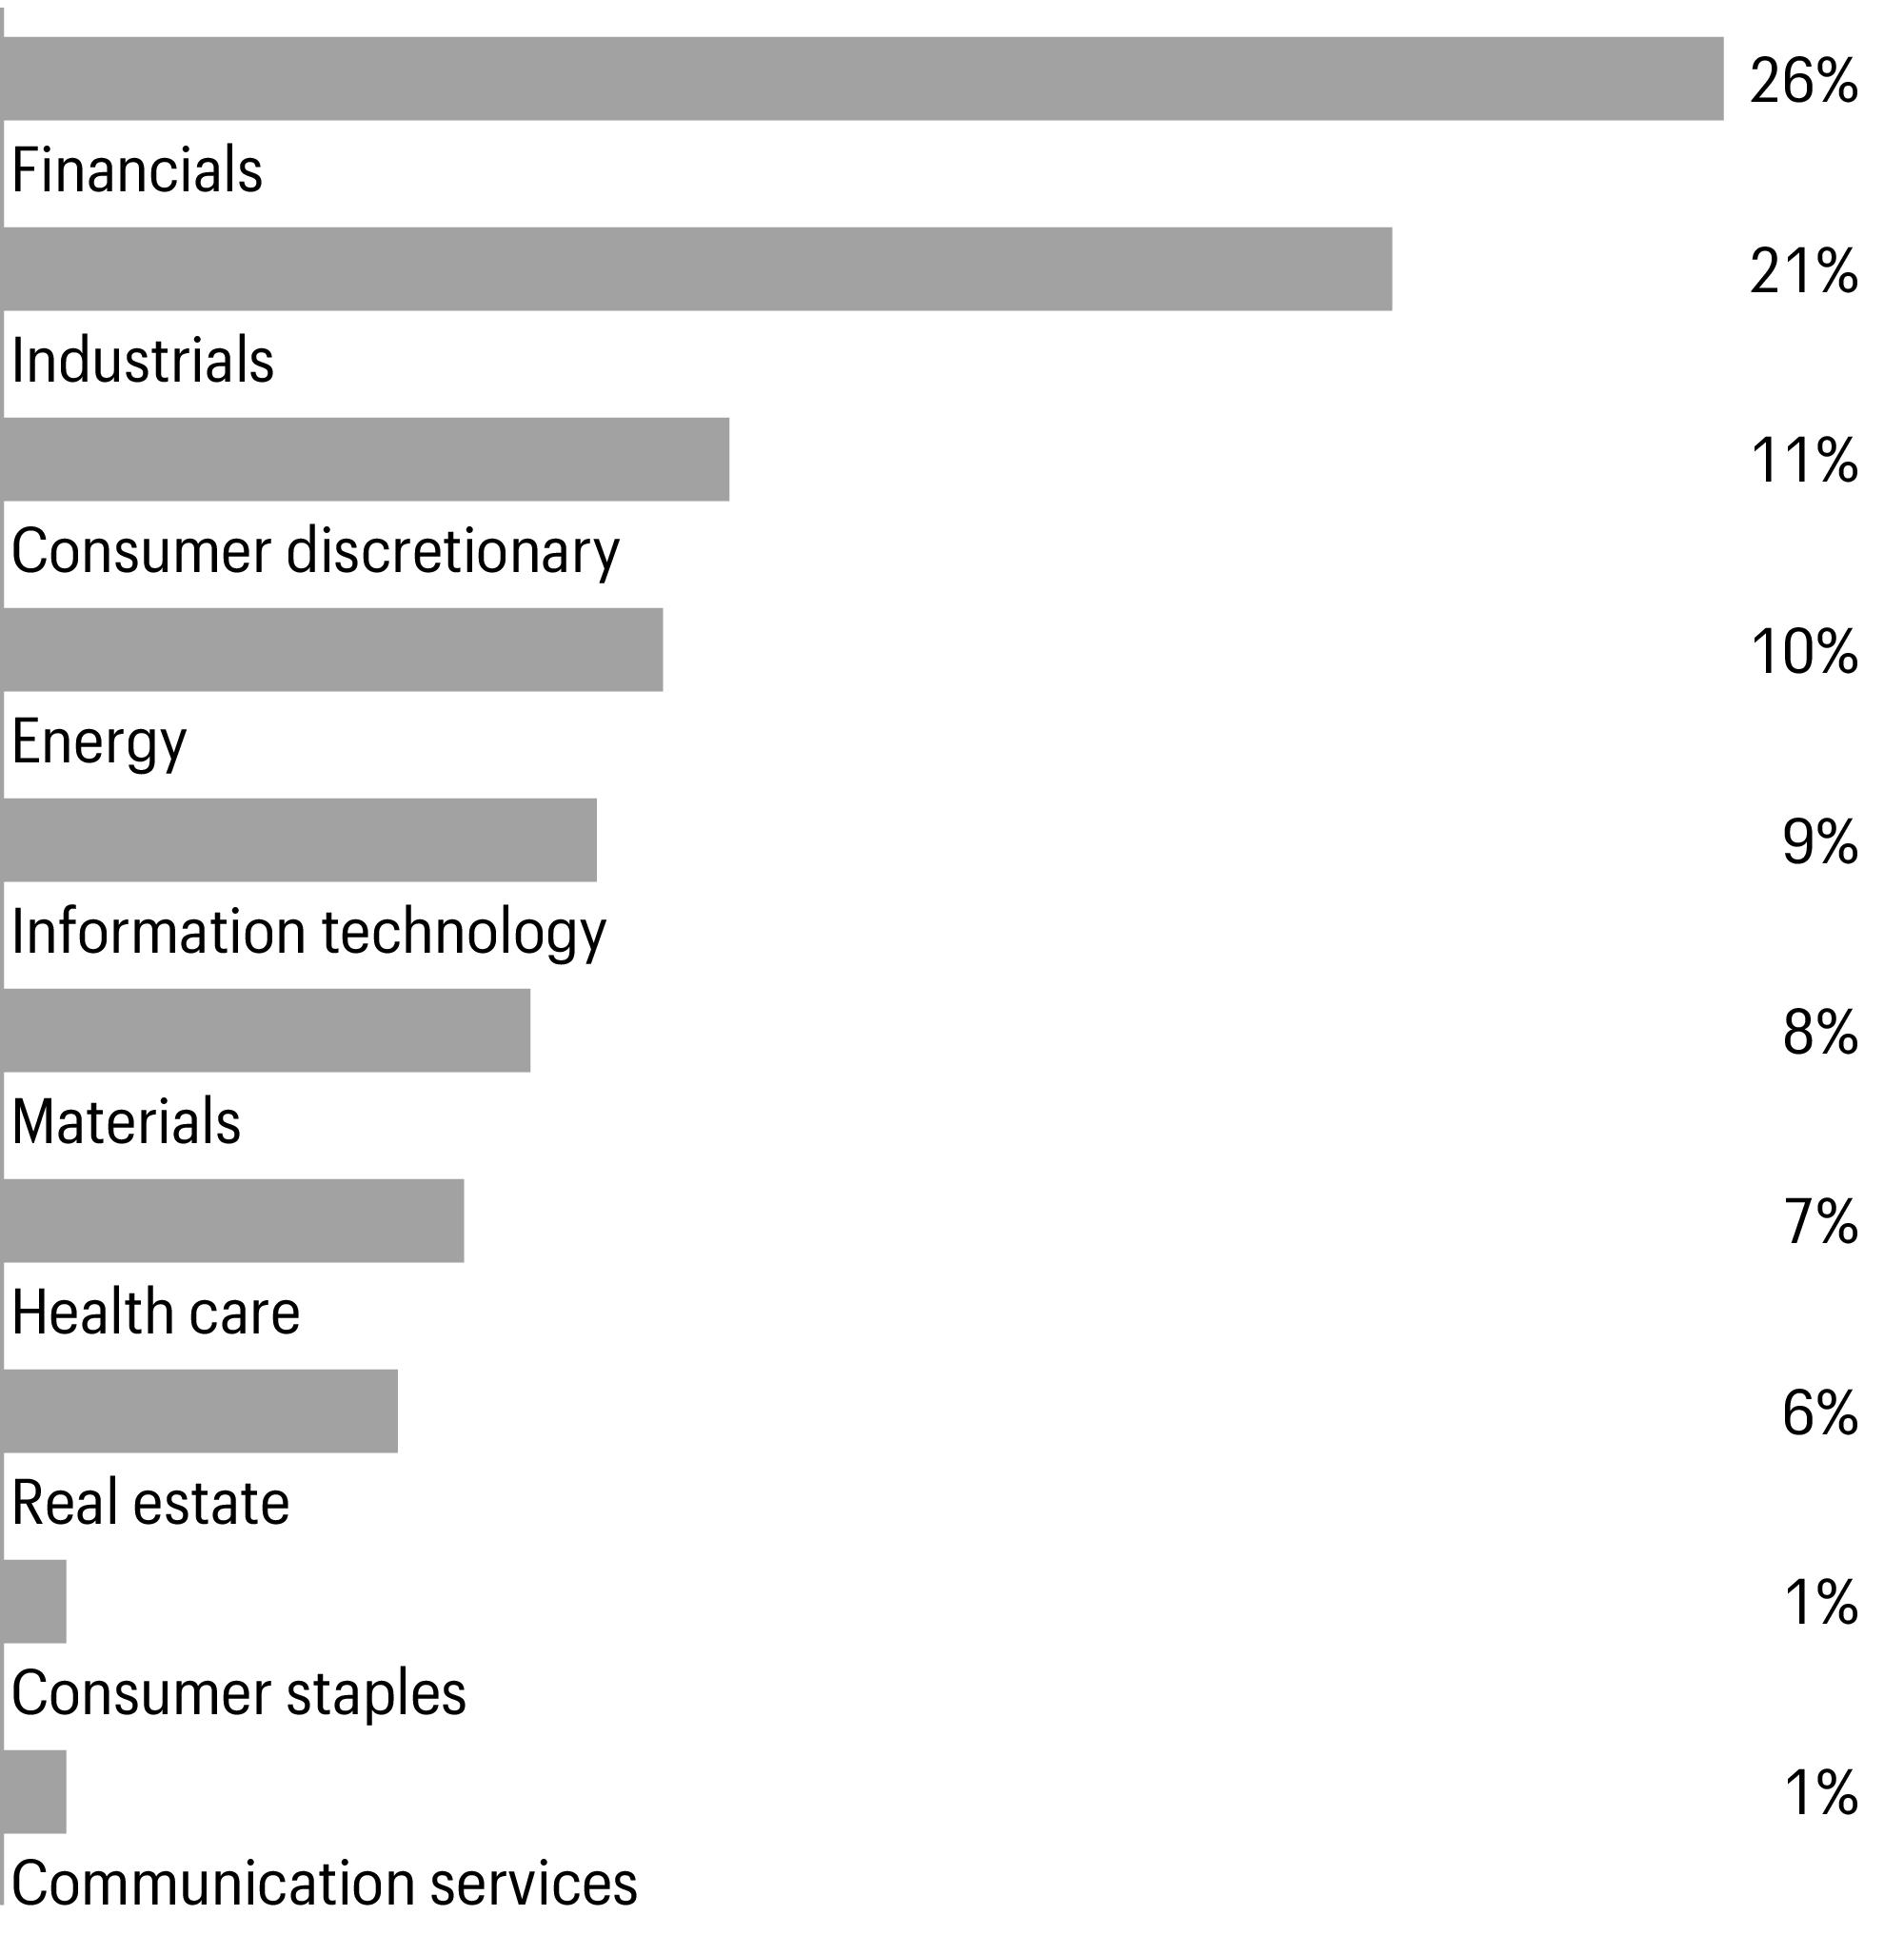
1 | Figures represent the sector allocation of the affiliated master portfolio as a percentage of the long-term investments of the affiliated master portfolio. These amounts are subject to change and may have changed since the date specified. |
Beginning account value 11-1-2023 | Ending account value 4-30-2024 | Expenses paid during the period1, 2 | Annualized net expense ratio2 | |
Class A | ||||
Actual | $1,000.00 | $1,191.85 | $5.94 | 1.09 % |
Hypothetical (5% return before expenses) | $1,000.00 | $1,019.44 | $5.47 | 1.09 % |
Class C | ||||
Actual | $1,000.00 | $1,187.01 | $10.28 | 1.89 % |
Hypothetical (5% return before expenses) | $1,000.00 | $1,015.47 | $9.47 | 1.89 % |
Class R6 | ||||
Actual | $1,000.00 | $1,193.78 | $4.09 | 0.75 % |
Hypothetical (5% return before expenses) | $1,000.00 | $1,021.13 | $3.77 | 0.75 % |
Administrator Class | ||||
Actual | $1,000.00 | $1,192.00 | $5.72 | 1.05 % |
Hypothetical (5% return before expenses) | $1,000.00 | $1,019.64 | $5.27 | 1.05 % |
Institutional Class | ||||
Actual | $1,000.00 | $1,193.51 | $4.64 | 0.85 % |
Hypothetical (5% return before expenses) | $1,000.00 | $1,020.64 | $4.27 | 0.85 % |
1 | Expenses paid is equal to the annualized net expense ratio of each class multiplied by the average account value over the period, multiplied by 182 divided by 366 (to reflect the one-half-year period). |
2 | Amounts reflect net expenses allocated from the affiliated Master Portfolio in which the Fund invests. |
Value | ||||||
Investment companies: 100.02% | ||||||
Affiliated master portfolio: 100.02% | ||||||
Allspring Small Company Value Portfolio | $659,268,503 | |||||
Total investment companies (Cost $543,594,424) | 659,268,503 | |||||
Total investments in securities (Cost $543,594,424) | 100.02 % | 659,268,503 | ||||
Other assets and liabilities, net | (0.02 ) | (135,918 ) | ||||
Total net assets | 100.00 % | $659,132,585 | ||||
% of ownership, beginning of period | % of ownership, end of period | Net realized gains (losses) on investments allocated from affiliated Master Portfolio | Net change in unrealized gains (losses) on investments allocated from affiliated Master Portfolio | Dividends allocated from affiliated Master Portfolio | Interest allocated from affiliated Master Portfolio | Affiliated Income Allocated from affiliated Master Portfolio | Value, end of period | |
Allspring Small Company Value Portfolio | 88.78 % | 92.00 % | $28,604,686 | $55,806,051 | $9,223,171 | $1,361 | $239,464 | $659,268,503 |
Assets | |
Investments in affiliated Master Portfolio, at value (cost $543,594,424) | $659,268,503 |
Receivable for Fund shares sold | 344,681 |
Receivable from manager | 64,233 |
Prepaid expenses and other assets | 139,065 |
Total assets | 659,816,482 |
Liabilities | |
Payable for Fund shares redeemed | 350,950 |
Administration fees payable | 92,108 |
Shareholder servicing fees payable | 81,409 |
Professional fees payable | 41,833 |
Distribution fee payable | 886 |
Accrued expenses and other liabilities | 116,711 |
Total liabilities | 683,897 |
Total net assets | $659,132,585 |
Net assets consist of | |
Paid-in capital | $535,256,407 |
Total distributable earnings | 123,876,178 |
Total net assets | $659,132,585 |
Computation of net asset value and offering price per share | |
Net assets–Class A | $365,526,424 |
Shares outstanding–Class A1 | 10,322,463 |
Net asset value per share–Class A | $35.41 |
Maximum offering price per share – Class A2 | $37.57 |
Net assets–Class C | $1,398,509 |
Shares outstanding–Class C1 | 46,086 |
Net asset value per share–Class C | $30.35 |
Net assets–Class R6 | $19,935,519 |
Shares outstanding–Class R61 | 541,540 |
Net asset value per share–Class R6 | $36.81 |
Net assets–Administrator Class | $19,037,228 |
Shares outstanding–Administrator Class1 | 523,549 |
Net asset value per share–Administrator Class | $36.36 |
Net assets–Institutional Class | $253,234,905 |
Shares outstanding–Institutional Class1 | 6,922,992 |
Net asset value per share–Institutional Class | $36.58 |
Year Ended April 30, 20241 | Year Ended May 31, 2023 | |
Investment income | ||
Dividends allocated from affiliated Master Portfolio (net of foreign withholding taxes of $18,768 and $15,292, respectively) | $9,223,171 | $9,127,734 |
Affiliated income allocated from affiliated Master Portfolio | 239,464 | 485,764 |
Interest allocated from affiliated Master Portfolio | 1,361 | 133 |
Interest | 4 | 14 |
Expenses allocated from affiliated Master Portfolio | (3,866,623 ) | (4,192,386 ) |
Waivers allocated from affiliated Master Portfolio | 383,001 | 465,726 |
Total investment income | 5,980,378 | 5,886,985 |
Expenses | ||
Management fee | 235,611 | 251,887 |
Administration fees | ||
Class A | 618,009 | 728,667 |
Class C | 2,563 | 4,101 |
Class R6 | 5,110 | 3,652 |
Administrator Class | 22,612 | 26,461 |
Institutional Class | 166,126 | 159,002 |
Shareholder servicing fees | ||
Class A | 769,317 | 867,460 |
Class C | 3,191 | 4,882 |
Administrator Class | 43,367 | 50,692 |
Distribution fee | ||
Class C | 9,563 | 14,647 |
Custody and accounting fees | 10,075 | 14,329 |
Professional fees | 73,852 | 52,398 |
Registration fees | 75,366 | 72,113 |
Shareholder report expenses | 47,029 | 106,566 |
Trustees’ fees and expenses | 25,053 | 21,093 |
Other fees and expenses | 58,946 | 83,933 |
Total expenses | 2,165,790 | 2,461,883 |
Less: Fee waivers and/or expense reimbursements | ||
Fund-level | (616,687 ) | (705,463 ) |
Class A | (161,100 ) | (118,237 ) |
Year Ended April 30, 20241 | Year Ended May 31, 2023 | |
Class C | (257 ) | (525 ) |
Administrator Class | (8,506 ) | (9,829 ) |
Net expenses | 1,379,240 | 1,627,829 |
Net investment income | 4,601,138 | 4,259,156 |
Realized and unrealized gains (losses) on investments | ||
Net realized gains (losses) on investments allocated from affiliated Master Portfolio | 28,604,686 | (12,161,642 ) |
Net change in unrealized gains (losses) on investments allocated from affiliated Master Portfolio | 55,806,051 | (44,270,421 ) |
Net realized and unrealized gains (losses) on investments | 84,410,737 | (56,432,063 ) |
Net increase (decrease) in net assets resulting from operations | $89,011,875 | $(52,172,907 ) |
Year ended April 30, 20241 | Year ended May 31, 2023 | Year ended May 31, 2022 | ||||
Operations | ||||||
Net investment income | $4,601,138 | $4,259,156 | $1,997,250 | |||
Net realized gains (losses) on investments | 28,604,686 | (12,161,642 ) | 55,806,887 | |||
Net change in unrealized gains (losses) on investments | 55,806,051 | (44,270,421 ) | (68,307,228 ) | |||
Net increase (decrease) in net assets resulting from operations | 89,011,875 | (52,172,907 ) | (10,503,091 ) | |||
Distributions to shareholders from | ||||||
Net investment income and net realized gains | ||||||
Class A | (2,682,829 ) | (14,333,053 ) | (23,780,784 ) | |||
Class C | 0 | (93,570 ) | (208,181 ) | |||
Class R6 | (215,043 ) | (506,589 ) | (352,499 ) | |||
Administrator Class | (166,705 ) | (798,183 ) | (1,952,485 ) | |||
Institutional Class | (1,194,588 ) | (5,228,302 ) | (4,608,431 ) | |||
Total distributions to shareholders | (4,259,165 ) | (20,959,697 ) | (30,902,380 ) | |||
Capital share transactions | Shares | Shares | Shares | |||
Proceeds from shares sold | ||||||
Class A | 271,151 | 9,007,315 | 398,977 | 12,672,302 | 656,676 | 24,000,526 |
Class C | 4,499 | 125,743 | 6,555 | 180,325 | 19,681 | 658,109 |
Class R6 | 240,548 | 8,243,846 | 357,751 | 11,911,540 | 189,729 | 7,081,211 |
Administrator Class | 58,386 | 2,030,545 | 196,183 | 6,527,787 | 415,003 | 15,666,878 |
Institutional Class | 4,339,134 | 158,877,502 | 1,630,016 | 54,246,836 | 2,016,490 | 74,654,109 |
178,284,951 | 85,538,790 | 122,060,833 | ||||
Reinvestment of distributions | ||||||
Class A | 73,847 | 2,629,686 | 437,444 | 14,076,915 | 658,773 | 23,358,988 |
Class C | 0 | 0 | 3,383 | 93,570 | 6,753 | 208,181 |
Class R6 | 5,815 | 215,043 | 15,179 | 506,589 | 9,588 | 352,499 |
Administrator Class | 4,346 | 158,922 | 23,252 | 768,015 | 52,212 | 1,898,392 |
Institutional Class | 32,273 | 1,186,373 | 156,571 | 5,199,039 | 124,652 | 4,555,015 |
4,190,024 | 20,644,128 | 30,373,075 | ||||
Payment for shares redeemed | ||||||
Class A | (1,255,276 ) | (42,111,164 ) | (1,488,263 ) | (47,166,763 ) | (1,505,117 ) | (54,479,971 ) |
Class C | (11,281 ) | (318,682 ) | (34,738 ) | (926,078 ) | (53,609 ) | (1,691,679 ) |
Class R6 | (202,147 ) | (7,103,279 ) | (124,227 ) | (4,060,442 ) | (208,117 ) | (7,991,882 ) |
Administrator Class | (133,374 ) | (4,583,578 ) | (311,874 ) | (10,266,220 ) | (651,213 ) | (24,288,201 ) |
Institutional Class | (1,151,960 ) | (39,641,717 ) | (1,435,391 ) | (47,534,257 ) | (761,649 ) | (28,166,610 ) |
(93,758,420 ) | (109,953,760 ) | (116,618,343 ) | ||||
Year ended April 30, 20241 | Year ended May 31, 2023 | Year ended May 31, 2022 | ||||
Shares | Shares | Shares | ||||
Net asset value of shares issued in acquisition | ||||||
Class A | 919,250 | $32,721,972 | 0 | $0 | 0 | $0 |
Class C | 1,195 | 36,509 | 0 | 0 | 0 | 0 |
Class R6 | 22,396 | 828,395 | 0 | 0 | 0 | 0 |
Administrator Class | 9,163 | 334,948 | 0 | 0 | 0 | 0 |
Institutional Class | 81,124 | 2,982,100 | 0 | 0 | 0 | 0 |
36,903,924 | 0 | 0 | ||||
Net increase (decrease) in net assets resulting from capital share transactions | 125,620,479 | (3,770,842 ) | 35,815,565 | |||
Total increase (decrease) in net assets | 210,373,189 | (76,903,446 ) | (5,589,906 ) | |||
Net assets | ||||||
Beginning of period | 448,759,396 | 525,662,842 | 531,252,748 | |||
End of period | $659,132,585 | $448,759,396 | $525,662,842 | |||
Year ended April 30 20241 | Year ended May 31 | |||||
Class A | 2023 | 2022 | 2021 | 2020 | 2019 | |
Net asset value, beginning of period | $29.53 | $34.30 | $37.11 | $20.91 | $24.22 | $28.60 |
Net investment income | 0.27 2 | 0.24 2 | 0.12 2 | 0.09 | 0.18 2 | 0.09 |
Net realized and unrealized gains (losses) on investments | 5.89 | (3.66 ) | (0.71 ) | 16.22 | (3.35 ) | (4.31 ) |
Total from investment operations | 6.16 | (3.42 ) | (0.59 ) | 16.31 | (3.17 ) | (4.22 ) |
Distributions to shareholders from | ||||||
Net investment income | (0.28 ) | 0.00 | (0.08 ) | (0.11 ) | (0.14 ) | (0.16 ) |
Net realized gains | 0.00 | (1.35 ) | (2.14 ) | 0.00 | 0.00 | 0.00 |
Total distributions to shareholders | (0.28 ) | (1.35 ) | (2.22 ) | (0.11 ) | (0.14 ) | (0.16 ) |
Net asset value, end of period | $35.41 | $29.53 | $34.30 | $37.11 | $20.91 | $24.22 |
Total return3 | 20.84 % | (10.31 )% | (1.77 )% | 77.80 % | (13.25 )% | (14.72 )% |
Ratios to average net assets (annualized)* | ||||||
Gross expenses | 1.30 % | 1.32 % | 1.32 % | 1.32 % | 1.32 % | 1.49 % |
Net expenses | 1.12 % | 1.14 % | 1.14 % | 1.14 % | 1.13 % | 1.15 % |
Net investment income | 0.89 % | 0.76 % | 0.33 % | 0.33 % | 0.74 % | 0.38 % |
Supplemental data | ||||||
Portfolio turnover rate4 | 107 % | 87 % | 70 % | 62 % | 78 % | 168 % |
Net assets, end of period (000s omitted) | $365,526 | $304,601 | $376,072 | $414,013 | $262,574 | $11,902 |
* | Ratios include net expenses allocated from the affiliated Master Portfolio which were as follows: |
Year ended April 30, 20241 | 0.74% |
Year ended May 31, 2023 | 0.74% |
Year ended May 31, 2022 | 0.74% |
Year ended May 31, 2021 | 0.74% |
Year ended May 31, 2020 | 0.74% |
Year ended May 31, 2019 | 0.75% |
1 | For the eleven months ended April 30, 2024. The Fund changed its fiscal year end from May 31 to April 30, effective April 30, 2024. |
2 | Calculated based upon average shares outstanding |
3 | Total return calculations do not include any sales charges. Returns for periods of less than one year are not annualized. |
4 | Portfolio turnover rate is calculated by multiplying the affiliated Master Portfolio’s percentage of the Fund’s total investment in securities at the end of the period by the affiliated Master Portfolio’s portfolio turnover rate. |
Year ended April 30 20241 | Year ended May 31 | |||||
Class C | 2023 | 2022 | 2021 | 2020 | 2019 | |
Net asset value, beginning of period | $25.30 | $29.79 | $32.69 | $18.43 | $21.48 | $25.38 |
Net investment income (loss) | 0.03 3 | 0.00 2,3 | (0.12 )3 | (0.07 )3 | 0.01 3 | (0.08 )3 |
Net realized and unrealized gains (losses) on investments | 5.02 | (3.14 ) | (0.64 ) | 14.33 | (3.00 ) | (3.82 ) |
Total from investment operations | 5.05 | (3.14 ) | (0.76 ) | 14.26 | (2.99 ) | (3.90 ) |
Distributions to shareholders from | ||||||
Net investment income | 0.00 | 0.00 | 0.00 | 0.00 | (0.06 ) | 0.00 |
Net realized gains | 0.00 | (1.35 ) | (2.14 ) | 0.00 | 0.00 | 0.00 |
Total distributions to shareholders | 0.00 | (1.35 ) | (2.14 ) | 0.00 | (0.06 ) | 0.00 |
Net asset value, end of period | $30.35 | $25.30 | $29.79 | $32.69 | $18.43 | $21.48 |
Total return4 | 19.92 % | (10.94 )% | (2.56 )% | 76.80 % | (13.98 )% | (15.37 )% |
Ratios to average net assets (annualized)* | ||||||
Gross expenses | 2.05 % | 2.07 % | 2.07 % | 2.06 % | 2.08 % | 2.22 % |
Net expenses | 1.90 % | 1.90 % | 1.90 % | 1.90 % | 1.90 % | 1.90 % |
Net investment income (loss) | 0.11 % | 0.00 % | (0.39 )% | (0.29 )% | 0.02 % | (0.35 )% |
Supplemental data | ||||||
Portfolio turnover rate5 | 107 % | 87 % | 70 % | 62 % | 78 % | 168 % |
Net assets, end of period (000s omitted) | $1,399 | $1,307 | $2,278 | $3,388 | $4,431 | $1,099 |
* | Ratios include net expenses allocated from the affiliated Master Portfolio which were as follows: |
Year ended April 30, 20241 | 0.74% |
Year ended May 31, 2023 | 0.74% |
Year ended May 31, 2022 | 0.74% |
Year ended May 31, 2021 | 0.74% |
Year ended May 31, 2020 | 0.74% |
Year ended May 31, 2019 | 0.75% |
1 | For the eleven months ended April 30, 2024. The Fund changed its fiscal year end from May 31 to April 30, effective April 30, 2024. |
2 | Amount is less than $0.005. |
3 | Calculated based upon average shares outstanding |
4 | Total return calculations do not include any sales charges. Returns for periods of less than one year are not annualized. |
5 | Portfolio turnover rate is calculated by multiplying the affiliated Master Portfolio’s percentage of the Fund’s total investment in securities at the end of the period by the affiliated Master Portfolio’s portfolio turnover rate. |
Year ended April 30 20241 | Year ended May 31 | |||||
Class R6 | 2023 | 2022 | 2021 | 2020 | 2019 | |
Net asset value, beginning of period | $30.68 | $35.46 | $38.33 | $21.56 | $24.92 | $29.44 |
Net investment income | 0.40 2 | 0.37 2 | 0.33 | 0.20 | 0.31 | 0.21 2 |
Net realized and unrealized gains (losses) on investments | 6.12 | (3.79 ) | (0.80 ) | 16.78 | (3.50 ) | (4.45 ) |
Total from investment operations | 6.52 | (3.42 ) | (0.47 ) | 16.98 | (3.19 ) | (4.24 ) |
Distributions to shareholders from | ||||||
Net investment income | (0.39 ) | (0.01 ) | (0.26 ) | (0.21 ) | (0.17 ) | (0.28 ) |
Net realized gains | 0.00 | (1.35 ) | (2.14 ) | 0.00 | 0.00 | 0.00 |
Total distributions to shareholders | (0.39 ) | (1.36 ) | (2.40 ) | (0.21 ) | (0.17 ) | (0.28 ) |
Net asset value, end of period | $36.81 | $30.68 | $35.46 | $38.33 | $21.56 | $24.92 |
Total return3 | 21.25 % | (9.95 )% | (1.41 )% | 78.63 % | (12.97 )% | (14.38 )% |
Ratios to average net assets (annualized)* | ||||||
Gross expenses | 0.88 % | 0.89 % | 0.89 % | 0.89 % | 0.90 % | 1.09 % |
Net expenses | 0.75 % | 0.75 % | 0.75 % | 0.75 % | 0.75 % | 0.75 % |
Net investment income | 1.27 % | 1.11 % | 0.71 % | 0.73 % | 1.22 % | 0.77 % |
Supplemental data | ||||||
Portfolio turnover rate4 | 107 % | 87 % | 70 % | 62 % | 78 % | 168 % |
Net assets, end of period (000s omitted) | $19,936 | $14,573 | $8,021 | $9,007 | $6,491 | $731 |
* | Ratios include net expenses allocated from the affiliated Master Portfolio which were as follows: |
Year ended April 30, 20241 | 0.74% |
Year ended May 31, 2023 | 0.74% |
Year ended May 31, 2022 | 0.74% |
Year ended May 31, 2021 | 0.74% |
Year ended May 31, 2020 | 0.74% |
Year ended May 31, 2019 | 0.75% |
1 | For the eleven months ended April 30, 2024. The Fund changed its fiscal year end from May 31 to April 30, effective April 30, 2024. |
2 | Calculated based upon average shares outstanding |
3 | Returns for periods of less than one year are not annualized. |
4 | Portfolio turnover rate is calculated by multiplying the affiliated Master Portfolio’s percentage of the Fund’s total investment in securities at the end of the period by the affiliated Master Portfolio’s portfolio turnover rate. |
Year ended April 30 20241 | Year ended May 31 | |||||
Administrator Class | 2023 | 2022 | 2021 | 2020 | 2019 | |
Net asset value, beginning of period | $30.33 | $35.15 | $37.98 | $21.40 | $24.80 | $29.23 |
Net investment income | 0.30 2 | 0.28 2 | 0.17 2 | 0.10 2 | 0.21 2 | 0.14 2 |
Net realized and unrealized gains (losses) on investments | 6.04 | (3.75 ) | (0.75 ) | 16.62 | (3.43 ) | (4.43 ) |
Total from investment operations | 6.34 | (3.47 ) | (0.58 ) | 16.72 | (3.22 ) | (4.29 ) |
Distributions to shareholders from | ||||||
Net investment income | (0.31 ) | 0.00 | (0.11 ) | (0.14 ) | (0.18 ) | (0.14 ) |
Net realized gains | 0.00 | (1.35 ) | (2.14 ) | 0.00 | 0.00 | 0.00 |
Total distributions to shareholders | (0.31 ) | (1.35 ) | (2.25 ) | (0.14 ) | (0.18 ) | (0.14 ) |
Net asset value, end of period | $36.36 | $30.33 | $35.15 | $37.98 | $21.40 | $24.80 |
Total return3 | 20.89 % | (10.20 )% | (1.71 )% | 77.91 % | (13.18 )% | (14.65 )% |
Ratios to average net assets (annualized)* | ||||||
Gross expenses | 1.23 % | 1.24 % | 1.24 % | 1.24 % | 1.32 % | 1.35 % |
Net expenses | 1.05 % | 1.05 % | 1.05 % | 1.05 % | 1.05 % | 1.05 % |
Net investment income | 0.97 % | 0.86 % | 0.45 % | 0.35 % | 0.82 % | 0.49 % |
Supplemental data | ||||||
Portfolio turnover rate4 | 107 % | 87 % | 70 % | 62 % | 78 % | 168 % |
Net assets, end of period (000s omitted) | $19,037 | $17,743 | $23,813 | $32,721 | $15,581 | $13,905 |
* | Ratios include net expenses allocated from the affiliated Master Portfolio which were as follows: |
Year ended April 30, 20241 | 0.74% |
Year ended May 31, 2023 | 0.74% |
Year ended May 31, 2022 | 0.74% |
Year ended May 31, 2021 | 0.74% |
Year ended May 31, 2020 | 0.74% |
Year ended May 31, 2019 | 0.75% |
1 | For the eleven months ended April 30, 2024. The Fund changed its fiscal year end from May 31 to April 30, effective April 30, 2024. |
2 | Calculated based upon average shares outstanding |
3 | Returns for periods of less than one year are not annualized. |
4 | Portfolio turnover rate is calculated by multiplying the affiliated Master Portfolio’s percentage of the Fund’s total investment in securities at the end of the period by the affiliated Master Portfolio’s portfolio turnover rate. |
Year ended April 30 20241 | Year ended May 31 | |||||
Institutional Class | 2023 | 2022 | 2021 | 2020 | 2019 | |
Net asset value, beginning of period | $30.51 | $35.30 | $38.13 | $21.46 | $24.86 | $29.40 |
Net investment income | 0.37 2 | 0.35 2 | 0.20 2 | 0.15 2 | 0.25 | 0.19 2 |
Net realized and unrealized gains (losses) on investments | 6.08 | (3.78 ) | (0.71 ) | 16.70 | (3.43 ) | (4.45 ) |
Total from investment operations | 6.45 | (3.43 ) | (0.51 ) | 16.85 | (3.18 ) | (4.26 ) |
Distributions to shareholders from | ||||||
Net investment income | (0.38 ) | (0.01 ) | (0.18 ) | (0.18 ) | (0.22 ) | (0.28 ) |
Net realized gains | 0.00 | (1.35 ) | (2.14 ) | 0.00 | 0.00 | 0.00 |
Total distributions to shareholders | (0.38 ) | (1.36 ) | (2.32 ) | (0.18 ) | (0.22 ) | (0.28 ) |
Net asset value, end of period | $36.58 | $30.51 | $35.30 | $38.13 | $21.46 | $24.86 |
Total return3 | 21.15 % | (10.03 )% | (1.53 )% | 78.39 % | (13.03 )% | (14.46 )% |
Ratios to average net assets (annualized)* | ||||||
Gross expenses | 0.98 % | 0.99 % | 0.99 % | 0.99 % | 1.07 % | 1.14 % |
Net expenses | 0.85 % | 0.85 % | 0.85 % | 0.85 % | 0.85 % | 0.85 % |
Net investment income | 1.15 % | 1.06 % | 0.54 % | 0.52 % | 1.04 % | 0.68 % |
Supplemental data | ||||||
Portfolio turnover rate4 | 107 % | 87 % | 70 % | 62 % | 78 % | 168 % |
Net assets, end of period (000s omitted) | $253,235 | $110,536 | $115,479 | $72,123 | $33,600 | $33,116 |
* | Ratios include net expenses allocated from the affiliated Master Portfolio which were as follows: |
Year ended April 30, 20241 | 0.74% |
Year ended May 31, 2023 | 0.74% |
Year ended May 31, 2022 | 0.74% |
Year ended May 31, 2021 | 0.74% |
Year ended May 31, 2020 | 0.74% |
Year ended May 31, 2019 | 0.75% |
1 | For the eleven months ended April 30, 2024. The Fund changed its fiscal year end from May 31 to April 30, effective April 30, 2024. |
2 | Calculated based upon average shares outstanding |
3 | Returns for periods of less than one year are not annualized. |
4 | Portfolio turnover rate is calculated by multiplying the affiliated Master Portfolio’s percentage of the Fund’s total investment in securities at the end of the period by the affiliated Master Portfolio’s portfolio turnover rate. |
Gross unrealized gains | $103,945,757 |
Gross unrealized losses | (0 ) |
Net unrealized gains | $103,945,757 |
Affiliated Master Portfolio | Investment objective | Fair value of affiliated Master Portfolio |
Allspring Small Company Value Portfolio | Seeks long-term capital appreciation | $659,268,503 |
Average daily net assets | Management fee |
First $5 billion | 0.050 % |
Next $5 billion | 0.040 |
Over $10 billion | 0.030 |
Class-level administration fee | |
Class A | 0.20 % |
Class C | 0.20 |
Class R6 | 0.03 |
Administrator Class | 0.13 |
Institutional Class | 0.13 |
EXPENSE RATIO CAPS | |
Class A | 1.15 % |
Class C | 1.90 |
Class R6 | 0.75 |
Administrator Class | 1.05 |
Institutional Class | 0.85 |
Net investment income | Net realized and unrealized gains (losses) on investments | Net increase (decrease) in net assets resulting from operations | |
Small Company Value | $4,495,325 | $88,462,885 | $92,958,210 |
Year ended May 31 | |||
Year ended April 30, 2024 | 2023 | 2022 | |
Ordinary income | $4,259,165 | $62,215 | $11,642,015 |
Long-term capital gain | 0 | 20,897,482 | 19,260,365 |
Undistributed ordinary income | Undistributed long-term gain | Unrealized gains |
$4,601,052 | $15,329,368 | $103,945,757 |
Allspring Funds Trust:

Shares | Value | |||||
Common stocks: 99.03% | ||||||
Communication services: 0.70% | ||||||
Interactive media & services: 0.70% | ||||||
Cargurus, Inc.† | 224,474 | $5,041,686 | ||||
Consumer discretionary: 11.44% | ||||||
Automobile components: 0.99% | ||||||
Patrick Industries, Inc. | 67,833 | 7,087,870 | ||||
Diversified consumer services: 0.61% | ||||||
Adtalem Global Education, Inc.† | 38,119 | 1,891,465 | ||||
Grand Canyon Education, Inc.† | 18,858 | 2,451,917 | ||||
4,343,382 | ||||||
Hotels, restaurants & leisure: 0.91% | ||||||
Wyndham Hotels & Resorts, Inc. | 88,660 | 6,517,397 | ||||
Household durables: 2.86% | ||||||
Cavco Industries, Inc.† | 13,799 | 5,025,734 | ||||
Century Communities, Inc. | 61,674 | 4,891,982 | ||||
Meritage Homes Corp. | 35,383 | 5,864,378 | ||||
Worthington Enterprises, Inc. | 82,124 | 4,694,208 | ||||
20,476,302 | ||||||
Leisure products: 0.70% | ||||||
Johnson Outdoors, Inc. Class A | 69,358 | 2,844,372 | ||||
Malibu Boats, Inc. Class A† | 63,776 | 2,169,659 | ||||
5,014,031 | ||||||
Specialty retail: 4.65% | ||||||
American Eagle Outfitters, Inc. | 282,130 | 6,844,474 | ||||
Dick’s Sporting Goods, Inc. | 37,848 | 7,605,177 | ||||
Foot Locker, Inc. | 145,566 | 3,035,051 | ||||
ODP Corp.† | 59,030 | 3,005,217 | ||||
Shoe Carnival, Inc. | 155,869 | 5,212,260 | ||||
Williams-Sonoma, Inc. | 26,686 | 7,653,011 | ||||
33,355,190 | ||||||
Textiles, apparel & luxury goods: 0.72% | ||||||
Capri Holdings Ltd.† | 18,778 | 666,243 | ||||
Carter’s, Inc. | 10,425 | 713,174 | ||||
Rocky Brands, Inc. | 86,644 | 2,232,816 | ||||
Superior Group of Cos., Inc. | 96,918 | 1,576,856 | ||||
5,189,089 | ||||||
Consumer staples: 0.75% | ||||||
Beverages: 0.10% | ||||||
Coca-Cola Consolidated, Inc. | 889 | 734,314 | ||||
Consumer staples distribution & retail : 0.11% | ||||||
Sprouts Farmers Market, Inc.† | 11,707 | 773,013 | ||||
Shares | Value | |||||
Food products: 0.54% | ||||||
Conagra Brands, Inc. | 40,070 | $1,233,354 | ||||
Ingredion, Inc. | 7,686 | 880,739 | ||||
Tootsie Roll Industries, Inc. | 59,756 | 1,775,351 | ||||
3,889,444 | ||||||
Energy: 9.89% | ||||||
Energy equipment & services: 0.87% | ||||||
Helmerich & Payne, Inc. | 158,758 | 6,243,952 | ||||
Oil, gas & consumable fuels: 9.02% | ||||||
APA Corp. | 165,368 | 5,199,170 | ||||
California Resources Corp. | 79,106 | 4,181,543 | ||||
Chord Energy Corp. | 45,291 | 8,015,601 | ||||
Civitas Resources, Inc. | 114,523 | 8,241,075 | ||||
Matador Resources Co. | 125,547 | 7,821,578 | ||||
Murphy Oil Corp. | 167,010 | 7,455,326 | ||||
PBF Energy, Inc. Class A | 118,720 | 6,324,214 | ||||
Peabody Energy Corp. | 62,372 | 1,368,442 | ||||
Permian Resources Corp. | 474,926 | 7,955,011 | ||||
SM Energy Co. | 165,848 | 8,041,970 | ||||
64,603,930 | ||||||
Financials: 25.85% | ||||||
Banks: 14.36% | ||||||
Ameris Bancorp | 173,722 | 8,248,321 | ||||
Atlantic Union Bankshares Corp. | 252,567 | 8,024,054 | ||||
Axos Financial, Inc.† | 98,162 | 4,967,979 | ||||
Bank OZK | 170,312 | 7,604,431 | ||||
Banner Corp. | 112,767 | 4,920,024 | ||||
Customers Bancorp, Inc.† | 141,172 | 6,447,325 | ||||
FB Financial Corp. | 173,421 | 6,355,880 | ||||
Great Southern Bancorp, Inc. | 122,156 | 6,278,818 | ||||
Home BancShares, Inc. | 238,478 | 5,647,159 | ||||
Independent Bank Corp. | 314,021 | 7,790,861 | ||||
OFG Bancorp | 227,044 | 8,198,559 | ||||
Prosperity Bancshares, Inc. | 77,451 | 4,799,638 | ||||
Synovus Financial Corp. | 225,180 | 8,059,192 | ||||
Wintrust Financial Corp. | 83,260 | 8,046,246 | ||||
WSFS Financial Corp. | 175,015 | 7,478,391 | ||||
102,866,878 | ||||||
Capital markets: 3.65% | ||||||
Donnelley Financial Solutions, Inc.† | 111,711 | 7,013,217 | ||||
Piper Sandler Cos. | 48,982 | 9,590,186 | ||||
Stifel Financial Corp. | 119,749 | 9,570,340 | ||||
26,173,743 | ||||||
Financial services: 3.97% | ||||||
Cass Information Systems, Inc. | 63,930 | 2,761,137 | ||||
Shares | Value | |||||
Financial services(continued) | ||||||
Federal Agricultural Mortgage Corp. Class C | 35,304 | $6,571,134 | ||||
Jackson Financial, Inc. Class A | 128,357 | 8,769,350 | ||||
Walker & Dunlop, Inc. | 61,057 | 5,594,653 | ||||
WEX, Inc.† | 22,481 | 4,749,336 | ||||
28,445,610 | ||||||
Insurance: 1.89% | ||||||
Brighthouse Financial, Inc.† | 73,510 | 3,546,858 | ||||
Genworth Financial, Inc. Class A† | 701,280 | 4,158,590 | ||||
Unum Group | 115,322 | 5,846,825 | ||||
13,552,273 | ||||||
Mortgage real estate investment trusts (REITs): 1.98% | ||||||
AGNC Investment Corp. | 763,426 | 6,985,348 | ||||
Annaly Capital Management, Inc. | 383,561 | 7,187,933 | ||||
14,173,281 | ||||||
Health care: 6.69% | ||||||
Biotechnology: 0.19% | ||||||
CRISPR Therapeutics AG† | 25,428 | 1,347,430 | ||||
Health care equipment & supplies: 3.52% | ||||||
ICU Medical, Inc.† | 25,729 | 2,519,384 | ||||
Integer Holdings Corp.† | 54,937 | 6,132,617 | ||||
Masimo Corp.† | 40,283 | 5,414,438 | ||||
Merit Medical Systems, Inc.† | 54,973 | 4,073,499 | ||||
Teleflex, Inc. | 18,727 | 3,909,261 | ||||
UFP Technologies, Inc.† | 15,509 | 3,193,924 | ||||
25,243,123 | ||||||
Health care providers & services: 2.61% | ||||||
AMN Healthcare Services, Inc.† | 78,957 | 4,735,841 | ||||
Brookdale Senior Living, Inc.† | 780,332 | 5,298,454 | ||||
Encompass Health Corp. | 64,923 | 5,413,280 | ||||
Ensign Group, Inc. | 27,758 | 3,285,437 | ||||
18,733,012 | ||||||
Pharmaceuticals: 0.37% | ||||||
Perrigo Co. PLC | 80,516 | 2,629,652 | ||||
Industrials: 20.42% | ||||||
Building products: 2.84% | ||||||
CSW Industrials, Inc. | 22,662 | 5,384,945 | ||||
Gibraltar Industries, Inc.† | 61,314 | 4,381,498 | ||||
UFP Industries, Inc. | 42,691 | 4,811,276 | ||||
Zurn Elkay Water Solutions Corp. | 185,280 | 5,795,558 | ||||
20,373,277 | ||||||
Commercial services & supplies: 1.05% | ||||||
Brady Corp. Class A | 62,076 | 3,662,484 | ||||
Shares | Value | |||||
Commercial services & supplies(continued) | ||||||
Brink’s Co. | 37,013 | $3,237,157 | ||||
Stericycle, Inc.† | 14,596 | 652,879 | ||||
7,552,520 | ||||||
Construction & engineering: 2.06% | ||||||
Comfort Systems USA, Inc. | 11,751 | 3,635,877 | ||||
MYR Group, Inc.† | 37,175 | 6,180,344 | ||||
Sterling Infrastructure, Inc.† | 48,880 | 4,966,208 | ||||
14,782,429 | ||||||
Electrical equipment: 1.97% | ||||||
Atkore, Inc. | 27,022 | 4,736,957 | ||||
Generac Holdings, Inc.† | 26,228 | 3,565,959 | ||||
Regal Rexnord Corp. | 36,073 | 5,821,100 | ||||
14,124,016 | ||||||
Ground transportation: 0.75% | ||||||
ArcBest Corp. | 48,141 | 5,339,318 | ||||
Machinery: 7.60% | ||||||
Allison Transmission Holdings, Inc. | 83,029 | 6,106,783 | ||||
Federal Signal Corp. | 72,609 | 5,903,112 | ||||
Greenbrier Cos., Inc. | 91,471 | 4,517,753 | ||||
Hillenbrand, Inc. | 86,922 | 4,147,918 | ||||
Kadant, Inc. | 19,404 | 5,312,621 | ||||
Miller Industries, Inc. | 122,891 | 5,986,021 | ||||
Standex International Corp. | 34,664 | 5,992,712 | ||||
Tennant Co. | 52,099 | 6,068,491 | ||||
Timken Co. | 65,469 | 5,841,144 | ||||
Wabash National Corp. | 198,327 | 4,583,337 | ||||
54,459,892 | ||||||
Marine transportation: 0.85% | ||||||
Matson, Inc. | 56,223 | 6,059,715 | ||||
Professional services: 0.67% | ||||||
CBIZ, Inc.† | 67,267 | 4,788,065 | ||||
Trading companies & distributors: 2.63% | ||||||
Air Lease Corp. | 100,962 | 5,072,331 | ||||
Boise Cascade Co. | 41,334 | 5,467,248 | ||||
GATX Corp. | 23,589 | 2,886,350 | ||||
Hudson Technologies, Inc.† | 292,541 | 2,902,007 | ||||
McGrath RentCorp | 23,690 | 2,526,775 | ||||
18,854,711 | ||||||
Information technology: 8.81% | ||||||
Electronic equipment, instruments & components: 4.21% | ||||||
Belden, Inc. | 45,192 | 3,672,754 | ||||
ePlus, Inc.† | 80,038 | 6,153,321 | ||||
Shares | Value | |||||
Electronic equipment, instruments & components(continued) | ||||||
Insight Enterprises, Inc.† | 28,414 | $5,187,544 | ||||
Napco Security Technologies, Inc. | 75,324 | 3,065,687 | ||||
OSI Systems, Inc.† | 30,451 | 4,002,479 | ||||
PC Connection, Inc. | 69,540 | 4,309,394 | ||||
Sanmina Corp.† | 62,570 | 3,796,122 | ||||
30,187,301 | ||||||
IT services: 1.85% | ||||||
EPAM Systems, Inc.† | 23,208 | 5,459,914 | ||||
Hackett Group, Inc. | 79,410 | 1,722,403 | ||||
Kyndryl Holdings, Inc.† | 307,401 | 6,043,504 | ||||
13,225,821 | ||||||
Semiconductors & semiconductor equipment: 2.13% | ||||||
Cirrus Logic, Inc.† | 37,152 | 3,290,553 | ||||
Diodes, Inc.† | 55,532 | 4,054,391 | ||||
FormFactor, Inc.† | 74,128 | 3,305,367 | ||||
Onto Innovation, Inc.† | 24,781 | 4,596,628 | ||||
15,246,939 | ||||||
Software: 0.62% | ||||||
Mitek Systems, Inc.† | 352,538 | 4,452,555 | ||||
Materials: 8.50% | ||||||
Chemicals: 3.24% | ||||||
Cabot Corp. | 52,211 | 4,763,209 | ||||
Core Molding Technologies, Inc.† | 119,248 | 2,148,849 | ||||
Hawkins, Inc. | 86,902 | 6,584,565 | ||||
Koppers Holdings, Inc. | 99,596 | 5,107,283 | ||||
Minerals Technologies, Inc. | 63,377 | 4,619,549 | ||||
23,223,455 | ||||||
Construction materials: 1.74% | ||||||
Eagle Materials, Inc. | 26,442 | 6,629,274 | ||||
Knife River Corp.† | 74,706 | 5,841,262 | ||||
12,470,536 | ||||||
Metals & mining: 2.40% | ||||||
Arch Resources, Inc. | 12,870 | 2,043,499 | ||||
Materion Corp. | 42,004 | 4,827,940 | ||||
Royal Gold, Inc. | 34,472 | 4,141,121 | ||||
Worthington Steel, Inc. | 200,246 | 6,165,574 | ||||
17,178,134 | ||||||
Paper & forest products: 1.12% | ||||||
Clearwater Paper Corp.† | 88,367 | 3,980,050 | ||||
Sylvamo Corp. | 64,984 | 4,061,500 | ||||
8,041,550 | ||||||
Shares | Value | |||||
Real estate: 5.87% | ||||||
Diversified REITs: 0.35% | ||||||
Armada Hoffler Properties, Inc. | 234,915 | $2,471,306 | ||||
Health care REITs: 0.17% | ||||||
Global Medical REIT, Inc. | 152,726 | 1,238,608 | ||||
Industrial REITs : 1.30% | ||||||
Plymouth Industrial REIT, Inc. | 198,935 | 4,153,763 | ||||
STAG Industrial, Inc. | 149,414 | 5,138,347 | ||||
9,292,110 | ||||||
Office REITs : 0.64% | ||||||
Vornado Realty Trust | 175,511 | 4,568,551 | ||||
Retail REITs : 2.76% | ||||||
Agree Realty Corp. | 91,590 | 5,240,780 | ||||
Brixmor Property Group, Inc. | 282,043 | 6,233,150 | ||||
Retail Opportunity Investments Corp. | 208,469 | 2,557,915 | ||||
Tanger, Inc. | 203,736 | 5,775,915 | ||||
19,807,760 | ||||||
Specialized REITs : 0.65% | ||||||
CubeSmart | 16,785 | 678,786 | ||||
National Storage Affiliates Trust | 19,730 | 691,339 | ||||
PotlatchDeltic Corp. | 82,795 | 3,312,628 | ||||
4,682,753 | ||||||
Utilities: 0.11% | ||||||
Electric utilities: 0.11% | ||||||
Pinnacle West Capital Corp. | 10,648 | 784,225 | ||||
Total common stocks (Cost $559,197,253) | 709,640,149 | |||||
Expiration date | ||||||
Warrants: 0.00% | ||||||
Energy: 0.00% | ||||||
Energy equipment & services: 0.00% | ||||||
Parker Drilling Co.♦† | 9-25-2024 | 8,457 | 169 | |||
Total warrants (Cost $0) | 169 | |||||
Yield | Shares | Value | ||||
Short-term investments: 1.02% | ||||||
Investment companies: 1.02% | ||||||
Allspring Government Money Market Fund Select Class♠∞ | 5.23 % | 7,273,563 | $7,273,563 | |||
Total short-term investments (Cost $7,273,563) | 7,273,563 | |||||
Total investments in securities (Cost $566,470,816) | 100.05 % | 716,913,881 | ||||
Other assets and liabilities, net | (0.05 ) | (332,720 ) | ||||
Total net assets | 100.00 % | $716,581,161 | ||||
† | Non-income-earning security |
♦ | The security is fair valued in accordance with procedures approved by the Board of Trustees. |
♠ | The issuer of the security is an affiliated person of the Portfolio as defined in the Investment Company Act of 1940. |
∞ | The rate represents the 7-day annualized yield at period end. |
Abbreviations: | |
REIT | Real estate investment trust |
Value, beginning of period | Purchases | Sales proceeds | Net realized gains (losses) | Net change in unrealized gains (losses) | Value, end of period | Shares, end of period | Income from affiliated securities | |
Short-term investments | ||||||||
Allspring Government Money Market Fund Select Class | $4,743,595 | $141,821,700 | $(139,291,732 ) | $0 | $0 | $7,273,563 | 7,273,563 | $266,499 |
Assets | |
Investments in unaffiliated securities, at value (cost $559,197,253) | $709,640,318 |
Investments in affiliated securities, at value (cost $7,273,563) | 7,273,563 |
Cash | 230 |
Receivable for investments sold | 3,934,047 |
Receivable for dividends | 490,366 |
Prepaid expenses and other assets | 1,490 |
Total assets | 721,340,014 |
Liabilities | |
Payable for investments purchased | 4,303,699 |
Advisory fee payable | 427,497 |
Accrued expenses and other liabilities | 27,657 |
Total liabilities | 4,758,853 |
Total net assets | $716,581,161 |
Year Ended April 30, 20241 | Year Ended May 31, 2023 | |
Investment income | ||
Dividends (net of foreign withholdings taxes of $20,912 and $17,167, respectively) | $10,285,767 | $10,250,490 |
Income from affiliated securities | 266,499 | 545,814 |
Interest | 1,510 | 150 |
Total investment income | 10,553,776 | 10,796,454 |
Expenses | ||
Advisory fee | 4,181,142 | 4,507,550 |
Custody and accounting fees | 26,632 | 61,434 |
Professional fees | 54,559 | 67,178 |
Interest holder report expenses | 3,316 | 18,862 |
Trustees’ fees and expenses | 21,511 | 27,365 |
Other fees and expenses | 23,230 | 25,377 |
Total expenses | 4,310,390 | 4,707,766 |
Less: Fee waivers and/or expense reimbursements | (427,136 ) | (523,137 ) |
Net expenses | 3,883,254 | 4,184,629 |
Net investment income | 6,670,522 | 6,611,825 |
Realized and unrealized gains (losses) on investments | ||
Unaffiliated securities | 33,937,138 | (12,010,256 ) |
Affiliated securities | 0 | (200 ) |
Net realized gains (losses) on investments | 33,937,138 | (12,010,456 ) |
Net change in unrealized gains (losses) on investments | 61,235,908 | (51,512,308 ) |
Net realized and unrealized gains (losses) on investments | 95,173,046 | (63,522,764 ) |
Net increase (decrease) in net assets resulting from operations | $101,843,568 | $(56,910,939 ) |
Year ended April 30, 20241 | Year ended May 31, 2023 | Year ended May 31, 2022 | ||||
Operations | ||||||
Net investment income | $6,670,522 | $6,611,825 | $4,422,079 | |||
Net realized gains (losses) on investments | 33,937,138 | (12,010,456 ) | 64,991,534 | |||
Net change in unrealized gains (losses) on investments | 61,235,908 | (51,512,308 ) | (80,777,394 ) | |||
Net increase (decrease) in net assets resulting from operations | 101,843,568 | (56,910,939 ) | (11,363,781 ) | |||
Capital transactions | ||||||
Transactions in investors’ beneficial interests | ||||||
Contributions | 187,185,263 | 41,481,218 | 74,799,145 | |||
Withdrawals | (77,896,474 ) | (75,314,113 ) | (87,265,392 ) | |||
Net increase (decrease) in net assets resulting from capital share transactions | 109,288,789 | (33,832,895 ) | (12,466,247 ) | |||
Total increase (decrease) in net assets | 211,132,357 | (90,743,834 ) | (23,830,028 ) | |||
Net assets | ||||||
Beginning of period | 505,448,804 | 596,192,638 | 620,022,666 | |||
End of period | $716,581,161 | $505,448,804 | $596,192,638 | |||
Year ended April 30 20241 | Year ended May 31 | |||||
2023 | 2022 | 2021 | 2020 | 2019 | ||
Total return | 21.34 % | (9.95 )% | (1.78 )% | 78.76 % | (13.74 )% | (14.51 )% |
Ratios to average net assets (annualized) | ||||||
Gross expenses | 0.82 % | 0.83 % | 0.83 % | 0.83 % | 0.82 % | 0.86 % |
Net expenses2 | 0.74 % | 0.74 % | 0.74 % | 0.74 % | 0.74 % | 0.75 % |
Net investment income | 1.27 % | 1.17 % | 0.72 % | 0.71 % | 1.15 % | 0.80 % |
Supplemental Data | ||||||
Portfolio turnover rate | 107 % | 87 % | 70 % | 62 % | 78 % | 168 % |
1 | For the eleven months ended April 30, 2024. The Portfolio changed its fiscal year end from May 31 to April 30, effective April 30, 2024. |
2 | Net expense ratios reflect voluntary waivers, if any. |
Gross unrealized gains | $158,734,353 |
Gross unrealized losses | (19,507,540 ) |
Net unrealized gains | $139,226,813 |
Quoted prices (Level 1) | Other significant observable inputs (Level 2) | Significant unobservable inputs (Level 3) | Total | |
Assets | ||||
Investments in: | ||||
Common stocks | ||||
Communication services | $5,041,686 | $0 | $0 | $5,041,686 |
Consumer discretionary | 81,983,261 | 0 | 0 | 81,983,261 |
Consumer staples | 5,396,771 | 0 | 0 | 5,396,771 |
Energy | 70,847,882 | 0 | 0 | 70,847,882 |
Financials | 185,211,785 | 0 | 0 | 185,211,785 |
Health care | 47,953,217 | 0 | 0 | 47,953,217 |
Industrials | 146,333,943 | 0 | 0 | 146,333,943 |
Information technology | 63,112,616 | 0 | 0 | 63,112,616 |
Materials | 60,913,675 | 0 | 0 | 60,913,675 |
Real estate | 42,061,088 | 0 | 0 | 42,061,088 |
Utilities | 784,225 | 0 | 0 | 784,225 |
Warrants | ||||
Energy | 0 | 169 | 0 | 169 |
Short-term investments | ||||
Investment companies | 7,273,563 | 0 | 0 | 7,273,563 |
Total assets | $716,913,712 | $169 | $0 | $716,913,881 |
Average daily net assets | Advisory fee |
First $500 million | 0.800 % |
Next $500 million | 0.775 |
Next $1 billion | 0.750 |
Next $1 billion | 0.725 |
Next $1 billion | 0.700 |
Over $4 billion | 0.680 |
Allspring Master Trust:
Name and year of birth | Position held and length of service** | Principal occupations during past five years or longer | Current other public company or investment company directorships |
William R. Ebsworth (Born 1957) | Trustee, since 2015 | Retired. From 1984 to 2013, equities analyst, portfolio manager, research director and chief investment officer at Fidelity Management and Research Company in Boston, Tokyo, and Hong Kong, and retired in 2013 as Chief Investment Officer of Fidelity Strategic Advisers, Inc. where he led a team of investment professionals managing client assets. Prior thereto, Board member of Hong Kong Securities Clearing Co., Hong Kong Options Clearing Corp., the Thailand International Fund, Ltd., Fidelity Investments Life Insurance Company, and Empire Fidelity Investments Life Insurance Company. Serves on the Investment Company Institute’s Board of Governors since 2022 and Executive Committee since 2023 as well as the Vice Chairman of the Governing Council of the Independent Directors Council since 2023. Audit Committee Chair and Investment Committee Chair of the Vincent Memorial Hospital Foundation (non-profit organization). Mr. Ebsworth is a CFA charterholder. | N/A |
Jane A. Freeman (Born 1953) | Trustee, since 2015; Chair Liaison, since January 2018*** | Retired. From 2012 to 2014 and 1999 to 2008, Chief Financial Officer of Scientific Learning Corporation. From 2008 to 2012, Ms. Freeman provided consulting services related to strategic business projects. Prior to 1999, Portfolio Manager at Rockefeller & Co. and Scudder, Stevens & Clark. Board member of the Harding Loevner Funds from 1996 to 2014, serving as both Lead Independent Director and chair of the Audit Committee. Board member of the Russell Exchange Traded Funds Trust from 2011 to 2012 and the chair of the Audit Committee. Ms. Freeman is also an inactive Chartered Financial Analyst. | N/A |
Isaiah Harris, Jr. (Born 1952) | Trustee, since 2009; Audit Committee Chair, since 2019 | Retired. Member of the Advisory Board of CEF of East Central Florida. Chairman of the Board of CIGNA Corporation from 2009 to 2021, and Director from 2005 to 2008. From 2003 to 2011, Director of Deluxe Corporation. Prior thereto, President and CEO of BellSouth Advertising and Publishing Corp. from 2005 to 2007, President and CEO of BellSouth Enterprises from 2004 to 2005 and President of BellSouth Consumer Services from 2000 to 2003. Emeritus member of the Iowa State University Foundation Board of Governors. Emeritus Member of the Advisory board of Iowa State University School of Business. Advisory Board Member, Palm Harbor Academy (private school). Advisory Board Member, Fellowship of Christian Athletes. Mr. Harris is a certified public accountant (inactive status). | N/A |
David F. Larcker (Born 1950) | Trustee, since 2009 | Distinguished Visiting Fellow at the Hoover Institution since 2022. James Irvin Miller Professor of Accounting at the Graduate School of Business (Emeritus), Stanford University, Director of the Corporate Governance Research Initiative and Senior Faculty of The Rock Center for Corporate Governance since 2006. From 2005 to 2008, Professor of Accounting at the Graduate School of Business, Stanford University. Prior thereto, Ernst & Young Professor of Accounting at The Wharton School, University of Pennsylvania from 1985 to 2005. | N/A |
Olivia S. Mitchell (Born 1953) | Trustee, since 2006 | International Foundation of Employee Benefit Plans Professor since 1993, Wharton School of the University of Pennsylvania. Director of Wharton’s Pension Research Council and Boettner Center on Pensions & Retirement Research, and Research Associate at the National Bureau of Economic Research. Previously taught at Cornell University from 1978 to 1993. | N/A |
Timothy J. Penny (Born 1951) | Trustee, since 1996; Chair, since 2018 | President and Chief Executive Officer of Southern Minnesota Initiative Foundation, a non-profit organization, since 2007. Vice Chair of the Economic Club of Minnesota, since 2007. Co-Chair of the Committee for a Responsible Federal Budget, since 1995. Member of the Board of Trustees of NorthStar Education Finance, Inc., a non-profit organization, from 2007-2022. Senior Fellow of the University of Minnesota Humphrey Institute from 1995 to 2017. | N/A |
Name and year of birth | Position held and length of service** | Principal occupations during past five years or longer | Current other public company or investment company directorships |
James G. Polisson (Born 1959) | Trustee, since 2018; Nominating and Governance Committee Chair, since 2024 | Retired. Chief Marketing Officer, Source (ETF) UK Services, Ltd, from 2015 to 2017. From 2012 to 2015, Principal of The Polisson Group, LLC, a management consulting, corporate advisory and principal investing company. Chief Executive Officer and Managing Director at Russell Investments, Global Exchange Traded Funds from 2010 to 2012. Managing Director of Barclays Global Investors from 1998 to 2010 and Global Chief Marketing Officer for iShares and Barclays Global Investors from 2000 to 2010. Trustee of the San Francisco Mechanics’ Institute, a non- profit organization, from 2013 to 2015. Board member of the Russell Exchange Traded Fund Trust from 2011 to 2012. Director of Barclays Global Investors Holdings Deutschland GmbH from 2006 to 2009. Mr. Polisson is an attorney and has a retired status with the Massachusetts and District of Columbia Bar Associations. | N/A |
Pamela Wheelock (Born 1959) | Trustee, since January 2020; previously Trustee from January 2018 to July 2019*** | Retired. Executive and Senior Financial leadership positions in the public, private and nonprofit sectors. Interim President and CEO, McKnight Foundation, 2020. Interim Commissioner, Minnesota Department of Human Services, 2019. Chief Operating Officer, Twin Cities Habitat for Humanity, 2017-2019. Vice President for University Services, University of Minnesota, 2012- 2016. Interim President and CEO, Blue Cross and Blue Shield of Minnesota, 2011-2012. Executive Vice-President and Chief Financial Officer, Minnesota Wild, 2002-2008. Commissioner, Minnesota Department of Finance, 1999-2002. Chair of the Board of Directors of Destination Medical Center Corporation. Board member of the Minnesota Wild Foundation. | N/A |
Name and year of birth | Position held and length of service | Principal occupations during past five years or longer |
Andrew Owen (Born 1960) | President, since 2017 | President and Chief Executive Officer of Allspring Funds Management, LLC since 2017 and Head of Global Fund Governance of Allspring Global Investments since 2022. Prior thereto, co-president of Galliard Capital Management, LLC, an affiliate of Allspring Funds Management, LLC, from 2019 to 2022 and Head of Affiliated Managers, Allspring Global Investments, from 2014 to 2019 and Executive Vice President responsible for marketing, investments and product development for Allspring Funds Management, LLC, from 2009 to 2014. |
Jeremy DePalma (Born 1974) | Treasurer, since 2012 (for certain funds in the Fund Complex); since 2021 (for the remaining funds in the Complex) | Senior Vice President of Allspring Funds Management, LLC since 2009. Senior Vice President of Evergreen Investment Management Company, LLC from 2008 to 2010 and head of the Fund Reporting and Control Team within Fund Administration from 2005 to 2010. |
Christopher Baker (Born 1976) | Chief Compliance Officer, since 2022 | Global Chief Compliance Officer for Allspring Global Investments since 2022. Prior thereto, Chief Compliance Officer for State Street Global Advisors from 2018 to 2021. Senior Compliance Officer for the State Street divisions of Alternative Investment Solutions, Sector Solutions, and Global Marketing from 2015 to 2018. From 2010 to 2015 Vice President, Global Head of Investment and Marketing Compliance for State Street Global Advisors. |
Matthew Prasse (Born 1983) | Chief Legal Officer, since 2022; Secretary, since 2021 | Senior Counsel of the Allspring Legal Department since 2021. Senior Counsel of the Wells Fargo Legal Department from 2018 to 2021. Previously, Counsel for Barings LLC from 2015 to 2018. Prior to joining Barings, Associate at Morgan, Lewis & Bockius LLP from 2008 to 2015. |

P.O. Box 219967
Kansas City, MO 64121-9967

AR1815 04-24

Spectrum Aggressive Growth Fund |
Spectrum Conservative Growth Fund |
Spectrum Growth Fund |
Spectrum Income Allocation Fund |
Spectrum Moderate Growth Fund |
2 | |
6 | |
6 | |
10 | |
14 | |
18 | |
22 | |
26 | |
28 | |
31 | |
35 | |
39 | |
43 | |
47 | |
49 | |
59 | |
65 | |
69 | |
72 | |
75 | |
78 | |
81 | |
94 | |
97 |

Allspring Funds

President
Allspring Funds
Notice to Shareholders |
Beginning in July 2024, each Fund will be required by the Securities and Exchange Commission to send shareholders a paper copy of a new tailored shareholder report in place of the full shareholder report that you are now receiving. The tailored shareholder report will contain concise information about the Fund, including certain expense and performance information and fund statistics. If you wish to receive this new tailored shareholder report electronically, please follow the instructions on the back cover of this report. |
Other information that is currently included in the shareholder report, such as each Fund’s financial statements, will be available online and upon request, free of charge, in paper or electronic format. |
Investment objective | The Fund seeks long-term capital appreciation with no emphasis on income. |
Manager | Allspring Funds Management, LLC |
Subadviser | Allspring Global Investments, LLC |
Portfolio managers | Petros N. Bocray, CFA, FRM, Travis L. Keshemberg, CFA, CIPM, FRM, David Kowalske, Jr.† |
Average annual total returns (%) as of April 30, 2024 | |||||||||
Including sales charge | Excluding sales charge | Expense ratios1 (%) | |||||||
Inception date | 1 year | 5 year | 10 year | 1 year | 5 year | 10 year | Gross | Net2 | |
Class A (WEAFX)3 | 2-10-2017 | 9.70 | 8.63 | 7.84 | 16.39 | 9.92 | 8.48 | 1.04 | 1.01 |
Class C (WEACX)4 | 10-1-1997 | 14.54 | 9.13 | 8.06 | 15.54 | 9.13 | 8.06 | 1.79 | 1.76 |
Administrator Class (WEADX)5 | 2-4-2022 | – | – | – | 16.51 | 10.02 | 8.55 | 0.97 | 0.94 |
Institutional Class (WEAYX)6 | 7-31-2018 | – | – | – | 16.78 | 10.30 | 8.69 | 0.72 | 0.69 |
Russell 3000® Index7 | – | – | – | – | 22.30 | 12.43 | 11.81 | – | – |
Spectrum Aggressive Growth Blended Index8 | – | – | – | – | 18.32 | 10.24 | 9.46 | – | – |
MSCI ACWI ex USA Index (Net)9 | – | – | – | – | 9.32 | 5.03 | 3.93 | – | – |
1 | Reflects the expense ratios as stated in the most recent prospectuses, which include the impact of 0.27% in acquired fund fees and expenses. Net expenses from affiliated master portfolios are included in the acquired fund fees and expense amount. The expense ratios shown are subject to change and may differ from the annualized expense ratios shown in the Financial Highlights of this report, which do not include acquired fund fees and expenses. |
2 | The manager has contractually committed through September 30, 2024, to waive fees and/or reimburse expenses to the extent necessary to cap total annual fund operating expenses after fee waivers at 0.74% for Class A, 1.49% for Class C, 0.67% for Administrator Class and 0.42% for Institutional Class. Brokerage commissions, stamp duty fees, interest, taxes, acquired fund fees and expenses (if any), net expenses from affiliated master portfolios, and extraordinary expenses are excluded from the expense caps. Prior to or after the commitment expiration date, the caps may be increased or the commitment to maintain the caps may be terminated only with the approval of the Board of Trustees. Without these caps, the Fund’s returns would have been lower. The expense ratio paid by an investor is the net expense ratio (the total annual fund operating expenses after fee waivers) as stated in the prospectuses. |
3 | Historical performance for the Class A shares prior to their inception reflects the performance of the Class C shares and includes the higher expenses applicable to the Class C shares. If these expenses had not been included, returns for the Class A shares would be higher. |
4 | Prior to February 13, 2017, historical performance shown for the Class C shares reflects the performance of the Fund’s predecessor WealthBuilder Portfolio share class and does not reflect the front-end sales load previously attributable to the predecessor class. The expenses for the Class C shares and the predecessor share class are similar. |
5 | Historical performance shown for the Administrator Class shares prior to their inception reflects the performance of the Institutional Class shares, adjusted to reflect the higher expenses applicable to the Administrator Class shares. |
6 | Historical performance shown for the Institutional Class shares prior to their inception reflects the performance of the Class A shares adjusted to reflect that the Institutional Class shares do not have a sales load but not adjusted to reflect the Institutional Class expenses. If these expenses had been included, returns for the Institutional Class shares would be higher. |
7 | The Russell 3000® Index measures the performance of the 3,000 largest U.S. companies based on total market capitalization, which represents approximately 98% of the investable U.S. equity market. You cannot invest directly in an index. |
† | Mr. Kowalske became a portfolio manager of the Fund effective January 16, 2024. |
CFA® and Chartered Financial Analyst® are trademarks owned by CFA Institute. | |
Growth of $10,000 investment as of April 30, 20241 |
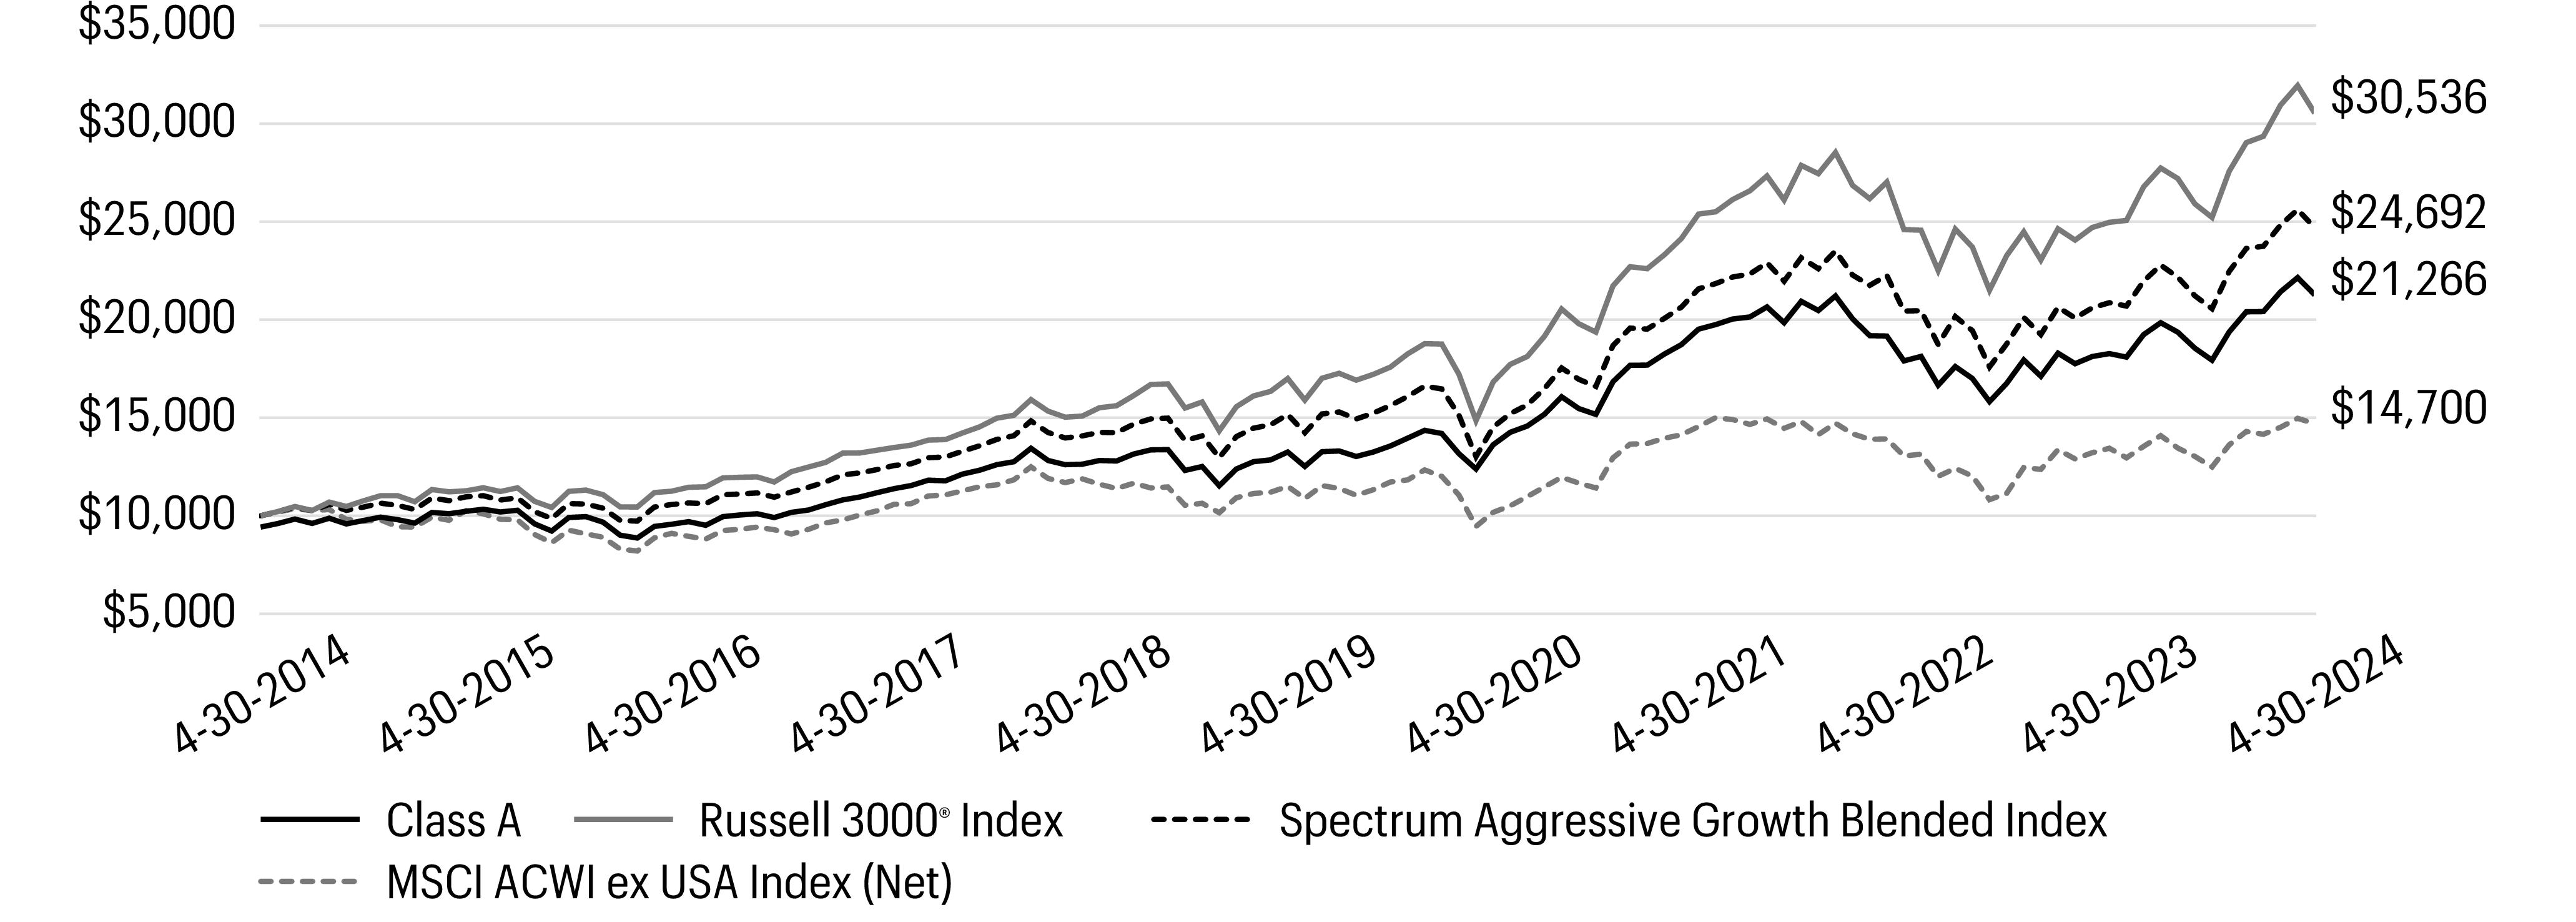
1 | The chart compares the performance of Class A shares for the most recent ten years with the Russell 3000® Index, Spectrum Aggressive Growth Blended Index and MSCI ACWI ex USA Index (Net). The chart assumes a hypothetical investment of $10,000 in Class A shares and reflects all operating expenses and assumes the maximum initial sales charge of 5.75%. |
Footnotes continued from previous page | |
8 | Source: Allspring Funds Management, LLC. The Spectrum Aggressive Growth Blended Index is composed 70% of the Russell 3000® Index and 30% of the MSCI ACWI ex USA Index (Net). Effective November 2, 2020, the WealthBuilder Equity Blended Index was renamed the Spectrum Aggressive Growth Blended Index. You cannot invest directly in an index. |
9 | The Morgan Stanley Capital International (MSCI) All Country World Index (ACWI) ex USA Index (Net) is a free-float-adjusted market-capitalization-weighted index that is designed to measure the equity market performance of developed and emerging markets, excluding the U.S. Source: MSCI. MSCI makes no express or implied warranties or representations and shall have no liability whatsoever with respect to any MSCI data contained herein. The MSCI data may not be further redistributed or used as a basis for other indexes or any securities or financial products. This report is not approved, reviewed, or produced by MSCI. You cannot invest directly in an index. |
Ten largest holdings (%) as of April 30, 20241 | |
Allspring Disciplined Large Cap Portfolio | 29.76 |
iShares Core S&P 500 ETF | 16.50 |
iShares Core MSCI EAFE ETF | 12.46 |
Allspring Disciplined International Developed Markets Portfolio | 9.97 |
iShares Core MSCI Emerging Markets ETF | 4.49 |
Allspring Special Large Cap Value Fund Class R6 | 3.96 |
Allspring Emerging Markets Equity Fund Class R6 | 3.00 |
iShares Core S&P Small-Cap ETF | 2.97 |
Allspring Disciplined Small Cap Fund Class R6 | 2.97 |
Allspring Discovery Large Cap Growth Fund Class R6 | 2.96 |
1 | Figures represent the percentage of the Fund’s net assets. Holdings are subject to change and may have changed since the date specified. |
Allocation (%) as of April 30, 2024 | ||
Neutral allocation | Effective allocation1 | |
Large Cap Funds | 60 | 60 |
International Developed Funds | 23 | 23 |
Small Cap Funds | 10 | 10 |
Emerging Markets Funds | 7 | 7 |
1 | Effective allocation includes the effect of any tactical futures overlay that may be in place. Effective cash, if any, represents the net offset to such future positions. The effective allocation does not reflect futures positions held in dynamic risk hedging strategies. Effective allocations are subject to change and may have changed since the date specified. |
Investment objective | The Fund seeks a combination of current income and capital appreciation. |
Manager | Allspring Funds Management, LLC |
Subadviser | Allspring Global Investments, LLC |
Portfolio managers | Petros N. Bocray, CFA, Travis L. Keshemberg, CFA, CIPM, FRM, David Kowalske, Jr.† |
Average annual total returns (%) as of April 30, 2024 | |||||||||
Including sales charge | Excluding sales charge | Expense ratios1 (%) | |||||||
Inception date | 1 year | 5 year | 10 year | 1 year | 5 year | 10 year | Gross | Net2 | |
Class A (WMBGX)3 | 2-10-2017 | 0.37 | 2.85 | 3.34 | 6.50 | 4.07 | 3.95 | 1.13 | 1.09 |
Class C (WMBFX)4 | 9-30-2004 | 4.70 | 3.30 | 3.55 | 5.70 | 3.30 | 3.55 | 1.88 | 1.84 |
Institutional Class (WMBZX)5 | 7-31-2018 | – | – | – | 6.78 | 4.38 | 4.14 | 0.81 | 0.77 |
Bloomberg U.S. Aggregate Bond Index6 | – | – | – | – | -1.47 | -0.16 | 1.20 | – | – |
Russell 3000® Index7 | – | – | – | – | 22.30 | 12.43 | 11.81 | – | – |
Spectrum Conservative Growth Blended Index8 | – | – | – | – | 5.60 | 4.05 | 4.60 | – | – |
Bloomberg U.S. TIPS Index9 | – | – | – | – | -1.35 | 2.07 | 1.90 | – | – |
ICE BofA U.S. High Yield Constrained Index10 | – | – | – | – | 8.89 | 3.52 | 4.18 | – | – |
MSCI ACWI ex USA Index (Net)11 | – | – | – | – | 9.32 | 5.03 | 3.93 | – | – |
1 | Reflects the expense ratios as stated in the most recent prospectuses, which include the impact of 0.35% in acquired fund fees and expenses. Net expenses from affiliated master portfolios are included in the acquired fund fees and expense amount. The expense ratios shown are subject to change and may differ from the annualized expense ratios shown in the Financial Highlights of this report, which do not include acquired fund fees and expenses. |
2 | The manager has contractually committed through September 30, 2024, to waive fees and/or reimburse expenses to the extent necessary to cap total annual fund operating expenses after fee waivers at 0.74% for Class A, 1.49% for Class C and 0.42% for Institutional Class. Brokerage commissions, stamp duty fees, interest, taxes, acquired fund fees and expenses (if any), net expenses from affiliated master portfolios, and extraordinary expenses are excluded from the expense caps. Prior to or after the commitment expiration date, the caps may be increased or the commitment to maintain the caps may be terminated only with the approval of the Board of Trustees. Without these caps, the Fund’s returns would have been lower. The expense ratio paid by an investor is the net expense ratio (the total annual fund operating expenses after fee waivers) as stated in the prospectuses. |
3 | Historical performance for the Class A shares prior to their inception reflects the performance of the Class C shares and includes the higher expenses applicable to the Class C shares. If these expenses had not been included, returns for the Class A shares would be higher. |
4 | Prior to February 13, 2017, historical performance shown for the Class C shares reflects the performance of the Fund’s predecessor WealthBuilder Portfolio share class and does not reflect the front-end sales load previously attributable to the predecessor class. The expenses for the Class C shares and the predecessor share class are similar. |
5 | Historical performance shown for the Institutional Class shares prior to their inception reflects the performance of the Class A shares adjusted to reflect that the Institutional Class shares do not have a sales load but not adjusted to reflect the Institutional Class expenses. If these expenses had been included, returns for the Institutional Class shares would be higher. |
† | Mr. Kowalske became a portfolio manager of the Fund effective January 16, 2024. |
CFA® and Chartered Financial Analyst® are trademarks owned by CFA Institute. | |
Growth of $10,000 investment as of April 30, 20241 |
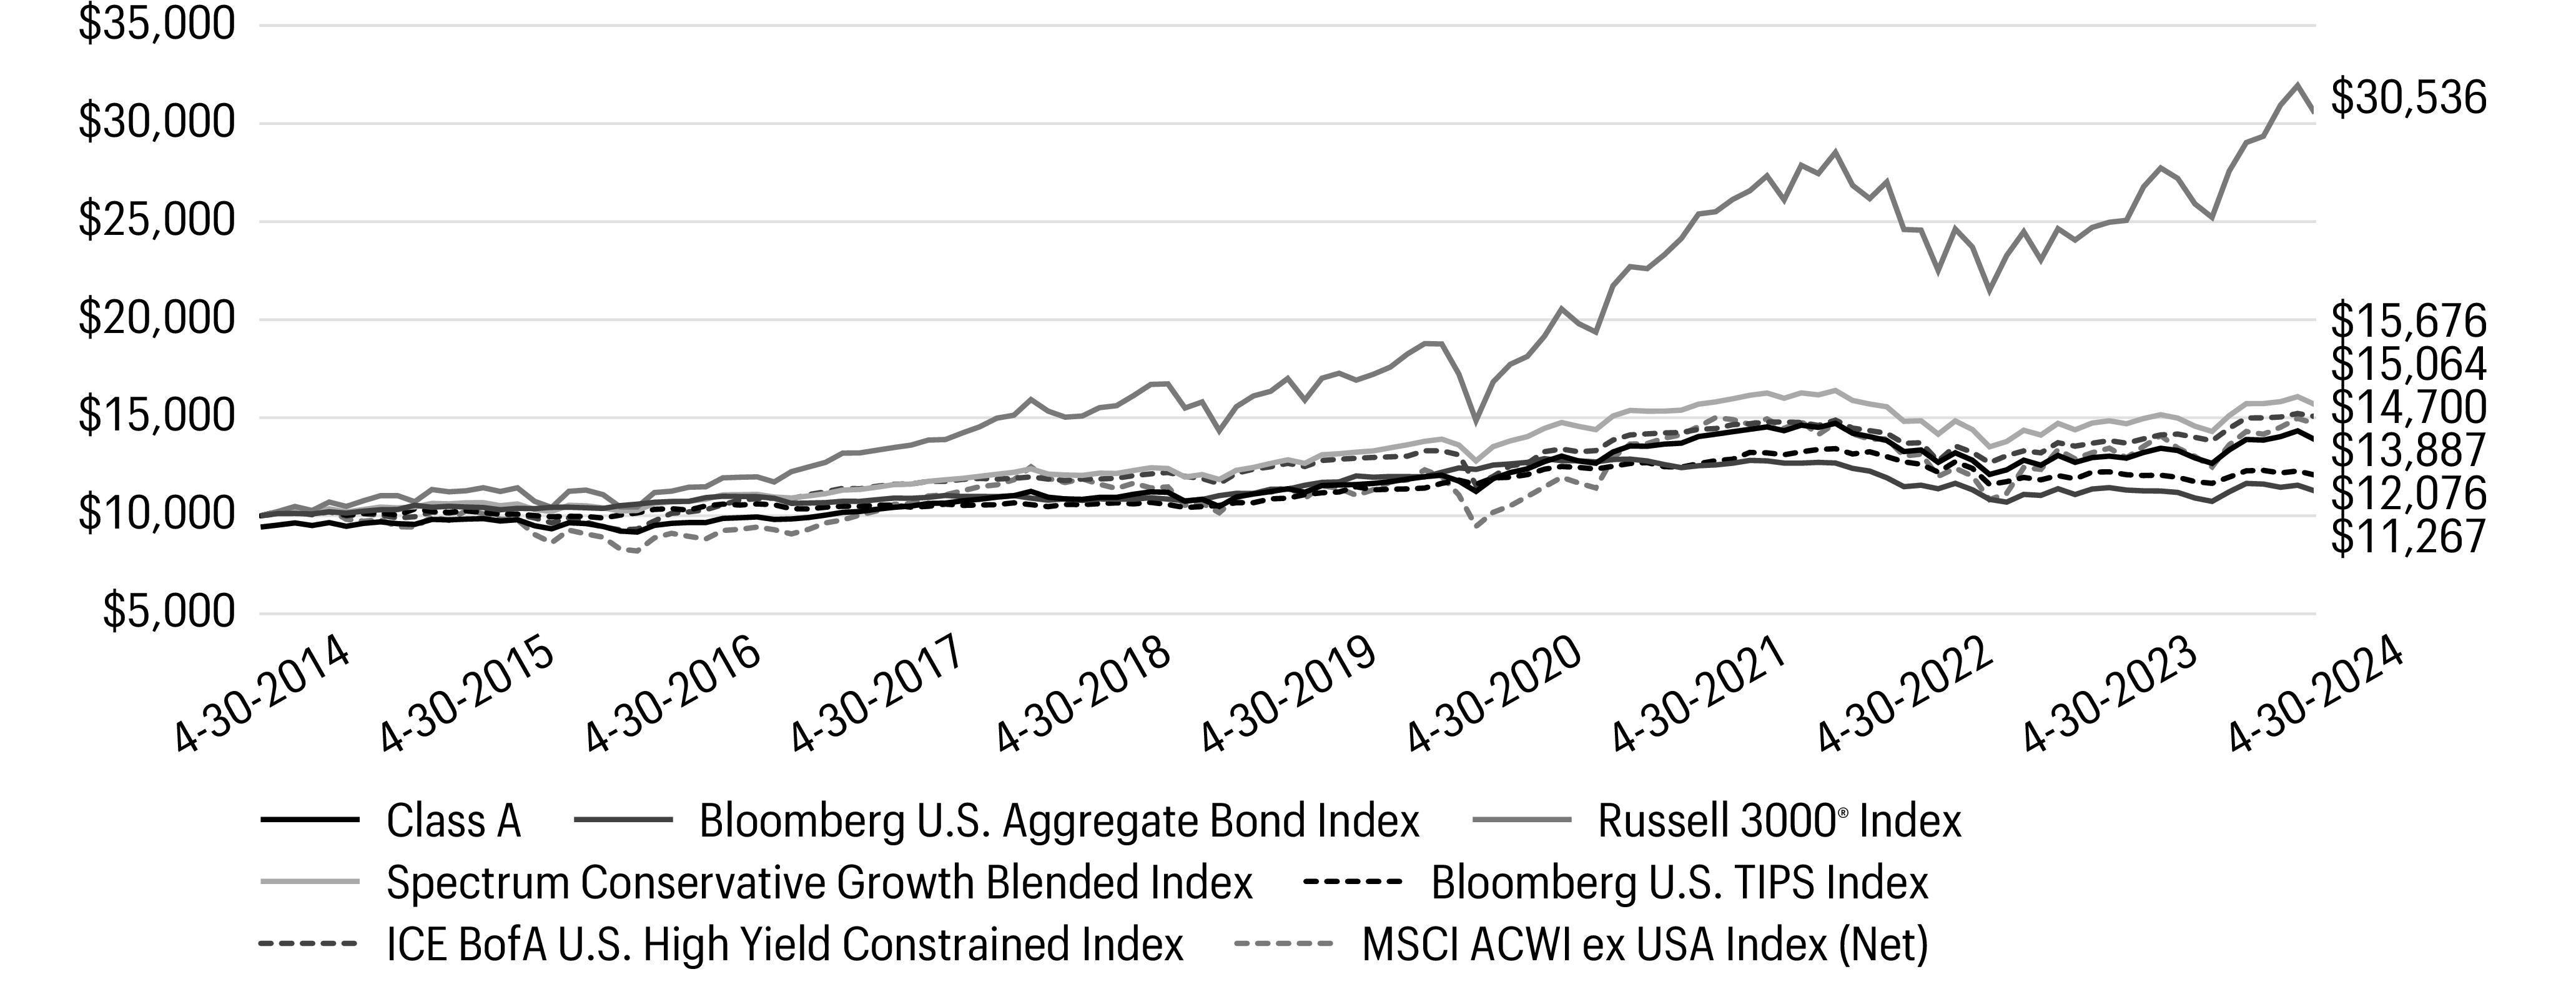
1 | The chart compares the performance of Class A shares for the most recent ten years with the Bloomberg U.S. Aggregate Bond Index, Russell 3000® Index, Spectrum Conservative Growth Blended Index, Bloomberg U.S. TIPS Index, ICE BofA U.S. High Yield Constrained Index and MSCI ACWI ex USA Index (Net). The chart assumes a hypothetical investment of $10,000 in Class A shares and reflects all operating expenses and assumes the maximum initial sales charge of 5.75%. |
Footnotes continued from previous page | |
6 | The Bloomberg U.S. Aggregate Bond Index is a broad-based benchmark that measures the investment-grade, U.S.–dollar–denominated, fixed-rate taxable bond market, including Treasuries, government-related and corporate securities, mortgage-backed securities (agency fixed-rate and hybrid adjustable-rate mortgage pass-throughs), asset-backed securities, and commercial mortgage-backed securities. You cannot invest directly in an index. |
7 | The Russell 3000® Index measures the performance of the 3,000 largest U.S. companies based on total market capitalization, which represents approximately 98% of the investable U.S. equity market. You cannot invest directly in an index. |
8 | Source: Allspring Funds Management, LLC. Spectrum Conservative Growth Blended Index is composed 41% of the Bloomberg U.S. Aggregate Bond Index, 20% of the Russell 3000® Index, 15% of the Bloomberg U.S. TIPS Index, 15% of ICE BofA U.S. High Yield Constrained Index, and 9% of the MSCI ACWI ex USA Index (Net). Effective November 2, 2020, the WealthBuilder Moderate Balanced Blended Index, which was composed 60% of the Bloomberg U.S. Aggregate Bond Index, 28% of the Russell 3000® Index, and 12% of the MSCI ACWI ex USA Index (Net), was renamed the Spectrum Conservative Growth Blended Index. You cannot invest directly in an index. |
9 | The Bloomberg U.S. Treasury Inflation-Protected Securities (TIPS) Index is an index of inflation-indexed-linked U.S. Treasury securities. You cannot invest directly in an index. |
10 | The ICE BofA U.S. High Yield Constrained Index is a market value-weighted index of all domestic and Yankee high-yield bonds, including deferred interest bonds and payment-in kind securities. Issues included in the index have maturities of one year or more and have a credit rating lower than BBB–/Baa3, but are not in default. The ICE BofA U.S. High Yield Constrained Index limits any individual issuer to a maximum of 2% benchmark exposure. Returns shown are net of transaction costs beginning on July 1, 2022. You cannot invest directly in an index. Copyright 2024. ICE Data Indices, LLC. All rights reserved. |
11 | The Morgan Stanley Capital International (MSCI) All Country World Index (ACWI) ex USA Index (Net) is a free-float-adjusted market-capitalization-weighted index that is designed to measure the equity market performance of developed and emerging markets, excluding the U.S. Source: MSCI. MSCI makes no express or implied warranties or representations and shall have no liability whatsoever with respect to any MSCI data contained herein. The MSCI data may not be further redistributed or used as a basis for other indexes or any securities or financial products. This report is not approved, reviewed, or produced by MSCI. You cannot invest directly in an index. |
Ten largest holdings (%) as of April 30, 20241 | |
iShares U.S. Treasury Bond ETF | 14.25 |
Allspring Real Return Portfolio | 12.03 |
Allspring Income Plus Fund Institutional Class | 11.38 |
Allspring Core Bond Portfolio | 9.70 |
Allspring Disciplined Large Cap Portfolio | 9.25 |
Allspring High Yield Bond Fund Institutional Class | 6.98 |
iShares Core S&P 500 ETF | 6.31 |
Allspring Diversified Income Builder Fund Class R6 | 4.68 |
Allspring Alternative Risk Premia Fund Class R6 | 3.68 |
iShares Core MSCI EAFE ETF | 3.46 |
1 | Figures represent the percentage of the Fund’s net assets. Holdings are subject to change and may have changed since the date specified. |
Allocation (%) as of April 30, 2024 | ||
Neutral allocation | Effective allocation1 | |
Bond Funds | 54 | 59 |
Stock Funds | 28 | 35 |
Inflation Sensitive Funds | 14 | 12 |
Alternative Funds | 4 | 4 |
Effective Cash | 0 | (10 ) |
1 | Effective allocation includes the effect of any tactical futures overlay that may be in place. Effective cash, if any, represents the net offset to such future positions. The effective allocation does not reflect futures positions held in dynamic risk hedging strategies. Effective allocations are subject to change and may have changed since the date specified. |
Investment objective | The Fund seeks capital appreciation with a secondary emphasis on current income. |
Manager | Allspring Funds Management, LLC |
Subadviser | Allspring Global Investments, LLC |
Portfolio managers | Petros N. Bocray, CFA, Travis L. Keshemberg, CFA, CIPM, FRM, David Kowalske, Jr.† |
Average annual total returns (%) as of April 30, 2024 | |||||||||
Including sales charge | Excluding sales charge | Expense ratios1 (%) | |||||||
Inception date | 1 year | 5 year | 10 year | 1 year | 5 year | 10 year | Gross | Net2 | |
Class A (WGAFX)3 | 2-10-2017 | 5.07 | 5.81 | 5.96 | 11.48 | 7.07 | 6.59 | 1.13 | 1.07 |
Class C (WGCFX)4 | 9-30-2004 | 9.61 | 6.31 | 6.19 | 10.61 | 6.31 | 6.19 | 1.88 | 1.82 |
Institutional Class (WGAYX)5 | 7-31-2018 | – | – | – | 11.91 | 7.41 | 6.77 | 0.81 | 0.75 |
Russell 3000® Index6 | – | – | – | – | 22.30 | 12.43 | 11.81 | – | – |
Bloomberg U.S. Aggregate Bond Index7 | – | – | – | – | -1.47 | -0.16 | 1.20 | – | – |
Spectrum Growth Blended Index8 | – | – | – | – | 11.11 | 6.81 | 7.18 | – | – |
MSCI ACWI ex USA Index (Net)9 | – | – | – | – | 9.32 | 5.03 | 3.93 | – | – |
Bloomberg U.S. TIPS Index10 | – | – | – | – | -1.35 | 2.07 | 1.90 | – | – |
ICE BofA U.S. High Yield Constrained Index11 | – | – | – | – | 8.89 | 3.52 | 4.18 | – | – |
1 | Reflects the expense ratios as stated in the most recent prospectuses, which include the impact of 0.33% in acquired fund fees and expenses. Net expenses from affiliated master portfolios are included in the acquired fund fees and expense amount. The expense ratios shown are subject to change and may differ from the annualized expense ratios shown in the Financial Highlights of this report, which do not include acquired fund fees and expenses. |
2 | The manager has contractually committed through September 30, 2024, to waive fees and/or reimburse expenses to the extent necessary to cap total annual fund operating expenses after fee waivers at 0.74% for Class A, 1.49% for Class C and 0.42% for Institutional Class. Brokerage commissions, stamp duty fees, interest, taxes, acquired fund fees and expenses (if any), net expenses from affiliated master portfolios, and extraordinary expenses are excluded from the expense caps. Prior to or after the commitment expiration date, the caps may be increased or the commitment to maintain the caps may be terminated only with the approval of the Board of Trustees. Without these caps, the Fund’s returns would have been lower. The expense ratio paid by an investor is the net expense ratio (the total annual fund operating expenses after fee waivers) as stated in the prospectuses. |
3 | Historical performance for the Class A shares prior to their inception reflects the performance of the Class C shares and includes the higher expenses applicable to the Class C shares. If these expenses had not been included, returns for the Class A shares would be higher. |
4 | Prior to February 13, 2017, historical performance shown for the Class C shares reflects the performance of the Fund’s predecessor WealthBuilder Portfolio share class and does not reflect the front-end sales load previously attributable to the predecessor class. The expenses for the Class C shares and the predecessor share class are similar. |
5 | Historical performance shown for the Institutional Class shares prior to their inception reflects the performance of the Class A shares adjusted to reflect that the Institutional Class shares do not have a sales load but not adjusted to reflect the Institutional Class expenses. If these expenses had been included, returns for the Institutional Class shares would be higher. |
6 | The Russell 3000® Index measures the performance of the 3,000 largest U.S. companies based on total market capitalization, which represents approximately 98% of the investable U.S. equity market. You cannot invest directly in an index. |
† | Mr. Kowalske became a portfolio manager of the Fund effective January 16, 2024. |
CFA® and Chartered Financial Analyst® are trademarks owned by CFA Institute. | |
Growth of $10,000 investment as of April 30, 20241 |
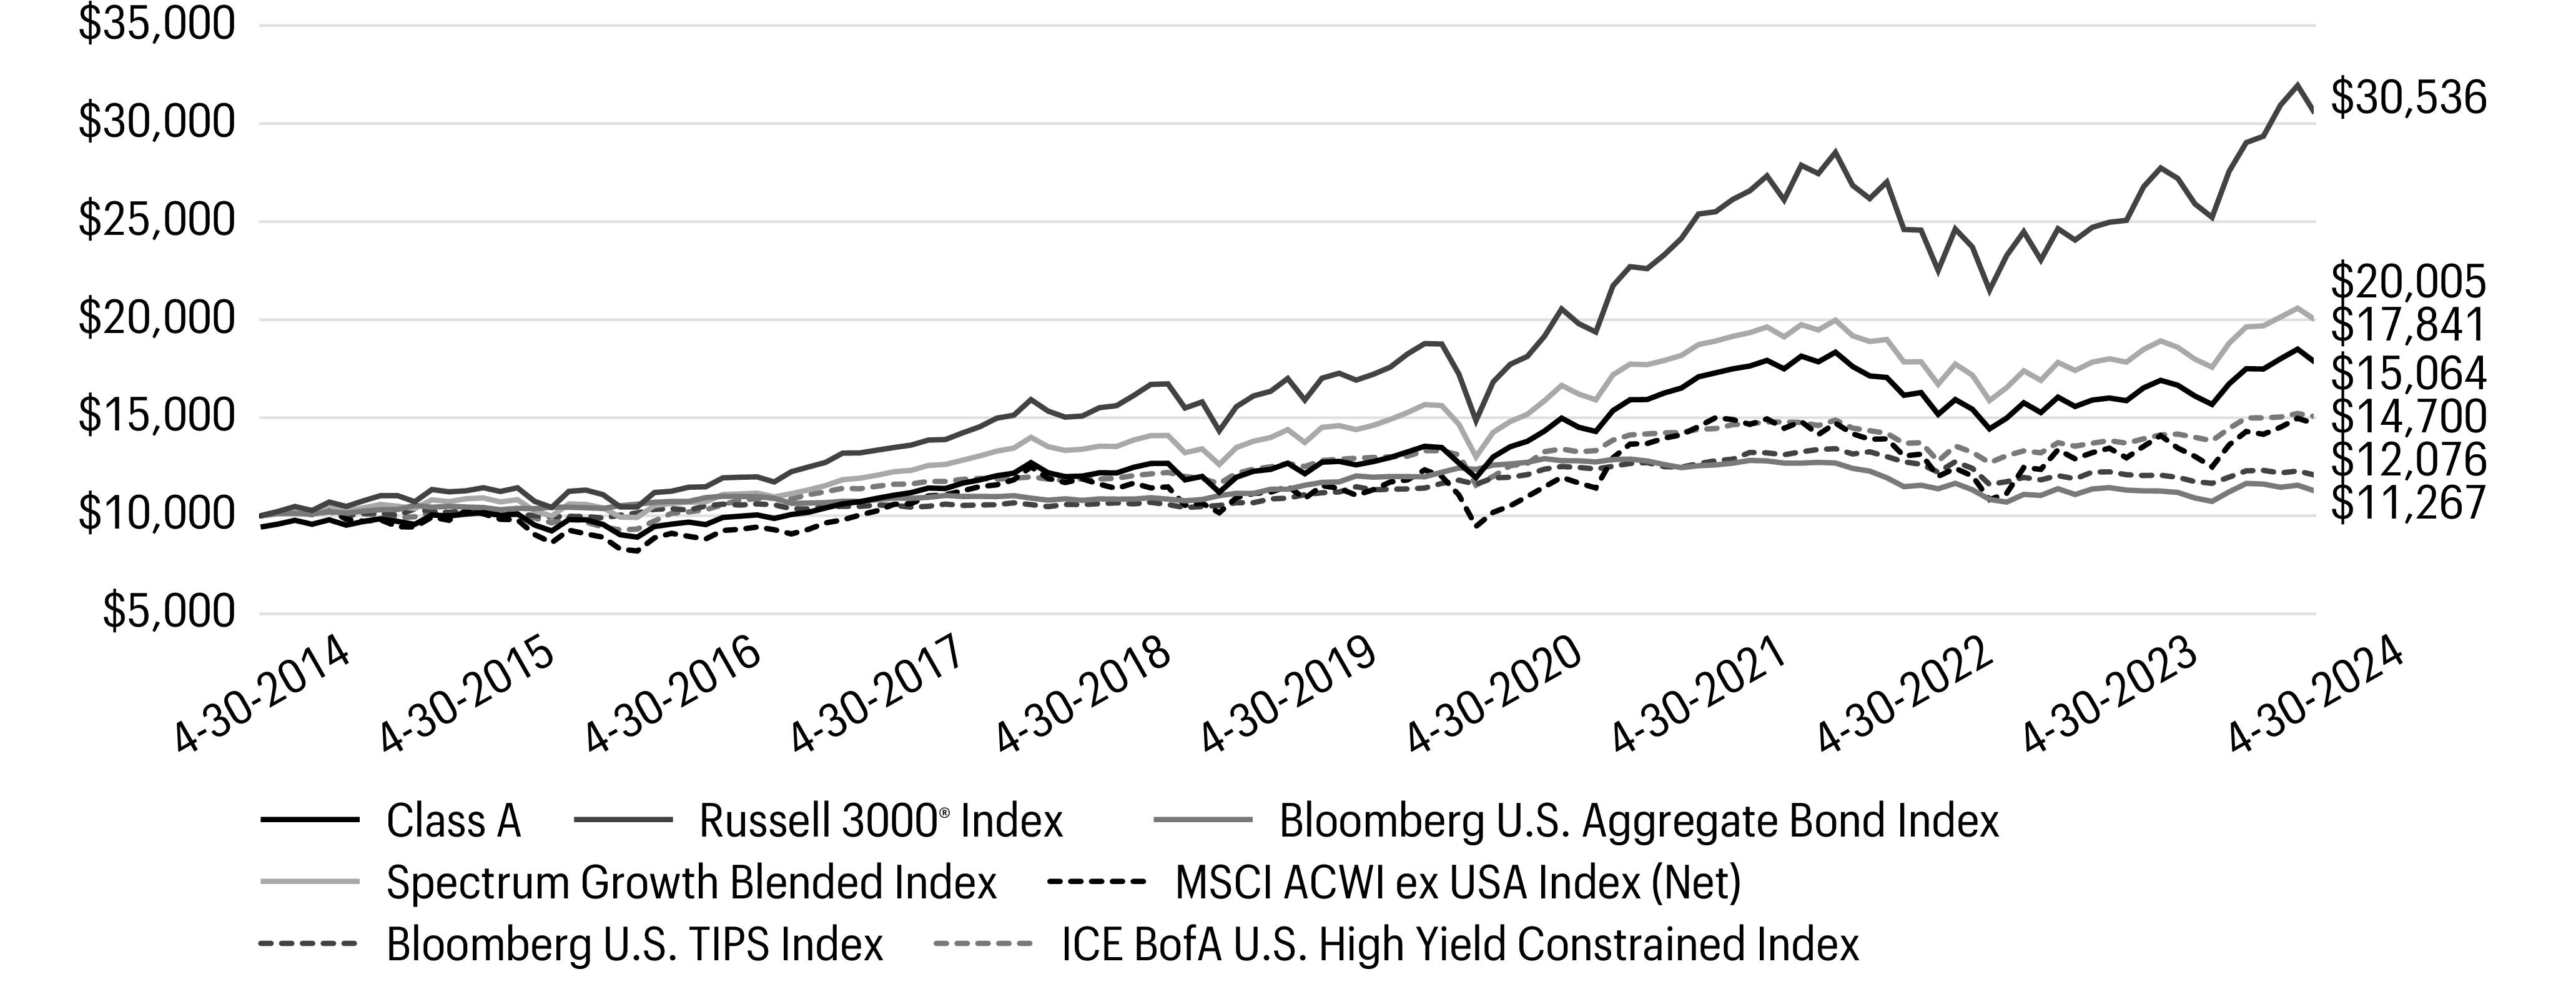
1 | The chart compares the performance of Class A shares for the most recent ten years with the Russell 3000® Index, Bloomberg U.S. Aggregate Bond Index, Spectrum Growth Blended Index, MSCI ACWI ex USA Index (Net), Bloomberg U.S. TIPS Index and ICE BofA U.S. High Yield Constrained Index . The chart assumes a hypothetical investment of $10,000 in Class A shares and reflects all operating expenses and assumes the maximum initial sales charge of 5.75%. |
Footnotes continued from previous page | |
7 | The Bloomberg U.S. Aggregate Bond Index is a broad-based benchmark that measures the investment-grade, U.S.–dollar–denominated, fixed-rate taxable bond market, including Treasuries, government-related and corporate securities, mortgage-backed securities (agency fixed-rate and hybrid adjustable-rate mortgage pass-throughs), asset-backed securities, and commercial mortgage-backed securities. You cannot invest directly in an index. |
8 | Source: Allspring Funds Management, LLC. Spectrum Growth Blended Index is composed 40% of the Russell 3000® Index, 17% of the MSCI ACWI ex USA Index (Net), 15% of the Bloomberg U.S. Aggregate Bond Index, 14% of the Bloomberg U.S. TIPS Index, and 14% of ICE BofA U.S. High Yield Constrained Index. Effective November 2, 2020, the WealthBuilder Growth Allocation Blended Index, which was composed 56% of the Russell 3000® Index, 24% of the MSCI ACWI ex USA Index (Net), and 20% of the Bloomberg U.S. Aggregate Bond Index, was renamed the Spectrum Growth Blended Index. You cannot invest directly in an index. |
9 | The Morgan Stanley Capital International (MSCI) All Country World Index (ACWI) ex USA Index (Net) is a free-float-adjusted market-capitalization-weighted index that is designed to measure the equity market performance of developed and emerging markets, excluding the U.S. Source: MSCI. MSCI makes no express or implied warranties or representations and shall have no liability whatsoever with respect to any MSCI data contained herein. The MSCI data may not be further redistributed or used as a basis for other indexes or any securities or financial products. This report is not approved, reviewed, or produced by MSCI. You cannot invest directly in an index. |
10 | The Bloomberg U.S. Treasury Inflation-Protected Securities (TIPS) Index is an index of inflation-indexed-linked U.S. Treasury securities. You cannot invest directly in an index. |
11 | The ICE BofA U.S. High Yield Constrained Index is a market-value-weighted index of all domestic and Yankee high-yield bonds, including deferred interest bonds and payment-in-kind securities. Issues included in the index have maturities of one year or more and have a credit rating lower than BBB-/Baa3 but are not in default. The ICE BofA U.S. High Yield Constrained Index limits any individual issuer to a maximum of 2% benchmark exposure. Returns shown are net of transaction costs beginning on July 1, 2022. You cannot invest directly in an index. Copyright 2024. ICE Data Indices, LLC. All rights reserved. |
Ten largest holdings (%) as of April 30, 20241 | |
Allspring Disciplined Large Cap Portfolio | 17.57 |
Allspring Real Return Portfolio | 11.60 |
iShares Core S&P 500 ETF | 8.90 |
Allspring High Yield Bond Fund Institutional Class | 7.55 |
iShares Core MSCI EAFE ETF | 7.53 |
Allspring Disciplined International Developed Markets Portfolio | 5.95 |
Allspring Diversified Income Builder Fund Class R6 | 5.67 |
iShares U.S. Treasury Bond ETF | 4.44 |
iShares Core MSCI Emerging Markets ETF | 2.79 |
Allspring Alternative Risk Premia Fund Class R6 | 2.47 |
1 | Figures represent the percentage of the Fund’s net assets. Holdings are subject to change and may have changed since the date specified. |
Allocation (%) as of April 30, 2024 | ||
Neutral allocation | Effective allocation1 | |
Stock Funds | 58 | 63 |
Bond Funds | 24 | 33 |
Inflation Sensitive Funds | 15 | 12 |
Alternative Funds | 3 | 2 |
Effective Cash | 0 | (10 ) |
1 | Effective allocation includes the effect of any tactical futures overlay that may be in place. Effective cash, if any, represents the net offset to such future positions. The effective allocation does not reflect futures positions held in dynamic risk hedging strategies. Effective allocations are subject to change and may have changed since the date specified. |
Investment objective | The Fund seeks current income with a secondary emphasis on capital appreciation. |
Manager | Allspring Funds Management, LLC |
Subadviser | Allspring Global Investments, LLC |
Portfolio managers | Petros N. Bocray, CFA, Travis L. Keshemberg, CFA, CIPM, FRM, David Kowalske, Jr.† |
Average annual total returns (%) as of April 30, 2024 | |||||||||
Including sales charge | Excluding sales charge | Expense ratios1 (%) | |||||||
Inception date | 1 year | 5 year | 10 year | 1 year | 5 year | 10 year | Gross | Net2 | |
Class A (WCAFX)3 | 2-10-2017 | -3.72 | 0.43 | 1.44 | 2.16 | 1.62 | 2.04 | 1.14 | 1.06 |
Class C (WCCFX)4 | 9-30-2004 | 0.55 | 0.87 | 1.63 | 1.55 | 0.87 | 1.63 | 1.89 | 1.81 |
Institutional Class (WCYFX)5 | 7-31-2018 | – | – | – | 2.59 | 2.00 | 2.23 | 0.82 | 0.74 |
Bloomberg U.S. Aggregate Bond Index6 | – | – | – | – | -1.47 | -0.16 | 1.20 | – | – |
Russell 3000® Index7 | – | – | – | – | 22.30 | 12.43 | 11.81 | – | – |
Spectrum Income Allocation Blended Index8 | – | – | – | – | 1.95 | 1.91 | 2.89 | – | – |
ICE BofA U.S. High Yield Constrained Index9 | – | – | – | – | 8.89 | 3.52 | 4.18 | – | – |
Bloomberg U.S. TIPS Index10 | – | – | – | – | -1.35 | 2.07 | 1.90 | – | – |
MSCI ACWI ex USA Index (Net)11 | – | – | – | – | 9.32 | 5.03 | 3.93 | – | – |
1 | Reflects the expense ratios as stated in the most recent prospectuses, which include the impact of 0.32% in acquired fund fees and expenses. Net expenses from affiliated master portfolios are included in the acquired fund fees and expense amount. The expense ratios shown are subject to change and may differ from the annualized expense ratios shown in the Financial Highlights of this report, which do not include acquired fund fees and expenses. |
2 | The manager has contractually committed through September 30, 2024, to waive fees and/or reimburse expenses to the extent necessary to cap total annual fund operating expenses after fee waivers at 0.74% for Class A, 1.49% for Class C and 0.42% for Institutional Class. Brokerage commissions, stamp duty fees, interest, taxes, acquired fund fees and expenses (if any), net expenses from affiliated master portfolios, and extraordinary expenses are excluded from the expense caps. Prior to or after the commitment expiration date, the caps may be increased or the commitment to maintain the caps may be terminated only with the approval of the Board of Trustees. Without these caps, the Fund’s returns would have been lower. The expense ratio paid by an investor is the net expense ratio (the total annual fund operating expenses after fee waivers) as stated in the prospectuses. |
3 | Historical performance for the Class A shares prior to their inception reflects the performance of the Class C shares and includes the higher expenses applicable to the Class C shares. If these expenses had not been included, returns for the Class A shares would be higher. |
4 | Prior to February 13, 2017, historical performance shown for the Class C shares reflects the performance of the Fund’s predecessor WealthBuilder Portfolio share class and does not reflect the front-end sales load previously attributable to the predecessor class. The expenses for the Class C shares and the predecessor share class are similar. |
5 | Historical performance shown for the Institutional Class shares prior to their inception reflects the performance of the Class A shares adjusted to reflect that the Institutional Class shares do not have a sales load but not adjusted to reflect the Institutional Class expenses. If these expenses had been included, returns for the Institutional Class shares would be higher. |
† | Mr. Kowalske became a portfolio manager of the Fund effective January 16, 2024. |
CFA® and Chartered Financial Analyst® are trademarks owned by CFA Institute. | |
Growth of $10,000 investment as of April 30, 20241 |
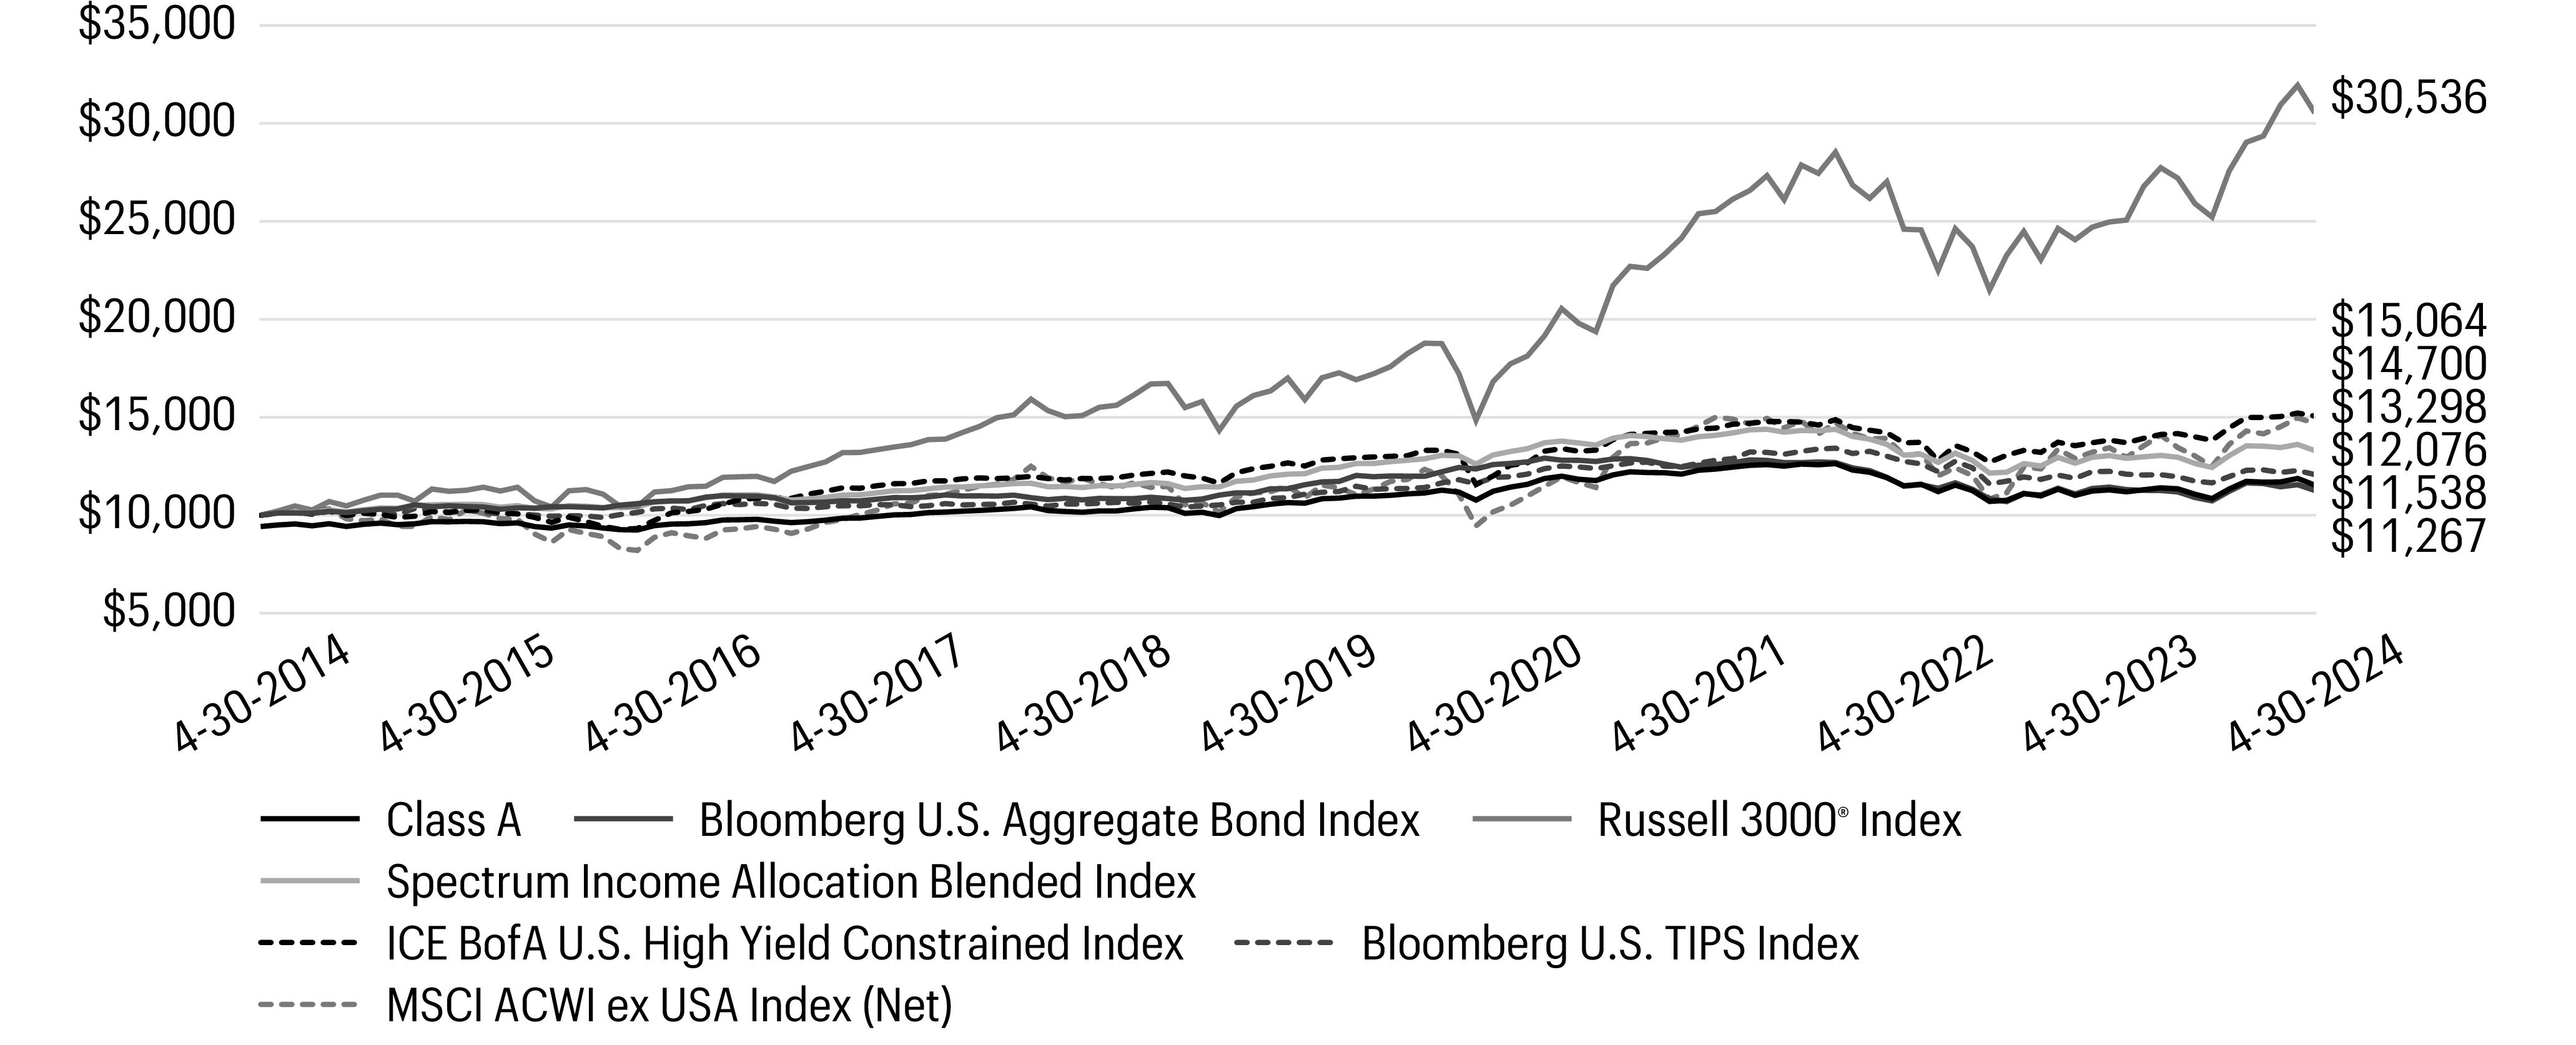
1 | The chart compares the performance of the Fund for the most recent ten years with the Bloomberg U.S. Aggregate Bond Index, Russell 3000® Index, Spectrum Income Allocation Blended Index, ICE BofA U.S. High Yield Constrained Index, Bloomberg U.S. TIPS Index and MSCI ACWI ex USA Index (Net). The chart assumes a hypothetical investment of $10,000 investment and reflects all operating expenses of the Fund. |
Footnotes continued from previous page | |
6 | The Bloomberg U.S. Aggregate Bond Index is a broad-based benchmark that measures the investment-grade, U.S.–dollar–denominated, fixed-rate taxable bond market, including Treasuries, government-related and corporate securities, mortgage-backed securities (agency fixed-rate and hybrid adjustable-rate mortgage pass-throughs), asset-backed securities, and commercial mortgage-backed securities. You cannot invest directly in an index. |
7 | The Russell 3000® Index measures the performance of the 3,000 largest U.S. companies based on total market capitalization, which represents approximately 98% of the investable U.S. equity market. You cannot invest directly in an index. |
8 | Source: Allspring Funds Management, LLC. Spectrum Income Allocation Blended Index is composed 65% of the Bloomberg U.S. Aggregate Bond Index, 15% of ICE BofA U.S. High Yield Constrained Index, 10% of the Bloomberg U.S. TIPS Index, 7% of the Russell 3000® Index, and 3% of the MSCI ACWI ex USA Index (Net). Effective November 2, 2020, the WealthBuilder Growth Allocation Blended Index, which was composed 80% of the Bloomberg U.S. Aggregate Bond Index, 14% of the Russell 3000® Index, and 6% of the MSCI ACWI ex USA Index (Net), was renamed the Spectrum Income Allocation Blended Index. You cannot invest directly in an index. |
9 | The ICE BofA U.S. High Yield Constrained Index is a market value-weighted index of all domestic and Yankee high-yield bonds, including deferred interest bonds and payment-in kind securities. Issues included in the index have maturities of one year or more and have a credit rating lower than BBB–/Baa3, but are not in default. The ICE BofA U.S. High Yield Constrained Index limits any individual issuer to a maximum of 2% benchmark exposure. Returns shown are net of transaction costs beginning on July 1, 2022. You cannot invest directly in an index. Copyright 2024. ICE Data Indices, LLC. All rights reserved. |
10 | The Bloomberg U.S. Treasury Inflation-Protected Securities (TIPS) Index is an index of inflation-indexed-linked U.S. Treasury securities. You cannot invest directly in an index. |
11 | The Morgan Stanley Capital International (MSCI) All Country World Index (ACWI) ex USA Index (Net) is a free-float-adjusted market-capitalization-weighted index that is designed to measure the equity market performance of developed and emerging markets, excluding the U.S. Source: MSCI. MSCI makes no express or implied warranties or representations and shall have no liability whatsoever with respect to any MSCI data contained herein. The MSCI data may not be further redistributed or used as a basis for other indexes or any securities or financial products. This report is not approved, reviewed, or produced by MSCI. You cannot invest directly in an index. |
Ten largest holdings (%) as of April 30, 20241 | |
iShares U.S. Treasury Bond ETF | 25.11 |
Allspring Core Bond Portfolio | 21.24 |
Allspring Real Return Portfolio | 11.49 |
Allspring Income Plus Fund Institutional Class | 9.88 |
Allspring High Yield Bond Fund Institutional Class | 6.36 |
Allspring Diversified Income Builder Fund Class R6 | 4.16 |
Allspring Disciplined Large Cap Portfolio | 3.62 |
Allspring Alternative Risk Premia Fund Class R6 | 3.16 |
iShares Core S&P 500 ETF | 3.03 |
Allspring Global Investment Grade Credit Fund Class R6 | 2.97 |
1 | Figures represent the percentage of the Fund’s net assets. Holdings are subject to change and may have changed since the date specified. |
Allocation (%) as of April 30, 2024 | ||
Neutral allocation | Effective allocation1 | |
Bond Funds | 77 | 79 |
Stock Funds | 10 | 16 |
Inflation Sensitive Funds | 10 | 12 |
Alternative Funds | 3 | 3 |
Effective Cash | 0 | (10 ) |
1 | Effective allocation includes the effect of any tactical futures overlay that may be in place. Effective cash, if any, represents the net offset to such future positions. The effective allocation does not reflect futures positions held in dynamic risk hedging strategies. Effective allocations are subject to change and may have changed since the date specified. |
Investment objective | The Fund seeks a combination of capital appreciation and current income. |
Manager | Allspring Funds Management, LLC |
Subadviser | Allspring Global Investments, LLC |
Portfolio managers | Petros N. Bocray, CFA, Travis L. Keshemberg, CFA, CIPM, FRM, David Kowalske, Jr.† |
Average annual total returns (%) as of April 30, 2024 | |||||||||
Including sales charge | Excluding sales charge | Expense ratios1 (%) | |||||||
Inception date | 1 year | 5 year | 10 year | 1 year | 5 year | 10 year | Gross | Net2 | |
Class A (WGBAX)3 | 2-10-2017 | 3.35 | 4.66 | 4.87 | 9.65 | 5.91 | 5.50 | 1.11 | 1.07 |
Class C (WGBFX)4 | 10-1-1997 | 7.83 | 5.13 | 5.09 | 8.83 | 5.13 | 5.09 | 1.86 | 1.82 |
Institutional Class (WGBIX)5 | 7-31-2018 | – | – | – | 9.99 | 6.24 | 5.68 | 0.79 | 0.75 |
Russell 3000® Index6 | – | – | – | – | 22.30 | 12.43 | 11.81 | – | – |
Bloomberg U.S. Aggregate Bond Index7 | – | – | – | – | -1.47 | -0.16 | 1.20 | – | – |
Spectrum Moderate Growth Blended Index8 | – | – | – | – | 8.87 | 5.75 | 6.06 | – | – |
Bloomberg U.S. TIPS Index9 | – | – | – | – | -1.35 | 2.07 | 1.90 | – | – |
ICE BofA U.S. High Yield Constrained Index10 | – | – | – | – | 8.89 | 3.52 | 4.18 | – | – |
MSCI ACWI ex USA Index (Net)11 | – | – | – | – | 9.32 | 5.03 | 3.93 | – | – |
1 | Reflects the expense ratios as stated in the most recent prospectuses, which include the impact of 0.36% in acquired fund fees and expenses. Net expenses from affiliated master portfolios are included in the acquired fund fees and expense amount. The expense ratios shown are subject to change and may differ from the annualized expense ratios shown in the Financial Highlights of this report, which do not include acquired fund fees and expenses. |
2 | The manager has contractually committed through September 30, 2025, to waive fees and/or reimburse expenses to the extent necessary to cap total annual fund operating expenses after fee waivers at 0.71% for Class A, 1.46% for Class C and 0.39% for Institutional Class. Brokerage commissions, stamp duty fees, interest, taxes, acquired fund fees and expenses (if any), net expenses from affiliated master portfolios, and extraordinary expenses are excluded from the expense caps. Prior to or after the commitment expiration date, the caps may be increased or the commitment to maintain the caps may be terminated only with the approval of the Board of Trustees. Without these caps, the Fund’s returns would have been lower. The expense ratio paid by an investor is the net expense ratio (the total annual fund operating expenses after fee waivers) as stated in the prospectuses. |
3 | Historical performance for the Class A shares prior to their inception reflects the performance of the Class C shares and includes the higher expenses applicable to the Class C shares. If these expenses had not been included, returns for the Class A shares would be higher. |
4 | Prior to February 13, 2017, historical performance shown for the Class C shares reflects the performance of the Fund’s predecessor WealthBuilder Portfolio share class and does not reflect the front-end sales load previously attributable to the predecessor class. The expenses for the Class C shares and the predecessor share class are similar. |
5 | Historical performance shown for the Institutional Class shares prior to their inception reflects the performance of the Class A shares adjusted to reflect that the Institutional Class shares do not have a sales load but not adjusted to reflect the Institutional Class expenses. If these expenses had been included, returns for the Institutional Class shares would be higher. |
6 | The Russell 3000® Index measures the performance of the 3,000 largest U.S. companies based on total market capitalization, which represents approximately 98% of the investable U.S. equity market. You cannot invest directly in an index. |
† | Mr. Kowalske became a portfolio manager of the Fund effective January 16, 2024. |
CFA® and Chartered Financial Analyst® are trademarks owned by CFA Institute. | |
Growth of $10,000 investment as of April 30, 20241 |
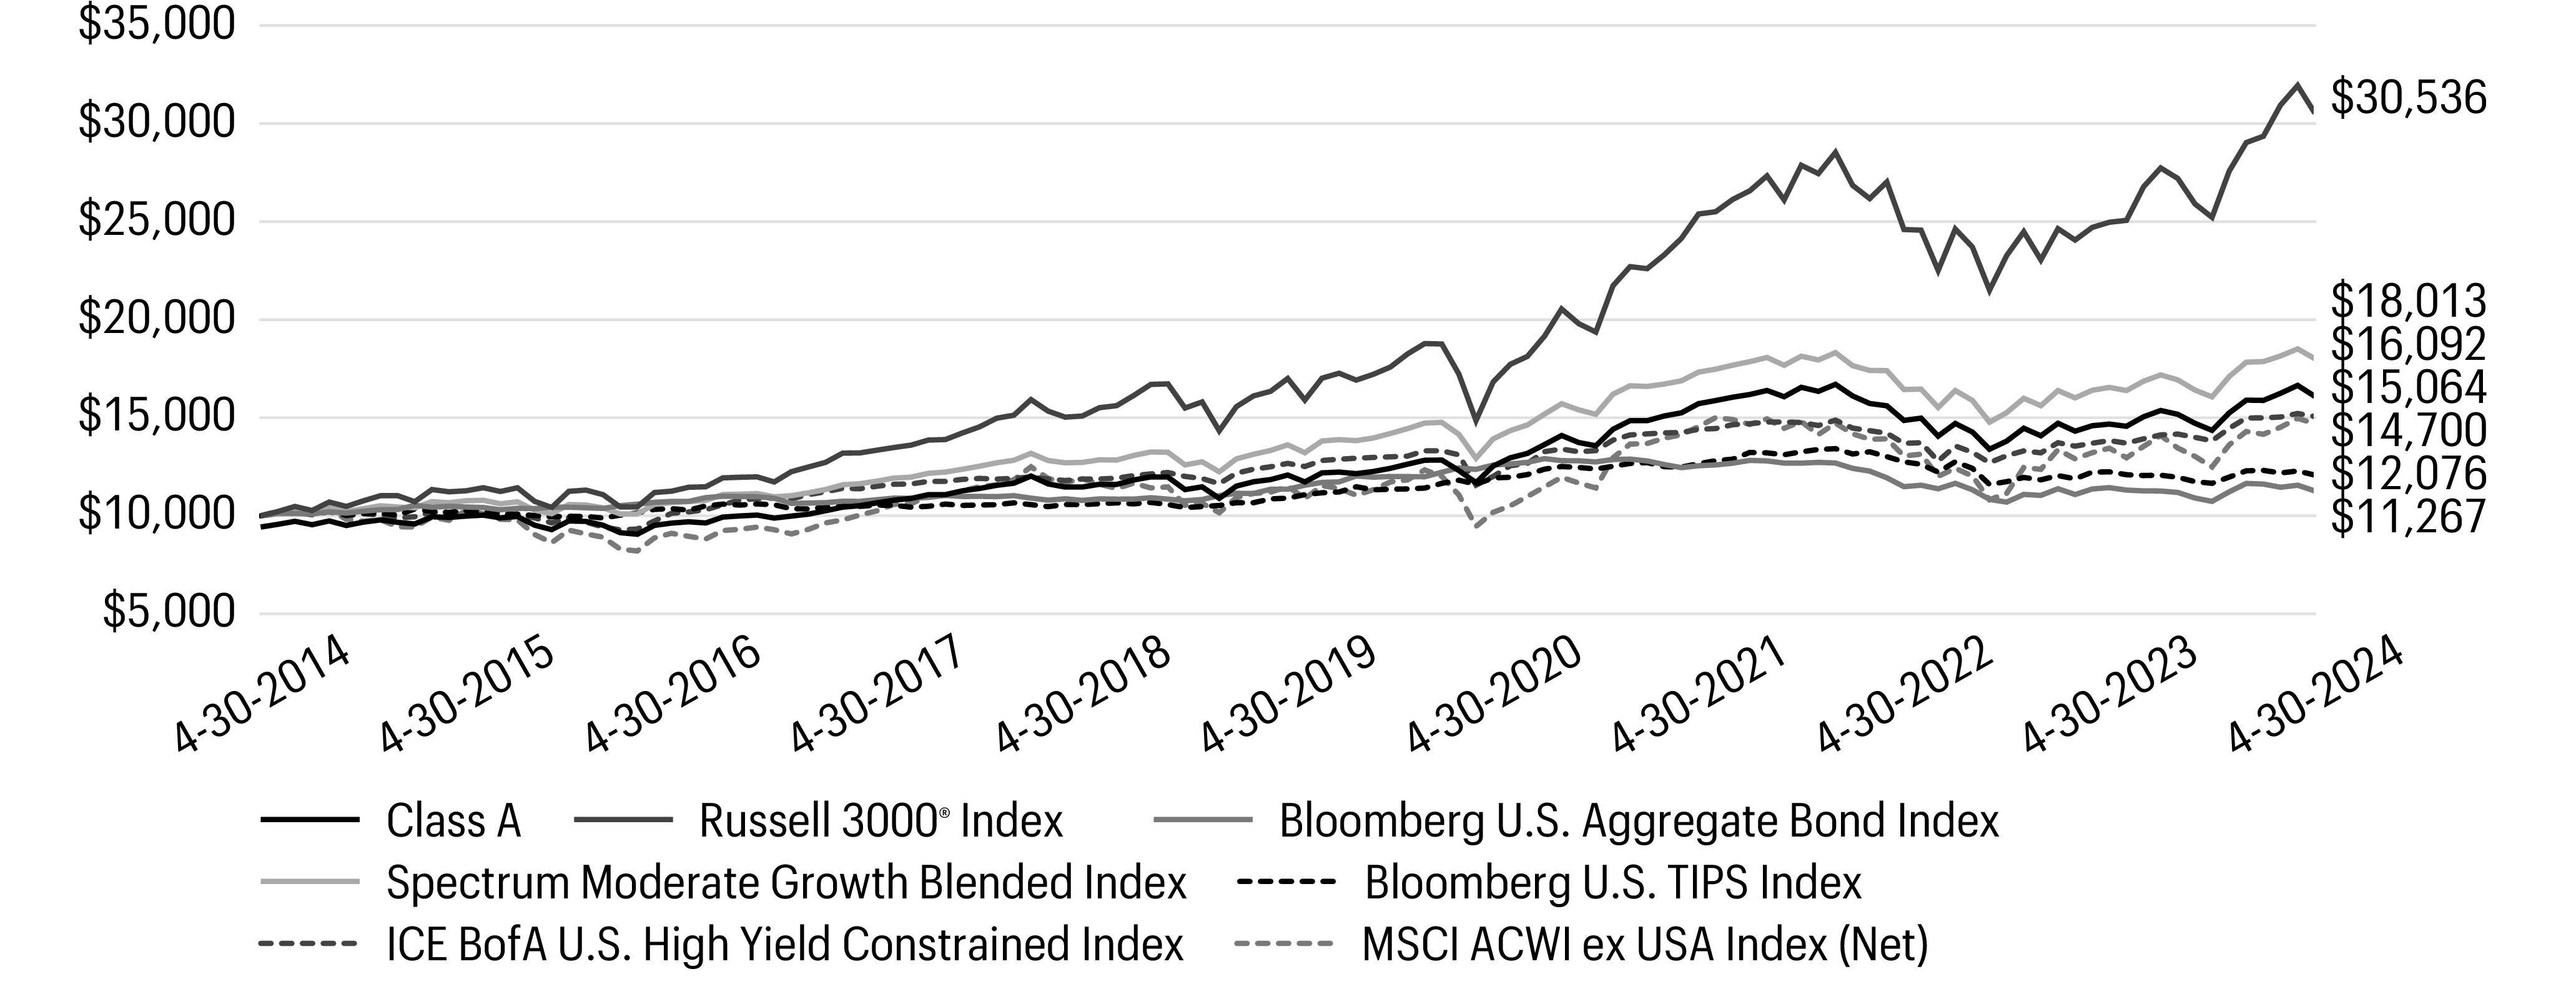
1 | The chart compares the performance of Class A shares for the most recent ten years with the Russell 3000® Index, Bloomberg U.S. Aggregate Bond Index, Spectrum Moderate Growth Blended Index, Bloomberg U.S. TIPS Index, ICE BofA U.S. High Yield Constrained Index and MSCI ACWI ex USA Index (Net). The chart assumes a hypothetical investment of $10,000 in Class A shares and reflects all operating expenses and assumes the maximum initial sales charge of 5.75%. |
Footnotes continued from previous page | |
7 | The Bloomberg U.S. Aggregate Bond Index is a broad-based benchmark that measures the investment-grade, U.S.–dollar–denominated, fixed-rate taxable bond market, including Treasuries, government-related and corporate securities, mortgage-backed securities (agency fixed-rate and hybrid adjustable-rate mortgage pass-throughs), asset-backed securities, and commercial mortgage-backed securities. You cannot invest directly in an index. |
8 | Source: Allspring Funds Management, LLC. Spectrum Moderate Growth Blended Index is composed 32% of the Russell 3000® Index, 26% of the Bloomberg U.S. Aggregate Bond Index, 14% of the Bloomberg U.S. TIPS Index, 14% of ICE BofA U.S. High Yield Constrained Index, and 14% of the MSCI ACWI ex USA Index (Net). Effective November 2, 2020, the WealthBuilder Growth Balanced Blended Index, which was composed of 42% of the Russell 3000® Index, 40% of the Bloomberg U.S. Aggregate Bond Index, and 18% of the MSCI ACWI ex USA Index (Net), was renamed the Spectrum Moderate Growth Blended Index. You cannot invest directly in an index. |
9 | The Bloomberg U.S. Treasury Inflation-Protected Securities (TIPS) Index is an index of inflation-indexed-linked U.S. Treasury securities. You cannot invest directly in an index. |
10 | The ICE BofA U.S. High Yield Constrained Index is a market-value-weighted index of all domestic and Yankee high-yield bonds, including deferred interest bonds and payment-in-kind securities. Issues included in the index have maturities of one year or more and have a credit rating lower than BBB-/Baa3 but are not in default. The ICE BofA U.S. High Yield Constrained Index limits any individual issuer to a maximum of 2% benchmark exposure. Returns shown are net of transaction costs beginning on July 1, 2022. You cannot invest directly in an index. Copyright 2024. ICE Data Indices, LLC. All rights reserved. |
11 | The Morgan Stanley Capital International (MSCI) All Country World Index (ACWI) ex USA Index (Net) is a free-float-adjusted market-capitalization-weighted index that is designed to measure the equity market performance of developed and emerging markets, excluding the U.S. Source: MSCI. MSCI makes no express or implied warranties or representations and shall have no liability whatsoever with respect to any MSCI data contained herein. The MSCI data may not be further redistributed or used as a basis for other indexes or any securities or financial products. This report is not approved, reviewed, or produced by MSCI. You cannot invest directly in an index. |
Ten largest holdings (%) as of April 30, 20241 | |
Allspring Disciplined Large Cap Portfolio | 14.32 |
Allspring Real Return Portfolio | 11.36 |
Allspring Income Plus Fund Institutional Class | 7.82 |
iShares Core S&P 500 ETF | 7.42 |
iShares U.S. Treasury Bond ETF | 6.93 |
Allspring High Yield Bond Fund Institutional Class | 6.59 |
iShares Core MSCI EAFE ETF | 6.25 |
Allspring Diversified Income Builder Fund Class R6 | 4.98 |
Allspring Disciplined International Developed Markets Portfolio | 4.95 |
Allspring Core Bond Portfolio | 4.45 |
1 | Figures represent the percentage of the Fund’s net assets. Holdings are subject to change and may have changed since the date specified. |
Allocation (%) as of April 30, 2024 | ||
Neutral allocation | Effective allocation1 | |
Stock Funds | 45 | 52 |
Bond Funds | 37 | 42 |
Inflation Sensitive Funds | 14 | 12 |
Alternative Funds | 4 | 4 |
Effective Cash | 0 | (10 ) |
1 | Effective allocation includes the effect of any tactical futures overlay that may be in place. Effective cash, if any, represents the net offset to such future positions. The effective allocation does not reflect futures positions held in dynamic risk hedging strategies. Effective allocations are subject to change and may have changed since the date specified. |
Beginning account value 11-1-2023 | Ending account value 4-30-2024 | Expenses paid during the period1, 2 | Annualized net expense ratio2 | |
Spectrum Aggressive Growth Fund | ||||
Class A | ||||
Actual | $1,000.00 | $1,185.71 | $4.02 | 0.74 % |
Hypothetical (5% return before expenses) | $1,000.00 | $1,021.18 | $3.72 | 0.74 % |
Class C | ||||
Actual | $1,000.00 | $1,181.39 | $8.08 | 1.49 % |
Hypothetical (5% return before expenses) | $1,000.00 | $1,017.45 | $7.47 | 1.49 % |
Administrator Class | ||||
Actual | $1,000.00 | $1,186.22 | $3.64 | 0.67 % |
Hypothetical (5% return before expenses) | $1,000.00 | $1,021.53 | $3.37 | 0.67 % |
Institutional Class | ||||
Actual | $1,000.00 | $1,187.54 | $2.28 | 0.42 % |
Hypothetical (5% return before expenses) | $1,000.00 | $1,022.78 | $2.11 | 0.42 % |
1 | Expenses paid is equal to the annualized net expense ratio of each class multiplied by the average account value over the period, multiplied by 182 divided by 366 (to reflect the one-half-year period). |
2 | Amounts do not reflect net expenses allocated from the affiliated Master Portfolios in which the Fund invests. |
Beginning account value 11-1-2023 | Ending account value 4-30-2024 | Expenses paid during the period1, 2 | Annualized net expense ratio2 | |
Spectrum Conservative Growth Fund | ||||
Class A | ||||
Actual | $1,000.00 | $1,095.82 | $3.86 | 0.74 % |
Hypothetical (5% return before expenses) | $1,000.00 | $1,021.18 | $3.72 | 0.74 % |
Class C | ||||
Actual | $1,000.00 | $1,092.14 | $7.75 | 1.49 % |
Hypothetical (5% return before expenses) | $1,000.00 | $1,017.45 | $7.47 | 1.49 % |
Institutional Class | ||||
Actual | $1,000.00 | $1,096.82 | $2.19 | 0.42 % |
Hypothetical (5% return before expenses) | $1,000.00 | $1,022.78 | $2.11 | 0.42 % |
Spectrum Growth Fund | ||||
Class A | ||||
Actual | $1,000.00 | $1,137.99 | $3.93 | 0.74 % |
Hypothetical (5% return before expenses) | $1,000.00 | $1,021.18 | $3.72 | 0.74 % |
Class C | ||||
Actual | $1,000.00 | $1,132.59 | $7.90 | 1.49 % |
Hypothetical (5% return before expenses) | $1,000.00 | $1,017.45 | $7.47 | 1.49 % |
Institutional Class | ||||
Actual | $1,000.00 | $1,139.12 | $2.23 | 0.42 % |
Hypothetical (5% return before expenses) | $1,000.00 | $1,022.78 | $2.11 | 0.42 % |
Spectrum Income Allocation Fund | ||||
Class A | ||||
Actual | $1,000.00 | $1,063.38 | $3.80 | 0.74 % |
Hypothetical (5% return before expenses) | $1,000.00 | $1,021.18 | $3.72 | 0.74 % |
Class C | ||||
Actual | $1,000.00 | $1,059.93 | $7.63 | 1.49 % |
Hypothetical (5% return before expenses) | $1,000.00 | $1,017.45 | $7.47 | 1.49 % |
Institutional Class | ||||
Actual | $1,000.00 | $1,064.89 | $2.16 | 0.42 % |
Hypothetical (5% return before expenses) | $1,000.00 | $1,022.78 | $2.11 | 0.42 % |
Spectrum Moderate Growth Fund | ||||
Class A | ||||
Actual | $1,000.00 | $1,120.89 | $3.80 | 0.72 % |
Hypothetical (5% return before expenses) | $1,000.00 | $1,021.28 | $3.62 | 0.72 % |
Class C | ||||
Actual | $1,000.00 | $1,117.01 | $7.79 | 1.48 % |
Hypothetical (5% return before expenses) | $1,000.00 | $1,017.50 | $7.42 | 1.48 % |
Institutional Class | ||||
Actual | $1,000.00 | $1,122.13 | $1.95 | 0.37 % |
Hypothetical (5% return before expenses) | $1,000.00 | $1,023.02 | $1.86 | 0.37 % |
1 | Expenses paid is equal to the annualized net expense ratio of each class multiplied by the average account value over the period, multiplied by 182 divided by 366 (to reflect the one-half-year period). |
2 | Amounts do not reflect net expenses allocated from the affiliated Master Portfolios in which the Fund invests. |
Shares | Value | |||||
Investment companies: 99.24% | ||||||
Affiliated master portfolios: 43.65% | ||||||
Allspring Disciplined International Developed Markets Portfolio | $47,491,825 | |||||
Allspring Disciplined Large Cap Portfolio | 141,801,792 | |||||
Allspring Emerging Growth Portfolio | 9,310,677 | |||||
Allspring Small Company Value Portfolio | 9,360,610 | |||||
207,964,904 | ||||||
Exchange-traded funds: 39.75% | ||||||
Energy Select Sector SPDR Fund | 68,904 | 6,443,902 | ||||
iShares Core MSCI EAFE ETF | 826,835 | 59,366,753 | ||||
iShares Core MSCI Emerging Markets ETF | 413,713 | 21,368,277 | ||||
iShares Core S&P 500 ETF | 155,818 | 78,600,831 | ||||
iShares Core S&P Small-Cap ETF | 135,648 | 14,160,296 | ||||
iShares Russell 1000 Growth ETF | 29,261 | 9,446,621 | ||||
189,386,680 | ||||||
Stock funds: 15.84% | ||||||
Allspring Disciplined Small Cap Fund Class R6♠ | 1,136,848 | 14,119,647 | ||||
Allspring Discovery Large Cap Growth Fund Class R6♠† | 1,356,469 | 14,107,281 | ||||
Allspring Emerging Markets Equity Fund Class R6♠ | 564,687 | 14,275,274 | ||||
Allspring Premier Large Company Growth Fund Class R6♠† | 1,150,879 | 14,063,740 | ||||
Allspring Special Large Cap Value Fund Class R6♠ | 1,480,851 | 18,880,855 | ||||
75,446,797 | ||||||
Total investment companies (Cost $374,996,767) | 472,798,381 | |||||
Yield | ||||||
Short-term investments: 0.06% | ||||||
Investment companies: 0.06% | ||||||
Allspring Government Money Market Fund Select Class♠∞ | 5.23 % | 300,000 | 300,000 | |||
Total short-term investments (Cost $300,000) | 300,000 | |||||
Total investments in securities (Cost $375,296,767) | 99.30 % | 473,098,381 | ||||
Other assets and liabilities, net | 0.70 | 3,338,313 | ||||
Total net assets | 100.00 % | $476,436,694 | ||||
♠ | The issuer of the security is an affiliated person of the Fund as defined in the Investment Company Act of 1940. |
† | Non-income-earning security |
∞ | The rate represents the 7-day annualized yield at period end. |
Value, beginning of period | Purchases | Sales proceeds | Net realized gains (losses) on affiliated Underlying Funds | Net change in unrealized gains (losses) on affiliated Underlying Funds | Value, end of period | |
Investment companies | ||||||
Allspring Disciplined Small Cap Fund Class R6 | $0 | $14,396,100 | $(1,044,801 ) | $52,574 | $715,774 | $14,119,647 |
Allspring Discovery Large Cap Growth Fund Class R6† | 18,356,702 | 1,068,793 | (7,861,538 ) | 551,446 | 1,991,878 | 14,107,281 |
Allspring Emerging Markets Equity Fund Class R6 | 13,346,748 | 1,281,490 | (1,157,130 ) | (219,434 ) | 1,023,600 | 14,275,274 |
Allspring Premier Large Company Growth Fund Class R6† | 18,317,214 | 4,839,537 | (8,482,025 ) | (1,601,210 ) | 990,224 | 14,063,740 |
Allspring Special Large Cap Value Fund Class R6 | 17,854,244 | 941,656 | (2,929,821 ) | (130,463 ) | 3,145,239 | 18,880,855 |
Short-term investments | ||||||
Allspring Government Money Market Fund Select Class | 300,000 | 128,425,354 | (128,425,354 ) | 0 | 0 | 300,000 |
$(1,347,087 ) | $7,866,715 | $75,746,797 |
Shares, end of period | Dividends from affiliated Underlying Funds | Net realized gains on capital gain distributions from affiliated Underlying Funds | |
Investment companies | |||
Allspring Disciplined Small Cap Fund Class R6 | 1,136,848 | $36,559 | $332,471 |
Allspring Discovery Large Cap Growth Fund Class R6† | 1,356,469 | 0 | 766,568 |
Allspring Emerging Markets Equity Fund Class R6 | 564,687 | 191,998 | 0 |
Allspring Premier Large Company Growth Fund Class R6† | 1,150,879 | 0 | 4,454,368 |
Allspring Special Large Cap Value Fund Class R6 | 1,480,851 | 222,636 | 392,253 |
Short-term investments | |||
Allspring Government Money Market Fund Select Class | 300,000 | 50,728 | 0 |
$501,921 | $5,945,660 |
† | Non-income-earning security |
% of ownership, beginning of period | % of ownership, end of period | Net realized gains (losses) on investments allocated from affiliated Master Portfolios | Net change in unrealized gains (losses) on investments allocated from affiliated Master Portfolios | Dividends allocated from affiliated Master Portfolios | Interest allocated from affiliated Master Portfolios | Affiliated Income Allocated from affiliated Master Portfolios | Value, end of period | |
Allspring Disciplined International Developed Markets Portfolio | 0.00 % | 16.01 % | $111,095 | $9,974,424 | $605,556 | $967 | $32,817 | $47,491,825 |
Allspring Disciplined Large Cap Portfolio | 50.69 | 41.14 | 1,520,490 | 36,145,893 | 1,593,529 | 15,113 | 117,732 | 141,801,792 |
Allspring Emerging Growth Portfolio | 2.71 | 3.35 | 127,044 | 1,062,634 | 10,651 | 91 | 8,097 | 9,310,677 |
Allspring Factor Enhanced Emerging Markets Equity Portfolio* | 10.67 | 0.00 | 578,819 | (1,552,911 ) | 197,814 | 735 | 12,809 | 0 |
Allspring Factor Enhanced International Equity Portfolio* | 20.84 | 0.00 | 14,242,027 | (20,535,476 ) | 509,734 | 5,466 | 134,075 | 0 |
Allspring Factor Enhanced U.S. Large Cap Equity Portfolio* | 10.67 | 0.00 | 14,092,554 | (15,067,616 ) | 366,444 | 5,390 | 56,354 | 0 |
Allspring Factor Enhanced U.S. Small Cap Equity Portfolio* | 11.27 | 0.00 | 835,400 | (1,972,823 ) | 96,802 | 1,704 | 21,257 | 0 |
Allspring Small Company Value Portfolio | 1.70 | 1.31 | 564,381 | 1,634,292 | 167,174 | 23 | 4,268 | 9,360,610 |
$32,071,810 | $9,688,417 | $3,547,704 | $29,489 | $387,409 | $207,964,904 |
* | Liquidated on December 6, 2023 |
Description | Number of contracts | Expiration date | Notional cost | Notional value | Unrealized gains | Unrealized losses |
Long | ||||||
TOPIX Index | 55 | 6-13-2024 | $9,476,581 | $9,579,622 | $103,041 | $0 |
Euro Futures | 100 | 6-17-2024 | 13,700,854 | 13,373,125 | 0 | (327,729 ) |
E-Mini NASDAQ 100 Index | 42 | 6-21-2024 | 15,366,667 | 14,759,850 | 0 | (606,817 ) |
E-Mini S&P 500 Index | 38 | 6-21-2024 | 9,590,337 | 9,627,300 | 36,963 | 0 |
Short | ||||||
New Zealand Dollar Futures | (233 ) | 6-17-2024 | (14,324,411 ) | (13,741,175 ) | 583,236 | 0 |
Swiss Franc Futures | (97 ) | 6-17-2024 | (13,954,252 ) | (13,262,325 ) | 691,927 | 0 |
Canadian Dollar Futures | (197 ) | 6-18-2024 | (14,314,436 ) | (14,326,825 ) | 0 | (12,389 ) |
E-Mini Russell 2000 Index | (97 ) | 6-21-2024 | (9,492,055 ) | (9,630,160 ) | 0 | (138,105 ) |
Euro STOXX 50 Index | (181 ) | 6-21-2024 | (9,589,080 ) | (9,459,207 ) | 129,873 | 0 |
MSCI Emerging Markets Index | (288 ) | 6-21-2024 | (15,069,662 ) | (15,004,800 ) | 64,862 | 0 |
$1,609,902 | $(1,085,040 ) |
Shares | Value | |||||
Investment companies: 98.83% | ||||||
Affiliated master portfolios: 35.20% | ||||||
Allspring Core Bond Portfolio | $22,078,089 | |||||
Allspring Disciplined International Developed Markets Portfolio | 6,977,382 | |||||
Allspring Disciplined Large Cap Portfolio | 21,057,591 | |||||
Allspring Emerging Growth Portfolio | 1,316,674 | |||||
Allspring Real Return Portfolio | 27,394,501 | |||||
Allspring Small Company Value Portfolio | 1,328,589 | |||||
80,152,826 | ||||||
Alternative investment funds: 3.68% | ||||||
Allspring Alternative Risk Premia Fund Class R6♠ | 1,025,886 | 8,371,228 | ||||
Bond funds: 21.35% | ||||||
Allspring Global Investment Grade Credit Fund Class R6♠ | 791,028 | 6,802,844 | ||||
Allspring High Yield Bond Fund Institutional Class♠ | 5,354,759 | 15,903,633 | ||||
Allspring Income Plus Fund Institutional Class♠ | 3,014,059 | 25,920,907 | ||||
48,627,384 | ||||||
Exchange-traded funds: 29.02% | ||||||
Energy Select Sector SPDR Fund | 32,735 | 3,061,377 | ||||
iShares Core MSCI EAFE ETF | 109,722 | 7,878,038 | ||||
iShares Core MSCI Emerging Markets ETF | 52,317 | 2,702,173 | ||||
iShares Core S&P 500 ETF | 28,472 | 14,362,416 | ||||
iShares Core S&P Small-Cap ETF | 17,138 | 1,789,036 | ||||
iShares Core U.S. Aggregate Bond ETF | 26,097 | 2,485,217 | ||||
iShares Russell 1000 Growth ETF | 4,165 | 1,344,629 | ||||
iShares U.S. Treasury Bond ETF | 1,465,162 | 32,460,664 | ||||
66,083,550 | ||||||
Multi-asset funds: 4.68% | ||||||
Allspring Diversified Income Builder Fund Class R6♠ | 1,873,195 | 10,658,481 | ||||
Stock funds: 4.90% | ||||||
Allspring Disciplined Small Cap Fund Class R6♠ | 178,385 | 2,215,538 | ||||
Allspring Discovery Large Cap Growth Fund Class R6♠† | 214,629 | 2,232,146 | ||||
Allspring Emerging Markets Equity Fund Class R6♠ | 71,376 | 1,804,379 | ||||
Allspring Premier Large Company Growth Fund Class R6♠† | 181,502 | 2,217,958 | ||||
Allspring Special Large Cap Value Fund Class R6♠ | 211,191 | 2,692,688 | ||||
11,162,709 | ||||||
Total investment companies (Cost $222,437,893) | 225,056,178 | |||||
Yield | Shares | Value | ||||
Short-term investments: 0.09% | ||||||
Investment companies: 0.09% | ||||||
Allspring Government Money Market Fund Select Class♠∞ | 5.23 % | 200,000 | $200,000 | |||
Total short-term investments (Cost $200,000) | 200,000 | |||||
Total investments in securities (Cost $222,637,893) | 98.92 % | 225,256,178 | ||||
Other assets and liabilities, net | 1.08 | 2,451,960 | ||||
Total net assets | 100.00 % | $227,708,138 | ||||
♠ | The issuer of the security is an affiliated person of the Fund as defined in the Investment Company Act of 1940. |
† | Non-income-earning security |
∞ | The rate represents the 7-day annualized yield at period end. |
Value, beginning of period | Purchases | Sales proceeds | Net realized gains (losses) on affiliated Underlying Funds | Net change in unrealized gains (losses) on affiliated Underlying Funds | Value, end of period | |
Investment companies | ||||||
Allspring Alternative Risk Premia Fund Class R6 | $9,540,449 | $746,216 | $(1,889,336 ) | $(328,882 ) | $302,781 | $8,371,228 |
Allspring Disciplined Small Cap Fund Class R6 | 0 | 2,447,941 | (365,409 ) | 20,971 | 112,035 | 2,215,538 |
Allspring Discovery Large Cap Growth Fund Class R6† | 3,107,539 | 202,176 | (1,509,709 ) | 165,893 | 266,247 | 2,232,146 |
Allspring Diversified Income Builder Fund Class R6 | 12,098,756 | 587,112 | (2,946,608 ) | (198,585 ) | 1,117,806 | 10,658,481 |
Allspring Emerging Markets Equity Fund Class R6 | 2,026,357 | 103,095 | (447,553 ) | (81,690 ) | 204,170 | 1,804,379 |
Allspring Global Investment Grade Credit Fund Class R6 | 7,752,710 | 316,457 | (1,323,252 ) | (309,978 ) | 366,907 | 6,802,844 |
Allspring High Yield Bond Fund Institutional Class | 18,061,427 | 1,981,699 | (4,598,308 ) | (611,497 ) | 1,070,312 | 15,903,633 |
Allspring Income Plus Fund Institutional Class | 29,501,895 | 2,353,218 | (6,055,213 ) | (540,954 ) | 661,961 | 25,920,907 |
Allspring Premier Large Company Growth Fund Class R6† | 3,097,321 | 858,883 | (1,647,458 ) | (307,391 ) | 216,603 | 2,217,958 |
Allspring Special Large Cap Value Fund Class R6 | 3,031,770 | 115,231 | (934,422 ) | (43,915 ) | 524,024 | 2,692,688 |
Short-term investments | ||||||
Allspring Government Money Market Fund Select Class | 200,000 | 56,292,306 | (56,292,306 ) | 0 | 0 | 200,000 |
$(2,236,028 ) | $4,842,846 | $79,019,802 |
Shares, end of period | Dividends from affiliated Underlying Funds | Net realized gains on capital gain distributions from affiliated Underlying Funds | |
Investment companies | |||
Allspring Alternative Risk Premia Fund Class R6 | 1,025,886 | $378,859 | $0 |
Allspring Disciplined Small Cap Fund Class R6 | 178,385 | 6,287 | 57,013 |
Allspring Discovery Large Cap Growth Fund Class R6† | 214,629 | 0 | 134,354 |
Allspring Diversified Income Builder Fund Class R6 | 1,873,195 | 565,419 | 0 |
Allspring Emerging Markets Equity Fund Class R6 | 71,376 | 26,494 | 0 |
Allspring Global Investment Grade Credit Fund Class R6 | 791,028 | 294,333 | 0 |
Allspring High Yield Bond Fund Institutional Class | 5,354,759 | 1,157,775 | 0 |
Allspring Income Plus Fund Institutional Class | 3,014,059 | 1,479,157 | 0 |
Allspring Premier Large Company Growth Fund Class R6† | 181,502 | 0 | 741,362 |
Allspring Special Large Cap Value Fund Class R6 | 211,191 | 34,951 | 61,847 |
Short-term investments | |||
Allspring Government Money Market Fund Select Class | 200,000 | 18,813 | 0 |
$3,962,088 | $994,576 |
† | Non-income-earning security |
% of ownership, beginning of period | % of ownership, end of period | Net realized gains (losses) on investments allocated from affiliated Master Portfolios | Net change in unrealized gains (losses) on investments allocated from affiliated Master Portfolios | Interest allocated from affiliated Master Portfolios | Dividends allocated from affiliated Master Portfolios | Affiliated Income Allocated from affiliated Master Portfolios | Value, end of period | |
Allspring Bloomberg US Aggregate ex- Corporate Portfolio* | 13.57 % | 0.00 % | $(4,051,971 ) | $2,722,463 | $490,950 | $0 | $51,447 | $0 |
Allspring Core Bond Portfolio | 0.67 | 0.44 | (1,138,986 ) | (54,840 ) | 1,057,007 | 0 | 43,587 | 22,078,089 |
Allspring Disciplined International Developed Markets Portfolio | 0.00 | 2.35 | 17,355 | 429,658 | 149 | 90,665 | 5,064 | 6,977,382 |
Allspring Disciplined Large Cap Portfolio | 8.35 | 6.11 | 1,313,912 | 3,141,874 | 2,362 | 247,669 | 18,200 | 21,057,591 |
Allspring Emerging Growth Portfolio | 0.46 | 0.47 | 13,400 | 107,210 | 14 | 1,643 | 1,264 | 1,316,674 |
Allspring Factor Enhanced Emerging Markets Equity Portfolio* | 1.70 | 0.00 | 85,615 | (39,519 ) | 111 | 30,197 | 1,911 | 0 |
Allspring Factor Enhanced International Equity Portfolio* | 3.44 | 0.00 | 2,177,866 | (1,592,356 ) | 865 | 80,612 | 20,819 | 0 |
Allspring Factor Enhanced U.S. Large Cap Equity Portfolio* | 1.81 | 0.00 | 2,339,273 | (1,572,905 ) | 870 | 59,155 | 9,256 | 0 |
Allspring Factor Enhanced U.S. Small Cap Equity Portfolio* | 2.14 | 0.00 | 146,674 | (71,557 ) | 307 | 17,336 | 3,779 | 0 |
Allspring Real Return Portfolio | 9.54 | 11.50 | 406,518 | (561,841 ) | 643,516 | 79,315 | 251,811 | 27,394,501 |
Allspring Small Company Value Portfolio | 0.29 | 0.19 | 86,620 | 195,514 | 4 | 25,994 | 659 | 1,328,589 |
$1,396,276 | $2,703,701 | $2,196,155 | $632,586 | $407,797 | $80,152,826 |
* | Liquidated on December 6, 2023 |
Description | Number of contracts | Expiration date | Notional cost | Notional value | Unrealized gains | Unrealized losses |
Long | ||||||
TOPIX Index | 40 | 6-13-2024 | $6,836,216 | $6,966,997 | $130,781 | $0 |
Euro Futures | 53 | 6-17-2024 | 7,261,452 | 7,087,756 | 0 | (173,696 ) |
10-Year U.S. Treasury Notes | 21 | 6-18-2024 | 2,263,735 | 2,256,188 | 0 | (7,547 ) |
S&P/TSX 60 Index | 12 | 6-20-2024 | 2,286,770 | 2,275,960 | 0 | (10,810 ) |
E-Mini NASDAQ 100 Index | 20 | 6-21-2024 | 7,317,460 | 7,028,500 | 0 | (288,960 ) |
E-Mini S&P 500 Index | 41 | 6-21-2024 | 10,589,211 | 10,387,350 | 0 | (201,861 ) |
Long Gilt Futures | 133 | 6-26-2024 | 16,069,754 | 15,917,695 | 0 | (152,059 ) |
Short | ||||||
New Zealand Dollar Futures | (117 ) | 6-17-2024 | (7,192,944 ) | (6,900,075 ) | 292,869 | 0 |
Swiss Franc Futures | (51 ) | 6-17-2024 | (7,336,771 ) | (6,972,975 ) | 363,796 | 0 |
Canadian Dollar Futures | (94 ) | 6-18-2024 | (6,830,239 ) | (6,836,150 ) | 0 | (5,911 ) |
Ultra Long Term U.S. Treasury Bond | (18 ) | 6-18-2024 | (2,267,107 ) | (2,152,125 ) | 114,982 | 0 |
E-Mini Russell 2000 Index | (47 ) | 6-21-2024 | (4,599,243 ) | (4,666,160 ) | 0 | (66,917 ) |
Euro STOXX 50 Index | (86 ) | 6-21-2024 | (4,556,137 ) | (4,494,430 ) | 61,707 | 0 |
MSCI Emerging Markets Index | (137 ) | 6-21-2024 | (7,168,695 ) | (7,137,700 ) | 30,995 | 0 |
$995,130 | $(907,761 ) |
Shares | Value | |||||
Investment companies: 98.70% | ||||||
Affiliated master portfolios: 39.83% | ||||||
Allspring Core Bond Portfolio | $4,898,241 | |||||
Allspring Disciplined International Developed Markets Portfolio | 12,311,492 | |||||
Allspring Disciplined Large Cap Portfolio | 36,372,440 | |||||
Allspring Emerging Growth Portfolio | 2,415,936 | |||||
Allspring Real Return Portfolio | 24,004,048 | |||||
Allspring Small Company Value Portfolio | 2,426,640 | |||||
82,428,797 | ||||||
Alternative investment funds: 2.47% | ||||||
Allspring Alternative Risk Premia Fund Class R6♠ | 625,997 | 5,108,137 | ||||
Bond funds: 11.59% | ||||||
Allspring Global Investment Grade Credit Fund Class R6♠ | 473,373 | 4,071,004 | ||||
Allspring High Yield Bond Fund Institutional Class♠ | 5,259,267 | 15,620,025 | ||||
Allspring Income Plus Fund Institutional Class♠ | 498,412 | 4,286,346 | ||||
23,977,375 | ||||||
Exchange-traded funds: 29.09% | ||||||
Energy Select Sector SPDR Fund | 29,754 | 2,782,594 | ||||
iShares Core MSCI EAFE ETF | 217,158 | 15,591,944 | ||||
iShares Core MSCI Emerging Markets ETF | 111,799 | 5,774,418 | ||||
iShares Core S&P 500 ETF | 36,500 | 18,412,060 | ||||
iShares Core S&P Small-Cap ETF | 35,196 | 3,674,110 | ||||
iShares Core U.S. Aggregate Bond ETF | 22,255 | 2,119,344 | ||||
iShares Russell 1000 Growth ETF | 8,228 | 2,656,328 | ||||
iShares U.S. Treasury Bond ETF | 415,062 | 9,195,699 | ||||
60,206,497 | ||||||
Multi-asset funds: 5.67% | ||||||
Allspring Diversified Income Builder Fund Class R6♠ | 2,062,938 | 11,738,115 | ||||
Stock funds: 10.05% | ||||||
Allspring Disciplined Small Cap Fund Class R6♠ | 327,925 | 4,072,828 | ||||
Allspring Discovery Large Cap Growth Fund Class R6♠† | 372,030 | 3,869,114 | ||||
Allspring Emerging Markets Equity Fund Class R6♠ | 155,008 | 3,918,601 | ||||
Allspring Premier Large Company Growth Fund Class R6♠† | 314,706 | 3,845,704 | ||||
Allspring Special Large Cap Value Fund Class R6♠ | 399,905 | 5,098,795 | ||||
20,805,042 | ||||||
Total investment companies (Cost $186,249,910) | 204,263,963 | |||||
Yield | Shares | Value | ||||
Short-term investments: 0.10% | ||||||
Investment companies: 0.10% | ||||||
Allspring Government Money Market Fund Select Class♠∞ | 5.23 % | 200,000 | $200,000 | |||
Total short-term investments (Cost $200,000) | 200,000 | |||||
Total investments in securities (Cost $186,449,910) | 98.80 % | 204,463,963 | ||||
Other assets and liabilities, net | 1.20 | 2,477,988 | ||||
Total net assets | 100.00 % | $206,941,951 | ||||
♠ | The issuer of the security is an affiliated person of the Fund as defined in the Investment Company Act of 1940. |
† | Non-income-earning security |
∞ | The rate represents the 7-day annualized yield at period end. |
Value, beginning of period | Purchases | Sales proceeds | Net realized gains (losses) on affiliated Underlying Funds | Net change in unrealized gains (losses) on affiliated Underlying Funds | Value, end of period | |
Investment companies | ||||||
Allspring Alternative Risk Premia Fund Class R6 | $5,250,684 | $637,734 | $(763,427 ) | $(82,154 ) | $65,300 | $5,108,137 |
Allspring Disciplined Small Cap Fund Class R6 | 0 | 4,239,581 | (395,507 ) | 21,796 | 206,958 | 4,072,828 |
Allspring Discovery Large Cap Growth Fund Class R6† | 5,309,722 | 335,439 | (2,499,551 ) | 239,532 | 483,972 | 3,869,114 |
Allspring Diversified Income Builder Fund Class R6 | 11,972,172 | 662,760 | (1,844,528 ) | (133,016 ) | 1,080,727 | 11,738,115 |
Allspring Emerging Markets Equity Fund Class R6 | 3,904,640 | 269,276 | (494,470 ) | (106,355 ) | 345,510 | 3,918,601 |
Allspring Global Investment Grade Credit Fund Class R6 | 4,192,441 | 194,829 | (345,500 ) | (101,042 ) | 130,276 | 4,071,004 |
Allspring High Yield Bond Fund Institutional Class | 15,888,667 | 2,632,217 | (3,309,032 ) | (443,132 ) | 851,305 | 15,620,025 |
Allspring Income Plus Fund Institutional Class | 4,368,966 | 672,539 | (770,584 ) | (73,076 ) | 88,501 | 4,286,346 |
Allspring Premier Large Company Growth Fund Class R6† | 5,293,465 | 1,413,529 | (2,698,732 ) | (501,879 ) | 339,321 | 3,845,704 |
Allspring Special Large Cap Value Fund Class R6 | 5,151,954 | 189,551 | (1,093,910 ) | (45,730 ) | 896,930 | 5,098,795 |
Short-term investments | ||||||
Allspring Government Money Market Fund Select Class | 200,000 | 48,368,763 | (48,368,763 ) | 0 | 0 | 200,000 |
$(1,225,056 ) | $4,488,800 | $61,828,669 |
Shares, end of period | Dividends from affiliated Underlying Funds | Net realized gains on capital gain distributions from affiliated Underlying Funds | |
Investment companies | |||
Allspring Alternative Risk Premia Fund Class R6 | 625,997 | $225,545 | $0 |
Allspring Disciplined Small Cap Fund Class R6 | 327,925 | 10,940 | 99,301 |
Allspring Discovery Large Cap Growth Fund Class R6† | 372,030 | 0 | 221,031 |
Allspring Diversified Income Builder Fund Class R6 | 2,062,938 | 586,730 | 0 |
Allspring Emerging Markets Equity Fund Class R6 | 155,008 | 54,403 | 0 |
Allspring Global Investment Grade Credit Fund Class R6 | 473,373 | 166,940 | 0 |
Allspring High Yield Bond Fund Institutional Class | 5,259,267 | 1,061,399 | 0 |
Allspring Income Plus Fund Institutional Class | 498,412 | 230,034 | 0 |
Allspring Premier Large Company Growth Fund Class R6† | 314,706 | 0 | 1,250,934 |
Allspring Special Large Cap Value Fund Class R6 | 399,905 | 62,607 | 109,960 |
Short-term investments | |||
Allspring Government Money Market Fund Select Class | 200,000 | 19,717 | 0 |
$2,418,315 | $1,681,226 |
† | Non-income-earning security |
% of ownership, beginning of period | % of ownership, end of period | Net realized gains (losses) on investments allocated from affiliated Master Portfolios | Net change in unrealized gains (losses) on investments allocated from affiliated Master Portfolios | Dividends allocated from affiliated Master Portfolios | Interest allocated from affiliated Master Portfolios | Affiliated Income Allocated from affiliated Master Portfolios | Value, end of period | |
Allspring Bloomberg US Aggregate ex- Corporate Portfolio* | 2.87 % | 0.00 % | $(893,134 ) | $559,476 | $0 | $106,281 | $11,232 | $0 |
Allspring Core Bond Portfolio | 0.18 | 0.10 | (297,154 ) | (75,683 ) | 0 | 261,408 | 10,795 | 4,898,241 |
Allspring Disciplined International Developed Markets Portfolio | 0.00 | 4.15 | 29,504 | 820,689 | 158,410 | 256 | 8,677 | 12,311,492 |
Allspring Disciplined Large Cap Portfolio | 14.45 | 10.55 | 2,700,948 | 4,949,419 | 427,727 | 4,026 | 31,263 | 36,372,440 |
Allspring Emerging Growth Portfolio | 0.74 | 0.87 | 30,998 | 182,592 | 2,834 | 24 | 2,158 | 2,415,936 |
Allspring Factor Enhanced Emerging Markets Equity Portfolio* | 2.96 | 0.00 | 156,564 | (98,008 ) | 53,604 | 198 | 3,453 | 0 |
Allspring Factor Enhanced International Equity Portfolio* | 5.79 | 0.00 | 3,839,610 | (3,013,427 ) | 137,357 | 1,484 | 36,224 | 0 |
Allspring Factor Enhanced U.S. Large Cap Equity Portfolio* | 3.05 | 0.00 | 3,945,206 | (2,743,692 ) | 101,374 | 1,490 | 15,700 | 0 |
Allspring Factor Enhanced U.S. Small Cap Equity Portfolio* | 3.40 | 0.00 | 249,487 | (167,740 ) | 28,916 | 509 | 6,375 | 0 |
Allspring Real Return Portfolio | 8.02 | 10.07 | (691,475 ) | 594,702 | 67,463 | 549,825 | 215,155 | 24,004,048 |
Allspring Small Company Value Portfolio | 0.46 | 0.34 | 151,739 | 319,071 | 44,746 | 6 | 1,140 | 2,426,640 |
$9,222,293 | $1,327,399 | $1,022,431 | $925,507 | $342,172 | $82,428,797 |
* | Liquidated on December 6, 2023 |
Description | Number of contracts | Expiration date | Notional cost | Notional value | Unrealized gains | Unrealized losses |
Long | ||||||
TOPIX Index | 36 | 6-13-2024 | $6,154,989 | $6,270,298 | $115,309 | $0 |
Euro Futures | 45 | 6-17-2024 | 6,165,384 | 6,017,906 | 0 | (147,478 ) |
S&P/TSX 60 Index | 11 | 6-20-2024 | 2,096,205 | 2,086,296 | 0 | (9,909 ) |
E-Mini NASDAQ 100 Index | 18 | 6-21-2024 | 6,585,714 | 6,325,650 | 0 | (260,064 ) |
E-Mini S&P 500 Index | 37 | 6-21-2024 | 9,547,222 | 9,373,950 | 0 | (173,272 ) |
Long Gilt Futures | 121 | 6-26-2024 | 14,620,131 | 14,481,512 | 0 | (138,619 ) |
Short | ||||||
New Zealand Dollar Futures | (103 ) | 6-17-2024 | (6,332,250 ) | (6,074,425 ) | 257,825 | 0 |
Swiss Franc Futures | (43 ) | 6-17-2024 | (6,185,905 ) | (5,879,175 ) | 306,730 | 0 |
10-Year U.S. Treasury Notes | (5 ) | 6-18-2024 | (540,113 ) | (537,188 ) | 2,925 | 0 |
Canadian Dollar Futures | (85 ) | 6-18-2024 | (6,176,280 ) | (6,181,625 ) | 0 | (5,345 ) |
Ultra Long Term U.S. Treasury Bond | (16 ) | 6-18-2024 | (2,015,206 ) | (1,913,000 ) | 102,206 | 0 |
E-Mini Russell 2000 Index | (42 ) | 6-21-2024 | (4,109,962 ) | (4,169,760 ) | 0 | (59,798 ) |
Euro STOXX 50 Index | (78 ) | 6-21-2024 | (4,132,310 ) | (4,076,343 ) | 55,967 | 0 |
MSCI Emerging Markets Index | (124 ) | 6-21-2024 | (6,488,327 ) | (6,460,400 ) | 27,927 | 0 |
$868,889 | $(794,485 ) |
Shares | Value | |||||
Investment companies: 98.63% | ||||||
Affiliated master portfolios: 37.91% | ||||||
Allspring Core Bond Portfolio | $24,079,651 | |||||
Allspring Disciplined International Developed Markets Portfolio | 1,335,705 | |||||
Allspring Disciplined Large Cap Portfolio | 4,098,949 | |||||
Allspring Emerging Growth Portfolio | 217,875 | |||||
Allspring Real Return Portfolio | 13,031,065 | |||||
Allspring Small Company Value Portfolio | 219,426 | |||||
42,982,671 | ||||||
Alternative investment funds: 3.16% | ||||||
Allspring Alternative Risk Premia Fund Class R6♠ | 439,740 | 3,588,281 | ||||
Bond funds: 19.21% | ||||||
Allspring Global Investment Grade Credit Fund Class R6♠ | 392,020 | 3,371,376 | ||||
Allspring High Yield Bond Fund Institutional Class♠ | 2,429,155 | 7,214,590 | ||||
Allspring Income Plus Fund Institutional Class♠ | 1,302,121 | 11,198,245 | ||||
21,784,211 | ||||||
Exchange-traded funds: 32.63% | ||||||
Energy Select Sector SPDR Fund | 16,225 | 1,517,362 | ||||
iShares Core MSCI EAFE ETF | 15,503 | 1,113,115 | ||||
iShares Core MSCI Emerging Markets ETF | 10,773 | 556,426 | ||||
iShares Core S&P 500 ETF | 6,820 | 3,440,281 | ||||
iShares Core S&P Small-Cap ETF | 4,239 | 442,509 | ||||
iShares Core U.S. Aggregate Bond ETF | 12,951 | 1,233,324 | ||||
iShares Russell 1000 Growth ETF | 687 | 221,791 | ||||
iShares U.S. Treasury Bond ETF | 1,285,336 | 28,476,618 | ||||
37,001,426 | ||||||
Multi-asset funds: 4.16% | ||||||
Allspring Diversified Income Builder Fund Class R6♠ | 828,031 | 4,711,495 | ||||
Stock funds: 1.56% | ||||||
Allspring Disciplined Small Cap Fund Class R6♠ | 26,547 | 329,714 | ||||
Allspring Discovery Large Cap Growth Fund Class R6♠† | 31,863 | 331,376 | ||||
Allspring Emerging Markets Equity Fund Class R6♠ | 13,235 | 334,573 | ||||
Allspring Premier Large Company Growth Fund Class R6♠† | 26,942 | 329,230 | ||||
Allspring Special Large Cap Value Fund Class R6♠ | 34,890 | 444,842 | ||||
1,769,735 | ||||||
Total investment companies (Cost $116,220,882) | 111,837,819 | |||||
Yield | Shares | Value | ||||
Short-term investments: 0.18% | ||||||
Investment companies: 0.18% | ||||||
Allspring Government Money Market Fund Select Class♠∞ | 5.23 % | 200,000 | $200,000 | |||
Total short-term investments (Cost $200,000) | 200,000 | |||||
Total investments in securities (Cost $116,420,882) | 98.81 % | 112,037,819 | ||||
Other assets and liabilities, net | 1.19 | 1,352,867 | ||||
Total net assets | 100.00 % | $113,390,686 | ||||
♠ | The issuer of the security is an affiliated person of the Fund as defined in the Investment Company Act of 1940. |
† | Non-income-earning security |
∞ | The rate represents the 7-day annualized yield at period end. |
Value, beginning of period | Purchases | Sales proceeds | Net realized gains (losses) on affiliated Underlying Funds | Net change in unrealized gains (losses) on affiliated Underlying Funds | Value, end of period | |
Investment companies | ||||||
Allspring Alternative Risk Premia Fund Class R6 | $4,436,084 | $551,352 | $(1,385,489 ) | $(156,838 ) | $143,172 | $3,588,281 |
Allspring Disciplined Small Cap Fund Class R6 | 0 | 377,087 | (68,025 ) | 3,977 | 16,675 | 329,714 |
Allspring Discovery Large Cap Growth Fund Class R6† | 552,243 | 45,528 | (337,675 ) | 1,433 | 69,847 | 331,376 |
Allspring Diversified Income Builder Fund Class R6 | 5,796,240 | 278,023 | (1,786,374 ) | (121,712 ) | 545,318 | 4,711,495 |
Allspring Emerging Markets Equity Fund Class R6 | 407,955 | 34,863 | (132,219 ) | 1,260 | 22,714 | 334,573 |
Allspring Global Investment Grade Credit Fund Class R6 | 4,166,365 | 176,020 | (999,835 ) | (233,634 ) | 262,460 | 3,371,376 |
Allspring High Yield Bond Fund Institutional Class | 8,836,854 | 889,255 | (2,730,976 ) | (397,626 ) | 617,083 | 7,214,590 |
Allspring Income Plus Fund Institutional Class | 13,771,308 | 971,737 | (3,600,665 ) | (316,562 ) | 372,427 | 11,198,245 |
Allspring Premier Large Company Growth Fund Class R6† | 550,660 | 153,860 | (362,327 ) | (57,847 ) | 44,884 | 329,230 |
Allspring Special Large Cap Value Fund Class R6 | 540,791 | 32,311 | (211,258 ) | (4,513 ) | 87,511 | 444,842 |
Short-term investments | ||||||
Allspring Government Money Market Fund Select Class | 200,000 | 40,155,319 | (40,155,319 ) | 0 | 0 | 200,000 |
$(1,282,062 ) | $2,182,091 | $32,053,722 |
Shares, end of period | Dividends from affiliated Underlying Funds | Net realized gains on capital gain distributions from affiliated Underlying Funds | |
Investment companies | |||
Allspring Alternative Risk Premia Fund Class R6 | 439,740 | $169,859 | $0 |
Allspring Disciplined Small Cap Fund Class R6 | 26,547 | 956 | 8,677 |
Allspring Discovery Large Cap Growth Fund Class R6† | 31,863 | 0 | 20,261 |
Allspring Diversified Income Builder Fund Class R6 | 828,031 | 256,738 | 0 |
Allspring Emerging Markets Equity Fund Class R6 | 13,235 | 5,019 | 0 |
Allspring Global Investment Grade Credit Fund Class R6 | 392,020 | 149,587 | 0 |
Allspring High Yield Bond Fund Institutional Class | 2,429,155 | 544,536 | 0 |
Allspring Income Plus Fund Institutional Class | 1,302,121 | 655,295 | 0 |
Allspring Premier Large Company Growth Fund Class R6† | 26,942 | 0 | 118,129 |
Allspring Special Large Cap Value Fund Class R6 | 34,890 | 5,843 | 10,420 |
Short-term investments | |||
Allspring Government Money Market Fund Select Class | 200,000 | 14,788 | 0 |
$1,802,621 | $157,487 |
† | Non-income-earning security |
% of ownership, beginning of period | % of ownership, end of period | Net realized gains (losses) on investments allocated from affiliated Master Portfolios | Net change in unrealized gains (losses) on investments allocated from affiliated Master Portfolios | Interest allocated from affiliated Master Portfolios | Dividends allocated from affiliated Master Portfolios | Affiliated Income Allocated from affiliated Master Portfolios | Value, end of period | |
Allspring Bloomberg US Aggregate ex- Corporate Portfolio* | 13.28 % | 0.00 % | $(3,747,474 ) | $2,553,712 | $463,032 | $0 | $48,045 | $0 |
Allspring Core Bond Portfolio | 0.71 | 0.48 | (1,075,331 ) | (132,575 ) | 1,124,570 | 0 | 46,320 | 24,079,651 |
Allspring Disciplined International Developed Markets Portfolio | 0.00 | 0.45 | 3,415 | 79,149 | 29 | 17,469 | 985 | 1,335,705 |
Allspring Disciplined Large Cap Portfolio | 1.66 | 1.19 | 257,334 | 635,663 | 469 | 48,742 | 3,574 | 4,098,949 |
Allspring Emerging Growth Portfolio | 0.08 | 0.08 | 2,111 | 18,711 | 2 | 278 | 216 | 217,875 |
Allspring Factor Enhanced Emerging Markets Equity Portfolio* | 0.26 | 0.00 | 12,248 | (4,401 ) | 16 | 4,491 | 277 | 0 |
Allspring Factor Enhanced International Equity Portfolio* | 0.60 | 0.00 | 357,451 | (247,696 ) | 146 | 13,776 | 3,468 | 0 |
Allspring Factor Enhanced U.S. Large Cap Equity Portfolio* | 0.29 | 0.00 | 393,003 | (266,954 ) | 136 | 9,258 | 1,515 | 0 |
Allspring Factor Enhanced U.S. Small Cap Equity Portfolio* | 0.35 | 0.00 | 22,221 | (8,326 ) | 48 | 2,693 | 581 | 0 |
Allspring Real Return Portfolio | 4.67 | 5.47 | (428,280 ) | 335,963 | 308,296 | 38,135 | 121,443 | 13,031,065 |
Allspring Small Company Value Portfolio | 0.05 | 0.03 | 14,748 | 34,466 | 1 | 4,426 | 112 | 219,426 |
$(4,188,554 ) | $2,997,712 | $1,896,745 | $139,268 | $226,536 | $42,982,671 |
* | Liquidated on December 6, 2023 |
Description | Number of contracts | Expiration date | Notional cost | Notional value | Unrealized gains | Unrealized losses |
Long | ||||||
TOPIX Index | 20 | 6-13-2024 | $3,418,109 | $3,483,499 | $65,390 | $0 |
Euro Futures | 27 | 6-17-2024 | 3,699,231 | 3,610,744 | 0 | (88,487 ) |
10-Year U.S. Treasury Notes | 5 | 6-18-2024 | 538,998 | 537,188 | 0 | (1,810 ) |
S&P/TSX 60 Index | 6 | 6-20-2024 | 1,143,385 | 1,137,980 | 0 | (5,405 ) |
E-Mini NASDAQ 100 Index | 10 | 6-21-2024 | 3,658,730 | 3,514,250 | 0 | (144,480 ) |
E-Mini S&P 500 Index | 20 | 6-21-2024 | 5,159,367 | 5,067,000 | 0 | (92,367 ) |
Long Gilt Futures | 67 | 6-26-2024 | 8,095,509 | 8,018,688 | 0 | (76,821 ) |
Short | ||||||
New Zealand Dollar Futures | (60 ) | 6-17-2024 | (3,688,689 ) | (3,538,500 ) | 150,189 | 0 |
Swiss Franc Futures | (26 ) | 6-17-2024 | (3,740,315 ) | (3,554,850 ) | 185,465 | 0 |
Canadian Dollar Futures | (47 ) | 6-18-2024 | (3,415,119 ) | (3,418,075 ) | 0 | (2,956 ) |
Ultra Long Term U.S. Treasury Bond | (9 ) | 6-18-2024 | (1,133,554 ) | (1,076,063 ) | 57,491 | 0 |
E-Mini Russell 2000 Index | (23 ) | 6-21-2024 | (2,250,693 ) | (2,283,440 ) | 0 | (32,747 ) |
Euro STOXX 50 Index | (43 ) | 6-21-2024 | (2,278,069 ) | (2,247,215 ) | 30,854 | 0 |
MSCI Emerging Markets Index | (68 ) | 6-21-2024 | (3,558,115 ) | (3,542,800 ) | 15,315 | 0 |
$504,704 | $(445,073 ) |
Shares | Value | |||||
Investment companies: 98.95% | ||||||
Affiliated master portfolios: 37.04% | ||||||
Allspring Core Bond Portfolio | $19,840,829 | |||||
Allspring Disciplined International Developed Markets Portfolio | 22,065,466 | |||||
Allspring Disciplined Large Cap Portfolio | 63,812,114 | |||||
Allspring Emerging Growth Portfolio | 4,336,190 | |||||
Allspring Real Return Portfolio | 50,614,982 | |||||
Allspring Small Company Value Portfolio | 4,345,165 | |||||
165,014,746 | ||||||
Alternative investment funds: 3.97% | ||||||
Allspring Alternative Risk Premia Fund Class R6♠ | 2,169,584 | 17,703,808 | ||||
Bond funds: 17.38% | ||||||
Allspring Global Investment Grade Credit Fund Class R6♠ | 1,540,188 | 13,245,618 | ||||
Allspring High Yield Bond Fund Institutional Class♠ | 9,880,774 | 29,345,900 | ||||
Allspring Income Plus Fund Institutional Class♠ | 4,053,424 | 34,859,444 | ||||
77,450,962 | ||||||
Exchange-traded funds: 27.69% | ||||||
Energy Select Sector SPDR Fund | 64,073 | 5,992,107 | ||||
iShares Core MSCI EAFE ETF | 387,692 | 27,836,286 | ||||
iShares Core MSCI Emerging Markets ETF | 189,167 | 9,770,476 | ||||
iShares Core S&P 500 ETF | 65,509 | 33,045,360 | ||||
iShares Core S&P Small-Cap ETF | 63,059 | 6,582,729 | ||||
iShares Core U.S. Aggregate Bond ETF | 50,724 | 4,830,446 | ||||
iShares Russell 1000 Growth ETF | 13,657 | 4,409,026 | ||||
iShares U.S. Treasury Bond ETF | 1,393,950 | 30,882,962 | ||||
123,349,392 | ||||||
Multi-asset funds: 4.98% | ||||||
Allspring Diversified Income Builder Fund Class R6♠ | 3,900,480 | 22,193,730 | ||||
Stock funds: 7.89% | ||||||
Allspring Disciplined Small Cap Fund Class R6♠ | 529,499 | 6,576,380 | ||||
Allspring Discovery Large Cap Growth Fund Class R6♠† | 633,260 | 6,585,906 | ||||
Allspring Emerging Markets Equity Fund Class R6♠ | 263,830 | 6,669,624 | ||||
Allspring Premier Large Company Growth Fund Class R6♠† | 535,471 | 6,543,459 | ||||
Allspring Special Large Cap Value Fund Class R6♠ | 688,954 | 8,784,162 | ||||
35,159,531 | ||||||
Total investment companies (Cost $423,285,506) | 440,872,169 | |||||
Yield | Shares | Value | ||||
Short-term investments: 0.07% | ||||||
Investment companies: 0.07% | ||||||
Allspring Government Money Market Fund Select Class♠∞ | 5.23 % | 300,000 | $300,000 | |||
Total short-term investments (Cost $300,000) | 300,000 | |||||
Total investments in securities (Cost $423,585,506) | 99.02 % | 441,172,169 | ||||
Other assets and liabilities, net | 0.98 | 4,388,299 | ||||
Total net assets | 100.00 % | $445,560,468 | ||||
♠ | The issuer of the security is an affiliated person of the Fund as defined in the Investment Company Act of 1940. |
† | Non-income-earning security |
∞ | The rate represents the 7-day annualized yield at period end. |
Value, beginning of period | Purchases | Sales proceeds | Net realized gains (losses) on affiliated Underlying Funds | Net change in unrealized gains (losses) on affiliated Underlying Funds | Value, end of period | |
Investment companies | ||||||
Allspring Alternative Risk Premia Fund Class R6 | $15,203,693 | $5,374,037 | $(2,892,263 ) | $(343,521 ) | $361,862 | $17,703,808 |
Allspring Disciplined Small Cap Fund Class R6 | 0 | 7,031,570 | (733,553 ) | 26,195 | 252,168 | 6,576,380 |
Allspring Discovery Large Cap Growth Fund Class R6† | 7,635,012 | 1,970,874 | (4,023,764 ) | 356,965 | 646,819 | 6,585,906 |
Allspring Diversified Income Builder Fund Class R6 | 18,948,431 | 5,868,967 | (4,118,915 ) | (259,197 ) | 1,754,444 | 22,193,730 |
Allspring Emerging Markets Equity Fund Class R6 | 5,591,586 | 1,656,034 | (1,048,551 ) | (231,149 ) | 701,704 | 6,669,624 |
Allspring Global Investment Grade Credit Fund Class R6 | 11,397,364 | 3,407,259 | (1,603,834 ) | (380,957 ) | 425,786 | 13,245,618 |
Allspring High Yield Bond Fund Institutional Class | 25,009,576 | 9,865,745 | (6,142,922 ) | (834,167 ) | 1,447,668 | 29,345,900 |
Allspring Income Plus Fund Institutional Class | 29,800,554 | 10,758,919 | (5,733,088 ) | (522,274 ) | 555,333 | 34,859,444 |
Allspring Premier Large Company Growth Fund Class R6† | 7,618,922 | 3,509,055 | (4,339,841 ) | (795,915 ) | 551,238 | 6,543,459 |
Allspring Special Large Cap Value Fund Class R6 | 7,436,131 | 2,213,739 | (2,124,093 ) | (73,127 ) | 1,331,512 | 8,784,162 |
Short-term investments | ||||||
Allspring Government Money Market Fund Select Class | 250,000 | 82,766,109 | (82,716,109 ) | 0 | 0 | 300,000 |
$(3,057,147 ) | $8,028,534 | $152,808,031 |
Shares, end of period | Dividends from affiliated Underlying Funds | Net realized gains on capital gain distributions from affiliated Underlying Funds | |
Investment companies | |||
Allspring Alternative Risk Premia Fund Class R6 | 2,169,584 | $619,386 | $0 |
Allspring Disciplined Small Cap Fund Class R6 | 529,499 | 14,359 | 130,221 |
Allspring Discovery Large Cap Growth Fund Class R6† | 633,260 | 0 | 307,221 |
Allspring Diversified Income Builder Fund Class R6 | 3,900,480 | 966,813 | 0 |
Allspring Emerging Markets Equity Fund Class R6 | 263,830 | 75,211 | 0 |
Allspring Global Investment Grade Credit Fund Class R6 | 1,540,188 | 466,709 | 0 |
Allspring High Yield Bond Fund Institutional Class | 9,880,774 | 1,694,292 | 0 |
Allspring Income Plus Fund Institutional Class | 4,053,424 | 1,608,190 | 0 |
Allspring Premier Large Company Growth Fund Class R6† | 535,471 | 0 | 1,757,999 |
Allspring Special Large Cap Value Fund Class R6 | 688,954 | 87,673 | 155,764 |
Short-term investments | |||
Allspring Government Money Market Fund Select Class | 300,000 | 29,836 | 0 |
$5,562,469 | $2,351,205 |
† | Non-income-earning security |
% of ownership, beginning of period | % of ownership, end of period | Net realized gains (losses) on investments allocated from affiliated Master Portfolios | Net change in unrealized gains (losses) on investments allocated from affiliated Master Portfolios | Interest allocated from affiliated Master Portfolios | Dividends allocated from affiliated Master Portfolios | Affiliated Income Allocated from affiliated Master Portfolios | Value, end of period | |
Allspring Bloomberg US Aggregate ex- Corporate Portfolio* | 8.92 % | 0.00 % | $(2,711,248 ) | $1,766,299 | $325,903 | $0 | $34,281 | $0 |
Allspring Core Bond Portfolio | 0.50 | 0.40 | (897,611 ) | (158,995 ) | 811,361 | 0 | 33,117 | 19,840,829 |
Allspring Disciplined International Developed Markets Portfolio | 0.00 | 7.44 | 48,726 | 1,070,531 | 414 | 274,570 | 14,059 | 22,065,466 |
Allspring Disciplined Large Cap Portfolio | 21.10 | 18.51 | 4,054,186 | 6,885,914 | 5,878 | 640,073 | 48,488 | 63,812,114 |
Allspring Emerging Growth Portfolio | 1.14 | 1.56 | 67,275 | 206,863 | 38 | 4,356 | 3,311 | 4,336,190 |
Allspring Factor Enhanced Emerging Markets Equity Portfolio* | 4.30 | 0.00 | 221,320 | (119,294 ) | 284 | 76,951 | 4,918 | 0 |
Allspring Factor Enhanced International Equity Portfolio* | 8.72 | 0.00 | 5,679,521 | (4,298,055 ) | 2,214 | 205,592 | 53,807 | 0 |
Allspring Factor Enhanced U.S. Large Cap Equity Portfolio* | 4.85 | 0.00 | 6,201,313 | (4,209,672 ) | 2,354 | 159,847 | 24,700 | 0 |
Allspring Factor Enhanced U.S. Small Cap Equity Portfolio* | 4.72 | 0.00 | 331,194 | (189,220 ) | 685 | 38,797 | 8,508 | 0 |
Allspring Real Return Portfolio | 13.83 | 21.24 | (1,161,967 ) | 776,217 | 984,510 | 120,425 | 403,147 | 50,614,982 |
Allspring Small Company Value Portfolio | 0.71 | 0.61 | 226,704 | 474,772 | 10 | 68,947 | 1,779 | 4,345,165 |
$12,059,413 | $2,205,360 | $2,133,651 | $1,589,558 | $630,115 | $165,014,746 |
* | Liquidated on December 6, 2023 |
Description | Number of contracts | Expiration date | Notional cost | Notional value | Unrealized gains | Unrealized losses |
Long | ||||||
TOPIX Index | 78 | 6-13-2024 | $13,331,819 | $13,585,645 | $253,826 | $0 |
Euro Futures | 103 | 6-17-2024 | 14,111,880 | 13,774,319 | 0 | (337,561 ) |
10-Year U.S. Treasury Notes | 51 | 6-18-2024 | 5,497,640 | 5,479,312 | 0 | (18,328 ) |
S&P/TSX 60 Index | 24 | 6-20-2024 | 4,573,540 | 4,551,919 | 0 | (21,621 ) |
E-Mini NASDAQ 100 Index | 39 | 6-21-2024 | 14,269,048 | 13,705,575 | 0 | (563,473 ) |
E-Mini S&P 500 Index | 80 | 6-21-2024 | 20,661,023 | 20,268,000 | 0 | (393,023 ) |
Long Gilt Futures | 262 | 6-26-2024 | 31,656,495 | 31,356,662 | 0 | (299,833 ) |
Short | ||||||
New Zealand Dollar Futures | (228 ) | 6-17-2024 | (14,017,020 ) | (13,446,300 ) | 570,720 | 0 |
Swiss Franc Futures | (99 ) | 6-17-2024 | (14,241,968 ) | (13,535,775 ) | 706,193 | 0 |
Canadian Dollar Futures | (185 ) | 6-18-2024 | (13,442,491 ) | (13,454,125 ) | 0 | (11,634 ) |
Ultra Long Term U.S. Treasury Bond | (36 ) | 6-18-2024 | (4,553,605 ) | (4,304,250 ) | 249,355 | 0 |
E-Mini Russell 2000 Index | (92 ) | 6-21-2024 | (9,002,774 ) | (9,133,760 ) | 0 | (130,986 ) |
Euro STOXX 50 Index | (169 ) | 6-21-2024 | (8,953,339 ) | (8,832,077 ) | 121,262 | 0 |
MSCI Emerging Markets Index | (270 ) | 6-21-2024 | (14,128,935 ) | (14,067,000 ) | 61,935 | 0 |
$1,963,291 | $(1,776,459 ) |
Spectrum Aggressive Growth Fund | Spectrum Conservative Growth Fund | |
Assets | ||
Investments in affiliated Master Portfolios, at value (cost $145,162,986 and $81,766,784, respectively) | $207,964,904 | $80,152,826 |
Investments in unaffiliated Underlying Funds, at value (cost $159,561,324 and $59,654,396, respectively) | 189,386,680 | 66,083,550 |
Investments in affiliated Underlying Funds, at value (cost $70,572,457 and $81,216,713, respectively) | 75,746,797 | 79,019,802 |
Cash at broker segregated for futures contracts | 3,321,847 | 2,939,809 |
Receivable for daily variation margin on open futures contracts | 1,159,296 | 634,174 |
Receivable for investments sold | 966,537 | 135,655 |
Receivable for Fund shares sold | 68,883 | 2,242 |
Receivable for dividends | 0 | 88,219 |
Prepaid expenses and other assets | 80,028 | 66,509 |
Total assets | 478,694,972 | 229,122,786 |
Liabilities | ||
Overdraft due to custodian bank | 966,844 | 126,073 |
Payable for daily variation margin on open futures contracts | 491,095 | 484,514 |
Payable for Fund shares redeemed | 350,842 | 476,484 |
Distribution fee payable | 134,598 | 80,285 |
Management fee payable | 98,825 | 30,145 |
Administration fees payable | 75,108 | 37,654 |
Payable for investments purchased | 0 | 100,711 |
Accrued expenses and other liabilities | 140,966 | 78,782 |
Total liabilities | 2,258,278 | 1,414,648 |
Total net assets | $476,436,694 | $227,708,138 |
Net assets consist of | ||
Paid-in capital | $367,422,962 | $240,974,671 |
Total distributable earnings (loss) | 109,013,732 | (13,266,533 ) |
Total net assets | $476,436,694 | $227,708,138 |
Computation of net asset value and offering price per share | ||
Net assets–Class A | $179,433,249 | $91,384,100 |
Shares outstanding–Class A1 | 8,863,426 | 9,719,957 |
Net asset value per share–Class A | $20.24 | $9.40 |
Maximum offering price per share – Class A2 | $21.47 | $9.97 |
Net assets–Class C | $214,467,175 | $128,575,502 |
Shares outstanding–Class C1 | 10,760,566 | 13,259,494 |
Net asset value per share–Class C | $19.93 | $9.70 |
Net assets–Administrator Class | $76,692,401 | N/A |
Shares outstanding–Administrator Class1 | 3,774,545 | N/A |
Net asset value per share–Administrator Class | $20.32 | N/A |
Net assets–Institutional Class | $5,843,869 | $7,748,536 |
Shares outstanding–Institutional Class1 | 286,649 | 822,346 |
Net asset value per share–Institutional Class | $20.39 | $9.42 |
Spectrum Growth Fund | Spectrum Income Allocation Fund | Spectrum Moderate Growth Fund | |
Assets | |||
Investments in affiliated Master Portfolios, at value (cost $72,740,463, $47,017,808 and $156,041,303, respectively) | $82,428,797 | $42,982,671 | $165,014,746 |
Investments in unaffiliated Underlying Funds, at value (cost $52,382,436, $36,234,820 and $113,058,903, respectively) | 60,206,497 | 37,001,426 | 123,349,392 |
Investments in affiliated Underlying Funds, at value (cost $61,327,011, $33,168,254 and $154,485,300, respectively) | 61,828,669 | 32,053,722 | 152,808,031 |
Cash at broker segregated for futures contracts | 2,649,862 | 1,469,887 | 5,766,735 |
Receivable for daily variation margin on open futures contracts | 567,699 | 317,629 | 1,241,350 |
Receivable for investments sold | 90,961 | 133,039 | 152,198 |
Receivable for Fund shares sold | 28,716 | 3,210 | 112,969 |
Receivable for dividends | 86,580 | 40,000 | 163,260 |
Prepaid expenses and other assets | 68,891 | 83,780 | 142,999 |
Total assets | 207,956,672 | 114,085,364 | 448,751,680 |
Liabilities | |||
Overdraft due to custodian bank | 63,261 | 103,500 | 64,408 |
Payable for daily variation margin on open futures contracts | 426,718 | 238,162 | 953,679 |
Payable for Fund shares redeemed | 175,380 | 154,756 | 1,494,468 |
Distribution fee payable | 83,555 | 46,977 | 142,871 |
Management fee payable | 36,444 | 9,144 | 67,471 |
Administration fees payable | 34,483 | 18,689 | 71,136 |
Payable for investments purchased | 116,952 | 71,079 | 256,696 |
Trustees’ fees and expenses payable | 0 | 0 | 1,224 |
Accrued expenses and other liabilities | 77,928 | 52,371 | 139,259 |
Total liabilities | 1,014,721 | 694,678 | 3,191,212 |
Total net assets | $206,941,951 | $113,390,686 | $445,560,468 |
Net assets consist of | |||
Paid-in capital | $186,032,641 | $136,184,951 | $420,900,363 |
Total distributable earnings (loss) | 20,909,310 | (22,794,265 ) | 24,660,105 |
Total net assets | $206,941,951 | $113,390,686 | $445,560,468 |
Computation of net asset value and offering price per share | |||
Net assets–Class A | $71,930,188 | $34,182,821 | $155,361,979 |
Shares outstanding–Class A1 | 6,004,540 | 4,034,483 | 13,449,474 |
Net asset value per share–Class A | $11.98 | $8.47 | $11.55 |
Maximum offering price per share – Class A2 | $12.71 | $8.99 | $12.25 |
Net assets–Class C | $133,450,065 | $75,015,827 | $228,121,702 |
Shares outstanding–Class C1 | 10,867,982 | 8,849,455 | 19,281,952 |
Net asset value per share–Class C | $12.28 | $8.48 | $11.83 |
Net assets–Institutional Class | $1,561,698 | $4,192,038 | $62,076,787 |
Shares outstanding–Institutional Class1 | 130,169 | 495,654 | 5,365,693 |
Net asset value per share–Institutional Class | $12.00 | $8.46 | $11.57 |
Spectrum Aggressive Growth Fund | ||
Year Ended April 30, 20241 | Year Ended May 31, 2023 | |
Investment income | ||
Dividends allocated from affiliated Master Portfolios (net of foreign withholding taxes of $728,060 and $478,567, respectively) | $3,547,704 | $6,358,376 |
Dividends from unaffiliated Underlying Funds | 2,766,253 | 1,753,912 |
Dividends from affiliated Underlying Funds | 501,921 | 476,150 |
Affiliated income allocated from affiliated Master Portfolios | 387,409 | 237,995 |
Interest | 201,094 | 68,479 |
Interest allocated from affiliated Master Portfolios | 29,489 | 18,197 |
Expenses allocated from affiliated Master Portfolios | (658,281 ) | (830,142 ) |
Waivers allocated from affiliated Master Portfolios | 65,566 | 99,488 |
Total investment income | 6,841,155 | 8,182,455 |
Expenses | ||
Management fee | 1,078,479 | 1,157,441 |
Administration fees | ||
Class A | 253,581 | 247,685 |
Class C | 465,065 | 564,495 |
Administrator Class | 89,239 | 92,418 |
Institutional Class | 6,456 | 6,673 |
Shareholder servicing fees | ||
Class A | 315,735 | 294,843 |
Class C | 578,445 | 670,826 |
Administrator Class | 171,037 | 176,721 |
Distribution fee | ||
Class C | 1,728,067 | 2,004,079 |
Custody and accounting fees | 12,222 | 51,206 |
Professional fees | 50,200 | 59,173 |
Registration fees | 87,525 | 75,867 |
Shareholder report expenses | 19,811 | 92,125 |
Trustees’ fees and expenses | 21,103 | 21,099 |
Other fees and expenses | 24,846 | 12,192 |
Total expenses | 4,901,811 | 5,526,843 |
Less: Fee waivers and/or expense reimbursements | ||
Fund-level | (36,077 ) | (100,100 ) |
Class A | (1,459 ) | (9,463 ) |
Class C | (912 ) | (129 ) |
Administrator Class | (6 ) | (4,499 ) |
Institutional Class | 0 | (350 ) |
Net expenses | 4,863,357 | 5,412,302 |
Net investment income | 1,977,798 | 2,770,153 |
Spectrum Aggressive Growth Fund | ||
Year Ended April 30, 20241 | Year Ended May 31, 2023 | |
Realized and unrealized gains (losses) on investments | ||
Net realized gain (losses) on | ||
Investments allocated from affiliated Master Portfolios | $32,071,810 | $(4,596,410 ) |
Affiliated Underlying Funds | (1,347,087 ) | (4,754,043 ) |
Unaffiliated Underlying Funds | (1,803,370 ) | (334,875 ) |
Foreign currency and foreign currency translations | (8,778 ) | (11,814 ) |
Futures contracts | (4,019,016 ) | (3,263,971 ) |
Capital gain distributions from affiliated Underlying Funds | 5,945,660 | 3,218,674 |
Net realized gains (losses) on investments | 30,839,219 | (9,742,439 ) |
Net change in unrealized gains (losses) on | ||
Investments allocated from affiliated Master Portfolios | 9,688,417 | (306,707 ) |
Affiliated Underlying Funds | 7,866,715 | 3,138,693 |
Unaffiliated Underlying Funds | 23,207,591 | (435,576 ) |
Foreign currency and foreign currency translations | 0 | 6 |
Futures contracts | 662,033 | (274,628 ) |
Net change in unrealized gains (losses) on investments | 41,424,756 | 2,121,788 |
Net realized and unrealized gains (losses) on investments | 72,263,975 | (7,620,651 ) |
Net increase (decrease) in net assets resulting from operations | $74,241,773 | $(4,850,498 ) |
Spectrum Conservative Growth Fund | ||
Year Ended April 30, 20241 | Year Ended May 31, 2023 | |
Investment income | ||
Dividends from affiliated Underlying Funds | $3,962,088 | $4,147,174 |
Interest allocated from affiliated Master Portfolios (net of foreign withholding taxes of $0 and $137, respectively) | 2,196,155 | 2,932,793 |
Dividends from unaffiliated Underlying Funds | 1,154,961 | 3,879,490 |
Dividends allocated from affiliated Master Portfolios (net of foreign withholding taxes of $114,349 and $82,701, respectively) | 632,586 | 1,218,955 |
Affiliated income allocated from affiliated Master Portfolios | 407,797 | 125,829 |
Interest | 137,821 | 39,295 |
Expenses allocated from affiliated Master Portfolios | (311,116 ) | (418,689 ) |
Waivers allocated from affiliated Master Portfolios | 43,602 | 58,447 |
Total investment income | 8,223,894 | 11,983,294 |
Expenses | ||
Management fee | 559,818 | 690,978 |
Administration fees | ||
Class A | 80,765 | 67,984 |
Class C | 350,826 | 486,514 |
Institutional Class | 11,845 | 16,048 |
Shareholder servicing fees | ||
Class A | 100,637 | 80,933 |
Class C | 435,925 | 578,185 |
Distribution fee | ||
Class C | 1,305,720 | 1,732,150 |
Custody and accounting fees | 15,969 | 47,464 |
Professional fees | 57,622 | 45,899 |
Registration fees | 48,022 | 56,528 |
Shareholder report expenses | 22,682 | 49,401 |
Trustees’ fees and expenses | 21,778 | 23,125 |
Other fees and expenses | 16,164 | 7,408 |
Total expenses | 3,027,773 | 3,882,617 |
Less: Fee waivers and/or expense reimbursements | ||
Fund-level | (85,919 ) | (112,872 ) |
Class A | (3,052 ) | (41 ) |
Class C | (248 ) | (33 ) |
Net expenses | 2,938,554 | 3,769,671 |
Net investment income | 5,285,340 | 8,213,623 |
Spectrum Conservative Growth Fund | ||
Year Ended April 30, 20241 | Year Ended May 31, 2023 | |
Realized and unrealized gains (losses) on investments | ||
Net realized gain (losses) on | ||
Investments allocated from affiliated Master Portfolios | $1,396,276 | $(2,265,673 ) |
Affiliated Underlying Funds | (2,236,028 ) | (2,903,289 ) |
Unaffiliated Underlying Funds | (1,008,062 ) | (4,139,748 ) |
Foreign currency and foreign currency translations | 6,290 | (6,896 ) |
Futures contracts | 851,678 | (3,651,844 ) |
Capital gain distributions from affiliated Underlying Funds | 994,576 | 993,306 |
Net realized gains (losses) on investments | 4,730 | (11,974,144 ) |
Net change in unrealized gains (losses) on | ||
Investments allocated from affiliated Master Portfolios | 2,703,701 | (4,808,442 ) |
Affiliated Underlying Funds | 4,842,846 | (1,274,480 ) |
Unaffiliated Underlying Funds | 4,350,082 | (3,609,512 ) |
Foreign currency and foreign currency translations | (3 ) | 3 |
Futures contracts | (1,082,453 ) | 1,474,290 |
Net change in unrealized gains (losses) on investments | 10,814,173 | (8,218,141 ) |
Net realized and unrealized gains (losses) on investments | 10,818,903 | (20,192,285 ) |
Net increase (decrease) in net assets resulting from operations | $16,104,243 | $(11,978,662 ) |
Spectrum Growth Fund | ||
Year Ended April 30, 20241 | Year Ended May 31, 2023 | |
Investment income | ||
Dividends from affiliated Underlying Funds | $2,418,315 | $2,357,084 |
Dividends from unaffiliated Underlying Funds | 1,063,277 | 3,214,898 |
Dividends allocated from affiliated Master Portfolios (net of foreign withholding taxes of $197,874 and $136,502, respectively) | 1,022,431 | 1,914,407 |
Interest allocated from affiliated Master Portfolios (net of foreign withholding taxes of $0 and $31, respectively) | 925,507 | 1,233,202 |
Affiliated income allocated from affiliated Master Portfolios | 342,172 | 90,955 |
Interest | 115,469 | 34,096 |
Expenses allocated from affiliated Master Portfolios | (294,150 ) | (367,443 ) |
Waivers allocated from affiliated Master Portfolios | 36,313 | 50,653 |
Total investment income | 5,629,334 | 8,527,852 |
Expenses | ||
Management fee | 479,764 | 547,847 |
Administration fees | ||
Class A | 66,368 | 52,395 |
Class C | 316,365 | 403,725 |
Institutional Class | 1,788 | 2,521 |
Shareholder servicing fees | ||
Class A | 82,698 | 62,354 |
Class C | 393,372 | 479,867 |
Distribution fee | ||
Class C | 1,176,460 | 1,435,533 |
Custody and accounting fees | 9,005 | 38,671 |
Professional fees | 56,163 | 50,693 |
Registration fees | 40,672 | 53,896 |
Shareholder report expenses | 22,893 | 42,687 |
Trustees’ fees and expenses | 21,778 | 23,426 |
Other fees and expenses | 15,765 | 8,124 |
Total expenses | 2,683,091 | 3,201,739 |
Less: Fee waivers and/or expense reimbursements | ||
Fund-level | (82,705 ) | (122,730 ) |
Class A | (2,684 ) | (93 ) |
Class C | (475 ) | (64 ) |
Institutional Class | (94 ) | 0 |
Net expenses | 2,597,133 | 3,078,852 |
Net investment income | 3,032,201 | 5,449,000 |
Spectrum Growth Fund | ||
Year Ended April 30, 20241 | Year Ended May 31, 2023 | |
Realized and unrealized gains (losses) on investments | ||
Net realized gain (losses) on | ||
Investments allocated from affiliated Master Portfolios | $9,222,293 | $1,904,140 |
Affiliated Underlying Funds | (1,225,056 ) | (2,388,995 ) |
Unaffiliated Underlying Funds | (759,380 ) | (3,752,393 ) |
Foreign currency and foreign currency translations | 7,022 | (5,335 ) |
Futures contracts | 729,442 | (2,826,492 ) |
Capital gain distributions from affiliated Underlying Funds | 1,681,226 | 1,172,746 |
Net realized gains (losses) on investments | 9,655,547 | (5,896,329 ) |
Net change in unrealized gains (losses) on | ||
Investments allocated from affiliated Master Portfolios | 1,327,399 | (5,448,625 ) |
Affiliated Underlying Funds | 4,488,800 | (12,378 ) |
Unaffiliated Underlying Funds | 5,741,798 | (3,738,833 ) |
Foreign currency and foreign currency translations | (2,123 ) | 1,167 |
Futures contracts | (919,132 ) | 1,342,099 |
Net change in unrealized gains (losses) on investments | 10,636,742 | (7,856,570 ) |
Net realized and unrealized gains (losses) on investments | 20,292,289 | (13,752,899 ) |
Net increase (decrease) in net assets resulting from operations | $23,324,490 | $(8,303,899 ) |
Spectrum Income Allocation Fund | ||
Year Ended April 30, 20241 | Year Ended May 31, 2023 | |
Investment income | ||
Interest allocated from affiliated Master Portfolios (net of foreign withholding taxes of $0 and $139, respectively) | $1,896,745 | $2,520,636 |
Dividends from affiliated Underlying Funds | 1,802,621 | 2,090,918 |
Dividends from unaffiliated Underlying Funds | 574,082 | 2,011,436 |
Affiliated income allocated from affiliated Master Portfolios | 226,536 | 91,341 |
Dividends allocated from affiliated Master Portfolios (net of foreign withholding taxes of $19,757 and $14,847, respectively) | 139,268 | 246,343 |
Interest | 74,009 | 20,557 |
Expenses allocated from affiliated Master Portfolios | (175,496 ) | (252,350 ) |
Waivers allocated from affiliated Master Portfolios | 25,855 | 32,311 |
Total investment income | 4,563,620 | 6,761,192 |
Expenses | ||
Management fee | 286,299 | 382,856 |
Administration fees | ||
Class A | 36,689 | 39,943 |
Class C | 185,245 | 269,867 |
Institutional Class | 5,304 | 7,298 |
Shareholder servicing fees | ||
Class A | 45,690 | 47,552 |
Class C | 230,032 | 320,588 |
Distribution fee | ||
Class C | 689,116 | 960,662 |
Custody and accounting fees | 12,924 | 34,315 |
Professional fees | 54,757 | 43,375 |
Registration fees | 41,473 | 48,385 |
Shareholder report expenses | 22,388 | 34,724 |
Trustees’ fees and expenses | 21,778 | 22,208 |
Other fees and expenses | 14,315 | 7,855 |
Total expenses | 1,646,010 | 2,219,628 |
Less: Fee waivers and/or expense reimbursements | ||
Fund-level | (116,881 ) | (124,643 ) |
Class A | (2,601 ) | (955 ) |
Class C | (129 ) | (18 ) |
Institutional Class | (253 ) | (301 ) |
Net expenses | 1,526,146 | 2,093,711 |
Net investment income | 3,037,474 | 4,667,481 |
Spectrum Income Allocation Fund | ||
Year Ended April 30, 20241 | Year Ended May 31, 2023 | |
Realized and unrealized gains (losses) on investments | ||
Net realized gain (losses) on | ||
Investments allocated from affiliated Master Portfolios | $(4,188,554 ) | $(3,712,038 ) |
Affiliated Underlying Funds | (1,282,062 ) | (1,586,414 ) |
Unaffiliated Underlying Funds | (591,220 ) | (1,430,246 ) |
Foreign currency and foreign currency translations | 1,540 | (3,692 ) |
Futures contracts | 262,248 | (1,302,521 ) |
Capital gain distributions from affiliated Underlying Funds | 157,487 | 310,326 |
Net realized losses on investments | (5,640,561 ) | (7,724,585 ) |
Net change in unrealized gains (losses) on | ||
Investments allocated from affiliated Master Portfolios | 2,997,712 | (1,684,145 ) |
Affiliated Underlying Funds | 2,182,091 | (623,909 ) |
Unaffiliated Underlying Funds | 1,062,296 | (2,292,100 ) |
Foreign currency and foreign currency translations | 1,809 | 307 |
Futures contracts | (553,505 ) | 699,300 |
Net change in unrealized gains (losses) on investments | 5,690,403 | (3,900,547 ) |
Net realized and unrealized gains (losses) on investments | 49,842 | (11,625,132 ) |
Net increase (decrease) in net assets resulting from operations | $3,087,316 | $(6,957,651 ) |
Spectrum Moderate Growth Fund | ||
Year Ended April 30, 20241 | Year Ended May 31, 2023 | |
Investment income | ||
Dividends from affiliated Underlying Funds | $5,562,469 | $5,659,178 |
Interest allocated from affiliated Master Portfolios (net of foreign withholding taxes of $0 and $94, respectively) | 2,133,651 | 2,800,392 |
Dividends from unaffiliated Underlying Funds | 1,778,047 | 5,723,485 |
Dividends allocated from affiliated Master Portfolios (net of foreign withholding taxes of $299,899 and $207,701, respectively) | 1,589,558 | 2,939,838 |
Affiliated income allocated from affiliated Master Portfolios | 630,115 | 166,947 |
Interest | 201,712 | 60,326 |
Expenses allocated from affiliated Master Portfolios | (512,956 ) | (636,947 ) |
Waivers allocated from affiliated Master Portfolios | 64,559 | 88,914 |
Total investment income | 11,447,155 | 16,802,133 |
Expenses | ||
Management fee | 889,302 | 1,011,786 |
Administration fees | ||
Class A | 126,086 | 91,503 |
Class C | 554,898 | 744,739 |
Institutional Class | 21,679 | 8,455 |
Shareholder servicing fees | ||
Class A | 156,400 | 108,914 |
Class C | 689,647 | 885,066 |
Distribution fee | ||
Class C | 2,066,698 | 2,651,764 |
Custody and accounting fees | 18,635 | 42,393 |
Professional fees | 67,806 | 46,843 |
Registration fees | 45,855 | 36,697 |
Shareholder report expenses | 22,006 | 48,611 |
Trustees’ fees and expenses | 25,618 | 22,203 |
Other fees and expenses | 20,031 | 9,688 |
Total expenses | 4,704,661 | 5,708,662 |
Less: Fee waivers and/or expense reimbursements | ||
Fund-level | (62,225 ) | (46,858 ) |
Class A | (11,546 ) | (18 ) |
Class C | (336 ) | (52 ) |
Institutional Class | (8,999 ) | 0 |
Net expenses | 4,621,555 | 5,661,734 |
Net investment income | 6,825,600 | 11,140,399 |
Spectrum Moderate Growth Fund | ||
Year Ended April 30, 20241 | Year Ended May 31, 2023 | |
Realized and unrealized gains (losses) on investments | ||
Net realized gain (losses) on | ||
Investments allocated from affiliated Master Portfolios | $12,059,413 | $1,464,128 |
Affiliated Underlying Funds | (3,057,147 ) | (5,201,765 ) |
Unaffiliated Underlying Funds | (1,813,842 ) | (7,094,139 ) |
Foreign currency and foreign currency translations | (31,018 ) | (10,045 ) |
Futures contracts | 954,912 | (5,290,918 ) |
Capital gain distributions from affiliated Underlying Funds | 2,351,205 | 2,070,278 |
Net realized gains (losses) on investments | 10,463,523 | (14,062,461 ) |
Net change in unrealized gains (losses) on | ||
Investments allocated from affiliated Master Portfolios | 2,205,360 | (8,912,352 ) |
Affiliated Underlying Funds | 8,028,534 | (785,752 ) |
Unaffiliated Underlying Funds | 8,382,219 | (5,993,481 ) |
Foreign currency and foreign currency translations | 33,288 | 2,542 |
Futures contracts | (1,494,322 ) | 2,251,067 |
Net change in unrealized gains (losses) on investments | 17,155,079 | (13,437,976 ) |
Net realized and unrealized gains (losses) on investments | 27,618,602 | (27,500,437 ) |
Net increase (decrease) in net assets resulting from operations | $34,444,202 | $(16,360,038 ) |
Spectrum Aggressive Growth Fund | ||||||
Year ended April 30, 20241 | Year ended May 31, 2023 | Year ended May 31, 2022 | ||||
Operations | ||||||
Net investment income | $1,977,798 | $2,770,153 | $925,743 | |||
Net realized gains (losses) on investments | 30,839,219 | (9,742,439 ) | 26,183,999 | |||
Net change in unrealized gains (losses) on investments | 41,424,756 | 2,121,788 | (77,972,191 ) | |||
Net increase (decrease) in net assets resulting from operations | 74,241,773 | (4,850,498 ) | (50,862,449 ) | |||
Distributions to shareholders from | ||||||
Net investment income and net realized gains | ||||||
Class A | 0 | (5,360,320 ) | (10,049,605 ) | |||
Class C | 0 | (10,294,513 ) | (46,652,606 ) | |||
Administrator Class | 0 | (3,317,435 ) | 0 2 | |||
Institutional Class | 0 | (249,706 ) | (874,349 ) | |||
Tax basis return of capital | ||||||
Class A | 0 | (583,510 ) | 0 | |||
Class C | 0 | (1,329,868 ) | 0 | |||
Administrator Class | 0 | (351,709 ) | 0 2 | |||
Institutional Class | 0 | (25,395 ) | 0 | |||
Total distributions to shareholders | 0 | (21,512,456 ) | (57,576,560 ) | |||
Capital share transactions | Shares | Shares | Shares | |||
Proceeds from shares sold | ||||||
Class A | 2,722,866 | 54,946,396 | 721,959 | 12,361,279 | 816,312 | 18,171,153 |
Class C | 217,777 | 4,064,749 | 309,768 | 5,239,508 | 343,193 | 7,214,990 |
Administrator Class | 96,860 | 1,837,629 | 95,193 | 1,618,791 | 45,122 2 | 865,939 2 |
Institutional Class | 201,235 | 3,918,776 | 158,844 | 2,731,633 | 634,500 | 14,278,622 |
64,767,550 | 21,951,211 | 40,530,704 | ||||
Reinvestment of distributions | ||||||
Class A | 0 | 0 | 352,466 | 5,923,710 | 480,525 | 10,028,952 |
Class C | 0 | 0 | 692,911 | 11,606,677 | 2,264,481 | 46,540,235 |
Administrator Class | 0 | 0 | 215,782 | 3,634,990 | 0 2 | 0 2 |
Institutional Class | 0 | 0 | 16,341 | 275,101 | 41,686 | 874,349 |
0 | 21,440,478 | 57,443,536 | ||||
Payment for shares redeemed | ||||||
Class A | (859,529 ) | (16,492,203 ) | (964,265 ) | (16,433,611 ) | (680,485 ) | (14,517,658 ) |
Class C | (4,368,924 ) | (85,015,803 ) | (2,892,486 ) | (48,988,220 ) | (2,606,924 ) | (55,520,562 ) |
Administrator Class | (432,389 ) | (8,340,841 ) | (409,693 ) | (7,043,597 ) | (563,869 )2 | (10,089,956 )2 |
Institutional Class | (193,500 ) | (3,748,805 ) | (213,905 ) | (3,636,097 ) | (706,658 ) | (16,276,740 ) |
(113,597,652 ) | (76,101,525 ) | (96,404,916 ) | ||||
Spectrum Aggressive Growth Fund | ||||||
Year ended April 30, 20241 | Year ended May 31, 2023 | Year ended May 31, 2022 | ||||
Shares | Shares | Shares | ||||
Net asset value of shares issued in acquisition | ||||||
Class A | 0 | $0 | 0 | $0 | 3,370,579 | $67,600,166 |
Class C | 0 | 0 | 0 | 0 | 57,632 | 1,147,568 |
Administrator Class | 0 | 0 | 0 | 0 | 4,727,539 2 | 95,077,457 2 |
0 | 0 | 163,825,191 | ||||
Net increase (decrease) in net assets resulting from capital share transactions | (48,830,102 ) | (32,709,836 ) | 165,394,515 | |||
Total increase (decrease) in net assets | 25,411,671 | (59,072,790 ) | 56,955,506 | |||
Net assets | ||||||
Beginning of period | 451,025,023 | 510,097,813 | 453,142,307 | |||
End of period | $476,436,694 | $451,025,023 | $510,097,813 | |||
Spectrum Conservative Growth Fund | ||||||
Year ended April 30, 20241 | Year ended May 31, 2023 | Year ended May 31, 2022 | ||||
Operations | ||||||
Net investment income | $5,285,340 | $8,213,623 | $6,806,428 | |||
Net realized gains (losses) on investments | 4,730 | (11,974,144 ) | 8,220,605 | |||
Net change in unrealized gains (losses) on investments | 10,814,173 | (8,218,141 ) | (36,062,340 ) | |||
Net increase (decrease) in net assets resulting from operations | 16,104,243 | (11,978,662 ) | (21,035,307 ) | |||
Distributions to shareholders from | ||||||
Net investment income and net realized gains | ||||||
Class A | (1,180,209 ) | (2,099,930 ) | (4,026,983 ) | |||
Class C | (4,422,294 ) | (12,875,159 ) | (28,133,207 ) | |||
Institutional Class | (318,328 ) | (844,294 ) | (1,743,701 ) | |||
Total distributions to shareholders | (5,920,831 ) | (15,819,383 ) | (33,903,891 ) | |||
Capital share transactions | Shares | Shares | Shares | |||
Proceeds from shares sold | ||||||
Class A | 7,294,658 | 69,140,292 | 579,071 | 5,351,457 | 405,172 | 4,537,206 |
Class C | 143,772 | 1,376,803 | 528,590 | 4,942,351 | 390,078 | 4,442,312 |
Institutional Class | 352,701 | 3,275,097 | 210,943 | 1,927,887 | 1,635,750 | 19,304,397 |
73,792,192 | 12,221,695 | 28,283,915 | ||||
Reinvestment of distributions | ||||||
Class A | 123,473 | 1,150,997 | 231,125 | 2,091,844 | 362,796 | 4,006,426 |
Class C | 464,152 | 4,407,108 | 1,381,228 | 12,866,079 | 2,485,248 | 28,094,921 |
Institutional Class | 34,514 | 318,328 | 93,167 | 844,294 | 158,208 | 1,742,918 |
5,876,433 | 15,802,217 | 33,844,265 | ||||
Payment for shares redeemed | ||||||
Class A | (1,182,836 ) | (11,057,327 ) | (751,253 ) | (6,888,334 ) | (782,754 ) | (8,635,241 ) |
Class C | (10,299,839 ) | (99,704,821 ) | (4,683,836 ) | (44,241,657 ) | (5,251,986 ) | (60,023,029 ) |
Institutional Class | (938,179 ) | (8,788,788 ) | (218,887 ) | (2,000,907 ) | (770,543 ) | (8,351,769 ) |
(119,550,936 ) | (53,130,898 ) | (77,010,039 ) | ||||
Net decrease in net assets resulting from capital share transactions | (39,882,311 ) | (25,106,986 ) | (14,881,859 ) | |||
Total decrease in net assets | (29,698,899 ) | (52,905,031 ) | (69,821,057 ) | |||
Net assets | ||||||
Beginning of period | 257,407,037 | 310,312,068 | 380,133,125 | |||
End of period | $227,708,138 | $257,407,037 | $310,312,068 | |||
Spectrum Growth Fund | ||||||
Year ended April 30, 20241 | Year ended May 31, 2023 | Year ended May 31, 2022 | ||||
Operations | ||||||
Net investment income | $3,032,201 | $5,449,000 | $5,149,272 | |||
Net realized gains (losses) on investments | 9,655,547 | (5,896,329 ) | 14,558,737 | |||
Net change in unrealized gains (losses) on investments | 10,636,742 | (7,856,570 ) | (36,266,865 ) | |||
Net increase (decrease) in net assets resulting from operations | 23,324,490 | (8,303,899 ) | (16,558,856 ) | |||
Distributions to shareholders from | ||||||
Net investment income and net realized gains | ||||||
Class A | (163,146 ) | (1,789,005 ) | (4,137,271 ) | |||
Class C | (470,432 ) | (12,249,697 ) | (30,888,748 ) | |||
Institutional Class | (11,832 ) | (154,866 ) | (338,432 ) | |||
Total distributions to shareholders | (645,410 ) | (14,193,568 ) | (35,364,451 ) | |||
Capital share transactions | Shares | Shares | Shares | |||
Proceeds from shares sold | ||||||
Class A | 4,032,374 | 48,413,477 | 437,991 | 4,760,622 | 246,428 | 3,515,326 |
Class C | 273,336 | 3,189,012 | 344,996 | 3,865,363 | 465,805 | 6,529,020 |
Institutional Class | 241,696 | 2,779,304 | 174,644 | 1,899,496 | 204,168 | 2,791,934 |
54,381,793 | 10,525,481 | 12,836,280 | ||||
Reinvestment of distributions | ||||||
Class A | 13,465 | 158,887 | 168,220 | 1,784,634 | 307,722 | 4,128,480 |
Class C | 38,736 | 469,872 | 1,117,113 | 12,232,792 | 2,251,455 | 30,852,298 |
Institutional Class | 1,002 | 11,832 | 14,625 | 154,866 | 25,184 | 338,432 |
640,591 | 14,172,292 | 35,319,210 | ||||
Payment for shares redeemed | ||||||
Class A | (448,066 ) | (5,189,948 ) | (450,613 ) | (4,944,924 ) | (467,843 ) | (6,436,687 ) |
Class C | (5,876,912 ) | (71,235,940 ) | (2,771,943 ) | (31,050,525 ) | (2,997,181 ) | (42,147,744 ) |
Institutional Class | (265,077 ) | (3,042,030 ) | (245,195 ) | (2,657,387 ) | (199,958 ) | (2,769,747 ) |
(79,467,918 ) | (38,652,836 ) | (51,354,178 ) | ||||
Net decrease in net assets resulting from capital share transactions | (24,445,534 ) | (13,955,063 ) | (3,198,688 ) | |||
Total decrease in net assets | (1,766,454 ) | (36,452,530 ) | (55,121,995 ) | |||
Net assets | ||||||
Beginning of period | 208,708,405 | 245,160,935 | 300,282,930 | |||
End of period | $206,941,951 | $208,708,405 | $245,160,935 | |||
Spectrum Income Allocation Fund | ||||||
Year ended April 30, 20241 | Year ended May 31, 2023 | Year ended May 31, 2022 | ||||
Operations | ||||||
Net investment income | $3,037,474 | $4,667,481 | $3,406,997 | |||
Net realized losses on investments | (5,640,561 ) | (7,724,585 ) | (547,741 ) | |||
Net change in unrealized gains (losses) on investments | 5,690,403 | (3,900,547 ) | (16,587,889 ) | |||
Net increase (decrease) in net assets resulting from operations | 3,087,316 | (6,957,651 ) | (13,728,633 ) | |||
Distributions to shareholders from | ||||||
Net investment income and net realized gains | ||||||
Class A | (608,137 ) | (864,868 ) | (1,594,768 ) | |||
Class C | (2,406,091 ) | (4,811,187 ) | (10,477,880 ) | |||
Institutional Class | (147,267 ) | (271,477 ) | (790,454 ) | |||
Total distributions to shareholders | (3,161,495 ) | (5,947,532 ) | (12,863,102 ) | |||
Capital share transactions | Shares | Shares | Shares | |||
Proceeds from shares sold | ||||||
Class A | 2,581,239 | 22,165,611 | 361,848 | 3,108,477 | 287,235 | 2,920,363 |
Class C | 51,365 | 434,536 | 208,362 | 1,804,859 | 367,054 | 3,613,412 |
Institutional Class | 138,442 | 1,185,601 | 53,807 | 469,980 | 1,272,557 | 13,383,942 |
23,785,748 | 5,383,316 | 19,917,717 | ||||
Reinvestment of distributions | ||||||
Class A | 71,196 | 607,225 | 101,327 | 863,269 | 157,714 | 1,593,948 |
Class C | 281,333 | 2,396,528 | 563,218 | 4,801,488 | 1,036,351 | 10,471,257 |
Institutional Class | 17,323 | 147,267 | 31,957 | 271,477 | 78,749 | 789,993 |
3,151,020 | 5,936,234 | 12,855,198 | ||||
Payment for shares redeemed | ||||||
Class A | (636,599 ) | (5,439,908 ) | (692,795 ) | (5,923,735 ) | (498,067 ) | (5,053,056 ) |
Class C | (5,153,255 ) | (43,965,492 ) | (3,260,095 ) | (28,066,319 ) | (3,981,333 ) | (39,973,681 ) |
Institutional Class | (318,170 ) | (2,698,142 ) | (68,847 ) | (596,639 ) | (818,687 ) | (7,694,286 ) |
(52,103,542 ) | (34,586,693 ) | (52,721,023 ) | ||||
Net decrease in net assets resulting from capital share transactions | (25,166,774 ) | (23,267,143 ) | (19,948,108 ) | |||
Total decrease in net assets | (25,240,953 ) | (36,172,326 ) | (46,539,843 ) | |||
Net assets | ||||||
Beginning of period | 138,631,639 | 174,803,965 | 221,343,808 | |||
End of period | $113,390,686 | $138,631,639 | $174,803,965 | |||
Spectrum Moderate Growth Fund | ||||||
Year ended April 30, 20241 | Year ended May 31, 2023 | Year ended May 31, 2022 | ||||
Operations | ||||||
Net investment income | $6,825,600 | $11,140,399 | $9,720,875 | |||
Net realized gains (losses) on investments | 10,463,523 | (14,062,461 ) | 22,358,842 | |||
Net change in unrealized gains (losses) on investments | 17,155,079 | (13,437,976 ) | (62,757,073 ) | |||
Net increase (decrease) in net assets resulting from operations | 34,444,202 | (16,360,038 ) | (30,677,356 ) | |||
Distributions to shareholders from | ||||||
Net investment income and net realized gains | ||||||
Class A | (249,522 ) | (2,975,461 ) | (6,498,756 ) | |||
Class C | (581,166 ) | (21,472,598 ) | (50,916,068 ) | |||
Institutional Class | (49,290 ) | (475,492 ) | (1,255,455 ) | |||
Total distributions to shareholders | (879,978 ) | (24,923,551 ) | (58,670,279 ) | |||
Capital share transactions | Shares | Shares | Shares | |||
Proceeds from shares sold | ||||||
Class A | 7,422,396 | 85,935,853 | 695,034 | 7,405,345 | 437,749 | 5,871,568 |
Class C | 315,492 | 3,575,584 | 508,539 | 5,636,312 | 525,068 | 7,193,590 |
Institutional Class | 343,529 | 3,899,955 | 367,124 | 3,944,823 | 861,717 | 11,938,967 |
93,411,392 | 16,986,480 | 25,004,125 | ||||
Reinvestment of distributions | ||||||
Class A | 21,599 | 247,312 | 283,302 | 2,949,491 | 496,494 | 6,478,082 |
Class C | 49,341 | 580,251 | 1,998,615 | 21,442,402 | 3,817,523 | 50,833,512 |
Institutional Class | 4,301 | 49,290 | 45,741 | 475,492 | 96,014 | 1,255,455 |
876,853 | 24,867,385 | 58,567,049 | ||||
Payment for shares redeemed | ||||||
Class A | (1,350,712 ) | (15,317,497 ) | (712,515 ) | (7,636,466 ) | (945,140 ) | (12,411,416 ) |
Class C | (11,534,917 ) | (134,613,402 ) | (6,098,542 ) | (67,180,571 ) | (5,676,098 ) | (76,893,468 ) |
Institutional Class | (824,930 ) | (9,587,842 ) | (407,494 ) | (4,406,072 ) | (571,340 ) | (7,428,017 ) |
(159,518,741 ) | (79,223,109 ) | (96,732,901 ) | ||||
Net asset value of shares issued in acquisition | ||||||
Class A | 3,078,205 | 35,799,448 | 0 | 0 | 0 | 0 |
Class C | 229,056 | 2,731,994 | 0 | 0 | 0 | 0 |
Institutional Class | 5,203,889 | 60,575,878 | 0 | 0 | 0 | 0 |
99,107,320 | 0 | 0 | ||||
Net increase (decrease) in net assets resulting from capital share transactions | 33,876,824 | (37,369,244 ) | (13,161,727 ) | |||
Total increase (decrease) in net assets | 67,441,048 | (78,652,833 ) | (102,509,362 ) | |||
Net assets | ||||||
Beginning of period | 378,119,420 | 456,772,253 | 559,281,615 | |||
End of period | $445,560,468 | $378,119,420 | $456,772,253 | |||
Year ended April 30 20241 | Year ended May 31 | |||||
Class A | 2023 | 2022 | 2021 | 2020 | 2019 | |
Net asset value, beginning of period | $17.22 | $18.17 | $22.82 | $18.59 | $16.52 | $20.55 |
Net investment income | 0.14 2 | 0.17 2 | 0.25 | 0.14 | 0.19 | 0.17 2 |
Net realized and unrealized gains (losses) on investments | 2.88 | (0.24 ) | (1.74 ) | 6.65 | 2.11 | (0.81 ) |
Total from investment operations | 3.02 | (0.07 ) | (1.49 ) | 6.79 | 2.30 | (0.64 ) |
Distributions to shareholders from | ||||||
Net investment income | 0.00 | (0.20 ) | (0.18 ) | (0.22 ) | (0.19 ) | (0.26 ) |
Net realized gains | 0.00 | (0.60 ) | (2.98 ) | (2.34 ) | (0.04 ) | (3.13 ) |
Tax basis return of capital | 0.00 | (0.08 ) | 0.00 | 0.00 | 0.00 | 0.00 |
Total distributions to shareholders | 0.00 | (0.88 ) | (3.16 ) | (2.56 ) | (0.23 ) | (3.39 ) |
Net asset value, end of period | $20.24 | $17.22 | $18.17 | $22.82 | $18.59 | $16.52 |
Total return3 | 17.54 % | (0.20 )% | (8.22 )% | 38.53 % | 13.91 % | (2.35 )% |
Ratios to average net assets (annualized) | ||||||
Gross expenses* | 0.75 % | 0.78 % | 0.76 % | 0.77 % | 0.77 % | 0.76 % |
Net expenses* | 0.74 % | 0.75 % | 0.75 % | 0.75 % | 0.75 % | 0.75 % |
Net investment income | 0.82 % | 1.02 % | 0.76 % | 0.63 % | 1.08 % | 0.97 % |
Supplemental data | ||||||
Portfolio turnover rate4 | 62 % | 38 % | 62 % | 82 % | 71 % | 78 % |
Net assets, end of period (000s omitted) | $179,433 | $120,576 | $125,195 | $66,239 | $44,714 | $42,588 |
* | Including net expenses allocated from the affiliated Master Portfolios, the expense ratios would be increased by the following amounts: |
Year ended April 30, 20241 | 0.14% |
Year ended May 31, 2023 | 0.16% |
Year ended May 31, 2022 | 0.16% |
Year ended May 31, 2021 | 0.15% |
Year ended May 31, 2020 | 0.18% |
Year ended May 31, 2019 | 0.18% |
1 | For the eleven months ended April 30, 2024. The Fund changed its fiscal year end from May 31 to April 30, effective April 30, 2024. |
2 | Calculated based upon average shares outstanding |
3 | Total return calculations do not include any sales charges. Returns for periods of less than one year are not annualized. |
4 | Portfolio turnover rate is calculated by multiplying the Fund’s ownership percentage in the respective affiliated Master Portfolio by the corresponding affiliated Master Portfolio’s purchases and sales. These purchases and sales amounts are aggregated with the direct purchases and sales in the Underlying Funds and included in the portfolio turnover calculation. |
Year ended April 30 20241 | Year ended May 31 | |||||
Class C | 2023 | 2022 | 2021 | 2020 | 2019 | |
Net asset value, beginning of period | $17.07 | $18.00 | $22.63 | $18.45 | $16.39 | $20.33 |
Net investment income (loss) | 0.02 2 | 0.04 2 | (0.01 ) | (0.03 ) | 0.07 | 0.06 |
Net realized and unrealized gains (losses) on investments | 2.84 | (0.24 ) | (1.63 ) | 6.62 | 2.07 | (0.82 ) |
Total from investment operations | 2.86 | (0.20 ) | (1.64 ) | 6.59 | 2.14 | (0.76 ) |
Distributions to shareholders from | ||||||
Net investment income | 0.00 | (0.05 ) | (0.01 ) | (0.07 ) | (0.04 ) | (0.05 ) |
Net realized gains | 0.00 | (0.60 ) | (2.98 ) | (2.34 ) | (0.04 ) | (3.13 ) |
Tax basis return of capital | 0.00 | (0.08 ) | 0.00 | 0.00 | 0.00 | 0.00 |
Total distributions to shareholders | 0.00 | (0.73 ) | (2.99 ) | (2.41 ) | (0.08 ) | (3.18 ) |
Net asset value, end of period | $19.93 | $17.07 | $18.00 | $22.63 | $18.45 | $16.39 |
Total return3 | 16.75 % | (0.96 )% | (8.87 )% | 37.57 % | 13.06 % | (3.16 )% |
Ratios to average net assets (annualized) | ||||||
Gross expenses* | 1.50 % | 1.52 % | 1.50 % | 1.52 % | 1.52 % | 1.51 % |
Net expenses* | 1.49 % | 1.50 % | 1.50 % | 1.50 % | 1.50 % | 1.50 % |
Net investment income (loss) | 0.11 % | 0.27 % | (0.03 )% | (0.12 )% | 0.33 % | 0.32 % |
Supplemental data | ||||||
Portfolio turnover rate4 | 62 % | 38 % | 62 % | 82 % | 71 % | 78 % |
Net assets, end of period (000s omitted) | $214,467 | $254,615 | $302,402 | $378,941 | $323,778 | $355,837 |
* | Including net expenses allocated from the affiliated Master Portfolios, the expense ratios would be increased by the following amounts: |
Year ended April 30, 20241 | 0.14% |
Year ended May 31, 2023 | 0.16% |
Year ended May 31, 2022 | 0.16% |
Year ended May 31, 2021 | 0.15% |
Year ended May 31, 2020 | 0.18% |
Year ended May 31, 2019 | 0.18% |
1 | For the eleven months ended April 30, 2024. The Fund changed its fiscal year end from May 31 to April 30, effective April 30, 2024. |
2 | Calculated based upon average shares outstanding |
3 | Total return calculations do not include any sales charges. Returns for periods of less than one year are not annualized. |
4 | Portfolio turnover rate is calculated by multiplying the Fund’s ownership percentage in the respective affiliated Master Portfolio by the corresponding affiliated Master Portfolio’s purchases and sales. These purchases and sales amounts are aggregated with the direct purchases and sales in the Underlying Funds and included in the portfolio turnover calculation. |
Year ended April 30 20241 | Year ended May 31 | ||
Administrator Class | 2023 | 20222 | |
Net asset value, beginning of period | $17.28 | $18.23 | $20.11 |
Net investment income | 0.16 3 | 0.19 3 | 0.06 |
Net realized and unrealized gains (losses) on investments | 2.88 | (0.25 ) | (1.94 ) |
Total from investment operations | 3.04 | (0.06 ) | (1.88 ) |
Distributions to shareholders from | |||
Net investment income | 0.00 | (0.21 ) | 0.00 |
Net realized gains | 0.00 | (0.60 ) | 0.00 |
Tax basis return of capital | 0.00 | (0.08 ) | 0.00 |
Total distributions to shareholders | 0.00 | (0.89 ) | 0.00 |
Net asset value, end of period | $20.32 | $17.28 | $18.23 |
Total return4 | 17.59 % | (0.10 )% | (9.35 )% |
Ratios to average net assets (annualized) | |||
Gross expenses* | 0.68 % | 0.70 % | 0.67 % |
Net expenses* | 0.67 % | 0.67 % | 0.67 % |
Net investment income | 0.92 % | 1.10 % | 0.98 % |
Supplemental data | |||
Portfolio turnover rate5 | 62 % | 38 % | 62 % |
Net assets, end of period (000s omitted) | $76,692 | $71,010 | $76,706 |
* | Including net expenses allocated from the affiliated Master Portfolios, the expense ratios would be increased by the following amounts: |
Year ended April 30, 20241 | 0.14% |
Year ended May 31, 2023 | 0.16% |
Year ended May 31, 20222 | 0.15% |
1 | For the eleven months ended April 30, 2024. The Fund changed its fiscal year end from May 31 to April 30, effective April 30, 2024. |
2 | For the period from February 4, 2022 (commencement of class operations) to May 31, 2022 |
3 | Calculated based upon average shares outstanding |
4 | Returns for periods of less than one year are not annualized. |
5 | Portfolio turnover rate is calculated by multiplying the Fund’s ownership percentage in the respective affiliated Master Portfolio by the corresponding affiliated Master Portfolio’s purchases and sales. These purchases and sales amounts are aggregated with the direct purchases and sales in the Underlying Funds and included in the portfolio turnover calculation. |
Year ended April 30 20241 | Year ended May 31 | |||||
Institutional Class | 2023 | 2022 | 2021 | 2020 | 20192 | |
Net asset value, beginning of period | $17.30 | $18.24 | $22.87 | $18.62 | $16.55 | $21.08 |
Net investment income | 0.20 3 | 0.23 3 | 0.27 | 0.22 | 0.29 | 0.14 |
Net realized and unrealized gains (losses) on investments | 2.89 | (0.24 ) | (1.69 ) | 6.65 | 2.07 | (1.26 ) |
Total from investment operations | 3.09 | (0.01 ) | (1.42 ) | 6.87 | 2.36 | (1.12 ) |
Distributions to shareholders from | ||||||
Net investment income | 0.00 | (0.25 ) | (0.23 ) | (0.28 ) | (0.25 ) | (0.28 ) |
Net realized gains | 0.00 | (0.60 ) | (2.98 ) | (2.34 ) | (0.04 ) | (3.13 ) |
Tax basis return of capital | 0.00 | (0.08 ) | 0.00 | 0.00 | 0.00 | 0.00 |
Total distributions to shareholders | 0.00 | (0.93 ) | (3.21 ) | (2.62 ) | (0.29 ) | (3.41 ) |
Net asset value, end of period | $20.39 | $17.30 | $18.24 | $22.87 | $18.62 | $16.55 |
Total return4 | 17.86 % | 0.18 % | (7.89 )% | 38.96 % | 14.26 % | (4.54 )% |
Ratios to average net assets (annualized) | ||||||
Gross expenses* | 0.43 % | 0.45 % | 0.43 % | 0.43 % | 0.44 % | 0.43 % |
Net expenses* | 0.42 % | 0.42 % | 0.42 % | 0.42 % | 0.42 % | 0.42 % |
Net investment income | 1.15 % | 1.35 % | 1.00 % | 0.96 % | 1.40 % | 1.40 % |
Supplemental data | ||||||
Portfolio turnover rate5 | 62 % | 38 % | 62 % | 82 % | 71 % | 78 % |
Net assets, end of period (000s omitted) | $5,844 | $4,824 | $5,794 | $7,962 | $2,281 | $1,172 |
* | Including net expenses allocated from the affiliated Master Portfolios, the expense ratios would be increased by the following amounts: |
Year ended April 30, 20241 | 0.14% |
Year ended May 31, 2023 | 0.16% |
Year ended May 31, 2022 | 0.16% |
Year ended May 31, 2021 | 0.15% |
Year ended May 31, 2020 | 0.18% |
Year ended May 31, 20192 | 0.18% |
1 | For the eleven months ended April 30, 2024. The Fund changed its fiscal year end from May 31 to April 30, effective April 30, 2024. |
2 | For the period from July 31, 2018 (commencement of class operations) to May 31, 2019 |
3 | Calculated based upon average shares outstanding |
4 | Returns for periods of less than one year are not annualized. |
5 | Portfolio turnover rate is calculated by multiplying the Fund’s ownership percentage in the respective affiliated Master Portfolio by the corresponding affiliated Master Portfolio’s purchases and sales. These purchases and sales amounts are aggregated with the direct purchases and sales in the Underlying Funds and included in the portfolio turnover calculation. |
Year ended April 30 20241 | Year ended May 31 | |||||
Class A | 2023 | 2022 | 2021 | 2020 | 2019 | |
Net asset value, beginning of period | $9.04 | $9.97 | $11.73 | $10.92 | $10.30 | $10.90 |
Net investment income | 0.24 2 | 0.33 2 | 0.28 | 0.14 | 0.15 | 0.19 2 |
Net realized and unrealized gains (losses) on investments | 0.41 | (0.65 ) | (0.85 ) | 1.56 | 0.76 | 0.03 |
Total from investment operations | 0.65 | (0.32 ) | (0.57 ) | 1.70 | 0.91 | 0.22 |
Distributions to shareholders from | ||||||
Net investment income | (0.29 ) | (0.38 ) | (0.29 ) | (0.11 ) | (0.21 ) | (0.18 ) |
Net realized gains | 0.00 | (0.23 ) | (0.90 ) | (0.78 ) | (0.08 ) | (0.64 ) |
Total distributions to shareholders | (0.29 ) | (0.61 ) | (1.19 ) | (0.89 ) | (0.29 ) | (0.82 ) |
Net asset value, end of period | $9.40 | $9.04 | $9.97 | $11.73 | $10.92 | $10.30 |
Total return3 | 7.32 % | (3.11 )% | (5.69 )% | 16.04 % | 8.95 % | 2.40 % |
Ratios to average net assets (annualized) | ||||||
Gross expenses* | 0.79 % | 0.79 % | 0.78 % | 0.77 % | 0.77 % | 0.76 % |
Net expenses* | 0.74 % | 0.75 % | 0.75 % | 0.75 % | 0.75 % | 0.75 % |
Net investment income | 2.83 % | 3.58 % | 2.52 % | 1.07 % | 1.47 % | 1.81 % |
Supplemental data | ||||||
Portfolio turnover rate4 | 96 % | 93 % | 137 % | 152 % | 162 % | 155 % |
Net assets, end of period (000s omitted) | $91,384 | $31,509 | $34,171 | $40,354 | $31,965 | $34,104 |
* | Including net expenses allocated from the affiliated Master Portfolios, the expense ratios would be increased by the following amounts: |
Year ended April 30, 20241 | 0.12% |
Year ended May 31, 2023 | 0.13% |
Year ended May 31, 2022 | 0.14% |
Year ended May 31, 2021 | 0.15% |
Year ended May 31, 2020 | 0.16% |
Year ended May 31, 2019 | 0.16% |
1 | For the eleven months ended April 30, 2024. The Fund changed its fiscal year end from May 31 to April 30, effective April 30, 2024. |
2 | Calculated based upon average shares outstanding |
3 | Total return calculations do not include any sales charges. Returns for periods of less than one year are not annualized. |
4 | Portfolio turnover rate is calculated by multiplying the Fund’s ownership percentage in the respective affiliated Master Portfolio by the corresponding affiliated Master Portfolio’s purchases and sales. These purchases and sales amounts are aggregated with the direct purchases and sales in the Underlying Funds and included in the portfolio turnover calculation. |
Year ended April 30 20241 | Year ended May 31 | |||||
Class C | 2023 | 2022 | 2021 | 2020 | 2019 | |
Net asset value, beginning of period | $9.30 | $10.23 | $11.98 | $11.14 | $10.50 | $11.10 |
Net investment income | 0.19 2 | 0.27 2 | 0.21 | 0.04 | 0.09 | 0.12 2 |
Net realized and unrealized gains (losses) on investments | 0.42 | (0.67 ) | (0.88 ) | 1.61 | 0.77 | 0.02 |
Total from investment operations | 0.61 | (0.40 ) | (0.67 ) | 1.65 | 0.86 | 0.14 |
Distributions to shareholders from | ||||||
Net investment income | (0.21 ) | (0.30 ) | (0.18 ) | (0.03 ) | (0.14 ) | (0.10 ) |
Net realized gains | 0.00 | (0.23 ) | (0.90 ) | (0.78 ) | (0.08 ) | (0.64 ) |
Total distributions to shareholders | (0.21 ) | (0.53 ) | (1.08 ) | (0.81 ) | (0.22 ) | (0.74 ) |
Net asset value, end of period | $9.70 | $9.30 | $10.23 | $11.98 | $11.14 | $10.50 |
Total return3 | 6.60 % | (3.83 )% | (6.38 )% | 15.17 % | 8.24 % | 1.58 % |
Ratios to average net assets (annualized) | ||||||
Gross expenses* | 1.53 % | 1.54 % | 1.53 % | 1.52 % | 1.52 % | 1.51 % |
Net expenses* | 1.49 % | 1.50 % | 1.50 % | 1.50 % | 1.50 % | 1.50 % |
Net investment income | 2.20 % | 2.84 % | 1.80 % | 0.31 % | 0.73 % | 1.13 % |
Supplemental data | ||||||
Portfolio turnover rate4 | 96 % | 93 % | 137 % | 152 % | 162 % | 155 % |
Net assets, end of period (000s omitted) | $128,576 | $213,452 | $263,264 | $336,665 | $339,482 | $393,207 |
* | Including net expenses allocated from the affiliated Master Portfolios, the expense ratios would be increased by the following amounts: |
Year ended April 30, 20241 | 0.12% |
Year ended May 31, 2023 | 0.13% |
Year ended May 31, 2022 | 0.14% |
Year ended May 31, 2021 | 0.15% |
Year ended May 31, 2020 | 0.16% |
Year ended May 31, 2019 | 0.17% |
1 | For the eleven months ended April 30, 2024. The Fund changed its fiscal year end from May 31 to April 30, effective April 30, 2024. |
2 | Calculated based upon average shares outstanding |
3 | Total return calculations do not include any sales charges. Returns for periods of less than one year are not annualized. |
4 | Portfolio turnover rate is calculated by multiplying the Fund’s ownership percentage in the respective affiliated Master Portfolio by the corresponding affiliated Master Portfolio’s purchases and sales. These purchases and sales amounts are aggregated with the direct purchases and sales in the Underlying Funds and included in the portfolio turnover calculation. |
Year ended April 30 20241 | Year ended May 31 | |||||
Institutional Class | 2023 | 2022 | 2021 | 2020 | 20192 | |
Net asset value, beginning of period | $9.06 | $10.00 | $11.77 | $10.94 | $10.32 | $11.06 |
Net investment income | 0.28 3 | 0.36 3 | 0.34 | 0.17 | 0.20 | 0.14 |
Net realized and unrealized gains (losses) on investments | 0.40 | (0.66 ) | (0.87 ) | 1.57 | 0.74 | (0.04 ) |
Total from investment operations | 0.68 | (0.30 ) | (0.53 ) | 1.74 | 0.94 | 0.10 |
Distributions to shareholders from | ||||||
Net investment income | (0.32 ) | (0.41 ) | (0.34 ) | (0.13 ) | (0.24 ) | (0.20 ) |
Net realized gains | 0.00 | (0.23 ) | (0.90 ) | (0.78 ) | (0.08 ) | (0.64 ) |
Total distributions to shareholders | (0.32 ) | (0.64 ) | (1.24 ) | (0.91 ) | (0.32 ) | (0.84 ) |
Net asset value, end of period | $9.42 | $9.06 | $10.00 | $11.77 | $10.94 | $10.32 |
Total return4 | 7.60 % | (2.87 )% | (5.36 )% | 16.44 % | 9.26 % | 1.28 % |
Ratios to average net assets (annualized) | ||||||
Gross expenses* | 0.46 % | 0.46 % | 0.45 % | 0.44 % | 0.44 % | 0.43 % |
Net expenses* | 0.42 % | 0.42 % | 0.42 % | 0.42 % | 0.42 % | 0.42 % |
Net investment income | 3.35 % | 3.89 % | 2.24 % | 1.39 % | 1.80 % | 1.37 % |
Supplemental data | ||||||
Portfolio turnover rate5 | 96 % | 93 % | 137 % | 152 % | 162 % | 155 % |
Net assets, end of period (000s omitted) | $7,749 | $12,445 | $12,877 | $3,114 | $2,678 | $1,817 |
* | Including net expenses allocated from the affiliated Master Portfolios, the expense ratios would be increased by the following amounts: |
Year ended April 30, 20241 | 0.12% |
Year ended May 31, 2023 | 0.13% |
Year ended May 31, 2022 | 0.14% |
Year ended May 31, 2021 | 0.15% |
Year ended May 31, 2020 | 0.16% |
Year ended May 31, 20192 | 0.16% |
1 | For the eleven months ended April 30, 2024. The Fund changed its fiscal year end from May 31 to April 30, effective April 30, 2024. |
2 | For the period from July 31, 2018 (commencement of class operations) to May 31, 2019 |
3 | Calculated based upon average shares outstanding |
4 | Returns for periods of less than one year are not annualized. |
5 | Portfolio turnover rate is calculated by multiplying the Fund’s ownership percentage in the respective affiliated Master Portfolio by the corresponding affiliated Master Portfolio’s purchases and sales. These purchases and sales amounts are aggregated with the direct purchases and sales in the Underlying Funds and included in the portfolio turnover calculation. |
Year ended April 30 20241 | Year ended May 31 | |||||
Class A | 2023 | 2022 | 2021 | 2020 | 2019 | |
Net asset value, beginning of period | $10.72 | $11.87 | $14.46 | $12.70 | $11.57 | $13.88 |
Net investment income | 0.22 2 | 0.34 2 | 0.34 2 | 0.13 | 0.15 | 0.14 2 |
Net realized and unrealized gains (losses) on investments | 1.11 | (0.67 ) | (1.00 ) | 3.24 | 1.17 | (0.30 ) |
Total from investment operations | 1.33 | (0.33 ) | (0.66 ) | 3.37 | 1.32 | (0.16 ) |
Distributions to shareholders from | ||||||
Net investment income | (0.07 ) | (0.41 ) | (0.33 ) | (0.13 ) | (0.18 ) | (0.23 ) |
Net realized gains | 0.00 | (0.41 ) | (1.60 ) | (1.48 ) | (0.01 ) | (1.92 ) |
Total distributions to shareholders | (0.07 ) | (0.82 ) | (1.93 ) | (1.61 ) | (0.19 ) | (2.15 ) |
Net asset value, end of period | $11.98 | $10.72 | $11.87 | $14.46 | $12.70 | $11.57 |
Total return3 | 12.42 % | (2.53 )% | (5.83 )% | 27.87 % | 11.34 % | (0.38 )% |
Ratios to average net assets (annualized) | ||||||
Gross expenses* | 0.79 % | 0.81 % | 0.80 % | 0.79 % | 0.79 % | 0.78 % |
Net expenses* | 0.74 % | 0.75 % | 0.75 % | 0.75 % | 0.75 % | 0.75 % |
Net investment income | 2.10 % | 3.12 % | 2.46 % | 0.90 % | 1.14 % | 1.20 % |
Supplemental data | ||||||
Portfolio turnover rate4 | 74 % | 57 % | 61 % | 100 % | 98 % | 97 % |
Net assets, end of period (000s omitted) | $71,930 | $25,803 | $26,717 | $31,295 | $25,089 | $23,420 |
* | Including net expenses allocated from the affiliated Master Portfolios, the expense ratios would be increased by the following amounts: |
Year ended April 30, 20241 | 0.14% |
Year ended May 31, 2023 | 0.14% |
Year ended May 31, 2022 | 0.14% |
Year ended May 31, 2021 | 0.14% |
Year ended May 31, 2020 | 0.16% |
Year ended May 31, 2019 | 0.17% |
1 | For the eleven months ended April 30, 2024. The Fund changed its fiscal year end from May 31 to April 30, effective April 30, 2024. |
2 | Calculated based upon average shares outstanding |
3 | Total return calculations do not include any sales charges. Returns for periods of less than one year are not annualized. |
4 | Portfolio turnover rate is calculated by multiplying the Fund’s ownership percentage in the respective affiliated Master Portfolio by the corresponding affiliated Master Portfolio’s purchases and sales. These purchases and sales amounts are aggregated with the direct purchases and sales in the Underlying Funds and included in the portfolio turnover calculation. |
Year ended April 30 20241 | Year ended May 31 | |||||
Class C | 2023 | 2022 | 2021 | 2020 | 2019 | |
Net asset value, beginning of period | $11.03 | $12.17 | $14.78 | $12.96 | $11.78 | $14.02 |
Net investment income | 0.16 2 | 0.27 2 | 0.24 | 0.02 | 0.06 | 0.08 |
Net realized and unrealized gains (losses) on investments | 1.12 | (0.68 ) | (1.03 ) | 3.30 | 1.20 | (0.33 ) |
Total from investment operations | 1.28 | (0.41 ) | (0.79 ) | 3.32 | 1.26 | (0.25 ) |
Distributions to shareholders from | ||||||
Net investment income | (0.03 ) | (0.32 ) | (0.22 ) | (0.02 ) | (0.07 ) | (0.07 ) |
Net realized gains | 0.00 | (0.41 ) | (1.60 ) | (1.48 ) | (0.01 ) | (1.92 ) |
Total distributions to shareholders | (0.03 ) | (0.73 ) | (1.82 ) | (1.50 ) | (0.08 ) | (1.99 ) |
Net asset value, end of period | $12.28 | $11.03 | $12.17 | $14.78 | $12.96 | $11.78 |
Total return3 | 11.62 % | (3.22 )% | (6.53 )% | 26.86 % | 10.67 % | (1.12 )% |
Ratios to average net assets (annualized) | ||||||
Gross expenses* | 1.53 % | 1.56 % | 1.55 % | 1.54 % | 1.53 % | 1.52 % |
Net expenses* | 1.49 % | 1.50 % | 1.50 % | 1.50 % | 1.50 % | 1.50 % |
Net investment income | 1.46 % | 2.39 % | 1.73 % | 0.15 % | 0.40 % | 0.56 % |
Supplemental data | ||||||
Portfolio turnover rate4 | 74 % | 57 % | 61 % | 100 % | 98 % | 97 % |
Net assets, end of period (000s omitted) | $133,450 | $181,270 | $215,969 | $266,399 | $241,980 | $261,722 |
* | Including net expenses allocated from the affiliated Master Portfolios, the expense ratios would be increased by the following amounts: |
Year ended April 30, 20241 | 0.13% |
Year ended May 31, 2023 | 0.14% |
Year ended May 31, 2022 | 0.14% |
Year ended May 31, 2021 | 0.15% |
Year ended May 31, 2020 | 0.16% |
Year ended May 31, 2019 | 0.17% |
1 | For the eleven months ended April 30, 2024. The Fund changed its fiscal year end from May 31 to April 30, effective April 30, 2024. |
2 | Calculated based upon average shares outstanding |
3 | Total return calculations do not include any sales charges. Returns for periods of less than one year are not annualized. |
4 | Portfolio turnover rate is calculated by multiplying the Fund’s ownership percentage in the respective affiliated Master Portfolio by the corresponding affiliated Master Portfolio’s purchases and sales. These purchases and sales amounts are aggregated with the direct purchases and sales in the Underlying Funds and included in the portfolio turnover calculation. |
Year ended April 30 20241 | Year ended May 31 | |||||
Institutional Class | 2023 | 2022 | 2021 | 2020 | 20192 | |
Net asset value, beginning of period | $10.72 | $11.87 | $14.46 | $12.70 | $11.57 | $14.20 |
Net investment income | 0.26 3 | 0.39 3 | 0.42 | 0.22 | 0.16 | 0.18 |
Net realized and unrealized gains (losses) on investments | 1.10 | (0.68 ) | (1.03 ) | 3.19 | 1.20 | (0.65 ) |
Total from investment operations | 1.36 | (0.29 ) | (0.61 ) | 3.41 | 1.36 | (0.47 ) |
Distributions to shareholders from | ||||||
Net investment income | (0.08 ) | (0.45 ) | (0.38 ) | (0.17 ) | (0.22 ) | (0.24 ) |
Net realized gains | 0.00 | (0.41 ) | (1.60 ) | (1.48 ) | (0.01 ) | (1.92 ) |
Total distributions to shareholders | (0.08 ) | (0.86 ) | (1.98 ) | (1.65 ) | (0.23 ) | (2.16 ) |
Net asset value, end of period | $12.00 | $10.72 | $11.87 | $14.46 | $12.70 | $11.57 |
Total return4 | 12.74 % | (2.17 )% | (5.55 )% | 28.25 % | 11.71 % | (2.47 )% |
Ratios to average net assets (annualized) | ||||||
Gross expenses* | 0.47 % | 0.48 % | 0.47 % | 0.46 % | 0.46 % | 0.45 % |
Net expenses* | 0.42 % | 0.42 % | 0.42 % | 0.42 % | 0.42 % | 0.42 % |
Net investment income | 2.46 % | 3.53 % | 2.85 % | 1.24 % | 1.44 % | 1.84 % |
Supplemental data | ||||||
Portfolio turnover rate5 | 74 % | 57 % | 61 % | 100 % | 98 % | 97 % |
Net assets, end of period (000s omitted) | $1,562 | $1,636 | $2,475 | $2,589 | $1,016 | $699 |
* | Including net expenses allocated from the affiliated Master Portfolios, the expense ratios would be increased by the following amounts: |
Year ended April 30, 20241 | 0.13% |
Year ended May 31, 2023 | 0.14% |
Year ended May 31, 2022 | 0.14% |
Year ended May 31, 2021 | 0.14% |
Year ended May 31, 2020 | 0.16% |
Year ended May 31, 20192 | 0.17% |
1 | For the eleven months ended April 30, 2024. The Fund changed its fiscal year end from May 31 to April 30, effective April 30, 2024. |
2 | For the period from July 31, 2018 (commencement of class operations) to May 31, 2019 |
3 | Calculated based upon average shares outstanding |
4 | Returns for periods of less than one year are not annualized. |
5 | Portfolio turnover rate is calculated by multiplying the Fund’s ownership percentage in the respective affiliated Master Portfolio by the corresponding affiliated Master Portfolio’s purchases and sales. These purchases and sales amounts are aggregated with the direct purchases and sales in the Underlying Funds and included in the portfolio turnover calculation. |
Year ended April 30 20241 | Year ended May 31 | |||||
Class A | 2023 | 2022 | 2021 | 2020 | 2019 | |
Net asset value, beginning of period | $8.48 | $9.18 | $10.50 | $10.40 | $9.82 | $10.05 |
Net investment income | 0.25 2 | 0.32 2 | 0.23 | 0.11 | 0.16 | 0.18 |
Net realized and unrealized gains (losses) on investments | 0.01 | (0.63 ) | (0.83 ) | 0.71 | 0.59 | 0.18 |
Total from investment operations | 0.26 | (0.31 ) | (0.60 ) | 0.82 | 0.75 | 0.36 |
Distributions to shareholders from | ||||||
Net investment income | (0.27 ) | (0.31 ) | (0.25 ) | (0.14 ) | (0.17 ) | (0.19 ) |
Net realized gains | 0.00 | (0.08 ) | (0.47 ) | (0.58 ) | 0.00 | (0.40 ) |
Total distributions to shareholders | (0.27 ) | (0.39 ) | (0.72 ) | (0.72 ) | (0.17 ) | (0.59 ) |
Net asset value, end of period | $8.47 | $8.48 | $9.18 | $10.50 | $10.40 | $9.82 |
Total return3 | 3.04 % | (3.32 )% | (6.28 )% | 8.07 % | 7.72 % | 3.84 % |
Ratios to average net assets (annualized) | ||||||
Gross expenses* | 0.85 % | 0.83 % | 0.81 % | 0.80 % | 0.80 % | 0.79 % |
Net expenses* | 0.74 % | 0.75 % | 0.75 % | 0.75 % | 0.75 % | 0.75 % |
Net investment income | 3.20 % | 3.67 % | 2.26 % | 1.04 % | 1.61 % | 2.15 % |
Supplemental data | ||||||
Portfolio turnover rate4 | 143 % | 148 % | 225 % | 206 % | 197 % | 183 % |
Net assets, end of period (000s omitted) | $34,183 | $17,128 | $20,647 | $24,170 | $21,256 | $16,242 |
* | Including net expenses allocated from the affiliated Master Portfolios, the expense ratios would be increased by the following amounts: |
Year ended April 30, 20241 | 0.13% |
Year ended May 31, 2023 | 0.14% |
Year ended May 31, 2022 | 0.16% |
Year ended May 31, 2021 | 0.16% |
Year ended May 31, 2020 | 0.15% |
Year ended May 31, 2019 | 0.16% |
1 | For the eleven months ended April 30, 2024. The Fund changed its fiscal year end from May 31 to April 30, effective April 30, 2024. |
2 | Calculated based upon average shares outstanding |
3 | Total return calculations do not include any sales charges. Returns for periods of less than one year are not annualized. |
4 | Portfolio turnover rate is calculated by multiplying the Fund’s ownership percentage in the respective affiliated Master Portfolio by the corresponding affiliated Master Portfolio’s purchases and sales. These purchases and sales amounts are aggregated with the direct purchases and sales in the Underlying Funds and included in the portfolio turnover calculation. |
Year ended April 30 20241 | Year ended May 31 | |||||
Class C | 2023 | 2022 | 2021 | 2020 | 2019 | |
Net asset value, beginning of period | $8.48 | $9.18 | $10.46 | $10.36 | $9.81 | $10.06 |
Net investment income | 0.20 2 | 0.25 2 | 0.15 | 0.03 | 0.09 | 0.14 2 |
Net realized and unrealized gains (losses) on investments | 0.00 | (0.62 ) | (0.82 ) | 0.71 | 0.58 | 0.13 |
Total from investment operations | 0.20 | (0.37 ) | (0.67 ) | 0.74 | 0.67 | 0.27 |
Distributions to shareholders from | ||||||
Net investment income | (0.20 ) | (0.25 ) | (0.14 ) | (0.06 ) | (0.12 ) | (0.12 ) |
Net realized gains | 0.00 | (0.08 ) | (0.47 ) | (0.58 ) | 0.00 | (0.40 ) |
Total distributions to shareholders | (0.20 ) | (0.33 ) | (0.61 ) | (0.64 ) | (0.12 ) | (0.52 ) |
Net asset value, end of period | $8.48 | $8.48 | $9.18 | $10.46 | $10.36 | $9.81 |
Total return3 | 2.38 % | (4.07 )% | (6.91 )% | 7.25 % | 6.90 % | 2.89 % |
Ratios to average net assets (annualized) | ||||||
Gross expenses* | 1.59 % | 1.58 % | 1.56 % | 1.55 % | 1.55 % | 1.54 % |
Net expenses* | 1.49 % | 1.50 % | 1.50 % | 1.50 % | 1.50 % | 1.50 % |
Net investment income | 2.51 % | 2.92 % | 1.53 % | 0.30 % | 0.89 % | 1.41 % |
Supplemental data | ||||||
Portfolio turnover rate4 | 143 % | 148 % | 225 % | 206 % | 197 % | 183 % |
Net assets, end of period (000s omitted) | $75,016 | $115,932 | $148,281 | $196,035 | $212,465 | $237,153 |
* | Including net expenses allocated from the affiliated Master Portfolios, the expense ratios would be increased by the following amounts: |
Year ended April 30, 20241 | 0.13% |
Year ended May 31, 2023 | 0.14% |
Year ended May 31, 2022 | 0.16% |
Year ended May 31, 2021 | 0.16% |
Year ended May 31, 2020 | 0.15% |
Year ended May 31, 2019 | 0.16% |
1 | For the eleven months ended April 30, 2024. The Fund changed its fiscal year end from May 31 to April 30, effective April 30, 2024. |
2 | Calculated based upon average shares outstanding |
3 | Total return calculations do not include any sales charges. Returns for periods of less than one year are not annualized. |
4 | Portfolio turnover rate is calculated by multiplying the Fund’s ownership percentage in the respective affiliated Master Portfolio by the corresponding affiliated Master Portfolio’s purchases and sales. These purchases and sales amounts are aggregated with the direct purchases and sales in the Underlying Funds and included in the portfolio turnover calculation. |
Year ended April 30 20241 | Year ended May 31 | |||||
Institutional Class | 2023 | 2022 | 2021 | 2020 | 20192 | |
Net asset value, beginning of period | $8.47 | $9.17 | $10.50 | $10.39 | $9.80 | $10.15 |
Net investment income | 0.27 3 | 0.34 3 | 0.20 3 | 0.19 | 0.21 | 0.15 |
Net realized and unrealized gains (losses) on investments | 0.01 | (0.62 ) | (0.77 ) | 0.68 | 0.57 | 0.12 |
Total from investment operations | 0.28 | (0.28 ) | (0.57 ) | 0.87 | 0.78 | 0.27 |
Distributions to shareholders from | ||||||
Net investment income | (0.29 ) | (0.34 ) | (0.29 ) | (0.18 ) | (0.19 ) | (0.22 ) |
Net realized gains | 0.00 | (0.08 ) | (0.47 ) | (0.58 ) | 0.00 | (0.40 ) |
Total distributions to shareholders | (0.29 ) | (0.42 ) | (0.76 ) | (0.76 ) | (0.19 ) | (0.62 ) |
Net asset value, end of period | $8.46 | $8.47 | $9.17 | $10.50 | $10.39 | $9.80 |
Total return4 | 3.33 % | (2.99 )% | (5.93 )% | 8.51 % | 8.07 % | 2.95 % |
Ratios to average net assets (annualized) | ||||||
Gross expenses* | 0.53 % | 0.51 % | 0.48 % | 0.47 % | 0.47 % | 0.46 % |
Net expenses* | 0.42 % | 0.42 % | 0.42 % | 0.42 % | 0.42 % | 0.42 % |
Net investment income | 3.53 % | 3.98 % | 1.98 % | 1.33 % | 1.96 % | 1.61 % |
Supplemental data | ||||||
Portfolio turnover rate5 | 143 % | 148 % | 225 % | 206 % | 197 % | 183 % |
Net assets, end of period (000s omitted) | $4,192 | $5,571 | $5,876 | $1,139 | $710 | $434 |
* | Including net expenses allocated from the affiliated Master Portfolios, the expense ratios would be increased by the following amounts: |
Year ended April 30, 20241 | 0.13% |
Year ended May 31, 2023 | 0.14% |
Year ended May 31, 2022 | 0.16% |
Year ended May 31, 2021 | 0.16% |
Year ended May 31, 2020 | 0.15% |
Year ended May 31, 20192 | 0.16% |
1 | For the eleven months ended April 30, 2024. The Fund changed its fiscal year end from May 31 to April 30, effective April 30, 2024. |
2 | For the period from July 31, 2018 (commencement of class operations) to May 31, 2019 |
3 | Calculated based upon average shares outstanding |
4 | Returns for periods of less than one year are not annualized. |
5 | Portfolio turnover rate is calculated by multiplying the Fund’s ownership percentage in the respective affiliated Master Portfolio by the corresponding affiliated Master Portfolio’s purchases and sales. These purchases and sales amounts are aggregated with the direct purchases and sales in the Underlying Funds and included in the portfolio turnover calculation. |
Year ended April 30 20241 | Year ended May 31 | |||||
Class A | 2023 | 2022 | 2021 | 2020 | 2019 | |
Net asset value, beginning of period | $10.51 | $11.63 | $13.92 | $12.64 | $11.64 | $13.27 |
Net investment income | 0.25 2 | 0.36 2 | 0.32 | 0.14 | 0.15 | 0.18 2 |
Net realized and unrealized gains (losses) on investments | 0.85 | (0.71 ) | (0.95 ) | 2.59 | 1.07 | (0.14 ) |
Total from investment operations | 1.10 | (0.35 ) | (0.63 ) | 2.73 | 1.22 | 0.04 |
Distributions to shareholders from | ||||||
Net investment income | (0.06 ) | (0.44 ) | (0.32 ) | (0.15 ) | (0.21 ) | (0.23 ) |
Net realized gains | 0.00 | (0.33 ) | (1.34 ) | (1.30 ) | (0.01 ) | (1.44 ) |
Total distributions to shareholders | (0.06 ) | (0.77 ) | (1.66 ) | (1.45 ) | (0.22 ) | (1.67 ) |
Net asset value, end of period | $11.55 | $10.51 | $11.63 | $13.92 | $12.64 | $11.64 |
Total return3 | 10.49 % | (2.76 )% | (5.66 )% | 22.56 % | 10.49 % | 1.02 % |
Ratios to average net assets (annualized) | ||||||
Gross expenses* | 0.76 % | 0.76 % | 0.74 % | 0.75 % | 0.76 % | 0.76 % |
Net expenses* | 0.72 % | 0.75 % | 0.74 % | 0.75 % | 0.75 % | 0.75 % |
Net investment income | 2.36 % | 3.38 % | 2.49 % | 0.96 % | 1.31 % | 1.51 % |
Supplemental data | ||||||
Portfolio turnover rate4 | 78 % | 65 % | 89 % | 120 % | 131 % | 126 % |
Net assets, end of period (000s omitted) | $155,362 | $44,966 | $46,650 | $56,004 | $46,133 | $46,380 |
* | Including net expenses allocated from the affiliated Master Portfolios, the expense ratios would be increased by the following amounts: |
Year ended April 30, 20241 | 0.13% |
Year ended May 31, 2023 | 0.14% |
Year ended May 31, 2022 | 0.14% |
Year ended May 31, 2021 | 0.15% |
Year ended May 31, 2020 | 0.16% |
Year ended May 31, 2019 | 0.17% |
1 | For the eleven months ended April 30, 2024. The Fund changed its fiscal year end from May 31 to April 30, effective April 30, 2024. |
2 | Calculated based upon average shares outstanding |
3 | Total return calculations do not include any sales charges. Returns for periods of less than one year are not annualized. |
4 | Portfolio turnover rate is calculated by multiplying the Fund’s ownership percentage in the respective affiliated Master Portfolio by the corresponding affiliated Master Portfolio’s purchases and sales. These purchases and sales amounts are aggregated with the direct purchases and sales in the Underlying Funds and included in the portfolio turnover calculation. |
Year ended April 30 20241 | Year ended May 31 | |||||
Class C | 2023 | 2022 | 2021 | 2020 | 2019 | |
Net asset value, beginning of period | $10.80 | $11.91 | $14.22 | $12.87 | $11.85 | $13.40 |
Net investment income | 0.18 2 | 0.29 2 | 0.24 2 | 0.03 | 0.08 | 0.11 |
Net realized and unrealized gains (losses) on investments | 0.87 | (0.72 ) | (1.00 ) | 2.66 | 1.06 | (0.14 ) |
Total from investment operations | 1.05 | (0.43 ) | (0.76 ) | 2.69 | 1.14 | (0.03 ) |
Distributions to shareholders from | ||||||
Net investment income | (0.02 ) | (0.35 ) | (0.21 ) | (0.04 ) | (0.11 ) | (0.08 ) |
Net realized gains | 0.00 | (0.33 ) | (1.34 ) | (1.30 ) | (0.01 ) | (1.44 ) |
Total distributions to shareholders | (0.02 ) | (0.68 ) | (1.55 ) | (1.34 ) | (0.12 ) | (1.52 ) |
Net asset value, end of period | $11.83 | $10.80 | $11.91 | $14.22 | $12.87 | $11.85 |
Total return3 | 9.74 % | (3.46 )% | (6.39 )% | 21.79 % | 9.58 % | 0.31 % |
Ratios to average net assets (annualized) | ||||||
Gross expenses* | 1.50 % | 1.51 % | 1.49 % | 1.50 % | 1.51 % | 1.50 % |
Net expenses* | 1.49 % | 1.50 % | 1.49 % | 1.50 % | 1.50 % | 1.50 % |
Net investment income | 1.78 % | 2.66 % | 1.76 % | 0.21 % | 0.57 % | 0.84 % |
Supplemental data | ||||||
Portfolio turnover rate4 | 78 % | 65 % | 89 % | 120 % | 131 % | 126 % |
Net assets, end of period (000s omitted) | $228,122 | $326,438 | $402,753 | $499,835 | $477,998 | $539,352 |
* | Including net expenses allocated from the affiliated Master Portfolios, the expense ratios would be increased by the following amounts: |
Year ended April 30, 20241 | 0.13% |
Year ended May 31, 2023 | 0.14% |
Year ended May 31, 2022 | 0.14% |
Year ended May 31, 2021 | 0.15% |
Year ended May 31, 2020 | 0.16% |
Year ended May 31, 2019 | 0.17% |
1 | For the eleven months ended April 30, 2024. The Fund changed its fiscal year end from May 31 to April 30, effective April 30, 2024. |
2 | Calculated based upon average shares outstanding |
3 | Total return calculations do not include any sales charges. Returns for periods of less than one year are not annualized. |
4 | Portfolio turnover rate is calculated by multiplying the Fund’s ownership percentage in the respective affiliated Master Portfolio by the corresponding affiliated Master Portfolio’s purchases and sales. These purchases and sales amounts are aggregated with the direct purchases and sales in the Underlying Funds and included in the portfolio turnover calculation. |
Year ended April 30 20241 | Year ended May 31 | |||||
Institutional Class | 2023 | 2022 | 2021 | 2020 | 20192 | |
Net asset value, beginning of period | $10.51 | $11.63 | $13.93 | $12.64 | $11.65 | $13.52 |
Net investment income | 0.28 3 | 0.40 3 | 0.31 3 | 0.23 | 0.25 | 0.15 |
Net realized and unrealized gains (losses) on investments | 0.86 | (0.71 ) | (0.90 ) | 2.55 | 1.01 | (0.33 ) |
Total from investment operations | 1.14 | (0.31 ) | (0.59 ) | 2.78 | 1.26 | (0.18 ) |
Distributions to shareholders from | ||||||
Net investment income | (0.08 ) | (0.48 ) | (0.37 ) | (0.19 ) | (0.26 ) | (0.25 ) |
Net realized gains | 0.00 | (0.33 ) | (1.34 ) | (1.30 ) | (0.01 ) | (1.44 ) |
Total distributions to shareholders | (0.08 ) | (0.81 ) | (1.71 ) | (1.49 ) | (0.27 ) | (1.69 ) |
Net asset value, end of period | $11.57 | $10.51 | $11.63 | $13.93 | $12.64 | $11.65 |
Total return4 | 10.83 % | (2.40 )% | (5.40 )% | 22.99 % | 10.78 % | (0.62 )% |
Ratios to average net assets (annualized) | ||||||
Gross expenses* | 0.45 % | 0.43 % | 0.41 % | 0.42 % | 0.43 % | 0.43 % |
Net expenses* | 0.38 % | 0.42 % | 0.41 % | 0.42 % | 0.42 % | 0.42 % |
Net investment income | 2.49 % | 3.73 % | 2.38 % | 1.32 % | 1.63 % | 1.38 % |
Supplemental data | ||||||
Portfolio turnover rate5 | 78 % | 65 % | 89 % | 120 % | 131 % | 126 % |
Net assets, end of period (000s omitted) | $62,077 | $6,715 | $7,369 | $3,443 | $1,945 | $1,067 |
* | Including net expenses allocated from the affiliated Master Portfolios, the expense ratios would be increased by the following amounts: |
Year ended April 30, 20241 | 0.13% |
Year ended May 31, 2023 | 0.14% |
Year ended May 31, 2022 | 0.14% |
Year ended May 31, 2021 | 0.15% |
Year ended May 31, 2020 | 0.16% |
Year ended May 31, 20192 | 0.16% |
1 | For the eleven months ended April 30, 2024. The Fund changed its fiscal year end from May 31 to April 30, effective April 30, 2024. |
2 | For the period from July 31, 2018 (commencement of class operations) to May 31, 2019 |
3 | Calculated based upon average shares outstanding |
4 | Returns for periods of less than one year are not annualized. |
5 | Portfolio turnover rate is calculated by multiplying the Fund’s ownership percentage in the respective affiliated Master Portfolio by the corresponding affiliated Master Portfolio’s purchases and sales. These purchases and sales amounts are aggregated with the direct purchases and sales in the Underlying Funds and included in the portfolio turnover calculation. |
Net investment income | Net realized gains | |
Spectrum Aggressive Growth Fund | Annually | Annually |
Spectrum Conservative Growth Fund | Quarterly | Annually |
Spectrum Growth Fund | Annually | Annually |
Spectrum Income Allocation Fund | Monthly | Annually |
Spectrum Moderate Growth Fund | Annually | Annually |
Tax cost | Gross unrealized gains | Gross unrealized losses | Net unrealized gains (losses) | |
Spectrum Aggressive Growth Fund | $396,462,935 | $99,688,005 | $(22,527,697 ) | $77,160,308 |
Spectrum Conservative Growth Fund | 227,622,171 | 10,015,605 | (12,294,229 ) | (2,278,624 ) |
Spectrum Growth Fund | 191,765,305 | 20,283,638 | (7,510,576 ) | 12,773,062 |
Spectrum Income Allocation Fund | 118,967,532 | 2,249,458 | (9,119,540 ) | (6,870,082 ) |
Spectrum Moderate Growth Fund | 421,854,904 | 32,653,224 | (13,149,127 ) | 19,504,097 |
Paid-in capital | Total distributable earnings | |
Spectrum Aggressive Growth Fund | $(5,929,717 ) | $5,929,717 |
Spectrum Conservative Growth Fund | (1,232,929 ) | 1,232,929 |
Spectrum Growth Fund | (1,956,950 ) | 1,956,950 |
Spectrum Income Allocation Fund | (249,548 ) | 249,548 |
Spectrum Moderate Growth Fund | (2,970,978 ) | 2,970,978 |
NO EXPIRATION | ||
Short-term | Long-term | |
Spectrum Conservative Growth Fund | $11,122,857 | $966,413 |
Spectrum Income Allocation Fund | 8,168,828 | 8,313,583 |
Spectrum Moderate Growth Fund | 2,000,256 | 0 |
Spectrum Aggressive Growth Fund | Quoted prices (Level 1) | Other significant observable inputs (Level 2) | Significant unobservable inputs (Level 3) | Total |
Assets | ||||
Investments in: | ||||
Investment companies | $264,833,477 | $0 | $0 | $264,833,477 |
Short-term investments | ||||
Investment companies | 300,000 | 0 | 0 | 300,000 |
Investments measured at net asset value* | 207,964,904 | |||
265,133,477 | 0 | 0 | 473,098,381 | |
Futures contracts | 1,609,902 | 0 | 0 | 1,609,902 |
Total assets | $266,743,379 | $0 | $0 | $474,708,283 |
Liabilities | ||||
Futures contracts | $1,085,040 | $0 | $0 | $1,085,040 |
Total liabilities | $1,085,040 | $0 | $0 | $1,085,040 |
* | Investments that are measured at fair value using the net asset value per share (or its equivalent) as a practical expedient have not been categorized in the fair value hierarchy. The fair value amount presented in the table is intended to permit reconciliation of the fair value hierarchy to the amounts presented in the Statements of Assets and Liabilities. The Fund’s investments in the affiliated Master Portfolios are valued at $207,964,904. Each affiliated Master Portfolio does not have a redemption period notice, can be redeemed daily and does not have any unfunded commitments. |
Spectrum Conservative Growth Fund | Quoted prices (Level 1) | Other significant observable inputs (Level 2) | Significant unobservable inputs (Level 3) | Total |
Assets | ||||
Investments in: | ||||
Investment companies | $144,903,352 | $0 | $0 | $144,903,352 |
Short-term investments | ||||
Investment companies | 200,000 | 0 | 0 | 200,000 |
Investments measured at net asset value* | 80,152,826 | |||
145,103,352 | 0 | 0 | 225,256,178 | |
Futures contracts | 995,130 | 0 | 0 | 995,130 |
Total assets | $146,098,482 | $0 | $0 | $226,251,308 |
Liabilities | ||||
Futures contracts | $907,761 | $0 | $0 | $907,761 |
Total liabilities | $907,761 | $0 | $0 | $907,761 |
* | Investments that are measured at fair value using the net asset value per share (or its equivalent) as a practical expedient have not been categorized in the fair value hierarchy. The fair value amount presented in the table is intended to permit reconciliation of the fair value hierarchy to the amounts presented in the Statements of Assets and Liabilities. The Fund’s investments in the affiliated Master Portfolios are valued at $80,152,826. Each affiliated Master Portfolio does not have a redemption period notice, can be redeemed daily and does not have any unfunded commitments. |
Spectrum Growth Fund | Quoted prices (Level 1) | Other significant observable inputs (Level 2) | Significant unobservable inputs (Level 3) | Total |
Assets | ||||
Investments in: | ||||
Investment companies | $121,835,166 | $0 | $0 | $121,835,166 |
Short-term investments | ||||
Investment companies | 200,000 | 0 | 0 | 200,000 |
Investments measured at net asset value* | 82,428,797 | |||
122,035,166 | 0 | 0 | 204,463,963 | |
Futures contracts | 868,889 | 0 | 0 | 868,889 |
Total assets | $122,904,055 | $0 | $0 | $205,332,852 |
Liabilities | ||||
Futures contracts | $794,485 | $0 | $0 | $794,485 |
Total liabilities | $794,485 | $0 | $0 | $794,485 |
* | Investments that are measured at fair value using the net asset value per share (or its equivalent) as a practical expedient have not been categorized in the fair value hierarchy. The fair value amount presented in the table is intended to permit reconciliation of the fair value hierarchy to the amounts presented in the Statements of Assets and Liabilities. The Fund’s investments in the affiliated Master Portfolios are valued at $82,428,797. Each affiliated Master Portfolio does not have a redemption period notice, can be redeemed daily and does not have any unfunded commitments. |
Spectrum Income Allocation Fund | Quoted prices (Level 1) | Other significant observable inputs (Level 2) | Significant unobservable inputs (Level 3) | Total |
Assets | ||||
Investments in: | ||||
Investment companies | $68,855,148 | $0 | $0 | $68,855,148 |
Short-term investments | ||||
Investment companies | 200,000 | 0 | 0 | 200,000 |
Investments measured at net asset value* | 42,982,671 | |||
69,055,148 | 0 | 0 | 112,037,819 | |
Futures contracts | 504,704 | 0 | 0 | 504,704 |
Total assets | $69,559,852 | $0 | $0 | $112,542,523 |
Liabilities | ||||
Futures contracts | $445,073 | $0 | $0 | $445,073 |
Total liabilities | $445,073 | $0 | $0 | $445,073 |
* | Investments that are measured at fair value using the net asset value per share (or its equivalent) as a practical expedient have not been categorized in the fair value hierarchy. The fair value amount presented in the table is intended to permit reconciliation of the fair value hierarchy to the amounts presented in the Statements of Assets and Liabilities. The Fund’s investments in the affiliated Master Portfolios are valued at $42,982,671. Each affiliated Master Portfolio does not have a redemption period notice, can be redeemed daily and does not have any unfunded commitments. |
Spectrum Moderate Growth Fund | Quoted prices (Level 1) | Other significant observable inputs (Level 2) | Significant unobservable inputs (Level 3) | Total |
Assets | ||||
Investments in: | ||||
Investment companies | $275,857,423 | $0 | $0 | $275,857,423 |
Short-term investments | ||||
Investment companies | 300,000 | 0 | 0 | 300,000 |
Investments measured at net asset value* | 165,014,746 | |||
276,157,423 | 0 | 0 | 441,172,169 | |
Futures contracts | 1,963,291 | 0 | 0 | 1,963,291 |
Total assets | $278,120,714 | $0 | $0 | $443,135,460 |
Liabilities | ||||
Futures contracts | $1,776,459 | $0 | $0 | $1,776,459 |
Total liabilities | $1,776,459 | $0 | $0 | $1,776,459 |
* | Investments that are measured at fair value using the net asset value per share (or its equivalent) as a practical expedient have not been categorized in the fair value hierarchy. The fair value amount presented in the table is intended to permit reconciliation of the fair value hierarchy to the amounts presented in the Statements of Assets and Liabilities. The Fund’s investments in the affiliated Master Portfolios are valued at $165,014,746. Each affiliated Master Portfolio does not have a redemption period notice, can be redeemed daily and does not have any unfunded commitments. |
Affiliated Master Portfolio | Investment objective |
Allspring Bloomberg US Aggregate ex- Corporate* | Seeks to replicate the total return of the Bloomberg U.S. Aggregate ex-Corporate Index, before fees and expenses |
Allspring Core Bond Portfolio | Seeks total return, consisting of income and capital appreciation |
Allspring Disciplined International Developed Markets Portfolio | Seeks long-term capital appreciation |
Allspring Disciplined Large Cap Portfolio | Seeks long-term capital appreciation |
Allspring Emerging Growth Portfolio | Seeks long-term capital appreciation |
Allspring Factor Enhanced Emerging Markets Equity Portfolio* | Seeks long-term capital appreciation |
Allspring Factor Enhanced International Equity Portfolio* | Seeks long-term capital appreciation |
Allspring Factor Enhanced U.S. Large Cap Equity Portfolio* | Seeks long-term capital appreciation |
Allspring Factor Enhanced U.S. Small Cap Equity Portfolio* | Seeks long-term capital appreciation |
Allspring Real Return Portfolio | Seeks returns that exceed the rate of inflation over the long-term |
Allspring Small Company Value Portfolio | Seeks long-term capital appreciation |
Average daily net assets | Management fee |
First $1 billion | 0.250 % |
Next $4 billion | 0.225 |
Next $5 billion | 0.190 |
Over $10 billion | 0.180 |
Class-level administration fee | |
Class A | 0.20 % |
Class C | 0.20 |
Administrator Class | 0.13 |
Institutional Class | 0.13 |
EXPENSE RATIO CAPS | |
Class A | 0.74 % |
Class C | 1.49 |
Administrator Class | 0.67 |
Institutional Class | 0.42 |
EXPENSE RATIO CAPS | Prior to February 26, 2024 | |
Class A | 0.71 % | 0.74 % |
Class C | 1.46 | 1.49 |
Institutional Class | 0.39 | 0.42 |
Front end sales-charges | Contingent Deferred Sales Charges | ||
Class A | Class A | Class C | |
Spectrum Aggressive Growth Fund | $6,139 | $36 | $25 |
Spectrum Conservative Growth Fund | 791 | 0 | 17 |
Spectrum Growth Fund | 2,557 | 0 | 46 |
Spectrum Income Allocation Fund | 727 | 0 | 0 |
Spectrum Moderate Growth Fund | 2,353 | 0 | 19 |
Purchases at cost | Sales proceeds | |||
U.S. government | Non-U.S. government | U.S. government | Non-U.S. government | |
Spectrum Aggressive Growth Fund | $0 | $273,363,605 | $0 | $324,689,414 |
Spectrum Conservative Growth Fund | 90,986,259 | 127,368,910 | 97,400,835 | 163,239,256 |
Spectrum Growth Fund | 24,115,510 | 117,436,040 | 32,192,068 | 140,211,237 |
Spectrum Income Allocation Fund | 95,352,886 | 72,798,696 | 95,922,928 | 90,077,488 |
Spectrum Moderate Growth Fund | 72,341,091 | 210,323,477 | 85,698,843 | 255,573,098 |
Purchases at cost | Sales proceeds | |||
U.S. government | Non-U.S. government | U.S. government | Non-U.S. government | |
Spectrum Aggressive Growth Fund | $0 | $170,899,334 | $0 | $234,826,554 |
Spectrum Conservative Growth Fund | 121,202,496 | 131,560,528 | 137,660,602 | 141,147,334 |
Spectrum Growth Fund | 29,178,817 | 92,950,360 | 32,431,289 | 112,293,898 |
Spectrum Income Allocation Fund | 129,235,858 | 94,740,708 | 145,903,702 | 97,788,262 |
Spectrum Moderate Growth Fund | 84,528,471 | 173,230,571 | 95,325,124 | 206,075,252 |
Long contracts | Short contracts | |
Spectrum Aggressive Growth Fund | $61,218,672 | $50,875,792 |
Spectrum Conservative Growth Fund | 56,628,739 | 50,187,043 |
Spectrum Growth Fund | 48,791,921 | 41,469,902 |
Spectrum Income Allocation Fund | 28,805,015 | 26,692,063 |
Spectrum Moderate Growth Fund | 90,831,292 | 77,583,217 |
Equity risk | Foreign currency risk | Total | |
Asset derivatives | |||
Futures contracts | $334,739 * | $1,275,163 * | $1,609,902 |
Liability derivatives | |||
Futures contracts | $744,922 * | $340,118 * | $1,085,040 |
* | Amount represents the cumulative unrealized gains (losses) as reported in the table following the Portfolio of Investments. For futures contracts, only the current day’s variation margin as of April 30, 2024 is reported separately on the Statements of Assets and Liabilities. |
Equity risk | Foreign currency risk | TOTAL | |
Net realized gains (losses) on derivatives | |||
Futures contracts | $(1,818,803 ) | $(2,200,213 ) | $(4,019,016 ) |
Net change in unrealized gains (losses) on derivatives | |||
Futures contracts | $(998,736 ) | $1,660,769 | $662,033 |
Equity risk | Foreign currency risk | Total | |
Net realized gains (losses) on derivatives | |||
Futures contracts | $(1,295,265 ) | $(1,968,706 ) | $(3,263,971 ) |
Net change in unrealized gains (losses) on derivatives | |||
Futures contracts | $579,641 | $(854,269 ) | $(274,628 ) |
Interest rate risk | Equity risk | Foreign currency risk | Total | |
Asset derivatives | ||||
Futures contracts | $114,982 * | $223,483 * | $656,665 * | $995,130 |
Liability derivatives | ||||
Futures contracts | $159,606 * | $568,548 * | $179,607 * | $907,761 |
* | Amount represents the cumulative unrealized gains (losses) as reported in the table following the Portfolio of Investments. For futures contracts, only the current day’s variation margin as of April 30, 2024 is reported separately on the Statements of Assets and Liabilities. |
INTEREST RATE RISK | Equity risk | Foreign currency risk | TOTAL | |
Net realized gains (losses) on derivatives | ||||
Futures contracts | $520,070 | $1,574,696 | $(1,243,088 ) | $851,678 |
Net change in unrealized gains (losses) on derivatives | ||||
Futures contracts | $(53,693 ) | $(1,918,699 ) | $889,939 | $(1,082,453 ) |
Interest rate risk | Equity risk | Foreign currency risk | Total | |
Net realized gains (losses) on derivatives | ||||
Futures contracts | $(933,608 ) | $(1,513,752 ) | $(1,204,484 ) | $(3,651,844 ) |
Net change in unrealized gains (losses) on derivatives | ||||
Futures contracts | $(1,772 ) | $1,966,738 | $(490,676 ) | $1,474,290 |
Interest rate risk | Equity risk | Foreign currency risk | Total | |
Asset derivatives | ||||
Futures contracts | $105,131 * | $199,203 * | $564,555 * | $868,889 |
Liability derivatives | ||||
Futures contracts | $138,619 * | $503,043 * | $152,823 * | $794,485 |
* | Amount represents the cumulative unrealized gains (losses) as reported in the table following the Portfolio of Investments. For futures contracts, only the current day’s variation margin as of April 30, 2024 is reported separately on the Statements of Assets and Liabilities. |
INTEREST RATE RISK | Equity risk | Foreign currency risk | TOTAL | |
Net realized gains (losses) on derivatives | ||||
Futures contracts | $366,285 | $1,382,144 | $(1,018,987 ) | $729,442 |
Net change in unrealized gains (losses) on derivatives | ||||
Futures contracts | $(40,352 ) | $(1,626,773 ) | $747,993 | $(919,132 ) |
Interest rate risk | Equity risk | Foreign currency risk | Total | |
Net realized gains (losses) on derivatives | ||||
Futures contracts | $(334,356 ) | $(1,557,953 ) | $(934,183 ) | $(2,826,492 ) |
Net change in unrealized gains (losses) on derivatives | ||||
Futures contracts | $127 | $1,741,433 | $(399,461 ) | $1,342,099 |
Interest rate risk | Equity risk | Foreign currency risk | Total | |
Asset derivatives | ||||
Futures contracts | $57,491 * | $111,559 * | $335,654 * | $504,704 |
Liability derivatives | ||||
Futures contracts | $78,631 * | $274,999 * | $91,443 * | $445,073 |
* | Amount represents the cumulative unrealized gains (losses) as reported in the table following the Portfolio of Investments. For futures contracts, only the current day’s variation margin as of April 30, 2024 is reported separately on the Statements of Assets and Liabilities. |
INTEREST RATE RISK | Equity risk | Foreign currency risk | TOTAL | |
Net realized gains (losses) on derivatives | ||||
Futures contracts | $295,453 | $620,865 | $(654,070 ) | $262,248 |
Net change in unrealized gains (losses) on derivatives | ||||
Futures contracts | $(25,092 ) | $(991,918 ) | $463,505 | $(553,505 ) |
Interest rate risk | Equity risk | Foreign currency risk | Total | |
Net realized gains (losses) on derivatives | ||||
Futures contracts | $70,014 | $(715,868 ) | $(656,667 ) | $(1,302,521 ) |
Net change in unrealized gains (losses) on derivatives | ||||
Futures contracts | $(1,390 ) | $967,864 | $(267,174 ) | $699,300 |
Interest rate risk | Equity risk | Foreign currency risk | Total | |
Asset derivatives | ||||
Futures contracts | $249,355 * | $437,023 * | $1,276,913 * | $1,963,291 |
Liability derivatives | ||||
Futures contracts | $318,161 * | $1,109,103 * | $349,195 * | $1,776,459 |
* | Amount represents the cumulative unrealized gains (losses) as reported in the table following the Portfolio of Investments. For futures contracts, only the current day’s variation margin as of April 30, 2024 is reported separately on the Statements of Assets and Liabilities. |
INTEREST RATE RISK | Equity risk | Foreign currency risk | TOTAL | |
Net realized gains (losses) on derivatives | ||||
Futures contracts | $531,154 | $2,261,994 | $(1,838,236 ) | $954,912 |
Net change in unrealized gains (losses) on derivatives | ||||
Futures contracts | $(80,677 ) | $(2,953,331 ) | $1,539,686 | $(1,494,322 ) |
Interest rate risk | Equity risk | Foreign currency risk | Total | |
Net realized gains (losses) on derivatives | ||||
Futures contracts | $(894,995 ) | $(2,664,963 ) | $(1,730,960 ) | $(5,290,918 ) |
Net change in unrealized gains (losses) on derivatives | ||||
Futures contracts | $(2,801 ) | $2,982,654 | $(728,786 ) | $2,251,067 |
Net investment income | $1,889,609 |
Net realized and unrealized gains (losses) on investments | (64,314,900 ) |
Net decrease in net assets resulting from operations | $(62,425,291 ) |
Net investment income | $8,657,753 |
Net realized and unrealized gains (losses) on investments | 30,639,196 |
Net increase in net assets resulting from operations | $39,296,949 |
Ordinary income | Long-term capital gain | Tax basis return of capital | |||||||
YEAR ENDED May 31 | YEAR ENDED May 31 | YEAR ENDED April 30, 2024 | YEAR ENDED May 31 | ||||||
YEAR ENDED April 30, 2024 | 2023 | 2022 | YEAR ENDED April 30, 2024 | 2023 | 2022 | 2023 | 2022 | ||
Spectrum Aggressive Growth Fund | $0 | $3,192,434 | $26,022,522 | $0 | $16,029,540 | $31,554,038 | $0 | $2,290,482 | $0 |
Spectrum Conservative Growth Fund | 5,920,831 | 9,254,849 | 20,737,292 | 0 | 6,564,534 | 13,166,727 | 0 | 0 | 0 |
Spectrum Growth Fund | 645,410 | 6,400,314 | 19,119,343 | 0 | 7,793,254 | 16,245,108 | 0 | 0 | 0 |
Spectrum Income Allocation Fund | 3,161,495 | 4,605,526 | 8,811,314 | 0 | 1,342,006 | 4,051,788 | 0 | 0 | 0 |
Spectrum Moderate Growth Fund | 879,978 | 13,035,610 | 29,731,201 | 0 | 11,887,941 | 28,939,078 | 0 | 0 | 0 |
Undistributed ordinary income | Undistributed long-term gain | Unrealized gains (losses) | Capital loss carryforward | |
Spectrum Aggressive Growth Fund | $2,350,628 | $29,502,796 | $77,160,308 | $0 |
Spectrum Conservative Growth Fund | 1,101,361 | 0 | (2,278,624 ) | (12,089,270 ) |
Spectrum Growth Fund | 3,214,329 | 4,921,919 | 12,773,062 | 0 |
Spectrum Income Allocation Fund | 558,228 | 0 | (6,870,082 ) | (16,482,411 ) |
Spectrum Moderate Growth Fund | 7,156,265 | 0 | 19,504,097 | (2,000,256 ) |
Allspring Funds Trust:

Dividends-received deduction | |
Spectrum Conservative Growth Fund | 8 % |
Spectrum Growth Fund | 21 |
Spectrum Income Allocation Fund | 3 |
Spectrum Moderate Growth Fund | 16 |
QDI | |
Spectrum Conservative Growth Fund | $769,893 |
Spectrum Growth Fund | 242,219 |
Spectrum Income Allocation Fund | 135,039 |
Spectrum Moderate Growth Fund | 256,493 |
Interest-related dividends | |
Spectrum Conservative Growth Fund | $1,577,297 |
Spectrum Growth Fund | 74,033 |
Spectrum Income Allocation Fund | 1,299,441 |
Spectrum Moderate Growth Fund | 107,220 |
% of U.S. government income | |
Spectrum Conservative Growth Fund | 27 % |
Spectrum Growth Fund | 17 |
Spectrum Income Allocation Fund | 31 |
Spectrum Moderate Growth Fund | 20 |
Name and year of birth | Position held and length of service** | Principal occupations during past five years or longer | Current other public company or investment company directorships |
William R. Ebsworth (Born 1957) | Trustee, since 2015 | Retired. From 1984 to 2013, equities analyst, portfolio manager, research director and chief investment officer at Fidelity Management and Research Company in Boston, Tokyo, and Hong Kong, and retired in 2013 as Chief Investment Officer of Fidelity Strategic Advisers, Inc. where he led a team of investment professionals managing client assets. Prior thereto, Board member of Hong Kong Securities Clearing Co., Hong Kong Options Clearing Corp., the Thailand International Fund, Ltd., Fidelity Investments Life Insurance Company, and Empire Fidelity Investments Life Insurance Company. Serves on the Investment Company Institute’s Board of Governors since 2022 and Executive Committee since 2023 as well as the Vice Chairman of the Governing Council of the Independent Directors Council since 2023. Audit Committee Chair and Investment Committee Chair of the Vincent Memorial Hospital Foundation (non-profit organization). Mr. Ebsworth is a CFA charterholder. | N/A |
Jane A. Freeman (Born 1953) | Trustee, since 2015; Chair Liaison, since January 2018*** | Retired. From 2012 to 2014 and 1999 to 2008, Chief Financial Officer of Scientific Learning Corporation. From 2008 to 2012, Ms. Freeman provided consulting services related to strategic business projects. Prior to 1999, Portfolio Manager at Rockefeller & Co. and Scudder, Stevens & Clark. Board member of the Harding Loevner Funds from 1996 to 2014, serving as both Lead Independent Director and chair of the Audit Committee. Board member of the Russell Exchange Traded Funds Trust from 2011 to 2012 and the chair of the Audit Committee. Ms. Freeman is also an inactive Chartered Financial Analyst. | N/A |
Isaiah Harris, Jr. (Born 1952) | Trustee, since 2009; Audit Committee Chair, since 2019 | Retired. Member of the Advisory Board of CEF of East Central Florida. Chairman of the Board of CIGNA Corporation from 2009 to 2021, and Director from 2005 to 2008. From 2003 to 2011, Director of Deluxe Corporation. Prior thereto, President and CEO of BellSouth Advertising and Publishing Corp. from 2005 to 2007, President and CEO of BellSouth Enterprises from 2004 to 2005 and President of BellSouth Consumer Services from 2000 to 2003. Emeritus member of the Iowa State University Foundation Board of Governors. Emeritus Member of the Advisory board of Iowa State University School of Business. Advisory Board Member, Palm Harbor Academy (private school). Advisory Board Member, Fellowship of Christian Athletes. Mr. Harris is a certified public accountant (inactive status). | N/A |
David F. Larcker (Born 1950) | Trustee, since 2009 | Distinguished Visiting Fellow at the Hoover Institution since 2022. James Irvin Miller Professor of Accounting at the Graduate School of Business (Emeritus), Stanford University, Director of the Corporate Governance Research Initiative and Senior Faculty of The Rock Center for Corporate Governance since 2006. From 2005 to 2008, Professor of Accounting at the Graduate School of Business, Stanford University. Prior thereto, Ernst & Young Professor of Accounting at The Wharton School, University of Pennsylvania from 1985 to 2005. | N/A |
Olivia S. Mitchell (Born 1953) | Trustee, since 2006 | International Foundation of Employee Benefit Plans Professor since 1993, Wharton School of the University of Pennsylvania. Director of Wharton’s Pension Research Council and Boettner Center on Pensions & Retirement Research, and Research Associate at the National Bureau of Economic Research. Previously taught at Cornell University from 1978 to 1993. | N/A |
Timothy J. Penny (Born 1951) | Trustee, since 1996; Chair, since 2018 | President and Chief Executive Officer of Southern Minnesota Initiative Foundation, a non-profit organization, since 2007. Vice Chair of the Economic Club of Minnesota, since 2007. Co-Chair of the Committee for a Responsible Federal Budget, since 1995. Member of the Board of Trustees of NorthStar Education Finance, Inc., a non-profit organization, from 2007-2022. Senior Fellow of the University of Minnesota Humphrey Institute from 1995 to 2017. | N/A |
Name and year of birth | Position held and length of service** | Principal occupations during past five years or longer | Current other public company or investment company directorships |
James G. Polisson (Born 1959) | Trustee, since 2018; Nominating and Governance Committee Chair, since 2024 | Retired. Chief Marketing Officer, Source (ETF) UK Services, Ltd, from 2015 to 2017. From 2012 to 2015, Principal of The Polisson Group, LLC, a management consulting, corporate advisory and principal investing company. Chief Executive Officer and Managing Director at Russell Investments, Global Exchange Traded Funds from 2010 to 2012. Managing Director of Barclays Global Investors from 1998 to 2010 and Global Chief Marketing Officer for iShares and Barclays Global Investors from 2000 to 2010. Trustee of the San Francisco Mechanics’ Institute, a non- profit organization, from 2013 to 2015. Board member of the Russell Exchange Traded Fund Trust from 2011 to 2012. Director of Barclays Global Investors Holdings Deutschland GmbH from 2006 to 2009. Mr. Polisson is an attorney and has a retired status with the Massachusetts and District of Columbia Bar Associations. | N/A |
Pamela Wheelock (Born 1959) | Trustee, since January 2020; previously Trustee from January 2018 to July 2019*** | Retired. Executive and Senior Financial leadership positions in the public, private and nonprofit sectors. Interim President and CEO, McKnight Foundation, 2020. Interim Commissioner, Minnesota Department of Human Services, 2019. Chief Operating Officer, Twin Cities Habitat for Humanity, 2017-2019. Vice President for University Services, University of Minnesota, 2012- 2016. Interim President and CEO, Blue Cross and Blue Shield of Minnesota, 2011-2012. Executive Vice-President and Chief Financial Officer, Minnesota Wild, 2002-2008. Commissioner, Minnesota Department of Finance, 1999-2002. Chair of the Board of Directors of Destination Medical Center Corporation. Board member of the Minnesota Wild Foundation. | N/A |
Name and year of birth | Position held and length of service | Principal occupations during past five years or longer |
Andrew Owen (Born 1960) | President, since 2017 | President and Chief Executive Officer of Allspring Funds Management, LLC since 2017 and Head of Global Fund Governance of Allspring Global Investments since 2022. Prior thereto, co-president of Galliard Capital Management, LLC, an affiliate of Allspring Funds Management, LLC, from 2019 to 2022 and Head of Affiliated Managers, Allspring Global Investments, from 2014 to 2019 and Executive Vice President responsible for marketing, investments and product development for Allspring Funds Management, LLC, from 2009 to 2014. |
Jeremy DePalma (Born 1974) | Treasurer, since 2012 (for certain funds in the Fund Complex); since 2021 (for the remaining funds in the Complex) | Senior Vice President of Allspring Funds Management, LLC since 2009. Senior Vice President of Evergreen Investment Management Company, LLC from 2008 to 2010 and head of the Fund Reporting and Control Team within Fund Administration from 2005 to 2010. |
Christopher Baker (Born 1976) | Chief Compliance Officer, since 2022 | Global Chief Compliance Officer for Allspring Global Investments since 2022. Prior thereto, Chief Compliance Officer for State Street Global Advisors from 2018 to 2021. Senior Compliance Officer for the State Street divisions of Alternative Investment Solutions, Sector Solutions, and Global Marketing from 2015 to 2018. From 2010 to 2015 Vice President, Global Head of Investment and Marketing Compliance for State Street Global Advisors. |
Matthew Prasse (Born 1983) | Chief Legal Officer, since 2022; Secretary, since 2021 | Senior Counsel of the Allspring Legal Department since 2021. Senior Counsel of the Wells Fargo Legal Department from 2018 to 2021. Previously, Counsel for Barings LLC from 2015 to 2018. Prior to joining Barings, Associate at Morgan, Lewis & Bockius LLP from 2008 to 2015. |
P.O. Box 219967
Kansas City, MO 64121-9967

AR4330 04-24
ITEM 2. CODE OF ETHICS
(a) As of the end of the period covered by the report, Allspring Funds Trust has adopted a code of ethics that applies to its President and Treasurer. A copy of the code of ethics is filed as an exhibit to this Form N-CSR.
(c) During the period covered by this report, there were no amendments to the provisions of the code of ethics adopted in Item 2(a) above.
(d) During the period covered by this report, there were no implicit or explicit waivers to the provisions of the code of ethics adopted in Item 2(a) above.
ITEM 3. AUDIT COMMITTEE FINANCIAL EXPERT
The Board of Trustees of Allspring Funds Trust has determined that Isaiah Harris is an audit committee financial expert, as defined in Item 3 of Form N-CSR. Mr. Harris is independent for purposes of Item 3 of Form N-CSR.
ITEM 4. PRINCIPAL ACCOUNTANT FEES AND SERVICES
(a), (b), (c), (d) The following table presents aggregate fees billed in each of the last two fiscal years for services rendered to the registrant by the registrant’s principal accountant. These fees were billed to the registrant and were approved by the registrant’s audit committee.
| Fiscal year ended April 30, 2024 | Fiscal year ended April 30, 2023 | |||||||
Audit fees | $ | 352,770 | $ | 346,690 | ||||
Audit-related fees | — | — | ||||||
Tax fees (1) | $ | 77,180 | $ | 72,370 | ||||
All other fees | — | — | ||||||
|
|
|
| |||||
| $ | 429,950 | $ | 419,060 | |||||
| (1) | Tax fees consist of fees for tax compliance, tax advice, tax planning and excise tax. |
(e)(1) The Chair of the Audit Committees is authorized to pre-approve: (1) audit services for the mutual funds of Allspring Funds Trust; (2) non-audit tax or compliance consulting or training services provided to the Funds by the independent auditors (“Auditors”) if the fees for any particular engagement are not anticipated to exceed $50,000; and (3) non-audit tax or compliance consulting or training services provided by the Auditors to a Fund’s investment adviser and its controlling entities (where pre-approval is required because the engagement relates directly to the operations and financial reporting of the Fund) if the fee to the Auditors for any particular engagement is not anticipated to exceed $50,000. For any such pre-approval sought from the Chair, Management shall prepare a brief description of the proposed services.
If the Chair approves of such service, he or she shall sign the statement prepared by Management. Such written statement shall be presented to the full Committees at their next regularly scheduled meetings.
(e)(2) Not applicable.
(f) Not applicable.
(g) Not applicable.
(h) Not applicable.
(i) Not applicable.
(j) Not applicable.
ITEM 5. AUDIT COMMITTEE OF LISTED REGISTRANTS
Not applicable.
ITEM 6. INVESTMENTS
A Portfolio of Investments for the series of Allspring Funds Trust is included as part of the report to shareholders filed under Item 1 of this Form.
ITEM 7. DISCLOSURE OF PROXY VOTING POLICIES AND PROCEDURES FOR CLOSED-END MANAGEMENT INVESTMENT COMPANIES
Not applicable.
ITEM 8. PORTFOLIO MANAGERS OF CLOSED-END MANAGEMENT INVESTMENT COMPANIES
Not applicable.
ITEM 9. PURCHASES OF EQUITY SECURITIES BY CLOSED-END MANAGEMENT INVESTMENT COMPANY AND AFFILIATED PURCHASERS
Not applicable.
ITEM 10. SUBMISSION OF MATTERS TO A VOTE OF SECURITY HOLDERS
There have been no material changes to the procedures by which shareholders may recommend nominees to the registrant’s Board of Trustees that have been implemented since the registrant’s last provided disclosure in response to the requirements of this Item.
ITEM 11. CONTROLS AND PROCEDURES
(a) The President and Treasurer have concluded that the Allspring Funds Trust disclosure controls and procedures (as defined in Rule 30a-3(c) under the Investment Company Act of 1940) provide reasonable assurances that material information relating to the registrant is made known to them by the appropriate persons based on their evaluation of these controls and procedures as of a date within 90 days of the filing of this report.
(b) There were no significant changes in the registrant’s internal control over financial reporting (as defined in Rule 30a-3(d) under the Investment Company Act of 1940) that occurred during the period covered by this report that materially affected, or is reasonably likely to materially affect, the registrant’s internal control over financial reporting.
ITEM 12. DISCLOSURES OF SECURITIES LENDING ACTIVITES FOR CLOSED-END MANAGEMENT INVESTMENT COMPANIES
Not applicable.
ITEM 13. EXHIBITS
(a)(1) Code of Ethics.
(a)(2) Certifications pursuant to Section 302 of the Sarbanes-Oxley Act of 2002.
(a)(3) Not applicable.
(a)(4) Not applicable.
(b) Certifications pursuant to Section 906 of the Sarbanes-Oxley Act of 2002.
SIGNATURES
Pursuant to the requirements of the Securities Exchange Act of 1934 and the Investment Company Act of 1940, the registrant has duly caused this report to be signed on its behalf by the undersigned, thereunto duly authorized.
| Allspring Funds Trust | ||
| By: | /s/ Andrew Owen | |
| Andrew Owen | ||
| President | ||
| Date: June 26, 2024 | ||
Pursuant to the requirements of the Securities Exchange Act of 1934 and the Investment Company Act of 1940, this report has been signed below by the following persons on behalf of the registrant and in the capacities and on the date indicated.
| Allspring Funds Trust | ||
| By: | /s/ Andrew Owen | |
| Andrew Owen | ||
| President | ||
| Date: June 26, 2024 | ||
| By: | /s/ Jeremy DePalma | |
| Jeremy DePalma | ||
| Treasurer | ||
| Date: June 26, 2024 | ||