Table of Contents

UNITED STATES
SECURITIES AND EXCHANGE COMMISSION
Washington, D.C. 20549
FORM N-CSRS
CERTIFIED SHAREHOLDER REPORT OF REGISTERED
MANAGEMENT INVESTMENT COMPANIES
Investment Company Act file number: 811-09255
Wells Fargo Variable Trust
(Exact name of registrant as specified in charter)
525 Market St., San Francisco, CA 94105
(Address of principal executive offices) (Zip code)
C. David Messman
Wells Fargo Funds Management, LLC
525 Market St., San Francisco, CA 94105
(Name and address of agent for service)
Registrant’s telephone number, including area code: 800-222-8222
Date of fiscal year end: December 31, 2011
Date of reporting period: June 30, 2012
Table of Contents
| ITEM 1. | REPORT TO SHAREHOLDERS |
Table of Contents

Wells Fargo Advantage VT Discovery FundSM

Semi-Annual Report
June 30, 2012

Table of Contents
Reduce clutter. Save trees.
Sign up for electronic delivery of prospectuses and shareholder reports at wellsfargo.com/advantagedelivery
| 2 | ||||
| 4 | ||||
| 6 | ||||
| 7 | ||||
Financial Statements | ||||
| 12 | ||||
| 13 | ||||
| 14 | ||||
| 15 | ||||
| 16 | ||||
| 20 | ||||
| 26 | ||||
The views expressed and any forward-looking statements are as of June 30, 2012, unless otherwise noted, and are those of the Fund managers and/or Wells Fargo Funds Management, LLC. Discussions of individual securities, or the markets generally, or any Wells Fargo Advantage Fund are not intended as individual recommendations. Future events or results may vary significantly from those expressed in any forward-looking statements; the views expressed are subject to change at any time in response to changing circumstances in the market. Wells Fargo Funds Management, LLC, disclaims any obligation to publicly update or revise any views expressed or forward-looking statements.
NOT FDIC INSURED ¡ NO BANK GUARANTEE ¡ MAY LOSE VALUE
Table of Contents

WELLS FARGO INVESTMENT HISTORY
| 1932 | Keystone creates one of the first mutual fund families. | |
| 1971 | Wells Fargo & Company introduces one of the first institutional index funds. | |
| 1978 | Wells Fargo applies Markowitz and Sharpe’s research on Modern Portfolio Theory to introduce one of the industry’s first Tactical Asset Allocation (TAA) models in institutional separately managed accounts. | |
| 1984 | Wells Fargo Stagecoach Funds launches its first asset allocation fund. | |
| 1989 | The Tactical Asset Allocation (TAA) Model is first applied to Wells Fargo’s asset allocation mutual funds. | |
| 1994 | Wells Fargo introduces the LifePath Funds, one of the first suites of target date funds (now the Wells Fargo Advantage Dow Jones Target Date FundsSM). | |
| 1996 | Evergreen Investments and Keystone Funds merge. | |
| 1997 | Wells Fargo launches Wells Fargo Advantage WealthBuilder PortfoliosSM, a fund-of-funds suite of products that includes the use of quantitative models to shift assets among investment styles. | |
| 1999 | Norwest Advantage Funds and Stagecoach Funds are reorganized into Wells Fargo Funds after the merger of Norwest and Wells Fargo. | |
| 2002 | Evergreen Retail and Evergreen Institutional companies form the umbrella asset management company, Evergreen Investments. | |
| 2005 | The integration of Strong Funds with Wells Fargo Funds creates Wells Fargo Advantage Funds, resulting in one of the top 20 mutual fund companies in the United States. | |
| 2006 | Wells Fargo Advantage Funds relaunches the target date product line as Wells Fargo Advantage Dow Jones Target Date Funds. | |
| 2010 | The mergers and reorganizations of Evergreen and Wells Fargo Advantage mutual funds are completed, unifying the families under the brand of Wells Fargo Advantage Funds. | |
Wells Fargo Advantage Funds®
Wells Fargo Advantage Funds skillfully guides institutions, financial advisors, and individuals through the investment terrain to help them reach their financial objectives. Everything we do on behalf of investors is backed by our unique combination of qualifications.
Strength
Our organization is built on the standards of integrity and service established by our parent company—Wells Fargo & Company—more than 150 years ago. And, because we’re part of a highly diversified financial enterprise, we offer the depth of resources to help investors succeed.
Expertise
Our multi-boutique model offers investors access to the independent thinking of premier investment managers that have been chosen for their time-tested strategies. While each team specializes in a specific investment strategy, collectively they provide investors a wide choice of distinct investment styles. Our dedication to investment excellence doesn’t end with our expertise in manager selection—risk management, analysis, and rigorous ongoing review seek to ensure each manager’s investment process remains consistent.
Partnership
Our collaborative approach is built around understanding the needs and goals of our clients. By adhering to core principles of sound judgment and steady guidance, we support you through every stage of the investment decision process.
Carefully consider a fund’s investment objectives, risks, charges, and expenses before investing. For a current prospectus and, if available, a summary prospectus, containing this and other information, visit wellsfargoadvantagefunds.com. Read it carefully before investing.
Wells Fargo Funds Management, LLC, a wholly owned subsidiary of Wells Fargo & Company, provides investment advisory and administrative services for Wells Fargo Advantage Funds®. Other affiliates of Wells Fargo & Company provide subadvisory and other services for the Funds. The Funds are distributed by Wells Fargo Funds Distributor, LLC, Member FINRA/SIPC, an affiliate of Wells Fargo & Company.
“Dow Jones®” and “Dow Jones Target Date IndexesSM” are service marks of Dow Jones Trademark Holdings, LLC (“Dow Jones”), have been licensed to CME Group Index Services LLC (“CME Indexes”) and have been sublicensed for use for certain purposes by Global Index Advisors, Inc, and Wells Fargo Funds Management, LLC. The Wells Fargo Advantage Dow Jones Target Date FundsSM based on the Dow Jones Target Date IndexesSM, are not sponsored, endorsed, sold or promoted by Dow Jones, CME Indexes or their respective affiliates and none of them makes any representation regarding the advisability of investing in such product(s).
NOT FDIC INSURED ¡ NO BANK GUARANTEE ¡ MAY LOSE VALUE
Not part of semi-annual report.
Table of Contents
Wells Fargo Advantage Funds offers more than 110 mutual funds across a wide range of asset classes, representing over $207 billion in assets under management, as of June 30, 2012.
| Equity Funds | ||||
Asia Pacific Fund | Enterprise Fund† | Opportunity Fund† | ||
C&B Large Cap Value Fund | Equity Value Fund | Precious Metals Fund | ||
C&B Mid Cap Value Fund | Global Opportunities Fund | Premier Large Company Growth Fund | ||
Capital Growth Fund | Growth Fund | Small Cap Opportunities Fund | ||
Common Stock Fund | Index Fund | Small Cap Value Fund | ||
Disciplined U.S. Core Fund | International Equity Fund | Small Company Growth Fund | ||
Discovery Fund† | International Value Fund | Small Company Value Fund | ||
Diversified Equity Fund | Intrinsic Small Cap Value Fund | Small/Mid Cap Core Fund | ||
Diversified International Fund | Intrinsic Value Fund | Small/Mid Cap Value Fund | ||
Diversified Small Cap Fund | Intrinsic World Equity Fund | Special Mid Cap Value Fund | ||
Emerging Growth Fund | Large Cap Core Fund | Special Small Cap Value Fund | ||
Emerging Markets Equity Fund | Large Cap Growth Fund | Specialized Technology Fund | ||
Emerging Markets Equity Income Fund | Large Company Value Fund | Traditional Small Cap Growth Fund | ||
Endeavor Select Fund† | Omega Growth Fund | Utility and Telecommunications Fund | ||
| Bond Funds | ||||
Adjustable Rate Government Fund | Inflation-Protected Bond Fund | Short-Term Bond Fund | ||
California Limited-Term Tax-Free Fund | Intermediate Tax/AMT-Free Fund | Short-Term High Yield Bond Fund | ||
California Tax-Free Fund | International Bond Fund | Short-Term Municipal Bond Fund | ||
Colorado Tax-Free Fund | Minnesota Tax-Free Fund | Strategic Municipal Bond Fund | ||
Emerging Markets Local Bond Fund | Municipal Bond Fund | Total Return Bond Fund | ||
Government Securities Fund | North Carolina Tax-Free Fund | Ultra Short-Term Income Fund | ||
High Income Fund | Pennsylvania Tax-Free Fund | Ultra Short-Term Municipal Income Fund | ||
High Yield Bond Fund | Short Duration Government Bond Fund | Wisconsin Tax-Free Fund | ||
Income Plus Fund | ||||
| Asset Allocation Funds | ||||
Absolute Return Fund | WealthBuilder Equity Portfolio† | Target 2020 Fund† | ||
Asset Allocation Fund | WealthBuilder Growth Allocation Portfolio† | Target 2025 Fund† | ||
Conservative Allocation Fund | WealthBuilder Growth Balanced Portfolio† | Target 2030 Fund† | ||
Diversified Capital Builder Fund | WealthBuilder Moderate Balanced Portfolio† | Target 2035 Fund† | ||
Diversified Income Builder Fund | WealthBuilder Tactical Equity Portfolio† | Target 2040 Fund† | ||
Growth Balanced Fund | Target Today Fund† | Target 2045 Fund† | ||
Index Asset Allocation Fund | Target 2010 Fund† | Target 2050 Fund† | ||
Moderate Balanced Fund | Target 2015 Fund† | Target 2055 Fund† | ||
WealthBuilder Conservative Allocation Portfolio† | ||||
| Money Market Funds | ||||
100% Treasury Money Market Fund | Heritage Money Market Fund† | National Tax-Free Money Market Fund | ||
California Municipal Money Market Fund | Money Market Fund | Prime Investment Money Market Fund | ||
Cash Investment Money Market Fund | Municipal Cash Management Money Market Fund | Treasury Plus Money Market Fund | ||
Government Money Market Fund | Municipal Money Market Fund | |||
| Variable Trust Funds1 | ||||
VT Discovery Fund† | VT Intrinsic Value Fund | VT Small Cap Growth Fund | ||
VT Index Asset Allocation Fund | VT Omega Growth Fund | VT Small Cap Value Fund | ||
VT International Equity Fund | VT Opportunity Fund† | VT Total Return Bond Fund |
An investment in a money market fund is not insured or guaranteed by the Federal Deposit Insurance Corporation or any other government agency. Although the Wells Fargo Advantage Money Market Funds seek to preserve the value of your investment at $1.00 per share, it is possible to lose money by investing in a money market fund.
| 1. | The Variable Trust Funds are generally available only through insurance company variable contracts. |
| † | In this report, the Wells Fargo Advantage Discovery FundSM, Wells Fargo Advantage Endeavor Select FundSM, Wells Fargo Advantage Enterprise FundSM, Wells Fargo Advantage Opportunity FundSM, Wells Fargo Advantage WealthBuilder Conservative Allocation PortfolioSM, Wells Fargo Advantage WealthBuilder Equity PortfolioSM, Wells Fargo Advantage WealthBuilder Growth Allocation PortfolioSM, Wells Fargo Advantage WealthBuilder Growth Balanced PortfolioSM, Wells Fargo Advantage WealthBuilder Moderate Balanced PortfolioSM, Wells Fargo Advantage WealthBuilder Tactical Equity PortfolioSM, Wells Fargo Advantage Dow Jones Target Today FundSM, Wells Fargo Advantage Dow Jones Target 2010 FundSM, Wells Fargo Advantage Dow Jones Target 2015 FundSM, Wells Fargo Advantage Dow Jones Target 2020 FundSM, Wells Fargo Advantage Dow Jones Target 2025 FundSM, Wells Fargo Advantage Dow Jones Target 2030 FundSM, Wells Fargo Advantage Dow Jones Target 2035 FundSM, Wells Fargo Advantage Dow Jones Target 2040 FundSM, Wells Fargo Advantage Dow Jones Target 2045 FundSM, Wells Fargo Advantage Dow Jones Target 2050 FundSM, Wells Fargo Advantage Dow Jones Target 2055 FundSM, Wells Fargo Advantage Heritage Money Market FundSM, Wells Fargo Advantage VT Discovery FundSM, and Wells Fargo Advantage VT Opportunity FundSM are referred to as the Discovery Fund, Endeavor Select Fund, Enterprise Fund, Opportunity Fund, WealthBuilder Conservative Allocation Portfolio, WealthBuilder Equity Portfolio, WealthBuilder Growth Allocation Portfolio, WealthBuilder Growth Balanced Portfolio, WealthBuilder Moderate Balanced Portfolio, WealthBuilder Tactical Equity Portfolio, Target Today Fund, Target 2010 Fund, Target 2015 Fund, Target 2020 Fund, Target 2025 Fund, Target 2030 Fund, Target 2035 Fund, Target 2040 Fund, Target 2045 Fund, Target 2050 Fund, Target 2055 Fund, Heritage Money Market Fund, VT Discovery Fund, and VT Opportunity Fund, respectively. |
Not part of semi-annual report.
Table of Contents
| 2 | Wells Fargo Advantage VT Discovery Fund | Letter to Shareholders (Unaudited) |

Karla M. Rabusch,
President
Wells Fargo Advantage Funds
The period was marked by continued concerns about the possible global economic effects of the ongoing European sovereign debt crisis that began in Greece and later spread to the larger economies of Italy and Spain.
In contrast to worrisome data from the eurozone, U.S. economic data remained moderately positive.
Dear Valued Shareholder:
We’re pleased to offer you this semi-annual report for the Wells Fargo Advantage VT Discovery Fund for the six-month period that ended June 30, 2012. The period was marked by continued concerns about the possible global economic effects of the ongoing European sovereign debt crisis that began in Greece and later spread to the larger economies of Italy and Spain. Widespread support from central banks helped push developed market indexes to gains despite considerable intra-period volatility.
Macroeconomic optimism faded as global growth slowed and worries rose.
Prior to and throughout the reporting period, concerns about the eurozone sovereign debt situation returned to center stage and dominated stock markets around the globe. Investors became increasingly concerned that Greece would default on its debt, a scenario that only seemed more likely as eurozone leaders began to openly discuss a “voluntary” haircut on Greek debt for private investors. Because many eurozone banks owned Greek debt and many U.S. banks had financial ties to eurozone banks, investors worried about the effects of such an event on the financial systems and on the global economy.
The Greek credit crisis was seemingly addressed in March 2012 when the Greek government came to an agreement with its creditors, allowing the country to write down the principal on most of its bonds in exchange for increased financial austerity. The Greek agreement, combined with unprecedented support for eurozone banks by the European Central Bank, seemed to calm investor concerns, at least temporarily.
By the end of the reporting period, however, the agreement seemed on the verge of unraveling. Legislative elections in May left no single party with enough seats to form a government, and none of the parties was able to form a ruling coalition. A pro-bailout party won the subsequent June elections, but the Greek economy remained so weak that investors questioned whether the country would be able to meet its economic targets from the March agreement. Even more worrisome, in May 2012, Spain nationalized Bankia, putting more than $19 billion into the bank after it suffered heavy losses from property loans. The move refocused investor attention on Spain’s weak economy and depressed property sector, and Spanish bonds sold off. Moreover, news reports indicated that Greeks and Spaniards were pulling money from their country’s banks in favor of German and Swiss banks. By mid-June, analysts were openly discussing the possibility of a crisis within the European banking system.
The U.S. economy reported relatively solid news.
In contrast to worrisome data from the eurozone, U.S. economic data remained moderately positive. Reported real gross domestic product (GDP) growth came in at an annualized rate of 3.0% in the fourth quarter of 2011 compared with the prior quarter. Real GDP growth decelerated to a 1.9% annualized rate in the first quarter of 2012 but remained solidly in positive territory. In addition, the major banks appeared to have taken steps toward repairing their balance sheets; in March, the Federal Reserve (Fed) announced that 15 of the 19 major banks had passed a “stress test” in which the Fed attempted to gauge whether the banks could survive a severe recession that included a 50% drop in the stock market and a 21% percent decline in housing prices.
Table of Contents
| Letter to Shareholders (Unaudited) | Wells Fargo Advantage VT Discovery Fund | 3 |
The main piece of negative economic data was the unemployment rate, which remained at relatively high levels, beginning the period at 8.3% and ending it at 8.2%. Toward the end of the period, data indicated that the U.S. economy was adding fewer jobs than expected, leading to concerns that the country’s economic growth was slowing.
Major stock indexes posted positive returns.
Even though investor worries about the sovereign debt crisis within the eurozone caused considerable stock market volatility, the combination of central bank support and relatively strong U.S. economic numbers pushed major stock market indexes into the black, both for developed markets and for major emerging markets. Within the U.S., large-cap stocks modestly outperformed small-cap stocks, and growth stocks edged past value stocks.
We use time-tested investment strategies, even as many variables are at work in the market.
The full effect of the credit crisis remains unknown. Elevated unemployment and debt defaults continue to pressure consumers and businesses alike. In our experience, strict adherence to time-tested investment strategies has its rewards. As a whole, Wells Fargo Advantage Funds represents investments across a range of asset classes and investment styles, giving you an opportunity to create a diversified investment portfolio. While diversification may not prevent losses in a downturn, we believe it helps in managing risk.
Thank you for choosing to invest with Wells Fargo Advantage Funds. We appreciate your confidence in us and remain committed to helping you meet your financial needs. For current information about your fund investments, contact your investment professional, visit our Web site at wellsfargoadvantagefunds.com, or call us directly at 1-800-222-8222. We are available 24 hours a day, 7 days a week.
Sincerely,

Karla M. Rabusch
President
Wells Fargo Advantage Funds
Table of Contents
| 4 | Wells Fargo Advantage VT Discovery Fund | Performance Highlights (Unaudited) |
INVESTMENT OBJECTIVE
The Fund seeks long-term capital appreciation.
ADVISER
Wells Fargo Funds Management, LLC
SUB-ADVISER
Wells Capital Management Incorporated
PORTFOLIO MANAGERS
Thomas J. Pence, CFA
Michael T. Smith, CFA
Chris Warner, CFA
FUND INCEPTION
May 8, 1992
| TEN LARGEST EQUITY HOLDINGS1 (AS OF JUNE 30, 2012) | ||||
Kansas City Southern Railway Company | 2.85% | |||
Airgas Incorporated | 2.66% | |||
SBA Communications Corporation Class A | 2.49% | |||
TransDigm Group Incorporated | 2.49% | |||
Gartner Incorporated | 2.19% | |||
Aspen Technology Incorporated | 2.00% | |||
Alliance Data Systems Corporation | 1.92% | |||
GNC Holdings Incorporated Class A | 1.82% | |||
TIBCO Software Incorporated | 1.75% | |||
Ulta Salon Cosmetics & Fragrance Incorporated | 1.73% | |||
| SECTOR DISTRIBUTION2 (AS OF JUNE 30, 2012) | ||
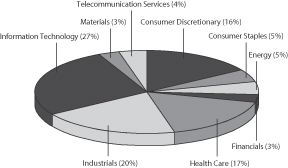 | ||
| 1. | The ten largest equity holdings are calculated based on the value of the securities divided by total net assets of the Fund. Holdings are subject to change and may have changed since the date specified. |
| 2. | Sector distribution is subject to change and is calculated based on the total long-term investments of the Fund. |
Table of Contents
| Performance Highlights (Unaudited) | Wells Fargo Advantage VT Discovery Fund | 5 |
AVERAGE ANNUAL TOTAL RETURN (%) (AS OF JUNE 30, 2012)
| Expense Ratios3 | ||||||||||||||||||||||||||||
| Inception Date | 6 Months* | 1 Year | 5 Year | 10 Year | Gross | Net4 | ||||||||||||||||||||||
Class 2 | 05/08/1992 | 11.89 | 2.09 | 4.61 | 10.38 | 1.18% | 1.15% | |||||||||||||||||||||
Russell 2500TM Growth Index5 | 8.44 | -3.19 | 2.35 | 8.35 | ||||||||||||||||||||||||
| * | Returns for periods of less than one year are not annualized. |
Figures quoted represent past performance, which is no guarantee of future results and do not reflect the deduction of taxes that a shareholder may pay on fund distributions or the redemption of fund shares.Investment return and principal value of an investment will fluctuate so that an investor’s shares, when redeemed, may be worth more or less than their original cost. Current performance may be lower or higher than the performance data quoted and assumes the reinvestment of dividends and capital gains. Current month-end performance is available by calling 1-866-765-0778. Performance figures of the Fund do not reflect fees charged pursuant to the terms of variable life insurance policies and variable annuity contracts.
Index returns do not include transaction costs associated with buying and selling securities, any mutual fund fees or expenses or any taxes. It is not possible to invest directly in an index.
Stock fund values fluctuate in response to the activities of individual companies and general market and economic conditions. Smaller-company stocks tend to be more volatile and less liquid than those of larger companies. The use of derivatives may reduce returns and/or increase volatility. Certain investment strategies tend to increase the total risk of an investment (relative to the broader market). This Fund is exposed to foreign investment risk. Consult the Fund’s prospectus for additional information on these and other risks.
Please refer to the prospectus provided by your participating insurance company for detailed information describing the separate accounts for information regarding surrender charges, mortality and expense risk fees and other charges that may be assessed by the participating insurance companies.
| 3. | Reflects the expense ratio as stated in the most recent prospectus. |
| 4. | The Adviser has committed through April 30, 2013 to waive fees and/or reimburse expenses to the extent necessary to cap the Fund’s Total Annual Fund Operating Expenses After Fee Waiver, excluding certain expenses, at the amount shown above. Without this cap, the Fund’s returns would have been lower. |
| 5. | The Russell 2500™ Growth Index measures the performance of those Russell 2500 companies with higher price-to-book ratios and higher forecasted growth values. You cannot invest directly in an index. |
Table of Contents
| 6 | Wells Fargo Advantage VT Discovery Fund | Fund Expenses (Unaudited) |
As a shareholder of the Fund, you incur ongoing costs, including management fees, distribution (12b-1) fees, and other Fund expenses. This example is intended to help you understand your ongoing costs (in dollars) of investing in the Fund and to compare these costs with the ongoing costs of investing in other mutual funds.
The example is based on an investment of $1,000 invested at the beginning of the six-month period and held for the entire period from January 1, 2012 to June 30, 2012.
Actual Expenses
The “Actual” line of the table below provides information about actual account values and actual expenses. You may use the information in this line, together with the amount you invested, to estimate the expenses that you paid over the period. Simply divide your account value by $1,000 (for example, an $8,600 account value divided by $1,000 = 8.6), then multiply the result by the number in the “Actual” line under the heading entitled “Expenses Paid During Period” for your applicable class of shares to estimate the expenses you paid on your account during this period.
Hypothetical Example for Comparison Purposes
The “Hypothetical” line of the table below provides information about hypothetical account values and hypothetical expenses based on the Fund’s actual expense ratio and an assumed rate of return of 5% per year before expenses, which is not the Fund’s actual return. The hypothetical account values and expenses may not be used to estimate the actual ending account balance or expenses you paid for the period. You may use this information to compare the ongoing costs of investing in the Fund and other funds. To do so, compare this 5% hypothetical example with the 5% hypothetical examples that appear in the shareholder reports of the other funds.
Please note that the expenses shown in the table are meant to highlight your ongoing costs only and do not reflect any separate account charges assessed by participating insurance companies. Therefore, the “Hypothetical” line of the table is useful in comparing ongoing costs only, and will not help you determine the relative total costs of owning different funds. In addition, if these separate account charges assessed by participating insurance companies were included, your costs would have been higher.
| Beginning Account Value 01-01-2012 | Ending Account Value 06-30-2012 | Expenses Paid During the Period1 | Net Annual Expense Ratio | |||||||||||||
Class 2 | ||||||||||||||||
Actual | $ | 1,000.00 | $ | 1,118.86 | $ | 6.06 | 1.15 | % | ||||||||
Hypothetical (5% return before expenses) | $ | 1,000.00 | $ | 1,019.14 | $ | 5.77 | 1.15 | % | ||||||||
| 1. | Expenses paid is equal to the annualized expense ratio multiplied by the average account value over the period, multiplied by the number of days in the most recent fiscal half-year divided by the number of days in the fiscal year (to reflect the one-half year period). |
Table of Contents
| Portfolio of Investments—June 30, 2012 (Unaudited) | Wells Fargo Advantage VT Discovery Fund | 7 |
| Security Name | Shares | Value | ||||||||||
Common Stocks: 96.81% | ||||||||||||
Consumer Discretionary: 15.50% | ||||||||||||
| Auto Components: 1.00% | ||||||||||||
BorgWarner Incorporated † | 16,300 | $ | 1,069,117 | |||||||||
|
| |||||||||||
| Automobiles: 1.17% | ||||||||||||
Tesla Motors Incorporated †« | 39,688 | 1,241,838 | ||||||||||
|
| |||||||||||
| Household Durables: 1.26% | ||||||||||||
SodaStream International Limited †« | 32,600 | 1,335,622 | ||||||||||
|
| |||||||||||
| Internet & Catalog Retail: 0.71% | ||||||||||||
HomeAway Incorporated †« | 2,172 | 47,219 | ||||||||||
TripAdvisor Incorporated † | 15,745 | 703,644 | ||||||||||
| 750,863 | ||||||||||||
|
| |||||||||||
| Leisure Equipment & Products: 1.08% | ||||||||||||
LeapFrog Enterprises Incorporated † | 112,400 | 1,153,224 | ||||||||||
|
| |||||||||||
| Specialty Retail: 7.18% | ||||||||||||
DSW Incorporated Class A « | 23,793 | 1,294,339 | ||||||||||
GNC Holdings Incorporated Class A | 49,319 | 1,933,305 | ||||||||||
Hibbett Sports Incorporated †« | 21,400 | 1,234,994 | ||||||||||
Select Comfort Corporation † | 31,100 | 650,612 | ||||||||||
Tractor Supply Company | 8,300 | 689,398 | ||||||||||
Ulta Salon Cosmetics & Fragrance Incorporated | 19,700 | 1,839,586 | ||||||||||
| 7,642,234 | ||||||||||||
|
| |||||||||||
| Textiles, Apparel & Luxury Goods: 3.10% | ||||||||||||
Fifth & Pacific Companies Incorporated † | 62,300 | 668,479 | ||||||||||
PVH Corporation | 15,700 | 1,221,303 | ||||||||||
Under Armour Incorporated †« | 14,900 | 1,407,752 | ||||||||||
| 3,297,534 | ||||||||||||
|
| |||||||||||
Consumer Staples: 4.71% | ||||||||||||
| Beverages: 2.80% | ||||||||||||
Boston Beer Company Incorporated †« | 14,500 | 1,754,500 | ||||||||||
Monster Beverage Corporation † | 17,100 | 1,217,520 | ||||||||||
| 2,972,020 | ||||||||||||
|
| |||||||||||
| Food & Staples Retailing: 0.85% | ||||||||||||
Fresh Market Incorporated † | 16,900 | 906,347 | ||||||||||
|
| |||||||||||
| Food Products: 1.06% | ||||||||||||
Hain Celestial Group Incorporated †« | 20,500 | 1,128,320 | ||||||||||
|
| |||||||||||
Energy: 5.12% | ||||||||||||
| Energy Equipment & Services: 1.63% | ||||||||||||
GulfMark Offshore Incorporated Class A † | 22,800 | 776,112 | ||||||||||
The accompanying notes are an integral part of these financial statements.
Table of Contents
| 8 | Wells Fargo Advantage VT Discovery Fund | Portfolio of Investments—June 30, 2012 (Unaudited) |
| Security Name | Shares | Value | ||||||||||
| Energy Equipment & Services (continued) | ||||||||||||
Oil States International Incorporated † | 14,500 | $ | 959,900 | |||||||||
| 1,736,012 | ||||||||||||
|
| |||||||||||
| Oil, Gas & Consumable Fuels: 3.49% | ||||||||||||
Approach Resources Incorporated †« | 36,841 | 940,919 | ||||||||||
Cabot Oil & Gas Corporation | 20,400 | 803,760 | ||||||||||
Kodiak Oil & Gas Corporation †« | 121,300 | 995,873 | ||||||||||
Plains Exploration & Product Company † | 27,500 | 967,450 | ||||||||||
| 3,708,002 | ||||||||||||
|
| |||||||||||
Financials: 2.68% | ||||||||||||
| Capital Markets: 1.70% | ||||||||||||
Affiliated Managers Group Incorporated † | 16,500 | 1,805,925 | ||||||||||
|
| |||||||||||
| Real Estate Management & Development: 0.98% | ||||||||||||
CBRE Group Incorporated † | 63,700 | 1,042,132 | ||||||||||
|
| |||||||||||
Health Care: 16.11% | ||||||||||||
| Biotechnology: 5.50% | ||||||||||||
Alexion Pharmaceuticals Incorporated † | 13,100 | 1,300,830 | ||||||||||
BioMarin Pharmaceutical Incorporated †« | 42,257 | 1,672,532 | ||||||||||
Cepheid Incorporated †« | 23,100 | 1,033,725 | ||||||||||
Cubist Pharmaceuticals Incorporated † | 37,700 | 1,429,207 | ||||||||||
Threshold Pharmaceuticals Incorporated †« | 56,700 | 419,580 | ||||||||||
| 5,855,874 | ||||||||||||
|
| |||||||||||
| Health Care Equipment & Supplies: 2.94% | ||||||||||||
Align Technology Incorporated †« | 24,600 | 823,116 | ||||||||||
HeartWare International Incorporated † | 7,300 | 648,240 | ||||||||||
MAKO Surgical Corporation †« | 26,700 | 683,787 | ||||||||||
Thoratec Corporation † | 28,834 | 968,246 | ||||||||||
| 3,123,389 | ||||||||||||
|
| |||||||||||
| Health Care Providers & Services: 3.52% | ||||||||||||
Hanger Incorporated † | 51,200 | 1,312,768 | ||||||||||
Laboratory Corporation of America Holdings † | 12,100 | 1,120,581 | ||||||||||
Team Health Holdings LLC † | 54,300 | 1,308,087 | ||||||||||
| 3,741,436 | ||||||||||||
|
| |||||||||||
| Health Care Technology: 1.00% | ||||||||||||
athenahealth Incorporated †« | 13,500 | 1,068,795 | ||||||||||
|
| |||||||||||
| Life Sciences Tools & Services: 0.74% | ||||||||||||
Bruker BioSciences Corporation † | 58,800 | 782,628 | ||||||||||
|
| |||||||||||
| Pharmaceuticals: 2.41% | ||||||||||||
Auxilium Pharmaceuticals Incorporated † | 52,400 | 1,409,036 | ||||||||||
Impax Laboratories Incorporated †« | 57,000 | 1,155,390 | ||||||||||
| 2,564,426 | ||||||||||||
|
| |||||||||||
The accompanying notes are an integral part of these financial statements.
Table of Contents
| Portfolio of Investments—June 30, 2012 (Unaudited) | Wells Fargo Advantage VT Discovery Fund | 9 |
| Security Name | Shares | Value | ||||||||||
Industrials: 19.23% | ||||||||||||
| Aerospace & Defense: 3.87% | ||||||||||||
TransDigm Group Incorporated † | 19,700 | $ | 2,645,710 | |||||||||
Triumph Group Incorporated | 26,100 | 1,468,647 | ||||||||||
| 4,114,357 | ||||||||||||
|
| |||||||||||
| Airlines: 1.64% | ||||||||||||
Copa Holdings SA | 21,200 | 1,748,576 | ||||||||||
|
| |||||||||||
| Machinery: 6.55% | ||||||||||||
Chart Industries Incorporated †« | 25,700 | 1,767,132 | ||||||||||
Colfax Corporation †« | 26,918 | 742,129 | ||||||||||
Graco Incorporated | 30,900 | 1,423,872 | ||||||||||
Joy Global Incorporated | 9,800 | 555,954 | ||||||||||
Rexnord Corporation †« | 50,626 | 1,014,545 | ||||||||||
Wabtec Corporation | 18,800 | 1,466,588 | ||||||||||
| 6,970,220 | ||||||||||||
|
| |||||||||||
| Professional Services: 0.99% | ||||||||||||
Verisk Analytics Incorporated Class A † | 21,400 | 1,054,164 | ||||||||||
|
| |||||||||||
| Road & Rail: 4.02% | ||||||||||||
Hertz Global Holdings Incorporated †« | 97,100 | 1,242,880 | ||||||||||
Kansas City Southern Railway Company | 43,600 | 3,032,816 | ||||||||||
| 4,275,696 | ||||||||||||
|
| |||||||||||
| Trading Companies & Distributors: 1.51% | ||||||||||||
WESCO International Incorporated †« | 27,800 | 1,599,890 | ||||||||||
|
| |||||||||||
| Transportation Infrastructure: 0.65% | ||||||||||||
Wesco Aircraft Holdings Incorporated †« | 54,152 | 689,355 | ||||||||||
|
| |||||||||||
Information Technology: 27.11% | ||||||||||||
| Communications Equipment: 0.97% | ||||||||||||
F5 Networks Incorporated † | 10,400 | 1,035,424 | ||||||||||
|
| |||||||||||
| Electronic Equipment, Instruments & Components: 2.19% | ||||||||||||
FEI Company †« | 19,200 | 918,528 | ||||||||||
Trimble Navigation Limited † | 30,600 | 1,407,906 | ||||||||||
| 2,326,434 | ||||||||||||
|
| |||||||||||
| Internet Software & Services: 6.95% | ||||||||||||
Angie’s List Incorporated †« | 38,079 | 603,171 | ||||||||||
DealerTrack Holdings Incorporated †« | 56,000 | 1,686,160 | ||||||||||
Equinix Incorporated †« | 6,063 | 1,064,966 | ||||||||||
ExactTarget Incorporated † | 25,876 | 565,649 | ||||||||||
Liquidity Services Incorporated †« | 23,900 | 1,223,441 | ||||||||||
LogMeIn Incorporated †« | 32,579 | 994,311 | ||||||||||
Mercadolibre Incorporated « | 16,600 | 1,258,280 | ||||||||||
| 7,395,978 | ||||||||||||
|
| |||||||||||
The accompanying notes are an integral part of these financial statements.
Table of Contents
| 10 | Wells Fargo Advantage VT Discovery Fund | Portfolio of Investments—June 30, 2012 (Unaudited) |
| Security Name | Shares | Value | ||||||||||
| IT Services: 5.58% | ||||||||||||
Alliance Data Systems Corporation † | 15,100 | $ | 2,038,500 | |||||||||
Gartner Incorporated † | 54,200 | 2,333,310 | ||||||||||
ServiceSource International Incorporated †« | 77,727 | 1,076,519 | ||||||||||
VeriFone Systems Incorporated †« | 14,800 | 489,732 | ||||||||||
| 5,938,061 | ||||||||||||
|
| |||||||||||
| Semiconductors & Semiconductor Equipment: 2.49% | ||||||||||||
Avago Technologies Limited | 29,600 | 1,062,640 | ||||||||||
EZchip Semiconductor Limited †« | 25,500 | 1,021,020 | ||||||||||
M/A-COM Technology Solutions Holdings Incorporated † | 30,234 | 559,329 | ||||||||||
| 2,642,989 | ||||||||||||
|
| |||||||||||
| Software: 8.93% | ||||||||||||
Aspen Technology Incorporated † | 91,800 | 2,125,170 | ||||||||||
Autodesk Incorporated † | 24,000 | 839,760 | ||||||||||
Broadsoft Incorporated †« | 47,800 | 1,384,288 | ||||||||||
CommVault Systems Incorporated † | 21,700 | 1,075,669 | ||||||||||
Fortinet Incorporated † | 67,934 | 1,577,427 | ||||||||||
NetSuite Incorporated †« | 11,600 | 635,332 | ||||||||||
TIBCO Software Incorporated † | 62,300 | 1,864,016 | ||||||||||
| 9,501,662 | ||||||||||||
|
| |||||||||||
Materials: 2.66% | ||||||||||||
| Chemicals: 2.66% | ||||||||||||
Airgas Incorporated | 33,700 | 2,831,137 | ||||||||||
|
| |||||||||||
Telecommunication Services: 3.69% | ||||||||||||
| Diversified Telecommunication Services: 1.20% | ||||||||||||
Iridium Communications Incorporated †« | 142,900 | 1,280,384 | ||||||||||
|
| |||||||||||
| Wireless Telecommunication Services: 2.49% | ||||||||||||
SBA Communications Corporation Class A † | 46,384 | 2,646,208 | ||||||||||
|
| |||||||||||
Total Common Stocks (Cost $93,135,948) | 102,976,273 | |||||||||||
|
| |||||||||||
| Principal | ||||||||||||
| Other: 0.15% | ||||||||||||
Gryphon Funding Limited, Pass-Through Entity (a)(i)(v) | $ | 599,622 | 161,898 | |||||||||
|
| |||||||||||
Total Other (Cost $74,225) | �� | 161,898 | ||||||||||
|
| |||||||||||
The accompanying notes are an integral part of these financial statements.
Table of Contents
| Portfolio of Investments—June 30, 2012 (Unaudited) | Wells Fargo Advantage VT Discovery Fund | 11 |
| Security Name | Yield | Shares | Value | |||||||||||
Short-Term Investments: 29.69% | ||||||||||||||
Wells Fargo Advantage Cash Investment Money Market Fund, Select Class (l)(u) | 0.15 | % | 3,288,049 | $ | 3,288,049 | |||||||||
Wells Fargo Securities Lending Cash Investments, LLC (v)(l)(u)(r) | 0.19 | 28,293,655 | 28,293,655 | |||||||||||
Total Short-Term Investments (Cost $31,581,704) | 31,581,704 | |||||||||||||
|
| |||||||||||||
| Total Investments in Securities | ||||||||
| (Cost $124,791,877) * | 126.65 | % | 134,719,875 | |||||
Other Assets and Liabilities, Net | (26.65 | ) | (28,352,025 | ) | ||||
|
|
|
| |||||
| Total Net Assets | 100.00 | % | $ | 106,367,850 | ||||
|
|
|
|
| † | Non-income earning security |
| « | All or a portion of this security is on loan. |
| (a) | Security is fair valued by the Management Valuation Team, and in certain instances by the Board of Trustees, in accordance with procedures approved by the Board of Trustees. |
| (i) | Illiquid security |
| (v) | Security represents investment of cash collateral received from securities on loan. |
| (l) | Investment in an affiliate |
| (u) | Rate shown is the 7-day annualized yield at period end. |
| (r) | The investment company is exempt from registration under Section 3(c)(7) of the 1940 Act. |
| * | Cost for federal income tax purposes is $125,577,175 and net unrealized appreciation (depreciation) consists of: |
Gross unrealized appreciation | $ | 13,051,331 | ||
Gross unrealized depreciation | (3,908,631 | ) | ||
|
| |||
Net unrealized appreciation | $ | 9,142,700 |
The accompanying notes are an integral part of these financial statements.
Table of Contents
| 12 | Wells Fargo Advantage VT Discovery Fund | Statement of Assets and Liabilities—June 30, 2012 (Unaudited) |
Assets | ||||
Investments | ||||
In unaffiliated securities (including securities on loan), at value (see cost below) | $ | 103,138,171 | ||
In affiliated securities, at value (see cost below) | 31,581,704 | |||
|
| |||
Total investments, at value (see cost below) | 134,719,875 | |||
Receivable for investments sold | 1,656,737 | |||
Receivable for Fund shares sold | 99,992 | |||
Receivable for dividends | 11,841 | |||
Receivable for securities lending income | 34,230 | |||
Prepaid expenses and other assets | 73 | |||
|
| |||
Total assets | 136,522,748 | |||
|
| |||
Liabilities | ||||
Payable for investments purchased | 1,596,244 | |||
Payable for Fund shares redeemed | 62,906 | |||
Payable upon receipt of securities loaned | 28,367,880 | |||
Advisory fee payable | 55,928 | |||
Distribution fees payable | 21,804 | |||
Due to other related parties | 10,336 | |||
Accrued expenses and other liabilities | 39,800 | |||
|
| |||
Total liabilities | 30,154,898 | |||
|
| |||
Total net assets | $ | 106,367,850 | ||
|
| |||
NET ASSETS CONSIST OF | ||||
Paid-in capital | $ | 96,577,985 | ||
Undistributed net investment loss | (165,236 | ) | ||
Accumulated net realized gains on investments | 27,103 | |||
Net unrealized gains on investments | 9,927,998 | |||
|
| |||
Total net assets | $ | 106,367,850 | ||
|
| |||
COMPUTATION OF NET ASSET VALUE PER SHARE1 | ||||
Net assets – Class 2 | $ | 106,367,850 | ||
Shares outstanding – Class 2 | 4,447,933 | |||
Net asset value per share – Class 2 | $23.91 | |||
Investments in unaffiliated securities, at cost | $ | 93,210,173 | ||
|
| |||
Investments in affiliated securities, at cost | $ | 31,581,704 | ||
|
| |||
Total investments, at cost | $ | 124,791,877 | ||
|
| |||
Securities on loan, at value | $ | 27,667,997 | ||
|
| |||
| 1. | The Fund has an unlimited number of authorized shares. |
The accompanying notes are an integral part of these financial statements.
Table of Contents
| Statement of Operations—Six Months Ended June 30, 2012 (Unaudited) | Wells Fargo Advantage VT Discovery Fund | 13 |
Investment income | ||||
Securities lending income, net | $ | 278,862 | ||
Dividends | 170,928 | |||
Income from affiliated securities | 1,240 | |||
|
| |||
Total investment income | 451,030 | |||
|
| |||
Expenses | ||||
Advisory fee | 375,118 | |||
Administration fees | ||||
Fund level | 26,794 | |||
Class 2 | 42,871 | |||
Distribution fees | ||||
Class 2 | 133,971 | |||
Custody and accounting fees | 11,403 | |||
Professional fees | 11,376 | |||
Shareholder report expenses | 31,445 | |||
Trustees’ fees and expenses | 8,733 | |||
Other fees and expenses | 1,269 | |||
|
| |||
Total expenses | 642,980 | |||
Less: Fee waivers and/or expense reimbursements | (26,714 | ) | ||
|
| |||
Net expenses | 616,266 | |||
|
| |||
Net investment loss | (165,236 | ) | ||
|
| |||
REALIZED AND UNREALIZED GAINS (LOSSES) ON INVESTMENTS | ||||
Net realized gains on investments | 5,660,065 | |||
Net change in unrealized gains (losses) on investments | 5,879,680 | |||
|
| |||
Net realized and unrealized gains (losses) on investments | 11,539,745 | |||
|
| |||
Net increase in net assets resulting from operations | $ | 11,374,509 | ||
|
| |||
The accompanying notes are an integral part of these financial statements.
Table of Contents
| 14 | Wells Fargo Advantage VT Discovery Fund | Statements of Changes in Net Assets |
Six Months Ended June 30, 2012 (Unaudited) | Year Ended December 31, 2011 | |||||||||||||||
Operations | ||||||||||||||||
Net investment loss | $ | (165,236 | ) | $ | (812,220 | ) | ||||||||||
Net realized gains on investments | 5,660,065 | 27,863,306 | ||||||||||||||
Net change in unrealized gains (losses) on investments | 5,879,680 | (26,402,344 | ) | |||||||||||||
|
|
|
|
|
|
|
| |||||||||
Net increase in net assets resulting from operations | 11,374,509 | 648,742 | ||||||||||||||
|
|
|
|
|
|
|
| |||||||||
Capital share transactions | Shares | Shares | ||||||||||||||
Proceeds from shares sold – Class 2 | 376,707 | 9,173,242 | 665,598 | 14,494,199 | ||||||||||||
Payment for shares redeemed – Class 2 | (518,931 | ) | (12,279,394 | ) | (1,279,927 | ) | (27,798,666 | ) | ||||||||
|
|
|
|
|
|
|
| |||||||||
Net decrease in net assets resulting from capital share transactions | (3,106,152 | ) | (13,304,467 | ) | ||||||||||||
|
|
|
|
|
|
|
| |||||||||
Total increase (decrease) in net assets | 8,268,357 | (12,655,725 | ) | |||||||||||||
|
|
|
|
|
|
|
| |||||||||
Net assets | ||||||||||||||||
Beginning of period | 98,099,493 | 110,755,218 | ||||||||||||||
|
|
|
|
|
|
|
| |||||||||
End of period | $ | 106,367,850 | $ | 98,099,493 | ||||||||||||
|
|
|
|
|
|
|
| |||||||||
Undistributed net investment loss | $ | (165,236 | ) | $ | 0 | |||||||||||
|
|
|
|
|
|
|
| |||||||||
The accompanying notes are an integral part of these financial statements.
Table of Contents
| Financial Highlights | Wells Fargo Advantage VT Discovery Fund | 15 |
(For a share outstanding throughout each period)
Class 21 | Six Months Ended | Year Ended December 31, | ||||||||||||||||||||||
| 2011 | 2010 | 2009 | 2008 | 2007 | ||||||||||||||||||||
Net asset value, beginning of period | $ | 21.37 | $ | 21.28 | $ | 15.70 | $ | 11.19 | $ | 20.11 | $ | 16.44 | ||||||||||||
Net investment loss | (0.04 | ) | (0.18 | ) | (0.13 | ) | (0.11 | ) | (0.11 | ) | (0.15 | ) | ||||||||||||
Net realized and unrealized gains (losses) on investments | 2.58 | 0.27 | 5.71 | 4.62 | (8.81 | ) | 3.82 | |||||||||||||||||
|
|
|
|
|
|
|
|
|
|
|
| |||||||||||||
Total from investment operations | 2.54 | 0.09 | 5.58 | 4.51 | (8.92 | ) | 3.67 | |||||||||||||||||
Net asset value, end of period | $ | 23.91 | $ | 21.37 | $ | 21.28 | $ | 15.70 | $ | 11.19 | $ | 20.11 | ||||||||||||
Total return | 11.89 | % | 0.42 | % | 35.54 | % | 40.30 | % | (44.36 | )% | 22.32 | % | ||||||||||||
Ratios to average net assets (annualized) | ||||||||||||||||||||||||
Gross expenses | 1.20 | % | 1.18 | % | 1.26 | % | 1.35 | % | 1.27 | % | 1.21 | % | ||||||||||||
Net expenses | 1.15 | % | 1.15 | % | 1.15 | % | 1.15 | % | 1.15 | % | 1.15 | % | ||||||||||||
Net investment loss | (0.31 | )% | (0.75 | )% | (0.71 | )% | (0.61 | )% | (0.63 | )% | (0.72 | )% | ||||||||||||
Supplemental data | ||||||||||||||||||||||||
Portfolio turnover rate | 55 | % | 113 | % | 101 | % | 208 | % | 166 | % | 135 | % | ||||||||||||
Net assets, end of period (000’s omitted) | $106,368 | $98,099 | $110,755 | $86,125 | $113,149 | $238,894 | ||||||||||||||||||
| 1. | After the close of business on July 16, 2010, existing shares of the Fund were renamed Class 2 shares. |
The accompanying notes are an integral part of these financial statements.
Table of Contents
| 16 | Wells Fargo Advantage VT Discovery Fund | Notes to Financial Statements (Unaudited) |
1. ORGANIZATION
Wells Fargo Variable Trust (the “Trust”), a Delaware statutory trust organized on March 10, 1999, is an open-end management investment company registered under the Investment Company Act of 1940, as amended (the “1940 Act”). These financial statements report on Wells Fargo Advantage VT Discovery Fund (the “Fund”) which is a diversified series of the Trust.
2. SIGNIFICANT ACCOUNTING POLICIES
The following significant accounting policies, which are consistently followed in the preparation of the financial statements of the Fund, are in conformity with U.S. generally accepted accounting principles which require management to make estimates and assumptions that affect the reported amounts of assets and liabilities, disclosure of contingent assets and liabilities at the date of the financial statements, and the reported amounts of revenues and expenses during the reporting period. Actual results could differ from those estimates.
Securities valuation
Investments in equity securities are valued each business day as of the close of regular trading on the New York Stock Exchange, which is usually 4:00 p.m. (Eastern Time). Securities which are traded on a national or foreign securities exchange are valued at the last reported sales price, except that securities listed on The Nasdaq Stock Market, Inc. (“Nasdaq”) are valued at the Nasdaq Official Closing Price (“NOCP”), and if no NOCP is available, then at the last reported sales price. If no sales price is shown on the Nasdaq, the bid price will be used. In the absence of any sale of securities listed on the Nasdaq, and in the case of other securities (including U.S. Government obligations, but excluding debt securities maturing in 60 days or less), the price will be deemed “stale” and the valuations will be determined in accordance with the Fund’s Valuation Procedures.
Investments in open-end mutual funds and non-registered investment companies are fair valued at net asset value.
Investments which are not valued using any of the methods discussed above, are valued at their fair value, as determined by procedures established in good faith and approved by the Board of Trustees. The Board of Trustees has established a Valuation Committee comprised of the Trustees and has delegated to it the authority to take any actions regarding the valuation of portfolio securities that the Valuation Committee deems necessary in determining the fair value of portfolio securities, unless the responsibility has been delegated to the Management Valuation Team of Wells Fargo Funds Management, LLC (“Funds Management”). The Board of Trustees retains the authority to make or ratify any valuation decisions or approve any changes to the Valuation Procedures as it deems appropriate. On a quarterly basis, the Board of Trustees considers for ratification any valuation actions taken by the Valuation Committee or the Management Valuation Team.
Valuations of fair valued securities are compared to the next actual sales price when available, or other appropriate market information to assess the continued appropriateness of the fair valuation methodology used. These securities are fair valued on a day-to-day basis, taking into consideration changes to appropriate market information and any significant changes to the input factors considered in the valuation process until there is a readily available price provided on the exchange or by an independent pricing service. Valuations received from an independent pricing service or broker quotes are periodically validated by comparisons to most recent trades and valuations provided by other independent pricing services in addition to the review of prices by the adviser and/or sub-adviser. Unobservable inputs used in determining fair valuations are identified based on the type of security, taking into consideration factors utilized by market participants in valuing the investment, knowledge about the issuer and the current market environment.
Security loans
The Fund may lend its securities from time to time in order to earn additional income in the form of fees or interest on securities received as collateral or the investment of any cash received as collateral. The Fund continues to receive interest or dividends on the securities loaned. The Fund receives collateral in the form of cash or securities with a value at least equal to the value of the securities on loan. The value of the loaned securities is determined at the close of each business day and any additional required collateral is delivered to the Fund on the next business day. In a securities lending transaction, the net asset value of the Fund will be affected by an increase or decrease in the value of the securities loaned and by an increase or decrease in the value of the instrument in which collateral is invested. The amount of securities lending activity undertaken by the Fund fluctuates from time to time. In the event of default or bankruptcy
Table of Contents
| Notes to Financial Statements (Unaudited) | Wells Fargo Advantage VT Discovery Fund | 17 |
by the borrower, the Fund may be prevented from recovering the loaned securities or gaining access to the collateral or may experience delays or costs in doing so. In addition, the investment of any cash collateral received may lose all or part of its value. The Fund has the right under the lending agreement to recover the securities from the borrower on demand.
The Fund lends its securities through an unaffiliated securities lending agent. Cash collateral received in connection with its securities lending transactions is invested in Wells Fargo Securities Lending Cash Investments, LLC (the “Cash Collateral Fund”). The Cash Collateral Fund is exempt from registration under Section 3(c)(7) of the 1940 Act and is managed by Funds Management and is sub-advised by Wells Capital Management Incorporated (“Wells Capital Management”). Funds Management receives an advisory fee starting at 0.05% and declining to 0.01% as the average daily net assets of the Cash Collateral Fund increase. All of the fees received by Funds Management are paid to Wells Capital Management for its services as sub-adviser. The Cash Collateral Fund seeks to provide a positive return compared to the daily Fed Funds Open rate by investing in high-quality, U.S. dollar-denominated short-term money market instruments. Cash Collateral Fund investments are fair valued based upon the amortized cost valuation technique. Income earned from investment in the Cash Collateral Fund is included in securities lending income on the Statement of Operations.
Security transactions and income recognition
Securities transactions are recorded on a trade date basis. Realized gains or losses are reported on the basis of identified cost of securities delivered.
Dividend income is recognized on the ex-dividend date.
Distributions to shareholders
Distributions to shareholders from net investment income and net realized gains, if any, are recorded on the ex-dividend date. Such distributions are determined in conformity with income tax regulations, which may differ from generally accepted accounting principles.
Federal and other taxes
The Fund intends to continue to qualify as a regulated investment company by distributing substantially all of its investment company taxable income and any net realized capital gains (after reduction for capital loss carryforwards) sufficient to relieve it from all, or substantially all, federal income taxes. Accordingly, no provision for federal income taxes was required.
The Fund’s income and federal excise tax returns and all financial records supporting those returns for the prior three fiscal years are subject to examination by the federal and Delaware revenue authorities. Management has analyzed the Fund’s tax positions taken on federal, state, and foreign tax returns for all open tax years and does not believe that there are any uncertain tax positions that require recognition of a tax liability.
Under the recently enacted Regulated Investment Company Modernization Act of 2010, the Fund is permitted to carry forward capital losses incurred in taxable years which began after December 22, 2010 for an unlimited period. However, any losses incurred are required to be utilized prior to the losses incurred in pre-enactment taxable years. As a result of this ordering rule, pre-enactment capital loss carryforwards may be more likely to expire unused. Post-enactment capital losses that are carried forward will retain their character as either short-term or long-term capital losses rather than be considered all short-term as under previous law. In addition, the Fund may elect to defer any portion of a post-October capital loss or qualified late-year ordinary loss to the first day of the following taxable year. A post-October capital loss is the greatest of the net capital loss, net short-term capital loss or net long-term capital loss for the portion of the taxable year after October 31. A qualified late-year ordinary loss is the net loss comprised of (a) net gain or loss from the sale or other disposition of capital assets for the portion of the taxable year after October 31, and (b) other ordinary income or loss for the portion of the taxable year after December 31.
As of December 31, 2011, the Fund had net capital loss carryforwards, which were available to offset future net realized capital gains, in the amount of $4,806,267 expiring in 2017.
3. FAIR VALUATION MEASUREMENTS
Fair value measurements of investments are determined within a framework that has established a fair value hierarchy based upon the various data inputs utilized in determining the value of the Fund’s investments. The three-level hierarchy gives the highest priority to unadjusted quoted prices in active markets for identical assets or liabilities (Level 1) and the
Table of Contents
| 18 | Wells Fargo Advantage VT Discovery Fund | Notes to Financial Statements (Unaudited) |
lowest priority to significant unobservable inputs (Level 3). The Fund’s investments are classified within the fair value hierarchy based on the lowest level of input that is significant to the fair value measurement. The inputs are summarized into three broad levels as follows:
| n | Level 1 – quoted prices in active markets for identical securities |
| n | Level 2 – other significant observable inputs (including quoted prices for similar securities, interest rates, prepayment speeds, credit risk, etc.) |
| n | Level 3 – significant unobservable inputs (including the Fund’s own assumptions in determining the fair value of investments) |
The inputs or methodologies used for valuing securities are not necessarily an indication of the risk associated with investing in those securities.
As of June 30, 2012, the inputs used in valuing the Fund’s assets, which are carried at fair value, were as follows:
| Investments in Securities | Quoted Prices (Level 1) | Significant Other Observable Inputs (Level 2) | Significant Unobservable Inputs | Total | ||||||||||||
Equity securities | ||||||||||||||||
Common stocks | $ | 102,976,273 | $ | 0 | $ | 0 | $ | 102,976,273 | ||||||||
Other | 0 | 0 | 161,898 | 161,898 | ||||||||||||
Short-term investments | ||||||||||||||||
Investment companies | 3,288,049 | 28,293,655 | 0 | 31,581,704 | ||||||||||||
| $ | 106,264,322 | $ | 28,293,655 | $ | 161,898 | $ | 134,719,875 | |||||||||
Further details on the major security types listed above can be found in the Portfolio of Investments.
Transfers in and transfers out are recognized at the end of the reporting period. For the six months ended June 30, 2012, the Fund did not have any transfers into/out of Level 1 and Level 2.
4. TRANSACTIONS WITH AFFILIATES AND OTHER EXPENSES
Advisory fee
The Trust has entered into an advisory contract with Funds Management, an indirect wholly owned subsidiary of Wells Fargo & Company (“Wells Fargo”). The adviser is responsible for implementing investment policies and guidelines and for supervising the sub-adviser, who is responsible for day-to-day portfolio management of the Fund.
Pursuant to the contract, Funds Management is entitled to receive an annual advisory fee starting at 0.70% and declining to 0.55% as the average daily net assets of the Fund increase. For the six months ended June 30, 2012, the advisory fee was equivalent to an annual rate of 0.70% of the Fund’s average daily net assets.
Funds Management has retained the services of a sub-adviser to provide daily portfolio management to the Fund. The fee for sub-advisory services is borne by Funds Management. Wells Capital Management, an affiliate of Funds Management, is the sub-adviser to the Fund and is entitled to receive a fee from Funds Management at an annual rate starting at 0.45% and declining to 0.35% as the average daily net assets of the Fund increase.
Administration and transfer agent fees
The Trust has entered into an administration agreement with Funds Management. Under this agreement, for providing administrative services, which includes paying fees and expenses for services provided by the transfer agent, sub-transfer agents, omnibus account servicers and record-keepers, Funds Management is entitled to receive from the Fund an annual fund level administration fee starting at 0.05% and declining to 0.03% as the average daily net assets of the Fund increase and for Class 2 shares, a class level administration fee of 0.08% which is calculated based on the average daily net assets.
Funds Management has contractually waived and/or reimbursed advisory and administration fees to the extent necessary to maintain the net operating expense ratio for the Fund. Waiver of fees and/or reimbursement of
Table of Contents
| Notes to Financial Statements (Unaudited) | Wells Fargo Advantage VT Discovery Fund | 19 |
expenses by Funds Management were made first from fund level expenses on a proportionate basis and then from class specific expenses. Funds Management has committed through April 30, 2013 to waive fees and/or reimburse expenses to the extent necessary to cap the Fund’s expenses at 1.15% for Class 2.
Distribution fees
The Trust has adopted a Distribution Plan for Class 2 shares of the Fund pursuant to Rule 12b-1 under the 1940 Act. Distribution fees are charged to Class 2 shares and paid to Wells Fargo Funds Distributor, LLC, the principal underwriter, at an annual rate of 0.25% of its average daily net assets.
5. INVESTMENT PORTFOLIO TRANSACTIONS
Purchases and sales of investments, excluding U.S. Government obligations (if any) and short-term securities, for the six months ended June 30, 2012 were $57,376,863 and $62,317,117, respectively.
6. BANK BORROWINGS
The Trust and Wells Fargo Funds Trust (excluding the money market funds) are parties to a $150,000,000 revolving credit agreement with State Street Bank and Trust Company, whereby the Fund is permitted to use bank borrowings for temporary or emergency purposes, such as to fund shareholder redemption requests. Interest under the credit agreement is charged to the Fund based on a borrowing rate equal to the higher of the Federal Funds rate in effect on that day plus 1.25% or the overnight LIBOR rate in effect on that day plus 1.25%. In addition, an annual commitment fee equal to 0.10% of the unused balance is allocated to each participating fund. For the six months ended June 30, 2012, the Fund paid $96 in commitment fees.
For the six months ended June 30, 2012, there were no borrowings by the Fund under the agreement.
7. INDEMNIFICATION
Under the Trust’s organizational documents, the officers and directors are indemnified against certain liabilities that may arise out of performance of their duties to the Trust. Additionally, in the normal course of business, the Trust may enter into contracts with service providers that contain a variety of indemnification clauses. The Trust’s maximum exposure under these arrangements is dependent on future claims that may be made against the Fund and, therefore, cannot be estimated.
8. NEW ACCOUNTING PRONOUNCEMENT
In December 2011, the Financial Accounting Standards Board (“FASB”) issued Accounting Standard Update (“ASU”) No. 2011-11, Disclosures about Offsetting Assets and Liabilities. ASU 2011-11, which amends FASB ASC Topic 210, Balance Sheet, creates new disclosure requirements which require entities to disclose both gross and net information for derivatives and other financial instruments that are either offset in the Statement of Assets and Liabilities or subject to an enforceable master netting arrangement or similar agreement. The disclosure requirements are effective for interim and annual reporting periods beginning on or after January 1, 2013. Management is currently assessing the potential impact, in addition to expanded financial statement disclosure, that may result from adopting this ASU.
Table of Contents
| 20 | Wells Fargo Advantage VT Discovery Fund | Other Information (Unaudited) |
PROXY VOTING INFORMATION
A description of the policies and procedures that the Fund uses to determine how to vote proxies relating to portfolio securities is available without charge, upon request, by calling 1-800-222-8222, visiting our Web site at wellsfargoadvantagefunds.com, or visiting the SEC Web site at sec.gov. Information regarding how the Fund voted proxies relating to portfolio securities during the most recent 12-month period ended June 30 is available without charge on the Fund’s Web site at wellsfargoadvantagefunds.com or by visiting the SEC Web site at sec.gov.
PORTFOLIO HOLDINGS INFORMATION
The complete portfolio holdings for the Fund are publicly available on the Fund’s Web site (wellsfargoadvantagefunds.com) on a monthly, 30-day or more delayed basis. In addition, top ten holdings information for the Fund is publicly available on the Fund’s Web site on a monthly, seven-day or more delayed basis. The Fund files its complete schedule of portfolio holdings with the SEC for the first and third quarters of each fiscal year on Form N-Q, which is available without charge by visiting the SEC Web site at sec.gov. In addition, the Fund’s Form N-Q may be reviewed and copied at the SEC’s Public Reference Room in Washington, DC, and at regional offices in New York City, at 233 Broadway, and in Chicago, at 175 West Jackson Boulevard, Suite 900. Information about the Public Reference Room may be obtained by calling 1-800-SEC-0330.
Table of Contents
| Other Information (Unaudited) | Wells Fargo Advantage VT Discovery Fund | 21 |
BOARD OF TRUSTEES AND OFFICERS
Each of the Trustees and Officers listed in the table below acts in identical capacities for the Wells Fargo Advantage family of funds, which consists of 138 funds comprising the Wells Fargo Funds Trust, Wells Fargo Variable Trust, Wells Fargo Master Trust and four closed-end funds (collectively the “Fund Complex”). This table should be read in conjunction with the Prospectus and the Statement of Additional Information1. All of the Trustees are also Members of the Audit and Governance Committees of each Trust in the Fund Complex. The mailing address of each Trustee and Officer is 525 Market Street, 12th Floor, San Francisco, CA 94105. Each Trustee and Officer serves an indefinite term, however, each Trustee serves such term until reaching the mandatory retirement age established by the Trustees.
Independent Trustees
Name and Year of Birth | Position Held and Length of Service* | Principal Occupations During Past Five Years | Other Directorships During | |||
| Peter G. Gordon (Born 1942) | Trustee, since 1998; Chairman, since 2005 (Lead Trustee since 2001) | Co-Founder, Retired Chairman, President and CEO of Crystal Geyser Water Company. Trustee Emeritus, Colby College | Asset Allocation Trust | |||
| Isaiah Harris, Jr. (Born 1952) | Trustee, since 2009 | Retired. Prior thereto, President and CEO of BellSouth Advertising and Publishing Corp. from 2005 to 2007, President and CEO of BellSouth Enterprises from 2004 to 2005 and President of BellSouth Consumer Services from 2000 to 2003. Emeritus member of the Iowa State University Foundation Board of Governors. Emeritus Member of the Advisory Board of Iowa State University School of Business. Mr. Harris is a certified public accountant. | CIGNA Corporation; Deluxe Corporation; Asset Allocation Trust | |||
| Judith M. Johnson (Born 1949) | Trustee, since 2008 | Retired. Prior thereto, Chief Executive Officer and Chief Investment Officer of Minneapolis Employees Retirement Fund from 1996 to 2008. Ms. Johnson is an attorney, certified public accountant and a certified managerial accountant. | Asset Allocation Trust | |||
| Leroy Keith, Jr. (Born 1939) | Trustee, since 2010 | Chairman, Bloc Global Services (development and construction). Trustee of the Evergreen Funds from 1983 to 2010. Former Managing Director, Almanac Capital Management (commodities firm), former Partner, Stonington Partners, Inc. (private equity fund), former Director, Obagi Medical Products Co. and former Director, Lincoln Educational Services. | Trustee, Virtus Fund Complex (consisting of 40 portfolios as of 12/31/11); Asset Allocation Trust | |||
| David F. Larcker (Born 1950) | Trustee, since 2009 | James Irvin Miller Professor of Accounting at the Graduate School of Business, Stanford University, Director of Corporate Governance Research Program and Senior Faculty of The Rock Center for Corporate Governance since 2006. From 2005 to 2008, Professor of Accounting at the Graduate School of Business, Stanford University. Prior thereto, Ernst & Young Professor of Accounting at The Wharton School, University of Pennsylvania from 1985 to 2005. | Asset Allocation Trust | |||
| Olivia S. Mitchell (Born 1953) | Trustee, since 2006 | International Foundation of Employee Benefit Plans Professor, Wharton School of the University of Pennsylvania since 1993. Director of Wharton’s Pension Research Council and Boettner Center on Pensions & Retirement Research, and Research Associate at the National Bureau of Economic Research. Previously, Cornell University Professor from 1978 to 1993. | Asset Allocation Trust | |||
| Timothy J. Penny (Born 1951) | Trustee, since 1996 | President and CEO of Southern Minnesota Initiative Foundation, a non-profit organization, since 2007 and Senior Fellow at the Humphrey Institute Policy Forum at the University of Minnesota since 1995. Member of the Board of Trustees of NorthStar Education Finance, Inc., a non-profit organization, since 2007. | Asset Allocation Trust |
Table of Contents
| 22 | Wells Fargo Advantage VT Discovery Fund | Other Information (Unaudited) |
Name and Year of Birth | Position Held and Length of Service* | Principal Occupations During Past Five Years | Other Directorships During | |||
| Michael S. Scofield (Born 1943) | Trustee, since 2010 | Served on the Investment Company Institute’s Board of Governors and Executive Committee from 2008-2011 as well the Governing Council of the Independent Directors Council from 2006-2011 and the Independent Directors Council Executive Committee from 2008-2011. Chairman of the IDC from 2008-2010. Institutional Investor (Fund Directions) Trustee of Year in 2007. Trustee of the Evergreen Funds (and its predecessors) from 1984 to 2010. Chairman of the Evergreen Funds from 2000-2010. Former Trustee of the Mentor Funds. Retired Attorney, Law Offices of Michael S. Scofield and former Director and Chairman, Branded Media Corporation (multi-media branding company). | Asset Allocation Trust | |||
| Donald C. Willeke (Born 1940) | Trustee, since 1996 | Principal of the law firm of Willeke & Daniels. General Counsel of the Minneapolis Employees Retirement Fund from 1984 until its consolidation into the Minnesota Public Employees Retirement Association on June 30, 2010. Director and Vice Chair of The Free Trust (non-profit corporation). Director of the American Chestnut Foundation (non-profit corporation). | Asset Allocation Trust |
| * | Length of service dates reflect the Trustee’s commencement of service with the Trust’s predecessor entities, where applicable. |
Officers
Name and Year of Birth | Position Held and Length of Service | Principal Occupations During Past Five Years | ||||
| Karla M. Rabusch (Born 1959) | President, since 2003 | Executive Vice President of Wells Fargo Bank, N.A. and President of Wells Fargo Funds Management, LLC since 2003. Senior Vice President and Chief Administrative Officer of Wells Fargo Funds Management, LLC from 2001 to 2003. | ||||
| C. David Messman (Born 1960) | Secretary, since 2000; Chief Legal Officer, since 2003 | Senior Vice President and Secretary of Wells Fargo Funds Management, LLC since 2001. Vice President and Managing Senior Counsel of Wells Fargo Bank, N.A. since 1996. | ||||
| Nancy Wiser (Born 1967) | Treasurer, since 2012 | Executive Vice President of Wells Fargo Funds Management, LLC since 2011. Chief Operating Officer and Chief Compliance Officer at LightBox Capital Management LLC, from 2008 to 2011. Owned and operated a consulting business providing services to various hedge funds including acting as Chief Operating Officer and Chief Compliance Officer for a hedge fund from 2007 to 2008. Chief Operating Officer and Chief Compliance Officer of GMN Capital LLC from 2006 to 2007. | ||||
| David Berardi (Born 1975) | Assistant Treasurer, since 2009 | Vice President of Wells Fargo Funds Management, LLC since 2009. Vice President of Evergreen Investment Management Company, LLC from 2008 to 2010. Assistant Vice President of Evergreen Investment Services, Inc. from 2004 to 2008. Manager of Fund Reporting and Control for Evergreen Investment Management Company, LLC from 2004 to 2010. | ||||
| Jeremy DePalma (Born 1974) | Assistant Treasurer, since 2009 | Senior Vice President of Wells Fargo Funds Management, LLC since 2009. Senior Vice President of Evergreen Investment Management Company, LLC from 2008 to 2010. Vice President, Evergreen Investment Services, Inc. from 2004 to 2007. Head of the Fund Reporting and Control Team within Fund Administration from 2005 to 2010. | ||||
| Debra Ann Early (Born 1964) | Chief Compliance Officer, since 2007 | Chief Compliance Officer of Wells Fargo Funds Management, LLC since 2007. Chief Compliance Officer of Parnassus Investments from 2005 to 2007. Chief Financial Officer of Parnassus Investments from 2004 to 2007 and Senior Audit Manager of PricewaterhouseCoopers LLP from 1998 to 2004. |
| 1. | The Statement of Additional Information includes additional information about the Trustees and is available, without charge, upon request, by calling 1-800-222-8222 or by visiting the Web site at wellsfargoadvantagefunds.com. |
Table of Contents
| Other Information (Unaudited) | Wells Fargo Advantage VT Discovery Fund | 23 |
BOARD CONSIDERATION OF INVESTMENT ADVISORY AND SUB-ADVISORY AGREEMENTS:
Under Section 15 of the Investment Company Act of 1940 (the “1940 Act”), the Board of Trustees (the “Board”) of Wells Fargo Funds Trust (the “Trust”), all the members of which have no direct or indirect interest in the investment advisory and sub-advisory agreements and are not “interested persons” of the Trust, as defined in the 1940 Act (the “Independent Trustees”), must determine whether to approve the continuation of the Trust’s investment advisory and sub-advisory agreements. In this regard, at an in person meeting held on March 29-30, 2012 (the “Meeting”), the Board reviewed and re-approved: (i) an investment advisory agreement with Wells Fargo Funds Management, LLC (“Funds Management”) for Wells Fargo Advantage VT Discovery FundSM (the “Fund”) and (ii) an investment sub-advisory agreement with Wells Capital Management Incorporated (“Wells Capital Management”) for the Fund. The investment advisory agreement with Funds Management and the investment sub-advisory agreement with Wells Capital Management are collectively referred to as the “Advisory Agreements.”
At the Meeting, the Board considered the factors and reached the conclusions described below relating to the selection of Funds Management and Wells Capital Management and the continuation of the Advisory Agreements. Prior to the Meeting, the Trustees conferred extensively among themselves and with representatives of Funds Management about these matters. The Board also met throughout the year and received information that was useful to them in considering the continuation of the Advisory Agreements. The Independent Trustees were assisted in their evaluation of the Advisory Agreements by independent legal counsel, from whom they received separate legal advice and with whom they met separately from Funds Management.
In providing information to the Board, Funds Management and Wells Capital Management were guided by a detailed set of requests submitted by the Independent Trustees’ independent legal counsel on their behalf at the start of the Board’s annual contract renewal process earlier in 2012. In approving the Advisory Agreements, the Board did not identify any particular information or consideration that was all-important or controlling, and each Trustee likely attributed different weights to various factors.
Nature, extent and quality of services
The Board received and considered various information regarding the nature, extent and quality of services provided to the Fund by Funds Management and Wells Capital Management under the Advisory Agreements. The Board also received and considered, among other things, information about the background and experience of senior management of Funds Management, and the qualifications, backgrounds, tenures and responsibilities of the portfolio managers primarily responsible for the day-to-day portfolio management of the Fund.
The Board evaluated the ability of Funds Management and Wells Capital Management, based on their respective financial condition, resources, reputation and other attributes, to attract and retain qualified investment professionals, including research, advisory, and supervisory personnel. The Board further considered the compliance programs and compliance records of Funds Management and Wells Capital Management. In addition, the Board took into account the administrative services provided to the Fund by Funds Management and its affiliates.
The Board’s decision to approve the continuation of the Advisory Agreements was based on a comprehensive evaluation of information provided to it. In considering these matters, the Board considered not only the specific information presented in connection with the Meeting, but also the knowledge gained over time through interaction with Funds Management and Wells Capital Management about various topics, including Funds Management’s oversight of service providers. The above factors, together with those referenced below, are some of the most important, but not necessarily all, factors considered by the Board in concluding that the nature, extent and quality of the investment advisory services provided to the Fund by Funds Management and Wells Capital Management supported the re-approval of the Advisory Agreements. Although the Board considered the continuation of the Advisory Agreements for the Fund as part of the larger process of considering the continuation of the advisory agreements for all of the funds in the complex, its decision to continue the Advisory Agreements for the Fund was ultimately made on a fund-by-fund basis.
Fund performance and expenses
The Board considered the performance results for the Fund over various time periods ended December 31, 2011. The Board also considered these results in comparison to the median performance of a universe of relevant funds (the “Universe”) that was determined by Lipper Inc. (“Lipper”) to be similar to the Fund, and in comparison to the Fund’s benchmark index and to other comparative data. Lipper is an independent provider of investment company data. The
Table of Contents
| 24 | Wells Fargo Advantage VT Discovery Fund | Other Information (Unaudited) |
Board received a description of the methodology used by Lipper to select the mutual funds in the Universe. The Board noted that the performance of the Fund was higher than the median performance of the Universe for all periods under review. The Board also noted that the performance of the Fund was higher than its benchmark, the Lipper VUF Mid-Cap Growth Funds Index, for the periods under review.
The Board received and considered information regarding the Fund’s contractual advisory fee and net operating expense ratios and their various components, including actual management fees (which reflect fee waivers, if any), transfer agent, custodian and other non-management fees, Rule 12b-1 and non-Rule 12b-1 fees, service fees and fee waiver and expense reimbursement arrangements. The Board also considered these ratios in comparison to the median ratios of an expense Universe and a narrower expense group of mutual funds (each, an “Expense Group”) that was determined by Lipper to be similar to the Fund. The Board received a description of the methodology used by Lipper to select the mutual funds in the Fund’s Expense Group. The Board noted that the net operating expense ratios of the Fund were in range of the Fund’s Expense Group’s median net operating expense ratios.
Based on the above-referenced considerations and other factors, the Board concluded that the overall performance and expense structure of the Fund supported the re-approval of the Advisory Agreements for the Fund.
Investment advisory and sub-advisory fee rates
The Board reviewed and considered the contractual investment advisory fee rate that is payable by the Fund to Funds Management for investment advisory services (the “Advisory Agreement Rate”), both on a stand-alone basis and on a combined basis with the Fund’s administration fee rate. The Board took into account the separate administrative and other services covered by the administration fee rate. The Board also reviewed and considered the contractual investment sub-advisory fee rate that is payable by Funds Management to Wells Capital Management for investment sub-advisory services (the “Sub-Advisory Agreement Rate”). In addition, the Board reviewed and considered the existing fee waiver/cap arrangements applicable to the Advisory Agreement Rate and considered the Advisory Agreement Rate after taking the waivers/caps into account (the “Net Advisory Rate”).
The Board received and considered information comparing the Advisory Agreement Rate and Net Advisory Rate, combined with the administration fee rates, with those of other funds in the Fund’s Expense Group median. The Board noted that the Advisory Agreement Rate and Net Advisory Rate for the Fund were in range of the median rates for the Fund’s Expense Group.
The Board also received and considered information about the nature and extent of services offered and fee rates charged by Funds Management and Wells Capital Management to other types of clients. In this regard, the Board received information about differences between the services, and the compliance, reporting, and other legal burdens and risks of providing investment advice to mutual funds and those associated with providing advice to non-mutual fund clients such as collective funds or institutional separate accounts.
The Board determined that the Advisory Agreement Rate for the Fund, both with and without the administration fee rate and before and after waivers, was reasonable in light of the Fund’s Expense Group information, the net expense ratio commitments, the services covered by the Advisory Agreements and other information provided. The Board also reviewed and considered the Sub-Advisory Agreement Rate and concluded that the Sub-Advisory Agreement Rate was reasonable in light of the services covered by the Sub-Advisory Agreement and other information provided.
Profitability
The Board received and considered a profitability analysis of Funds Management, as well as an analysis of the profitability to the collective Wells Fargo businesses that provide services to the Fund. It considered that the information provided to it was necessarily estimated, and that the profitability information provided to it, especially on a fund-by-fund basis, did not necessarily provide a precise tool for evaluating the appropriateness of the Fund’s Advisory Agreement Rate in isolation. It noted that the levels of profitability reported on a fund-by-fund basis varied widely, depending on, among other things, the size and type of fund. The Board concluded that the profitability reported by Funds Management was not unreasonable.
The Board did not consider separate profitability information with respect to Wells Capital Management, because, as an affiliate of Funds Management, its profitability information was subsumed in the collective Wells Fargo profitability analysis provided by Funds Management.
Table of Contents
| Other Information (Unaudited) | Wells Fargo Advantage VT Discovery Fund | 25 |
Economies of scale
With respect to possible economies of scale, the Board reviewed the breakpoints in the Fund’s advisory fee and/or administration fee structure, which operate generally to reduce the expenses of the Fund (as a percentage of Fund assets) as the Fund grows in size. It considered that, as a fund shrinks in size, breakpoints conversely result in increasing fee levels. The Board noted that it would have on-going opportunities to review the appropriate levels of breakpoints in the future, and concluded that the breakpoints as implemented appeared to be a reasonable step toward sharing economies of scale, if any, with the Fund. However, the Board acknowledged the inherent limitations of any analysis of economies of scale and of any attempt to correlate breakpoints with such economies, stemming largely from the Board’s understanding that economies of scale are realized, if at all, across a variety of products and services, not just with respect to a single fund.
Other benefits to Funds Management and Wells Capital Management
The Board received and considered information regarding potential “fall-out” or ancillary benefits received by Funds Management and its affiliates, including Wells Capital Management, as a result of their relationship with the Fund. Ancillary benefits could include, among others, benefits directly attributable to the relationship of Funds Management and Wells Capital Management with the Fund and benefits potentially derived from an increase in Funds Management’s and Wells Capital Management’s business as a result of their relationship with the Fund (such as the ability to market to shareholders other financial products offered by Funds Management and its affiliates, including Wells Capital Management).
The Board considered that Wells Fargo Funds Distributor, LLC, an affiliate of Funds Management, serves as distributor to the Fund and receives certain compensation for those services. The Board noted that various financial institutions, including affiliates of Funds Management, may receive distribution-related fees, shareholder servicing payments (including amounts derived from payments under Rule 12b-1 plans) and sub-transfer agency fees in respect of shares sold or held through them and services provided.
The Board also reviewed information about whether and to what extent soft dollar credits are sought and how any such credits are utilized and any benefits that may be realized by using an affiliated broker.
Other factors and broader review
The Board also considered the markets for distribution of the Fund’s shares, including the channels through which the Fund’s shares are offered and sold. The Board noted that the Fund is part of one of the few fund families that have both direct-to-fund and intermediary distribution channels. As discussed above, the Board reviews detailed materials received from Funds Management and Wells Capital Management annually as part of the re-approval process under Section 15 of the 1940 Act and also reviews and assesses information about the quality of the services that the Fund receives throughout the year. In this regard, the Board has reviewed reports of Funds Management at each of its quarterly meetings, which include, among other things, portfolio reviews and performance reports. In addition, the Board confers with portfolio managers at various times throughout the year.
Conclusion
After considering the above-described factors and based on its deliberations and its evaluation of the information described above, the Board unanimously approved the continuation of the Advisory Agreements for an additional one-year period.
Table of Contents
| 26 | Wells Fargo Advantage VT Discovery Fund | List of Abbreviations |
The following is a list of common abbreviations for terms and entities which may have appeared in this report.
| ACB | — Agricultural Credit Bank |
| ADR | — American Depository Receipt |
| ADS | — American Depository Shares |
| AGC-ICC | — Assured Guaranty Corporation - Insured Custody Certificates |
| AGM | — Assured Guaranty Municipal |
| AMBAC | — American Municipal Bond Assurance Corporation |
| AMT | — Alternative Minimum Tax |
| AUD | — Australian Dollar |
| BAN | — Bond Anticipation Notes |
| BHAC | — Berkshire Hathaway Assurance Corporation |
| BRL | — Brazil Real |
| CAB | — Capital Appreciation Bond |
| CAD | — Canadian Dollar |
| CCAB | — Convertible Capital Appreciation Bond |
| CDA | — Community Development Authority |
| CDO | — Collateralized Debt Obligation |
| CHF | — Swiss Franc |
| COP | — Certificate of Participation |
| CR | — Custody Receipts |
| DKK | — Danish Krone |
| DRIVER | — Derivative Inverse Tax-Exempt Receipts |
| DW&P | — Department of Water & Power |
| DWR | — Department of Water Resources |
| ECFA | — Educational & Cultural Facilities Authority |
| EDA | — Economic Development Authority |
| EDFA | — Economic Development Finance Authority |
| ETF | — Exchange-Traded Fund |
| EUR | — Euro |
| FFCB | — Federal Farm Credit Bank |
| FGIC | — Financial Guaranty Insurance Corporation |
| FGLMC | — Federal Government Loan Mortgage Company |
| FHA | — Federal Housing Authority |
| FHLB | — Federal Home Loan Bank |
| FHLMC | — Federal Home Loan Mortgage Corporation |
| FICO | — The Financing Corporation |
| FNMA | — Federal National Mortgage Association |
| FSA | — Farm Service Agency |
| GBP | — Great British Pound |
| GDR | — Global Depository Receipt |
| GNMA | — Government National Mortgage Association |
| GO | — General Obligation |
| HCFR | — Healthcare Facilities Revenue |
| HEFA | — Health & Educational Facilities Authority |
| HEFAR | — Higher Education Facilities Authority Revenue |
| HFA | — Housing Finance Authority |
| HFFA | — Health Facilities Financing Authority |
| HKD | — Hong Kong Dollar |
| HUF | — Hungarian Forint |
| IBC | — Insured Bond Certificate |
| IDA | — Industrial Development Authority |
| IDAG | — Industrial Development Agency |
| IDR | — Industrial Development Revenue |
| IEP | — Irish Pound |
| JPY | — Japanese Yen |
| KRW | — Republic of Korea Won |
| LIBOR | — London Interbank Offered Rate |
| LIQ | — Liquidity Agreement |
| LLC | — Limited Liability Company |
| LLP | — Limited Liability Partnership |
| LOC | — Letter of Credit |
| LP | — Limited Partnership |
| MBIA | — Municipal Bond Insurance Association |
| MFHR | — Multi-Family Housing Revenue |
| MSTR | — Municipal Securities Trust Receipts |
| MTN | — Medium Term Note |
| MUD | — Municipal Utility District |
| MXN | — Mexican Peso |
| MYR | — Malaysian Ringgit |
| NATL-RE | — National Public Finance Guarantee Corporation |
| NOK | — Norwegian Krone |
| NZD | — New Zealand Dollar |
| PCFA | — Pollution Control Finance Authority |
| PCR | — Pollution Control Revenue |
| PFA | — Public Finance Authority |
| PFFA | — Public Facilities Financing Authority |
| PFOTER | — Puttable Floating Option Tax-Exempt Receipts |
| plc | — Public Limited Company |
| PLN | — Polish Zloty |
| PUTTER | — Puttable Tax-Exempt Receipts |
| R&D | — Research & Development |
| RDA | — Redevelopment Authority |
| RDFA | — Redevelopment Finance Authority |
| REIT | — Real Estate Investment Trust |
| ROC | — Reset Option Certificates |
| SAVRS | — Select Auction Variable Rate Securities |
| SBA | — Small Business Authority |
| SEK | — Swedish Krona |
| SFHR | — Single Family Housing Revenue |
| SFMR | — Single Family Mortgage Revenue |
| SGD | — Singapore Dollar |
| SKK | — Slovakian Koruna |
| SPA | — Standby Purchase Agreement |
| SPDR | — Standard & Poor’s Depositary Receipts |
| STRIPS | — Separate Trading of Registered Interest and Principal Securities |
| TAN | — Tax Anticipation Notes |
| TBA | — To Be Announced |
| TIPS | — Treasury Inflation-Protected Securities |
| TRAN | — Tax Revenue Anticipation Notes |
| TCR | — Transferable Custody Receipts |
| TRY | — Turkish Lira |
| TTFA | — Transportation Trust Fund Authority |
| TVA | — Tennessee Valley Authority |
| XLCA | — XL Capital Assurance |
| ZAR | — South African Rand |
Table of Contents


FOR MORE INFORMATION
More information about Wells Fargo Advantage Funds is available free upon request. To obtain literature, please write, e-mail, visit the Fund’s Web site, or call:
Wells Fargo Advantage Funds
P.O. Box 8266
Boston, MA 02266-8266
E-mail: wfaf@wellsfargo.com
Web site: wellsfargoadvantagefunds.com
Individual investors: 1-800-222-8222
Retail investment professionals: 1-888-877-9275
Institutional investment professionals: 1-866-765-0778
This report and the financial statements contained herein are submitted for the general information of the shareholders of Wells Fargo Advantage Funds. If this report is used for promotional purposes, distribution of the report must be accompanied or preceded by a current prospectus. For a current prospectus and, if available, a summary prospectus containing more complete information, including charges and expenses, call 1-800-222-8222 or visit the Fund’s Web site at wellsfargoadvantagefunds.com . Please consider the investment objectives, risks, charges, and expenses of the investment carefully before investing. This and other information about Wells Fargo Advantage Funds can be found in the current prospectus. Read the prospectus carefully before you invest or send money.
Wells Fargo Funds Management, LLC, a wholly owned subsidiary of Wells Fargo & Company, provides investment advisory and administrative services for Wells Fargo Advantage Funds. Other affiliates of Wells Fargo & Company provide subadvisory and other services for the Funds. The Funds are distributed by Wells Fargo Funds Distributor, LLC, Member FINRA/SIPC, an affiliate of Wells Fargo & Company.
NOT FDIC INSURED ¡ NO BANK GUARANTEE ¡ MAY LOSE VALUE
© 2012 Wells Fargo Funds Management, LLC. All rights reserved.
210662 08-12 SVT1/SAR138 06-12 |
Table of Contents

Wells Fargo Advantage
VT Index Asset Allocation Fund

Semi-Annual Report
June 30, 2012

Table of Contents
Reduce clutter. Save trees.
Sign up for electronic delivery of prospectuses and shareholder reports at wellsfargo.com/advantagedelivery
| 2 | ||||
| 5 | ||||
| 8 | ||||
| 9 | ||||
Financial Statements | ||||
| 25 | ||||
| 26 | ||||
| 27 | ||||
| 28 | ||||
| 29 | ||||
| 35 | ||||
| 41 | ||||
The views expressed and any forward-looking statements are as of June 30, 2012, unless otherwise noted, and are those of the Fund managers and/or Wells Fargo Funds Management, LLC. Discussions of individual securities, or the markets generally, or any Wells Fargo Advantage Fund are not intended as individual recommendations. Future events or results may vary significantly from those expressed in any forward-looking statements; the views expressed are subject to change at any time in response to changing circumstances in the market. Wells Fargo Funds Management, LLC, disclaims any obligation to publicly update or revise any views expressed or forward-looking statements.
NOT FDIC INSURED ¡ NO BANK GUARANTEE ¡ MAY LOSE VALUE
Table of Contents

WELLS FARGO INVESTMENT HISTORY
| 1932 | Keystone creates one of the first mutual fund families. | |
| 1971 | Wells Fargo & Company introduces one of the first institutional index funds. | |
| 1978 | Wells Fargo applies Markowitz and Sharpe’s research on Modern Portfolio Theory to introduce one of the industry’s first Tactical Asset Allocation (TAA) models in institutional separately managed accounts. | |
| 1984 | Wells Fargo Stagecoach Funds launches its first asset allocation fund. | |
| 1989 | The Tactical Asset Allocation (TAA) Model is first applied to Wells Fargo’s asset allocation mutual funds. | |
| 1994 | Wells Fargo introduces the LifePath Funds, one of the first suites of target date funds (now the Wells Fargo Advantage Dow Jones Target Date FundsSM). | |
| 1996 | Evergreen Investments and Keystone Funds merge. | |
| 1997 | Wells Fargo launches Wells Fargo Advantage WealthBuilder PortfoliosSM, a fund-of-funds suite of products that includes the use of quantitative models to shift assets among investment styles. | |
| 1999 | Norwest Advantage Funds and Stagecoach Funds are reorganized into Wells Fargo Funds after the merger of Norwest and Wells Fargo. | |
| 2002 | Evergreen Retail and Evergreen Institutional companies form the umbrella asset management company, Evergreen Investments. | |
| 2005 | The integration of Strong Funds with Wells Fargo Funds creates Wells Fargo Advantage Funds, resulting in one of the top 20 mutual fund companies in the United States. | |
| 2006 | Wells Fargo Advantage Funds relaunches the target date product line as Wells Fargo Advantage Dow Jones Target Date Funds. | |
| 2010 | The mergers and reorganizations of Evergreen and Wells Fargo Advantage mutual funds are completed, unifying the families under the brand of Wells Fargo Advantage Funds. | |
Wells Fargo Advantage Funds®
Wells Fargo Advantage Funds skillfully guides institutions, financial advisors, and individuals through the investment terrain to help them reach their financial objectives. Everything we do on behalf of investors is backed by our unique combination of qualifications.
Strength
Our organization is built on the standards of integrity and service established by our parent company—Wells Fargo & Company—more than 150 years ago. And, because we’re part of a highly diversified financial enterprise, we offer the depth of resources to help investors succeed.
Expertise
Our multi-boutique model offers investors access to the independent thinking of premier investment managers that have been chosen for their time-tested strategies. While each team specializes in a specific investment strategy, collectively they provide investors a wide choice of distinct investment styles. Our dedication to investment excellence doesn’t end with our expertise in manager selection—risk management, analysis, and rigorous ongoing review seek to ensure each manager’s investment process remains consistent.
Partnership
Our collaborative approach is built around understanding the needs and goals of our clients. By adhering to core principles of sound judgment and steady guidance, we support you through every stage of the investment decision process.
Carefully consider a fund’s investment objectives, risks, charges, and expenses before investing. For a current prospectus and, if available, a summary prospectus, containing this and other information, visit wellsfargoadvantagefunds.com. Read it carefully before investing.
Wells Fargo Funds Management, LLC, a wholly owned subsidiary of Wells Fargo & Company, provides investment advisory and administrative services for Wells Fargo Advantage Funds®. Other affiliates of Wells Fargo & Company provide subadvisory and other services for the Funds. The Funds are distributed by Wells Fargo Funds Distributor, LLC, Member FINRA/SIPC, an affiliate of Wells Fargo & Company.
“Dow Jones®” and “Dow Jones Target Date IndexesSM” are service marks of Dow Jones Trademark Holdings, LLC (“Dow Jones”), have been licensed to CME Group Index Services LLC (“CME Indexes”) and have been sublicensed for use for certain purposes by Global Index Advisors, Inc, and Wells Fargo Funds Management, LLC. The Wells Fargo Advantage Dow Jones Target Date FundsSM based on the Dow Jones Target Date IndexesSM, are not sponsored, endorsed, sold or promoted by Dow Jones, CME Indexes or their respective affiliates and none of them makes any representation regarding the advisability of investing in such product(s).
NOT FDIC INSURED ¡ NO BANK GUARANTEE ¡ MAY LOSE VALUE
Not part of semi-annual report.
Table of Contents
Wells Fargo Advantage Funds offers more than 110 mutual funds across a wide range of asset classes, representing over $207 billion in assets under management, as of June 30, 2012.
| Equity Funds | ||||
Asia Pacific Fund | Enterprise Fund† | Opportunity Fund† | ||
C&B Large Cap Value Fund | Equity Value Fund | Precious Metals Fund | ||
C&B Mid Cap Value Fund | Global Opportunities Fund | Premier Large Company Growth Fund | ||
Capital Growth Fund | Growth Fund | Small Cap Opportunities Fund | ||
Common Stock Fund | Index Fund | Small Cap Value Fund | ||
Disciplined U.S. Core Fund | International Equity Fund | Small Company Growth Fund | ||
Discovery Fund† | International Value Fund | Small Company Value Fund | ||
Diversified Equity Fund | Intrinsic Small Cap Value Fund | Small/Mid Cap Core Fund | ||
Diversified International Fund | Intrinsic Value Fund | Small/Mid Cap Value Fund | ||
Diversified Small Cap Fund | Intrinsic World Equity Fund | Special Mid Cap Value Fund | ||
Emerging Growth Fund | Large Cap Core Fund | Special Small Cap Value Fund | ||
Emerging Markets Equity Fund | Large Cap Growth Fund | Specialized Technology Fund | ||
Emerging Markets Equity Income Fund | Large Company Value Fund | Traditional Small Cap Growth Fund | ||
Endeavor Select Fund† | Omega Growth Fund | Utility and Telecommunications Fund | ||
| Bond Funds | ||||
Adjustable Rate Government Fund | Inflation-Protected Bond Fund | Short-Term Bond Fund | ||
California Limited-Term Tax-Free Fund | Intermediate Tax/AMT-Free Fund | Short-Term High Yield Bond Fund | ||
California Tax-Free Fund | International Bond Fund | Short-Term Municipal Bond Fund | ||
Colorado Tax-Free Fund | Minnesota Tax-Free Fund | Strategic Municipal Bond Fund | ||
Emerging Markets Local Bond Fund | Municipal Bond Fund | Total Return Bond Fund | ||
Government Securities Fund | North Carolina Tax-Free Fund | Ultra Short-Term Income Fund | ||
High Income Fund | Pennsylvania Tax-Free Fund | Ultra Short-Term Municipal Income Fund | ||
High Yield Bond Fund | Short Duration Government Bond Fund | Wisconsin Tax-Free Fund | ||
Income Plus Fund | ||||
| Asset Allocation Funds | ||||
Absolute Return Fund | WealthBuilder Equity Portfolio† | Target 2020 Fund† | ||
Asset Allocation Fund | WealthBuilder Growth Allocation Portfolio† | Target 2025 Fund† | ||
Conservative Allocation Fund | WealthBuilder Growth Balanced Portfolio† | Target 2030 Fund† | ||
Diversified Capital Builder Fund | WealthBuilder Moderate Balanced Portfolio† | Target 2035 Fund† | ||
Diversified Income Builder Fund | WealthBuilder Tactical Equity Portfolio† | Target 2040 Fund† | ||
Growth Balanced Fund | Target Today Fund† | Target 2045 Fund† | ||
Index Asset Allocation Fund | Target 2010 Fund† | Target 2050 Fund† | ||
Moderate Balanced Fund | Target 2015 Fund† | Target 2055 Fund† | ||
WealthBuilder Conservative Allocation Portfolio† | ||||
| Money Market Funds | ||||
100% Treasury Money Market Fund | Heritage Money Market Fund† | National Tax-Free Money Market Fund | ||
California Municipal Money Market Fund | Money Market Fund | Prime Investment Money Market Fund | ||
Cash Investment Money Market Fund | Municipal Cash Management Money Market Fund | Treasury Plus Money Market Fund | ||
Government Money Market Fund | Municipal Money Market Fund | |||
| Variable Trust Funds1 | ||||
VT Discovery Fund† | VT Intrinsic Value Fund | VT Small Cap Growth Fund | ||
VT Index Asset Allocation Fund | VT Omega Growth Fund | VT Small Cap Value Fund | ||
VT International Equity Fund | VT Opportunity Fund† | VT Total Return Bond Fund |
An investment in a money market fund is not insured or guaranteed by the Federal Deposit Insurance Corporation or any other government agency. Although the Wells Fargo Advantage Money Market Funds seek to preserve the value of your investment at $1.00 per share, it is possible to lose money by investing in a money market fund.
| 1. | The Variable Trust Funds are generally available only through insurance company variable contracts. |
| † | In this report, the Wells Fargo Advantage Discovery FundSM, Wells Fargo Advantage Endeavor Select FundSM, Wells Fargo Advantage Enterprise FundSM, Wells Fargo Advantage Opportunity FundSM, Wells Fargo Advantage WealthBuilder Conservative Allocation PortfolioSM, Wells Fargo Advantage WealthBuilder Equity PortfolioSM, Wells Fargo Advantage WealthBuilder Growth Allocation PortfolioSM, Wells Fargo Advantage WealthBuilder Growth Balanced PortfolioSM, Wells Fargo Advantage WealthBuilder Moderate Balanced PortfolioSM, Wells Fargo Advantage WealthBuilder Tactical Equity PortfolioSM, Wells Fargo Advantage Dow Jones Target Today FundSM, Wells Fargo Advantage Dow Jones Target 2010 FundSM, Wells Fargo Advantage Dow Jones Target 2015 FundSM, Wells Fargo Advantage Dow Jones Target 2020 FundSM, Wells Fargo Advantage Dow Jones Target 2025 FundSM, Wells Fargo Advantage Dow Jones Target 2030 FundSM, Wells Fargo Advantage Dow Jones Target 2035 FundSM, Wells Fargo Advantage Dow Jones Target 2040 FundSM, Wells Fargo Advantage Dow Jones Target 2045 FundSM, Wells Fargo Advantage Dow Jones Target 2050 FundSM, Wells Fargo Advantage Dow Jones Target 2055 FundSM, Wells Fargo Advantage Heritage Money Market FundSM, Wells Fargo Advantage VT Discovery FundSM, and Wells Fargo Advantage VT Opportunity FundSM are referred to as the Discovery Fund, Endeavor Select Fund, Enterprise Fund, Opportunity Fund, WealthBuilder Conservative Allocation Portfolio, WealthBuilder Equity Portfolio, WealthBuilder Growth Allocation Portfolio, WealthBuilder Growth Balanced Portfolio, WealthBuilder Moderate Balanced Portfolio, WealthBuilder Tactical Equity Portfolio, Target Today Fund, Target 2010 Fund, Target 2015 Fund, Target 2020 Fund, Target 2025 Fund, Target 2030 Fund, Target 2035 Fund, Target 2040 Fund, Target 2045 Fund, Target 2050 Fund, Target 2055 Fund, Heritage Money Market Fund, VT Discovery Fund, and VT Opportunity Fund, respectively. |
Not part of semi-annual report.
Table of Contents
| 2 | Wells Fargo Advantage VT Index Asset Allocation Fund | Letter to Shareholders (Unaudited) |

Karla M. Rabusch,
President
Wells Fargo Advantage Funds
The financial markets throughout most of the six-month period may best be described as a risk-on/risk-off trading environment in response to the uncertainty about the sustainability of the U.S. economic recovery and ongoing concerns about the overall health of the eurozone.
On balance, positive news outweighed negative news during the six-month period, resulting in positive performance across the U.S. financial markets.
Dear Valued Shareholder:
We are pleased to provide you with this semi-annual report for the Wells Fargo Advantage VT Index Asset Allocation Fund for the six-month period that ended June 30, 2012.
The financial markets throughout most of the six-month period may best be described as a risk-on/risk-off trading environment in response to the uncertainty about the sustainability of the U.S. economic recovery and ongoing concerns about the overall health of the eurozone. When uncertainty was high, investors sold riskier assets such as high-beta1 equities, commodities, emerging markets securities, and high-yield bonds in preference for the relative safety of U.S. Treasuries. In periods of low volatility, investor risk tolerance dramatically rose and the markets sought out the higher yield and return potential of those riskier investments.
During the first quarter of 2012, investor sentiment appeared to be more positive and balanced. This recent shift in sentiment seemed to be the result of improvement in the global macroeconomic backdrop, which contributed to a less volatile market environment and a more stable consensus earnings growth outlook. These developments also encouraged investors to refocus on underlying fundamentals, sparking the first-quarter equity rally that was led by stocks and sectors that were shunned at points in 2011, notably retail and higher-growth information technology names—especially within the U.S. markets.
The momentum of the first quarter faded during April and May as softening global economic data and political leadership changes in France and Greece raised more immediate questions about the future of the European Union and its euro currency. In June, investors were encouraged by the successful formation of a new government in Greece, an uneventful bailout of several Spanish banks, and some progress among European leaders about how to handle their ongoing fiscal challenges. In addition, the Federal Reserve extended “Operation Twist”—a stimulus program designed to keep long-term rates low—in response to U.S. economic data that confirmed a slowdown in economic activity during the period.
On balance, positive news outweighed negative news during the six-month period, resulting in positive performance across the U.S. financial markets. The S&P 500 Index2 and the Russell 3000® Index3—which measure the broad U.S. equity market—posted total returns of 9.49% and 9.32%, respectively, for the reporting period. By comparison, the Barclays U.S. Aggregate Bond Index4, representing the universe of U.S. investment-grade taxable bonds, returned 2.37%, and the Barclays U.S. Treasury Index5, which is composed of U.S. Treasury securities, returned 1.51% for the six-month period.
The global economic activity slowed during the period.
Many global economies showed some signs of improvement early in the period, but the pace slowed primarily due to persistently sluggish job growth and a flat housing market affecting the U.S., in addition to the ongoing fiscal concerns affecting the eurozone.
| 1. | Beta measures fund volatility relative to general market movements. It is a standardized measure of systematic risk in comparison to a specified index. The benchmark beta is 1.00 by definition. Beta is based on historical performance and does not represent future results. |
| 2. | The S&P 500 Index consists of 500 stocks chosen for market size, liquidity, and industry group representation. It is a market-value-weighted index with each stock’s weight in the index proportionate to its market value. You cannot invest directly in an index. |
| 3. | The Russell 3000® Index measures the performance of the 3,000 largest U.S. companies based on total market capitalization, which represents approximately 98% of the investable U.S. equity market. You cannot invest directly in an index. |
| 4. | The Barclays U.S. Aggregate Bond Index is composed of the Barclays Government/Credit Index and the Mortgage-Backed Securities Index and includes U.S. Treasury issues, agency issues, corporate bond issues, and mortgage-backed securities. You cannot invest directly in an index. |
Table of Contents
| Letter to Shareholders (Unaudited) | Wells Fargo Advantage VT Index Asset Allocation Fund | 3 |
During the six-month period, the U.S. Bureau of Economic Analysis reported that U.S. gross domestic product (GDP) accelerated to an annual growth rate of 3.0% in the fourth quarter of 2011, reigniting hopes of a sustainable U.S. economic recovery in 2012. Those hopes were buoyed further in April 2012 by the advance estimate of first-quarter 2012 GDP, which remained positive with a 2.2% annual rate. However, in May 2012, that estimate of first-quarter 2012 GDP was revised lower to a 1.9% annual rate.
Global policy makers remained committed to accommodative policies.
Throughout the six-month period, the U.S. Federal Reserve (Fed) remained committed to an expansionary monetary policy to help stimulate growth in the U.S. economy. Citing that inflation remained subdued, the Fed held its target range for the federal funds rate—a proxy for short-term interest rates—steady at 0% to 0.25%. The Fed also reiterated its belief that economic conditions were likely to warrant exceptionally low levels for the federal funds rate through late 2014 following the FOMC meeting on January 25, 2012. Additionally, in June 2012, the Fed extended its “Operation Twist”—a stimulus program that is designed to keep intermediate- and longer-term yields relatively low. By keeping longer-term yields low, lending activity may increase and potentially spark business investments and home purchases that, in turn, may provide support for a more sustainable economic recovery.
The European Central Bank (ECB) also continued to maintain an accommodative monetary policy throughout the period, primarily in an effort to stave off the contagion risk stemming from the ongoing concerns about the potential of Greece defaulting on its sovereign bonds. Fortunately, Greece received another bailout and was able to restructure its outstanding debt in February 2012, which alleviated near-term contagion risks and the possibility of the euro collapsing. However, the agreement does not fully address longer-term structural issues that affect not only Greece but several other countries across the eurozone.
Recognizing the drag the persistent sovereign debt crisis has had on financial stability across the eurozone, the ECB introduced additional liquidity into the European banking system through its Long-Term Refinancing Operation (LTRO). The LTRO effectively encourages European banks to buy sovereign bonds of the eurozone governments, helping to push yields lower on bonds from financially fragile countries like Spain and Italy. This type of activity helps reduce the near-term risk that those countries will experience funding issues. From a global market perspective, this additional liquidity further helps alleviate fears of contagion and may cause risk premiums to decline.
Recent events have not altered our message to shareholders.
The heightened volatility of the past six months and lingering uncertainties about the global economic outlook going forward have left many investors questioning their resolve—and their investments. Yet, it is precisely at such times that the market may present opportunities—as well as challenges—for prudent investors. For many investors, simply building and maintaining a well-diversified6 investment plan focused on clear financial objectives is the best long-term strategy.
| 5. | The Barclays U.S. Treasury Index is an unmanaged index of prices of U.S. Treasury bonds with maturities of one to 30 years. You cannot invest directly in an index. |
Table of Contents
| 4 | Wells Fargo Advantage VT Index Asset Allocation Fund | Letter to Shareholders (Unaudited) |
Thank you for choosing to invest with Wells Fargo Advantage Funds. We appreciate your confidence in us and remain committed to helping you meet your financial needs. For current information about your fund investments, contact your investment professional, visit our Web site at wellsfargoadvantagefunds.com, or call us directly at 1-800-222-8222. We are available 24 hours a day, 7 days a week.
Sincerely,

Karla M. Rabusch
President
Wells Fargo Advantage Funds
| 6. | Diversification does not assure or guarantee better performance and cannot eliminate the risk of investment losses. |
Table of Contents
| Performance Highlights (Unaudited) | Wells Fargo Advantage VT Index Asset Allocation Fund | 5 |
INVESTMENT OBJECTIVE
The Fund seeks long-term total return, consisting of capital appreciation and current income.
ADVISER
Wells Fargo Funds Management, LLC
SUB-ADVISER
Wells Capital Management Incorporated
PORTFOLIO MANAGERS
Petros Bocray, CFA
Jeffrey P. Mellas, CAIA
FUND INCEPTION
April 15, 1994
| TEN LARGEST HOLDINGS1 (AS OF JUNE 30, 2012) | ||||
US Treasury Bond, 4.38%, 05/15/2040 | 2.94% | |||
US Treasury Bond, 3.75%, 08/15/2041 | 2.89% | |||
US Treasury Bond, 4.25%, 11/15/2040 | 2.86% | |||
US Treasury Bond, 4.38%, 11/15/2039 | 2.85% | |||
US Treasury Bond, 4.62%, 02/15/2040 | 2.80% | |||
Apple Incorporated | 2.54% | |||
US Treasury Bond, 3.87%, 08/15/2040 | 2.40% | |||
US Treasury Bond, 4.38%, 05/15/2041 | 2.39% | |||
US Treasury Bond, 4.75%, 02/15/2041 | 2.22% | |||
US Treasury Bond, 4.25%, 05/15/2039 | 2.06% | |||
| NEUTRAL ALLOCATION2 (AS OF JUNE 30, 2012) | ||
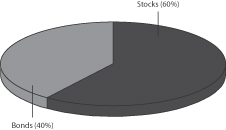 | ||
| 1. | The ten largest holdings are calculated based on the value of the securities divided by total net assets of the Fund. Holdings are subject to change and may have changed since the date specified. |
| 2. | Portfolio allocations are subject to change. Cash and cash equivalents are not reflected in the calculations of the portfolio allocations. Neutral allocation is the target allocation of the Fund as stated in the Fund’s prospectus. Current target allocation is the current allocation of the Fund based on our Tactical Asset Allocation Model as of the date specified and is subject to change. |
Table of Contents
| 6 | Wells Fargo Advantage VT Index Asset Allocation Fund | Performance Highlights (Unaudited) |
| CURRENT TARGET ALLOCATION2 (AS OF JUNE 30, 2012) | ||
 | ||
| EQUITY SECTOR DISTRIBUTION3 (AS OF JUNE 30, 2012) | ||
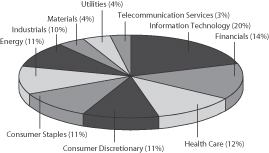 | ||
| 3. | Equity sector distribution is subject to change and is calculated based on the total long-term equity investments of the Fund. |
Table of Contents
| Performance Highlights (Unaudited) | Wells Fargo Advantage VT Index Asset Allocation Fund | 7 |
AVERAGE ANNUAL TOTAL RETURN (%) (AS OF JUNE 30, 2012)
| Expense Ratios4 | ||||||||||||||||||||||||||||
| Inception Date | 6 Months* | 1 Year | 5 Year | 10 Year | Gross | Net5 | ||||||||||||||||||||||
Class 2 | 04/15/1994 | 8.61 | 10.71 | 1.84 | 5.44 | 1.06% | 1.00% | |||||||||||||||||||||
Index Asset Allocation Composite Index6 | 7.87 | 18.94 | 6.02 | 7.64 | ||||||||||||||||||||||||
S&P 500 Index7 | 9.49 | 5.45 | 0.22 | 5.33 | ||||||||||||||||||||||||
Barclays U.S. Treasury 20+ Year Index8 | 4.27 | 37.20 | 12.46 | 9.27 | ||||||||||||||||||||||||
| * | Returns for periods of less than one year are not annualized. |
Figures quoted represent past performance, which is no guarantee of future results and do not reflect the deduction of taxes that a shareholder may pay on fund distributions or the redemption of fund shares. Investment return and principal value of an investment will fluctuate so that an investor’s shares, when redeemed, may be worth more or less than their original cost. Current performance may be lower or higher than the performance data quoted and assumes the reinvestment of dividends and capital gains. Current month-end performance is available by calling 1-866-765-0778. Performance figures of the Fund do not reflect fees charged pursuant to the terms of variable life insurance policies and variable annuity contracts.
Index returns do not include transaction costs associated with buying and selling securities, any mutual fund fees or expenses or any taxes. It is not possible to invest directly in an index.
Balanced funds may invest in stocks and bonds. Stock values fluctuate in response to the activities of individual companies and general market and economic conditions. Bond values fluctuate in response to the financial condition of individual issuers, general market and economic conditions, and changes in interest rates. In general, when interest rates rise, bond values fall and investors may lose principal value. The use of derivatives may reduce returns and/or increase volatility. Consult the Fund’s prospectus for additional information on these and other risks.
Please refer to the prospectus provided by your participating insurance company for detailed information describing the separate accounts for information regarding surrender charges, mortality and expense risk fees and other charges that may be assessed by the participating insurance companies.
| 4. | Reflects the expense ratio as stated in the most recent prospectus. |
| 5. | The Adviser has committed through April 30, 2013 to waive fees and/or reimburse expenses to the extent necessary to cap the Fund’s Total Annual Fund Operating Expenses After Fee Waiver, excluding certain expenses, at the amount shown above. Without this cap, the Fund’s returns would have been lower. |
| 6. | The Index Asset Allocation Composite Index is weighted 60% in the S&P 500 Index and 40% in the Barclays U.S. Treasury 20+ Year Index. You cannot invest directly in an index. |
| 7. | The S&P 500 Index consists of 500 stocks chosen for market size, liquidity, and industry group representation. It is a market value weighted index with each stock’s weight in the index proportionate to its market value. You cannot invest directly in an index. |
| 8. | The Barclays U.S. Treasury 20+ Year Index is an unmanaged index composed of securities in the U.S. Treasury Index with maturities of 20 years or greater. You cannot invest directly in an index. |
Table of Contents
| 8 | Wells Fargo Advantage VT Index Asset Allocation Fund | Fund Expenses (Unaudited) |
As a shareholder of the Fund, you incur ongoing costs, including management fees distribution (12b-1) fees and other Fund expenses. This example is intended to help you understand your ongoing costs (in dollars) of investing in the Fund and to compare these costs with the ongoing costs of investing in other mutual funds.
The example is based on an investment of $1,000 invested at the beginning of the six-month period and held for the entire period from January 1, 2012 to June 30, 2012.
Actual Expenses
The “Actual” line of the table below provides information about actual account values and actual expenses. You may use the information in this line, together with the amount you invested, to estimate the expenses that you paid over the period. Simply divide your account value by $1,000 (for example, an $8,600 account value divided by $1,000 = 8.6), then multiply the result by the number in the “Actual” line under the heading entitled “Expenses Paid During Period” for your applicable class of shares to estimate the expenses you paid on your account during this period.
Hypothetical Example for Comparison Purposes
The “Hypothetical” line of the table below provides information about hypothetical account values and hypothetical expenses based on the Fund��s actual expense ratio and an assumed rate of return of 5% per year before expenses, which is not the Fund’s actual return. The hypothetical account values and expenses may not be used to estimate the actual ending account balance or expenses you paid for the period. You may use this information to compare the ongoing costs of investing in the Fund and other funds. To do so, compare this 5% hypothetical example with the 5% hypothetical examples that appear in the shareholder reports of the other funds.
Please note that the expenses shown in the table are meant to highlight your ongoing costs only and do not reflect any separate account charges assessed by participating insurance companies. Therefore, the “Hypothetical” line of the table is useful in comparing ongoing costs only, and will not help you determine the relative total costs of owning different funds. In addition, if these separate account charges assessed by participating insurance companies were included, your costs would have been higher.
| Beginning Account Value 01-01-2012 | Ending Account Value 06-30-2012 | Expenses Paid During the Period1 | Net Annual Expense Ratio | |||||||||||||
Class 2 | ||||||||||||||||
Actual | $ | 1,000.00 | $ | 1,086.14 | $ | 5.19 | 1.00 | % | ||||||||
Hypothetical (5% return before expenses) | $ | 1,000.00 | $ | 1,019.89 | $ | 5.02 | 1.00 | % | ||||||||
| 1. | Expenses paid is equal to the annualized expense ratio multiplied by the average account value over the period, multiplied by the number of days in the most recent fiscal half-year divided by the number of days in the fiscal year (to reflect the one-half year period). |
Table of Contents
| Portfolio of Investments—June 30, 2012 (Unaudited) | Wells Fargo Advantage VT Index Asset Allocation Fund | 9 |
| Security Name | Shares | Value | ||||||||||
Common Stocks: 57.21% | ||||||||||||
Consumer Discretionary: 6.32% | ||||||||||||
| Auto Components: 0.14% | ||||||||||||
BorgWarner Incorporated Ǡ | 472 | $ | 30,958 | |||||||||
Johnson Controls Incorporated | 2,798 | 77,533 | ||||||||||
The Goodyear Tire & Rubber Company † | 1,007 | 11,893 | ||||||||||
| 120,384 | ||||||||||||
|
| |||||||||||
| Automobiles: 0.22% | ||||||||||||
Ford Motor Company | 15,700 | 150,563 | ||||||||||
Harley-Davidson Incorporated | 952 | 43,535 | ||||||||||
| 194,098 | ||||||||||||
|
| |||||||||||
| Distributors: 0.04% | ||||||||||||
Genuine Parts Company « | 642 | 38,681 | ||||||||||
|
| |||||||||||
| Diversified Consumer Services: 0.05% | ||||||||||||
Apollo Group Incorporated Class A † | 442 | 15,996 | ||||||||||
DeVry Incorporated | 242 | 7,495 | ||||||||||
H&R Block Incorporated | 1,208 | 19,304 | ||||||||||
| 42,795 | ||||||||||||
|
| |||||||||||
| Hotels, Restaurants & Leisure: 1.10% | ||||||||||||
Carnival Corporation « | 1,864 | 63,879 | ||||||||||
Chipotle Mexican Grill Incorporated Ǡ | 130 | 49,394 | ||||||||||
Darden Restaurants Incorporated « | 529 | 26,783 | ||||||||||
International Game Technology | 1,214 | 19,121 | ||||||||||
Marriott International Incorporated Class A « | 1,089 | 42,689 | ||||||||||
McDonald’s Corporation | 4,181 | 370,144 | ||||||||||
Starbucks Corporation | 3,121 | 166,412 | ||||||||||
Starwood Hotels & Resorts Worldwide Incorporated | 813 | 43,122 | ||||||||||
Wyndham Worldwide Corporation « | 600 | 31,644 | ||||||||||
Wynn Resorts Limited | 327 | 33,916 | ||||||||||
Yum! Brands Incorporated « | 1,895 | 122,076 | ||||||||||
| 969,180 | ||||||||||||
|
| |||||||||||
| Household Durables: 0.19% | ||||||||||||
D.R. Horton Incorporated « | 1,153 | 21,192 | ||||||||||
Harman International Industries Incorporated | 290 | 11,484 | ||||||||||
Leggett & Platt Incorporated | 577 | 12,192 | ||||||||||
Lennar Corporation « | 670 | 20,710 | ||||||||||
Newell Rubbermaid Incorporated | 1,193 | 21,641 | ||||||||||
Pulte Homes Incorporated † | 1,389 | 14,862 | ||||||||||
Stanley Black & Decker Incorporated | 703 | 45,245 | ||||||||||
Whirlpool Corporation | 318 | 19,449 | ||||||||||
| 166,775 | ||||||||||||
|
| |||||||||||
The accompanying notes are an integral part of these financial statements.
Table of Contents
| 10 | Wells Fargo Advantage VT Index Asset Allocation Fund | Portfolio of Investments—June 30, 2012 (Unaudited) |
| Security Name | Shares | Value | ||||||||||
| Internet & Catalog Retail: 0.59% | ||||||||||||
Amazon.com Incorporated † | 1,483 | $ | 338,643 | |||||||||
Expedia Incorporated « | 371 | 17,834 | ||||||||||
Netflix Incorporated † | 228 | 15,611 | ||||||||||
priceline.com Incorporated † | 205 | 136,227 | ||||||||||
TripAdvisor Incorporated † | 392 | 17,518 | ||||||||||
| 525,833 | ||||||||||||
|
| |||||||||||
| Leisure Equipment & Products: 0.07% | ||||||||||||
Hasbro Incorporated | 480 | 16,258 | ||||||||||
Mattel Incorporated | 1,401 | 45,448 | ||||||||||
| 61,706 | ||||||||||||
|
| |||||||||||
| Media: 1.95% | ||||||||||||
Cablevision Systems Corporation New York Group Class A | 881 | 11,708 | ||||||||||
CBS Corporation Class B | 2,666 | 87,391 | ||||||||||
Comcast Corporation Class A | 11,092 | 354,611 | ||||||||||
DIRECTV Group Incorporated † | 2,694 | 131,521 | ||||||||||
Discovery Communications Incorporated Class C Ǡ | 1,049 | 56,646 | ||||||||||
Gannett Company Incorporated « | 966 | 14,229 | ||||||||||
Interpublic Group of Companies Incorporated | 1,823 | 19,780 | ||||||||||
McGraw-Hill Companies Incorporated | 1,151 | 51,795 | ||||||||||
News Corporation Class A | 8,667 | 193,187 | ||||||||||
Omnicom Group Incorporated « | 1,121 | 54,481 | ||||||||||
Scripps Networks Interactive Incorporated | 381 | 21,664 | ||||||||||
Time Warner Cable Incorporated | 1,286 | 105,581 | ||||||||||
Time Warner Incorporated | 3,949 | 152,037 | ||||||||||
Viacom Incorporated Class B | 2,171 | 102,080 | ||||||||||
Walt Disney Company | 7,353 | 356,621 | ||||||||||
Washington Post Company Class B | 20 | 7,476 | ||||||||||
| 1,720,808 | ||||||||||||
|
| |||||||||||
| Multiline Retail: 0.46% | ||||||||||||
Big Lots Incorporated Ǡ | 262 | 10,687 | ||||||||||
Dollar Tree Incorporated † | 954 | 51,325 | ||||||||||
Family Dollar Stores Incorporated | 480 | 31,910 | ||||||||||
JCPenney Company Incorporated « | 603 | 14,056 | ||||||||||
Kohl’s Corporation « | 986 | 44,853 | ||||||||||
Macy’s Incorporated | 1,699 | 58,361 | ||||||||||
Nordstrom Incorporated | 659 | 32,746 | ||||||||||
Sears Holdings Corporation Ǡ | 157 | 9,373 | ||||||||||
Target Corporation | 2,720 | 158,277 | ||||||||||
| 411,588 | ||||||||||||
|
| |||||||||||
| Specialty Retail: 1.17% | ||||||||||||
Abercrombie & Fitch Company Class A « | 340 | 11,608 | ||||||||||
AutoNation Incorporated Ǡ | 171 | 6,033 | ||||||||||
AutoZone Incorporated Ǡ | 109 | 40,022 | ||||||||||
Bed Bath & Beyond Incorporated † | 956 | 59,081 | ||||||||||
Best Buy Company Incorporated | 1,140 | 23,894 | ||||||||||
The accompanying notes are an integral part of these financial statements.
Table of Contents
| Portfolio of Investments—June 30, 2012 (Unaudited) | Wells Fargo Advantage VT Index Asset Allocation Fund | 11 |
| Security Name | Shares | Value | ||||||||||
| Specialty Retail (continued) | ||||||||||||
CarMax Incorporated Ǡ | 939 | $ | 24,358 | |||||||||
GameStop Corporation Class A | 536 | 9,841 | ||||||||||
Gap Incorporated | 1,369 | 37,456 | ||||||||||
Home Depot Incorporated « | 6,297 | 333,678 | ||||||||||
Limited Brands Incorporated | 994 | 42,275 | ||||||||||
Lowe’s Companies Incorporated | 4,841 | 137,678 | ||||||||||
O’Reilly Automotive Incorporated † | 519 | 43,477 | ||||||||||
Ross Stores Incorporated | 928 | 57,972 | ||||||||||
Staples Incorporated « | 2,835 | 36,997 | ||||||||||
Tiffany & Company « | 521 | 27,587 | ||||||||||
TJX Companies Incorporated | 3,048 | 130,851 | ||||||||||
Urban Outfitters Incorporated Ǡ | 459 | 12,664 | ||||||||||
| 1,035,472 | ||||||||||||
|
| |||||||||||
| Textiles, Apparel & Luxury Goods: 0.34% | ||||||||||||
Coach Incorporated | 1,182 | 69,123 | ||||||||||
Fossil Incorporated † | 214 | 16,380 | ||||||||||
Nike Incorporated Class B | 1,509 | 132,460 | ||||||||||
Ralph Lauren Corporation | 267 | 37,396 | ||||||||||
VF Corporation | 356 | 47,508 | ||||||||||
| 302,867 | ||||||||||||
|
| |||||||||||
Consumer Staples: 6.46% | ||||||||||||
| Beverages: 1.56% | ||||||||||||
Beam Incorporated | 648 | 40,494 | ||||||||||
Brown-Forman Corporation Class B | 409 | 39,612 | ||||||||||
Coca-Cola Enterprises Incorporated | 1,234 | 34,601 | ||||||||||
Constellation Brands Incorporated Class A † | 668 | 18,076 | ||||||||||
Dr Pepper Snapple Group Incorporated « | 871 | 38,106 | ||||||||||
Molson Coors Brewing Company | 647 | 26,922 | ||||||||||
PepsiCo Incorporated | 6,434 | 454,626 | ||||||||||
The Coca-Cola Company | 9,281 | 725,681 | ||||||||||
| 1,378,118 | ||||||||||||
|
| |||||||||||
| Food & Staples Retailing: 1.38% | ||||||||||||
Costco Wholesale Corporation | 1,778 | 168,910 | ||||||||||
CVS Caremark Corporation | 5,272 | 246,361 | ||||||||||
Kroger Company « | 2,308 | 53,523 | ||||||||||
Safeway Incorporated « | 989 | 17,950 | ||||||||||
Sysco Corporation « | 2,409 | 71,812 | ||||||||||
Wal-Mart Stores Incorporated « | 7,099 | 494,942 | ||||||||||
Walgreen Company | 3,549 | 104,979 | ||||||||||
Whole Foods Market Incorporated | 672 | 64,055 | ||||||||||
| 1,222,532 | ||||||||||||
|
| |||||||||||
| Food Products: 1.05% | ||||||||||||
Archer Daniels Midland Company | 2,709 | 79,970 | ||||||||||
Campbell Soup Company « | 728 | 24,301 | ||||||||||
The accompanying notes are an integral part of these financial statements.
Table of Contents
| 12 | Wells Fargo Advantage VT Index Asset Allocation Fund | Portfolio of Investments—June 30, 2012 (Unaudited) |
| Security Name | Shares | Value | ||||||||||
| Food Products (continued) | ||||||||||||
ConAgra Foods Incorporated | 1,709 | $ | 44,314 | |||||||||
De Master Blenders1753 NV † | 2,441 | 27,524 | ||||||||||
Dean Foods Company † | 759 | 12,926 | ||||||||||
General Mills Incorporated « | 2,663 | 102,632 | ||||||||||
H.J. Heinz Company « | 1,316 | 71,564 | ||||||||||
Hillshire Brands Company | 488 | 14,153 | ||||||||||
Hormel Foods Corporation « | 564 | 17,157 | ||||||||||
JM Smucker Company | 466 | 35,192 | ||||||||||
Kellogg Company | 1,015 | 50,070 | ||||||||||
Kraft Foods Incorporated Class A | 7,294 | 281,694 | ||||||||||
McCormick & Company Incorporated « | 546 | 33,115 | ||||||||||
Mead Johnson & Company | 839 | 67,548 | ||||||||||
The Hershey Company | 626 | 45,091 | ||||||||||
Tyson Foods Incorporated Class A | 1,188 | 22,370 | ||||||||||
| 929,621 | ||||||||||||
|
| |||||||||||
| Household Products: 1.21% | ||||||||||||
Clorox Company « | 535 | 38,766 | ||||||||||
Colgate-Palmolive Company | 1,963 | 204,348 | ||||||||||
Kimberly-Clark Corporation | 1,613 | 135,121 | ||||||||||
Procter & Gamble Company | 11,272 | 690,410 | ||||||||||
| 1,068,645 | ||||||||||||
|
| |||||||||||
| Personal Products: 0.09% | ||||||||||||
Avon Products Incorporated | 1,776 | 28,789 | ||||||||||
Estee Lauder Companies Incorporated Class A | 927 | 50,169 | ||||||||||
| 78,958 | ||||||||||||
|
| |||||||||||
| Tobacco: 1.17% | ||||||||||||
Altria Group Incorporated | 8,371 | 289,218 | ||||||||||
Lorillard Incorporated | 537 | 70,857 | ||||||||||
Philip Morris International | 7,017 | 612,303 | ||||||||||
Reynolds American Incorporated | 1,364 | 61,203 | ||||||||||
| 1,033,581 | ||||||||||||
|
| |||||||||||
Energy: 6.18% | ||||||||||||
| Energy Equipment & Services: 0.95% | ||||||||||||
Baker Hughes Incorporated | 1,804 | 74,144 | ||||||||||
Cameron International Corporation † | 1,013 | 43,265 | ||||||||||
Diamond Offshore Drilling Incorporated « | 286 | 16,911 | ||||||||||
FMC Technologies Incorporated † | 984 | 38,602 | ||||||||||
Halliburton Company | 3,797 | 107,797 | ||||||||||
Helmerich & Payne Incorporated | 442 | 19,218 | ||||||||||
Nabors Industries Limited † | 1,194 | 17,194 | ||||||||||
National Oilwell Varco Incorporated | 1,753 | 112,963 | ||||||||||
Noble Corporation | 1,038 | 33,766 | ||||||||||
Rowan Companies plc † | 511 | 16,521 | ||||||||||
Schlumberger Limited | 5,486 | 356,096 | ||||||||||
| 836,477 | ||||||||||||
|
| |||||||||||
The accompanying notes are an integral part of these financial statements.
Table of Contents
| Portfolio of Investments—June 30, 2012 (Unaudited) | Wells Fargo Advantage VT Index Asset Allocation Fund | 13 |
| Security Name | Shares | Value | ||||||||||
| Oil, Gas & Consumable Fuels: 5.23% | ||||||||||||
Alpha Natural Resources Incorporated † | 906 | $ | 7,891 | |||||||||
Anadarko Petroleum Corporation | 2,055 | 136,041 | ||||||||||
Apache Corporation « | 1,608 | 141,327 | ||||||||||
Cabot Oil & Gas Corporation | 863 | 34,002 | ||||||||||
Chesapeake Energy Corporation « | 2,725 | 50,685 | ||||||||||
Chevron Corporation | 8,117 | 856,344 | ||||||||||
ConocoPhillips Company « | 5,202 | 290,688 | ||||||||||
CONSOL Energy Incorporated « | 936 | 28,305 | ||||||||||
Denbury Resources Incorporated † | 1,607 | 24,282 | ||||||||||
Devon Energy Corporation | 1,663 | 96,437 | ||||||||||
EOG Resources Incorporated | 1,109 | 99,932 | ||||||||||
EQT Corporation | 615 | 32,982 | ||||||||||
Exxon Mobil Corporation | 19,237 | 1,646,110 | ||||||||||
Hess Corporation | 1,251 | 54,356 | ||||||||||
Kinder Morgan Incorporated | 2,077 | 66,921 | ||||||||||
Marathon Oil Corporation | 2,902 | 74,204 | ||||||||||
Marathon Petroleum Corporation | 1,402 | 62,978 | ||||||||||
Murphy Oil Corporation | 799 | 40,182 | ||||||||||
Newfield Exploration Company † | 555 | 16,267 | ||||||||||
Noble Energy Incorporated | 732 | 62,088 | ||||||||||
Occidental Petroleum Corporation | 3,336 | 286,129 | ||||||||||
Peabody Energy Corporation | 1,121 | 27,487 | ||||||||||
Phillips 66 Incorporated † | 2,572 | 85,493 | ||||||||||
Pioneer Natural Resources Company « | 506 | 44,634 | ||||||||||
QEP Resources Incorporated | 734 | 21,998 | ||||||||||
Range Resources Corporation | 667 | 41,267 | ||||||||||
Southwestern Energy Company † | 1,432 | 45,724 | ||||||||||
Spectra Energy Corporation | 2,685 | 78,026 | ||||||||||
Sunoco Incorporated | 436 | 20,710 | ||||||||||
Tesoro Petroleum Corporation † | 577 | 14,402 | ||||||||||
The Williams Companies Incorporated | 2,574 | 74,183 | ||||||||||
Valero Energy Corporation | 2,275 | 54,941 | ||||||||||
WPX Energy Incorporated † | 817 | 13,219 | ||||||||||
| 4,630,235 | ||||||||||||
|
| |||||||||||
Financials: 8.24% | ||||||||||||
| Capital Markets: 1.05% | ||||||||||||
Ameriprise Financial Incorporated | 899 | 46,982 | ||||||||||
Bank of New York Mellon Corporation | 4,906 | 107,687 | ||||||||||
BlackRock Incorporated | 527 | 89,495 | ||||||||||
Charles Schwab Corporation | 4,452 | 57,564 | ||||||||||
E*TRADE Financial Corporation † | 1,046 | 8,410 | ||||||||||
Federated Investors Incorporated Class B | 381 | 8,325 | ||||||||||
Franklin Resources Incorporated « | 584 | 64,818 | ||||||||||
Goldman Sachs Group Incorporated | 2,024 | 194,021 | ||||||||||
Invesco Limited | 1,844 | 41,674 | ||||||||||
Legg Mason Incorporated « | 517 | 13,633 | ||||||||||
Morgan Stanley | 6,265 | 91,406 | ||||||||||
Northern Trust Corporation | 992 | 45,652 | ||||||||||
The accompanying notes are an integral part of these financial statements.
Table of Contents
| 14 | Wells Fargo Advantage VT Index Asset Allocation Fund | Portfolio of Investments—June 30, 2012 (Unaudited) |
| Security Name | Shares | Value | ||||||||||
| Capital Markets (continued) | ||||||||||||
State Street Corporation | 2,010 | $ | 89,726 | |||||||||
T. Rowe Price Group Incorporated « | 1,049 | 66,045 | ||||||||||
| 925,438 | ||||||||||||
|
| |||||||||||
| Commercial Banks: 1.69% | ||||||||||||
Branch Banking & Trust Corporation | 2,874 | 88,663 | ||||||||||
Comerica Incorporated « | 809 | 24,844 | ||||||||||
Fifth Third Bancorp | 3,785 | 50,719 | ||||||||||
First Horizon National Corporation | 1,039 | 8,987 | ||||||||||
Huntington Bancshares Incorporated | 3,557 | 22,765 | ||||||||||
KeyCorp | 3,921 | 30,349 | ||||||||||
M&T Bank Corporation « | 521 | 43,019 | ||||||||||
PNC Financial Services Group Incorporated | 2,175 | 132,914 | ||||||||||
Regions Financial Corporation | 5,810 | 39,218 | ||||||||||
SunTrust Banks Incorporated | 2,214 | 53,645 | ||||||||||
US Bancorp | 7,792 | 250,591 | ||||||||||
Wells Fargo & Company (l) | 21,860 | 730,998 | ||||||||||
Zions Bancorporation « | 758 | 14,720 | ||||||||||
| 1,491,432 | ||||||||||||
|
| |||||||||||
| Consumer Finance: 0.54% | ||||||||||||
American Express Company | 4,119 | 239,767 | ||||||||||
Capital One Financial Corporation | 2,387 | 130,473 | ||||||||||
Discover Financial Services | 2,182 | 75,454 | ||||||||||
SLM Corporation | 2,007 | 31,530 | ||||||||||
| 477,224 | ||||||||||||
|
| |||||||||||
| Diversified Financial Services: 2.32% | ||||||||||||
Bank of America Corporation | 44,333 | 362,644 | ||||||||||
Berkshire Hathaway Incorporated Class B † | 7,234 | 602,809 | ||||||||||
Citigroup Incorporated | 12,062 | 330,619 | ||||||||||
CME Group Incorporated | 273 | 73,194 | ||||||||||
InterContinental Exchange Incorporated † | 299 | 40,658 | ||||||||||
JPMorgan Chase & Company | 15,660 | 559,532 | ||||||||||
Leucadia National Corporation | 815 | 17,335 | ||||||||||
Moody’s Corporation « | 813 | 29,715 | ||||||||||
NASDAQ Stock Market Incorporated | 504 | 11,426 | ||||||||||
NYSE Euronext Incorporated | 1,045 | 26,731 | ||||||||||
| 2,054,663 | ||||||||||||
|
| |||||||||||
| Insurance: 1.36% | ||||||||||||
ACE Limited | 1,393 | 103,263 | ||||||||||
AFLAC Incorporated | 1,924 | 81,943 | ||||||||||
Allstate Corporation « | 2,021 | 70,917 | ||||||||||
American International Group Incorporated † | 2,631 | 84,429 | ||||||||||
AON plc | 1,343 | 62,826 | ||||||||||
Assurant Incorporated | 353 | 12,299 | ||||||||||
Chubb Corporation | 1,110 | 80,830 | ||||||||||
Cincinnati Financial Corporation « | 668 | 25,431 | ||||||||||
The accompanying notes are an integral part of these financial statements.
Table of Contents
| Portfolio of Investments—June 30, 2012 (Unaudited) | Wells Fargo Advantage VT Index Asset Allocation Fund | 15 |
| Security Name | Shares | Value | ||||||||||
| Insurance (continued) | ||||||||||||
Genworth Financial Incorporated † | 2,022 | $ | 11,445 | |||||||||
Lincoln National Corporation | 1,174 | 25,675 | ||||||||||
Loews Corporation | 1,257 | 51,424 | ||||||||||
Marsh & McLennan Companies Incorporated | 2,245 | 72,356 | ||||||||||
MetLife Incorporated | 4,369 | 134,784 | ||||||||||
Principal Financial Group Incorporated | 1,235 | 32,394 | ||||||||||
Prudential Financial Incorporated | 1,929 | 93,421 | ||||||||||
The Hartford Financial Services Group Incorporated | 1,814 | 31,981 | ||||||||||
The Progressive Corporation « | 2,508 | 52,242 | ||||||||||
The Travelers Companies Incorporated | 1,600 | 102,144 | ||||||||||
Torchmark Corporation « | 405 | 20,473 | ||||||||||
UnumProvident Corporation | 1,176 | 22,497 | ||||||||||
XL Group plc | 1,282 | 26,973 | ||||||||||
| 1,199,747 | ||||||||||||
|
| |||||||||||
| Real Estate Management & Development: 0.02% | ||||||||||||
CBRE Group Incorporated † | 1,349 | 22,070 | ||||||||||
|
| |||||||||||
| REITs: 1.23% | ||||||||||||
American Tower Corporation | 1,623 | 113,464 | ||||||||||
Apartment Investment & Management Company Class A | 545 | 14,731 | ||||||||||
AvalonBay Communities Incorporated | 392 | 55,460 | ||||||||||
Boston Properties Incorporated | 616 | 66,756 | ||||||||||
Equity Residential Corporation | 1,237 | 77,139 | ||||||||||
HCP Incorporated | 1,726 | 76,203 | ||||||||||
Health Care REIT Incorporated | 879 | 51,246 | ||||||||||
Host Hotels & Resorts Incorporated « | 2,955 | 46,748 | ||||||||||
Kimco Realty Corporation « | 1,674 | 31,856 | ||||||||||
Plum Creek Timber Company | 665 | 26,401 | ||||||||||
Prologis Incorporated | 1,894 | 62,938 | ||||||||||
Public Storage Incorporated | 586 | 84,624 | ||||||||||
Simon Property Group Incorporated | 1,247 | 194,108 | ||||||||||
Ventas Incorporated « | 1,189 | 75,050 | ||||||||||
Vornado Realty Trust | 764 | 64,161 | ||||||||||
Weyerhaeuser Company | 2,211 | 49,438 | ||||||||||
| 1,090,323 | ||||||||||||
|
| |||||||||||
| Thrifts & Mortgage Finance: 0.03% | ||||||||||||
Hudson City Bancorp Incorporated | 2,173 | 13,842 | ||||||||||
People’s United Financial Incorporated | 1,464 | 16,997 | ||||||||||
| 30,839 | ||||||||||||
|
| |||||||||||
Health Care: 6.86% | ||||||||||||
| Biotechnology: 0.82% | ||||||||||||
Alexion Pharmaceuticals Incorporated Ǡ | 790 | 78,447 | ||||||||||
Amgen Incorporated | 3,199 | 233,655 | ||||||||||
Biogen Idec Incorporated † | 985 | 142,214 | ||||||||||
Celgene Corporation † | 1,812 | 116,258 | ||||||||||
Gilead Sciences Incorporated † | 3,116 | 159,788 | ||||||||||
| 730,362 | ||||||||||||
|
| |||||||||||
The accompanying notes are an integral part of these financial statements.
Table of Contents
| 16 | Wells Fargo Advantage VT Index Asset Allocation Fund | Portfolio of Investments—June 30, 2012 (Unaudited) |
| Security Name | Shares | Value | ||||||||||
| Health Care Equipment & Supplies: 1.03% | ||||||||||||
Baxter International Incorporated | 2,265 | $ | 120,385 | |||||||||
Becton Dickinson & Company « | 834 | 62,342 | ||||||||||
Boston Scientific Corporation † | 5,880 | 33,340 | ||||||||||
C.R. Bard Incorporated | 345 | 37,067 | ||||||||||
CareFusion Corporation † | 913 | 23,446 | ||||||||||
Covidien plc | 1,984 | 106,144 | ||||||||||
DENTSPLY International Incorporated « | 583 | 22,043 | ||||||||||
Edwards Lifesciences Corporation † | 471 | 48,654 | ||||||||||
Intuitive Surgical Incorporated Ǡ | 163 | 90,268 | ||||||||||
Medtronic Incorporated | 4,281 | 165,803 | ||||||||||
St. Jude Medical Incorporated | 1,291 | 51,524 | ||||||||||
Stryker Corporation | 1,332 | 73,393 | ||||||||||
Varian Medical Systems Incorporated Ǡ | 459 | 27,893 | ||||||||||
Zimmer Holdings Incorporated « | 725 | 46,661 | ||||||||||
| 908,963 | ||||||||||||
|
| |||||||||||
| Health Care Providers & Services: 1.16% | ||||||||||||
Aetna Incorporated | 1,429 | 55,402 | ||||||||||
AmerisourceBergen Corporation | 1,032 | 40,609 | ||||||||||
Cardinal Health Incorporated | 1,424 | 59,808 | ||||||||||
CIGNA Corporation | 1,186 | 52,184 | ||||||||||
Coventry Health Care Incorporated | 588 | 18,693 | ||||||||||
DaVita Incorporated Ǡ | 387 | 38,007 | ||||||||||
Express Scripts Holding Corporation † | 3,313 | 184,965 | ||||||||||
Humana Incorporated | 671 | 51,962 | ||||||||||
Laboratory Corporation of America Holdings Ǡ | 398 | 36,859 | ||||||||||
McKesson Corporation | 968 | 90,750 | ||||||||||
Patterson Companies Incorporated « | 361 | 12,444 | ||||||||||
Quest Diagnostics Incorporated « | 653 | 39,115 | ||||||||||
Tenet Healthcare Corporation † | 1,702 | 8,918 | ||||||||||
UnitedHealth Group Incorporated | 4,268 | 249,678 | ||||||||||
WellPoint Incorporated | 1,361 | 86,818 | ||||||||||
| 1,026,212 | ||||||||||||
|
| |||||||||||
| Health Care Technology: 0.06% | ||||||||||||
Cerner Corporation Ǡ | 603 | 49,844 | ||||||||||
|
| |||||||||||
| Life Sciences Tools & Services: 0.24% | ||||||||||||
Agilent Technologies Incorporated | 1,430 | 56,113 | ||||||||||
Life Technologies Corporation † | 735 | 33,068 | ||||||||||
PerkinElmer Incorporated | 469 | 12,100 | ||||||||||
Thermo Fisher Scientific Incorporated | 1,511 | 78,436 | ||||||||||
Waters Corporation Ǡ | 366 | 29,086 | ||||||||||
| 208,803 | ||||||||||||
|
| |||||||||||
| Pharmaceuticals: 3.55% | ||||||||||||
Abbott Laboratories | 6,472 | 417,250 | ||||||||||
Allergan Incorporated « | 1,265 | 117,101 | ||||||||||
Bristol-Myers Squibb Company | 6,949 | 249,817 | ||||||||||
The accompanying notes are an integral part of these financial statements.
Table of Contents
| Portfolio of Investments—June 30, 2012 (Unaudited) | Wells Fargo Advantage VT Index Asset Allocation Fund | 17 |
| Security Name | Shares | Value | ||||||||||
| Pharmaceuticals (continued) | ||||||||||||
Eli Lilly & Company | 4,201 | $ | 180,265 | |||||||||
Forest Laboratories Incorporated † | 1,093 | 38,244 | ||||||||||
Hospira Incorporated Ǡ | 680 | 23,786 | ||||||||||
Johnson & Johnson Services Incorporated | 11,298 | 763,293 | ||||||||||
Merck & Company Incorporated | 12,513 | 522,418 | ||||||||||
Mylan Laboratories Incorporated † | 1,763 | 37,675 | ||||||||||
Perrigo Company | 384 | 45,285 | ||||||||||
Pfizer Incorporated | 30,805 | 708,515 | ||||||||||
Watson Pharmaceuticals Incorporated † | 524 | 38,771 | ||||||||||
| 3,142,420 | ||||||||||||
|
| |||||||||||
Industrials: 5.94% | ||||||||||||
| Aerospace & Defense: 1.42% | ||||||||||||
Boeing Company | 3,082 | 228,993 | ||||||||||
General Dynamics Corporation | 1,484 | 97,885 | ||||||||||
Goodrich Corporation | 518 | 65,734 | ||||||||||
Honeywell International Incorporated | 3,205 | 178,967 | ||||||||||
L-3 Communications Holdings Incorporated | 401 | 29,678 | ||||||||||
Lockheed Martin Corporation « | 1,095 | 95,353 | ||||||||||
Northrop Grumman Corporation | 1,035 | 66,023 | ||||||||||
Precision Castparts Corporation | 598 | 98,365 | ||||||||||
Raytheon Company | 1,371 | 77,585 | ||||||||||
Rockwell Collins Incorporated « | 597 | 29,462 | ||||||||||
United Technologies Corporation | 3,749 | 283,162 | ||||||||||
| 1,251,207 | ||||||||||||
|
| |||||||||||
| Air Freight & Logistics: 0.57% | ||||||||||||
C.H. Robinson Worldwide Incorporated « | 669 | 39,157 | ||||||||||
Expeditors International of Washington Incorporated « | 874 | 33,868 | ||||||||||
FedEx Corporation | 1,297 | 118,818 | ||||||||||
United Parcel Service Incorporated Class B | 3,947 | 310,866 | ||||||||||
| 502,709 | ||||||||||||
|
| |||||||||||
| Airlines: 0.03% | ||||||||||||
Southwest Airlines Company « | 3,158 | 29,117 | ||||||||||
|
| |||||||||||
| Building Products: 0.02% | ||||||||||||
Masco Corporation | 1,469 | 20,375 | ||||||||||
|
| |||||||||||
| Commercial Services & Supplies: 0.29% | ||||||||||||
Avery Dennison Corporation « | 426 | 11,647 | ||||||||||
Cintas Corporation | 454 | 17,529 | ||||||||||
Dun & Bradstreet Corporation « | 197 | 14,020 | ||||||||||
Equifax Incorporated | 495 | 23,067 | ||||||||||
Iron Mountain Incorporated | 704 | 23,204 | ||||||||||
Pitney Bowes Incorporated « | 823 | 12,320 | ||||||||||
Republic Services Incorporated | 1,295 | 34,266 | ||||||||||
Robert Half International Incorporated | 588 | 16,799 | ||||||||||
RR Donnelley & Sons Company « | 742 | 8,733 | ||||||||||
The accompanying notes are an integral part of these financial statements.
Table of Contents
| 18 | Wells Fargo Advantage VT Index Asset Allocation Fund | Portfolio of Investments—June 30, 2012 (Unaudited) |
| Security Name | Shares | Value | ||||||||||
| Commercial Services & Supplies (continued) | ||||||||||||
Stericycle Incorporated Ǡ | 350 | $ | 32,085 | |||||||||
Waste Management Incorporated « | 1,903 | 63,560 | ||||||||||
| 257,230 | ||||||||||||
|
| |||||||||||
| Construction & Engineering: 0.09% | ||||||||||||
Fluor Corporation | 696 | 34,341 | ||||||||||
Jacobs Engineering Group Incorporated † | 531 | 20,104 | ||||||||||
Quanta Services Incorporated Ǡ | 876 | 21,085 | ||||||||||
| 75,530 | ||||||||||||
|
| |||||||||||
| Electrical Equipment: 0.30% | ||||||||||||
Cooper Industries plc | 655 | 44,658 | ||||||||||
Emerson Electric Company | 3,018 | 140,578 | ||||||||||
Rockwell Automation Incorporated | 587 | 38,777 | ||||||||||
Roper Industries Incorporated | 401 | 39,531 | ||||||||||
| 263,544 | ||||||||||||
|
| |||||||||||
| Industrial Conglomerates: 1.46% | ||||||||||||
3M Company | 2,854 | 255,718 | ||||||||||
General Electric Company | 43,587 | 908,353 | ||||||||||
Textron Incorporated « | 1,153 | 28,675 | ||||||||||
Tyco International Limited | 1,904 | 100,626 | ||||||||||
| 1,293,372 | ||||||||||||
|
| |||||||||||
| Machinery: 1.16% | ||||||||||||
Caterpillar Incorporated | 2,684 | 227,898 | ||||||||||
Cummins Incorporated | 791 | 76,656 | ||||||||||
Danaher Corporation | 2,366 | 123,221 | ||||||||||
Deere & Company « | 1,636 | 132,303 | ||||||||||
Dover Corporation | 756 | 40,529 | ||||||||||
Eaton Corporation | 1,389 | 55,046 | ||||||||||
Flowserve Corporation « | 225 | 25,819 | ||||||||||
Illinois Tool Works Incorporated « | 1,964 | 103,876 | ||||||||||
Ingersoll-Rand plc | 1,229 | 51,839 | ||||||||||
Joy Global Incorporated | 435 | 24,678 | ||||||||||
Paccar Incorporated « | 1,468 | 57,531 | ||||||||||
Pall Corporation « | 476 | 26,090 | ||||||||||
Parker Hannifin Corporation | 622 | 47,819 | ||||||||||
Snap-On Incorporated « | 239 | 14,878 | ||||||||||
Xylem Incorporated | 763 | 19,205 | ||||||||||
| 1,027,388 | ||||||||||||
|
| |||||||||||
| Road & Rail: 0.49% | ||||||||||||
CSX Corporation | 4,275 | 95,589 | ||||||||||
Norfolk Southern Corporation | 1,340 | 96,172 | ||||||||||
Ryder System Incorporated | 211 | 7,598 | ||||||||||
Union Pacific Corporation | 1,959 | 233,728 | ||||||||||
| 433,087 | ||||||||||||
|
| |||||||||||
The accompanying notes are an integral part of these financial statements.
Table of Contents
| Portfolio of Investments—June 30, 2012 (Unaudited) | Wells Fargo Advantage VT Index Asset Allocation Fund | 19 |
| Security Name | Shares | Value | ||||||||||
| Trading Companies & Distributors: 0.11% | ||||||||||||
Fastenal Company « | 1,215 | $ | 48,977 | |||||||||
W.W. Grainger Incorporated « | 251 | 48,001 | ||||||||||
| 96,978 | ||||||||||||
|
| |||||||||||
Information Technology: 11.29% | ||||||||||||
| Communications Equipment: 1.05% | ||||||||||||
Cisco Systems Incorporated | 22,037 | 378,375 | ||||||||||
F5 Networks Incorporated Ǡ | 327 | 32,556 | ||||||||||
Harris Corporation « | 468 | 19,586 | ||||||||||
JDS Uniphase Corporation † | 952 | 10,472 | ||||||||||
Juniper Networks Incorporated † | 2,179 | 35,539 | ||||||||||
Motorola Solutions Incorporated | 1,201 | 57,780 | ||||||||||
QUALCOMM Incorporated | 7,052 | 392,655 | ||||||||||
| 926,963 | ||||||||||||
|
| |||||||||||
| Computers & Peripherals: 3.20% | ||||||||||||
Apple Incorporated † | 3,847 | 2,246,648 | ||||||||||
Dell Incorporated † | 6,116 | 76,572 | ||||||||||
EMC Corporation † | 8,638 | 221,392 | ||||||||||
Hewlett-Packard Company | 8,134 | 163,575 | ||||||||||
Lexmark International Incorporated « | 293 | 7,788 | ||||||||||
NetApp Incorporated † | 1,493 | 47,507 | ||||||||||
SanDisk Corporation † | 1,002 | 36,553 | ||||||||||
Western Digital Corporation † | 963 | 29,352 | ||||||||||
| 2,829,387 | ||||||||||||
|
| |||||||||||
| Electronic Equipment, Instruments & Components: 0.24% | ||||||||||||
Amphenol Corporation Class A « | 667 | 36,632 | ||||||||||
Corning Incorporated | 6,243 | 80,722 | ||||||||||
FLIR Systems Incorporated | 635 | 12,383 | ||||||||||
Jabil Circuit Incorporated « | 748 | 15,207 | ||||||||||
Molex Incorporated | 566 | 13,550 | ||||||||||
TE Connectivity Limited | 1,759 | 56,130 | ||||||||||
| 214,624 | ||||||||||||
|
| |||||||||||
| Internet Software & Services: 1.06% | ||||||||||||
Akamai Technologies Incorporated † | 737 | 23,400 | ||||||||||
eBay Incorporated † | 4,728 | 198,623 | ||||||||||
Google Incorporated Class A † | 1,046 | 606,753 | ||||||||||
VeriSign Incorporated Ǡ | 650 | 28,321 | ||||||||||
Yahoo! Incorporated † | 5,013 | 79,356 | ||||||||||
| 936,453 | ||||||||||||
|
| |||||||||||
| IT Services: 2.22% | ||||||||||||
Accenture plc | 2,651 | 159,299 | ||||||||||
Automatic Data Processing Incorporated | 2,012 | 111,988 | ||||||||||
Cognizant Technology Solutions Corporation Class A † | 1,253 | 75,180 | ||||||||||
Computer Sciences Corporation | 639 | 15,860 | ||||||||||
The accompanying notes are an integral part of these financial statements.
Table of Contents
| 20 | Wells Fargo Advantage VT Index Asset Allocation Fund | Portfolio of Investments—June 30, 2012 (Unaudited) |
| Security Name | Shares | Value | ||||||||||
| IT Services (continued) | ||||||||||||
Fidelity National Information Services Incorporated | 982 | $ | 33,467 | |||||||||
Fiserv Incorporated Ǡ | 562 | 40,588 | ||||||||||
International Business Machines Corporation | 4,745 | 928,027 | ||||||||||
MasterCard Incorporated | 437 | 187,958 | ||||||||||
Paychex Incorporated | 1,327 | 41,681 | ||||||||||
SAIC Incorporated « | 1,138 | 13,793 | ||||||||||
Teradata Corporation † | 694 | 49,975 | ||||||||||
Total System Services Incorporated | 661 | 15,818 | ||||||||||
Visa Incorporated Class A « | 2,049 | 253,318 | ||||||||||
Western Union Company | 2,521 | 42,454 | ||||||||||
| 1,969,406 | ||||||||||||
|
| |||||||||||
| Office Electronics: 0.05% | ||||||||||||
Xerox Corporation | 5,545 | 43,639 | ||||||||||
|
| |||||||||||
| Semiconductors & Semiconductor Equipment: 1.32% | ||||||||||||
Advanced Micro Devices Incorporated Ǡ | 2,423 | 13,884 | ||||||||||
Altera Corporation | 1,327 | 44,906 | ||||||||||
Analog Devices Incorporated | 1,227 | 46,221 | ||||||||||
Applied Materials Incorporated | 5,273 | 60,429 | ||||||||||
Broadcom Corporation Class A | 2,040 | 68,952 | ||||||||||
First Solar Incorporated Ǡ | 243 | 3,660 | ||||||||||
Intel Corporation | 20,696 | 551,548 | ||||||||||
KLA-Tencor Corporation | 689 | 33,933 | ||||||||||
Lam Research Corporation † | 829 | 31,286 | ||||||||||
Linear Technology Corporation | 947 | 29,670 | ||||||||||
LSI Corporation † | 2,341 | 14,912 | ||||||||||
Microchip Technology Incorporated « | 796 | 26,332 | ||||||||||
Micron Technology Incorporated † | 4,071 | 25,688 | ||||||||||
NVIDIA Corporation † | 2,546 | 35,186 | ||||||||||
Teradyne Incorporated Ǡ | 768 | 10,798 | ||||||||||
Texas Instruments Incorporated | 4,708 | 135,073 | ||||||||||
Xilinx Incorporated | 1,086 | 36,457 | ||||||||||
| 1,168,935 | ||||||||||||
|
| |||||||||||
| Software: 2.15% | ||||||||||||
Adobe Systems Incorporated † | 2,041 | 66,067 | ||||||||||
Autodesk Incorporated † | 945 | 33,066 | ||||||||||
BMC Software Incorporated † | 663 | 28,297 | ||||||||||
CA Incorporated | 1,456 | 39,443 | ||||||||||
Citrix Systems Incorporated † | 766 | 64,298 | ||||||||||
Electronic Arts Incorporated † | 1,308 | 16,154 | ||||||||||
Intuit Incorporated | 1,208 | 71,695 | ||||||||||
Microsoft Corporation | 30,758 | 940,887 | ||||||||||
Oracle Corporation | 15,964 | 474,131 | ||||||||||
Red Hat Incorporated † | 794 | 44,845 | ||||||||||
Salesforce.com Incorporated Ǡ | 561 | 77,564 | ||||||||||
Symantec Corporation † | 2,965 | 43,319 | ||||||||||
| 1,899,766 | ||||||||||||
|
| |||||||||||
The accompanying notes are an integral part of these financial statements.
Table of Contents
| Portfolio of Investments—June 30, 2012 (Unaudited) | Wells Fargo Advantage VT Index Asset Allocation Fund | 21 |
| Security Name | Shares | Value | ||||||||||
Materials: 1.95% | ||||||||||||
| Chemicals: 1.34% | ||||||||||||
Air Products & Chemicals Incorporated | 870 | $ | 70,235 | |||||||||
Airgas Incorporated | 285 | 23,943 | ||||||||||
CF Industries Holdings Incorporated | 270 | 52,310 | ||||||||||
Dow Chemical Company « | 4,917 | 154,886 | ||||||||||
E.I. du Pont de Nemours & Company | 3,855 | 194,947 | ||||||||||
Eastman Chemical Company « | 568 | 28,610 | ||||||||||
Ecolab Incorporated | 1,202 | 82,373 | ||||||||||
FMC Corporation | 564 | 30,163 | ||||||||||
International Flavors & Fragrances Incorporated « | 333 | 18,248 | ||||||||||
Monsanto Company | 2,195 | 181,702 | ||||||||||
Mosaic Company | 1,225 | 67,081 | ||||||||||
PPG Industries Incorporated | 627 | 66,537 | ||||||||||
Praxair Incorporated | 1,229 | 133,629 | ||||||||||
Sherwin-Williams Company | 353 | 46,720 | ||||||||||
Sigma-Aldrich Corporation « | 497 | 36,743 | ||||||||||
| 1,188,127 | ||||||||||||
|
| |||||||||||
| Construction Materials: 0.03% | ||||||||||||
Vulcan Materials Company | 532 | 21,126 | ||||||||||
|
| |||||||||||
| Containers & Packaging: 0.07% | ||||||||||||
Ball Corporation « | 645 | 26,477 | ||||||||||
Bemis Company Incorporated | 424 | 13,288 | ||||||||||
Owens-Illinois Incorporated † | 679 | 13,016 | ||||||||||
Sealed Air Corporation | 798 | 12,321 | ||||||||||
| 65,102 | ||||||||||||
|
| |||||||||||
| Metals & Mining: 0.43% | ||||||||||||
Alcoa Incorporated « | 4,388 | 38,395 | ||||||||||
Allegheny Technologies Incorporated | 441 | 14,063 | ||||||||||
Cliffs Natural Resources Incorporated « | 586 | 28,884 | ||||||||||
Freeport-McMoRan Copper & Gold Incorporated Class B | 3,905 | 133,043 | ||||||||||
Newmont Mining Corporation | 2,039 | 98,912 | ||||||||||
Nucor Corporation « | 1,304 | 49,422 | ||||||||||
Titanium Metals Corporation | 339 | 3,834 | ||||||||||
United States Steel Corporation « | 593 | 12,216 | ||||||||||
| 378,769 | ||||||||||||
|
| |||||||||||
| Paper & Forest Products: 0.08% | ||||||||||||
International Paper Company | 1,798 | 51,980 | ||||||||||
MeadWestvaco Corporation | 709 | 20,384 | ||||||||||
| 72,364 | ||||||||||||
|
| |||||||||||
Telecommunication Services: 1.84% | ||||||||||||
| Diversified Telecommunication Services: 1.72% | ||||||||||||
AT&T Incorporated | 24,119 | 860,084 | ||||||||||
CenturyTel Incorporated | 2,556 | 100,936 | ||||||||||
The accompanying notes are an integral part of these financial statements.
Table of Contents
| 22 | Wells Fargo Advantage VT Index Asset Allocation Fund | Portfolio of Investments—June 30, 2012 (Unaudited) |
| Security Name | Shares | Value | ||||||||||
| Diversified Telecommunication Services (continued) | ||||||||||||
Frontier Communications Corporation « | 4,107 | $ | 15,730 | |||||||||
Verizon Communications Incorporated | 11,688 | 519,415 | ||||||||||
Windstream Corporation « | 2,420 | 23,377 | ||||||||||
| 1,519,542 | ||||||||||||
|
| |||||||||||
| Wireless Telecommunication Services: 0.12% | ||||||||||||
Crown Castle International Corporation † | 1,061 | 62,238 | ||||||||||
MetroPCS Communications Incorporated † | 1,210 | 7,321 | ||||||||||
Sprint Nextel Corporation † | 12,337 | 40,219 | ||||||||||
| 109,778 | ||||||||||||
|
| |||||||||||
Utilities: 2.13% | ||||||||||||
| Electric Utilities: 1.27% | ||||||||||||
American Electric Power Company Incorporated | 1,992 | 79,481 | ||||||||||
Consolidated Edison Incorporated « | 1,205 | 74,939 | ||||||||||
Duke Energy Corporation | 5,505 | 126,945 | ||||||||||
Edison International | 1,340 | 61,908 | ||||||||||
Entergy Corporation | 729 | 49,492 | ||||||||||
Exelon Corporation | 3,507 | 131,933 | ||||||||||
FirstEnergy Corporation | 1,720 | 84,607 | ||||||||||
Nextera Energy Incorporated | 1,716 | 118,078 | ||||||||||
Northeast Utilities | 1,290 | 50,065 | ||||||||||
Pepco Holdings Incorporated « | 939 | 18,376 | ||||||||||
Pinnacle West Capital Corporation | 450 | 23,283 | ||||||||||
PPL Corporation « | 2,386 | 66,355 | ||||||||||
Progress Energy Incorporated | 1,218 | 73,287 | ||||||||||
The Southern Company | 3,574 | 165,476 | ||||||||||
| 1,124,225 | ||||||||||||
|
| |||||||||||
| Gas Utilities: 0.06% | ||||||||||||
AGL Resources Incorporated | 483 | 18,716 | ||||||||||
ONEOK Incorporated | 855 | 36,175 | ||||||||||
| 54,891 | ||||||||||||
|
| |||||||||||
| Independent Power Producers & Energy Traders: 0.06% | ||||||||||||
AES Corporation † | 2,652 | 34,025 | ||||||||||
NRG Energy Incorporated † | 937 | 16,266 | ||||||||||
| 50,291 | ||||||||||||
|
| |||||||||||
| Multi-Utilities: 0.74% | ||||||||||||
Ameren Corporation | 998 | 33,473 | ||||||||||
CenterPoint Energy Incorporated | 1,758 | 36,338 | ||||||||||
CMS Energy Corporation | 1,071 | 25,160 | ||||||||||
Dominion Resources Incorporated | 2,351 | 126,954 | ||||||||||
DTE Energy Company | 700 | 41,531 | ||||||||||
Integrys Energy Group Incorporated « | 320 | 18,198 | ||||||||||
NiSource Incorporated « | 1,169 | 28,933 | ||||||||||
PG&E Corporation | 1,737 | 78,634 | ||||||||||
The accompanying notes are an integral part of these financial statements.
Table of Contents
| Portfolio of Investments—June 30, 2012 (Unaudited) | Wells Fargo Advantage VT Index Asset Allocation Fund | 23 |
| Security Name | Shares | Value | ||||||||||||||
| Multi-Utilities (continued) | ||||||||||||||||
Public Service Enterprise Group Incorporated | 2,081 | $ | 67,633 | |||||||||||||
SCANA Corporation « | 479 | 22,915 | ||||||||||||||
Sempra Energy | 987 | 67,985 | ||||||||||||||
TECO Energy Incorporated | 888 | 16,037 | ||||||||||||||
Wisconsin Energy Corporation | 948 | 37,512 | ||||||||||||||
Xcel Energy Incorporated | 2,003 | 56,905 | ||||||||||||||
| 658,208 | ||||||||||||||||
|
| |||||||||||||||
Total Common Stocks (Cost $40,682,378) | 50,608,827 | |||||||||||||||
|
| |||||||||||||||
| Interest Rate | Maturity Date | Principal | ||||||||||||||
| U.S. Treasury Securities: 36.12% | ||||||||||||||||
U.S. Treasury Bond | 3.13 | % | 11/15/2041 | $ | 1,729,000 | 1,861,917 | ||||||||||
U.S. Treasury Bond | 3.13 | 02/15/2042 | 828,000 | 891,006 | ||||||||||||
U.S. Treasury Bond | 3.50 | 02/15/2039 | 1,216,000 | 1,408,850 | ||||||||||||
U.S. Treasury Bond | 3.75 | 08/15/2041 | 2,115,000 | 2,554,854 | ||||||||||||
U.S. Treasury Bond | 3.88 | 08/15/2040 | 1,718,000 | 2,118,509 | ||||||||||||
U.S. Treasury Bond | 4.25 | 05/15/2039 | 1,391,000 | 1,819,602 | ||||||||||||
U.S. Treasury Bond | 4.25 | 11/15/2040 | 1,930,000 | 2,528,902 | ||||||||||||
U.S. Treasury Bond | 4.38 | 02/15/2038 | 688,000 | 914,395 | ||||||||||||
U.S. Treasury Bond | 4.38 | 11/15/2039 | 1,888,000 | 2,518,415 | ||||||||||||
U.S. Treasury Bond | 4.38 | 05/15/2040 | 1,951,000 | 2,603,670 | ||||||||||||
U.S. Treasury Bond | 4.38 | 05/15/2041 | 1,580,000 | 2,113,496 | ||||||||||||
U.S. Treasury Bond | 4.50 | 02/15/2036 | 1,026,000 | 1,379,970 | ||||||||||||
U.S. Treasury Bond | 4.50 | 05/15/2038 | 872,000 | 1,181,696 | ||||||||||||
U.S. Treasury Bond | 4.50 | 08/15/2039 | 1,324,000 | 1,798,985 | ||||||||||||
U.S. Treasury Bond | 4.63 | 02/15/2040 | 1,785,000 | 2,473,062 | ||||||||||||
U.S. Treasury Bond | 4.75 | 02/15/2037 | 545,000 | 760,701 | ||||||||||||
U.S. Treasury Bond | 4.75 | 02/15/2041 | 1,390,000 | 1,966,632 | ||||||||||||
U.S. Treasury Bond | 5.00 | 05/15/2037 | 728,000 | 1,052,074 | ||||||||||||
Total U.S. Treasury Securities (Cost $25,249,910) | 31,946,736 | |||||||||||||||
|
| |||||||||||||||
| Expiration Date | Shares | |||||||||||||||
| Warrants: 0.00% | ||||||||||||||||
| Utilities: 0.00% | ||||||||||||||||
| Gas Utilities: 0.00% | ||||||||||||||||
Kinder Morgan Incorporated (Utilities, Gas Utilities) † | 2/15/2017 | 2,047 | 4,422 | |||||||||||||
|
| |||||||||||||||
Total Warrants (Cost $3,141) | 4,422 | |||||||||||||||
|
| |||||||||||||||
| Principal | ||||||||||||||||
| Other: 0.12% | ||||||||||||||||
Gryphon Funding Limited Pass-Through Entity (a)(i)(v) | $ | 389,097 | 105,056 | |||||||||||||
|
| |||||||||||||||
Total Other (Cost $48,165) | 105,056 | |||||||||||||||
|
| |||||||||||||||
The accompanying notes are an integral part of these financial statements.
Table of Contents
| 24 | Wells Fargo Advantage VT Index Asset Allocation Fund | Portfolio of Investments—June 30, 2012 (Unaudited) |
| Security Name | Shares | Value | ||||||||||||||
Short-Term Investments: 11.02% | ||||||||||||||||
| Investment Companies: 11.02% | ||||||||||||||||
| Yield | ||||||||||||||||
Wells Fargo Advantage Cash Investment Money Market Fund, Select Class (l)(u) | 0.15 | % | 2,142,172 | $ | 2,142,172 | |||||||||||
Wells Fargo Securities Lending Cash Investments, LLC (l)(v)(u)(r) | 0.19 | 5,284,238 | 5,284,238 | |||||||||||||
| 7,426,410 | ||||||||||||||||
|
| |||||||||||||||
| Maturity Date | Principal | |||||||||||||||
| U.S. Treasury Securities: 2.62% | ||||||||||||||||
U.S. Treasury Bill #(z) | 0.01 | 08/02/2012 | $ | 840,000 | 839,962 | |||||||||||
U.S. Treasury Bill #(z) | 0.01 | 08/23/2012 | 1,480,000 | 1,479,904 | ||||||||||||
| 2,319,866 | ||||||||||||||||
|
| |||||||||||||||
Total Short-Term Investments (Cost $9,746,224) | 9,746,276 | |||||||||||||||
|
| |||||||||||||||
| Total Investments in Securities | ||||||||
| (Cost $75,729,818) * | 104.47 | % | 92,411,317 | |||||
Other Assets and Liabilities, Net | (4.47 | ) | (3,955,262 | ) | ||||
|
|
|
| |||||
| Total Net Assets | 100.00 | % | $ | 88,456,055 | ||||
|
|
|
|
| « | All or a portion of this security is on loan. |
| † | Non-income earning security |
| (l) | Investment in an affiliate |
| (v) | Security represents investment of cash collateral received from securities on loan. |
| (a) | Security is fair valued by the Management Valuation Team, and in certain instances by the Board of Trustees, in accordance with procedures approved by the Board of Trustees. |
| (i) | Illiquid security |
| (u) | Rate shown is the 7-day annualized yield at period end. |
| (r) | The investment company is exempt from registration under Section 3(c)(7) of the 1940 Act. |
| # | All or a portion of this security is segregated as collateral for investments in derivative instruments. |
| (z) | Zero coupon security. Rate represents yield to maturity at time of purchase. |
| * | Cost for federal income tax purposes is $78,316,409 and net unrealized appreciation (depreciation) consists of: |
Gross unrealized appreciation | $ | 18,169,892 | ||
Gross unrealized depreciation | (4,074,984 | ) | ||
|
| |||
Net unrealized appreciation | $ | 14,094,908 |
The accompanying notes are an integral part of these financial statements.
Table of Contents
| Statement of Assets and Liabilities—June 30, 2012 (Unaudited) | Wells Fargo Advantage VT Index Asset Allocation Fund | 25 |
Assets | ||||
Investments | ||||
In unaffiliated securities (including securities on loan), at value (see cost below) | $ | 84,253,909 | ||
In affiliated securities, at value (see cost below) | 8,157,408 | |||
|
| |||
Total investments, at value (see cost below) | 92,411,317 | |||
Receivable for investments sold | 337,606 | |||
Receivable for Fund shares sold | 19,334 | |||
Receivable for dividends and interest | 338,434 | |||
Receivable for daily variation margin on open futures contracts | 859,375 | |||
Receivable for securities lending income | 4,668 | |||
Prepaid expenses and other assets | 6,121 | |||
|
| |||
Total assets | 93,976,855 | |||
|
| |||
Liabilities | ||||
Payable for Fund shares redeemed | 83,591 | |||
Payable upon receipt of securities loaned | 5,332,403 | |||
Advisory fee payable | 30,286 | |||
Distribution fees payable | 17,807 | |||
Due to other related parties | 9,194 | |||
Accrued expenses and other liabilities | 47,519 | |||
|
| |||
Total liabilities | 5,520,800 | |||
|
| |||
Total net assets | $ | 88,456,055 | ||
|
| |||
NET ASSETS CONSIST OF | ||||
Paid-in capital | $ | 99,503,176 | ||
Undistributed net investment income | 50,574 | |||
Accumulated net realized losses on investments | (28,445,937 | ) | ||
Net unrealized gains on investments | 17,348,242 | |||
|
| |||
Total net assets | $ | 88,456,055 | ||
|
| |||
COMPUTATION OF NET ASSET VALUE PER SHARE1 | ||||
Net assets – Class 2 | $ | 88,456,055 | ||
Shares outstanding – Class 2 | 6,782,376 | |||
Net asset value per share – Class 2 | $13.04 | |||
Investments in unaffiliated securities, at cost | $ | 67,369,047 | ||
|
| |||
Investments in affiliated securities, at cost | $ | 8,360,771 | ||
|
| |||
Total investments, at cost | $ | 75,729,818 | ||
|
| |||
Securities on loan, at value | $ | 5,210,840 | ||
|
| |||
| 1. | The Fund has an unlimited number of authorized shares. |
The accompanying notes are an integral part of these financial statements.
Table of Contents
| 26 | Wells Fargo Advantage VT Index Asset Allocation Fund | Statement of Operation—Six Months Ended June 30, 2012 (Unaudited) |
Investment income | ||||
Dividends | $ | 578,746 | ||
Interest | 527,122 | |||
Securities lending income, net | 9,621 | |||
Income from affiliated securities | 3,933 | |||
|
| |||
Total investment income | 1,119,422 | |||
|
| |||
Expenses | ||||
Advisory fee | 244,836 | |||
Administration fees | ||||
Fund level | 22,258 | |||
Class 2 | 35,612 | |||
Distribution fees | ||||
Class 2 | 111,289 | |||
Custody and accounting fees | 20,778 | |||
Professional fees | 16,496 | |||
Shareholder report expenses | 30,954 | |||
Trustees’ fees and expenses | 6,179 | |||
Other fees and expenses | 7,518 | |||
|
| |||
Total expenses | 495,920 | |||
Less: Fee waivers and/or expense reimbursements | (50,764 | ) | ||
|
| |||
Net expenses | 445,156 | |||
|
| |||
Net investment income | 674,266 | |||
|
| |||
REALIZED AND UNREALIZED GAINS (LOSSES) ON INVESTMENTS | ||||
Net realized gains on: | ||||
Unaffiliated securities | 1,959,117 | |||
Affiliated securities | 9,565 | |||
Futures transactions | 1,370,515 | |||
|
| |||
Net realized gains on investments | 3,339,197 | |||
|
| |||
Net change in unrealized gains (losses) on: | ||||
Unaffiliated securities | 3,209,876 | |||
Affiliated securities | 128,156 | |||
Futures transactions | 177,773 | |||
|
| |||
Net change in unrealized gains (losses) on investments | 3,515,805 | |||
|
| |||
Net realized and unrealized gains (losses) on investments | 6,855,002 | |||
|
| |||
Net increase in net assets resulting from operations | $ | 7,529,268 | ||
|
| |||
The accompanying notes are an integral part of these financial statements.
Table of Contents
| Statements of Changes in Net Assets | Wells Fargo Advantage VT Index Asset Allocation Fund | 27 |
Six Months Ended June 30, 2012 | Year Ended December 31, 2011 | |||||||||||||||
Operations | ||||||||||||||||
Net investment income | $ | 674,266 | $ | 1,618,433 | ||||||||||||
Net realized gains on investments | 3,339,197 | 257,523 | ||||||||||||||
Net change in unrealized gains (losses) on investments | 3,515,805 | 4,099,372 | ||||||||||||||
|
|
|
|
|
|
|
| |||||||||
Net increase in net assets resulting from operations | 7,529,268 | 5,975,328 | ||||||||||||||
|
|
|
|
|
|
|
| |||||||||
Distributions to shareholders from | ||||||||||||||||
Net investment income – Class 2 | (623,692 | ) | (2,862,036 | ) | ||||||||||||
|
|
|
|
|
|
|
| |||||||||
Capital share transactions | Shares | Shares | ||||||||||||||
Proceeds from shares sold – Class 2 | 142,253 | 1,825,455 | 112,473 | 1,333,493 | ||||||||||||
Reinvestment of distributions – Class 2 | 48,209 | 623,692 | 242,703 | 2,862,036 | ||||||||||||
Payment for shares redeemed – Class 2 | (804,452 | ) | (10,300,957 | ) | (1,742,779 | ) | (20,852,107 | ) | ||||||||
|
|
|
|
|
|
|
| |||||||||
Net decrease in net assets resulting from capital share transactions | (7,851,810 | ) | (16,656,578 | ) | ||||||||||||
|
|
|
|
|
|
|
| |||||||||
Total decrease in net assets | (946,234 | ) | (13,543,286 | ) | ||||||||||||
|
|
|
|
|
|
|
| |||||||||
Net assets | ||||||||||||||||
Beginning of period | 89,402,289 | 102,945,575 | ||||||||||||||
|
|
|
|
|
|
|
| |||||||||
End of period | $ | 88,456,055 | $ | 89,402,289 | ||||||||||||
|
|
|
|
|
|
|
| |||||||||
Undistributed net investment income | $ | 50,574 | $ | 0 | ||||||||||||
|
|
|
|
|
|
|
| |||||||||
The accompanying notes are an integral part of these financial statements.
Table of Contents
| 28 | Wells Fargo Advantage VT Index Asset Allocation Fund | Financial Highlights |
(For a share outstanding throughout each period)
Six Months Ended (Unaudited) | Year Ended December 31, | |||||||||||||||||||||||
| Class 21 | 2011 | 2010 | 2009 | 2008 | 2007 | |||||||||||||||||||
Net asset value, beginning of period | $ | 12.09 | $ | 11.72 | $ | 10.53 | $ | 9.31 | $ | 14.64 | $ | 14.13 | ||||||||||||
Net investment income | 0.10 | 0.21 | 0.20 | 0.19 | 0.30 | 0.34 | ||||||||||||||||||
Net realized and unrealized gains (losses) on investments | 0.94 | 0.54 | 1.18 | 1.22 | (4.32 | ) | 0.73 | |||||||||||||||||
|
|
|
|
|
|
|
|
|
|
|
| |||||||||||||
Total from investment operations | 1.04 | 0.75 | 1.38 | 1.41 | (4.02 | ) | 1.07 | |||||||||||||||||
Distributions to shareholders from | ||||||||||||||||||||||||
Net investment income | (0.09 | ) | (0.38 | ) | (0.19 | ) | (0.19 | ) | (0.30 | ) | (0.33 | ) | ||||||||||||
Net realized gains | 0.00 | 0.00 | 0.00 | 0.00 | (1.01 | ) | (0.23 | ) | ||||||||||||||||
|
|
|
|
|
|
|
|
|
|
|
| |||||||||||||
Total distributions to shareholders | (0.09 | ) | (0.38 | ) | (0.19 | ) | (0.19 | ) | (1.31 | ) | (0.56 | ) | ||||||||||||
Net asset value, end of period | $ | 13.04 | $ | 12.09 | $ | 11.72 | $ | 10.53 | $ | 9.31 | $ | 14.64 | ||||||||||||
Total return | 8.61 | % | 6.48 | % | 13.29 | % | 15.46 | % | (29.11 | )% | 7.60 | % | ||||||||||||
Ratios to average net assets (annualized) | ||||||||||||||||||||||||
Gross expenses | 1.11 | % | 1.06 | % | 1.10 | % | 1.07 | % | 1.07 | % | 1.02 | % | ||||||||||||
Net expenses | 1.00 | % | 0.99 | % | 1.00 | % | 1.00 | % | 1.00 | % | 1.00 | % | ||||||||||||
Net investment income | 1.51 | % | 1.70 | % | 1.76 | % | 2.01 | % | 2.37 | % | 2.26 | % | ||||||||||||
Supplemental data | ||||||||||||||||||||||||
Portfolio turnover rate | 4 | % | 17 | % | 25 | % | 43 | % | 21 | % | 25 | % | ||||||||||||
Net assets, end of period (000’s omitted) | $88,456 | $89,402 | $102,946 | $113,271 | $125,958 | $254,054 | ||||||||||||||||||
| 1. | After the close of business on July 16, 2010, existing shares of the Fund were renamed Class 2 shares. |
The accompanying notes are an integral part of these financial statements.
Table of Contents
| Notes to Financial Statements (Unaudited) | Wells Fargo Advantage VT Index Asset Allocation Fund | 29 |
1. ORGANIZATION
Wells Fargo Variable Trust (the “Trust”), a Delaware statutory trust organized on March 10, 1999, is an open-end management investment company registered under the Investment Company Act of 1940, as amended (the “1940 Act”). These financial statements report on Wells Fargo Advantage VT Index Asset Allocation Fund (the “Fund”) which is a diversified series of the Trust.
2. SIGNIFICANT ACCOUNTING POLICIES
The following significant accounting policies, which are consistently followed in the preparation of the financial statements of the Fund, are in conformity with U.S. generally accepted accounting principles which require management to make estimates and assumptions that affect the reported amounts of assets and liabilities, disclosure of contingent assets and liabilities at the date of the financial statements, and the reported amounts of revenues and expenses during the reporting period. Actual results could differ from those estimates.
Securities valuation
Investments in equity securities are valued each business day as of the close of regular trading on the New York Stock Exchange, which is usually 4:00 p.m. (Eastern Time). Securities which are traded on a national or foreign securities exchange are valued at the last reported sales price, except that securities listed on The Nasdaq Stock Market, Inc. (“Nasdaq”) are valued at the Nasdaq Official Closing Price (“NOCP”), and if no NOCP is available, then at the last reported sales price. If no sales price is shown on the Nasdaq, the bid price will be used. In the absence of any sale of securities listed on the Nasdaq, and in the case of other securities (including U.S. Government obligations, but excluding debt securities maturing in 60 days or less), the price will be deemed “stale” and the valuations will be determined in accordance with the Fund’s Valuation Procedures.
Fixed income securities with original maturities exceeding 60 days are valued based on evaluated prices received from an independent pricing service approved by the Board of Trustees which may utilize both transaction data and market information such as yield, prices of securities of comparable quality, coupon rate, maturity, type of issue, trading characteristics and other market data. If valuations are not available from the pricing service or values received are deemed not representative of market value, values will be obtained from a third party broker-dealer or determined based on the Fund’s Valuation Procedures.
Debt securities of sufficient credit quality with original maturities of 60 days or less generally are valued at amortized cost which approximates fair value. The amortized cost method involves valuing a security at its cost, plus accretion of discount or minus amortization of premium over the period until maturity.
Investments in open-end mutual funds and non-registered investment companies are fair valued at net asset value.
Investments which are not valued using any of the methods discussed above, are valued at their fair value, as determined by procedures established in good faith and approved by the Board of Trustees. The Board of Trustees has established a Valuation Committee comprised of the Trustees and has delegated to it the authority to take any actions regarding the valuation of portfolio securities that the Valuation Committee deems necessary in determining the fair value of portfolio securities, unless the responsibility has been delegated to the Management Valuation Team of Wells Fargo Funds Management, LLC (“Funds Management”). The Board of Trustees retains the authority to make or ratify any valuation decisions or approve any changes to the Valuation Procedures as it deems appropriate. On a quarterly basis, the Board of Trustees considers for ratification any valuation actions taken by the Valuation Committee or the Management Valuation Team.
Valuations of fair valued securities are compared to the next actual sales price when available, or other appropriate market information to assess the continued appropriateness of the fair valuation methodology used. These securities are fair valued on a day-to-day basis, taking into consideration changes to appropriate market information and any significant changes to the input factors considered in the valuation process until there is a readily available price provided on the exchange or by an independent pricing service. Valuations received from an independent pricing service or broker quotes are periodically validated by comparisons to most recent trades and valuations provided by other independent pricing services in addition to the review of prices by the adviser and/or sub-adviser. Unobservable inputs used in determining fair valuations are identified based on the type of security, taking into consideration factors utilized by market participants in valuing the investment, knowledge about the issuer and the current market environment.
Table of Contents
| 30 | Wells Fargo Advantage VT Index Asset Allocation Fund | Notes to Financial Statements (Unaudited) |
Security loans
The Fund may lend its securities from time to time in order to earn additional income in the form of fees or interest on securities received as collateral or the investment of any cash received as collateral. The Fund continues to receive interest or dividends on the securities loaned. The Fund receives collateral in the form of cash or securities with a value at least equal to the value of the securities on loan. The value of the loaned securities is determined at the close of each business day and any additional required collateral is delivered to the Fund on the next business day. In a securities lending transaction, the net asset value of the Fund will be affected by an increase or decrease in the value of the securities loaned and by an increase or decrease in the value of the instrument in which collateral is invested. The amount of securities lending activity undertaken by the Fund fluctuates from time to time. In the event of default or bankruptcy by the borrower, the Fund may be prevented from recovering the loaned securities or gaining access to the collateral or may experience delays or costs in doing so. In addition, the investment of any cash collateral received may lose all or part of its value. The Fund has the right under the lending agreement to recover the securities from the borrower on demand.
The Fund lends its securities through an unaffiliated securities lending agent. Cash collateral received in connection with its securities lending transactions is invested in Wells Fargo Securities Lending Cash Investments, LLC (the “Cash Collateral Fund”). The Cash Collateral Fund is exempt from registration under Section 3(c)(7) of the 1940 Act and is managed by Funds Management and is sub-advised by Wells Capital Management Incorporated (“Wells Capital Management”). Funds Management receives an advisory fee starting at 0.05% and declining to 0.01% as the average daily net assets of the Cash Collateral Fund increase. All of the fees received by Funds Management are paid to Wells Capital Management for its services as sub-adviser. The Cash Collateral Fund seeks to provide a positive return compared to the daily Fed Funds Open rate by investing in high-quality, U.S. dollar-denominated short-term money market instruments. Cash Collateral Fund investments are fair valued based upon the amortized cost valuation technique. Income earned from investment in the Cash Collateral Fund is included in securities lending income on the Statement of Operations.
Futures contracts
The Fund may be subject to interest rate risk and equity price risk in the normal course of pursuing its investment objectives. The Fund may buy and sell futures contracts in order to gain exposure to, or protect against changes in, security values and interest rates. The primary risks associated with the use of futures contracts are the imperfect correlation between changes in market values of securities held by the Fund and the prices of futures contracts, and the possibility of an illiquid market.
Futures contracts are valued based upon their quoted daily settlement prices when available. The aggregate principal amounts of the contracts are not recorded in the financial statements. Fluctuations in the value of the contracts are recorded in the Statement of Assets and Liabilities as an asset or liability and in the Statement of Operations as unrealized gains or losses until the contracts are closed, at which point they are recorded as net realized gains or losses on futures contracts. With futures contracts, there is minimal counterparty risk to the Fund since futures are exchange traded and the exchange’s clearinghouse, as counterparty to all exchange traded futures, guarantees the futures against default.
Security transactions and income recognition
Securities transactions are recorded on a trade date basis. Realized gains or losses are reported on the basis of identified cost of securities delivered.
Interest income is accrued daily and bond discounts are accreted and premiums are amortized daily based on the effective interest method. To the extent debt obligations are placed on non-accrual status, any related interest income may be reduced by writing off interest receivables when the collection of all or a portion of interest has become doubtful based on consistently applied procedures. If the issuer subsequently resumes interest payments or when the collectability of interest is reasonably assured, the debt obligation is removed from non-accrual status.
Dividend income is recognized on the ex-dividend date.
Distributions to shareholders
Distributions to shareholders from net investment income and net realized gains, if any, are recorded on the ex-dividend date. Such distributions are determined in conformity with income tax regulations, which may differ from generally accepted accounting principles.
Table of Contents
| Notes to Financial Statements (Unaudited) | Wells Fargo Advantage VT Index Asset Allocation Fund | 31 |
Federal and other taxes
The Fund intends to continue to qualify as a regulated investment company by distributing substantially all of its investment company taxable income and any net realized capital gains (after reduction for capital loss carryforwards) sufficient to relieve it from all, or substantially all, federal income taxes. Accordingly, no provision for federal income taxes was required.
The Fund’s income and federal excise tax returns and all financial records supporting those returns for the prior three fiscal years are subject to examination by the federal and Delaware revenue authorities. Management has analyzed the Fund’s tax positions taken on federal, state, and foreign tax returns for all open tax years and does not believe that there are any uncertain tax positions that require recognition of a tax liability.
Under the recently enacted Regulated Investment Company Modernization Act of 2010, the Fund is permitted to carry forward capital losses incurred in taxable years which began after December 22, 2010 for an unlimited period. However, any losses incurred are required to be utilized prior to the losses incurred in pre-enactment taxable years. As a result of this ordering rule, pre-enactment capital loss carryforwards may be more likely to expire unused. Post-enactment capital losses that are carried forward will retain their character as either short-term or long-term capital losses rather than be considered all short-term as under previous law. In addition, the Fund may elect to defer any portion of a post-October capital loss or qualified late-year ordinary loss to the first day of the following taxable year. A post-October capital loss is the greatest of the net capital loss, net short-term capital loss or net long-term capital loss for the portion of the taxable year after October 31. A qualified late-year ordinary loss is the net loss comprised of (a) net gain or loss from the sale or other disposition of certain capital assets for the portion of the taxable year after October 31, and (b) other ordinary income or loss for the portion of the taxable year after December 31.
As of December 31, 2011, the Fund had net capital loss carryforwards, which are available to offset future net realized capital gains, in the amount of $23,800,005 with $20,075,438 expiring in 2016 and $3,724,567 expiring in 2017.
3. FAIR VALUATION MEASUREMENTS
Fair value measurements of investments are determined within a framework that has established a fair value hierarchy based upon the various data inputs utilized in determining the value of the Fund’s investments. The three-level hierarchy gives the highest priority to unadjusted quoted prices in active markets for identical assets or liabilities (Level 1) and the lowest priority to significant unobservable inputs (Level 3). The Fund’s investments are classified within the fair value hierarchy based on the lowest level of input that is significant to the fair value measurement. The inputs are summarized into three broad levels as follows:
| n | Level 1 – quoted prices in active markets for identical securities |
| n | Level 2 – other significant observable inputs (including quoted prices for similar securities, interest rates, prepayment speeds, credit risk, etc.) |
| n | Level 3 – significant unobservable inputs (including the Fund’s own assumptions in determining the fair value of investments) |
The inputs or methodologies used for valuing securities are not necessarily an indication of the risk associated with investing in those securities.
Table of Contents
| 32 | Wells Fargo Advantage VT Index Asset Allocation Fund | Notes to Financial Statements (Unaudited) |
As of June 30, 2012, the inputs used in valuing the Fund’s assets, which are carried at fair value, were as follows:
| Investments in Securities | Quoted Prices (Level 1) | Significant Other (Level 2) | Significant Unobservable Inputs (Level 3) | Total | ||||||||||||
Equity securities | ||||||||||||||||
Common stocks | $ | 50,608,827 | $ | 0 | $ | 0 | $ | 50,608,827 | ||||||||
Warrants | 0 | 4,422 | 0 | 4,422 | ||||||||||||
U.S. Treasury securities | 31,946,736 | 0 | 0 | 31,946,736 | ||||||||||||
Other | 0 | 0 | 105,056 | 105,056 | ||||||||||||
Short-term investments | ||||||||||||||||
Investment companies | 2,142,172 | 5,284,238 | 0 | 7,426,410 | ||||||||||||
U.S. Treasury securities | 2,319,866 | 0 | 0 | 2,319,866 | ||||||||||||
| $ | 87,017,601 | $ | 5,288,660 | $ | 105,056 | $ | 92,411,317 | |||||||||
Further details on the major security types listed above can be found in the Portfolio of Investments.
As of June 30, 2012, the inputs used in valuing the Fund’s other financial instruments, which are carried at fair value, were as follows:
| Other financial instruments | Quoted Prices (Level 1) | Significant Other (Level 2) | Significant Unobservable Inputs (Level 3) | Total | ||||||||||||
Futures contracts+ | $ | 666,743 | $ | 0 | $ | 0 | $ | 666,743 | ||||||||
| + | Futures contracts are presented at the unrealized gains or losses on the instrument. |
Transfers in and transfers out are recognized at the end of the reporting period. For the six months ended June 30, 2012, the Fund did not have any transfers into/out of Level 1 and Level 2.
4. TRANSACTIONS WITH AFFILIATES AND OTHER EXPENSES
Advisory fee
The Trust has entered into an advisory contract with Funds Management, an indirect wholly owned subsidiary of Wells Fargo & Company (“Wells Fargo”). The adviser is responsible for implementing investment policies and guidelines and for supervising the sub-adviser, who is responsible for day-to-day portfolio management of the Fund.
Pursuant to the contract, Funds Management is entitled to receive an annual advisory fee starting at 0.55% and declining to 0.40% as the average daily net assets of the Fund increase. For the six months ended June 30, 2012, the advisory fee was equivalent to an annual rate of 0.55% of the Fund’s average daily net assets.
Funds Management has retained the services of a sub-adviser to provide daily portfolio management to the Fund. The fee for sub-advisory services is borne by Funds Management. Wells Capital Management, an affiliate of Funds Management, is the sub-adviser to the Fund and is entitled to receive a fee from Funds Management at an annual rate starting at 0.15% and declining to 0.10% as the average daily net assets of the Fund increase.
Administration and transfer agent fees
The Trust has entered into an administration agreement with Funds Management. Under this agreement, for providing administrative services, which includes paying fees and expenses for services provided by the transfer agent, sub-transfer agents, omnibus account servicers and record-keepers, Funds Management is entitled to receive from the Fund an annual fund level administration fee starting at 0.05% and declining to 0.03% as the average daily net assets of the Fund increase and for Class 2 shares a class level administration fee of 0.08% of its average daily net assets.
Funds Management has contractually waived and/or reimbursed advisory and administration fees to the extent necessary to maintain the net operating expense ratio for the Fund. Waiver of fees and/or reimbursement of expenses by Funds Management were made first from fund level expenses on a proportionate basis and then from class specific expenses. Funds Management has committed through April 30, 2013 to waive fees and/or reimburse expenses to the extent necessary to cap the Fund’s expenses at 1.00% for Class 2.
Table of Contents
| Notes to Financial Statements (Unaudited) | Wells Fargo Advantage VT Index Asset Allocation Fund | 33 |
Distribution fees
The Trust has adopted a Distribution Plan for Class 2 shares of the Fund pursuant to Rule 12b-1 under the 1940 Act. Distribution fees are charged to Class 2 shares and paid to Wells Fargo Funds Distributor, LLC, the principal underwriter, at an annual rate of 0.25% of the average daily net assets.
5. INVESTMENT PORTFOLIO TRANSACTIONS
Purchases and sales of investments, excluding short-term securities, for the six months ended June 30, 2012 were as follows:
| Purchases at Cost | Sales Proceeds | |||||||||||||
| U.S. Government | Non-U.S. Government | U.S. Government | Non-U.S. Government | |||||||||||
| $ | 3,000,774 | $ | 759,357 | $ | 4,451,274 | $ | 5,145,108 | |||||||
6. DERIVATIVE TRANSACTIONS
During the six months ended June 30, 2012, the Fund entered into futures contracts to gain market exposure to certain asset classes consistent with an active asset allocation strategy.
At June 30, 2012, the Fund had long and short futures contracts outstanding as follows:
| Expiration Date | Contracts | Type | Contract Value at June 30, | Unrealized Gains (Losses) | ||||||||
| September 2012 | 70 Long | S&P 500 Index | $ | 23,737,000 | $ | 814,761 | ||||||
| September 2012 | 3 Long | 30-Year U.S. Treasury Bonds | 443,906 | (572 | ) | |||||||
| September 2012 | 144 Short | 30-Year U.S. Treasury Bonds | 21,307,500 | (147,446 | ) | |||||||
The Fund had average contract amounts of $24,694,062 and $22,012,288 in long and short futures contracts, respectively, during the six months ended June 30, 2012.
A summary of derivative instruments by primary risk exposure is outlined in the following tables.
The fair value of derivative instruments as of June 30, 2012 was as follows for the Fund:
Asset Derivatives | Liability Derivatives | |||||||||||
| Balance Sheet Location | Fair Value | Balance Sheet Location | Fair Value | |||||||||
Interest rate contracts | Net assets – Net unrealized gains on investments | $ | 0 | * | Net assets – Net unrealized gains on investments | $ | 148,018 | * | ||||
Equity contracts | Net assets – Net unrealized gains on investments | 814,761 | * | Net assets – Net unrealized gains on investments | 0 | * | ||||||
| $ | 814,761 | $ | 148,018 | |||||||||
| * | Amount represents cumulative unrealized gains/losses on futures contracts. Only the variation margin as of June 30, 2012 is reported separately on the Statement of Assets and Liabilities. |
Table of Contents
| 34 | Wells Fargo Advantage VT Index Asset Allocation Fund | Notes to Financial Statements (Unaudited) |
The effect of derivative instruments on the Statement of Operations for the six months ended June 30, 2012 was as follows for the Fund:
| Amount of Realized Gains (Losses) on Derivatives | Change in Unrealized Gains (Losses) on Derivatives | |||||||
Equity contracts | $ | 2,005,399 | $ | 379,735 | ||||
Interest rate contracts | (634,884 | ) | (201,962 | ) | ||||
| $ | 1,370,515 | $ | 177,773 | |||||
7. BANK BORROWINGS
The Trust and Wells Fargo Funds Trust (excluding the money market funds) are parties to a $150,000,000 revolving credit agreement with State Street Bank and Trust Company, whereby the Fund is permitted to use bank borrowings for temporary or emergency purposes, such as to fund shareholder redemption requests. Interest under the credit agreement is charged to the Fund based on a borrowing rate equal to the higher of the Federal Funds rate in effect on that day plus 1.25% or the overnight LIBOR rate in effect on that day plus 1.25%. In addition, an annual commitment fee equal to 0.10% of the unused balance is allocated to each participating fund. For the six months ended June 30, 2012, the Fund paid $85 in commitment fees.
For the six months ended June 30, 2012, there were no borrowings by the Fund under the agreement.
8. INDEMNIFICATION
Under the Trust’s organizational documents, the officers and directors are indemnified against certain liabilities that may arise out of performance of their duties to the Trust. Additionally, in the normal course of business, the Trust may enter into contracts with service providers that contain a variety of indemnification clauses. The Trust’s maximum exposure under these arrangements is dependent on future claims that may be made against the Fund and, therefore, cannot be estimated.
9. NEW ACCOUNTING PRONOUNCEMENT
In December 2011, the Financial Accounting Standards Board (“FASB”) issued Accounting Standard Update (“ASU”) No. 2011-11, Disclosures about Offsetting Assets and Liabilities. ASU 2011-11, which amends FASB ASC Topic 210, Balance Sheet, creates new disclosure requirements which require entities to disclose both gross and net information for derivatives and other financial instruments that are either offset in the Statement of Assets and Liabilities or subject to an enforceable master netting arrangement or similar agreement. The disclosure requirements are effective for interim and annual reporting periods beginning on or after January 1, 2013. Management is currently assessing the potential impact, in addition to expanded financial statement disclosure, that may result from adopting this ASU.
Table of Contents
| Other Information (Unaudited) | Wells Fargo Advantage VT Index Asset Allocation Fund | 35 |
PROXY VOTING INFORMATION
A description of the policies and procedures that the Fund uses to determine how to vote proxies relating to portfolio securities is available without charge, upon request, by calling 1-800-222-8222, visiting our Web site at wellsfargoadvantagefunds.com, or visiting the SEC Web site at sec.gov. Information regarding how the Fund voted proxies relating to portfolio securities during the most recent 12-month period ended June 30 is available without charge on the Fund’s Web site at wellsfargoadvantagefunds.com or by visiting the SEC Web site at sec.gov.
PORTFOLIO HOLDINGS INFORMATION
The complete portfolio holdings for the Fund are publicly available on the Fund’s Web site (wellsfargoadvantagefunds.com) on a monthly, 30-day or more delayed basis. In addition, top ten holdings information for the Fund is publicly available on the Fund’s Web site on a monthly, seven-day or more delayed basis. The Fund files its complete schedule of portfolio holdings with the SEC for the first and third quarters of each fiscal year on Form N-Q, which is available without charge by visiting the SEC Web site at sec.gov. In addition, the Fund’s Form N-Q may be reviewed and copied at the SEC’s Public Reference Room in Washington, DC, and at regional offices in New York City, at 233 Broadway, and in Chicago, at 175 West Jackson Boulevard, Suite 900. Information about the Public Reference Room may be obtained by calling 1-800-SEC-0330.
Table of Contents
| 36 | Wells Fargo Advantage VT Index Asset Allocation Fund | Other Information (Unaudited) |
BOARD OF TRUSTEES AND OFFICERS
Each of the Trustees and Officers listed in the table below acts in identical capacities for the Wells Fargo Advantage family of funds, which consists of 138 funds comprising the Wells Fargo Funds Trust, Wells Fargo Variable Trust, Wells Fargo Master Trust and four closed-end funds (collectively the “Fund Complex”). This table should be read in conjunction with the Prospectus and the Statement of Additional Information1. All of the Trustees are also Members of the Audit and Governance Committees of each Trust in the Fund Complex. The mailing address of each Trustee and Officer is 525 Market Street, 12th Floor, San Francisco, CA 94105. Each Trustee and Officer serves an indefinite term, however, each Trustee serves such term until reaching the mandatory retirement age established by the Trustees.
Independent Trustees
Name and Year of Birth | Position Held and Length of Service* | Principal Occupations During Past Five Years | Other Directorships During | |||
| Peter G. Gordon (Born 1942) | Trustee, since 1998; Chairman, since 2005 (Lead Trustee since 2001) | Co-Founder, Retired Chairman, President and CEO of Crystal Geyser Water Company. Trustee Emeritus, Colby College | Asset Allocation Trust | |||
| Isaiah Harris, Jr. (Born 1952) | Trustee, since 2009 | Retired. Prior thereto, President and CEO of BellSouth Advertising and Publishing Corp. from 2005 to 2007, President and CEO of BellSouth Enterprises from 2004 to 2005 and President of BellSouth Consumer Services from 2000 to 2003. Emeritus member of the Iowa State University Foundation Board of Governors. Emeritus Member of the Advisory Board of Iowa State University School of Business. Mr. Harris is a certified public accountant. | CIGNA Corporation; Deluxe Corporation; Asset Allocation Trust | |||
| Judith M. Johnson (Born 1949) | Trustee, since 2008 | Retired. Prior thereto, Chief Executive Officer and Chief Investment Officer of Minneapolis Employees Retirement Fund from 1996 to 2008. Ms. Johnson is an attorney, certified public accountant and a certified managerial accountant. | Asset Allocation Trust | |||
| Leroy Keith, Jr. (Born 1939) | Trustee, since 2010 | Chairman, Bloc Global Services (development and construction). Trustee of the Evergreen Funds from 1983 to 2010. Former Managing Director, Almanac Capital Management (commodities firm), former Partner, Stonington Partners, Inc. (private equity fund), former Director, Obagi Medical Products Co. and former Director, Lincoln Educational Services. | Trustee, Virtus Fund Complex (consisting of 40 portfolios as of 12/31/11); Asset Allocation Trust | |||
| David F. Larcker (Born 1950) | Trustee, since 2009 | James Irvin Miller Professor of Accounting at the Graduate School of Business, Stanford University, Director of Corporate Governance Research Program and Senior Faculty of The Rock Center for Corporate Governance since 2006. From 2005 to 2008, Professor of Accounting at the Graduate School of Business, Stanford University. Prior thereto, Ernst & Young Professor of Accounting at The Wharton School, University of Pennsylvania from 1985 to 2005. | Asset Allocation Trust | |||
| Olivia S. Mitchell (Born 1953) | Trustee, since 2006 | International Foundation of Employee Benefit Plans Professor, Wharton School of the University of Pennsylvania since 1993. Director of Wharton’s Pension Research Council and Boettner Center on Pensions & Retirement Research, and Research Associate at the National Bureau of Economic Research. Previously, Cornell University Professor from 1978 to 1993. | Asset Allocation Trust |
Table of Contents
| Other Information (Unaudited) | Wells Fargo Advantage VT Index Asset Allocation Fund | 37 |
Name and Year of Birth | Position Held and Length of Service* | Principal Occupations During Past Five Years | Other Directorships During | |||
| Timothy J. Penny (Born 1951) | Trustee, since 1996 | President and CEO of Southern Minnesota Initiative Foundation, a non-profit organization, since 2007 and Senior Fellow at the Humphrey Institute Policy Forum at the University of Minnesota since 1995. Member of the Board of Trustees of NorthStar Education Finance, Inc., a non-profit organization, since 2007. | Asset Allocation Trust | |||
| Michael S. Scofield (Born 1943) | Trustee, since 2010 | Served on the Investment Company Institute’s Board of Governors and Executive Committee from 2008-2011 as well the Governing Council of the Independent Directors Council from 2006-2011 and the Independent Directors Council Executive Committee from 2008-2011. Chairman of the IDC from 2008-2010. Institutional Investor (Fund Directions) Trustee of Year in 2007. Trustee of the Evergreen Funds (and its predecessors) from 1984 to 2010. Chairman of the Evergreen Funds from 2000-2010. Former Trustee of the Mentor Funds. Retired Attorney, Law Offices of Michael S. Scofield and former Director and Chairman, Branded Media Corporation (multi-media branding company). | Asset Allocation Trust | |||
| Donald C. Willeke (Born 1940) | Trustee, since 1996 | Principal of the law firm of Willeke & Daniels. General Counsel of the Minneapolis Employees Retirement Fund from 1984 until its consolidation into the Minnesota Public Employees Retirement Association on June 30, 2010. Director and Vice Chair of The Free Trust (non-profit corporation). Director of the American Chestnut Foundation (non-profit corporation). | Asset Allocation Trust |
| * | Length of service dates reflect the Trustee’s commencement of service with the Trust’s predecessor entities, where applicable. |
Officers
Name and Year of Birth | Position Held and Length of Service | Principal Occupations During Past Five Years | ||||
| Karla M. Rabusch (Born 1959) | President, since 2003 | Executive Vice President of Wells Fargo Bank, N.A. and President of Wells Fargo Funds Management, LLC since 2003. Senior Vice President and Chief Administrative Officer of Wells Fargo Funds Management, LLC from 2001 to 2003. | ||||
| C. David Messman (Born 1960) | Secretary, since 2000; Chief Legal Officer, since 2003 | Senior Vice President and Secretary of Wells Fargo Funds Management, LLC since 2001. Vice President and Managing Senior Counsel of Wells Fargo Bank, N.A. since 1996. | ||||
| Nancy Wiser (Born 1967) | Treasurer, since 2012 | Executive Vice President of Wells Fargo Funds Management, LLC since 2011. Chief Operating Officer and Chief Compliance Officer at LightBox Capital Management LLC, from 2008 to 2011. Owned and operated a consulting business providing services to various hedge funds including acting as Chief Operating Officer and Chief Compliance Officer for a hedge fund from 2007 to 2008. Chief Operating Officer and Chief Compliance Officer of GMN Capital LLC from 2006 to 2007. | ||||
| David Berardi (Born 1975) | Assistant Treasurer, since 2009 | Vice President of Wells Fargo Funds Management, LLC since 2009. Vice President of Evergreen Investment Management Company, LLC from 2008 to 2010. Assistant Vice President of Evergreen Investment Services, Inc. from 2004 to 2008. Manager of Fund Reporting and Control for Evergreen Investment Management Company, LLC from 2004 to 2010. | ||||
| Jeremy DePalma (Born 1974) | Assistant Treasurer, since 2009 | Senior Vice President of Wells Fargo Funds Management, LLC since 2009. Senior Vice President of Evergreen Investment Management Company, LLC from 2008 to 2010. Vice President, Evergreen Investment Services, Inc. from 2004 to 2007. Head of the Fund Reporting and Control Team within Fund Administration from 2005 to 2010. | ||||
| Debra Ann Early (Born 1964) | Chief Compliance Officer, since 2007 | Chief Compliance Officer of Wells Fargo Funds Management, LLC since 2007. Chief Compliance Officer of Parnassus Investments from 2005 to 2007. Chief Financial Officer of Parnassus Investments from 2004 to 2007 and Senior Audit Manager of PricewaterhouseCoopers LLP from 1998 to 2004. |
| 1. | The Statement of Additional Information includes additional information about the Trustees and is available, without charge, upon request, by calling 1-800-222-8222 or by visiting the Web site at wellsfargoadvantagefunds.com. |
Table of Contents
| 38 | Wells Fargo Advantage VT Index Asset Allocation Fund | Other Information (Unaudited) |
BOARD CONSIDERATION OF INVESTMENT ADVISORY AND SUB-ADVISORY AGREEMENTS:
Under Section 15 of the Investment Company Act of 1940 (the “1940 Act”), the Board of Trustees (the “Board”) of Wells Fargo Funds Trust (the “Trust”), all the members of which have no direct or indirect interest in the investment advisory and sub-advisory agreements and are not “interested persons” of the Trust, as defined in the 1940 Act (the “Independent Trustees”), must determine whether to approve the continuation of the Trust’s investment advisory and sub-advisory agreements. In this regard, at an in person meeting held on March 29-30, 2012 (the “Meeting”), the Board reviewed and re-approved: (i) an investment advisory agreement with Wells Fargo Funds Management, LLC (“Funds Management”) for Wells Fargo Advantage VT Index Asset Allocation Fund (the “Fund”) and (ii) an investment sub-advisory agreement with Wells Capital Management Incorporated (“Wells Capital Management”) for the Fund. The investment advisory agreement with Funds Management and the investment sub-advisory agreement with Wells Capital Management are collectively referred to as the “Advisory Agreements.”
At the Meeting, the Board considered the factors and reached the conclusions described below relating to the selection of Funds Management and Wells Capital Management and the continuation of the Advisory Agreements. Prior to the Meeting, the Trustees conferred extensively among themselves and with representatives of Funds Management about these matters. The Board also met throughout the year and received information that was useful to them in considering the continuation of the Advisory Agreements. The Independent Trustees were assisted in their evaluation of the Advisory Agreements by independent legal counsel, from whom they received separate legal advice and with whom they met separately from Funds Management.
In providing information to the Board, Funds Management and Wells Capital Management were guided by a detailed set of requests submitted by the Independent Trustees’ independent legal counsel on their behalf at the start of the Board’s annual contract renewal process earlier in 2012. In approving the Advisory Agreements, the Board did not identify any particular information or consideration that was all-important or controlling, and each Trustee likely attributed different weights to various factors.
Nature, extent and quality of services
The Board received and considered various information regarding the nature, extent and quality of services provided to the Fund by Funds Management and Wells Capital Management under the Advisory Agreements. The Board also received and considered, among other things, information about the background and experience of senior management of Funds Management, and the qualifications, backgrounds, tenures and responsibilities of the portfolio managers primarily responsible for the day-to-day portfolio management of the Fund.
The Board evaluated the ability of Funds Management and Wells Capital Management, based on their respective financial condition, resources, reputation and other attributes, to attract and retain qualified investment professionals, including research, advisory, and supervisory personnel. The Board further considered the compliance programs and compliance records of Funds Management and Wells Capital Management. In addition, the Board took into account the administrative services provided to the Fund by Funds Management and its affiliates.
The Board’s decision to approve the continuation of the Advisory Agreements was based on a comprehensive evaluation of information provided to it. In considering these matters, the Board considered not only the specific information presented in connection with the Meeting, but also the knowledge gained over time through interaction with Funds Management and Wells Capital Management about various topics, including Funds Management’s oversight of service providers. The above factors, together with those referenced below, are some of the most important, but not necessarily all, factors considered by the Board in concluding that the nature, extent and quality of the investment advisory services provided to the Fund by Funds Management and Wells Capital Management supported the re-approval of the Advisory Agreements. Although the Board considered the continuation of the Advisory Agreements for the Fund as part of the larger process of considering the continuation of the advisory agreements for all of the funds in the complex, its decision to continue the Advisory Agreements for the Fund was ultimately made on a fund-by-fund basis.
Fund performance and expenses
The Board considered the performance results for the Fund over various time periods ended December 31, 2011. The Board also considered these results in comparison to the median performance of a universe of relevant funds (the “Universe”) that was determined by Lipper Inc. (“Lipper”) to be similar to the Fund, and in comparison to the Fund’s
Table of Contents
| Other Information (Unaudited) | Wells Fargo Advantage VT Index Asset Allocation Fund | 39 |
benchmark index and to other comparative data. Lipper is an independent provider of investment company data. The Board received a description of the methodology used by Lipper to select the mutual funds in the Universe. The Board noted that the performance of the Fund was higher than or in range of the median performance of the Universe for all periods under review, except for the five-year period. The Board also noted that the performance of the Fund was higher than or in range of its benchmark, the Lipper VUF Mixed-Asset Target Allocation Moderate Funds Index, for the periods under review.
The Board received and considered information regarding the Fund’s contractual advisory fee and net operating expense ratios and their various components, including actual management fees (which reflect fee waivers, if any), transfer agent, custodian and other non-management fees, Rule 12b-1 and non-Rule 12b-1 fees, service fees and fee waiver and expense reimbursement arrangements. The Board also considered these ratios in comparison to the median ratios of an expense Universe and a narrower expense group of mutual funds (each, an “Expense Group”) that was determined by Lipper to be similar to the Fund. The Board received a description of the methodology used by Lipper to select the mutual funds in the Fund’s Expense Group. The Board noted that the net operating expense ratios of the Fund were in range of the Fund’s Expense Group’s median net operating expense ratios.
Based on the above-referenced considerations and other factors, the Board concluded that the overall performance and expense structure of the Fund supported the re-approval of the Advisory Agreements for the Fund.
Investment advisory and sub-advisory fee rates
The Board reviewed and considered the contractual investment advisory fee rate that is payable by the Fund to Funds Management for investment advisory services (the “Advisory Agreement Rate”), both on a stand-alone basis and on a combined basis with the Fund’s administration fee rate. The Board took into account the separate administrative and other services covered by the administration fee rate. The Board also reviewed and considered the contractual investment sub-advisory fee rate that is payable by Funds Management to Wells Capital Management for investment sub-advisory services (the “Sub-Advisory Agreement Rate”). In addition, the Board reviewed and considered the existing fee waiver/cap arrangements applicable to the Advisory Agreement Rate and considered the Advisory Agreement Rate after taking the waivers/caps into account (the “Net Advisory Rate”).
The Board received and considered information comparing the Advisory Agreement Rate and Net Advisory Rate, combined with the administration fee rates, with those of other funds in the Fund’s Expense Group median. The Board noted that the Advisory Agreement Rate and Net Advisory Rate for the Fund were in range of the median rates for the Fund’s Expense Group.
The Board also received and considered information about the nature and extent of services offered and fee rates charged by Funds Management and Wells Capital Management to other types of clients. In this regard, the Board received information about differences between the services, and the compliance, reporting, and other legal burdens and risks of providing investment advice to mutual funds and those associated with providing advice to non-mutual fund clients such as collective funds or institutional separate accounts.
The Board determined that the Advisory Agreement Rate for the Fund, both with and without the administration fee rate and before and after waivers, was reasonable in light of the Fund’s Expense Group information, the net expense ratio commitments, the services covered by the Advisory Agreements and other information provided. The Board also reviewed and considered the Sub-Advisory Agreement Rate and concluded that the Sub-Advisory Agreement Rate was reasonable in light of the services covered by the Sub-Advisory Agreement and other information provided.
Profitability
The Board received and considered a profitability analysis of Funds Management, as well as an analysis of the profitability to the collective Wells Fargo businesses that provide services to the Fund. It considered that the information provided to it was necessarily estimated, and that the profitability information provided to it, especially on a fund-by-fund basis, did not necessarily provide a precise tool for evaluating the appropriateness of the Fund’s Advisory Agreement Rate in isolation. It noted that the levels of profitability reported on a fund-by-fund basis varied widely, depending on, among other things, the size and type of fund. The Board concluded that the profitability reported by Funds Management was not unreasonable.
Table of Contents
| 40 | Wells Fargo Advantage VT Index Asset Allocation Fund | Other Information (Unaudited) |
The Board did not consider separate profitability information with respect to Wells Capital Management, because, as an affiliate of Funds Management, its profitability information was subsumed in the collective Wells Fargo profitability analysis provided by Funds Management.
Economies of scale
With respect to possible economies of scale, the Board reviewed the breakpoints in the Fund’s advisory fee and/or administration fee structure, which operate generally to reduce the expenses of the Fund (as a percentage of Fund assets) as the Fund grows in size. It considered that, as a fund shrinks in size, breakpoints conversely result in increasing fee levels. The Board noted that it would have on-going opportunities to review the appropriate levels of breakpoints in the future, and concluded that the breakpoints as implemented appeared to be a reasonable step toward sharing economies of scale, if any, with the Fund. However, the Board acknowledged the inherent limitations of any analysis of economies of scale and of any attempt to correlate breakpoints with such economies, stemming largely from the Board’s understanding that economies of scale are realized, if at all, across a variety of products and services, not just with respect to a single fund.
Other benefits to Funds Management and Wells Capital Management
The Board received and considered information regarding potential “fall-out” or ancillary benefits received by Funds Management and its affiliates, including Wells Capital Management, as a result of their relationship with the Fund. Ancillary benefits could include, among others, benefits directly attributable to the relationship of Funds Management and Wells Capital Management with the Fund and benefits potentially derived from an increase in Funds Management’s and Wells Capital Management’s business as a result of their relationship with the Fund (such as the ability to market to shareholders other financial products offered by Funds Management and its affiliates, including Wells Capital Management).
The Board considered that Wells Fargo Funds Distributor, LLC, an affiliate of Funds Management, serves as distributor to the Fund and receives certain compensation for those services. The Board noted that various financial institutions, including affiliates of Funds Management, may receive distribution-related fees, shareholder servicing payments (including amounts derived from payments under Rule 12b-1 plans) and sub-transfer agency fees in respect of shares sold or held through them and services provided.
The Board also reviewed information about whether and to what extent soft dollar credits are sought and how any such credits are utilized and any benefits that may be realized by using an affiliated broker.
Other factors and broader review
The Board also considered the markets for distribution of the Fund’s shares, including the channels through which the Fund’s shares are offered and sold. The Board noted that the Fund is part of one of the few fund families that have both direct-to-fund and intermediary distribution channels. As discussed above, the Board reviews detailed materials received from Funds Management and Wells Capital Management annually as part of the re-approval process under Section 15 of the 1940 Act and also reviews and assesses information about the quality of the services that the Fund receives throughout the year. In this regard, the Board has reviewed reports of Funds Management at each of its quarterly meetings, which include, among other things, portfolio reviews and performance reports. In addition, the Board confers with portfolio managers at various times throughout the year.
Conclusion
After considering the above-described factors and based on its deliberations and its evaluation of the information described above, the Board unanimously approved the continuation of the Advisory Agreements for an additional one-year period.
Table of Contents
| List of Abbreviations | Wells Fargo Advantage VT Index Asset Allocation Fund | 41 |
The following is a list of common abbreviations for terms and entities which may have appeared in this report.
| ACB | — Agricultural Credit Bank |
| ADR | — American Depository Receipt |
| ADS | — American Depository Shares |
| AGC-ICC | — Assured Guaranty Corporation - Insured Custody Certificates |
| AGM | — Assured Guaranty Municipal |
| AMBAC | — American Municipal Bond Assurance Corporation |
| AMT | — Alternative Minimum Tax |
| AUD | — Australian Dollar |
| BAN | — Bond Anticipation Notes |
| BHAC | — Berkshire Hathaway Assurance Corporation |
| BRL | — Brazil Real |
| CAB | — Capital Appreciation Bond |
| CAD | — Canadian Dollar |
| CCAB | — Convertible Capital Appreciation Bond |
| CDA | — Community Development Authority |
| CDO | — Collateralized Debt Obligation |
| CHF | — Swiss Franc |
| COP | — Certificate of Participation |
| CR | — Custody Receipts |
| DKK | — Danish Krone |
| DRIVER | — Derivative Inverse Tax-Exempt Receipts |
| DW&P | — Department of Water & Power |
| DWR | — Department of Water Resources |
| ECFA | — Educational & Cultural Facilities Authority |
| EDA | — Economic Development Authority |
| EDFA | — Economic Development Finance Authority |
| ETF | — Exchange-Traded Fund |
| EUR | — Euro |
| FFCB | — Federal Farm Credit Bank |
| FGIC | — Financial Guaranty Insurance Corporation |
| FGLMC | — Federal Government Loan Mortgage Company |
| FHA | — Federal Housing Authority |
| FHLB | — Federal Home Loan Bank |
| FHLMC | — Federal Home Loan Mortgage Corporation |
| FICO | — The Financing Corporation |
| FNMA | — Federal National Mortgage Association |
| FSA | — Farm Service Agency |
| GBP | — Great British Pound |
| GDR | — Global Depository Receipt |
| GNMA | — Government National Mortgage Association |
| GO | — General Obligation |
| HCFR | — Healthcare Facilities Revenue |
| HEFA | — Health & Educational Facilities Authority |
| HEFAR | — Higher Education Facilities Authority Revenue |
| HFA | — Housing Finance Authority |
| HFFA | — Health Facilities Financing Authority |
| HKD | — Hong Kong Dollar |
| HUF | — Hungarian Forint |
| IBC | — Insured Bond Certificate |
| IDA | — Industrial Development Authority |
| IDAG | — Industrial Development Agency |
| IDR | — Industrial Development Revenue |
| IEP | — Irish Pound |
| JPY | — Japanese Yen |
| KRW | — Republic of Korea Won |
| LIBOR | — London Interbank Offered Rate |
| LIQ | — Liquidity Agreement |
| LLC | — Limited Liability Company |
| LLP | — Limited Liability Partnership |
| LOC | — Letter of Credit |
| LP | — Limited Partnership |
| MBIA | — Municipal Bond Insurance Association |
| MFHR | — Multi-Family Housing Revenue |
| MSTR | — Municipal Securities Trust Receipts |
| MTN | — Medium Term Note |
| MUD | — Municipal Utility District |
| MXN | — Mexican Peso |
| MYR | — Malaysian Ringgit |
| NATL-RE | — National Public Finance Guarantee Corporation |
| NOK | — Norwegian Krone |
| NZD | — New Zealand Dollar |
| PCFA | — Pollution Control Finance Authority |
| PCR | — Pollution Control Revenue |
| PFA | — Public Finance Authority |
| PFFA | — Public Facilities Financing Authority |
| PFOTER | — Puttable Floating Option Tax-Exempt Receipts |
| plc | — Public Limited Company |
| PLN | — Polish Zloty |
| PUTTER | — Puttable Tax-Exempt Receipts |
| R&D | — Research & Development |
| RDA | — Redevelopment Authority |
| RDFA | — Redevelopment Finance Authority |
| REIT | — Real Estate Investment Trust |
| ROC | — Reset Option Certificates |
| SAVRS | — Select Auction Variable Rate Securities |
| SBA | — Small Business Authority |
| SEK | — Swedish Krona |
| SFHR | — Single Family Housing Revenue |
| SFMR | — Single Family Mortgage Revenue |
| SGD | — Singapore Dollar |
| SKK | — Slovakian Koruna |
| SPA | — Standby Purchase Agreement |
| SPDR | — Standard & Poor’s Depositary Receipts |
| STRIPS | — Separate Trading of Registered Interest and Principal Securities |
| TAN | — Tax Anticipation Notes |
| TBA | — To Be Announced |
| TIPS | — Treasury Inflation-Protected Securities |
| TRAN | — Tax Revenue Anticipation Notes |
| TCR | — Transferable Custody Receipts |
| TRY | — Turkish Lira |
| TTFA | — Transportation Trust Fund Authority |
| TVA | — Tennessee Valley Authority |
| XLCA | — XL Capital Assurance |
| ZAR | — South African Rand |
Table of Contents
This page is intentionally left blank.
Table of Contents


FOR MORE INFORMATION
More information about Wells Fargo Advantage Funds is available free upon request. To obtain literature, please write, e-mail, visit the Fund’s Web site, or call:
Wells Fargo Advantage Funds
P.O. Box 8266
Boston, MA 02266-8266
E-mail: wfaf@wellsfargo.com
Web site: wellsfargoadvantagefunds.com
Individual investors: 1-800-222-8222
Retail investment professionals: 1-888-877-9275
Institutional investment professionals: 1-866-765-0778
This report and the financial statements contained herein are submitted for the general information of the shareholders of Wells Fargo Advantage Funds. If this report is used for promotional purposes, distribution of the report must be accompanied or preceded by a current prospectus. For a current prospectus and, if available, a summary prospectus containing more complete information, including charges and expenses, call 1-800-222-8222 or visit the Fund’s Web site at wellsfargoadvantagefunds.com . Please consider the investment objectives, risks, charges, and expenses of the investment carefully before investing. This and other information about Wells Fargo Advantage Funds can be found in the current prospectus. Read the prospectus carefully before you invest or send money.
Wells Fargo Funds Management, LLC, a wholly owned subsidiary of Wells Fargo & Company, provides investment advisory and administrative services for Wells Fargo Advantage Funds. Other affiliates of Wells Fargo & Company provide subadvisory and other services for the Funds. The Funds are distributed by Wells Fargo Funds Distributor, LLC, Member FINRA/SIPC, an affiliate of Wells Fargo & Company.
NOT FDIC INSURED ¡ NO BANK GUARANTEE ¡ MAY LOSE VALUE
© 2012 Wells Fargo Funds Management, LLC. All rights reserved.
210663 08-12 SVT2/SAR136 06-12 |
Table of Contents

Wells Fargo Advantage
VT International Equity Fund

Semi-Annual Report
June 30, 2012

Table of Contents
Reduce clutter. Save trees.
Sign up for electronic delivery of prospectuses and shareholder reports at wellsfargo.com/advantagedelivery
| 2 | ||||
| 4 | ||||
| 6 | ||||
| 7 | ||||
Financial Statements | ||||
| 11 | ||||
| 12 | ||||
| 13 | ||||
| 14 | ||||
| 16 | ||||
| 21 | ||||
| 27 | ||||
The views expressed and any forward-looking statements are as of June 30, 2012, unless otherwise noted, and are those of the Fund managers and/or Wells Fargo Funds Management, LLC. Discussions of individual securities, or the markets generally, or any Wells Fargo Advantage Fund are not intended as individual recommendations. Future events or results may vary significantly from those expressed in any forward-looking statements; the views expressed are subject to change at any time in response to changing circumstances in the market. Wells Fargo Funds Management, LLC, disclaims any obligation to publicly update or revise any views expressed or forward-looking statements.
NOT FDIC INSURED ¡ NO BANK GUARANTEE ¡ MAY LOSE VALUE
Table of Contents

WELLS FARGO INVESTMENT HISTORY
| 1932 | Keystone creates one of the first mutual fund families. | |
| 1971 | Wells Fargo & Company introduces one of the first institutional index funds. | |
| 1978 | Wells Fargo applies Markowitz and Sharpe’s research on Modern Portfolio Theory to introduce one of the industry’s first Tactical Asset Allocation (TAA) models in institutional separately managed accounts. | |
| 1984 | Wells Fargo Stagecoach Funds launches its first asset allocation fund. | |
| 1989 | The Tactical Asset Allocation (TAA) Model is first applied to Wells Fargo’s asset allocation mutual funds. | |
| 1994 | Wells Fargo introduces the LifePath Funds, one of the first suites of target date funds (now the Wells Fargo Advantage Dow Jones Target Date FundsSM). | |
| 1996 | Evergreen Investments and Keystone Funds merge. | |
| 1997 | Wells Fargo launches Wells Fargo Advantage WealthBuilder PortfoliosSM, a fund-of-funds suite of products that includes the use of quantitative models to shift assets among investment styles. | |
| 1999 | Norwest Advantage Funds and Stagecoach Funds are reorganized into Wells Fargo Funds after the merger of Norwest and Wells Fargo. | |
| 2002 | Evergreen Retail and Evergreen Institutional companies form the umbrella asset management company, Evergreen Investments. | |
| 2005 | The integration of Strong Funds with Wells Fargo Funds creates Wells Fargo Advantage Funds, resulting in one of the top 20 mutual fund companies in the United States. | |
| 2006 | Wells Fargo Advantage Funds relaunches the target date product line as Wells Fargo Advantage Dow Jones Target Date Funds. | |
| 2010 | The mergers and reorganizations of Evergreen and Wells Fargo Advantage mutual funds are completed, unifying the families under the brand of Wells Fargo Advantage Funds. | |
Wells Fargo Advantage Funds®
Wells Fargo Advantage Funds skillfully guides institutions, financial advisors, and individuals through the investment terrain to help them reach their financial objectives. Everything we do on behalf of investors is backed by our unique combination of qualifications.
Strength
Our organization is built on the standards of integrity and service established by our parent company—Wells Fargo & Company—more than 150 years ago. And, because we’re part of a highly diversified financial enterprise, we offer the depth of resources to help investors succeed.
Expertise
Our multi-boutique model offers investors access to the independent thinking of premier investment managers that have been chosen for their time-tested strategies. While each team specializes in a specific investment strategy, collectively they provide investors a wide choice of distinct investment styles. Our dedication to investment excellence doesn’t end with our expertise in manager selection—risk management, analysis, and rigorous ongoing review seek to ensure each manager’s investment process remains consistent.
Partnership
Our collaborative approach is built around understanding the needs and goals of our clients. By adhering to core principles of sound judgment and steady guidance, we support you through every stage of the investment decision process.
Carefully consider a fund’s investment objectives, risks, charges, and expenses before investing. For a current prospectus and, if available, a summary prospectus, containing this and other information, visit wellsfargoadvantagefunds.com. Read it carefully before investing.
Wells Fargo Funds Management, LLC, a wholly owned subsidiary of Wells Fargo & Company, provides investment advisory and administrative services for Wells Fargo Advantage Funds®. Other affiliates of Wells Fargo & Company provide subadvisory and other services for the Funds. The Funds are distributed by Wells Fargo Funds Distributor, LLC, Member FINRA/SIPC, an affiliate of Wells Fargo & Company.
“Dow Jones®” and “Dow Jones Target Date IndexesSM” are service marks of Dow Jones Trademark Holdings, LLC (“Dow Jones”), have been licensed to CME Group Index Services LLC (“CME Indexes”) and have been sublicensed for use for certain purposes by Global Index Advisors, Inc, and Wells Fargo Funds Management, LLC. The Wells Fargo Advantage Dow Jones Target Date FundsSM based on the Dow Jones Target Date IndexesSM, are not sponsored, endorsed, sold or promoted by Dow Jones, CME Indexes or their respective affiliates and none of them makes any representation regarding the advisability of investing in such product(s).
NOT FDIC INSURED ¡ NO BANK GUARANTEE ¡ MAY LOSE VALUE
Not part of semi-annual report.
Table of Contents
Wells Fargo Advantage Funds offers more than 110 mutual funds across a wide range of asset classes, representing over $207 billion in assets under management, as of June 30, 2012.
| Equity Funds | ||||
Asia Pacific Fund | Enterprise Fund† | Opportunity Fund† | ||
C&B Large Cap Value Fund | Equity Value Fund | Precious Metals Fund | ||
C&B Mid Cap Value Fund | Global Opportunities Fund | Premier Large Company Growth Fund | ||
Capital Growth Fund | Growth Fund | Small Cap Opportunities Fund | ||
Common Stock Fund | Index Fund | Small Cap Value Fund | ||
Disciplined U.S. Core Fund | International Equity Fund | Small Company Growth Fund | ||
Discovery Fund† | International Value Fund | Small Company Value Fund | ||
Diversified Equity Fund | Intrinsic Small Cap Value Fund | Small/Mid Cap Core Fund | ||
Diversified International Fund | Intrinsic Value Fund | Small/Mid Cap Value Fund | ||
Diversified Small Cap Fund | Intrinsic World Equity Fund | Special Mid Cap Value Fund | ||
Emerging Growth Fund | Large Cap Core Fund | Special Small Cap Value Fund | ||
Emerging Markets Equity Fund | Large Cap Growth Fund | Specialized Technology Fund | ||
Emerging Markets Equity Income Fund | Large Company Value Fund | Traditional Small Cap Growth Fund | ||
Endeavor Select Fund† | Omega Growth Fund | Utility and Telecommunications Fund | ||
| Bond Funds | ||||
Adjustable Rate Government Fund | Inflation-Protected Bond Fund | Short-Term Bond Fund | ||
California Limited-Term Tax-Free Fund | Intermediate Tax/AMT-Free Fund | Short-Term High Yield Bond Fund | ||
California Tax-Free Fund | International Bond Fund | Short-Term Municipal Bond Fund | ||
Colorado Tax-Free Fund | Minnesota Tax-Free Fund | Strategic Municipal Bond Fund | ||
Emerging Markets Local Bond Fund | Municipal Bond Fund | Total Return Bond Fund | ||
Government Securities Fund | North Carolina Tax-Free Fund | Ultra Short-Term Income Fund | ||
High Income Fund | Pennsylvania Tax-Free Fund | Ultra Short-Term Municipal Income Fund | ||
High Yield Bond Fund | Short Duration Government Bond Fund | Wisconsin Tax-Free Fund | ||
Income Plus Fund | ||||
| Asset Allocation Funds | ||||
Absolute Return Fund | WealthBuilder Equity Portfolio† | Target 2020 Fund† | ||
Asset Allocation Fund | WealthBuilder Growth Allocation Portfolio† | Target 2025 Fund† | ||
Conservative Allocation Fund | WealthBuilder Growth Balanced Portfolio† | Target 2030 Fund† | ||
Diversified Capital Builder Fund | WealthBuilder Moderate Balanced Portfolio† | Target 2035 Fund† | ||
Diversified Income Builder Fund | WealthBuilder Tactical Equity Portfolio† | Target 2040 Fund† | ||
Growth Balanced Fund | Target Today Fund† | Target 2045 Fund† | ||
Index Asset Allocation Fund | Target 2010 Fund† | Target 2050 Fund† | ||
Moderate Balanced Fund | Target 2015 Fund† | Target 2055 Fund† | ||
WealthBuilder Conservative Allocation Portfolio† | ||||
| Money Market Funds | ||||
100% Treasury Money Market Fund | Heritage Money Market Fund† | National Tax-Free Money Market Fund | ||
California Municipal Money Market Fund | Money Market Fund | Prime Investment Money Market Fund | ||
Cash Investment Money Market Fund | Municipal Cash Management Money Market Fund | Treasury Plus Money Market Fund | ||
Government Money Market Fund | Municipal Money Market Fund | |||
| Variable Trust Funds1 | ||||
VT Discovery Fund† | VT Intrinsic Value Fund | VT Small Cap Growth Fund | ||
VT Index Asset Allocation Fund | VT Omega Growth Fund | VT Small Cap Value Fund | ||
VT International Equity Fund | VT Opportunity Fund† | VT Total Return Bond Fund |
An investment in a money market fund is not insured or guaranteed by the Federal Deposit Insurance Corporation or any other government agency. Although the Wells Fargo Advantage Money Market Funds seek to preserve the value of your investment at $1.00 per share, it is possible to lose money by investing in a money market fund.
| 1. | The Variable Trust Funds are generally available only through insurance company variable contracts. |
| † | In this report, the Wells Fargo Advantage Discovery FundSM, Wells Fargo Advantage Endeavor Select FundSM, Wells Fargo Advantage Enterprise FundSM, Wells Fargo Advantage Opportunity FundSM, Wells Fargo Advantage WealthBuilder Conservative Allocation PortfolioSM, Wells Fargo Advantage WealthBuilder Equity PortfolioSM, Wells Fargo Advantage WealthBuilder Growth Allocation PortfolioSM, Wells Fargo Advantage WealthBuilder Growth Balanced PortfolioSM, Wells Fargo Advantage WealthBuilder Moderate Balanced PortfolioSM, Wells Fargo Advantage WealthBuilder Tactical Equity PortfolioSM, Wells Fargo Advantage Dow Jones Target Today FundSM, Wells Fargo Advantage Dow Jones Target 2010 FundSM, Wells Fargo Advantage Dow Jones Target 2015 FundSM, Wells Fargo Advantage Dow Jones Target 2020 FundSM, Wells Fargo Advantage Dow Jones Target 2025 FundSM, Wells Fargo Advantage Dow Jones Target 2030 FundSM, Wells Fargo Advantage Dow Jones Target 2035 FundSM, Wells Fargo Advantage Dow Jones Target 2040 FundSM, Wells Fargo Advantage Dow Jones Target 2045 FundSM, Wells Fargo Advantage Dow Jones Target 2050 FundSM, Wells Fargo Advantage Dow Jones Target 2055 FundSM, Wells Fargo Advantage Heritage Money Market FundSM, Wells Fargo Advantage VT Discovery FundSM, and Wells Fargo Advantage VT Opportunity FundSM are referred to as the Discovery Fund, Endeavor Select Fund, Enterprise Fund, Opportunity Fund, WealthBuilder Conservative Allocation Portfolio, WealthBuilder Equity Portfolio, WealthBuilder Growth Allocation Portfolio, WealthBuilder Growth Balanced Portfolio, WealthBuilder Moderate Balanced Portfolio, WealthBuilder Tactical Equity Portfolio, Target Today Fund, Target 2010 Fund, Target 2015 Fund, Target 2020 Fund, Target 2025 Fund, Target 2030 Fund, Target 2035 Fund, Target 2040 Fund, Target 2045 Fund, Target 2050 Fund, Target 2055 Fund, Heritage Money Market Fund, VT Discovery Fund, and VT Opportunity Fund, respectively. |
Not part of semi-annual report.
Table of Contents
| 2 | Wells Fargo Advantage VT International Equity Fund | Letter to Shareholders (Unaudited) |

Karla M. Rabusch,
President
Wells Fargo Advantage Funds
The period was marked by continued concerns about the possible global economic effects of the ongoing European sovereign debt crisis that began in Greece and later spread to the larger economies of Italy and Spain.
In contrast to worrisome data from the eurozone, U.S. economic data remained moderately positive.
Dear Valued Shareholder:
We’re pleased to offer you this semi-annual report for the Wells Fargo Advantage VT International Equity Fund for the six-month period that ended June 30, 2012. The period was marked by continued concerns about the possible global economic effects of the ongoing European sovereign debt crisis that began in Greece and later spread to the larger economies of Italy and Spain. Widespread support from central banks helped push developed market indexes to gains despite considerable intra-period volatility.
Macroeconomic optimism faded as global growth slowed and worries rose.
Prior to and throughout the reporting period, concerns about the eurozone sovereign debt situation returned to center stage and dominated stock markets around the globe. Investors became increasingly concerned that Greece would default on its debt, a scenario that only seemed more likely as eurozone leaders began to openly discuss a “voluntary” haircut on Greek debt for private investors. Because many eurozone banks owned Greek debt and many U.S. banks had financial ties to eurozone banks, investors worried about the effects of such an event on the financial systems and on the global economy.
The Greek credit crisis was seemingly addressed in March 2012 when the Greek government came to an agreement with its creditors, allowing the country to write down the principal on most of its bonds in exchange for increased financial austerity. The Greek agreement, combined with unprecedented support for eurozone banks by the European Central Bank, seemed to calm investor concerns, at least temporarily.
By the end of the reporting period, however, the agreement seemed on the verge of unraveling. Legislative elections in May left no single party with enough seats to form a government, and none of the parties was able to form a ruling coalition. A pro-bailout party won the subsequent June elections, but the Greek economy remained so weak that investors questioned whether the country would be able to meet its economic targets from the March agreement. Even more worrisome, in May 2012, Spain nationalized Bankia, putting more than $19 billion into the bank after it suffered heavy losses from property loans. The move refocused investor attention on Spain’s weak economy and depressed property sector, and Spanish bonds sold off. Moreover, news reports indicated that Greeks and Spaniards were pulling money from their country’s banks in favor of German and Swiss banks. By mid-June, analysts were openly discussing the possibility of a crisis within the European banking system.
The U.S. economy reported relatively solid news.
In contrast to worrisome data from the eurozone, U.S. economic data remained moderately positive. Reported real gross domestic product (GDP) growth came in at an annualized rate of 3.0% in the fourth quarter of 2011 compared with the prior quarter. Real GDP growth decelerated to a 1.9% annualized rate in the first quarter of 2012 but remained solidly in positive territory. In addition, the major banks appeared to have taken steps toward repairing their balance sheets; in March, the Federal Reserve (Fed) announced that 15 of the 19 major banks had passed a “stress test” in which the Fed attempted to gauge whether the banks could survive a severe recession that included a 50% drop in the stock market and a 21% percent decline in housing prices.
Table of Contents
| Letter to Shareholders (Unaudited) | Wells Fargo Advantage VT International Equity Fund | 3 |
The main piece of negative economic data was the unemployment rate, which remained at relatively high levels, beginning the period at 8.3% and ending it at 8.2%. Toward the end of the period, data indicated that the U.S. economy was adding fewer jobs than expected, leading to concerns that the country’s economic growth was slowing.
Major stock indexes posted positive returns.
Even though investor worries about the sovereign debt crisis within the eurozone caused considerable stock market volatility, the combination of central bank support and relatively strong U.S. economic numbers pushed major stock market indexes into the black, both for developed markets and for major emerging markets. Within the U.S., large-cap stocks modestly outperformed small-cap stocks, and growth stocks edged past value stocks.
We use time-tested investment strategies, even as many variables are at work in the market.
The full effect of the credit crisis remains unknown. Elevated unemployment and debt defaults continue to pressure consumers and businesses alike. In our experience, strict adherence to time-tested investment strategies has its rewards. As a whole, Wells Fargo Advantage Funds represents investments across a range of asset classes and investment styles, giving you an opportunity to create a diversified investment portfolio. While diversification may not prevent losses in a downturn, we believe it helps in managing risk.
Thank you for choosing to invest with Wells Fargo Advantage Funds. We appreciate your confidence in us and remain committed to helping you meet your financial needs. For current information about your fund investments, contact your investment professional, visit our Web site at wellsfargoadvantagefunds.com, or call us directly at 1-800-222-8222. We are available 24 hours a day, 7 days a week.
Sincerely,

Karla M. Rabusch
President
Wells Fargo Advantage Funds
Table of Contents
| 4 | Wells Fargo Advantage VT International Equity Fund | Performance Highlights (Unaudited) |
INVESTMENT OBJECTIVE
The Fund seeks long-term capital appreciation.
ADVISER
Wells Fargo Funds Management, LLC
SUB-ADVISER
Wells Capital Management Incorporated
PORTFOLIO MANAGERS
Jeffrey Everett, CFA
Dale A. Winner, CFA
FUND INCEPTION
August 17, 1998
| TEN LARGEST EQUITY HOLDINGS1 (AS OF JUNE 30, 2012) | ||||
Canon Incorporated | 2.23% | |||
China Mobile Limited | 2.16% | |||
Hennes & Mauritz AB Class B | 2.16% | |||
China Resources Power Holdings Company | 2.11% | |||
Bayer AG | 2.10% | |||
Novartis AG | 2.06% | |||
Smiths Group plc | 1.95% | |||
Volvo AB Class B | 1.95% | |||
E. ON AG | 1.94% | |||
Siemens AG | 1.94% | |||
| SECTOR DISTRIBUTION2 (AS OF JUNE 30, 2012) | ||
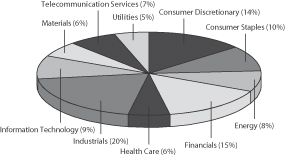 | ||
| 1. | The ten largest equity holdings are calculated based on the value of the securities divided by total net assets of the Fund. Holdings are subject to change and may have changed since the date specified. |
| 2. | Sector distribution is subject to change and is calculated based on the total long-term investments of the Fund. |
Table of Contents
| Performance Highlights (Unaudited) | Wells Fargo Advantage VT International Equity Fund | 5 |
AVERAGE ANNUAL TOTAL RETURN3 (%) (AS OF JUNE 30, 2012)
| Expense Ratios4 | ||||||||||||||||||||||||||||
| Inception Date | 6 Months* | 1 Year | 5 Year | 10 Year | Gross | Net5 | ||||||||||||||||||||||
Class 1 | 08/17/1998 | 0.42 | (15.51 | ) | (6.32 | ) | 4.21 | 0.98% | 0.70% | |||||||||||||||||||
Class 2 | 07/31/2002 | 0.42 | (15.63 | ) | (6.52 | ) | 3.97 | 1.23% | 0.95% | |||||||||||||||||||
MSCI ACWI Ex. USA Index (Net)6,8 | 2.77 | (14.57 | ) | (4.62 | ) | 6.74 | ||||||||||||||||||||||
MSCI EAFE Free Index (Net)7, 8 | 2.96 | (13.83 | ) | (6.10 | ) | 5.14 | ||||||||||||||||||||||
| * | Returns for periods of less than one year are not annualized. |
Figures quoted represent past performance, which is no guarantee of future results and do not reflect the deduction of taxes that a shareholder may pay on fund distributions or the redemption of fund shares. Investment return and principal value of an investment will fluctuate so that an investor’s shares, when redeemed, may be worth more or less than their original cost. Current performance may be lower or higher than the performance data quoted and assumes the reinvestment of dividends and capital gains. Current month-end performance is available by calling 1-866-765-0778. Performance figures of the Fund do not reflect fees charged pursuant to the terms of variable life insurance policies and variable annuity contracts.
Index returns do not include transaction costs associated with buying and selling securities, any mutual fund fees or expenses or any taxes. It is not possible to invest directly in an index.
Stock fund values fluctuate in response to the activities of individual companies and general market and economic conditions. Foreign investments are especially volatile and can rise or fall dramatically due to differences in the political and economic conditions of the host country. These risks are generally intensified in emerging markets. The use of derivatives may reduce returns and/or increase volatility. Certain investment strategies tend to increase the total risk of an investment (relative to the broader market). This Fund is exposed to active trading risk and smaller company securities risk. Consult the Fund’s prospectus for additional information on these and other risks.
Please refer to the prospectus provided by your participating insurance company for detailed information describing the separate accounts for information regarding surrender charges, mortality and expense risk fees and other charges that may be assessed by the participating insurance companies.
| 3. | Performance shown for Class 2 shares prior to its inception reflects the performance of Class 1 shares, adjusted to reflect the higher expenses applicable to Class 2 shares. Historical performance shown for all classes of the Fund prior to July 19, 2010 is based on the performance of the Fund’s predecessor, Evergreen VA International Equity Fund. Effective July 16, 2010, the Fund changed its name from Wells Fargo Advantage VT International Core Fund to Wells Fargo Advantage VT International Equity Fund. |
| 4. | Reflects the expense ratios as stated in the most recent prospectuses. |
| 5. | The Adviser has committed through July 18, 2013 to waive fees and/or reimburse expenses to the extent necessary to cap the Fund’s Total Annual Fund Operating Expenses After Fee Waiver, excluding certain expenses, at 0.69% for Class 1 and 0.94% for Class 2. Without this cap, the Fund’s returns would have been lower. |
| 6. | The Morgan Stanley Capital International All Country World Ex. USA Index (Net) is a free float-adjusted market capitalization weighted index that is designed to measure the equity market performance of developed and emerging markets excluding the United States. You cannot invest directly in an index. Source: MSCI. MSCI makes no express or implied warranties or representations and shall have no liability whatsoever with respect to any MSCI data contained herein. The MSCI data may not be further redistributed or used as a basis for other indexes or any securities or financial products. This report is not approved, reviewed, or produced by MSCI. |
| 7. | The Morgan Stanley Capital International Europe, Australasia, and Far East (“MSCI EAFE Free”) Free Index (Net) is an unmanaged group of securities widely regarded by investors to be representative of the stock markets of Europe, Australasia, and the Far East. MSCI Free Indexes (Net) are constructed to reflect investment opportunities for global investors to account for local market restrictions on stock ownership by international investors. You cannot invest directly in an index. |
| 8. | The Fund has changed its benchmark from the MSCI EAFE Index to the MSCI ACWI Ex. USA Index because the Fund’s adviser believes that the MSCI ACWI Ex. USA Index is a more appropriate index in light of the Fund’s increased ability to invest in emerging markets. |
Table of Contents
| 6 | Wells Fargo Advantage VT International Equity Fund | Fund Expenses (Unaudited) |
As a shareholder of the Fund, you incur ongoing costs, including management fees, distribution (12b-1) fees, and other Fund expenses. This example is intended to help you understand your ongoing costs (in dollars) of investing in the Fund and to compare these costs with the ongoing costs of investing in other mutual funds.
The example is based on an investment of $1,000 invested at the beginning of the six-month period and held for the entire period from January 1, 2012 to June 30, 2012.
Actual Expenses
The “Actual” line of the table below provides information about actual account values and actual expenses. You may use the information in this line, together with the amount you invested, to estimate the expenses that you paid over the period. Simply divide your account value by $1,000 (for example, an $8,600 account value divided by $1,000 = 8.6), then multiply the result by the number in the “Actual” line under the heading entitled “Expenses Paid During Period” for your applicable class of shares to estimate the expenses you paid on your account during this period.
Hypothetical Example for Comparison Purposes
The “Hypothetical” line of the table below provides information about hypothetical account values and hypothetical expenses based on the Fund’s actual expense ratio and an assumed rate of return of 5% per year before expenses, which is not the Fund’s actual return. The hypothetical account values and expenses may not be used to estimate the actual ending account balance or expenses you paid for the period. You may use this information to compare the ongoing costs of investing in the Fund and other funds. To do so, compare this 5% hypothetical example with the 5% hypothetical examples that appear in the shareholder reports of the other funds.
Please note that the expenses shown in the table are meant to highlight your ongoing costs only and do not reflect any separate account charges assessed by participating insurance companies. Therefore, the “Hypothetical” line of the table is useful in comparing ongoing costs only, and will not help you determine the relative total costs of owning different funds. In addition, if these separate account charges assessed by participating insurance companies were included, your costs would have been higher.
| Beginning Account Value 01-01-2012 | Ending Account Value 06-30-2012 | Expenses Paid During the Period1 | Net Annual Expense Ratio | |||||||||||||
Class 1 | ||||||||||||||||
Actual | $ | 1,000.00 | $ | 1,004.19 | $ | 3.44 | 0.69 | % | ||||||||
Hypothetical (5% return before expenses) | $ | 1,000.00 | $ | 1,021.43 | $ | 3.47 | 0.69 | % | ||||||||
Class 2 | ||||||||||||||||
Actual | $ | 1,000.00 | $ | 1,004.18 | $ | 4.68 | 0.94 | % | ||||||||
Hypothetical (5% return before expenses) | $ | 1,000.00 | $ | 1,020.19 | $ | 4.72 | 0.94 | % | ||||||||
| 1. | Expenses paid is equal to the annualized expense ratio of each class multiplied by the average account value over the period, multiplied by the number of days in the most recent fiscal half-year divided by the number of days in the fiscal year (to reflect the one-half year period). |
Table of Contents
| Portfolio of Investments—June 30, 2012 (Unaudited) | Wells Fargo Advantage VT International Equity Fund | 7 |
| Security Name | Shares | Value | ||||||||||
Common Stocks: 93.72% | ||||||||||||
| Argentina: 0.05% | ||||||||||||
IRSA Inversiones y Representaciones SA ADR (Financials, Real Estate Management & Development) | 21,579 | $ | 152,995 | |||||||||
|
| |||||||||||
| Australia: 0.76% | ||||||||||||
BHP Billiton Limited (Materials, Metals & Mining) | 72,014 | 2,345,662 | ||||||||||
|
| |||||||||||
| Bermuda: 2.27% | ||||||||||||
Cosan Limited Class A (Consumer Staples, Food Products) | 165,832 | 2,104,408 | ||||||||||
Jardine Matheson Holdings Limited (Industrials, Industrial Conglomerates) | 71,200 | 3,468,173 | ||||||||||
Ports Design Limited (Consumer Discretionary, Textiles, Apparel & Luxury Goods) (i) | 1,341,466 | 1,403,399 | ||||||||||
| 6,975,980 | ||||||||||||
|
| |||||||||||
| Canada: 3.84% | ||||||||||||
Barrick Gold Corporation (Materials, Metals & Mining) | 71,932 | 2,709,549 | ||||||||||
Cenovus Energy Incorporated (Energy, Oil, Gas & Consumable Fuels) | 85,713 | 2,725,673 | ||||||||||
Suncor Energy Incorporated (Energy, Oil, Gas & Consumable Fuels) | 53,871 | 1,557,767 | ||||||||||
Valeant Pharmaceuticals International Incorporated (Health Care, Pharmaceuticals) † | 107,112 | 4,797,546 | ||||||||||
| 11,790,535 | ||||||||||||
|
| |||||||||||
| Cayman Islands: 1.45% | ||||||||||||
Hengdeli Holdings Limited (Consumer Discretionary, Specialty Retail) | 13,949,103 | 4,456,381 | ||||||||||
|
| |||||||||||
| China: 0.96% | ||||||||||||
Industrial & Commercial Bank of China Class H (Financials, Commercial Banks) | 3,951,000 | 2,214,885 | ||||||||||
LDK Solar Company Limited ADR (Information Technology, Electronic Equipment, Instruments & Components) †« | 389,366 | 743,689 | ||||||||||
| 2,958,574 | ||||||||||||
|
| |||||||||||
| Denmark: 1.27% | ||||||||||||
A.P. Moller-Maersk AS Class B (Industrials, Marine) | 594 | 3,895,169 | ||||||||||
|
| |||||||||||
| Finland: 1.72% | ||||||||||||
Metso Oyj (Industrials, Machinery) | 153,670 | 5,298,406 | ||||||||||
|
| |||||||||||
| France: 1.51% | ||||||||||||
Total SA (Energy, Oil, Gas & Consumable Fuels) | 102,843 | 4,628,847 | ||||||||||
|
| |||||||||||
| Germany: 10.14% | ||||||||||||
Allianz AG (Financials, Insurance) | 40,093 | 4,032,745 | ||||||||||
Bayer AG (Health Care, Pharmaceuticals) | 89,439 | 6,444,908 | ||||||||||
E.ON AG (Utilities, Electric Utilities) | 275,491 | 5,953,116 | ||||||||||
Metro AG (Consumer Staples, Food & Staples Retailing) | 202,910 | 5,916,874 | ||||||||||
SAP AG (Information Technology, Software) | 48,198 | 2,854,063 | ||||||||||
Siemens AG (Industrials, Industrial Conglomerates) | 71,087 | 5,973,231 | ||||||||||
| 31,174,937 | ||||||||||||
|
| |||||||||||
| Hong Kong: 5.76% | ||||||||||||
China Everbright Limited (Financials, Diversified Financial Services) | 3,194,000 | 4,564,219 | ||||||||||
China Mobile Limited (Telecommunication Services, Wireless Telecommunication Services) | 604,000 | 6,630,404 | ||||||||||
The accompanying notes are an integral part of these financial statements.
Table of Contents
| 8 | Wells Fargo Advantage VT International Equity Fund | Portfolio of Investments—June 30, 2012 (Unaudited) |
| Security Name | Shares | Value | ||||||||||
| Hong Kong (continued) | ||||||||||||
China Resources Power Holdings Company (Utilities, Independent Power Producers & Energy Traders) | 3,142,000 | $ | 6,490,151 | |||||||||
| 17,684,774 | ||||||||||||
|
| |||||||||||
| Italy: 3.02% | ||||||||||||
ENI SpA (Energy, Oil, Gas & Consumable Fuels) | 218,436 | 4,640,704 | ||||||||||
Intesa Sanpaolo SpA (Financials, Commercial Banks) « | 3,263,496 | 4,644,758 | ||||||||||
| 9,285,462 | ||||||||||||
|
| |||||||||||
| Japan: 17.72% | ||||||||||||
Asahi Glass Company Limited (Industrials, Building Products) « | 764,000 | 5,154,096 | ||||||||||
Canon Incorporated (Information Technology, Office Electronics) « | 171,900 | 6,860,618 | ||||||||||
Capcom Company Limited (Information Technology, Software) | 257,200 | 5,382,729 | ||||||||||
FamilyMart Company Limited (Consumer Staples, Food & Staples Retailing) | 99,400 | 4,549,434 | ||||||||||
Itochu Corporation (Industrials, Trading Companies & Distributors) | 326,200 | 3,428,576 | ||||||||||
Mitsubishi UFJ Financial Group Incorporated (Financials, Commercial Banks) | 1,114,300 | 5,338,472 | ||||||||||
Mitsui OSK Lines Limited (Industrials, Marine) | 1,423,000 | 5,129,718 | ||||||||||
Nissan Motor Company Limited (Consumer Discretionary, Automobiles) | 497,400 | 4,723,176 | ||||||||||
Nitto Denko Corporation (Materials, Chemicals) | 125,382 | 5,371,955 | ||||||||||
Toyota Motor Corporation (Consumer Discretionary, Automobiles) | 120,700 | 4,871,719 | ||||||||||
USS Company Limited (Consumer Discretionary, Specialty Retail) | 33,810 | 3,648,154 | ||||||||||
| 54,458,647 | ||||||||||||
|
| |||||||||||
| Netherlands: 1.65% | ||||||||||||
Akzo Nobel NV (Materials, Chemicals) | 107,932 | 5,079,770 | ||||||||||
|
| |||||||||||
| Norway: 2.87% | ||||||||||||
Marine Harvest (Consumer Staples, Food Products) †« | 5,106,877 | 3,635,058 | ||||||||||
Statoil ASA (Energy, Oil, Gas & Consumable Fuels) | 217,265 | 5,181,448 | ||||||||||
| 8,816,506 | ||||||||||||
|
| |||||||||||
| Philippines: 1.12% | ||||||||||||
Philippine Long Distance Telephone Company (Telecommunication Services, Wireless Telecommunication Services) | 54,395 | 3,448,746 | ||||||||||
|
| |||||||||||
| Russia: 1.13% | ||||||||||||
Mobile Telesystems ADR (Telecommunication Services, Wireless Telecommunication Services) | 114,593 | 1,971,000 | ||||||||||
Sberbank of Russia (Financials, Commercial Banks) | 563,271 | 1,506,672 | ||||||||||
| 3,477,672 | ||||||||||||
|
| |||||||||||
| Singapore: 2.60% | ||||||||||||
DBS Group Holdings Limited (Financials, Commercial Banks) | 526,000 | 5,810,032 | ||||||||||
Indofood Agri Resources Limited (Consumer Staples, Food Products) † | 1,897,246 | 2,174,640 | ||||||||||
| 7,984,672 | ||||||||||||
|
| |||||||||||
| South Korea: 3.58% | ||||||||||||
Hana Financial Group Incorporated (Financials, Commercial Banks) | 73,820 | 2,359,890 | ||||||||||
Samsung Electronics Company Limited GDR (Information Technology, Semiconductors & Semiconductor Equipment) 144A | 7,640 | 4,005,605 | ||||||||||
Samsung Electronics Company Limited GDR (London Exchange) (Information Technology, Semiconductors & Semiconductor Equipment) 144A | 1,013 | 541,588 | ||||||||||
The accompanying notes are an integral part of these financial statements.
Table of Contents
| Portfolio of Investments—June 30, 2012 (Unaudited) | Wells Fargo Advantage VT International Equity Fund | 9 |
| Security Name | Shares | Value | ||||||||||
| South Korea (continued) | ||||||||||||
SK Telecom Company Limited (Telecommunication Services, Wireless Telecommunication Services) | 37,269 | $ | 4,078,496 | |||||||||
| 10,985,579 | ||||||||||||
|
| |||||||||||
| Sweden: 4.10% | ||||||||||||
Hennes & Mauritz AB Class B (Consumer Discretionary, Specialty Retail) | 184,631 | 6,627,129 | ||||||||||
Volvo AB Class B (Consumer Discretionary, Automobiles) | 522,898 | 5,978,555 | ||||||||||
| 12,605,684 | ||||||||||||
|
| |||||||||||
| Switzerland: 8.61% | ||||||||||||
ABB Limited (Industrials, Electrical Equipment) | 228,952 | 3,738,374 | ||||||||||
Compagnie Financiere Richemont SA (Consumer Discretionary, Textiles, Apparel & Luxury Goods) | 48,857 | 2,682,726 | ||||||||||
Julius Baer Group Limited (Financials, Capital Markets) | 145,115 | 5,261,385 | ||||||||||
Novartis AG (Health Care, Pharmaceuticals) | 113,263 | 6,332,683 | ||||||||||
Swatch Group AG Class B (Consumer Discretionary, Textiles, Apparel & Luxury Goods) | 10,024 | 3,961,900 | ||||||||||
Zurich Financial Services AG (Financials, Insurance) | 19,810 | 4,479,516 | ||||||||||
| 26,456,584 | ||||||||||||
|
| |||||||||||
| Taiwan: 1.76% | ||||||||||||
High Tech Computer Corporation (Information Technology, Communications Equipment) | 232,000 | 3,063,102 | ||||||||||
Taiwan Semiconductor Manufacturing Company Limited ADR (Information Technology, Semiconductors & Semiconductor Equipment) « | 168,188 | 2,347,904 | ||||||||||
| 5,411,006 | ||||||||||||
|
| |||||||||||
| Thailand: 0.09% | ||||||||||||
Bumrungrad Hospital Public Company Limited (Health Care, Health Care Providers & Services) | 131,300 | 289,389 | ||||||||||
|
| |||||||||||
| United Kingdom: 15.74% | ||||||||||||
BP plc (Energy, Oil, Gas & Consumable Fuels) | 804,635 | 5,373,512 | ||||||||||
Capita Group plc (Industrials, Commercial Services & Supplies) | 527,310 | 5,418,440 | ||||||||||
Chemring Group plc (Industrials, Aerospace & Defense) | 1,122,008 | 4,830,684 | ||||||||||
Debenhams plc (Consumer Discretionary, Multiline Retail) | 1,809,979 | 2,457,683 | ||||||||||
Man Group plc (Financials, Capital Markets) | 2,605,765 | 3,117,978 | ||||||||||
Reckitt Benckiser Group (Consumer Staples, Household Products) | 112,009 | 5,920,457 | ||||||||||
Smiths Group plc (Industrials, Industrial Conglomerates) | 377,590 | 5,996,644 | ||||||||||
Vodafone Group plc ADR (Telecommunication Services, Wireless Telecommunication Services) | 163,100 | 4,596,158 | ||||||||||
William Morrison Supermarkets plc (Consumer Staples, Food & Staples Retailing) | 1,317,621 | 5,498,140 | ||||||||||
Wolseley plc (Industrials, Trading Companies & Distributors) | 138,014 | 5,144,151 | ||||||||||
| 48,353,847 | ||||||||||||
|
| |||||||||||
Total Common Stocks (Cost $313,308,624) | 288,015,824 | |||||||||||
|
| |||||||||||
The accompanying notes are an integral part of these financial statements.
Table of Contents
| 10 | Wells Fargo Advantage VT International Equity Fund | Portfolio of Investments—June 30, 2012 (Unaudited) |
| Security Name | Yield | Shares | Value | |||||||||||
Short-Term Investments: 10.31% | ||||||||||||||
| Investment Companies: 10.31% | ||||||||||||||
Wells Fargo Advantage Cash Investment Money Market Fund, Select Class (l)(u) | 0.15 | % | 15,108,241 | $ | 15,108,241 | |||||||||
Wells Fargo Securities Lending Cash Investments, LLC (l)(u)(r)(v) | 0.19 | 16,562,415 | 16,562,415 | |||||||||||
Total Short-Term Investments (Cost $31,670,656) | 31,670,656 | |||||||||||||
|
| |||||||||||||
| Total Investments in Securities | ||||||||
| (Cost $344,979,280) * | 104.03 | % | 319,686,480 | |||||
Other Assets and Liabilities, Net | (4.03 | ) | (12,373,718 | ) | ||||
|
|
|
| |||||
Total Net Assets | 100.00 | % | $ | 307,312,762 | ||||
|
|
|
| |||||
| (i) | Illiquid security |
| † | Non-income earning security |
| « | All or a portion of this security is on loan. |
| 144A | Security that may be resold to “qualified institutional buyers” under Rule 144A or security offered pursuant to Section 4(2) of the Securities Act of 1933, as amended. |
| (l) | Investment in an affiliate |
| (u) | Rate shown is the 7-day annualized yield at period end. |
| (r) | The investment company is exempt from registration under Section 3(c)(7) of the 1940 Act. |
| (v) | Security represents investment of cash collateral received from securities on loan. |
| * | Cost for federal income tax purposes is $346,139,018 and net unrealized appreciation (depreciation) consists of: |
Gross unrealized appreciation | $ | 4,489,658 | ||
Gross unrealized depreciation | (30,942,196 | ) | ||
|
| |||
Net unrealized depreciation | $ | (26,452,538 | ) |
The accompanying notes are an integral part of these financial statements.
Table of Contents
| Statement of Assets and Liabilities—June 30, 2012 (Unaudited) | Wells Fargo Advantage VT International Equity Fund | 11 |
Assets | ||||
Investments | ||||
In unaffiliated securities (including securities on loan), at value (see cost below) | $ | 288,015,824 | ||
In affiliated securities, at value (see cost below) | 31,670,656 | |||
|
| |||
Total investments, at value (see cost below) | 319,686,480 | |||
Foreign currency, at value (see cost below) | 3,315,386 | |||
Receivable for Fund shares sold | 207,526 | |||
Receivable for dividends | 1,759,726 | |||
Receivable for securities lending income | 40,853 | |||
|
| |||
Total assets | 325,009,971 | |||
|
| |||
Liabilities | ||||
Payable for investments purchased | 781,865 | |||
Payable for Fund shares redeemed | 79,537 | |||
Payable upon receipt of securities loaned | 16,562,415 | |||
Advisory fee payable | 120,495 | |||
Distribution fees payable | 54,346 | |||
Due to other related parties | 32,697 | |||
Accrued expenses and other liabilities | 65,854 | |||
|
| |||
Total liabilities | 17,697,209 | |||
|
| |||
Total net assets | $ | 307,312,762 | ||
|
| |||
NET ASSETS CONSIST OF | ||||
Paid-in capital | $ | 282,676,015 | ||
Undistributed net investment income | 9,869,527 | |||
Accumulated net realized gains on investments | 39,982,070 | |||
Net unrealized losses on investments | (25,214,850 | ) | ||
|
| |||
Total net assets | $ | 307,312,762 | ||
|
| |||
COMPUTATION OF NET ASSET VALUE PER SHARE1 | ||||
Net assets – Class 1 | $ | 41,583,518 | ||
Shares outstanding – Class 1 | 8,676,335 | |||
Net asset value per share – Class 1 | $4.79 | |||
Net assets – Class 2 | $ | 265,729,244 | ||
Shares outstanding – Class 2 | 55,383,724 | |||
Net asset value per share – Class 2 | $4.80 | |||
Investments in unaffiliated securities, at cost | $ | 313,308,624 | ||
|
| |||
Investments in affiliated securities, at cost | $ | 31,670,656 | ||
|
| |||
Total investments, at cost | $ | 344,979,280 | ||
|
| |||
Securities on loan, at value | $ | 15,653,243 | ||
|
| |||
Foreign currency, at cost | $ | 3,286,290 | ||
|
| |||
| 1. | The Fund has an unlimited number of authorized shares. |
The accompanying notes are an integral part of these financial statements.
Table of Contents
| 12 | Wells Fargo Advantage VT International Equity Fund | Statement of Operations—Six Months Ended June 30, 2012 (Unaudited) |
Investment income | ||||
Dividends* | $ | 6,273,188 | ||
Securities lending income, net | 429,111 | |||
Income from affiliated securities | 11,541 | |||
|
| |||
Total investment income | 6,713,840 | |||
|
| |||
Expenses | ||||
Advisory fee | 1,126,895 | |||
Administration fees | ||||
Fund level | 75,126 | |||
Class 1 | 18,205 | |||
Class 2 | 101,997 | |||
Distribution fees | ||||
Class 2 | 318,742 | |||
Custody and accounting fees | 34,622 | |||
Professional fees | 24,274 | |||
Shareholder report expenses | 35,519 | |||
Trustees’ fees and expenses | 6,102 | |||
Other fees and expenses | 20,537 | |||
|
| |||
Total expenses | 1,762,019 | |||
Less: Fee waivers and/or expense reimbursements | (406,533 | ) | ||
|
| |||
Net expenses | 1,355,486 | |||
|
| |||
Net investment income | 5,358,354 | |||
|
| |||
REALIZED AND UNREALIZED GAINS (LOSSES) ON INVESTMENTS | ||||
Net realized gains on investments | 24,184,308 | |||
Net change in unrealized gains (losses) on investments | (30,245,626 | ) | ||
|
| |||
Net realized and unrealized gains (losses) on investments | (6,061,318 | ) | ||
|
| |||
Net decrease in net assets resulting from operations | $ | (702,964 | ) | |
|
| |||
* Net of foreign dividend withholding taxes of | $640,373 | |||
The accompanying notes are an integral part of these financial statements.
Table of Contents
| Statements of Changes in Net Assets | Wells Fargo Advantage VT International Equity Fund | 13 |
| Six Months Ended June 30, 2012 (Unaudited) | Year Ended December 31, 2011 | |||||||||||||||
Operations | ||||||||||||||||
Net investment income | $ | 5,358,354 | $ | 5,097,236 | ||||||||||||
Net realized gains on investments | 24,184,308 | 22,276,161 | ||||||||||||||
Net change in unrealized gains (losses) on investments | (30,245,626 | ) | (65,432,308 | ) | ||||||||||||
|
|
|
|
|
|
|
| |||||||||
Net decrease in net assets resulting from operations | (702,964 | ) | (38,058,911 | ) | ||||||||||||
|
|
|
|
|
|
|
| |||||||||
Distributions to shareholders from | ||||||||||||||||
Net investment income | ||||||||||||||||
Class 1 | 0 | (366,876 | ) | |||||||||||||
Class 2 | 0 | (233,091 | ) | |||||||||||||
Net realized gains | ||||||||||||||||
Class 1 | 0 | (2,581,647 | ) | |||||||||||||
Class 2 | 0 | (9,844,118 | ) | |||||||||||||
|
|
|
|
|
|
|
| |||||||||
Total distributions to shareholders | 0 | (13,025,732 | ) | |||||||||||||
|
|
|
|
|
|
|
| |||||||||
Capital share transactions | Shares | Shares | ||||||||||||||
Proceeds from shares sold | ||||||||||||||||
Class 1 | 175,541 | 884,188 | 745,197 | 4,050,134 | ||||||||||||
Class 2 | 9,953,333 | 50,145,871 | 13,140,189 | 69,270,290 | ||||||||||||
|
|
|
|
|
|
|
| |||||||||
| 51,030,059 | 73,320,424 | |||||||||||||||
|
|
|
|
|
|
|
| |||||||||
Reinvestment of distributions | ||||||||||||||||
Class 1 | 0 | 0 | 533,187 | 2,948,523 | ||||||||||||
Class 2 | 0 | 0 | 1,815,713 | 10,077,209 | ||||||||||||
|
|
|
|
|
|
|
| |||||||||
| 0 | 13,025,732 | |||||||||||||||
|
|
|
|
|
|
|
| |||||||||
Payment for shares redeemed | ||||||||||||||||
Class 1 | (1,146,324 | ) | (5,713,408 | ) | (3,400,121 | ) | (18,259,790 | ) | ||||||||
Class 2 | (2,194,691 | ) | (11,010,202 | ) | (5,339,924 | ) | (29,300,042 | ) | ||||||||
|
|
|
|
|
|
|
| |||||||||
| (16,723,610 | ) | (47,559,832 | ) | |||||||||||||
|
|
|
|
|
|
|
| |||||||||
Net increase in net assets resulting from capital share transactions | 34,306,449 | 38,786,324 | ||||||||||||||
|
|
|
|
|
|
|
| |||||||||
Total increase (decrease) in net assets | 33,603,485 | (12,298,319 | ) | |||||||||||||
|
|
|
|
|
|
|
| |||||||||
Net assets | ||||||||||||||||
Beginning of period | 273,709,277 | 286,007,596 | ||||||||||||||
|
|
|
|
|
|
|
| |||||||||
End of period | $ | 307,312,762 | $ | 273,709,277 | ||||||||||||
|
|
|
|
|
|
|
| |||||||||
Undistributed net investment income | $ | 9,869,527 | $ | 4,511,173 | ||||||||||||
|
|
|
|
|
|
|
| |||||||||
The accompanying notes are an integral part of these financial statements.
Table of Contents
| 14 | Wells Fargo Advantage VT International Equity Fund | Financial Highlights |
(For a share outstanding throughout each period)
Six Months Ended (Unaudited) | Year Ended December 31, | |||||||||||||||||||||||
| Class 1 | 2011 | 20101 | 20091 | 20081 | 20071 | |||||||||||||||||||
Net asset value, beginning of period | $ | 4.77 | $ | 5.75 | $ | 5.15 | $ | 4.64 | $ | 8.14 | $ | 7.82 | ||||||||||||
Net investment income | 0.09 | 2 | 0.11 | 2 | 0.05 | 2 | 0.11 | 2 | 0.20 | 2 | 0.16 | |||||||||||||
Net realized and unrealized gains (losses) on investments | (0.07 | ) | (0.80 | ) | 0.78 | 0.55 | (3.52 | ) | 1.02 | |||||||||||||||
|
|
|
|
|
|
|
|
|
|
|
| |||||||||||||
Total from investment operations | 0.02 | (0.69 | ) | 0.83 | 0.66 | (3.32 | ) | 1.18 | ||||||||||||||||
Distributions to shareholders from | ||||||||||||||||||||||||
Net investment income | 0.00 | (0.04 | ) | (0.05 | ) | (0.15 | ) | 0.00 | (0.20 | ) | ||||||||||||||
Net realized gains | 0.00 | (0.25 | ) | (0.18 | ) | 0.00 | (0.18 | ) | (0.66 | ) | ||||||||||||||
|
|
|
|
|
|
|
|
|
|
|
| |||||||||||||
Total distributions to shareholders | 0.00 | (0.29 | ) | (0.23 | ) | (0.15 | ) | (0.18 | ) | (0.86 | ) | |||||||||||||
Net asset value, end of period | $4.79 | $4.77 | $5.75 | $5.15 | $4.64 | $8.14 | ||||||||||||||||||
Total return | 0.42 | % | (12.79 | )% | 16.79 | % | 15.95 | % | (41.49 | )% | 15.00 | % | ||||||||||||
Ratios to average net assets (annualized) | ||||||||||||||||||||||||
Gross expenses | 0.96 | % | 0.97 | % | 0.85 | % | 0.68 | % | 0.67 | % | 0.63 | % | ||||||||||||
Net expenses | 0.69 | % | 0.69 | % | 0.66 | % | 0.68 | % | 0.67 | % | 0.63 | % | ||||||||||||
Net investment income | 3.66 | % | 2.06 | % | 1.04 | % | 2.31 | % | 3.02 | % | 2.01 | % | ||||||||||||
Supplemental data | ||||||||||||||||||||||||
Portfolio turnover rate | 113 | % | 66 | % | 60 | % | 205 | % | 127 | % | 58 | % | ||||||||||||
Net assets, end of period (000’s omitted) | $41,584 | $46,017 | $67,659 | $69,407 | $71,286 | $190,766 | ||||||||||||||||||
| 1. | After the close of business on July 16, 2010, the Fund acquired the net assets of Evergreen VA International Fund which became the accounting and performance survivor in the transaction. The information for the periods prior to July 19, 2010 is that of Class 1 of Evergreen VA International Fund. The per share information has been adjusted to give effect to this transaction. |
| 2. | Calculated based upon average shares outstanding |
The accompanying notes are an integral part of these financial statements.
Table of Contents
| Financial Highlights | Wells Fargo Advantage VT International Equity Fund | 15 |
(For a share outstanding throughout each period)
Six Months Ended (Unaudited) | Year Ended December 31, | |||||||||||||||||||||||
| Class 2 | 2011 | 20101 | 20091 | 20081 | 20071 | |||||||||||||||||||
Net asset value, beginning of period | $ | 4.78 | $ | 5.74 | $ | 5.15 | $ | 4.64 | $ | 8.15 | $ | 7.84 | ||||||||||||
Net investment income | 0.08 | �� | 0.09 | 2 | 0.06 | 2 | 0.04 | 2 | 0.18 | 2 | 0.14 | |||||||||||||
Net realized and unrealized gains (losses) on investments | (0.06 | ) | (0.79 | ) | 0.75 | 0.62 | (3.51 | ) | 1.01 | |||||||||||||||
|
|
|
|
|
|
|
|
|
|
|
| |||||||||||||
Total from investment operations | 0.02 | (0.70 | ) | 0.81 | 0.66 | (3.33 | ) | 1.15 | ||||||||||||||||
Distributions to shareholders from | ||||||||||||||||||||||||
Net investment income | 0.00 | (0.01 | ) | (0.04 | ) | (0.15 | ) | 0.00 | (0.18 | ) | ||||||||||||||
Net realized gains | 0.00 | (0.25 | ) | (0.18 | ) | 0.00 | (0.18 | ) | (0.66 | ) | ||||||||||||||
|
|
|
|
|
|
|
|
|
|
|
| |||||||||||||
Total distributions to shareholders | 0.00 | (0.26 | ) | (0.22 | ) | (0.15 | ) | (0.18 | ) | (0.84 | ) | |||||||||||||
Net asset value, end of period | $4.80 | $4.78 | $5.74 | $5.15 | $4.64 | $8.15 | ||||||||||||||||||
Total return | 0.42 | % | (12.91 | )% | 16.50 | % | 15.47 | % | (41.60 | )% | 14.73 | % | ||||||||||||
Ratios to average net assets (annualized) | ||||||||||||||||||||||||
Gross expenses | 1.21 | % | 1.22 | % | 0.97 | % | 0.89 | % | 0.92 | % | 0.88 | % | ||||||||||||
Net expenses | 0.94 | % | 0.94 | % | 0.89 | % | 0.89 | % | 0.92 | % | 0.88 | % | ||||||||||||
Net investment income | 3.55 | % | 1.75 | % | 1.22 | % | 0.70 | % | 2.74 | % | 1.75 | % | ||||||||||||
Supplemental data | ||||||||||||||||||||||||
Portfolio turnover rate | 113 | % | 66 | % | 60 | % | 205 | % | 127 | % | 58 | % | ||||||||||||
Net assets, end of period (000’s omitted) | $265,729 | $227,692 | $218,348 | $891,137 | $56,692 | $118,843 | ||||||||||||||||||
| 1. | After the close of business on July 16, 2010, the Fund acquired the net assets of Evergreen VA International Fund which became the accounting and performance survivor in the transaction. The information for the periods prior to July 19, 2010 is that of Class 2 of Evergreen VA International Fund. The per share information has been adjusted to give effect to this transaction. |
| 2. | Calculated based upon average shares outstanding |
The accompanying notes are an integral part of these financial statements.
Table of Contents
| 16 | Wells Fargo Advantage VT International Equity Fund | Notes to Financial Statements (Unaudited) |
1. ORGANIZATION
Wells Fargo Variable Trust (the “Trust”), a Delaware statutory trust organized on March 10, 1999, is an open-end management investment company registered under the Investment Company Act of 1940, as amended (the “1940 Act”). These financial statements report on Wells Fargo Advantage VT International Equity Fund (the “Fund”) which is a diversified series of the Trust.
2. SIGNIFICANT ACCOUNTING POLICIES
The following significant accounting policies, which are consistently followed in the preparation of the financial statements of the Fund, are in conformity with U.S. generally accepted accounting principles which require management to make estimates and assumptions that affect the reported amounts of assets and liabilities, disclosure of contingent assets and liabilities at the date of the financial statements, and the reported amounts of revenues and expenses during the reporting period. Actual results could differ from those estimates.
Securities valuation
Investments in equity securities are valued each business day as of the close of regular trading on the New York Stock Exchange, which is usually 4:00 p.m. (Eastern Time). Securities which are traded on a national or foreign securities exchange are valued at the last reported sales price, except that securities listed on The Nasdaq Stock Market, Inc. (“Nasdaq”) are valued at the Nasdaq Official Closing Price (“NOCP”), and if no NOCP is available, then at the last reported sales price. If no sales price is shown on the Nasdaq, the bid price will be used. In the absence of any sale of securities listed on the Nasdaq, and in the case of other securities (including U.S. Government obligations, but excluding debt securities maturing in 60 days or less), the price will be deemed “stale” and the valuations will be determined in accordance with the Fund’s Valuation Procedures.
Securities denominated in foreign currencies are translated into U.S. dollars using the closing rates of exchange in effect on the day of valuation.
Many securities markets and exchanges outside the U.S. close prior to the close of the New York Stock Exchange and therefore may not fully reflect trading or events that occur after the close of the principal exchange in which the foreign securities are traded, but before the close of the New York Stock Exchange. If such trading or events are expected to materially affect the value of securities, then fair value pricing procedures approved by the Board of Trustees are applied. These procedures take into account multiple factors including movements in U.S. securities markets after foreign exchanges close. As a result of the fair value pricing procedures, these securities which are normally categorized as Level 1 in the fair value hierarchy will represent a transfer from a Level 1 to a Level 2 security and will be categorized as Level 2. Depending on market activity, such fair valuations may be frequent. Such fair value pricing may result in NAVs that are higher or lower than NAVs based on the closing price or latest quoted bid price. On June 30, 2012, fair value pricing was used in pricing foreign securities.
Investments in open-end mutual funds and non-registered investment companies are fair valued at net asset value.
Investments which are not valued using any of the methods discussed above, are valued at their fair value, as determined by procedures established in good faith and approved by the Board of Trustees. The Board of Trustees has established a Valuation Committee comprised of the Trustees and has delegated to it the authority to take any actions regarding the valuation of portfolio securities that the Valuation Committee deems necessary in determining the fair value of portfolio securities, unless the responsibility has been delegated to the Management Valuation Team of Wells Fargo Funds Management, LLC (“Funds Management”). The Board of Trustees retains the authority to make or ratify any valuation decisions or approve any changes to the Valuation Procedures as it deems appropriate. On a quarterly basis, the Board of Trustees considers for ratification any valuation actions taken by the Valuation Committee or the Management Valuation Team.
Valuations of fair valued securities are compared to the next actual sales price when available, or other appropriate market information to assess the continued appropriateness of the fair valuation methodology used. These securities are fair valued on a day-to-day basis, taking into consideration changes to appropriate market information and any significant changes to the input factors considered in the valuation process until there is a readily available price provided on the exchange or by an independent pricing service. Valuations received from an independent pricing service or broker quotes are periodically validated by comparisons to most recent trades and valuations provided by other independent pricing services in addition to the review of prices by the adviser and/or sub-adviser. Unobservable inputs
Table of Contents
| Notes to Financial Statements (Unaudited) | Wells Fargo Advantage VT International Equity Fund | 17 |
used in determining fair valuations are identified based on the type of security, taking into consideration factors utilized by market participants in valuing the investment, knowledge about the issuer and the current market environment.
Foreign currency translation
The accounting records of the Fund are maintained in U.S. dollars. Assets, including investment securities, and liabilities denominated in foreign currency are translated into U.S. dollars at the prevailing rates of exchange at the date of valuation. Purchases and sales of securities, and income and expenses are translated at the prevailing rate of exchange on the respective dates of such transactions. Reported net realized foreign exchange gains or losses arise from sales of foreign currencies, currency gains or losses realized between the trade and settlement dates on securities transactions, and the difference between the amounts of dividends, interest and foreign withholding taxes recorded and the U.S. dollar equivalent of the amounts actually paid or received. Net unrealized foreign exchange gains and losses arise from changes in the fair value of assets and liabilities other than investments in securities resulting in changes in exchange rates.
The changes in net assets arising from changes in exchange rates and the changes in net assets resulting from changes in market prices of securities are not separately presented. Such changes are recorded with net realized and unrealized gains or losses from investments. Gains and losses from certain foreign currency transactions are treated as ordinary income for U.S. federal income tax purposes.
Forward foreign currency contracts
The Fund may be subject to foreign currency exchange rate risk in the normal course of pursuing its investment objectives. A forward foreign currency contract is an agreement between two parties to purchase or sell a specific currency for an agreed-upon price at a future date. The Fund enters into forward foreign currency contracts to facilitate transactions in foreign-denominated securities and to attempt to minimize the risk to the Fund from adverse changes in the relationship between currencies. Forward foreign currency contracts are recorded at the forward rate and marked-to-market daily. When the contracts are closed, realized gains and losses arising from such transactions are recorded as realized gains or losses on foreign currency related transactions. The Fund could be exposed to risks if the counterparties to the contracts are unable to meet the terms of their contracts or if the value of the foreign currency changes unfavorably. The Fund’s maximum risk of loss from counterparty credit risk is the unrealized gains or losses on the contracts. This risk is mitigated by having a master netting arrangement between the Fund and the counterparty.
Security loans
The Fund may lend its securities from time to time in order to earn additional income in the form of fees or interest on securities received as collateral or the investment of any cash received as collateral. The Fund continues to receive interest or dividends on the securities loaned. The Fund receives collateral in the form of cash or securities with a value at least equal to the value of the securities on loan. The value of the loaned securities is determined at the close of each business day and any additional required collateral is delivered to the Fund on the next business day. In a securities lending transaction, the net asset value of the Fund will be affected by an increase or decrease in the value of the securities loaned and by an increase or decrease in the value of the instrument in which collateral is invested. The amount of securities lending activity undertaken by the Fund fluctuates from time to time. In the event of default or bankruptcy by the borrower, the Fund may be prevented from recovering the loaned securities or gaining access to the collateral or may experience delays or costs in doing so. In addition, the investment of any cash collateral received may lose all or part of its value. The Fund has the right under the lending agreement to recover the securities from the borrower on demand.
The Fund lends its securities through an unaffiliated securities lending agent. Cash collateral received in connection with its securities lending transactions is invested in Wells Fargo Securities Lending Cash Investments, LLC (the “Cash Collateral Fund”). The Cash Collateral Fund is exempt from registration under Section 3(c)(7) of the 1940 Act and is managed by Funds Management and is sub-advised by Wells Capital Management Incorporated (“Wells Capital Management”). Funds Management receives an advisory fee starting at 0.05% and declining to 0.01% as the average daily net assets of the Cash Collateral Fund increase. All of the fees received by Funds Management are paid to Wells Capital Management for its services as sub-adviser. The Cash Collateral Fund seeks to provide a positive return compared to the daily Fed Funds Open rate by investing in high-quality, U.S. dollar-denominated short-term money market instruments. Cash Collateral Fund investments are fair valued based upon the amortized cost valuation technique. Income earned from investment in the Cash Collateral Fund is included in securities lending income on the Statement of Operations.
Table of Contents
| 18 | Wells Fargo Advantage VT International Equity Fund | Notes to Financial Statements (Unaudited) |
Security transactions and income recognition
Securities transactions are recorded on a trade date basis. Realized gains or losses are reported on the basis of identified cost of securities delivered.
Dividend income is recognized on the ex-dividend date, except for certain dividends from foreign securities, which are recorded as soon as the Fund is informed of the ex-dividend date. Dividend income from foreign securities is recorded net of foreign taxes withheld where recovery of such taxes is not assured.
Distributions to shareholders
Distributions to shareholders from net investment income and net realized gains, if any, are recorded on the ex-dividend date. Such distributions are determined in conformity with income tax regulations, which may differ from generally accepted accounting principles.
Federal and other taxes
The Fund intends to continue to qualify as a regulated investment company by distributing substantially all of its investment company taxable income and any net realized capital gains (after reduction for capital loss carryforwards) sufficient to relieve it from all, or substantially all, federal income taxes. Accordingly, no provision for federal income taxes was required.
The Fund’s income and federal excise tax returns and all financial records supporting those returns for the prior three fiscal years are subject to examination by the federal and Delaware revenue authorities. Management has analyzed the Fund’s tax positions taken on federal, state, and foreign tax returns for all open tax years and does not believe that there are any uncertain tax positions that require recognition of a tax liability.
Under the recently enacted Regulated Investment Company Modernization Act of 2010, the Fund is permitted to carry forward capital losses incurred in taxable years which began after December 22, 2010 for an unlimited period. However, any losses incurred are required to be utilized prior to the losses incurred in pre-enactment taxable years. As a result of this ordering rule, pre-enactment capital loss carryforwards may be more likely to expire unused. Post-enactment capital losses that are carried forward will retain their character as either short-term or long-term capital losses rather than be considered all short-term as under previous law. In addition, the Fund may elect to defer any portion of a post-October capital loss or qualified late-year ordinary loss to the first day of the following taxable year. A post-October capital loss is the greatest of the net capital loss, net short-term capital loss or net long-term capital loss for the portion of the taxable year after October 31. A qualified late-year ordinary loss is the net loss comprised of (a) net gain or loss from the sale or other disposition of certain capital assets for the portion of the taxable year after October 31, and (b) other ordinary income or loss for the portion of the taxable year after December 31.
As of December 31, 2011, the Fund had net capital loss carryforwards, which were available to offset future net realized capital gains, in the amount of $4,003,584 expiring in 2017.
Class allocations
The separate classes of shares offered by the Fund differ principally in distribution fees. Shareholders of each class bear certain expenses that pertain to that particular class. All shareholders bear the common expenses of the Fund, earn income from the portfolio, and are allocated unrealized gains and losses pro rata based on the average daily net assets of each class, without distinction between share classes. Dividends are determined separately for each class based on income and expenses allocable to each class. Realized gains and losses are allocated to each class pro rata based upon the net assets of each class on the date realized. Differences in per share dividend rates generally result from the relative weightings of pro rata income and realized gain allocations and from differences in separate class expenses, including distribution fees.
4. FAIR VALUATION MEASUREMENTS
Fair value measurements of investments are determined within a framework that has established a fair value hierarchy based upon the various data inputs utilized in determining the value of the Fund’s investments. The three-level hierarchy gives the highest priority to unadjusted quoted prices in active markets for identical assets or liabilities (Level 1) and the lowest priority to significant unobservable inputs (Level 3). The Fund’s investments are classified within the fair value hierarchy based on the lowest level of input that is significant to the fair value measurement. The inputs are summarized into three broad levels as follows:
| n | Level 1 – quoted prices in active markets for identical securities |
Table of Contents
| Notes to Financial Statements (Unaudited) | Wells Fargo Advantage VT International Equity Fund | 19 |
| n | Level 2 – other significant observable inputs (including quoted prices for similar securities, interest rates, prepayment speeds, credit risk, etc.) |
| n | Level 3 – significant unobservable inputs (including the Fund’s own assumptions in determining the fair value of investments) |
The inputs or methodologies used for valuing securities are not necessarily an indication of the risk associated with investing in those securities.
As of June 30, 2012, the inputs used in valuing the Fund’s assets, which are carried at fair value, were as follows:
| Investments in Securities | Quoted Prices (Level 1) | Significant Other (Level 2) | Significant Unobservable Inputs (Level 3) | Total | ||||||||||||
Equity securities | ||||||||||||||||
Common stocks | $ | 23,996,079 | $ | 264,019,745 | $ | 0 | $ | 288,015,824 | ||||||||
Short-term investments | ||||||||||||||||
Investment companies | 15,108,241 | 16,562,415 | 0 | 31,670,656 | ||||||||||||
| $ | 39,104,320 | $ | 280,582,160 | $ | 0 | $ | 319,686,480 | |||||||||
Further details on the major security types listed above can be found in the Portfolio of Investments.
5. TRANSACTIONS WITH AFFILIATES AND OTHER EXPENSES
Advisory fee
The Trust has entered into an advisory contract with Funds Management, an indirect wholly owned subsidiary of Wells Fargo & Company (“Wells Fargo”). The adviser is responsible for implementing investment policies and guidelines and for supervising the sub-adviser, who is responsible for day-to-day portfolio management of the Fund.
Pursuant to the contract, Funds Management is entitled to receive an annual advisory fee starting at 0.75% and declining to 0.60% as the average daily net assets of the Fund increase. For the six months ended June 30, 2012, the advisory fee was equivalent to an annual rate of 0.75% of the Fund’s average daily net assets.
Funds Management has retained the services of a sub-adviser to provide daily portfolio management to the Fund. The fee for sub-advisory services is borne by Funds Management. Wells Capital Management, an affiliate of Funds Management, is the sub-adviser to the Fund and is entitled to receive a fee from Funds Management at an annual rate starting at 0.45% and declining to 0.40% as the average daily net assets of the Fund increase.
Administration and transfer agent fees
The Trust has entered into an administration agreement with Funds Management. Under this agreement, for providing administrative services, which includes paying fees and expenses for services provided by the transfer agent, sub-transfer agents, omnibus account servicers and record-keepers, Funds Management is entitled to receive from the Fund an annual fund level administration fee starting at 0.05% and declining to 0.03% as the average daily net assets of the Fund increase and a class level administration fee of 0.08% of the average daily net assets of each class.
Funds Management has contractually waived and/or reimbursed advisory and administration fees to the extent necessary to maintain certain net operating expense ratios for the Fund. Waiver of fees and/or reimbursement of expenses by Funds Management were made first from fund level expenses on a proportionate basis and then from class specific expenses. Funds Management has committed through July 18, 2013 to waive fees and/or reimburse expenses to the extent necessary to cap the Fund’s expenses at 0.69% for Class 1 and 0.94% for Class 2.
Distribution fees
The Trust has adopted a Distribution Plan for Class 2 shares of the Fund pursuant to Rule 12b-1 under the 1940 Act. Distribution fees are charged to Class 2 shares and paid to Wells Fargo Funds Distributor, LLC, the principal underwriter, at an annual rate of 0.25% of its average daily net assets.
Table of Contents
| 20 | Wells Fargo Advantage VT International Equity Fund | Notes to Financial Statements (Unaudited) |
6. INVESTMENT PORTFOLIO TRANSACTIONS
Purchases and sales of investments, excluding U.S. Government obligations (if any) and short-term securities, for the six months ended June 30, 2012 were $344,147,036 and $313,347,440, respectively.
7. DERIVATIVE TRANSACTIONS
During the six months ended June 30, 2012, the Fund entered into forward foreign currency exchange contracts for economic hedging purposes.
As of June 30, 2012, the Fund did not have any open forward foreign currency contracts but had average contract amounts of $1,116,396 and $1,958,852 in forward foreign currency contracts to buy and forward foreign currency contracts to sell, respectively, during the six months ended June 30, 2012.
The fair value, realized gains or losses and change in unrealized gains or losses, if any, on derivative instruments are reflected in the appropriate financial statements.
8. BANK BORROWINGS
The Trust and Wells Fargo Funds Trust (excluding the money market funds) are parties to a $150,000,000 revolving credit agreement with State Street Bank and Trust Company, whereby the Fund is permitted to use bank borrowings for temporary or emergency purposes, such as to fund shareholder redemption requests. Interest under the credit agreement is charged to the Fund based on a borrowing rate equal to the higher of the Federal Funds rate in effect on that day plus 1.25% or the overnight LIBOR rate in effect on that day plus 1.25%. In addition, an annual commitment fee equal to 0.10% of the unused balance is allocated to each participating fund. For the six months ended June 30, 2012, the Fund paid $331 in commitment fees.
For the six months ended June 30, 2012, there were no borrowings by the Fund under the agreement.
9. INDEMNIFICATION
Under the Trust’s organizational documents, the officers and directors are indemnified against certain liabilities that may arise out of performance of their duties to the Trust. Additionally, in the normal course of business, the Trust may enter into contracts with service providers that contain a variety of indemnification clauses. The Trust’s maximum exposure under these arrangements is dependent on future claims that may be made against the Fund and, therefore, cannot be estimated.
10. NEW ACCOUNTING PRONOUNCEMENT
In December 2011, the Financial Accounting Standards Board (“FASB”) issued Accounting Standard Update (“ASU”) No. 2011-11, Disclosures about Offsetting Assets and Liabilities. ASU 2011-11, which amends FASB ASC Topic 210 Balance Sheet, creates new disclosure requirements which require entities to disclose both gross and net information for derivatives and other financial instruments that are either offset in the Statement of Assets and Liabilities or subject to an enforceable master netting arrangement or similar agreement. The disclosure requirements are effective for interim and annual reporting periods beginning on or after January 1, 2013. Management is currently assessing the potential impact, in addition to expanded financial statement disclosure, that may result from adopting this ASU.
11. SUBSEQUENT DISTRIBUTIONS
On July 12, 2012, the Fund declared distributions from net investment income and long-term capital gains to shareholders of record on July 11, 2012. The per share amounts payable on July 13, 2012 were as follows:
| Net Investment Income | Long-term Capital Gains | |||||||
Class 1 | $ | 0.08160 | $ | 0.33068 | ||||
Class 2 | 0.06631 | 0.33068 | ||||||
These distributions are not reflected in the accompanying financial statements.
Table of Contents
| Other Information (Unaudited) | Wells Fargo Advantage VT International Equity Fund | 21 |
PROXY VOTING INFORMATION
A description of the policies and procedures that the Fund uses to determine how to vote proxies relating to portfolio securities is available without charge, upon request, by calling 1-800-222-8222, visiting our Web site at wellsfargoadvantagefunds.com, or visiting the SEC Web site at sec.gov. Information regarding how the Fund voted proxies relating to portfolio securities during the most recent 12-month period ended June 30 is available without charge on the Fund’s Web site at wellsfargoadvantagefunds.com or by visiting the SEC Web site at sec.gov.
PORTFOLIO HOLDINGS INFORMATION
The complete portfolio holdings for the Fund are publicly available on the Fund’s Web site (wellsfargoadvantagefunds.com) on a monthly, 30-day or more delayed basis. In addition, top ten holdings information for the Fund is publicly available on the Fund’s Web site on a monthly, seven-day or more delayed basis. The Fund files its complete schedule of portfolio holdings with the SEC for the first and third quarters of each fiscal year on Form N-Q, which is available without charge by visiting the SEC Web site at sec.gov. In addition, the Fund’s Form N-Q may be reviewed and copied at the SEC’s Public Reference Room in Washington, DC, and at regional offices in New York City, at 233 Broadway, and in Chicago, at 175 West Jackson Boulevard, Suite 900. Information about the Public Reference Room may be obtained by calling 1-800-SEC-0330.
Table of Contents
| 22 | Wells Fargo Advantage VT International Equity Fund | Other Information (Unaudited) |
BOARD OF TRUSTEES AND OFFICERS
Each of the Trustees and Officers listed in the table below acts in identical capacities for the Wells Fargo Advantage family of funds, which consists of 138 funds comprising the Wells Fargo Funds Trust, Wells Fargo Variable Trust, Wells Fargo Master Trust and four closed-end funds (collectively the “Fund Complex”). This table should be read in conjunction with the Prospectus and the Statement of Additional Information1. All of the Trustees are also Members of the Audit and Governance Committees of each Trust in the Fund Complex. The mailing address of each Trustee and Officer is 525 Market Street, 12th Floor, San Francisco, CA 94105. Each Trustee and Officer serves an indefinite term, however, each Trustee serves such term until reaching the mandatory retirement age established by the Trustees.
Independent Trustees
Name and Year of Birth | Position Held and Length of Service* | Principal Occupations During Past Five Years | Other Directorships During | |||
| Peter G. Gordon (Born 1942) | Trustee, since 1998; Chairman, since 2005 (Lead Trustee since 2001) | Co-Founder, Retired Chairman, President and CEO of Crystal Geyser Water Company. Trustee Emeritus, Colby College | Asset Allocation Trust | |||
| Isaiah Harris, Jr. (Born 1952) | Trustee, since 2009 | Retired. Prior thereto, President and CEO of BellSouth Advertising and Publishing Corp. from 2005 to 2007, President and CEO of BellSouth Enterprises from 2004 to 2005 and President of BellSouth Consumer Services from 2000 to 2003. Emeritus member of the Iowa State University Foundation Board of Governors. Emeritus Member of the Advisory Board of Iowa State University School of Business. Mr. Harris is a certified public accountant. | CIGNA Corporation; Deluxe Corporation; Asset Allocation Trust | |||
| Judith M. Johnson (Born 1949) | Trustee, since 2008 | Retired. Prior thereto, Chief Executive Officer and Chief Investment Officer of Minneapolis Employees Retirement Fund from 1996 to 2008. Ms. Johnson is an attorney, certified public accountant and a certified managerial accountant. | Asset Allocation Trust | |||
| Leroy Keith, Jr. (Born 1939) | Trustee, since 2010 | Chairman, Bloc Global Services (development and construction). Trustee of the Evergreen Funds from 1983 to 2010. Former Managing Director, Almanac Capital Management (commodities firm), former Partner, Stonington Partners, Inc. (private equity fund), former Director, Obagi Medical Products Co. and former Director, Lincoln Educational Services. | Trustee, Virtus Fund Complex (consisting of 40 portfolios as of 12/31/11); Asset Allocation Trust | |||
| David F. Larcker (Born 1950) | Trustee, since 2009 | James Irvin Miller Professor of Accounting at the Graduate School of Business, Stanford University, Director of Corporate Governance Research Program and Senior Faculty of The Rock Center for Corporate Governance since 2006. From 2005 to 2008, Professor of Accounting at the Graduate School of Business, Stanford University. Prior thereto, Ernst & Young Professor of Accounting at The Wharton School, University of Pennsylvania from 1985 to 2005. | Asset Allocation Trust | |||
| Olivia S. Mitchell (Born 1953) | Trustee, since 2006 | International Foundation of Employee Benefit Plans Professor, Wharton School of the University of Pennsylvania since 1993. Director of Wharton’s Pension Research Council and Boettner Center on Pensions & Retirement Research, and Research Associate at the National Bureau of Economic Research. Previously, Cornell University Professor from 1978 to 1993. | Asset Allocation Trust |
Table of Contents
| Other Information (Unaudited) | Wells Fargo Advantage VT International Equity Fund | 23 |
Name and Year of Birth | Position Held and Length of Service* | Principal Occupations During Past Five Years | Other Directorships During | |||
| Timothy J. Penny (Born 1951) | Trustee, since 1996 | President and CEO of Southern Minnesota Initiative Foundation, a non-profit organization, since 2007 and Senior Fellow at the Humphrey Institute Policy Forum at the University of Minnesota since 1995. Member of the Board of Trustees of NorthStar Education Finance, Inc., a non-profit organization, since 2007. | Asset Allocation Trust | |||
| Michael S. Scofield (Born 1943) | Trustee, since 2010 | Served on the Investment Company Institute’s Board of Governors and Executive Committee from 2008-2011 as well the Governing Council of the Independent Directors Council from 2006-2011 and the Independent Directors Council Executive Committee from 2008-2011. Chairman of the IDC from 2008-2010. Institutional Investor (Fund Directions) Trustee of Year in 2007. Trustee of the Evergreen Funds (and its predecessors) from 1984 to 2010. Chairman of the Evergreen Funds from 2000-2010. Former Trustee of the Mentor Funds. Retired Attorney, Law Offices of Michael S. Scofield and former Director and Chairman, Branded Media Corporation (multi-media branding company). | Asset Allocation Trust | |||
| Donald C. Willeke (Born 1940) | Trustee, since 1996 | Principal of the law firm of Willeke & Daniels. General Counsel of the Minneapolis Employees Retirement Fund from 1984 until its consolidation into the Minnesota Public Employees Retirement Association on June 30, 2010. Director and Vice Chair of The Free Trust (non-profit corporation). Director of the American Chestnut Foundation (non-profit corporation). | Asset Allocation Trust |
| * | Length of service dates reflect the Trustee’s commencement of service with the Trust’s predecessor entities, where applicable. |
Officers
Name and Year of Birth | Position Held and Length of Service | Principal Occupations During Past Five Years | ||||
| Karla M. Rabusch (Born 1959) | President, since 2003 | Executive Vice President of Wells Fargo Bank, N.A. and President of Wells Fargo Funds Management, LLC since 2003. Senior Vice President and Chief Administrative Officer of Wells Fargo Funds Management, LLC from 2001 to 2003. | ||||
| C. David Messman (Born 1960) | Secretary, since 2000; Chief Legal Officer, since 2003 | Senior Vice President and Secretary of Wells Fargo Funds Management, LLC since 2001. Vice President and Managing Senior Counsel of Wells Fargo Bank, N.A. since 1996. | ||||
| Nancy Wiser (Born 1967) | Treasurer, since 2012 | Executive Vice President of Wells Fargo Funds Management, LLC since 2011. Chief Operating Officer and Chief Compliance Officer at LightBox Capital Management LLC, from 2008 to 2011. Owned and operated a consulting business providing services to various hedge funds including acting as Chief Operating Officer and Chief Compliance Officer for a hedge fund from 2007 to 2008. Chief Operating Officer and Chief Compliance Officer of GMN Capital LLC from 2006 to 2007. | ||||
| David Berardi (Born 1975) | Assistant Treasurer, since 2009 | Vice President of Wells Fargo Funds Management, LLC since 2009. Vice President of Evergreen Investment Management Company, LLC from 2008 to 2010. Assistant Vice President of Evergreen Investment Services, Inc. from 2004 to 2008. Manager of Fund Reporting and Control for Evergreen Investment Management Company, LLC from 2004 to 2010. | ||||
| Jeremy DePalma (Born 1974) | Assistant Treasurer, since 2009 | Senior Vice President of Wells Fargo Funds Management, LLC since 2009. Senior Vice President of Evergreen Investment Management Company, LLC from 2008 to 2010. Vice President, Evergreen Investment Services, Inc. from 2004 to 2007. Head of the Fund Reporting and Control Team within Fund Administration from 2005 to 2010. | ||||
| Debra Ann Early (Born 1964) | Chief Compliance Officer, since 2007 | Chief Compliance Officer of Wells Fargo Funds Management, LLC since 2007. Chief Compliance Officer of Parnassus Investments from 2005 to 2007. Chief Financial Officer of Parnassus Investments from 2004 to 2007 and Senior Audit Manager of PricewaterhouseCoopers LLP from 1998 to 2004. |
| 1. | The Statement of Additional Information includes additional information about the Trustees and is available, without charge, upon request, by calling 1-800-222-8222 or by visiting the Web site at wellsfargoadvantagefunds.com. |
Table of Contents
| 24 | Wells Fargo Advantage VT International Equity Fund | Other Information (Unaudited) |
BOARD CONSIDERATION OF INVESTMENT ADVISORY AND SUB-ADVISORY AGREEMENTS:
Under Section 15 of the Investment Company Act of 1940 (the “1940 Act”), the Board of Trustees (the “Board”) of Wells Fargo Funds Trust (the “Trust”), all the members of which have no direct or indirect interest in the investment advisory and sub-advisory agreements and are not “interested persons” of the Trust, as defined in the 1940 Act (the “Independent Trustees”), must determine whether to approve the continuation of the Trust’s investment advisory and sub-advisory agreements. In this regard, at an in person meeting held on March 29-30, 2012 (the “Meeting”), the Board reviewed and re-approved: (i) an investment advisory agreement with Wells Fargo Funds Management, LLC (“Funds Management”) for Wells Fargo Advantage VT International Equity Fund (the “Fund”) and (ii) an investment sub-advisory agreement with Wells Capital Management Incorporated (“Wells Capital Management”) for the Fund. The investment advisory agreement with Funds Management and the investment sub-advisory agreement with Wells Capital Management are collectively referred to as the “Advisory Agreements.”
At the Meeting, the Board considered the factors and reached the conclusions described below relating to the selection of Funds Management and Wells Capital Management and the continuation of the Advisory Agreements. Prior to the Meeting, the Trustees conferred extensively among themselves and with representatives of Funds Management about these matters. The Board also met throughout the year and received information that was useful to them in considering the continuation of the Advisory Agreements. The Independent Trustees were assisted in their evaluation of the Advisory Agreements by independent legal counsel, from whom they received separate legal advice and with whom they met separately from Funds Management.
In providing information to the Board, Funds Management and Wells Capital Management were guided by a detailed set of requests submitted by the Independent Trustees’ independent legal counsel on their behalf at the start of the Board’s annual contract renewal process earlier in 2012. In approving the Advisory Agreements, the Board did not identify any particular information or consideration that was all-important or controlling, and each Trustee likely attributed different weights to various factors.
Nature, extent and quality of services
The Board received and considered various information regarding the nature, extent and quality of services provided to the Fund by Funds Management and Wells Capital Management under the Advisory Agreements. The Board also received and considered, among other things, information about the background and experience of senior management of Funds Management, and the qualifications, backgrounds, tenures and responsibilities of the portfolio managers primarily responsible for the day-to-day portfolio management of the Fund.
The Board evaluated the ability of Funds Management and Wells Capital Management, based on their respective financial condition, resources, reputation and other attributes, to attract and retain qualified investment professionals, including research, advisory, and supervisory personnel. The Board further considered the compliance programs and compliance records of Funds Management and Wells Capital Management. In addition, the Board took into account the administrative services provided to the Fund by Funds Management and its affiliates.
The Board’s decision to approve the continuation of the Advisory Agreements was based on a comprehensive evaluation of information provided to it. In considering these matters, the Board considered not only the specific information presented in connection with the Meeting, but also the knowledge gained over time through interaction with Funds Management and Wells Capital Management about various topics, including Funds Management’s oversight of service providers. The above factors, together with those referenced below, are some of the most important, but not necessarily all, factors considered by the Board in concluding that the nature, extent and quality of the investment advisory services provided to the Fund by Funds Management and Wells Capital Management supported the re-approval of the Advisory Agreements. Although the Board considered the continuation of the Advisory Agreements for the Fund as part of the larger process of considering the continuation of the advisory agreements for all of the funds in the complex, its decision to continue the Advisory Agreements for the Fund was ultimately made on a fund-by-fund basis.
Fund performance and expenses
The Board considered the performance results for the Fund over various time periods ended December 31, 2011. The Board also considered these results in comparison to the median performance of a universe of relevant funds (the “Universe”) that was determined by Lipper Inc. (“Lipper”) to be similar to the Fund, and in comparison to the Fund’s
Table of Contents
| Other Information (Unaudited) | Wells Fargo Advantage VT International Equity Fund | 25 |
benchmark index and to other comparative data. Lipper is an independent provider of investment company data. The Board received a description of the methodology used by Lipper to select the mutual funds in the Universe.
The Board noted that the performance of the Fund was higher than or in range of the median performance of the Universe for the periods under review, except for the three-year and five-year periods. The Board also noted that the performance of the Fund was higher than or in range of its benchmark, the Lipper VUF International Core Funds Index, for the periods under review, except for the three-year period. Funds Management explained the factors contributing to the Fund’s underperformance results. The Board was satisfied that Funds Management was taking appropriate actions with respect to the Fund’s investment performance and will continue to monitor the Fund’s investment performance.
The Board received and considered information regarding the Fund’s contractual advisory fee and net operating expense ratios and their various components, including actual management fees (which reflect fee waivers, if any), transfer agent, custodian and other non-management fees, Rule 12b-1 and non-Rule 12b-1 fees, service fees and fee waiver and expense reimbursement arrangements. The Board also considered these ratios in comparison to the median ratios of an expense Universe and a narrower expense group of mutual funds (each, an “Expense Group”) that was determined by Lipper to be similar to the Fund. The Board received a description of the methodology used by Lipper to select the mutual funds in the Fund’s Expense Group. The Board noted that the net operating expense ratios of the Fund were lower than the Fund’s Expense Group’s median net operating expense ratios.
Based on the above-referenced considerations and other factors, the Board concluded that the overall performance and expense structure of the Fund supported the re-approval of the Advisory Agreements for the Fund.
Investment advisory and sub-advisory fee rates
The Board reviewed and considered the contractual investment advisory fee rate that is payable by the Fund to Funds Management for investment advisory services (the “Advisory Agreement Rate”), both on a stand-alone basis and on a combined basis with the Fund’s administration fee rate. The Board took into account the separate administrative and other services covered by the administration fee rate. The Board also reviewed and considered the contractual investment sub-advisory fee rate that is payable by Funds Management to Wells Capital Management for investment sub-advisory services (the “Sub-Advisory Agreement Rate”). In addition, the Board reviewed and considered the existing fee waiver/cap arrangements applicable to the Advisory Agreement Rate and considered the Advisory Agreement Rate after taking the waivers/caps into account (the “Net Advisory Rate”).
The Board received and considered information comparing the Advisory Agreement Rate and Net Advisory Rate, combined with the administration fee rates, with those of other funds in the Fund’s Expense Group median. The Board noted that the Advisory Agreement Rate for the Fund was in range of the median rate for the Fund’s Expense Group, and the Net Advisory Rate for the Fund was lower than the median rate for the Fund’s Expense Group.
The Board also received and considered information about the nature and extent of services offered and fee rates charged by Funds Management and Wells Capital Management to other types of clients. In this regard, the Board received information about differences between the services, and the compliance, reporting, and other legal burdens and risks of providing investment advice to mutual funds and those associated with providing advice to non-mutual fund clients such as collective funds or institutional separate accounts.
The Board determined that the Advisory Agreement Rate for the Fund, both with and without the administration fee rate and before and after waivers, was reasonable in light of the Fund’s Expense Group information, the net expense ratio commitments, the services covered by the Advisory Agreements and other information provided. The Board also reviewed and considered the Sub-Advisory Agreement Rate and concluded that the Sub-Advisory Agreement Rate was reasonable in light of the services covered by the Sub-Advisory Agreement and other information provided.
Profitability
The Board received and considered a profitability analysis of Funds Management, as well as an analysis of the profitability to the collective Wells Fargo businesses that provide services to the Fund. It considered that the information provided to it was necessarily estimated, and that the profitability information provided to it, especially on a fund-by-fund basis, did not necessarily provide a precise tool for evaluating the appropriateness of the Fund’s Advisory Agreement Rate in isolation. It noted that the levels of profitability reported on a fund-by-fund basis varied widely, depending on, among other things, the size and type of fund. The Board concluded that the profitability reported by Funds Management was not unreasonable.
Table of Contents
| 26 | Wells Fargo Advantage VT International Equity Fund | Other Information (Unaudited) |
The Board did not consider separate profitability information with respect to Wells Capital Management, because, as an affiliate of Funds Management, its profitability information was subsumed in the collective Wells Fargo profitability analysis provided by Funds Management.
Economies of scale
With respect to possible economies of scale, the Board reviewed the breakpoints in the Fund’s advisory fee and/or administration fee structure, which operate generally to reduce the expenses of the Fund (as a percentage of Fund assets) as the Fund grows in size. It considered that, as a fund shrinks in size, breakpoints conversely result in increasing fee levels. The Board noted that it would have on-going opportunities to review the appropriate levels of breakpoints in the future, and concluded that the breakpoints as implemented appeared to be a reasonable step toward sharing economies of scale, if any, with the Fund. However, the Board acknowledged the inherent limitations of any analysis of economies of scale and of any attempt to correlate breakpoints with such economies, stemming largely from the Board’s understanding that economies of scale are realized, if at all, across a variety of products and services, not just with respect to a single fund.
Other benefits to Funds Management and Wells Capital Management
The Board received and considered information regarding potential “fall-out” or ancillary benefits received by Funds Management and its affiliates, including Wells Capital Management, as a result of their relationship with the Fund. Ancillary benefits could include, among others, benefits directly attributable to the relationship of Funds Management and Wells Capital Management with the Fund and benefits potentially derived from an increase in Funds Management’s and Wells Capital Management’s business as a result of their relationship with the Fund (such as the ability to market to shareholders other financial products offered by Funds Management and its affiliates, including Wells Capital Management).
The Board considered that Wells Fargo Funds Distributor, LLC, an affiliate of Funds Management, serves as distributor to the Fund and receives certain compensation for those services. The Board noted that various financial institutions, including affiliates of Funds Management, may receive distribution-related fees, shareholder servicing payments (including amounts derived from payments under Rule 12b-1 plans) and sub-transfer agency fees in respect of shares sold or held through them and services provided.
The Board also reviewed information about whether and to what extent soft dollar credits are sought and how any such credits are utilized and any benefits that may be realized by using an affiliated broker.
Other factors and broader review
The Board also considered the markets for distribution of the Fund’s shares, including the channels through which the Fund’s shares are offered and sold. The Board noted that the Fund is part of one of the few fund families that have both direct-to-fund and intermediary distribution channels. As discussed above, the Board reviews detailed materials received from Funds Management and Wells Capital Management annually as part of the re-approval process under Section 15 of the 1940 Act and also reviews and assesses information about the quality of the services that the Fund receives throughout the year. In this regard, the Board has reviewed reports of Funds Management at each of its quarterly meetings, which include, among other things, portfolio reviews and performance reports. In addition, the Board confers with portfolio managers at various times throughout the year.
Conclusion
After considering the above-described factors and based on its deliberations and its evaluation of the information described above, the Board unanimously approved the continuation of the Advisory Agreements for an additional one-year period.
Table of Contents
| List of Abbreviations | Wells Fargo Advantage VT International Equity Fund | 27 |
The following is a list of common abbreviations for terms and entities which may have appeared in this report.
| ACB | — Agricultural Credit Bank |
| ADR | — American Depository Receipt |
| ADS | — American Depository Shares |
| AGC-ICC | — Assured Guaranty Corporation - Insured Custody Certificates |
| AGM | — Assured Guaranty Municipal |
| AMBAC | — American Municipal Bond Assurance Corporation |
| AMT | — Alternative Minimum Tax |
| AUD | — Australian Dollar |
| BAN | — Bond Anticipation Notes |
| BHAC | — Berkshire Hathaway Assurance Corporation |
| BRL | — Brazil Real |
| CAB | — Capital Appreciation Bond |
| CAD | — Canadian Dollar |
| CCAB | — Convertible Capital Appreciation Bond |
| CDA | — Community Development Authority |
| CDO | — Collateralized Debt Obligation |
| CHF | — Swiss Franc |
| COP | — Certificate of Participation |
| CR | — Custody Receipts |
| DKK | — Danish Krone |
| DRIVER | — Derivative Inverse Tax-Exempt Receipts |
| DW&P | — Department of Water & Power |
| DWR | — Department of Water Resources |
| ECFA | — Educational & Cultural Facilities Authority |
| EDA | — Economic Development Authority |
| EDFA | — Economic Development Finance Authority |
| ETF | — Exchange-Traded Fund |
| EUR | — Euro |
| FFCB | — Federal Farm Credit Bank |
| FGIC | — Financial Guaranty Insurance Corporation |
| FGLMC | — Federal Government Loan Mortgage Company |
| FHA | — Federal Housing Authority |
| FHLB | — Federal Home Loan Bank |
| FHLMC | — Federal Home Loan Mortgage Corporation |
| FICO | — The Financing Corporation |
| FNMA | — Federal National Mortgage Association |
| FSA | — Farm Service Agency |
| GBP | — Great British Pound |
| GDR | — Global Depository Receipt |
| GNMA | — Government National Mortgage Association |
| GO | — General Obligation |
| HCFR | — Healthcare Facilities Revenue |
| HEFA | — Health & Educational Facilities Authority |
| HEFAR | — Higher Education Facilities Authority Revenue |
| HFA | — Housing Finance Authority |
| HFFA | — Health Facilities Financing Authority |
| HKD | — Hong Kong Dollar |
| HUF | — Hungarian Forint |
| IBC | — Insured Bond Certificate |
| IDA | — Industrial Development Authority |
| IDAG | — Industrial Development Agency |
| IDR | — Industrial Development Revenue |
| IEP | — Irish Pound |
| JPY | — Japanese Yen |
| KRW | — Republic of Korea Won |
| LIBOR | — London Interbank Offered Rate |
| LIQ | — Liquidity Agreement |
| LLC | — Limited Liability Company |
| LLP | — Limited Liability Partnership |
| LOC | — Letter of Credit |
| LP | — Limited Partnership |
| MBIA | — Municipal Bond Insurance Association |
| MFHR | — Multi-Family Housing Revenue |
| MSTR | — Municipal Securities Trust Receipts |
| MTN | — Medium Term Note |
| MUD | — Municipal Utility District |
| MXN | — Mexican Peso |
| MYR | — Malaysian Ringgit |
| NATL-RE | — National Public Finance Guarantee Corporation |
| NOK | — Norwegian Krone |
| NZD | — New Zealand Dollar |
| PCFA | — Pollution Control Finance Authority |
| PCR | — Pollution Control Revenue |
| PFA | — Public Finance Authority |
| PFFA | — Public Facilities Financing Authority |
| PFOTER | — Puttable Floating Option Tax-Exempt Receipts |
| plc | — Public Limited Company |
| PLN | — Polish Zloty |
| PUTTER | — Puttable Tax-Exempt Receipts |
| R&D | — Research & Development |
| RDA | — Redevelopment Authority |
| RDFA | — Redevelopment Finance Authority |
| REIT | — Real Estate Investment Trust |
| ROC | — Reset Option Certificates |
| SAVRS | — Select Auction Variable Rate Securities |
| SBA | — Small Business Authority |
| SEK | — Swedish Krona |
| SFHR | — Single Family Housing Revenue |
| SFMR | — Single Family Mortgage Revenue |
| SGD | — Singapore Dollar |
| SKK | — Slovakian Koruna |
| SPA | — Standby Purchase Agreement |
| SPDR | — Standard & Poor’s Depositary Receipts |
| STRIPS | — Separate Trading of Registered Interest and Principal Securities |
| TAN | — Tax Anticipation Notes |
| TBA | — To Be Announced |
| TIPS | — Treasury Inflation-Protected Securities |
| TRAN | — Tax Revenue Anticipation Notes |
| TCR | — Transferable Custody Receipts |
| TRY | — Turkish Lira |
| TTFA | — Transportation Trust Fund Authority |
| TVA | — Tennessee Valley Authority |
| XLCA | — XL Capital Assurance |
| ZAR | — South African Rand |
Table of Contents
This page is intentionally left blank.
Table of Contents
This page is intentionally left blank.
Table of Contents
This page is intentionally left blank.
Table of Contents


FOR MORE INFORMATION
More information about Wells Fargo Advantage Funds is available free upon request. To obtain literature, please write, e-mail, visit the Fund’s Web site, or call:
Wells Fargo Advantage Funds
P.O. Box 8266
Boston, MA 02266-8266
E-mail: wfaf@wellsfargo.com
Web site: wellsfargoadvantagefunds.com
Individual investors: 1-800-222-8222
Retail investment professionals: 1-888-877-9275
Institutional investment professionals: 1-866-765-0778
This report and the financial statements contained herein are submitted for the general information of the shareholders of Wells Fargo Advantage Funds. If this report is used for promotional purposes, distribution of the report must be accompanied or preceded by a current prospectus. For a current prospectus and, if available, a summary prospectus containing more complete information, including charges and expenses, call 1-800-222-8222 or visit the Fund’s Web site at wellsfargoadvantagefunds.com . Please consider the investment objectives, risks, charges, and expenses of the investment carefully before investing. This and other information about Wells Fargo Advantage Funds can be found in the current prospectus. Read the prospectus carefully before you invest or send money.
Wells Fargo Funds Management, LLC, a wholly owned subsidiary of Wells Fargo & Company, provides investment advisory and administrative services for Wells Fargo Advantage Funds. Other affiliates of Wells Fargo & Company provide subadvisory and other services for the Funds. The Funds are distributed by Wells Fargo Funds Distributor, LLC, Member FINRA/SIPC, an affiliate of Wells Fargo & Company.
NOT FDIC INSURED ¡ NO BANK GUARANTEE ¡ MAY LOSE VALUE
© 2012 Wells Fargo Funds Management, LLC. All rights reserved.
210664 08-12 SVT3/SAR140 06-12 |
Table of Contents

Wells Fargo Advantage VT Intrinsic Value Fund

Semi-Annual Report
June 30, 2012

Table of Contents
Reduce clutter. Save trees.
Sign up for electronic delivery of prospectuses and shareholder reports at wellsfargo.com/advantagedelivery
| 2 | ||||
| 4 | ||||
| 6 | ||||
| 7 | ||||
Financial Statements | ||||
| 10 | ||||
| 11 | ||||
| 12 | ||||
| 13 | ||||
| 14 | ||||
| 18 | ||||
| 24 | ||||
The views expressed and any forward-looking statements are as of June 30, 2012, unless otherwise noted, and are those of the Fund managers and/or Wells Fargo Funds Management, LLC. Discussions of individual securities, or the markets generally, or any Wells Fargo Advantage Fund are not intended as individual recommendations. Future events or results may vary significantly from those expressed in any forward-looking statements; the views expressed are subject to change at any time in response to changing circumstances in the market. Wells Fargo Funds Management, LLC, disclaims any obligation to publicly update or revise any views expressed or forward-looking statements.
NOT FDIC INSURED ¡ NO BANK GUARANTEE ¡ MAY LOSE VALUE
Table of Contents

WELLS FARGO INVESTMENT HISTORY
| 1932 | Keystone creates one of the first mutual fund families. | |
| 1971 | Wells Fargo & Company introduces one of the first institutional index funds. | |
| 1978 | Wells Fargo applies Markowitz and Sharpe’s research on Modern Portfolio Theory to introduce one of the industry’s first Tactical Asset Allocation (TAA) models in institutional separately managed accounts. | |
| 1984 | Wells Fargo Stagecoach Funds launches its first asset allocation fund. | |
| 1989 | The Tactical Asset Allocation (TAA) Model is first applied to Wells Fargo’s asset allocation mutual funds. | |
| 1994 | Wells Fargo introduces the LifePath Funds, one of the first suites of target date funds (now the Wells Fargo Advantage Dow Jones Target Date FundsSM). | |
| 1996 | Evergreen Investments and Keystone Funds merge. | |
| 1997 | Wells Fargo launches Wells Fargo Advantage WealthBuilder PortfoliosSM, a fund-of-funds suite of products that includes the use of quantitative models to shift assets among investment styles. | |
| 1999 | Norwest Advantage Funds and Stagecoach Funds are reorganized into Wells Fargo Funds after the merger of Norwest and Wells Fargo. | |
| 2002 | Evergreen Retail and Evergreen Institutional companies form the umbrella asset management company, Evergreen Investments. | |
| 2005 | The integration of Strong Funds with Wells Fargo Funds creates Wells Fargo Advantage Funds, resulting in one of the top 20 mutual fund companies in the United States. | |
| 2006 | Wells Fargo Advantage Funds relaunches the target date product line as Wells Fargo Advantage Dow Jones Target Date Funds. | |
| 2010 | The mergers and reorganizations of Evergreen and Wells Fargo Advantage mutual funds are completed, unifying the families under the brand of Wells Fargo Advantage Funds. | |
Wells Fargo Advantage Funds®
Wells Fargo Advantage Funds skillfully guides institutions, financial advisors, and individuals through the investment terrain to help them reach their financial objectives. Everything we do on behalf of investors is backed by our unique combination of qualifications.
Strength
Our organization is built on the standards of integrity and service established by our parent company—Wells Fargo & Company—more than 150 years ago. And, because we’re part of a highly diversified financial enterprise, we offer the depth of resources to help investors succeed.
Expertise
Our multi-boutique model offers investors access to the independent thinking of premier investment managers that have been chosen for their time-tested strategies. While each team specializes in a specific investment strategy, collectively they provide investors a wide choice of distinct investment styles. Our dedication to investment excellence doesn’t end with our expertise in manager selection—risk management, analysis, and rigorous ongoing review seek to ensure each manager’s investment process remains consistent.
Partnership
Our collaborative approach is built around understanding the needs and goals of our clients. By adhering to core principles of sound judgment and steady guidance, we support you through every stage of the investment decision process.
Carefully consider a fund’s investment objectives, risks, charges, and expenses before investing. For a current prospectus and, if available, a summary prospectus, containing this and other information, visit wellsfargoadvantagefunds.com. Read it carefully before investing.
Wells Fargo Funds Management, LLC, a wholly owned subsidiary of Wells Fargo & Company, provides investment advisory and administrative services for Wells Fargo Advantage Funds®. Other affiliates of Wells Fargo & Company provide subadvisory and other services for the Funds. The Funds are distributed by Wells Fargo Funds Distributor, LLC, Member FINRA/SIPC, an affiliate of Wells Fargo & Company.
“Dow Jones®” and “Dow Jones Target Date IndexesSM” are service marks of Dow Jones Trademark Holdings, LLC (“Dow Jones”), have been licensed to CME Group Index Services LLC (“CME Indexes”) and have been sublicensed for use for certain purposes by Global Index Advisors, Inc, and Wells Fargo Funds Management, LLC. The Wells Fargo Advantage Dow Jones Target Date FundsSM based on the Dow Jones Target Date IndexesSM, are not sponsored, endorsed, sold or promoted by Dow Jones, CME Indexes or their respective affiliates and none of them makes any representation regarding the advisability of investing in such product(s).
NOT FDIC INSURED ¡ NO BANK GUARANTEE ¡ MAY LOSE VALUE
Not part of semi-annual report.
Table of Contents
Wells Fargo Advantage Funds offers more than 110 mutual funds across a wide range of asset classes, representing over $207 billion in assets under management, as of June 30, 2012.
| Equity Funds | ||||
Asia Pacific Fund | Enterprise Fund† | Opportunity Fund† | ||
C&B Large Cap Value Fund | Equity Value Fund | Precious Metals Fund | ||
C&B Mid Cap Value Fund | Global Opportunities Fund | Premier Large Company Growth Fund | ||
Capital Growth Fund | Growth Fund | Small Cap Opportunities Fund | ||
Common Stock Fund | Index Fund | Small Cap Value Fund | ||
Disciplined U.S. Core Fund | International Equity Fund | Small Company Growth Fund | ||
Discovery Fund† | International Value Fund | Small Company Value Fund | ||
Diversified Equity Fund | Intrinsic Small Cap Value Fund | Small/Mid Cap Core Fund | ||
Diversified International Fund | Intrinsic Value Fund | Small/Mid Cap Value Fund | ||
Diversified Small Cap Fund | Intrinsic World Equity Fund | Special Mid Cap Value Fund | ||
Emerging Growth Fund | Large Cap Core Fund | Special Small Cap Value Fund | ||
Emerging Markets Equity Fund | Large Cap Growth Fund | Specialized Technology Fund | ||
Emerging Markets Equity Income Fund | Large Company Value Fund | Traditional Small Cap Growth Fund | ||
Endeavor Select Fund† | Omega Growth Fund | Utility and Telecommunications Fund | ||
| Bond Funds | ||||
Adjustable Rate Government Fund | Inflation-Protected Bond Fund | Short-Term Bond Fund | ||
California Limited-Term Tax-Free Fund | Intermediate Tax/AMT-Free Fund | Short-Term High Yield Bond Fund | ||
California Tax-Free Fund | International Bond Fund | Short-Term Municipal Bond Fund | ||
Colorado Tax-Free Fund | Minnesota Tax-Free Fund | Strategic Municipal Bond Fund | ||
Emerging Markets Local Bond Fund | Municipal Bond Fund | Total Return Bond Fund | ||
Government Securities Fund | North Carolina Tax-Free Fund | Ultra Short-Term Income Fund | ||
High Income Fund | Pennsylvania Tax-Free Fund | Ultra Short-Term Municipal Income Fund | ||
High Yield Bond Fund | Short Duration Government Bond Fund | Wisconsin Tax-Free Fund | ||
Income Plus Fund | ||||
| Asset Allocation Funds | ||||
Absolute Return Fund | WealthBuilder Equity Portfolio† | Target 2020 Fund† | ||
Asset Allocation Fund | WealthBuilder Growth Allocation Portfolio† | Target 2025 Fund† | ||
Conservative Allocation Fund | WealthBuilder Growth Balanced Portfolio† | Target 2030 Fund† | ||
Diversified Capital Builder Fund | WealthBuilder Moderate Balanced Portfolio† | Target 2035 Fund† | ||
Diversified Income Builder Fund | WealthBuilder Tactical Equity Portfolio† | Target 2040 Fund† | ||
Growth Balanced Fund | Target Today Fund† | Target 2045 Fund† | ||
Index Asset Allocation Fund | Target 2010 Fund† | Target 2050 Fund† | ||
Moderate Balanced Fund | Target 2015 Fund† | Target 2055 Fund† | ||
WealthBuilder Conservative Allocation Portfolio† | ||||
| Money Market Funds | ||||
100% Treasury Money Market Fund | Heritage Money Market Fund† | National Tax-Free Money Market Fund | ||
California Municipal Money Market Fund | Money Market Fund | Prime Investment Money Market Fund | ||
Cash Investment Money Market Fund | Municipal Cash Management Money Market Fund | Treasury Plus Money Market Fund | ||
Government Money Market Fund | Municipal Money Market Fund | |||
| Variable Trust Funds1 | ||||
VT Discovery Fund† | VT Intrinsic Value Fund | VT Small Cap Growth Fund | ||
VT Index Asset Allocation Fund | VT Omega Growth Fund | VT Small Cap Value Fund | ||
VT International Equity Fund | VT Opportunity Fund† | VT Total Return Bond Fund |
An investment in a money market fund is not insured or guaranteed by the Federal Deposit Insurance Corporation or any other government agency. Although the Wells Fargo Advantage Money Market Funds seek to preserve the value of your investment at $1.00 per share, it is possible to lose money by investing in a money market fund.
| 1. | The Variable Trust Funds are generally available only through insurance company variable contracts. |
| † | In this report, the Wells Fargo Advantage Discovery FundSM, Wells Fargo Advantage Endeavor Select FundSM, Wells Fargo Advantage Enterprise FundSM, Wells Fargo Advantage Opportunity FundSM, Wells Fargo Advantage WealthBuilder Conservative Allocation PortfolioSM, Wells Fargo Advantage WealthBuilder Equity PortfolioSM, Wells Fargo Advantage WealthBuilder Growth Allocation PortfolioSM, Wells Fargo Advantage WealthBuilder Growth Balanced PortfolioSM, Wells Fargo Advantage WealthBuilder Moderate Balanced PortfolioSM, Wells Fargo Advantage WealthBuilder Tactical Equity PortfolioSM, Wells Fargo Advantage Dow Jones Target Today FundSM, Wells Fargo Advantage Dow Jones Target 2010 FundSM, Wells Fargo Advantage Dow Jones Target 2015 FundSM, Wells Fargo Advantage Dow Jones Target 2020 FundSM, Wells Fargo Advantage Dow Jones Target 2025 FundSM, Wells Fargo Advantage Dow Jones Target 2030 FundSM, Wells Fargo Advantage Dow Jones Target 2035 FundSM, Wells Fargo Advantage Dow Jones Target 2040 FundSM, Wells Fargo Advantage Dow Jones Target 2045 FundSM, Wells Fargo Advantage Dow Jones Target 2050 FundSM, Wells Fargo Advantage Dow Jones Target 2055 FundSM, Wells Fargo Advantage Heritage Money Market FundSM, Wells Fargo Advantage VT Discovery FundSM, and Wells Fargo Advantage VT Opportunity FundSM are referred to as the Discovery Fund, Endeavor Select Fund, Enterprise Fund, Opportunity Fund, WealthBuilder Conservative Allocation Portfolio, WealthBuilder Equity Portfolio, WealthBuilder Growth Allocation Portfolio, WealthBuilder Growth Balanced Portfolio, WealthBuilder Moderate Balanced Portfolio, WealthBuilder Tactical Equity Portfolio, Target Today Fund, Target 2010 Fund, Target 2015 Fund, Target 2020 Fund, Target 2025 Fund, Target 2030 Fund, Target 2035 Fund, Target 2040 Fund, Target 2045 Fund, Target 2050 Fund, Target 2055 Fund, Heritage Money Market Fund, VT Discovery Fund, and VT Opportunity Fund, respectively. |
Not part of semi-annual report.
Table of Contents
| 2 | Wells Fargo Advantage VT Intrinsic Value Fund | Letter to Shareholders (Unaudited) |

Karla M. Rabusch,
President
Wells Fargo Advantage Funds
The period was marked by continued concerns about the possible global economic effects of the ongoing European sovereign debt crisis that began in Greece and later spread to the larger economies of Italy and Spain.
In contrast to worrisome data from the eurozone, U.S. economic data remained moderately positive.
Dear Valued Shareholder:
We’re pleased to offer you this semi-annual report for the Wells Fargo Advantage VT Intrinsic Value Fund for the six-month period that ended June 30, 2012. The period was marked by continued concerns about the possible global economic effects of the ongoing European sovereign debt crisis that began in Greece and later spread to the larger economies of Italy and Spain. Widespread support from central banks helped push developed market indexes to gains despite considerable intra-period volatility.
Macroeconomic optimism faded as global growth slowed and worries rose.
Prior to and throughout the reporting period, concerns about the eurozone sovereign debt situation returned to center stage and dominated stock markets around the globe. Investors became increasingly concerned that Greece would default on its debt, a scenario that only seemed more likely as eurozone leaders began to openly discuss a “voluntary” haircut on Greek debt for private investors. Because many eurozone banks owned Greek debt and many U.S. banks had financial ties to eurozone banks, investors worried about the effects of such an event on the financial systems and on the global economy.
The Greek credit crisis was seemingly addressed in March 2012 when the Greek government came to an agreement with its creditors, allowing the country to write down the principal on most of its bonds in exchange for increased financial austerity. The Greek agreement, combined with unprecedented support for eurozone banks by the European Central Bank, seemed to calm investor concerns, at least temporarily.
By the end of the reporting period, however, the agreement seemed on the verge of unraveling. Legislative elections in May left no single party with enough seats to form a government, and none of the parties was able to form a ruling coalition. A pro-bailout party won the subsequent June elections, but the Greek economy remained so weak that investors questioned whether the country would be able to meet its economic targets from the March agreement. Even more worrisome, in May 2012, Spain nationalized Bankia, putting more than $19 billion into the bank after it suffered heavy losses from property loans. The move refocused investor attention on Spain’s weak economy and depressed property sector, and Spanish bonds sold off. Moreover, news reports indicated that Greeks and Spaniards were pulling money from their country’s banks in favor of German and Swiss banks. By mid-June, analysts were openly discussing the possibility of a crisis within the European banking system.
The U.S. economy reported relatively solid news.
In contrast to worrisome data from the eurozone, U.S. economic data remained moderately positive. Reported real gross domestic product (GDP) growth came in at an annualized rate of 3.0% in the fourth quarter of 2011 compared with the prior quarter. Real GDP growth decelerated to a 1.9% annualized rate in the first quarter of 2012 but remained solidly in positive territory. In addition, the major banks appeared to have taken steps toward repairing their balance sheets; in March, the Federal Reserve (Fed) announced that 15 of the 19 major banks had passed a “stress test” in which the Fed attempted to gauge whether the banks could survive a severe recession that included a 50% drop in the stock market and a 21% percent decline in housing prices.
Table of Contents
| Letter to Shareholders (Unaudited) | Wells Fargo Advantage VT Intrinsic Value Fund | 3 |
The main piece of negative economic data was the unemployment rate, which remained at relatively high levels, beginning the period at 8.3% and ending it at 8.2%. Toward the end of the period, data indicated that the U.S. economy was adding fewer jobs than expected, leading to concerns that the country’s economic growth was slowing.
Major stock indexes posted positive returns.
Even though investor worries about the sovereign debt crisis within the eurozone caused considerable stock market volatility, the combination of central bank support and relatively strong U.S. economic numbers pushed major stock market indexes into the black, both for developed markets and for major emerging markets. Within the U.S., large-cap stocks modestly outperformed small-cap stocks, and growth stocks edged past value stocks.
We use time-tested investment strategies, even as many variables are at work in the market.
The full effect of the credit crisis remains unknown. Elevated unemployment and debt defaults continue to pressure consumers and businesses alike. In our experience, strict adherence to time-tested investment strategies has its rewards. As a whole, Wells Fargo Advantage Funds represents investments across a range of asset classes and investment styles, giving you an opportunity to create a diversified investment portfolio. While diversification may not prevent losses in a downturn, we believe it helps in managing risk.
Thank you for choosing to invest with Wells Fargo Advantage Funds. We appreciate your confidence in us and remain committed to helping you meet your financial needs. For current information about your fund investments, contact your investment professional, visit our Web site at wellsfargoadvantagefunds.com, or call us directly at 1-800-222-8222. We are available 24 hours a day, 7 days a week.
Sincerely,

Karla M. Rabusch
President
Wells Fargo Advantage Funds
Table of Contents
| 4 | Wells Fargo Advantage VT Intrinsic Value Fund | Performance Highlights (Unaudited) |
INVESTMENT OBJECTIVE
The Fund seeks long-term capital appreciation.
ADVISER
Wells Fargo Funds Management, LLC
SUB-ADVISER
Metropolitan West Capital Management, LLC
PORTFOLIO MANAGERS
Gary Lisenbee
Jeffrey Peck
FUND INCEPTION
May 6, 1996
TEN LARGEST EQUITY HOLDINGS1 (AS OF JUNE 30, 2012) | ||||
Home Depot Incorporated | 3.37% | |||
Diageo plc ADR | 3.09% | |||
The Hershey Company | 3.08% | |||
Abbott Laboratories | 3.08% | |||
Apple Incorporated | 2.87% | |||
EMC Corporation | 2.87% | |||
International Business Machines Corporation | 2.85% | |||
Time Warner Incorporated | 2.76% | |||
Nextera Energy Incorporated | 2.75% | |||
Intuit Incorporated | 2.74% | |||
SECTOR DISTRIBUTION2 (AS OF JUNE 30, 2012) | ||
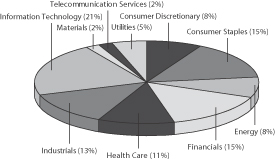 | ||
| 1. | The ten largest equity holdings are calculated based on the value of the securities divided by total net assets of the Fund. Holdings are subject to change and may have changed since the date specified. |
| 2. | Sector distribution is subject to change and is calculated based on the total long-term investments of the Fund. |
Table of Contents
| Performance Highlights (Unaudited) | Wells Fargo Advantage VT Intrinsic Value Fund | 5 |
AVERAGE ANNUAL TOTAL RETURN3 (%) (AS OF JUNE 30, 2012)
| Expense Ratios4 | ||||||||||||||||||||||||||||
| Inception Date | 6 Months* | 1 Year | 5 Year | 10 Year | Gross | Net5 | ||||||||||||||||||||||
Class 2 | 05/06/1996 | 10.71 | 1.19 | (2.21 | ) | 3.55 | 1.18% | 1.01% | ||||||||||||||||||||
Russell 1000® Value Index6 | 8.68 | 3.01 | (2.19 | ) | 5.28 | |||||||||||||||||||||||
| * | Returns for periods of less than one year are not annualized. |
Figures quoted represent past performance, which is no guarantee of future results and do not reflect the deduction of taxes that a shareholder may pay on fund distributions or the redemption of fund shares. Investment return and principal value of an investment will fluctuate so that an investor’s shares, when redeemed, may be worth more or less than their original cost. Current performance may be lower or higher than the performance data quoted and assumes the reinvestment of dividends and capital gains. Current month-end performance is available by calling 1-866-765-0778. Performance figures of the Fund do not reflect fees charged pursuant to the terms of variable life insurance policies and variable annuity contracts.
Index returns do not include transaction costs associated with buying and selling securities, any mutual fund fees or expenses or any taxes. It is not possible to invest directly in an index.
Stock fund values fluctuate in response to the activities of individual companies and general market and economic conditions. Certain investment strategies tend to increase the total risk of an investment (relative to the broader market). This Fund is exposed to foreign investment risk. Consult the Fund’s prospectus for additional information on these and other risks.
Please refer to the prospectus provided by your participating insurance company for detailed information describing the separate accounts for information regarding surrender charges, mortality and expense risk fees and other charges that may be assessed by the participating insurance companies.
| 3. | Historical performance shown for Class 2 of the Fund prior to July 19, 2010 is based on the performance of the Fund’s predecessor, Wells Fargo Advantage VT Equity Income Fund. |
| 4. | Reflects the expense ratio as stated in the most recent prospectus. |
| 5. | The Adviser has committed through July 18, 2013 to waive fees and/or reimburse expenses to the extent necessary to cap the Fund’s Total Annual Fund Operating Expenses After Fee Waiver, excluding certain expenses, at 1.00% for Class 2. Without this cap, the Fund’s returns would have been lower. |
| 6. | The Russell 1000® Value Index measures the performance of those Russell 1000 companies with lower price-to-book ratios and lower forecasted growth values. You cannot invest directly in an index. |
Table of Contents
| 6 | Wells Fargo Advantage VT Intrinsic Value Fund | Fund Expenses (Unaudited) |
As a shareholder of the Fund, you incur ongoing costs, including management fees, distribution (12b-1) fees, and other Fund expenses. This example is intended to help you understand your ongoing costs (in dollars) of investing in the Fund and to compare these costs with the ongoing costs of investing in other mutual funds.
The example is based on an investment of $1,000 invested at the beginning of the six-month period and held for the entire period from January 1, 2012 to June 30, 2012.
Actual Expenses
The “Actual” line of the table below provides information about actual account values and actual expenses. You may use the information in this line, together with the amount you invested, to estimate the expenses that you paid over the period. Simply divide your account value by $1,000 (for example, an $8,600 account value divided by $1,000 = 8.6), then multiply the result by the number in the “Actual” line under the heading entitled “Expenses Paid During Period” for your applicable class of shares to estimate the expenses you paid on your account during this period.
Hypothetical Example for Comparison Purposes
The “Hypothetical” line of the table below provides information about hypothetical account values and hypothetical expenses based on the Fund’s actual expense ratio and an assumed rate of return of 5% per year before expenses, which is not the Fund’s actual return. The hypothetical account values and expenses may not be used to estimate the actual ending account balance or expenses you paid for the period. You may use this information to compare the ongoing costs of investing in the Fund and other funds. To do so, compare this 5% hypothetical example with the 5% hypothetical examples that appear in the shareholder reports of the other funds.
Please note that the expenses shown in the table are meant to highlight your ongoing costs only and do not reflect any separate account charges assessed by participating insurance companies. Therefore, the “Hypothetical” line of the table is useful in comparing ongoing costs only, and will not help you determine the relative total costs of owning different funds. In addition, if these separate account charges assessed by participating insurance companies were included, your costs would have been higher.
| Beginning Account Value 01-01-2012 | Ending Account Value 06-30-2012 | Expenses Paid During the Period¹ | Net Annual Expense Ratio | |||||||||||||
Class 2 | ||||||||||||||||
Actual | $ | 1,000.00 | $ | 1,107.09 | $ | 5.24 | 1.00 | % | ||||||||
Hypothetical (5% return before expenses) | $ | 1,000.00 | $ | 1,019.89 | $ | 5.02 | 1.00 | % | ||||||||
| 1. | Expenses paid is equal to the annualized expense ratio multiplied by the average account value over the period, multiplied by the number of days in the most recent fiscal half-year divided by the number of days in the fiscal year (to reflect the one-half year period). |
Table of Contents
| Portfolio of Investments—June 30, 2012 (Unaudited) | Wells Fargo Advantage VT Intrinsic Value Fund | 7 |
| Security Name | Shares | Value | ||||||||||
Common Stocks: 96.54% | ||||||||||||
Consumer Discretionary: 8.01% | ||||||||||||
| Auto Components: 1.89% | ||||||||||||
TRW Automotive Holdings Corporation † | 24,000 | $ | 882,240 | |||||||||
|
| |||||||||||
| Media: 2.76% | ||||||||||||
Time Warner Incorporated | 33,500 | 1,289,750 | ||||||||||
|
| |||||||||||
| Specialty Retail: 3.36% | ||||||||||||
Home Depot Incorporated | 29,700 | 1,573,803 | ||||||||||
|
| |||||||||||
Consumer Staples: 14.28% | ||||||||||||
| Beverages: 5.45% | ||||||||||||
Diageo plc ADR | 14,000 | 1,442,980 | ||||||||||
PepsiCo Incorporated | 15,600 | 1,102,296 | ||||||||||
| 2,545,276 | ||||||||||||
|
| |||||||||||
| Food & Staples Retailing: 1.40% | ||||||||||||
Safeway Incorporated « | 36,000 | 653,400 | ||||||||||
|
| |||||||||||
| Food Products: 7.43% | ||||||||||||
H.J. Heinz Company « | 19,300 | 1,049,534 | ||||||||||
The Hershey Company | 20,000 | 1,440,600 | ||||||||||
Unilever NV | 29,500 | 983,825 | ||||||||||
| 3,473,959 | ||||||||||||
|
| |||||||||||
Energy: 7.69% | ||||||||||||
| Energy Equipment & Services: 1.94% | ||||||||||||
Schlumberger Limited | 14,000 | 908,740 | ||||||||||
|
| |||||||||||
| Oil, Gas & Consumable Fuels: 5.75% | ||||||||||||
Hess Corporation | 22,500 | 977,625 | ||||||||||
Occidental Petroleum Corporation | 11,000 | 943,470 | ||||||||||
QEP Resources Incorporated | 25,500 | 764,235 | ||||||||||
| 2,685,330 | ||||||||||||
|
| |||||||||||
Financials: 15.02% | ||||||||||||
| Capital Markets: 6.49% | ||||||||||||
Charles Schwab Corporation | 71,200 | 920,616 | ||||||||||
Franklin Resources Incorporated « | 8,700 | 965,613 | ||||||||||
Northern Trust Corporation | 24,900 | 1,145,898 | ||||||||||
| 3,032,127 | ||||||||||||
|
| |||||||||||
| Commercial Banks: 6.24% | ||||||||||||
M&T Bank Corporation « | 11,400 | 941,298 | ||||||||||
SunTrust Banks Incorporated | 43,500 | 1,054,005 | ||||||||||
Zions Bancorporation « | 47,500 | 922,450 | ||||||||||
| 2,917,753 | ||||||||||||
|
| |||||||||||
The accompanying notes are an integral part of these financial statements.
Table of Contents
| 8 | Wells Fargo Advantage VT Intrinsic Value Fund | Portfolio of Investments—June 30, 2012 (Unaudited) |
| Security Name | Shares | Value | ||||||||||
| Diversified Financial Services: 2.29% | ||||||||||||
JPMorgan Chase & Company | 30,000 | $ | 1,071,900 | |||||||||
|
| |||||||||||
Health Care: 10.56% | ||||||||||||
| Health Care Equipment & Supplies: 2.16% | ||||||||||||
Baxter International Incorporated | 19,000 | 1,009,850 | ||||||||||
|
| |||||||||||
| Health Care Providers & Services: 1.65% | ||||||||||||
CIGNA Corporation | 17,500 | 770,000 | ||||||||||
|
| |||||||||||
| Pharmaceuticals: 6.75% | ||||||||||||
Abbott Laboratories | 22,300 | 1,437,681 | ||||||||||
Eli Lilly & Company | 23,500 | 1,008,385 | ||||||||||
Hospira Incorporated †« | 20,300 | 710,094 | ||||||||||
| 3,156,160 | ||||||||||||
|
| |||||||||||
Industrials: 12.24% | ||||||||||||
| Aerospace & Defense: 6.18% | ||||||||||||
Boeing Company | 15,800 | 1,173,940 | ||||||||||
Huntington Ingalls Industries Incorporated † | 13,000 | 523,120 | ||||||||||
Northrop Grumman Corporation « | 18,700 | 1,192,873 | ||||||||||
| 2,889,933 | ||||||||||||
|
| |||||||||||
| Air Freight & Logistics: 1.99% | ||||||||||||
United Parcel Service Incorporated Class B | 11,800 | 929,368 | ||||||||||
|
| |||||||||||
| Machinery: 4.07% | ||||||||||||
Deere & Company « | 13,000 | 1,051,310 | ||||||||||
SPX Corporation | 13,000 | 849,160 | ||||||||||
| 1,900,470 | ||||||||||||
|
| |||||||||||
Information Technology: 20.13% | ||||||||||||
| Communications Equipment: 2.07% | ||||||||||||
QUALCOMM Incorporated | 17,400 | 968,832 | ||||||||||
|
| |||||||||||
| Computers & Peripherals: 5.74% | ||||||||||||
Apple Incorporated † | 2,300 | 1,343,200 | ||||||||||
EMC Corporation † | 52,300 | 1,340,449 | ||||||||||
| 2,683,649 | ||||||||||||
|
| |||||||||||
| Internet Software & Services: 2.25% | ||||||||||||
eBay Incorporated † | 25,000 | 1,050,250 | ||||||||||
|
| |||||||||||
| IT Services: 2.85% | ||||||||||||
International Business Machines Corporation | 6,800 | 1,329,944 | ||||||||||
|
| |||||||||||
| Semiconductors & Semiconductor Equipment: 1.75% | ||||||||||||
Texas Instruments Incorporated | 28,500 | 817,665 | ||||||||||
|
| |||||||||||
The accompanying notes are an integral part of these financial statements.
Table of Contents
| Portfolio of Investments—June 30, 2012 (Unaudited) | Wells Fargo Advantage VT Intrinsic Value Fund | 9 |
| Security Name | Shares | Value | ||||||||||||
| Software: 5.47% | ||||||||||||||
Intuit Incorporated | 21,600 | $ | 1,281,960 | |||||||||||
Oracle Corporation | 43,000 | 1,277,100 | ||||||||||||
| 2,559,060 | ||||||||||||||
|
| |||||||||||||
Materials: 1.95% | ||||||||||||||
| Chemicals: 1.95% | ||||||||||||||
Dow Chemical Company « | 29,000 | 913,500 | ||||||||||||
|
| |||||||||||||
Telecommunication Services: 2.17% | ||||||||||||||
| Wireless Telecommunication Services: 2.17% | ||||||||||||||
Vodafone Group plc ADR | 35,900 | 1,011,662 | ||||||||||||
|
| |||||||||||||
Utilities: 4.49% | ||||||||||||||
| Electric Utilities: 2.75% | ||||||||||||||
Nextera Energy Incorporated | 18,700 | 1,286,747 | ||||||||||||
|
| |||||||||||||
| Gas Utilities: 1.74% | ||||||||||||||
Questar Corporation | 39,000 | 813,531 | ||||||||||||
|
| |||||||||||||
Total Common Stocks (Cost $38,231,763) | 45,124,899 | |||||||||||||
|
| |||||||||||||
| Principal | ||||||||||||||
| Other: 0.02% | ||||||||||||||
Gryphon Funding Limited, Pass-Through Entity (a)(i)(v) | $ | 31,505 | 8,506 | |||||||||||
|
| |||||||||||||
Total Other (Cost $3,890) | 8,506 | |||||||||||||
|
| |||||||||||||
| Yield | Shares | |||||||||||||
| Short-Term Investments: 15.23% | ||||||||||||||
| Investment Companies: 15.23% | ||||||||||||||
Wells Fargo Advantage Cash Investment Money Market Fund, Select Class (l)(u) | 0.15 | % | 1,603,694 | 1,603,694 | ||||||||||
Wells Fargo Securities Lending Cash Investments, LLC (v)(l)(u)(r) | 0.19 | 5,514,160 | 5,514,160 | |||||||||||
Total Short-Term Investments (Cost $7,117,854) | 7,117,854 | |||||||||||||
|
| |||||||||||||
| Total Investments in Securities | ||||||||
| (Cost $45,353,507) * | 111.79 | % | 52,251,259 | |||||
Other Assets and Liabilities, Net | (11.79 | ) | (5,510,881 | ) | ||||
|
|
|
| |||||
| Total Net Assets | 100.00 | % | $ | 46,740,378 | ||||
|
|
|
|
| † | Non-income earning security |
| « | All or a portion of this security is on loan. |
| (a) | Security is fair valued by the Management Valuation Team, and in certain instances by the Board of Trustees, in accordance with procedures approved by the Board of Trustees. |
| (i) | Illiquid security |
| (v) | Security represents investment of cash collateral received from securities on loan. |
| (l) | Investment in an affiliate |
| (u) | Rate shown is the 7-day annualized yield at period end. |
| (r) | The investment company is exempt from registration under Section 3(c)(7) of the 1940 Act. |
| * | Cost for federal income tax purposes is $45,418,001 and net unrealized appreciation (depreciation) consists of: |
Gross unrealized appreciation | $ | 8,262,331 | ||
Gross unrealized depreciation | (1,429,073 | ) | ||
|
| |||
Net unrealized appreciation | $ | 6,833,258 |
The accompanying notes are an integral part of these financial statements.
Table of Contents
| 10 | Wells Fargo Advantage VT Intrinsic Value Fund | Statement of Assets and Liabilities—June 30, 2012 (Unaudited) |
Assets | ||||
Investments | ||||
In unaffiliated securities (including securities on loan), at value | $ | 45,133,405 | ||
In affiliated securities, at value | 7,117,854 | |||
|
| |||
Total investments, at value (see cost below) | 52,251,259 | |||
Receivable for investments sold | 11,582 | |||
Receivable for Fund shares sold | 2,495 | |||
Receivable for dividends | 92,091 | |||
Receivable for securities lending income | 926 | |||
Prepaid expenses and other assets | 16 | |||
|
| |||
Total assets | 52,358,369 | |||
|
| |||
Liabilities | ||||
Payable for Fund shares redeemed | 26,184 | |||
Payable upon receipt of securities loaned | 5,518,050 | |||
Advisory fee payable | 15,038 | |||
Distribution fees payable | 9,597 | |||
Due to other related parties | 4,989 | |||
Accrued expenses and other liabilities | 44,133 | |||
|
| |||
Total liabilities | 5,617,991 | |||
|
| |||
Total net assets | $ | 46,740,378 | ||
|
| |||
NET ASSETS CONSIST OF | ||||
Paid-in capital | $ | 47,399,969 | ||
Undistributed net investment income | 884,338 | |||
Accumulated net realized losses on investments | (8,441,681 | ) | ||
Net unrealized gains on investments | 6,897,752 | |||
|
| |||
Total net assets | $ | 46,740,378 | ||
|
| |||
COMPUTATION OF NET ASSET VALUE PER SHARE1 | ||||
Net assets – Class 2 | $ | 46,740,378 | ||
Shares outstanding – Class 2 | 3,399,330 | |||
Net asset value per share – Class 2 | $13.75 | |||
Investments in unaffiliated securities, at cost | $ | 38,235,653 | ||
|
| |||
Investments in affiliated securities, at cost | $ | 7,117,854 | ||
|
| |||
Total investments, at cost | $ | 45,353,507 | ||
|
| |||
Securities on loan, at value | $ | 5,394,634 | ||
|
| |||
| 1. | The Fund has an unlimited number of authorized shares. |
The accompanying notes are an integral part of these financial statements.
Table of Contents
| Statement of Operations—Six Months Ended June 30, 2012 (Unaudited) | Wells Fargo Advantage VT Intrinsic Value Fund | 11 |
Investment income | ||||
Dividends* | $ | 479,016 | ||
Securities lending income, net | 5,234 | |||
Income from affiliated securities | 1,177 | |||
|
| |||
Total investment income | 485,427 | |||
|
| |||
Expenses | ||||
Advisory fee | 131,197 | |||
Administration fees | ||||
Fund level | 11,927 | |||
Class 2 | 19,083 | |||
Distribution fees | ||||
Class 2 | 59,635 | |||
Custody and accounting fees | 4,457 | |||
Professional fees | 20,536 | |||
Shareholder report expenses | 17,077 | |||
Trustees’ fees and expenses | 5,622 | |||
Other fees and expenses | 1,249 | |||
|
| |||
Total expenses | 270,783 | |||
Less: Fee waivers and/or expense reimbursements | (32,243 | ) | ||
|
| |||
Net expenses | 238,540 | |||
|
| |||
Net investment income | 246,887 | |||
|
| |||
REALIZED AND UNREALIZED GAINS (LOSSES) ON INVESTMENTS | ||||
Net realized gains on investments | 2,389,572 | |||
Net change in unrealized gains (losses) on investments | 2,243,147 | |||
|
| |||
Net realized and unrealized gains (losses) on investments | 4,632,719 | |||
|
| |||
Net increase in net assets resulting from operations | $ | 4,879,606 | ||
|
| |||
* Net of foreign dividend withholding taxes of | $3,134 | |||
The accompanying notes are an integral part of these financial statements.
Table of Contents
| 12 | Wells Fargo Advantage VT Intrinsic Value Fund | Statements of Changes in Net Assets |
| Six Months Ended June 30, 2012 (Unaudited) | Year Ended December 31, 2011 | |||||||||||||||
Operations | ||||||||||||||||
Net investment income | $ | 246,887 | $ | 637,465 | ||||||||||||
Net realized gains on investments | 2,389,572 | 1,243,561 | ||||||||||||||
Net change in unrealized gains (losses) on investments | 2,243,147 | (2,810,230 | ) | |||||||||||||
|
|
|
|
|
|
|
| |||||||||
Net increase (decrease) in net assets resulting from operations | 4,879,606 | (929,204 | ) | |||||||||||||
|
|
|
|
|
|
|
| |||||||||
Distributions to shareholders from | ||||||||||||||||
Net investment income – Class 2 | 0 | (287,742 | ) | |||||||||||||
|
|
|
|
|
|
|
| |||||||||
Capital share transactions | Shares | Shares | ||||||||||||||
Proceeds from shares sold – Class 2 | 73,751 | 996,777 | 404,649 | 5,353,142 | ||||||||||||
Reinvestment of distributions – Class 2 | 0 | 0 | 21,619 | 287,742 | ||||||||||||
Payment for shares redeemed – Class 2 | (400,749 | ) | (5,420,550 | ) | (1,311,539 | ) | (16,971,260 | ) | ||||||||
|
|
|
|
|
|
|
| |||||||||
Net decrease in net assets resulting from capital share transactions | (4,423,773 | ) | (11,330,376 | ) | ||||||||||||
|
|
|
|
|
|
|
| |||||||||
Total increase (decrease) in net assets | 455,833 | (12,547,322 | ) | |||||||||||||
|
|
|
|
|
|
|
| |||||||||
Net assets | ||||||||||||||||
Beginning of period | 46,284,545 | 58,831,867 | ||||||||||||||
|
|
|
|
|
|
|
| |||||||||
End of period | $ | 46,740,378 | $ | 46,284,545 | ||||||||||||
|
|
|
|
|
|
|
| |||||||||
Undistributed net investment income | $ | 884,338 | $ | 637,451 | ||||||||||||
|
|
|
|
|
|
|
| |||||||||
The accompanying notes are an integral part of these financial statements.
Table of Contents
| Financial Highlights | Wells Fargo Advantage VT Intrinsic Value Fund | 13 |
(For a share outstanding throughout each period)
Class 22 | Six Months Ended (Unaudited) | Year Ended December 31, | ||||||||||||||||||||||
| 2011 | 20101 | 20091 | 20081 | 20071 | ||||||||||||||||||||
Net asset value, beginning of period | $ | 12.42 | $ | 12.76 | $ | 11.31 | $ | 9.88 | $ | 18.74 | $ | 19.75 | ||||||||||||
Net investment income | 0.09 | 0.18 | 0.16 | 0.19 | 0.30 | 0.30 | ||||||||||||||||||
Net realized and unrealized gains (losses) on investments | 1.24 | (0.45 | ) | 1.39 | 1.44 | (6.46 | ) | 0.33 | ||||||||||||||||
|
|
|
|
|
|
|
|
|
|
|
| |||||||||||||
Total from investment operations | 1.33 | (0.27 | ) | 1.55 | 1.63 | (6.16 | ) | 0.63 | ||||||||||||||||
Distributions to shareholders from | ||||||||||||||||||||||||
Net investment income | 0.00 | (0.07 | ) | (0.10 | ) | (0.20 | ) | (0.28 | ) | (0.30 | ) | |||||||||||||
Net realized gains | 0.00 | 0.00 | 0.00 | 0.00 | (2.42 | ) | (1.34 | ) | ||||||||||||||||
|
|
|
|
|
|
|
|
|
|
|
| |||||||||||||
Total distributions to shareholders | 0.00 | (0.07 | ) | (0.10 | ) | (0.20 | ) | (2.70 | ) | (1.64 | ) | |||||||||||||
Net asset value, end of period | $13.75 | $12.42 | $12.76 | $11.31 | $ 9.88 | $18.74 | ||||||||||||||||||
Total return | 10.71 | % | (2.15 | )% | 13.83 | % | 16.86 | % | (36.47 | )% | 2.80 | % | ||||||||||||
Ratios to average net assets (annualized) | ||||||||||||||||||||||||
Gross expenses | 1.14 | % | 1.17 | % | 1.10 | % | 1.18 | % | 1.15 | % | 1.05 | % | ||||||||||||
Net expenses | 1.00 | % | 1.00 | % | 1.00 | % | 1.00 | % | 1.00 | % | 1.00 | % | ||||||||||||
Net investment income | 1.03 | % | 1.17 | % | 1.29 | % | 1.94 | % | 1.95 | % | 1.49 | % | ||||||||||||
Supplemental data | ||||||||||||||||||||||||
Portfolio turnover rate | 10 | % | 26 | % | 72 | % | 16 | % | 9 | % | 20 | % | ||||||||||||
Net assets, end of period (000’s omitted) | $46,740 | $46,285 | $58,832 | $54,441 | $43,452 | $94,097 | ||||||||||||||||||
| 1. | After the close of business on July 16, 2010, the Fund acquired the net assets of Wells Fargo Advantage VT Equity Income Fund and Wells Fargo Advantage VT C&B Large Cap Value Fund. Wells Fargo Advantage VT Equity Income Fund became the accounting and performance survivor in the transaction. The information for the periods prior to July 19, 2010 is that of Wells Fargo Advantage VT Equity Income Fund. |
| 2. | After the close of business on July 16, 2010, existing shares of Wells Fargo Advantage VT Equity Income Fund were renamed Class 2 shares. |
The accompanying notes are an integral part of these financial statements.
Table of Contents
| 14 | Wells Fargo Advantage VT Intrinsic Value Fund | Notes to Financial Statements (Unaudited) |
1. ORGANIZATION
Wells Fargo Variable Trust (the “Trust”), a Delaware statutory trust organized on March 10, 1999, is an open-end management investment company registered under the Investment Company Act of 1940, as amended (the “1940 Act”). These financial statements report on Wells Fargo Advantage VT Intrinsic Value Fund (the “Fund”) which is a diversified series of the Trust.
2. SIGNIFICANT ACCOUNTING POLICIES
The following significant accounting policies, which are consistently followed in the preparation of the financial statements of the Fund, are in conformity with U.S. generally accepted accounting principles which require management to make estimates and assumptions that affect the reported amounts of assets and liabilities, disclosure of contingent assets and liabilities at the date of the financial statements, and the reported amounts of revenues and expenses during the reporting period. Actual results could differ from those estimates.
Securities valuation
Investments in equity securities are valued each business day as of the close of regular trading on the New York Stock Exchange, which is usually 4:00 p.m. (Eastern Time). Securities which are traded on a national or foreign securities exchange are valued at the last reported sales price, except that securities listed on The Nasdaq Stock Market, Inc. (“Nasdaq”) are valued at the Nasdaq Official Closing Price (“NOCP”), and if no NOCP is available, then at the last reported sales price. If no sales price is shown on the Nasdaq, the bid price will be used. In the absence of any sale of securities listed on the Nasdaq, and in the case of other securities (including U.S. Government obligations, but excluding debt securities maturing in 60 days or less), the price will be deemed “stale” and the valuations will be determined in accordance with the Fund’s Valuation Procedures.
Investments in open-end mutual funds and non-registered investment companies are fair valued at net asset value.
Investments which are not valued using any of the methods discussed above, are valued at their fair value, as determined by procedures established in good faith and approved by the Board of Trustees. The Board of Trustees has established a Valuation Committee comprised of the Trustees and has delegated to it the authority to take any actions regarding the valuation of portfolio securities that the Valuation Committee deems necessary in determining the fair value of portfolio securities, unless the responsibility has been delegated to the Management Valuation Team of Wells Fargo Funds Management, LLC (“Funds Management”). The Board of Trustees retains the authority to make or ratify any valuation decisions or approve any changes to the Valuation Procedures as it deems appropriate. On a quarterly basis, the Board of Trustees considers for ratification any valuation actions taken by the Valuation Committee or the Management Valuation Team.
Valuations of fair valued securities are compared to the next actual sales price when available, or other appropriate market information to assess the continued appropriateness of the fair valuation methodology used. These securities are fair valued on a day-to-day basis, taking into consideration changes to appropriate market information and any significant changes to the input factors considered in the valuation process until there is a readily available price provided on the exchange or by an independent pricing service. Valuations received from an independent pricing service or broker quotes are periodically validated by comparisons to most recent trades and valuations provided by other independent pricing services in addition to the review of prices by the adviser and/or sub-adviser. Unobservable inputs used in determining fair valuations are identified based on the type of security, taking into consideration factors utilized by market participants in valuing the investment, knowledge about the issuer and the current market environment.
Security loans
The Fund may lend its securities from time to time in order to earn additional income in the form of fees or interest on securities received as collateral or the investment of any cash received as collateral. The Fund continues to receive interest or dividends on the securities loaned. The Fund receives collateral in the form of cash or securities with a value at least equal to the value of the securities on loan. The value of the loaned securities is determined at the close of each business day and any additional required collateral is delivered to the Fund on the next business day. In a securities lending transaction, the net asset value of the Fund will be affected by an increase or decrease in the value of the securities loaned and by an increase or decrease in the value of the instrument in which collateral is invested. The amount of securities lending activity undertaken by the Fund fluctuates from time to time. In the event of default or bankruptcy
Table of Contents
| Notes to Financial Statements (Unaudited) | Wells Fargo Advantage VT Intrinsic Value Fund | 15 |
by the borrower, the Fund may be prevented from recovering the loaned securities or gaining access to the collateral or may experience delays or costs in doing so. In addition, the investment of any cash collateral received may lose all or part of its value. The Fund has the right under the lending agreement to recover the securities from the borrower on demand.
The Fund lends its securities through an unaffiliated securities lending agent. Cash collateral received in connection with its securities lending transactions is invested in Wells Fargo Securities Lending Cash Investments, LLC (the “Cash Collateral Fund”). The Cash Collateral Fund is exempt from registration under Section 3(c)(7) of the 1940 Act and is managed by Funds Management and is sub-advised by Wells Capital Management Incorporated (“Wells Capital Management”). Funds Management receives an advisory fee starting at 0.05% and declining to 0.01% as the average daily net assets of the Cash Collateral Fund increase. All of the fees received by Funds Management are paid to Wells Capital Management for its services as sub-adviser. The Cash Collateral Fund seeks to provide a positive return compared to the daily Fed Funds Open rate by investing in high-quality, U.S. dollar-denominated short-term money market instruments. Cash Collateral Fund investments are fair valued based upon the amortized cost valuation technique. Income earned from investment in the Cash Collateral Fund is included in securities lending income on the Statement of Operations.
Security transactions and income recognition
Securities transactions are recorded on a trade date basis. Realized gains or losses are reported on the basis of identified cost of securities delivered.
Dividend income is recognized on the ex-dividend date. Dividend income is recorded net of foreign taxes withheld where recovery of such taxes is not assured.
Distributions to shareholders
Distributions to shareholders from net investment income and net realized gains, if any, are recorded on the ex-dividend date. Such distributions are determined in conformity with income tax regulations, which may differ from generally accepted accounting principles.
Federal and other taxes
The Fund intends to continue to qualify as a regulated investment company by distributing substantially all of its investment company taxable income and any net realized capital gains (after reduction for capital loss carryforwards) sufficient to relieve it from all, or substantially all, federal income taxes. Accordingly, no provision for federal income taxes was required.
The Fund’s income and federal excise tax returns and all financial records supporting those returns for the prior three fiscal years are subject to examination by the federal and Delaware revenue authorities. Management has analyzed the Fund’s tax positions taken on federal, state, and foreign tax returns for all open tax years and does not believe that there are any uncertain tax positions that require recognition of a tax liability.
Under the recently enacted Regulated Investment Company Modernization Act of 2010, the Fund is permitted to carry forward capital losses incurred in taxable years which began after December 22, 2010 for an unlimited period. However, any losses incurred are required to be utilized prior to the losses incurred in pre-enactment taxable years. As a result of this ordering rule, pre-enactment capital loss carryforwards may be more likely to expire unused. Post-enactment capital losses that are carried forward will retain their character as either short-term or long-term capital losses rather than be considered all short-term as under previous law. In addition, the Fund may elect to defer any portion of a post-October capital loss or qualified late-year ordinary loss to the first day of the following taxable year. A post-October capital loss is the greatest of the net capital loss, net short-term capital loss or net long-term capital loss for the portion of the taxable year after October 31. A qualified late-year ordinary loss is the net loss comprised of (a) net gain or loss from the sale or other disposition of certain capital assets for the portion of the taxable year after October 31, and (b) other ordinary income or loss for the portion of the taxable year after December 31.
As of December 31, 2011, the Fund had net capital loss carryforwards, which are available to offset future net realized capital gains, in the amount of $10,766,757 with $2,708,874 expiring in 2015, $4,073,329 expiring in 2016 and $3,984,554 expiring in 2017.
Table of Contents
| 16 | Wells Fargo Advantage VT Intrinsic Value Fund | Notes to Financial Statements (Unaudited) |
3. FAIR VALUATION MEASUREMENTS
Fair value measurements of investments are determined within a framework that has established a fair value hierarchy based upon the various data inputs utilized in determining the value of the Fund’s investments. The three-level hierarchy gives the highest priority to unadjusted quoted prices in active markets for identical assets or liabilities (Level 1) and the lowest priority to significant unobservable inputs (Level 3). The Fund’s investments are classified within the fair value hierarchy based on the lowest level of input that is significant to the fair value measurement. The inputs are summarized into three broad levels as follows:
| n | Level 1 – quoted prices in active markets for identical securities |
| n | Level 2 – other significant observable inputs (including quoted prices for similar securities, interest rates, prepayment speeds, credit risk, etc.) |
| n | Level 3 – significant unobservable inputs (including the Fund’s own assumptions in determining the fair value of investments) |
The inputs or methodologies used for valuing securities are not necessarily an indication of the risk associated with investing in those securities.
As of June 30, 2012, the inputs used in valuing the Fund’s assets, which are carried at fair value, were as follows:
| Investments in Securities | Quoted Prices (Level 1) | Significant Other Observable Inputs (Level 2) | Significant Unobservable Inputs (Level 3) | Total | ||||||||||||
Equity securities | ||||||||||||||||
Common stocks | $ | 45,124,899 | $ | 0 | $ | 0 | $ | 45,124,899 | ||||||||
Other | 0 | 0 | 8,506 | 8,506 | ||||||||||||
Short-term investments | ||||||||||||||||
Investment companies | 1,603,694 | 5,514,160 | 0 | 7,117,854 | ||||||||||||
| $ | 46,728,593 | $ | 5,514,160 | $ | 8,506 | $ | 52,251,259 | |||||||||
Further details on the major security types listed above can be found in the Portfolio of Investments.
Transfers in and transfers out are recognized at the end of the reporting period. For the six months ended June 30, 2012, the Fund did not have any transfers into/out of Level 1 and Level 2.
4. TRANSACTIONS WITH AFFILIATES AND OTHER EXPENSES
Advisory fee
The Trust has entered into an advisory contract with Funds Management, an indirect wholly owned subsidiary of Wells Fargo & Company (“Wells Fargo”). The adviser is responsible for implementing investment policies and guidelines and for supervising the sub-adviser, who is responsible for day-to-day portfolio management of the Fund.
Pursuant to the contract, Funds Management is entitled to receive an annual advisory fee starting at 0.55% and declining to 0.40% as the average daily net assets of the Fund increase. For the six months ended June 30, 2012, the advisory fee was equivalent to an annual rate of 0.55% of the Fund’s average daily net assets.
Funds Management has retained the services of a sub-adviser to provide daily portfolio management to the Fund. The fee for sub-advisory services is borne by Funds Management. Metropolitan West Capital Management, LLC, an affiliate of Funds Management, is the sub-adviser to the Fund and is entitled to receive a fee from Funds Management at an annual rate starting at 0.35% and declining to 0.25% as the average daily net assets of the Fund increase.
Administration and transfer agent fees
The Trust has entered into an administration agreement with Funds Management. Under this agreement, for providing administrative services, which includes paying fees and expenses for services provided by the transfer agent, sub-transfer agents, omnibus account servicers and record-keepers, Funds Management is entitled to receive from the Fund an annual fund level administration fee starting at 0.05% and declining to 0.03% as the average daily net assets of the Fund increase and, for Class 2 shares, a class level administration fee of 0.08% of its average daily net assets.
Table of Contents
| Notes to Financial Statements (Unaudited) | Wells Fargo Advantage VT Intrinsic Value Fund | 17 |
Funds Management has contractually waived and/or reimbursed advisory and administration fees to the extent necessary to maintain the net operating expense ratio for the Fund. Waiver of fees and/or reimbursement of expenses by Funds Management were made first from fund level expenses on a proportionate basis and then from class specific expenses. Funds Management has committed through July 18, 2013 to waive fees and/or reimburse expenses to the extent necessary to cap the Fund’s expenses at 1.00% for Class 2.
Distribution fees
The Trust has adopted a Distribution Plan for Class 2 shares of the Fund pursuant to Rule 12b-1 under the 1940 Act. Distribution fees are charged to Class 2 shares and paid to Wells Fargo Funds Distributor, LLC, the principal underwriter, at an annual rate of 0.25% of the average daily net assets.
5. INVESTMENT PORTFOLIO TRANSACTIONS
Purchases and sales of investments, excluding U.S. Government obligations (if any) and short-term securities, for the six months ended June 30, 2012 were $4,608,038 and $8,654,615, respectively.
6. BANK BORROWINGS
The Trust and Wells Fargo Funds Trust (excluding the money market funds) are parties to a $150,000,000 revolving credit agreement with State Street Bank and Trust Company, whereby the Fund is permitted to use bank borrowings for temporary or emergency purposes, such as to fund shareholder redemption requests. Interest under the credit agreement is charged to the Fund based on a borrowing rate equal to the higher of the Federal Funds rate in effect on that day plus 1.25% or the overnight LIBOR rate in effect on that day plus 1.25%. In addition, an annual commitment fee equal to 0.10% of the unused balance is allocated to each participating fund. For the six months ended June 30, 2012, the Fund paid $45 in commitment fees.
For the six months ended June 30, 2012, there were no borrowings by the Fund under the agreement.
7. INDEMNIFICATION
Under the Trust’s organizational documents, the officers and directors are indemnified against certain liabilities that may arise out of performance of their duties to the Trust. Additionally, in the normal course of business, the Trust may enter into contracts with service providers that contain a variety of indemnification clauses. The Trust’s maximum exposure under these arrangements is dependent on future claims that may be made against the Fund and, therefore, cannot be estimated.
8. NEW ACCOUNTING PRONOUNCEMENT
In December 2011, the Financial Accounting Standards Board (“FASB”) issued Accounting Standard Update (“ASU”) No. 2011-11, Disclosures about Offsetting Assets and Liabilities. ASU 2011-11, which amends FASB ASC Topic 210 Balance Sheet, creates new disclosure requirements which require entities to disclose both gross and net information for derivatives and other financial instruments that are either offset in the Statement of Assets and Liabilities or subject to an enforceable master netting arrangement or similar agreement. The disclosure requirements are effective for interim and annual reporting periods beginning on or after January 1, 2013. Management is currently assessing the potential impact, in addition to expanded financial statement disclosure, that may result from adopting this ASU.
9. SUBSEQUENT DISTRIBUTION
On July 12, 2012, the Fund declared distributions from net investment income to Class 2 shareholders of record on July 11, 2012. The per share amount of $0.18787 is payable on July 13, 2012. This distribution is not reflected in the accompanying financial statements.
Table of Contents
| 18 | Wells Fargo Advantage VT Intrinsic Value Fund | Other Information (Unaudited) |
PROXY VOTING INFORMATION
A description of the policies and procedures that the Fund uses to determine how to vote proxies relating to portfolio securities is available without charge, upon request, by calling 1-800-222-8222, visiting our Web site at wellsfargoadvantagefunds.com, or visiting the SEC Web site at sec.gov. Information regarding how the Fund voted proxies relating to portfolio securities during the most recent 12-month period ended June 30 is available without charge on the Fund’s Web site at wellsfargoadvantagefunds.com or by visiting the SEC Web site at sec.gov.
PORTFOLIO HOLDINGS INFORMATION
The complete portfolio holdings for the Fund are publicly available on the Fund’s Web site (wellsfargoadvantagefunds.com) on a monthly, 30-day or more delayed basis. In addition, top ten holdings information for the Fund is publicly available on the Fund’s Web site on a monthly, seven-day or more delayed basis. The Fund files its complete schedule of portfolio holdings with the SEC for the first and third quarters of each fiscal year on Form N-Q, which is available without charge by visiting the SEC Web site at sec.gov. In addition, the Fund’s Form N-Q may be reviewed and copied at the SEC’s Public Reference Room in Washington, DC, and at regional offices in New York City, at 233 Broadway, and in Chicago, at 175 West Jackson Boulevard, Suite 900. Information about the Public Reference Room may be obtained by calling 1-800-SEC-0330.
Table of Contents
| Other Information (Unaudited) | Wells Fargo Advantage VT Intrinsic Value Fund | 19 |
BOARD OF TRUSTEES AND OFFICERS
Each of the Trustees and Officers listed in the table below acts in identical capacities for the Wells Fargo Advantage family of funds, which consists of 138 funds comprising the Wells Fargo Funds Trust, Wells Fargo Variable Trust, Wells Fargo Master Trust and four closed-end funds (collectively the “Fund Complex”). This table should be read in conjunction with the Prospectus and the Statement of Additional Information1. All of the Trustees are also Members of the Audit and Governance Committees of each Trust in the Fund Complex. The mailing address of each Trustee and Officer is 525 Market Street, 12th Floor, San Francisco, CA 94105. Each Trustee and Officer serves an indefinite term, however, each Trustee serves such term until reaching the mandatory retirement age established by the Trustees.
Independent Trustees
Name and Year of Birth | Position Held and Length of Service* | Principal Occupations During Past Five Years | Other Directorships During | |||
| Peter G. Gordon (Born 1942) | Trustee, since 1998; Chairman, since 2005 (Lead Trustee since 2001) | Co-Founder, Retired Chairman, President and CEO of Crystal Geyser Water Company. Trustee Emeritus, Colby College | Asset Allocation Trust | |||
| Isaiah Harris, Jr. (Born 1952) | Trustee, since 2009 | Retired. Prior thereto, President and CEO of BellSouth Advertising and Publishing Corp. from 2005 to 2007, President and CEO of BellSouth Enterprises from 2004 to 2005 and President of BellSouth Consumer Services from 2000 to 2003. Emeritus member of the Iowa State University Foundation Board of Governors. Emeritus Member of the Advisory Board of Iowa State University School of Business. Mr. Harris is a certified public accountant. | CIGNA Corporation; Deluxe Corporation; Asset Allocation Trust | |||
| Judith M. Johnson (Born 1949) | Trustee, since 2008 | Retired. Prior thereto, Chief Executive Officer and Chief Investment Officer of Minneapolis Employees Retirement Fund from 1996 to 2008. Ms. Johnson is an attorney, certified public accountant and a certified managerial accountant. | Asset Allocation Trust | |||
| Leroy Keith, Jr. (Born 1939) | Trustee, since 2010 | Chairman, Bloc Global Services (development and construction). Trustee of the Evergreen Funds from 1983 to 2010. Former Managing Director, Almanac Capital Management (commodities firm), former Partner, Stonington Partners, Inc. (private equity fund), former Director, Obagi Medical Products Co. and former Director, Lincoln Educational Services. | Trustee, Virtus Fund Complex (consisting of 40 portfolios as of 12/31/11); Asset Allocation Trust | |||
| David F. Larcker (Born 1950) | Trustee, since 2009 | James Irvin Miller Professor of Accounting at the Graduate School of Business, Stanford University, Director of Corporate Governance Research Program and Senior Faculty of The Rock Center for Corporate Governance since 2006. From 2005 to 2008, Professor of Accounting at the Graduate School of Business, Stanford University. Prior thereto, Ernst & Young Professor of Accounting at The Wharton School, University of Pennsylvania from 1985 to 2005. | Asset Allocation Trust | |||
| Olivia S. Mitchell (Born 1953) | Trustee, since 2006 | International Foundation of Employee Benefit Plans Professor, Wharton School of the University of Pennsylvania since 1993. Director of Wharton’s Pension Research Council and Boettner Center on Pensions & Retirement Research, and Research Associate at the National Bureau of Economic Research. Previously, Cornell University Professor from 1978 to 1993. | Asset Allocation Trust | |||
| Timothy J. Penny (Born 1951) | Trustee, since 1996 | President and CEO of Southern Minnesota Initiative Foundation, a non-profit organization, since 2007 and Senior Fellow at the Humphrey Institute Policy Forum at the University of Minnesota since 1995. Member of the Board of Trustees of NorthStar Education Finance, Inc., a non-profit organization, since 2007. | Asset Allocation Trust |
Table of Contents
| 20 | Wells Fargo Advantage VT Intrinsic Value Fund | Other Information (Unaudited) |
Name and Year of Birth | Position Held and Length of Service* | Principal Occupations During Past Five Years | Other Directorships During | |||
| Michael S. Scofield (Born 1943) | Trustee, since 2010 | Served on the Investment Company Institute’s Board of Governors and Executive Committee from 2008-2011 as well the Governing Council of the Independent Directors Council from 2006-2011 and the Independent Directors Council Executive Committee from 2008-2011. Chairman of the IDC from 2008-2010. Institutional Investor (Fund Directions) Trustee of Year in 2007. Trustee of the Evergreen Funds (and its predecessors) from 1984 to 2010. Chairman of the Evergreen Funds from 2000-2010. Former Trustee of the Mentor Funds. Retired Attorney, Law Offices of Michael S. Scofield and former Director and Chairman, Branded Media Corporation (multi-media branding company). | Asset Allocation Trust | |||
| Donald C. Willeke (Born 1940) | Trustee, since 1996 | Principal of the law firm of Willeke & Daniels. General Counsel of the Minneapolis Employees Retirement Fund from 1984 until its consolidation into the Minnesota Public Employees Retirement Association on June 30, 2010. Director and Vice Chair of The Free Trust (non-profit corporation). Director of the American Chestnut Foundation (non-profit corporation). | Asset Allocation Trust |
| * | Length of service dates reflect the Trustee’s commencement of service with the Trust’s predecessor entities, where applicable. |
Officers
Name and Year of Birth | Position Held and Length of Service | Principal Occupations During Past Five Years | ||||
| Karla M. Rabusch (Born 1959) | President, since 2003 | Executive Vice President of Wells Fargo Bank, N.A. and President of Wells Fargo Funds Management, LLC since 2003. Senior Vice President and Chief Administrative Officer of Wells Fargo Funds Management, LLC from 2001 to 2003. | ||||
| C. David Messman (Born 1960) | Secretary, since 2000; Chief Legal Officer, since 2003 | Senior Vice President and Secretary of Wells Fargo Funds Management, LLC since 2001. Vice President and Managing Senior Counsel of Wells Fargo Bank, N.A. since 1996. | ||||
| Nancy Wiser (Born 1967) | Treasurer, since 2012 | Executive Vice President of Wells Fargo Funds Management, LLC since 2011. Chief Operating Officer and Chief Compliance Officer at LightBox Capital Management LLC, from 2008 to 2011. Owned and operated a consulting business providing services to various hedge funds including acting as Chief Operating Officer and Chief Compliance Officer for a hedge fund from 2007 to 2008. Chief Operating Officer and Chief Compliance Officer of GMN Capital LLC from 2006 to 2007. | ||||
| David Berardi (Born 1975) | Assistant Treasurer, since 2009 | Vice President of Wells Fargo Funds Management, LLC since 2009. Vice President of Evergreen Investment Management Company, LLC from 2008 to 2010. Assistant Vice President of Evergreen Investment Services, Inc. from 2004 to 2008. Manager of Fund Reporting and Control for Evergreen Investment Management Company, LLC from 2004 to 2010. | ||||
| Jeremy DePalma (Born 1974) | Assistant Treasurer, since 2009 | Senior Vice President of Wells Fargo Funds Management, LLC since 2009. Senior Vice President of Evergreen Investment Management Company, LLC from 2008 to 2010. Vice President, Evergreen Investment Services, Inc. from 2004 to 2007. Head of the Fund Reporting and Control Team within Fund Administration from 2005 to 2010. | ||||
| Debra Ann Early (Born 1964) | Chief Compliance Officer, since 2007 | Chief Compliance Officer of Wells Fargo Funds Management, LLC since 2007. Chief Compliance Officer of Parnassus Investments from 2005 to 2007. Chief Financial Officer of Parnassus Investments from 2004 to 2007 and Senior Audit Manager of PricewaterhouseCoopers LLP from 1998 to 2004. |
| 1. | The Statement of Additional Information includes additional information about the Trustees and is available, without charge, upon request, by calling 1-800-222-8222 or by visiting the Web site at wellsfargoadvantagefunds.com. |
Table of Contents
| Other Information (Unaudited) | Wells Fargo Advantage VT Intrinsic Value Fund | 21 |
BOARD CONSIDERATION OF INVESTMENT ADVISORY AND SUB-ADVISORY AGREEMENTS:
Under Section 15 of the Investment Company Act of 1940 (the “1940 Act”), the Board of Trustees (the “Board”) of Wells Fargo Funds Trust (the “Trust”), all the members of which have no direct or indirect interest in the investment advisory and sub-advisory agreements and are not “interested persons” of the Trust, as defined in the 1940 Act (the “Independent Trustees”), must determine whether to approve the continuation of the Trust’s investment advisory and sub-advisory agreements. In this regard, at an in person meeting held on March 29-30, 2012 (the “Meeting”), the Board reviewed and re-approved: (i) an investment advisory agreement with Wells Fargo Funds Management, LLC (“Funds Management”) for Wells Fargo Advantage VT Intrinsic Value Fund (the “Fund”) and (ii) an investment sub-advisory agreement with Metropolitan West Capital Management, LLC (“MetWest”) for the Fund. The investment advisory agreement with Funds Management and the investment sub-advisory agreement with MetWest are collectively referred to as the “Advisory Agreements.”
At the Meeting, the Board considered the factors and reached the conclusions described below relating to the selection of Funds Management and MetWest and the continuation of the Advisory Agreements. Prior to the Meeting, the Trustees conferred extensively among themselves and with representatives of Funds Management about these matters. The Board also met throughout the year and received information that was useful to them in considering the continuation of the Advisory Agreements. The Independent Trustees were assisted in their evaluation of the Advisory Agreements by independent legal counsel, from whom they received separate legal advice and with whom they met separately from Funds Management.
In providing information to the Board, Funds Management and MetWest were guided by a detailed set of requests submitted by the Independent Trustees’ independent legal counsel on their behalf at the start of the Board’s annual contract renewal process earlier in 2012. In approving the Advisory Agreements, the Board did not identify any particular information or consideration that was all-important or controlling, and each Trustee likely attributed different weights to various factors.
Nature, extent and quality of services
The Board received and considered various information regarding the nature, extent and quality of services provided to the Fund by Funds Management and MetWest under the Advisory Agreements. The Board also received and considered, among other things, information about the background and experience of senior management of Funds Management, and the qualifications, backgrounds, tenures and responsibilities of the portfolio managers primarily responsible for the day-to-day portfolio management of the Fund.
The Board evaluated the ability of Funds Management and MetWest, based on their respective financial condition, resources, reputation and other attributes, to attract and retain qualified investment professionals, including research, advisory, and supervisory personnel. The Board further considered the compliance programs and compliance records of Funds Management and MetWest. In addition, the Board took into account the administrative services provided to the Fund by Funds Management and its affiliates.
The Board’s decision to approve the continuation of the Advisory Agreements was based on a comprehensive evaluation of information provided to it. In considering these matters, the Board considered not only the specific information presented in connection with the Meeting, but also the knowledge gained over time through interaction with Funds Management and MetWest about various topics, including Funds Management’s oversight of service providers. The above factors, together with those referenced below, are some of the most important, but not necessarily all, factors considered by the Board in concluding that the nature, extent and quality of the investment advisory services provided to the Fund by Funds Management and MetWest supported the re-approval of the Advisory Agreements. Although the Board considered the continuation of the Advisory Agreements for the Fund as part of the larger process of considering the continuation of the advisory agreements for all of the funds in the complex, its decision to continue the Advisory Agreements for the Fund was ultimately made on a fund-by-fund basis.
Fund performance and expenses
The Board considered the performance results for the Fund over various time periods ended December 31, 2011. The Board also considered these results in comparison to the median performance of a universe of relevant funds (the “Universe”) that was determined by Lipper Inc. (“Lipper”) to be similar to the Fund, and in comparison to the Fund’s benchmark index and to other comparative data. Lipper is an independent provider of investment company data. The
Table of Contents
| 22 | Wells Fargo Advantage VT Intrinsic Value Fund | Other Information (Unaudited) |
Board received a description of the methodology used by Lipper to select the mutual funds in the Universe. The Board noted that the performance of the Fund was lower than the median performance of the Universe for all periods under review. The Board also noted that the performance of the Fund was lower than its benchmark, the Lipper VUF Equity Income Funds Index, for the periods under review. Funds Management explained factors contributing to the Fund’s underperformance results. The Board was satisfied that Funds Management was taking appropriate actions with respect to the Fund’s investment performance and will continue to monitor the Fund’s investment performance.
The Board received and considered information regarding the Fund’s contractual advisory fee and net operating expense ratios and their various components, including actual management fees (which reflect fee waivers, if any), transfer agent, custodian and other non-management fees, Rule 12b-1 and non-Rule 12b-1 fees, service fees and fee waiver and expense reimbursement arrangements. The Board also considered these ratios in comparison to the median ratios of an expense Universe and a narrower expense group of mutual funds (each, an “Expense Group”) that was determined by Lipper to be similar to the Fund. The Board received a description of the methodology used by Lipper to select the mutual funds in the Fund’s Expense Group. The Board noted that the net operating expense ratio of the Fund was equal to the Fund’s Expense Group’s median net operating expense ratio.
Based on the above-referenced considerations and other factors, the Board concluded that the overall performance and expense structure of the Fund supported the re-approval of the Advisory Agreements for the Fund.
Investment advisory and sub-advisory fee rates
The Board reviewed and considered the contractual investment advisory fee rate that is payable by the Fund to Funds Management for investment advisory services (the “Advisory Agreement Rate”), both on a stand-alone basis and on a combined basis with the Fund’s administration fee rate. The Board took into account the separate administrative and other services covered by the administration fee rate. The Board also reviewed and considered the contractual investment sub-advisory fee rate that is payable by Funds Management to MetWest for investment sub-advisory services (the “Sub-Advisory Agreement Rate”). In addition, the Board reviewed and considered the existing fee waiver/cap arrangements applicable to the Advisory Agreement Rate and considered the Advisory Agreement Rate after taking the waivers/caps into account (the “Net Advisory Rate”).
The Board received and considered information comparing the Advisory Agreement Rate and Net Advisory Rate, combined with the administration fee rates, with those of other funds in the Fund’s Expense Group median. The Board noted that the Advisory Agreement Rate and Net Advisory Rate for the Fund were in range of the median rates for the Fund’s Expense Group.
The Board also received and considered information about the nature and extent of services offered and fee rates charged by Funds Management and MetWest to other types of clients. In this regard, the Board received information about differences between the services, and the compliance, reporting, and other legal burdens and risks of providing investment advice to mutual funds and those associated with providing advice to non-mutual fund clients such as collective funds or institutional separate accounts.
The Board determined that the Advisory Agreement Rate for the Fund, both with and without the administration fee rate and before and after waivers, was reasonable in light of the Fund’s Expense Group information, the net expense ratio commitments, the services covered by the Advisory Agreements and other information provided. The Board also reviewed and considered the Sub-Advisory Agreement Rate and concluded that the Sub-Advisory Agreement Rate was reasonable in light of the services covered by the Sub-Advisory Agreement and other information provided.
Profitability
The Board received and considered a profitability analysis of Funds Management, as well as an analysis of the profitability to the collective Wells Fargo businesses that provide services to the Fund. It considered that the information provided to it was necessarily estimated, and that the profitability information provided to it, especially on a fund-by-fund basis, did not necessarily provide a precise tool for evaluating the appropriateness of the Fund’s Advisory Agreement Rate in isolation. It noted that the levels of profitability reported on a fund-by-fund basis varied widely, depending on, among other things, the size and type of fund. The Board concluded that the profitability reported by Funds Management was not unreasonable.
Table of Contents
| Other Information (Unaudited) | Wells Fargo Advantage VT Intrinsic Value Fund | 23 |
The Board did not consider separate profitability information with respect to MetWest, because, as an affiliate of Funds Management, its profitability information was subsumed in the collective Wells Fargo profitability analysis provided by Funds Management.
Economies of scale
With respect to possible economies of scale, the Board reviewed the breakpoints in the Fund’s advisory fee and/or administration fee structure, which operate generally to reduce the expenses of the Fund (as a percentage of Fund assets) as the Fund grows in size. It considered that, as a fund shrinks in size, breakpoints conversely result in increasing fee levels. The Board noted that it would have on-going opportunities to review the appropriate levels of breakpoints in the future, and concluded that the breakpoints as implemented appeared to be a reasonable step toward sharing economies of scale, if any, with the Fund. However, the Board acknowledged the inherent limitations of any analysis of economies of scale and of any attempt to correlate breakpoints with such economies, stemming largely from the Board’s understanding that economies of scale are realized, if at all, across a variety of products and services, not just with respect to a single fund.
Other benefits to Funds Management and MetWest
The Board received and considered information regarding potential “fall-out” or ancillary benefits received by Funds Management and its affiliates, including MetWest, as a result of their relationship with the Fund. Ancillary benefits could include, among others, benefits directly attributable to the relationship of Funds Management and MetWest with the Fund and benefits potentially derived from an increase in Funds Management’s and MetWest’s business as a result of their relationship with the Fund (such as the ability to market to shareholders other financial products offered by Funds Management and its affiliates, including MetWest).
The Board considered that Wells Fargo Funds Distributor, LLC, an affiliate of Funds Management, serves as distributor to the Fund and receives certain compensation for those services. The Board noted that various financial institutions, including affiliates of Funds Management, may receive distribution-related fees, shareholder servicing payments (including amounts derived from payments under Rule 12b-1 plans) and sub-transfer agency fees in respect of shares sold or held through them and services provided.
The Board also reviewed information about whether and to what extent soft dollar credits are sought and how any such credits are utilized and any benefits that may be realized by using an affiliated broker.
Other factors and broader review
The Board also considered the markets for distribution of the Fund’s shares, including the channels through which the Fund’s shares are offered and sold. The Board noted that the Fund is part of one of the few fund families that have both direct-to-fund and intermediary distribution channels. As discussed above, the Board reviews detailed materials received from Funds Management and MetWest annually as part of the re-approval process under Section 15 of the 1940 Act and also reviews and assesses information about the quality of the services that the Fund receives throughout the year. In this regard, the Board has reviewed reports of Funds Management at each of its quarterly meetings, which include, among other things, portfolio reviews and performance reports. In addition, the Board confers with portfolio managers at various times throughout the year.
Conclusion
After considering the above-described factors and based on its deliberations and its evaluation of the information described above, the Board unanimously approved the continuation of the Advisory Agreements for an additional one-year period.
Table of Contents
| 24 | Wells Fargo Advantage VT Intrinsic Value Fund | List of Abbreviations |
The following is a list of common abbreviations for terms and entities which may have appeared in this report.
| ACB | — Agricultural Credit Bank |
| ADR | — American Depository Receipt |
| ADS | — American Depository Shares |
| AGC-ICC | — Assured Guaranty Corporation - Insured Custody Certificates |
| AGM | — Assured Guaranty Municipal |
| AMBAC | — American Municipal Bond Assurance Corporation |
| AMT | — Alternative Minimum Tax |
| AUD | — Australian Dollar |
| BAN | — Bond Anticipation Notes |
| BHAC | — Berkshire Hathaway Assurance Corporation |
| BRL | — Brazil Real |
| CAB | — Capital Appreciation Bond |
| CAD | — Canadian Dollar |
| CCAB | — Convertible Capital Appreciation Bond |
| CDA | — Community Development Authority |
| CDO | — Collateralized Debt Obligation |
| CHF | — Swiss Franc |
| COP | — Certificate of Participation |
| CR | — Custody Receipts |
| DKK | — Danish Krone |
| DRIVER | — Derivative Inverse Tax-Exempt Receipts |
| DW&P | — Department of Water & Power |
| DWR | — Department of Water Resources |
| ECFA | — Educational & Cultural Facilities Authority |
| EDA | — Economic Development Authority |
| EDFA | — Economic Development Finance Authority |
| ETF | — Exchange-Traded Fund |
| EUR | — Euro |
| FFCB | — Federal Farm Credit Bank |
| FGIC | — Financial Guaranty Insurance Corporation |
| FGLMC | — Federal Government Loan Mortgage Company |
| FHA | — Federal Housing Authority |
| FHLB | — Federal Home Loan Bank |
| FHLMC | — Federal Home Loan Mortgage Corporation |
| FICO | — The Financing Corporation |
| FNMA | — Federal National Mortgage Association |
| FSA | — Farm Service Agency |
| GBP | — Great British Pound |
| GDR | — Global Depository Receipt |
| GNMA | — Government National Mortgage Association |
| GO | — General Obligation |
| HCFR | — Healthcare Facilities Revenue |
| HEFA | — Health & Educational Facilities Authority |
| HEFAR | — Higher Education Facilities Authority Revenue |
| HFA | — Housing Finance Authority |
| HFFA | — Health Facilities Financing Authority |
| HKD | — Hong Kong Dollar |
| HUF | — Hungarian Forint |
| IBC | — Insured Bond Certificate |
| IDA | — Industrial Development Authority |
| IDAG | — Industrial Development Agency |
| IDR | — Industrial Development Revenue |
| IEP | — Irish Pound |
| JPY | — Japanese Yen |
| KRW | — Republic of Korea Won |
| LIBOR | — London Interbank Offered Rate |
| LIQ | — Liquidity Agreement |
| LLC | — Limited Liability Company |
| LLP | — Limited Liability Partnership |
| LOC | — Letter of Credit |
| LP | — Limited Partnership |
| MBIA | — Municipal Bond Insurance Association |
| MFHR | — Multi-Family Housing Revenue |
| MSTR | — Municipal Securities Trust Receipts |
| MTN | — Medium Term Note |
| MUD | — Municipal Utility District |
| MXN | — Mexican Peso |
| MYR | — Malaysian Ringgit |
| NATL-RE | — National Public Finance Guarantee Corporation |
| NOK | — Norwegian Krone |
| NZD | — New Zealand Dollar |
| PCFA | — Pollution Control Finance Authority |
| PCR | — Pollution Control Revenue |
| PFA | — Public Finance Authority |
| PFFA | — Public Facilities Financing Authority |
| PFOTER | — Puttable Floating Option Tax-Exempt Receipts |
| plc | — Public Limited Company |
| PLN | — Polish Zloty |
| PUTTER | — Puttable Tax-Exempt Receipts |
| R&D | — Research & Development |
| RDA | — Redevelopment Authority |
| RDFA | — Redevelopment Finance Authority |
| REIT | — Real Estate Investment Trust |
| ROC | — Reset Option Certificates |
| SAVRS | — Select Auction Variable Rate Securities |
| SBA | — Small Business Authority |
| SEK | — Swedish Krona |
| SFHR | — Single Family Housing Revenue |
| SFMR | — Single Family Mortgage Revenue |
| SGD | — Singapore Dollar |
| SKK | — Slovakian Koruna |
| SPA | — Standby Purchase Agreement |
| SPDR | — Standard & Poor’s Depositary Receipts |
| STRIPS | — Separate Trading of Registered Interest and Principal Securities |
| TAN | — Tax Anticipation Notes |
| TBA | — To Be Announced |
| TIPS | — Treasury Inflation-Protected Securities |
| TRAN | — Tax Revenue Anticipation Notes |
| TCR | — Transferable Custody Receipts |
| TRY | — Turkish Lira |
| TTFA | — Transportation Trust Fund Authority |
| TVA | — Tennessee Valley Authority |
| XLCA | — XL Capital Assurance |
| ZAR | — South African Rand |
Table of Contents
This page is intentionally left blank.
Table of Contents
This page is intentionally left blank.
Table of Contents


FOR MORE INFORMATION
More information about Wells Fargo Advantage Funds is available free upon request. To obtain literature, please write, e-mail, visit the Fund’s Web site, or call:
Wells Fargo Advantage Funds
P.O. Box 8266
Boston, MA 02266-8266
E-mail: wfaf@wellsfargo.com
Web site: wellsfargoadvantagefunds.com
Individual investors: 1-800-222-8222
Retail investment professionals: 1-888-877-9275
Institutional investment professionals: 1-866-765-0778
This report and the financial statements contained herein are submitted for the general information of the shareholders of Wells Fargo Advantage Funds. If this report is used for promotional purposes, distribution of the report must be accompanied or preceded by a current prospectus. For a current prospectus and, if available, a summary prospectus containing more complete information, including charges and expenses, call 1-800-222-8222 or visit the Fund’s Web site at wellsfargoadvantagefunds.com . Please consider the investment objectives, risks, charges, and expenses of the investment carefully before investing. This and other information about Wells Fargo Advantage Funds can be found in the current prospectus. Read the prospectus carefully before you invest or send money.
Wells Fargo Funds Management, LLC, a wholly owned subsidiary of Wells Fargo & Company, provides investment advisory and administrative services for Wells Fargo Advantage Funds. Other affiliates of Wells Fargo & Company provide subadvisory and other services for the Funds. The Funds are distributed by Wells Fargo Funds Distributor, LLC, Member FINRA/SIPC, an affiliate of Wells Fargo & Company.
NOT FDIC INSURED ¡ NO BANK GUARANTEE ¡ MAY LOSE VALUE
© 2012 Wells Fargo Funds Management, LLC. All rights reserved.
210665 08-12 SVT4/SAR139 06-12 |
Table of Contents

Wells Fargo Advantage VT Omega Growth Fund

Semi-Annual Report
June 30, 2012

Table of Contents
Reduce clutter. Save trees.
Sign up for electronic delivery of prospectuses and shareholder reports at wellsfargo.com/advantagedelivery
| 2 | ||||
| 4 | ||||
| 6 | ||||
| 7 | ||||
Financial Statements | ||||
| 11 | ||||
| 12 | ||||
| 13 | ||||
| 14 | ||||
| 16 | ||||
| 21 | ||||
| 27 | ||||
The views expressed and any forward-looking statements are as of June 30, 2012, unless otherwise noted, and are those of the Fund managers and/or Wells Fargo Funds Management, LLC. Discussions of individual securities, or the markets generally, or any Wells Fargo Advantage Fund are not intended as individual recommendations. Future events or results may vary significantly from those expressed in any forward-looking statements; the views expressed are subject to change at any time in response to changing circumstances in the market. Wells Fargo Funds Management, LLC, disclaims any obligation to publicly update or revise any views expressed or forward-looking statements.
NOT FDIC INSURED ¡ NO BANK GUARANTEE ¡ MAY LOSE VALUE
Table of Contents

WELLS FARGO INVESTMENT HISTORY
| 1932 | Keystone creates one of the first mutual fund families. | |
| 1971 | Wells Fargo & Company introduces one of the first institutional index funds. | |
| 1978 | Wells Fargo applies Markowitz and Sharpe’s research on Modern Portfolio Theory to introduce one of the industry’s first Tactical Asset Allocation (TAA) models in institutional separately managed accounts. | |
| 1984 | Wells Fargo Stagecoach Funds launches its first asset allocation fund. | |
| 1989 | The Tactical Asset Allocation (TAA) Model is first applied to Wells Fargo’s asset allocation mutual funds. | |
| 1994 | Wells Fargo introduces the LifePath Funds, one of the first suites of target date funds (now the Wells Fargo Advantage Dow Jones Target Date FundsSM). | |
| 1996 | Evergreen Investments and Keystone Funds merge. | |
| 1997 | Wells Fargo launches Wells Fargo Advantage WealthBuilder PortfoliosSM, a fund-of-funds suite of products that includes the use of quantitative models to shift assets among investment styles. | |
| 1999 | Norwest Advantage Funds and Stagecoach Funds are reorganized into Wells Fargo Funds after the merger of Norwest and Wells Fargo. | |
| 2002 | Evergreen Retail and Evergreen Institutional companies form the umbrella asset management company, Evergreen Investments. | |
| 2005 | The integration of Strong Funds with Wells Fargo Funds creates Wells Fargo Advantage Funds, resulting in one of the top 20 mutual fund companies in the United States. | |
| 2006 | Wells Fargo Advantage Funds relaunches the target date product line as Wells Fargo Advantage Dow Jones Target Date Funds. | |
| 2010 | The mergers and reorganizations of Evergreen and Wells Fargo Advantage mutual funds are completed, unifying the families under the brand of Wells Fargo Advantage Funds. | |
Wells Fargo Advantage Funds®
Wells Fargo Advantage Funds skillfully guides institutions, financial advisors, and individuals through the investment terrain to help them reach their financial objectives. Everything we do on behalf of investors is backed by our unique combination of qualifications.
Strength
Our organization is built on the standards of integrity and service established by our parent company—Wells Fargo & Company—more than 150 years ago. And, because we’re part of a highly diversified financial enterprise, we offer the depth of resources to help investors succeed.
Expertise
Our multi-boutique model offers investors access to the independent thinking of premier investment managers that have been chosen for their time-tested strategies. While each team specializes in a specific investment strategy, collectively they provide investors a wide choice of distinct investment styles. Our dedication to investment excellence doesn’t end with our expertise in manager selection—risk management, analysis, and rigorous ongoing review seek to ensure each manager’s investment process remains consistent.
Partnership
Our collaborative approach is built around understanding the needs and goals of our clients. By adhering to core principles of sound judgment and steady guidance, we support you through every stage of the investment decision process.
Carefully consider a fund’s investment objectives, risks, charges, and expenses before investing. For a current prospectus and, if available, a summary prospectus, containing this and other information, visit wellsfargoadvantagefunds.com. Read it carefully before investing.
Wells Fargo Funds Management, LLC, a wholly owned subsidiary of Wells Fargo & Company, provides investment advisory and administrative services for Wells Fargo Advantage Funds®. Other affiliates of Wells Fargo & Company provide subadvisory and other services for the Funds. The Funds are distributed by Wells Fargo Funds Distributor, LLC, Member FINRA/SIPC, an affiliate of Wells Fargo & Company.
“Dow Jones®” and “Dow Jones Target Date IndexesSM” are service marks of Dow Jones Trademark Holdings, LLC (“Dow Jones”), have been licensed to CME Group Index Services LLC (“CME Indexes”) and have been sublicensed for use for certain purposes by Global Index Advisors, Inc, and Wells Fargo Funds Management, LLC. The Wells Fargo Advantage Dow Jones Target Date FundsSM based on the Dow Jones Target Date IndexesSM, are not sponsored, endorsed, sold or promoted by Dow Jones, CME Indexes or their respective affiliates and none of them makes any representation regarding the advisability of investing in such product(s).
NOT FDIC INSURED ¡ NO BANK GUARANTEE ¡ MAY LOSE VALUE
Not part of semi-annual report.
Table of Contents
Wells Fargo Advantage Funds offers more than 110 mutual funds across a wide range of asset classes, representing over $207 billion in assets under management, as of June 30, 2012.
| Equity Funds | ||||
Asia Pacific Fund | Enterprise Fund† | Opportunity Fund† | ||
C&B Large Cap Value Fund | Equity Value Fund | Precious Metals Fund | ||
C&B Mid Cap Value Fund | Global Opportunities Fund | Premier Large Company Growth Fund | ||
Capital Growth Fund | Growth Fund | Small Cap Opportunities Fund | ||
Common Stock Fund | Index Fund | Small Cap Value Fund | ||
Disciplined U.S. Core Fund | International Equity Fund | Small Company Growth Fund | ||
Discovery Fund† | International Value Fund | Small Company Value Fund | ||
Diversified Equity Fund | Intrinsic Small Cap Value Fund | Small/Mid Cap Core Fund | ||
Diversified International Fund | Intrinsic Value Fund | Small/Mid Cap Value Fund | ||
Diversified Small Cap Fund | Intrinsic World Equity Fund | Special Mid Cap Value Fund | ||
Emerging Growth Fund | Large Cap Core Fund | Special Small Cap Value Fund | ||
Emerging Markets Equity Fund | Large Cap Growth Fund | Specialized Technology Fund | ||
Emerging Markets Equity Income Fund | Large Company Value Fund | Traditional Small Cap Growth Fund | ||
Endeavor Select Fund† | Omega Growth Fund | Utility and Telecommunications Fund | ||
| Bond Funds | ||||
Adjustable Rate Government Fund | Inflation-Protected Bond Fund | Short-Term Bond Fund | ||
California Limited-Term Tax-Free Fund | Intermediate Tax/AMT-Free Fund | Short-Term High Yield Bond Fund | ||
California Tax-Free Fund | International Bond Fund | Short-Term Municipal Bond Fund | ||
Colorado Tax-Free Fund | Minnesota Tax-Free Fund | Strategic Municipal Bond Fund | ||
Emerging Markets Local Bond Fund | Municipal Bond Fund | Total Return Bond Fund | ||
Government Securities Fund | North Carolina Tax-Free Fund | Ultra Short-Term Income Fund | ||
High Income Fund | Pennsylvania Tax-Free Fund | Ultra Short-Term Municipal Income Fund | ||
High Yield Bond Fund | Short Duration Government Bond Fund | Wisconsin Tax-Free Fund | ||
Income Plus Fund | ||||
| Asset Allocation Funds | ||||
Absolute Return Fund | WealthBuilder Equity Portfolio† | Target 2020 Fund† | ||
Asset Allocation Fund | WealthBuilder Growth Allocation Portfolio† | Target 2025 Fund† | ||
Conservative Allocation Fund | WealthBuilder Growth Balanced Portfolio† | Target 2030 Fund† | ||
Diversified Capital Builder Fund | WealthBuilder Moderate Balanced Portfolio† | Target 2035 Fund† | ||
Diversified Income Builder Fund | WealthBuilder Tactical Equity Portfolio† | Target 2040 Fund† | ||
Growth Balanced Fund | Target Today Fund† | Target 2045 Fund† | ||
Index Asset Allocation Fund | Target 2010 Fund† | Target 2050 Fund† | ||
Moderate Balanced Fund | Target 2015 Fund† | Target 2055 Fund† | ||
WealthBuilder Conservative Allocation Portfolio† | ||||
| Money Market Funds | ||||
100% Treasury Money Market Fund | Heritage Money Market Fund† | National Tax-Free Money Market Fund | ||
California Municipal Money Market Fund | Money Market Fund | Prime Investment Money Market Fund | ||
Cash Investment Money Market Fund | Municipal Cash Management Money Market Fund | Treasury Plus Money Market Fund | ||
Government Money Market Fund | Municipal Money Market Fund | |||
| Variable Trust Funds1 | ||||
VT Discovery Fund† | VT Intrinsic Value Fund | VT Small Cap Growth Fund | ||
VT Index Asset Allocation Fund | VT Omega Growth Fund | VT Small Cap Value Fund | ||
VT International Equity Fund | VT Opportunity Fund† | VT Total Return Bond Fund |
An investment in a money market fund is not insured or guaranteed by the Federal Deposit Insurance Corporation or any other government agency. Although the Wells Fargo Advantage Money Market Funds seek to preserve the value of your investment at $1.00 per share, it is possible to lose money by investing in a money market fund.
| 1. | The Variable Trust Funds are generally available only through insurance company variable contracts. |
| † | In this report, the Wells Fargo Advantage Discovery FundSM, Wells Fargo Advantage Endeavor Select FundSM, Wells Fargo Advantage Enterprise FundSM, Wells Fargo Advantage Opportunity FundSM, Wells Fargo Advantage WealthBuilder Conservative Allocation PortfolioSM, Wells Fargo Advantage WealthBuilder Equity PortfolioSM, Wells Fargo Advantage WealthBuilder Growth Allocation PortfolioSM, Wells Fargo Advantage WealthBuilder Growth Balanced PortfolioSM, Wells Fargo Advantage WealthBuilder Moderate Balanced PortfolioSM, Wells Fargo Advantage WealthBuilder Tactical Equity PortfolioSM, Wells Fargo Advantage Dow Jones Target Today FundSM, Wells Fargo Advantage Dow Jones Target 2010 FundSM, Wells Fargo Advantage Dow Jones Target 2015 FundSM, Wells Fargo Advantage Dow Jones Target 2020 FundSM, Wells Fargo Advantage Dow Jones Target 2025 FundSM, Wells Fargo Advantage Dow Jones Target 2030 FundSM, Wells Fargo Advantage Dow Jones Target 2035 FundSM, Wells Fargo Advantage Dow Jones Target 2040 FundSM, Wells Fargo Advantage Dow Jones Target 2045 FundSM, Wells Fargo Advantage Dow Jones Target 2050 FundSM, Wells Fargo Advantage Dow Jones Target 2055 FundSM, Wells Fargo Advantage Heritage Money Market FundSM, Wells Fargo Advantage VT Discovery FundSM, and Wells Fargo Advantage VT Opportunity FundSM are referred to as the Discovery Fund, Endeavor Select Fund, Enterprise Fund, Opportunity Fund, WealthBuilder Conservative Allocation Portfolio, WealthBuilder Equity Portfolio, WealthBuilder Growth Allocation Portfolio, WealthBuilder Growth Balanced Portfolio, WealthBuilder Moderate Balanced Portfolio, WealthBuilder Tactical Equity Portfolio, Target Today Fund, Target 2010 Fund, Target 2015 Fund, Target 2020 Fund, Target 2025 Fund, Target 2030 Fund, Target 2035 Fund, Target 2040 Fund, Target 2045 Fund, Target 2050 Fund, Target 2055 Fund, Heritage Money Market Fund, VT Discovery Fund, and VT Opportunity Fund, respectively. |
Not part of semi-annual report.
Table of Contents
| 2 | Wells Fargo Advantage VT Omega Growth Fund | Letter to Shareholders (Unaudited) |

Karla M. Rabusch,
President
Wells Fargo Advantage Funds
The period was marked by continued concerns about the possible global economic effects of the ongoing European sovereign debt crisis that began in Greece and later spread to the larger economies of Italy and Spain.
In contrast to worrisome data from the eurozone, U.S. economic data remained moderately positive.
Dear Valued Shareholder:
We’re pleased to offer you this semi-annual report for the Wells Fargo Advantage VT Omega Growth Fund for the six-month period that ended June 30, 2012. The period was marked by continued concerns about the possible global economic effects of the ongoing European sovereign debt crisis that began in Greece and later spread to the larger economies of Italy and Spain. Widespread support from central banks helped push developed market indexes to gains despite considerable intra-period volatility.
Macroeconomic optimism faded as global growth slowed and worries rose.
Prior to and throughout the reporting period, concerns about the eurozone sovereign debt situation returned to center stage and dominated stock markets around the globe. Investors became increasingly concerned that Greece would default on its debt, a scenario that only seemed more likely as eurozone leaders began to openly discuss a “voluntary” haircut on Greek debt for private investors. Because many eurozone banks owned Greek debt and many U.S. banks had financial ties to eurozone banks, investors worried about the effects of such an event on the financial systems and on the global economy.
The Greek credit crisis was seemingly addressed in March 2012 when the Greek government came to an agreement with its creditors, allowing the country to write down the principal on most of its bonds in exchange for increased financial austerity. The Greek agreement, combined with unprecedented support for eurozone banks by the European Central Bank, seemed to calm investor concerns, at least temporarily.
By the end of the reporting period, however, the agreement seemed on the verge of unraveling. Legislative elections in May left no single party with enough seats to form a government, and none of the parties was able to form a ruling coalition. A pro-bailout party won the subsequent June elections, but the Greek economy remained so weak that investors questioned whether the country would be able to meet its economic targets from the March agreement. Even more worrisome, in May 2012, Spain nationalized Bankia, putting more than $19 billion into the bank after it suffered heavy losses from property loans. The move refocused investor attention on Spain’s weak economy and depressed property sector, and Spanish bonds sold off. Moreover, news reports indicated that Greeks and Spaniards were pulling money from their country’s banks in favor of German and Swiss banks. By mid-June, analysts were openly discussing the possibility of a crisis within the European banking system.
The U.S. economy reported relatively solid news.
In contrast to worrisome data from the eurozone, U.S. economic data remained moderately positive. Reported real gross domestic product (GDP) growth came in at an annualized rate of 3.0% in the fourth quarter of 2011 compared with the prior quarter. Real GDP growth decelerated to a 1.9% annualized rate in the first quarter of 2012 but remained solidly in positive territory. In addition, the major banks appeared to have taken steps toward repairing their balance sheets; in March, the Federal Reserve (Fed) announced that 15 of the 19 major banks had passed a “stress test” in which the Fed attempted to gauge whether the banks could survive a severe recession that included a 50% drop in the stock market and a 21% percent decline in housing prices.
Table of Contents
| Letter to Shareholders (Unaudited) | Wells Fargo Advantage VT Omega Growth Fund | 3 |
The main piece of negative economic data was the unemployment rate, which remained at relatively high levels, beginning the period at 8.3% and ending it at 8.2%. Toward the end of the period, data indicated that the U.S. economy was adding fewer jobs than expected, leading to concerns that the country’s economic growth was slowing.
Major stock indexes posted positive returns.
Even though investor worries about the sovereign debt crisis within the eurozone caused considerable stock market volatility, the combination of central bank support and relatively strong U.S. economic numbers pushed major stock market indexes into the black, both for developed markets and for major emerging markets. Within the U.S., large-cap stocks modestly outperformed small-cap stocks, and growth stocks edged past value stocks.
We use time-tested investment strategies, even as many variables are at work in the market.
The full effect of the credit crisis remains unknown. Elevated unemployment and debt defaults continue to pressure consumers and businesses alike. In our experience, strict adherence to time-tested investment strategies has its rewards. As a whole, Wells Fargo Advantage Funds represents investments across a range of asset classes and investment styles, giving you an opportunity to create a diversified investment portfolio. While diversification may not prevent losses in a downturn, we believe it helps in managing risk.
Thank you for choosing to invest with Wells Fargo Advantage Funds. We appreciate your confidence in us and remain committed to helping you meet your financial needs. For current information about your fund investments, contact your investment professional, visit our Web site at wellsfargoadvantagefunds.com, or call us directly at 1-800-222-8222. We are available 24 hours a day, 7 days a week.
Sincerely,

Karla M. Rabusch
President
Wells Fargo Advantage Funds
Table of Contents
| 4 | Wells Fargo Advantage VT Omega Growth Fund | Performance Highlights (Unaudited) |
INVESTMENT OBJECTIVE
The Fund seeks long-term capital appreciation.
ADVISER
Wells Fargo Funds Management, LLC
SUB-ADVISER
Wells Capital Management Incorporated
PORTFOLIO MANAGERS
Thomas J. Pence, CFA
Michael T. Smith, CFA
FUND INCEPTION
March 6, 1997
| TEN LARGEST EQUITY HOLDINGS1 (AS OF JUNE 30, 2012) | ||||
Apple Incorporated | 8.65% | |||
Google Incorporated Class A | 3.00% | |||
Dollar General Corporation | 2.57% | |||
Visa Incorporated Class A | 2.52% | |||
eBay Incorporated | 2.33% | |||
Monsanto Company | 2.22% | |||
Airgas Incorporated | 2.12% | |||
TransDigm Group Incorporated | 1.95% | |||
Kansas City Southern | 1.91% | |||
Crown Castle International Corporation | 1.84% | |||
| SECTOR DISTRIBUTION2 (AS OF JUNE 30, 2012) | ||
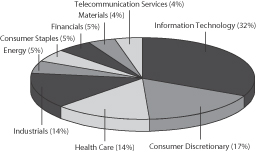 | ||
| 1. | The ten largest equity holdings are calculated based on the value of the securities divided by total net assets of the Fund. Holdings are subject to change and may have changed since the date specified. |
| 2. | Sector distribution is subject to change and is calculated based on the total long-term investments of the Fund. |
Table of Contents
| Performance Highlights (Unaudited) | Wells Fargo Advantage VT Omega Growth Fund | 5 |
AVERAGE ANNUAL TOTAL RETURN3 (%) (AS OF JUNE 30, 2012)
| Expense Ratios4 | ||||||||||||||||||||||||||||
| Inception Date | 6 Months* | 1 Year | 5 Year | 10 Year | Gross | Net5 | ||||||||||||||||||||||
Class 1 | 03/06/1997 | 13.04 | 0.29 | 6.39 | 8.22 | 0.80% | 0.75% | |||||||||||||||||||||
Class 2 | 07/31/2002 | 12.86 | 0.06 | 6.11 | 7.95 | 1.05% | 1.00% | |||||||||||||||||||||
Russell 3000® Growth Index6 | 9.98 | 5.05 | 2.79 | 6.13 | ||||||||||||||||||||||||
| * | Returns for periods of less than one year are not annualized. |
Figures quoted represent past performance, which is no guarantee of future results and do not reflect the deduction of taxes that a shareholder may pay on fund distributions or the redemption of fund shares. Investment return and principal value of an investment will fluctuate so that an investor’s shares, when redeemed, may be worth more or less than their original cost. Current performance may be lower or higher than the performance data quoted and assumes the reinvestment of dividends and capital gains. Current month-end performance is available by calling 1-866-765-0778. Performance figures of the Fund do not reflect fees charged pursuant to the terms of variable life insurance policies and variable annuity contracts.
Index returns do not include transaction costs associated with buying and selling securities, any mutual fund fees or expenses or any taxes. It is not possible to invest directly in an index.
Stock fund values fluctuate in response to the activities of individual companies and general market and economic conditions. Certain investment strategies tend to increase the total risk of an investment (relative to the broader market). This Fund is exposed to smaller company securities risk. Consult the Fund’s prospectus for additional information on these and other risks.
Please refer to the prospectus provided by your participating insurance company for detailed information describing the separate accounts for information regarding surrender charges, mortality and expense risk fees and other charges that may be assessed by the participating insurance companies.
| 3. | Performance shown for Class 2 shares prior to its inception reflects the performance of Class 1 shares, adjusted to reflect the higher expenses applicable to Class 2 shares. Historical performance shown for all classes of the Fund prior to July 19, 2010 is based on the performance of the Fund’s predecessor, Evergreen VA Omega Fund. |
| 4. | Reflects the expense ratios as stated in the most recent prospectuses. |
| 5. | The Adviser has committed through July 18, 2013 to waive fees and/or reimburse expenses to the extent necessary to cap the Fund’s Total Annual Fund Operating Expenses After Fee Waiver, excluding certain expenses, at the amounts shown above. Without this cap, the Fund’s returns would have been lower. |
| 6. | The Russell 3000® Growth Index measures the performance of those Russell 3000 Index companies with higher price-to-book ratios and higher forecasted growth values. The stocks in this index are also members of either the Russell 1000® Growth Index or the Russell 2000® Growth Index. You cannot invest directly in an index. |
Table of Contents
| 6 | Wells Fargo Advantage VT Omega Growth Fund | Fund Expenses (Unaudited) |
As a shareholder of the Fund, you incur ongoing costs, including management fees, distribution (12b-1) fees, and other Fund expenses. This example is intended to help you understand your ongoing costs (in dollars) of investing in the Fund and to compare these costs with the ongoing costs of investing in other mutual funds.
The example is based on an investment of $1,000 invested at the beginning of the six-month period and held for the entire period from January 1, 2012 to June 30, 2012.
Actual Expenses
The “Actual” line of the table below provides information about actual account values and actual expenses. You may use the information in this line, together with the amount you invested, to estimate the expenses that you paid over the period. Simply divide your account value by $1,000 (for example, an $8,600 account value divided by $1,000 = 8.6), then multiply the result by the number in the “Actual” line under the heading entitled “Expenses Paid During Period” for your applicable class of shares to estimate the expenses you paid on your account during this period.
Hypothetical Example for Comparison Purposes
The “Hypothetical” line of the table below provides information about hypothetical account values and hypothetical expenses based on the Fund’s actual expense ratio and an assumed rate of return of 5% per year before expenses, which is not the Fund’s actual return. The hypothetical account values and expenses may not be used to estimate the actual ending account balance or expenses you paid for the period. You may use this information to compare the ongoing costs of investing in the Fund and other funds. To do so, compare this 5% hypothetical example with the 5% hypothetical examples that appear in the shareholder reports of the other funds.
Please note that the expenses shown in the table are meant to highlight your ongoing costs only and do not reflect any separate account charges assessed by participating insurance companies. Therefore, the “Hypothetical” line of the table is useful in comparing ongoing costs only, and will not help you determine the relative total costs of owning different funds. In addition, if these separate account charges assessed by participating insurance companies were included, your costs would have been higher.
| Beginning Account Value 01-01-2012 | Ending Account Value 06-30-2012 | Expenses Paid During the Period1 | Net Annual Expense Ratio | |||||||||||||
Class 1 | ||||||||||||||||
Actual | $ | 1,000.00 | $ | 1,130.43 | $ | 3.97 | 0.75 | % | ||||||||
Hypothetical (5% return before expenses) | $ | 1,000.00 | $ | 1,021.13 | $ | 3.77 | 0.75 | % | ||||||||
Class 2 | ||||||||||||||||
Actual | $ | 1,000.00 | $ | 1,128.56 | $ | 5.29 | 1.00 | % | ||||||||
Hypothetical (5% return before expenses) | $ | 1,000.00 | $ | 1,019.89 | $ | 5.02 | 1.00 | % | ||||||||
| 1. | Expenses paid is equal to the annualized expense ratio of each class multiplied by the average account value over the period, multiplied by the number of days in the most recent fiscal half-year divided by the number of days in the fiscal year (to reflect the one-half year period). |
Table of Contents
| Portfolio of Investments—June 30, 2012 (Unaudited) | Wells Fargo Advantage VT Omega Growth Fund | 7 |
| Security Name | Shares | Value | ||||||||||
Common Stocks: 98.77% | ||||||||||||
Consumer Discretionary: 16.74% | ||||||||||||
| Auto Components: 1.97% | ||||||||||||
BorgWarner Incorporated Ǡ | 17,675 | $ | 1,159,303 | |||||||||
Delphi Automotive plc ADR † | 41,320 | 1,053,660 | ||||||||||
| 2,212,963 | ||||||||||||
|
| |||||||||||
| Hotels, Restaurants & Leisure : 1.70% | ||||||||||||
Starbucks Corporation | 35,747 | 1,906,030 | ||||||||||
|
| |||||||||||
| Internet & Catalog Retail: 1.66% | ||||||||||||
Priceline.com Incorporated † | 2,800 | 1,860,656 | ||||||||||
|
| |||||||||||
| Media: 2.74% | ||||||||||||
CBS Corporation Class B | 37,950 | 1,244,001 | ||||||||||
Discovery Communications Incorporated † | 36,630 | 1,834,797 | ||||||||||
| 3,078,798 | ||||||||||||
|
| |||||||||||
| Multiline Retail: 2.56% | ||||||||||||
Dollar General Corporation † | 52,995 | 2,882,398 | ||||||||||
|
| |||||||||||
| Specialty Retail: 3.99% | ||||||||||||
GNC Holdings Incorporated Class A | 31,800 | 1,246,560 | ||||||||||
Limited Brands Incorporated | 41,355 | 1,758,828 | ||||||||||
Ulta Salon, Cosmetics & Fragrance Incorporated | 15,800 | 1,475,404 | ||||||||||
| 4,480,792 | ||||||||||||
|
| |||||||||||
| Textiles, Apparel & Luxury Goods: 2.12% | ||||||||||||
lululemon athletica incorporated Ǡ | 19,785 | 1,179,780 | ||||||||||
Under Armour Incorporated † | 12,800 | 1,198,565 | ||||||||||
| 2,378,345 | ||||||||||||
|
| |||||||||||
Consumer Staples: 4.70% | ||||||||||||
| Beverages: 1.27% | ||||||||||||
Monster Beverage Corporation † | 20,040 | 1,426,848 | ||||||||||
|
| |||||||||||
| Food & Staples Retailing: 1.67% | ||||||||||||
Whole Foods Market Incorporated | 19,700 | 1,877,804 | ||||||||||
|
| |||||||||||
| Food Products: 1.76% | ||||||||||||
Mead Johnson & Company | 17,050 | 1,372,696 | ||||||||||
The Hershey Company | 8,446 | 605,088 | ||||||||||
| 1,977,784 | ||||||||||||
|
| |||||||||||
Energy: 5.02% | ||||||||||||
| Energy Equipment & Services: 1.69% | ||||||||||||
Ensco International plc ADR | 16,670 | 782,990 | ||||||||||
Schlumberger Limited | 17,140 | 1,112,557 | ||||||||||
| 1,895,547 | ||||||||||||
|
| |||||||||||
The accompanying notes are an integral part of these financial statements.
Table of Contents
| 8 | Wells Fargo Advantage VT Omega Growth Fund | Portfolio of Investments—June 30, 2012 (Unaudited) |
| Security Name | Shares | Value | ||||||||||
| Oil, Gas & Consumable Fuels: 3.33% | ||||||||||||
Pioneer Natural Resources Company « | 15,775 | $ | 1,391,513 | |||||||||
Plains Exploration & Production Company † | 18,200 | 640,276 | ||||||||||
The Williams Companies Incorporated | 59,170 | 1,705,279 | ||||||||||
| 3,737,068 | ||||||||||||
|
| |||||||||||
Financials: 4.65% | ||||||||||||
| Consumer Finance: 3.58% | ||||||||||||
Capital One Financial Corporation | 21,715 | 1,186,942 | ||||||||||
Visa Incorporated Class A | 22,890 | 2,829,891 | ||||||||||
| 4,016,833 | ||||||||||||
|
| |||||||||||
| Real Estate Management & Development: 1.07% | ||||||||||||
CBRE Group Incorporated † | 73,690 | 1,205,568 | ||||||||||
|
| |||||||||||
Health Care: 14.12% | ||||||||||||
| Biotechnology: 4.71% | ||||||||||||
Alexion Pharmaceuticals Incorporated † | 20,492 | 2,034,856 | ||||||||||
BioMarin Pharmaceutical Incorporated Ǡ | 37,125 | 1,469,408 | ||||||||||
Gilead Sciences Incorporated † | 34,780 | 1,783,518 | ||||||||||
| 5,287,782 | ||||||||||||
|
| |||||||||||
| Health Care Equipment & Supplies: 1.48% | ||||||||||||
Intuitive Surgical Incorporated Ǡ | 3,000 | 1,661,370 | ||||||||||
|
| |||||||||||
| Health Care Providers & Services: 1.16% | ||||||||||||
Humana Incorporated | 16,835 | 1,303,702 | ||||||||||
|
| |||||||||||
| Health Care Technology: 1.71% | ||||||||||||
Cerner Corporation Ǡ | 23,250 | 1,921,845 | ||||||||||
|
| |||||||||||
| Pharmaceuticals: 5.06% | ||||||||||||
Abbott Laboratories | 22,175 | 1,429,622 | ||||||||||
Allergan Incorporated « | 18,400 | 1,703,288 | ||||||||||
Novo Nordisk A/S ADR | 8,660 | 1,258,644 | ||||||||||
Shire plc ADR | 14,875 | 1,285,051 | ||||||||||
| 5,676,605 | ||||||||||||
|
| |||||||||||
Industrials: 14.07% | ||||||||||||
| Aerospace & Defense: 3.73% | ||||||||||||
Precision Castparts Corporation | 12,200 | 2,006,778 | ||||||||||
TransDigm Group Incorporated † | 16,280 | 2,186,404 | ||||||||||
| 4,193,182 | ||||||||||||
|
| |||||||||||
| Airlines: 1.47% | ||||||||||||
Copa Holdings SA | 20,000 | 1,649,599 | ||||||||||
|
| |||||||||||
| Electrical Equipment: 0.74% | ||||||||||||
Rockwell Automation Incorporated | 12,490 | 825,089 | ||||||||||
|
| |||||||||||
The accompanying notes are an integral part of these financial statements.
Table of Contents
| Portfolio of Investments—June 30, 2012 (Unaudited) | Wells Fargo Advantage VT Omega Growth Fund | 9 |
| Security Name | Shares | Value | ||||||||||
| Machinery: 3.07% | ||||||||||||
Caterpillar Incorporated | 13,055 | $ | 1,108,500 | |||||||||
Chart Industries Incorporated Ǡ | 17,960 | 1,234,930 | ||||||||||
Cummins Incorporated | 11,364 | 1,101,285 | ||||||||||
| 3,444,715 | ||||||||||||
|
| |||||||||||
| Road & Rail: 2.87% | ||||||||||||
Hertz Global Holdings Incorporated Ǡ | 84,300 | 1,079,040 | ||||||||||
Kansas City Southern | 30,875 | 2,147,665 | ||||||||||
| 3,226,705 | ||||||||||||
|
| |||||||||||
| Trading Companies & Distributors: 2.19% | ||||||||||||
W.W. Grainger Incorporated « | 6,187 | 1,183,202 | ||||||||||
WESCO International Incorporated Ǡ | 22,095 | 1,271,567 | ||||||||||
| 2,454,769 | ||||||||||||
|
| |||||||||||
Information Technology: 31.68% | ||||||||||||
| Communications Equipment : 1.48% | ||||||||||||
QUALCOMM Incorporated | 29,870 | 1,663,162 | ||||||||||
|
| |||||||||||
| Computers & Peripherals: 8.65% | ||||||||||||
Apple Incorporated † | 16,630 | 9,711,920 | ||||||||||
|
| |||||||||||
| Internet Software & Services: 7.93% | ||||||||||||
eBay Incorporated † | 62,250 | 2,615,123 | ||||||||||
ExactTarget Incorporated Ǡ | 28,296 | 618,551 | ||||||||||
F5 Networks Incorporated † | 11,500 | 1,144,940 | ||||||||||
Google Incorporated Class A † | 5,800 | 3,364,406 | ||||||||||
MercadoLibre Incorporated | 15,300 | 1,159,740 | ||||||||||
| 8,902,760 | ||||||||||||
|
| |||||||||||
| IT Services: 4.18% | ||||||||||||
Cognizant Technology Solutions Corporation Class A † | 26,445 | 1,586,700 | ||||||||||
Gartner Incorporated † | 39,909 | 1,718,082 | ||||||||||
Teradata Incorporated † | 19,300 | 1,389,793 | ||||||||||
| 4,694,575 | ||||||||||||
|
| |||||||||||
| Semiconductors & Semiconductor Equipment: 2.19% | ||||||||||||
ARM Holdings plc ADR | 44,625 | 1,061,629 | ||||||||||
Broadcom Corporation Class A | 41,200 | 1,392,560 | ||||||||||
| 2,454,189 | ||||||||||||
|
| |||||||||||
| Software: 7.25% | ||||||||||||
Autodesk Incorporated † | 41,695 | 1,458,908 | ||||||||||
BroadSoft Incorporated Ǡ | 35,690 | 1,033,582 | ||||||||||
Check Point Software Technologies Limited Ǡ | 20,957 | 1,039,258 | ||||||||||
Citrix Systems Incorporated † | 17,370 | 1,458,038 | ||||||||||
CommVault Systems Incorporated † | 19,400 | 961,658 | ||||||||||
Red Hat Incorporated † | 11,200 | 632,576 | ||||||||||
The accompanying notes are an integral part of these financial statements.
Table of Contents
| 10 | Wells Fargo Advantage VT Omega Growth Fund | Portfolio of Investments—June 30, 2012 (Unaudited) |
| Security Name | Shares | Value | ||||||||||||
| Software (continued) | ||||||||||||||
TIBCO Software Incorporated † | 52,190 | $ | 1,561,525 | |||||||||||
| 8,145,545 | ||||||||||||||
|
| |||||||||||||
Materials: 4.34% | ||||||||||||||
| Chemicals: 4.34% | ||||||||||||||
Airgas Incorporated | 28,400 | 2,385,884 | ||||||||||||
Monsanto Company | 30,115 | 2,492,920 | ||||||||||||
| 4,878,804 | ||||||||||||||
|
| |||||||||||||
Telecommunication Services: 3.45% | ||||||||||||||
| Wireless Telecommunication Services: 3.45% | ||||||||||||||
Crown Castle International Corporation † | 35,245 | 2,067,472 | ||||||||||||
SBA Communications Corporation Class A † | 31,660 | 1,806,203 | ||||||||||||
| 3,873,675 | ||||||||||||||
|
| |||||||||||||
Total Common Stocks (Cost $90,730,682) | 110,907,427 | |||||||||||||
|
| |||||||||||||
| Principal | ||||||||||||||
| Other: 0.05% | ||||||||||||||
Gryphon Funding Limited, Pass-Through Entity (a)(i)(v) | $ | 180,390 | 48,705 | |||||||||||
|
| |||||||||||||
Total Other (Cost $22,330) | 48,705 | |||||||||||||
|
| |||||||||||||
| Yield | Shares | |||||||||||||
| Short-Term Investments: 13.40% | ||||||||||||||
| Investment Companies: 13.40% | ||||||||||||||
Wells Fargo Advantage Cash Investment Money Market Fund, Select Class (l)(u) | 0.15 | % | 1,694,461 | 1,694,461 | ||||||||||
Wells Fargo Securities Lending Cash Investments, LLC (v)(l)(u)(r) | 0.19 | 13,355,020 | 13,355,020 | |||||||||||
Total Short-Term Investments (Cost $15,049,481) | 15,049,481 | |||||||||||||
|
| |||||||||||||
| Total Investments in Securities | ||||||||
| (Cost $105,802,493) * | 112.22 | % | 126,005,613 | |||||
Other Assets and Liabilities, Net | (12.22 | ) | (13,719,416 | ) | ||||
|
|
|
| |||||
| Total Net Assets | 100.00 | % | $ | 112,286,197 | ||||
|
|
|
|
| « | All or a portion of this security is on loan. |
| † | Non-income earning security |
| (a) | Security is fair valued by the Management Valuation Team, and in certain instances by the Board of Trustees, in accordance with procedures approved by the Board of Trustees. |
| (i) | Illiquid security |
| (v) | Security represents investment of cash collateral received from securities on loan. |
| (l) | Investment in an affiliate |
| (u) | Rate shown is the 7-day annualized yield at period end. |
| (r) | The investment company is exempt from registration under Section 3(c)(7) of the 1940 Act. |
| * | Cost for federal income tax purposes is $105,953,987 and net unrealized appreciation (depreciation) consists of: |
Gross unrealized appreciation | $ | 23,084,511 | ||
Gross unrealized depreciation | (3,032,885 | ) | ||
|
| |||
Net unrealized appreciation | $ | 20,051,626 |
The accompanying notes are an integral part of these financial statements.
Table of Contents
| Statement of Assets and Liabilities—June 30, 2012 (Unaudited) | Wells Fargo Advantage VT Omega Growth Fund | 11 |
Assets | ||||
Investments | ||||
In unaffiliated securities (including securities on loan), at value (see cost below) | $ | 110,956,132 | ||
In affiliated securities, at value (see cost below) | 15,049,481 | |||
|
| |||
Total investments, at value (see cost below) | 126,005,613 | |||
Receivable for investments sold | 1,580,743 | |||
Receivable for Fund shares sold | 31,648 | |||
Receivable for dividends | 29,809 | |||
Receivable for securities lending income | 1,900 | |||
Prepaid expenses and other assets | 800 | |||
|
| |||
Total assets | 127,650,513 | |||
|
| |||
Liabilities | ||||
Payable for investments purchased | 1,803,653 | |||
Payable for Fund shares redeemed | 50,630 | |||
Payable upon receipt of securities loaned | 13,377,350 | |||
Advisory fee payable | 47,689 | |||
Distribution fees payable | 13,334 | |||
Due to other related parties | 12,564 | |||
Accrued expenses and other liabilities | 59,096 | |||
|
| |||
Total liabilities | 15,364,316 | |||
|
| |||
Total net assets | $ | 112,286,197 | ||
|
| |||
NET ASSETS CONSIST OF | ||||
Paid-in capital | $ | 87,547,477 | ||
Undistributed net investment loss | (171,133 | ) | ||
Accumulated net realized gains on investments | 4,706,733 | |||
Net unrealized gains on investments | 20,203,120 | |||
|
| |||
Total net assets | $ | 112,286,197 | ||
|
| |||
COMPUTATION OF NET ASSET VALUE PER SHARE1 | ||||
Net assets – Class 1 | $ | 48,692,480 | ||
Shares outstanding – Class 1 | 1,892,034 | |||
Net asset value per share – Class 1 | $25.74 | |||
Net assets – Class 2 | $ | 63,593,717 | ||
Shares outstanding – Class 2 | 2,506,955 | |||
Net asset value per share – Class 2 | $25.37 | |||
Investments in unaffiliated securities, at cost | $ | 90,753,012 | ||
|
| |||
Investments in affiliated securities, at cost | $ | 15,049,481 | ||
|
| |||
Total investments, at cost | $ | 105,802,493 | ||
|
| |||
Securities on loan, at value | $ | 13,088,859 | ||
|
| |||
| 1. | The Fund has an unlimited number of authorized shares. |
The accompanying notes are an integral part of these financial statements.
Table of Contents
| 12 | Wells Fargo Advantage VT Omega Growth Fund | Statement of Operations—Six Months Ended June 30, 2012 (Unaudited) |
Investment income | ||||
Dividends * | $ | 351,132 | ||
Securities lending income, net | 9,463 | |||
Income from affiliated securities | 920 | |||
|
| |||
Total investment income | 361,515 | |||
|
| |||
Expenses | ||||
Advisory fee | 325,341 | |||
Administration fees | ||||
Fund level | 29,576 | |||
Class 1 | 19,637 | |||
Class 2 | 27,686 | |||
Distribution fees | ||||
Class 2 | 86,518 | |||
Custody and accounting fees | 8,492 | |||
Professional fees | 20,719 | |||
Shareholder report expenses | 32,176 | |||
Trustees’ fees and expenses | 6,894 | |||
Other fees and expenses | 2,205 | |||
|
| |||
Total expenses | 559,244 | |||
Less: Fee waivers and/or expense reimbursements | (29,079 | ) | ||
|
| |||
Net expenses | 530,165 | |||
|
| |||
Net investment loss | (168,650 | ) | ||
|
| |||
REALIZED AND UNREALIZED GAINS (LOSSES) ON INVESTMENTS | ||||
Net realized gains on investments | 7,101,975 | |||
Net change in unrealized gains (losses) on investments | 7,668,677 | |||
|
| |||
Net realized and unrealized gains (losses) on investments | 14,770,652 | |||
|
| |||
Net increase in net assets resulting from operations | $ | 14,602,002 | ||
|
| |||
* Net of foreign dividend withholding taxes of | $552 | |||
The accompanying notes are an integral part of these financial statements.
Table of Contents
| Statements of Changes in Net Assets | Wells Fargo Advantage VT Omega Growth Fund | 13 |
Six Months Ended June 30, 2012 (Unaudited) | Year Ended December 31, 2011 | |||||||||||||||
Operations | ||||||||||||||||
Net investment loss | $ | (168,650 | ) | $ | (537,404 | ) | ||||||||||
Net realized gains on investments | 7,101,975 | 10,208,867 | ||||||||||||||
Net change in unrealized gains (losses) on investments | 7,668,677 | (16,548,843 | ) | |||||||||||||
|
|
|
|
|
|
|
| |||||||||
Net increase (decrease) in net assets resulting from operations | 14,602,002 | (6,877,380 | ) | |||||||||||||
|
|
|
|
|
|
|
| |||||||||
Distributions to shareholders from | ||||||||||||||||
Net realized gains | ||||||||||||||||
Class 1 | 0 | (478,304 | ) | |||||||||||||
Class 2 | 0 | (638,543 | ) | |||||||||||||
|
|
|
|
|
|
|
| |||||||||
Total distributions to shareholders | 0 | (1,116,847 | ) | |||||||||||||
|
|
|
|
|
|
|
| |||||||||
Capital share transactions | Shares | Shares | ||||||||||||||
Proceeds from shares sold | ||||||||||||||||
Class 1 | 179,302 | 4,644,253 | 475,258 | 11,982,674 | ||||||||||||
Class 2 | 48,411 | 1,230,938 | 258,675 | 6,051,791 | ||||||||||||
|
|
|
|
|
|
|
| |||||||||
| 5,875,191 | 18,034,465 | |||||||||||||||
|
|
|
|
|
|
|
| |||||||||
Reinvestment of distributions | ||||||||||||||||
Class 1 | 0 | 0 | 18,928 | 478,304 | ||||||||||||
Class 2 | 0 | 0 | 25,582 | 638,543 | ||||||||||||
|
|
|
|
|
|
|
| |||||||||
| 0 | 1,116,847 | |||||||||||||||
|
|
|
|
|
|
|
| |||||||||
Payment for shares redeemed | ||||||||||||||||
Class 1 | (275,972 | ) | (7,096,943 | ) | (741,540 | ) | (17,562,839 | ) | ||||||||
Class 2 | (511,486 | ) | (13,143,427 | ) | (782,129 | ) | (19,014,915 | ) | ||||||||
|
|
|
|
|
|
|
| |||||||||
| (20,240,370 | ) | (36,577,754 | ) | |||||||||||||
|
|
|
|
|
|
|
| |||||||||
Net decrease in net assets resulting from capital share transactions | (14,365,179 | ) | (17,426,442 | ) | ||||||||||||
|
|
|
|
|
|
|
| |||||||||
Total increase (decrease) in net assets | 236,823 | (25,420,669 | ) | |||||||||||||
|
|
|
|
|
|
|
| |||||||||
Net assets | ||||||||||||||||
Beginning of period | 112,049,374 | 137,470,043 | ||||||||||||||
|
|
|
|
|
|
|
| |||||||||
End of period | $ | 112,286,197 | $ | 112,049,374 | ||||||||||||
|
|
|
|
|
|
|
| |||||||||
Undistributed net investment loss | $ | (171,133 | ) | $ | (2,483 | ) | ||||||||||
|
|
|
|
|
|
|
| |||||||||
The accompanying notes are an integral part of these financial statements.
Table of Contents
| 14 | Wells Fargo Advantage VT Omega Growth Fund | Financial Highlights |
(For a share outstanding throughout each period)
Six Months Ended (Unaudited) | Year Ended December 31, | |||||||||||||||||||||||
| Class 1 | 2011 | 20101 | 20091 | 20081 | 20071 | |||||||||||||||||||
Net asset value, beginning of period | $ | 22.78 | $ | 24.26 | $ | 20.42 | $ | 14.43 | $ | 19.82 | $ | 17.80 | ||||||||||||
Net investment income (loss) | (0.01 | ) | (0.06 | ) | 0.03 | 0.13 | 0.23 | 0.08 | ||||||||||||||||
Net realized and unrealized gains (losses) on investments | 2.97 | (1.21 | ) | 3.98 | 6.09 | (5.62 | ) | 2.05 | ||||||||||||||||
|
|
|
|
|
|
|
|
|
|
|
| |||||||||||||
Total from investment operations | 2.96 | (1.27 | ) | 4.01 | 6.22 | (5.39 | ) | 2.13 | ||||||||||||||||
Distributions to shareholders from | ||||||||||||||||||||||||
Net investment income | 0.00 | 0.00 | (0.17 | ) | (0.23 | ) | 0.00 | (0.11 | ) | |||||||||||||||
Net realized gains | 0.00 | (0.21 | ) | 0.00 | 0.00 | 0.00 | 0.00 | |||||||||||||||||
|
|
|
|
|
|
|
|
|
|
|
| |||||||||||||
Total distributions to shareholders | 0.00 | (0.21 | ) | (0.17 | ) | (0.23 | ) | 0.00 | (0.11 | ) | ||||||||||||||
Net asset value, end of period | $ | 25.74 | $ | 22.78 | $ | 24.26 | $ | 20.42 | $ | 14.43 | $ | 19.82 | ||||||||||||
Total return | 13.04 | % | (5.36 | )% | 19.79 | % | 43.97 | % | (27.19 | )% | 11.96 | % | ||||||||||||
Ratios to average net assets (annualized) | ||||||||||||||||||||||||
Gross expenses | 0.80 | % | 0.80 | % | 0.75 | % | 0.76 | % | 0.72 | % | 0.71 | % | ||||||||||||
Net expenses | 0.75 | % | 0.75 | % | 0.74 | % | 0.76 | % | 0.72 | % | 0.71 | % | ||||||||||||
Net investment income (loss) | (0.14 | )% | (0.27 | )% | 0.01 | % | 0.86 | % | 1.11 | % | 0.32 | % | ||||||||||||
Supplemental data | ||||||||||||||||||||||||
Portfolio turnover rate | 56 | % | 110 | % | 160 | % | 28 | % | 46 | % | 31 | % | ||||||||||||
Net assets, end of period (000’s omitted) | $48,692 | $45,293 | $54,246 | $59,807 | $35,952 | $67,773 | ||||||||||||||||||
| 1. | After the close of business on July 16, 2010, the Fund acquired the net assets of Evergreen VA Omega Fund and Wells Fargo Advantage VT Large Company Growth Fund. Evergreen VA Omega Fund became the accounting and performance survivor in the transaction. The information for the periods prior to July 19, 2010 is that of Class 1 of Evergreen VA Omega Fund. |
The accompanying notes are an integral part of these financial statements.
Table of Contents
| Financial Highlights | Wells Fargo Advantage VT Omega Growth Fund | 15 |
(For a share outstanding throughout each period)
Six Months Ended (Unaudited) | Year Ended December 31, | |||||||||||||||||||||||
| Class 2 | 2011 | 20101 | 20091 | 20081 | 20071 | |||||||||||||||||||
Net asset value, beginning of period | $ | 22.48 | $ | 24.00 | $ | 20.19 | $ | 14.25 | $ | 19.63 | $ | 17.62 | ||||||||||||
Net investment income (loss) | (0.07 | ) | (0.14 | ) | (0.07 | )2 | 0.11 | 0.15 | 0.01 | |||||||||||||||
Net realized and unrealized gains (losses) on investments | 2.96 | (1.17 | ) | 3.99 | 6.00 | (5.53 | ) | 2.05 | ||||||||||||||||
|
|
|
|
|
|
|
|
|
|
|
| |||||||||||||
Total from investment operations | 2.89 | (1.31 | ) | 3.92 | 6.11 | (5.38 | ) | 2.06 | ||||||||||||||||
Distributions to shareholders from | ||||||||||||||||||||||||
Net investment income | 0.00 | 0.00 | (0.11 | ) | (0.17 | ) | 0.00 | (0.05 | ) | |||||||||||||||
Net realized gains | 0.00 | (0.21 | ) | 0.00 | 0.00 | 0.00 | 0.00 | |||||||||||||||||
|
|
|
|
|
|
|
|
|
|
|
| |||||||||||||
Total distributions to shareholders | 0.00 | (0.21 | ) | (0.11 | ) | (0.17 | ) | 0.00 | (0.05 | ) | ||||||||||||||
Net asset value, end of period | $ | 25.37 | $ | 22.48 | $ | 24.00 | $ | 20.19 | $ | 14.25 | $ | 19.63 | ||||||||||||
Total return | 12.86 | % | (5.54 | )% | 19.48 | % | 43.58 | % | (27.41 | )% | 11.74 | % | ||||||||||||
Ratios to average net assets (annualized) | ||||||||||||||||||||||||
Gross expenses | 1.05 | % | 1.05 | % | 1.01 | % | 1.00 | % | 0.97 | % | 0.96 | % | ||||||||||||
Net expenses | 1.00 | % | 1.00 | % | 1.00 | % | 1.00 | % | 0.97 | % | 0.96 | % | ||||||||||||
Net investment income (loss) | (0.39 | )% | (0.52 | )% | (0.34 | )% | 0.63 | % | 0.86 | % | 0.07 | % | ||||||||||||
Supplemental data | ||||||||||||||||||||||||
Portfolio turnover rate | 56 | % | 110 | % | 160 | % | 28 | % | 46 | % | 31 | % | ||||||||||||
Net assets, end of period (000’s omitted) | $63,594 | $66,756 | $83,224 | $33,196 | $22,910 | $38,137 | ||||||||||||||||||
| 1. | After the close of business on July 16, 2010, the Fund acquired the net assets of Evergreen VA Omega Fund and Wells Fargo Advantage VT Large Company Growth Fund. Evergreen VA Omega Fund became the accounting and performance survivor in the transaction. The information for the periods prior to July 19, 2010 is that of Class 2 of Evergreen VA Omega Fund. |
| 2. | Calculated based upon average shares outstanding |
The accompanying notes are an integral part of these financial statements.
Table of Contents
| 16 | Wells Fargo Advantage VT Omega Growth Fund | Notes to Financial Statements (Unaudited) |
1. ORGANIZATION
Wells Fargo Variable Trust (the “Trust”), a Delaware statutory trust organized on March 10, 1999, is an open-end management investment company registered under the Investment Company Act of 1940, as amended (the “1940 Act”). These financial statements report on Wells Fargo Advantage VT Omega Growth Fund (the “Fund”) which is a diversified series of the Trust.
2. SIGNIFICANT ACCOUNTING POLICIES
The following significant accounting policies, which are consistently followed in the preparation of the financial statements of the Fund, are in conformity with U.S. generally accepted accounting principles which require management to make estimates and assumptions that affect the reported amounts of assets and liabilities, disclosure of contingent assets and liabilities at the date of the financial statements, and the reported amounts of revenues and expenses during the reporting period. Actual results could differ from those estimates.
Securities valuation
Investments in equity securities are valued each business day as of the close of regular trading on the New York Stock Exchange, which is usually 4:00 p.m. (Eastern Time). Securities which are traded on a national or foreign securities exchange are valued at the last reported sales price, except that securities listed on The Nasdaq Stock Market, Inc. (“Nasdaq”) are valued at the Nasdaq Official Closing Price (“NOCP”), and if no NOCP is available, then at the last reported sales price. If no sales price is shown on the Nasdaq, the bid price will be used. In the absence of any sale of securities listed on the Nasdaq, and in the case of other securities (including U.S. Government obligations, but excluding debt securities maturing in 60 days or less), the price will be deemed “stale” and the valuations will be determined in accordance with the Fund’s Valuation Procedures.
Investments in open-end mutual funds and non-registered investment companies are fair valued at net asset value.
Investments which are not valued using any of the methods discussed above, are valued at their fair value, as determined by procedures established in good faith and approved by the Board of Trustees. The Board of Trustees has established a Valuation Committee comprised of the Trustees and has delegated to it the authority to take any actions regarding the valuation of portfolio securities that the Valuation Committee deems necessary in determining the fair value of portfolio securities, unless the responsibility has been delegated to the Management Valuation Team of Wells Fargo Funds Management, LLC (“Funds Management”). The Board of Trustees retains the authority to make or ratify any valuation decisions or approve any changes to the Valuation Procedures as it deems appropriate. On a quarterly basis, the Board of Trustees considers for ratification any valuation actions taken by the Valuation Committee or the Management Valuation Team.
Valuations of fair valued securities are compared to the next actual sales price when available, or other appropriate market information to assess the continued appropriateness of the fair valuation methodology used. These securities are fair valued on a day-to-day basis, taking into consideration changes to appropriate market information and any significant changes to the input factors considered in the valuation process until there is a readily available price provided on the exchange or by an independent pricing service. Valuations received from an independent pricing service or broker quotes are periodically validated by comparisons to most recent trades and valuations provided by other independent pricing services in addition to the review of prices by the adviser and/or sub-adviser. Unobservable inputs used in determining fair valuations are identified based on the type of security, taking into consideration factors utilized by market participants in valuing the investment, knowledge about the issuer and the current market environment.
Security loans
The Fund may lend its securities from time to time in order to earn additional income in the form of fees or interest on securities received as collateral or the investment of any cash received as collateral. The Fund continues to receive interest or dividends on the securities loaned. The Fund receives collateral in the form of cash or securities with a value at least equal to the value of the securities on loan. The value of the loaned securities is determined at the close of each business day and any additional required collateral is delivered to the Fund on the next business day. In a securities lending transaction, the net asset value of the Fund will be affected by an increase or decrease in the value of the securities loaned and by an increase or decrease in the value of the instrument in which collateral is invested. The amount of securities lending activity undertaken by the Fund fluctuates from time to time. In the event of default or bankruptcy
Table of Contents
| Notes to Financial Statements (Unaudited) | Wells Fargo Advantage VT Omega Growth Fund | 17 |
by the borrower, the Fund may be prevented from recovering the loaned securities or gaining access to the collateral or may experience delays or costs in doing so. In addition, the investment of any cash collateral received may lose all or part of its value. The Fund has the right under the lending agreement to recover the securities from the borrower on demand.
The Fund lends its securities through an unaffiliated securities lending agent. Cash collateral received in connection with its securities lending transactions is invested in Wells Fargo Securities Lending Cash Investments, LLC (the “Cash Collateral Fund”). The Cash Collateral Fund is exempt from registration under Section 3(c)(7) of the 1940 Act and is managed by Funds Management and is sub-advised by Wells Capital Management Incorporated (“Wells Capital Management”). Funds Management receives an advisory fee starting at 0.05% and declining to 0.01% as the average daily net assets of the Cash Collateral Fund increase. All of the fees received by Funds Management are paid to Wells Capital Management for its services as sub-adviser. The Cash Collateral Fund seeks to provide a positive return compared to the daily Fed Funds Open rate by investing in high-quality, U.S. dollar-denominated short-term money market instruments. Cash Collateral Fund investments are fair valued based upon the amortized cost valuation technique. Income earned from investment in the Cash Collateral Fund is included in securities lending income on the Statement of Operations.
Security transactions and income recognition
Securities transactions are recorded on a trade date basis. Realized gains or losses are reported on the basis of identified cost of securities delivered.
Dividend income is recognized on the ex-dividend date. Dividend income from foreign securities is recorded net of foreign taxes withheld where recovery of such taxes is not assured.
Distributions to shareholders
Distributions to shareholders from net investment income and net realized gains, if any, are recorded on the ex-dividend date. Such distributions are determined in conformity with income tax regulations, which may differ from generally accepted accounting principles.
Federal and other taxes
The Fund intends to continue to qualify as a regulated investment company by distributing substantially all of its investment company taxable income and any net realized capital gains (after reduction for capital loss carryforwards) sufficient to relieve it from all, or substantially all, federal income taxes. Accordingly, no provision for federal income taxes was required.
The Fund’s income and federal excise tax returns and all financial records supporting those returns for the prior three fiscal years are subject to examination by the federal and Delaware revenue authorities. Management has analyzed the Fund’s tax positions taken on federal, state, and foreign tax returns for all open tax years and does not believe that there are any uncertain tax positions that require recognition of a tax liability.
Under the recently enacted Regulated Investment Company Modernization Act of 2010, the Fund is permitted to carry forward capital losses incurred in taxable years which began after December 22, 2010 for an unlimited period. However, any losses incurred are required to be utilized prior to the losses incurred in pre-enactment taxable years. As a result of this ordering rule, pre-enactment capital loss carryforwards may be more likely to expire unused. Post-enactment capital losses that are carried forward will retain their character as either short-term or long-term capital losses rather than be considered all short-term as under previous law. In addition, the Fund may elect to defer any portion of a post-October capital loss or qualified late-year ordinary loss to the first day of the following taxable year. A post-October capital loss is the greatest of the net capital loss, net short-term capital loss or net long-term capital loss for the portion of the taxable year after October 31. A qualified late-year ordinary loss is the net loss comprised of (a) net gain or loss from the sale or other disposition of capital assets for the portion of the taxable year after October 31, and (b) other ordinary income or loss for the portion of the taxable year after December 31.
At December 31, 2011, net capital loss carryforwards, which were available to offset future net realized capital gains, were as follows:
| Pre-enactment Capital Loss Expiration | ||||||||||||||||||
| 2012 | 2013 | 2015 | 2016 | 2017 | ||||||||||||||
| $ | 1,078,104 | $ | 1,615,063 | $ | 4,132,177 | $ | 2,303,740 | $ | 771,379 | |||||||||
Table of Contents
| 18 | Wells Fargo Advantage VT Omega Growth Fund | Notes to Financial Statements (Unaudited) |
Class allocations
The separate classes of shares offered by the Fund differ principally in distribution fees. Shareholders of each class bear certain expenses that pertain to that particular class. All shareholders bear the common expenses of the Fund, earn income from the portfolio, and are allocated unrealized gains and losses pro rata based on the average daily net assets of each class, without distinction between share classes. Dividends are determined separately for each class based on income and expenses allocable to each class. Realized gains and losses are allocated to each class pro rata based upon the net assets of each class on the date realized. Differences in per share dividend rates generally result from the relative weightings of pro rata income and realized gain allocations and from differences in separate class expenses, including distribution fees.
3. FAIR VALUATION MEASUREMENTS
Fair value measurements of investments are determined within a framework that has established a fair value hierarchy based upon the various data inputs utilized in determining the value of the Fund’s investments. The three-level hierarchy gives the highest priority to unadjusted quoted prices in active markets for identical assets or liabilities (Level 1) and the lowest priority to significant unobservable inputs (Level 3). The Fund’s investments are classified within the fair value hierarchy based on the lowest level of input that is significant to the fair value measurement. The inputs are summarized into three broad levels as follows:
| n | Level 1 – quoted prices in active markets for identical securities |
| n | Level 2 – other significant observable inputs (including quoted prices for similar securities, interest rates, prepayment speeds, credit risk, etc.) |
| n | Level 3 – significant unobservable inputs (including the Fund’s own assumptions in determining the fair value of investments) |
The inputs or methodologies used for valuing securities are not necessarily an indication of the risk associated with investing in those securities.
As of June 30, 2012, the inputs used in valuing the Fund’s assets, which are carried at fair value, were as follows:
| Investments in Securities | Quoted Prices (Level 1) | Significant Other Observable Inputs (Level 2) | Significant Unobservable Inputs (Level 3) | Total | ||||||||||||
Equity securities | ||||||||||||||||
Common stocks | $ | 110,907,427 | $ | 0 | $ | 0 | $ | 110,907,427 | ||||||||
Other | 0 | 0 | 48,705 | 48,705 | ||||||||||||
Short-term investments | ||||||||||||||||
Investment companies | 1,694,461 | 13,355,020 | 0 | 15,049,481 | ||||||||||||
| $ | 112,601,888 | $ | 13,355,020 | $ | 48,705 | $ | 126,005,613 | |||||||||
Further details on the major security types listed above can be found in the Portfolio of Investments.
Transfers in and transfers out are recognized at the end of the reporting period. For the six months ended June 30, 2012, the Fund did not have any transfers into/out of Level 1 and Level 2.
4. TRANSACTIONS WITH AFFILIATES AND OTHER EXPENSES
Advisory fee
The Trust has entered into an advisory contract with Funds Management, an indirect wholly owned subsidiary of Wells Fargo & Company (“Wells Fargo”). The adviser is responsible for implementing investment policies and guidelines and for supervising the sub-adviser, who is responsible for day-to-day portfolio management of the Fund.
Pursuant to the contract, Funds Management is entitled to receive an annual advisory fee starting at 0.55% and declining to 0.40% as the average daily net assets of the Fund increase. For the six months ended June 30, 2012, the advisory fee was equivalent to an annual rate of 0.55% of the Fund’s average daily net assets.
Table of Contents
| Notes to Financial Statements (Unaudited) | Wells Fargo Advantage VT Omega Growth Fund | 19 |
Funds Management has retained the services of a sub-adviser to provide daily portfolio management to the Fund. The fee for sub-advisory services is borne by Funds Management. Wells Capital Management, an affiliate of Funds Management, is the sub-adviser to the Fund and is entitled to receive a fee from Funds Management at an annual rate starting at 0.35% and declining to 0.15% as the average daily net assets of the Fund increase.
Administration and transfer agent fees
The Trust has entered into an administration agreement with Funds Management. Under this agreement, for providing administrative services, which includes paying fees and expenses for services provided by the transfer agent, sub-transfer agents, omnibus account servicers and record-keepers, Funds Management is entitled to receive from the Fund an annual fund level administration fee starting at 0.05% and declining to 0.03% as the average daily net assets of the Fund increase and a class level administration fee of 0.08% of the average daily net assets of each class.
Funds Management has contractually waived and/or reimbursed advisory and administration fees to the extent necessary to maintain certain net operating expense ratios for the Fund. Waiver of fees and/or reimbursement of expenses by Funds Management were made first from fund level expenses on a proportionate basis and then from class specific expenses. Funds Management has committed through July 18, 2013 to waive fees and/or reimburse expenses to the extent necessary to cap the Fund’s expenses at 0.75% for Class 1 and 1.00% for Class 2.
Distribution fees
The Trust has adopted a Distribution Plan for Class 2 shares of the Fund pursuant to Rule 12b-1 under the 1940 Act. Distribution fees are charged to Class 2 shares and paid to Wells Fargo Funds Distributor, LLC, the principal underwriter, at an annual rate of 0.25% of its average daily net assets.
5. INVESTMENT PORTFOLIO TRANSACTIONS
Purchases and sales of investments, excluding U.S. Government obligations (if any) and short-term securities, for the six months ended June 30, 2012 were $64,991,135 and $78,285,013, respectively.
6. BANK BORROWINGS
The Trust and Wells Fargo Funds Trust (excluding the money market funds) are parties to a $150,000,000 revolving credit agreement with State Street Bank and Trust Company, whereby the Fund is permitted to use bank borrowings for temporary or emergency purposes, such as to fund shareholder redemption requests. Interest under the credit agreement is charged to the Fund based on a borrowing rate equal to the higher of the Federal Funds rate in effect on that day plus 1.25% or the overnight LIBOR rate in effect on that day plus 1.25%. In addition, an annual commitment fee equal to 0.10% of the unused balance is allocated to each participating fund. For the six months ended June 30, 2012, the Fund paid $111 in commitment fees.
For the six months ended June 30, 2012, there were no borrowings by the Fund under the agreement.
7. INDEMNIFICATION
Under the Trust’s organizational documents, the officers and directors are indemnified against certain liabilities that may arise out of performance of their duties to the Trust. Additionally, in the normal course of business, the Trust may enter into contracts with service providers that contain a variety of indemnification clauses. The Trust’s maximum exposure under these arrangements is dependent on future claims that may be made against the Fund and, therefore, cannot be estimated.
8. NEW ACCOUNTING PRONOUNCEMENT
In December 2011, the Financial Accounting Standards Board (“FASB”) issued Accounting Standard Update (“ASU”) No. 2011-11, Disclosures about Offsetting Assets and Liabilities. ASU 2011-11, which amends FASB ASC Topic 210, Balance Sheet, creates new disclosure requirements which require entities to disclose both gross and net information for derivatives and other financial instruments that are either offset in the Statement of Assets and Liabilities or subject to an enforceable master netting arrangement or similar agreement. The disclosure requirements are effective for interim and annual reporting periods beginning on or after January 1, 2013. Management is currently assessing the potential impact, in addition to expanded financial statement disclosure, that may result from adopting this ASU.
Table of Contents
| 20 | Wells Fargo Advantage VT Omega Growth Fund | Notes to Financial Statements (Unaudited) |
9. SUBSEQUENT DISTRIBUTIONS
On July 12, 2012, the Fund declared distributions from short-term capital gains and long-term capital gains to shareholders of record on July 11, 2012. The per share amounts payable on July 13, 2012 were as follows:
Short-term Capital Gains | Long-term Capital Gains | |||||||
Class 1 | $ | 0.5535 | $ | 1.20933 | ||||
Class 2 | 0.5535 | 1.20933 | ||||||
These distributions are not reflected in the accompanying financial statements.
Table of Contents
| Other Information (Unaudited) | Wells Fargo Advantage VT Omega Growth Fund | 21 |
PROXY VOTING INFORMATION
A description of the policies and procedures that the Fund uses to determine how to vote proxies relating to portfolio securities is available without charge, upon request, by calling 1-800-222-8222, visiting our Web site at wellsfargoadvantagefunds.com, or visiting the SEC Web site at sec.gov. Information regarding how the Fund voted proxies relating to portfolio securities during the most recent 12-month period ended June 30 is available without charge on the Fund’s Web site at wellsfargoadvantagefunds.com or by visiting the SEC Web site at sec.gov.
PORTFOLIO HOLDINGS INFORMATION
The complete portfolio holdings for the Fund are publicly available on the Fund’s Web site (wellsfargoadvantagefunds.com) on a monthly, 30-day or more delayed basis. In addition, top ten holdings information for the Fund is publicly available on the Fund’s Web site on a monthly, seven-day or more delayed basis. The Fund files its complete schedule of portfolio holdings with the SEC for the first and third quarters of each fiscal year on Form N-Q, which is available without charge by visiting the SEC Web site at sec.gov. In addition, the Fund’s Form N-Q may be reviewed and copied at the SEC’s Public Reference Room in Washington, DC, and at regional offices in New York City, at 233 Broadway, and in Chicago, at 175 West Jackson Boulevard, Suite 900. Information about the Public Reference Room may be obtained by calling 1-800-SEC-0330.
Table of Contents
| 22 | Wells Fargo Advantage VT Omega Growth Fund | Other Information (Unaudited) |
BOARD OF TRUSTEES AND OFFICERS
Each of the Trustees and Officers listed in the table below acts in identical capacities for the Wells Fargo Advantage family of funds, which consists of 138 funds comprising the Wells Fargo Funds Trust, Wells Fargo Variable Trust, Wells Fargo Master Trust and four closed-end funds (collectively the “Fund Complex”). This table should be read in conjunction with the Prospectus and the Statement of Additional Information1. All of the Trustees are also Members of the Audit and Governance Committees of each Trust in the Fund Complex. The mailing address of each Trustee and Officer is 525 Market Street, 12th Floor, San Francisco, CA 94105. Each Trustee and Officer serves an indefinite term, however, each Trustee serves such term until reaching the mandatory retirement age established by the Trustees.
Independent Trustees
Name and Year of Birth | Position Held and Length of Service* | Principal Occupations During Past Five Years | Other Directorships During | |||
| Peter G. Gordon (Born 1942) | Trustee, since 1998; Chairman, since 2005 (Lead Trustee since 2001) | Co-Founder, Retired Chairman, President and CEO of Crystal Geyser Water Company. Trustee Emeritus, Colby College | Asset Allocation Trust | |||
| Isaiah Harris, Jr. (Born 1952) | Trustee, since 2009 | Retired. Prior thereto, President and CEO of BellSouth Advertising and Publishing Corp. from 2005 to 2007, President and CEO of BellSouth Enterprises from 2004 to 2005 and President of BellSouth Consumer Services from 2000 to 2003. Emeritus member of the Iowa State University Foundation Board of Governors. Emeritus Member of the Advisory Board of Iowa State University School of Business. Mr. Harris is a certified public accountant. | CIGNA Corporation; Deluxe Corporation; Asset Allocation Trust | |||
| Judith M. Johnson (Born 1949) | Trustee, since 2008 | Retired. Prior thereto, Chief Executive Officer and Chief Investment Officer of Minneapolis Employees Retirement Fund from 1996 to 2008. Ms. Johnson is an attorney, certified public accountant and a certified managerial accountant. | Asset Allocation Trust | |||
| Leroy Keith, Jr. (Born 1939) | Trustee, since 2010 | Chairman, Bloc Global Services (development and construction). Trustee of the Evergreen Funds from 1983 to 2010. Former Managing Director, Almanac Capital Management (commodities firm), former Partner, Stonington Partners, Inc. (private equity fund), former Director, Obagi Medical Products Co. and former Director, Lincoln Educational Services. | Trustee, Virtus Fund Complex (consisting of 40 portfolios as of 12/31/11); Asset Allocation Trust | |||
| David F. Larcker (Born 1950) | Trustee, since 2009 | James Irvin Miller Professor of Accounting at the Graduate School of Business, Stanford University, Director of Corporate Governance Research Program and Senior Faculty of The Rock Center for Corporate Governance since 2006. From 2005 to 2008, Professor of Accounting at the Graduate School of Business, Stanford University. Prior thereto, Ernst & Young Professor of Accounting at The Wharton School, University of Pennsylvania from 1985 to 2005. | Asset Allocation Trust | |||
| Olivia S. Mitchell (Born 1953) | Trustee, since 2006 | International Foundation of Employee Benefit Plans Professor, Wharton School of the University of Pennsylvania since 1993. Director of Wharton’s Pension Research Council and Boettner Center on Pensions & Retirement Research, and Research Associate at the National Bureau of Economic Research. Previously, Cornell University Professor from 1978 to 1993. | Asset Allocation Trust | |||
| Timothy J. Penny (Born 1951) | Trustee, since 1996 | President and CEO of Southern Minnesota Initiative Foundation, a non-profit organization, since 2007 and Senior Fellow at the Humphrey Institute Policy Forum at the University of Minnesota since 1995. Member of the Board of Trustees of NorthStar Education Finance, Inc., a non-profit organization, since 2007. | Asset Allocation Trust |
Table of Contents
| Other Information (Unaudited) | Wells Fargo Advantage VT Omega Growth Fund | 23 |
Name and Year of Birth | Position Held and Length of Service* | Principal Occupations During Past Five Years | Other Directorships During | |||
| Michael S. Scofield (Born 1943) | Trustee, since 2010 | Served on the Investment Company Institute’s Board of Governors and Executive Committee from 2008-2011 as well the Governing Council of the Independent Directors Council from 2006-2011 and the Independent Directors Council Executive Committee from 2008-2011. Chairman of the IDC from 2008-2010. Institutional Investor (Fund Directions) Trustee of Year in 2007. Trustee of the Evergreen Funds (and its predecessors) from 1984 to 2010. Chairman of the Evergreen Funds from 2000-2010. Former Trustee of the Mentor Funds. Retired Attorney, Law Offices of Michael S. Scofield and former Director and Chairman, Branded Media Corporation (multi-media branding company). | Asset Allocation Trust | |||
| Donald C. Willeke (Born 1940) | Trustee, since 1996 | Principal of the law firm of Willeke & Daniels. General Counsel of the Minneapolis Employees Retirement Fund from 1984 until its consolidation into the Minnesota Public Employees Retirement Association on June 30, 2010. Director and Vice Chair of The Free Trust (non-profit corporation). Director of the American Chestnut Foundation (non-profit corporation). | Asset Allocation Trust |
| * | Length of service dates reflect the Trustee’s commencement of service with the Trust’s predecessor entities, where applicable. |
Officers
Name and Year of Birth | Position Held and Length of Service | Principal Occupations During Past Five Years | ||||
| Karla M. Rabusch (Born 1959) | President, since 2003 | Executive Vice President of Wells Fargo Bank, N.A. and President of Wells Fargo Funds Management, LLC since 2003. Senior Vice President and Chief Administrative Officer of Wells Fargo Funds Management, LLC from 2001 to 2003. | ||||
| C. David Messman (Born 1960) | Secretary, since 2000; Chief Legal Officer, since 2003 | Senior Vice President and Secretary of Wells Fargo Funds Management, LLC since 2001. Vice President and Managing Senior Counsel of Wells Fargo Bank, N.A. since 1996. | ||||
Nancy Wiser (Born 1967) | Treasurer, since 2012 | Executive Vice President of Wells Fargo Funds Management, LLC since 2011. Chief Operating Officer and Chief Compliance Officer at LightBox Capital Management LLC, from 2008 to 2011. Owned and operated a consulting business providing services to various hedge funds including acting as Chief Operating Officer and Chief Compliance Officer for a hedge fund from 2007 to 2008. Chief Operating Officer and Chief Compliance Officer of GMN Capital LLC from 2006 to 2007. | ||||
| David Berardi (Born 1975) | Assistant Treasurer, since 2009 | Vice President of Wells Fargo Funds Management, LLC since 2009. Vice President of Evergreen Investment Management Company, LLC from 2008 to 2010. Assistant Vice President of Evergreen Investment Services, Inc. from 2004 to 2008. Manager of Fund Reporting and Control for Evergreen Investment Management Company, LLC from 2004 to 2010. | ||||
| Jeremy DePalma (Born 1974) | Assistant Treasurer, since 2009 | Senior Vice President of Wells Fargo Funds Management, LLC since 2009. Senior Vice President of Evergreen Investment Management Company, LLC from 2008 to 2010. Vice President, Evergreen Investment Services, Inc. from 2004 to 2007. Head of the Fund Reporting and Control Team within Fund Administration from 2005 to 2010. | ||||
| Debra Ann Early (Born 1964) | Chief Compliance Officer, since 2007 | Chief Compliance Officer of Wells Fargo Funds Management, LLC since 2007. Chief Compliance Officer of Parnassus Investments from 2005 to 2007. Chief Financial Officer of Parnassus Investments from 2004 to 2007 and Senior Audit Manager of PricewaterhouseCoopers LLP from 1998 to 2004. |
| 1. | The Statement of Additional Information includes additional information about the Trustees and is available, without charge, upon request, by calling 1-800-222-8222 or by visiting the Web site at wellsfargoadvantagefunds.com. |
Table of Contents
| 24 | Wells Fargo Advantage VT Omega Growth Fund | Other Information (Unaudited) |
BOARD CONSIDERATION OF INVESTMENT ADVISORY AND SUB-ADVISORY AGREEMENTS:
Under Section 15 of the Investment Company Act of 1940 (the “1940 Act”), the Board of Trustees (the “Board”) of Wells Fargo Funds Trust (the “Trust”), all the members of which have no direct or indirect interest in the investment advisory and sub-advisory agreements and are not “interested persons” of the Trust, as defined in the 1940 Act (the “Independent Trustees”), must determine whether to approve the continuation of the Trust’s investment advisory and sub-advisory agreements. In this regard, at an in person meeting held on March 29-30, 2012 (the “Meeting”), the Board reviewed and re-approved: (i) an investment advisory agreement with Wells Fargo Funds Management, LLC (“Funds Management”) for Wells Fargo Advantage VT Omega Growth Fund (the “Fund”) and (ii) an investment sub-advisory agreement with Wells Capital Management Incorporated (“Wells Capital Management”) for the Fund. The investment advisory agreement with Funds Management and the investment sub-advisory agreement with Wells Capital Management are collectively referred to as the “Advisory Agreements.”
At the Meeting, the Board considered the factors and reached the conclusions described below relating to the selection of Funds Management and Wells Capital Management and the continuation of the Advisory Agreements. Prior to the Meeting, the Trustees conferred extensively among themselves and with representatives of Funds Management about these matters. The Board also met throughout the year and received information that was useful to them in considering the continuation of the Advisory Agreements. The Independent Trustees were assisted in their evaluation of the Advisory Agreements by independent legal counsel, from whom they received separate legal advice and with whom they met separately from Funds Management.
In providing information to the Board, Funds Management and Wells Capital Management were guided by a detailed set of requests submitted by the Independent Trustees’ independent legal counsel on their behalf at the start of the Board’s annual contract renewal process earlier in 2012. In approving the Advisory Agreements, the Board did not identify any particular information or consideration that was all-important or controlling, and each Trustee likely attributed different weights to various factors.
Nature, extent and quality of services
The Board received and considered various information regarding the nature, extent and quality of services provided to the Fund by Funds Management and Wells Capital Management under the Advisory Agreements. The Board also received and considered, among other things, information about the background and experience of senior management of Funds Management, and the qualifications, backgrounds, tenures and responsibilities of the portfolio managers primarily responsible for the day-to-day portfolio management of the Fund.
The Board evaluated the ability of Funds Management and Wells Capital Management, based on their respective financial condition, resources, reputation and other attributes, to attract and retain qualified investment professionals, including research, advisory, and supervisory personnel. The Board further considered the compliance programs and compliance records of Funds Management and Wells Capital Management. In addition, the Board took into account the administrative services provided to the Fund by Funds Management and its affiliates.
The Board’s decision to approve the continuation of the Advisory Agreements was based on a comprehensive evaluation of information provided to it. In considering these matters, the Board considered not only the specific information presented in connection with the Meeting, but also the knowledge gained over time through interaction with Funds Management and Wells Capital Management about various topics, including Funds Management’s oversight of service providers. The above factors, together with those referenced below, are some of the most important, but not necessarily all, factors considered by the Board in concluding that the nature, extent and quality of the investment advisory services provided to the Fund by Funds Management and Wells Capital Management supported the re-approval of the Advisory Agreements. Although the Board considered the continuation of the Advisory Agreements for the Fund as part of the larger process of considering the continuation of the advisory agreements for all of the funds in the complex, its decision to continue the Advisory Agreements for the Fund was ultimately made on a fund-by-fund basis.
Fund performance and expenses
The Board considered the performance results for the Fund over various time periods ended December 31, 2011. The Board also considered these results in comparison to the median performance of a universe of relevant funds (the “Universe”) that was determined by Lipper Inc. (“Lipper”) to be similar to the Fund, and in comparison to the Fund’s
Table of Contents
| Other Information (Unaudited) | Wells Fargo Advantage VT Omega Growth Fund | 25 |
benchmark index and to other comparative data. Lipper is an independent provider of investment company data. The Board received a description of the methodology used by Lipper to select the mutual funds in the Universe. The Board noted that the performance of the Fund was higher than or in range of the median performance of the Universe for all periods under review, except for the one-year performance period. The Board also noted that the performance of the Fund was higher than its benchmark, the Lipper VUF Multi-Cap Growth Funds Index, for the periods under review, except for the one-year period.
The Board received and considered information regarding the Fund’s contractual advisory fee and net operating expense ratios and their various components, including actual management fees (which reflect fee waivers, if any), transfer agent, custodian and other non-management fees, Rule 12b-1 and non-Rule 12b-1 fees, service fees and fee waiver and expense reimbursement arrangements. The Board also considered these ratios in comparison to the median ratios of an expense Universe and a narrower expense group of mutual funds (each, an “Expense Group”) that was determined by Lipper to be similar to the Fund. The Board received a description of the methodology used by Lipper to select the mutual funds in the Fund’s Expense Group. The Board noted that the net operating expense ratio of the Fund was lower than the Fund’s Expense Group’s median net operating expense ratio.
Based on the above-referenced considerations and other factors, the Board concluded that the overall performance and expense structure of the Fund supported the re-approval of the Advisory Agreements for the Fund.
Investment advisory and sub-advisory fee rates
The Board reviewed and considered the contractual investment advisory fee rate that is payable by the Fund to Funds Management for investment advisory services (the “Advisory Agreement Rate”), both on a stand-alone basis and on a combined basis with the Fund’s administration fee rate. The Board took into account the separate administrative and other services covered by the administration fee rate. The Board also reviewed and considered the contractual investment sub-advisory fee rate that is payable by Funds Management to Wells Capital Management for investment sub-advisory services (the “Sub-Advisory Agreement Rate”). In addition, the Board reviewed and considered the existing fee waiver/cap arrangements applicable to the Advisory Agreement Rate and considered the Advisory Agreement Rate after taking the waivers/caps into account (the “Net Advisory Rate”).
The Board received and considered information comparing the Advisory Agreement Rate and Net Advisory Rate, combined with the administration fee rates, with those of other funds in the Fund’s Expense Group median. The Board noted that the Advisory Agreement Rate and Net Advisory Rate for the Fund were lower than or in range of the median rates for the Fund’s Expense Group.
The Board also received and considered information about the nature and extent of services offered and fee rates charged by Funds Management and Wells Capital Management to other types of clients. In this regard, the Board received information about differences between the services, and the compliance, reporting, and other legal burdens and risks of providing investment advice to mutual funds and those associated with providing advice to non-mutual fund clients such as collective funds or institutional separate accounts.
The Board determined that the Advisory Agreement Rate for the Fund, both with and without the administration fee rate and before and after waivers, was reasonable in light of the Fund’s Expense Group information, the net expense ratio commitments, the services covered by the Advisory Agreements and other information provided. The Board also reviewed and considered the Sub-Advisory Agreement Rate and concluded that the Sub-Advisory Agreement Rate was reasonable in light of the services covered by the Sub-Advisory Agreement and other information provided.
Profitability
The Board received and considered a profitability analysis of Funds Management, as well as an analysis of the profitability to the collective Wells Fargo businesses that provide services to the Fund. It considered that the information provided to it was necessarily estimated, and that the profitability information provided to it, especially on a fund-by-fund basis, did not necessarily provide a precise tool for evaluating the appropriateness of the Fund’s Advisory Agreement Rate in isolation. It noted that the levels of profitability reported on a fund-by-fund basis varied widely, depending on, among other things, the size and type of fund. The Board concluded that the profitability reported by Funds Management was not unreasonable.
Table of Contents
| 26 | Wells Fargo Advantage VT Omega Growth Fund | Other Information (Unaudited) |
The Board did not consider separate profitability information with respect to Wells Capital Management, because, as an affiliate of Funds Management, its profitability information was subsumed in the collective Wells Fargo profitability analysis provided by Funds Management.
Economies of scale
With respect to possible economies of scale, the Board reviewed the breakpoints in the Fund’s advisory fee and/or administration fee structure, which operate generally to reduce the expenses of the Fund (as a percentage of Fund assets) as the Fund grows in size. It considered that, as a fund shrinks in size, breakpoints conversely result in increasing fee levels. The Board noted that it would have on-going opportunities to review the appropriate levels of breakpoints in the future, and concluded that the breakpoints as implemented appeared to be a reasonable step toward sharing economies of scale, if any, with the Fund. However, the Board acknowledged the inherent limitations of any analysis of economies of scale and of any attempt to correlate breakpoints with such economies, stemming largely from the Board’s understanding that economies of scale are realized, if at all, across a variety of products and services, not just with respect to a single fund.
Other benefits to Funds Management and Wells Capital Management
The Board received and considered information regarding potential “fall-out” or ancillary benefits received by Funds Management and its affiliates, including Wells Capital Management, as a result of their relationship with the Fund. Ancillary benefits could include, among others, benefits directly attributable to the relationship of Funds Management and Wells Capital Management with the Fund and benefits potentially derived from an increase in Funds Management’s and Wells Capital Management’s business as a result of their relationship with the Fund (such as the ability to market to shareholders other financial products offered by Funds Management and its affiliates, including Wells Capital Management).
The Board considered that Wells Fargo Funds Distributor, LLC, an affiliate of Funds Management, serves as distributor to the Fund and receives certain compensation for those services. The Board noted that various financial institutions, including affiliates of Funds Management, may receive distribution-related fees, shareholder servicing payments (including amounts derived from payments under Rule 12b-1 plans) and sub-transfer agency fees in respect of shares sold or held through them and services provided.
The Board also reviewed information about whether and to what extent soft dollar credits are sought and how any such credits are utilized and any benefits that may be realized by using an affiliated broker.
Other factors and broader review
The Board also considered the markets for distribution of the Fund’s shares, including the channels through which the Fund’s shares are offered and sold. The Board noted that the Fund is part of one of the few fund families that have both direct-to-fund and intermediary distribution channels. As discussed above, the Board reviews detailed materials received from Funds Management and Wells Capital Management annually as part of the re-approval process under Section 15 of the 1940 Act and also reviews and assesses information about the quality of the services that the Fund receives throughout the year. In this regard, the Board has reviewed reports of Funds Management at each of its quarterly meetings, which include, among other things, portfolio reviews and performance reports. In addition, the Board confers with portfolio managers at various times throughout the year.
Conclusion
After considering the above-described factors and based on its deliberations and its evaluation of the information described above, the Board unanimously approved the continuation of the Advisory Agreements for an additional one-year period.
Table of Contents
| List of Abbreviations | Wells Fargo Advantage VT Omega Growth Fund | 27 |
The following is a list of common abbreviations for terms and entities which may have appeared in this report.
| ACB | — Agricultural Credit Bank |
| ADR | — American Depository Receipt |
| ADS | — American Depository Shares |
| AGC-ICC | — Assured Guaranty Corporation - Insured Custody Certificates |
| AGM | — Assured Guaranty Municipal |
| AMBAC | — American Municipal Bond Assurance Corporation |
| AMT | — Alternative Minimum Tax |
| AUD | — Australian Dollar |
| BAN | — Bond Anticipation Notes |
| BHAC | — Berkshire Hathaway Assurance Corporation |
| BRL | — Brazil Real |
| CAB | — Capital Appreciation Bond |
| CAD | — Canadian Dollar |
| CCAB | — Convertible Capital Appreciation Bond |
| CDA | — Community Development Authority |
| CDO | — Collateralized Debt Obligation |
| CHF | — Swiss Franc |
| COP | — Certificate of Participation |
| CR | — Custody Receipts |
| DKK | — Danish Krone |
| DRIVER | — Derivative Inverse Tax-Exempt Receipts |
| DW&P | — Department of Water & Power |
| DWR | — Department of Water Resources |
| ECFA | — Educational & Cultural Facilities Authority |
| EDA | — Economic Development Authority |
| EDFA | — Economic Development Finance Authority |
| ETF | — Exchange-Traded Fund |
| EUR | — Euro |
| FFCB | — Federal Farm Credit Bank |
| FGIC | — Financial Guaranty Insurance Corporation |
| FGLMC | — Federal Government Loan Mortgage Company |
| FHA | — Federal Housing Authority |
| FHLB | — Federal Home Loan Bank |
| FHLMC | — Federal Home Loan Mortgage Corporation |
| FICO | — The Financing Corporation |
| FNMA | — Federal National Mortgage Association |
| FSA | — Farm Service Agency |
| GBP | — Great British Pound |
| GDR | — Global Depository Receipt |
| GNMA | — Government National Mortgage Association |
| GO | — General Obligation |
| HCFR | — Healthcare Facilities Revenue |
| HEFA | — Health & Educational Facilities Authority |
| HEFAR | — Higher Education Facilities Authority Revenue |
| HFA | — Housing Finance Authority |
| HFFA | — Health Facilities Financing Authority |
| HKD | — Hong Kong Dollar |
| HUF | — Hungarian Forint |
| IBC | — Insured Bond Certificate |
| IDA | — Industrial Development Authority |
| IDAG | — Industrial Development Agency |
| IDR | — Industrial Development Revenue |
| IEP | — Irish Pound |
| JPY | — Japanese Yen |
| KRW | — Republic of Korea Won |
| LIBOR | — London Interbank Offered Rate |
| LIQ | — Liquidity Agreement |
| LLC | — Limited Liability Company |
| LLP | — Limited Liability Partnership |
| LOC | — Letter of Credit |
| LP | — Limited Partnership |
| MBIA | — Municipal Bond Insurance Association |
| MFHR | — Multi-Family Housing Revenue |
| MSTR | — Municipal Securities Trust Receipts |
| MTN | — Medium Term Note |
| MUD | — Municipal Utility District |
| MXN | — Mexican Peso |
| MYR | — Malaysian Ringgit |
| NATL-RE | — National Public Finance Guarantee Corporation |
| NOK | — Norwegian Krone |
| NZD | — New Zealand Dollar |
| PCFA | — Pollution Control Finance Authority |
| PCR | — Pollution Control Revenue |
| PFA | — Public Finance Authority |
| PFFA | — Public Facilities Financing Authority |
| PFOTER | — Puttable Floating Option Tax-Exempt Receipts |
| plc | — Public Limited Company |
| PLN | — Polish Zloty |
| PUTTER | — Puttable Tax-Exempt Receipts |
| R&D | — Research & Development |
| RDA | — Redevelopment Authority |
| RDFA | — Redevelopment Finance Authority |
| REIT | — Real Estate Investment Trust |
| ROC | — Reset Option Certificates |
| SAVRS | — Select Auction Variable Rate Securities |
| SBA | — Small Business Authority |
| SEK | — Swedish Krona |
| SFHR | — Single Family Housing Revenue |
| SFMR | — Single Family Mortgage Revenue |
| SGD | — Singapore Dollar |
| SKK | — Slovakian Koruna |
| SPA | — Standby Purchase Agreement |
| SPDR | — Standard & Poor’s Depositary Receipts |
| STRIPS | — Separate Trading of Registered Interest and Principal Securities |
| TAN | — Tax Anticipation Notes |
| TBA | — To Be Announced |
| TIPS | — Treasury Inflation-Protected Securities |
| TRAN | — Tax Revenue Anticipation Notes |
| TCR | — Transferable Custody Receipts |
| TRY | — Turkish Lira |
| TTFA | — Transportation Trust Fund Authority |
| TVA | — Tennessee Valley Authority |
| XLCA | — XL Capital Assurance |
| ZAR | — South African Rand |
Table of Contents
This page is intentionally left blank.
Table of Contents
This page is intentionally left blank.
Table of Contents
This page is intentionally left blank.
Table of Contents


FOR MORE INFORMATION
More information about Wells Fargo Advantage Funds is available free upon request. To obtain literature, please write, e-mail, visit the Fund’s Web site, or call:
Wells Fargo Advantage Funds
P.O. Box 8266
Boston, MA 02266-8266
E-mail: wfaf@wellsfargo.com
Web site: wellsfargoadvantagefunds.com
Individual investors: 1-800-222-8222
Retail investment professionals: 1-888-877-9275
Institutional investment professionals: 1-866-765-0778
This report and the financial statements contained herein are submitted for the general information of the shareholders of Wells Fargo Advantage Funds. If this report is used for promotional purposes, distribution of the report must be accompanied or preceded by a current prospectus. For a current prospectus and, if available, a summary prospectus containing more complete information, including charges and expenses, call 1-800-222-8222 or visit the Fund’s Web site at wellsfargoadvantagefunds.com . Please consider the investment objectives, risks, charges, and expenses of the investment carefully before investing. This and other information about Wells Fargo Advantage Funds can be found in the current prospectus. Read the prospectus carefully before you invest or send money.
Wells Fargo Funds Management, LLC, a wholly owned subsidiary of Wells Fargo & Company, provides investment advisory and administrative services for Wells Fargo Advantage Funds. Other affiliates of Wells Fargo & Company provide subadvisory and other services for the Funds. The Funds are distributed by Wells Fargo Funds Distributor, LLC, Member FINRA/SIPC, an affiliate of Wells Fargo & Company.
NOT FDIC INSURED ¡ NO BANK GUARANTEE ¡ MAY LOSE VALUE
© 2012 Wells Fargo Funds Management, LLC. All rights reserved.
210666 08-12 SVT5/SAR142 06-12 |
Table of Contents

Wells Fargo Advantage VT Opportunity FundSM

Semi-Annual Report
June 30, 2012

Table of Contents
Reduce clutter. Save trees.
Sign up for electronic delivery of prospectuses and shareholder reports at wellsfargo.com/advantagedelivery
| 2 | ||||
| 4 | ||||
| 6 | ||||
| 7 | ||||
Financial Statements | ||||
| 12 | ||||
| 13 | ||||
| 14 | ||||
| 15 | ||||
| 17 | ||||
| 23 | ||||
| 29 | ||||
The views expressed and any forward-looking statements are as of June 30, 2012, unless otherwise noted, and are those of the Fund managers and/or Wells Fargo Funds Management, LLC. Discussions of individual securities, or the markets generally, or any Wells Fargo Advantage Fund are not intended as individual recommendations. Future events or results may vary significantly from those expressed in any forward-looking statements; the views expressed are subject to change at any time in response to changing circumstances in the market. Wells Fargo Funds Management, LLC, disclaims any obligation to publicly update or revise any views expressed or forward-looking statements.
NOT FDIC INSURED ¡ NO BANK GUARANTEE ¡ MAY LOSE VALUE
Table of Contents

WELLS FARGO INVESTMENT HISTORY
| 1932 | Keystone creates one of the first mutual fund families. | |
| 1971 | Wells Fargo & Company introduces one of the first institutional index funds. | |
| 1978 | Wells Fargo applies Markowitz and Sharpe’s research on Modern Portfolio Theory to introduce one of the industry’s first Tactical Asset Allocation (TAA) models in institutional separately managed accounts. | |
| 1984 | Wells Fargo Stagecoach Funds launches its first asset allocation fund. | |
| 1989 | The Tactical Asset Allocation (TAA) Model is first applied to Wells Fargo’s asset allocation mutual funds. | |
| 1994 | Wells Fargo introduces the LifePath Funds, one of the first suites of target date funds (now the Wells Fargo Advantage Dow Jones Target Date FundsSM). | |
| 1996 | Evergreen Investments and Keystone Funds merge. | |
| 1997 | Wells Fargo launches Wells Fargo Advantage WealthBuilder PortfoliosSM, a fund-of-funds suite of products that includes the use of quantitative models to shift assets among investment styles. | |
| 1999 | Norwest Advantage Funds and Stagecoach Funds are reorganized into Wells Fargo Funds after the merger of Norwest and Wells Fargo. | |
| 2002 | Evergreen Retail and Evergreen Institutional companies form the umbrella asset management company, Evergreen Investments. | |
| 2005 | The integration of Strong Funds with Wells Fargo Funds creates Wells Fargo Advantage Funds, resulting in one of the top 20 mutual fund companies in the United States. | |
| 2006 | Wells Fargo Advantage Funds relaunches the target date product line as Wells Fargo Advantage Dow Jones Target Date Funds. | |
| 2010 | The mergers and reorganizations of Evergreen and Wells Fargo Advantage mutual funds are completed, unifying the families under the brand of Wells Fargo Advantage Funds. | |
Wells Fargo Advantage Funds®
Wells Fargo Advantage Funds skillfully guides institutions, financial advisors, and individuals through the investment terrain to help them reach their financial objectives. Everything we do on behalf of investors is backed by our unique combination of qualifications.
Strength
Our organization is built on the standards of integrity and service established by our parent company—Wells Fargo & Company—more than 150 years ago. And, because we’re part of a highly diversified financial enterprise, we offer the depth of resources to help investors succeed.
Expertise
Our multi-boutique model offers investors access to the independent thinking of premier investment managers that have been chosen for their time-tested strategies. While each team specializes in a specific investment strategy, collectively they provide investors a wide choice of distinct investment styles. Our dedication to investment excellence doesn’t end with our expertise in manager selection—risk management, analysis, and rigorous ongoing review seek to ensure each manager’s investment process remains consistent.
Partnership
Our collaborative approach is built around understanding the needs and goals of our clients. By adhering to core principles of sound judgment and steady guidance, we support you through every stage of the investment decision process.
Carefully consider a fund’s investment objectives, risks, charges, and expenses before investing. For a current prospectus and, if available, a summary prospectus, containing this and other information, visit wellsfargoadvantagefunds.com. Read it carefully before investing.
Wells Fargo Funds Management, LLC, a wholly owned subsidiary of Wells Fargo & Company, provides investment advisory and administrative services for Wells Fargo Advantage Funds®. Other affiliates of Wells Fargo & Company provide subadvisory and other services for the Funds. The Funds are distributed by Wells Fargo Funds Distributor, LLC, Member FINRA/SIPC, an affiliate of Wells Fargo & Company.
“Dow Jones®” and “Dow Jones Target Date IndexesSM” are service marks of Dow Jones Trademark Holdings, LLC (“Dow Jones”), have been licensed to CME Group Index Services LLC (“CME Indexes”) and have been sublicensed for use for certain purposes by Global Index Advisors, Inc, and Wells Fargo Funds Management, LLC. The Wells Fargo Advantage Dow Jones Target Date FundsSM based on the Dow Jones Target Date IndexesSM, are not sponsored, endorsed, sold or promoted by Dow Jones, CME Indexes or their respective affiliates and none of them makes any representation regarding the advisability of investing in such product(s).
NOT FDIC INSURED ¡ NO BANK GUARANTEE ¡ MAY LOSE VALUE
Not part of semi-annual report.
Table of Contents
Wells Fargo Advantage Funds offers more than 110 mutual funds across a wide range of asset classes, representing over $207 billion in assets under management, as of June 30, 2012.
| Equity Funds | ||||
Asia Pacific Fund | Enterprise Fund† | Opportunity Fund† | ||
C&B Large Cap Value Fund | Equity Value Fund | Precious Metals Fund | ||
C&B Mid Cap Value Fund | Global Opportunities Fund | Premier Large Company Growth Fund | ||
Capital Growth Fund | Growth Fund | Small Cap Opportunities Fund | ||
Common Stock Fund | Index Fund | Small Cap Value Fund | ||
Disciplined U.S. Core Fund | International Equity Fund | Small Company Growth Fund | ||
Discovery Fund† | International Value Fund | Small Company Value Fund | ||
Diversified Equity Fund | Intrinsic Small Cap Value Fund | Small/Mid Cap Core Fund | ||
Diversified International Fund | Intrinsic Value Fund | Small/Mid Cap Value Fund | ||
Diversified Small Cap Fund | Intrinsic World Equity Fund | Special Mid Cap Value Fund | ||
Emerging Growth Fund | Large Cap Core Fund | Special Small Cap Value Fund | ||
Emerging Markets Equity Fund | Large Cap Growth Fund | Specialized Technology Fund | ||
Emerging Markets Equity Income Fund | Large Company Value Fund | Traditional Small Cap Growth Fund | ||
Endeavor Select Fund† | Omega Growth Fund | Utility and Telecommunications Fund | ||
| Bond Funds | ||||
Adjustable Rate Government Fund | Inflation-Protected Bond Fund | Short-Term Bond Fund | ||
California Limited-Term Tax-Free Fund | Intermediate Tax/AMT-Free Fund | Short-Term High Yield Bond Fund | ||
California Tax-Free Fund | International Bond Fund | Short-Term Municipal Bond Fund | ||
Colorado Tax-Free Fund | Minnesota Tax-Free Fund | Strategic Municipal Bond Fund | ||
Emerging Markets Local Bond Fund | Municipal Bond Fund | Total Return Bond Fund | ||
Government Securities Fund | North Carolina Tax-Free Fund | Ultra Short-Term Income Fund | ||
High Income Fund | Pennsylvania Tax-Free Fund | Ultra Short-Term Municipal Income Fund | ||
High Yield Bond Fund | Short Duration Government Bond Fund | Wisconsin Tax-Free Fund | ||
Income Plus Fund | ||||
| Asset Allocation Funds | ||||
Absolute Return Fund | WealthBuilder Equity Portfolio† | Target 2020 Fund† | ||
Asset Allocation Fund | WealthBuilder Growth Allocation Portfolio† | Target 2025 Fund† | ||
Conservative Allocation Fund | WealthBuilder Growth Balanced Portfolio† | Target 2030 Fund† | ||
Diversified Capital Builder Fund | WealthBuilder Moderate Balanced Portfolio† | Target 2035 Fund† | ||
Diversified Income Builder Fund | WealthBuilder Tactical Equity Portfolio† | Target 2040 Fund† | ||
Growth Balanced Fund | Target Today Fund† | Target 2045 Fund† | ||
Index Asset Allocation Fund | Target 2010 Fund† | Target 2050 Fund† | ||
Moderate Balanced Fund | Target 2015 Fund† | Target 2055 Fund† | ||
WealthBuilder Conservative Allocation Portfolio† | ||||
| Money Market Funds | ||||
100% Treasury Money Market Fund | Heritage Money Market Fund† | National Tax-Free Money Market Fund | ||
California Municipal Money Market Fund | Money Market Fund | Prime Investment Money Market Fund | ||
Cash Investment Money Market Fund | Municipal Cash Management Money Market Fund | Treasury Plus Money Market Fund | ||
Government Money Market Fund | Municipal Money Market Fund | |||
| Variable Trust Funds1 | ||||
VT Discovery Fund† | VT Intrinsic Value Fund | VT Small Cap Growth Fund | ||
VT Index Asset Allocation Fund | VT Omega Growth Fund | VT Small Cap Value Fund | ||
VT International Equity Fund | VT Opportunity Fund† | VT Total Return Bond Fund |
An investment in a money market fund is not insured or guaranteed by the Federal Deposit Insurance Corporation or any other government agency. Although the Wells Fargo Advantage Money Market Funds seek to preserve the value of your investment at $1.00 per share, it is possible to lose money by investing in a money market fund.
| 1. | The Variable Trust Funds are generally available only through insurance company variable contracts. |
| † | In this report, the Wells Fargo Advantage Discovery FundSM, Wells Fargo Advantage Endeavor Select FundSM, Wells Fargo Advantage Enterprise FundSM, Wells Fargo Advantage Opportunity FundSM, Wells Fargo Advantage WealthBuilder Conservative Allocation PortfolioSM, Wells Fargo Advantage WealthBuilder Equity PortfolioSM, Wells Fargo Advantage WealthBuilder Growth Allocation PortfolioSM, Wells Fargo Advantage WealthBuilder Growth Balanced PortfolioSM, Wells Fargo Advantage WealthBuilder Moderate Balanced PortfolioSM, Wells Fargo Advantage WealthBuilder Tactical Equity PortfolioSM, Wells Fargo Advantage Dow Jones Target Today FundSM, Wells Fargo Advantage Dow Jones Target 2010 FundSM, Wells Fargo Advantage Dow Jones Target 2015 FundSM, Wells Fargo Advantage Dow Jones Target 2020 FundSM, Wells Fargo Advantage Dow Jones Target 2025 FundSM, Wells Fargo Advantage Dow Jones Target 2030 FundSM, Wells Fargo Advantage Dow Jones Target 2035 FundSM, Wells Fargo Advantage Dow Jones Target 2040 FundSM, Wells Fargo Advantage Dow Jones Target 2045 FundSM, Wells Fargo Advantage Dow Jones Target 2050 FundSM, Wells Fargo Advantage Dow Jones Target 2055 FundSM, Wells Fargo Advantage Heritage Money Market FundSM, Wells Fargo Advantage VT Discovery FundSM, and Wells Fargo Advantage VT Opportunity FundSM are referred to as the Discovery Fund, Endeavor Select Fund, Enterprise Fund, Opportunity Fund, WealthBuilder Conservative Allocation Portfolio, WealthBuilder Equity Portfolio, WealthBuilder Growth Allocation Portfolio, WealthBuilder Growth Balanced Portfolio, WealthBuilder Moderate Balanced Portfolio, WealthBuilder Tactical Equity Portfolio, Target Today Fund, Target 2010 Fund, Target 2015 Fund, Target 2020 Fund, Target 2025 Fund, Target 2030 Fund, Target 2035 Fund, Target 2040 Fund, Target 2045 Fund, Target 2050 Fund, Target 2055 Fund, Heritage Money Market Fund, VT Discovery Fund, and VT Opportunity Fund, respectively. |
Not part of semi-annual report.
Table of Contents
| 2 | Wells Fargo Advantage VT Opportunity Fund | Letter to Shareholders (Unaudited) |

Karla M. Rabusch,
President
Wells Fargo Advantage Funds
The period was marked by continued concerns about the possible global economic effects of the ongoing European sovereign debt crisis that began in Greece and later spread to the larger economies of Italy and Spain.
In contrast to worrisome data from the eurozone, U.S. economic data remained moderately positive.
Dear Valued Shareholder:
We’re pleased to offer you this semi-annual report for the Wells Fargo Advantage VT Opportunity Fund for the six-month period that ended June 30, 2012. The period was marked by continued concerns about the possible global economic effects of the ongoing European sovereign debt crisis that began in Greece and later spread to the larger economies of Italy and Spain. Widespread support from central banks helped push developed market indexes to gains despite considerable intra-period volatility.
Macroeconomic optimism faded as global growth slowed and worries rose.
Prior to and throughout the reporting period, concerns about the eurozone sovereign debt situation returned to center stage and dominated stock markets around the globe. Investors became increasingly concerned that Greece would default on its debt, a scenario that only seemed more likely as eurozone leaders began to openly discuss a “voluntary” haircut on Greek debt for private investors. Because many eurozone banks owned Greek debt and many U.S. banks had financial ties to eurozone banks, investors worried about the effects of such an event on the financial systems and on the global economy.
The Greek credit crisis was seemingly addressed in March 2012 when the Greek government came to an agreement with its creditors, allowing the country to write down the principal on most of its bonds in exchange for increased financial austerity. The Greek agreement, combined with unprecedented support for eurozone banks by the European Central Bank, seemed to calm investor concerns, at least temporarily.
By the end of the reporting period, however, the agreement seemed on the verge of unraveling. Legislative elections in May left no single party with enough seats to form a government, and none of the parties was able to form a ruling coalition. A pro-bailout party won the subsequent June elections, but the Greek economy remained so weak that investors questioned whether the country would be able to meet its economic targets from the March agreement. Even more worrisome, in May 2012, Spain nationalized Bankia, putting more than $19 billion into the bank after it suffered heavy losses from property loans. The move refocused investor attention on Spain’s weak economy and depressed property sector, and Spanish bonds sold off. Moreover, news reports indicated that Greeks and Spaniards were pulling money from their country’s banks in favor of German and Swiss banks. By mid-June, analysts were openly discussing the possibility of a crisis within the European banking system.
The U.S. economy reported relatively solid news.
In contrast to worrisome data from the eurozone, U.S. economic data remained moderately positive. Reported real gross domestic product (GDP) growth came in at an annualized rate of 3.0% in the fourth quarter of 2011 compared with the prior quarter. Real GDP growth decelerated to a 1.9% annualized rate in the first quarter of 2012 but remained solidly in positive territory. In addition, the major banks appeared to have taken steps toward repairing their balance sheets; in March, the Federal Reserve (Fed) announced that 15 of the 19 major banks had passed a “stress test” in which the Fed attempted to gauge whether the banks could survive a severe recession that included a 50% drop in the stock market and a 21% percent decline in housing prices.
Table of Contents
| Letter to Shareholders (Unaudited) | Wells Fargo Advantage VT Opportunity Fund | 3 |
The main piece of negative economic data was the unemployment rate, which remained at relatively high levels, beginning the period at 8.3% and ending it at 8.2%. Toward the end of the period, data indicated that the U.S. economy was adding fewer jobs than expected, leading to concerns that the country’s economic growth was slowing.
Major stock indexes posted positive returns.
Even though investor worries about the sovereign debt crisis within the eurozone caused considerable stock market volatility, the combination of central bank support and relatively strong U.S. economic numbers pushed major stock market indexes into the black, both for developed markets and for major emerging markets. Within the U.S., large-cap stocks modestly outperformed small-cap stocks, and growth stocks edged past value stocks.
We use time-tested investment strategies, even as many variables are at work in the market.
The full effect of the credit crisis remains unknown. Elevated unemployment and debt defaults continue to pressure consumers and businesses alike. In our experience, strict adherence to time-tested investment strategies has its rewards. As a whole, Wells Fargo Advantage Funds represents investments across a range of asset classes and investment styles, giving you an opportunity to create a diversified investment portfolio. While diversification may not prevent losses in a downturn, we believe it helps in managing risk.
Thank you for choosing to invest with Wells Fargo Advantage Funds. We appreciate your confidence in us and remain committed to helping you meet your financial needs. For current information about your fund investments, contact your investment professional, visit our Web site at wellsfargoadvantagefunds.com, or call us directly at 1-800-222-8222. We are available 24 hours a day, 7 days a week.
Sincerely,

Karla M. Rabusch
President
Wells Fargo Advantage Funds
Table of Contents
| 4 | Wells Fargo Advantage VT Opportunity Fund | Performance Highlights (Unaudited) |
INVESTMENT OBJECTIVE
The Fund seeks long-term capital appreciation.
ADVISER
Wells Fargo Funds Management, LLC
SUB-ADVISER
Wells Capital Management Incorporated
PORTFOLIO MANAGERS
Ann M. Miletti
Thomas D. Wooden, CFA
FUND INCEPTION
May 8, 1992
| TEN LARGEST EQUITY HOLDINGS1 (AS OF JUNE 30, 2012) | ||||
Praxair Incorporated | 1.99% | |||
Fifth Third Bancorp | 1.94% | |||
Health Management Associates Incorporated Class A | 1.63% | |||
Covance Incorporated | 1.58% | |||
ACE Limited | 1.56% | |||
McDermott International Incorporated | 1.53% | |||
Kroger Company | 1.51% | |||
Republic Services Incorporated | 1.50% | |||
Avago Technologies Limited | 1.49% | |||
Discovery Communications Incorporated | 1.48% | |||
| SECTOR DISTRIBUTION2 (AS OF JUNE 30, 2012) | ||
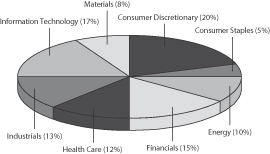 | ||
| 1. | The ten largest equity holdings are calculated based on the value of the securities divided by total net assets of the Fund. Holdings are subject to change and may have changed since the date specified. |
| 2. | Sector distribution is subject to change and is calculated based on the total long-term investments of the Fund. |
Table of Contents
| Performance Highlights (Unaudited) | Wells Fargo Advantage VT Opportunity Fund | 5 |
AVERAGE ANNUAL TOTAL RETURN3 (%) (AS OF JUNE 30, 2012)
| Expense Ratios4 | ||||||||||||||||||||||||||||
| Inception Date | 6 Months* | 1 Year | 5 Year | 10 Year | Gross | Net5 | ||||||||||||||||||||||
Class 1 | 08/26/2011 | 6.03 | (6.36 | ) | 1.16 | 7.08 | 0.82% | 0.75% | ||||||||||||||||||||
Class 2 | 05/08/1992 | 5.93 | (6.56 | ) | 1.12 | 7.05 | 1.07% | 1.00% | ||||||||||||||||||||
Russell Midcap® Index6 | 7.97 | (1.65 | ) | 1.06 | 8.45 | |||||||||||||||||||||||
| * | Returns for periods of less than one year are not annualized. |
Figures quoted represent past performance, which is no guarantee of future results and do not reflect the deduction of taxes that a shareholder may pay on fund distributions or the redemption of fund shares. Investment return and principal value of an investment will fluctuate so that an investor’s shares, when redeemed, may be worth more or less than their original cost. Current performance may be lower or higher than the performance data quoted and assumes the reinvestment of dividends and capital gains. Current month-end performance is available by calling 1-866-765-0778. Performance figures of the Fund do not reflect fees charged pursuant to the terms of variable life insurance policies and variable annuity contracts.
Index returns do not include transaction costs associated with buying and selling securities, any mutual fund fees or expenses or any taxes. It is not possible to invest directly in an index.
Stock fund values fluctuate in response to the activities of individual companies and general market and economic conditions. Smaller company stocks tend to be more volatile and less liquid than those of larger companies. The use of derivatives may reduce returns and/or increase volatility. Certain investment strategies tend to increase the total risk of an investment (relative to the broader market). This Fund is exposed to foreign investment risk. Consult the Fund’s prospectus for additional information on these and other risks.
Please refer to the prospectus provided by your participating insurance company for detailed information describing the separate accounts for information regarding surrender charges, mortality and expense risk fees and other charges that may be assessed by the participating insurance companies.
| 3. | Historical performance shown for Class 1 shares prior to their inception reflects the performance of Class 2 shares, and includes the higher expenses applicable to Class 2 shares. If these expenses had not been included, returns would be higher. |
| 4. | Reflects the expense ratios as stated in the most recent prospectuses. |
| 5. | The Adviser has committed through July 18, 2013 to waive fees and/or reimburse expenses to the extent necessary to cap the Fund’s Total Annual Fund Operating Expenses After Fee Waiver, excluding certain expenses, at the amounts shown above. Without this cap, the Fund’s returns would have been lower. |
| 6. | The Russell Midcap® Index measures the performance of the 800 smallest companies in the Russell 1000® Index, which represent approximately 25% of the total market capitalization of the Russell 1000 Index. You cannot invest directly in an index. |
Table of Contents
| 6 | Wells Fargo Advantage VT Opportunity Fund | Fund Expenses (Unaudited) |
As a shareholder of the Fund, you incur ongoing costs, including management fees, distribution (12b-1) fees, and other Fund expenses. This example is intended to help you understand your ongoing costs (in dollars) of investing in the Fund and to compare these costs with the ongoing costs of investing in other mutual funds.
The example is based on an investment of $1,000 invested at the beginning of the six-month period and held for the entire period from January 1, 2012 to June 30, 2012.
Actual Expenses
The “Actual” line of the table below provides information about actual account values and actual expenses. You may use the information in this line, together with the amount you invested, to estimate the expenses that you paid over the period. Simply divide your account value by $1,000 (for example, an $8,600 account value divided by $1,000 = 8.6), then multiply the result by the number in the “Actual” line under the heading entitled “Expenses Paid During Period” for your applicable class of shares to estimate the expenses you paid on your account during this period.
Hypothetical Example for Comparison Purposes
The “Hypothetical” line of the table below provides information about hypothetical account values and hypothetical expenses based on the Fund’s actual expense ratio and an assumed rate of return of 5% per year before expenses, which is not the Fund’s actual return. The hypothetical account values and expenses may not be used to estimate the actual ending account balance or expenses you paid for the period. You may use this information to compare the ongoing costs of investing in the Fund and other funds. To do so, compare this 5% hypothetical example with the 5% hypothetical examples that appear in the shareholder reports of the other funds.
Please note that the expenses shown in the table are meant to highlight your ongoing costs only and do not reflect any separate account charges assessed by participating insurance companies. Therefore, the “Hypothetical” line of the table is useful in comparing ongoing costs only, and will not help you determine the relative total costs of owning different funds. In addition, if these separate account charges assessed by participating insurance companies were included, your costs would have been higher.
| Beginning Account Value 01-01-2012 | Ending Account Value 06-30-2012 | Expenses Paid During the Period1 | Net Annual Expense Ratio | |||||||||||||
Class 1 | ||||||||||||||||
Actual | $ | 1,000.00 | $ | 1,060.35 | $ | 3.84 | 0.75 | % | ||||||||
Hypothetical (5% return before expenses) | $ | 1,000.00 | $ | 1,021.13 | $ | 3.77 | 0.75 | % | ||||||||
Class 2 | ||||||||||||||||
Actual | $ | 1,000.00 | $ | 1,059.26 | $ | 5.12 | 1.00 | % | ||||||||
Hypothetical (5% return before expenses) | $ | 1,000.00 | $ | 1,019.89 | $ | 5.02 | 1.00 | % | ||||||||
| 1. | Expenses paid is equal to the annualized expense ratio of each class multiplied by the average account value over the period, multiplied by the number of days in the most recent fiscal half-year divided by the number of days in the fiscal year (to reflect the one-half year period). |
Table of Contents
| Portfolio of Investments—June 30, 2012 (Unaudited) | Wells Fargo Advantage VT Opportunity Fund | 7 |
| Security Name | Shares | Value | ||||||||||
Common Stocks: 95.37% | ||||||||||||
Consumer Discretionary: 19.55% | ||||||||||||
| Diversified Consumer Services: 1.36% | ||||||||||||
K12 Incorporated †« | 135,651 | $ | 3,160,668 | |||||||||
|
| |||||||||||
| Hotels, Restaurants & Leisure: 1.39% | ||||||||||||
Carnival Corporation « | 93,955 | 3,219,838 | ||||||||||
|
| |||||||||||
| Household Durables: 1.73% | ||||||||||||
Harman International Industries Incorporated | 26,780 | 1,060,488 | ||||||||||
Whirlpool Corporation | 48,095 | 2,941,490 | ||||||||||
| 4,001,978 | ||||||||||||
|
| |||||||||||
| Internet & Catalog Retail: 1.21% | ||||||||||||
Liberty Interactive Corporation Series A † | 157,204 | 2,796,659 | ||||||||||
|
| |||||||||||
| Media: 5.79% | ||||||||||||
Cablevision Systems Corporation New York Group Class A « | 174,341 | 2,316,992 | ||||||||||
Comcast Corporation Class A | 57,674 | 1,810,964 | ||||||||||
Discovery Communications Incorporated † | 68,364 | 3,424,353 | ||||||||||
Liberty Global Incorporated Class A † | 52,412 | 2,601,208 | ||||||||||
Omnicom Group Incorporated | 67,326 | 3,272,044 | ||||||||||
| 13,425,561 | ||||||||||||
|
| |||||||||||
| Multiline Retail: 4.39% | ||||||||||||
Family Dollar Stores Incorporated | 28,878 | 1,919,809 | ||||||||||
Kohl’s Corporation | 67,536 | 3,072,213 | ||||||||||
Macy’s Incorporated | 55,397 | 1,902,887 | ||||||||||
Nordstrom Incorporated | 65,699 | 3,264,583 | ||||||||||
| 10,159,492 | ||||||||||||
|
| |||||||||||
| Specialty Retail: 3.68% | ||||||||||||
Abercrombie & Fitch Company Class A | 75,150 | 2,565,621 | ||||||||||
CarMax Incorporated † | 104,545 | 2,711,897 | ||||||||||
Dick’s Sporting Goods Incorporated | 18,038 | 865,824 | ||||||||||
Express Incorporated † | 131,317 | 2,386,030 | ||||||||||
| 8,529,372 | ||||||||||||
|
| |||||||||||
Consumer Staples: 4.19% | ||||||||||||
| Food & Staples Retailing: 1.51% | ||||||||||||
Kroger Company | 150,605 | 3,492,530 | ||||||||||
|
| |||||||||||
| Food Products: 1.36% | ||||||||||||
General Mills Incorporated | 81,866 | 3,155,116 | ||||||||||
|
| |||||||||||
| Household Products: 1.32% | ||||||||||||
Church & Dwight Company Incorporated | �� | 55,062 | 3,054,289 | |||||||||
|
| |||||||||||
The accompanying notes are an integral part of these financial statements.
Table of Contents
| 8 | Wells Fargo Advantage VT Opportunity Fund | Portfolio of Investments—June 30, 2012 (Unaudited) |
| Security Name | Shares | Value | ||||||||||
Energy: 9.98% | ||||||||||||
| Energy Equipment & Services: 5.09% | ||||||||||||
McDermott International Incorporated † | 317,688 | $ | 3,539,044 | |||||||||
National Oilwell Varco Incorporated | 47,041 | 3,031,322 | ||||||||||
Superior Energy Services Incorporated † | 128,363 | 2,596,783 | ||||||||||
Weatherford International Limited † | 207,293 | 2,618,111 | ||||||||||
| 11,785,260 | ||||||||||||
|
| |||||||||||
| Oil, Gas & Consumable Fuels: 4.89% | ||||||||||||
Cabot Oil & Gas Corporation | 84,957 | 3,347,306 | ||||||||||
Denbury Resources Incorporated † | 175,997 | 2,659,315 | ||||||||||
Newfield Exploration Company † | 99,414 | 2,913,824 | ||||||||||
Peabody Energy Corporation | 98,578 | 2,417,133 | ||||||||||
| 11,337,578 | ||||||||||||
|
| |||||||||||
Financials: 14.73% | ||||||||||||
| Capital Markets: 2.67% | ||||||||||||
Invesco Limited | 133,121 | 3,008,535 | ||||||||||
TD Ameritrade Holding Corporation | 186,930 | 3,177,810 | ||||||||||
| 6,186,345 | ||||||||||||
|
| |||||||||||
| Commercial Banks: 3.97% | ||||||||||||
Branch Banking & Trust Corporation | 77,043 | 2,376,777 | ||||||||||
City National Corporation « | 47,925 | 2,328,197 | ||||||||||
Fifth Third Bancorp | 335,119 | 4,490,595 | ||||||||||
| 9,195,569 | ||||||||||||
|
| |||||||||||
| Diversified Financial Services: 1.15% | ||||||||||||
InterContinental Exchange Incorporated † | 19,599 | 2,665,072 | ||||||||||
|
| |||||||||||
| Insurance: 4.46% | ||||||||||||
ACE Limited | 48,648 | 3,606,276 | ||||||||||
Reinsurance Group of America Incorporated | 47,790 | 2,542,906 | ||||||||||
RenaissanceRe Holdings Limited | 40,292 | 3,062,595 | ||||||||||
Willis Group Holdings plc | 30,833 | 1,125,096 | ||||||||||
| 10,336,873 | ||||||||||||
|
| |||||||||||
| REITs: 2.48% | ||||||||||||
American Tower Corporation | 41,206 | 2,880,711 | ||||||||||
BioMed Realty Trust Incorporated | 153,816 | 2,873,283 | ||||||||||
| 5,753,994 | ||||||||||||
|
| |||||||||||
Health Care: 11.34% | ||||||||||||
| Health Care Equipment & Supplies: 4.18% | ||||||||||||
C.R. Bard Incorporated | 30,103 | 3,234,266 | ||||||||||
Covidien plc | 58,889 | 3,150,562 | ||||||||||
Zimmer Holdings Incorporated | 51,370 | 3,306,173 | ||||||||||
| 9,691,001 | ||||||||||||
|
| |||||||||||
The accompanying notes are an integral part of these financial statements.
Table of Contents
| Portfolio of Investments—June 30, 2012 (Unaudited) | Wells Fargo Advantage VT Opportunity Fund | 9 |
| Security Name | Shares | Value | ||||||||||
| Health Care Providers & Services: 1.63% | ||||||||||||
Health Management Associates Incorporated Class A † | 481,037 | $ | 3,776,140 | |||||||||
|
| |||||||||||
| Life Sciences Tools & Services: 5.53% | ||||||||||||
Agilent Technologies Incorporated | 74,164 | 2,910,195 | ||||||||||
Covance Incorporated † | 76,425 | 3,656,936 | ||||||||||
Thermo Fisher Scientific Incorporated | 64,435 | 3,344,821 | ||||||||||
Waters Corporation † | 36,435 | 2,895,489 | ||||||||||
| 12,807,441 | ||||||||||||
|
| |||||||||||
Industrials: 12.60% | ||||||||||||
| Aerospace & Defense: 1.29% | ||||||||||||
BE Aerospace Incorporated † | 68,535 | 2,992,238 | ||||||||||
|
| |||||||||||
| Airlines: 1.13% | ||||||||||||
Delta Air Lines Incorporated † | 128,912 | 1,411,586 | ||||||||||
United Continental Holdings Incorporated †« | 49,046 | 1,193,289 | ||||||||||
| 2,604,875 | ||||||||||||
|
| |||||||||||
| Commercial Services & Supplies: 1.50% | ||||||||||||
Republic Services Incorporated | 131,418 | 3,477,320 | ||||||||||
|
| |||||||||||
| Construction & Engineering: 1.08% | ||||||||||||
Quanta Services Incorporated † | 104,317 | 2,510,910 | ||||||||||
|
| |||||||||||
| Electrical Equipment: 3.87% | ||||||||||||
AMETEK Incorporated | 53,217 | 2,656,060 | ||||||||||
Babcock & Wilcox Company † | 73,931 | 1,811,310 | ||||||||||
Regal-Beloit Corporation | 48,681 | 3,030,879 | ||||||||||
Rockwell Automation Incorporated | 22,220 | 1,467,853 | ||||||||||
| 8,966,102 | ||||||||||||
|
| |||||||||||
| Machinery: 1.11% | ||||||||||||
Dover Corporation | 48,019 | 2,574,299 | ||||||||||
|
| |||||||||||
| Road & Rail: 2.62% | ||||||||||||
Hertz Global Holdings Incorporated †« | 234,549 | 3,002,227 | ||||||||||
J.B. Hunt Transport Services Incorporated « | 51,573 | 3,073,751 | ||||||||||
| 6,075,978 | ||||||||||||
|
| |||||||||||
Information Technology: 16.38% | ||||||||||||
| Communications Equipment: 1.24% | ||||||||||||
Riverbed Technology Incorporated † | 177,595 | 2,868,159 | ||||||||||
|
| |||||||||||
| Computers & Peripherals: 1.35% | ||||||||||||
NetApp Incorporated † | 98,180 | 3,124,088 | ||||||||||
|
| |||||||||||
| Electronic Equipment, Instruments & Components: 1.44% | ||||||||||||
Amphenol Corporation Class A | 60,968 | 3,348,363 | ||||||||||
|
| |||||||||||
The accompanying notes are an integral part of these financial statements.
Table of Contents
| 10 | Wells Fargo Advantage VT Opportunity Fund | Portfolio of Investments—June 30, 2012 (Unaudited) |
| Security Name | Shares | Value | ||||||||||||
| IT Services: 4.84% | ||||||||||||||
Alliance Data Systems Corporation † | 18,276 | $ | 2,467,260 | |||||||||||
Cognizant Technology Solutions Corporation Class A † | 49,549 | 2,972,940 | ||||||||||||
Global Payments Incorporated | 70,183 | 3,034,011 | ||||||||||||
MasterCard Incorporated | 6,402 | 2,753,564 | ||||||||||||
| 11,227,775 | ||||||||||||||
|
| |||||||||||||
| Semiconductors & Semiconductor Equipment: 5.05% | ||||||||||||||
Altera Corporation | 76,814 | 2,599,386 | ||||||||||||
ARM Holdings plc | 304,393 | 2,411,589 | ||||||||||||
Avago Technologies Limited | 96,262 | 3,455,806 | ||||||||||||
ON Semiconductor Corporation † | 454,500 | 3,226,950 | ||||||||||||
| 11,693,731 | ||||||||||||||
|
| |||||||||||||
| Software: 2.46% | ||||||||||||||
Autodesk Incorporated † | 72,344 | 2,531,317 | ||||||||||||
Red Hat Incorporated † | 55,996 | 3,162,654 | ||||||||||||
| 5,693,971 | ||||||||||||||
|
| |||||||||||||
Materials: 6.60% | ||||||||||||||
| Chemicals: 1.99% | ||||||||||||||
Praxair Incorporated | 42,412 | 4,611,457 | ||||||||||||
|
| |||||||||||||
| Containers & Packaging: 4.04% | ||||||||||||||
Bemis Company Incorporated | 100,257 | 3,142,054 | ||||||||||||
Crown Holdings Incorporated † | 89,844 | 3,098,720 | ||||||||||||
Owens-Illinois Incorporated † | 162,387 | 3,112,959 | ||||||||||||
| 9,353,733 | ||||||||||||||
|
| |||||||||||||
| Metals & Mining: 0.57% | ||||||||||||||
Agnico-Eagle Mines Limited « | 32,668 | 1,321,746 | ||||||||||||
|
| |||||||||||||
Total Common Stocks (Cost $206,594,479) | 220,975,521 | |||||||||||||
|
| |||||||||||||
| Principal | ||||||||||||||
| Other: 0.22% | ||||||||||||||
Gryphon Funding Limited, Pass-Through Entity (a)(i)(v) | $ | 1,923,649 | 519,385 | |||||||||||
|
| |||||||||||||
Total Other (Cost $238,121) | 519,385 | |||||||||||||
|
| |||||||||||||
| Yield | Shares | |||||||||||||
| Short-Term Investments: 9.18% | ||||||||||||||
Wells Fargo Advantage Cash Investment Money Market Fund, Select Class (l)(u) | 0.15 | % | 9,908,981 | 9,908,981 | ||||||||||
Wells Fargo Securities Lending Cash Investments, LLC (v)(l)(u)(r) | 0.19 | 11,350,704 | 11,350,704 | |||||||||||
Total Short-Term Investments (Cost $21,259,685) | 21,259,685 | |||||||||||||
|
| |||||||||||||
| Total Investments in Securities | ||||||||
| (Cost $228,092,285) * | 104.77 | % | 242,754,591 | |||||
Other Assets and Liabilities, Net | (4.77 | ) | (11,058,244 | ) | ||||
|
|
|
| |||||
| Total Net Assets | 100.00 | % | $ | 231,696,347 | ||||
|
|
|
|
The accompanying notes are an integral part of these financial statements.
Table of Contents
| Portfolio of Investments—June 30, 2012 (Unaudited) | Wells Fargo Advantage VT Opportunity Fund | 11 |
| † | Non-income earning security |
| « | All or a portion of this security is on loan. |
| (a) | Security is fair valued by the Management Valuation Team, and in certain instances by the Board of Trustees, in accordance with procedures approved by the Board of Trustees. |
| (i) | Illiquid security |
| (v) | Security represents investment of cash collateral received from securities on loan. |
| (l) | Investment in an affiliate |
| (u) | Rate shown is the 7-day annualized yield at period end. |
| (r) | The investment company is exempt from registration under Section 3(c)(7) of the 1940 Act. |
| * | Cost for federal income tax purposes is $231,030,438 and net unrealized appreciation (depreciation) consists of: |
Gross unrealized appreciation | $ | 22,649,679 | ||
Gross unrealized depreciation | (10,925,526 | ) | ||
|
| |||
Net unrealized appreciation | $ | 11,724,153 |
The accompanying notes are an integral part of these financial statements.
Table of Contents
| 12 | Wells Fargo Advantage VT Opportunity Fund | Statement of Assets and Liabilities—June 30, 2012 (Unaudited) |
Assets | ||||
Investments | ||||
In unaffiliated securities (including securities on loan), at value (see cost below) | $ | 221,494,906 | ||
In affiliated securities, at value (see cost below) | 21,259,685 | |||
|
| |||
Total investments, at value (see cost below) | 242,754,591 | |||
Receivable for investments sold | 2,294,782 | |||
Receivable for Fund shares sold | 18,448 | |||
Receivable for dividends | 189,604 | |||
Receivable for securities lending income | 12,559 | |||
|
| |||
Total assets | 245,269,984 | |||
|
| |||
Liabilities | ||||
Payable for investments purchased | 848,010 | |||
Payable for Fund shares redeemed | 904,610 | |||
Payable upon receipt of securities loaned | 11,588,825 | |||
Advisory fee payable | 115,833 | |||
Distribution fees payable | 40,638 | |||
Due to other related parties | 22,234 | |||
Accrued expenses and other liabilities | 53,487 | |||
|
| |||
Total liabilities | 13,573,637 | |||
|
| |||
Total net assets | $ | 231,696,347 | ||
|
| |||
NET ASSETS CONSIST OF | ||||
Paid-in capital | $ | 260,210,067 | ||
Undistributed net investment income | 565,383 | |||
Accumulated net realized losses on investments | (43,741,409 | ) | ||
Net unrealized gains on investments | 14,662,306 | |||
|
| |||
Total net assets | $ | 231,696,347 | ||
|
| |||
COMPUTATION OF NET ASSET VALUE PER SHARE1 | ||||
Net assets – Class 1 | $ | 40,464,842 | ||
Shares outstanding – Class 1 | 2,193,134 | |||
Net asset value per share – Class 1 | $18.45 | |||
Net assets – Class 2 | $ | 191,231,505 | ||
Shares outstanding – Class 2 | 10,386,462 | |||
Net asset value per share – Class 2 | $18.41 | |||
Investments in unaffiliated securities, at cost | $ | 206,832,600 | ||
|
| |||
Investments in affiliated securities, at cost | $ | 21,259,685 | ||
|
| |||
Total investments, at cost | $ | 228,092,285 | ||
|
| |||
Securities on loan, at value | $ | 11,339,873 | ||
|
| |||
| 1. | The Fund has an unlimited number of authorized shares. |
The accompanying notes are an integral part of these financial statements.
Table of Contents
| Statement of Operations—Six Months Ended June 30, 2012 (Unaudited) | Wells Fargo Advantage VT Opportunity Fund | 13 |
Investment income | ||||
Dividends* | $ | 1,391,346 | ||
Securities lending income, net | 27,833 | |||
Income from affiliated securities | 3,972 | |||
|
| |||
Total investment income | 1,423,151 | |||
|
| |||
Expenses | ||||
Advisory fee | 807,705 | |||
Administration fees | ||||
Fund level | 62,131 | |||
Class 1 | 17,197 | |||
Class 2 | 82,213 | |||
Distribution fees | ||||
Class 2 | 256,916 | |||
Custody and accounting fees | 13,493 | |||
Professional fees | 21,339 | |||
Shareholder report expenses | 37,999 | |||
Trustees’ fees and expenses | 7,912 | |||
Other fees and expenses | 3,748 | |||
|
| |||
Total expenses | 1,310,653 | |||
Less: Fee waivers and/or expense reimbursements | (121,769 | ) | ||
|
| |||
Net expenses | 1,188,884 | |||
|
| |||
Net investment income | 234,267 | |||
|
| |||
REALIZED AND UNREALIZED GAINS (LOSSES) ON INVESTMENTS | ||||
Net realized gains on investments | 12,256,506 | |||
Net change in unrealized gains (losses) on investments | 2,432,308 | |||
|
| |||
Net realized and unrealized gains (losses) on investments | 14,688,814 | |||
|
| |||
Net increase in net assets resulting from operations | $ | 14,923,081 | ||
|
| |||
* Net of foreign dividend withholding taxes of | $1,251 | |||
The accompanying notes are an integral part of these financial statements.
Table of Contents
| 14 | Wells Fargo Advantage VT Opportunity Fund | Statements of Changes in Net Assets |
| Six Months Ended June 30, 2012 (Unaudited) | Year Ended December 31, 2011 | |||||||||||||||
Operations | ||||||||||||||||
Net investment income | $ | 234,267 | $ | 415,644 | ||||||||||||
Net realized gains on investments | 12,256,506 | 12,647,751 | ||||||||||||||
Net change in unrealized gains (losses) on investments | 2,432,308 | (16,138,693 | ) | |||||||||||||
|
|
|
|
|
|
|
| |||||||||
Net increase (decrease) in net assets resulting from operations | 14,923,081 | (3,075,298 | ) | |||||||||||||
|
|
|
|
|
|
|
| |||||||||
Distributions to shareholders from | ||||||||||||||||
Net investment income – Class 2 | 0 | (228,148 | ) | |||||||||||||
|
|
|
|
|
|
|
| |||||||||
Capital share transactions | Shares | Shares | ||||||||||||||
Proceeds from shares sold | ||||||||||||||||
Class 1 | 15,818 | 301,213 | 78,783 | 1 | 1,305,075 | 1 | ||||||||||
Class 2 | 222,941 | 4,255,515 | 721,399 | 13,833,446 | ||||||||||||
|
|
|
|
|
|
|
| |||||||||
| 4,556,728 | 15,138,521 | |||||||||||||||
|
|
|
|
|
|
|
| |||||||||
Reinvestment of distributions | ||||||||||||||||
Class 2 | 0 | 0 | 11,742 | 228,148 | ||||||||||||
|
|
|
|
|
|
|
| |||||||||
Payment for shares redeemed | ||||||||||||||||
Class 1 | (243,233 | ) | (4,606,995 | ) | (201,134 | )1 | (3,415,950 | )1 | ||||||||
Class 2 | (1,429,436 | ) | (26,828,190 | ) | (2,739,789 | ) | (49,078,548 | ) | ||||||||
|
|
|
|
|
|
|
| |||||||||
| (31,435,185 | ) | (52,494,498 | ) | |||||||||||||
|
|
|
|
|
|
|
| |||||||||
Net asset value of shares issued in acquisition | ||||||||||||||||
Class 1 | 0 | 0 | 2,542,900 | 1 | 42,011,395 | |||||||||||
Class 2 | 0 | 0 | 4,464,853 | 73,764,505 | ||||||||||||
|
|
|
|
|
|
|
| |||||||||
| 0 | 115,775,900 | |||||||||||||||
|
|
|
|
|
|
|
| |||||||||
Net increase (decrease) in net assets resulting from capital share transactions | (26,878,457 | ) | 78,648,071 | |||||||||||||
|
|
|
|
|
|
|
| |||||||||
Total increase (decrease) in net assets | (11,955,376 | ) | 75,344,625 | |||||||||||||
|
|
|
|
|
|
|
| |||||||||
Net assets | ||||||||||||||||
Beginning of period | 243,651,723 | 168,307,098 | ||||||||||||||
|
|
|
|
|
|
|
| |||||||||
End of period | $ | 231,696,347 | $ | 243,651,723 | ||||||||||||
|
|
|
|
|
|
|
| |||||||||
Undistributed net investment income | $ | 565,383 | $ | 331,116 | ||||||||||||
|
|
|
|
|
|
|
| |||||||||
| 1. | Class commenced operations on August 26, 2011. |
The accompanying notes are an integral part of these financial statements.
Table of Contents
| Financial Highlights | Wells Fargo Advantage VT Opportunity Fund | 15 |
(For a share outstanding throughout each period)
| Class 1 | Six Months Ended June 30, 2012 (Unaudited) | Year Ended December 31, 20111 | ||||||
Net asset value, beginning of period | $ | 17.40 | $ | 16.52 | ||||
Net investment income | 0.04 | 0.04 | ||||||
Net realized and unrealized gains (losses) on investments | 1.01 | 0.84 | ||||||
|
|
|
| |||||
Total from investment operations | 1.05 | 0.88 | ||||||
Net asset value, end of period | $18.45 | $17.40 | ||||||
Total return2 | 6.03 | % | 5.33 | % | ||||
Ratios to average net assets (annualized) | ||||||||
Gross expenses | 0.85 | % | 0.83 | % | ||||
Net expenses | 0.75 | % | 0.75 | % | ||||
Net investment income | 0.40 | % | 0.61 | % | ||||
Supplemental data | ||||||||
Portfolio turnover rate | 23 | % | 35 | % | ||||
Net assets, end of period (000’s omitted) | $40,465 | $42,116 | ||||||
| 1. | For the period from August 26, 2011 (commencement of class operations) to December 31, 2011. |
| 2. | Returns for periods of less than one year are not annualized. |
The accompanying notes are an integral part of these financial statements.
Table of Contents
| 16 | Wells Fargo Advantage VT Opportunity Fund | Financial Highlights |
(For a share outstanding throughout each period)
| Six Months Ended June 30, 2012 (Unaudited) | Year Ended December 31, | |||||||||||||||||||||||
| Class 21 | 2011 | 2010 | 2009 | 2008 | 2007 | |||||||||||||||||||
Net asset value, beginning of period | $ | 17.38 | $ | 18.42 | $ | 15.01 | $ | 10.16 | $ | 22.03 | $ | 24.02 | ||||||||||||
Net investment income | 0.02 | 0.03 | 0.02 | 0.11 | 0.12 | 0.21 | ||||||||||||||||||
Net realized and unrealized gains (losses) on investments | 1.01 | (1.04 | ) | 3.51 | 4.74 | (7.30 | ) | 1.60 | ||||||||||||||||
|
|
|
|
|
|
|
|
|
|
|
| |||||||||||||
Total from investment operations | 1.03 | (1.01 | ) | 3.53 | 4.85 | (7.18 | ) | 1.81 | ||||||||||||||||
Distributions to shareholders from | ||||||||||||||||||||||||
Net investment income | 0.00 | (0.03 | ) | (0.12 | ) | 0.00 | (0.37 | ) | (0.16 | ) | ||||||||||||||
Net realized gains | 0.00 | 0.00 | 0.00 | 0.00 | (4.32 | ) | (3.64 | ) | ||||||||||||||||
|
|
|
|
|
|
|
|
|
|
|
| |||||||||||||
Total distributions to shareholders | 0.00 | (0.03 | ) | (0.12 | ) | 0.00 | (4.69 | ) | (3.80 | ) | ||||||||||||||
Net asset value, end of period | $18.41 | $17.38 | $18.42 | $15.01 | $10.16 | $22.03 | ||||||||||||||||||
Total return2 | 5.93 | % | (5.52 | )% | 23.76 | % | 47.74 | % | (40.10 | )% | 6.63 | % | ||||||||||||
Ratios to average net assets (annualized) | ||||||||||||||||||||||||
Gross expenses | 1.10 | % | 1.07 | % | 1.18 | % | 1.32 | % | 1.21 | % | 1.19 | % | ||||||||||||
Net expenses | 1.00 | % | 1.04 | % | 1.07 | % | 1.07 | % | 1.07 | % | 1.07 | % | ||||||||||||
Net investment income | 0.15 | % | 0.18 | % | 0.08 | % | 0.39 | % | 0.47 | % | 0.74 | % | ||||||||||||
Supplemental data | ||||||||||||||||||||||||
Portfolio turnover rate | 23 | % | 35 | % | 40 | % | 50 | % | 70 | % | 64 | % | ||||||||||||
Net assets, end of period (000’s omitted) | $191,232 | $201,535 | $168,307 | $154,782 | $378,197 | $779,286 | ||||||||||||||||||
| 1. | After the close of business on July 16, 2010, existing shares of the Fund were renamed Class 2 shares. |
| 2. | Returns for periods of less than one year are not annualized. |
The accompanying notes are an integral part of these financial statements.
Table of Contents
| Notes to Financial Statements (Unaudited) | Wells Fargo Advantage VT Opportunity Fund | 17 |
1. ORGANIZATION
Wells Fargo Variable Trust (the “Trust”), a Delaware statutory trust organized on March 10, 1999, is an open-end management investment company registered under the Investment Company Act of 1940, as amended (the “1940 Act”). These financial statements report on Wells Fargo Advantage VT Opportunity Fund (the “Fund”) which is a diversified series of the Trust.
2. SIGNIFICANT ACCOUNTING POLICIES
The following significant accounting policies, which are consistently followed in the preparation of the financial statements of the Fund, are in conformity with U.S. generally accepted accounting principles which require management to make estimates and assumptions that affect the reported amounts of assets and liabilities, disclosure of contingent assets and liabilities at the date of the financial statements, and the reported amounts of revenues and expenses during the reporting period. Actual results could differ from those estimates.
Securities valuation
Investments in equity securities are valued each business day as of the close of regular trading on the New York Stock Exchange, which is usually 4:00 p.m. (Eastern Time). Securities which are traded on a national or foreign securities exchange are valued at the last reported sales price, except that securities listed on The Nasdaq Stock Market, Inc. (“Nasdaq”) are valued at the Nasdaq Official Closing Price (“NOCP”), and if no NOCP is available, then at the last reported sales price. If no sales price is shown on the Nasdaq, the bid price will be used. In the absence of any sale of securities listed on the Nasdaq, and in the case of other securities (including U.S. Government obligations, but excluding debt securities maturing in 60 days or less), the price will be deemed “stale” and the valuations will be determined in accordance with the Fund’s Valuation Procedures.
Securities denominated in foreign currencies are translated into U.S. dollars using the closing rates of exchange in effect on the day of valuation.
Many securities markets and exchanges outside the U.S. close prior to the close of the New York Stock Exchange and therefore may not fully reflect trading or events that occur after the close of the principal exchange in which the foreign securities are traded, but before the close of the New York Stock Exchange. If such trading or events are expected to materially affect the value of securities, then fair value pricing procedures approved by the Board of Trustees are applied. These procedures take into account multiple factors including movements in U.S. securities markets after foreign exchanges close. As a result of the fair value pricing procedures, these securities which are normally categorized as Level 1 in the fair value hierarchy will represent a transfer from a Level 1 to a Level 2 security and will be categorized as Level 2. Depending on market activity, such fair valuations may be frequent. Such fair value pricing may result in NAVs that are higher or lower than NAVs based on the closing price or latest quoted bid price. On June 30, 2012, fair value pricing was used in pricing foreign securities.
Investments in open-end mutual funds and non-registered investment companies are fair valued at net asset value.
Investments which are not valued using any of the methods discussed above, are valued at their fair value, as determined by procedures established in good faith and approved by the Board of Trustees. The Board of Trustees has established a Valuation Committee comprised of the Trustees and has delegated to it the authority to take any actions regarding the valuation of portfolio securities that the Valuation Committee deems necessary in determining the fair value of portfolio securities, unless the responsibility has been delegated to the Management Valuation Team of Wells Fargo Funds Management, LLC (“Funds Management”). The Board of Trustees retains the authority to make or ratify any valuation decisions or approve any changes to the Valuation Procedures as it deems appropriate. On a quarterly basis, the Board of Trustees considers for ratification any valuation actions taken by the Valuation Committee or the Management Valuation Team.
Valuations of fair valued securities are compared to the next actual sales price when available, or other appropriate market information to assess the continued appropriateness of the fair valuation methodology used. These securities are fair valued on a day-to-day basis, taking into consideration changes to appropriate market information and any significant changes to the input factors considered in the valuation process until there is a readily available price provided on the exchange or by an independent pricing service. Valuations received from an independent pricing service
Table of Contents
| 18 | Wells Fargo Advantage VT Opportunity Fund | Notes to Financial Statements (Unaudited) |
or broker quotes are periodically validated by comparisons to most recent trades and valuations provided by other independent pricing services in addition to the review of prices by the adviser and/or sub-adviser. Unobservable inputs used in determining fair valuations are identified based on the type of security, taking into consideration factors utilized by market participants in valuing the investment, knowledge about the issuer and the current market environment.
Foreign currency translation
The accounting records of the Fund are maintained in U.S. dollars. Assets, including investment securities, and liabilities denominated in foreign currency are translated into U.S. dollars at the prevailing rates of exchange at the date of valuation. Purchases and sales of securities, and income and expenses are translated at the prevailing rate of exchange on the respective dates of such transactions. Reported net realized foreign exchange gains or losses arise from sales of foreign currencies, currency gains or losses realized between the trade and settlement dates on securities transactions, and the difference between the amounts of dividends, interest and foreign withholding taxes recorded and the U.S. dollar equivalent of the amounts actually paid or received. Net unrealized foreign exchange gains and losses arise from changes in the fair value of assets and liabilities other than investments in securities resulting in changes in exchange rates.
The changes in net assets arising from changes in exchange rates and the changes in net assets resulting from changes in market prices of securities are not separately presented. Such changes are recorded with net realized and unrealized gains or losses from investments. Gains and losses from certain foreign currency transactions are treated as ordinary income for U.S. federal income tax purposes.
Security loans
The Fund may lend its securities from time to time in order to earn additional income in the form of fees or interest on securities received as collateral or the investment of any cash received as collateral. The Fund continues to receive interest or dividends on the securities loaned. The Fund receives collateral in the form of cash or securities with a value at least equal to the value of the securities on loan. The value of the loaned securities is determined at the close of each business day and any additional required collateral is delivered to the Fund on the next business day. In a securities lending transaction, the net asset value of the Fund will be affected by an increase or decrease in the value of the securities loaned and by an increase or decrease in the value of the instrument in which collateral is invested. The amount of securities lending activity undertaken by the Fund fluctuates from time to time. In the event of default or bankruptcy by the borrower, the Fund may be prevented from recovering the loaned securities or gaining access to the collateral or may experience delays or costs in doing so. In addition, the investment of any cash collateral received may lose all or part of its value. The Fund has the right under the lending agreement to recover the securities from the borrower on demand.
The Fund lends its securities through an unaffiliated securities lending agent. Cash collateral received in connection with its securities lending transactions is invested in Wells Fargo Securities Lending Cash Investments, LLC (the “Cash Collateral Fund”). The Cash Collateral Fund is exempt from registration under Section 3(c)(7) of the 1940 Act and is managed by Funds Management and is sub-advised by Wells Capital Management Incorporated (“Wells Capital Management”). Funds Management receives an advisory fee starting at 0.05% and declining to 0.01% as the average daily net assets of the Cash Collateral Fund increase. All of the fees received by Funds Management are paid to Wells Capital Management for its services as sub-adviser. The Cash Collateral Fund seeks to provide a positive return compared to the daily Fed Funds Open rate by investing in high-quality, U.S. dollar-denominated short-term money market instruments. Cash Collateral Fund investments are fair valued based upon the amortized cost valuation technique. Income earned from investment in the Cash Collateral Fund is included in securities lending income on the Statement of Operations.
Security transactions and income recognition
Securities transactions are recorded on a trade date basis. Realized gains or losses are reported on the basis of identified cost of securities delivered.
Dividend income is recognized on the ex-dividend date. Dividend income from foreign securities is recorded net of foreign taxes withheld where recovery of such taxes is not assured.
Distributions to shareholders
Distributions to shareholders from net investment income and net realized gains, if any, are recorded on the ex-dividend date. Such distributions are determined in conformity with income tax regulations, which may differ from generally accepted accounting principles.
Table of Contents
| Notes to Financial Statements (Unaudited) | Wells Fargo Advantage VT Opportunity Fund | 19 |
Federal and other taxes
The Fund intends to continue to qualify as a regulated investment company by distributing substantially all of its investment company taxable income and any net realized capital gains (after reduction for capital loss carryforwards) sufficient to relieve it from all, or substantially all, federal income taxes. Accordingly, no provision for federal income taxes was required.
The Fund’s income and federal excise tax returns and all financial records supporting those returns for the prior three fiscal years are subject to examination by the federal and Delaware revenue authorities. Management has analyzed the Fund’s tax positions taken on federal, state, and foreign tax returns for all open tax years and does not believe that there are any uncertain tax positions that require recognition of a tax liability.
Under the recently enacted Regulated Investment Company Modernization Act of 2010, the Fund is permitted to carry forward capital losses incurred in taxable years which began after December 22, 2010 for an unlimited period. However, any losses incurred are required to be utilized prior to the losses incurred in pre-enactment taxable years. As a result of this ordering rule, pre-enactment capital loss carryforwards may be more likely to expire unused. Post-enactment capital losses that are carried forward will retain their character as either short-term or long-term capital losses rather than be considered all short-term as under previous law. In addition, the Fund may elect to defer any portion of a post-October capital loss or qualified late-year ordinary loss to the first day of the following taxable year. A post-October capital loss is the greatest of the net capital loss, net short-term capital loss or net long-term capital loss for the portion of the taxable year after October 31. A qualified late-year ordinary loss is the net loss comprised of (a) net gain or loss from the sale or other disposition of certain capital assets for the portion of the taxable year after October 31, and (b) other ordinary income or loss for the portion of the taxable year after December 31.
At December 31, 2011, net capital loss carryforwards, which were available to offset future net realized capital gains, were as follows:
| Pre-enactment Capital Loss Expiration | Post-enactment Capital Losses | |||||||||||||||||
| 2015 | 2016 | 2017 | Short-term | Long-term | ||||||||||||||
| $ | 1,442,700 | $ | 360,675 | $ | 47,818,946 | $ | 2,181,517 | $ | 286,150 | |||||||||
Class allocations
The separate classes of shares offered by the Fund differ principally in distribution fees. Shareholders of each class bear certain expenses that pertain to that particular class. All shareholders bear the common expenses of the Fund, earn income from the portfolio, and are allocated unrealized gains and losses pro rata based on the average daily net assets of each class, without distinction between share classes. Dividends are determined separately for each class based on income and expenses allocable to each class. Realized gains and losses are allocated to each class pro rata based upon the net assets of each class on the date realized. Differences in per share dividend rates generally result from the relative weightings of pro rata income and realized gain allocations and from differences in separate class expenses, including distribution fees.
3. FAIR VALUATION MEASUREMENTS
Fair value measurements of investments are determined within a framework that has established a fair value hierarchy based upon the various data inputs utilized in determining the value of the Fund’s investments. The three-level hierarchy gives the highest priority to unadjusted quoted prices in active markets for identical assets or liabilities (Level 1) and the lowest priority to significant unobservable inputs (Level 3). The Fund’s investments are classified within the fair value hierarchy based on the lowest level of input that is significant to the fair value measurement. The inputs are summarized into three broad levels as follows:
| n | Level 1 – quoted prices in active markets for identical securities |
| n | Level 2 – other significant observable inputs (including quoted prices for similar securities, interest rates, prepayment speeds, credit risk, etc.) |
| n | Level 3 – significant unobservable inputs (including the Fund’s own assumptions in determining the fair value of investments) |
Table of Contents
| 20 | Wells Fargo Advantage VT Opportunity Fund | Notes to Financial Statements (Unaudited) |
The inputs or methodologies used for valuing securities are not necessarily an indication of the risk associated with investing in those securities.
As of June 30, 2012, the inputs used in valuing the Fund’s assets, which are carried at fair value, were as follows:
| Investments in Securities | Quoted Prices (Level 1) | Significant Other Observable Inputs (Level 2) | Significant Unobservable Inputs (Level 3) | Total | ||||||||||||
Equity securities | ||||||||||||||||
Common stocks | $ | 218,563,932 | $ | 2,411,589 | $ | 0 | $ | 220,975,521 | ||||||||
Other | 0 | 0 | 519,385 | 519,385 | ||||||||||||
Short-term investments | ||||||||||||||||
Investment companies | 9,908,981 | 11,350,704 | 0 | 21,259,685 | ||||||||||||
| $ | 228,472,913 | $ | 13,762,293 | $ | 519,385 | $ | 242,754,591 | |||||||||
Further details on the major security types listed above can be found in the Portfolio of Investments.
Transfers in and transfers out are recognized at the end of the reporting period. For the six months ended June 30, 2012, the Fund did not have any transfers into/out of Level 1 and Level 2.
4. TRANSACTIONS WITH AFFILIATES AND OTHER EXPENSES
Advisory fee
The Trust has entered into an advisory contract with Funds Management, an indirect wholly owned subsidiary of Wells Fargo & Company (“Wells Fargo”). The adviser is responsible for implementing investment policies and guidelines and for supervising the sub-adviser, who is responsible for day-to-day portfolio management of the Fund.
Pursuant to the contract, Funds Management is entitled to receive an annual advisory fee starting at 0.65% and declining to 0.55% as the average daily net assets of the Fund increase. For the six months ended June 30, 2012, the advisory fee was equivalent to an annual rate of 0.65% of the Fund’s average daily net assets.
Funds Management has retained the services of a sub-adviser to provide daily portfolio management to the Fund. The fee for sub-advisory services is borne by Funds Management. Wells Capital Management, an affiliate of Funds Management, is the sub-adviser to the Fund and is entitled to receive a fee from Funds Management at an annual rate starting at 0.45% and declining to 0.30% as the average daily net assets of the Fund increase.
Administration and transfer agent fees
The Trust has entered into an administration agreement with Funds Management. Under this agreement, for providing administrative services, which includes paying fees and expenses for services provided by the transfer agent, sub-transfer agents, omnibus account servicers and record-keepers, Funds Management is entitled to receive from the Fund an annual fund level administration fee starting at 0.05% and declining to 0.03% as the average daily net assets of the Fund increase and a class level administration fee of 0.08% which is calculated based on the average daily net assets of each class.
Funds Management has contractually waived and/or reimbursed advisory and administration fees to the extent necessary to maintain certain net operating expense ratios for the Fund. Waiver of fees and/or reimbursement of expenses by Funds Management were made first from fund level expenses on a proportionate basis and then from class specific expenses. Funds Management has committed through July 18, 2013 to waive fees and/or reimburse expenses to the extent necessary to cap the Fund’s expenses at 0.75% for Class 1 and 1.00% for Class 2.
Distribution fees
The Trust has adopted a Distribution Plan for Class 2 shares of the Fund pursuant to Rule 12b-1 under the 1940 Act. Distribution fees are charged to Class 2 shares and paid to Wells Fargo Funds Distributor, LLC, the principal underwriter, at an annual rate of 0.25% of its average daily net assets.
5. INVESTMENT PORTFOLIO TRANSACTIONS
Purchases and sales of investments, excluding U.S. Government obligations (if any) and short-term securities, for the six months ended June 30, 2012 were $54,390,686 and $85,345,739, respectively.
Table of Contents
| Notes to Financial Statements (Unaudited) | Wells Fargo Advantage VT Opportunity Fund | 21 |
6. ACQUISITION
After the close of business on August 26, 2011, the Fund acquired the net assets of Wells Fargo Advantage VT Core Equity Fund. The purpose of the transaction was to combine two funds with similar investment objectives and strategies. Shareholders holding Class 1 and Class 2 shares of Wells Fargo Advantage VT Core Equity Fund received Class 1 and Class 2 shares, respectively, of the Fund in the reorganization. The acquisition was accomplished by a tax-free exchange of all of the shares of Wells Fargo Advantage VT Core Equity Fund for 7,007,753 shares of the Fund valued at $115,775,900 at an exchange ratio of 0.77 and 0.76 for Class 1 and Class 2 shares, respectively. The investment portfolio of Wells Fargo Advantage VT Core Equity Fund with a fair value of $115,698,003, identified cost of $130,800,975 and unrealized losses of $15,102,972 at August 26, 2011 were the principal assets acquired by the Fund. The aggregate net assets of Wells Fargo Advantage VT Core Equity Fund and the Fund immediately prior to the acquisition were $115,775,900 and $138,830,614, respectively. The aggregate net assets of the Fund immediately after the acquisition were $254,606,514. For financial reporting purposes, assets received and shares issued by the Fund were recorded at fair value; however, the cost basis of the investments received from Wells Fargo Advantage VT Core Equity Fund was carried forward to align ongoing reporting of the Fund’s realized and unrealized gains and losses with amounts distributable to shareholders for tax purposes.
Assuming the acquisition had been completed January 1, 2011, the beginning of the annual reporting period for the Fund, the pro forma results of operations for the year ended December 31, 2011 would have been:
Net investment income | $ | 1,159,297 | ||
Net realized and unrealized losses on investments | $ | (2,976,757 | ) | |
Net decrease in net assets resulting from operations | $ | (1,817,460 | ) |
7. BANK BORROWINGS
The Trust and Wells Fargo Funds Trust (excluding the money market funds) are parties to a $150,000,000 revolving credit agreement with State Street Bank and Trust Company, whereby the Fund is permitted to use bank borrowings for temporary or emergency purposes, such as to fund shareholder redemption requests. Interest under the credit agreement is charged to the Fund based on a borrowing rate equal to the higher of the Federal Funds rate in effect on that day plus 1.25% or the overnight LIBOR rate in effect on that day plus 1.25%. In addition, an annual commitment fee equal to 0.10% of the unused balance is allocated to each participating fund. For the six months ended June 30, 2012, the Fund paid $237 in commitment fees.
For the six months ended June 30, 2012, there were no borrowings by the Fund under the agreement.
8. INDEMNIFICATION
Under the Trust’s organizational documents, the officers and directors are indemnified against certain liabilities that may arise out of performance of their duties to the Trust. Additionally, in the normal course of business, the Trust may enter into contracts with service providers that contain a variety of indemnification clauses. The Trust’s maximum exposure under these arrangements is dependent on future claims that may be made against the Fund and, therefore, cannot be estimated.
9. NEW ACCOUNTING PRONOUNCEMENT
In December 2011, the Financial Accounting Standards Board (“FASB”) issued Accounting Standard Update (“ASU”) No. 2011-11, Disclosures about Offsetting Assets and Liabilities. ASU 2011-11, which amends FASB ASC Topic 210, Balance Sheet, creates new disclosure requirements which require entities to disclose both gross and net information for derivatives and other financial instruments that are either offset in the Statement of Assets and Liabilities or subject to an enforceable master netting arrangement or similar agreement. The disclosure requirements are effective for interim and annual reporting periods beginning on or after January 1, 2013. Management is currently assessing the potential impact, in addition to expanded financial statement disclosure, that may result from adopting this ASU.
Table of Contents
| 22 | Wells Fargo Advantage VT Opportunity Fund | Notes to Financial Statements (Unaudited) |
10. SUBSEQUENT DISTRIBUTIONS
On July 12, 2012, the Fund declared distributions from net investment income and long-term capital gains to shareholders of record on July 11, 2012. The per share amounts payable on July 13, 2012 were as follows:
| Net Investment Income | Long-term Capital Gains | |||||||
Class 1 | $ | 0.07073 | $ | 0.00662 | ||||
Class 2 | 0.01805 | 0.00662 | ||||||
These distributions are not reflected in the accompanying financial statements.
Table of Contents
| Other Information (Unaudited) | Wells Fargo Advantage VT Opportunity Fund | 23 |
PROXY VOTING INFORMATION
A description of the policies and procedures that the Fund uses to determine how to vote proxies relating to portfolio securities is available without charge, upon request, by calling 1-800-222-8222, visiting our Web site at wellsfargoadvantagefunds.com, or visiting the SEC Web site at sec.gov. Information regarding how the Fund voted proxies relating to portfolio securities during the most recent 12-month period ended June 30 is available without charge on the Fund’s Web site at wellsfargoadvantagefunds.com or by visiting the SEC Web site at sec.gov.
PORTFOLIO HOLDINGS INFORMATION
The complete portfolio holdings for the Fund are publicly available on the Fund’s Web site (wellsfargoadvantagefunds.com) on a monthly, 30-day or more delayed basis. In addition, top ten holdings information for the Fund is publicly available on the Fund’s Web site on a monthly, seven-day or more delayed basis. The Fund files its complete schedule of portfolio holdings with the SEC for the first and third quarters of each fiscal year on Form N-Q, which is available without charge by visiting the SEC Web site at sec.gov. In addition, the Fund’s Form N-Q may be reviewed and copied at the SEC’s Public Reference Room in Washington, DC, and at regional offices in New York City, at 233 Broadway, and in Chicago, at 175 West Jackson Boulevard, Suite 900. Information about the Public Reference Room may be obtained by calling 1-800-SEC-0330.
Table of Contents
| 24 | Wells Fargo Advantage VT Opportunity Fund | Other Information (Unaudited) |
BOARD OF TRUSTEES AND OFFICERS
Each of the Trustees and Officers listed in the table below acts in identical capacities for the Wells Fargo Advantage family of funds, which consists of 138 funds comprising the Wells Fargo Funds Trust, Wells Fargo Variable Trust, Wells Fargo Master Trust and four closed-end funds (collectively the “Fund Complex”). This table should be read in conjunction with the Prospectus and the Statement of Additional Information1. All of the Trustees are also Members of the Audit and Governance Committees of each Trust in the Fund Complex. The mailing address of each Trustee and Officer is 525 Market Street, 12th Floor, San Francisco, CA 94105. Each Trustee and Officer serves an indefinite term, however, each Trustee serves such term until reaching the mandatory retirement age established by the Trustees.
Independent Trustees
Name and Year of Birth | Position Held and Length of Service* | Principal Occupations During Past Five Years | Other Directorships During | |||
| Peter G. Gordon (Born 1942) | Trustee, since 1998; Chairman, since 2005 (Lead Trustee since 2001) | Co-Founder, Retired Chairman, President and CEO of Crystal Geyser Water Company. Trustee Emeritus, Colby College | Asset Allocation Trust | |||
| Isaiah Harris, Jr. (Born 1952) | Trustee, since 2009 | Retired. Prior thereto, President and CEO of BellSouth Advertising and Publishing Corp. from 2005 to 2007, President and CEO of BellSouth Enterprises from 2004 to 2005 and President of BellSouth Consumer Services from 2000 to 2003. Emeritus member of the Iowa State University Foundation Board of Governors. Emeritus Member of the Advisory Board of Iowa State University School of Business. Mr. Harris is a certified public accountant. | CIGNA Corporation; Deluxe Corporation; Asset Allocation Trust | |||
| Judith M. Johnson (Born 1949) | Trustee, since 2008 | Retired. Prior thereto, Chief Executive Officer and Chief Investment Officer of Minneapolis Employees Retirement Fund from 1996 to 2008. Ms. Johnson is an attorney, certified public accountant and a certified managerial accountant. | Asset Allocation Trust | |||
| Leroy Keith, Jr. (Born 1939) | Trustee, since 2010 | Chairman, Bloc Global Services (development and construction). Trustee of the Evergreen Funds from 1983 to 2010. Former Managing Director, Almanac Capital Management (commodities firm), former Partner, Stonington Partners, Inc. (private equity fund), former Director, Obagi Medical Products Co. and former Director, Lincoln Educational Services. | Trustee, Virtus Fund Complex (consisting of 40 portfolios as of 12/31/11); Asset Allocation Trust | |||
| David F. Larcker (Born 1950) | Trustee, since 2009 | James Irvin Miller Professor of Accounting at the Graduate School of Business, Stanford University, Director of Corporate Governance Research Program and Senior Faculty of The Rock Center for Corporate Governance since 2006. From 2005 to 2008, Professor of Accounting at the Graduate School of Business, Stanford University. Prior thereto, Ernst & Young Professor of Accounting at The Wharton School, University of Pennsylvania from 1985 to 2005. | Asset Allocation Trust | |||
| Olivia S. Mitchell (Born 1953) | Trustee, since 2006 | International Foundation of Employee Benefit Plans Professor, Wharton School of the University of Pennsylvania since 1993. Director of Wharton’s Pension Research Council and Boettner Center on Pensions & Retirement Research, and Research Associate at the National Bureau of Economic Research. Previously, Cornell University Professor from 1978 to 1993. | Asset Allocation Trust | |||
| Timothy J. Penny (Born 1951) | Trustee, since 1996 | President and CEO of Southern Minnesota Initiative Foundation, a non-profit organization, since 2007 and Senior Fellow at the Humphrey Institute Policy Forum at the University of Minnesota since 1995. Member of the Board of Trustees of NorthStar Education Finance, Inc., a non-profit organization, since 2007. | Asset Allocation Trust |
Table of Contents
| Other Information (Unaudited) | Wells Fargo Advantage VT Opportunity Fund | 25 |
Name and Year of Birth | Position Held and Length of Service* | Principal Occupations During Past Five Years | Other Directorships During | |||
| Michael S. Scofield (Born 1943) | Trustee, since 2010 | Served on the Investment Company Institute’s Board of Governors and Executive Committee from 2008-2011 as well the Governing Council of the Independent Directors Council from 2006-2011 and the Independent Directors Council Executive Committee from 2008-2011. Chairman of the IDC from 2008-2010. Institutional Investor (Fund Directions) Trustee of Year in 2007. Trustee of the Evergreen Funds (and its predecessors) from 1984 to 2010. Chairman of the Evergreen Funds from 2000-2010. Former Trustee of the Mentor Funds. Retired Attorney, Law Offices of Michael S. Scofield and former Director and Chairman, Branded Media Corporation (multi-media branding company). | Asset Allocation Trust | |||
| Donald C. Willeke (Born 1940) | Trustee, since 1996 | Principal of the law firm of Willeke & Daniels. General Counsel of the Minneapolis Employees Retirement Fund from 1984 until its consolidation into the Minnesota Public Employees Retirement Association on June 30, 2010. Director and Vice Chair of The Free Trust (non-profit corporation). Director of the American Chestnut Foundation (non-profit corporation). | Asset Allocation Trust |
| * | Length of service dates reflect the Trustee’s commencement of service with the Trust’s predecessor entities, where applicable. |
Officers
Name and Year of Birth | Position Held and Length of Service | Principal Occupations During Past Five Years | ||||
| Karla M. Rabusch (Born 1959) | President, since 2003 | Executive Vice President of Wells Fargo Bank, N.A. and President of Wells Fargo Funds Management, LLC since 2003. Senior Vice President and Chief Administrative Officer of Wells Fargo Funds Management, LLC from 2001 to 2003. | ||||
| C. David Messman (Born 1960) | Secretary, since 2000; Chief Legal Officer, since 2003 | Senior Vice President and Secretary of Wells Fargo Funds Management, LLC since 2001. Vice President and Managing Senior Counsel of Wells Fargo Bank, N.A. since 1996. | ||||
| Nancy Wiser (Born 1967) | Treasurer, since 2012 | Executive Vice President of Wells Fargo Funds Management, LLC since 2011. Chief Operating Officer and Chief Compliance Officer at LightBox Capital Management LLC, from 2008 to 2011. Owned and operated a consulting business providing services to various hedge funds including acting as Chief Operating Officer and Chief Compliance Officer for a hedge fund from 2007 to 2008. Chief Operating Officer and Chief Compliance Officer of GMN Capital LLC from 2006 to 2007. | ||||
| David Berardi (Born 1975) | Assistant Treasurer, since 2009 | Vice President of Wells Fargo Funds Management, LLC since 2009. Vice President of Evergreen Investment Management Company, LLC from 2008 to 2010. Assistant Vice President of Evergreen Investment Services, Inc. from 2004 to 2008. Manager of Fund Reporting and Control for Evergreen Investment Management Company, LLC from 2004 to 2010. | ||||
| Jeremy DePalma (Born 1974) | Assistant Treasurer, since 2009 | Senior Vice President of Wells Fargo Funds Management, LLC since 2009. Senior Vice President of Evergreen Investment Management Company, LLC from 2008 to 2010. Vice President, Evergreen Investment Services, Inc. from 2004 to 2007. Head of the Fund Reporting and Control Team within Fund Administration from 2005 to 2010. | ||||
| Debra Ann Early (Born 1964) | Chief Compliance Officer, since 2007 | Chief Compliance Officer of Wells Fargo Funds Management, LLC since 2007. Chief Compliance Officer of Parnassus Investments from 2005 to 2007. Chief Financial Officer of Parnassus Investments from 2004 to 2007 and Senior Audit Manager of PricewaterhouseCoopers LLP from 1998 to 2004. |
| 1. | The Statement of Additional Information includes additional information about the Trustees and is available, without charge, upon request, by calling 1-800-222-8222 or by visiting the Web site at wellsfargoadvantagefunds.com. |
Table of Contents
| 26 | Wells Fargo Advantage VT Opportunity Fund | Other Information (Unaudited) |
BOARD CONSIDERATION OF INVESTMENT ADVISORY AND SUB-ADVISORY AGREEMENTS:
Under Section 15 of the Investment Company Act of 1940 (the “1940 Act”), the Board of Trustees (the “Board”) of Wells Fargo Funds Trust (the “Trust”), all the members of which have no direct or indirect interest in the investment advisory and sub-advisory agreements and are not “interested persons” of the Trust, as defined in the 1940 Act (the “Independent Trustees”), must determine whether to approve the continuation of the Trust’s investment advisory and sub-advisory agreements. In this regard, at an in person meeting held on March 29-30, 2012 (the “Meeting”), the Board reviewed and re-approved: (i) an investment advisory agreement with Wells Fargo Funds Management, LLC (“Funds Management”) for Wells Fargo Advantage VT Opportunity FundSM (the “Fund”) and (ii) an investment sub-advisory agreement with Wells Capital Management Incorporated (“Wells Capital Management”) for the Fund. The investment advisory agreement with Funds Management and the investment sub-advisory agreement with Wells Capital Management are collectively referred to as the “Advisory Agreements.”
At the Meeting, the Board considered the factors and reached the conclusions described below relating to the selection of Funds Management and Wells Capital Management and the continuation of the Advisory Agreements. Prior to the Meeting, the Trustees conferred extensively among themselves and with representatives of Funds Management about these matters. The Board also met throughout the year and received information that was useful to them in considering the continuation of the Advisory Agreements. The Independent Trustees were assisted in their evaluation of the Advisory Agreements by independent legal counsel, from whom they received separate legal advice and with whom they met separately from Funds Management.
In providing information to the Board, Funds Management and Wells Capital Management were guided by a detailed set of requests submitted by the Independent Trustees’ independent legal counsel on their behalf at the start of the Board’s annual contract renewal process earlier in 2012. In approving the Advisory Agreements, the Board did not identify any particular information or consideration that was all-important or controlling, and each Trustee likely attributed different weights to various factors.
Nature, extent and quality of services
The Board received and considered various information regarding the nature, extent and quality of services provided to the Fund by Funds Management and Wells Capital Management under the Advisory Agreements. The Board also received and considered, among other things, information about the background and experience of senior management of Funds Management, and the qualifications, backgrounds, tenures and responsibilities of the portfolio managers primarily responsible for the day-to-day portfolio management of the Fund.
The Board evaluated the ability of Funds Management and Wells Capital Management, based on their respective financial condition, resources, reputation and other attributes, to attract and retain qualified investment professionals, including research, advisory, and supervisory personnel. The Board further considered the compliance programs and compliance records of Funds Management and Wells Capital Management. In addition, the Board took into account the administrative services provided to the Fund by Funds Management and its affiliates.
The Board’s decision to approve the continuation of the Advisory Agreements was based on a comprehensive evaluation of information provided to it. In considering these matters, the Board considered not only the specific information presented in connection with the Meeting, but also the knowledge gained over time through interaction with Funds Management and Wells Capital Management about various topics, including Funds Management’s oversight of service providers. The above factors, together with those referenced below, are some of the most important, but not necessarily all, factors considered by the Board in concluding that the nature, extent and quality of the investment advisory services provided to the Fund by Funds Management and Wells Capital Management supported the re-approval of the Advisory Agreements. Although the Board considered the continuation of the Advisory Agreements for the Fund as part of the larger process of considering the continuation of the advisory agreements for all of the funds in the complex, its decision to continue the Advisory Agreements for the Fund was ultimately made on a fund-by-fund basis.
Fund performance and expenses
The Board considered the performance results for the Fund over various time periods ended December 31, 2011. The Board also considered these results in comparison to the median performance of a universe of relevant funds (the “Universe”) that was determined by Lipper Inc. (“Lipper”) to be similar to the Fund, and in comparison to the Fund’s
Table of Contents
| Other Information (Unaudited) | Wells Fargo Advantage VT Opportunity Fund | 27 |
benchmark index and to other comparative data. Lipper is an independent provider of investment company data. The Board received a description of the methodology used by Lipper to select the mutual funds in the Universe. The Board noted that the performance of the Fund was higher than the median performance of the Universe for all periods under review, except for the one-year period. The Board also noted that the performance of the Fund was higher than its benchmark, the Lipper VUF Multi-Cap Core Funds Index, for the periods under review, except for the one-year period. As part of its review, the Board received an analysis of, and discussed factors contributing to, the recent performance of the Fund. The Board was satisfied that the Fund’s investment performance was being appropriately monitored and that Funds Management and Wells Capital Management were taking appropriate actions with respect to the Fund’s investment performance.
The Board received and considered information regarding the Fund’s contractual advisory fee and net operating expense ratios and their various components, including actual management fees (which reflect fee waivers, if any), transfer agent, custodian and other non-management fees, Rule 12b-1 and non-Rule 12b-1 fees, service fees and fee waiver and expense reimbursement arrangements. The Board also considered these ratios in comparison to the median ratios of an expense Universe and a narrower expense group of mutual funds (each, an “Expense Group”) that was determined by Lipper to be similar to the Fund. The Board received a description of the methodology used by Lipper to select the mutual funds in the Fund’s Expense Group. The Board noted that the net operating expense ratio of the Fund was in range of the Fund’s Expense Group’s median net operating expense ratio.
Based on the above-referenced considerations and other factors, the Board concluded that the overall performance and expense structure of the Fund supported the re-approval of the Advisory Agreements for the Fund.
Investment advisory and sub-advisory fee rates
The Board reviewed and considered the contractual investment advisory fee rate that is payable by the Fund to Funds Management for investment advisory services (the “Advisory Agreement Rate”), both on a stand-alone basis and on a combined basis with the Fund’s administration fee rate. The Board took into account the separate administrative and other services covered by the administration fee rate. The Board also reviewed and considered the contractual investment sub-advisory fee rate that is payable by Funds Management to Wells Capital Management for investment sub-advisory services (the “Sub-Advisory Agreement Rate”). In addition, the Board reviewed and considered the existing fee waiver/cap arrangements applicable to the Advisory Agreement Rate and considered the Advisory Agreement Rate after taking the waivers/caps into account (the “Net Advisory Rate”).
The Board received and considered information comparing the Advisory Agreement Rate and Net Advisory Rate, combined with the administration fee rates, with those of other funds in the Fund’s Expense Group median. The Board noted that the Advisory Agreement Rate and Net Advisory Rate for the Fund were in range of the median rates for the Fund’s Expense Group.
The Board also received and considered information about the nature and extent of services offered and fee rates charged by Funds Management and Wells Capital Management to other types of clients. In this regard, the Board received information about differences between the services, and the compliance, reporting, and other legal burdens and risks of providing investment advice to mutual funds and those associated with providing advice to non-mutual fund clients such as collective funds or institutional separate accounts.
The Board determined that the Advisory Agreement Rate for the Fund, both with and without the administration fee rate and before and after waivers, was reasonable in light of the Fund’s Expense Group information, the net expense ratio commitments, the services covered by the Advisory Agreements and other information provided. The Board also reviewed and considered the Sub-Advisory Agreement Rate and concluded that the Sub-Advisory Agreement Rate was reasonable in light of the services covered by the Sub-Advisory Agreement and other information provided.
Profitability
The Board received and considered a profitability analysis of Funds Management, as well as an analysis of the profitability to the collective Wells Fargo businesses that provide services to the Fund. It considered that the information provided to it was necessarily estimated, and that the profitability information provided to it, especially on a fund-by-fund basis, did not necessarily provide a precise tool for evaluating the appropriateness of the Fund’s Advisory Agreement Rate in
Table of Contents
| 28 | Wells Fargo Advantage VT Opportunity Fund | Other Information (Unaudited) |
isolation. It noted that the levels of profitability reported on a fund-by-fund basis varied widely, depending on, among other things, the size and type of fund. The Board concluded that the profitability reported by Funds Management was not unreasonable.
The Board did not consider separate profitability information with respect to Wells Capital Management, because, as an affiliate of Funds Management, its profitability information was subsumed in the collective Wells Fargo profitability analysis provided by Funds Management.
Economies of scale
With respect to possible economies of scale, the Board reviewed the breakpoints in the Fund’s advisory fee and/or administration fee structure, which operate generally to reduce the expenses of the Fund (as a percentage of Fund assets) as the Fund grows in size. It considered that, as a fund shrinks in size, breakpoints conversely result in increasing fee levels. The Board noted that it would have on-going opportunities to review the appropriate levels of breakpoints in the future, and concluded that the breakpoints as implemented appeared to be a reasonable step toward sharing economies of scale, if any, with the Fund. However, the Board acknowledged the inherent limitations of any analysis of economies of scale and of any attempt to correlate breakpoints with such economies, stemming largely from the Board’s understanding that economies of scale are realized, if at all, across a variety of products and services, not just with respect to a single fund.
Other benefits to Funds Management and Wells Capital Management
The Board received and considered information regarding potential “fall-out” or ancillary benefits received by Funds Management and its affiliates, including Wells Capital Management, as a result of their relationship with the Fund. Ancillary benefits could include, among others, benefits directly attributable to the relationship of Funds Management and Wells Capital Management with the Fund and benefits potentially derived from an increase in Funds Management’s and Wells Capital Management’s business as a result of their relationship with the Fund (such as the ability to market to shareholders other financial products offered by Funds Management and its affiliates, including Wells Capital Management).
The Board considered that Wells Fargo Funds Distributor, LLC, an affiliate of Funds Management, serves as distributor to the Fund and receives certain compensation for those services. The Board noted that various financial institutions, including affiliates of Funds Management, may receive distribution-related fees, shareholder servicing payments (including amounts derived from payments under Rule 12b-1 plans) and sub-transfer agency fees in respect of shares sold or held through them and services provided.
The Board also reviewed information about whether and to what extent soft dollar credits are sought and how any such credits are utilized and any benefits that may be realized by using an affiliated broker.
Other factors and broader review
The Board also considered the markets for distribution of the Fund’s shares, including the channels through which the Fund’s shares are offered and sold. The Board noted that the Fund is part of one of the few fund families that have both direct-to-fund and intermediary distribution channels. As discussed above, the Board reviews detailed materials received from Funds Management and Wells Capital Management annually as part of the re-approval process under Section 15 of the 1940 Act and also reviews and assesses information about the quality of the services that the Fund receives throughout the year. In this regard, the Board has reviewed reports of Funds Management at each of its quarterly meetings, which include, among other things, portfolio reviews and performance reports. In addition, the Board confers with portfolio managers at various times throughout the year.
Conclusion
After considering the above-described factors and based on its deliberations and its evaluation of the information described above, the Board unanimously approved the continuation of the Advisory Agreements for an additional one-year period.
Table of Contents
| List of Abbreviations | Wells Fargo Advantage VT Opportunity Fund | 29 |
The following is a list of common abbreviations for terms and entities which may have appeared in this report.
| ACB | — Agricultural Credit Bank |
| ADR | — American Depository Receipt |
| ADS | — American Depository Shares |
| AGC-ICC | — Assured Guaranty Corporation - Insured Custody Certificates |
| AGM | — Assured Guaranty Municipal |
| AMBAC | — American Municipal Bond Assurance Corporation |
| AMT | — Alternative Minimum Tax |
| AUD | — Australian Dollar |
| BAN | — Bond Anticipation Notes |
| BHAC | — Berkshire Hathaway Assurance Corporation |
| BRL | — Brazil Real |
| CAB | — Capital Appreciation Bond |
| CAD | — Canadian Dollar |
| CCAB | — Convertible Capital Appreciation Bond |
| CDA | — Community Development Authority |
| CDO | — Collateralized Debt Obligation |
| CHF | — Swiss Franc |
| COP | — Certificate of Participation |
| CR | — Custody Receipts |
| DKK | — Danish Krone |
| DRIVER | — Derivative Inverse Tax-Exempt Receipts |
| DW&P | — Department of Water & Power |
| DWR | — Department of Water Resources |
| ECFA | — Educational & Cultural Facilities Authority |
| EDA | — Economic Development Authority |
| EDFA | — Economic Development Finance Authority |
| ETF | — Exchange-Traded Fund |
| EUR | — Euro |
| FFCB | — Federal Farm Credit Bank |
| FGIC | — Financial Guaranty Insurance Corporation |
| FGLMC | — Federal Government Loan Mortgage Company |
| FHA | — Federal Housing Authority |
| FHLB | — Federal Home Loan Bank |
| FHLMC | — Federal Home Loan Mortgage Corporation |
| FICO | — The Financing Corporation |
| FNMA | — Federal National Mortgage Association |
| FSA | — Farm Service Agency |
| GBP | — Great British Pound |
| GDR | — Global Depository Receipt |
| GNMA | — Government National Mortgage Association |
| GO | — General Obligation |
| HCFR | — Healthcare Facilities Revenue |
| HEFA | — Health & Educational Facilities Authority |
| HEFAR | — Higher Education Facilities Authority Revenue |
| HFA | — Housing Finance Authority |
| HFFA | — Health Facilities Financing Authority |
| HKD | — Hong Kong Dollar |
| HUF | — Hungarian Forint |
| IBC | — Insured Bond Certificate |
| IDA | — Industrial Development Authority |
| IDAG | — Industrial Development Agency |
| IDR | — Industrial Development Revenue |
| IEP | — Irish Pound |
| JPY | — Japanese Yen |
| KRW | — Republic of Korea Won |
| LIBOR | — London Interbank Offered Rate |
| LIQ | — Liquidity Agreement |
| LLC | — Limited Liability Company |
| LLP | — Limited Liability Partnership |
| LOC | — Letter of Credit |
| LP | — Limited Partnership |
| MBIA | — Municipal Bond Insurance Association |
| MFHR | — Multi-Family Housing Revenue |
| MSTR | — Municipal Securities Trust Receipts |
| MTN | — Medium Term Note |
| MUD | — Municipal Utility District |
| MXN | — Mexican Peso |
| MYR | — Malaysian Ringgit |
| NATL-RE | — National Public Finance Guarantee Corporation |
| NOK | — Norwegian Krone |
| NZD | — New Zealand Dollar |
| PCFA | — Pollution Control Finance Authority |
| PCR | — Pollution Control Revenue |
| PFA | — Public Finance Authority |
| PFFA | — Public Facilities Financing Authority |
| PFOTER | — Puttable Floating Option Tax-Exempt Receipts |
| plc | — Public Limited Company |
| PLN | — Polish Zloty |
| PUTTER | — Puttable Tax-Exempt Receipts |
| R&D | — Research & Development |
| RDA | — Redevelopment Authority |
| RDFA | — Redevelopment Finance Authority |
| REIT | — Real Estate Investment Trust |
| ROC | — Reset Option Certificates |
| SAVRS | — Select Auction Variable Rate Securities |
| SBA | — Small Business Authority |
| SEK | — Swedish Krona |
| SFHR | — Single Family Housing Revenue |
| SFMR | — Single Family Mortgage Revenue |
| SGD | — Singapore Dollar |
| SKK | — Slovakian Koruna |
| SPA | — Standby Purchase Agreement |
| SPDR | — Standard & Poor’s Depositary Receipts |
| STRIPS | — Separate Trading of Registered Interest and Principal Securities |
| TAN | — Tax Anticipation Notes |
| TBA | — To Be Announced |
| TIPS | — Treasury Inflation-Protected Securities |
| TRAN | — Tax Revenue Anticipation Notes |
| TCR | — Transferable Custody Receipts |
| TRY | — Turkish Lira |
| TTFA | — Transportation Trust Fund Authority |
| TVA | — Tennessee Valley Authority |
| XLCA | — XL Capital Assurance |
| ZAR | — South African Rand |
Table of Contents
This page is intentionally left blank.
Table of Contents


FOR MORE INFORMATION
More information about Wells Fargo Advantage Funds is available free upon request. To obtain literature, please write, e-mail, visit the Fund’s Web site, or call:
Wells Fargo Advantage Funds
P.O. Box 8266
Boston, MA 02266-8266
E-mail: wfaf@wellsfargo.com
Web site: wellsfargoadvantagefunds.com
Individual investors: 1-800-222-8222
Retail investment professionals: 1-888-877-9275
Institutional investment professionals: 1-866-765-0778
This report and the financial statements contained herein are submitted for the general information of the shareholders of Wells Fargo Advantage Funds. If this report is used for promotional purposes, distribution of the report must be accompanied or preceded by a current prospectus. For a current prospectus and, if available, a summary prospectus containing more complete information, including charges and expenses, call 1-800-222-8222 or visit the Fund’s Web site at wellsfargoadvantagefunds.com . Please consider the investment objectives, risks, charges, and expenses of the investment carefully before investing. This and other information about Wells Fargo Advantage Funds can be found in the current prospectus. Read the prospectus carefully before you invest or send money.
Wells Fargo Funds Management, LLC, a wholly owned subsidiary of Wells Fargo & Company, provides investment advisory and administrative services for Wells Fargo Advantage Funds. Other affiliates of Wells Fargo & Company provide subadvisory and other services for the Funds. The Funds are distributed by Wells Fargo Funds Distributor, LLC, Member FINRA/SIPC, an affiliate of Wells Fargo & Company.
NOT FDIC INSURED ¡ NO BANK GUARANTEE ¡ MAY LOSE VALUE
© 2012 Wells Fargo Funds Management, LLC. All rights reserved.
210667 08-12 SVT6/SAR143 06-12 |
Table of Contents

Wells Fargo Advantage VT Small Cap Growth Fund

Semi-Annual Report
June 30, 2012

Table of Contents
Reduce clutter. Save trees.
Sign up for electronic delivery of prospectuses and shareholder reports at wellsfargo.com/advantagedelivery
| 2 | ||||
| 4 | ||||
| 6 | ||||
| 7 | ||||
Financial Statements | ||||
| 12 | ||||
| 13 | ||||
| 14 | ||||
| 15 | ||||
| 17 | ||||
| 22 | ||||
| 28 | ||||
The views expressed and any forward-looking statements are as of June 30, 2012, unless otherwise noted, and are those of the Fund managers and/or Wells Fargo Funds Management, LLC. Discussions of individual securities, or the markets generally, or any Wells Fargo Advantage Fund are not intended as individual recommendations. Future events or results may vary significantly from those expressed in any forward-looking statements; the views expressed are subject to change at any time in response to changing circumstances in the market. Wells Fargo Funds Management, LLC, disclaims any obligation to publicly update or revise any views expressed or forward-looking statements.
NOT FDIC INSURED ¡ NO BANK GUARANTEE ¡ MAY LOSE VALUE
Table of Contents

WELLS FARGO INVESTMENT HISTORY
| 1932 | Keystone creates one of the first mutual fund families. | |
| 1971 | Wells Fargo & Company introduces one of the first institutional index funds. | |
| 1978 | Wells Fargo applies Markowitz and Sharpe’s research on Modern Portfolio Theory to introduce one of the industry’s first Tactical Asset Allocation (TAA) models in institutional separately managed accounts. | |
| 1984 | Wells Fargo Stagecoach Funds launches its first asset allocation fund. | |
| 1989 | The Tactical Asset Allocation (TAA) Model is first applied to Wells Fargo’s asset allocation mutual funds. | |
| 1994 | Wells Fargo introduces the LifePath Funds, one of the first suites of target date funds (now the Wells Fargo Advantage Dow Jones Target Date FundsSM). | |
| 1996 | Evergreen Investments and Keystone Funds merge. | |
| 1997 | Wells Fargo launches Wells Fargo Advantage WealthBuilder PortfoliosSM, a fund-of-funds suite of products that includes the use of quantitative models to shift assets among investment styles. | |
| 1999 | Norwest Advantage Funds and Stagecoach Funds are reorganized into Wells Fargo Funds after the merger of Norwest and Wells Fargo. | |
| 2002 | Evergreen Retail and Evergreen Institutional companies form the umbrella asset management company, Evergreen Investments. | |
| 2005 | The integration of Strong Funds with Wells Fargo Funds creates Wells Fargo Advantage Funds, resulting in one of the top 20 mutual fund companies in the United States. | |
| 2006 | Wells Fargo Advantage Funds relaunches the target date product line as Wells Fargo Advantage Dow Jones Target Date Funds. | |
| 2010 | The mergers and reorganizations of Evergreen and Wells Fargo Advantage mutual funds are completed, unifying the families under the brand of Wells Fargo Advantage Funds. | |
Wells Fargo Advantage Funds®
Wells Fargo Advantage Funds skillfully guides institutions, financial advisors, and individuals through the investment terrain to help them reach their financial objectives. Everything we do on behalf of investors is backed by our unique combination of qualifications.
Strength
Our organization is built on the standards of integrity and service established by our parent company—Wells Fargo & Company—more than 150 years ago. And, because we’re part of a highly diversified financial enterprise, we offer the depth of resources to help investors succeed.
Expertise
Our multi-boutique model offers investors access to the independent thinking of premier investment managers that have been chosen for their time-tested strategies. While each team specializes in a specific investment strategy, collectively they provide investors a wide choice of distinct investment styles. Our dedication to investment excellence doesn’t end with our expertise in manager selection—risk management, analysis, and rigorous ongoing review seek to ensure each manager’s investment process remains consistent.
Partnership
Our collaborative approach is built around understanding the needs and goals of our clients. By adhering to core principles of sound judgment and steady guidance, we support you through every stage of the investment decision process.
Carefully consider a fund’s investment objectives, risks, charges, and expenses before investing. For a current prospectus and, if available, a summary prospectus, containing this and other information, visit wellsfargoadvantagefunds.com. Read it carefully before investing.
Wells Fargo Funds Management, LLC, a wholly owned subsidiary of Wells Fargo & Company, provides investment advisory and administrative services for Wells Fargo Advantage Funds®. Other affiliates of Wells Fargo & Company provide subadvisory and other services for the Funds. The Funds are distributed by Wells Fargo Funds Distributor, LLC, Member FINRA/SIPC, an affiliate of Wells Fargo & Company.
“Dow Jones®” and “Dow Jones Target Date IndexesSM” are service marks of Dow Jones Trademark Holdings, LLC (“Dow Jones”), have been licensed to CME Group Index Services LLC (“CME Indexes”) and have been sublicensed for use for certain purposes by Global Index Advisors, Inc, and Wells Fargo Funds Management, LLC. The Wells Fargo Advantage Dow Jones Target Date FundsSM based on the Dow Jones Target Date IndexesSM, are not sponsored, endorsed, sold or promoted by Dow Jones, CME Indexes or their respective affiliates and none of them makes any representation regarding the advisability of investing in such product(s).
NOT FDIC INSURED ¡ NO BANK GUARANTEE ¡ MAY LOSE VALUE
Not part of semi-annual report.
Table of Contents
Wells Fargo Advantage Funds offers more than 110 mutual funds across a wide range of asset classes, representing over $207 billion in assets under management, as of June 30, 2012.
| Equity Funds | ||||
Asia Pacific Fund | Enterprise Fund† | Opportunity Fund† | ||
C&B Large Cap Value Fund | Equity Value Fund | Precious Metals Fund | ||
C&B Mid Cap Value Fund | Global Opportunities Fund | Premier Large Company Growth Fund | ||
Capital Growth Fund | Growth Fund | Small Cap Opportunities Fund | ||
Common Stock Fund | Index Fund | Small Cap Value Fund | ||
Disciplined U.S. Core Fund | International Equity Fund | Small Company Growth Fund | ||
Discovery Fund† | International Value Fund | Small Company Value Fund | ||
Diversified Equity Fund | Intrinsic Small Cap Value Fund | Small/Mid Cap Core Fund | ||
Diversified International Fund | Intrinsic Value Fund | Small/Mid Cap Value Fund | ||
Diversified Small Cap Fund | Intrinsic World Equity Fund | Special Mid Cap Value Fund | ||
Emerging Growth Fund | Large Cap Core Fund | Special Small Cap Value Fund | ||
Emerging Markets Equity Fund | Large Cap Growth Fund | Specialized Technology Fund | ||
Emerging Markets Equity Income Fund | Large Company Value Fund | Traditional Small Cap Growth Fund | ||
Endeavor Select Fund† | Omega Growth Fund | Utility and Telecommunications Fund | ||
| Bond Funds | ||||
Adjustable Rate Government Fund | Inflation-Protected Bond Fund | Short-Term Bond Fund | ||
California Limited-Term Tax-Free Fund | Intermediate Tax/AMT-Free Fund | Short-Term High Yield Bond Fund | ||
California Tax-Free Fund | International Bond Fund | Short-Term Municipal Bond Fund | ||
Colorado Tax-Free Fund | Minnesota Tax-Free Fund | Strategic Municipal Bond Fund | ||
Emerging Markets Local Bond Fund | Municipal Bond Fund | Total Return Bond Fund | ||
Government Securities Fund | North Carolina Tax-Free Fund | Ultra Short-Term Income Fund | ||
High Income Fund | Pennsylvania Tax-Free Fund | Ultra Short-Term Municipal Income Fund | ||
High Yield Bond Fund | Short Duration Government Bond Fund | Wisconsin Tax-Free Fund | ||
Income Plus Fund | ||||
| Asset Allocation Funds | ||||
Absolute Return Fund | WealthBuilder Equity Portfolio† | Target 2020 Fund† | ||
Asset Allocation Fund | WealthBuilder Growth Allocation Portfolio† | Target 2025 Fund† | ||
Conservative Allocation Fund | WealthBuilder Growth Balanced Portfolio† | Target 2030 Fund† | ||
Diversified Capital Builder Fund | WealthBuilder Moderate Balanced Portfolio† | Target 2035 Fund† | ||
Diversified Income Builder Fund | WealthBuilder Tactical Equity Portfolio† | Target 2040 Fund† | ||
Growth Balanced Fund | Target Today Fund† | Target 2045 Fund† | ||
Index Asset Allocation Fund | Target 2010 Fund† | Target 2050 Fund† | ||
Moderate Balanced Fund | Target 2015 Fund† | Target 2055 Fund† | ||
WealthBuilder Conservative Allocation Portfolio† | ||||
| Money Market Funds | ||||
100% Treasury Money Market Fund | Heritage Money Market Fund† | National Tax-Free Money Market Fund | ||
California Municipal Money Market Fund | Money Market Fund | Prime Investment Money Market Fund | ||
Cash Investment Money Market Fund | Municipal Cash Management Money Market Fund | Treasury Plus Money Market Fund | ||
Government Money Market Fund | Municipal Money Market Fund | |||
| Variable Trust Funds1 | ||||
VT Discovery Fund† | VT Intrinsic Value Fund | VT Small Cap Growth Fund | ||
VT Index Asset Allocation Fund | VT Omega Growth Fund | VT Small Cap Value Fund | ||
VT International Equity Fund | VT Opportunity Fund† | VT Total Return Bond Fund |
An investment in a money market fund is not insured or guaranteed by the Federal Deposit Insurance Corporation or any other government agency. Although the Wells Fargo Advantage Money Market Funds seek to preserve the value of your investment at $1.00 per share, it is possible to lose money by investing in a money market fund.
| 1. | The Variable Trust Funds are generally available only through insurance company variable contracts. |
| † | In this report, the Wells Fargo Advantage Discovery FundSM, Wells Fargo Advantage Endeavor Select FundSM, Wells Fargo Advantage Enterprise FundSM, Wells Fargo Advantage Opportunity FundSM, Wells Fargo Advantage WealthBuilder Conservative Allocation PortfolioSM, Wells Fargo Advantage WealthBuilder Equity PortfolioSM, Wells Fargo Advantage WealthBuilder Growth Allocation PortfolioSM, Wells Fargo Advantage WealthBuilder Growth Balanced PortfolioSM, Wells Fargo Advantage WealthBuilder Moderate Balanced PortfolioSM, Wells Fargo Advantage WealthBuilder Tactical Equity PortfolioSM, Wells Fargo Advantage Dow Jones Target Today FundSM, Wells Fargo Advantage Dow Jones Target 2010 FundSM, Wells Fargo Advantage Dow Jones Target 2015 FundSM, Wells Fargo Advantage Dow Jones Target 2020 FundSM, Wells Fargo Advantage Dow Jones Target 2025 FundSM, Wells Fargo Advantage Dow Jones Target 2030 FundSM, Wells Fargo Advantage Dow Jones Target 2035 FundSM, Wells Fargo Advantage Dow Jones Target 2040 FundSM, Wells Fargo Advantage Dow Jones Target 2045 FundSM, Wells Fargo Advantage Dow Jones Target 2050 FundSM, Wells Fargo Advantage Dow Jones Target 2055 FundSM, Wells Fargo Advantage Heritage Money Market FundSM, Wells Fargo Advantage VT Discovery FundSM, and Wells Fargo Advantage VT Opportunity FundSM are referred to as the Discovery Fund, Endeavor Select Fund, Enterprise Fund, Opportunity Fund, WealthBuilder Conservative Allocation Portfolio, WealthBuilder Equity Portfolio, WealthBuilder Growth Allocation Portfolio, WealthBuilder Growth Balanced Portfolio, WealthBuilder Moderate Balanced Portfolio, WealthBuilder Tactical Equity Portfolio, Target Today Fund, Target 2010 Fund, Target 2015 Fund, Target 2020 Fund, Target 2025 Fund, Target 2030 Fund, Target 2035 Fund, Target 2040 Fund, Target 2045 Fund, Target 2050 Fund, Target 2055 Fund, Heritage Money Market Fund, VT Discovery Fund, and VT Opportunity Fund, respectively. |
Not part of semi-annual report.
Table of Contents
| 2 | Wells Fargo Advantage VT Small Cap Growth Fund | Letter to Shareholders (Unaudited) |

Karla M. Rabusch,
President
Wells Fargo Advantage Funds
The period was marked by continued concerns about the possible global economic effects of the ongoing European sovereign debt crisis that began in Greece and later spread to the larger economies of Italy and Spain.
In contrast to worrisome data from the eurozone, U.S. economic data remained moderately positive.
Dear Valued Shareholder:
We are pleased to offer you this semi-annual report for the Wells Fargo Advantage VT Small Cap Growth Fund for the six-month period that ended June 30, 2012. The period was marked by continued concerns about the possible global economic effects of the ongoing European sovereign debt crisis that began in Greece and later spread to the larger economies of Italy and Spain. Widespread support from central banks helped push developed market indexes to gains despite considerable intra-period volatility.
Macroeconomic optimism faded as global growth slowed and worries rose.
Prior to and throughout the reporting period, concerns about the eurozone sovereign debt situation returned to center stage and dominated stock markets around the globe. Investors became increasingly concerned that Greece would default on its debt, a scenario that only seemed more likely as eurozone leaders began to openly discuss a “voluntary” haircut on Greek debt for private investors. Because many eurozone banks owned Greek debt and many U.S. banks had financial ties to eurozone banks, investors worried about the effects of such an event on the financial systems and on the global economy.
The Greek credit crisis was seemingly addressed in March 2012 when the Greek government came to an agreement with its creditors, allowing the country to write down the principal on most of its bonds in exchange for increased financial austerity. The Greek agreement, combined with unprecedented support for eurozone banks by the European Central Bank, seemed to calm investor concerns, at least temporarily.
By the end of the reporting period, however, the agreement seemed on the verge of unraveling. Legislative elections in May left no single party with enough seats to form a government, and none of the parties was able to form a ruling coalition. A pro-bailout party won the subsequent June elections, but the Greek economy remained so weak that investors questioned whether the country would be able to meet its economic targets from the March agreement. Even more worrisome, in May 2012, Spain nationalized Bankia, putting more than $19 billion into the bank after it suffered heavy losses from property loans. The move refocused investor attention on Spain’s weak economy and depressed property sector, and Spanish bonds sold off. Moreover, news reports indicated that Greeks and Spaniards were pulling money from their country’s banks in favor of German and Swiss banks. By mid-June, analysts were openly discussing the possibility of a crisis within the European banking system.
The U.S. economy reported relatively solid news.
In contrast to worrisome data from the eurozone, U.S. economic data remained moderately positive. Reported real gross domestic product (GDP) growth came in at an annualized rate of 3.0% in the fourth quarter of 2011 compared with the prior quarter. Real GDP growth decelerated to a 1.9% annualized rate in the first quarter of 2012 but remained solidly in positive territory. In addition, the major banks appeared to have taken steps toward repairing their balance sheets; in March, the Federal Reserve (Fed) announced that 15 of the 19 major banks had passed a “stress test” in which the Fed attempted to gauge whether the banks could survive a severe recession that included a 50% drop in the stock market and a 21% percent decline in housing prices.
Table of Contents
| Letter to Shareholders (Unaudited) | Wells Fargo Advantage VT Small Cap Growth Fund | 3 |
The main piece of negative economic data was the unemployment rate, which remained at relatively high levels, beginning the period at 8.3% and ending it at 8.2%. Toward the end of the period, data indicated that the U.S. economy was adding fewer jobs than expected, leading to concerns that the country’s economic growth was slowing.
Major stock indexes posted positive returns.
Even though investor worries about the sovereign debt crisis within the eurozone caused considerable stock market volatility, the combination of central bank support and relatively strong U.S. economic numbers pushed major stock market indexes into the black, both for developed markets and for major emerging markets. Within the U.S., large-cap stocks modestly outperformed small-cap stocks, and growth stocks edged past value stocks.
We use time-tested investment strategies, even as many variables are at work in the market.
The full effect of the credit crisis remains unknown. Elevated unemployment and debt defaults continue to pressure consumers and businesses alike. In our experience, strict adherence to time-tested investment strategies has its rewards. As a whole, Wells Fargo Advantage Funds represents investments across a range of asset classes and investment styles, giving you an opportunity to create a diversified investment portfolio. While diversification may not prevent losses in a downturn, we believe it helps in managing risk.
Thank you for choosing to invest with Wells Fargo Advantage Funds. We appreciate your confidence in us and remain committed to helping you meet your financial needs. For current information about your fund investments, contact your investment professional, visit our Web site at wellsfargoadvantagefunds.com, or call us directly at 1-800-222-8222. We are available 24 hours a day, 7 days a week.
Sincerely,

Karla M. Rabusch
President
Wells Fargo Advantage Funds
Table of Contents
| 4 | Wells Fargo Advantage VT Small Cap Growth Fund | Performance Highlights (Unaudited) |
INVESTMENT OBJECTIVE
The Fund seeks long-term capital appreciation.
ADVISER
Wells Fargo Funds Management, LLC
SUB-ADVISER
Wells Capital Management Incorporated
PORTFOLIO MANAGERS
Joseph M. Eberhardy, CFA, CFP
Thomas C. Ognar, CFA
Bruce C. Olson, CFA
FUND INCEPTION
May 1, 1995
| TEN LARGEST EQUITY HOLDINGS1 (AS OF JUNE 30, 2012) | ||||
Akorn Incorporated | 4.03% | |||
Endologix Incorporated | 2.68% | |||
Align Technology Incorporated | 2.53% | |||
Life Time Fitness Incorporated | 2.38% | |||
Wright Express Corporation | 2.20% | |||
Volcano Corporation | 2.17% | |||
Financial Engines Incorporated | 2.15% | |||
Chart Industries Incorporated | 2.00% | |||
Titan Machinery Incorporated | 1.99% | |||
NxStage Medical Incorporated | 1.98% | |||
| SECTOR DISTRIBUTION2 (AS OF JUNE 30, 2012) | ||
 | ||
| 1. | The ten largest equity holdings are calculated based on the value of the securities divided by total net assets of the Fund. Holdings are subject to change and may have changed since the date specified. |
| 2. | Sector distribution is subject to change and is calculated based on the total long-term investments of the Fund. |
Table of Contents
| Performance Highlights (Unaudited) | Wells Fargo Advantage VT Small Cap Growth Fund | 5 |
AVERAGE ANNUAL TOTAL RETURN3 (%) (AS OF JUNE 30, 2012)
| Expense Ratios4 | ||||||||||||||||||||||||||||
| Inception Date | 6 Months* | 1 Year | 5 Year | 10 Year | Gross | Net5 | ||||||||||||||||||||||
Class 1 | 07/16/2010 | 8.04 | (1.65 | ) | 2.87 | 8.49 | 0.96% | 0.96% | ||||||||||||||||||||
Class 2 | 05/01/1995 | 7.94 | (1.89 | ) | 2.77 | 8.44 | 1.21% | 1.21% | ||||||||||||||||||||
Russell 2000® Growth Index6 | 8.81 | (2.71 | ) | 1.99 | 7.39 | |||||||||||||||||||||||
| * | Returns for periods of less than one year are not annualized. |
Figures quoted represent past performance, which is no guarantee of future results and do not reflect the deduction of taxes that a shareholder may pay on fund distributions or the redemption of fund shares. Investment return and principal value of an investment will fluctuate so that an investor’s shares, when redeemed, may be worth more or less than their original cost. Current performance may be lower or higher than the performance data quoted and assumes the reinvestment of dividends and capital gains. Current month-end performance is available by calling 1-866-765-0778. Performance figures of the Fund do not reflect fees charged pursuant to the terms of variable life insurance policies and variable annuity contracts.
Index returns do not include transaction costs associated with buying and selling securities, any mutual fund fees or expenses or any taxes. It is not possible to invest directly in an index.
Stock fund values fluctuate in response to the activities of individual companies and general market and economic conditions. Smaller company stocks tend to be more volatile and less liquid than those of larger companies. Consult the Fund’s prospectus for additional information on these and other risks.
Please refer to the prospectus provided by your participating insurance company for detailed information describing the separate accounts for information regarding surrender charges, mortality and expense risk fees and other charges that may be assessed by the participating insurance companies.
| 3. | Historical performance shown for Class 1 shares prior to their inception reflects the performance of Class 2 shares, and includes the higher expenses applicable to Class 2 shares. If these expenses had not been included, returns would be higher. |
| 4. | Reflects the expense ratios as stated in the most recent prospectuses. |
| 5. | The Adviser has committed through July 18, 2013 to waive fees and/or reimburse expenses to the extent necessary to cap the Fund’s Total Annual Fund Operating Expenses After Fee Waiver, excluding certain expenses, at 0.95% for Class 1 and 1.20% for Class 2. Without this cap, the Fund’s returns would have been lower. |
| 6. | Russell 2000® Growth Index measures the performance of those Russell 2000 companies with higher price-to-book ratios and higher forecasted growth values. You cannot invest directly in an index. |
Table of Contents
| 6 | Wells Fargo Advantage VT Small Cap Growth Fund | Fund Expenses (Unaudited) |
As a shareholder of the Fund, you incur ongoing costs, including management fees, distribution (12b-1) fees, and other Fund expenses. This example is intended to help you understand your ongoing costs (in dollars) of investing in the Fund and to compare these costs with the ongoing costs of investing in other mutual funds.
The example is based on an investment of $1,000 invested at the beginning of the six-month period and held for the entire period from January 1, 2012 to June 30, 2012.
Actual Expenses
The “Actual” line of the table below provides information about actual account values and actual expenses. You may use the information in this line, together with the amount you invested, to estimate the expenses that you paid over the period. Simply divide your account value by $1,000 (for example, an $8,600 account value divided by $1,000 = 8.6), then multiply the result by the number in the “Actual” line under the heading entitled “Expenses Paid During Period” for your applicable class of shares to estimate the expenses you paid on your account during this period.
Hypothetical Example for Comparison Purposes
The “Hypothetical” line of the table below provides information about hypothetical account values and hypothetical expenses based on the Fund’s actual expense ratio and an assumed rate of return of 5% per year before expenses, which is not the Fund’s actual return. The hypothetical account values and expenses may not be used to estimate the actual ending account balance or expenses you paid for the period. You may use this information to compare the ongoing costs of investing in the Fund and other funds. To do so, compare this 5% hypothetical example with the 5% hypothetical examples that appear in the shareholder reports of the other funds.
Please note that the expenses shown in the table are meant to highlight your ongoing costs only and do not reflect any separate account charges assessed by participating insurance companies. Therefore, the “Hypothetical” line of the table is useful in comparing ongoing costs only, and will not help you determine the relative total costs of owning different funds. In addition, if these separate account charges assessed by participating insurance companies were included, your costs would have been higher.
| Beginning Account Value 01-01-2012 | Ending Account Value 06-30-2012 | Expenses Paid During the Period1 | Net Annual Expense Ratio | |||||||||||||
Class 1 | ||||||||||||||||
Actual | $ | 1,000.00 | $ | 1,080.42 | $ | 4.91 | 0.95 | % | ||||||||
Hypothetical (5% return before expenses) | $ | 1,000.00 | $ | 1,020.14 | $ | 4.77 | 0.95 | % | ||||||||
Class 2 | ||||||||||||||||
Actual | $ | 1,000.00 | $ | 1,079.43 | $ | 6.20 | 1.20 | % | ||||||||
Hypothetical (5% return before expenses) | $ | 1,000.00 | $ | 1,018.90 | $ | 6.02 | 1.20 | % | ||||||||
| 1. | Expenses paid is equal to the annualized expense ratio of each class multiplied by the average account value over the period, multiplied by the number of days in the most recent fiscal half-year divided by the number of days in the fiscal year (to reflect the one-half year period). |
Table of Contents
| Portfolio of Investments—June 30, 2012 (Unaudited) | Wells Fargo Advantage VT Small Cap Growth Fund | 7 |
| Security Name | Shares | Value | ||||||||||
Common Stocks: 97.91% | ||||||||||||
Consumer Discretionary: 17.73% | ||||||||||||
| Hotels, Restaurants & Leisure: 6.24% | ||||||||||||
BJ’s Restaurants Incorporated «† | 112,180 | $ | 4,262,840 | |||||||||
Bravo Brio Restaurant Group Incorporated † | 66,066 | 1,177,957 | ||||||||||
Ignite Restaurant Group Incorporated † | 5,251 | 95,096 | ||||||||||
Life Time Fitness Incorporated Ǡ | 118,400 | 5,506,784 | ||||||||||
Scientific Games Corporation Class A † | 152,600 | 1,304,730 | ||||||||||
Shuffle Master Incorporated † | 149,242 | 2,059,540 | ||||||||||
| 14,406,947 | ||||||||||||
|
| |||||||||||
| Household Durables: 0.35% | ||||||||||||
SodaStream International Limited Ǡ | 19,900 | 815,303 | ||||||||||
|
| |||||||||||
| Internet & Catalog Retail: 3.12% | ||||||||||||
CafePress Incorporated † | 38,363 | 570,841 | ||||||||||
HomeAway Incorporated Ǡ | 120,654 | 2,623,018 | ||||||||||
Shutterfly Incorporated † | 130,953 | 4,018,948 | ||||||||||
| 7,212,807 | ||||||||||||
|
| |||||||||||
| Media: 1.35% | ||||||||||||
IMAX Corporation Ǡ | 130,100 | 3,126,303 | ||||||||||
|
| |||||||||||
| Specialty Retail: 5.00% | ||||||||||||
Asbury Automotive Group Incorporated † | 66,700 | 1,580,123 | ||||||||||
DSW Incorporated Class A « | 52,200 | 2,839,680 | ||||||||||
Hibbett Sports Incorporated Ǡ | 38,700 | 2,233,377 | ||||||||||
Mattress Firm Holding Corporation Ǡ | 24,848 | 753,143 | ||||||||||
Ulta Salon Cosmetics & Fragrance Incorporated | 7,000 | 653,660 | ||||||||||
Vitamin Shoppe Incorporated Ǡ | 63,700 | 3,499,041 | ||||||||||
| 11,559,024 | ||||||||||||
|
| |||||||||||
| Textiles, Apparel & Luxury Goods: 1.67% | ||||||||||||
Crocs Incorporated Ǡ | 40,700 | 657,305 | ||||||||||
Vera Bradley Incorporated Ǡ | 85,493 | 1,802,192 | ||||||||||
Warnaco Group Incorporated † | 33,000 | 1,405,140 | ||||||||||
| 3,864,637 | ||||||||||||
|
| |||||||||||
Consumer Staples: 2.55% | ||||||||||||
| Food & Staples Retailing: 2.55% | ||||||||||||
The Fresh Market Incorporated † | 77,900 | 4,177,777 | ||||||||||
United Natural Foods Incorporated Ǡ | 31,400 | 1,722,604 | ||||||||||
| 5,900,381 | ||||||||||||
|
| |||||||||||
Energy: 4.92% | ||||||||||||
| Energy Equipment & Services: 0.49% | ||||||||||||
Forum Energy Technologies Incorporated Ǡ | 57,246 | 1,127,174 | ||||||||||
|
| |||||||||||
The accompanying notes are an integral part of these financial statements.
Table of Contents
| 8 | Wells Fargo Advantage VT Small Cap Growth Fund | Portfolio of Investments—June 30, 2012 (Unaudited) |
| Security Name | Shares | Value | ||||||||||
| Oil, Gas & Consumable Fuels: 4.43% | ||||||||||||
Approach Resources Incorporated Ǡ | 116,400 | $ | 2,972,856 | |||||||||
Carrizo Oil & Gas Incorporated Ǡ | 67,756 | 1,592,944 | ||||||||||
Kodiak Oil & Gas Corporation † | 199,200 | 1,635,432 | ||||||||||
Laredo Petroleum Holdings Incorporated Ǡ | 92,759 | 1,929,387 | ||||||||||
Oasis Petroleum Incorporated Ǡ | 87,300 | 2,110,914 | ||||||||||
| 10,241,533 | ||||||||||||
|
| |||||||||||
Financials: 2.25% | ||||||||||||
| Capital Markets: 2.15% | ||||||||||||
Financial Engines Incorporated Ǡ | 231,800 | 4,972,110 | ||||||||||
|
| |||||||||||
| Insurance: 0.10% | ||||||||||||
eHealth Incorporated † | 14,500 | 234,145 | ||||||||||
|
| |||||||||||
Health Care: 21.59% | ||||||||||||
| Biotechnology: 0.72% | ||||||||||||
Cepheid Incorporated Ǡ | 18,400 | 823,400 | ||||||||||
Exact Sciences Corporation Ǡ | 78,820 | 844,950 | ||||||||||
| 1,668,350 | ||||||||||||
|
| |||||||||||
| Health Care Equipment & Supplies: 11.44% | ||||||||||||
Abiomed Incorporated Ǡ | 50,600 | 1,154,692 | ||||||||||
Align Technology Incorporated Ǡ | 174,900 | 5,852,154 | ||||||||||
DexCom Incorporated † | 118,800 | 1,539,648 | ||||||||||
Endologix Incorporated Ǡ | 400,999 | 6,191,425 | ||||||||||
Masimo Corporation Ǡ | 94,640 | 2,118,043 | ||||||||||
NxStage Medical Incorporated Ǡ | 273,020 | 4,575,815 | ||||||||||
Volcano Corporation † | 175,100 | 5,016,615 | ||||||||||
| 26,448,392 | ||||||||||||
|
| |||||||||||
| Health Care Providers & Services: 2.27% | ||||||||||||
Catalyst Health Solutions Incorporated † | 21,137 | 1,975,041 | ||||||||||
HMS Holdings Corporation Ǡ | 56,050 | 1,867,026 | ||||||||||
MWI Veterinary Supply Incorporated Ǡ | 13,700 | 1,407,949 | ||||||||||
| 5,250,016 | ||||||||||||
|
| |||||||||||
| Health Care Technology: 0.97% | ||||||||||||
SXC Health Solutions Corporation † | 22,540 | 2,236,193 | ||||||||||
|
| |||||||||||
| Pharmaceuticals: 6.19% | ||||||||||||
Akorn Incorporated Ǡ | 590,815 | 9,317,153 | ||||||||||
Impax Laboratories Incorporated Ǡ | 129,800 | 2,631,046 | ||||||||||
Jazz Pharmaceuticals plc Ǡ | 52,300 | 2,354,023 | ||||||||||
| 14,302,222 | ||||||||||||
|
| |||||||||||
The accompanying notes are an integral part of these financial statements.
Table of Contents
| Portfolio of Investments—June 30, 2012 (Unaudited) | Wells Fargo Advantage VT Small Cap Growth Fund | 9 |
| Security Name | Shares | Value | ||||||||||
Industrials: 14.96% | ||||||||||||
| Commercial Services & Supplies: 2.72% | ||||||||||||
InnerWorkings Incorporated † | 226,389 | $ | 3,063,043 | |||||||||
On Assignment Incorporated † | 201,881 | 3,222,021 | ||||||||||
| 6,285,064 | ||||||||||||
|
| |||||||||||
| Electrical Equipment: 0.32% | ||||||||||||
Polypore International Incorporated Ǡ | 18,400 | 743,176 | ||||||||||
|
| |||||||||||
| Machinery: 5.03% | ||||||||||||
Chart Industries Incorporated Ǡ | 67,192 | 4,620,122 | ||||||||||
Colfax Corporation Ǡ | 70,600 | 1,946,442 | ||||||||||
Rexnord Corporation Ǡ | 63,969 | 1,281,939 | ||||||||||
Robbins & Myers Incorporated | 21,200 | 886,584 | ||||||||||
The Middleby Corporation Ǡ | 28,999 | 2,888,590 | ||||||||||
| 11,623,677 | ||||||||||||
|
| |||||||||||
| Professional Services: 1.83% | ||||||||||||
Advisory Board Company Ǡ | 46,400 | 2,300,976 | ||||||||||
Mistras Group Incorporated † | 73,468 | 1,930,739 | ||||||||||
| 4,231,715 | ||||||||||||
|
| |||||||||||
| Road & Rail: 1.86% | ||||||||||||
Genesee & Wyoming Incorporated Ǡ | 81,400 | 4,301,176 | ||||||||||
|
| |||||||||||
| Trading Companies & Distributors: 3.20% | ||||||||||||
DXP Enterprises Incorporated Ǡ | 66,897 | 2,775,557 | ||||||||||
Titan Machinery Incorporated Ǡ | 151,573 | 4,603,272 | ||||||||||
| 7,378,829 | ||||||||||||
|
| |||||||||||
Information Technology: 33.91% | ||||||||||||
| Communications Equipment: 2.22% | ||||||||||||
Aruba Networks Incorporated Ǡ | 111,100 | 1,672,055 | ||||||||||
Ixia Ǡ | 103,211 | 1,240,596 | ||||||||||
Procera Networks Incorporated † | 91,735 | 2,230,078 | ||||||||||
| 5,142,729 | ||||||||||||
|
| |||||||||||
| Electronic Equipment, Instruments & Components: 1.71% | ||||||||||||
FARO Technologies Incorporated † | 22,600 | 951,008 | ||||||||||
OSI Systems Incorporated † | 47,500 | 3,008,650 | ||||||||||
| 3,959,658 | ||||||||||||
|
| |||||||||||
| Internet Software & Services: 8.87% | ||||||||||||
Brightcove Incorporated Ǡ | 118,179 | 1,802,230 | ||||||||||
Envestnet Incorporated | 235,500 | 2,826,000 | ||||||||||
Liquidity Services Incorporated Ǡ | 56,300 | 2,881,997 | ||||||||||
LivePerson Incorporated † | 125,000 | 2,382,500 | ||||||||||
LogMeIn Incorporated Ǡ | 124,700 | 3,805,844 | ||||||||||
Mercadolibre Incorporated « | 38,500 | 2,918,300 | ||||||||||
The accompanying notes are an integral part of these financial statements.
Table of Contents
| 10 | Wells Fargo Advantage VT Small Cap Growth Fund | Portfolio of Investments—June 30, 2012 (Unaudited) |
| Security Name | Shares | Value | ||||||||||
| Internet Software & Services (continued) | ||||||||||||
SciQuest Incorporated † | 216,554 | $ | 3,889,310 | |||||||||
| 20,506,181 | ||||||||||||
|
| |||||||||||
| IT Services: 4.62% | ||||||||||||
Gartner Incorporated † | 35,794 | 1,540,932 | ||||||||||
MarketAxess Holdings Incorporated | 61,978 | 1,651,094 | ||||||||||
ServiceSource International Incorporated Ǡ | 173,300 | 2,400,205 | ||||||||||
Wright Express Corporation † | 82,294 | 5,079,186 | ||||||||||
| 10,671,417 | ||||||||||||
|
| |||||||||||
| Semiconductors & Semiconductor Equipment: 2.57% | ||||||||||||
Cavium Incorporated Ǡ | 56,100 | 1,570,800 | ||||||||||
Entegris Incorporated † | 245,800 | 2,099,132 | ||||||||||
EZchip Semiconductor Limited Ǡ | 56,500 | 2,262,260 | ||||||||||
| 5,932,192 | ||||||||||||
|
| |||||||||||
| Software: 13.92% | ||||||||||||
Allot Communications Limited † | 89,794 | 2,501,661 | ||||||||||
Broadsoft Incorporated Ǡ | 123,176 | 3,567,177 | ||||||||||
ClickSoftware Technologies Limited | 119,200 | 964,328 | ||||||||||
Fortinet Incorporated † | 140,200 | 3,255,444 | ||||||||||
Glu Mobile Incorporated Ǡ | 252,800 | 1,403,040 | ||||||||||
Guidewire Software Incorporated Ǡ | 27,100 | 762,052 | ||||||||||
Imperva Incorporated † | 54,136 | 1,560,200 | ||||||||||
Kenexa Corporation Ǡ | 55,961 | 1,624,548 | ||||||||||
PROS Holdings Incorporated † | 104,427 | 1,756,462 | ||||||||||
Solarwinds Incorporated † | 101,600 | 4,425,696 | ||||||||||
Synchronoss Technologies Incorporated † | 143,358 | 2,647,822 | ||||||||||
Tangoe Incorporated † | 159,360 | 3,395,962 | ||||||||||
Ultimate Software Group Incorporated Ǡ | 48,300 | 4,304,496 | ||||||||||
| 32,168,888 | ||||||||||||
|
| |||||||||||
Total Common Stocks (Cost $205,055,861) | 226,310,239 | |||||||||||
|
| |||||||||||
| Investment Companies: 0.50% | ||||||||||||
iShares Russell 2000 Growth Index Fund ETF « | 12,730 | 1,164,409 | ||||||||||
|
| |||||||||||
Total Investment Companies (Cost $1,095,223) | 1,164,409 | |||||||||||
|
| |||||||||||
| Principal | ||||||||||||
| Other: 0.10% | ||||||||||||
Gryphon Funding Limited Pass-Through Entity (i)(a)(v) | $ | 832,001 | 224,640 | |||||||||
|
| |||||||||||
Total Other (Cost $102,990) | 224,640 | |||||||||||
|
| |||||||||||
The accompanying notes are an integral part of these financial statements.
Table of Contents
| Portfolio of Investments—June 30, 2012 (Unaudited) | Wells Fargo Advantage VT Small Cap Growth Fund | 11 |
| Security Name | Yield | Shares | Value | |||||||||||
Short-Term Investments: 44.38% | ||||||||||||||
| Investment Companies: 44.38% | ||||||||||||||
Wells Fargo Advantage Cash Investment Money Market Fund, Select Class (l)(u) | 0.15 | % | 4,230,017 | $ | 4,230,017 | |||||||||
Wells Fargo Securities Lending Cash Investments, LLC (v)(l)(u)(r) | 0.19 | 98,341,906 | 98,341,906 | |||||||||||
Total Short-Term Investments (Cost $102,571,923) | 102,571,923 | |||||||||||||
|
| |||||||||||||
| Total Investments in Securities | ||||||||
| (Cost $308,825,997) * | 142.89 | % | 330,271,211 | |||||
Other Assets and Liabilities, Net | (42.89 | ) | (99,140,688 | ) | ||||
|
|
|
| |||||
| Total Net Assets | 100.00 | % | $ | 231,130,523 | ||||
|
|
|
|
| « | All or a portion of this security is on loan. |
| † | Non-income earning security |
| (i) | Illiquid security |
| (a) | Security is fair valued by the Management Valuation Team, and in certain instances by the Board of Trustees, in accordance with procedures approved by the Board of Trustees. |
| (v) | Security represents investment of cash collateral received from securities on loan. |
| (l) | Investment in an affiliate |
| (u) | Rate shown is the 7-day annualized yield at period end. |
| (r) | The investment company is exempt from registration under Section 3(c)(7) of the 1940 Act. |
| * | Cost for federal income tax purposes is $310,430,565 and net unrealized appreciation (depreciation) consists of: |
Gross unrealized appreciation | $ | 34,620,664 | ||
Gross unrealized depreciation | (14,780,018 | ) | ||
|
| |||
Net unrealized appreciation | $ | 19,840,646 |
The accompanying notes are an integral part of these financial statements.
Table of Contents
| 12 | Wells Fargo Advantage VT Small Cap Growth Fund | Statement of Assets and Liabilities—June 30, 2012 (Unaudited) |
Assets | ||||
Investments | ||||
In unaffiliated securities (including securities on loan), at value (see cost below) | $ | 227,699,288 | ||
In affiliated securities, at value (see cost below) | 102,571,923 | |||
|
| |||
Total investments, at value (see cost below) | 330,271,211 | |||
Receivable for investments sold | 524,410 | |||
Receivable for Fund shares sold | 11,472 | |||
Receivable for dividends | 7,047 | |||
Receivable for securities lending income | 24,743 | |||
Prepaid expenses and other assets | 2,454 | |||
|
| |||
Total assets | 330,841,337 | |||
|
| |||
Liabilities | ||||
Payable for investments purchased | 748,279 | |||
Payable for Fund shares redeemed | 213,720 | |||
Payable upon receipt of securities loaned | 98,444,896 | |||
Advisory fee payable | 159,691 | |||
Distribution fees payable | 47,154 | |||
Due to other related parties | 27,573 | |||
Accrued expenses and other liabilities | 69,501 | |||
|
| |||
Total liabilities | 99,710,814 | |||
|
| |||
Total net assets | $ | 231,130,523 | ||
|
| |||
NET ASSETS CONSIST OF | ||||
Paid-in capital | $ | 191,599,626 | ||
Accumulated net investment loss | (1,084,957 | ) | ||
Accumulated net realized gains on investments | 19,170,640 | |||
Net unrealized gains on investments | 21,445,214 | |||
|
| |||
Total net assets | $ | 231,130,523 | ||
|
| |||
COMPUTATION OF NET ASSET VALUE PER SHARE1 | ||||
Net assets – Class 1 | $ | 28,623,977 | ||
Shares outstanding – Class 1 | 3,436,915 | |||
Net asset value per share – Class 1 | $8.33 | |||
Net assets – Class 2 | $ | 202,506,546 | ||
Shares outstanding – Class 2 | 24,424,640 | |||
Net asset value per share – Class 2 | $8.29 | |||
Investments in unaffiliated securities, at cost | $ | 206,254,074 | ||
|
| |||
Investments in affiliated securities, at cost | $ | 102,571,923 | ||
|
| |||
Total investments, at cost | $ | 308,825,997 | ||
|
| |||
Securities on loan, at value | $ | 95,886,993 | ||
|
| |||
| 1. | The Fund has an unlimited number of authorized shares. |
The accompanying notes are an integral part of these financial statements.
Table of Contents
| Statement of Operations—Six Months Ended June 30, 2012 (Unaudited) | Wells Fargo Advantage VT Small Cap Growth Fund | 13 |
Investment income | ||||
Securities lending income, net | $ | 200,742 | ||
Dividends* | 110,747 | |||
Income from affiliated securities | 2,204 | |||
|
| |||
Total investment income | 313,693 | |||
|
| |||
Expenses | ||||
Advisory fee | 899,832 | |||
Administration fees | ||||
Fund level | 59,989 | |||
Class 1 | 12,104 | |||
Class 2 | 83,878 | |||
Distribution fees | ||||
Class 2 | 262,118 | |||
Custody and accounting fees | 24,071 | |||
Professional fees | 22,415 | |||
Shareholder report expenses | 23,041 | |||
Trustees’ fees and expenses | 4,250 | |||
Other fees and expenses | 5,679 | |||
|
| |||
Total expenses | 1,397,377 | |||
Less: Fee waivers and/or expense reimbursements | (366 | ) | ||
|
| |||
Net expenses | 1,397,011 | |||
|
| |||
Net investment loss | (1,083,318 | ) | ||
|
| |||
REALIZED AND UNREALIZED GAINS (LOSSES) ON INVESTMENTS | ||||
Net realized gains on investments | 11,612,720 | |||
Net change in unrealized gains (losses) on investments | 8,058,125 | |||
|
| |||
Net realized and unrealized gains (losses) on investments | 19,670,845 | |||
|
| |||
Net increase in net assets resulting from operations | $ | 18,587,527 | ||
|
| |||
* Net of foreign dividend withholding taxes of | $3,955 | |||
The accompanying notes are an integral part of these financial statements.
Table of Contents
| 14 | Wells Fargo Advantage VT Small Cap Growth Fund | Statements of Changes in Net Assets |
| Six Months Ended June 30, 2012 (Unaudited) | Year Ended December 31, 2011 | |||||||||||||||
Operations | ||||||||||||||||
Net investment loss | $ | (1,083,318 | ) | $ | (2,498,473 | ) | ||||||||||
Net realized gains on investments | 11,612,720 | 19,985,502 | ||||||||||||||
Net change in unrealized gains (losses) on investments | 8,058,125 | (30,858,077 | ) | |||||||||||||
|
|
|
|
|
|
|
| |||||||||
Net increase (decrease) in net assets resulting from operations | 18,587,527 | (13,371,048 | ) | |||||||||||||
|
|
|
|
|
|
|
| |||||||||
Capital share transactions | Shares | Shares | ||||||||||||||
Proceeds from shares sold | ||||||||||||||||
Class 1 | 113,363 | 962,419 | 392,602 | 3,135,719 | ||||||||||||
Class 2 | 1,268,974 | 10,759,857 | 8,793,012 | 69,683,930 | ||||||||||||
|
|
|
|
|
|
|
| |||||||||
| 11,722,276 | 72,819,649 | |||||||||||||||
|
|
|
|
|
|
|
| |||||||||
Payment for shares redeemed | ||||||||||||||||
Class 1 | (484,975 | ) | (4,074,918 | ) | (1,848,297 | ) | (14,311,440 | ) | ||||||||
Class 2 | (3,316,374 | ) | (27,803,340 | ) | (13,028,327 | ) | (102,117,549 | ) | ||||||||
|
|
|
|
|
|
|
| |||||||||
| (31,878,258 | ) | (116,428,989 | ) | |||||||||||||
|
|
|
|
|
|
|
| |||||||||
Net decrease in net assets resulting from capital share transactions | (20,155,982 | ) | (43,609,340 | ) | ||||||||||||
|
|
|
|
|
|
|
| |||||||||
Total decrease in net assets | (1,568,455 | ) | (56,980,388 | ) | ||||||||||||
|
|
|
|
|
|
|
| |||||||||
Net assets | ||||||||||||||||
Beginning of period | 232,698,978 | 289,679,366 | ||||||||||||||
|
|
|
|
|
|
|
| |||||||||
End of period | $ | 231,130,523 | $ | 232,698,978 | ||||||||||||
|
|
|
|
|
|
|
| |||||||||
Accumulated net investment loss | $ | (1,084,957 | ) | $ | (1,639 | ) | ||||||||||
|
|
|
|
|
|
|
| |||||||||
The accompanying notes are an integral part of these financial statements.
Table of Contents
| Financial Highlights | Wells Fargo Advantage VT Small Cap Growth Fund | 15 |
(For a share outstanding throughout each period)
Six Months Ended (Unaudited) | Year Ended December 31, | |||||||||||
| Class 1 | 2011 | 20101 | ||||||||||
Net asset value, beginning of period | $ | 7.71 | $ | 8.06 | $ | 6.26 | ||||||
Net investment loss | (0.02 | ) | (0.06 | ) | (0.02 | ) | ||||||
Net realized and unrealized gains (losses) on investments | 0.64 | (0.29 | ) | 1.82 | ||||||||
|
|
|
|
|
| |||||||
Total from investment operations | 0.62 | (0.35 | ) | 1.80 | ||||||||
Net asset value, end of period | $ | 8.33 | $ | 7.71 | $ | 8.06 | ||||||
Total return2 | 8.04 | % | (4.34 | )% | 26.93 | % | ||||||
Ratios to average net assets (annualized) | ||||||||||||
Gross expenses | 0.95 | % | 0.94 | % | 0.95 | % | ||||||
Net expenses | 0.95 | % | 0.94 | % | 0.95 | % | ||||||
Net investment loss | (0.68 | )% | (0.73 | )% | (0.58 | )% | ||||||
Supplemental data | ||||||||||||
Portfolio turnover rate | 36 | % | 118 | % | 71 | % | ||||||
Net assets, end of period (000’s omitted) | $28,624 | $29,351 | $42,434 | |||||||||
| 1. | For the period from July 16, 2010 (commencement of class operations) to December 31, 2010. |
| 2. | Returns for periods less than one year are not annualized. |
The accompanying notes are an integral part of these financial statements.
Table of Contents
| 16 | Wells Fargo Advantage VT Small Cap Growth Fund | Financial Highlights |
(For a share outstanding throughout each period)
| Six Months Ended June 30, 2012 (Unaudited) | Year Ended December 31, | |||||||||||||||||||||||
| Class 21 | 2011 | 2010 | 2009 | 2008 | 2007 | |||||||||||||||||||
Net asset value, beginning of period | $ | 7.68 | $ | 8.05 | $ | 6.35 | $ | 4.16 | $ | 9.69 | $ | 9.96 | ||||||||||||
Net investment loss | (0.04 | ) | (0.09 | ) | (0.06 | ) | (0.03 | ) | (0.05 | ) | (0.07 | ) | ||||||||||||
Net realized and unrealized gains (losses) on investments | 0.65 | (0.28 | ) | 1.76 | 2.22 | (3.31 | ) | 1.52 | ||||||||||||||||
|
|
|
|
|
|
|
|
|
|
|
| |||||||||||||
Total from investment operations | 0.61 | (0.37 | ) | 1.70 | 2.19 | (3.36 | ) | 1.45 | ||||||||||||||||
Distributions to shareholders from | ||||||||||||||||||||||||
Net realized gains | 0.00 | 0.00 | 0.00 | 0.00 | (2.17 | ) | (1.72 | ) | ||||||||||||||||
Net asset value, end of period | $ | 8.29 | $ | 7.68 | $ | 8.05 | $ | 6.35 | $ | 4.16 | $ | 9.69 | ||||||||||||
Total return2 | 7.94 | % | (4.60 | )% | 26.77 | % | 52.64 | % | (41.42 | )% | 13.81 | % | ||||||||||||
Ratios to average net assets (annualized) | ||||||||||||||||||||||||
Gross expenses | 1.20 | % | 1.20 | % | 1.22 | % | 1.26 | % | 1.26 | % | 1.22 | % | ||||||||||||
Net expenses | 1.20 | % | 1.19 | % | 1.20 | % | 1.20 | % | 1.20 | % | 1.20 | % | ||||||||||||
Net investment loss | (0.93 | )% | (0.98 | )% | (0.82 | )% | (0.69 | )% | (0.73 | )% | (0.73 | )% | ||||||||||||
Supplemental data | ||||||||||||||||||||||||
Portfolio turnover rate | 36 | % | 118 | % | 71 | % | 75 | % | 76 | % | 121 | % | ||||||||||||
Net assets, end of period (000’s omitted) | $202,507 | $203,348 | $247,246 | $185,345 | $109,996 | $221,394 | ||||||||||||||||||
| 1. | After the close of business on July 16, 2010, existing shares of the Fund were renamed Class 2 shares. |
| 2. | Returns for periods less than one year are not annualized. |
The accompanying notes are an integral part of these financial statements.
Table of Contents
| Notes to Financial Statements (Unaudited) | Wells Fargo Advantage VT Small Cap Growth Fund | 17 |
1. ORGANIZATION
Wells Fargo Variable Trust (the “Trust”), a Delaware statutory trust organized on March 10, 1999, is an open-end management investment company registered under the Investment Company Act of 1940, as amended (the “1940 Act”). These financial statements report on Wells Fargo Advantage VT Small Cap Growth Fund (the “Fund”) which is a diversified series of the Trust.
2. SIGNIFICANT ACCOUNTING POLICIES
The following significant accounting policies, which are consistently followed in the preparation of the financial statements of the Fund, are in conformity with U.S. generally accepted accounting principles which require management to make estimates and assumptions that affect the reported amounts of assets and liabilities, disclosure of contingent assets and liabilities at the date of the financial statements, and the reported amounts of revenues and expenses during the reporting period. Actual results could differ from those estimates.
Securities valuation
Investments in equity securities are valued each business day as of the close of regular trading on the New York Stock Exchange, which is usually 4:00 p.m. (Eastern Time). Securities which are traded on a national or foreign securities exchange are valued at the last reported sales price, except that securities listed on The Nasdaq Stock Market, Inc. (“Nasdaq”) are valued at the Nasdaq Official Closing Price (“NOCP”), and if no NOCP is available, then at the last reported sales price. If no sales price is shown on the Nasdaq, the bid price will be used. In the absence of any sale of securities listed on the Nasdaq, and in the case of other securities (including U.S. Government obligations, but excluding debt securities maturing in 60 days or less), the price will be deemed “stale” and the valuations will be determined in accordance with the Fund’s Valuation Procedures.
Investments in open-end mutual funds and non-registered investment companies are fair valued at net asset value.
Investments which are not valued using any of the methods discussed above, are valued at their fair value, as determined by procedures established in good faith and approved by the Board of Trustees. The Board of Trustees has established a Valuation Committee comprised of the Trustees and has delegated to it the authority to take any actions regarding the valuation of portfolio securities that the Valuation Committee deems necessary in determining the fair value of portfolio securities, unless the responsibility has been delegated to the Management Valuation Team of Wells Fargo Funds Management, LLC (“Funds Management”). The Board of Trustees retains the authority to make or ratify any valuation decisions or approve any changes to the Valuation Procedures as it deems appropriate. On a quarterly basis, the Board of Trustees considers for ratification any valuation actions taken by the Valuation Committee or the Management Valuation Team.
Valuations of fair valued securities are compared to the next actual sales price when available, or other appropriate market information to assess the continued appropriateness of the fair valuation methodology used. These securities are fair valued on a day-to-day basis, taking into consideration changes to appropriate market information and any significant changes to the input factors considered in the valuation process until there is a readily available price provided on the exchange or by an independent pricing service. Valuations received from an independent pricing service or broker quotes are periodically validated by comparisons to most recent trades and valuations provided by other independent pricing services in addition to the review of prices by the adviser and/or sub-adviser. Unobservable inputs used in determining fair valuations are identified based on the type of security, taking into consideration factors utilized by market participants in valuing the investment, knowledge about the issuer and the current market environment.
Security loans
The Fund may lend its securities from time to time in order to earn additional income in the form of fees or interest on securities received as collateral or the investment of any cash received as collateral. The Fund continues to receive interest or dividends on the securities loaned. The Fund receives collateral in the form of cash or securities with a value at least equal to the value of the securities on loan. The value of the loaned securities is determined at the close of each business day and any additional required collateral is delivered to the Fund on the next business day. In a securities lending transaction, the net asset value of the Fund will be affected by an increase or decrease in the value of the securities loaned and by an increase or decrease in the value of the instrument in which collateral is invested. The amount of securities lending activity undertaken by the Fund fluctuates from time to time. In the event of default or bankruptcy
Table of Contents
| 18 | Wells Fargo Advantage VT Small Cap Growth Fund | Notes to Financial Statements (Unaudited) |
by the borrower, the Fund may be prevented from recovering the loaned securities or gaining access to the collateral or may experience delays or costs in doing so. In addition, the investment of any cash collateral received may lose all or part of its value. The Fund has the right under the lending agreement to recover the securities from the borrower on demand.
The Fund lends its securities through an unaffiliated securities lending agent. Cash collateral received in connection with its securities lending transactions is invested in Wells Fargo Securities Lending Cash Investments, LLC (the “Cash Collateral Fund”). The Cash Collateral Fund is exempt from registration under Section 3(c)(7) of the 1940 Act and is managed by Funds Management and is sub-advised by Wells Capital Management Incorporated (“Wells Capital Management”). Funds Management receives an advisory fee starting at 0.05% and declining to 0.01% as the average daily net assets of the Cash Collateral Fund increase. All of the fees received by Funds Management are paid to Wells Capital Management for its services as sub-adviser. The Cash Collateral Fund seeks to provide a positive return compared to the daily Fed Funds Open rate by investing in high-quality, U.S. dollar-denominated short-term money market instruments. Cash Collateral Fund investments are fair valued based upon the amortized cost valuation technique. Income earned from investment in the Cash Collateral Fund is included in securities lending income on the Statement of Operations.
Security transactions and income recognition
Securities transactions are recorded on a trade date basis. Realized gains or losses are reported on the basis of identified cost of securities delivered.
Dividend income is recognized on the ex-dividend date. Dividend income is recorded net of foreign taxes withheld where recovery of such taxes is not assured.
Distributions to shareholders
Distributions to shareholders from net investment income and net realized gains, if any, are recorded on the ex-dividend date. Such distributions are determined in conformity with income tax regulations, which may differ from generally accepted accounting principles.
Federal and other taxes
The Fund intends to continue to qualify as a regulated investment company by distributing substantially all of its investment company taxable income and any net realized capital gains (after reduction for capital loss carryforwards) sufficient to relieve it from all, or substantially all, federal income taxes. Accordingly, no provision for federal income taxes was required.
The Fund’s income and federal excise tax returns and all financial records supporting those returns for the prior three fiscal years are subject to examination by the federal and Delaware revenue authorities. Management has analyzed the Fund’s tax positions taken on federal, state, and foreign tax returns for all open tax years and does not believe that there are any uncertain tax positions that require recognition of a tax liability.
Under the recently enacted Regulated Investment Company Modernization Act of 2010, the Fund is permitted to carry forward capital losses incurred in taxable years which began after December 22, 2010 for an unlimited period. However, any losses incurred are required to be utilized prior to the losses incurred in pre-enactment taxable years. As a result of this ordering rule, pre-enactment capital loss carryforwards may be more likely to expire unused. Post-enactment capital losses that are carried forward will retain their character as either short-term or long-term capital losses rather than be considered all short-term as under previous law. In addition, the Fund may elect to defer any portion of a post-October capital loss or qualified late-year ordinary loss to the first day of the following taxable year. A post-October capital loss is the greatest of the net capital loss, net short-term capital loss or net long-term capital loss for the portion of the taxable year after October 31. A qualified late-year ordinary loss is the net loss comprised of (a) net gain or loss from the sale or other disposition of certain capital assets for the portion of the taxable year after October 31, and (b) other ordinary income or loss for the portion of the taxable year after December 31.
As of December 31, 2011, the Fund had net capital loss carryforwards, which are available to offset future net realized capital gains, in the amount of $1,304,250 expiring in 2016.
Class allocations
The separate classes of shares offered by the Fund differ principally in distribution fees. Shareholders of each class bear certain expenses that pertain to that particular class. All shareholders bear the common expenses of the Fund, earn
Table of Contents
| Notes to Financial Statements (Unaudited) | Wells Fargo Advantage VT Small Cap Growth Fund | 19 |
income from the portfolio, and are allocated unrealized gains and losses pro rata based on the average daily net assets of each class, without distinction between share classes. Dividends are determined separately for each class based on income and expenses allocable to each class. Realized gains and losses are allocated to each class pro rata based upon the net assets of each class on the date realized. Differences in per share dividend rates generally result from the relative weightings of pro rata income and realized gain allocations and from differences in separate class expenses, including distribution fees.
3. FAIR VALUATION MEASUREMENTS
Fair value measurements of investments are determined within a framework that has established a fair value hierarchy based upon the various data inputs utilized in determining the value of the Fund’s investments. The three-level hierarchy gives the highest priority to unadjusted quoted prices in active markets for identical assets or liabilities (Level 1) and the lowest priority to significant unobservable inputs (Level 3). The Fund’s investments are classified within the fair value hierarchy based on the lowest level of input that is significant to the fair value measurement. The inputs are summarized into three broad levels as follows:
| n | Level 1 – quoted prices in active markets for identical securities |
| n | Level 2 – other significant observable inputs (including quoted prices for similar securities, interest rates, prepayment speeds, credit risk, etc.) |
| n | Level 3 – significant unobservable inputs (including the Fund’s own assumptions in determining the fair value of investments) |
The inputs or methodologies used for valuing securities are not necessarily an indication of the risk associated with investing in those securities.
As of June 30, 2012, the inputs used in valuing the Fund’s assets, which are carried at fair value, were as follows:
| Investments in Securities | Quoted Prices (Level 1) | Significant Other Observable Inputs (Level 2) | Significant Unobservable Inputs (Level 3) | Total | ||||||||||||
Equity securities | ||||||||||||||||
Common stocks | $ | 226,310,239 | $ | 0 | $ | 0 | $ | 226,310,239 | ||||||||
Investment companies | 1,164,409 | 0 | 0 | 1,164,409 | ||||||||||||
Other | 0 | 0 | 224,640 | 224,640 | ||||||||||||
Short-term investments | ||||||||||||||||
Investment companies | 4,230,017 | 98,341,906 | 0 | 102,571,923 | ||||||||||||
| $ | 231,704,665 | $ | 98,341,906 | $ | 224,640 | $ | 330,271,211 | |||||||||
Further details on the major security types listed above can be found in the Portfolio of Investments.
Transfers in and transfers out are recognized at the end of the reporting period. For the six months ended June 30, 2012, the Fund did not have any transfers into/out of Level 1 and Level 2.
4. TRANSACTIONS WITH AFFILIATES AND OTHER EXPENSES
Advisory Fee
The Trust has entered into an advisory contract with Funds Management, an indirect wholly owned subsidiary of Wells Fargo & Company (“Wells Fargo”). The adviser is responsible for implementing investment policies and guidelines and for supervising the sub-adviser, who is responsible for day-to-day portfolio management of the Fund.
Pursuant to the contract, Funds Management is entitled to receive an annual advisory fee starting at 0.75% and declining to 0.60% as the average daily net assets of the Fund increase. For the six months ended June 30, 2012, the advisory fee was equivalent to an annual rate of 0.75% of the Fund’s average daily net assets.
Funds Management has retained the services of a sub-adviser to provide daily portfolio management to the Fund. The fee for sub-advisory services is borne by Funds Management. Wells Capital Management, an affiliate of Funds Management, is the sub-adviser to the Fund and is entitled to receive a fee from Funds Management at an annual rate starting at 0.55% and declining to 0.40% as the average daily net assets of the Fund increase.
Table of Contents
| 20 | Wells Fargo Advantage VT Small Cap Growth Fund | Notes to Financial Statements (Unaudited) |
Administration and transfer agent fees
The Trust has entered into an administration agreement with Funds Management. Under this agreement, for providing administrative services, which includes paying fees and expenses for services provided by the transfer agent, sub-transfer agents, omnibus account servicers and record-keepers, Funds Management is entitled to receive from the Fund an annual fund level administration fee starting at 0.05% and declining to 0.03% as the average daily net assets of the Fund increase and a class level administration fee of 0.08% of the average daily net assets of each class.
Funds Management has contractually waived and/or reimbursed advisory and administration fees to the extent necessary to maintain certain net operating expense ratios for the Fund. Waiver of fees and/or reimbursement of expenses by Funds Management were made first from fund level expenses on a proportionate basis and then from class specific expenses. Funds Management has committed through July 18, 2013 to waive fees and/or reimburse expenses to the extent necessary to cap the Fund’s expenses at 0.95% for Class 1 shares and 1.20% for Class 2 shares.
Distribution fees
The Trust has adopted a Distribution Plan for Class 2 shares of the Fund pursuant to Rule 12b-1 under the 1940 Act. Distribution fees are charged to Class 2 shares and paid to Wells Fargo Funds Distributor, LLC, the principal underwriter, at an annual rate of 0.25% of its average daily net assets.
5. INVESTMENT PORTFOLIO TRANSACTIONS
Purchases and sales of investments, excluding U.S. Government obligations (if any) and short-term securities, for the six months ended June 30, 2012 were $86,196,127 and $93,569,119, respectively.
6. BANK BORROWINGS
The Trust and Wells Fargo Funds Trust (excluding the money market funds) are parties to a $150,000,000 revolving credit agreement with State Street Bank and Trust Company, whereby the Fund is permitted to use bank borrowings for temporary or emergency purposes, such as to fund shareholder redemption requests. Interest under the credit agreement is charged to the Fund based on a borrowing rate equal to the higher of the Federal Funds rate in effect on that day plus 1.25% or the overnight LIBOR rate in effect on that day plus 1.25%. In addition, an annual commitment fee equal to 0.10% of the unused balance is allocated to each participating fund. For the six months ended June 30, 2012, the Fund paid $281 in commitment fees.
For the six months ended June 30, 2012, there were no borrowings by the Fund under the agreement.
7. INDEMNIFICATION
Under the Trust’s organizational documents, the officers and directors are indemnified against certain liabilities that may arise out of performance of their duties to the Trust. Additionally, in the normal course of business, the Trust may enter into contracts with service providers that contain a variety of indemnification clauses. The Trust’s maximum exposure under these arrangements is dependent on future claims that may be made against the Fund and, therefore, cannot be estimated.
8. NEW ACCOUNTING PRONOUNCEMENT
In December 2011, the Financial Accounting Standards Board (“FASB”) issued Accounting Standard Update (“ASU”) No. 2011-11, Disclosures about Offsetting Assets and Liabilities. ASU 2011-11, which amends FASB ASC Topic 210, Balance Sheet, creates new disclosure requirements which require entities to disclose both gross and net information for derivatives and other financial instruments that are either offset in the Statement of Assets and Liabilities or subject to an enforceable master netting arrangement or similar agreement. The disclosure requirements are effective for interim and annual reporting periods beginning on or after January 1, 2013. Management is currently assessing the potential impact, in addition to expanded financial statement disclosure, that may result from adopting this ASU.
Table of Contents
| Notes to Financial Statements (Unaudited) | Wells Fargo Advantage VT Small Cap Growth Fund | 21 |
9. SUBSEQUENT DISTRIBUTIONS
On July 12, 2012, the Fund declared distributions from long-term capital gains to shareholders of record on July 11, 2012. The per share amounts payable on July 13, 2012 were as follows:
| Long-term Capital Gains | ||||
Class 1 | $ | 0.39273 | ||
Class 2 | 0.39273 | |||
These distributions are not reflected in the accompanying financial statements.
Table of Contents
| 22 | Wells Fargo Advantage VT Small Cap Growth Fund | Other Information (Unaudited) |
PROXY VOTING INFORMATION
A description of the policies and procedures that the Fund uses to determine how to vote proxies relating to portfolio securities is available without charge, upon request, by calling 1-800-222-8222, visiting our Web site at wellsfargoadvantagefunds.com, or visiting the SEC Web site at sec.gov. Information regarding how the Fund voted proxies relating to portfolio securities during the most recent 12-month period ended June 30 is available without charge on the Fund’s Web site at wellsfargoadvantagefunds.com or by visiting the SEC Web site at sec.gov.
PORTFOLIO HOLDINGS INFORMATION
The complete portfolio holdings for the Fund are publicly available on the Fund’s Web site (wellsfargoadvantagefunds.com) on a monthly, 30-day or more delayed basis. In addition, top ten holdings information for the Fund is publicly available on the Fund’s Web site on a monthly, seven-day or more delayed basis. The Fund files its complete schedule of portfolio holdings with the SEC for the first and third quarters of each fiscal year on Form N-Q, which is available without charge by visiting the SEC Web site at sec.gov. In addition, the Fund’s Form N-Q may be reviewed and copied at the SEC’s Public Reference Room in Washington, DC, and at regional offices in New York City, at 233 Broadway, and in Chicago, at 175 West Jackson Boulevard, Suite 900. Information about the Public Reference Room may be obtained by calling 1-800-SEC-0330.
Table of Contents
| Other Information (Unaudited) | Wells Fargo Advantage VT Small Cap Growth Fund | 23 |
BOARD OF TRUSTEES AND OFFICERS
Each of the Trustees and Officers listed in the table below acts in identical capacities for the Wells Fargo Advantage family of funds, which consists of 138 funds comprising the Wells Fargo Funds Trust, Wells Fargo Variable Trust, Wells Fargo Master Trust and four closed-end funds (collectively the “Fund Complex”). This table should be read in conjunction with the Prospectus and the Statement of Additional Information1. All of the Trustees are also Members of the Audit and Governance Committees of each Trust in the Fund Complex. The mailing address of each Trustee and Officer is 525 Market Street, 12th Floor, San Francisco, CA 94105. Each Trustee and Officer serves an indefinite term, however, each Trustee serves such term until reaching the mandatory retirement age established by the Trustees.
Independent Trustees
Name and Year of Birth | Position Held and Length of Service* | Principal Occupations During Past Five Years | Other Directorships During | |||
| Peter G. Gordon (Born 1942) | Trustee, since 1998; Chairman, since 2005 (Lead Trustee since 2001) | Co-Founder, Retired Chairman, President and CEO of Crystal Geyser Water Company. Trustee Emeritus, Colby College | Asset Allocation Trust | |||
| Isaiah Harris, Jr. (Born 1952) | Trustee, since 2009 | Retired. Prior thereto, President and CEO of BellSouth Advertising and Publishing Corp. from 2005 to 2007, President and CEO of BellSouth Enterprises from 2004 to 2005 and President of BellSouth Consumer Services from 2000 to 2003. Emeritus member of the Iowa State University Foundation Board of Governors. Emeritus Member of the Advisory Board of Iowa State University School of Business. Mr. Harris is a certified public accountant. | CIGNA Corporation; Deluxe Corporation; Asset Allocation Trust | |||
| Judith M. Johnson (Born 1949) | Trustee, since 2008 | Retired. Prior thereto, Chief Executive Officer and Chief Investment Officer of Minneapolis Employees Retirement Fund from 1996 to 2008. Ms. Johnson is an attorney, certified public accountant and a certified managerial accountant. | Asset Allocation Trust | |||
| Leroy Keith, Jr. (Born 1939) | Trustee, since 2010 | Chairman, Bloc Global Services (development and construction). Trustee of the Evergreen Funds from 1983 to 2010. Former Managing Director, Almanac Capital Management (commodities firm), former Partner, Stonington Partners, Inc. (private equity fund), former Director, Obagi Medical Products Co. and former Director, Lincoln Educational Services. | Trustee, Virtus Fund Complex (consisting of 40 portfolios as of 12/31/11); Asset Allocation Trust | |||
| David F. Larcker (Born 1950) | Trustee, since 2009 | James Irvin Miller Professor of Accounting at the Graduate School of Business, Stanford University, Director of Corporate Governance Research Program and Senior Faculty of The Rock Center for Corporate Governance since 2006. From 2005 to 2008, Professor of Accounting at the Graduate School of Business, Stanford University. Prior thereto, Ernst & Young Professor of Accounting at The Wharton School, University of Pennsylvania from 1985 to 2005. | Asset Allocation Trust | |||
| Olivia S. Mitchell (Born 1953) | Trustee, since 2006 | International Foundation of Employee Benefit Plans Professor, Wharton School of the University of Pennsylvania since 1993. Director of Wharton’s Pension Research Council and Boettner Center on Pensions & Retirement Research, and Research Associate at the National Bureau of Economic Research. Previously, Cornell University Professor from 1978 to 1993. | Asset Allocation Trust | |||
| Timothy J. Penny (Born 1951) | Trustee, since 1996 | President and CEO of Southern Minnesota Initiative Foundation, a non-profit organization, since 2007 and Senior Fellow at the Humphrey Institute Policy Forum at the University of Minnesota since 1995. Member of the Board of Trustees of NorthStar Education Finance, Inc., a non-profit organization, since 2007. | Asset Allocation Trust |
Table of Contents
| 24 | Wells Fargo Advantage VT Small Cap Growth Fund | Other Information (Unaudited) |
Name and Year of Birth | Position Held and Length of Service* | Principal Occupations During Past Five Years | Other Directorships During | |||
| Michael S. Scofield (Born 1943) | Trustee, since 2010 | Served on the Investment Company Institute’s Board of Governors and Executive Committee from 2008-2011 as well the Governing Council of the Independent Directors Council from 2006-2011 and the Independent Directors Council Executive Committee from 2008-2011. Chairman of the IDC from 2008-2010. Institutional Investor (Fund Directions) Trustee of Year in 2007. Trustee of the Evergreen Funds (and its predecessors) from 1984 to 2010. Chairman of the Evergreen Funds from 2000-2010. Former Trustee of the Mentor Funds. Retired Attorney, Law Offices of Michael S. Scofield and former Director and Chairman, Branded Media Corporation (multi-media branding company). | Asset Allocation Trust | |||
| Donald C. Willeke (Born 1940) | Trustee, since 1996 | Principal of the law firm of Willeke & Daniels. General Counsel of the Minneapolis Employees Retirement Fund from 1984 until its consolidation into the Minnesota Public Employees Retirement Association on June 30, 2010. Director and Vice Chair of The Free Trust (non-profit corporation). Director of the American Chestnut Foundation (non-profit corporation). | Asset Allocation Trust |
| * | Length of service dates reflect the Trustee’s commencement of service with the Trust’s predecessor entities, where applicable. |
Officers
Name and Year of Birth | Position Held and Length of Service | Principal Occupations During Past Five Years | ||||
| Karla M. Rabusch (Born 1959) | President, since 2003 | Executive Vice President of Wells Fargo Bank, N.A. and President of Wells Fargo Funds Management, LLC since 2003. Senior Vice President and Chief Administrative Officer of Wells Fargo Funds Management, LLC from 2001 to 2003. | ||||
| C. David Messman (Born 1960) | Secretary, since 2000; Chief Legal Officer, since 2003 | Senior Vice President and Secretary of Wells Fargo Funds Management, LLC since 2001. Vice President and Managing Senior Counsel of Wells Fargo Bank, N.A. since 1996. | ||||
Nancy Wiser (Born 1967) | Treasurer, since 2012 | Executive Vice President of Wells Fargo Funds Management, LLC since 2011. Chief Operating Officer and Chief Compliance Officer at LightBox Capital Management LLC, from 2008 to 2011. Owned and operated a consulting business providing services to various hedge funds including acting as Chief Operating Officer and Chief Compliance Officer for a hedge fund from 2007 to 2008. Chief Operating Officer and Chief Compliance Officer of GMN Capital LLC from 2006 to 2007. | ||||
| David Berardi (Born 1975) | Assistant Treasurer, since 2009 | Vice President of Wells Fargo Funds Management, LLC since 2009. Vice President of Evergreen Investment Management Company, LLC from 2008 to 2010. Assistant Vice President of Evergreen Investment Services, Inc. from 2004 to 2008. Manager of Fund Reporting and Control for Evergreen Investment Management Company, LLC from 2004 to 2010. | ||||
| Jeremy DePalma (Born 1974) | Assistant Treasurer, since 2009 | Senior Vice President of Wells Fargo Funds Management, LLC since 2009. Senior Vice President of Evergreen Investment Management Company, LLC from 2008 to 2010. Vice President, Evergreen Investment Services, Inc. from 2004 to 2007. Head of the Fund Reporting and Control Team within Fund Administration from 2005 to 2010. | ||||
| Debra Ann Early (Born 1964) | Chief Compliance Officer, since 2007 | Chief Compliance Officer of Wells Fargo Funds Management, LLC since 2007. Chief Compliance Officer of Parnassus Investments from 2005 to 2007. Chief Financial Officer of Parnassus Investments from 2004 to 2007 and Senior Audit Manager of PricewaterhouseCoopers LLP from 1998 to 2004. |
| 1. | The Statement of Additional Information includes additional information about the Trustees and is available, without charge, upon request, by calling 1-800-222-8222 or by visiting the Web site at wellsfargoadvantagefunds.com. |
Table of Contents
| Other Information (Unaudited) | Wells Fargo Advantage VT Small Cap Growth Fund | 25 |
BOARD CONSIDERATION OF INVESTMENT ADVISORY AND SUB-ADVISORY AGREEMENTS:
Under Section 15 of the Investment Company Act of 1940 (the “1940 Act”), the Board of Trustees (the “Board”) of Wells Fargo Funds Trust (the “Trust”), all the members of which have no direct or indirect interest in the investment advisory and sub-advisory agreements and are not “interested persons” of the Trust, as defined in the 1940 Act (the “Independent Trustees”), must determine whether to approve the continuation of the Trust’s investment advisory and sub-advisory agreements. In this regard, at an in person meeting held on March 29-30, 2012 (the “Meeting”), the Board reviewed and re-approved: (i) an investment advisory agreement with Wells Fargo Funds Management, LLC (“Funds Management”) for Wells Fargo Advantage VT Small Cap Growth Fund (the “Fund”) and (ii) an investment sub-advisory agreement with Wells Capital Management Incorporated (“Wells Capital Management”) for the Fund. The investment advisory agreement with Funds Management and the investment sub-advisory agreement with Wells Capital Management are collectively referred to as the “Advisory Agreements.”
At the Meeting, the Board considered the factors and reached the conclusions described below relating to the selection of Funds Management and Wells Capital Management and the continuation of the Advisory Agreements. Prior to the Meeting, the Trustees conferred extensively among themselves and with representatives of Funds Management about these matters. The Board also met throughout the year and received information that was useful to them in considering the continuation of the Advisory Agreements. The Independent Trustees were assisted in their evaluation of the Advisory Agreements by independent legal counsel, from whom they received separate legal advice and with whom they met separately from Funds Management.
In providing information to the Board, Funds Management and Wells Capital Management were guided by a detailed set of requests submitted by the Independent Trustees’ independent legal counsel on their behalf at the start of the Board’s annual contract renewal process earlier in 2012. In approving the Advisory Agreements, the Board did not identify any particular information or consideration that was all-important or controlling, and each Trustee likely attributed different weights to various factors.
Nature, extent and quality of services
The Board received and considered various information regarding the nature, extent and quality of services provided to the Fund by Funds Management and Wells Capital Management under the Advisory Agreements. The Board also received and considered, among other things, information about the background and experience of senior management of Funds Management, and the qualifications, backgrounds, tenures and responsibilities of the portfolio managers primarily responsible for the day-to-day portfolio management of the Fund.
The Board evaluated the ability of Funds Management and Wells Capital Management, based on their respective financial condition, resources, reputation and other attributes, to attract and retain qualified investment professionals, including research, advisory, and supervisory personnel. The Board further considered the compliance programs and compliance records of Funds Management and Wells Capital Management. In addition, the Board took into account the administrative services provided to the Fund by Funds Management and its affiliates.
The Board’s decision to approve the continuation of the Advisory Agreements was based on a comprehensive evaluation of information provided to it. In considering these matters, the Board considered not only the specific information presented in connection with the Meeting, but also the knowledge gained over time through interaction with Funds Management and Wells Capital Management about various topics, including Funds Management’s oversight of service providers. The above factors, together with those referenced below, are some of the most important, but not necessarily all, factors considered by the Board in concluding that the nature, extent and quality of the investment advisory services provided to the Fund by Funds Management and Wells Capital Management supported the re-approval of the Advisory Agreements. Although the Board considered the continuation of the Advisory Agreements for the Fund as part of the larger process of considering the continuation of the advisory agreements for all of the funds in the complex, its decision to continue the Advisory Agreements for the Fund was ultimately made on a fund-by-fund basis.
Fund performance and expenses
The Board considered the performance results for the Fund over various time periods ended December 31, 2011. The Board also considered these results in comparison to the median performance of a universe of relevant funds (the “Universe”) that was determined by Lipper Inc. (“Lipper”) to be similar to the Fund, and in comparison to the Fund’s
Table of Contents
| 26 | Wells Fargo Advantage VT Small Cap Growth Fund | Other Information (Unaudited) |
benchmark index and to other comparative data. Lipper is an independent provider of investment company data. The Board received a description of the methodology used by Lipper to select the mutual funds in the Universe. The Board noted that the performance of the Fund was higher than the median performance of the Universe for all periods under review, except for the one-year period. The Board also noted that the performance of the Fund was higher than or in range of its benchmark, the Lipper VUF Small Cap Growth Funds Index, for the periods under review, except for the one-year period.
The Board received and considered information regarding the Fund’s contractual advisory fee and net operating expense ratios and their various components, including actual management fees (which reflect fee waivers, if any), transfer agent, custodian and other non-management fees, Rule 12b-1 and non-Rule 12b-1 fees, service fees and fee waiver and expense reimbursement arrangements. The Board also considered these ratios in comparison to the median ratios of an expense Universe and a narrower expense group of mutual funds (each, an “Expense Group”) that was determined by Lipper to be similar to the Fund. The Board received a description of the methodology used by Lipper to select the mutual funds in the Fund’s Expense Group. The Board noted that the net operating expense ratio of the Fund was in range of the Fund’s Expense Group’s median net operating expense ratio.
Based on the above-referenced considerations and other factors, the Board concluded that the overall performance and expense structure of the Fund supported the re-approval of the Advisory Agreements for the Fund.
Investment advisory and sub-advisory fee rates
The Board reviewed and considered the contractual investment advisory fee rate that is payable by the Fund to Funds Management for investment advisory services (the “Advisory Agreement Rate”), both on a stand-alone basis and on a combined basis with the Fund’s administration fee rate. The Board took into account the separate administrative and other services covered by the administration fee rate. The Board also reviewed and considered the contractual investment sub-advisory fee rate that is payable by Funds Management to Wells Capital Management for investment sub-advisory services (the “Sub-Advisory Agreement Rate”). In addition, the Board reviewed and considered the existing fee waiver/cap arrangements applicable to the Advisory Agreement Rate and considered the Advisory Agreement Rate after taking the waivers/caps into account (the “Net Advisory Rate”).
The Board received and considered information comparing the Advisory Agreement Rate and Net Advisory Rate, combined with the administration fee rates, with those of other funds in the Fund’s Expense Group median. The Board noted that the Advisory Agreement Rate and Net Advisory Rate for the Fund were in range of the median rates for the Fund’s Expense Group.
The Board also received and considered information about the nature and extent of services offered and fee rates charged by Funds Management and Wells Capital Management to other types of clients. In this regard, the Board received information about differences between the services, and the compliance, reporting, and other legal burdens and risks of providing investment advice to mutual funds and those associated with providing advice to non-mutual fund clients such as collective funds or institutional separate accounts.
The Board determined that the Advisory Agreement Rate for the Fund, both with and without the administration fee rate and before and after waivers, was reasonable in light of the Fund’s Expense Group information, the net expense ratio commitments, the services covered by the Advisory Agreements and other information provided. The Board also reviewed and considered the Sub-Advisory Agreement Rate and concluded that the Sub-Advisory Agreement Rate was reasonable in light of the services covered by the Sub-Advisory Agreement and other information provided.
Profitability
The Board received and considered a profitability analysis of Funds Management, as well as an analysis of the profitability to the collective Wells Fargo businesses that provide services to the Fund. It considered that the information provided to it was necessarily estimated, and that the profitability information provided to it, especially on a fund-by-fund basis, did not necessarily provide a precise tool for evaluating the appropriateness of the Fund’s Advisory Agreement Rate in isolation. It noted that the levels of profitability reported on a fund-by-fund basis varied widely, depending on, among other things, the size and type of fund. The Board concluded that the profitability reported by Funds Management was not unreasonable.
Table of Contents
| Other Information (Unaudited) | Wells Fargo Advantage VT Small Cap Growth Fund | 27 |
The Board did not consider separate profitability information with respect to Wells Capital Management, because, as an affiliate of Funds Management, its profitability information was subsumed in the collective Wells Fargo profitability analysis provided by Funds Management.
Economies of scale
With respect to possible economies of scale, the Board reviewed the breakpoints in the Fund’s advisory fee and/or administration fee structure, which operate generally to reduce the expenses of the Fund (as a percentage of Fund assets) as the Fund grows in size. It considered that, as a fund shrinks in size, breakpoints conversely result in increasing fee levels. The Board noted that it would have on-going opportunities to review the appropriate levels of breakpoints in the future, and concluded that the breakpoints as implemented appeared to be a reasonable step toward sharing economies of scale, if any, with the Fund. However, the Board acknowledged the inherent limitations of any analysis of economies of scale and of any attempt to correlate breakpoints with such economies, stemming largely from the Board’s understanding that economies of scale are realized, if at all, across a variety of products and services, not just with respect to a single fund.
Other benefits to Funds Management and Wells Capital Management
The Board received and considered information regarding potential “fall-out” or ancillary benefits received by Funds Management and its affiliates, including Wells Capital Management, as a result of their relationship with the Fund. Ancillary benefits could include, among others, benefits directly attributable to the relationship of Funds Management and Wells Capital Management with the Fund and benefits potentially derived from an increase in Funds Management’s and Wells Capital Management’s business as a result of their relationship with the Fund (such as the ability to market to shareholders other financial products offered by Funds Management and its affiliates, including Wells Capital Management).
The Board considered that Wells Fargo Funds Distributor, LLC, an affiliate of Funds Management, serves as distributor to the Fund and receives certain compensation for those services. The Board noted that various financial institutions, including affiliates of Funds Management, may receive distribution-related fees, shareholder servicing payments (including amounts derived from payments under Rule 12b-1 plans) and sub-transfer agency fees in respect of shares sold or held through them and services provided.
The Board also reviewed information about whether and to what extent soft dollar credits are sought and how any such credits are utilized and any benefits that may be realized by using an affiliated broker.
Other factors and broader review
The Board also considered the markets for distribution of the Fund’s shares, including the channels through which the Fund’s shares are offered and sold. The Board noted that the Fund is part of one of the few fund families that have both direct-to-fund and intermediary distribution channels. As discussed above, the Board reviews detailed materials received from Funds Management and Wells Capital Management annually as part of the re-approval process under Section 15 of the 1940 Act and also reviews and assesses information about the quality of the services that the Fund receives throughout the year. In this regard, the Board has reviewed reports of Funds Management at each of its quarterly meetings, which include, among other things, portfolio reviews and performance reports. In addition, the Board confers with portfolio managers at various times throughout the year.
Conclusion
After considering the above-described factors and based on its deliberations and its evaluation of the information described above, the Board unanimously approved the continuation of the Advisory Agreements for an additional one-year period.
Table of Contents
| 28 | Wells Fargo Advantage VT Small Cap Growth Fund | List of Abbreviations |
The following is a list of common abbreviations for terms and entities which may have appeared in this report.
| ACB | — Agricultural Credit Bank |
| ADR | — American Depository Receipt |
| ADS | — American Depository Shares |
| AGC-ICC | — Assured Guaranty Corporation - Insured Custody Certificates |
| AGM | — Assured Guaranty Municipal |
| AMBAC | — American Municipal Bond Assurance Corporation |
| AMT | — Alternative Minimum Tax |
| AUD | — Australian Dollar |
| BAN | — Bond Anticipation Notes |
| BHAC | — Berkshire Hathaway Assurance Corporation |
| BRL | — Brazil Real |
| CAB | — Capital Appreciation Bond |
| CAD | — Canadian Dollar |
| CCAB | — Convertible Capital Appreciation Bond |
| CDA | — Community Development Authority |
| CDO | — Collateralized Debt Obligation |
| CHF | — Swiss Franc |
| COP | — Certificate of Participation |
| CR | — Custody Receipts |
| DKK | — Danish Krone |
| DRIVER | — Derivative Inverse Tax-Exempt Receipts |
| DW&P | — Department of Water & Power |
| DWR | — Department of Water Resources |
| ECFA | — Educational & Cultural Facilities Authority |
| EDA | — Economic Development Authority |
| EDFA | — Economic Development Finance Authority |
| ETF | — Exchange-Traded Fund |
| EUR | — Euro |
| FFCB | — Federal Farm Credit Bank |
| FGIC | — Financial Guaranty Insurance Corporation |
| FGLMC | — Federal Government Loan Mortgage Company |
| FHA | — Federal Housing Authority |
| FHLB | — Federal Home Loan Bank |
| FHLMC | — Federal Home Loan Mortgage Corporation |
| FICO | — The Financing Corporation |
| FNMA | — Federal National Mortgage Association |
| FSA | — Farm Service Agency |
| GBP | — Great British Pound |
| GDR | — Global Depository Receipt |
| GNMA | — Government National Mortgage Association |
| GO | — General Obligation |
| HCFR | — Healthcare Facilities Revenue |
| HEFA | — Health & Educational Facilities Authority |
| HEFAR | — Higher Education Facilities Authority Revenue |
| HFA | — Housing Finance Authority |
| HFFA | — Health Facilities Financing Authority |
| HKD | — Hong Kong Dollar |
| HUF | — Hungarian Forint |
| IBC | — Insured Bond Certificate |
| IDA | — Industrial Development Authority |
| IDAG | — Industrial Development Agency |
| IDR | — Industrial Development Revenue |
| IEP | — Irish Pound |
| JPY | — Japanese Yen |
| KRW | — Republic of Korea Won |
| LIBOR | — London Interbank Offered Rate |
| LIQ | — Liquidity Agreement |
| LLC | — Limited Liability Company |
| LLP | — Limited Liability Partnership |
| LOC | — Letter of Credit |
| LP | — Limited Partnership |
| MBIA | — Municipal Bond Insurance Association |
| MFHR | — Multi-Family Housing Revenue |
| MSTR | — Municipal Securities Trust Receipts |
| MTN | — Medium Term Note |
| MUD | — Municipal Utility District |
| MXN | — Mexican Peso |
| MYR | — Malaysian Ringgit |
| NATL-RE | — National Public Finance Guarantee Corporation |
| NOK | — Norwegian Krone |
| NZD | — New Zealand Dollar |
| PCFA | — Pollution Control Finance Authority |
| PCR | — Pollution Control Revenue |
| PFA | — Public Finance Authority |
| PFFA | — Public Facilities Financing Authority |
| PFOTER | — Puttable Floating Option Tax-Exempt Receipts |
| plc | — Public Limited Company |
| PLN | — Polish Zloty |
| PUTTER | — Puttable Tax-Exempt Receipts |
| R&D | — Research & Development |
| RDA | — Redevelopment Authority |
| RDFA | — Redevelopment Finance Authority |
| REIT | — Real Estate Investment Trust |
| ROC | — Reset Option Certificates |
| SAVRS | — Select Auction Variable Rate Securities |
| SBA | — Small Business Authority |
| SEK | — Swedish Krona |
| SFHR | — Single Family Housing Revenue |
| SFMR | — Single Family Mortgage Revenue |
| SGD | — Singapore Dollar |
| SKK | — Slovakian Koruna |
| SPA | — Standby Purchase Agreement |
| SPDR | — Standard & Poor’s Depositary Receipts |
| STRIPS | — Separate Trading of Registered Interest and Principal Securities |
| TAN | — Tax Anticipation Notes |
| TBA | — To Be Announced |
| TIPS | — Treasury Inflation-Protected Securities |
| TRAN | — Tax Revenue Anticipation Notes |
| TCR | — Transferable Custody Receipts |
| TRY | — Turkish Lira |
| TTFA | — Transportation Trust Fund Authority |
| TVA | — Tennessee Valley Authority |
| XLCA | — XL Capital Assurance |
| ZAR | — South African Rand |
Table of Contents
This page is intentionally left blank.
Table of Contents
This page is intentionally left blank.
Table of Contents


FOR MORE INFORMATION
More information about Wells Fargo Advantage Funds is available free upon request. To obtain literature, please write, e-mail, visit the Fund’s Web site, or call:
Wells Fargo Advantage Funds
P.O. Box 8266
Boston, MA 02266-8266
E-mail: wfaf@wellsfargo.com
Web site: wellsfargoadvantagefunds.com
Individual investors: 1-800-222-8222
Retail investment professionals: 1-888-877-9275
Institutional investment professionals: 1-866-765-0778
This report and the financial statements contained herein are submitted for the general information of the shareholders of Wells Fargo Advantage Funds. If this report is used for promotional purposes, distribution of the report must be accompanied or preceded by a current prospectus. For a current prospectus and, if available, a summary prospectus containing more complete information, including charges and expenses, call 1-800-222-8222 or visit the Fund’s Web site at wellsfargoadvantagefunds.com . Please consider the investment objectives, risks, charges, and expenses of the investment carefully before investing. This and other information about Wells Fargo Advantage Funds can be found in the current prospectus. Read the prospectus carefully before you invest or send money.
Wells Fargo Funds Management, LLC, a wholly owned subsidiary of Wells Fargo & Company, provides investment advisory and administrative services for Wells Fargo Advantage Funds. Other affiliates of Wells Fargo & Company provide subadvisory and other services for the Funds. The Funds are distributed by Wells Fargo Funds Distributor, LLC, Member FINRA/SIPC, an affiliate of Wells Fargo & Company.
NOT FDIC INSURED ¡ NO BANK GUARANTEE ¡ MAY LOSE VALUE
© 2012 Wells Fargo Funds Management, LLC. All rights reserved.
210668 08-12 SVT7/SAR144 06-12 |
Table of Contents

Wells Fargo Advantage VT Small Cap Value Fund

Semi-Annual Report
June 30, 2012

Table of Contents
Reduce clutter. Save trees.
Sign up for electronic delivery of prospectuses and shareholder reports at wellsfargo.com/advantagedelivery
| 2 | ||||
| 4 | ||||
| 6 | ||||
| 7 | ||||
Financial Statements | ||||
| 13 | ||||
| 14 | ||||
| 15 | ||||
| 16 | ||||
| 18 | ||||
| 24 | ||||
| 30 | ||||
The views expressed and any forward-looking statements are as of June 30, 2012, unless otherwise noted, and are those of the Fund managers and/or Wells Fargo Funds Management, LLC. Discussions of individual securities, or the markets generally, or any Wells Fargo Advantage Fund are not intended as individual recommendations. Future events or results may vary significantly from those expressed in any forward-looking statements; the views expressed are subject to change at any time in response to changing circumstances in the market. Wells Fargo Funds Management, LLC, disclaims any obligation to publicly update or revise any views expressed or forward-looking statements.
NOT FDIC INSURED ¡ NO BANK GUARANTEE ¡ MAY LOSE VALUE
Table of Contents

WELLS FARGO INVESTMENT HISTORY
| 1932 | Keystone creates one of the first mutual fund families. | |
| 1971 | Wells Fargo & Company introduces one of the first institutional index funds. | |
| 1978 | Wells Fargo applies Markowitz and Sharpe’s research on Modern Portfolio Theory to introduce one of the industry’s first Tactical Asset Allocation (TAA) models in institutional separately managed accounts. | |
| 1984 | Wells Fargo Stagecoach Funds launches its first asset allocation fund. | |
| 1989 | The Tactical Asset Allocation (TAA) Model is first applied to Wells Fargo’s asset allocation mutual funds. | |
| 1994 | Wells Fargo introduces the LifePath Funds, one of the first suites of target date funds (now the Wells Fargo Advantage Dow Jones Target Date FundsSM). | |
| 1996 | Evergreen Investments and Keystone Funds merge. | |
| 1997 | Wells Fargo launches Wells Fargo Advantage WealthBuilder PortfoliosSM, a fund-of-funds suite of products that includes the use of quantitative models to shift assets among investment styles. | |
| 1999 | Norwest Advantage Funds and Stagecoach Funds are reorganized into Wells Fargo Funds after the merger of Norwest and Wells Fargo. | |
| 2002 | Evergreen Retail and Evergreen Institutional companies form the umbrella asset management company, Evergreen Investments. | |
| 2005 | The integration of Strong Funds with Wells Fargo Funds creates Wells Fargo Advantage Funds, resulting in one of the top 20 mutual fund companies in the United States. | |
| 2006 | Wells Fargo Advantage Funds relaunches the target date product line as Wells Fargo Advantage Dow Jones Target Date Funds. | |
| 2010 | The mergers and reorganizations of Evergreen and Wells Fargo Advantage mutual funds are completed, unifying the families under the brand of Wells Fargo Advantage Funds. | |
Wells Fargo Advantage Funds®
Wells Fargo Advantage Funds skillfully guides institutions, financial advisors, and individuals through the investment terrain to help them reach their financial objectives. Everything we do on behalf of investors is backed by our unique combination of qualifications.
Strength
Our organization is built on the standards of integrity and service established by our parent company—Wells Fargo & Company—more than 150 years ago. And, because we’re part of a highly diversified financial enterprise, we offer the depth of resources to help investors succeed.
Expertise
Our multi-boutique model offers investors access to the independent thinking of premier investment managers that have been chosen for their time-tested strategies. While each team specializes in a specific investment strategy, collectively they provide investors a wide choice of distinct investment styles. Our dedication to investment excellence doesn’t end with our expertise in manager selection—risk management, analysis, and rigorous ongoing review seek to ensure each manager’s investment process remains consistent.
Partnership
Our collaborative approach is built around understanding the needs and goals of our clients. By adhering to core principles of sound judgment and steady guidance, we support you through every stage of the investment decision process.
Carefully consider a fund’s investment objectives, risks, charges, and expenses before investing. For a current prospectus and, if available, a summary prospectus, containing this and other information, visit wellsfargoadvantagefunds.com. Read it carefully before investing.
Wells Fargo Funds Management, LLC, a wholly owned subsidiary of Wells Fargo & Company, provides investment advisory and administrative services for Wells Fargo Advantage Funds®. Other affiliates of Wells Fargo & Company provide subadvisory and other services for the Funds. The Funds are distributed by Wells Fargo Funds Distributor, LLC, Member FINRA/SIPC, an affiliate of Wells Fargo & Company.
“Dow Jones®” and “Dow Jones Target Date IndexesSM” are service marks of Dow Jones Trademark Holdings, LLC (“Dow Jones”), have been licensed to CME Group Index Services LLC (“CME Indexes”) and have been sublicensed for use for certain purposes by Global Index Advisors, Inc, and Wells Fargo Funds Management, LLC. The Wells Fargo Advantage Dow Jones Target Date FundsSM based on the Dow Jones Target Date IndexesSM, are not sponsored, endorsed, sold or promoted by Dow Jones, CME Indexes or their respective affiliates and none of them makes any representation regarding the advisability of investing in such product(s).
NOT FDIC INSURED ¡ NO BANK GUARANTEE ¡ MAY LOSE VALUE
Not part of semi-annual report.
Table of Contents
Wells Fargo Advantage Funds offers more than 110 mutual funds across a wide range of asset classes, representing over $207 billion in assets under management, as of June 30, 2012.
| Equity Funds | ||||
Asia Pacific Fund | Enterprise Fund† | Opportunity Fund† | ||
C&B Large Cap Value Fund | Equity Value Fund | Precious Metals Fund | ||
C&B Mid Cap Value Fund | Global Opportunities Fund | Premier Large Company Growth Fund | ||
Capital Growth Fund | Growth Fund | Small Cap Opportunities Fund | ||
Common Stock Fund | Index Fund | Small Cap Value Fund | ||
Disciplined U.S. Core Fund | International Equity Fund | Small Company Growth Fund | ||
Discovery Fund† | International Value Fund | Small Company Value Fund | ||
Diversified Equity Fund | Intrinsic Small Cap Value Fund | Small/Mid Cap Core Fund | ||
Diversified International Fund | Intrinsic Value Fund | Small/Mid Cap Value Fund | ||
Diversified Small Cap Fund | Intrinsic World Equity Fund | Special Mid Cap Value Fund | ||
Emerging Growth Fund | Large Cap Core Fund | Special Small Cap Value Fund | ||
Emerging Markets Equity Fund | Large Cap Growth Fund | Specialized Technology Fund | ||
Emerging Markets Equity Income Fund | Large Company Value Fund | Traditional Small Cap Growth Fund | ||
Endeavor Select Fund† | Omega Growth Fund | Utility and Telecommunications Fund | ||
| Bond Funds | ||||
Adjustable Rate Government Fund | Inflation-Protected Bond Fund | Short-Term Bond Fund | ||
California Limited-Term Tax-Free Fund | Intermediate Tax/AMT-Free Fund | Short-Term High Yield Bond Fund | ||
California Tax-Free Fund | International Bond Fund | Short-Term Municipal Bond Fund | ||
Colorado Tax-Free Fund | Minnesota Tax-Free Fund | Strategic Municipal Bond Fund | ||
Emerging Markets Local Bond Fund | Municipal Bond Fund | Total Return Bond Fund | ||
Government Securities Fund | North Carolina Tax-Free Fund | Ultra Short-Term Income Fund | ||
High Income Fund | Pennsylvania Tax-Free Fund | Ultra Short-Term Municipal Income Fund | ||
High Yield Bond Fund | Short Duration Government Bond Fund | Wisconsin Tax-Free Fund | ||
Income Plus Fund | ||||
| Asset Allocation Funds | ||||
Absolute Return Fund | WealthBuilder Equity Portfolio† | Target 2020 Fund† | ||
Asset Allocation Fund | WealthBuilder Growth Allocation Portfolio† | Target 2025 Fund† | ||
Conservative Allocation Fund | WealthBuilder Growth Balanced Portfolio† | Target 2030 Fund† | ||
Diversified Capital Builder Fund | WealthBuilder Moderate Balanced Portfolio† | Target 2035 Fund† | ||
Diversified Income Builder Fund | WealthBuilder Tactical Equity Portfolio† | Target 2040 Fund† | ||
Growth Balanced Fund | Target Today Fund† | Target 2045 Fund† | ||
Index Asset Allocation Fund | Target 2010 Fund† | Target 2050 Fund† | ||
Moderate Balanced Fund | Target 2015 Fund† | Target 2055 Fund† | ||
WealthBuilder Conservative Allocation Portfolio† | ||||
| Money Market Funds | ||||
100% Treasury Money Market Fund | Heritage Money Market Fund† | National Tax-Free Money Market Fund | ||
California Municipal Money Market Fund | Money Market Fund | Prime Investment Money Market Fund | ||
Cash Investment Money Market Fund | Municipal Cash Management Money Market Fund | Treasury Plus Money Market Fund | ||
Government Money Market Fund | Municipal Money Market Fund | |||
| Variable Trust Funds1 | ||||
VT Discovery Fund† | VT Intrinsic Value Fund | VT Small Cap Growth Fund | ||
VT Index Asset Allocation Fund | VT Omega Growth Fund | VT Small Cap Value Fund | ||
VT International Equity Fund | VT Opportunity Fund† | VT Total Return Bond Fund |
An investment in a money market fund is not insured or guaranteed by the Federal Deposit Insurance Corporation or any other government agency. Although the Wells Fargo Advantage Money Market Funds seek to preserve the value of your investment at $1.00 per share, it is possible to lose money by investing in a money market fund.
| 1. | The Variable Trust Funds are generally available only through insurance company variable contracts. |
| † | In this report, the Wells Fargo Advantage Discovery FundSM, Wells Fargo Advantage Endeavor Select FundSM, Wells Fargo Advantage Enterprise FundSM, Wells Fargo Advantage Opportunity FundSM, Wells Fargo Advantage WealthBuilder Conservative Allocation PortfolioSM, Wells Fargo Advantage WealthBuilder Equity PortfolioSM, Wells Fargo Advantage WealthBuilder Growth Allocation PortfolioSM, Wells Fargo Advantage WealthBuilder Growth Balanced PortfolioSM, Wells Fargo Advantage WealthBuilder Moderate Balanced PortfolioSM, Wells Fargo Advantage WealthBuilder Tactical Equity PortfolioSM, Wells Fargo Advantage Dow Jones Target Today FundSM, Wells Fargo Advantage Dow Jones Target 2010 FundSM, Wells Fargo Advantage Dow Jones Target 2015 FundSM, Wells Fargo Advantage Dow Jones Target 2020 FundSM, Wells Fargo Advantage Dow Jones Target 2025 FundSM, Wells Fargo Advantage Dow Jones Target 2030 FundSM, Wells Fargo Advantage Dow Jones Target 2035 FundSM, Wells Fargo Advantage Dow Jones Target 2040 FundSM, Wells Fargo Advantage Dow Jones Target 2045 FundSM, Wells Fargo Advantage Dow Jones Target 2050 FundSM, Wells Fargo Advantage Dow Jones Target 2055 FundSM, Wells Fargo Advantage Heritage Money Market FundSM, Wells Fargo Advantage VT Discovery FundSM, and Wells Fargo Advantage VT Opportunity FundSM are referred to as the Discovery Fund, Endeavor Select Fund, Enterprise Fund, Opportunity Fund, WealthBuilder Conservative Allocation Portfolio, WealthBuilder Equity Portfolio, WealthBuilder Growth Allocation Portfolio, WealthBuilder Growth Balanced Portfolio, WealthBuilder Moderate Balanced Portfolio, WealthBuilder Tactical Equity Portfolio, Target Today Fund, Target 2010 Fund, Target 2015 Fund, Target 2020 Fund, Target 2025 Fund, Target 2030 Fund, Target 2035 Fund, Target 2040 Fund, Target 2045 Fund, Target 2050 Fund, Target 2055 Fund, Heritage Money Market Fund, VT Discovery Fund, and VT Opportunity Fund, respectively. |
Not part of semi-annual report.
Table of Contents
| 2 | Wells Fargo Advantage VT Small Cap Value Fund | Letter to Shareholders (Unaudited) |

Karla M. Rabusch,
President
Wells Fargo Advantage Funds
The period was marked by continued concerns about the possible global economic effects of the ongoing European sovereign debt crisis that began in Greece and later spread to the larger economies of Italy and Spain.
In contrast to worrisome data from the eurozone, U.S. economic data remained moderately positive.
Dear Valued Shareholder:
We’re pleased to offer you this semi-annual report for the Wells Fargo Advantage VT Small Cap Value Fund for the six-month period that ended June 30, 2012. The period was marked by continued concerns about the possible global economic effects of the ongoing European sovereign debt crisis that began in Greece and later spread to the larger economies of Italy and Spain. Widespread support from central banks helped push developed market indexes to gains despite considerable intra-period volatility.
Macroeconomic optimism faded as global growth slowed and worries rose.
Prior to and throughout the reporting period, concerns about the eurozone sovereign debt situation returned to center stage and dominated stock markets around the globe. Investors became increasingly concerned that Greece would default on its debt, a scenario that only seemed more likely as eurozone leaders began to openly discuss a “voluntary” haircut on Greek debt for private investors. Because many eurozone banks owned Greek debt and many U.S. banks had financial ties to eurozone banks, investors worried about the effects of such an event on the financial systems and on the global economy.
The Greek credit crisis was seemingly addressed in March 2012 when the Greek government came to an agreement with its creditors, allowing the country to write down the principal on most of its bonds in exchange for increased financial austerity. The Greek agreement, combined with unprecedented support for eurozone banks by the European Central Bank, seemed to calm investor concerns, at least temporarily.
By the end of the reporting period, however, the agreement seemed on the verge of unraveling. Legislative elections in May left no single party with enough seats to form a government, and none of the parties was able to form a ruling coalition. A pro-bailout party won the subsequent June elections, but the Greek economy remained so weak that investors questioned whether the country would be able to meet its economic targets from the March agreement. Even more worrisome, in May 2012, Spain nationalized Bankia, putting more than $19 billion into the bank after it suffered heavy losses from property loans. The move refocused investor attention on Spain’s weak economy and depressed property sector, and Spanish bonds sold off. Moreover, news reports indicated that Greeks and Spaniards were pulling money from their country’s banks in favor of German and Swiss banks. By mid-June, analysts were openly discussing the possibility of a crisis within the European banking system.
The U.S. economy reported relatively solid news.
In contrast to worrisome data from the eurozone, U.S. economic data remained moderately positive. Reported real gross domestic product (GDP) growth came in at an annualized rate of 3.0% in the fourth quarter of 2011 compared with the prior quarter. Real GDP growth decelerated to a 1.9% annualized rate in the first quarter of 2012 but remained solidly in positive territory. In addition, the major banks appeared to have taken steps toward repairing their balance sheets; in March, the Federal Reserve (Fed) announced that 15 of the 19 major banks had passed a “stress test” in which the Fed attempted to gauge whether the banks could survive a severe recession that included a 50% drop in the stock market and a 21% percent decline in housing prices.
Table of Contents
| Letter to Shareholders (Unaudited) | Wells Fargo Advantage VT Small Cap Value Fund | 3 |
The main piece of negative economic data was the unemployment rate, which remained at relatively high levels, beginning the period at 8.3% and ending it at 8.2%. Toward the end of the period, data indicated that the U.S. economy was adding fewer jobs than expected, leading to concerns that the country’s economic growth was slowing.
Major stock indexes posted positive returns.
Even though investor worries about the sovereign debt crisis within the eurozone caused considerable stock market volatility, the combination of central bank support and relatively strong U.S. economic numbers pushed major stock market indexes into the black, both for developed markets and for major emerging markets. Within the U.S., large-cap stocks modestly outperformed small-cap stocks, and growth stocks edged past value stocks.
We use time-tested investment strategies, even as many variables are at work in the market.
The full effect of the credit crisis remains unknown. Elevated unemployment and debt defaults continue to pressure consumers and businesses alike. In our experience, strict adherence to time-tested investment strategies has its rewards. As a whole, Wells Fargo Advantage Funds represents investments across a range of asset classes and investment styles, giving you an opportunity to create a diversified investment portfolio. While diversification may not prevent losses in a downturn, we believe it helps in managing risk.
Thank you for choosing to invest with Wells Fargo Advantage Funds. We appreciate your confidence in us and remain committed to helping you meet your financial needs. For current information about your fund investments, contact your investment professional, visit our Web site at wellsfargoadvantagefunds.com, or call us directly at 1-800-222-8222. We are available 24 hours a day, 7 days a week.
Sincerely,

Karla M. Rabusch
President
Wells Fargo Advantage Funds
Table of Contents
| 4 | Wells Fargo Advantage VT Small Cap Value Fund | Performance Highlights (Unaudited) |
INVESTMENT OBJECTIVE
The Fund seeks long-term capital appreciation.
ADVISER
Wells Fargo Funds Management, LLC
SUB-ADVISER
Wells Capital Management Incorporated
PORTFOLIO MANAGERS
Erik Asthelmer
I. Charles Rinaldi
Michael Schneider, CFA
FUND INCEPTION
October 10, 1997
TEN LARGEST EQUITY HOLDINGS1 (AS OF JUNE 30, 2012) | ||||
InterOil Corporation | 9.23% | |||
Randgold Resources Limited ADR | 7.08% | |||
Range Resources Corporation | 2.83% | |||
Chimera Investment Corporation | 2.72% | |||
United Continental Holdings Incorporated | 2.61% | |||
McMoRan Exploration Company | 2.45% | |||
Chicago Bridge & Iron Company NV | 2.35% | |||
Orasure Technologies Incorporated | 2.02% | |||
GEO Group Incorporated | 1.81% | |||
Argo Group International Holdings Limited | 1.75% | |||
| SECTOR DISTRIBUTION2 (AS OF JUNE 30, 2012) | ||
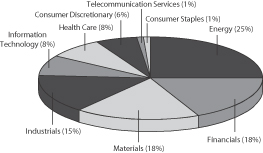 | ||
| 1. | The ten largest equity holdings are calculated based on the value of the securities divided by total net assets of the Fund. Holdings are subject to change and may have changed since the date specified. |
| 2. | Sector distribution is subject to change and is calculated based on the total long-term investments of the Fund. |
Table of Contents
| Performance Highlights (Unaudited) | Wells Fargo Advantage VT Small Cap Value Fund | 5 |
AVERAGE ANNUAL TOTAL RETURN3 (%) (AS OF JUNE 30, 2012)
| Expense Ratios4 | ||||||||||||||||||||||||||||
| Inception Date | 6 Months* | 1 Year | 5 Year | 10 Year | Gross | Net5 | ||||||||||||||||||||||
Class 1 | 07/16/2010 | 6.24 | (1.36 | ) | (0.94 | ) | 6.12 | 1.15% | 0.90% | |||||||||||||||||||
Class 2 | 10/10/1997 | 6.13 | (1.47 | ) | (1.02 | ) | 6.07 | 1.40% | 1.15% | |||||||||||||||||||
Russell 2000® Value Index6 | 8.23 | (1.44 | ) | (1.05 | ) | 6.50 | ||||||||||||||||||||||
| * | Returns for periods of less than one year are not annualized. |
Figures quoted represent past performance, which is no guarantee of future results and do not reflect the deduction of taxes that a shareholder may pay on fund distributions or the redemption of fund shares. Investment return and principal value of an investment will fluctuate so that an investor’s shares, when redeemed, may be worth more or less than their original cost. Current performance may be lower or higher than the performance data quoted and assumes the reinvestment of dividends and capital gains. Current month-end performance is available by calling 1-866-765-0778. Performance figures of the Fund do not reflect fees charged pursuant to the terms of variable life insurance policies and variable annuity contracts.
Index returns do not include transaction costs associated with buying and selling securities, any mutual fund fees or expenses or any taxes. It is not possible to invest directly in an index.
Stock fund values fluctuate in response to the activities of individual companies and general market and economic conditions. Smaller company stocks tend to be more volatile and less liquid than those of larger companies. The use of derivatives may reduce returns and/or increase volatility. Certain investment strategies tend to increase the total risk of an investment (relative to the broader market). This Fund is exposed to foreign investment risk. Consult the Fund’s prospectus for additional information on these and other risks.
Please refer to the prospectus provided by your participating insurance company for detailed information describing the separate accounts for information regarding surrender charges, mortality and expense risk fees and other charges that may be assessed by the participating insurance companies.
| 3. | Historical performance shown for Class 1 shares prior to their inception reflects the performance of Class 2 shares, and includes the higher expenses applicable to Class 2 shares. If these expenses had not been included, returns would be higher. |
| 4. | Reflects the expense ratios as stated in the most recent prospectuses. |
| 5. | The Adviser has committed through July 18, 2013 to waive fees and/or reimburse expenses to the extent necessary to cap the Fund’s Total Annual Fund Operating Expenses After Fee Waiver, excluding certain expenses, at 0.89% for Class 1 and 1.14% for Class 2. Without this cap, the Fund’s returns would have been lower. |
| 6. | The Russell 2000® Value Index measures the performance of those Russell 2000 companies with lower price-to-book ratios and lower forecasted growth values. You cannot invest directly in an index. |
Table of Contents
| 6 | Wells Fargo Advantage VT Small Cap Value Fund | Fund Expenses (Unaudited) |
As a shareholder of the Fund, you incur ongoing costs, including management fees, distribution (12b-1) fees, and other Fund expenses. This example is intended to help you understand your ongoing costs (in dollars) of investing in the Fund and to compare these costs with the ongoing costs of investing in other mutual funds.
The example is based on an investment of $1,000 invested at the beginning of the six-month period and held for the entire period from January 1, 2012 to June 30, 2012.
Actual Expenses
The “Actual” line of the table below provides information about actual account values and actual expenses. You may use the information in this line, together with the amount you invested, to estimate the expenses that you paid over the period. Simply divide your account value by $1,000 (for example, an $8,600 account value divided by $1,000 = 8.6), then multiply the result by the number in the “Actual” line under the heading entitled “Expenses Paid During Period” for your applicable class of shares to estimate the expenses you paid on your account during this period.
Hypothetical Example for Comparison Purposes
The “Hypothetical” line of the table below provides information about hypothetical account values and hypothetical expenses based on the Fund’s actual expense ratio and an assumed rate of return of 5% per year before expenses, which is not the Fund’s actual return. The hypothetical account values and expenses may not be used to estimate the actual ending account balance or expenses you paid for the period. You may use this information to compare the ongoing costs of investing in the Fund and other funds. To do so, compare this 5% hypothetical example with the 5% hypothetical examples that appear in the shareholder reports of the other funds.
Please note that the expenses shown in the table are meant to highlight your ongoing costs only and do not reflect any separate account charges assessed by participating insurance companies. Therefore, the “Hypothetical” line of the table is useful in comparing ongoing costs only, and will not help you determine the relative total costs of owning different funds. In addition, if these separate account charges assessed by participating insurance companies were included, your costs would have been higher.
| Beginning Account Value 01-01-2012 | Ending Account Value 06-30-2012 | Expenses Paid During the Period1 | Net Annual Expense Ratio | |||||||||||||
Class 1 | ||||||||||||||||
Actual | $ | 1,000.00 | $ | 1,062.42 | $ | 4.56 | 0.89 | % | ||||||||
Hypothetical (5% return before expenses) | $ | 1,000.00 | $ | 1,020.44 | $ | 4.47 | 0.89 | % | ||||||||
Class 2 | ||||||||||||||||
Actual | $ | 1,000.00 | $ | 1,061.30 | $ | 5.84 | 1.14 | % | ||||||||
Hypothetical (5% return before expenses) | $ | 1,000.00 | $ | 1,019.19 | $ | 5.72 | 1.14 | % | ||||||||
| 1. | Expenses paid is equal to the annualized expense ratio of each class multiplied by the average account value over the period, multiplied by the number of days in the most recent fiscal half-year divided by the number of days in the fiscal year (to reflect the one-half year period). |
Table of Contents
| Portfolio of Investments—June 30, 2012 (Unaudited) | Wells Fargo Advantage VT Small Cap Value Fund | 7 |
| Security Name | Shares | Value | ||||||||||
Common Stocks: 94.90% | ||||||||||||
Consumer Discretionary: 5.29% | ||||||||||||
| Automobiles: 0.07% | ||||||||||||
Winnebago Industries Incorporated † | 4,100 | $ | 41,779 | |||||||||
|
| |||||||||||
| Diversified Consumer Services: 0.50% | ||||||||||||
Cambium Learning Group Incorporated † | 22,100 | 20,995 | ||||||||||
Corinthian Colleges Incorporated † | 88,700 | 256,343 | ||||||||||
| 277,338 | ||||||||||||
|
| |||||||||||
| Hotels, Restaurants & Leisure: 1.86% | ||||||||||||
Denny’s Corporation † | 52,200 | 231,768 | ||||||||||
Scientific Games Corporation Class A † | 38,800 | 331,740 | ||||||||||
The Wendy’s Company | 99,700 | 470,584 | ||||||||||
| 1,034,092 | ||||||||||||
|
| |||||||||||
| Household Durables: 0.97% | ||||||||||||
Cavco Industries Incorporated † | 7,900 | 405,112 | ||||||||||
KB Home Incorporated | 6,200 | 60,760 | ||||||||||
Skyline Corporation | 14,300 | 72,644 | ||||||||||
| 538,516 | ||||||||||||
|
| |||||||||||
| Internet & Catalog Retail: 0.10% | ||||||||||||
dELiA*s Incorporated † | 35,450 | 54,948 | ||||||||||
|
| |||||||||||
| Media: 0.49% | ||||||||||||
Discovery Communications Incorporated † | 5,500 | 275,495 | ||||||||||
|
| |||||||||||
| Multiline Retail: 0.22% | ||||||||||||
Saks Incorporated † | 11,400 | 121,410 | ||||||||||
|
| |||||||||||
| Specialty Retail: 1.08% | ||||||||||||
Collective Brands Incorporated † | 11,141 | 238,640 | ||||||||||
GameStop Corporation Class A | 10,800 | 198,288 | ||||||||||
rue21 Incorporated † | 5,000 | 126,200 | ||||||||||
Talbots Incorporated † | 13,900 | 35,028 | ||||||||||
| 598,156 | ||||||||||||
|
| |||||||||||
Consumer Staples: 0.72% | ||||||||||||
| Personal Products: 0.72% | ||||||||||||
Prestige Brands Holdings Incorporated † | 25,400 | 401,574 | ||||||||||
|
| |||||||||||
Energy: 24.05% | ||||||||||||
| Energy Equipment & Services: 7.05% | ||||||||||||
Ensco International plc ADR | 3,300 | 155,001 | ||||||||||
Helix Energy Solutions Group Incorporated † | 19,400 | 318,354 | ||||||||||
Helmerich & Payne Incorporated | 10,200 | 443,496 | ||||||||||
ION Geophysical Corporation † | 106,100 | 699,199 | ||||||||||
Key Energy Services Incorporated † | 35,200 | 267,520 | ||||||||||
The accompanying notes are an integral part of these financial statements.
Table of Contents
| 8 | Wells Fargo Advantage VT Small Cap Value Fund | Portfolio of Investments—June 30, 2012 (Unaudited) |
| Security Name | Shares | Value | ||||||||||
| Energy Equipment & Services (continued) | ||||||||||||
Newpark Resources Incorporated † | 117,800 | $ | 695,020 | |||||||||
Oceaneering International Incorporated # | 9,000 | 430,740 | ||||||||||
Parker Drilling Company † | 37,700 | 170,027 | ||||||||||
PHI Incorporated (non-voting) † | 12,300 | 342,063 | ||||||||||
PHI Incorporated (voting) † | 2,400 | 63,840 | ||||||||||
Vantage Drilling Company † | 59,700 | 89,550 | ||||||||||
Willbros Group Incorporated † | 37,300 | 240,958 | ||||||||||
| 3,915,768 | ||||||||||||
|
| |||||||||||
| Oil, Gas & Consumable Fuels: 17.00% | ||||||||||||
Forest Oil Corporation † | 17,700 | 129,741 | ||||||||||
InterOil Corporation †# | 73,600 | 5,129,920 | ||||||||||
Lone Pine Resources Incorporated † | 9,000 | 24,750 | ||||||||||
McMoRan Exploration Company †# | 107,300 | 1,359,491 | ||||||||||
Newfield Exploration Company † | 4,300 | 126,033 | ||||||||||
PetroQuest Energy Incorporated † | 5,500 | 27,500 | ||||||||||
Pioneer Natural Resources Company | 1,100 | 97,031 | ||||||||||
Plains Exploration & Product Company † | 2,600 | 91,468 | ||||||||||
Range Resources Corporation # | 25,400 | 1,571,498 | ||||||||||
Trilogy Energy Corporation | 38,400 | 887,111 | ||||||||||
| 9,444,543 | ||||||||||||
|
| |||||||||||
Financials: 17.08% | ||||||||||||
| Commercial Banks: 3.10% | ||||||||||||
Ameris Bancorp † | 6,000 | 75,600 | ||||||||||
Associated Banc-Corporation | 7,000 | 92,330 | ||||||||||
Bancorp Incorporated † | 21,100 | 199,395 | ||||||||||
BBCN Bancorp Incorporated † | 13,488 | 146,884 | ||||||||||
CenterState Banks Incorporated | 18,300 | 130,845 | ||||||||||
City National Corporation | 4,900 | 238,042 | ||||||||||
First Horizon National Corporation | 18,900 | 163,485 | ||||||||||
IBERIABANK Corporation | 5,400 | 272,430 | ||||||||||
NBH Holdings Corporation †144A(a) | 12,400 | 226,300 | ||||||||||
Park Sterling Corporation † | 14,900 | 70,179 | ||||||||||
Sandy Spring Bancorp Incorporated | 3,780 | 68,040 | ||||||||||
Western Liberty Bancorp † | 13,700 | 39,730 | ||||||||||
| 1,723,260 | ||||||||||||
|
| |||||||||||
| Insurance: 3.08% | ||||||||||||
Argo Group International Holdings Limited | 33,200 | 971,764 | ||||||||||
Hilltop Holdings Incorporated † | 28,300 | 291,773 | ||||||||||
Mercury General Corporation | 6,600 | 275,022 | ||||||||||
OneBeacon Insurance Group Limited | 13,200 | 171,864 | ||||||||||
| 1,710,423 | ||||||||||||
|
| |||||||||||
| REITs: 10.44% | ||||||||||||
Anworth Mortgage Asset Corporation | 36,700 | 258,735 | ||||||||||
Capstead Mortgage Corporation | 49,400 | 687,154 | ||||||||||
The accompanying notes are an integral part of these financial statements.
Table of Contents
| Portfolio of Investments—June 30, 2012 (Unaudited) | Wells Fargo Advantage VT Small Cap Value Fund | 9 |
| Security Name | Shares | Value | ||||||||||
| REITs (continued) | ||||||||||||
Chimera Investment Corporation | 640,600 | $ | 1,511,816 | |||||||||
Crexus Investment Corporation | 65,800 | 669,186 | ||||||||||
Hatteras Financial Corporation | 13,600 | 388,960 | ||||||||||
Invesco Mortgage Capital Incorporated | 42,700 | 783,118 | ||||||||||
MFA Mortgage Investments Incorporated | 75,700 | 597,273 | ||||||||||
Redwood Trust Incorporated | 32,200 | 401,856 | ||||||||||
Sun Communities Incorporated | 11,300 | 499,912 | ||||||||||
| 5,798,010 | ||||||||||||
|
| |||||||||||
| Thrifts & Mortgage Finance: 0.46% | ||||||||||||
First Niagara Financial Group Incorporated | 24,800 | 189,720 | ||||||||||
Northwest Bancshares Incorporated | 5,700 | 66,747 | ||||||||||
| 256,467 | ||||||||||||
|
| |||||||||||
Health Care: 7.56% | ||||||||||||
| Health Care Equipment & Supplies: 3.84% | ||||||||||||
Hill-Rom Holdings Incorporated | 3,900 | 120,315 | ||||||||||
Hologic Incorporated † | 11,300 | 203,852 | ||||||||||
Invacare Corporation | 5,000 | 77,150 | ||||||||||
Orasure Technologies Incorporated † | 99,800 | 1,121,752 | ||||||||||
Symmetry Medical Incorporated † | 19,900 | 170,742 | ||||||||||
Thoratec Corporation † | 7,400 | 248,492 | ||||||||||
Varian Medical Systems Incorporated † | 3,100 | 188,387 | ||||||||||
| 2,130,690 | ||||||||||||
|
| |||||||||||
| Health Care Providers & Services: 1.76% | ||||||||||||
Amedisys Incorporated † | 20,700 | 257,715 | ||||||||||
Community Health Systems Incorporated † | 5,300 | 148,559 | ||||||||||
Cross Country Healthcare Incorporated † | 34,937 | 152,675 | ||||||||||
Gentiva Health Services Incorporated † | 39,900 | 276,507 | ||||||||||
Healthways Incorporated † | 17,800 | 142,044 | ||||||||||
| 977,500 | ||||||||||||
|
| |||||||||||
| Health Care Technology: 0.64% | ||||||||||||
Allscripts Healthcare Solutions Incorporated † | 19,100 | 208,763 | ||||||||||
Medidata Solutions Incorporated † | 4,500 | 147,015 | ||||||||||
| 355,778 | ||||||||||||
|
| |||||||||||
| Life Sciences Tools & Services: 1.32% | ||||||||||||
Accelrys Incorporated † | 29,700 | 240,273 | ||||||||||
Nordion Incorporated | 23,100 | 216,216 | ||||||||||
Parexel International Corporation † | 9,900 | 279,477 | ||||||||||
| 735,966 | ||||||||||||
|
| |||||||||||
Industrials: 14.67% | ||||||||||||
| Airlines: 5.41% | ||||||||||||
Alaska Air Group Incorporated †# | 15,600 | 560,040 | ||||||||||
Delta Air Lines Incorporated † | 80,400 | 880,380 | ||||||||||
The accompanying notes are an integral part of these financial statements.
Table of Contents
| 10 | Wells Fargo Advantage VT Small Cap Value Fund | Portfolio of Investments—June 30, 2012 (Unaudited) |
| Security Name | Shares | Value | ||||||||||
| Airlines (continued) | ||||||||||||
Lan Airlines SA ADR | 4,400 | $ | 114,840 | |||||||||
United Continental Holdings Incorporated † | 59,700 | 1,452,501 | ||||||||||
| 3,007,761 | ||||||||||||
|
| |||||||||||
| Building Products: 0.43% | ||||||||||||
Webco Industries Incorporated †(a)(i) | 1,850 | 236,338 | ||||||||||
|
| |||||||||||
| Commercial Services & Supplies: 4.60% | ||||||||||||
ABM Industries Incorporated # | 30,600 | 598,536 | ||||||||||
ACCO Brands Corporation † | 52,500 | 542,850 | ||||||||||
GEO Group Incorporated † | 44,200 | 1,004,224 | ||||||||||
Healthcare Services Group | 15,500 | 300,390 | ||||||||||
Kforce Incorporated † | 8,200 | 110,372 | ||||||||||
| 2,556,372 | ||||||||||||
|
| |||||||||||
| Construction & Engineering: 2.78% | ||||||||||||
Chicago Bridge & Iron Company NV # | 34,400 | 1,305,824 | ||||||||||
Primoris Services Corporation | 20,100 | 241,200 | ||||||||||
| 1,547,024 | ||||||||||||
|
| |||||||||||
| Electrical Equipment: 0.74% | ||||||||||||
GrafTech International Limited † | 32,200 | 310,730 | ||||||||||
Polypore International Incorporated †# | 2,500 | 100,975 | ||||||||||
| 411,705 | ||||||||||||
|
| |||||||||||
| Professional Services: 0.34% | ||||||||||||
Hill International Incorporated † | 42,900 | 137,280 | ||||||||||
Verisk Analytics Incorporated Class A † | 1,000 | 49,260 | ||||||||||
| 186,540 | ||||||||||||
|
| |||||||||||
| Road & Rail: 0.16% | ||||||||||||
Covenant Transport Incorporated Class A † | 23,700 | 88,164 | ||||||||||
|
| |||||||||||
| Trading Companies & Distributors: 0.21% | ||||||||||||
Applied Industrial Technologies Incorporated # | 3,200 | 117,920 | ||||||||||
|
| |||||||||||
Information Technology: 7.86% | ||||||||||||
| Communications Equipment: 0.98% | ||||||||||||
Brocade Communications Systems Incorporated † | 59,700 | 294,321 | ||||||||||
Harmonic Incorporated † | 49,500 | 210,870 | ||||||||||
MRV Communications Incorporated | 56,200 | 36,867 | ||||||||||
| 542,058 | ||||||||||||
|
| |||||||||||
| Computers & Peripherals: 2.30% | ||||||||||||
Cray Incorporated † | 55,840 | 674,547 | ||||||||||
Intermec Incorporated † | 57,500 | 356,500 | ||||||||||
Quantum Corporation † | 122,900 | 249,487 | ||||||||||
| 1,280,534 | ||||||||||||
|
| |||||||||||
The accompanying notes are an integral part of these financial statements.
Table of Contents
| Portfolio of Investments—June 30, 2012 (Unaudited) | Wells Fargo Advantage VT Small Cap Value Fund | 11 |
| Security Name | Shares | Value | ||||||||||
| Electronic Equipment, Instruments & Components: 3.94% | ||||||||||||
Checkpoint Systems Incorporated † | 18,200 | $ | 158,522 | |||||||||
Cognex Corporation | 11,200 | 354,480 | ||||||||||
Coherent Incorporated † | 14,300 | 619,190 | ||||||||||
OSI Systems Incorporated † | 11,860 | 751,213 | ||||||||||
Power One Incorporated † | 67,500 | 305,100 | ||||||||||
| 2,188,505 | ||||||||||||
|
| |||||||||||
| Internet Software & Services: 0.41% | ||||||||||||
Monster Worldwide Incorporated † | 27,000 | 229,500 | ||||||||||
|
| |||||||||||
| Office Electronics: 0.23% | ||||||||||||
Zebra Technologies Corporation † | 3,700 | 127,132 | ||||||||||
|
| |||||||||||
Materials: 16.59% | ||||||||||||
| Chemicals: 0.48% | ||||||||||||
Calgon Carbon Corporation † | 18,600 | 264,492 | ||||||||||
|
| |||||||||||
| Containers & Packaging: 0.92% | ||||||||||||
Intertape Polymer Group Incorporated † | 67,000 | 512,550 | ||||||||||
|
| |||||||||||
| Metals & Mining: 14.76% | ||||||||||||
Agnico-Eagle Mines Limited | 23,100 | 934,626 | ||||||||||
Carpenter Technology Corporation # | 13,900 | 664,976 | ||||||||||
Eldorado Gold Corporation | 23,400 | 288,288 | ||||||||||
Great Basin Gold Limited † | 113,800 | 72,832 | ||||||||||
Harry Winston Diamond Corporation † | 8,300 | 94,288 | ||||||||||
Petaquilla Minerals Limited † | 23,600 | 9,322 | ||||||||||
Randgold Resources Limited ADR # | 43,700 | 3,933,437 | ||||||||||
Royal Gold Incorporated # | 11,400 | 893,760 | ||||||||||
Sandstorm Gold Limited † | 42,048 | 342,794 | ||||||||||
Silver Standard Resources Incorporated † | 28,900 | 324,836 | ||||||||||
Steel Dynamics Incorporated | 37,600 | 441,800 | ||||||||||
United States Steel Corporation # | 9,700 | 199,820 | ||||||||||
| 8,200,779 | ||||||||||||
|
| |||||||||||
| Paper & Forest Products: 0.43% | ||||||||||||
Wausau Paper Corporation | 24,700 | 240,331 | ||||||||||
|
| |||||||||||
Telecommunication Services: 1.08% | ||||||||||||
| Diversified Telecommunication Services: 1.08% | ||||||||||||
Cincinnati Bell Incorporated † | 162,000 | 602,640 | ||||||||||
|
| |||||||||||
Total Common Stocks (Cost $48,910,596) | 52,732,058 | |||||||||||
|
| |||||||||||
Investment Companies: 1.11% | ||||||||||||
KBW Regional Banking ETF | 3,600 | 98,568 | ||||||||||
Market Vectors Gold Miners ETF | 11,525 | 515,974 | ||||||||||
Total Investment Companies (Cost $655,778) | 614,542 | |||||||||||
|
| |||||||||||
The accompanying notes are an integral part of these financial statements.
Table of Contents
| 12 | Wells Fargo Advantage VT Small Cap Value Fund | Portfolio of Investments—June 30, 2012 (Unaudited) |
| Security Name | Yield | Shares | Value | |||||||||||
Short-Term Investments: 3.71% | ||||||||||||||
| Investment Companies: 3.71% | ||||||||||||||
Wells Fargo Advantage Cash Investment Money Market Fund, Select Class (l)(u) | 0.15 | % | 2,060,677 | $ | 2,060,677 | |||||||||
|
| |||||||||||||
Total Short-Term Investments (Cost $2,060,677) | 2,060,677 | |||||||||||||
|
| |||||||||||||
| Total Investments in Securities | ||||||||
| (Cost $51,627,051) * | 99.72 | % | 55,407,277 | |||||
Other Assets and Liabilities, Net | 0.28 | 155,217 | ||||||
|
|
|
| |||||
| Total Net Assets | 100.00 | % | $ | 55,562,494 | ||||
|
|
|
|
| † | Non-income earning security |
| # | All or a portion of this security is segregated as collateral for investments in derivative instruments. |
| 144A | Security that may be resold to “qualified institutional buyers” under Rule 144A or security offered pursuant to Section 4(2) of the Securities Act of 1933, as amended. |
| (a) | Security is fair valued by the Management Valuation Team, and in certain instances by the Board of Trustees, in accordance with procedures approved by the Board of Trustees. |
| (l) | Investment in an affiliate |
| (u) | Rate shown is the 7-day annualized yield at period end. |
| (i) | Illiquid security |
| * | Cost for federal income tax purposes is $51,938,570 and net unrealized appreciation (depreciation) consists of: |
Gross unrealized appreciation | $ | 9,323,445 | ||
Gross unrealized depreciation | (5,854,738 | ) | ||
|
| |||
Net unrealized appreciation | $ | 3,468,707 |
The accompanying notes are an integral part of these financial statements.
Table of Contents
| Statement of Assets and Liabilities—June 30, 2012 (Unaudited) | Wells Fargo Advantage VT Small Cap Value Fund | 13 |
Assets | ||||
Investments | ||||
In unaffiliated securities, at value (see cost below) | $ | 53,346,600 | ||
In affiliated securities, at value (see cost below) | 2,060,677 | |||
|
| |||
Total investments, at value (see cost below) | 55,407,277 | |||
Receivable for investments sold | 214,872 | |||
Receivable for Fund shares sold | 6,860 | |||
Receivable for dividends | 144,901 | |||
Prepaid expenses and other assets | 915 | |||
|
| |||
Total assets | 55,774,825 | |||
|
| |||
Liabilities | ||||
Payable for investments purchased | 87,789 | |||
Payable for Fund shares redeemed | 28,234 | |||
Written options, at value | 24,002 | |||
Advisory fee payable | 25,534 | |||
Distribution fees payable | 3,370 | |||
Due to other related parties | 6,049 | |||
Shareholder report expenses payable | 12,569 | |||
Professional fees payable | 19,301 | |||
Accrued expenses and other liabilities | 5,483 | |||
|
| |||
Total liabilities | 212,331 | |||
|
| |||
Total net assets | $ | 55,562,494 | ||
|
| |||
NET ASSETS CONSIST OF | ||||
Paid-in capital | $ | 66,461,039 | ||
Undistributed net investment income | 763,329 | |||
Accumulated net realized losses on investments | (15,439,711 | ) | ||
Net unrealized gains on investments | 3,777,837 | |||
|
| |||
Total net assets | $ | 55,562,494 | ||
|
| |||
COMPUTATION OF NET ASSET VALUE AND OFFERING PRICE PER SHARE1 | ||||
Net assets – Class 1 | $ | 40,667,128 | ||
Shares outstanding – Class 1 | 4,594,276 | |||
Net asset value per share – Class 1 | $8.85 | |||
Net assets – Class 2 | $ | 14,895,366 | ||
Shares outstanding – Class 2 | 1,687,281 | |||
Net asset value per share – Class 2 | $8.83 | |||
Investments in unaffiliated securities, at cost | $ | 49,566,374 | ||
|
| |||
Investments in affiliated securities, at cost | $ | 2,060,677 | ||
|
| |||
Total investments, at cost | $ | 51,627,051 | ||
|
| |||
Premiums received on written options | $ | 21,597 | ||
|
| |||
| 1. | The Fund has an unlimited number of authorized shares. |
The accompanying notes are an integral part of these financial statements.
Table of Contents
| 14 | Wells Fargo Advantage VT Small Cap Value Fund | Statement of Operations—Six Months Ended June 30, 2012 (Unaudited) |
Investment income | ||||
Dividends* | $ | 490,850 | ||
Income from affiliated securities | 1,132 | |||
|
| |||
Total investment income | 491,982 | |||
|
| |||
Expenses | ||||
Advisory fee | 217,275 | |||
Administration fees | ||||
Fund level | 14,485 | |||
Class 1 | 16,902 | |||
Class 2 | 6,274 | |||
Distribution fees | ||||
Class 2 | 19,605 | |||
Custody and accounting fees | 6,576 | |||
Professional fees | 19,649 | |||
Shareholder report expenses | 16,533 | |||
Trustees’ fees and expenses | 6,608 | |||
Other fees and expenses | 1,849 | |||
|
| |||
Total expenses | 325,756 | |||
Less: Fee waivers and/or expense reimbursements | (48,319 | ) | ||
|
| |||
Net expenses | 277,437 | |||
|
| |||
Net investment income | 214,545 | |||
|
| |||
REALIZED AND UNREALIZED GAINS (LOSSES) ON INVESTMENTS | ||||
Net realized gains (losses) on: | ||||
Unaffiliated securities | 2,325,190 | |||
Written options | 7,976 | |||
|
| |||
Net realized gains on investments | 2,333,166 | |||
|
| |||
Net change in unrealized gains (losses) on: | ||||
Unaffiliated securities | 1,028,111 | |||
Written options | (2,405 | ) | ||
|
| |||
Net change in unrealized gains (losses) on investments | 1,025,706 | |||
|
| |||
Net realized and unrealized gains (losses) on investments | 3,358,872 | |||
|
| |||
Net increase in net assets resulting from operations | $ | 3,573,417 | ||
|
| |||
* Net of foreign dividend withholding taxes of | $5,545 | |||
The accompanying notes are an integral part of these financial statements.
Table of Contents
| Statements of Changes in Net Assets | Wells Fargo Advantage VT Small Cap Value Fund | 15 |
| Six Months Ended June 30, 2012 (Unaudited) | Year Ended December 31, 2011 | |||||||||||||||
Operations | ||||||||||||||||
Net investment income | $ | 214,545 | $ | 674,545 | ||||||||||||
Net realized gains on investments | 2,333,166 | 4,495,887 | ||||||||||||||
Net change in unrealized gains (losses) on investments | 1,025,706 | (10,006,816 | ) | |||||||||||||
|
|
|
|
|
|
|
| |||||||||
Net increase (decrease) in net assets resulting from operations | 3,573,417 | (4,836,384 | ) | |||||||||||||
|
|
|
|
|
|
|
| |||||||||
Distributions to shareholders from | ||||||||||||||||
Net investment income | ||||||||||||||||
Class 1 | 0 | (440,656 | ) | |||||||||||||
Class 2 | 0 | (112,333 | ) | |||||||||||||
|
|
|
|
|
|
|
| |||||||||
Total distributions to shareholders | 0 | (552,989 | ) | |||||||||||||
|
|
|
|
|
|
|
| |||||||||
Capital share transactions | Shares | Shares | ||||||||||||||
Proceeds from shares sold | ||||||||||||||||
Class 1 | 75,352 | 655,831 | 177,977 | 1,478,858 | ||||||||||||
Class 2 | 204,835 | 1,777,441 | 100,076 | 880,176 | ||||||||||||
|
|
|
|
|
|
|
| |||||||||
| 2,433,272 | 2,359,034 | |||||||||||||||
|
|
|
|
|
|
|
| |||||||||
Reinvestment of distributions | ||||||||||||||||
Class 1 | 0 | 0 | 49,071 | 440,656 | ||||||||||||
Class 2 | 0 | 0 | 12,509 | 112,333 | ||||||||||||
|
|
|
|
|
|
|
| |||||||||
| 0 | 552,989 | |||||||||||||||
|
|
|
|
|
|
|
| |||||||||
Payment for shares redeemed | ||||||||||||||||
Class 1 | (660,529 | ) | (5,819,333 | ) | (1,488,987 | ) | (13,002,318 | ) | ||||||||
Class 2 | (282,255 | ) | (2,461,007 | ) | (518,177 | ) | (4,544,639 | ) | ||||||||
|
|
|
|
|
|
|
| |||||||||
| (8,280,340 | ) | (17,546,957 | ) | |||||||||||||
|
|
|
|
|
|
|
| |||||||||
Net decrease in net assets resulting from capital share transactions | (5,847,068 | ) | (14,634,934 | ) | ||||||||||||
|
|
|
|
|
|
|
| |||||||||
Total decrease in net assets | (2,273,651 | ) | (20,024,307 | ) | ||||||||||||
|
|
|
|
|
|
|
| |||||||||
Net assets | ||||||||||||||||
Beginning of period | 57,836,145 | 77,860,452 | ||||||||||||||
|
|
|
|
|
|
|
| |||||||||
End of period | $ | 55,562,494 | $ | 57,836,145 | ||||||||||||
|
|
|
|
|
|
|
| |||||||||
Undistributed net investment income | $ | 763,329 | $ | 548,784 | ||||||||||||
|
|
|
|
|
|
|
| |||||||||
The accompanying notes are an integral part of these financial statements.
Table of Contents
| 16 | Wells Fargo Advantage VT Small Cap Value Fund | Financial Highlights |
(For a share outstanding throughout each period)
| Six Months Ended June 30, 2012 (Unaudited) | Year Ended December 31, | |||||||||||
| Class 1 | 2011 | 20101 | ||||||||||
Net asset value, beginning of period | $ | 8.33 | $ | 9.04 | $ | 7.36 | ||||||
Net investment income | 0.05 | 0.11 | 0.05 | 2 | ||||||||
Net realized and unrealized gains (losses) on investments | 0.47 | (0.74 | ) | 1.63 | ||||||||
|
|
|
|
|
| |||||||
Total from investment operations | 0.52 | (0.63 | ) | 1.68 | ||||||||
Distributions to shareholders from | ||||||||||||
Net investment income | 0.00 | (0.08 | ) | 0.00 | ||||||||
Net asset value, end of period | $ | 8.85 | $ | 8.33 | $ | 9.04 | ||||||
Total return3 | 6.24 | % | (7.06 | )% | 22.83 | % | ||||||
Ratios to average net assets (annualized) | ||||||||||||
Gross expenses | 1.06 | % | 1.14 | % | 0.96 | % | ||||||
Net expenses | 0.89 | % | 0.89 | % | 0.89 | % | ||||||
Net investment income | 0.81 | % | 1.07 | % | 1.43 | % | ||||||
Supplemental data | ||||||||||||
Portfolio turnover rate | 7 | % | 16 | % | 61 | % | ||||||
Net assets, end of period (000’s omitted) | $40,667 | $43,155 | $58,255 | |||||||||
| 1. | For the period from July 16, 2010 (commencement of class operations) to December 31, 2010. |
| 2. | Calculated based upon average shares outstanding |
| 3. | Returns for periods of less than one year are not annualized. |
The accompanying notes are an integral part of these financial statements.
Table of Contents
| Financial Highlights | Wells Fargo Advantage VT Small Cap Value Fund | 17 |
(For a share outstanding throughout each period)
Six Months Ended (Unaudited) | Year Ended December 31, | |||||||||||||||||||||||
| Class 21 | 2011 | 2010 | 2009 | 2008 | 2007 | |||||||||||||||||||
Net asset value, beginning of period | $ | 8.32 | $ | 9.03 | $ | 7.83 | $ | 4.95 | $ | 11.08 | $ | 13.22 | ||||||||||||
Net investment income (loss) | 0.03 | 0.09 | 0.12 | 0.08 | 0.09 | 2 | (0.04 | ) | ||||||||||||||||
Net realized and unrealized gains (losses) on investments | 0.48 | (0.74 | ) | 1.20 | 2.87 | (4.21 | ) | 0.21 | ||||||||||||||||
|
|
|
|
|
|
|
|
|
|
|
| |||||||||||||
Total from investment operations | 0.51 | (0.65 | ) | 1.32 | 2.95 | (4.12 | ) | 0.17 | ||||||||||||||||
Distributions to shareholders from | ||||||||||||||||||||||||
Net investment income | 0.00 | (0.06 | ) | (0.12 | ) | (0.07 | ) | 0.00 | 0.00 | |||||||||||||||
Net realized gains | 0.00 | 0.00 | 0.00 | 0.00 | (2.01 | ) | (2.31 | ) | ||||||||||||||||
|
|
|
|
|
|
|
|
|
|
|
| |||||||||||||
Total distributions to shareholders | 0.00 | (0.06 | ) | (0.12 | ) | (0.07 | ) | (2.01 | ) | (2.31 | ) | |||||||||||||
Net asset value, end of period | $ | 8.83 | $ | 8.32 | $ | 9.03 | $ | 7.83 | $ | 4.95 | $ | 11.08 | ||||||||||||
Total return3 | 6.13 | % | (7.26 | )% | 17.25 | % | 60.18 | % | (44.55 | )% | (0.32 | )% | ||||||||||||
Ratios to average net assets (annualized) | ||||||||||||||||||||||||
Gross expenses | 1.31 | % | 1.39 | % | 1.52 | % | 2.56 | % | 1.69 | % | 1.51 | % | ||||||||||||
Net expenses | 1.14 | % | 1.14 | % | 1.14 | % | 1.14 | % | 1.14 | % | 1.14 | % | ||||||||||||
Net investment income (loss) | 0.56 | % | 0.82 | % | 1.06 | % | 1.39 | % | 1.18 | % | (0.31 | )% | ||||||||||||
Supplemental data | ||||||||||||||||||||||||
Portfolio turnover rate | 7 | % | 16 | % | 61 | % | 45 | % | 39 | % | 60 | % | ||||||||||||
Net assets, end of period (000’s omitted) | $14,895 | $14,681 | $19,606 | $12,018 | $7,928 | $17,527 | ||||||||||||||||||
| 1. | After the close of business on July 16, 2010, existing shares of the Fund were renamed Class 2 shares. |
| 2. | Calculated based upon average shares outstanding |
| 3. | Returns for periods of less than one year are not annualized. |
The accompanying notes are an integral part of these financial statements.
Table of Contents
| 18 | Wells Fargo Advantage VT Small Cap Value Fund | Notes to Financial Statements (Unaudited) |
1. ORGANIZATION
Wells Fargo Variable Trust (the “Trust”), a Delaware statutory trust organized on March 10, 1999, is an open-end management investment company registered under the Investment Company Act of 1940, as amended (the “1940 Act”). These financial statements report on Wells Fargo Advantage VT Small Cap Value Fund (the “Fund”) which is a diversified series of the Trust.
2. SIGNIFICANT ACCOUNTING POLICIES
The following significant accounting policies, which are consistently followed in the preparation of the financial statements of the Fund, are in conformity with U.S. generally accepted accounting principles which require management to make estimates and assumptions that affect the reported amounts of assets and liabilities, disclosure of contingent assets and liabilities at the date of the financial statements, and the reported amounts of revenues and expenses during the reporting period. Actual results could differ from those estimates.
Securities valuation
Investments in equity securities are valued each business day as of the close of regular trading on the New York Stock Exchange, which is usually 4:00 p.m. (Eastern Time). Securities which are traded on a national or foreign securities exchange are valued at the last reported sales price, except that securities listed on The Nasdaq Stock Market, Inc. (“Nasdaq”) are valued at the Nasdaq Official Closing Price (“NOCP”), and if no NOCP is available, then at the last reported sales price. If no sales price is shown on the Nasdaq, the bid price will be used. In the absence of any sale of securities listed on the Nasdaq, and in the case of other securities (including U.S. Government obligations, but excluding debt securities maturing in 60 days or less), the price will be deemed “stale” and the valuations will be determined in accordance with the Fund’s Valuation Procedures.
Securities denominated in foreign currencies are translated into U.S. dollars using the closing rates of exchange in effect on the day of valuation.
Many securities markets and exchanges outside the U.S. close prior to the close of the New York Stock Exchange and therefore may not fully reflect trading or events that occur after the close of the principal exchange in which the foreign securities are traded, but before the close of the New York Stock Exchange. If such trading or events are expected to materially affect the value of securities, then fair value pricing procedures approved by the Board of Trustees are applied. These procedures take into account multiple factors including movements in U.S. securities markets after foreign exchanges close. As a result of the fair value pricing procedures, these securities which are normally categorized as Level 1 in the fair value hierarchy will represent a transfer from a Level 1 to a Level 2 security and will be categorized as Level 2. Depending on market activity, such fair valuations may be frequent. Such fair value pricing may result in NAVs that are higher or lower than NAVs based on the closing price or latest quoted bid price. On June 30, 2012, fair value pricing was not used in pricing foreign securities.
Investments in open-end mutual funds and non-registered investment companies are fair valued at net asset value.
Investments which are not valued using any of the methods discussed above, are valued at their fair value, as determined by procedures established in good faith and approved by the Board of Trustees. The Board of Trustees has established a Valuation Committee comprised of the Trustees and has delegated to it the authority to take any actions regarding the valuation of portfolio securities that the Valuation Committee deems necessary in determining the fair value of portfolio securities, unless the responsibility has been delegated to the Management Valuation Team of Wells Fargo Funds Management, LLC (“Funds Management”). The Board of Trustees retains the authority to make or ratify any valuation decisions or approve any changes to the Valuation Procedures as it deems appropriate. On a quarterly basis, the Board of Trustees considers for ratification any valuation actions taken by the Valuation Committee or the Management Valuation Team.
Valuations of fair valued securities are compared to the next actual sales price when available, or other appropriate market information to assess the continued appropriateness of the fair valuation methodology used. These securities are fair valued on a day-to-day basis, taking into consideration changes to appropriate market information and any significant changes to the input factors considered in the valuation process until there is a readily available price provided on the exchange or by an independent pricing service. Valuations received from an independent pricing service or broker quotes are periodically validated by comparisons to most recent trades and valuations provided by other independent pricing services in addition to the review of prices by the adviser and/or sub-adviser. Unobservable inputs
Table of Contents
| Notes to Financial Statements (Unaudited) | Wells Fargo Advantage VT Small Cap Value Fund | 19 |
used in determining fair valuations are identified based on the type of security, taking into consideration factors utilized by market participants in valuing the investment, knowledge about the issuer and the current market environment.
Foreign currency translation
The accounting records of the Fund are maintained in U.S. dollars. Assets, including investment securities, and liabilities denominated in foreign currency are translated into U.S. dollars at the prevailing rates of exchange at the date of valuation. Purchases and sales of securities, and income and expenses are translated at the prevailing rate of exchange on the respective dates of such transactions. Reported net realized foreign exchange gains or losses arise from sales of foreign currencies, currency gains or losses realized between the trade and settlement dates on securities transactions, and the difference between the amounts of dividends, interest and foreign withholding taxes recorded and the U.S. dollar equivalent of the amounts actually paid or received. Net unrealized foreign exchange gains and losses arise from changes in the fair value of assets and liabilities other than investments in securities resulting in changes in exchange rates.
The changes in net assets arising from changes in exchange rates and the changes in net assets resulting from changes in market prices of securities are not separately presented. Such changes are recorded with net realized and unrealized gains or losses from investments. Gains and losses from certain foreign currency transactions are treated as ordinary income for U.S. federal income tax purposes.
Options
The Fund may be subject to equity price risk in the normal course of pursuing its investment objectives. The Fund may write covered call options or secured put options on individual securities. When the Fund writes an option, an amount equal to the premium received is recorded as a liability and is subsequently adjusted to the current market value of the written option. Premiums received from written options that expire unexercised are recognized as realized gains from investments on the expiration date. The difference between the premium received and the amount paid on effecting a closing purchase transaction, including brokerage commissions, is treated as a realized gain or loss. If a call option is exercised, the premium is added to the proceeds from the sale of the underlying security in calculating the realized gain or loss on the sale. If a put option is exercised, the premium reduces the cost of the security purchased. The Fund, as a writer of an option, bears the market risk of an unfavorable change in the price of the security underlying the written option.
The Fund may also purchase call or put options. The premium is included in the Statement of Assets and Liabilities as an investment, the value of which is subsequently adjusted based on the current market value of the option. Premiums paid for purchased options that expire are recognized as realized losses from investments on the expiration date. Premiums paid for purchased options that are exercised or closed are added to the amount paid or offset against the proceeds received for the underlying security to determine the realized gain or loss. The risk of loss associated with purchased options is limited to the premium paid.
Options traded on an exchange are regulated and terms of the options are standardized. Options traded over the counter expose the Fund to counterparty risk in the event the counterparty does not perform. This risk is mitigated by having a master netting arrangement between the Fund and the counterparty and by having the counterparty post collateral to cover the Fund’s exposure to the counterparty.
Distributions to shareholders
Distributions to shareholders from net investment income and net realized gains, if any, are recorded on the ex-dividend date. Such distributions are determined in conformity with income tax regulations, which may differ from generally accepted accounting principles.
Security transactions and income recognition
Securities transactions are recorded on a trade date basis. Realized gains or losses are reported on the basis of identified cost of securities delivered.
Dividend income is recognized on the ex-dividend date, except for certain dividends from foreign securities, which are recorded as soon as the Fund is informed of the ex-dividend date. Dividend income from foreign securities is recorded net of foreign taxes withheld where recovery of such taxes is not assured.
Table of Contents
| 20 | Wells Fargo Advantage VT Small Cap Value Fund | Notes to Financial Statements (Unaudited) |
Federal and other taxes
The Fund intends to continue to qualify as a regulated investment company by distributing substantially all of its investment company taxable income and any net realized capital gains (after reduction for capital loss carryforwards) sufficient to relieve it from all, or substantially all, federal income taxes. Accordingly, no provision for federal income taxes was required.
The Fund’s income and federal excise tax returns and all financial records supporting those returns for the prior three fiscal years are subject to examination by the federal and Delaware revenue authorities. Management has analyzed the Fund’s tax positions taken on federal, state, and foreign tax returns for all open tax years and does not believe that there are any uncertain tax positions that require recognition of a tax liability.
Under the recently enacted Regulated Investment Company Modernization Act of 2010, the Fund is permitted to carry forward capital losses incurred in taxable years which began after December 22, 2010 for an unlimited period. However, any losses incurred are required to be utilized prior to the losses incurred in pre-enactment taxable years. As a result of this ordering rule, pre-enactment capital loss carryforwards may be more likely to expire unused. Post-enactment capital losses that are carried forward will retain their character as either short-term or long-term capital losses rather than be considered all short-term as under previous law. In addition, the Fund may elect to defer any portion of a post-October capital loss or qualified late-year ordinary loss to the first day of the following taxable year. A post-October capital loss is the greatest of the net capital loss, net short-term capital loss or net long-term capital loss for the portion of the taxable year after October 31. A qualified late-year ordinary loss is the net loss comprised of (a) net gain or loss from the sale or other disposition of certain capital assets for the portion of the taxable year after October 31, and (b) other ordinary income or loss for the portion of the taxable year after December 31.
As of December 31, 2011, the Fund had net capital loss carryforwards, which were available to offset future net realized capital gains, in the amount of $17,402,202 with $4,116,200 expiring in 2016 and $13,286,002 expiring in 2017.
Class allocations
The separate classes of shares offered by the Fund differ principally in distribution fees. Shareholders of each class bear certain expenses that pertain to that particular class. All shareholders bear the common expenses of the Fund, earn income from the portfolio, and are allocated unrealized gains and losses pro rata based on the average daily net assets of each class, without distinction between share classes. Dividends are determined separately for each class based on income and expenses allocable to each class. Realized gains and losses are allocated to each class pro rata based upon the net assets of each class on the date realized. Differences in per share dividend rates generally result from the relative weightings of pro rata income and realized gain allocations and from differences in separate class expenses, including distribution fees.
3. FAIR VALUATION MEASUREMENTS
Fair value measurements of investments are determined within a framework that has established a fair value hierarchy based upon the various data inputs utilized in determining the value of the Fund’s investments. The three-level hierarchy gives the highest priority to unadjusted quoted prices in active markets for identical assets or liabilities (Level 1) and the lowest priority to significant unobservable inputs (Level 3). The Fund’s investments are classified within the fair value hierarchy based on the lowest level of input that is significant to the fair value measurement. The inputs are summarized into three broad levels as follows:
| n | Level 1 – quoted prices in active markets for identical securities |
| n | Level 2 – other significant observable inputs (including quoted prices for similar securities, interest rates, prepayment speeds, credit risk, etc.) |
| n | Level 3 – significant unobservable inputs (including the Fund’s own assumptions in determining the fair value of investments) |
The inputs or methodologies used for valuing securities are not necessarily an indication of the risk associated with investing in those securities.
Table of Contents
| Notes to Financial Statements (Unaudited) | Wells Fargo Advantage VT Small Cap Value Fund | 21 |
As of June 30, 2012, the inputs used in valuing the Fund’s assets, which are carried at fair value, were as follows:
| Investments in Securities | Quoted Prices (Level 1) | Significant��Other (Level 2) | Significant Unobservable Inputs (Level 3) | Total | ||||||||||||
Equity securities | ||||||||||||||||
Common stocks | $ | 52,269,420 | $ | 236,338 | $ | 226,300 | $ | 52,732,058 | ||||||||
Investment companies | 614,542 | 0 | 0 | 614,542 | ||||||||||||
Short-term investments | ||||||||||||||||
Investment companies | 2,060,677 | 0 | 0 | 2,060,677 | ||||||||||||
| $ | 54,944,639 | $ | 236,338 | $ | 226,300 | $ | 55,407,277 | |||||||||
Further details on the major security types listed above can be found in the Portfolio of Investments.
As of June 30, 2012, the inputs used in valuing the Fund’s other financial instruments, which are carried at fair value, were as follows:
| Other financial instruments | Quoted Prices (Level 1) | Significant Other (Level 2) | Significant Unobservable Inputs (Level 3) | Total | ||||||||||||
Written options | $ | 0 | $ | (24,002 | ) | $ | 0 | $ | (24,002 | ) | ||||||
Transfers in and transfers out are recognized at the end of the reporting period. For the six months ended June 30, 2012, the Fund did not have any transfers into/out of Level 1 and Level 2.
4. TRANSACTIONS WITH AFFILIATES AND OTHER EXPENSES
Advisory fee
The Trust has entered into an advisory contract with Funds Management, an indirect wholly owned subsidiary of Wells Fargo & Company (“Wells Fargo”). The adviser is responsible for implementing investment policies and guidelines and for supervising the sub-adviser, who is responsible for day-to-day portfolio management of the Fund.
Pursuant to the contract, Funds Management is entitled to receive an annual advisory fee starting at 0.75% and declining to 0.60% as the average daily net assets of the Fund increase. For the six months ended June 30, 2012, the advisory fee was equivalent to an annual rate of 0.75% of the Fund’s average daily net assets.
Funds Management has retained the services of a sub-adviser to provide daily portfolio management to the Fund. The fee for sub-advisory services is borne by Funds Management. Wells Capital Management, Incorporated an affiliate of Funds Management, is the sub-adviser to the Fund and is entitled to receive a fee from Funds Management at an annual rate starting at 0.55% and declining to 0.40% as the average daily net assets of the Fund increase.
Administration and transfer agent fees
The Trust has entered into an administration agreement with Funds Management. Under this agreement, for providing administrative services, which includes paying fees and expenses for services provided by the transfer agent, sub-transfer agents, omnibus account servicers and record-keepers, Funds Management is entitled to receive from the Fund an annual fund level administration fee starting at 0.05% and declining to 0.03% as the average daily net assets of the Fund increase and a class level administration fee of 0.08% of the average daily net assets of each class.
Funds Management has contractually waived and/or reimbursed advisory and administration fees to the extent necessary to maintain certain net operating expense ratios for the Fund. Waiver of fees and/or reimbursement of expenses by Funds Management were made first from fund level expenses on a proportionate basis and then from class specific expenses. Funds Management has committed through July 18, 2013 to waive fees and/or reimburse expenses to the extent necessary to cap the Fund’s expenses at 0.89% for Class 1 and 1.14% for Class 2.
Distribution fees
The Trust has adopted a Distribution Plan for Class 2 shares of the Fund pursuant to Rule 12b-1 under the 1940 Act. Distribution fees are charged to Class 2 shares and paid to Wells Fargo Funds Distributor, LLC, the principal underwriter, at an annual rate of 0.25% of its average daily net assets.
Table of Contents
| 22 | Wells Fargo Advantage VT Small Cap Value Fund | Notes to Financial Statements (Unaudited) |
5. INVESTMENT PORTFOLIO TRANSACTIONS
Purchases and sales of investments, excluding U.S. Government obligations (if any) and short-term securities, for the six months ended June 30, 2012 were $4,056,471 and $10,510,563, respectively.
6. DERIVATIVE TRANSACTIONS
During the six months ended June 30, 2012, the Fund entered into written options for economic hedging purposes.
During the six months ended June 30, 2012, the Fund had written call option activities as follows:
| Number of Contracts | Premiums Received | |||||||
Options outstanding at December 31, 2011 | 0 | $ | 0 | |||||
Options written | 286 | 55,499 | ||||||
Options expired | (27 | ) | (3,402 | ) | ||||
Options terminated in closing purchase transactions | (130 | ) | (29,648 | ) | ||||
Options exercised | (3 | ) | (852 | ) | ||||
Options outstanding at June 30, 2012 | 126 | $ | 21,597 | |||||
The Fund had outstanding written options with total premiums received that averaged $7,862 during the six months ended June 30, 2012.
Open call options written at June 30, 2012 were as follow for the Fund:
| Expiration Date | Issuer Name | Number of Contracts | Strike Price | Value | ||||||||||||
| July 2012 | ABM Industries Incorporated | 2 | $ | 20.00 | $ | (10 | ) | |||||||||
| July 2012 | Alaska Air Group Incorporated | 6 | 37.50 | (210 | ) | |||||||||||
| July 2012 | Applied Industrial Technology | 1 | 35.00 | (115 | ) | |||||||||||
| July 2012 | Carpenter Technology | 6 | 50.00 | (300 | ) | |||||||||||
| July 2012 | Carpenter Technology | 9 | 45.00 | (2,610 | ) | |||||||||||
| July 2012 | Chicago Bridge & Iron Company NV | 6 | 37.00 | (1,110 | ) | |||||||||||
| July 2012 | InterOil Corporartion | 1 | 70.00 | (305 | ) | |||||||||||
| July 2012 | McMoran Exploration Company | 20 | 12.00 | (2,640 | ) | |||||||||||
| July 2012 | Oceaneering International Incorporated | 4 | 55.00 | (20 | ) | |||||||||||
| July 2012 | Oceaneering International Incorporated | 2 | 45.00 | (340 | ) | |||||||||||
| July 2012 | Polypore International Incorporated | 6 | 35.00 | (3,240 | ) | |||||||||||
| July 2012 | Polypore International Incorporated | 12 | 37.50 | (3,960 | ) | |||||||||||
| July 2012 | Polypore International Incorporated | 6 | 40.00 | (990 | ) | |||||||||||
| July 2012 | Range Resources Corporation | 2 | 60.00 | (680 | ) | |||||||||||
| July 2012 | Royal Gold Incorporated | 2 | 77.50 | (540 | ) | |||||||||||
| July 2012 | Royal Gold Incorporated | 3 | 75.00 | (1,260 | ) | |||||||||||
| July 2012 | Royal Gold Incorporated | 2 | 80.00 | (280 | ) | |||||||||||
| July 2012 | United States Steel Corporation | 4 | 20.00 | (500 | ) | |||||||||||
| August 2012 | Carpenter Technology | 1 | 45.00 | (410 | ) | |||||||||||
| August 2012 | McMoran Exploration Company | 20 | 13.00 | (2,280 | ) | |||||||||||
| August 2012 | �� | Randgold Resources Limited ADR | 1 | 100.00 | (170 | ) | ||||||||||
| September 2012 | Carpenter Technology | 2 | 50.00 | (420 | ) | |||||||||||
| September 2012 | InterOil Corporartion | 2 | 105.00 | (340 | ) | |||||||||||
Table of Contents
| Notes to Financial Statements (Unaudited) | Wells Fargo Advantage VT Small Cap Value Fund | 23 |
| Expiration Date | Issuer Name | Number of Contracts | Strike Price | Value | ||||||||||||
| September 2012 | InterOil Corporartion | 1 | $ | 95.00 | $ | (249 | ) | |||||||||
| September 2012 | InterOil Corporartion | 1 | 90.00 | (350 | ) | |||||||||||
| September 2012 | InterOil Corporartion | 1 | 100.00 | (200 | ) | |||||||||||
| September 2012 | InterOil Corporartion | 2 | 110.00 | (228 | ) | |||||||||||
| October 2012 | Oceaneering International Incorporated | 1 | 50.00 | (245 | ) | |||||||||||
The fair value, realized gains or losses and change in unrealized gains or losses, if any, on derivative instruments are reflected on the appropriate financial statements.
7. BANK BORROWINGS
The Trust and Wells Fargo Funds Trust (excluding the money market funds) are parties to a $150,000,000 revolving credit agreement with State Street Bank and Trust Company, whereby the Fund is permitted to use bank borrowings for temporary or emergency purposes, such as to fund shareholder redemption requests. Interest under the credit agreement is charged to the Fund based on a borrowing rate equal to the higher of the Federal Funds rate in effect on that day plus 1.25% or the overnight LIBOR rate in effect on that day plus 1.25%. In addition, an annual commitment fee equal to 0.10% of the unused balance is allocated to each participating fund. For the six months ended June 30, 2012, the Fund paid $70 in commitment fees.
For the six months ended June 30, 2012, there were no borrowings by the Fund under the agreement.
8. INDEMNIFICATION
Under the Trust’s organizational documents, the officers and directors are indemnified against certain liabilities that may arise out of performance of their duties to the Trust. Additionally, in the normal course of business, the Trust may enter into contracts with service providers that contain a variety of indemnification clauses. The Trust’s maximum exposure under these arrangements is dependent on future claims that may be made against the Fund and, therefore, cannot be estimated.
9. NEW ACCOUNTING PRONOUNCEMENT
In December 2011, the Financial Accounting Standards Board (“FASB”) issued Accounting Standard Update (“ASU”) No. 2011-11, Disclosures about Offsetting Assets and Liabilities. ASU 2011-11, which amends FASB ASC Topic 210, Balance Sheet, creates new disclosure requirements which require entities to disclose both gross and net information for derivatives and other financial instruments that are either offset in the Statement of Assets and Liabilities or subject to an enforceable master netting arrangement or similar agreement. The disclosure requirements are effective for interim and annual reporting periods beginning on or after January 1, 2013. Management is currently assessing the potential impact, in addition to expanded financial statement disclosure, that may result from adopting this ASU.
10. SUBSEQUENT DISTRIBUTIONS
On June 30, 2012, the Fund declared distributions from net investment income to shareholders of record on July 11, 2012. The per share amounts payable on July 13, 2012 were as follows:
| Net Investment Income | ||||
Class 1 | $ | 0.10468 | ||
Class 2 | 0.07759 | |||
These distributions are not reflected in the accompanying financial statements.
Table of Contents
| 24 | Wells Fargo Advantage VT Small Cap Value Fund | Other Information (Unaudited) |
PROXY VOTING INFORMATION
A description of the policies and procedures that the Fund uses to determine how to vote proxies relating to portfolio securities is available without charge, upon request, by calling 1-800-222-8222, visiting our Web site at wellsfargoadvantagefunds.com, or visiting the SEC Web site at sec.gov. Information regarding how the Fund voted proxies relating to portfolio securities during the most recent 12-month period ended June 30 is available without charge on the Fund’s Web site at wellsfargoadvantagefunds.com or by visiting the SEC Web site at sec.gov.
PORTFOLIO HOLDINGS INFORMATION
The complete portfolio holdings for the Fund are publicly available on the Fund’s Web site (wellsfargoadvantagefunds.com) on a monthly, 30-day or more delayed basis. In addition, top ten holdings information for the Fund is publicly available on the Fund’s Web site on a monthly, seven-day or more delayed basis. The Fund files its complete schedule of portfolio holdings with the SEC for the first and third quarters of each fiscal year on Form N-Q, which is available without charge by visiting the SEC Web site at sec.gov. In addition, the Fund’s Form N-Q may be reviewed and copied at the SEC’s Public Reference Room in Washington, DC, and at regional offices in New York City, at 233 Broadway, and in Chicago, at 175 West Jackson Boulevard, Suite 900. Information about the Public Reference Room may be obtained by calling 1-800-SEC-0330.
Table of Contents
| Other Information (Unaudited) | Wells Fargo Advantage VT Small Cap Value Fund | 25 |
BOARD OF TRUSTEES AND OFFICERS
Each of the Trustees and Officers listed in the table below acts in identical capacities for the Wells Fargo Advantage family of funds, which consists of 138 funds comprising the Wells Fargo Funds Trust, Wells Fargo Variable Trust, Wells Fargo Master Trust and four closed-end funds (collectively the “Fund Complex”). This table should be read in conjunction with the Prospectus and the Statement of Additional Information1. All of the Trustees are also Members of the Audit and Governance Committees of each Trust in the Fund Complex. The mailing address of each Trustee and Officer is 525 Market Street, 12th Floor, San Francisco, CA 94105. Each Trustee and Officer serves an indefinite term, however, each Trustee serves such term until reaching the mandatory retirement age established by the Trustees.
Independent Trustees
Name and Year of Birth | Position Held and Length of Service* | Principal Occupations During Past Five Years | Other Directorships During | |||
| Peter G. Gordon (Born 1942) | Trustee, since 1998; Chairman, since 2005 (Lead Trustee since 2001) | Co-Founder, Retired Chairman, President and CEO of Crystal Geyser Water Company. Trustee Emeritus, Colby College | Asset Allocation Trust | |||
| Isaiah Harris, Jr. (Born 1952) | Trustee, since 2009 | Retired. Prior thereto, President and CEO of BellSouth Advertising and Publishing Corp. from 2005 to 2007, President and CEO of BellSouth Enterprises from 2004 to 2005 and President of BellSouth Consumer Services from 2000 to 2003. Emeritus member of the Iowa State University Foundation Board of Governors. Emeritus Member of the Advisory Board of Iowa State University School of Business. Mr. Harris is a certified public accountant. | CIGNA Corporation; Deluxe Corporation; Asset Allocation Trust | |||
| Judith M. Johnson (Born 1949) | Trustee, since 2008 | Retired. Prior thereto, Chief Executive Officer and Chief Investment Officer of Minneapolis Employees Retirement Fund from 1996 to 2008. Ms. Johnson is an attorney, certified public accountant and a certified managerial accountant. | Asset Allocation Trust | |||
| Leroy Keith, Jr. (Born 1939) | Trustee, since 2010 | Chairman, Bloc Global Services (development and construction). Trustee of the Evergreen Funds from 1983 to 2010. Former Managing Director, Almanac Capital Management (commodities firm), former Partner, Stonington Partners, Inc. (private equity fund), former Director, Obagi Medical Products Co. and former Director, Lincoln Educational Services. | Trustee, Virtus Fund Complex (consisting of 40 portfolios as of 12/31/11); Asset Allocation Trust | |||
| David F. Larcker (Born 1950) | Trustee, since 2009 | James Irvin Miller Professor of Accounting at the Graduate School of Business, Stanford University, Director of Corporate Governance Research Program and Senior Faculty of The Rock Center for Corporate Governance since 2006. From 2005 to 2008, Professor of Accounting at the Graduate School of Business, Stanford University. Prior thereto, Ernst & Young Professor of Accounting at The Wharton School, University of Pennsylvania from 1985 to 2005. | Asset Allocation Trust | |||
| Olivia S. Mitchell (Born 1953) | Trustee, since 2006 | International Foundation of Employee Benefit Plans Professor, Wharton School of the University of Pennsylvania since 1993. Director of Wharton’s Pension Research Council and Boettner Center on Pensions & Retirement Research, and Research Associate at the National Bureau of Economic Research. Previously, Cornell University Professor from 1978 to 1993. | Asset Allocation Trust | |||
| Timothy J. Penny (Born 1951) | Trustee, since 1996 | President and CEO of Southern Minnesota Initiative Foundation, a non-profit organization, since 2007 and Senior Fellow at the Humphrey Institute Policy Forum at the University of Minnesota since 1995. Member of the Board of Trustees of NorthStar Education Finance, Inc., a non-profit organization, since 2007. | Asset Allocation Trust |
Table of Contents
| 26 | Wells Fargo Advantage VT Small Cap Value Fund | Other Information (Unaudited) |
Name and Year of Birth | Position Held and Length of Service* | Principal Occupations During Past Five Years | Other Directorships During | |||
| Michael S. Scofield (Born 1943) | Trustee, since 2010 | Served on the Investment Company Institute’s Board of Governors and Executive Committee from 2008-2011 as well the Governing Council of the Independent Directors Council from 2006-2011 and the Independent Directors Council Executive Committee from 2008-2011. Chairman of the IDC from 2008-2010. Institutional Investor (Fund Directions) Trustee of Year in 2007. Trustee of the Evergreen Funds (and its predecessors) from 1984 to 2010. Chairman of the Evergreen Funds from 2000-2010. Former Trustee of the Mentor Funds. Retired Attorney, Law Offices of Michael S. Scofield and former Director and Chairman, Branded Media Corporation (multi-media branding company). | Asset Allocation Trust | |||
| Donald C. Willeke (Born 1940) | Trustee, since 1996 | Principal of the law firm of Willeke & Daniels. General Counsel of the Minneapolis Employees Retirement Fund from 1984 until its consolidation into the Minnesota Public Employees Retirement Association on June 30, 2010. Director and Vice Chair of The Free Trust (non-profit corporation). Director of the American Chestnut Foundation (non-profit corporation). | Asset Allocation Trust |
| * | Length of service dates reflect the Trustee’s commencement of service with the Trust’s predecessor entities, where applicable. |
Officers
Name and Year of Birth | Position Held and Length of Service | Principal Occupations During Past Five Years | ||||
| Karla M. Rabusch (Born 1959) | President, since 2003 | Executive Vice President of Wells Fargo Bank, N.A. and President of Wells Fargo Funds Management, LLC since 2003. Senior Vice President and Chief Administrative Officer of Wells Fargo Funds Management, LLC from 2001 to 2003. | ||||
| C. David Messman (Born 1960) | Secretary, since 2000; Chief Legal Officer, since 2003 | Senior Vice President and Secretary of Wells Fargo Funds Management, LLC since 2001. Vice President and Managing Senior Counsel of Wells Fargo Bank, N.A. since 1996. | ||||
| Nancy Wiser (Born 1967) | Treasurer, since 2012 | Executive Vice President of Wells Fargo Funds Management, LLC since 2011. Chief Operating Officer and Chief Compliance Officer at LightBox Capital Management LLC, from 2008 to 2011. Owned and operated a consulting business providing services to various hedge funds including acting as Chief Operating Officer and Chief Compliance Officer for a hedge fund from 2007 to 2008. Chief Operating Officer and Chief Compliance Officer of GMN Capital LLC from 2006 to 2007. | ||||
| David Berardi (Born 1975) | Assistant Treasurer, since 2009 | Vice President of Wells Fargo Funds Management, LLC since 2009. Vice President of Evergreen Investment Management Company, LLC from 2008 to 2010. Assistant Vice President of Evergreen Investment Services, Inc. from 2004 to 2008. Manager of Fund Reporting and Control for Evergreen Investment Management Company, LLC from 2004 to 2010. | ||||
| Jeremy DePalma (Born 1974) | Assistant Treasurer, since 2009 | Senior Vice President of Wells Fargo Funds Management, LLC since 2009. Senior Vice President of Evergreen Investment Management Company, LLC from 2008 to 2010. Vice President, Evergreen Investment Services, Inc. from 2004 to 2007. Head of the Fund Reporting and Control Team within Fund Administration from 2005 to 2010. | ||||
| Debra Ann Early (Born 1964) | Chief Compliance Officer, since 2007 | Chief Compliance Officer of Wells Fargo Funds Management, LLC since 2007. Chief Compliance Officer of Parnassus Investments from 2005 to 2007. Chief Financial Officer of Parnassus Investments from 2004 to 2007 and Senior Audit Manager of PricewaterhouseCoopers LLP from 1998 to 2004. |
| 1. | The Statement of Additional Information includes additional information about the Trustees and is available, without charge, upon request, by calling 1-800-222-8222 or by visiting the Web site at wellsfargoadvantagefunds.com. |
Table of Contents
| Other Information (Unaudited) | Wells Fargo Advantage VT Small Cap Value Fund | 27 |
BOARD CONSIDERATION OF INVESTMENT ADVISORY AND SUB-ADVISORY AGREEMENTS:
Under Section 15 of the Investment Company Act of 1940 (the “1940 Act”), the Board of Trustees (the “Board”) of Wells Fargo Funds Trust (the “Trust”), all the members of which have no direct or indirect interest in the investment advisory and sub-advisory agreements and are not “interested persons” of the Trust, as defined in the 1940 Act (the “Independent Trustees”), must determine whether to approve the continuation of the Trust’s investment advisory and sub-advisory agreements. In this regard, at an in person meeting held on March 29-30, 2012 (the “Meeting”), the Board reviewed and re-approved: (i) an investment advisory agreement with Wells Fargo Funds Management, LLC (“Funds Management”) for Wells Fargo Advantage VT Small Cap Value Fund (the “Fund”) and (ii) an investment sub-advisory agreement with Wells Capital Management Incorporated (“Wells Capital Management”) for the Fund. The investment advisory agreement with Funds Management and the investment sub-advisory agreement with Wells Capital Management are collectively referred to as the “Advisory Agreements.”
At the Meeting, the Board considered the factors and reached the conclusions described below relating to the selection of Funds Management and Wells Capital Management and the continuation of the Advisory Agreements. Prior to the Meeting, the Trustees conferred extensively among themselves and with representatives of Funds Management about these matters. The Board also met throughout the year and received information that was useful to them in considering the continuation of the Advisory Agreements. The Independent Trustees were assisted in their evaluation of the Advisory Agreements by independent legal counsel, from whom they received separate legal advice and with whom they met separately from Funds Management.
In providing information to the Board, Funds Management and Wells Capital Management were guided by a detailed set of requests submitted by the Independent Trustees’ independent legal counsel on their behalf at the start of the Board’s annual contract renewal process earlier in 2012. In approving the Advisory Agreements, the Board did not identify any particular information or consideration that was all-important or controlling, and each Trustee likely attributed different weights to various factors.
Nature, extent and quality of services
The Board received and considered various information regarding the nature, extent and quality of services provided to the Fund by Funds Management and Wells Capital Management under the Advisory Agreements. The Board also received and considered, among other things, information about the background and experience of senior management of Funds Management, and the qualifications, backgrounds, tenures and responsibilities of the portfolio managers primarily responsible for the day-to-day portfolio management of the Fund.
The Board evaluated the ability of Funds Management and Wells Capital Management, based on their respective financial condition, resources, reputation and other attributes, to attract and retain qualified investment professionals, including research, advisory, and supervisory personnel. The Board further considered the compliance programs and compliance records of Funds Management and Wells Capital Management. In addition, the Board took into account the administrative services provided to the Fund by Funds Management and its affiliates.
The Board’s decision to approve the continuation of the Advisory Agreements was based on a comprehensive evaluation of information provided to it. In considering these matters, the Board considered not only the specific information presented in connection with the Meeting, but also the knowledge gained over time through interaction with Funds Management and Wells Capital Management about various topics, including Funds Management’s oversight of service providers. The above factors, together with those referenced below, are some of the most important, but not necessarily all, factors considered by the Board in concluding that the nature, extent and quality of the investment advisory services provided to the Fund by Funds Management and Wells Capital Management supported the re-approval of the Advisory Agreements. Although the Board considered the continuation of the Advisory Agreements for the Fund as part of the larger process of considering the continuation of the advisory agreements for all of the funds in the complex, its decision to continue the Advisory Agreements for the Fund was ultimately made on a fund-by-fund basis.
Fund performance and expenses
The Board considered the performance results for the Fund over various time periods ended December 31, 2011. The Board also considered these results in comparison to the median performance of a universe of relevant funds (the “Universe”) that was determined by Lipper Inc. (“Lipper”) to be similar to the Fund, and in comparison to the Fund’s
Table of Contents
| 28 | Wells Fargo Advantage VT Small Cap Value Fund | Other Information (Unaudited) |
benchmark index and to other comparative data. Lipper is an independent provider of investment company data. The Board received a description of the methodology used by Lipper to select the mutual funds in the Universe. The Board noted that the performance of the Fund was higher than or in range of the median performance of the Universe for the periods under review, except for the one-year and five-year periods. The Board also noted that the performance of the Fund was higher than or in range of its benchmark, the Lipper VUF Small Cap Core Funds Index, for the periods under review, except for the one-year and five-year periods. As part of its review, the Board received an analysis of, and discussed factors contributing to, the performance of the Fund. The Board was satisfied that Funds Management was appropriately monitoring the Fund’s investment performance.
The Board received and considered information regarding the Fund’s contractual advisory fee and net operating expense ratios and their various components, including actual management fees (which reflect fee waivers, if any), transfer agent, custodian and other non-management fees, Rule 12b-1 and non-Rule 12b-1 fees, service fees and fee waiver and expense reimbursement arrangements. The Board also considered these ratios in comparison to the median ratios of an expense Universe and a narrower expense group of mutual funds (each, an “Expense Group”) that was determined by Lipper to be similar to the Fund. The Board received a description of the methodology used by Lipper to select the mutual funds in the Fund’s Expense Group. The Board noted that the net operating expense ratio of the Fund was in range of the Fund’s Expense Group’s median net operating expense ratio.
Based on the above-referenced considerations and other factors, the Board concluded that the overall performance and expense structure of the Fund supported the re-approval of the Advisory Agreements for the Fund.
Investment advisory and sub-advisory fee rates
The Board reviewed and considered the contractual investment advisory fee rate that is payable by the Fund to Funds Management for investment advisory services (the “Advisory Agreement Rate”), both on a stand-alone basis and on a combined basis with the Fund’s administration fee rate. The Board took into account the separate administrative and other services covered by the administration fee rate. The Board also reviewed and considered the contractual investment sub-advisory fee rate that is payable by Funds Management to Wells Capital Management for investment sub-advisory services (the “Sub-Advisory Agreement Rate”). In addition, the Board reviewed and considered the existing fee waiver/cap arrangements applicable to the Advisory Agreement Rate and considered the Advisory Agreement Rate after taking the waivers/caps into account (the “Net Advisory Rate”).
The Board received and considered information comparing the Advisory Agreement Rate and Net Advisory Rate, combined with the administration fee rates, with those of other funds in the Fund’s Expense Group median. The Board noted that the Advisory Agreement Rate for the Fund was in range of the median rate for the Fund’s Expense Group, except for Class 1. The Board also noted that the Net Advisory Rate for the Fund was in range of or equal to the median rate for the Fund’s Expense Group.
The Board also received and considered information about the nature and extent of services offered and fee rates charged by Funds Management and Wells Capital Management to other types of clients. In this regard, the Board received information about differences between the services, and the compliance, reporting, and other legal burdens and risks of providing investment advice to mutual funds and those associated with providing advice to non-mutual fund clients such as collective funds or institutional separate accounts.
The Board determined that the Advisory Agreement Rate for the Fund, both with and without the administration fee rate and before and after waivers, was reasonable in light of the Fund’s Expense Group information, the net expense ratio commitments, the services covered by the Advisory Agreements and other information provided. The Board also reviewed and considered the Sub-Advisory Agreement Rate and concluded that the Sub-Advisory Agreement Rate was reasonable in light of the services covered by the Sub-Advisory Agreement and other information provided.
Profitability
The Board received and considered a profitability analysis of Funds Management, as well as an analysis of the profitability to the collective Wells Fargo businesses that provide services to the Fund. It considered that the information provided to it was necessarily estimated, and that the profitability information provided to it, especially on a fund-by-fund basis, did not necessarily provide a precise tool for evaluating the appropriateness of the Fund’s Advisory Agreement Rate in
Table of Contents
| Other Information (Unaudited) | Wells Fargo Advantage VT Small Cap Value Fund | 29 |
isolation. It noted that the levels of profitability reported on a fund-by-fund basis varied widely, depending on, among other things, the size and type of fund. The Board concluded that the profitability reported by Funds Management was not unreasonable.
The Board did not consider separate profitability information with respect to Wells Capital Management, because, as an affiliate of Funds Management, its profitability information was subsumed in the collective Wells Fargo profitability analysis provided by Funds Management.
Economies of scale
With respect to possible economies of scale, the Board reviewed the breakpoints in the Fund’s advisory fee and/or administration fee structure, which operate generally to reduce the expenses of the Fund (as a percentage of Fund assets) as the Fund grows in size. It considered that, as a fund shrinks in size, breakpoints conversely result in increasing fee levels. The Board noted that it would have on-going opportunities to review the appropriate levels of breakpoints in the future, and concluded that the breakpoints as implemented appeared to be a reasonable step toward sharing economies of scale, if any, with the Fund. However, the Board acknowledged the inherent limitations of any analysis of economies of scale and of any attempt to correlate breakpoints with such economies, stemming largely from the Board’s understanding that economies of scale are realized, if at all, across a variety of products and services, not just with respect to a single fund.
Other benefits to Funds Management and Wells Capital Management
The Board received and considered information regarding potential “fall-out” or ancillary benefits received by Funds Management and its affiliates, including Wells Capital Management, as a result of their relationship with the Fund. Ancillary benefits could include, among others, benefits directly attributable to the relationship of Funds Management and Wells Capital Management with the Fund and benefits potentially derived from an increase in Funds Management’s and Wells Capital Management’s business as a result of their relationship with the Fund (such as the ability to market to shareholders other financial products offered by Funds Management and its affiliates, including Wells Capital Management).
The Board considered that Wells Fargo Funds Distributor, LLC, an affiliate of Funds Management, serves as distributor to the Fund and receives certain compensation for those services. The Board noted that various financial institutions, including affiliates of Funds Management, may receive distribution-related fees, shareholder servicing payments (including amounts derived from payments under Rule 12b-1 plans) and sub-transfer agency fees in respect of shares sold or held through them and services provided.
The Board also reviewed information about whether and to what extent soft dollar credits are sought and how any such credits are utilized and any benefits that may be realized by using an affiliated broker.
Other factors and broader review
The Board also considered the markets for distribution of the Fund’s shares, including the channels through which the Fund’s shares are offered and sold. The Board noted that the Fund is part of one of the few fund families that have both direct-to-fund and intermediary distribution channels. As discussed above, the Board reviews detailed materials received from Funds Management and Wells Capital Management annually as part of the re-approval process under Section 15 of the 1940 Act and also reviews and assesses information about the quality of the services that the Fund receives throughout the year. In this regard, the Board has reviewed reports of Funds Management at each of its quarterly meetings, which include, among other things, portfolio reviews and performance reports. In addition, the Board confers with portfolio managers at various times throughout the year.
Conclusion
After considering the above-described factors and based on its deliberations and its evaluation of the information described above, the Board unanimously approved the continuation of the Advisory Agreements for an additional one-year period.
Table of Contents
| 30 | Wells Fargo Advantage VT Small Cap Value Fund | List of Abbreviations |
The following is a list of common abbreviations for terms and entities which may have appeared in this report.
| ACB | — Agricultural Credit Bank |
| ADR | — American Depository Receipt |
| ADS | — American Depository Shares |
| AGC-ICC | — Assured Guaranty Corporation - Insured Custody Certificates |
| AGM | — Assured Guaranty Municipal |
| AMBAC | — American Municipal Bond Assurance Corporation |
| AMT | — Alternative Minimum Tax |
| AUD | — Australian Dollar |
| BAN | — Bond Anticipation Notes |
| BHAC | — Berkshire Hathaway Assurance Corporation |
| BRL | — Brazil Real |
| CAB | — Capital Appreciation Bond |
| CAD | — Canadian Dollar |
| CCAB | — Convertible Capital Appreciation Bond |
| CDA | — Community Development Authority |
| CDO | — Collateralized Debt Obligation |
| CHF | — Swiss Franc |
| COP | — Certificate of Participation |
| CR | — Custody Receipts |
| DKK | — Danish Krone |
| DRIVER | — Derivative Inverse Tax-Exempt Receipts |
| DW&P | — Department of Water & Power |
| DWR | — Department of Water Resources |
| ECFA | — Educational & Cultural Facilities Authority |
| EDA | — Economic Development Authority |
| EDFA | — Economic Development Finance Authority |
| ETF | — Exchange-Traded Fund |
| EUR | — Euro |
| FFCB | — Federal Farm Credit Bank |
| FGIC | — Financial Guaranty Insurance Corporation |
| FGLMC | — Federal Government Loan Mortgage Company |
| FHA | — Federal Housing Authority |
| FHLB | — Federal Home Loan Bank |
| FHLMC | — Federal Home Loan Mortgage Corporation |
| FICO | — The Financing Corporation |
| FNMA | — Federal National Mortgage Association |
| FSA | — Farm Service Agency |
| GBP | — Great British Pound |
| GDR | — Global Depository Receipt |
| GNMA | — Government National Mortgage Association |
| GO | — General Obligation |
| HCFR | — Healthcare Facilities Revenue |
| HEFA | — Health & Educational Facilities Authority |
| HEFAR | — Higher Education Facilities Authority Revenue |
| HFA | — Housing Finance Authority |
| HFFA | — Health Facilities Financing Authority |
| HKD | — Hong Kong Dollar |
| HUF | — Hungarian Forint |
| IBC | — Insured Bond Certificate |
| IDA | — Industrial Development Authority |
| IDAG | — Industrial Development Agency |
| IDR | — Industrial Development Revenue |
| IEP | — Irish Pound |
| JPY | — Japanese Yen |
| KRW | — Republic of Korea Won |
| LIBOR | — London Interbank Offered Rate |
| LIQ | — Liquidity Agreement |
| LLC | — Limited Liability Company |
| LLP | — Limited Liability Partnership |
| LOC | — Letter of Credit |
| LP | — Limited Partnership |
| MBIA | — Municipal Bond Insurance Association |
| MFHR | — Multi-Family Housing Revenue |
| MSTR | — Municipal Securities Trust Receipts |
| MTN | — Medium Term Note |
| MUD | — Municipal Utility District |
| MXN | — Mexican Peso |
| MYR | — Malaysian Ringgit |
| NATL-RE | — National Public Finance Guarantee Corporation |
| NOK | — Norwegian Krone |
| NZD | — New Zealand Dollar |
| PCFA | — Pollution Control Finance Authority |
| PCR | — Pollution Control Revenue |
| PFA | — Public Finance Authority |
| PFFA | — Public Facilities Financing Authority |
| PFOTER | — Puttable Floating Option Tax-Exempt Receipts |
| plc | — Public Limited Company |
| PLN | — Polish Zloty |
| PUTTER | — Puttable Tax-Exempt Receipts |
| R&D | — Research & Development |
| RDA | — Redevelopment Authority |
| RDFA | — Redevelopment Finance Authority |
| REIT | — Real Estate Investment Trust |
| ROC | — Reset Option Certificates |
| SAVRS | — Select Auction Variable Rate Securities |
| SBA | — Small Business Authority |
| SEK | — Swedish Krona |
| SFHR | — Single Family Housing Revenue |
| SFMR | — Single Family Mortgage Revenue |
| SGD | — Singapore Dollar |
| SKK | — Slovakian Koruna |
| SPA | — Standby Purchase Agreement |
| SPDR | — Standard & Poor’s Depositary Receipts |
| STRIPS | — Separate Trading of Registered Interest and Principal Securities |
| TAN | — Tax Anticipation Notes |
| TBA | — To Be Announced |
| TIPS | — Treasury Inflation-Protected Securities |
| TRAN | — Tax Revenue Anticipation Notes |
| TCR | — Transferable Custody Receipts |
| TRY | — Turkish Lira |
| TTFA | — Transportation Trust Fund Authority |
| TVA | — Tennessee Valley Authority |
| XLCA | — XL Capital Assurance |
| ZAR | — South African Rand |
Table of Contents


FOR MORE INFORMATION
More information about Wells Fargo Advantage Funds is available free upon request. To obtain literature, please write, e-mail, visit the Fund’s Web site, or call:
Wells Fargo Advantage Funds
P.O. Box 8266
Boston, MA 02266-8266
E-mail: wfaf@wellsfargo.com
Web site: wellsfargoadvantagefunds.com
Individual investors: 1-800-222-8222
Retail investment professionals: 1-888-877-9275
Institutional investment professionals: 1-866-765-0778
This report and the financial statements contained herein are submitted for the general information of the shareholders of Wells Fargo Advantage Funds. If this report is used for promotional purposes, distribution of the report must be accompanied or preceded by a current prospectus. For a current prospectus and, if available, a summary prospectus containing more complete information, including charges and expenses, call 1-800-222-8222 or visit the Fund’s Web site at wellsfargoadvantagefunds.com . Please consider the investment objectives, risks, charges, and expenses of the investment carefully before investing. This and other information about Wells Fargo Advantage Funds can be found in the current prospectus. Read the prospectus carefully before you invest or send money.
Wells Fargo Funds Management, LLC, a wholly owned subsidiary of Wells Fargo & Company, provides investment advisory and administrative services for Wells Fargo Advantage Funds. Other affiliates of Wells Fargo & Company provide subadvisory and other services for the Funds. The Funds are distributed by Wells Fargo Funds Distributor, LLC, Member FINRA/SIPC, an affiliate of Wells Fargo & Company.
NOT FDIC INSURED ¡ NO BANK GUARANTEE ¡ MAY LOSE VALUE
© 2012 Wells Fargo Funds Management, LLC. All rights reserved.
210669 08-12 SVT8/SAR145 06-12 |
Table of Contents

Wells Fargo Advantage VT Total Return Bond Fund

Semi-Annual Report
June 30, 2012

Table of Contents
Reduce clutter. Save trees.
Sign up for electronic delivery of prospectuses and shareholder reports at wellsfargo.com/advantagedelivery
| 2 | ||||
| 5 | ||||
| 7 | ||||
| 8 | ||||
Financial Statements | ||||
| 22 | ||||
| 23 | ||||
| 24 | ||||
| 25 | ||||
| 26 | ||||
| 31 | ||||
| 37 | ||||
The views expressed and any forward-looking statements are as of June 30, 2012, unless otherwise noted, and are those of the Fund managers and/or Wells Fargo Funds Management, LLC. Discussions of individual securities, or the markets generally, or any Wells Fargo Advantage Fund are not intended as individual recommendations. Future events or results may vary significantly from those expressed in any forward-looking statements; the views expressed are subject to change at any time in response to changing circumstances in the market. Wells Fargo Funds Management, LLC, disclaims any obligation to publicly update or revise any views expressed or forward-looking statements.
NOT FDIC INSURED ¡ NO BANK GUARANTEE ¡ MAY LOSE VALUE
Table of Contents

WELLS FARGO INVESTMENT HISTORY
| 1932 | Keystone creates one of the first mutual fund families. | |
| 1971 | Wells Fargo & Company introduces one of the first institutional index funds. | |
| 1978 | Wells Fargo applies Markowitz and Sharpe’s research on Modern Portfolio Theory to introduce one of the industry’s first Tactical Asset Allocation (TAA) models in institutional separately managed accounts. | |
| 1984 | Wells Fargo Stagecoach Funds launches its first asset allocation fund. | |
| 1989 | The Tactical Asset Allocation (TAA) Model is first applied to Wells Fargo’s asset allocation mutual funds. | |
| 1994 | Wells Fargo introduces the LifePath Funds, one of the first suites of target date funds (now the Wells Fargo Advantage Dow Jones Target Date FundsSM). | |
| 1996 | Evergreen Investments and Keystone Funds merge. | |
| 1997 | Wells Fargo launches Wells Fargo Advantage WealthBuilder PortfoliosSM, a fund-of-funds suite of products that includes the use of quantitative models to shift assets among investment styles. | |
| 1999 | Norwest Advantage Funds and Stagecoach Funds are reorganized into Wells Fargo Funds after the merger of Norwest and Wells Fargo. | |
| 2002 | Evergreen Retail and Evergreen Institutional companies form the umbrella asset management company, Evergreen Investments. | |
| 2005 | The integration of Strong Funds with Wells Fargo Funds creates Wells Fargo Advantage Funds, resulting in one of the top 20 mutual fund companies in the United States. | |
| 2006 | Wells Fargo Advantage Funds relaunches the target date product line as Wells Fargo Advantage Dow Jones Target Date Funds. | |
| 2010 | The mergers and reorganizations of Evergreen and Wells Fargo Advantage mutual funds are completed, unifying the families under the brand of Wells Fargo Advantage Funds. | |
Wells Fargo Advantage Funds®
Wells Fargo Advantage Funds skillfully guides institutions, financial advisors, and individuals through the investment terrain to help them reach their financial objectives. Everything we do on behalf of investors is backed by our unique combination of qualifications.
Strength
Our organization is built on the standards of integrity and service established by our parent company—Wells Fargo & Company—more than 150 years ago. And, because we’re part of a highly diversified financial enterprise, we offer the depth of resources to help investors succeed.
Expertise
Our multi-boutique model offers investors access to the independent thinking of premier investment managers that have been chosen for their time-tested strategies. While each team specializes in a specific investment strategy, collectively they provide investors a wide choice of distinct investment styles. Our dedication to investment excellence doesn’t end with our expertise in manager selection—risk management, analysis, and rigorous ongoing review seek to ensure each manager’s investment process remains consistent.
Partnership
Our collaborative approach is built around understanding the needs and goals of our clients. By adhering to core principles of sound judgment and steady guidance, we support you through every stage of the investment decision process.
Carefully consider a fund’s investment objectives, risks, charges, and expenses before investing. For a current prospectus and, if available, a summary prospectus, containing this and other information, visit wellsfargoadvantagefunds.com. Read it carefully before investing.
Wells Fargo Funds Management, LLC, a wholly owned subsidiary of Wells Fargo & Company, provides investment advisory and administrative services for Wells Fargo Advantage Funds®. Other affiliates of Wells Fargo & Company provide subadvisory and other services for the Funds. The Funds are distributed by Wells Fargo Funds Distributor, LLC, Member FINRA/SIPC, an affiliate of Wells Fargo & Company.
“Dow Jones®” and “Dow Jones Target Date IndexesSM” are service marks of Dow Jones Trademark Holdings, LLC (“Dow Jones”), have been licensed to CME Group Index Services LLC (“CME Indexes”) and have been sublicensed for use for certain purposes by Global Index Advisors, Inc, and Wells Fargo Funds Management, LLC. The Wells Fargo Advantage Dow Jones Target Date FundsSM based on the Dow Jones Target Date IndexesSM, are not sponsored, endorsed, sold or promoted by Dow Jones, CME Indexes or their respective affiliates and none of them makes any representation regarding the advisability of investing in such product(s).
NOT FDIC INSURED ¡ NO BANK GUARANTEE ¡ MAY LOSE VALUE
Not part of semi-annual report.
Table of Contents
Wells Fargo Advantage Funds offers more than 110 mutual funds across a wide range of asset classes, representing over $207 billion in assets under management, as of June 30, 2012.
| Equity Funds | ||||
Asia Pacific Fund | Enterprise Fund† | Opportunity Fund† | ||
C&B Large Cap Value Fund | Equity Value Fund | Precious Metals Fund | ||
C&B Mid Cap Value Fund | Global Opportunities Fund | Premier Large Company Growth Fund | ||
Capital Growth Fund | Growth Fund | Small Cap Opportunities Fund | ||
Common Stock Fund | Index Fund | Small Cap Value Fund | ||
Disciplined U.S. Core Fund | International Equity Fund | Small Company Growth Fund | ||
Discovery Fund† | International Value Fund | Small Company Value Fund | ||
Diversified Equity Fund | Intrinsic Small Cap Value Fund | Small/Mid Cap Core Fund | ||
Diversified International Fund | Intrinsic Value Fund | Small/Mid Cap Value Fund | ||
Diversified Small Cap Fund | Intrinsic World Equity Fund | Special Mid Cap Value Fund | ||
Emerging Growth Fund | Large Cap Core Fund | Special Small Cap Value Fund | ||
Emerging Markets Equity Fund | Large Cap Growth Fund | Specialized Technology Fund | ||
Emerging Markets Equity Income Fund | Large Company Value Fund | Traditional Small Cap Growth Fund | ||
Endeavor Select Fund† | Omega Growth Fund | Utility and Telecommunications Fund | ||
| Bond Funds | ||||
Adjustable Rate Government Fund | Inflation-Protected Bond Fund | Short-Term Bond Fund | ||
California Limited-Term Tax-Free Fund | Intermediate Tax/AMT-Free Fund | Short-Term High Yield Bond Fund | ||
California Tax-Free Fund | International Bond Fund | Short-Term Municipal Bond Fund | ||
Colorado Tax-Free Fund | Minnesota Tax-Free Fund | Strategic Municipal Bond Fund | ||
Emerging Markets Local Bond Fund | Municipal Bond Fund | Total Return Bond Fund | ||
Government Securities Fund | North Carolina Tax-Free Fund | Ultra Short-Term Income Fund | ||
High Income Fund | Pennsylvania Tax-Free Fund | Ultra Short-Term Municipal Income Fund | ||
High Yield Bond Fund | Short Duration Government Bond Fund | Wisconsin Tax-Free Fund | ||
Income Plus Fund | ||||
| Asset Allocation Funds | ||||
Absolute Return Fund | WealthBuilder Equity Portfolio† | Target 2020 Fund† | ||
Asset Allocation Fund | WealthBuilder Growth Allocation Portfolio† | Target 2025 Fund† | ||
Conservative Allocation Fund | WealthBuilder Growth Balanced Portfolio† | Target 2030 Fund† | ||
Diversified Capital Builder Fund | WealthBuilder Moderate Balanced Portfolio† | Target 2035 Fund† | ||
Diversified Income Builder Fund | WealthBuilder Tactical Equity Portfolio† | Target 2040 Fund† | ||
Growth Balanced Fund | Target Today Fund† | Target 2045 Fund† | ||
Index Asset Allocation Fund | Target 2010 Fund† | Target 2050 Fund† | ||
Moderate Balanced Fund | Target 2015 Fund† | Target 2055 Fund† | ||
WealthBuilder Conservative Allocation Portfolio† | ||||
| Money Market Funds | ||||
100% Treasury Money Market Fund | Heritage Money Market Fund† | National Tax-Free Money Market Fund | ||
California Municipal Money Market Fund | Money Market Fund | Prime Investment Money Market Fund | ||
Cash Investment Money Market Fund | Municipal Cash Management Money Market Fund | Treasury Plus Money Market Fund | ||
Government Money Market Fund | Municipal Money Market Fund | |||
| Variable Trust Funds1 | ||||
VT Discovery Fund† | VT Intrinsic Value Fund | VT Small Cap Growth Fund | ||
VT Index Asset Allocation Fund | VT Omega Growth Fund | VT Small Cap Value Fund | ||
VT International Equity Fund | VT Opportunity Fund† | VT Total Return Bond Fund |
An investment in a money market fund is not insured or guaranteed by the Federal Deposit Insurance Corporation or any other government agency. Although the Wells Fargo Advantage Money Market Funds seek to preserve the value of your investment at $1.00 per share, it is possible to lose money by investing in a money market fund.
| 1. | The Variable Trust Funds are generally available only through insurance company variable contracts. |
| † | In this report, the Wells Fargo Advantage Discovery FundSM, Wells Fargo Advantage Endeavor Select FundSM, Wells Fargo Advantage Enterprise FundSM, Wells Fargo Advantage Opportunity FundSM, Wells Fargo Advantage WealthBuilder Conservative Allocation PortfolioSM, Wells Fargo Advantage WealthBuilder Equity PortfolioSM, Wells Fargo Advantage WealthBuilder Growth Allocation PortfolioSM, Wells Fargo Advantage WealthBuilder Growth Balanced PortfolioSM, Wells Fargo Advantage WealthBuilder Moderate Balanced PortfolioSM, Wells Fargo Advantage WealthBuilder Tactical Equity PortfolioSM, Wells Fargo Advantage Dow Jones Target Today FundSM, Wells Fargo Advantage Dow Jones Target 2010 FundSM, Wells Fargo Advantage Dow Jones Target 2015 FundSM, Wells Fargo Advantage Dow Jones Target 2020 FundSM, Wells Fargo Advantage Dow Jones Target 2025 FundSM, Wells Fargo Advantage Dow Jones Target 2030 FundSM, Wells Fargo Advantage Dow Jones Target 2035 FundSM, Wells Fargo Advantage Dow Jones Target 2040 FundSM, Wells Fargo Advantage Dow Jones Target 2045 FundSM, Wells Fargo Advantage Dow Jones Target 2050 FundSM, Wells Fargo Advantage Dow Jones Target 2055 FundSM, Wells Fargo Advantage Heritage Money Market FundSM, Wells Fargo Advantage VT Discovery FundSM, and Wells Fargo Advantage VT Opportunity FundSM are referred to as the Discovery Fund, Endeavor Select Fund, Enterprise Fund, Opportunity Fund, WealthBuilder Conservative Allocation Portfolio, WealthBuilder Equity Portfolio, WealthBuilder Growth Allocation Portfolio, WealthBuilder Growth Balanced Portfolio, WealthBuilder Moderate Balanced Portfolio, WealthBuilder Tactical Equity Portfolio, Target Today Fund, Target 2010 Fund, Target 2015 Fund, Target 2020 Fund, Target 2025 Fund, Target 2030 Fund, Target 2035 Fund, Target 2040 Fund, Target 2045 Fund, Target 2050 Fund, Target 2055 Fund, Heritage Money Market Fund, VT Discovery Fund, and VT Opportunity Fund, respectively. |
Not part of semi-annual report.
Table of Contents
| 2 | Wells Fargo Advantage VT Total Return Bond Fund | Letter to Shareholders (Unaudited) |

Karla M. Rabusch,
President
Wells Fargo Advantage Funds
Fixed-income performance was best among corporate bonds and commercial mortgage-backed securities (CMBS) mostly due to the first half of the period that benefited from strengthening economic fundamentals in the United States.
Dear Valued Shareholder:
We are pleased to offer you this semi-annual report for the Wells Fargo Advantage VT Total Return Bond Fund, which covers the six-month period that ended June 30, 2012. During the period, fixed-income performance was best among corporate bonds and commercial mortgage-backed securities (CMBS) mostly due to the first half of the period that benefited from strengthening economic fundamentals in the United States. These trends abruptly shifted in April and May as deteriorating credit conditions in Europe caused investors to turn to U.S. Treasuries, driving Treasury yields to some of their lowest levels on record in early June. Despite this strong rally in Treasuries, middle-quality corporate bonds continued to perform well, resulting in strong performance from the A-rated and BBB-rated1 credit tiers of the Barclays U.S. Aggregate Bond Index2 (Aggregate Index) during the six-month period, and resulting in strong performance from the corporate bond subsector.
Improving economic trends in the U.S. were once again undermined by the European sovereign debt crisis.
The first two months of 2012 continued the trends that started in December 2011; investor confidence strengthened as the U.S. economy demonstrated signs of sustainable growth and U.S. credit markets began to show some resistance to the credit problems of Europe. During these months, the lowest-rated credit tiers of the U.S. domestic fixed-income markets generally performed best while inflation expectations once again began to increase. The highest-quality credit tiers generally declined in value as yields began to shift higher on expectations for a strengthening economy and the potential for higher inflation and ultimately higher interest rates down the road. Consequently, U.S. Treasury yields shifted higher and declined in price during February and March. In the first quarter of 2012, the Barclays U.S. Treasury Index3 returned (1.29)%, while lower-rated credit tiers generated positive returns. The Barclays U.S. Corporate Bond Index4 returned 2.08%, and the Barclays U.S. High Yield Bond Index5 returned 5.34%.
During these opening three months, it looked as though the U.S. economy would continue to strengthen throughout much of 2012 and that lower-rated corporate bonds were poised to provide some of the best returns. In fact, conditions looked compelling for bonds in the middle credit tiers, as extraordinarily low interest rates made debt refinancing fluid for bond issuers while at the same time corporate earnings and balance sheet fundamentals continued to strengthen. These conditions did, in fact, translate to the quarterly performance of fixed-income securities in the first quarter as the lower-rated credit tiers outperformed each respectively higher-rated credit tier. In the Aggregate Index, the BBB-rated tier returned 2.52% and the AAA-rated tier returned (0.32)%. Additionally, lower-quality structured product sectors outperformed as higher yield spreads
| 1. | The ratings indicated are from Standard & Poor’s. Credit-quality ratings apply to underlying holdings of the Fund and not the Fund itself. Standard & Poor’s rates the creditworthiness of bonds, ranging from AAA (highest) to D (lowest). |
| 2. | The Barclays U.S. Aggregate Bond Index is composed of the Barclays U.S. Government/Credit Index and the Barclays U.S. Mortgage-Backed Securities Index and includes U.S. Treasury issues, agency issues, corporate bond issues, and mortgage-backed securities. You cannot invest directly in an index. |
| 3. | The Barclays U.S. Treasury Index is an unmanaged index of prices of U.S. Treasury bonds with maturities of one to 30 years. You cannot invest directly in an index. |
| 4. | The Barclays U.S. Corporate Bond Index is an unmanaged market value-weighted index of investment-grade corporate fixed-rate debt issues with maturities of one year or more. You cannot invest directly in an index. |
| 5. | The Barclays U.S. High-Yield Bond Index is an index consisting of all domestic and Yankee bonds, rated below investment grade, with a minimum outstanding amount of $100 million and maturing over one year. You cannot invest directly in an index. |
Table of Contents
| Letter to Shareholders (Unaudited) | Wells Fargo Advantage VT Total Return Bond Fund | 3 |
generated high levels of income and appreciated in price from spread compression. The CMBS subsector of the Aggregate Index returned 3.46% during the first quarter.
But once again, these trends would be undermined by the woes of Europe and would not last. By early May, the viability of the euro was being debated as Greece neared default on its sovereign debt and hinted at the possibility of exiting the euro. Consequently, global investors rallied to the U.S. Treasury market, driving long-term yields to some of their lowest levels on record in May and early June. The highest-rated credit tiers were the best performers while the lower-rated credit tiers were out of favor but generally still provided positive returns across the investment-grade credit tiers. In the second quarter of 2012, U.S. Treasuries was the strongest-performing subsector of the Aggregate Index, returning 2.83%, while CMBS was one of the lowest, returning 0.86%. However, the lower-rated investment-grade credit tiers continued to outperform the higher-rated tiers, mostly benefiting from higher spreads and the deepening rally in the Treasury market. The BBB-rated subsector of the Aggregate Index returned 2.35% in the second quarter, culminating in a 4.93% return for the six-month period, while the AAA-rated subsector returned 1.94% in the second quarter, culminating in a 1.62% return for the six-month period.
Thus, the theme for the period was an abrupt shift from burgeoning economic optimism in the U.S. domestic markets during the first quarter to quickly escalating risk aversion from global credit concerns in Europe during the second quarter. Yet, despite the heightened risk aversion in the second half of the period, U.S. investment-grade core fixed-income markets generally provided positive returns over the six-month period, with the Aggregate Index returning 2.37%, its U.S. Corporate Bond subsector returning 4.65%, and its. U.S. Treasury subsector returning 1.51%.
Don’t let short-term uncertainty derail long-term investment goals.
Periods of uncertainty can present challenges, but experience has taught us that maintaining a long-term investment strategy based on individual goals and risk tolerance can be an effective way to plan for the future. To help you create a sound strategy based on your personal goals and risk tolerance, Wells Fargo Advantage Funds offers more than 110 mutual funds and other investments spanning a wide range of asset classes and investment styles. Although diversification cannot guarantee an investment profit or prevent losses, we believe it can be an effective way to manage investment risk and potentially smooth out overall portfolio performance.
In our opinion, diligent and earnest assessment of the fundamental risks in individual fixed-income securities will be a key differentiating factor between which investment strategies perform well and which do not. At Wells Fargo Advantage Funds, we intend to continue measuring relative-value opportunities in the fixed-income markets and across our lineup of Wells Fargo Advantage Income Funds. We believe it is particularly important to have diligent investment analysts in charge of investor assets in changing markets. As evidenced by the performance of fixed-income assets during the recent six-month period, heightened risks also often accompany such opportunities.
The theme for the period was an abrupt shift from burgeoning economic optimism in the U.S. domestic markets during the first quarter to quickly escalating risk aversion from global credit concerns in Europe during the second quarter.
Table of Contents
| 4 | Wells Fargo Advantage VT Total Return Bond Fund | Letter to Shareholders (Unaudited) |
Thank you for choosing to invest with Wells Fargo Advantage Funds. We appreciate your confidence in us and remain committed to helping you meet your financial needs. For current information about your fund investments, contact your investment professional, visit our Web site at wellsfargoadvantagefunds.com, or call us directly at 1-800-222-8222. We are available 24 hours a day, 7 days a week.
Sincerely,

Karla M. Rabusch
President
Wells Fargo Advantage Funds
Table of Contents
| Performance Highlights (Unaudited) | Wells Fargo Advantage VT Total Return Bond Fund | 5 |
INVESTMENT OBJECTIVE
The Fund seeks total return, consisting of income and capital appreciation.
ADVISER
Wells Fargo Funds Management, LLC
SUB-ADVISER
Wells Capital Management Incorporated
PORTFOLIO MANAGERS
Troy Ludgood
Thomas O’Connor, CFA
FUND INCEPTION
September 20, 1999
TEN LARGEST LONG-TERM HOLDINGS1 (AS OF JUNE 30, 2012) | ||||
U.S. Treasury Note, 3.00%, 09/30/2016 | 2.40% | |||
U.S. Treasury Note, 0.38%, 04/15/2015 | 2.40% | |||
U.S. Treasury Note, 0.38%, 06/15/2015 | 2.22% | |||
U.S. Treasury Note, 2.63%, 08/15/2020 | 1.80% | |||
U.S. Treasury Note, 3.38%, 07/31/2013 | 1.68% | |||
U.S. Treasury Note, 2.38%, 02/28/2015 | 1.65% | |||
U.S. Treasury Note, 0.63%, 06/30/2017 | 1.54% | |||
FHLMC, 4.00%, 06/01/2042 | 1.47% | |||
FNMA, 5.00%, 07/01/2041 | 1.40% | |||
FHLMC, 2.50%, 08/15/2027 | 1.37% | |||
PORTFOLIO ALLOCATION2 (AS OF JUNE 30, 2012) | ||
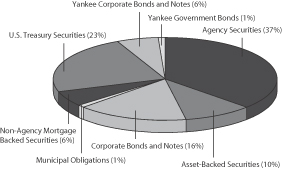 | ||
| 1. | The ten largest long-term holdings are calculated based on the value of the securities divided by total net assets of the Fund. Holdings are subject to change and may have changed since the date specified. |
| 2. | Portfolio allocation is subject to change and is calculated based on the total long-term investments of the Fund. |
Table of Contents
| 6 | Wells Fargo Advantage VT Total Return Bond Fund | Performance Highlights (Unaudited) |
AVERAGE ANNUAL TOTAL RETURN (%) (AS OF JUNE 30, 2012)
| Expense Ratios3 | ||||||||||||||||||||||||||||
| Inception Date | 6 Months* | 1 Year | 5 Year | 10 Year | Gross | Net4 | ||||||||||||||||||||||
Class 2 | 09/20/1999 | 3.19 | 8.23 | 7.64 | 6.27 | 0.92% | 0.91% | |||||||||||||||||||||
Barclays U.S. Aggregate Bond Index5 | 2.37 | 7.47 | 6.79 | 5.63 | ||||||||||||||||||||||||
| * | Returns for periods of less than one year are not annualized. |
Figures quoted represent past performance, which is no guarantee of future results and do not reflect the deduction of taxes that a shareholder may pay on fund distributions or the redemption of fund shares. Investment return and principal value of an investment will fluctuate so that an investor’s shares, when redeemed, may be worth more or less than their original cost. Current performance may be lower or higher than the performance data quoted and assumes the reinvestment of dividends and capital gains. Current month-end performance is available by calling 1-866-765-0778. Performance figures of the Fund do not reflect fees charged pursuant to the terms of variable life insurance policies and variable annuity contracts.
Index returns do not include transaction costs associated with buying and selling securities, any mutual fund fees or expenses or any taxes. It is not possible to invest directly in an index.
Bond fund values fluctuate in response to the financial condition of individual issuers, general market and economic conditions, and changes in interest rates. In general, when interest rates rise, bond fund values fall and investors may lose principal value. The use of derivatives may reduce returns and/or increase volatility. Certain investment strategies tend to increase the total risk of an investment (relative to the broader market). This Fund is exposed to foreign investment risk and mortgage- and asset-backed securities risk. Consult the Fund’s prospectus for additional information on these and other risks.
Please refer to the prospectus provided by your participating insurance company for detailed information describing the separate accounts for information regarding surrender charges, mortality and expense risk fees and other charges that may be assessed by the participating insurance companies.
| 3. | Reflects the expense ratios as stated in the most recent prospectus. |
| 4. | The Adviser has committed through July 18, 2013 to waive fees and/or reimburse expenses to the extent necessary to cap the Fund’s Total Annual Fund Operating Expenses After Fee Waiver, excluding certain expenses, at 0.90% for Class 2. Without this cap, the Fund’s returns would have been lower. |
| 5. | The Barclays U.S. Aggregate Bond Index is composed of the Barclays U.S. Government/Credit Index and the Barclays U.S. Mortgage-Backed Securities Index and includes U.S. Treasury issues, agency issues, corporate bond issues, and mortgage-backed securities. You cannot invest directly in an index. |
Table of Contents
| Fund Expenses (Unaudited) | Wells Fargo Advantage VT Total Return Bond Fund | 7 |
As a shareholder of the Fund, you incur ongoing costs, including management fees, distribution (12b-1) fees, and other Fund expenses. This example is intended to help you understand your ongoing costs (in dollars) of investing in the Fund and to compare these costs with the ongoing costs of investing in other mutual funds.
The example is based on an investment of $1,000 invested at the beginning of the six-month period and held for the entire period from January 1, 2012 to June 30, 2012.
Actual Expenses
The “Actual” line of the table below provides information about actual account values and actual expenses. You may use the information in this line, together with the amount you invested, to estimate the expenses that you paid over the period. Simply divide your account value by $1,000 (for example, an $8,600 account value divided by $1,000 = 8.6), then multiply the result by the number in the “Actual” line under the heading entitled “Expenses Paid During Period” for your applicable class of shares to estimate the expenses you paid on your account during this period.
Hypothetical Example for Comparison Purposes
The “Hypothetical” line of the table below provides information about hypothetical account values and hypothetical expenses based on the Fund’s actual expense ratio and an assumed rate of return of 5% per year before expenses, which is not the Fund’s actual return. The hypothetical account values and expenses may not be used to estimate the actual ending account balance or expenses you paid for the period. You may use this information to compare the ongoing costs of investing in the Fund and other funds. To do so, compare this 5% hypothetical example with the 5% hypothetical examples that appear in the shareholder reports of the other funds.
Please note that the expenses shown in the table are meant to highlight your ongoing costs only and do not reflect any separate account charges assessed by participating insurance companies. Therefore, the “Hypothetical” line of the table is useful in comparing ongoing costs only, and will not help you determine the relative total costs of owning different funds. In addition, if these separate account charges assessed by participating insurance companies were included, your costs would have been higher.
| Beginning Account Value 01-01-2012 | Ending Account Value 06-30-2012 | Expenses Paid During the Period1 | Net Annual Expense Ratio | |||||||||||||
Class 2 | ||||||||||||||||
Actual | $ | 1,000.00 | $ | 1,031.86 | $ | 4.55 | 0.90 | % | ||||||||
Hypothetical (5% return before expenses) | $ | 1,000.00 | $ | 1,020.39 | $ | 4.52 | 0.90 | % | ||||||||
| 1. | Expenses paid is equal to the annualized expense ratio multiplied by the average account value over the period, multiplied by the number of days in the most recent fiscal half-year divided by the number of days in the fiscal year (to reflect the one-half year period). |
Table of Contents
| 8 | Wells Fargo Advantage VT Total Return Bond Fund | Portfolio of Investments—June 30, 2012 (Unaudited) |
| Security Name | Interest Rate | Maturity Date | Principal | Value | ||||||||||||
| Agency Securities: 38.61% | ||||||||||||||||
FHLMC %% | 2.50 | % | 08/15/2027 | $ | 1,200,000 | $ | 1,230,938 | |||||||||
FHLMC %% | 3.00 | 08/15/2027 | 400,000 | 417,438 | ||||||||||||
FHLMC | 3.50 | 01/01/2032 | 24,645 | 26,080 | ||||||||||||
FHLMC | 3.50 | 03/01/2032 | 331,071 | 350,345 | ||||||||||||
FHLMC | 3.50 | 04/01/2032 | 93,209 | 98,636 | ||||||||||||
FHLMC | 4.00 | 01/01/2032 | 26,646 | 28,708 | ||||||||||||
FHLMC | 4.00 | 01/01/2032 | 44,397 | 47,833 | ||||||||||||
FHLMC | 4.00 | 02/01/2032 | 106,708 | 114,967 | ||||||||||||
FHLMC | 4.00 | 02/01/2032 | 48,598 | 52,360 | ||||||||||||
FHLMC | 4.00 | 04/01/2032 | 125,660 | 135,385 | ||||||||||||
FHLMC | 4.00 | 04/01/2032 | 49,572 | 53,409 | ||||||||||||
FHLMC | 4.00 | 06/01/2032 | 124,000 | 134,255 | ||||||||||||
FHLMC | 4.00 | 11/15/2037 | 87,678 | 91,862 | ||||||||||||
FHLMC | 4.00 | 02/15/2040 | 223,212 | 235,604 | ||||||||||||
FHLMC | 4.00 | 04/01/2042 | 451,000 | 487,313 | ||||||||||||
FHLMC | 4.00 | 06/01/2042 | 95,000 | 102,649 | ||||||||||||
FHLMC | 4.00 | 06/01/2042 | 305,000 | 329,558 | ||||||||||||
FHLMC | 4.00 | 06/01/2042 | 200,000 | 216,103 | ||||||||||||
FHLMC | 4.00 | 06/01/2042 | 1,221,000 | 1,319,311 | ||||||||||||
FHLMC | 4.00 | 06/01/2042 | 301,000 | 325,236 | ||||||||||||
FHLMC | 4.50 | 05/01/2042 | 879,000 | 968,416 | ||||||||||||
FHLMC | 4.50 | 05/01/2042 | 337,000 | 371,281 | ||||||||||||
FHLMC | 4.50 | 06/01/2042 | 232,000 | 255,600 | ||||||||||||
FHLMC | 4.50 | 06/01/2042 | 216,000 | 237,972 | ||||||||||||
FHLMC | 4.50 | 06/01/2042 | 234,000 | 257,803 | ||||||||||||
FHLMC | 4.50 | 06/01/2042 | 508,000 | 559,676 | ||||||||||||
FHLMC (a) | 4.50 | 07/15/2042 | 239,000 | 261,437 | ||||||||||||
FHLMC (a) | 4.50 | 07/15/2042 | 232,000 | 253,779 | ||||||||||||
FHLMC | 5.00 | 08/01/2039 | 641,806 | 714,085 | ||||||||||||
FHLMC | 5.00 | 04/01/2041 | 86,758 | 96,718 | ||||||||||||
FHLMC | 5.00 | 05/01/2041 | 77,132 | 85,987 | ||||||||||||
FHLMC | 5.00 | 07/01/2041 | 38,468 | 42,644 | ||||||||||||
FHLMC | 5.00 | 07/01/2041 | 211,630 | 234,604 | ||||||||||||
FHLMC | 5.00 | 07/01/2041 | 311,192 | 337,680 | ||||||||||||
FHLMC | 5.00 | 08/01/2041 | 590,603 | 640,874 | ||||||||||||
FHLMC | 5.50 | 07/01/2038 | 275,284 | 306,943 | ||||||||||||
FHLMC | 5.50 | 12/15/2039 | 567,430 | 619,591 | ||||||||||||
FHLMC ± | 5.61 | 10/01/2038 | 30,299 | 32,789 | ||||||||||||
FHLMC ± | 5.65 | 11/01/2039 | 394,206 | 427,048 | ||||||||||||
FHLMC ± | 5.83 | 11/01/2037 | 1,452 | 1,578 | ||||||||||||
FHLMC ± | 5.95 | 03/01/2037 | 6,422 | 6,958 | ||||||||||||
FHLMC | 6.00 | 03/01/2034 | 37,591 | 42,159 | ||||||||||||
FHLMC | 6.00 | 02/01/2035 | 31,319 | 35,125 | ||||||||||||
FHLMC | 6.00 | 12/01/2035 | 506,993 | 568,608 | ||||||||||||
FHLMC Series 2980 Class QA | 6.00 | 05/15/2035 | 590,944 | 663,928 | ||||||||||||
FHLMC Series 3529 Class AG | 6.50 | 04/15/2039 | 338,885 | 381,235 | ||||||||||||
FHLMC Series 3622 Class WA | 5.50 | 09/15/2039 | 197,080 | 213,792 | ||||||||||||
FHLMC Series K003 Class AAVB | 4.77 | 05/25/2018 | 166,000 | 187,137 | ||||||||||||
FHLMC Series K005 Class A2 | 4.32 | 11/25/2019 | 127,000 | 144,581 | ||||||||||||
FHLMC Series T-48 Class 1A3 Preassign 00764 ± | 6.25 | 07/25/2033 | 2,924 | 3,381 | ||||||||||||
The accompanying notes are an integral part of these financial statements.
Table of Contents
| Portfolio of Investments—June 30, 2012 (Unaudited) | Wells Fargo Advantage VT Total Return Bond Fund | 9 |
| Security Name | Interest Rate | Maturity Date | Principal | Value | ||||||||||||
| Agency Securities (continued) | ||||||||||||||||
FHLMC Series T-57 Class 1A3 Preassign 00073 | 7.50 | % | 07/25/2043 | $ | 32,469 | $ | 37,619 | |||||||||
FHLMC Series T-59 Class 1A3 Preassign 00329 | 7.50 | 10/25/2043 | 44,704 | 51,349 | ||||||||||||
FHLMC Series T-60 Class 1A3 Preassign 00462 | 7.50 | 03/25/2044 | 45,363 | 51,937 | ||||||||||||
FNMA %% | 2.50 | 08/15/2027 | 1,000,000 | 1,028,750 | ||||||||||||
FNMA %% | 2.50 | 09/15/2027 | 1,100,000 | 1,129,047 | ||||||||||||
FNMA | 3.50 | 01/01/2032 | 113,281 | 119,881 | ||||||||||||
FNMA | 3.50 | 04/01/2032 | 289,868 | 306,754 | ||||||||||||
FNMA | 3.50 | 04/01/2032 | 192,895 | 204,132 | ||||||||||||
FNMA | 3.50 | 04/01/2032 | 120,294 | 127,302 | ||||||||||||
FNMA | 4.00 | 01/01/2032 | 41,385 | 44,581 | ||||||||||||
FNMA | 4.00 | 01/01/2032 | 24,671 | 26,576 | ||||||||||||
FNMA | 4.00 | 02/01/2032 | 24,726 | 26,636 | ||||||||||||
FNMA | 4.00 | 02/01/2032 | 124,305 | 133,905 | ||||||||||||
FNMA | 4.00 | 04/01/2032 | 81,213 | 87,486 | ||||||||||||
FNMA | 4.00 | 06/01/2042 | 311,000 | 335,895 | ||||||||||||
FNMA | 4.00 | 07/01/2042 | 868,000 | 937,482 | ||||||||||||
FNMA (a) | 4.00 | 07/15/2042 | 117,000 | 126,384 | ||||||||||||
FNMA | 4.50 | 06/01/2042 | 320,000 | 353,552 | ||||||||||||
FNMA | 4.50 | 06/01/2042 | 91,000 | 100,541 | ||||||||||||
FNMA | 4.50 | 07/01/2042 | 196,000 | 216,550 | ||||||||||||
FNMA (a) | 4.50 | 07/25/2042 | 124,000 | 135,641 | ||||||||||||
FNMA | 4.50 | 08/15/2042 | 46,000 | 50,571 | ||||||||||||
FNMA (a) | 4.50 | 08/15/2042 | 207,000 | 226,433 | ||||||||||||
FNMA (a) | 4.50 | 08/25/2042 | 130,000 | 142,204 | ||||||||||||
FNMA | 4.50 | 09/15/2042 | 69,000 | 75,749 | ||||||||||||
FNMA | 5.00 | 04/01/2040 | 488,760 | 531,624 | ||||||||||||
FNMA | 5.00 | 02/01/2041 | 72,092 | 79,460 | ||||||||||||
FNMA | 5.00 | 03/01/2041 | 24,553 | 27,565 | ||||||||||||
FNMA | 5.00 | 05/01/2041 | 107,992 | 121,242 | ||||||||||||
FNMA | 5.00 | 05/01/2041 | 110,233 | 122,725 | ||||||||||||
FNMA | 5.00 | 06/01/2041 | 93,571 | 105,051 | ||||||||||||
FNMA | 5.00 | 06/01/2041 | 127,320 | 141,748 | ||||||||||||
FNMA | 5.00 | 06/01/2041 | 81,493 | 91,237 | ||||||||||||
FNMA | 5.00 | 06/01/2041 | 64,115 | 71,781 | ||||||||||||
FNMA | 5.00 | 07/01/2041 | 24,493 | 27,421 | ||||||||||||
FNMA | 5.00 | 07/01/2041 | 1,122,562 | 1,256,792 | ||||||||||||
FNMA | 5.00 | 07/01/2041 | 52,699 | 57,378 | ||||||||||||
FNMA | 5.00 | 08/01/2041 | 62,915 | 70,438 | ||||||||||||
FNMA | 5.00 | 08/01/2041 | 234,904 | 263,725 | ||||||||||||
FNMA | 5.00 | 08/01/2041 | 64,105 | 71,770 | ||||||||||||
FNMA | 5.00 | 08/01/2041 | 63,888 | 71,128 | ||||||||||||
FNMA | 5.00 | 08/01/2041 | 107,523 | 120,716 | ||||||||||||
FNMA | 5.00 | 09/01/2041 | 149,323 | 167,178 | ||||||||||||
FNMA | 5.00 | 09/01/2041 | 174,397 | 194,161 | ||||||||||||
FNMA | 5.00 | 09/01/2041 | 77,102 | 86,562 | ||||||||||||
FNMA ± | 5.49 | 01/01/2036 | 99,272 | 106,179 | ||||||||||||
FNMA | 5.50 | 09/01/2034 | 49,696 | 54,101 | ||||||||||||
FNMA | 5.50 | 04/01/2036 | 47,032 | 51,368 | ||||||||||||
FNMA | 5.50 | 01/15/2038 | 105,000 | 115,207 | ||||||||||||
FNMA | 5.50 | 07/01/2039 | 50,503 | 56,485 | ||||||||||||
The accompanying notes are an integral part of these financial statements.
Table of Contents
| 10 | Wells Fargo Advantage VT Total Return Bond Fund | Portfolio of Investments—June 30, 2012 (Unaudited) |
| Security Name | Interest Rate | Maturity Date | Principal | Value | ||||||||||||
| Agency Securities (continued) | ||||||||||||||||
FNMA ± | 5.84 | % | 09/01/2037 | $ | 55,261 | $ | 59,993 | |||||||||
FNMA ± | 5.99 | 09/01/2037 | 18,371 | 20,125 | ||||||||||||
FNMA | 6.00 | 03/01/2034 | 808,974 | 911,541 | ||||||||||||
FNMA | 6.00 | 08/01/2034 | 87,002 | 99,025 | ||||||||||||
FNMA | 6.00 | 08/01/2034 | 41,675 | 46,929 | ||||||||||||
FNMA | 6.00 | 11/01/2034 | 65,560 | 73,169 | ||||||||||||
FNMA | 6.00 | 12/01/2034 | 269,965 | 307,274 | ||||||||||||
FNMA | 6.00 | 04/01/2035 | 414,755 | 466,158 | ||||||||||||
FNMA | 6.00 | 04/01/2035 | 20,166 | 22,708 | ||||||||||||
FNMA | 6.00 | 04/01/2035 | 202,973 | 226,530 | ||||||||||||
FNMA | 6.00 | 12/01/2035 | 160,281 | 180,487 | ||||||||||||
FNMA | 6.00 | 08/01/2036 | 223,039 | 248,925 | ||||||||||||
FNMA | 6.00 | 09/01/2036 | 309,095 | 348,060 | ||||||||||||
FNMA | 6.00 | 07/01/2037 | 411,177 | 462,914 | ||||||||||||
FNMA | 6.00 | 07/01/2037 | 62,081 | 69,907 | ||||||||||||
FNMA | 6.00 | 10/01/2038 | 221,949 | 244,588 | ||||||||||||
FNMA ± | 6.27 | 09/01/2037 | 198,484 | 217,076 | ||||||||||||
FNMA | 7.00 | 02/25/2042 | 210,169 | 236,534 | ||||||||||||
FNMA Series 2002-33 Class A2 | 7.50 | 06/25/2032 | 34,166 | 39,251 | ||||||||||||
FNMA Series 2003-W17 Class 1A7 | 5.75 | 08/25/2033 | 85,000 | 99,271 | ||||||||||||
FNMA Series 2005-5 Class PA | 5.00 | 01/25/2035 | 58,073 | 63,327 | ||||||||||||
FNMA Series 2006-56 Class CA | 6.00 | 07/25/2036 | 31,337 | 35,663 | ||||||||||||
FNMA Series 2009-105 Class CB | 6.00 | 12/25/2039 | 235,066 | 259,850 | ||||||||||||
FNMA Series 2009-11 Class LC | 4.50 | 03/25/2049 | 144,759 | 153,530 | ||||||||||||
FNMA Series 2009-30 Class AD | 6.50 | 04/25/2039 | 216,845 | 241,613 | ||||||||||||
FNMA Series 2009-66 Class KE | 4.00 | 09/25/2039 | 186,962 | 198,130 | ||||||||||||
FNMA Series 2009-93 Class PD | 4.50 | 09/25/2039 | 80,361 | 86,323 | ||||||||||||
FNMA Series 2009-M01 Class A2 | 4.29 | 07/25/2019 | 135,000 | 151,936 | ||||||||||||
FNMA Series 2009-M02 Class A3 | 4.00 | 01/25/2019 | 244,000 | 270,415 | ||||||||||||
FNMA Series 2010-054 Class EA | 4.50 | 06/25/2040 | 288,149 | 309,424 | ||||||||||||
FNMA Series 2010-M01 Class A2 | 4.45 | 09/25/2019 | 100,000 | 113,783 | ||||||||||||
FNMA Series 2010-M03 Class A3 ± | 4.33 | 03/25/2020 | 499,000 | 564,669 | ||||||||||||
FNMA Series 2011 Class 53 | 4.50 | 06/25/2041 | 191,633 | 203,065 | ||||||||||||
FNMA Series 2011-53 Class TN | 4.00 | 06/25/2041 | 987,415 | 1,044,326 | ||||||||||||
FNMA Series 2011-78 Class D | 4.00 | 08/25/2041 | 46,880 | 49,644 | ||||||||||||
GNMA ± | 3.50 | 05/20/2041 | 66,651 | 70,950 | ||||||||||||
GNMA ± | 3.50 | 10/20/2041 | 62,077 | 66,081 | ||||||||||||
GNMA | 4.50 | 04/20/2039 | 88,000 | 100,605 | ||||||||||||
GNMA | 6.00 | 01/15/2040 | 476,531 | 535,535 | ||||||||||||
GNMA II ± | 3.00 | 08/20/2041 | 95,212 | 100,453 | ||||||||||||
GNMA II ± | 3.00 | 08/20/2041 | 66,202 | 69,813 | ||||||||||||
GNMA II ± | 3.00 | 10/20/2041 | 72,984 | 77,167 | ||||||||||||
GNMA II ± | 3.00 | 11/20/2041 | 46,905 | 49,570 | ||||||||||||
GNMA II ± | 3.00 | 01/20/2042 | 149,685 | 158,529 | ||||||||||||
GNMA II ± | 3.50 | 07/20/2041 | 189,635 | 201,819 | ||||||||||||
GNMA II ± | 3.50 | 08/20/2041 | 62,581 | 66,602 | ||||||||||||
GNMA Series 2002-95 Class DB | 6.00 | 01/25/2033 | 140,000 | 158,138 | ||||||||||||
Total Agency Securities (Cost $33,954,508) | 34,672,823 | |||||||||||||||
|
| |||||||||||||||
The accompanying notes are an integral part of these financial statements.
Table of Contents
| Portfolio of Investments—June 30, 2012 (Unaudited) | Wells Fargo Advantage VT Total Return Bond Fund | 11 |
| Security Name | Interest Rate | Maturity Date | Principal | Value | ||||||||||||
| Asset-Backed Securities: 10.44% | ||||||||||||||||
Ally Auto Receivables Trust Series 2011-4 Class A2 | 0.65 | % | 03/17/2014 | $ | 66,335 | $ | 66,358 | |||||||||
Ally Master Owner Trust Series 2012-1 Class A1 ± | 1.04 | 02/15/2017 | 473,000 | 475,494 | ||||||||||||
Americredit Automobile Receivable Trust Series 2012-3 Class A3 | 0.96 | 01/09/2017 | 157,000 | 156,956 | ||||||||||||
Capital One Multi-Asset Execution Trust Series 2005-A10 Class A ± | 0.32 | 09/15/2015 | 101,000 | 100,972 | ||||||||||||
Capital One Multi-Asset Execution Trust Series 2005-A6 Class A6 ± | 0.52 | 07/15/2015 | 358,000 | 357,827 | ||||||||||||
Capital One Multi-Asset Execution Trust Series 2007-A8 Class A8 ± | 0.77 | 10/15/2015 | 326,000 | 326,310 | ||||||||||||
Chase Issuance Trust Series 2008-A13 Class A13 ± | 1.97 | 09/15/2015 | 139,000 | 141,551 | ||||||||||||
Citibank Omni Master Trust Series 2009-A14A Class A14 ±144A | 2.99 | 08/15/2018 | 259,000 | 271,981 | ||||||||||||
Developers Diversified Realty Corporation Trust Series 2009-DDR1 Class A 144A | 3.81 | 10/14/2022 | 258,671 | 271,868 | ||||||||||||
Ford Credit Auto Owner Trust Series 2009-D Class A3 | 2.17 | 10/15/2013 | 23,492 | 23,540 | ||||||||||||
Ford Credit Floorplan Master Trust Series 2009-2 Class A ± | 1.79 | 09/15/2014 | 271,000 | 271,876 | ||||||||||||
Ford Credit Floorplan Master Trust Series 2012-1 Class A ± | 0.71 | 01/15/2016 | 350,000 | 351,255 | ||||||||||||
GE Capital Credit Card Master Note Trust Series 2012-4 Class A ± | 0.54 | 06/15/2018 | 234,000 | 234,001 | ||||||||||||
Honda Auto Receivables Owner Trust Series 2009-2 Class A4 | 4.43 | 07/15/2015 | 128,878 | 129,752 | ||||||||||||
MMCA Automobile Trust Series 2011-A Class A4 144A | 2.02 | 10/17/2016 | 116,000 | 118,119 | ||||||||||||
Nelnet Student Loan Trust Series 2002-2 Class A4CP ± | 0.48 | 09/25/2024 | 86,915 | 85,291 | ||||||||||||
Nelnet Student Loan Trust Series 2005-1 Class A5 ± | 0.58 | 10/25/2033 | 293,000 | 271,160 | ||||||||||||
Nelnet Student Loan Trust Series 2005-2 Class A5 ± | 0.57 | 03/23/2037 | 296,000 | 272,672 | ||||||||||||
Nelnet Student Loan Trust Series 2006-1 Class A4 ± | 0.56 | 11/23/2022 | 369,000 | 367,542 | ||||||||||||
Nelnet Student Loan Trust Series 2006-2 Class A4 ± | 0.55 | 10/26/2026 | 328,000 | 325,982 | ||||||||||||
Nelnet Student Loan Trust Series 2007-1 Class A3 ± | 0.54 | 05/27/2025 | 153,000 | 142,112 | ||||||||||||
Nelnet Student Loan Trust Series 2007-2A Class A3l ±144A | 0.82 | 03/25/2026 | 526,000 | 509,692 | ||||||||||||
Nissan Master Owner Trust Receivables Series 2012-A Class A ± | 0.71 | 05/15/2017 | 84,000 | 84,168 | ||||||||||||
Santander Drive Auto Receivable Trust Series 2012-2 Class A3 | 1.22 | 12/15/2015 | 76,000 | 76,421 | ||||||||||||
Santander Drive Auto Receivable Trust Series 2012-4 Class A3 | 1.40 | 08/15/2016 | 102,000 | 101,985 | ||||||||||||
SLC Student Loan Trust Series 2010-1 Class A ± | 1.34 | 11/25/2042 | 194,862 | 196,538 | ||||||||||||
SLM Student Loan Trust Series 2000-A Class A2 ± | 0.66 | 10/28/2028 | 110,620 | 110,289 | ||||||||||||
SLM Student Loan Trust Series 2004-5 Class A4 ± | 0.62 | 01/25/2021 | 73,069 | 72,966 | ||||||||||||
SLM Student Loan Trust Series 2004-6 Class A5 ± | 0.64 | 04/27/2020 | 252,028 | 251,307 | ||||||||||||
SLM Student Loan Trust Series 2005-1 Class A2 ± | 0.55 | 04/27/2020 | 81,354 | 80,703 | ||||||||||||
SLM Student Loan Trust Series 2005-6 Class A5 ± | 1.67 | 07/27/2026 | 100,000 | 99,997 | ||||||||||||
SLM Student Loan Trust Series 2007-2 Class A2 ± | 0.47 | 07/25/2017 | 115,900 | 115,465 | ||||||||||||
SLM Student Loan Trust Series 2007-4 Class A3 ± | 0.53 | 01/25/2022 | 237,000 | 235,684 | ||||||||||||
SLM Student Loan Trust Series 2008-5 Class A4 ± | 2.17 | 07/25/2023 | 266,000 | 276,630 | ||||||||||||
SLM Student Loan Trust Series 2008-9 Class A ± | 1.97 | 04/25/2023 | 145,247 | 149,963 | ||||||||||||
SLM Student Loan Trust Series 2011-C Class A1 ±144A | 1.64 | 12/15/2023 | 328,181 | 329,937 | ||||||||||||
SLM Student Loan Trust Series 2012-2 Class A ± | 0.95 | 01/25/2029 | 453,953 | 458,097 | ||||||||||||
SLM Student Loan Trust Series 2012-3 Class A ± | 0.90 | 12/26/2025 | 328,946 | 328,939 | ||||||||||||
SLM Student Loan Trust Series 2012-A Class A1 ±144A | 1.64 | 08/15/2025 | 317,148 | 319,530 | ||||||||||||
SLM Student Loan Trust Series 2012-B Class A1 ±144A | 1.34 | 12/15/2021 | 313,403 | 313,898 | ||||||||||||
SLM Student Loan Trust Series 2012-C Class A1 ±144A | 1.34 | 08/15/2023 | 272,000 | 271,998 | ||||||||||||
SMS Student Loan Trust Series 2000-B Class A2 ± | 0.67 | 04/28/2029 | 108,705 | 107,775 | ||||||||||||
World Financial Network Credit Card Master Trust Series 2011-A Class A | 1.68 | 08/15/2018 | 122,000 | 122,660 | ||||||||||||
Total Asset-Backed Securities (Cost $9,326,760) | 9,377,261 | |||||||||||||||
|
| |||||||||||||||
The accompanying notes are an integral part of these financial statements.
Table of Contents
| 12 | Wells Fargo Advantage VT Total Return Bond Fund | Portfolio of Investments—June 30, 2012 (Unaudited) |
| Security Name | Interest Rate | Maturity Date | Principal | Value | ||||||||||||
Corporate Bonds and Notes: 16.78% | ||||||||||||||||
Consumer Discretionary: 1.61% | ||||||||||||||||
| Automobiles: 0.50% | ||||||||||||||||
Daimler Finance North America LLC 144A | 1.65 | % | 04/10/2015 | $ | 200,000 | $ | 200,813 | |||||||||
Daimler Finance North America LLC 144A | 1.88 | 09/15/2014 | 245,000 | 246,334 | ||||||||||||
| 447,147 | ||||||||||||||||
|
| |||||||||||||||
| Diversified Consumer Services: 0.09% | ||||||||||||||||
University of Pennsylvania § | 4.67 | 09/01/2112 | 70,000 | 80,394 | ||||||||||||
|
| |||||||||||||||
| Hotels, Restaurants & Leisure: 0.20% | ||||||||||||||||
Wyndham Worldwide Corporation | 2.95 | 03/01/2017 | 55,000 | 54,736 | ||||||||||||
Wyndham Worldwide Corporation | 4.25 | 03/01/2022 | 125,000 | 125,965 | ||||||||||||
| 180,701 | ||||||||||||||||
|
| |||||||||||||||
| Media: 0.71% | ||||||||||||||||
CBS Corporation | 4.85 | 07/01/2042 | 85,000 | 83,311 | ||||||||||||
Comcast Corporation | 4.65 | 07/15/2042 | 155,000 | 155,296 | ||||||||||||
DIRECTV Holdings LLC | 2.40 | 03/15/2017 | 45,000 | 45,316 | ||||||||||||
DIRECTV Holdings LLC | 3.80 | 03/15/2022 | 70,000 | 70,848 | ||||||||||||
DIRECTV Holdings LLC | 5.15 | 03/15/2042 | 70,000 | 70,548 | ||||||||||||
News America Incorporated | 6.15 | 03/01/2037 | 60,000 | 68,064 | ||||||||||||
News America Incorporated | 6.15 | 02/15/2041 | 43,000 | 50,348 | ||||||||||||
Omnicom Group Incorporated | 3.63 | 05/01/2022 | 35,000 | 35,593 | ||||||||||||
Time Warner Cable Incorporated | 5.50 | 09/01/2041 | 50,000 | 54,478 | ||||||||||||
| 633,802 | ||||||||||||||||
|
| |||||||||||||||
| Specialty Retail: 0.11% | ||||||||||||||||
Gap Incorporated | 5.95 | 04/12/2021 | 100,000 | 103,722 | ||||||||||||
|
| |||||||||||||||
Consumer Staples: 0.98% | ||||||||||||||||
| Beverages: 0.32% | ||||||||||||||||
PepsiCo Incorporated | 2.50 | 05/10/2016 | 105,000 | 110,274 | ||||||||||||
The Coca-Cola Company | 1.80 | 09/01/2016 | 175,000 | 179,811 | ||||||||||||
| 290,085 | ||||||||||||||||
|
| |||||||||||||||
| Food & Staples Retailing: 0.10% | ||||||||||||||||
Wal-Mart Stores Incorporated | 5.63 | 04/15/2041 | 70,000 | 91,234 | ||||||||||||
|
| |||||||||||||||
| Food Products: 0.56% | ||||||||||||||||
Kraft Foods Incorporated 144A | 5.00 | 06/04/2042 | 80,000 | 84,791 | ||||||||||||
Kraft Foods Incorporated Class A | 5.38 | 02/10/2020 | 95,000 | 112,490 | ||||||||||||
Kraft Foods Incorporated Class A | 6.50 | 02/09/2040 | 75,000 | 96,470 | ||||||||||||
Tyson Foods Incorporated | 4.50 | 06/15/2022 | 200,000 | 206,000 | ||||||||||||
| 499,751 | ||||||||||||||||
|
| |||||||||||||||
The accompanying notes are an integral part of these financial statements.
Table of Contents
| Portfolio of Investments—June 30, 2012 (Unaudited) | Wells Fargo Advantage VT Total Return Bond Fund | 13 |
| Security Name | Interest Rate | Maturity Date | Principal | Value | ||||||||||||
Energy: 1.54% | ||||||||||||||||
| Oil, Gas & Consumable Fuels: 1.54% | ||||||||||||||||
DCP Midstream Operating Company | 4.95 | % | 04/01/2022 | $ | 135,000 | $ | 138,663 | |||||||||
El Paso Pipeline Partners Operating LLC | 4.10 | 11/15/2015 | 110,000 | 115,098 | ||||||||||||
El Paso Pipeline Partners Operating LLC | 7.50 | 11/15/2040 | 45,000 | 57,091 | ||||||||||||
Energen Corporation | 4.63 | 09/01/2021 | 115,000 | 118,766 | ||||||||||||
Energy Transfer Partners LP | 5.20 | 02/01/2022 | 50,000 | 53,585 | ||||||||||||
Energy Transfer Partners LP | 6.50 | 02/01/2042 | 75,000 | 80,471 | ||||||||||||
Energy Transfer Partners LP | 9.00 | 04/15/2019 | 20,000 | 24,993 | ||||||||||||
Kerr-McGee Corporation | 6.95 | 07/01/2024 | 180,000 | 222,980 | ||||||||||||
Kinder Morgan Energy Partners LP | 3.95 | 09/01/2022 | 85,000 | 86,185 | ||||||||||||
Marathon Petroleum Corporation | 6.50 | 03/01/2041 | 138,000 | 157,025 | ||||||||||||
MidAmerican Energy Holdings Company | 6.50 | 09/15/2037 | 35,000 | 46,135 | ||||||||||||
Phillips 66 144A | 5.88 | 05/01/2042 | 60,000 | 64,674 | ||||||||||||
Western Gas Partners | 4.00 | 07/01/2022 | 100,000 | 100,000 | ||||||||||||
Western Gas Partners | 5.38 | 06/01/2021 | 105,000 | 116,223 | ||||||||||||
| 1,381,889 | ||||||||||||||||
|
| |||||||||||||||
Financials: 8.27% | ||||||||||||||||
| Capital Markets: 0.98% | ||||||||||||||||
Goldman Sachs Group Incorporated | 3.30 | 05/03/2015 | 160,000 | 159,999 | ||||||||||||
Goldman Sachs Group Incorporated | 6.00 | 06/15/2020 | 120,000 | 128,190 | ||||||||||||
Lazard Group LLC | 6.85 | 06/15/2017 | 220,000 | 241,550 | ||||||||||||
Lazard Group LLC | 7.13 | 05/15/2015 | 150,000 | 163,821 | ||||||||||||
Morgan Stanley | 5.50 | 07/28/2021 | 185,000 | 182,401 | ||||||||||||
| 875,961 | ||||||||||||||||
|
| |||||||||||||||
| Commercial Banks: 0.56% | ||||||||||||||||
HSBC USA Incorporated | 2.38 | 02/13/2015 | 345,000 | 348,976 | ||||||||||||
Inter-American Development Bank Series EMTN | 3.88 | 10/28/2041 | 141,000 | 152,997 | ||||||||||||
| 501,973 | ||||||||||||||||
|
| |||||||||||||||
| Consumer Finance: 0.79% | ||||||||||||||||
American Express Credit Corporation | 1.75 | 06/12/2015 | 60,000 | 60,690 | ||||||||||||
American Express Credit Corporation | 2.38 | 03/24/2017 | 71,000 | 72,803 | ||||||||||||
Ford Motor Credit Company LLC | 2.75 | 05/15/2015 | 230,000 | 231,898 | ||||||||||||
Ford Motor Credit Company LLC | 5.88 | 08/02/2021 | 200,000 | 222,660 | ||||||||||||
John Deere Capital Corporation | 0.95 | 06/29/2015 | 55,000 | 55,099 | ||||||||||||
Nisource Finance Corporation | 5.25 | 02/15/2043 | 65,000 | 65,997 | ||||||||||||
| 709,147 | ||||||||||||||||
|
| |||||||||||||||
| Diversified Financial Services: 3.56% | ||||||||||||||||
ABB Finance USA Incorporated | 1.63 | 05/08/2017 | 70,000 | 70,371 | ||||||||||||
Bank of America Corporation | 3.88 | 03/22/2017 | 70,000 | 71,339 | ||||||||||||
Bank of America Corporation | 5.70 | 01/24/2022 | 24,000 | 26,451 | ||||||||||||
Bank of America Corporation | 5.88 | 02/07/2042 | 50,000 | 54,841 | ||||||||||||
Bank of America Corporation | 6.00 | 09/01/2017 | 125,000 | 134,958 | ||||||||||||
Citigroup Incorporated | 1.88 | 10/22/2012 | 370,000 | 371,818 | ||||||||||||
Citigroup Incorporated | 2.65 | 03/02/2015 | 165,000 | 165,001 | ||||||||||||
The accompanying notes are an integral part of these financial statements.
Table of Contents
| 14 | Wells Fargo Advantage VT Total Return Bond Fund | Portfolio of Investments—June 30, 2012 (Unaudited) |
| Security Name | Interest Rate | Maturity Date | Principal | Value | ||||||||||||
| Diversified Financial Services (continued) | ||||||||||||||||
Citigroup Incorporated | 4.45 | % | 01/10/2017 | $ | 158,000 | $ | 165,690 | |||||||||
Citigroup Incorporated | 4.50 | 01/14/2022 | 173,000 | 178,822 | ||||||||||||
Citigroup Incorporated | 6.13 | 05/15/2018 | 140,000 | 156,398 | ||||||||||||
General Electric Capital Corporation | 1.63 | 07/02/2015 | 275,000 | 274,788 | ||||||||||||
General Electric Capital Corporation | 2.30 | 04/27/2017 | 140,000 | 141,011 | ||||||||||||
General Electric Capital Corporation | 6.88 | 01/10/2039 | 120,000 | 155,008 | ||||||||||||
JPMorgan Chase & Company | 4.50 | 01/24/2022 | 90,000 | 97,025 | ||||||||||||
JPMorgan Chase & Company | 4.65 | 06/01/2014 | 355,000 | 373,788 | ||||||||||||
JPMorgan Chase & Company | 5.40 | 01/06/2042 | 70,000 | 76,968 | ||||||||||||
Murray Street Investment Trust I | 4.65 | 03/09/2017 | 395,000 | 395,927 | ||||||||||||
PPL Capital Funding Incorporated | 4.20 | 06/15/2022 | 105,000 | 105,422 | ||||||||||||
Private Export Funding | 2.45 | 07/15/2024 | 185,000 | 183,338 | ||||||||||||
| 3,198,964 | ||||||||||||||||
|
| |||||||||||||||
| Insurance: 1.42% | ||||||||||||||||
American International Group Incorporated | 4.88 | 06/01/2022 | 95,000 | 97,282 | ||||||||||||
American International Group Incorporated Series MTN | 5.85 | 01/16/2018 | 20,000 | 22,121 | ||||||||||||
Berkshire Hathaway Financial Incorporated | 1.60 | 05/15/2017 | 140,000 | 141,041 | ||||||||||||
Berkshire Hathaway Financial Incorporated | 3.40 | 01/31/2022 | 191,000 | 200,395 | ||||||||||||
Berkshire Hathaway Financial Incorporated | 4.40 | 05/15/2042 | 37,000 | 38,008 | ||||||||||||
Hartford Financial Services Group | 6.63 | 04/15/2042 | 30,000 | 30,937 | ||||||||||||
Liberty Mutual Group Incorporated 144A | 6.50 | 05/01/2042 | 125,000 | 126,675 | ||||||||||||
Markel Corporation | 4.90 | 07/01/2022 | 110,000 | 110,864 | ||||||||||||
MetLife Global Funding I 144A | 1.70 | 06/29/2015 | 100,000 | 100,090 | ||||||||||||
MetLife Incorporated | 5.70 | 06/15/2035 | 50,000 | 59,345 | ||||||||||||
Prudential Covered Trust Company 144A | 3.00 | 09/30/2015 | 140,000 | 142,239 | ||||||||||||
Prudential Financial Incorporated | 4.75 | 09/17/2015 | 95,000 | 102,293 | ||||||||||||
Prudential Financial Incorporated | 5.63 | 05/12/2041 | 30,000 | 30,677 | ||||||||||||
WR Berkley Corporation | 4.63 | 03/15/2022 | 56,000 | 56,630 | ||||||||||||
WR Berkley Corporation | 5.38 | 09/15/2020 | 15,000 | 16,167 | ||||||||||||
| 1,274,764 | ||||||||||||||||
|
| |||||||||||||||
| REITs: 0.96% | ||||||||||||||||
Boston Properties LP | 3.70 | 11/15/2018 | 55,000 | 57,502 | ||||||||||||
Boston Properties LP | 3.85 | 02/01/2023 | 160,000 | 161,640 | ||||||||||||
DDR Corporation | 4.63 | 07/15/2022 | 70,000 | 69,140 | ||||||||||||
HCP Incorporated | 3.75 | 02/01/2019 | 150,000 | 149,823 | ||||||||||||
HCP Incorporated | 5.65 | 12/15/2013 | 150,000 | 158,437 | ||||||||||||
Health Care REIT Incorporated | 6.50 | 03/15/2041 | 35,000 | 37,438 | ||||||||||||
Kilroy Realty LP | 4.80 | 07/15/2018 | 65,000 | 68,350 | ||||||||||||
Kilroy Realty LP | 5.00 | 11/03/2015 | 40,000 | 42,581 | ||||||||||||
Ventas Realty LP | 4.00 | 04/30/2019 | 75,000 | 76,952 | ||||||||||||
WEA Finance LLC 144A | 4.63 | 05/10/2021 | 40,000 | 42,304 | ||||||||||||
| 864,167 | ||||||||||||||||
|
| |||||||||||||||
Health Care: 1.47% | ||||||||||||||||
| Biotechnology: 0.33% | ||||||||||||||||
Amgen Incorporated | 5.38 | 05/15/2043 | 70,000 | 75,828 | ||||||||||||
Gilead Sciences Incorporated | 4.50 | 04/01/2021 | 85,000 | 94,527 | ||||||||||||
The accompanying notes are an integral part of these financial statements.
Table of Contents
| Portfolio of Investments—June 30, 2012 (Unaudited) | Wells Fargo Advantage VT Total Return Bond Fund | 15 |
| Security Name | Interest Rate | Maturity Date | Principal | Value | ||||||||||||
| Biotechnology (continued) | ||||||||||||||||
Gilead Sciences Incorporated | 5.65 | % | 12/01/2041 | $ | 110,000 | $ | 128,399 | |||||||||
| 298,754 | ||||||||||||||||
|
| |||||||||||||||
| Health Care Equipment & Supplies: 0.18% | ||||||||||||||||
Boston Scientific Corporation | 6.40 | 06/15/2016 | 140,000 | 161,290 | ||||||||||||
|
| |||||||||||||||
| Health Care Providers & Services: 0.87% | ||||||||||||||||
Aristotle Holding Incorporated 144A | 2.65 | 02/15/2017 | 225,000 | 229,007 | ||||||||||||
Coventry Health Care Incorporated | 5.95 | 03/15/2017 | 180,000 | 204,254 | ||||||||||||
Express Scripts Holding Company 144A | 2.10 | 02/12/2015 | 200,000 | 201,981 | ||||||||||||
Wellpoint Incorporated | 3.13 | 05/15/2022 | 95,000 | 95,842 | ||||||||||||
Wellpoint Incorporated | 4.63 | 05/15/2042 | 45,000 | 46,458 | ||||||||||||
| 777,542 | ||||||||||||||||
|
| |||||||||||||||
| Life Sciences Tools & Services: 0.09% | ||||||||||||||||
Life Technologies Corporation | 5.00 | 01/15/2021 | 75,000 | 83,407 | ||||||||||||
|
| |||||||||||||||
Industrials: 0.53% | ||||||||||||||||
| Aerospace & Defense: 0.25% | ||||||||||||||||
United Technologies Corporation | 1.20 | 06/01/2015 | 50,000 | 50,589 | ||||||||||||
United Technologies Corporation | 1.80 | 06/01/2017 | 95,000 | 97,063 | ||||||||||||
United Technologies Corporation | 4.50 | 06/01/2042 | 70,000 | 77,006 | ||||||||||||
| 224,658 | ||||||||||||||||
|
| |||||||||||||||
| Commercial Services & Supplies: 0.28% | ||||||||||||||||
ADT Corporation 144A | 2.25 | 07/15/2017 | 79,000 | 79,408 | ||||||||||||
ADT Corporation 144A | 3.50 | 07/15/2022 | 106,000 | 106,445 | ||||||||||||
ADT Corporation 144A | 4.88 | 07/15/2042 | 70,000 | 68,667 | ||||||||||||
| 254,520 | ||||||||||||||||
|
| |||||||||||||||
Information Technology: 0.07% | ||||||||||||||||
| Computers & Peripherals: 0.07% | ||||||||||||||||
Hewlett Packard Company | 2.60 | 09/15/2017 | 60,000 | 60,257 | ||||||||||||
|
| |||||||||||||||
Materials: 0.13% | ||||||||||||||||
| Chemicals: 0.13% | ||||||||||||||||
Dow Chemical Company | 5.25 | 11/15/2041 | 70,000 | 77,489 | ||||||||||||
Dow Chemical Company | 8.55 | 05/15/2019 | 29,000 | 38,593 | ||||||||||||
| 116,082 | ||||||||||||||||
|
| |||||||||||||||
Telecommunication Services: 0.87% | ||||||||||||||||
| Diversified Telecommunication Services: 0.52% | ||||||||||||||||
AT&T Incorporated | 0.88 | 02/13/2015 | 215,000 | 214,867 | ||||||||||||
AT&T Incorporated | 1.60 | 02/15/2017 | 140,000 | 140,241 | ||||||||||||
AT&T Incorporated | 6.40 | 05/15/2038 | 50,000 | 63,011 | ||||||||||||
CenturyLink Incorporated | 7.65 | 03/15/2042 | 50,000 | 48,578 | ||||||||||||
| 466,697 | ||||||||||||||||
|
| |||||||||||||||
The accompanying notes are an integral part of these financial statements.
Table of Contents
| 16 | Wells Fargo Advantage VT Total Return Bond Fund | Portfolio of Investments—June 30, 2012 (Unaudited) |
| Security Name | Interest Rate | Maturity Date | Principal | Value | ||||||||||||
| Wireless Telecommunication Services: 0.35% | ||||||||||||||||
American Tower Corporation | 4.50 | % | 01/15/2018 | $ | 145,000 | $ | 153,342 | |||||||||
American Tower Corporation | 5.05 | 09/01/2020 | 43,000 | 45,196 | ||||||||||||
Verizon Wireless Capital LLC | 8.50 | 11/15/2018 | 85,000 | 116,373 | ||||||||||||
| 314,911 | ||||||||||||||||
|
| |||||||||||||||
Utilities: 1.31% | ||||||||||||||||
| Electric Utilities: 0.95% | ||||||||||||||||
Ameren Corporation | 8.88 | 05/15/2014 | 110,000 | 122,538 | ||||||||||||
Arizona Public Service Company | 4.50 | 04/01/2042 | 100,000 | 103,357 | ||||||||||||
Cleveland Electric Illuminating Company | 8.88 | 11/15/2018 | 115,000 | 153,767 | ||||||||||||
Duke Energy Indiana Incorporated | 4.20 | 03/15/2042 | 95,000 | 98,314 | ||||||||||||
Progress Energy Incorporated | 3.15 | 04/01/2022 | 85,000 | 85,851 | ||||||||||||
Progress Energy Incorporated | 4.10 | 05/15/2042 | 80,000 | 83,558 | ||||||||||||
Southern California Edison Company | 4.05 | 03/15/2042 | 50,000 | 52,230 | ||||||||||||
Southwestern Electric Power Company | 3.55 | 02/15/2022 | 150,000 | 153,063 | ||||||||||||
| 852,678 | ||||||||||||||||
|
| |||||||||||||||
| Multi-Utilities: 0.36% | ||||||||||||||||
CMS Energy Corporation | 2.75 | 05/15/2014 | 65,000 | 65,341 | ||||||||||||
CMS Energy Corporation | 5.05 | 03/15/2022 | 70,000 | 72,661 | ||||||||||||
Dominion Resources Incorporated | 8.88 | 01/15/2019 | 115,000 | 156,414 | ||||||||||||
San Diego Gas & Electric Company | 4.30 | 04/01/2042 | 25,000 | 27,945 | ||||||||||||
| 322,361 | ||||||||||||||||
|
| |||||||||||||||
Total Corporate Bonds and Notes (Cost $14,579,103) | 15,066,858 | |||||||||||||||
|
| |||||||||||||||
Municipal Obligations: 1.10% | ||||||||||||||||
| California: 0.36% | ||||||||||||||||
California Build America Bonds (Miscellaneous Revenue) | 7.60 | 11/01/2040 | 80,000 | 103,278 | ||||||||||||
Los Angeles CA Community College District Build America Bonds | 6.75 | 08/01/2049 | 95,000 | 128,922 | ||||||||||||
Los Angeles CA DW&P Build America Bonds (Utilities Revenue) § | 6.57 | 07/01/2045 | 60,000 | 86,294 | ||||||||||||
| 318,494 | ||||||||||||||||
|
| |||||||||||||||
| Illinois: 0.20% | ||||||||||||||||
Illinois Finance Authority (Tax Revenue) | 5.37 | 03/01/2017 | 60,000 | 66,121 | ||||||||||||
Illinois Finance Authority (Tax Revenue) | 5.67 | 03/01/2018 | 55,000 | 60,911 | ||||||||||||
Illinois Finance Authority (Tax Revenue) | 5.88 | 03/01/2019 | 50,000 | 55,622 | ||||||||||||
| 182,654 | ||||||||||||||||
|
| |||||||||||||||
| Nevada: 0.15% | ||||||||||||||||
Clark County NV Airport Authority (Airport Revenue) § | 6.82 | 07/01/2045 | 95,000 | 131,039 | ||||||||||||
|
| |||||||||||||||
| New Jersey: 0.19% | ||||||||||||||||
New Jersey State Turnpike Authority (Transportation Revenue) § | 7.10 | 01/01/2041 | 120,000 | 169,376 | ||||||||||||
|
| |||||||||||||||
| Ohio: 0.04% | ||||||||||||||||
Ohio State University Taxable Series A (Education Revenue) § | 4.80 | 06/01/2111 | 35,000 | 37,968 | ||||||||||||
|
| |||||||||||||||
The accompanying notes are an integral part of these financial statements.
Table of Contents
| Portfolio of Investments—June 30, 2012 (Unaudited) | Wells Fargo Advantage VT Total Return Bond Fund | 17 |
| Security Name | Interest Rate | Maturity Date | Principal | Value | ||||||||||||
| Texas: 0.16% | ||||||||||||||||
North Texas Tollway Authority (Transportation Revenue) § | 6.72 | % | 01/01/2049 | $ | 108,000 | $ | 144,683 | |||||||||
|
| |||||||||||||||
Total Municipal Obligations (Cost $791,753) | 984,214 | |||||||||||||||
|
| |||||||||||||||
| Non-Agency Mortgage Backed Securities: 6.11% | ||||||||||||||||
Bank of America Commercial Mortgage Incorporated Series 2002-PB2 Class B | 6.31 | 06/11/2035 | 51,870 | 51,838 | ||||||||||||
Bank of America Commercial Mortgage Incorporated Series 2004-6 Class A3 | 4.51 | 12/10/2042 | 18,915 | 19,085 | ||||||||||||
Bank of America Commercial Mortgage Incorporated Series 2006-5 Class A4 | 5.41 | 09/10/2047 | 189,000 | 209,188 | ||||||||||||
Bank of America Commercial Mortgage Incorporated Series 2007-1 Class A2 | 5.38 | 01/15/2049 | 14,296 | 14,288 | ||||||||||||
Bear Stearns Commercial Mortgage Securities Incorporated Series 2003-T12 Class A3 ± | 4.24 | 08/13/2039 | 6,009 | 6,021 | ||||||||||||
Bear Stearns Commercial Mortgage Securities Incorporated Series 2005-PWR7 Class A | 4.95 | 02/11/2041 | 26,322 | 26,378 | ||||||||||||
CFCRE Commercial Mortgage Trust Series 2011-C2 Class A4 | 3.83 | 12/15/2047 | 86,000 | 90,493 | ||||||||||||
Citigroup Mortgage Loan Trust Incorporated Series 2007-AHL1 Class A2A ± | 0.29 | 12/25/2036 | 5,755 | 5,671 | ||||||||||||
Citigroup/Deutsche Bank Commercial Mortgage Series 2005-CD1 Class AM ± | 5.39 | 07/15/2044 | 87,000 | 93,952 | ||||||||||||
Commercial Mortgage Pass-Through Certificate Series 2001-J2 Class B 144A | 6.30 | 07/16/2034 | 151,000 | 151,477 | ||||||||||||
Commercial Mortgage Pass-Through Certificate Series 2012 LC4 Class A4 | 3.29 | 12/10/2044 | 169,000 | 171,128 | ||||||||||||
Commercial Mortgage Pass-Through Certificate Series 2012-CR1 Class A3 | 3.39 | 05/15/2045 | 140,000 | 142,468 | ||||||||||||
Credit Suisse First Boston Mortgage Securities Corporation Series 2003-C4 Class B ± | 5.25 | 08/15/2036 | 74,000 | 75,953 | ||||||||||||
Credit Suisse First Boston Mortgage Securities Corporation Series 2005-C1 Class A3 | 4.81 | 02/15/2038 | 44,558 | 45,680 | ||||||||||||
Credit Suisse First Boston Mortgage Securities Corporation Series 2005-C2 Class A4 | 4.83 | 04/15/2037 | 146,000 | 154,734 | ||||||||||||
Credit Suisse First Boston Mortgage Securities Corporation Series 2005-C3 Class A | 4.73 | 07/15/2037 | 70,000 | 73,887 | ||||||||||||
Credit Suisse First Boston Mortgage Securities Corporation Series 2006-C4 Class A3 | 5.47 | 09/15/2039 | 117,000 | 129,557 | ||||||||||||
Credit Suisse Mortgage Capital Certificates Series 2006-C5 Class A3 | 5.31 | 12/15/2039 | 75,000 | 83,231 | ||||||||||||
GE Capital Commercial Mortgage Corporation Series 2005-C3 Class A7A | 4.97 | 07/10/2045 | 94,000 | 103,363 | ||||||||||||
GMAC Commercial Mortgage Securities Incorporated Series 2006-C1 | 5.29 | 11/10/2045 | 88,000 | 89,539 | ||||||||||||
Greenwich Capital Commercial Funding Corporation Series 2002-C1 Class A4 | 4.95 | 01/11/2035 | 59,900 | 60,270 | ||||||||||||
Greenwich Capital Commercial Funding Corporation Series 2005-GG5 | 5.22 | 04/10/2037 | 249,000 | 272,123 | ||||||||||||
Greenwich Capital Commercial Funding Corporation Series 2006-GG7 | 6.07 | 07/10/2038 | 62,000 | 70,677 | ||||||||||||
Greenwich Capital Commercial Funding Corporation Series 2007-GG11 | 5.74 | 12/10/2049 | 98,000 | 108,642 | ||||||||||||
Greenwich Capital Commercial Funding Corporation Series 2007-GG9 Class A4 | 5.44 | 03/10/2039 | 44,000 | 48,823 | ||||||||||||
Impact Funding LLC Series 2010-1 Class A1 144A | 5.31 | 01/25/2051 | 272,202 | 297,474 | ||||||||||||
JPMorgan Chase Commercial Mortgage Securities Corporation Series 2001-CIBC2 Class D ± | 6.85 | 04/15/2035 | 59,000 | 60,107 | ||||||||||||
JPMorgan Chase Commercial Mortgage Securities Corporation Series 2002-C2 Class B ± | 5.21 | 12/12/2034 | 30,000 | 30,246 | ||||||||||||
JPMorgan Chase Commercial Mortgage Securities Corporation Series 2002-C2 Class A2 | 5.05 | 12/12/2034 | 48,945 | 49,249 | ||||||||||||
JPMorgan Chase Commercial Mortgage Securities Corporation Series 2003-CB6 Class A1 | 4.39 | 07/12/2037 | 9,042 | 9,090 | ||||||||||||
JPMorgan Chase Commercial Mortgage Securities Corporation Series 2004-LN2 Class A2 | 5.12 | 07/15/2041 | 186,000 | 197,422 | ||||||||||||
The accompanying notes are an integral part of these financial statements.
Table of Contents
| 18 | Wells Fargo Advantage VT Total Return Bond Fund | Portfolio of Investments—June 30, 2012 (Unaudited) |
| Security Name | Interest Rate | Maturity Date | Principal | Value | ||||||||||||
| Non-Agency Mortgage Backed Securities (continued) | ||||||||||||||||
JPMorgan Chase Commercial Mortgage Securities Corporation Series 2006-LDP9 Class A2 | 5.13 | % | 05/15/2047 | $ | 34,045 | $ | 35,605 | |||||||||
JPMorgan Chase Commercial Mortgage Securities Corporation Series 2007-CB18 Class A4 | 5.44 | 06/12/2047 | 49,000 | 55,313 | ||||||||||||
JPMorgan Chase Commercial Mortgage Securities Corporation Series 2007-LD11 Class A4 ± | 6.01 | 06/15/2049 | 351,000 | 385,450 | ||||||||||||
JPMorgan Chase Commercial Mortgage Securities Corporation Series 2007-LD12 Class A4 ± | 5.88 | 02/15/2051 | 84,000 | 95,473 | ||||||||||||
JPMorgan Chase Commercial Mortgage Securities Corporation | 3.85 | 06/15/2043 | 327,708 | 348,239 | ||||||||||||
JPMorgan Chase Commercial Mortgage Securities Corporation | 3.30 | 08/05/2032 | 86,571 | 92,018 | ||||||||||||
JPMorgan Chase Commercial Mortgage Securities Corporation Series 2012-CBX Class A4 | 3.48 | 06/15/2045 | 117,000 | 119,563 | ||||||||||||
JPMorgan Chase Commercial Mortgage Securities Corporation Series 2012-CBX Class A3 | 3.14 | 06/15/2045 | 93,000 | 95,325 | ||||||||||||
Lehman Brothers UBS Commercial Mortgage Trust Series 2004-C7 Class A5 | 4.63 | 10/15/2029 | 44,742 | 45,731 | ||||||||||||
Lehman Brothers UBS Commercial Mortgage Trust Series 2007-C3 Class A3 ± | 6.10 | 07/15/2044 | 53,000 | 56,112 | ||||||||||||
Lehman Brothers UBS Commercial Mortgage Trust Series 2007-C7 Class A3 ± | 5.87 | 09/15/2045 | 207,000 | 237,367 | ||||||||||||
Merrill Lynch Mortgage Trust Series 2005-CIP1 Class A3A ± | 4.95 | 07/12/2038 | 76,000 | 79,427 | ||||||||||||
Morgan Stanley Capital I Series 2007-IQ Class A4 | 5.81 | 12/12/2049 | 49,000 | 56,699 | ||||||||||||
Morgan Stanley Capital I Series 2012-C4 Class A4 | 3.24 | 03/15/2045 | 141,000 | 142,594 | ||||||||||||
Morgan Stanley Dean Witter Capital I Series 2001-TOP3 Class A4 | 6.39 | 07/15/2033 | 3,656 | 3,654 | ||||||||||||
Morgan Stanley Dean Witter Capital I Series 2004-TP13 Class A3 | 4.39 | 09/13/2045 | 21,032 | 21,263 | ||||||||||||
Morgan Stanley Dean Witter Capital I Series 2007-HE2 Class A2A ± | 0.29 | 01/25/2037 | 387 | 386 | ||||||||||||
Morgan Stanley Dean Witter Capital I Series 2007-HQ13 Class A1 | 5.36 | 12/15/2044 | 6,569 | 6,560 | ||||||||||||
Morgan Stanley Mortgage Loan Trust Series 2007-6XS Class 2A1S ± | 0.36 | 02/25/2047 | 13,266 | 10,829 | ||||||||||||
Nomura Asset Securities Corporation Series 1998-D6 Class A2 ± | 7.33 | 03/15/2030 | 128,000 | 130,690 | ||||||||||||
Sequoia Mortgage Trust Series 2010-H1 Class A1 ± | 3.75 | 02/25/2040 | 18,790 | 19,080 | ||||||||||||
Sequoia Mortgage Trust Series 2011-1 Class A1 ± | 4.13 | 02/25/2041 | 26,803 | 27,375 | ||||||||||||
UBS Barclays Commercial Mortgage Trust Series 2012-C2 Class A4 | 3.53 | 05/10/2063 | 93,000 | 94,854 | ||||||||||||
UBS Commercial Mortgage Trust Series 2005-C3 Class A | 4.79 | 07/15/2040 | 148,000 | 157,393 | ||||||||||||
UBS Commercial Mortgage Trust Series 2012-C1 Class A3 | 3.40 | 05/10/2045 | 117,000 | 119,166 | ||||||||||||
Wachovia Bank Commercial Mortgage Trust Series 2003-C7 Class A1 144A | 4.24 | 10/15/2035 | 9,695 | 9,764 | ||||||||||||
Wachovia Bank Commercial Mortgage Trust Series 2003-C8 Class A3 | 4.45 | 11/15/2035 | 93,461 | 94,183 | ||||||||||||
Total Non-Agency Mortgage Backed Securities (Cost $5,370,437) | 5,482,167 | |||||||||||||||
|
| |||||||||||||||
| U.S. Treasury Securities: 23.99% | ||||||||||||||||
U.S. Treasury Bond | 3.00 | 05/15/2042 | 378,000 | 396,782 | ||||||||||||
U.S. Treasury Bond | 3.13 | 11/15/2041 | 1,082,000 | 1,165,179 | ||||||||||||
U.S. Treasury Bond | 3.13 | 02/15/2042 | 543,000 | 584,319 | ||||||||||||
U.S. Treasury Bond | 4.38 | 05/15/2041 | 72,000 | 96,311 | ||||||||||||
U.S. Treasury Bond | 4.50 | 02/15/2036 | 655,000 | 880,975 | ||||||||||||
U.S. Treasury Note | 0.25 | 05/31/2014 | 613,000 | 612,282 | ||||||||||||
U.S. Treasury Note « | 0.38 | 04/15/2015 | 2,153,000 | 2,151,822 | ||||||||||||
U.S. Treasury Note | 0.38 | 06/15/2015 | 1,994,000 | 1,992,598 | ||||||||||||
U.S. Treasury Note | 0.63 | 05/31/2017 | 419,000 | 417,265 | ||||||||||||
U.S. Treasury Note | 0.63 | 06/30/2017 | 1,380,000 | 1,382,048 | ||||||||||||
U.S. Treasury Note | 0.88 | 12/31/2016 | 1,172,000 | 1,182,988 | ||||||||||||
U.S. Treasury Note | 1.50 | 06/30/2016 | 339,000 | 351,289 | ||||||||||||
U.S. Treasury Note | 1.75 | 07/31/2015 | 610,000 | 634,257 | ||||||||||||
The accompanying notes are an integral part of these financial statements.
Table of Contents
| Portfolio of Investments—June 30, 2012 (Unaudited) | Wells Fargo Advantage VT Total Return Bond Fund | 19 |
| Security Name | Interest Rate | Maturity Date | Principal | Value | ||||||||||||
| U.S. Treasury Securities (continued) | ||||||||||||||||
U.S. Treasury Note | 1.75 | % | 05/15/2022 | $ | 1,119,000 | $ | 1,129,140 | |||||||||
U.S. Treasury Note | 1.88 | 10/31/2017 | 655,000 | 691,383 | ||||||||||||
U.S. Treasury Note | 2.00 | 11/15/2021 | 911,000 | 945,234 | ||||||||||||
U.S. Treasury Note | 2.00 | 02/15/2022 | 169,000 | 174,823 | ||||||||||||
U.S. Treasury Note | 2.38 | 02/28/2015 | 1,405,000 | 1,478,763 | ||||||||||||
U.S. Treasury Note | 2.63 | 08/15/2020 | 1,467,000 | 1,615,648 | ||||||||||||
U.S. Treasury Note | 3.00 | 09/30/2016 | 1,958,000 | 2,152,729 | ||||||||||||
U.S. Treasury Note | 3.38 | 07/31/2013 | 1,457,000 | 1,505,776 | ||||||||||||
Total U.S. Treasury Securities (Cost $21,161,856) | 21,541,611 | |||||||||||||||
|
| |||||||||||||||
Yankee Corporate Bonds and Notes: 5.68% | ||||||||||||||||
Consumer Discretionary: 0.14% | ||||||||||||||||
| Textiles, Apparel & Luxury Goods: 0.14% | ||||||||||||||||
LVMH Moet Hennessy Louis 144A | 1.63 | 06/29/2017 | 130,000 | 130,025 | ||||||||||||
|
| |||||||||||||||
Consumer Staples: 0.57% | ||||||||||||||||
| Beverages: 0.38% | ||||||||||||||||
Pernod Ricard SA 144A | 5.50 | 01/15/2042 | 155,000 | 158,942 | ||||||||||||
Pernod Ricard SA 144A | 5.75 | 04/07/2021 | 160,000 | 180,753 | ||||||||||||
| 339,695 | ||||||||||||||||
|
| |||||||||||||||
| Tobacco: 0.19% | ||||||||||||||||
BAT International Finance plc 144A | 2.13 | 06/07/2017 | 170,000 | 169,855 | ||||||||||||
|
| |||||||||||||||
Energy: 1.67% | ||||||||||||||||
| Oil, Gas & Consumable Fuels: 1.67% | ||||||||||||||||
BP Capital Markets plc | 1.85 | 05/05/2017 | 185,000 | 186,926 | ||||||||||||
Canadian Oil Sands Trust Limited 144A | 6.00 | 04/01/2042 | 150,000 | 159,349 | ||||||||||||
Husky Energy Incorporated | 7.25 | 12/15/2019 | 37,000 | 45,695 | ||||||||||||
Petrobras International Finance Company | 2.88 | 02/06/2015 | 95,000 | 96,437 | ||||||||||||
Petrobras International Finance Company | 3.50 | 02/06/2017 | 235,000 | 241,315 | ||||||||||||
Petroleos Mexicanos Company | 1.95 | 12/20/2022 | 162,000 | 162,087 | ||||||||||||
Petroleos Mexicanos Company 144A | 6.50 | 06/02/2041 | 20,000 | 23,350 | ||||||||||||
Talisman Energy Incorporated | 7.75 | 06/01/2019 | 75,000 | 92,074 | ||||||||||||
Total Capital International SA | 1.55 | 06/28/2017 | 280,000 | 280,790 | ||||||||||||
Transocean Incorporated | 6.38 | 12/15/2021 | 140,000 | 160,244 | ||||||||||||
Transocean Incorporated | 7.35 | 12/15/2041 | 45,000 | 54,511 | ||||||||||||
| 1,502,778 | ||||||||||||||||
|
| |||||||||||||||
Financials: 2.29% | ||||||||||||||||
| Commercial Banks: 2.02% | ||||||||||||||||
Commonwealth Bank of Australia (New York) | 1.95 | 03/16/2015 | 280,000 | 281,842 | ||||||||||||
Experian Finance plc 144A | 2.38 | 06/15/2017 | 200,000 | 200,317 | ||||||||||||
HSBC Holdings plc | 4.00 | 03/30/2022 | 105,000 | 109,120 | ||||||||||||
HSBC Holdings plc | 6.80 | 06/01/2038 | 100,000 | 114,672 | ||||||||||||
Lloyds TSB Bank plc | 4.20 | 03/28/2017 | 80,000 | 82,556 | ||||||||||||
Lloyds TSB Bank plc | 6.38 | 01/21/2021 | 50,000 | 56,702 | ||||||||||||
The accompanying notes are an integral part of these financial statements.
Table of Contents
| 20 | Wells Fargo Advantage VT Total Return Bond Fund | Portfolio of Investments—June 30, 2012 (Unaudited) |
| Security Name | Interest Rate | Maturity Date | Principal | Value | ||||||||||||
| Commercial Banks (continued) | ||||||||||||||||
NIBC Bank NV 144A | 2.80 | % | 12/02/2014 | $ | 125,000 | $ | 129,703 | |||||||||
Nordea Bank AB 144A | 2.25 | 03/20/2015 | 200,000 | 200,748 | ||||||||||||
Rabobank Nederland NV | 3.88 | 02/08/2022 | 95,000 | 96,714 | ||||||||||||
Standard Chartered plc 144A | 3.20 | 05/12/2016 | 190,000 | 194,289 | ||||||||||||
Svenska Handelsbanken AB | 2.88 | 04/04/2017 | 250,000 | 253,545 | ||||||||||||
Swedish Export Credit Corporation | 1.75 | 05/30/2017 | 95,000 | 95,624 | ||||||||||||
| 1,815,832 | ||||||||||||||||
|
| |||||||||||||||
| Thrifts & Mortgage Finance: 0.27% | ||||||||||||||||
Achmea Hypotheekbank NV 144A | 3.20 | 11/03/2014 | 235,000 | 245,163 | ||||||||||||
|
| |||||||||||||||
Health Care: 0.20% | ||||||||||||||||
| Pharmaceuticals: 0.20% | ||||||||||||||||
Glaxosmithkline Capital plc | 1.50 | 05/08/2017 | 175,000 | 175,398 | ||||||||||||
|
| |||||||||||||||
Materials: 0.32% | ||||||||||||||||
| Metals & Mining: 0.32% | ||||||||||||||||
Barrick Gold Corporation | 3.85 | 04/01/2022 | 120,000 | 124,340 | ||||||||||||
Teck Resources Limited | 6.25 | 07/15/2041 | 57,000 | 63,897 | ||||||||||||
Vale Overseas Limited | 4.38 | 01/11/2022 | 97,000 | 98,854 | ||||||||||||
| 287,091 | ||||||||||||||||
|
| |||||||||||||||
Telecommunication Services: 0.35% | ||||||||||||||||
| Diversified Telecommunication Services: 0.24% | ||||||||||||||||
Deutsche Telekom International 144A | 2.25 | 03/06/2017 | 215,000 | 212,539 | ||||||||||||
|
| |||||||||||||||
| Wireless Telecommunication Services: 0.11% | ||||||||||||||||
Telefonica Moviles Chile SA 144A | 2.88 | 11/09/2015 | 100,000 | 100,525 | ||||||||||||
|
| |||||||||||||||
Utilities: 0.14% | ||||||||||||||||
| Electric Utilities: 0.14% | ||||||||||||||||
PPL WEM Holdings plc 144A | 3.90 | 05/01/2016 | 120,000 | 125,812 | ||||||||||||
|
| |||||||||||||||
Total Yankee Corporate Bonds and Notes (Cost $4,999,290) | 5,104,713 | |||||||||||||||
|
| |||||||||||||||
| Yankee Government Bonds: 1.24% | ||||||||||||||||
Province of Manitoba | 1.75 | 05/30/2019 | 95,000 | 95,536 | ||||||||||||
Province of Ontario | 0.95 | 05/26/2015 | 375,000 | 376,721 | ||||||||||||
Province of Ontario | 2.45 | 06/29/2022 | 140,000 | 138,307 | ||||||||||||
Slovak Republic 144A | 4.38 | 05/21/2022 | 375,000 | 369,375 | ||||||||||||
United Mexican States § | 5.75 | 10/12/2110 | 117,000 | 133,088 | ||||||||||||
Total Yankee Government Bonds (Cost $1,104,453) | 1,113,027 | |||||||||||||||
|
| |||||||||||||||
| Other: 0.07% | ||||||||||||||||
Gryphon Funding Limited, Pass-Through Entity (a)(i)(v) | 222,408 | 60,050 | ||||||||||||||
|
| |||||||||||||||
Total Other (Cost $27,531) | 60,050 | |||||||||||||||
|
| |||||||||||||||
The accompanying notes are an integral part of these financial statements.
Table of Contents
| Portfolio of Investments—June 30, 2012 (Unaudited) | Wells Fargo Advantage VT Total Return Bond Fund | 21 |
| Security Name | Yield | Shares | Value | |||||||||||
Short-Term Investments: 5.73% | ||||||||||||||
| Investment Companies: 5.73% | ||||||||||||||
Wells Fargo Advantage Cash Investment Money Market Fund, Select Class (l)(u) | 0.15 | % | 3,126,250 | $ | 3,126,250 | |||||||||
Wells Fargo Securities Lending Cash Investments, LLC (v)(l)(u)(r) | 0.19 | 2,017,469 | 2,017,469 | |||||||||||
Total Short-Term Investments (Cost $5,143,719) | 5,143,719 | |||||||||||||
|
| |||||||||||||
| Total Investments in Securities | ||||||||
| (Cost $96,459,410) * | 109.75 | % | 98,546,443 | |||||
Other Assets and Liabilities, Net | (9.75 | ) | (8,756,228 | ) | ||||
|
|
|
| |||||
| Total Net Assets | 100.00 | % | $ | 89,790,215 | ||||
|
|
|
|
| %% | Security issued on a when-issued basis |
| (a) | Security is fair valued by the Management Valuation Team, and in certain instances by the Board of Trustees, in accordance with procedures approved by the Board of Trustees. |
| ± | Variable rate investment |
| 144A | Security that may be resold to “qualified institutional buyers” under Rule 144A or security offered pursuant to Section 4(2) of the Securities Act of 1933, as amended. |
| § | These securities are subject to a demand feature which reduces the effective maturity. |
| « | All or a portion of this security is on loan. |
| (i) | Illiquid security |
| (v) | Security represents investment of cash collateral received from securities on loan. |
| (l) | Investment in an affiliate |
| (u) | Rate shown is the 7-day annualized yield at period end. |
| (r) | The investment company is exempt from registration under Section 3(c)(7) of the 1940 Act. |
| * | Cost for federal income tax purposes is $96,685,875 and net unrealized appreciation (depreciation) consists of: |
Gross unrealized appreciation | $ | 1,931,256 | ||
Gross unrealized depreciation | (70,688 | ) | ||
|
| |||
Net unrealized appreciation | $ | 1,860,568 |
The accompanying notes are an integral part of these financial statements.
Table of Contents
| 22 | Wells Fargo Advantage VT Total Return Bond Fund | Statement of Assets and Liabilities—June 30, 2012 (Unaudited) |
Assets | ||||
Investments | ||||
In unaffiliated securities (including securities on loan), at value | $ | 93,402,724 | ||
In affiliated securities, at value | 5,143,719 | |||
|
| |||
Total investments, at value (see cost below) | 98,546,443 | |||
Receivable for investments sold | 12,482,965 | |||
Principal paydown receivable | 24,648 | |||
Receivable for Fund shares sold | 7,701 | |||
Receivable for interest | 462,460 | |||
Receivable for securities lending income | 2,117 | |||
Prepaid expenses and other assets | 103 | |||
|
| |||
Total assets | 111,526,437 | |||
|
| |||
Liabilities | ||||
Payable for investments purchased | 19,488,800 | |||
Payable for Fund shares redeemed | 81,062 | |||
Payable upon receipt of securities loaned | 2,045,000 | |||
Advisory fee payable | 28,555 | |||
Distribution fees payable | 19,193 | |||
Due to other related parties | 9,979 | |||
Accrued expenses and other liabilities | 63,633 | |||
|
| |||
Total liabilities | 21,736,222 | |||
|
| |||
Total net assets | $ | 89,790,215 | ||
|
| |||
NET ASSETS CONSIST OF | ||||
Paid-in capital | $ | 89,558,006 | ||
Undistributed net investment income | 17,433 | |||
Accumulated net realized losses on investments | (1,872,257 | ) | ||
Net unrealized gains on investments | 2,087,033 | |||
|
| |||
Total net assets | $ | 89,790,215 | ||
|
| |||
COMPUTATION OF NET ASSET VALUE PER SHARE1 | ||||
Net assets – Class 2 | $ | 89,790,215 | ||
Shares outstanding – Class 2 | 8,321,088 | |||
Net asset value per share – Class 2 | $10.79 | |||
Investments in unaffiliated securities, at cost | $ | 91,315,691 | ||
|
| |||
Investments in affiliated securities, at cost | $ | 5,143,719 | ||
|
| |||
Total investments, at cost | $ | 96,459,410 | ||
|
| |||
Securities on loan, at value | $ | 2,000,443 | ||
|
| |||
| 1. | The Fund has an unlimited number of authorized shares. |
The accompanying notes are an integral part of these financial statements.
Table of Contents
| Statement of Operation—Six Months Ended June 30, 2012 (Unaudited) | Wells Fargo Advantage VT Total Return Bond Fund | 23 |
Investment income | ||||
Interest* | $ | 1,049,700 | ||
Income from affiliated securities | 2,575 | |||
Securities lending income, net | 1,766 | |||
|
| |||
Total investment income | 1,054,041 | |||
|
| |||
Expenses | ||||
Advisory fee | 177,130 | |||
Administration fees | ||||
Fund level | 22,141 | |||
Class 2 | 35,426 | |||
Distribution fees | ||||
Class 2 | 110,706 | |||
Custody and accounting fees | 17,152 | |||
Professional fees | 23,552 | |||
Shareholder report expenses | 18,918 | |||
Trustees’ fees and expenses | 5,962 | |||
Other fees and expenses | 2,757 | |||
|
| |||
Total expenses | 413,744 | |||
Less: Fee waivers and/or expense reimbursements | (15,202 | ) | ||
|
| |||
Net expenses | 398,542 | |||
|
| |||
Net investment income | 655,499 | |||
|
| |||
REALIZED AND UNREALIZED GAINS (LOSSES) ON INVESTMENTS | ||||
Net realized gains (losses) on: | ||||
Unaffiliated securities | 2,159,113 | |||
TBA sale commitments | (18,902 | ) | ||
|
| |||
Net realized gains on investments | 2,140,211 | |||
|
| |||
Net change in unrealized gains (losses) on: | ||||
Unaffiliated securities | 37,000 | |||
TBA sale commitments | 24,051 | |||
|
| |||
Net change in unrealized gains (losses) on investments | 61,051 | |||
|
| |||
Net realized and unrealized gains (losses) on investments | 2,201,262 | |||
|
| |||
Net increase in net assets resulting from operations | $ | 2,856,761 | ||
|
| |||
* Net of foreign interest withholding taxes of | $161 | |||
The accompanying notes are an integral part of these financial statements.
Table of Contents
| 24 | Wells Fargo Advantage VT Total Return Bond Fund | Statements of Changes in Net Assets |
| Six Months Ended June 30, 2012 (Unaudited) | Year Ended December 31, 2011 | |||||||||||||||
Operations | ||||||||||||||||
Net investment income | $ | 655,499 | $ | 1,753,279 | ||||||||||||
Net realized gains on investments | 2,140,211 | 3,765,571 | ||||||||||||||
Net change in unrealized gains (losses) on investments | 61,051 | 1,107,927 | ||||||||||||||
|
|
|
|
|
|
|
| |||||||||
Net increase in net assets resulting from operations | 2,856,761 | 6,626,777 | ||||||||||||||
|
|
|
|
|
|
|
| |||||||||
Distributions to shareholders from | ||||||||||||||||
Net investment income – Class 2 | (705,844 | ) | (2,244,747 | ) | ||||||||||||
Net realized gains – Class 2 | 0 | (3,319,231 | ) | |||||||||||||
|
|
|
|
|
|
|
| |||||||||
Total distributions to shareholders | (705,844 | ) | (5,563,978 | ) | ||||||||||||
|
|
|
|
|
|
|
| |||||||||
Capital share transactions | Shares | Shares | ||||||||||||||
Proceeds from shares sold – Class 2 | 872,062 | 9,284,880 | 1,837,013 | 19,239,066 | ||||||||||||
Reinvestment of distributions – Class 2 | 67,031 | 705,844 | 538,528 | 5,563,978 | ||||||||||||
Payment for shares redeemed – Class 2 | (888,622 | ) | (9,489,204 | ) | (2,306,909 | ) | (24,143,648 | ) | ||||||||
|
|
|
|
|
|
|
| |||||||||
Net increase in net assets resulting from capital share transactions | 501,520 | 659,396 | ||||||||||||||
|
|
|
|
|
|
|
| |||||||||
Total increase in net assets | 2,652,437 | 1,722,195 | ||||||||||||||
|
|
|
|
|
|
|
| |||||||||
Net assets | ||||||||||||||||
Beginning of period | 87,137,778 | 85,415,583 | ||||||||||||||
|
|
|
|
|
|
|
| |||||||||
End of period | $ | 89,790,215 | $ | 87,137,778 | ||||||||||||
|
|
|
|
|
|
|
| |||||||||
Undistributed net investment income | $ | 17,433 | $ | 67,778 | ||||||||||||
|
|
|
|
|
|
|
| |||||||||
The accompanying notes are an integral part of these financial statements.
Table of Contents
| Financial Highlights | Wells Fargo Advantage VT Total Return Bond Fund | 25 |
(For a share outstanding throughout each period)
Six Months Ended (Unaudited) | Year Ended December 31, | |||||||||||||||||||||||
| Class 21 | 2011 | 2010 | 2009 | 2008 | 2007 | |||||||||||||||||||
Net asset value, beginning of period | $ | 10.54 | $ | 10.41 | $ | 10.34 | $ | 9.70 | $ | 9.94 | $ | 9.81 | ||||||||||||
Net investment income | 0.08 | 0.22 | 0.29 | 0.42 | 0.44 | 0.45 | ||||||||||||||||||
Net realized and unrealized gains (losses) on investments | 0.25 | 0.62 | 0.43 | 0.72 | (0.21 | ) | 0.13 | |||||||||||||||||
|
|
|
|
|
|
|
|
|
|
|
| |||||||||||||
Total from investment operations | 0.33 | 0.84 | 0.72 | 1.14 | 0.23 | 0.58 | ||||||||||||||||||
Distributions to shareholders from | ||||||||||||||||||||||||
Net investment income | (0.08 | ) | (0.28 | ) | (0.36 | ) | (0.46 | ) | (0.47 | ) | (0.45 | ) | ||||||||||||
Net realized gains | 0.00 | (0.43 | ) | (0.29 | ) | (0.04 | ) | 0.00 | 0.00 | |||||||||||||||
|
|
|
|
|
|
|
|
|
|
|
| |||||||||||||
Total distributions to shareholders | (0.08 | ) | (0.71 | ) | (0.65 | ) | (0.50 | ) | (0.47 | ) | (0.45 | ) | ||||||||||||
Net asset value, end of period | $ | 10.79 | $ | 10.54 | $ | 10.41 | $ | 10.34 | $ | 9.70 | $ | 9.94 | ||||||||||||
Total return2 | 3.19 | % | 8.31 | % | 7.04 | % | 11.99 | % | 2.39 | % | 6.08 | % | ||||||||||||
Ratios to average net assets (annualized) | ||||||||||||||||||||||||
Gross expenses | 0.93 | % | 0.91 | % | 0.91 | % | 1.20 | % | 1.19 | % | 0.94 | % | ||||||||||||
Net expenses | 0.90 | % | 0.88 | % | 0.86 | % | 0.85 | % | 0.90 | % | 0.90 | % | ||||||||||||
Net investment income | 1.48 | % | 2.09 | % | 2.76 | % | 4.07 | % | 4.55 | % | 4.58 | % | ||||||||||||
Supplemental data | ||||||||||||||||||||||||
Portfolio turnover rate | 346 | % | 843 | % | 838 | % | 580 | % | 692 | % | 580 | % | ||||||||||||
Net assets, end of period (000’s omitted) | $89,790 | $87,138 | $85,416 | $95,134 | $93,610 | $129,098 | ||||||||||||||||||
| 1. | After the close of business of July 16, 2010, existing shares of the Fund were renamed Class 2 shares. |
| 2. | Returns for period of less than one year are not annualized. |
The accompanying notes are an integral part of these financial statements.
Table of Contents
| 26 | Wells Fargo Advantage VT Total Return Bond Fund | Notes to Financial Statements (Unaudited) |
1. ORGANIZATION
Wells Fargo Variable Trust (the “Trust”), a Delaware statutory trust organized on March 10, 1999, is an open-end management investment company registered under the Investment Company Act of 1940, as amended (the “1940 Act”). These financial statements report on Wells Fargo Advantage VT Total Return Bond Fund (the “Fund”) which is a diversified series of the Trust.
2. SIGNIFICANT ACCOUNTING POLICIES
The following significant accounting policies, which are consistently followed in the preparation of the financial statements of the Fund, are in conformity with U.S. generally accepted accounting principles which require management to make estimates and assumptions that affect the reported amounts of assets and liabilities, disclosure of contingent assets and liabilities at the date of the financial statements, and the reported amounts of revenues and expenses during the reporting period. Actual results could differ from those estimates.
Securities valuation
Fixed income securities with original maturities exceeding 60 days are valued based on evaluated prices received from an independent pricing service approved by the Board of Trustees which may utilize both transaction data and market information such as yield, prices of securities of comparable quality, coupon rate, maturity, type of issue, trading characteristics and other market data. If valuations are not available from the pricing service or values received are deemed not representative of market value, values will be obtained from a third party broker-dealer or determined based on the Fund’s Valuation Procedures.
Debt securities of sufficient credit quality with original maturities of 60 days or less generally are valued at amortized cost which approximates fair value. The amortized cost method involves valuing a security at its cost, plus accretion of discount or minus amortization of premium over the period until maturity.
Investments in open-end mutual funds and non-registered investment companies are fair valued at net asset value.
Investments which are not valued using any of the methods discussed above, are valued at their fair value, as determined by procedures established in good faith and approved by the Board of Trustees. The Board of Trustees has established a Valuation Committee comprised of the Trustees and has delegated to it the authority to take any actions regarding the valuation of portfolio securities that the Valuation Committee deems necessary in determining the fair value of portfolio securities, unless the responsibility has been delegated to the Management Valuation Team of Wells Fargo Funds Management, LLC (“Funds Management”). The Board of Trustees retains the authority to make or ratify any valuation decisions or approve any changes to the Valuation Procedures as it deems appropriate. On a quarterly basis, the Board of Trustees considers for ratification any valuation actions taken by the Valuation Committee or the Management Valuation Team.
Valuations of fair valued securities are compared to the next actual sales price when available, or other appropriate market information to assess the continued appropriateness of the fair valuation methodology used. These securities are fair valued on a day-to-day basis, taking into consideration changes to appropriate market information and any significant changes to the input factors considered in the valuation process until there is a readily available price provided on the exchange or by an independent pricing service. Valuations received from an independent pricing service or broker quotes are periodically validated by comparisons to most recent trades and valuations provided by other independent pricing services in addition to the review of prices by the adviser and/or sub-adviser. Unobservable inputs used in determining fair valuations are identified based on the type of security, taking into consideration factors utilized by market participants in valuing the investment, knowledge about the issuer and the current market environment.
Security loans
The Fund may lend its securities from time to time in order to earn additional income in the form of fees or interest on securities received as collateral or the investment of any cash received as collateral. The Fund continues to receive interest or dividends on the securities loaned. The Fund receives collateral in the form of cash or securities with a value at least equal to the value of the securities on loan. The value of the loaned securities is determined at the close of each business day and any additional required collateral is delivered to the Fund on the next business day. In a securities lending transaction, the net asset value of the Fund will be affected by an increase or decrease in the value of the securities loaned and by an increase or decrease in the value of the instrument in which collateral is invested. The amount
Table of Contents
| Notes to Financial Statements (Unaudited) | Wells Fargo Advantage VT Total Return Bond Fund | 27 |
of securities lending activity undertaken by the Fund fluctuates from time to time. In the event of default or bankruptcy by the borrower, the Fund may be prevented from recovering the loaned securities or gaining access to the collateral or may experience delays or costs in doing so. In addition, the investment of any cash collateral received may lose all or part of its value. The Fund has the right under the lending agreement to recover the securities from the borrower on demand.
The Fund lends its securities through an unaffiliated securities lending agent. Cash collateral received in connection with its securities lending transactions is invested in Wells Fargo Securities Lending Cash Investments, LLC (the “Cash Collateral Fund”). The Cash Collateral Fund is exempt from registration under Section 3(c)(7) of the 1940 Act and is managed by Funds Management and is sub-advised by Wells Capital Management Incorporated (“Wells Capital Management”). Funds Management receives an advisory fee starting at 0.05% and declining to 0.01% as the average daily net assets of the Cash Collateral Fund increase. All of the fees received by Funds Management are paid to Wells Capital Management for its services as sub-adviser. The Cash Collateral Fund seeks to provide a positive return compared to the daily Fed Funds Open rate by investing in high-quality, U.S. dollar-denominated short-term money market instruments. Cash Collateral Fund investments are fair valued based upon the amortized cost valuation technique. Income earned from investment in the Cash Collateral Fund is included in securities lending income on the Statement of Operations.
When-issued transactions
The Fund may purchase securities on a forward commitment or ‘when-issued’ basis. The Fund records a when-issued transaction on the trade date and will segregate assets in an amount at least equal in value to the Fund’s commitment to purchase when-issued securities. Securities purchased on a when-issued basis are marked-to-market daily and the Fund begins earning interest on the settlement date. Losses may arise due to changes in the market value of the underlying securities or if the counterparty does not perform under the contract.
TBA sale commitments
The Fund may enter into To Be Announced (“TBA”) sale commitments to hedge its portfolio positions or to sell mortgage-backed securities it owns under delayed delivery arrangements. Proceeds of TBA sale commitments are not received until the contractual settlement date. During the time a TBA sale commitment is outstanding, equivalent deliverable securities, or an offsetting TBA purchase commitment deliverable on or before the sale commitment date, are held as “cover” for the transaction. Unsettled TBA sale commitments are valued at the current market value of the underlying securities, generally according to the procedures described under “Securities valuation”. The contract is marked-to-market daily and the change in market value is recorded by the Fund as an unrealized gain or loss. If the TBA sale commitment is closed through the acquisition of an offsetting purchase commitment, the Fund realizes a gain or loss. If the Fund delivers securities under the commitment, the Fund realizes a gain or a loss from the sale of the securities based upon the unit price established at the date the commitment was entered into.
Mortgage dollar roll transactions
The Fund may engage in mortgage dollar roll transactions with respect to mortgage-backed securities issued by Government National Mortgage Association (GNMA), Federal National Mortgage Association (FNMA) and Federal Home Loan Mortgage Corporation (FHLMC). In a mortgage dollar roll transaction, the Fund sells a mortgage-backed security to a financial institution, such as a bank or broker-dealer and simultaneously agrees to repurchase a substantially similar security from the institution at a later date at an agreed upon price. The mortgage-backed securities that are repurchased will bear the same interest rate as those sold, but generally will be collateralized by different pools of mortgages with different pre-payment histories. During the roll period, the Fund foregoes principal and interest paid on the securities. The Fund is compensated by the difference between the current sales price and the forward price for the future purchase as well as by the earnings on the cash proceeds of the initial sale. Mortgage dollar rolls may be renewed without physical delivery of the securities subject to the contract. The Fund accounts for TBA dollar roll transactions as purchases and sales.
Security transactions and income recognition
Securities transactions are recorded on a trade date basis. Realized gains or losses are reported on the basis of identified cost of securities delivered.
Interest income is accrued daily and bond discounts are accreted and premiums are amortized daily based on the effective interest method. To the extent debt obligations are placed on non-accrual status, any related interest income may be reduced by writing off interest receivables when the collection of all or a portion of interest has become doubtful
Table of Contents
| 28 | Wells Fargo Advantage VT Total Return Bond Fund | Notes to Financial Statements (Unaudited) |
based on consistently applied procedures. If the issuer subsequently resumes interest payments or when the collectability of interest is reasonably assured, the debt obligation is removed from non-accrual status.
Income from foreign securities is recorded net of foreign taxes withheld where recovery of such taxes is not assured.
Distributions to shareholders
Distributions to shareholders from net investment income and net realized gains, if any, are recorded on the ex-dividend date. Such distributions are determined in conformity with income tax regulations, which may differ from generally accepted accounting principles.
Federal and other taxes
The Fund intends to continue to qualify as a regulated investment company by distributing substantially all of its investment company taxable income and any net realized capital gains (after reduction for capital loss carryforwards) sufficient to relieve it from all, or substantially all, federal income taxes. Accordingly, no provision for federal income taxes was required.
The Fund’s income and federal excise tax returns and all financial records supporting those returns for the prior three fiscal years are subject to examination by the federal and Delaware revenue authorities. Management has analyzed the Fund’s tax positions taken on federal, state, and foreign tax returns for all open tax years and does not believe that there are any uncertain tax positions that require recognition of a tax liability.
Under the recently enacted Regulated Investment Company Modernization Act of 2010, the Fund is permitted to carry forward capital losses incurred in taxable years which began after December 22, 2010 for an unlimited period. However, any losses incurred are required to be utilized prior to the losses incurred in pre-enactment taxable years. As a result of this ordering rule, pre-enactment capital loss carryforwards may be more likely to expire unused. Post-enactment capital losses that are carried forward will retain their character as either short-term or long-term capital losses rather than be considered all short-term as under previous law. In addition, the Fund may elect to defer any portion of a post-October capital loss or qualified late-year ordinary loss to the first day of the following taxable year. A post-October capital loss is the greatest of the net capital loss, net short-term capital loss or net long-term capital loss for the portion of the taxable year after October 31. A qualified late-year ordinary loss is the net loss comprised of (a) net gain or loss from the sale or other disposition of certain capital assets for the portion of the taxable year after October 31, and (b) other ordinary income or loss for the portion of the taxable year after December 31.
As of December 31, 2011, the Fund had net capital loss carryforwards, which were available to offset future net realized capital gains, in the amount of $5,408,193 with $713,327 expiring in 2015 and $4,694,866 expiring in 2016.
3. FAIR VALUATION MEASUREMENTS
Fair value measurements of investments are determined within a framework that has established a fair value hierarchy based upon the various data inputs utilized in determining the value of the Fund’s investments. The three-level hierarchy gives the highest priority to unadjusted quoted prices in active markets for identical assets or liabilities (Level 1) and the lowest priority to significant unobservable inputs (Level 3). The Fund’s investments are classified within the fair value hierarchy based on the lowest level of input that is significant to the fair value measurement. The inputs are summarized into three broad levels as follows:
| n | Level 1 – quoted prices in active markets for identical securities |
| n | Level 2 – other significant observable inputs (including quoted prices for similar securities, interest rates, prepayment speeds, credit risk, etc.) |
| n | Level 3 – significant unobservable inputs (including the Fund’s own assumptions in determining the fair value of investments) |
The inputs or methodologies used for valuing securities are not necessarily an indication of the risk associated with investing in those securities.
Table of Contents
| Notes to Financial Statements (Unaudited) | Wells Fargo Advantage VT Total Return Bond Fund | 29 |
As of June 30, 2012, the inputs used in valuing the Fund’s assets, which are carried at fair value, were as follows:
| Investments in Securities | Quoted Prices (Level 1) | Significant Other Observable Inputs (Level 2) | Significant Unobservable Inputs | Total | ||||||||||||
Agency securities | $ | 0 | $ | 34,672,823 | $ | 0 | $ | 34,672,823 | ||||||||
Asset-backed securities | 0 | 9,377,261 | 0 | 9,377,261 | ||||||||||||
Corporate bonds and notes | 0 | 15,066,858 | 0 | 15,066,858 | ||||||||||||
Municipal obligations | 0 | 984,214 | 0 | 984,214 | ||||||||||||
Non-agency mortgage backed securities | 0 | 5,482,167 | 0 | 5,482,167 | ||||||||||||
U.S. Treasury securities | 21,541,611 | 0 | 0 | 21,541,611 | ||||||||||||
Yankee corporate bonds and notes | 0 | 5,104,713 | 0 | 5,104,713 | ||||||||||||
Yankee government bonds | 0 | 1,113,027 | 0 | 1,113,027 | ||||||||||||
Other | 0 | 0 | 60,050 | 60,050 | ||||||||||||
Short-term investments | ||||||||||||||||
Investment companies | 3,126,250 | 2,017,469 | 0 | 5,143,719 | ||||||||||||
| $ | 24,667,861 | $ | 73,818,532 | $ | 60,050 | $ | 98,546,443 | |||||||||
Further details on the major security types listed above can be found in the Portfolio of Investments.
Transfers in and transfers out are recognized at the end of the reporting period. For the six months ended June 30, 2012, the Fund did not have any transfers into/out of Level 1 and Level 2.
4. TRANSACTIONS WITH AFFILIATES AND OTHER EXPENSES
Advisory fee
The Trust has entered into an advisory contract with Funds Management, an indirect wholly owned subsidiary of Wells Fargo & Company (“Wells Fargo”). The adviser is responsible for implementing investment policies and guidelines and for supervising the sub-adviser, who is responsible for day-to-day portfolio management of the Fund.
Pursuant to the contract, Funds Management is entitled to receive an annual advisory fee starting at 0.40% and declining to 0.30% as the average daily net assets of the Fund increase. For the six months ended June 30, 2012, the advisory fee was equivalent to an annual rate of 0.40% of the Fund’s average daily net assets.
Funds Management has retained the services of a sub-adviser to provide daily portfolio management to the Fund. The fee for sub-advisory services is borne by Funds Management. Wells Capital Management Incorporated, an affiliate of Funds Management, is the sub-adviser to the Fund and is entitled to receive a fee from Funds Management at an annual rate starting at 0.20% and declining to 0.10% as the average daily net assets of the Fund increase.
Administration and transfer agent fees
The Trust has entered into an administration agreement with Funds Management. Under this agreement, for providing administrative services, which includes paying fees and expenses for services provided by the transfer agent, sub-transfer agents, omnibus account servicers and record-keepers, Funds Management is entitled to receive from the Fund an annual fund level administration fee starting at 0.05% and declining to 0.03% as the average daily net assets of the Fund increase and for Class 2 shares, a class level administration fee of 0.08% of its average daily net assets.
Funds Management has contractually waived and/or reimbursed advisory and administration fees to the extent necessary to maintain certain net operating expense ratios for the Fund. Waiver of fees and/or reimbursement of expenses by Funds Management were made first from fund level expenses on a proportionate basis and then from class specific expenses. Funds Management has committed through July 18, 2013 to waive fees and/or reimburse expenses to the extent necessary to cap the Fund’s expenses at 0.90% for Class 2.
Table of Contents
| 30 | Wells Fargo Advantage VT Total Return Bond Fund | Notes to Financial Statements (Unaudited) |
Distribution fees
The Trust has adopted a Distribution Plan for Class 2 shares of the Fund pursuant to Rule 12b-1 under the 1940 Act. Distribution fees are charged to Class 2 shares and paid to Wells Fargo Funds Distributor, LLC, the principal underwriter, at an annual rate of 0.25% of its average daily net assets.
5. INVESTMENT PORTFOLIO TRANSACTIONS
Purchases and sales of investments, excluding short-term securities, for the six months ended June 30, 2012 were as follows:
| Purchases at Cost | Sales Proceeds | |||||
| U.S. Government | Non-U.S. Government | U.S. Government | Non-U.S. Government | |||
| $280,458,674 | $51,250,667 | $284,079,549 | $45,185,344 | |||
6. BANK BORROWINGS
The Trust and Wells Fargo Funds Trust (excluding the money market funds) are parties to a $150,000,000 revolving credit agreement with State Street Bank and Trust Company, whereby the Fund is permitted to use bank borrowings for temporary or emergency purposes, such as to fund shareholder redemption requests. Interest under the credit agreement is charged to the Fund based on a borrowing rate equal to the higher of the Federal Funds rate in effect on that day plus 1.25% or the overnight LIBOR rate in effect on that day plus 1.25%. In addition, an annual commitment fee equal to 0.10% of the unused balance is allocated to each participating fund. For the six months ended June 30, 2012, the Fund paid $61 in commitment fees.
For the six months ended June 30, 2012, there were no borrowings by the Fund under the agreement.
7. INDEMNIFICATION
Under the Trust’s organizational documents, the officers and directors are indemnified against certain liabilities that may arise out of performance of their duties to the Trust. Additionally, in the normal course of business, the Trust may enter into contracts with service providers that contain a variety of indemnification clauses. The Trust’s maximum exposure under these arrangements is dependent on future claims that may be made against the Fund and, therefore, cannot be estimated.
8. NEW ACCOUNTING PRONOUNCEMENT
In December 2011, the Financial Accounting Standards Board (“FASB”) issued Accounting Standard Update (“ASU”) No. 2011-11, Disclosures about Offsetting Assets and Liabilities. ASU 2011-11, which amends FASB ASC Topic 210, Balance Sheet, creates new disclosure requirements which require entities to disclose both gross and net information for derivatives and other financial instruments that are either offset in the Statement of Assets and Liabilities or subject to an enforceable master netting arrangement or similar agreement. The disclosure requirements are effective for interim and annual reporting periods beginning on or after January 1, 2013. Management is currently assessing the potential impact, in addition to expanded financial statement disclosure, that may result from adopting this ASU.
9. SUBSEQUENT DISTRIBUTIONS
On July 12, 2012, the Fund declared distributions from short-term capital gains and long-term capital gains to shareholders of record on July 11, 2012. The per share amounts payable on July 13, 2012 were as follows:
| Short-term Capital Gains | Long-term Capital Gains | |||||||
Class 2 | $ | 0.08416 | $ | 0.11561 | ||||
These distributions are not reflected in the accompanying financial statements.
Table of Contents
| Other Information (Unaudited) | Wells Fargo Advantage VT Total Return Bond Fund | 31 |
PROXY VOTING INFORMATION
A description of the policies and procedures that the Fund uses to determine how to vote proxies relating to portfolio securities is available without charge, upon request, by calling 1-800-222-8222, visiting our Web site at wellsfargoadvantagefunds.com, or visiting the SEC Web site at sec.gov. Information regarding how the Fund voted proxies relating to portfolio securities during the most recent 12-month period ended June 30 is available without charge on the Fund’s Web site at wellsfargoadvantagefunds.com or by visiting the SEC Web site at sec.gov.
PORTFOLIO HOLDINGS INFORMATION
The complete portfolio holdings for the Fund are publicly available on the Fund’s Web site (wellsfargoadvantagefunds.com) on a monthly, 30-day or more delayed basis. In addition, top ten holdings information for the Fund is publicly available on the Fund’s Web site on a monthly, seven-day or more delayed basis. The Fund files its complete schedule of portfolio holdings with the SEC for the first and third quarters of each fiscal year on Form N-Q, which is available without charge by visiting the SEC Web site at sec.gov. In addition, the Fund’s Form N-Q may be reviewed and copied at the SEC’s Public Reference Room in Washington, DC, and at regional offices in New York City, at 233 Broadway, and in Chicago, at 175 West Jackson Boulevard, Suite 900. Information about the Public Reference Room may be obtained by calling 1-800-SEC-0330.
Table of Contents
| 32 | Wells Fargo Advantage VT Total Return Bond Fund | Other Information (Unaudited) |
BOARD OF TRUSTEES AND OFFICERS
Each of the Trustees and Officers listed in the table below acts in identical capacities for the Wells Fargo Advantage family of funds, which consists of 138 funds comprising the Wells Fargo Funds Trust, Wells Fargo Variable Trust, Wells Fargo Master Trust and four closed-end funds (collectively the “Fund Complex”). This table should be read in conjunction with the Prospectus and the Statement of Additional Information1. All of the Trustees are also Members of the Audit and Governance Committees of each Trust in the Fund Complex. The mailing address of each Trustee and Officer is 525 Market Street, 12th Floor, San Francisco, CA 94105. Each Trustee and Officer serves an indefinite term, however, each Trustee serves such term until reaching the mandatory retirement age established by the Trustees.
Independent Trustees
Name and Year of Birth | Position Held and Length of Service* | Principal Occupations During Past Five Years | Other Directorships During | |||
| Peter G. Gordon (Born 1942) | Trustee, since 1998; Chairman, since 2005 (Lead Trustee since 2001) | Co-Founder, Retired Chairman, President and CEO of Crystal Geyser Water Company. Trustee Emeritus, Colby College | Asset Allocation Trust | |||
| Isaiah Harris, Jr. (Born 1952) | Trustee, since 2009 | Retired. Prior thereto, President and CEO of BellSouth Advertising and Publishing Corp. from 2005 to 2007, President and CEO of BellSouth Enterprises from 2004 to 2005 and President of BellSouth Consumer Services from 2000 to 2003. Emeritus member of the Iowa State University Foundation Board of Governors. Emeritus Member of the Advisory Board of Iowa State University School of Business. Mr. Harris is a certified public accountant. | CIGNA Corporation; Deluxe Corporation; Asset Allocation Trust | |||
| Judith M. Johnson (Born 1949) | Trustee, since 2008 | Retired. Prior thereto, Chief Executive Officer and Chief Investment Officer of Minneapolis Employees Retirement Fund from 1996 to 2008. Ms. Johnson is an attorney, certified public accountant and a certified managerial accountant. | Asset Allocation Trust | |||
| Leroy Keith, Jr. (Born 1939) | Trustee, since 2010 | Chairman, Bloc Global Services (development and construction). Trustee of the Evergreen Funds from 1983 to 2010. Former Managing Director, Almanac Capital Management (commodities firm), former Partner, Stonington Partners, Inc. (private equity fund), former Director, Obagi Medical Products Co. and former Director, Lincoln Educational Services. | Trustee, Virtus Fund Complex (consisting of 40 portfolios as of 12/31/11); Asset Allocation Trust | |||
| David F. Larcker (Born 1950) | Trustee, since 2009 | James Irvin Miller Professor of Accounting at the Graduate School of Business, Stanford University, Director of Corporate Governance Research Program and Senior Faculty of The Rock Center for Corporate Governance since 2006. From 2005 to 2008, Professor of Accounting at the Graduate School of Business, Stanford University. Prior thereto, Ernst & Young Professor of Accounting at The Wharton School, University of Pennsylvania from 1985 to 2005. | Asset Allocation Trust | |||
| Olivia S. Mitchell (Born 1953) | Trustee, since 2006 | International Foundation of Employee Benefit Plans Professor, Wharton School of the University of Pennsylvania since 1993. Director of Wharton’s Pension Research Council and Boettner Center on Pensions & Retirement Research, and Research Associate at the National Bureau of Economic Research. Previously, Cornell University Professor from 1978 to 1993. | Asset Allocation Trust | |||
| Timothy J. Penny (Born 1951) | Trustee, since 1996 | President and CEO of Southern Minnesota Initiative Foundation, a non-profit organization, since 2007 and Senior Fellow at the Humphrey Institute Policy Forum at the University of Minnesota since 1995. Member of the Board of Trustees of NorthStar Education Finance, Inc., a non-profit organization, since 2007. | Asset Allocation Trust |
Table of Contents
| Other Information (Unaudited) | Wells Fargo Advantage VT Total Return Bond Fund | 33 |
Name and Year of Birth | Position Held and Length of Service* | Principal Occupations During Past Five Years | Other Directorships During | |||
| Michael S. Scofield (Born 1943) | Trustee, since 2010 | Served on the Investment Company Institute’s Board of Governors and Executive Committee from 2008-2011 as well the Governing Council of the Independent Directors Council from 2006-2011 and the Independent Directors Council Executive Committee from 2008-2011. Chairman of the IDC from 2008-2010. Institutional Investor (Fund Directions) Trustee of Year in 2007. Trustee of the Evergreen Funds (and its predecessors) from 1984 to 2010. Chairman of the Evergreen Funds from 2000-2010. Former Trustee of the Mentor Funds. Retired Attorney, Law Offices of Michael S. Scofield and former Director and Chairman, Branded Media Corporation (multi-media branding company). | Asset Allocation Trust | |||
| Donald C. Willeke (Born 1940) | Trustee, since 1996 | Principal of the law firm of Willeke & Daniels. General Counsel of the Minneapolis Employees Retirement Fund from 1984 until its consolidation into the Minnesota Public Employees Retirement Association on June 30, 2010. Director and Vice Chair of The Free Trust (non-profit corporation). Director of the American Chestnut Foundation (non-profit corporation). | Asset Allocation Trust |
| * | Length of service dates reflect the Trustee’s commencement of service with the Trust’s predecessor entities, where applicable. |
Officers
Name and Year of Birth | Position Held and Length of Service | Principal Occupations During Past Five Years | ||||
| Karla M. Rabusch (Born 1959) | President, since 2003 | Executive Vice President of Wells Fargo Bank, N.A. and President of Wells Fargo Funds Management, LLC since 2003. Senior Vice President and Chief Administrative Officer of Wells Fargo Funds Management, LLC from 2001 to 2003. | ||||
| C. David Messman (Born 1960) | Secretary, since 2000; Chief Legal Officer, since 2003 | Senior Vice President and Secretary of Wells Fargo Funds Management, LLC since 2001. Vice President and Managing Senior Counsel of Wells Fargo Bank, N.A. since 1996. | ||||
| Nancy Wiser (Born 1967) | Treasurer, since 2012 | Executive Vice President of Wells Fargo Funds Management, LLC since 2011. Chief Operating Officer and Chief Compliance Officer at LightBox Capital Management LLC, from 2008 to 2011. Owned and operated a consulting business providing services to various hedge funds including acting as Chief Operating Officer and Chief Compliance Officer for a hedge fund from 2007 to 2008. Chief Operating Officer and Chief Compliance Officer of GMN Capital LLC from 2006 to 2007. | ||||
| David Berardi (Born 1975) | Assistant Treasurer, since 2009 | Vice President of Wells Fargo Funds Management, LLC since 2009. Vice President of Evergreen Investment Management Company, LLC from 2008 to 2010. Assistant Vice President of Evergreen Investment Services, Inc. from 2004 to 2008. Manager of Fund Reporting and Control for Evergreen Investment Management Company, LLC from 2004 to 2010. | ||||
| Jeremy DePalma (Born 1974) | Assistant Treasurer, since 2009 | Senior Vice President of Wells Fargo Funds Management, LLC since 2009. Senior Vice President of Evergreen Investment Management Company, LLC from 2008 to 2010. Vice President, Evergreen Investment Services, Inc. from 2004 to 2007. Head of the Fund Reporting and Control Team within Fund Administration from 2005 to 2010. | ||||
| Debra Ann Early (Born 1964) | Chief Compliance Officer, since 2007 | Chief Compliance Officer of Wells Fargo Funds Management, LLC since 2007. Chief Compliance Officer of Parnassus Investments from 2005 to 2007. Chief Financial Officer of Parnassus Investments from 2004 to 2007 and Senior Audit Manager of PricewaterhouseCoopers LLP from 1998 to 2004. |
| 1. | The Statement of Additional Information includes additional information about the Trustees and is available, without charge, upon request, by calling 1-800-222-8222 or by visiting the Web site at wellsfargoadvantagefunds.com. |
Table of Contents
| 34 | Wells Fargo Advantage VT Total Return Bond Fund | Other Information (Unaudited) |
BOARD CONSIDERATION OF INVESTMENT ADVISORY AND SUB-ADVISORY AGREEMENTS:
Under Section 15 of the Investment Company Act of 1940 (the “1940 Act”), the Board of Trustees (the “Board”) of Wells Fargo Funds Trust (the “Trust”), all the members of which have no direct or indirect interest in the investment advisory and sub-advisory agreements and are not “interested persons” of the Trust, as defined in the 1940 Act (the “Independent Trustees”), must determine whether to approve the continuation of the Trust’s investment advisory and sub-advisory agreements. In this regard, at an in person meeting held on March 29-30, 2012 (the “Meeting”), the Board reviewed and re-approved: (i) an investment advisory agreement with Wells Fargo Funds Management, LLC (“Funds Management”) for Wells Fargo Advantage VT Total Return Bond Fund (the “Fund”) and (ii) an investment sub-advisory agreement with Wells Capital Management Incorporated (“Wells Capital Management”) for the Fund. The investment advisory agreement with Funds Management and the investment sub-advisory agreement with Wells Capital Management are collectively referred to as the “Advisory Agreements.”
At the Meeting, the Board considered the factors and reached the conclusions described below relating to the selection of Funds Management and Wells Capital Management and the continuation of the Advisory Agreements. Prior to the Meeting, the Trustees conferred extensively among themselves and with representatives of Funds Management about these matters. The Board also met throughout the year and received information that was useful to them in considering the continuation of the Advisory Agreements. The Independent Trustees were assisted in their evaluation of the Advisory Agreements by independent legal counsel, from whom they received separate legal advice and with whom they met separately from Funds Management.
In providing information to the Board, Funds Management and Wells Capital Management were guided by a detailed set of requests submitted by the Independent Trustees’ independent legal counsel on their behalf at the start of the Board’s annual contract renewal process earlier in 2012. In approving the Advisory Agreements, the Board did not identify any particular information or consideration that was all-important or controlling, and each Trustee likely attributed different weights to various factors.
Nature, extent and quality of services
The Board received and considered various information regarding the nature, extent and quality of services provided to the Fund by Funds Management and Wells Capital Management under the Advisory Agreements. The Board also received and considered, among other things, information about the background and experience of senior management of Funds Management, and the qualifications, backgrounds, tenures and responsibilities of the portfolio managers primarily responsible for the day-to-day portfolio management of the Fund.
The Board evaluated the ability of Funds Management and Wells Capital Management, based on their respective financial condition, resources, reputation and other attributes, to attract and retain qualified investment professionals, including research, advisory, and supervisory personnel. The Board further considered the compliance programs and compliance records of Funds Management and Wells Capital Management. In addition, the Board took into account the administrative services provided to the Fund by Funds Management and its affiliates.
The Board’s decision to approve the continuation of the Advisory Agreements was based on a comprehensive evaluation of information provided to it. In considering these matters, the Board considered not only the specific information presented in connection with the Meeting, but also the knowledge gained over time through interaction with Funds Management and Wells Capital Management about various topics, including Funds Management’s oversight of service providers. The above factors, together with those referenced below, are some of the most important, but not necessarily all, factors considered by the Board in concluding that the nature, extent and quality of the investment advisory services provided to the Fund by Funds Management and Wells Capital Management supported the re-approval of the Advisory Agreements. Although the Board considered the continuation of the Advisory Agreements for the Fund as part of the larger process of considering the continuation of the advisory agreements for all of the funds in the complex, its decision to continue the Advisory Agreements for the Fund was ultimately made on a fund-by-fund basis.
Fund performance and expenses
The Board considered the performance results for the Fund over various time periods ended December 31, 2011. The Board also considered these results in comparison to the median performance of a universe of relevant funds (the “Universe”) that was determined by Lipper Inc. (“Lipper”) to be similar to the Fund, and in comparison to the Fund’s
Table of Contents
| Other Information (Unaudited) | Wells Fargo Advantage VT Total Return Bond Fund | 35 |
benchmark index and to other comparative data. Lipper is an independent provider of investment company data. The Board received a description of the methodology used by Lipper to select the mutual funds in the Universe. The Board noted that the performance of the Fund was higher than the median performance of the Universe for all periods under review. The Board also noted that the performance of the Fund was higher than or equal to its benchmark, the Lipper VUF Intermediate Investment Grade Funds Index, for the periods under review.
The Board received and considered information regarding the Fund’s contractual advisory fee and net operating expense ratios and their various components, including actual management fees (which reflect fee waivers, if any), transfer agent, custodian and other non-management fees, Rule 12b-1 and non-Rule 12b-1 fees, service fees and fee waiver and expense reimbursement arrangements. The Board also considered these ratios in comparison to the median ratios of an expense Universe and a narrower expense group of mutual funds (each, an “Expense Group”) that was determined by Lipper to be similar to the Fund. The Board received a description of the methodology used by Lipper to select the mutual funds in the Fund’s Expense Group. The Board noted that the net operating expense ratio of the Fund was in range of the Fund’s Expense Group’s median net operating expense ratio.
Based on the above-referenced considerations and other factors, the Board concluded that the overall performance and expense structure of the Fund supported the re-approval of the Advisory Agreements for the Fund.
Investment advisory and sub-advisory fee rates
The Board reviewed and considered the contractual investment advisory fee rate that is payable by the Fund to Funds Management for investment advisory services (the “Advisory Agreement Rate”), both on a stand-alone basis and on a combined basis with the Fund’s administration fee rate. The Board took into account the separate administrative and other services covered by the administration fee rate. The Board also reviewed and considered the contractual investment sub-advisory fee rate that is payable by Funds Management to Wells Capital Management for investment sub-advisory services (the “Sub-Advisory Agreement Rate”). In addition, the Board reviewed and considered the existing fee waiver/cap arrangements applicable to the Advisory Agreement Rate and considered the Advisory Agreement Rate after taking the waivers/caps into account (the “Net Advisory Rate”).
The Board received and considered information comparing the Advisory Agreement Rate and Net Advisory Rate, combined with the administration fee rates, with those of other funds in the Fund’s Expense Group median. The Board noted that the Advisory Agreement Rate and Net Advisory Rate for the Fund were in range of the median rates for the Fund’s Expense Group.
The Board also received and considered information about the nature and extent of services offered and fee rates charged by Funds Management and Wells Capital Management to other types of clients. In this regard, the Board received information about differences between the services, and the compliance, reporting, and other legal burdens and risks of providing investment advice to mutual funds and those associated with providing advice to non-mutual fund clients such as collective funds or institutional separate accounts.
The Board determined that the Advisory Agreement Rate for the Fund, both with and without the administration fee rate and before and after waivers, was reasonable in light of the Fund’s Expense Group information, the net expense ratio commitments, the services covered by the Advisory Agreements and other information provided. The Board also reviewed and considered the Sub-Advisory Agreement Rate and concluded that the Sub-Advisory Agreement Rate was reasonable in light of the services covered by the Sub-Advisory Agreement and other information provided.
Profitability
The Board received and considered a profitability analysis of Funds Management, as well as an analysis of the profitability to the collective Wells Fargo businesses that provide services to the Fund. It considered that the information provided to it was necessarily estimated, and that the profitability information provided to it, especially on a fund-by-fund basis, did not necessarily provide a precise tool for evaluating the appropriateness of the Fund’s Advisory Agreement Rate in isolation. It noted that the levels of profitability reported on a fund-by-fund basis varied widely, depending on, among other things, the size and type of fund. The Board concluded that the profitability reported by Funds Management was not unreasonable.
The Board did not consider separate profitability information with respect to Wells Capital Management, because, as an affiliate of Funds Management, its profitability information was subsumed in the collective Wells Fargo profitability analysis provided by Funds Management.
Table of Contents
| 36 | Wells Fargo Advantage VT Total Return Bond Fund | Other Information (Unaudited) |
Economies of scale
With respect to possible economies of scale, the Board reviewed the breakpoints in the Fund’s advisory fee and/or administration fee structure, which operate generally to reduce the expenses of the Fund (as a percentage of Fund assets) as the Fund grows in size. It considered that, as a fund shrinks in size, breakpoints conversely result in increasing fee levels. The Board noted that it would have on-going opportunities to review the appropriate levels of breakpoints in the future, and concluded that the breakpoints as implemented appeared to be a reasonable step toward sharing economies of scale, if any, with the Fund. However, the Board acknowledged the inherent limitations of any analysis of economies of scale and of any attempt to correlate breakpoints with such economies, stemming largely from the Board’s understanding that economies of scale are realized, if at all, across a variety of products and services, not just with respect to a single fund.
Other benefits to Funds Management and Wells Capital Management
The Board received and considered information regarding potential “fall-out” or ancillary benefits received by Funds Management and its affiliates, including Wells Capital Management, as a result of their relationship with the Fund. Ancillary benefits could include, among others, benefits directly attributable to the relationship of Funds Management and Wells Capital Management with the Fund and benefits potentially derived from an increase in Funds Management’s and Wells Capital Management’s business as a result of their relationship with the Fund (such as the ability to market to shareholders other financial products offered by Funds Management and its affiliates, including Wells Capital Management).
The Board considered that Wells Fargo Funds Distributor, LLC, an affiliate of Funds Management, serves as distributor to the Fund and receives certain compensation for those services. The Board noted that various financial institutions, including affiliates of Funds Management, may receive distribution-related fees, shareholder servicing payments (including amounts derived from payments under Rule 12b-1 plans) and sub-transfer agency fees in respect of shares sold or held through them and services provided.
The Board also reviewed information about whether and to what extent soft dollar credits are sought and how any such credits are utilized and any benefits that may be realized by using an affiliated broker.
Other factors and broader review
The Board also considered the markets for distribution of the Fund’s shares, including the channels through which the Fund’s shares are offered and sold. The Board noted that the Fund is part of one of the few fund families that have both direct-to-fund and intermediary distribution channels. As discussed above, the Board reviews detailed materials received from Funds Management and Wells Capital Management annually as part of the re-approval process under Section 15 of the 1940 Act and also reviews and assesses information about the quality of the services that the Fund receives throughout the year. In this regard, the Board has reviewed reports of Funds Management at each of its quarterly meetings, which include, among other things, portfolio reviews and performance reports. In addition, the Board confers with portfolio managers at various times throughout the year.
Conclusion
After considering the above-described factors and based on its deliberations and its evaluation of the information described above, the Board unanimously approved the continuation of the Advisory Agreements for an additional one-year period.
Table of Contents
| List of Abbreviations | Wells Fargo Advantage VT Total Return Bond Fund | 37 |
The following is a list of common abbreviations for terms and entities which may have appeared in this report.
| ACB | — Agricultural Credit Bank |
| ADR | — American Depository Receipt |
| ADS | — American Depository Shares |
| AGC-ICC | — Assured Guaranty Corporation - Insured Custody Certificates |
| AGM | — Assured Guaranty Municipal |
| AMBAC | — American Municipal Bond Assurance Corporation |
| AMT | — Alternative Minimum Tax |
| AUD | — Australian Dollar |
| BAN | — Bond Anticipation Notes |
| BHAC | — Berkshire Hathaway Assurance Corporation |
| BRL | — Brazil Real |
| CAB | — Capital Appreciation Bond |
| CAD | — Canadian Dollar |
| CCAB | — Convertible Capital Appreciation Bond |
| CDA | — Community Development Authority |
| CDO | — Collateralized Debt Obligation |
| CHF | — Swiss Franc |
| COP | — Certificate of Participation |
| CR | — Custody Receipts |
| DKK | — Danish Krone |
| DRIVER | — Derivative Inverse Tax-Exempt Receipts |
| DW&P | — Department of Water & Power |
| DWR | — Department of Water Resources |
| ECFA | — Educational & Cultural Facilities Authority |
| EDA | — Economic Development Authority |
| EDFA | — Economic Development Finance Authority |
| ETF | — Exchange-Traded Fund |
| EUR | — Euro |
| FFCB | — Federal Farm Credit Bank |
| FGIC | — Financial Guaranty Insurance Corporation |
| FGLMC | — Federal Government Loan Mortgage Company |
| FHA | — Federal Housing Authority |
| FHLB | — Federal Home Loan Bank |
| FHLMC | — Federal Home Loan Mortgage Corporation |
| FICO | — The Financing Corporation |
| FNMA | — Federal National Mortgage Association |
| FSA | — Farm Service Agency |
| GBP | — Great British Pound |
| GDR | — Global Depository Receipt |
| GNMA | — Government National Mortgage Association |
| GO | — General Obligation |
| HCFR | — Healthcare Facilities Revenue |
| HEFA | — Health & Educational Facilities Authority |
| HEFAR | — Higher Education Facilities Authority Revenue |
| HFA | — Housing Finance Authority |
| HFFA | — Health Facilities Financing Authority |
| HKD | — Hong Kong Dollar |
| HUF | — Hungarian Forint |
| IBC | — Insured Bond Certificate |
| IDA | — Industrial Development Authority |
| IDAG | — Industrial Development Agency |
| IDR | — Industrial Development Revenue |
| IEP | — Irish Pound |
| JPY | — Japanese Yen |
| KRW | — Republic of Korea Won |
| LIBOR | — London Interbank Offered Rate |
| LIQ | — Liquidity Agreement |
| LLC | — Limited Liability Company |
| LLP | — Limited Liability Partnership |
| LOC | — Letter of Credit |
| LP | — Limited Partnership |
| MBIA | — Municipal Bond Insurance Association |
| MFHR | — Multi-Family Housing Revenue |
| MSTR | — Municipal Securities Trust Receipts |
| MTN | — Medium Term Note |
| MUD | — Municipal Utility District |
| MXN | — Mexican Peso |
| MYR | — Malaysian Ringgit |
| NATL-RE | — National Public Finance Guarantee Corporation |
| NOK | — Norwegian Krone |
| NZD | — New Zealand Dollar |
| PCFA | — Pollution Control Finance Authority |
| PCR | — Pollution Control Revenue |
| PFA | — Public Finance Authority |
| PFFA | — Public Facilities Financing Authority |
| PFOTER | — Puttable Floating Option Tax-Exempt Receipts |
| plc | — Public Limited Company |
| PLN | — Polish Zloty |
| PUTTER | — Puttable Tax-Exempt Receipts |
| R&D | — Research & Development |
| RDA | — Redevelopment Authority |
| RDFA | — Redevelopment Finance Authority |
| REIT | — Real Estate Investment Trust |
| ROC | — Reset Option Certificates |
| SAVRS | — Select Auction Variable Rate Securities |
| SBA | — Small Business Authority |
| SEK | — Swedish Krona |
| SFHR | — Single Family Housing Revenue |
| SFMR | — Single Family Mortgage Revenue |
| SGD | — Singapore Dollar |
| SKK | — Slovakian Koruna |
| SPA | — Standby Purchase Agreement |
| SPDR | — Standard & Poor’s Depositary Receipts |
| STRIPS | — Separate Trading of Registered Interest and Principal Securities |
| TAN | — Tax Anticipation Notes |
| TBA | — To Be Announced |
| TIPS | — Treasury Inflation-Protected Securities |
| TRAN | — Tax Revenue Anticipation Notes |
| TCR | — Transferable Custody Receipts |
| TRY | — Turkish Lira |
| TTFA | — Transportation Trust Fund Authority |
| TVA | — Tennessee Valley Authority |
| XLCA | — XL Capital Assurance |
| ZAR | — South African Rand |
Table of Contents
This page is intentionally left blank.
Table of Contents


FOR MORE INFORMATION
More information about Wells Fargo Advantage Funds is available free upon request. To obtain literature, please write, e-mail, visit the Fund’s Web site, or call:
Wells Fargo Advantage Funds
P.O. Box 8266
Boston, MA 02266-8266
E-mail: wfaf@wellsfargo.com
Web site: wellsfargoadvantagefunds.com
Individual investors: 1-800-222-8222
Retail investment professionals: 1-888-877-9275
Institutional investment professionals: 1-866-765-0778
This report and the financial statements contained herein are submitted for the general information of the shareholders of Wells Fargo Advantage Funds. If this report is used for promotional purposes, distribution of the report must be accompanied or preceded by a current prospectus. For a current prospectus and, if available. a summary prospectus containing more complete information, including charges and expenses, call 1-800-222-8222 or visit the Fund’s Web site at wellsfargoadvantagefunds.com. Please consider the investment objectives, risks, charges, and expenses of the investment carefully before investing. This and other information about Wells Fargo Advantage Funds can be found in the current prospectus. Read the prospectus carefully before you invest or send money.
Wells Fargo Funds Management, LLC, a wholly owned subsidiary of Wells Fargo & Company, provides investment advisory and administrative services for Wells Fargo Advantage Funds. Other affiliates of Wells Fargo & Company provide subadvisory and other services for the Funds. The Funds are distributed by Wells Fargo Funds Distributor, LLC, Member FINRA/SIPC, an affiliate of Wells Fargo & Company.
NOT FDIC INSURED ¡ NO BANK GUARANTEE ¡ MAY LOSE VALUE
© 2012 Wells Fargo Funds Management, LLC. All rights reserved.
210670 08-12 SVT9/SAR146 06-12 |
Table of Contents
| ITEM 2. | CODE OF ETHICS |
Not required in this filing
| ITEM 3. | AUDIT COMMITTEE FINANCIAL EXPERT |
Not required in this filing.
| ITEM 4. | PRINCIPAL ACCOUNTANT FEES AND SERVICES |
Not required in this filing.
| ITEM 5. | AUDIT COMMITTEE OF LISTED REGISTRANTS |
Not required in this filing.
| ITEM 6. | PORTFOLIO OF INVESTMENTS |
The Portfolio of Investments is included as part of the report to shareholders filed under Item 1 of this Form.
| ITEM 7. | DISCLOSURE OF PROXY VOTING POLICIES AND PROCEDURES FOR CLOSED-END MANAGEMENT INVESTMENT COMPANIES |
Not applicable.
| ITEM 8. | PORTFOLIO MANAGERS OF CLOSED-END MANAGEMENT INVESTMENT COMPANIES |
Not applicable.
| ITEM 9. | PURCHASES OF EQUITY SECURITIES BY CLOSED-END MANAGEMENT INVESTMENT COMPANY AND AFFILIATED PURCHASES |
Not applicable.
| ITEM 10. | SUBMISSION OF MATTERS TO A VOTE OF SECURITY HOLDERS |
The Governance Committee (the “Committee”) of the Board of Trustees of the registrant (the “Trust”) has adopted procedures by which a shareholder of any series of the Trust may submit properly a nominee recommendation for the Committee’s consideration.
The shareholder must submit any such recommendation (a “Shareholder Recommendation”) in writing to the Trust, to the attention of the Trust’s Secretary, at the address of the principal executive offices of the Trust.
The Shareholder Recommendation must be delivered to, or mailed and received at, the principal executive offices of the Trust not less than forty-five (45) calendar days nor more than seventy-five (75) calendar days prior to the date of the Committee meeting at which the nominee would be considered.
Table of Contents
The Shareholder Recommendation must include: (i) a statement in writing setting forth (A) the name, age, date of birth, business address, residence address and nationality of the person recommended by the shareholder (the “candidate”); (B) the series (and, if applicable, class) and number of all shares of the Trust owned of record or beneficially by the candidate, as reported to such shareholder by the candidate; (C) any other information regarding the candidate called for with respect to director nominees by paragraphs (a), (d), (e) and (f) of Item 401 of Regulation S-K or paragraph (b) of Item 22 of Rule 14a-101 (Schedule 14A) under the Securities Exchange Act of 1934, as amended (the “Exchange Act”), adopted by the Securities and Exchange Commission (or the corresponding provisions of any regulation or rule subsequently adopted by the Securities and Exchange Commission or any successor agency applicable to the Trust); (D) any other information regarding the candidate that would be required to be disclosed if the candidate were a nominee in a proxy statement or other filing required to be made in connection with solicitation of proxies for election of directors pursuant to Section 14 of the Exchange Act and the rules and regulations promulgated thereunder; and (E) whether the recommending shareholder believes that the candidate is or will be an “interested person” of the Trust (as defined in the Investment Company Act of 1940, as amended) and, if not an “interested person,” information regarding the candidate that will be sufficient for the Trust to make such determination; (ii) the written and signed consent of the candidate to be named as a nominee and to serve as a Trustee if elected; (iii) the recommending shareholder’s name as it appears on the Trust’s books; (iv) the series (and, if applicable, class) and number of all shares of the Trust owned beneficially and of record by the recommending shareholder; and (v) a description of all arrangements or understandings between the recommending shareholder and the candidate and any other person or persons (including their names) pursuant to which the recommendation is being made by the recommending shareholder. In addition, the Committee may require the candidate to interview in person and furnish such other information as it may reasonably require or deem necessary to determine the eligibility of such candidate to serve as a Trustee of the Trust.
| ITEM 11. | CONTROLS AND PROCEDURES |
(a) The President and Treasurer have concluded that the Wells Fargo Variable Trust (the “Trust”) disclosure controls and procedures (as defined in Rule 30a-3(c) under the Investment Company Act of 1940) provide reasonable assurances that material information relating to the Trust is made known to them by the appropriate persons, based on their evaluation of these controls and procedures as of a date within 90 days of the filing of this report.
(b) There were no significant changes in the Trust’s internal controls over financial reporting (as defined in Rule 30a-3(d) under the Investment Company Act of 1940) that occurred during the second quarter of the period covered by this report that materially affected, or is reasonably likely to materially affect, the registrant’s internal control over financial reporting.
| ITEM 12. | EXHIBITS |
(a)(1) Not required in this filing.
(a)(2) Certification pursuant to Rule 30a-2(a) under the Investment Company Act of 1940 (17 CFR 270.30a-2(a)) is filed and attached hereto as Exhibit 99.CERT.
(a)(3) Not applicable.
(b) Certification pursuant to Rule 30a-2(b) under the Investment Company Act of 1940 (17 CFR 270.30a-2(b)) is filed and attached hereto as Exhibit 99.906CERT.
Table of Contents
SIGNATURES
Pursuant to the requirements of the Securities Exchange Act of 1934 and the Investment Company Act of 1940, the registrant has duly caused this report to be signed on its behalf by the undersigned, thereunto duly authorized.
| Wells Fargo Variable Trust | ||
| By: | ||
| /s/ Karla M. Rabusch | ||
| Karla M. Rabusch | ||
| President | ||
| Date: August 24, 2012 | ||
Pursuant to the requirements of the Securities Exchange Act of 1934 and the Investment Company Act of 1940, this report has been signed below by the following persons on behalf of the registrant and in the capacities and on the date indicated.
| By: | ||
| /s/ Karla M. Rabusch | ||
| Karla M. Rabusch | ||
| President | ||
| Date: August 24, 2012 | ||
| By: | ||
| /s/ Nancy Wiser | ||
| Nancy Wiser | ||
| Treasurer | ||
| Date: August 24, 2012 | ||