Table of Contents

UNITED STATES
SECURITIES AND EXCHANGE COMMISSION
Washington, D.C. 20549
FORM N-CSRS
CERTIFIED SHAREHOLDER REPORT OF REGISTERED
MANAGEMENT INVESTMENT COMPANIES
Investment Company Act file number: 811-09255
Wells Fargo Variable Trust
(Exact name of registrant as specified in charter)
525 Market St., San Francisco, CA 94105
(Address of principal executive offices) (Zip code)
C. David Messman
Wells Fargo Funds Management, LLC
525 Market St., San Francisco, CA 94105
(Name and address of agent for service)
Registrant’s telephone number, including area code: 800-222-8222
Date of fiscal year end: December 31
Registrant is making a filing for 9 of its series:
Wells Fargo Advantage VT Discovery Fund, Wells Fargo Advantage VT Index Asset Allocation Fund, Wells Fargo Advantage VT International Equity Fund, Wells Fargo Advantage VT Intrinsic Value Fund, Wells Fargo Advantage VT Omega Growth Fund, Wells Fargo Advantage VT Opportunity Fund, Wells Fargo Advantage VT Small Cap Growth Fund, Wells Fargo Advantage VT Small Cap Value Fund and Wells Fargo Advantage VT Total Return Bond Fund
Date of reporting period: June 30, 2015
Table of Contents
| ITEM 1. | REPORT TO STOCKHOLDERS |
Table of Contents

Wells Fargo Advantage VT Discovery FundSM

Semi-Annual Report
June 30, 2015

Table of Contents
Reduce clutter. Save trees.
Sign up for electronic delivery of prospectuses and shareholder reports at wellsfargo.com/advantagedelivery
| 2 | ||||
| 4 | ||||
| 6 | ||||
| 7 | ||||
Financial statements | ||||
| 11 | ||||
| 12 | ||||
| 13 | ||||
| 14 | ||||
| 15 | ||||
| 19 | ||||
| 25 | ||||
The views expressed and any forward-looking statements are as of June 30, 2015, unless otherwise noted, and are those of the Fund managers and/or Wells Fargo Funds Management, LLC. Discussions of individual securities, or the markets generally, or any Wells Fargo Advantage Fund are not intended as individual recommendations. Future events or results may vary significantly from those expressed in any forward-looking statements; the views expressed are subject to change at any time in response to changing circumstances in the market. Wells Fargo Funds Management, LLC and the Fund disclaim any obligation to publicly update or revise any views expressed or forward-looking statements.
NOT FDIC INSURED ¡ NO BANK GUARANTEE ¡ MAY LOSE VALUE
Table of Contents
| 2 | Wells Fargo Advantage VT Discovery Fund | Letter to shareholders (unaudited) |

Karla M. Rabusch
President
Wells Fargo Advantage Funds
The period was marked by continued low global interest rates and a slow but steady economic recovery in the U.S.
Dear Valued Shareholder:
We are pleased to offer you this semi-annual report for the Wells Fargo Advantage VT Discovery Fund for the six-month period that ended June 30, 2015. The period was marked by continued low global interest rates and a slow but steady economic recovery in the U.S. However, growing concern as to whether a newly elected anti-austerity government in Greece would default on the country’s debt and remove it from the eurozone resulted in late-period volatility for both U.S. and European stocks.
Major central banks continued to provide liquidity to the markets.
Throughout the reporting period, the Federal Open Market Committee (FOMC), which is the U.S. Federal Reserve’s (Fed’s) monetary policymaking body, kept its key interest rate effectively at zero. As the reporting period progressed, though, various comments by Fed Chair Janet Yellen led investors to believe that the FOMC would raise its key federal funds rate by late 2015. Moreover, the FOMC seemed confident that economic conditions would evolve in a way that it would most likely continue raising rates gradually over time.
In contrast, the European Central Bank (ECB) showed no signs of raising rates at any point in the near future. Rather, the ECB maintained a variety of measures aimed at encouraging lending, including making funds available to banks at low interest rates and imposing a negative interest rate on bank deposits held at the central bank. In January 2015, the bank announced quantitative easing via significant bond purchases in an attempt to raise the eurozone’s inflation to just under its target of 2%. The ECB also provided emergency liquidity to Greek banks while that country’s government negotiated with its creditors, which included the eurozone member states and the International Monetary Fund (IMF).
The prospect of a near-term rate hike in the U.S., combined with continued easing from the ECB and other major central banks, resulted in the U.S. dollar appreciating against a basket of currencies for the six-month reporting period.
Although U.S. economic growth slowed in the first quarter, market participants believed that its recovery remained on track.
Reported U.S. gross domestic product (GDP) growth came in at a solid 2.2% annualized rate in the fourth quarter of 2014. Although the final estimate for annualized GDP growth came in at a modest 0.6% in the first quarter of 2015, the slowdown was attributed to short-term factors such as a harsh winter and a long-lived strike at West Coast ports. The U.S. unemployment rate continued its slow improvement, easing from 5.7% in January 2015 to 5.3% in June.
U.S. stocks generally posted gains for the period, aided by a solid economy. However, uncertainty as to whether Greece would default on a June 30 payment to the IMF resulted in volatility and negative returns in the last month of the reporting period. The S&P 500 Index1, a measure of U.S. large-cap stocks, ended the period with a gain of 1.23%. Growth stocks outperformed value stocks in the large-cap space, and health care delivered the best return among the index’s sectors.
| 1 | The S&P 500 Index consists of 500 stocks chosen for market size, liquidity, and industry group representation. It is a market-value-weighted index with each stock’s weight in the index proportionate to its market value. You cannot invest directly in an index. |
| 2 | The Russell 2000® Index measures the performance of the 2,000 smallest companies in the Russell 3000® Index, which represents approximately 8% of the total market capitalization of the Russell 3000 Index. You cannot invest directly in an index. |
Table of Contents
| Letter to shareholders (unaudited) | Wells Fargo Advantage VT Discovery Fund | 3 |
Small-cap stocks solidly outperformed large caps for the period, with the Russell 2000® Index2 gaining 4.75%. Smaller-cap stocks often have an advantage when the U.S. dollar strengthens, as it did during the reporting period. Because larger companies tend to be globally diversified, a stronger dollar can dampen their earnings growth; smaller companies often have more of a domestic focus and thus are less likely to face currency-related headwinds. Small-cap growth stocks significantly outperformed small-cap value stocks, with the information technology sector delivering the highest returns.
Don’t let short-term uncertainty derail long-term investment goals.
Periods of uncertainty can present challenges, but experience has taught us that maintaining long-term investment goals can be an effective way to plan for the future. To help you create a sound strategy based on your personal goals and risk tolerance, Wells Fargo Advantage Funds offers more than 100 mutual funds and other investments spanning a wide range of asset classes and investment styles. Although diversification cannot guarantee an investment profit or prevent losses, we believe it can be an effective way to manage investment risk and potentially smooth out overall portfolio performance. We encourage investors to know their investments and to understand that appropriate levels of risk-taking may unlock opportunities.
Thank you for choosing to invest with Wells Fargo Advantage Funds. We appreciate your confidence in us and remain committed to helping you meet your financial needs.
Sincerely,

Karla M. Rabusch
President
Wells Fargo Advantage Funds
Smaller-cap stocks often have an advantage when the U.S. dollar strengthens, as it did during the reporting period.
Notice to shareholders
At a meeting held on August 11–12, 2015, the Board of Trustees of the Fund approved a change in the name of the Fund whereby the word “Advantage” will be removed from its name, effective December 15, 2015.
For current information about your fund investments, contact your investment professional, visit our website at wellsfargoadvantagefunds.com, or call us directly at 1-800-222-8222. We are available 24 hours a day, 7 days a week.
Table of Contents
| 4 | Wells Fargo Advantage VT Discovery Fund | Performance highlights (unaudited) |
The Fund is currently closed to new insurance companies1.
Investment objective
The Fund seeks long-term capital appreciation.
Adviser
Wells Fargo Funds Management, LLC
Subadviser
Wells Capital Management Incorporated
Portfolio managers
Thomas J. Pence, CFA
Michael T. Smith, CFA
Chris Warner, CFA
Average annual total returns (%) as of June 30, 2015
| Expense ratios2 (%) | ||||||||||||||||||||||
| Inception date | 1 year | 5 year | 10 year | Gross | Net3 | |||||||||||||||||
| Class 2 | 5-8-1992 | 11.69 | 19.92 | 11.75 | 1.14 | 1.14 | ||||||||||||||||
| Russell 2500™ Growth Index4 | – | 11.30 | 19.55 | 10.32 | – | – | ||||||||||||||||
Figures quoted represent past performance, which is no guarantee of future results and do not reflect the deduction of taxes that a shareholder may pay on fund distributions or the redemption of fund shares. Investment return and principal value of an investment will fluctuate so that an investor’s shares, when redeemed, may be worth more or less than their original cost. Current performance may be lower or higher than the performance data quoted, which assumes the reinvestment of dividends and capital gains. Current month-end performance is available by calling 1-800-222-8222. Performance figures of the Fund do not reflect fees charged pursuant to the terms of variable life insurance policies and variable annuity contracts. If fees had been reflected, performance would have been lower.
Index returns do not include transaction costs associated with buying and selling securities, any mutual fund fees or expenses, or any taxes. It is not possible to invest directly in an index.
Stock values fluctuate in response to the activities of individual companies and general market and economic conditions. Smaller-company stocks tend to be more volatile and less liquid than those of larger companies. Certain investment strategies tend to increase the total risk of an investment (relative to the broader market). The Fund is exposed to foreign investment risk. Consult the Fund’s prospectus for additional information on these and other risks.
Please refer to the prospectus provided by your participating insurance company for detailed information describing the separate accounts for information regarding surrender charges, mortality and expense risk fees, and other charges that may be assessed by the participating insurance companies.
Please see footnotes on page 5.
Table of Contents
| Performance highlights (unaudited) | Wells Fargo Advantage VT Discovery Fund | 5 |
| Ten largest holdings5 (%) as of June 30, 2015 | ||||
ServiceMaster Global Holdings Incorporated | 2.26 | |||
Carlisle Companies Incorporated | 2.11 | |||
Wabtec Corporation | 2.09 | |||
CoStar Group Incorporated | 2.05 | |||
SEI Investments Company | 2.03 | |||
Cinemark Holdings Incorporated | 1.93 | |||
Splunk Incorporated | 1.76 | |||
Axalta Coating Systems Limited | 1.73 | |||
Tyler Technologies Incorporated | 1.69 | |||
Tableau Software Incorporated Class A | 1.64 | |||
| Sector distribution6 as of June 30, 2015 |
 |
| 1 | Please see the Fund’s current Statement of Additional Information for further details. |
| 2 | Reflects the expense ratios as stated in the most recent prospectus. The expense ratios shown are subject to change and may differ from the annualized expense ratios shown in the financial highlights of this report. |
| 3 | The Adviser has contractually committed through April 30, 2016, to waive fees and/or reimburse expenses to the extent necessary to cap the Fund’s Total Annual Fund Operating Expenses After Fee Waiver at 1.15% for Class 2. After this time, the cap may be increased or the commitment to maintain the cap may be terminated only with the approval of the Board of Trustees. Brokerage commissions, stamp duty fees, interest, taxes, acquired fund fees and expenses, and extraordinary expenses are excluded from the cap. Without this cap, the Fund’s returns would have been lower. |
| 4 | The Russell 2500TM Growth Index measures the performance of those Russell 2500 companies with higher price-to-book ratios and higher forecasted growth values. You cannot invest directly in an index. |
| 5 | The ten largest holdings, excluding cash and cash equivalents, are calculated based on the value of the investments divided by total net assets of the Fund. Holdings are subject to change and may have changed since the date specified. |
| 6 | Amounts are calculated based on the total long-term investments of the Fund. These amounts are subject to change and may have changed since the date specified. |
Table of Contents
| 6 | Wells Fargo Advantage VT Discovery Fund | Fund expenses (unaudited) |
As a shareholder of the Fund, you incur ongoing costs, including management fees, distribution (12b-1) fees, and other Fund expenses. This example is intended to help you understand your ongoing costs (in dollars) of investing in the Fund and to compare these costs with the ongoing costs of investing in other mutual funds.
The example is based on an investment of $1,000 invested at the beginning of the six-month period and held for the entire period from January 1, 2015 to June 30, 2015.
Actual expenses
The “Actual” line of the table below provides information about actual account values and actual expenses. You may use the information in this line, together with the amount you invested, to estimate the expenses that you paid over the period. Simply divide your account value by $1,000 (for example, an $8,600 account value divided by $1,000 = 8.6), then multiply the result by the number in the “Actual” line under the heading entitled “Expenses Paid During Period” for your applicable class of shares to estimate the expenses you paid on your account during this period.
Hypothetical example for comparison purposes
The “Hypothetical” line of the table below provides information about hypothetical account values and hypothetical expenses based on the Fund’s actual expense ratio and an assumed rate of return of 5% per year before expenses, which is not the Fund’s actual return. The hypothetical account values and expenses may not be used to estimate the actual ending account balance or expenses you paid for the period. You may use this information to compare the ongoing costs of investing in the Fund and other funds. To do so, compare this 5% hypothetical example with the 5% hypothetical examples that appear in the shareholder reports of the other funds.
Please note that the expenses shown in the table are meant to highlight your ongoing costs only and do not reflect any separate account charges assessed by participating insurance companies. Therefore, the “Hypothetical” line of the table is useful in comparing ongoing costs only, and will not help you determine the relative total costs of owning different funds. In addition, if these separate account charges assessed by participating insurance companies were included, your costs would have been higher.
| Beginning account value 1-1-2015 | Ending account value 6-30-2015 | Expenses paid during the period¹ | Net annualized expense ratio | |||||||||||||
Class 2 | ||||||||||||||||
Actual | $ | 1,000.00 | $ | 1,098.99 | $ | 5.98 | 1.15 | % | ||||||||
Hypothetical (5% return before expenses) | $ | 1,000.00 | $ | 1,019.09 | $ | 5.76 | 1.15 | % | ||||||||
| 1 | Expenses paid is equal to the annualized expense ratio multiplied by the average account value over the period, multiplied by the number of days in the most recent fiscal half-year divided by the number of days in the fiscal year (to reflect the one-half year period). |
Table of Contents
| Portfolio of investments—June 30, 2015 (unaudited) | Wells Fargo Advantage VT Discovery Fund | 7 |
| Security name | Shares | Value | ||||||||||
Common Stocks: 96.21% | ||||||||||||
Consumer Discretionary: 25.16% | ||||||||||||
| Auto Components: 1.14% | ||||||||||||
Gentherm Incorporated † | 30,269 | $ | 1,662,071 | |||||||||
|
| |||||||||||
| Diversified Consumer Services: 3.72% | ||||||||||||
Bright Horizons Family Solutions Incorporated † | 36,600 | 2,115,480 | ||||||||||
ServiceMaster Global Holdings Incorporated † | 90,925 | 3,288,757 | ||||||||||
| 5,404,237 | ||||||||||||
|
| |||||||||||
| Hotels, Restaurants & Leisure: 3.92% | ||||||||||||
Dave & Buster Entertainment Incorporated † | 57,311 | 2,068,354 | ||||||||||
Domino’s Pizza Incorporated | 17,000 | 1,927,800 | ||||||||||
Vail Resorts Incorporated | 15,500 | 1,692,600 | ||||||||||
| 5,688,754 | ||||||||||||
|
| |||||||||||
| Household Durables: 2.80% | ||||||||||||
Harman International Industries Incorporated | 16,400 | 1,950,616 | ||||||||||
Jarden Corporation † | 41,000 | 2,121,750 | ||||||||||
| 4,072,366 | ||||||||||||
|
| |||||||||||
| Internet & Catalog Retail: 1.19% | ||||||||||||
Vipshop Holdings Limited ADR † | 77,700 | 1,728,825 | ||||||||||
|
| |||||||||||
| Leisure Products: 0.95% | ||||||||||||
The Brunswick Corporation | 27,200 | 1,383,392 | ||||||||||
|
| |||||||||||
| Media: 1.93% | ||||||||||||
Cinemark Holdings Incorporated | 69,700 | 2,799,849 | ||||||||||
|
| |||||||||||
| Specialty Retail: 5.38% | ||||||||||||
Caleres Incorporated | 42,500 | 1,350,650 | ||||||||||
Lithia Motors Incorporated Class A | 20,100 | 2,274,516 | ||||||||||
The Men’s Wearhouse Incorporated | 31,700 | 2,031,019 | ||||||||||
The Michaels Companies Incorporated † | 80,438 | 2,164,587 | ||||||||||
| 7,820,772 | ||||||||||||
|
| |||||||||||
| Textiles, Apparel & Luxury Goods: 4.13% | ||||||||||||
Carter’s Incorporated | 21,000 | 2,232,300 | ||||||||||
Columbia Sportswear Company | 31,277 | 1,891,007 | ||||||||||
lululemon athletica incorporated † | 28,799 | 1,880,575 | ||||||||||
| 6,003,882 | ||||||||||||
|
| |||||||||||
Consumer Staples: 2.02% | ||||||||||||
| Beverages: 1.06% | ||||||||||||
Constellation Brands Incorporated Class A | 13,300 | 1,543,066 | ||||||||||
|
| |||||||||||
| Food & Staples Retailing: 0.96% | ||||||||||||
Sprouts Farmers Market Incorporated † | 51,543 | 1,390,630 | ||||||||||
|
| |||||||||||
The accompanying notes are an integral part of these financial statements.
Table of Contents
| 8 | Wells Fargo Advantage VT Discovery Fund | Portfolio of investments—June 30, 2015 (unaudited) |
| Security name | Shares | Value | ||||||||||
Energy: 1.59% | ||||||||||||
| Oil, Gas & Consumable Fuels: 1.59% | ||||||||||||
Diamondback Energy Incorporated † | 25,100 | $ | 1,892,038 | |||||||||
Sanchez Energy Corporation Ǡ | 43,470 | 426,006 | ||||||||||
| 2,318,044 | ||||||||||||
|
| |||||||||||
Financials: 4.43% | ||||||||||||
| Capital Markets: 3.55% | ||||||||||||
Affiliated Managers Group Incorporated † | 800 | 174,880 | ||||||||||
Evercore Partners Incorporated Class A | 4,090 | 220,696 | ||||||||||
Raymond James Financial Incorporated | 30,400 | 1,811,232 | ||||||||||
SEI Investments Company | 60,100 | 2,946,703 | ||||||||||
| 5,153,511 | ||||||||||||
|
| |||||||||||
| Real Estate Management & Development: 0.88% | ||||||||||||
The Howard Hughes Corporation † | 8,900 | 1,277,506 | ||||||||||
|
| |||||||||||
Health Care: 20.84% | ||||||||||||
| Biotechnology: 8.20% | ||||||||||||
Alnylam Pharmaceuticals Incorporated † | 13,323 | 1,597,028 | ||||||||||
AMAG Pharmaceuticals Incorporated † | 28,474 | 1,966,414 | ||||||||||
BioMarin Pharmaceutical Incorporated † | 9,567 | 1,308,574 | ||||||||||
bluebird bio Incorporated † | 5,800 | 976,546 | ||||||||||
Cepheid Incorporated † | 34,953 | 2,137,376 | ||||||||||
Medivation Incorporated † | 14,789 | 1,688,904 | ||||||||||
Novavax Incorporated † | 126,134 | 1,405,133 | ||||||||||
Puma Biotechnology Incorporated Ǡ | 1,700 | 198,475 | ||||||||||
Ultragenyx Pharmaceutical Incorporated † | 6,200 | 634,818 | ||||||||||
| 11,913,268 | ||||||||||||
|
| |||||||||||
| Health Care Equipment & Supplies: 6.35% | ||||||||||||
Alere Incorporated † | 41,990 | 2,214,973 | ||||||||||
Align Technology Incorporated † | 35,900 | 2,251,289 | ||||||||||
DexCom Incorporated † | 26,056 | 2,083,959 | ||||||||||
IDEXX Laboratories Incorporated † | 9,236 | 592,397 | ||||||||||
The Cooper Companies Incorporated | 11,700 | 2,082,249 | ||||||||||
| 9,224,867 | ||||||||||||
|
| |||||||||||
| Health Care Providers & Services: 4.35% | ||||||||||||
Community Health Systems Incorporated † | 32,900 | 2,071,713 | ||||||||||
Envision Healthcare Holdings Incorporated † | 57,958 | 2,288,182 | ||||||||||
VCA Incorporated † | 36,000 | 1,958,580 | ||||||||||
| 6,318,475 | ||||||||||||
|
| |||||||||||
| Pharmaceuticals: 1.94% | ||||||||||||
Catalent Incorporated † | 42,519 | 1,247,082 | ||||||||||
GW Pharmaceuticals plc Ǡ | 6,500 | 798,460 | ||||||||||
Jazz Pharmaceuticals plc † | 4,400 | 774,708 | ||||||||||
| 2,820,250 | ||||||||||||
|
| |||||||||||
The accompanying notes are an integral part of these financial statements.
Table of Contents
| Portfolio of investments—June 30, 2015 (unaudited) | Wells Fargo Advantage VT Discovery Fund | 9 |
| Security name | Shares | Value | ||||||||||
Industrials: 15.77% | ||||||||||||
| Aerospace & Defense: 2.37% | ||||||||||||
Huntington Ingalls Industries Incorporated | 12,900 | $ | 1,452,411 | |||||||||
TASER International Incorporated Ǡ | 59,700 | 1,988,607 | ||||||||||
| 3,441,018 | ||||||||||||
|
| |||||||||||
| Airlines: 1.06% | ||||||||||||
Spirit Airlines Incorporated † | 24,700 | 1,533,870 | ||||||||||
|
| |||||||||||
| Building Products: 1.51% | ||||||||||||
Allegion plc | 36,500 | 2,195,110 | ||||||||||
|
| |||||||||||
| Electrical Equipment: 1.58% | ||||||||||||
Acuity Brands Incorporated | 12,800 | 2,303,744 | ||||||||||
|
| |||||||||||
| Industrial Conglomerates: 2.10% | ||||||||||||
Carlisle Companies Incorporated | 30,557 | 3,059,367 | ||||||||||
|
| |||||||||||
| Machinery: 5.78% | ||||||||||||
Allison Transmission Holdings Incorporated | 40,900 | 1,196,734 | ||||||||||
Proto Labs Incorporated Ǡ | 14,900 | 1,005,452 | ||||||||||
Snap-on Incorporated | 7,672 | 1,221,766 | ||||||||||
WABCO Holdings Incorporated † | 15,600 | 1,930,032 | ||||||||||
Wabtec Corporation | 32,300 | 3,043,952 | ||||||||||
| 8,397,936 | ||||||||||||
|
| |||||||||||
| Road & Rail: 1.37% | ||||||||||||
Old Dominion Freight Line Incorporated † | 29,000 | 1,989,545 | ||||||||||
|
| |||||||||||
Information Technology: 22.41% | ||||||||||||
| Electronic Equipment, Instruments & Components: 1.27% | ||||||||||||
Cognex Corporation | 38,500 | 1,851,850 | ||||||||||
|
| |||||||||||
| Internet Software & Services: 2.05% | ||||||||||||
CoStar Group Incorporated † | 14,779 | 2,974,422 | ||||||||||
|
| |||||||||||
| IT Services: 6.42% | ||||||||||||
Black Knight Financial Services Incorporated † | 32,802 | 1,012,598 | ||||||||||
EPAM Systems Incorporated † | 26,000 | 1,851,980 | ||||||||||
Euronet Worldwide Incorporated † | 34,493 | 2,128,218 | ||||||||||
Vantiv Incorporated Class A † | 53,453 | 2,041,370 | ||||||||||
WEX Incorporated † | 20,100 | 2,290,797 | ||||||||||
| 9,324,963 | ||||||||||||
|
| |||||||||||
| Semiconductors & Semiconductor Equipment: 2.37% | ||||||||||||
Ambarella Incorporated † | 15,800 | 1,622,502 | ||||||||||
Tower Semiconductor Limited Ǡ | 62,900 | 971,176 | ||||||||||
Veeco Instruments Incorporated † | 29,700 | 853,578 | ||||||||||
| 3,447,256 | ||||||||||||
|
| |||||||||||
The accompanying notes are an integral part of these financial statements.
Table of Contents
| 10 | Wells Fargo Advantage VT Discovery Fund | Portfolio of investments—June 30, 2015 (unaudited) |
| Security name | Shares | Value | ||||||||||||
| Software: 10.30% | ||||||||||||||
CyberArk Software Limited Ǡ | 21,494 | $ | 1,350,253 | |||||||||||
Fleetmatics Group plc † | 38,204 | 1,789,093 | ||||||||||||
Guidewire Software Incorporated † | 33,291 | 1,762,093 | ||||||||||||
Imperva Incorporated † | 11,227 | 760,068 | ||||||||||||
Mobileye NV Ǡ | 16,300 | 866,671 | ||||||||||||
Solera Holdings Incorporated | 23,420 | 1,043,595 | ||||||||||||
Splunk Incorporated † | 36,800 | 2,562,016 | ||||||||||||
Tableau Software Incorporated Class A † | 20,615 | 2,376,910 | ||||||||||||
Tyler Technologies Incorporated † | 18,975 | 2,454,986 | ||||||||||||
| 14,965,685 | ||||||||||||||
|
| |||||||||||||
Materials: 2.80% | ||||||||||||||
| Chemicals: 1.73% | ||||||||||||||
Axalta Coating Systems Limited † | 75,783 | 2,506,902 | ||||||||||||
|
| |||||||||||||
| Construction Materials: 1.07% | ||||||||||||||
Vulcan Materials Company | 18,600 | 1,561,098 | ||||||||||||
|
| |||||||||||||
Telecommunication Services: 1.19% | ||||||||||||||
| Wireless Telecommunication Services: 1.19% | ||||||||||||||
SBA Communications Corporation Class A † | 14,984 | 1,722,709 | ||||||||||||
|
| |||||||||||||
Total Common Stocks (Cost $114,588,937) | 139,799,240 | |||||||||||||
|
| |||||||||||||
| Yield | ||||||||||||||
| Short-Term Investments: 6.11% | ||||||||||||||
| Investment Companies: 6.11% | ||||||||||||||
Securities Lending Cash Investments, LLC (l)(r)(u) | 0.13 | % | 5,697,700 | 5,697,700 | ||||||||||
Wells Fargo Advantage Cash Investment Money Market Fund, Select Class (l)(u) | 0.12 | 3,177,206 | 3,177,206 | |||||||||||
Total Short-Term Investments (Cost $8,874,906) | 8,874,906 | |||||||||||||
|
| |||||||||||||
| Total investments in securities (Cost $123,463,843) * | 102.32 | % | 148,674,146 | |||||
Other assets and liabilities, net | (2.32 | ) | (3,368,569 | ) | ||||
|
|
|
| |||||
| Total net assets | 100.00 | % | $ | 145,305,577 | ||||
|
|
|
|
| † | Non-income-earning security |
| « | All or a portion of this security is on loan. |
| (l) | The security represents an affiliate of the Fund as defined in the Investment Company Act of 1940. |
| (r) | The investment is a non-registered investment vehicle purchased with cash collateral received from securities on loan. |
| (u) | The rate represents the 7-day annualized yield at period end. |
| * | Cost for federal income tax purposes is $123,597,022 and unrealized gains (losses) consists of: |
Gross unrealized gains | $ | 28,091,489 | ||
Gross unrealized losses | (3,014,365 | ) | ||
|
| |||
Net unrealized gains | $ | 25,077,124 |
The accompanying notes are an integral part of these financial statements.
Table of Contents
| Statement of assets and liabilities—June 30, 2015 (unaudited) | Wells Fargo Advantage VT Discovery Fund | 11 |
Assets | ||||
Investments | ||||
In unaffiliated securities (including $5,567,283 of securities loaned), at value (cost $114,588,937) | $ | 139,799,240 | ||
In affiliated securities, at value (cost $8,874,906) | 8,874,906 | |||
|
| |||
Total investments, at value (cost $123,463,843) | 148,674,146 | |||
Cash | 3,650 | |||
Receivable for investments sold | 4,746,055 | |||
Receivable for Fund shares sold | 402,776 | |||
Receivable for dividends | 18,310 | |||
Receivable for securities lending income | 8,781 | |||
Prepaid expenses and other assets | 3,832 | |||
|
| |||
Total assets | 153,857,550 | |||
|
| |||
Liabilities | ||||
Payable for investments purchased | 2,399,130 | |||
Payable for Fund shares redeemed | 298,745 | |||
Payable upon receipt of securities loaned | 5,697,700 | |||
Advisory fee payable | 82,476 | |||
Distribution fee payable | 29,975 | |||
Administration fee payable | 15,587 | |||
Accrued expenses and other liabilities | 28,360 | |||
|
| |||
Total liabilities | 8,551,973 | �� | ||
|
| |||
Total net assets | $ | 145,305,577 | ||
|
| |||
NET ASSETS CONSIST OF | ||||
Paid-in capital | $ | 90,209,602 | ||
Accumulated net investment loss | (509,780 | ) | ||
Accumulated net realized gains on investments | 30,395,452 | |||
Net unrealized gains on investments | 25,210,303 | |||
|
| |||
Total net assets | $ | 145,305,577 | ||
|
| |||
COMPUTATION OF NET ASSET VALUE PER SHARE | ||||
Net assets – Class 2 | $ | 145,305,577 | ||
Shares outstanding – Class 21 | 4,305,791 | |||
Net asset value per share – Class 2 | $33.75 | |||
| 1 | The Fund has an unlimited number of authorized shares. |
The accompanying notes are an integral part of these financial statements.
Table of Contents
| 12 | Wells Fargo Advantage VT Discovery Fund | Statement of operations—six months ended June 30, 2015 (unaudited) |
Investment income | ||||
Dividends | $ | 245,870 | ||
Securities lending income, net | 53,523 | |||
Income from affiliated securities | 974 | |||
|
| |||
Total investment income | 300,367 | |||
|
| |||
Expenses | ||||
Advisory fee | 493,134 | |||
Administration fee | 91,582 | |||
Distribution fee | ||||
Class 2 | 176,119 | |||
Custody and accounting fees | 11,760 | |||
Professional fees | 19,771 | |||
Shareholder report expenses | 14,445 | |||
Trustees’ fees and expenses | 7,133 | |||
Other fees and expenses | 5,920 | |||
|
| |||
Total expenses | 819,864 | |||
Less: Fee waivers and/or expense reimbursements | (9,717 | ) | ||
|
| |||
Net expenses | 810,147 | |||
|
| |||
Net investment loss | (509,780 | ) | ||
|
| |||
REALIZED AND UNREALIZED GAINS (LOSSES) ON INVESTMENTS | ||||
Net realized gains on investments | 10,339,814 | |||
Net change in unrealized gains (losses) on investments | 3,617,708 | |||
|
| |||
Net realized and unrealized gains (losses) on investments | 13,957,522 | |||
|
| |||
Net increase in net assets resulting from operations | $ | 13,447,742 | ||
|
| |||
The accompanying notes are an integral part of these financial statements.
Table of Contents
| Statement of changes in net assets | Wells Fargo Advantage VT Discovery Fund | 13 |
Six months ended June 30, 2015 (unaudited) | Year ended December 31, 2014 | |||||||||||||||
Operations | ||||||||||||||||
Net investment loss | $ | (509,780 | ) | $ | (990,469 | ) | ||||||||||
Net realized gains on investments | 10,339,814 | 20,144,541 | ||||||||||||||
Net change in unrealized gains (losses) on investments | 3,617,708 | (19,385,645 | ) | |||||||||||||
|
| |||||||||||||||
Net increase (decrease) in net assets resulting from operations | 13,447,742 | (231,573 | ) | |||||||||||||
|
| |||||||||||||||
Distributions to shareholders from | ||||||||||||||||
Net realized gains – Class 2 | 0 | (18,974,676 | ) | |||||||||||||
|
| |||||||||||||||
Capital share transactions | Shares | Shares | ||||||||||||||
Proceeds from shares sold – Class 2 | 181,639 | 5,939,521 | 363,614 | 11,794,023 | ||||||||||||
Reinvestment of distributions – Class 2 | 0 | 0 | 644,301 | 18,974,676 | ||||||||||||
Payment for shares redeemed – Class 2 | (385,642 | ) | (12,571,254 | ) | (999,205 | ) | (31,523,941 | ) | ||||||||
|
| |||||||||||||||
Net decrease in net assets resulting from capital share transactions | (6,631,733 | ) | (755,242 | ) | ||||||||||||
|
| |||||||||||||||
Total increase (decrease) in net assets | 6,816,009 | (19,961,491 | ) | |||||||||||||
|
| |||||||||||||||
Net assets | ||||||||||||||||
Beginning of period | 138,489,568 | 158,451,059 | ||||||||||||||
|
| |||||||||||||||
End of period | $ | 145,305,577 | $ | 138,489,568 | ||||||||||||
|
| |||||||||||||||
Accumulated net investment loss | $ | (509,780 | ) | $ | 0 | |||||||||||
|
| |||||||||||||||
The accompanying notes are an integral part of these financial statements.
Table of Contents
| 14 | Wells Fargo Advantage VT Discovery Fund | Financial highlights |
(For a share outstanding throughout each period)
| Six months ended June 30, 2015 (unaudited) | Year ended December 31 | |||||||||||||||||||||||
| CLASS 2 | 2014 | 2013 | 2012 | 2011 | 20101 | |||||||||||||||||||
Net asset value, beginning of period | $30.71 | $35.20 | $25.16 | $21.37 | $21.28 | $15.70 | ||||||||||||||||||
Net investment loss | (0.12 | ) | (0.22 | ) | (0.17 | ) | (0.01 | ) | (0.18 | ) | (0.13 | ) | ||||||||||||
Net realized and unrealized gains (losses) on investments | 3.16 | 0.16 | 11.06 | 3.80 | 0.27 | 5.71 | ||||||||||||||||||
|
|
|
|
|
|
|
|
|
|
|
| |||||||||||||
Total from investment operations | 3.04 | (0.06 | ) | 10.89 | 3.79 | 0.09 | 5.58 | |||||||||||||||||
Distributions to shareholders from | ||||||||||||||||||||||||
Net investment income | 0.00 | 0.00 | (0.00 | )2 | 0.00 | 0.00 | 0.00 | |||||||||||||||||
Net realized gains | 0.00 | (4.43 | ) | (0.85 | ) | 0.00 | 0.00 | 0.00 | ||||||||||||||||
|
|
|
|
|
|
|
|
|
|
|
| |||||||||||||
Total distributions to shareholders | 0.00 | (4.43 | ) | (0.85 | ) | 0.00 | 0.00 | 0.00 | ||||||||||||||||
Net asset value, end of period | $33.75 | $30.71 | $35.20 | $25.16 | $21.37 | $21.28 | ||||||||||||||||||
Total return3 | 9.90 | % | 0.36 | % | 43.80 | % | 17.74 | % | 0.42 | % | 35.54 | % | ||||||||||||
Ratios to average net assets (annualized) | ||||||||||||||||||||||||
Gross expenses | 1.16 | % | 1.14 | % | 1.16 | % | 1.21 | % | 1.18 | % | 1.26 | % | ||||||||||||
Net expenses | 1.15 | % | 1.14 | % | 1.15 | % | 1.15 | % | 1.15 | % | 1.15 | % | ||||||||||||
Net investment loss | (0.72 | )% | (0.68 | )% | (0.56 | )% | (0.03 | )% | (0.75 | )% | (0.71 | )% | ||||||||||||
Supplemental data | ||||||||||||||||||||||||
Portfolio turnover rate | 49 | % | 79 | % | 88 | % | 98 | % | 113 | % | 101 | % | ||||||||||||
Net assets, end of period (000s omitted) | $145,306 | $138,490 | $158,451 | $111,458 | $98,099 | $110,755 | ||||||||||||||||||
| 1 | After the close of business on July 16, 2010, existing shares of the Fund were renamed Class 2 shares. |
| 2 | Amount is less than $0.005. |
| 3 | Returns for periods of less than one year are not annualized. |
The accompanying notes are an integral part of these financial statements.
Table of Contents
| Notes to financial statements (unaudited) | Wells Fargo Advantage VT Discovery Fund | 15 |
1. ORGANIZATION
Wells Fargo Variable Trust (the “Trust”), a Delaware statutory trust organized on March 10, 1999, is an open-end management investment company registered under the Investment Company Act of 1940, as amended (the “1940 Act”). As an investment company, the Trust follows the accounting and reporting guidance in Financial Accounting Standards Board (“FASB”) Accounting Standards Codification Topic 946, Financial Services – Investment Companies. These financial statements report on the Wells Fargo Advantage VT Discovery Fund (the “Fund”) which is a diversified series of the Trust.
2. SIGNIFICANT ACCOUNTING POLICIES
The following significant accounting policies, which are consistently followed in the preparation of the financial statements of the Fund, are in conformity with U.S. generally accepted accounting principles which require management to make estimates and assumptions that affect the reported amounts of assets and liabilities, disclosure of contingent assets and liabilities at the date of the financial statements, and the reported amounts of revenues and expenses during the reporting period. Actual results could differ from those estimates.
Securities valuation
All investments are valued each business day as of the close of regular trading on the New York Stock Exchange (generally 4 p.m. Eastern Time).
Equity securities that are listed on a foreign or domestic exchange or market are valued at the official closing price or, if none, the last sales price. If no sale occurs on the primary exchange or market that day, the prior day’s price will be deemed “stale” and a fair value price will be determined in accordance with the Fund’s Valuation Procedures.
Equity securities that are not listed on a foreign or domestic exchange or market, but have a public trading market, are valued at the quoted bid price from an independent broker-dealer that the Management Valuation Team of Wells Fargo Funds Management, LLC (“Funds Management”) has determined is an acceptable source.
Investments in registered open-end investment companies are valued at net asset value. Interests in non-registered investment vehicles that are redeemable at net asset value are fair valued at net asset value when available.
Investments which are not valued using any of the methods discussed above are valued at their fair value, as determined in good faith by the Board of Trustees of the Fund. The Board of Trustees has established a Valuation Committee comprised of the Trustees and has delegated to it the authority to take any actions regarding the valuation of portfolio securities that the Valuation Committee deems necessary or appropriate, including determining the fair value of portfolio securities, unless the determination has been delegated to the Management Valuation Team. The Board of Trustees retains the authority to make or ratify any valuation decisions or approve any changes to the Valuation Procedures as it deems appropriate. On a quarterly basis, the Board of Trustees receives reports on any valuation actions taken by the Valuation Committee or the Management Valuation Team which may include items for ratification.
Valuations of fair valued securities are compared to the next actual sales price when available, or other appropriate market values, to assess the continued appropriateness of the fair valuation methodologies used. These securities are fair valued on a day-to-day basis, taking into consideration changes to appropriate market information and any significant changes to the inputs considered in the valuation process until there is a readily available price provided on an exchange or by an independent pricing service. Valuations received from an independent pricing service or independent broker-dealer quotes are periodically validated by comparisons to most recent trades and valuations provided by other independent pricing services in addition to the review of prices by the adviser and/or subadviser. Unobservable inputs used in determining fair valuations are identified based on the type of security, taking into consideration factors utilized by market participants in valuing the investment, knowledge about the issuer and the current market environment.
Security loans
The Fund may lend its securities from time to time in order to earn additional income in the form of fees or interest on securities received as collateral or the investment of any cash received as collateral. The Fund continues to receive interest or dividends on the securities loaned. The Fund receives collateral in the form of cash or securities with a value at least equal to the value of the securities on loan. The value of the loaned securities is determined at the close of each business day and any additional required collateral is delivered to the Fund on the next business day. In a securities lending transaction, the net asset value of the Fund will be affected by an increase or decrease in the value of the securities loaned and by an increase or decrease in the value of the instrument in which collateral is invested. The amount of securities lending activity undertaken by the Fund fluctuates from time to time. In the event of default or bankruptcy by the borrower, the Fund may be prevented from recovering the loaned securities or gaining access to the collateral or may experience delays or costs in doing so. In addition, the investment of any cash collateral received may lose all or part of its value. The Fund has the right under the lending agreement to recover the securities from the borrower on demand.
Table of Contents
| 16 | Wells Fargo Advantage VT Discovery Fund | Notes to financial statements (unaudited) |
The Fund lends its securities through an unaffiliated securities lending agent. Cash collateral received in connection with its securities lending transactions is invested in Securities Lending Cash Investments, LLC (the “Securities Lending Fund”). The Securities Lending Fund is exempt from registration under Section 3(c)(7) of the 1940 Act and is managed by Funds Management and is subadvised by Wells Capital Management Incorporated (“WellsCap”). Funds Management receives an advisory fee starting at 0.05% and declining to 0.01% as the average daily net assets of the Securities Lending Fund increase. All of the fees received by Funds Management are paid to WellsCap for its services as subadviser. The Securities Lending Fund seeks to provide a positive return compared to the daily Fed Funds Open rate by investing in high-quality, U.S. dollar-denominated short-term money market instruments. Securities Lending Fund investments are fair valued based upon the amortized cost valuation technique. Income earned from investment in the Securities Lending Fund is included in securities lending income on the Statement of Operations.
Security transactions and income recognition
Securities transactions are recorded on a trade date basis. Realized gains or losses are recorded on the basis of identified cost.
Dividend income is recognized on the ex-dividend date.
Distributions to shareholders
Distributions to shareholders from net investment income and net realized gains, if any, are recorded on the ex-dividend date. Such distributions are determined in conformity with federal income tax regulations, which may differ in amount or character from net investment income and realized gains recognized for purposes of U.S. generally accepted accounting principles.
Federal and other taxes
The Fund intends to continue to qualify as a regulated investment company by distributing substantially all of its investment company taxable income and any net realized capital gains (after reduction for capital loss carryforwards) sufficient to relieve it from all, or substantially all, federal income taxes. Accordingly, no provision for federal income taxes was required.
The Fund’s income and federal excise tax returns and all financial records supporting those returns for the prior three fiscal years are subject to examination by the federal and Delaware revenue authorities. Management has analyzed the Fund’s tax positions taken on federal, state, and foreign tax returns for all open tax years and does not believe that there are any uncertain tax positions that require recognition of a tax liability.
3. FAIR VALUATION MEASUREMENTS
Fair value measurements of investments are determined within a framework that has established a fair value hierarchy based upon the various data inputs utilized in determining the value of the Fund’s investments. The three-level hierarchy gives the highest priority to unadjusted quoted prices in active markets for identical assets or liabilities (Level 1) and the lowest priority to significant unobservable inputs (Level 3). The Fund’s investments are classified within the fair value hierarchy based on the lowest level of input that is significant to the fair value measurement. The inputs are summarized into three broad levels as follows:
| n | Level 1 – quoted prices in active markets for identical securities |
| n | Level 2 – other significant observable inputs (including quoted prices for similar securities, interest rates, prepayment speeds, credit risk, use of amortized cost, etc.) |
| n | Level 3 – significant unobservable inputs (including the Fund’s own assumptions in determining the fair value of investments) |
The inputs or methodologies used for valuing investments in securities are not necessarily an indication of the risk associated with investing in those securities.
Table of Contents
| Notes to financial statements (unaudited) | Wells Fargo Advantage VT Discovery Fund | 17 |
The following is a summary of the inputs used in valuing the Fund’s assets and liabilities as of June 30, 2015:
| Quoted prices (Level 1) | Other significant observable inputs (Level 2) | Significant unobservable inputs (Level 3) | Total | |||||||||||||
Assets | ||||||||||||||||
Investments in: | ||||||||||||||||
Common stocks | ||||||||||||||||
Consumer discretionary | $ | 36,564,148 | $ | 0 | $ | 0 | $ | 36,564,148 | ||||||||
Consumer staples | 2,933,696 | 0 | 0 | 2,933,696 | ||||||||||||
Energy | 2,318,044 | 0 | 0 | 2,318,044 | ||||||||||||
Financials | 6,431,017 | 0 | 0 | 6,431,017 | ||||||||||||
Health care | 30,276,860 | 0 | 0 | 30,276,860 | ||||||||||||
Industrials | 22,920,590 | 0 | 0 | 22,920,590 | ||||||||||||
Information technology | 32,564,176 | 0 | 0 | 32,564,176 | ||||||||||||
Materials | 4,068,000 | 0 | 0 | 4,068,000 | ||||||||||||
Telecommunication services | 1,722,709 | 0 | 0 | 1,722,709 | ||||||||||||
Short-term investments | ||||||||||||||||
Investment companies | 3,177,206 | 5,697,700 | 0 | 8,874,906 | ||||||||||||
Total assets | $ | 142,976,446 | $ | 5,697,700 | $ | 0 | $ | 148,674,146 | ||||||||
The Fund recognizes transfers between levels within the fair value hierarchy at the end of the reporting period. At June 30, 2015, the Fund did not have any transfers into/out of Level 1, Level 2, or Level 3.
4. TRANSACTIONS WITH AFFILIATES
Advisory fee
The Trust has entered into an advisory contract with Funds Management, an indirect wholly owned subsidiary of Wells Fargo & Company (“Wells Fargo”). The adviser is responsible for implementing investment policies and guidelines and for supervising the subadviser, who is responsible for day-to-day portfolio management of the Fund.
Pursuant to the contract, Funds Management is entitled to receive an annual advisory fee starting at 0.70% and declining to 0.55% as the average daily net assets of the Fund increase. For the six months ended June 30, 2015, the advisory fee was equivalent to an annual rate of 0.70% of the Fund’s average daily net assets.
Funds Management has retained the services of a subadviser to provide daily portfolio management to the Fund. The fee for subadvisory services is borne by Funds Management. WellsCap, an affiliate of Funds Management and an indirect wholly owned subsidiary of Wells Fargo, is the subadviser to the Fund and is entitled to receive a fee from Funds Management at an annual rate starting at 0.45% and declining to 0.35% as the average daily net assets of the Fund increase.
Administration fee
The Trust has entered into an administration agreement with Funds Management. Under this agreement, for providing administrative services, which includes paying fees and expenses for services provided by the transfer agent, sub-transfer agents, omnibus account servicers and record-keepers, Funds Management is entitled to receive from the Fund an annual fund level administration fee starting at 0.13% and declining to 0.11% as the average daily net assets of the Fund increase.
Funds Management has contractually waived and/or reimbursed advisory and administration fees to the extent necessary to maintain certain net operating expense ratios for the Fund. Waiver of fees and/or reimbursement of expenses by Funds Management were made first from fund level expenses on a proportionate basis and then from class specific expenses. Funds Management has committed through April 30, 2016 to waive fees and/or reimburse expenses to the extent necessary to cap the Fund’s expenses at 1.15% for Class 2 shares. After this time, the cap may be increased or the commitment to maintain the cap may be terminated only with the approval of the Board of Trustees.
Distribution fee
The Trust has adopted a Distribution Plan for Class 2 shares of the Fund pursuant to Rule 12b-1 under the 1940 Act. A distribution fee is charged to Class 2 shares and paid to Wells Fargo Funds Distributor, LLC, the principal underwriter, at an annual rate of 0.25% of the average daily net assets of Class 2 shares.
Table of Contents
| 18 | Wells Fargo Advantage VT Discovery Fund | Notes to financial statements (unaudited) |
5. INVESTMENT PORTFOLIO TRANSACTIONS
Purchases and sales of investments, excluding U.S. government obligations (if any) and short-term securities, for the six months ended June 30, 2015 were $68,758,775 and $80,197,686, respectively.
6. BANK BORROWINGS
The Trust and Wells Fargo Funds Trust (excluding the money market funds and certain other funds) are parties to a $150,000,000 revolving credit agreement, whereby the Fund is permitted to use bank borrowings for temporary or emergency purposes, such as to fund shareholder redemption requests. Interest under the credit agreement is charged to the Fund based on a borrowing rate equal to the higher of the Federal Funds rate in effect on that day plus 1.25% or the overnight LIBOR rate in effect on that day plus 1.25%. In addition, an annual commitment fee equal to 0.10% of the unused balance is allocated to each participating fund. For the six months ended June 30, 2015, the Fund paid $101 in commitment fees.
For the six months ended June 30, 2015, there were no borrowings by the Fund under the agreement.
7. CONCENTRATION RISK
Concentration risks result from exposure to a limited number of sectors. A fund that invests a substantial portion of its assets in any sector may be more affected by changes in that sector than would be a fund whose investments are not heavily weighted in any sector.
8. INDEMNIFICATION
Under the Trust’s organizational documents, the officers and Trustees have been granted certain indemnification rights against certain liabilities that may arise out of performance of their duties to the Trust. Additionally, in the normal course of business, the Trust may enter into contracts with service providers that contain a variety of indemnification clauses. The Trust’s maximum exposure under these arrangements is dependent on future claims that may be made against the Fund and, therefore, cannot be estimated.
9. SUBSEQUENT DISTRIBUTION
On July 9, 2015, the Fund declared a distribution from long-term capital gains to shareholders of record on July 8, 2015. The per share amount payable on July 10, 2015 was $4.71780 for Class 2.
These distributions are not reflected in the accompanying financial statements. The final determination of the source of all distributions is subject to change and made after the Fund’s tax year-end.
Table of Contents
| Other information (unaudited) | Wells Fargo Advantage VT Discovery Fund | 19 |
PROXY VOTING INFORMATION
A description of the policies and procedures that the Fund uses to determine how to vote proxies relating to portfolio securities is available, upon request, by calling 1-800-222-8222, visiting our website at wellsfargoadvantagefunds.com, or visiting the SEC website at sec.gov. Information regarding how the Fund voted proxies relating to portfolio securities during the most recent 12-month period ended June 30 is available on the Fund’s website at wellsfargoadvantagefunds.com or by visiting the SEC website at sec.gov.
PORTFOLIO HOLDINGS INFORMATION
The complete portfolio holdings for the Fund are publicly available monthly on the Fund’s website (wellsfargoadvantagefunds.com), on a one-month delayed basis. In addition, top ten holdings information (excluding derivative positions) for the Fund is publicly available on the Fund’s website on a monthly, seven-day or more delayed basis. The Fund files its complete schedule of portfolio holdings with the SEC for the first and third quarters of each fiscal year on Form N-Q, which is available by visiting the SEC website at sec.gov. In addition, the Fund’s Form N-Q may be reviewed and copied at the SEC’s Public Reference Room in Washington, DC, and at regional offices in New York City, at 233 Broadway, and in Chicago, at 175 West Jackson Boulevard, Suite 900. Information about the Public Reference Room may be obtained by calling 1-800-SEC-0330.
Table of Contents
| 20 | Wells Fargo Advantage VT Discovery Fund | Other information (unaudited) |
BOARD OF TRUSTEES AND OFFICERS
Each of the Trustees and Officers1 listed in the table below acts in identical capacities for each fund in the Wells Fargo Advantage family of funds, which consists of 134 mutual funds comprising the Wells Fargo Funds Trust, Wells Fargo Variable Trust, Wells Fargo Master Trust and four closed-end funds (collectively the “Fund Complex”). This table should be read in conjunction with the Prospectus and the Statement of Additional Information2. The mailing address of each Trustee and Officer is 525 Market Street, 12th Floor, San Francisco, CA 94105. Each Trustee and Officer serves an indefinite term, however, each Trustee serves such term until reaching the mandatory retirement age established by the Trustees.
Independent Trustees
| Name and year of birth | Position held and length of service* | Principal occupations during past five years or longer | Other directorships during past five years | |||
| William R. Ebsworth (Born 1957) | Trustee, since 2015** | Retired. From 1984 to 2013, equities analyst, portfolio manager, research director at Fidelity Management and Research Company and retired in 2013 as Chief Investment Officer of Fidelity Strategic Advisers, Inc. in Boston, Tokyo, and Hong Kong where he led a team of investment professionals managing client assets. Prior thereto, Board member of Hong Kong Securities Clearing Co., Hong Kong Options Clearing Corp., the Thailand International Fund, Ltd., Fidelity Investments Life Insurance Company, and Empire Fidelity Investments Life Insurance Company. Mr. Ebsworth is an Adjunct Lecturer, Finance, at Babson College and a Chartered Financial Analyst. | Asset Allocation Trust | |||
Jane A. Freeman (Born 1953) | Trustee, since 2015** | Retired. From 2012 to 2014 and 1999 to 2008, Chief Financial Officer of Scientific Learning Corporation. From 2008 to 2012, Ms. Freeman provided consulting services related to strategic business projects. Prior to 1999, Portfolio Manager at Rockefeller & Co. and Scudder, Stevens & Clark. Board member of the Harding Loevner Funds from 1996 to 2014, serving as both Lead Independent Director and chair of the Audit Committee. Board member of the Russell Exchange Traded Funds Trust from 2011 to 2012 and the chair of the Audit Committee. Ms. Freeman is a Chartered Financial Analyst (inactive), Chair of Taproot Foundation (non-profit organization) and a Board Member of Ruth Bancroft Garden (non-profit organization). | Asset Allocation Trust | |||
Peter G. Gordon (Born 1942) | Trustee, since 1998; Chairman, since 2005 | Co-Founder, Retired Chairman, President and CEO of Crystal Geyser Water Company. Trustee Emeritus, Colby College. | Asset Allocation Trust | |||
Isaiah Harris, Jr. (Born 1952) | Trustee, since 2009 | Retired. Chairman of the Board of CIGNA Corporation since 2009, and Director since 2005. From 2003 to 2011, Director of Deluxe Corporation. Prior thereto, President and CEO of BellSouth Advertising and Publishing Corp. from 2005 to 2007, President and CEO of BellSouth Enterprises from 2004 to 2005 and President of BellSouth Consumer Services from 2000 to 2003. Emeritus member of the Iowa State University Foundation Board of Governors. Emeritus Member of the Advisory Board of Iowa State University School of Business. Advisory Board Member, Palm Harbor Academy. Mr. Harris is a certified public accountant. | CIGNA Corporation; Asset Allocation Trust | |||
Judith M. Johnson (Born 1949) | Trustee, since 2008; Audit Committee Chairman, since 2008 | Retired. Prior thereto, Chief Executive Officer and Chief Investment Officer of Minneapolis Employees Retirement Fund from 1996 to 2008. Ms. Johnson is an attorney, certified public accountant and a certified managerial accountant. | Asset Allocation Trust | |||
David F. Larcker (Born 1950) | Trustee, since 2009 | James Irvin Miller Professor of Accounting at the Graduate School of Business, Stanford University, Morgan Stanley Director of the Center for Leadership Development and Research and Senior Faculty of The Rock Center for Corporate Governance since 2006. From 2005 to 2008, Professor of Accounting at the Graduate School of Business, Stanford University. Prior thereto, Ernst & Young Professor of Accounting at The Wharton School, University of Pennsylvania from 1985 to 2005. | Asset Allocation Trust |
Table of Contents
| Other information (unaudited) | Wells Fargo Advantage VT Discovery Fund | 21 |
| Name and year of birth | Position held and length of service* | Principal occupations during past five years or longer | Other directorships during past five years | |||
Olivia S. Mitchell (Born 1953) | Trustee, since 2006 | International Foundation of Employee Benefit Plans Professor, Wharton School of the University of Pennsylvania since 1993. Director of Wharton’s Pension Research Council and Boettner Center on Pensions & Retirement Research, and Research Associate at the National Bureau of Economic Research. Previously, Cornell University Professor from 1978 to 1993. | Asset Allocation Trust | |||
Timothy J. Penny (Born 1951) | Trustee, since 1996 | President and Chief Executive Officer of Southern Minnesota Initiative Foundation, a non-profit organization, since 2007 and Senior Fellow at the Humphrey Institute Policy Forum at the University of Minnesota since 1995. Member of the Board of Trustees of NorthStar Education Finance, Inc., a non-profit organization, since 2007. | Asset Allocation Trust | |||
Michael S. Scofield (Born 1943) | Trustee, since 2010 | Served on the Investment Company Institute’s Board of Governors and Executive Committee from 2008-2011 as well the Governing Council of the Independent Directors Council from 2006-2011 and the Independent Directors Council Executive Committee from 2008-2011. Chairman of the IDC from 2008-2010. Institutional Investor (Fund Directions) Trustee of Year in 2007. Trustee of the Evergreen Funds complex (and its predecessors) from 1984 to 2010. Chairman of the Evergreen Funds from 2000-2010. Former Trustee of the Mentor Funds. Retired Attorney, Law Offices of Michael S. Scofield. | Asset Allocation Trust | |||
Donald C. Willeke (Born 1940) | Trustee, since 1996 | Principal of the law firm of Willeke & Daniels. General Counsel of the Minneapolis Employees Retirement Fund from 1984 until its consolidation into the Minnesota Public Employees Retirement Association on June 30, 2010. Director and Vice Chair of The Tree Trust (non-profit corporation). Director of the American Chestnut Foundation (non-profit corporation). | Asset Allocation Trust |
| * | Length of service dates reflect the Trustee’s commencement of service with the Trust’s predecessor entities, where applicable. |
| ** | William R. Ebsworth and Jane A. Freeman each became a Trustee effective January 1, 2015. |
Officers
| Name and year of birth | Position held and length of service | Principal occupations during past five years or longer | ||||
| Karla M. Rabusch (Born 1959) | President, since 2003 | Executive Vice President of Wells Fargo Bank, N.A. and President of Wells Fargo Funds Management, LLC since 2003. | ||||
| Jeremy DePalma1 (Born 1974) | Treasurer, since 2012 | Senior Vice President of Wells Fargo Funds Management, LLC since 2009. Senior Vice President of Evergreen Investment Management Company, LLC from 2008 to 2010. Vice President, Evergreen Investment Services, Inc. from 2004 to 2007. Head of the Fund Reporting and Control Team within Fund Administration from 2005 to 2010. | ||||
| C. David Messman (Born 1960) | Secretary, since 2000; Chief Legal Officer, since 2003 | Senior Vice President and Secretary of Wells Fargo Funds Management, LLC since 2001. Assistant General Counsel of Wells Fargo Bank, N.A. since 2013 and Vice President and Managing Counsel of Wells Fargo Bank N.A. from 1996 to 2013. | ||||
| Debra Ann Early (Born 1964) | Chief Compliance Officer, since 2007 | Senior Vice President of Wells Fargo Funds Management, LLC since 2007 and Chief Compliance Officer from 2007 to 2014. Chief Compliance Officer of Parnassus Investments from 2005 to 2007. Chief Financial Officer of Parnassus Investments from 2004 to 2007 and Senior Audit Manager of PricewaterhouseCoopers LLP from 1998 to 2004. | ||||
| David Berardi (Born 1975) | Assistant Treasurer, since 2009 | Vice President of Wells Fargo Funds Management, LLC since 2009. Vice President of Evergreen Investment Management Company, LLC from 2008 to 2010. Assistant Vice President of Evergreen Investment Services, Inc. from 2004 to 2008. Manager of Fund Reporting and Control for Evergreen Investment Management Company, LLC from 2004 to 2010. |
| 1 | Jeremy DePalma acts as Treasurer of 61 funds and Assistant Treasurer of 73 funds in the Fund Complex. |
| 2 | The Statement of Additional Information includes additional information about the Trustees and is available, without charge, upon request, by calling 1-800-222-8222 or by visiting the website at wellsfargoadvantagefunds.com. |
Table of Contents
| 22 | Wells Fargo Advantage VT Discovery Fund | Other information (unaudited) |
BOARD CONSIDERATION OF INVESTMENT ADVISORY, INVESTMENT MANAGEMENT AND SUB-ADVISORY AGREEMENTS:
Under the Investment Company Act of 1940 (the “1940 Act”), the Board of Trustees (the “Board”) of Wells Fargo Variable Trust (the “Trust”) must determine annually whether to approve the continuation of the Trust’s investment advisory and sub-advisory agreements. In this regard, at an in-person meeting held on May 19-20, 2015 (the “Meeting”), the Board, all the members of which have no direct or indirect interest in the investment advisory and sub-advisory agreements and are not “interested persons” of the Trust, as defined in the 1940 Act (the “Independent Trustees”), reviewed and approved for Wells Fargo Advantage VT Discovery Fund (the “Fund”): (i) an investment advisory agreement (the “Advisory Agreement”) with Wells Fargo Funds Management, LLC (“Funds Management”); (ii) an investment management agreement (the “Management Agreement”) with Funds Management; and (iii) an investment sub-advisory agreement (the “Sub-Advisory Agreement”) with Wells Capital Management Incorporated (the “Sub-Adviser”), an affiliate of Funds Management. The Management Agreement combines the terms of the Advisory Agreement with the terms of the Fund’s Amended and Restated Administration Agreement (the “Administration Agreement”) applicable to Fund-level administrative services. The Advisory Agreement, the Management Agreement and the Sub-Advisory Agreement are collectively referred to as the “Advisory Agreements.”
At the Meeting, the Board considered the factors and reached the conclusions described below relating to the selection of Funds Management and the Sub-Adviser and the approval of the Advisory Agreements. Prior to the Meeting, including at an in-person meeting in March 2015, the Trustees conferred extensively among themselves and with representatives of Funds Management about these matters. Also, the Board has adopted a team-based approach, with each team consisting of a sub-set of Trustees, to assist the full Board in the discharge of its duties in reviewing performance and other matters throughout the year. The Independent Trustees were assisted in their evaluation of the Advisory Agreements by independent legal counsel, from whom they received separate legal advice and with whom they met separately.
In providing information to the Board, Funds Management and the Sub-Adviser were guided by a detailed set of requests for information submitted to them by independent legal counsel on behalf of the Independent Trustees at the start of the Board’s annual contract renewal process earlier in 2015. In considering and approving the Advisory Agreements, the Trustees considered the information they believed relevant, including but not limited to the information discussed below. The Board considered not only the specific information presented in connection with the Meeting, but also the knowledge gained over time through interaction with Funds Management and the Sub-Adviser about various topics. In this regard, the Board reviewed reports of Funds Management at each of its quarterly meetings, which included, among other things, portfolio reviews and performance reports. In addition, the Board and the teams mentioned above confer with portfolio managers at various times throughout the year. The Board did not identify any particular information or consideration that was all-important or controlling, and each individual Trustee may have attributed different weights to various factors.
After its deliberations, the Board unanimously approved the continuation of the Advisory Agreement for the period from June 1, 2015 through June 30, 2015, approved the Management Agreement for the period from July 1, 2015 through May 31, 2016, and approved the continuation of the Sub-Advisory Agreement for a one-year term through May 31, 2016. The Board also determined that the compensation payable to Funds Management and the Sub-Adviser under each of the Advisory Agreements was reasonable. The Board considered the approval of the Advisory Agreements for the Fund as part of its consideration of agreements for funds across the complex, but its approvals were made on a fund-by-fund basis. The following summarizes a number of important, but not necessarily all, factors considered by the Board in support of its approvals.
Nature, extent and quality of services
The Board received and considered various information regarding the nature, extent and quality of services provided to the Fund by Funds Management and the Sub-Adviser under the Advisory Agreements. This information included, among other things, a summary of the background and experience of senior management of Funds Management, and the qualifications, background, tenure and responsibilities of each of the portfolio managers primarily responsible for the day-to-day portfolio management of the Fund. The Board noted that the services to be provided to the Fund pursuant to the Management Agreement combined the advisory services previously provided to the Fund pursuant to the Fund’s Advisory Agreement with the Fund-level administrative services previously provided to the Fund pursuant to the Fund’s Administration Agreement. The Board received a representation from Funds Management that combining these services would not result in any change to the nature or level of services provided by Funds Management to the Fund.
The Board evaluated the ability of Funds Management and the Sub-Adviser to attract and retain qualified investment professionals, including research, advisory and supervisory personnel. The Board further considered the compliance
Table of Contents
| Other information (unaudited) | Wells Fargo Advantage VT Discovery Fund | 23 |
programs and compliance records of Funds Management and the Sub-Adviser. In addition, the Board took into account the full range of services provided to the Fund by Funds Management and its affiliates.
Fund performance and expenses
The Board considered the performance results for the Fund over various time periods ended March 31, 2015. The Board considered these results in comparison to the performance of funds in a universe that was determined by Lipper Inc. (“Lipper”) to be similar to the Fund (the “Universe”), and in comparison to the Fund’s benchmark index and to other comparative data. Lipper is an independent provider of investment company data. The Board received a description of the methodology used by Lipper to select the mutual funds in the performance Universe. The Board noted that the performance of the Fund (Class 2) was higher than the average performance of the Universe for all periods under review except the one-year period. The Board also noted that the performance of the Fund was lower than its benchmark, the Russell 2500™ Growth Index, for all periods under review except the five- and ten-year periods.
The Board received information concerning, and discussed factors contributing to, the underperformance of the Fund relative to the Universe and benchmark for the periods identified above. The Board took note of the explanations for the relative underperformance in these periods, including with respect to market factors and investment decisions that affected the Fund’s performance, and of longer term recent outperformance.
The Board also received and considered information regarding the Fund’s net operating expense ratio and its various components, including actual management fees (which reflect fee waivers, if any, and include advisory, administration and transfer agent fees), custodian and other non-management fees, and Rule 12b-1 and non-Rule 12b-1 service fees. The Board considered this ratio in comparison to the median ratios of funds in a class-specific expense group that was determined by Lipper to be similar to the Fund (the “Group”). The Board received a description of the methodology used by Lipper to select the mutual funds in the expense Group and an explanation of how funds comprising expense groups and their expense ratios may vary from year-to-year. Based on the Lipper reports, the Board noted that the net operating expense ratio of the Fund was lower than the median net operating expense ratio of the expense Group.
The Board took into account the Fund performance and expense information provided to it among the factors considered in deciding to re-approve the Advisory Agreement and Sub-Advisory Agreement and approve the Management Agreement.
Investment advisory and sub-advisory fee rates
The Board reviewed and considered the contractual investment advisory fee rate that is payable by the Fund to Funds Management for investment advisory services (the “Advisory Agreement Rate”), both on a stand-alone basis and on a combined basis with the Fund’s contractual administration fee rate (the “Management Rate”). The Board noted that the Management Rate includes transfer agency and sub-transfer agency costs. The Board also noted that the fee rate to be paid by the Fund under the Management Agreement will incorporate the advisory fee and Fund-level administration fee previously payable separately by the Fund under the Fund’s Advisory Agreement and Administration Agreement with Funds Management. The Board also reviewed and considered the contractual investment sub-advisory fee rate that is payable by Funds Management to the Sub-Adviser for investment sub-advisory services (the “Sub-Advisory Agreement Rate”).
Among other information reviewed by the Board was a comparison of the Management Rate of the Fund with those of other funds in the expense Group at a common asset level. The Board noted that the Management Rate of the Fund was lower than the average rate for the Fund’s expense Group.
The Board also received and considered information about the portion of the total advisory fee that was retained by Funds Management after payment of the fee to the Sub-Adviser for sub-advisory services. In assessing the reasonableness of this amount, the Board received and evaluated information about the nature and extent of responsibilities retained and risks assumed by Funds Management and not delegated to or assumed by the Sub-Adviser, and about Funds Management’s on-going oversight services. However, given the affiliation between Funds Management and the Sub-Adviser, the Board ascribed limited relevance to the allocation of the advisory fee between them.
The Board also received and considered information about the nature and extent of services offered and fee rates charged by Funds Management and the Sub-Adviser to other types of clients with investment strategies similar to those of the Fund. In this regard, the Board received information about the significantly greater scope of services, and compliance, reporting and other legal burdens and risks of managing mutual funds compared with those associated with managing assets of non-mutual fund clients such as collective funds or institutional separate accounts.
Table of Contents
| 24 | Wells Fargo Advantage VT Discovery Fund | Other information (unaudited) |
Based on its consideration of the factors and information it deemed relevant, including those described here, the Board determined that the compensation payable to Funds Management under the Management Agreement and Advisory Agreement and to the Sub-Adviser under the Sub-Advisory Agreement was reasonable, in light of the services covered by the Advisory Agreements.
Profitability
The Board received and considered information concerning the profitability of Funds Management, as well as the profitability of Wells Fargo as a whole, from providing services to the Fund and the fund family as a whole. The Board also received and considered information concerning the profitability of the Sub-Adviser from providing services to the fund family as a whole, noting that the Sub-Adviser’s profitability information with respect to providing services to the Fund was subsumed in the Wells Fargo profitability analysis.
Funds Management reported on the methodologies and estimates used in calculating profitability. Among other things, the Board noted that the levels of profitability reported on a fund-by-fund basis varied widely, depending on factors such as the size and type of fund. Based on its review, the Board did not deem the profits reported by Funds Management or Wells Fargo from its services to the Fund to be at a level that would prevent it from approving the continuation of the Advisory Agreements.
Economies of scale
With respect to possible economies of scale, the Board noted the existence of breakpoints in the Fund’s advisory and management fee structures, and the Fund’s administration fee structure, which operate generally to reduce the Fund’s expense ratios as the Fund grows in size. It considered that, for a small fund or a fund that shrinks in size, breakpoints conversely can result in higher fee levels. The Board also considered that fee waiver and expense reimbursement arrangements and competitive fee rates at the outset are means of sharing potential economies of scale with shareholders of the Fund and the fund family as a whole. The Board considered Funds Management’s view that any analyses of potential economies of scale in managing a particular fund are inherently limited in light of the joint and common costs and investments that Funds Management incurs across the fund family as a whole.
The Board concluded that the Fund’s fee and expense arrangements, including contractual breakpoints, constituted a reasonable approach to sharing potential economies of scale with the Fund and its shareholders.
Other benefits to Funds Management and the Sub-Adviser
The Board received and considered information regarding potential “fall-out” or ancillary benefits received by Funds Management and its affiliates, including the Sub-Adviser, as a result of their relationships with the Fund. Ancillary benefits could include, among others, benefits directly attributable to other relationships with the Fund and benefits potentially derived from an increase in Funds Management’s and the Sub-Adviser’s business as a result of their relationships with the Fund. The Board noted that various affiliates of Funds Management may receive distribution-related fees, shareholder servicing payments and sub-transfer agency fees in respect of shares sold or held through them and services provided.
The Board also reviewed information about soft dollar credits earned and utilized by the Sub-Adviser, fees earned by Funds Management and the Sub-Adviser from managing a private investment vehicle for the fund family’s securities lending collateral and commissions earned by an affiliated broker from portfolio transactions.
Based on its consideration of the factors and information it deemed relevant, including those described here, the Board did not find that any ancillary benefits received by Funds Management and its affiliates, including the Sub-Adviser, were unreasonable.
Conclusion
At the Meeting, after considering the above-described factors and based on its deliberations and its evaluation of the information described above, the Board unanimously approved the continuation of the Advisory Agreement for the period from June 1, 2015 through June 30, 2015, approved the Management Agreement for the period from July 1, 2015 through May 31, 2016, and approved the continuation of the Sub-Advisory Agreement for a one-year term through May 31, 2016. The Board also determined that the compensation payable to Funds Management and the Sub-Adviser under each of the Advisory Agreements was reasonable.
Table of Contents
| List of abbreviations | Wells Fargo Advantage VT Discovery Fund | 25 |
The following is a list of common abbreviations for terms and entities that may have appeared in this report.
| ACA | — ACA Financial Guaranty Corporation |
| ADR | — American depositary receipt |
| ADS | — American depositary shares |
| AGC | — Assured Guaranty Corporation |
| AGM | — Assured Guaranty Municipal |
| Ambac | — Ambac Financial Group Incorporated |
| AMT | — Alternative minimum tax |
| AUD | — Australian dollar |
| BAN | — Bond anticipation notes |
| BHAC | — Berkshire Hathaway Assurance Corporation |
| BRL | — Brazilian real |
| CAB | — Capital appreciation bond |
| CAD | — Canadian dollar |
| CCAB | — Convertible capital appreciation bond |
| CDA | — Community Development Authority |
| CDO | — Collateralized debt obligation |
| CHF | — Swiss franc |
| COP | — Columbian Peso |
| CLP | — Chilean peso |
| DKK | — Danish krone |
| DRIVER | — Derivative inverse tax-exempt receipts |
| DW&P | — Department of Water & Power |
| DWR | — Department of Water Resources |
| ECFA | — Educational & Cultural Facilities Authority |
| EDA | — Economic Development Authority |
| EDFA | — Economic Development Finance Authority |
| ETF | — Exchange-traded fund |
| EUR | — Euro |
| FDIC | — Federal Deposit Insurance Corporation |
| FFCB | — Federal Farm Credit Banks |
| FGIC | — Financial Guaranty Insurance Corporation |
| FHA | — Federal Housing Administration |
| FHLB | — Federal Home Loan Bank |
| FHLMC | — Federal Home Loan Mortgage Corporation |
| FICO | — The Financing Corporation |
| FNMA | — Federal National Mortgage Association |
| FSA | — Farm Service Agency |
| GBP | — Great British pound |
| GDR | — Global depositary receipt |
| GNMA | — Government National Mortgage Association |
| GO | — General obligation |
| HCFR | — Healthcare facilities revenue |
| HEFA | — Health & Educational Facilities Authority |
| HEFAR | — Higher education facilities authority revenue |
| HFA | — Housing Finance Authority |
| HFFA | — Health Facilities Financing Authority |
| HKD | — Hong Kong dollar |
| HUD | — Department of Housing and Urban Development |
| HUF | — Hungarian forint |
| IDA | — Industrial Development Authority |
| IDAG | — Industrial Development Agency |
| IDR | — Indonesian rupiah |
| IEP | — Irish pound |
| JPY | — Japanese yen |
| KRW | — Republic of Korea won |
| LIBOR | — London Interbank Offered Rate |
| LIFER | — Long Inverse Floating Exempt Receipts |
| LIQ | — Liquidity agreement |
| LLC | — Limited liability company |
| LLLP | — Limited liability limited partnership |
| LLP | — Limited liability partnership |
| LOC | — Letter of credit |
| LP | — Limited partnership |
| MBIA | — Municipal Bond Insurance Association |
| MFHR | — Multifamily housing revenue |
| MSTR | — Municipal securities trust receipts |
| MTN | — Medium-term note |
| MUD | — Municipal Utility District |
| MXN | — Mexican peso |
| MYR | — Malaysian ringgit |
| National | — National Public Finance Guarantee Corporation |
| NGN | — Nigerian naira |
| NOK | — Norwegian krone |
| NZD | — New Zealand dollar |
| PCFA | — Pollution Control Financing Authority |
| PCL | — Public Company Limited |
| PCR | — Pollution control revenue |
| PFA | — Public Finance Authority |
| PFFA | — Public Facilities Financing Authority |
| PFOTER | — Puttable floating option tax-exempt receipts |
| plc | — Public limited company |
| PLN | — Polish zloty |
| PUTTER | — Puttable tax-exempt receipts |
| R&D | — Research & development |
| Radian | — Radian Asset Assurance |
| RAN | — Revenue anticipation notes |
| RDA | — Redevelopment Authority |
| RDFA | — Redevelopment Finance Authority |
| REIT | — Real estate investment trust |
| ROC | — Reset option certificates |
| RON | — Romanian lei |
| RUB | — Russian ruble |
| SAVRS | — Select auction variable rate securities |
| SBA | — Small Business Authority |
| SDR | — Swedish depositary receipt |
| SEK | — Swedish krona |
| SFHR | — Single-family housing revenue |
| SFMR | — Single-family mortgage revenue |
| SGD | — Singapore dollar |
| SPA | — Standby purchase agreement |
| SPDR | — Standard & Poor’s Depositary Receipts |
| SPEAR | — Short Puttable Exempt Adjustable Receipts |
| STRIPS | — Separate trading of registered interest and |
| principal securities |
| TAN | — Tax anticipation notes |
| TBA | — To be announced |
| THB | — Thai baht |
| TIPS | — Treasury inflation-protected securities |
| TRAN | — Tax revenue anticipation notes |
| TRY | — Turkish lira |
| TTFA | — Transportation Trust Fund Authority |
| TVA | — Tennessee Valley Authority |
| ZAR | — South African rand |
Table of Contents
This page is intentionally left blank.
Table of Contents
This page is intentionally left blank.
Table of Contents
This page is intentionally left blank.
Table of Contents


For more information
More information about Wells Fargo Advantage Funds is available free upon request. To obtain literature, please write, email, visit the Fund’s website, or call:
Wells Fargo Advantage Funds
P.O. Box 8266
Boston, MA 02266-8266
Email: wfaf@wellsfargo.com
Website: wellsfargoadvantagefunds.com
Individual investors: 1-800-222-8222
Retail investment professionals: 1-888-877-9275
Institutional investment professionals: 1-866-765-0778
This report and the financial statements contained herein are submitted for the general information of the shareholders of Wells Fargo Advantage Funds. If this report is used for promotional purposes, distribution of the report must be accompanied or preceded by a current prospectus. Before investing, please consider the investment objectives, risks, charges, and expenses of the investment. For a current prospectus and, if available, a summary prospectus, containing this information, call 1-800-222-8222 or visit the Fund’s website at wellsfargoadvantagefunds.com. Read the prospectus carefully before you invest or send money.
Wells Fargo Funds Management, LLC, a wholly owned subsidiary of Wells Fargo & Company, provides investment advisory and administrative services for Wells Fargo Advantage Funds. Other affiliates of Wells Fargo & Company provide subadvisory and other services for the Funds. The Funds are distributed by Wells Fargo Funds Distributor, LLC, Member FINRA/SIPC, an affiliate of Wells Fargo & Company.
NOT FDIC INSURED ¡ NO BANK GUARANTEE ¡ MAY LOSE VALUE
© 2015 Wells Fargo Funds Management, LLC. All rights reserved.
235285 08-15 SVT1/SAR138 06-15 |
Table of Contents

Wells Fargo Advantage
VT Index Asset Allocation Fund

Semi-Annual Report
June 30, 2015

Table of Contents
Reduce clutter. Save trees.
Sign up for electronic delivery of prospectuses and shareholder reports at wellsfargo.com/advantagedelivery
| 2 | ||||
| 4 | ||||
| 6 | ||||
| 7 | ||||
Financial statements | ||||
| 27 | ||||
| 28 | ||||
| 29 | ||||
| 30 | ||||
| 31 | ||||
| 37 | ||||
| 43 | ||||
The views expressed and any forward-looking statements are as of June 30, 2015, unless otherwise noted, and are those of the Fund managers and/or Wells Fargo Funds Management, LLC. Discussions of individual securities, or the markets generally, or any Wells Fargo Advantage Fund are not intended as individual recommendations. Future events or results may vary significantly from those expressed in any forward-looking statements; the views expressed are subject to change at any time in response to changing circumstances in the market. Wells Fargo Funds Management, LLC and the Fund disclaim any obligation to publicly update or revise any views expressed or forward-looking statements.
NOT FDIC INSURED ¡ NO BANK GUARANTEE ¡ MAY LOSE VALUE
Table of Contents
| 2 | Wells Fargo Advantage VT Index Asset Allocation Fund | Letter to shareholders (unaudited) |

Karla M. Rabusch
President
Wells Fargo Advantage Funds
Domestic equity and fixed-income markets were influenced by investor concerns about increasing interest rates in the U.S., slowing growth globally, negotiations between Greece and its creditors, and reversals in China’s stock market.
Government bond yields in most developed countries increased during the second quarter.
Dear Valued Shareholder:
We are pleased to offer you this semi-annual report for the Wells Fargo Advantage VT Index Asset Allocation Fund for the six-month period that ended June 30, 2015. Domestic equity and fixed-income markets were influenced by investor concerns about increasing interest rates in the U.S., slowing growth globally, negotiations between Greece and its creditors, and reversals in China’s stock market. These concerns were counterbalanced by improving U.S. economic data and the policy efforts of central banks overseas to spark economic activity.
U.S. stock returns moderated compared with the prior two years as the stock market rally aged.
The U.S. stock market rally entered its seventh year in 2015. After delivering full-year gains of more than 30% in 2013 and more than 13% in 2014, the S&P 500 Index1 gained 1.23% during the first six months of 2015. Observers attributed a first-quarter contraction in annual gross domestic product (GDP) growth to a harsh winter, a stronger U.S. dollar, and lower capital spending by U.S. energy companies still struggling with oil and natural gas prices that remained substantially below mid-2014 levels. On the positive side, corporate earnings were generally favorable, consumer confidence improved, and the labor market continued to recover. Unemployment declined to 5.3% in June 2015 from 6.1% one year earlier.
Equity market volatility increased over the period on renewed concerns of slowing global growth and short-term interest-rate increases. At the end of 2014, stocks in 9 of the 10 economic sectors recorded positive returns for the year, with the energy sector being the lone notable exception. By comparison, half of the 10 sectors recorded negative returns for the six-month period that ended June 30, 2015. In a reversal from full-year 2014 results, mid-cap and small-cap stocks outperformed large-cap stocks for the six-month period. Growth stocks, which are stocks of companies expected to grow earnings at an above-average rate relative to the market, outperformed value stocks, which are those that tend to trade at a lower price than their dividends, earnings, sales, or other fundamental characteristics might suggest.
The U.S. Federal Reserve kept short-term interest rates low, which continued to stifle fixed-income returns. For the period, the Barclays U.S. Aggregate Bond Index2 was essentially flat. Government bond yields in most developed countries increased during the second quarter. The increases came after yields for many European sovereign bonds fell to multiyear lows during the first quarter. Despite the increases, yields remain at the low end of historical ranges generally, with U.S. yields remaining among the highest. Medium- and long-term U.S. Treasury bond yields increased modestly during the period with rates on the 30-year Treasury bond rising more significantly than the 10-year rate. The Barclays Global Aggregate ex-U.S. Dollar Bond Index3 lost 6.57%.
| 1 | The S&P 500 Index consists of 500 stocks chosen for market size, liquidity, and industry group representation. It is a market-value-weighted index with each stock’s weight in the index proportionate to its market value. You cannot invest directly in an index. |
| 2 | The Barclays U.S. Aggregate Bond Index is a broad-based benchmark that measures the investment-grade, U.S. dollar–denominated, fixed-rate taxable bond market, including Treasuries, government-related and corporate securities, MBS (agency fixed-rate and hybrid ARM pass-throughs), ABS, and CMBS. You cannot invest directly in an index. |
| 3 | The Barclays Global Aggregate ex-U.S. Dollar Bond Index tracks an international basket of government, corporate, agency, and mortgage-related bonds. You cannot invest directly in an index. |
Table of Contents
| Letter to shareholders (unaudited) | Wells Fargo Advantage VT Index Asset Allocation Fund | 3 |
In overseas markets, central banks intervened to stimulate economic activity.
In the Pacific region, the Bank of Japan maintained accommodative monetary policies as it sought to stimulate economic growth. Japan’s economy rebounded from a recession in the final quarter of 2014, and the outlook improved further in May when consumer spending in Japan increased for the first time in more than a year. Early in 2015, the European Central Bank launched a quantitative easing–related bond-buying program and kept interest rates low. Early indications were that the policies benefited economic growth in some of the larger eurozone member countries when, for the first time in five years, all four of the region’s largest economies—France, Germany, Italy, and Spain—recorded GDP growth during the first quarter of 2015. In China, economic growth remains positive but at lower levels than in recent years. In response, the People’s Bank of China reduced interest rates five times in eight months through June 30, 2015, in an effort to spark economic activity. Monetary policies intended to spur international economies can benefit U.S. companies, especially companies that maintain overseas operations or offer products and services in foreign markets.
Don’t let short-term uncertainty derail long-term investment goals.
Periods of uncertainty can present challenges, but experience has taught us that maintaining long-term investment goals can be an effective way to plan for the future. To help you create a sound strategy based on your personal goals and risk tolerance, Wells Fargo Advantage Funds offers more than 100 mutual funds spanning a wide range of asset classes and investment styles. Although diversification cannot guarantee an investment profit or prevent losses, we believe it can be an effective way to manage investment risk and potentially smooth out overall portfolio performance. We encourage investors to know their investments and to understand that appropriate levels of risk-taking may unlock opportunities.
Thank you for choosing to invest with Wells Fargo Advantage Funds. We appreciate your confidence in us and remain committed to helping you meet your financial needs.
Sincerely,

Karla M. Rabusch
President
Wells Fargo Advantage Funds
Notice to shareholders
At a meeting held on August 11–12, 2015, the Board of Trustees of the Fund approved a change in the name of the Fund whereby the word “Advantage” will be removed from its name, effective December 15, 2015.
For current information about your fund investments, contact your investment professional, visit our website at wellsfargoadvantagefunds.com, or call us directly at 1-800-222-8222. We are available 24 hours a day, 7 days a
week.
Table of Contents
| 4 | Wells Fargo Advantage VT Index Asset Allocation Fund | Performance highlights (unaudited) |
Investment objective
The Fund seeks long-term total return, consisting of capital appreciation and current income.
Adviser
Wells Fargo Funds Management, LLC
Subadviser
Wells Capital Management Incorporated
Portfolio managers
Kandarp Acharya, CFA, FRM
Christian L. Chan, CFA
Average annual total returns (%) as of June 30, 2015
| Expense ratios1 (%) | ||||||||||||||||||||||
| Inception date | 1 year | 5 year | 10 year | Gross | Net2 | |||||||||||||||||
| Class 2 | 4-15-1994 | 9.35 | 15.03 | 7.16 | 1.02 | 1.00 | ||||||||||||||||
| Index Asset Allocation Composite Index3 | – | 10.99 | 14.31 | 8.19 | – | – | ||||||||||||||||
| Barclays U.S. Treasury 20+ Year Index4,6 | – | 6.71 | 6.50 | 6.06 | – | – | ||||||||||||||||
| Barclays U.S. Treasury Index5,6 | – | 2.31 | 2.74 | 4.05 | – | – | ||||||||||||||||
| S&P 500 Index7 | – | 7.42 | 17.34 | 7.89 | – | – | ||||||||||||||||
Figures quoted represent past performance, which is no guarantee of future results and do not reflect the deduction of taxes that a shareholder may pay on fund distributions or the redemption of fund shares. Investment return and principal value of an investment will fluctuate so that an investor’s shares, when redeemed, may be worth more or less than their original cost. Current performance may be lower or higher than the performance data quoted, which assumes the reinvestment of dividends and capital gains. Current month-end performance is available by calling 1-800-222-8222. Performance figures of the Fund do not reflect fees charged pursuant to the terms of variable life insurance policies and variable annuity contracts. If fees had been reflected, performance would have been lower.
Index returns do not include transaction costs associated with buying and selling securities, any mutual fund fees or expenses, or any taxes. It is not possible to invest directly in an index.
Balanced funds may invest in stocks and bonds. Stock values fluctuate in response to the activities of individual companies and general market and economic conditions. Bond values fluctuate in response to the financial condition of individual issuers, general market and economic conditions, and changes in interest rates. Changes in market conditions and government policies may lead to periods of heightened volatility in the bond market and reduced liquidity for certain bonds held by the Fund. In general, when interest rates rise, bond values fall and investors may lose principal value. Interest-rate changes and their impact on the Fund and its share price can be sudden and unpredictable. The use of derivatives may reduce returns and/or increase volatility. Consult the Fund’s prospectus for additional information on these and other risks.
Please refer to the prospectus provided by your participating insurance company for detailed information describing the separate accounts for information regarding surrender charges, mortality and expense risk fees, and other charges that may be assessed by the participating insurance companies.
Please see footnotes on page 5.
Table of Contents
| Performance highlights (unaudited) | Wells Fargo Advantage VT Index Asset Allocation Fund | 5 |
| Ten largest holdings8 (%) as of June 30, 2015 | ||||
Apple Incorporated | 2.36 | |||
Microsoft Corporation | 1.17 | |||
Exxon Mobil Corporation | 1.14 | |||
Johnson & Johnson | 0.88 | |||
General Electric Company | 0.87 | |||
Wells Fargo & Company | 0.86 | |||
JPMorgan Chase & Company | 0.82 | |||
Berkshire Hathaway Incorporated Class B | 0.81 | |||
The Procter & Gamble Company | 0.69 | |||
Pfizer Incorporated | 0.67 | |||
| Neutral target allocation9 |
 |
| Current target allocation9 as of June 30, 2015 |
 |
| Equity sector distribution10 as of June 30, 2015 |
 |
| 1 | Reflects the expense ratios as stated in the most recent prospectus. The expense ratios shown are subject to change and may differ from the annualized expense ratios shown in the financial highlights of this report. |
| 2 | The Adviser has contractually committed through April 30, 2016, to waive fees and/or reimburse expenses to the extent necessary to cap the Fund’s Total Annual Fund Operating Expenses After Fee Waiver at the amount shown. After this time, the cap may be increased or the commitment to maintain the cap may be terminated only with the approval of the Board of Trustees. Brokerage commissions, stamp duty fees, interest, taxes, acquired fund fees and expenses, and extraordinary expenses are excluded from the cap. Without this cap, the Fund’s returns would have been lower. |
| 3 | Source: Wells Fargo Funds Management, LLC. The Index Asset Allocation Composite Index is weighted 40% in the Barclays U.S. Treasury 20+ Year Index and 60% in the S&P 500 Index. You cannot invest directly in an index. |
| 4 | The Barclays U.S. Treasury 20+ Year Index is an unmanaged index composed of securities in the U.S. Treasury Index with maturities of 20 years or greater. You cannot invest directly in an index. |
| 5 | The Barclays U.S. Treasury Index is an unmanaged index of prices of U.S. Treasury bonds with maturities of 1 to 30 years. You cannot invest directly in an index. |
| 6 | Effective April 1, 2015, the Fund changed its benchmark from the Barclays U.S. Treasury 20+ Year Index to the Barclays U.S. Treasury Index to better align its duration range. |
| 7 | The S&P 500 Index consists of 500 stocks chosen for market size, liquidity, and industry group representation. It is a market-value-weighted index with each stock’s weight in the index proportionate to its market value. You cannot invest directly in an index. |
| 8 | The ten largest holdings, excluding cash and cash equivalents, are calculated based on the value of the investments divided by total net assets of the Fund. Holdings are subject to change and may have changed since the date specified. |
| 9 | Neutral target allocation is the target allocation of the Fund as stated in the Fund’s prospectus. Current target allocation is the current allocation of the Fund based on our Tactical Asset Allocation (TAA) Model as of the date specified and is subject to change. |
| 10 | Amounts are calculated based on the total long-term equity investments of the Fund. These amounts are subject to change and may have changed since the date specified. |
Table of Contents
| 6 | Wells Fargo Advantage VT Index Asset Allocation Fund | Fund expenses (unaudited) |
As a shareholder of the Fund, you incur ongoing costs, including management fees, distribution (12b-1) fees, and other Fund expenses. This example is intended to help you understand your ongoing costs (in dollars) of investing in the Fund and to compare these costs with the ongoing costs of investing in other mutual funds.
The example is based on an investment of $1,000 invested at the beginning of the six-month period and held for the entire period from January 1, 2015 to June 30, 2015.
Actual expenses
The “Actual” line of the table below provides information about actual account values and actual expenses. You may use the information in this line, together with the amount you invested, to estimate the expenses that you paid over the period. Simply divide your account value by $1,000 (for example, an $8,600 account value divided by $1,000 = 8.6), then multiply the result by the number in the “Actual” line under the heading entitled “Expenses Paid During Period” for your applicable class of shares to estimate the expenses you paid on your account during this period.
Hypothetical example for comparison purposes
The “Hypothetical” line of the table below provides information about hypothetical account values and hypothetical expenses based on the Fund’s actual expense ratio and an assumed rate of return of 5% per year before expenses, which is not the Fund’s actual return. The hypothetical account values and expenses may not be used to estimate the actual ending account balance or expenses you paid for the period. You may use this information to compare the ongoing costs of investing in the Fund and other funds. To do so, compare this 5% hypothetical example with the 5% hypothetical examples that appear in the shareholder reports of the other funds.
Please note that the expenses shown in the table are meant to highlight your ongoing costs only and do not reflect any separate account charges assessed by participating insurance companies. Therefore, the “Hypothetical” line of the table is useful in comparing ongoing costs only, and will not help you determine the relative total costs of owning different funds. In addition, if these separate account charges assessed by participating insurance companies were included, your costs would have been higher.
| Beginning account value 1-1-2015 | Ending account value 6-30-2015 | Expenses paid during the period¹ | Net annualized expense ratio | |||||||||||||
Class 2 | ||||||||||||||||
Actual | $ | 1,000.00 | $ | 1,009.41 | $ | 4.98 | 1.00 | % | ||||||||
Hypothetical (5% return before expenses) | $ | 1,000.00 | $ | 1,019.84 | $ | 5.01 | 1.00 | % | ||||||||
| 1 | Expenses paid is equal to the annualized expense ratio multiplied by the average account value over the period, multiplied by the number of days in the most recent fiscal half-year divided by the number of days in the fiscal year (to reflect the one-half year period). |
Table of Contents
| Portfolio of investments—June 30, 2015 (unaudited) | Wells Fargo Advantage VT Index Asset Allocation Fund | 7 |
| Security name | Shares | Value | ||||||||||
Common Stocks: 59.43% | ||||||||||||
Consumer Discretionary: 7.59% | ||||||||||||
| Auto Components: 0.25% | ||||||||||||
BorgWarner Incorporated | 651 | $ | 37,003 | |||||||||
Delphi Automotive plc | 831 | 70,710 | ||||||||||
Johnson Controls Incorporated | 1,885 | 93,364 | ||||||||||
The Goodyear Tire & Rubber Company | 776 | 23,396 | ||||||||||
| 224,473 | ||||||||||||
|
| |||||||||||
| Automobiles: 0.38% | ||||||||||||
Ford Motor Company | 11,443 | 171,759 | ||||||||||
General Motors Company | 3,886 | 129,520 | ||||||||||
Harley-Davidson Incorporated | 601 | 33,866 | ||||||||||
| 335,145 | ||||||||||||
|
| |||||||||||
| Distributors: 0.04% | ||||||||||||
Genuine Parts Company | 438 | 39,214 | ||||||||||
|
| |||||||||||
| Diversified Consumer Services: 0.03% | ||||||||||||
H&R Block Incorporated | 792 | 23,483 | ||||||||||
|
| |||||||||||
| Hotels, Restaurants & Leisure: 1.04% | ||||||||||||
Carnival Corporation | 1,298 | 64,108 | ||||||||||
Chipotle Mexican Grill Incorporated † | 89 | 53,844 | ||||||||||
Darden Restaurants Incorporated | 361 | 25,660 | ||||||||||
Marriott International Incorporated Class A | 593 | 44,113 | ||||||||||
McDonald’s Corporation | 2,759 | 262,298 | ||||||||||
Royal Caribbean Cruises Limited | 474 | 37,299 | ||||||||||
Starbucks Corporation | 4,319 | 231,563 | ||||||||||
Starwood Hotels & Resorts Worldwide Incorporated | 491 | 39,815 | ||||||||||
Wyndham Worldwide Corporation | 345 | 28,259 | ||||||||||
Wynn Resorts Limited | 234 | 23,089 | ||||||||||
Yum! Brands Incorporated | 1,244 | 112,060 | ||||||||||
| �� | 922,108 | |||||||||||
|
| |||||||||||
| Household Durables: 0.27% | ||||||||||||
D.R. Horton Incorporated | 960 | 26,266 | ||||||||||
Garmin Limited | 346 | 15,200 | ||||||||||
Harman International Industries Incorporated | 204 | 24,264 | ||||||||||
Leggett & Platt Incorporated | 396 | 19,277 | ||||||||||
Lennar Corporation Class A | 514 | 26,235 | ||||||||||
Mohawk Industries Incorporated † | 177 | 33,789 | ||||||||||
Newell Rubbermaid Incorporated | 773 | 31,778 | ||||||||||
PulteGroup Incorporated | 944 | 19,022 | ||||||||||
Whirlpool Corporation | 226 | 39,109 | ||||||||||
| 234,940 | ||||||||||||
|
| |||||||||||
| Internet & Catalog Retail: 0.93% | ||||||||||||
Amazon.com Incorporated † | 1,100 | 477,499 | ||||||||||
Expedia Incorporated | 287 | 31,383 | ||||||||||
The accompanying notes are an integral part of these financial statements.
Table of Contents
| 8 | Wells Fargo Advantage VT Index Asset Allocation Fund | Portfolio of investments—June 30, 2015 (unaudited) |
| Security name | Shares | Value | ||||||||||
| Internet & Catalog Retail (continued) | ||||||||||||
Netflix Incorporated † | 174 | $ | 114,308 | |||||||||
The Priceline Group Incorporated † | 148 | 170,403 | ||||||||||
TripAdvisor Incorporated † | 322 | 28,059 | ||||||||||
| 821,652 | ||||||||||||
|
| |||||||||||
| Leisure Products: 0.06% | ||||||||||||
Hasbro Incorporated | 322 | 24,082 | ||||||||||
Mattel Incorporated | 974 | 25,022 | ||||||||||
| 49,104 | ||||||||||||
|
| |||||||||||
| Media: 2.19% | ||||||||||||
Cablevision Systems Corporation New York Group Class A | 634 | 15,178 | ||||||||||
CBS Corporation Class B | 1,302 | 72,261 | ||||||||||
Comcast Corporation Class A | 7,235 | 435,113 | ||||||||||
DIRECTV † | 1,447 | 134,267 | ||||||||||
Discovery Communications Incorporated Class A | 429 | 14,269 | ||||||||||
Discovery Communications Incorporated Class C † | 751 | 23,341 | ||||||||||
Gannett Company Incorporated † | 326 | 4,561 | ||||||||||
Interpublic Group of Companies Incorporated | 1,189 | 22,912 | ||||||||||
News Corporation Class A † | 1,441 | 21,024 | ||||||||||
Omnicom Group Incorporated | 702 | 48,782 | ||||||||||
Scripps Networks Interactive Incorporated Class A | 273 | 17,846 | ||||||||||
Tegna Incorporated | 652 | 20,910 | ||||||||||
The Walt Disney Company | 4,493 | 512,831 | ||||||||||
Time Warner Cable Incorporated | 813 | 144,852 | ||||||||||
Time Warner Incorporated | 2,373 | 207,424 | ||||||||||
Twenty-First Century Fox Incorporated Class A | 5,093 | 165,752 | ||||||||||
Viacom Incorporated Class B | 1,028 | 66,450 | ||||||||||
| 1,927,773 | ||||||||||||
|
| |||||||||||
| Multiline Retail: 0.47% | ||||||||||||
Dollar General Corporation | 855 | 66,468 | ||||||||||
Dollar Tree Incorporated † | 593 | 46,841 | ||||||||||
Family Dollar Stores Incorporated | 276 | 21,752 | ||||||||||
Kohl’s Corporation | 569 | 35,625 | ||||||||||
Macy’s Incorporated | 967 | 65,243 | ||||||||||
Nordstrom Incorporated | 405 | 30,173 | ||||||||||
Target Corporation | 1,838 | 150,036 | ||||||||||
| 416,138 | ||||||||||||
|
| |||||||||||
| Specialty Retail: 1.39% | ||||||||||||
AutoNation Incorporated † | 216 | 13,604 | ||||||||||
AutoZone Incorporated † | 90 | 60,021 | ||||||||||
Bed Bath & Beyond Incorporated † | 493 | 34,007 | ||||||||||
Best Buy Company Incorporated | 843 | 27,490 | ||||||||||
CarMax Incorporated † | 602 | 39,858 | ||||||||||
GameStop Corporation Class A | 306 | 13,146 | ||||||||||
L Brands Incorporated | 705 | 60,440 | ||||||||||
Lowe’s Companies Incorporated | 2,684 | 179,747 | ||||||||||
O’Reilly Automotive Incorporated † | 290 | 65,534 | ||||||||||
The accompanying notes are an integral part of these financial statements.
Table of Contents
| Portfolio of investments—June 30, 2015 (unaudited) | Wells Fargo Advantage VT Index Asset Allocation Fund | 9 |
| Security name | Shares | Value | ||||||||||
| Specialty Retail (continued) | ||||||||||||
Ross Stores Incorporated | 1,191 | $ | 57,895 | |||||||||
Staples Incorporated | 1,844 | 28,232 | ||||||||||
The Gap Incorporated | 756 | 28,857 | ||||||||||
The Home Depot Incorporated | 3,738 | �� | 415,404 | |||||||||
The TJX Companies Incorporated | 1,958 | 129,561 | ||||||||||
Tiffany & Company | 323 | 29,651 | ||||||||||
Tractor Supply Company | 392 | 35,256 | ||||||||||
Urban Outfitters Incorporated † | 280 | 9,800 | ||||||||||
| 1,228,503 | ||||||||||||
|
| |||||||||||
| Textiles, Apparel & Luxury Goods: 0.54% | ||||||||||||
Coach Incorporated | 795 | 27,515 | ||||||||||
Fossil Group Incorporated † | 122 | 8,462 | ||||||||||
HanesBrands Incorporated | 1,155 | 38,485 | ||||||||||
Michael Kors Holdings Limited † | 572 | 24,075 | ||||||||||
Nike Incorporated Class B | 2,004 | 216,472 | ||||||||||
PVH Corporation | 237 | 27,302 | ||||||||||
Ralph Lauren Corporation | 173 | 22,898 | ||||||||||
Under Armour Incorporated Class A † | 483 | 40,302 | ||||||||||
VF Corporation | 978 | 68,206 | ||||||||||
| 473,717 | ||||||||||||
|
| |||||||||||
Consumer Staples: 5.58% | ||||||||||||
| Beverages: 1.24% | ||||||||||||
Brown-Forman Corporation Class B | 448 | 44,881 | ||||||||||
Coca-Cola Enterprises Incorporated | 616 | 26,759 | ||||||||||
Constellation Brands Incorporated Class A | 487 | 56,502 | ||||||||||
Dr Pepper Snapple Group Incorporated | 552 | 40,241 | ||||||||||
Molson Coors Brewing Company Class B | 460 | 32,113 | ||||||||||
Monster Beverage Corporation † | 421 | 56,422 | ||||||||||
PepsiCo Incorporated | 4,248 | 396,508 | ||||||||||
The Coca-Cola Company | 11,291 | 442,946 | ||||||||||
| 1,096,372 | ||||||||||||
|
| |||||||||||
| Food & Staples Retailing: 1.42% | ||||||||||||
Costco Wholesale Corporation | 1,265 | 170,851 | ||||||||||
CVS Health Corporation | 3,248 | 340,650 | ||||||||||
Sysco Corporation | 1,710 | 61,731 | ||||||||||
The Kroger Company | 1,410 | 102,239 | ||||||||||
Wal-Mart Stores Incorporated | 4,542 | 322,164 | ||||||||||
Walgreens Boots Alliance Incorporated | 2,512 | 212,113 | ||||||||||
Whole Foods Market Incorporated | 1,030 | 40,623 | ||||||||||
| 1,250,371 | ||||||||||||
|
| |||||||||||
| Food Products: 0.99% | ||||||||||||
Archer Daniels Midland Company | 1,786 | 86,121 | ||||||||||
Campbell Soup Company | 511 | 24,349 | ||||||||||
ConAgra Foods Incorporated | 1,229 | 53,732 | ||||||||||
General Mills Incorporated | 1,715 | 95,560 | ||||||||||
The accompanying notes are an integral part of these financial statements.
Table of Contents
| 10 | Wells Fargo Advantage VT Index Asset Allocation Fund | Portfolio of investments—June 30, 2015 (unaudited) |
| Security name | Shares | Value | ||||||||||
| Food Products (continued) | ||||||||||||
Hormel Foods Corporation | 388 | $ | 21,872 | |||||||||
Kellogg Company | 721 | 45,207 | ||||||||||
Keurig Green Mountain Incorporated | 332 | 25,441 | ||||||||||
Kraft Foods Group Incorporated | 1,705 | 145,164 | ||||||||||
McCormick & Company Incorporated | 367 | 29,709 | ||||||||||
Mead Johnson Nutrition Company | 582 | 52,508 | ||||||||||
Mondelez International Incorporated Class A | 4,681 | 192,576 | ||||||||||
The Hershey Company | 422 | 37,486 | ||||||||||
The JM Smucker Company | 279 | 30,246 | ||||||||||
Tyson Foods Incorporated Class A | 839 | 35,767 | ||||||||||
| 875,738 | ||||||||||||
|
| |||||||||||
| Household Products: 1.05% | ||||||||||||
Colgate-Palmolive Company | 2,447 | 160,058 | ||||||||||
Kimberly-Clark Corporation | 1,047 | 110,951 | ||||||||||
The Clorox Company | 377 | 39,216 | ||||||||||
The Procter & Gamble Company | 7,809 | 610,976 | ||||||||||
| 921,201 | ||||||||||||
|
| |||||||||||
| Personal Products: 0.06% | ||||||||||||
The Estee Lauder Companies Incorporated Class A | 642 | 55,636 | ||||||||||
|
| |||||||||||
| Tobacco: 0.82% | ||||||||||||
Altria Group Incorporated | 5,660 | 276,831 | ||||||||||
Philip Morris International | 4,459 | 357,478 | ||||||||||
Reynolds American Incorporated | 1,197 | 89,368 | ||||||||||
| 723,677 | ||||||||||||
|
| |||||||||||
Energy: 4.68% | ||||||||||||
| Energy Equipment & Services: 0.77% | ||||||||||||
Baker Hughes Incorporated | 1,251 | 77,187 | ||||||||||
Cameron International Corporation † | 550 | 28,804 | ||||||||||
Diamond Offshore Drilling Incorporated | 192 | 4,956 | ||||||||||
Ensco plc Class A | 674 | 15,010 | ||||||||||
FMC Technologies Incorporated † | 664 | 27,549 | ||||||||||
Halliburton Company | 2,449 | 105,478 | ||||||||||
Helmerich & Payne Incorporated | 309 | 21,760 | ||||||||||
National Oilwell Varco Incorporated | 1,116 | 53,880 | ||||||||||
Noble Corporation plc | 696 | 10,711 | ||||||||||
Schlumberger Limited | 3,654 | 314,938 | ||||||||||
Transocean Limited « | 983 | 15,846 | ||||||||||
| 676,119 | ||||||||||||
|
| |||||||||||
| Oil, Gas & Consumable Fuels: 3.91% | ||||||||||||
Anadarko Petroleum Corporation | 1,462 | 114,124 | ||||||||||
Apache Corporation | 1,085 | 62,529 | ||||||||||
Cabot Oil & Gas Corporation | 1,191 | 37,564 | ||||||||||
Chesapeake Energy Corporation | 1,490 | 16,643 | ||||||||||
Chevron Corporation | 5,412 | 522,096 | ||||||||||
Cimarex Energy Company | 269 | 29,673 | ||||||||||
The accompanying notes are an integral part of these financial statements.
Table of Contents
| Portfolio of investments—June 30, 2015 (unaudited) | Wells Fargo Advantage VT Index Asset Allocation Fund | 11 |
| Security name | Shares | Value | ||||||||||
| Oil, Gas & Consumable Fuels (continued) | ||||||||||||
ConocoPhillips | 3,549 | $ | 217,944 | |||||||||
CONSOL Energy Incorporated | 658 | 14,305 | ||||||||||
Devon Energy Corporation | 1,112 | 66,153 | ||||||||||
EOG Resources Incorporated | 1,580 | 138,329 | ||||||||||
EQT Corporation | 438 | 35,627 | ||||||||||
Exxon Mobil Corporation | 12,034 | 1,001,229 | ||||||||||
Hess Corporation | 702 | 46,950 | ||||||||||
Kinder Morgan Incorporated | 4,993 | 191,681 | ||||||||||
Marathon Oil Corporation | 1,942 | 51,541 | ||||||||||
Marathon Petroleum Corporation | 1,564 | 81,813 | ||||||||||
Murphy Oil Corporation | 481 | 19,995 | ||||||||||
Newfield Exploration Company † | 467 | 16,868 | ||||||||||
Noble Energy Incorporated | 1,114 | 47,546 | ||||||||||
Occidental Petroleum Corporation | 2,211 | 171,949 | ||||||||||
ONEOK Incorporated | 600 | 23,688 | ||||||||||
Phillips 66 | 1,561 | 125,754 | ||||||||||
Pioneer Natural Resources Company | 429 | 59,498 | ||||||||||
QEP Resources Incorporated | 467 | 8,644 | ||||||||||
Range Resources Corporation | 478 | 23,604 | ||||||||||
Southwestern Energy Company † | 1,114 | 25,321 | ||||||||||
Spectra Energy Corporation | 1,933 | 63,016 | ||||||||||
Tesoro Corporation | 362 | 30,556 | ||||||||||
The Williams Companies Incorporated | 1,940 | 111,337 | ||||||||||
Valero Energy Corporation | 1,463 | 91,584 | ||||||||||
| 3,447,561 | ||||||||||||
|
| |||||||||||
Financials: 9.82% | ||||||||||||
| Banks: 3.69% | ||||||||||||
Bank of America Corporation | 30,229 | 514,498 | ||||||||||
BB&T Corporation | 2,104 | 84,812 | ||||||||||
Citigroup Incorporated | 8,733 | 482,411 | ||||||||||
Comerica Incorporated | 512 | 26,276 | ||||||||||
Fifth Third Bancorp | 2,331 | 48,531 | ||||||||||
Huntington Bancshares Incorporated | 2,327 | 26,318 | ||||||||||
JPMorgan Chase & Company | 10,682 | 723,812 | ||||||||||
KeyCorp | 2,442 | 36,679 | ||||||||||
M&T Bank Corporation | 382 | 47,723 | ||||||||||
People’s United Financial Incorporated | 890 | 14,427 | ||||||||||
PNC Financial Services Group Incorporated | 1,490 | 142,519 | ||||||||||
Regions Financial Corporation | 3,858 | 39,969 | ||||||||||
SunTrust Banks Incorporated | 1,485 | 63,885 | ||||||||||
US Bancorp | 5,103 | 221,470 | ||||||||||
Wells Fargo & Company (l) | 13,487 | 758,509 | ||||||||||
Zions Bancorporation | 584 | 18,533 | ||||||||||
| 3,250,372 | ||||||||||||
|
| |||||||||||
| Capital Markets: 1.39% | ||||||||||||
Affiliated Managers Group Incorporated † | 157 | 34,320 | ||||||||||
Ameriprise Financial Incorporated | 521 | 65,089 | ||||||||||
Bank of New York Mellon Corporation | 3,228 | 135,479 | ||||||||||
The accompanying notes are an integral part of these financial statements.
Table of Contents
| 12 | Wells Fargo Advantage VT Index Asset Allocation Fund | Portfolio of investments—June 30, 2015 (unaudited) |
| Security name | Shares | Value | ||||||||||
| Capital Markets (continued) | ||||||||||||
BlackRock Incorporated | 364 | $ | 125,937 | |||||||||
Charles Schwab Corporation | 3,327 | 108,627 | ||||||||||
E*TRADE Financial Corporation † | 834 | 24,978 | ||||||||||
Franklin Resources Incorporated | 1,122 | 55,012 | ||||||||||
Goldman Sachs Group Incorporated | 1,156 | 241,361 | ||||||||||
Invesco Limited | 1,240 | 46,488 | ||||||||||
Legg Mason Incorporated | 280 | 14,428 | ||||||||||
Morgan Stanley | 4,423 | 171,568 | ||||||||||
Northern Trust Corporation | 631 | 48,246 | ||||||||||
State Street Corporation | 1,185 | 91,245 | ||||||||||
T. Rowe Price Group Incorporated | 755 | 58,686 | ||||||||||
| 1,221,464 | ||||||||||||
|
| |||||||||||
| Consumer Finance: 0.48% | ||||||||||||
American Express Company | 2,514 | 195,388 | ||||||||||
Capital One Financial Corporation | 1,573 | 138,377 | ||||||||||
Discover Financial Services | 1,273 | 73,350 | ||||||||||
Navient Corporation | 1,120 | 20,395 | ||||||||||
| 427,510 | ||||||||||||
|
| |||||||||||
| Diversified Financial Services: 1.18% | ||||||||||||
Berkshire Hathaway Incorporated Class B † | 5,249 | 714,441 | ||||||||||
CME Group Incorporated | 913 | 84,964 | ||||||||||
Intercontinental Exchange Incorporated | 321 | 71,779 | ||||||||||
Leucadia National Corporation | 908 | 22,046 | ||||||||||
McGraw Hill Financial Incorporated | 788 | 79,155 | ||||||||||
Moody’s Corporation | 512 | 55,276 | ||||||||||
The NASDAQ OMX Group Incorporated | 341 | 16,644 | ||||||||||
| 1,044,305 | ||||||||||||
|
| |||||||||||
| Insurance: 1.63% | ||||||||||||
ACE Limited | 940 | 95,579 | ||||||||||
AFLAC Incorporated | 1,248 | 77,626 | ||||||||||
American International Group Incorporated | 3,837 | 237,203 | ||||||||||
Aon plc | 810 | 80,741 | ||||||||||
Assurant Incorporated | 194 | 12,998 | ||||||||||
Cincinnati Financial Corporation | 425 | 21,327 | ||||||||||
Genworth Financial Incorporated Class A † | 1,432 | 10,840 | ||||||||||
Lincoln National Corporation | 728 | 43,112 | ||||||||||
Loews Corporation | 855 | 32,926 | ||||||||||
Marsh & McLennan Companies Incorporated | 1,549 | 87,828 | ||||||||||
MetLife Incorporated | 3,212 | 179,840 | ||||||||||
Principal Financial Group Incorporated | 789 | 40,468 | ||||||||||
Prudential Financial Incorporated | 1,304 | 114,126 | ||||||||||
The Allstate Corporation | 1,177 | 76,352 | ||||||||||
The Chubb Corporation | 661 | 62,888 | ||||||||||
The Hartford Financial Services Group Incorporated | 1,208 | 50,217 | ||||||||||
The Progressive Corporation | 1,536 | 42,747 | ||||||||||
The Travelers Companies Incorporated | 917 | 88,637 | ||||||||||
Torchmark Corporation | 362 | 21,076 | ||||||||||
The accompanying notes are an integral part of these financial statements.
Table of Contents
| Portfolio of investments—June 30, 2015 (unaudited) | Wells Fargo Advantage VT Index Asset Allocation Fund | 13 |
| Security name | Shares | Value | ||||||||||
| Insurance (continued) | ||||||||||||
UnumProvident Corporation | 718 | $ | 25,669 | |||||||||
XL Group plc | 882 | 32,810 | ||||||||||
| 1,435,010 | ||||||||||||
|
| |||||||||||
| Real Estate Management & Development: 0.03% | ||||||||||||
CBRE Group Incorporated Class A † | 805 | 29,785 | ||||||||||
|
| |||||||||||
| REITs: 1.40% | ||||||||||||
American Tower Corporation | 1,218 | 113,627 | ||||||||||
Apartment Investment & Management Company Class A | 450 | 16,619 | ||||||||||
AvalonBay Communities Incorporated | 380 | 60,751 | ||||||||||
Boston Properties Incorporated | 441 | 53,379 | ||||||||||
Crown Castle International Corporation | 971 | 77,971 | ||||||||||
Equity Residential | 1,047 | 73,468 | ||||||||||
Essex Property Trust Incorporated | 187 | 39,738 | ||||||||||
General Growth Properties Incorporated | 1,811 | 46,470 | ||||||||||
HCP Incorporated | 1,328 | 48,432 | ||||||||||
Health Care REIT Incorporated | 1,010 | 66,286 | ||||||||||
Host Hotels & Resorts Incorporated | 2,181 | 43,249 | ||||||||||
Iron Mountain Incorporated | 539 | 16,709 | ||||||||||
Kimco Realty Corporation | 1,188 | 26,778 | ||||||||||
Plum Creek Timber Company | 505 | 20,488 | ||||||||||
Prologis Incorporated | 1,508 | 55,947 | ||||||||||
Public Storage Incorporated | 417 | 76,882 | ||||||||||
Realty Income Corporation | 669 | 29,697 | ||||||||||
Simon Property Group Incorporated | 896 | 155,026 | ||||||||||
SL Green Realty Corporation | 286 | 31,429 | ||||||||||
The Macerich Company | 404 | 30,138 | ||||||||||
Ventas Incorporated | 952 | 59,110 | ||||||||||
Vornado Realty Trust | 504 | 47,845 | ||||||||||
Weyerhaeuser Company | 1,490 | 46,935 | ||||||||||
| 1,236,974 | ||||||||||||
|
| |||||||||||
| Thrifts & Mortgage Finance: 0.02% | ||||||||||||
Hudson City Bancorp Incorporated | 1,387 | 13,704 | ||||||||||
|
| |||||||||||
Health Care: 9.18% | ||||||||||||
| Biotechnology: 1.91% | ||||||||||||
Alexion Pharmaceuticals Incorporated † | 644 | 116,416 | ||||||||||
Amgen Incorporated | 2,188 | 335,902 | ||||||||||
Biogen Incorporated † | 677 | 273,467 | ||||||||||
Celgene Corporation † | 2,283 | 264,223 | ||||||||||
Gilead Sciences Incorporated | 4,229 | 495,131 | ||||||||||
Regeneron Pharmaceuticals Incorporated † | 216 | 110,188 | ||||||||||
Vertex Pharmaceuticals Incorporated † | 701 | 86,559 | ||||||||||
| 1,681,886 | ||||||||||||
|
| |||||||||||
| Health Care Equipment & Supplies: 1.34% | ||||||||||||
Abbott Laboratories | 4,285 | 210,308 | ||||||||||
Baxter International Incorporated | 1,566 | 109,510 | ||||||||||
The accompanying notes are an integral part of these financial statements.
Table of Contents
| 14 | Wells Fargo Advantage VT Index Asset Allocation Fund | Portfolio of investments—June 30, 2015 (unaudited) |
| Security name | Shares | Value | ||||||||||
| Health Care Equipment & Supplies (continued) | ||||||||||||
Becton Dickinson & Company | 602 | $ | 85,273 | |||||||||
Boston Scientific Corporation † | 3,859 | 68,304 | ||||||||||
C.R. Bard Incorporated | 213 | 36,359 | ||||||||||
DENTSPLY International Incorporated | 402 | 20,723 | ||||||||||
Edwards Lifesciences Corporation † | 309 | 44,011 | ||||||||||
Henry Schein Incorporated † | 240 | 34,109 | ||||||||||
Intuitive Surgical Incorporated † | 106 | 51,357 | ||||||||||
Medtronic plc | 4,102 | 303,958 | ||||||||||
St. Jude Medical Incorporated | 805 | 58,821 | ||||||||||
Stryker Corporation | 860 | 82,190 | ||||||||||
Varian Medical Systems Incorporated † | 287 | 24,203 | ||||||||||
Zimmer Holdings Incorporated | �� | 490 | 53,523 | |||||||||
| 1,182,649 | ||||||||||||
|
| |||||||||||
| Health Care Providers & Services: 1.72% | ||||||||||||
Aetna Incorporated | 1,005 | 128,097 | ||||||||||
AmerisourceBergen Corporation | 600 | 63,804 | ||||||||||
Anthem Incorporated | 761 | 124,911 | ||||||||||
Cardinal Health Incorporated | 952 | 79,635 | ||||||||||
Cigna Corporation | 741 | 120,042 | ||||||||||
DaVita HealthCare Partners Incorporated † | 494 | 39,258 | ||||||||||
Express Scripts Holding Company † | 2,099 | 186,685 | ||||||||||
HCA Holdings Incorporated † | 834 | 75,660 | ||||||||||
Humana Incorporated | 430 | 82,250 | ||||||||||
Laboratory Corporation of America Holdings † | 288 | 34,911 | ||||||||||
McKesson Corporation | 666 | 149,723 | ||||||||||
Patterson Companies Incorporated | 246 | 11,968 | ||||||||||
Quest Diagnostics Incorporated | 412 | 29,878 | ||||||||||
Tenet Healthcare Corporation † | 285 | 16,496 | ||||||||||
UnitedHealth Group Incorporated | 2,740 | 334,280 | ||||||||||
Universal Health Services Incorporated Class B | 262 | 37,230 | ||||||||||
| 1,514,828 | ||||||||||||
|
| |||||||||||
| Health Care Technology: 0.07% | ||||||||||||
Cerner Corporation † | 881 | 60,842 | ||||||||||
|
| |||||||||||
| Life Sciences Tools & Services: 0.26% | ||||||||||||
Agilent Technologies Incorporated | 959 | 36,998 | ||||||||||
PerkinElmer Incorporated | 325 | 17,108 | ||||||||||
Thermo Fisher Scientific Incorporated | 1,146 | 148,705 | ||||||||||
Waters Corporation † | 237 | 30,426 | ||||||||||
| 233,237 | ||||||||||||
|
| |||||||||||
| Pharmaceuticals: 3.88% | ||||||||||||
AbbVie Incorporated | 4,950 | 332,591 | ||||||||||
Allergan plc † | 1,129 | 342,606 | ||||||||||
Bristol-Myers Squibb Company | 4,798 | 319,259 | ||||||||||
Eli Lilly & Company | 2,811 | 234,690 | ||||||||||
Endo International plc † | 583 | 46,436 | ||||||||||
Hospira Incorporated † | 497 | 44,089 | ||||||||||
The accompanying notes are an integral part of these financial statements.
Table of Contents
| Portfolio of investments—June 30, 2015 (unaudited) | Wells Fargo Advantage VT Index Asset Allocation Fund | 15 |
| Security name | Shares | Value | ||||||||||
| Pharmaceuticals (continued) | ||||||||||||
Johnson & Johnson | 7,981 | $ | 777,828 | |||||||||
Mallinckrodt plc † | 336 | 39,554 | ||||||||||
Merck & Company Incorporated | 8,132 | 462,955 | ||||||||||
Mylan NV † | 1,185 | 80,414 | ||||||||||
Perrigo Company plc | 420 | 77,629 | ||||||||||
Pfizer Incorporated | 17,724 | 594,286 | ||||||||||
Zoetis Incorporated | 1,439 | 69,389 | ||||||||||
| 3,421,726 | ||||||||||||
|
| |||||||||||
Industrials: 5.99% | ||||||||||||
| Aerospace & Defense: 1.55% | ||||||||||||
General Dynamics Corporation | 899 | 127,379 | ||||||||||
Honeywell International Incorporated | 2,250 | 229,433 | ||||||||||
L-3 Communications Holdings Incorporated | 236 | 26,758 | ||||||||||
Lockheed Martin Corporation | 770 | 143,143 | ||||||||||
Northrop Grumman Corporation | 558 | 88,516 | ||||||||||
Precision Castparts Corporation | 397 | 79,348 | ||||||||||
Raytheon Company | 878 | 84,007 | ||||||||||
Rockwell Collins Incorporated | 380 | 35,093 | ||||||||||
Textron Incorporated | 799 | 35,659 | ||||||||||
The Boeing Company | 1,850 | 256,632 | ||||||||||
United Technologies Corporation | 2,383 | 264,346 | ||||||||||
| 1,370,314 | ||||||||||||
|
| |||||||||||
| Air Freight & Logistics: 0.43% | ||||||||||||
C.H. Robinson Worldwide Incorporated | 419 | 26,141 | ||||||||||
Expeditors International of Washington Incorporated | 550 | 25,358 | ||||||||||
FedEx Corporation | 758 | 129,163 | ||||||||||
United Parcel Service Incorporated Class B | 1,997 | 193,529 | ||||||||||
| 374,191 | ||||||||||||
|
| |||||||||||
| Airlines: 0.27% | ||||||||||||
American Airlines Group Incorporated | 1,994 | 79,630 | ||||||||||
Delta Air Lines Incorporated | 2,364 | 97,113 | ||||||||||
Southwest Airlines Company | 1,923 | 63,632 | ||||||||||
| 240,375 | ||||||||||||
|
| |||||||||||
| Building Products: 0.05% | ||||||||||||
Allegion plc | 275 | 16,539 | ||||||||||
Masco Corporation | 1,000 | 26,670 | ||||||||||
| 43,209 | ||||||||||||
|
| |||||||||||
| Commercial Services & Supplies: 0.25% | ||||||||||||
Cintas Corporation | 273 | 23,093 | ||||||||||
Pitney Bowes Incorporated | 580 | 12,070 | ||||||||||
Republic Services Incorporated | 718 | 28,124 | ||||||||||
Stericycle Incorporated † | 244 | 32,674 | ||||||||||
The ADT Corporation | 493 | 16,550 | ||||||||||
The accompanying notes are an integral part of these financial statements.
Table of Contents
| 16 | Wells Fargo Advantage VT Index Asset Allocation Fund | Portfolio of investments—June 30, 2015 (unaudited) |
| Security name | Shares | Value | ||||||||||
| Commercial Services & Supplies (continued) | ||||||||||||
Tyco International plc | 1,213 | $ | 46,676 | |||||||||
Waste Management Incorporated | 1,225 | 56,779 | ||||||||||
| 215,966 | ||||||||||||
|
| |||||||||||
| Construction & Engineering: 0.06% | ||||||||||||
Fluor Corporation | 423 | 22,423 | ||||||||||
Jacobs Engineering Group Incorporated † | 361 | 14,664 | ||||||||||
Quanta Services Incorporated † | 609 | 17,551 | ||||||||||
| 54,638 | ||||||||||||
|
| |||||||||||
| Electrical Equipment: 0.32% | ||||||||||||
AMETEK Incorporated | 694 | 38,017 | ||||||||||
Eaton Corporation plc | 1,344 | 90,707 | ||||||||||
Emerson Electric Company | 1,923 | 106,592 | ||||||||||
Rockwell Automation Incorporated | 387 | 48,236 | ||||||||||
| 283,552 | ||||||||||||
|
| |||||||||||
| Industrial Conglomerates: 1.42% | ||||||||||||
3M Company | 1,825 | 281,598 | ||||||||||
Danaher Corporation | 1,772 | 151,665 | ||||||||||
General Electric Company | 29,002 | 770,583 | ||||||||||
Roper Industries Incorporated | 289 | 49,841 | ||||||||||
| 1,253,687 | ||||||||||||
|
| |||||||||||
| Machinery: 0.89% | ||||||||||||
Caterpillar Incorporated | 1,738 | 147,417 | ||||||||||
Cummins Incorporated | 482 | 63,234 | ||||||||||
Deere & Company | 961 | 93,265 | ||||||||||
Dover Corporation | 461 | 32,353 | ||||||||||
Flowserve Corporation | 387 | 20,379 | ||||||||||
Illinois Tool Works Incorporated | 973 | 89,312 | ||||||||||
Ingersoll-Rand plc | 761 | 51,307 | ||||||||||
Joy Global Incorporated | 280 | 10,136 | ||||||||||
Paccar Incorporated | 1,021 | 65,150 | ||||||||||
Pall Corporation | 307 | 38,206 | ||||||||||
Parker Hannifin Corporation | 399 | 46,416 | ||||||||||
Pentair plc | 517 | 35,544 | ||||||||||
Snap-on Incorporated | 167 | 26,595 | ||||||||||
Stanley Black & Decker Incorporated | 442 | 46,516 | ||||||||||
Xylem Incorporated | 521 | 19,313 | ||||||||||
| 785,143 | ||||||||||||
|
| |||||||||||
| Professional Services: 0.13% | ||||||||||||
Dun & Bradstreet Corporation | 103 | 12,566 | ||||||||||
Equifax Incorporated | 342 | 33,205 | ||||||||||
Nielsen Holdings NV | 1,062 | 47,546 | ||||||||||
Robert Half International Incorporated | 388 | 21,534 | ||||||||||
| 114,851 | ||||||||||||
|
| |||||||||||
The accompanying notes are an integral part of these financial statements.
Table of Contents
| Portfolio of investments—June 30, 2015 (unaudited) | Wells Fargo Advantage VT Index Asset Allocation Fund | 17 |
| Security name | Shares | Value | ||||||||||
| Road & Rail: 0.51% | ||||||||||||
CSX Corporation | 2,843 | $ | 92,824 | |||||||||
Kansas City Southern | 318 | 29,002 | ||||||||||
Norfolk Southern Corporation | 877 | 76,615 | ||||||||||
Ryder System Incorporated | 153 | 13,368 | ||||||||||
Union Pacific Corporation | 2,519 | 240,237 | ||||||||||
| 452,046 | ||||||||||||
|
| |||||||||||
| Trading Companies & Distributors: 0.11% | ||||||||||||
Fastenal Company | 782 | 32,985 | ||||||||||
United Rentals Incorporated † | 279 | 24,446 | ||||||||||
W.W. Grainger Incorporated | 171 | 40,467 | ||||||||||
| 97,898 | ||||||||||||
|
| |||||||||||
Information Technology: 11.70% | ||||||||||||
| Communications Equipment: 0.91% | ||||||||||||
Cisco Systems Incorporated | 14,639 | 401,987 | ||||||||||
F5 Networks Incorporated † | 206 | 24,792 | ||||||||||
Harris Corporation | 353 | 27,149 | ||||||||||
Juniper Networks Incorporated | 1,011 | 26,256 | ||||||||||
Motorola Solutions Incorporated | 533 | 30,562 | ||||||||||
QUALCOMM Incorporated | 4,690 | 293,735 | ||||||||||
| 804,481 | ||||||||||||
|
| |||||||||||
| Electronic Equipment, Instruments & Components: 0.24% | ||||||||||||
Amphenol Corporation Class A | 889 | 51,535 | ||||||||||
Corning Incorporated | 3,622 | 71,462 | ||||||||||
FLIR Systems Incorporated | 403 | 12,420 | ||||||||||
TE Connectivity Limited | 1,170 | 75,231 | ||||||||||
| 210,648 | ||||||||||||
|
| |||||||||||
| Internet Software & Services: 2.02% | ||||||||||||
Akamai Technologies Incorporated † | 514 | 35,887 | ||||||||||
eBay Incorporated † | 3,182 | 191,684 | ||||||||||
Equinix Incorporated | 165 | 41,910 | ||||||||||
Facebook Incorporated Class A † | 6,063 | 519,993 | ||||||||||
Google Incorporated Class A † | 823 | 444,453 | ||||||||||
Google Incorporated Class C † | 826 | 429,941 | ||||||||||
VeriSign Incorporated † | 301 | 18,578 | ||||||||||
Yahoo! Incorporated † | 2,512 | 98,696 | ||||||||||
| 1,781,142 | ||||||||||||
|
| |||||||||||
| IT Services: 2.01% | ||||||||||||
Accenture plc Class A | 1,802 | 174,398 | ||||||||||
Alliance Data Systems Corporation † | 177 | 51,673 | ||||||||||
Automatic Data Processing Incorporated | 1,351 | 108,391 | ||||||||||
Cognizant Technology Solutions Corporation Class A † | 1,757 | 107,335 | ||||||||||
Computer Sciences Corporation | 396 | 25,993 | ||||||||||
Fidelity National Information Services Incorporated | 815 | 50,367 | ||||||||||
Fiserv Incorporated † | 681 | 56,407 | ||||||||||
The accompanying notes are an integral part of these financial statements.
Table of Contents
| 18 | Wells Fargo Advantage VT Index Asset Allocation Fund | Portfolio of investments—June 30, 2015 (unaudited) |
| Security name | Shares | Value | ||||||||||
| IT Services (continued) | ||||||||||||
International Business Machines Corporation | 2,635 | $ | 428,609 | |||||||||
MasterCard Incorporated Class A | 2,789 | 260,716 | ||||||||||
Paychex Incorporated | 941 | 44,114 | ||||||||||
Teradata Corporation † | 407 | 15,059 | ||||||||||
The Western Union Company | 1,486 | 30,210 | ||||||||||
Total System Services Incorporated | 471 | 19,674 | ||||||||||
Visa Incorporated Class A | 5,563 | 373,555 | ||||||||||
Xerox Corporation | 2,987 | 31,782 | ||||||||||
| 1,778,283 | ||||||||||||
|
| |||||||||||
| Semiconductors & Semiconductor Equipment: 1.43% | ||||||||||||
Altera Corporation | 866 | 44,339 | ||||||||||
Analog Devices Incorporated | 902 | 57,895 | ||||||||||
Applied Materials Incorporated | 3,545 | 68,135 | ||||||||||
Avago Technologies Limited | 739 | 98,235 | ||||||||||
Broadcom Corporation Class A | 1,565 | 80,582 | ||||||||||
First Solar Incorporated † | 217 | 10,195 | ||||||||||
Intel Corporation | 13,655 | 415,317 | ||||||||||
KLA-Tencor Corporation | 460 | 25,857 | ||||||||||
Lam Research Corporation | 455 | 37,014 | ||||||||||
Linear Technology Corporation | 689 | 30,474 | ||||||||||
Microchip Technology Incorporated « | 581 | 27,554 | ||||||||||
Micron Technology Incorporated † | 3,101 | 58,423 | ||||||||||
NVIDIA Corporation | 1,470 | 29,562 | ||||||||||
Qorvo Incorporated † | 429 | 34,436 | ||||||||||
Skyworks Solutions Incorporated | 549 | 57,151 | ||||||||||
Texas Instruments Incorporated | 2,994 | 154,221 | ||||||||||
Xilinx Incorporated | 744 | 32,855 | ||||||||||
| 1,262,245 | ||||||||||||
|
| |||||||||||
| Software: 2.21% | ||||||||||||
Adobe Systems Incorporated † | 1,368 | 110,822 | ||||||||||
Autodesk Incorporated † | 655 | 32,799 | ||||||||||
CA Incorporated | 911 | 26,683 | ||||||||||
Citrix Systems Incorporated † | 461 | 32,344 | ||||||||||
Electronic Arts Incorporated † | 894 | 59,451 | ||||||||||
Intuit Incorporated | 793 | 79,911 | ||||||||||
Microsoft Corporation | 23,284 | 1,027,989 | ||||||||||
Oracle Corporation | 9,176 | 369,793 | ||||||||||
Red Hat Incorporated † | 527 | 40,015 | ||||||||||
Salesforce.com Incorporated † | 1,755 | 122,201 | ||||||||||
Symantec Corporation | 1,959 | 45,547 | ||||||||||
| 1,947,555 | ||||||||||||
|
| |||||||||||
| Technology Hardware, Storage & Peripherals: 2.88% | ||||||||||||
Apple Incorporated | 16,582 | 2,079,797 | ||||||||||
EMC Corporation | 5,589 | 147,494 | ||||||||||
Hewlett-Packard Company | 5,199 | 156,022 | ||||||||||
NetApp Incorporated | 897 | 28,309 | ||||||||||
SanDisk Corporation | 598 | 34,816 | ||||||||||
The accompanying notes are an integral part of these financial statements.
Table of Contents
| Portfolio of investments—June 30, 2015 (unaudited) | Wells Fargo Advantage VT Index Asset Allocation Fund | 19 |
| Security name | Shares | Value | ||||||||||
| Technology Hardware, Storage & Peripherals (continued) | ||||||||||||
Seagate Technology plc | 913 | $ | 43,368 | |||||||||
Western Digital Corporation | 625 | 49,013 | ||||||||||
| 2,538,819 | ||||||||||||
|
| |||||||||||
Materials: 1.86% | ||||||||||||
| Chemicals: 1.40% | ||||||||||||
Air Products & Chemicals Incorporated | 556 | 76,077 | ||||||||||
Airgas Incorporated | 194 | 20,521 | ||||||||||
CF Industries Holdings Incorporated | 677 | 43,518 | ||||||||||
E.I. du Pont de Nemours & Company | 2,605 | 166,590 | ||||||||||
Eastman Chemical Company | 428 | 35,019 | ||||||||||
Ecolab Incorporated | 771 | 87,177 | ||||||||||
FMC Corporation | 384 | 20,179 | ||||||||||
International Flavors & Fragrances Incorporated | 231 | 25,246 | ||||||||||
LyondellBasell Industries NV Class A | 1,131 | 117,081 | ||||||||||
Monsanto Company | 1,370 | 146,028 | ||||||||||
PPG Industries Incorporated | 782 | 89,711 | ||||||||||
Praxair Incorporated | 830 | 99,227 | ||||||||||
Sigma-Aldrich Corporation | 343 | 47,797 | ||||||||||
The Dow Chemical Company | 3,119 | 159,599 | ||||||||||
The Mosaic Company | 893 | 41,837 | ||||||||||
The Sherwin-Williams Company | 227 | 62,430 | ||||||||||
| 1,238,037 | ||||||||||||
|
| |||||||||||
| Construction Materials: 0.06% | ||||||||||||
Martin Marietta Materials Incorporated | 177 | 25,047 | ||||||||||
Vulcan Materials Company | 381 | 31,977 | ||||||||||
| 57,024 | ||||||||||||
|
| |||||||||||
| Containers & Packaging: 0.12% | ||||||||||||
Avery Dennison Corporation | 261 | 15,905 | ||||||||||
Ball Corporation | 396 | 27,779 | ||||||||||
MeadWestvaco Corporation | 482 | 22,746 | ||||||||||
Owens-Illinois Incorporated † | 463 | 10,621 | ||||||||||
Sealed Air Corporation | 604 | 31,034 | ||||||||||
| 108,085 | ||||||||||||
|
| |||||||||||
| Metals & Mining: 0.21% | ||||||||||||
Alcoa Incorporated | 3,519 | 39,237 | ||||||||||
Allegheny Technologies Incorporated | 314 | 9,483 | ||||||||||
Freeport-McMoRan Incorporated | 2,993 | 55,730 | ||||||||||
Newmont Mining Corporation | 1,521 | 35,531 | ||||||||||
Nucor Corporation | 919 | 40,500 | ||||||||||
| 180,481 | ||||||||||||
|
| |||||||||||
| Paper & Forest Products: 0.07% | ||||||||||||
International Paper Company | 1,216 | 57,869 | ||||||||||
|
| |||||||||||
The accompanying notes are an integral part of these financial statements.
Table of Contents
| 20 | Wells Fargo Advantage VT Index Asset Allocation Fund | Portfolio of investments—June 30, 2015 (unaudited) |
| Security name | Shares | Value | ||||||||||
Telecommunication Services: 1.35% | ||||||||||||
| Diversified Telecommunication Services: 1.35% | ||||||||||||
AT&T Incorporated | 14,948 | $ | 530,953 | |||||||||
CenturyLink Incorporated | 1,623 | 47,684 | ||||||||||
Frontier Communications Corporation | 3,317 | 16,419 | ||||||||||
Level 3 Communications Incorporated † | 847 | 44,611 | ||||||||||
Verizon Communications Incorporated | 11,739 | 547,155 | ||||||||||
| 1,186,822 | ||||||||||||
|
| |||||||||||
Utilities: 1.68% | ||||||||||||
| Electric Utilities: 0.95% | ||||||||||||
American Electric Power Company Incorporated | 1,410 | 74,688 | ||||||||||
Duke Energy Corporation | 1,990 | 140,534 | ||||||||||
Edison International | 937 | 52,078 | ||||||||||
Entergy Corporation | 517 | 36,449 | ||||||||||
Eversource Energy | 914 | 41,505 | ||||||||||
Exelon Corporation | 2,480 | 77,922 | ||||||||||
FirstEnergy Corporation | 1,214 | 39,516 | ||||||||||
NextEra Energy Incorporated | 1,278 | 125,282 | ||||||||||
Pepco Holdings Incorporated | 727 | 19,585 | ||||||||||
Pinnacle West Capital Corporation | 318 | 18,091 | ||||||||||
PPL Corporation | 1,924 | 56,700 | ||||||||||
The Southern Company | 2,614 | 109,527 | ||||||||||
Xcel Energy Incorporated | 1,459 | 46,951 | ||||||||||
| 838,828 | ||||||||||||
|
| |||||||||||
| Gas Utilities: 0.02% | ||||||||||||
AGL Resources Incorporated | 345 | 16,063 | ||||||||||
|
| |||||||||||
| Independent Power & Renewable Electricity Producers: 0.05% | ||||||||||||
AES Corporation | 1,964 | 26,043 | ||||||||||
NRG Energy Incorporated | 960 | 21,965 | ||||||||||
| 48,008 | ||||||||||||
|
| |||||||||||
| Multi-Utilities: 0.66% | ||||||||||||
Ameren Corporation | 697 | 26,263 | ||||||||||
CenterPoint Energy Incorporated | 1,238 | 23,559 | ||||||||||
CMS Energy Corporation | 794 | 25,281 | ||||||||||
Consolidated Edison Incorporated | 843 | 48,793 | ||||||||||
Dominion Resources Incorporated | 1,708 | 114,214 | ||||||||||
DTE Energy Company | 516 | 38,514 | ||||||||||
NiSource Incorporated | 914 | 41,669 | ||||||||||
PG&E Corporation | 1,382 | 67,856 | ||||||||||
Public Service Enterprise Group Incorporated | 1,456 | 57,192 | ||||||||||
SCANA Corporation | 410 | 20,767 | ||||||||||
Sempra Energy | 669 | 66,191 | ||||||||||
TECO Energy Incorporated | 676 | 11,938 | ||||||||||
WEC Energy Group Incorporated | 905 | 40,706 | ||||||||||
| 582,943 | ||||||||||||
|
| |||||||||||
Total Common Stocks (Cost $30,663,030) | 52,420,420 | |||||||||||
|
| |||||||||||
The accompanying notes are an integral part of these financial statements.
Table of Contents
| Portfolio of investments—June 30, 2015 (unaudited) | Wells Fargo Advantage VT Index Asset Allocation Fund | 21 |
| Security name | Shares | Value | ||||||||||||||
Rights: 0.00% | ||||||||||||||||
Safeway Casa Ley Contingent Value Rights (Consumer Staples, Food & Staples Retailing) †(a)(i) | 684 | $ | 0 | |||||||||||||
Safeway PDC Contingent Value Rights(Consumer Staples, Food & Staples Retailing) †(a)(i) | 684 | 0 | ||||||||||||||
Total Rights (Cost $725) | 0 | |||||||||||||||
|
| |||||||||||||||
| Interest rate | Maturity date | Principal | ||||||||||||||
| U.S. Treasury Securities: 38.03% | ||||||||||||||||
U.S. Treasury Bond | 2.50 | % | 2-15-2045 | $ | 225,000 | 197,086 | ||||||||||
U.S. Treasury Bond | 2.75 | 8-15-2042 | 126,000 | 116,816 | ||||||||||||
U.S. Treasury Bond | 2.75 | 11-15-2042 | 155,000 | 143,532 | ||||||||||||
U.S. Treasury Bond | 2.88 | 5-15-2043 | 220,000 | 208,656 | ||||||||||||
U.S. Treasury Bond | 3.00 | 5-15-2042 | 84,000 | 81,920 | ||||||||||||
U.S. Treasury Bond | 3.00 | 11-15-2044 | 224,000 | 218,068 | ||||||||||||
U.S. Treasury Bond | 3.00 | 5-15-2045 | 148,000 | 144,346 | ||||||||||||
U.S. Treasury Bond | 3.13 | 11-15-2041 | 66,000 | 66,134 | ||||||||||||
U.S. Treasury Bond | 3.13 | 2-15-2042 | 87,000 | 87,082 | ||||||||||||
U.S. Treasury Bond | 3.13 | 2-15-2043 | 158,000 | 157,469 | ||||||||||||
U.S. Treasury Bond | 3.13 | 8-15-2044 | 223,000 | 222,303 | ||||||||||||
U.S. Treasury Bond | 3.38 | 5-15-2044 | 223,000 | 233,122 | ||||||||||||
U.S. Treasury Bond | 3.50 | 2-15-2039 | 61,000 | 65,470 | ||||||||||||
U.S. Treasury Bond | 3.63 | 8-15-2043 | 182,000 | 199,304 | ||||||||||||
U.S. Treasury Bond | 3.63 | 2-15-2044 | 221,000 | 241,891 | ||||||||||||
U.S. Treasury Bond | 3.75 | 8-15-2041 | 68,000 | 76,022 | ||||||||||||
U.S. Treasury Bond | 3.75 | 11-15-2043 | 220,000 | 246,297 | ||||||||||||
U.S. Treasury Bond | 3.88 | 8-15-2040 | 71,000 | 80,757 | ||||||||||||
U.S. Treasury Bond | 4.25 | 5-15-2039 | 57,000 | 68,511 | ||||||||||||
U.S. Treasury Bond | 4.25 | 11-15-2040 | 74,000 | 89,164 | ||||||||||||
U.S. Treasury Bond | 4.38 | 2-15-2038 | 32,000 | 39,203 | ||||||||||||
U.S. Treasury Bond | 4.38 | 11-15-2039 | 57,000 | 69,807 | ||||||||||||
U.S. Treasury Bond | 4.38 | 5-15-2040 | 83,000 | 101,792 | ||||||||||||
U.S. Treasury Bond | 4.38 | 5-15-2041 | 65,000 | 79,996 | ||||||||||||
U.S. Treasury Bond | 4.50 | 2-15-2036 | 70,000 | 87,702 | ||||||||||||
U.S. Treasury Bond | 4.50 | 5-15-2038 | 36,000 | 44,828 | ||||||||||||
U.S. Treasury Bond | 4.50 | 8-15-2039 | 59,000 | 73,561 | ||||||||||||
U.S. Treasury Bond | 4.63 | 2-15-2040 | 102,000 | 129,548 | ||||||||||||
U.S. Treasury Bond | 4.75 | 2-15-2037 | 24,000 | 30,986 | ||||||||||||
U.S. Treasury Bond | 4.75 | 2-15-2041 | 88,000 | 114,146 | ||||||||||||
U.S. Treasury Bond | 5.00 | 5-15-2037 | 29,000 | 38,729 | ||||||||||||
U.S. Treasury Bond | 5.25 | 11-15-2028 | 45,000 | 58,549 | ||||||||||||
U.S. Treasury Bond | 5.25 | 2-15-2029 | 33,000 | 42,980 | ||||||||||||
U.S. Treasury Bond | 5.38 | 2-15-2031 | 70,000 | 93,909 | ||||||||||||
U.S. Treasury Bond | 5.50 | 8-15-2028 | 35,000 | 46,454 | ||||||||||||
U.S. Treasury Bond | 6.00 | 2-15-2026 | 42,000 | 56,319 | ||||||||||||
U.S. Treasury Bond | 6.13 | 11-15-2027 | 49,000 | 67,831 | ||||||||||||
U.S. Treasury Bond | 6.13 | 8-15-2029 | 25,000 | 35,311 | ||||||||||||
U.S. Treasury Bond | 6.25 | 5-15-2030 | 45,000 | 64,811 | ||||||||||||
U.S. Treasury Bond | 6.38 | 8-15-2027 | 21,000 | 29,548 | ||||||||||||
U.S. Treasury Bond | 6.50 | 11-15-2026 | 28,000 | 39,331 | ||||||||||||
U.S. Treasury Bond | 6.63 | 2-15-2027 | 18,000 | 25,608 | ||||||||||||
The accompanying notes are an integral part of these financial statements.
Table of Contents
| 22 | Wells Fargo Advantage VT Index Asset Allocation Fund | Portfolio of investments—June 30, 2015 (unaudited) |
| Security name | Interest rate | Maturity date | Principal | Value | ||||||||||||
U.S. Treasury Securities (continued) | ||||||||||||||||
U.S. Treasury Bond | 6.75 | % | 8-15-2026 | $ | 21,000 | $ | 29,905 | |||||||||
U.S. Treasury Bond | 6.88 | 8-15-2025 | 21,000 | 29,674 | ||||||||||||
U.S. Treasury Note | 0.88 | 11-30-2016 | 185,000 | 186,012 | ||||||||||||
U.S. Treasury Note | 1.38 | 2-29-2020 | 184,000 | 182,289 | ||||||||||||
U.S. Treasury Note | 1.50 | 1-31-2022 | 152,000 | 146,989 | ||||||||||||
U.S. Treasury Note | 0.38 | 10-31-2016 | 153,000 | 152,833 | ||||||||||||
U.S. Treasury Note | 0.50 | 7-31-2016 | 153,000 | 153,203 | ||||||||||||
U.S. Treasury Note | 0.50 | 8-31-2016 | 153,000 | 153,155 | ||||||||||||
U.S. Treasury Note | 0.50 | 9-30-2016 | 153,000 | 153,144 | ||||||||||||
U.S. Treasury Note | 0.50 | 11-30-2016 | 146,000 | 146,034 | ||||||||||||
U.S. Treasury Note | 0.50 | 1-31-2017 | 136,000 | 135,904 | ||||||||||||
U.S. Treasury Note | 0.50 | 2-28-2017 | 136,000 | 135,862 | ||||||||||||
U.S. Treasury Note | 0.50 | 3-31-2017 | 136,000 | 135,798 | ||||||||||||
U.S. Treasury Note | 0.50 | 4-30-2017 | 136,000 | 135,724 | ||||||||||||
U.S. Treasury Note | 0.50 | 7-31-2017 | 160,000 | 159,400 | ||||||||||||
U.S. Treasury Note | 0.63 | 8-15-2016 | 169,000 | 169,436 | ||||||||||||
U.S. Treasury Note | 0.63 | 10-15-2016 | 156,000 | 156,354 | ||||||||||||
U.S. Treasury Note | 0.63 | 11-15-2016 | 159,000 | 159,348 | ||||||||||||
U.S. Treasury Note | 0.63 | 12-15-2016 | 159,000 | 159,298 | ||||||||||||
U.S. Treasury Note | 0.63 | 12-31-2016 | 142,000 | 142,244 | ||||||||||||
U.S. Treasury Note | 0.63 | 2-15-2017 | 156,000 | 156,159 | ||||||||||||
U.S. Treasury Note | 0.63 | 5-31-2017 | 317,000 | 316,827 | ||||||||||||
U.S. Treasury Note | 0.63 | 6-30-2017 | 135,000 | 134,926 | ||||||||||||
U.S. Treasury Note | 0.63 | 8-31-2017 | 184,000 | 183,641 | ||||||||||||
U.S. Treasury Note | 0.63 | 9-30-2017 | 160,000 | 159,512 | ||||||||||||
U.S. Treasury Note | 0.63 | 11-30-2017 | 184,000 | 183,109 | ||||||||||||
U.S. Treasury Note | 0.63 | 4-30-2018 | 164,000 | 162,411 | ||||||||||||
U.S. Treasury Note | 0.75 | 1-15-2017 | 159,000 | 159,522 | ||||||||||||
U.S. Treasury Note | 0.75 | 3-15-2017 | 159,000 | 159,522 | ||||||||||||
U.S. Treasury Note | 0.75 | 6-30-2017 | 173,000 | 173,311 | ||||||||||||
U.S. Treasury Note | 0.75 | 10-31-2017 | 157,000 | 156,792 | ||||||||||||
U.S. Treasury Note | 0.75 | 12-31-2017 | 163,000 | 162,567 | ||||||||||||
U.S. Treasury Note | 0.75 | 2-28-2018 | 153,000 | 152,307 | ||||||||||||
U.S. Treasury Note | 0.75 | 3-31-2018 | 133,000 | 132,252 | ||||||||||||
U.S. Treasury Note | 0.75 | 4-15-2018 | 127,000 | 126,256 | ||||||||||||
U.S. Treasury Note | 0.88 | 9-15-2016 | 162,000 | 162,873 | ||||||||||||
U.S. Treasury Note | 0.88 | 12-31-2016 | 185,000 | 186,012 | ||||||||||||
U.S. Treasury Note | 0.88 | 1-31-2017 | 182,000 | 182,938 | ||||||||||||
U.S. Treasury Note | 0.88 | 2-28-2017 | 179,000 | 179,895 | ||||||||||||
U.S. Treasury Note | 0.88 | 4-15-2017 | 159,000 | 159,770 | ||||||||||||
U.S. Treasury Note | 0.88 | 4-30-2017 | 183,000 | 183,872 | ||||||||||||
U.S. Treasury Note | 0.88 | 5-15-2017 | 152,000 | 152,665 | ||||||||||||
U.S. Treasury Note | 0.88 | 6-15-2017 | 149,000 | 149,652 | ||||||||||||
U.S. Treasury Note | 0.88 | 7-15-2017 | 142,000 | 142,555 | ||||||||||||
U.S. Treasury Note | 0.88 | 8-15-2017 | 142,000 | 142,499 | ||||||||||||
U.S. Treasury Note | 0.88 | 10-15-2017 | 143,000 | 143,257 | ||||||||||||
U.S. Treasury Note | 0.88 | 11-15-2017 | 135,000 | 135,179 | ||||||||||||
U.S. Treasury Note | 0.88 | 1-15-2018 | 125,000 | 124,981 | ||||||||||||
U.S. Treasury Note | 0.88 | 1-31-2018 | 115,000 | 114,991 | ||||||||||||
U.S. Treasury Note | 0.88 | 7-31-2019 | 76,000 | 74,373 | ||||||||||||
The accompanying notes are an integral part of these financial statements.
Table of Contents
| Portfolio of investments—June 30, 2015 (unaudited) | Wells Fargo Advantage VT Index Asset Allocation Fund | 23 |
| Security name | Interest rate | Maturity date | Principal | Value | ||||||||||||
U.S. Treasury Securities (continued) | ||||||||||||||||
U.S. Treasury Note | 1.00 | % | 8-31-2016 | $ | 185,000 | $ | 186,257 | |||||||||
U.S. Treasury Note | 1.00 | 9-30-2016 | 186,000 | 187,337 | ||||||||||||
U.S. Treasury Note | 1.00 | 10-31-2016 | 186,000 | 187,322 | ||||||||||||
U.S. Treasury Note | 1.00 | 3-31-2017 | 172,000 | 173,236 | ||||||||||||
U.S. Treasury Note | 1.00 | 9-15-2017 | 142,000 | 142,788 | ||||||||||||
U.S. Treasury Note | 1.00 | 12-15-2017 | 132,000 | 132,495 | ||||||||||||
U.S. Treasury Note | 1.00 | 2-15-2018 | 125,000 | 125,303 | ||||||||||||
U.S. Treasury Note | 1.00 | 3-15-2018 | 125,000 | 125,225 | ||||||||||||
U.S. Treasury Note | 1.00 | 5-15-2018 | 124,000 | 124,058 | ||||||||||||
U.S. Treasury Note | 1.00 | 5-31-2018 | 176,000 | 175,945 | ||||||||||||
U.S. Treasury Note | 1.00 | 6-30-2019 | 58,000 | 57,125 | ||||||||||||
U.S. Treasury Note | 1.00 | 8-31-2019 | 79,000 | 77,562 | ||||||||||||
U.S. Treasury Note | 1.00 | 9-30-2019 | 100,000 | 98,055 | ||||||||||||
U.S. Treasury Note | 1.00 | 11-30-2019 | 117,000 | 114,340 | ||||||||||||
U.S. Treasury Note | 1.13 | 6-15-2018 | 124,000 | 124,397 | ||||||||||||
U.S. Treasury Note | 1.13 | 5-31-2019 | 65,000 | 64,431 | ||||||||||||
U.S. Treasury Note | 1.13 | 12-31-2019 | 117,000 | 114,834 | ||||||||||||
U.S. Treasury Note | 1.13 | 3-31-2020 | 93,000 | 90,900 | ||||||||||||
U.S. Treasury Note | 1.13 | 4-30-2020 | 125,000 | 122,012 | ||||||||||||
U.S. Treasury Note | 1.25 | 10-31-2018 | 165,000 | 165,451 | ||||||||||||
U.S. Treasury Note | 1.25 | 11-30-2018 | 155,000 | 155,291 | ||||||||||||
U.S. Treasury Note | 1.25 | 1-31-2019 | 125,000 | 124,961 | ||||||||||||
U.S. Treasury Note | 1.25 | 4-30-2019 | 51,000 | 50,853 | ||||||||||||
U.S. Treasury Note | 1.25 | 10-31-2019 | 75,000 | 74,262 | ||||||||||||
U.S. Treasury Note | 1.25 | 1-31-2020 | 184,000 | 181,413 | ||||||||||||
U.S. Treasury Note | 1.25 | 2-29-2020 | 103,000 | 101,391 | ||||||||||||
U.S. Treasury Note | 1.38 | 6-30-2018 | 127,000 | 128,300 | ||||||||||||
U.S. Treasury Note | 1.38 | 7-31-2018 | 151,000 | 152,416 | ||||||||||||
U.S. Treasury Note | 1.38 | 9-30-2018 | 249,000 | 250,887 | ||||||||||||
U.S. Treasury Note | 1.38 | 11-30-2018 | 74,000 | 74,526 | ||||||||||||
U.S. Treasury Note | 1.38 | 12-31-2018 | 91,000 | 91,462 | ||||||||||||
U.S. Treasury Note | 1.38 | 2-28-2019 | 121,000 | 121,350 | ||||||||||||
U.S. Treasury Note | 1.38 | 1-31-2020 | 122,000 | 120,961 | ||||||||||||
U.S. Treasury Note | 1.38 | 3-31-2020 | 184,000 | 182,045 | ||||||||||||
U.S. Treasury Note | 1.38 | 4-30-2020 | 184,000 | 181,829 | ||||||||||||
U.S. Treasury Note | 1.38 | 5-31-2020 | 129,000 | 127,327 | ||||||||||||
U.S. Treasury Note | 1.50 | 7-31-2016 | 184,000 | 186,214 | ||||||||||||
U.S. Treasury Note | 1.50 | 8-31-2018 | 241,000 | 243,975 | ||||||||||||
U.S. Treasury Note | 1.50 | 12-31-2018 | 174,000 | 175,604 | ||||||||||||
U.S. Treasury Note | 1.50 | 1-31-2019 | 161,000 | 162,359 | ||||||||||||
U.S. Treasury Note | 1.50 | 2-28-2019 | 171,000 | 172,323 | ||||||||||||
U.S. Treasury Note | 1.50 | 3-31-2019 | 60,000 | 60,422 | ||||||||||||
U.S. Treasury Note | 1.50 | 5-31-2019 | 184,000 | 184,920 | ||||||||||||
U.S. Treasury Note | 1.50 | 10-31-2019 | 184,000 | 183,943 | ||||||||||||
U.S. Treasury Note | 1.50 | 11-30-2019 | 185,000 | 184,884 | ||||||||||||
U.S. Treasury Note | 1.50 | 5-31-2020 | 183,000 | 181,813 | ||||||||||||
U.S. Treasury Note | 1.63 | 3-31-2019 | 177,000 | 179,005 | ||||||||||||
U.S. Treasury Note | 1.63 | 4-30-2019 | 159,000 | 160,677 | ||||||||||||
U.S. Treasury Note | 1.63 | 6-30-2019 | 183,000 | 184,601 | ||||||||||||
U.S. Treasury Note | 1.63 | 7-31-2019 | 180,000 | 181,434 | ||||||||||||
The accompanying notes are an integral part of these financial statements.
Table of Contents
| 24 | Wells Fargo Advantage VT Index Asset Allocation Fund | Portfolio of investments—June 30, 2015 (unaudited) |
| Security name | Interest rate | Maturity date | Principal | Value | ||||||||||||
U.S. Treasury Securities (continued) | ||||||||||||||||
U.S. Treasury Note | 1.63 | % | 8-31-2019 | $ | 184,000 | $ | 185,323 | |||||||||
U.S. Treasury Note | 1.63 | 12-31-2019 | 184,000 | 184,589 | ||||||||||||
U.S. Treasury Note | 1.63 | 6-30-2020 | 182,000 | 181,815 | ||||||||||||
U.S. Treasury Note | 1.63 | 8-15-2022 | 117,000 | 113,289 | ||||||||||||
U.S. Treasury Note | 1.63 | 11-15-2022 | 179,000 | 172,805 | ||||||||||||
U.S. Treasury Note | 1.75 | 10-31-2018 | 66,000 | 67,305 | ||||||||||||
U.S. Treasury Note | 1.75 | 9-30-2019 | 183,000 | 185,044 | ||||||||||||
U.S. Treasury Note | 1.75 | 10-31-2020 | 148,000 | 148,000 | ||||||||||||
U.S. Treasury Note | 1.75 | 2-28-2022 | 153,000 | 150,179 | ||||||||||||
U.S. Treasury Note | 1.75 | 3-31-2022 | 154,000 | 151,064 | ||||||||||||
U.S. Treasury Note | 1.75 | 4-30-2022 | 151,000 | 148,015 | ||||||||||||
U.S. Treasury Note | 1.75 | 5-15-2022 | 136,000 | 133,248 | ||||||||||||
U.S. Treasury Note | 1.75 | 5-15-2023 | 270,000 | 260,888 | ||||||||||||
U.S. Treasury Note | 1.88 | 8-31-2017 | 142,000 | 145,539 | ||||||||||||
U.S. Treasury Note | 1.88 | 9-30-2017 | 122,000 | 125,031 | ||||||||||||
U.S. Treasury Note | 1.88 | 10-31-2017 | 139,000 | 142,453 | ||||||||||||
U.S. Treasury Note | 1.88 | 6-30-2020 | 86,000 | 86,907 | ||||||||||||
U.S. Treasury Note | 1.88 | 11-30-2021 | 154,000 | 152,845 | ||||||||||||
U.S. Treasury Note | 1.88 | 5-31-2022 | 150,000 | 148,184 | ||||||||||||
U.S. Treasury Note | 2.00 | 7-31-2020 | 122,000 | 123,992 | ||||||||||||
U.S. Treasury Note | 2.00 | 9-30-2020 | 106,000 | 107,491 | ||||||||||||
U.S. Treasury Note | 2.00 | 11-30-2020 | 122,000 | 123,458 | ||||||||||||
U.S. Treasury Note | 2.00 | 2-28-2021 | 136,000 | 137,148 | ||||||||||||
U.S. Treasury Note | 2.00 | 5-31-2021 | 146,000 | 146,821 | ||||||||||||
U.S. Treasury Note | 2.00 | 8-31-2021 | 154,000 | 154,361 | ||||||||||||
U.S. Treasury Note | 2.00 | 10-31-2021 | 154,000 | 154,120 | ||||||||||||
U.S. Treasury Note | 2.00 | 11-15-2021 | 216,000 | 216,169 | ||||||||||||
U.S. Treasury Note | 2.00 | 2-15-2022 | 157,000 | 156,816 | ||||||||||||
U.S. Treasury Note | 2.00 | 6-30-2022 | 151,000 | 151,484 | ||||||||||||
U.S. Treasury Note | 2.00 | 2-15-2023 | 265,000 | 261,750 | ||||||||||||
U.S. Treasury Note | 2.00 | 2-15-2025 | 347,000 | 336,644 | ||||||||||||
U.S. Treasury Note | 2.13 | 8-31-2020 | 138,000 | 140,879 | ||||||||||||
U.S. Treasury Note | 2.13 | 1-31-2021 | 132,000 | 134,124 | ||||||||||||
U.S. Treasury Note | 2.13 | 6-30-2021 | 142,000 | 143,631 | ||||||||||||
U.S. Treasury Note | 2.13 | 8-15-2021 | 212,000 | 214,186 | ||||||||||||
U.S. Treasury Note | 2.13 | 9-30-2021 | 153,000 | 154,386 | ||||||||||||
U.S. Treasury Note | 2.13 | 12-31-2021 | 152,000 | 153,045 | ||||||||||||
U.S. Treasury Note | 2.13 | 5-15-2025 | 234,000 | 229,375 | ||||||||||||
U.S. Treasury Note | 2.25 | 11-30-2017 | 117,000 | 121,013 | ||||||||||||
U.S. Treasury Note | 2.25 | 7-31-2018 | 49,000 | 50,761 | ||||||||||||
U.S. Treasury Note | 2.25 | 3-31-2021 | 135,000 | 137,816 | ||||||||||||
U.S. Treasury Note | 2.25 | 4-30-2021 | 142,000 | 144,873 | ||||||||||||
U.S. Treasury Note | 2.25 | 7-31-2021 | 154,000 | 156,767 | ||||||||||||
U.S. Treasury Note | 2.25 | 11-15-2024 | 347,000 | 344,289 | ||||||||||||
U.S. Treasury Note | 2.38 | 7-31-2017 | 117,000 | 121,040 | ||||||||||||
U.S. Treasury Note | 2.38 | 5-31-2018 | 58,000 | 60,297 | ||||||||||||
U.S. Treasury Note | 2.38 | 6-30-2018 | 74,000 | 76,920 | ||||||||||||
U.S. Treasury Note | 2.38 | 12-31-2020 | 123,000 | 126,738 | ||||||||||||
U.S. Treasury Note | 2.38 | 8-15-2024 | 348,000 | 349,359 | ||||||||||||
U.S. Treasury Note | 2.50 | 6-30-2017 | 107,000 | 110,904 | ||||||||||||
U.S. Treasury Note | 2.50 | 8-15-2023 | 230,000 | 234,690 | ||||||||||||
The accompanying notes are an integral part of these financial statements.
Table of Contents
| Portfolio of investments—June 30, 2015 (unaudited) | Wells Fargo Advantage VT Index Asset Allocation Fund | 25 |
| Security name | Interest rate | Maturity date | Principal | Value | ||||||||||||
U.S. Treasury Securities (continued) | ||||||||||||||||
U.S. Treasury Note | 2.50 | % | 5-15-2024 | $ | 339,000 | $ | 344,350 | |||||||||
U.S. Treasury Note | 2.63 | 1-31-2018 | 81,000 | 84,607 | ||||||||||||
U.S. Treasury Note | 2.63 | 4-30-2018 | 62,000 | 64,872 | ||||||||||||
U.S. Treasury Note | 2.63 | 8-15-2020 | 180,000 | 188,142 | ||||||||||||
U.S. Treasury Note | 2.63 | 11-15-2020 | 290,000 | 302,755 | ||||||||||||
U.S. Treasury Note | 2.75 | 11-30-2016 | 127,000 | 131,028 | ||||||||||||
U.S. Treasury Note | 2.75 | 5-31-2017 | 106,000 | 110,265 | ||||||||||||
U.S. Treasury Note | 2.75 | 12-31-2017 | 90,000 | 94,240 | ||||||||||||
U.S. Treasury Note | 2.75 | 2-28-2018 | 71,000 | 74,422 | ||||||||||||
U.S. Treasury Note | 2.75 | 2-15-2019 | 128,000 | 134,670 | ||||||||||||
U.S. Treasury Note | 2.75 | 11-15-2023 | 303,000 | 314,623 | ||||||||||||
U.S. Treasury Note | 2.75 | 2-15-2024 | 261,000 | 270,624 | ||||||||||||
U.S. Treasury Note | 2.88 | 3-31-2018 | 80,000 | 84,162 | ||||||||||||
U.S. Treasury Note | 3.00 | 8-31-2016 | 121,000 | 124,639 | ||||||||||||
U.S. Treasury Note | 3.00 | 9-30-2016 | 124,000 | 127,962 | ||||||||||||
U.S. Treasury Note | 3.00 | 2-28-2017 | 113,000 | 117,546 | ||||||||||||
U.S. Treasury Note | 3.13 | 10-31-2016 | 141,000 | 145,979 | ||||||||||||
U.S. Treasury Note | 3.13 | 1-31-2017 | 139,000 | 144,647 | ||||||||||||
U.S. Treasury Note | 3.13 | 4-30-2017 | 107,000 | 111,915 | ||||||||||||
U.S. Treasury Note | 3.13 | 5-15-2019 | 166,000 | 177,049 | ||||||||||||
U.S. Treasury Note | 3.13 | 5-15-2021 | 155,000 | 165,668 | ||||||||||||
U.S. Treasury Note | 3.25 | 7-31-2016 | 117,000 | 120,592 | ||||||||||||
U.S. Treasury Note | 3.25 | 12-31-2016 | 119,000 | 123,862 | ||||||||||||
U.S. Treasury Note | 3.25 | 3-31-2017 | 120,000 | 125,578 | ||||||||||||
U.S. Treasury Note | 3.38 | 11-15-2019 | 191,000 | 206,026 | ||||||||||||
U.S. Treasury Note | 3.50 | 2-15-2018 | 120,000 | 128,053 | ||||||||||||
U.S. Treasury Note | 3.50 | 5-15-2020 | 165,000 | 179,296 | ||||||||||||
U.S. Treasury Note | 3.63 | 8-15-2019 | 145,000 | 157,721 | ||||||||||||
U.S. Treasury Note | 3.63 | 2-15-2020 | 230,000 | 250,970 | ||||||||||||
U.S. Treasury Note | 3.63 | 2-15-2021 | 240,000 | 263,175 | ||||||||||||
U.S. Treasury Note | 3.75 | 11-15-2018 | 141,000 | 153,051 | ||||||||||||
U.S. Treasury Note | 3.88 | 5-15-2018 | 65,000 | 70,337 | ||||||||||||
U.S. Treasury Note | 4.00 | 8-15-2018 | 74,000 | 80,781 | ||||||||||||
U.S. Treasury Note | 4.25 | 11-15-2017 | 86,000 | 92,961 | ||||||||||||
U.S. Treasury Note | 4.50 | 5-15-2017 | 65,000 | 69,672 | ||||||||||||
U.S. Treasury Note | 4.63 | 11-15-2016 | 97,000 | 102,502 | ||||||||||||
U.S. Treasury Note | 4.63 | 2-15-2017 | 79,000 | 84,184 | ||||||||||||
U.S. Treasury Note | 4.75 | 8-15-2017 | 80,000 | 86,825 | ||||||||||||
U.S. Treasury Note | 4.88 | 8-15-2016 | 86,000 | 90,293 | ||||||||||||
U.S. Treasury Note | 6.25 | 8-15-2023 | 35,000 | 45,634 | ||||||||||||
U.S. Treasury Note | 7.13 | 2-15-2023 | 24,000 | 32,527 | ||||||||||||
U.S. Treasury Note | 7.25 | 8-15-2022 | 24,000 | 32,364 | ||||||||||||
U.S. Treasury Note | 7.50 | 11-15-2016 | 54,000 | 59,206 | ||||||||||||
U.S. Treasury Note | 7.50 | 11-15-2024 | 22,000 | 31,744 | ||||||||||||
U.S. Treasury Note | 7.63 | 11-15-2022 | 12,000 | 16,611 | ||||||||||||
U.S. Treasury Note | 7.63 | 2-15-2025 | 20,000 | 29,258 | ||||||||||||
U.S. Treasury Note | 7.88 | 2-15-2021 | 15,000 | 19,900 | ||||||||||||
U.S. Treasury Note | 8.00 | 11-15-2021 | 48,000 | 65,460 | ||||||||||||
U.S. Treasury Note | 8.13 | 8-15-2019 | 29,000 | 36,807 | ||||||||||||
U.S. Treasury Note | 8.13 | 5-15-2021 | 17,000 | 22,931 | ||||||||||||
U.S. Treasury Note | 8.13 | 8-15-2021 | 15,000 | 20,408 | ||||||||||||
The accompanying notes are an integral part of these financial statements.
Table of Contents
| 26 | Wells Fargo Advantage VT Index Asset Allocation Fund | Portfolio of investments—June 30, 2015 (unaudited) |
| Security name | Interest rate | Maturity date | Principal | Value | ||||||||||||
U.S. Treasury Securities (continued) | ||||||||||||||||
U.S. Treasury Note | 8.50 | % | 2-15-2020 | $ | 15,000 | $ | 19,654 | |||||||||
U.S. Treasury Note | 8.75 | 5-15-2017 | 42,000 | 48,343 | ||||||||||||
U.S. Treasury Note | 8.75 | 5-15-2020 | 12,000 | 15,989 | ||||||||||||
U.S. Treasury Note | 8.75 | 8-15-2020 | 27,000 | 36,399 | ||||||||||||
U.S. Treasury Note | 8.88 | 8-15-2017 | 25,000 | 29,301 | ||||||||||||
U.S. Treasury Note | 8.88 | 2-15-2019 | 29,000 | 36,880 | ||||||||||||
U.S. Treasury Note | 9.00 | 11-15-2018 | 18,000 | 22,687 | ||||||||||||
U.S. Treasury Note | 9.13 | 5-15-2018 | 16,000 | 19,711 | ||||||||||||
Total U.S. Treasury Securities (Cost $33,804,149) | 33,542,380 | |||||||||||||||
|
| |||||||||||||||
| Yield | Shares | |||||||||||||||
| Short-Term Investments: 2.42% | ||||||||||||||||
| Investment Companies: 2.07% | ||||||||||||||||
Securities Lending Cash Investments, LLC (l)(r)(u) | 0.13 | 38,975 | 38,975 | |||||||||||||
Wells Fargo Advantage Cash Investment Money Market Fund, Select Class (l)(u) | 0.12 | 1,788,012 | 1,788,012 | |||||||||||||
| 1,826,987 | ||||||||||||||||
|
| |||||||||||||||
| Principal | ||||||||||||||||
| U.S. Treasury Securities: 0.35% | ||||||||||||||||
U.S. Treasury Bill #(z) | 0.01 | 11-19-2015 | $ | 270,000 | 269,968 | |||||||||||
U.S. Treasury Bill #(z) | 0.06 | 11-27-2015 | 15,000 | 14,998 | ||||||||||||
U.S. Treasury Bill #(z) | 0.08 | 11-5-2015 | 26,000 | 25,998 | ||||||||||||
| 310,964 | ||||||||||||||||
|
| |||||||||||||||
Total Short-Term Investments (Cost $2,137,902) | 2,137,951 | |||||||||||||||
|
| |||||||||||||||
| Total investments in securities (Cost $66,605,806) * | 99.88 | % | 88,100,751 | |||||
Other assets and liabilities, net | 0.12 | 104,467 | ||||||
|
|
|
| |||||
| Total net assets | 100.00 | % | $ | 88,205,218 | ||||
|
|
|
|
| † | Non-income-earning security |
| « | All or a portion of this security is on loan. |
| (l) | The security represents an affiliate of the Fund as defined in the Investment Company Act of 1940. |
| (a) | The security is fair valued in accordance with procedures approved by the Board of Trustees. |
| (i) | Illiquid security |
| (r) | The investment is a non-registered investment vehicle purchased with cash collateral received from securities on loan. |
| (u) | The rate represents the 7-day annualized yield at period end. |
| # | All or a portion of this security is segregated as collateral for investments in derivative instruments. |
| (z) | Zero coupon security. The rate represents the current yield to maturity. |
| * | Cost for federal income tax purposes is $72,519,676 and unrealized gains (losses) consists of: |
Gross unrealized gains | $ | 22,778,790 | ||
Gross unrealized losses | (7,197,715 | ) | ||
|
| |||
Net unrealized gains | $ | 15,581,075 |
The accompanying notes are an integral part of these financial statements.
Table of Contents
| Statement of assets and liabilities—June 30, 2015 (unaudited) | Wells Fargo Advantage VT Index Asset Allocation Fund | 27 |
Assets |
| |||
Investments | ||||
In unaffiliated securities (including $37,955 of securities loaned), at value (cost $64,388,241) | $ | 85,515,255 | ||
In affiliated securities, at value (cost $2,217,565) | 2,585,496 | |||
|
| |||
Total investments, at value (cost $66,605,806) | 88,100,751 | |||
Cash | 46,013 | |||
Receivable for investments sold | 15,910 | |||
Receivable for Fund shares sold | 43,582 | |||
Receivable for dividends and interest | 221,015 | |||
Receivable for daily variation margin on open futures contracts | 7,535 | |||
Receivable for securities lending income | 137 | |||
Prepaid expenses and other assets | 23,035 | |||
|
| |||
Total assets | 88,457,978 | |||
|
| |||
Liabilities | ||||
Payable for investments purchased | 57,114 | |||
Payable for Fund shares redeemed | 66,532 | |||
Payable upon receipt of securities loaned | 38,975 | |||
Payable for daily variation margin on open futures contracts | 547 | |||
Advisory fee payable | 33,259 | |||
Distribution fee payable | 18,430 | |||
Administration fee payable | 9,583 | |||
Professional fees payable | 14,893 | |||
Accrued expenses and other liabilities | 13,427 | |||
|
| |||
Total liabilities | 252,760 | |||
|
| |||
Total net assets | $ | 88,205,218 | ||
|
| |||
NET ASSETS CONSIST OF | ||||
Paid-in capital | $ | 68,497,534 | ||
Undistributed net investment income | 17,210 | |||
Accumulated net realized losses on investments | (1,821,877 | ) | ||
Net unrealized gains on investments | 21,512,351 | |||
|
| |||
Total net assets | $ | 88,205,218 | ||
|
| |||
COMPUTATION OF NET ASSET VALUE PER SHARE | ||||
Net assets – Class 2 | $ | 88,205,218 | ||
Shares outstanding – Class 21 | 4,770,616 | |||
Net asset value per share – Class 2 | $18.49 | |||
| 1 | The Fund has an unlimited number of authorized shares. |
The accompanying notes are an integral part of these financial statements.
Table of Contents
| 28 | Wells Fargo Advantage VT Index Asset Allocation Fund | Statement of operations—six months ended June 30, 2015 (unaudited) |
Investment income | ||||
Dividends (net of foreign withholding taxes of $81) | $ | 564,713 | ||
Interest | 344,614 | |||
Income from affiliated securities | 12,540 | |||
Securities lending income, net | 1,352 | |||
|
| |||
Total investment income | 923,219 | |||
|
| |||
Expenses | ||||
Advisory fee | 248,055 | |||
Administration fee | 58,632 | |||
Distribution fee | ||||
Class 2 | 112,752 | |||
Custody and accounting fees | 18,956 | |||
Professional fees | 20,159 | |||
Shareholder report expenses | 9,163 | |||
Trustees’ fees and expenses | 7,246 | |||
Other fees and expenses | 14,403 | |||
|
| |||
Total expenses | 489,366 | |||
Less: Fee waivers and/or expense reimbursements | (38,355 | ) | ||
|
| |||
Net expenses | 451,011 | |||
|
| |||
Net investment income | 472,208 | |||
|
| |||
REALIZED AND UNREALIZED GAINS (LOSSES) ON INVESTMENTS | ||||
Net realized gains on: | ||||
Unaffiliated securities | 7,123,124 | |||
Affiliated securities | 6,170 | |||
Futures transactions | 336,459 | |||
|
| |||
Net realized gains on investments | 7,465,753 | |||
|
| |||
Net change in unrealized gains (losses) on: | ||||
Unaffiliated securities | (7,241,898 | ) | ||
Affiliated securities | 4,035 | |||
Futures transactions | 213,183 | |||
|
| |||
Net change in unrealized gains (losses) on investments | (7,024,680 | ) | ||
|
| |||
Net realized and unrealized gains (losses) on investments | 441,073 | |||
|
| |||
Net increase in net assets resulting from operations | $ | 913,281 | ||
|
| |||
The accompanying notes are an integral part of these financial statements.
Table of Contents
| Statement of changes in net assets | Wells Fargo Advantage VT Index Asset Allocation Fund | 29 |
| Six months ended June 30, 2015 (unaudited) | Year ended December 31, 2014 | |||||||||||||||
Operations | ||||||||||||||||
Net investment income | $ | 472,208 | $ | 1,399,772 | ||||||||||||
Net realized gains on investments | 7,465,753 | 5,525,585 | ||||||||||||||
Net change in unrealized gains (losses) on investments | (7,024,680 | ) | 7,792,582 | |||||||||||||
|
| |||||||||||||||
Net increase in net assets resulting from operations | 913,281 | 14,717,939 | ||||||||||||||
|
| |||||||||||||||
Distributions to shareholders from | ||||||||||||||||
Net investment income – Class 2 | (554,189 | ) | (1,351,046 | ) | ||||||||||||
|
| |||||||||||||||
Capital share transactions | Shares | Shares | ||||||||||||||
Proceeds from shares sold – Class 2 | 127,065 | 2,370,879 | 202,482 | 3,451,969 | ||||||||||||
Reinvestment of distributions – Class 2 | 29,714 | 554,189 | 78,919 | 1,351,046 | ||||||||||||
Payment for shares redeemed – Class 2 | (386,369 | ) | (7,225,087 | ) | (764,955 | ) | (12,958,898 | ) | ||||||||
|
| |||||||||||||||
Net decrease in net assets resulting from capital share transactions | (4,300,019 | ) | (8,155,883 | ) | ||||||||||||
|
| |||||||||||||||
Total increase (decrease) in net assets | (3,940,927 | ) | 5,211,010 | |||||||||||||
|
| |||||||||||||||
Net assets | ||||||||||||||||
Beginning of period | 92,146,145 | 86,935,135 | ||||||||||||||
|
| |||||||||||||||
End of period | $ | 88,205,218 | $ | 92,146,145 | ||||||||||||
|
| |||||||||||||||
Undistributed net investment income | $ | 17,210 | $ | 99,191 | ||||||||||||
|
| |||||||||||||||
The accompanying notes are an integral part of these financial statements.
Table of Contents
| 30 | Wells Fargo Advantage VT Index Asset Allocation Fund | Financial highlights |
(For a share outstanding throughout each period)
| Six months ended June 30, 2015 (unaudited) | Year ended December 31 | |||||||||||||||||||||||
| CLASS 2 | 2014 | 2013 | 2012 | 2011 | 20101 | |||||||||||||||||||
Net asset value, beginning of period | $18.43 | $15.85 | $13.47 | $12.09 | $11.72 | $10.53 | ||||||||||||||||||
Net investment income | 0.10 | 0.27 | 0.24 | 0.21 | 0.21 | 0.20 | ||||||||||||||||||
Net realized and unrealized gains (losses) on investments | 0.07 | 2.57 | 2.39 | 1.36 | 0.54 | 1.18 | ||||||||||||||||||
|
|
|
|
|
|
|
|
|
|
|
| |||||||||||||
Total from investment operations | 0.17 | 2.84 | 2.63 | 1.57 | 0.75 | 1.38 | ||||||||||||||||||
Distributions to shareholders from | ||||||||||||||||||||||||
Net investment income | (0.11 | ) | (0.26 | ) | (0.25 | ) | (0.19 | ) | (0.38 | ) | (0.19 | ) | ||||||||||||
Net asset value, end of period | $18.49 | $18.43 | $15.85 | $13.47 | $12.09 | $11.72 | ||||||||||||||||||
Total return2 | 0.94 | % | 18.06 | % | 19.63 | % | 13.03 | % | 6.48 | % | 13.29 | % | ||||||||||||
Ratios to average net assets (annualized) | ||||||||||||||||||||||||
Gross expenses | 1.09 | % | 1.02 | % | 1.11 | % | 1.13 | % | 1.06 | % | 1.10 | % | ||||||||||||
Net expenses | 1.00 | % | 0.99 | % | 1.00 | % | 1.00 | % | 0.99 | % | 1.00 | % | ||||||||||||
Net investment income | 1.05 | % | 1.58 | % | 1.57 | % | 1.58 | % | 1.70 | % | 1.76 | % | ||||||||||||
Supplemental data | ||||||||||||||||||||||||
Portfolio turnover rate | 37 | % | 3 | % | 11 | % | 8 | % | 17 | % | 25 | % | ||||||||||||
Net assets, end of period (000s omitted) | $88,205 | $92,146 | $86,935 | $84,791 | $89,402 | $102,946 | ||||||||||||||||||
| 1 | After the close of business on July 16, 2010, existing shares of the Fund were renamed Class 2 shares. |
| 2 | Returns for periods of less than one year are not annualized. |
The accompanying notes are an integral part of these financial statements.
Table of Contents
| Notes to financial statements (unaudited) | Wells Fargo Advantage VT Index Asset Allocation Fund | 31 |
1. ORGANIZATION
Wells Fargo Variable Trust (the “Trust”), a Delaware statutory trust organized on March 10, 1999, is an open-end management investment company registered under the Investment Company Act of 1940, as amended (the “1940 Act”). As an investment company, the Trust follows the accounting and reporting guidance in Financial Accounting Standards Board (“FASB”) Accounting Standards Codification Topic 946, Financial Services – Investment Companies. These financial statements report on the Wells Fargo Advantage VT Index Asset Allocation Fund (the “Fund”) which is a diversified series of the Trust.
2. SIGNIFICANT ACCOUNTING POLICIES
The following significant accounting policies, which are consistently followed in the preparation of the financial statements of the Fund, are in conformity with U.S. generally accepted accounting principles which require management to make estimates and assumptions that affect the reported amounts of assets and liabilities, disclosure of contingent assets and liabilities at the date of the financial statements, and the reported amounts of revenues and expenses during the reporting period. Actual results could differ from those estimates.
Securities valuation
All investments are valued each business day as of the close of regular trading on the New York Stock Exchange (generally 4 p.m. Eastern Time).
Equity securities and futures that are listed on a foreign or domestic exchange or market are valued at the official closing price or, if none, the last sales price. If no sale occurs on the primary exchange or market that day, the prior day’s price will be deemed “stale” and a fair value price will be determined in accordance with the Fund’s Valuation Procedures.
Equity securities that are not listed on a foreign or domestic exchange or market, but have a public trading market, are valued at the quoted bid price from an independent broker-dealer that the Management Valuation Team of Wells Fargo Funds Management, LLC (“Funds Management”) has determined is an acceptable source.
Debt securities are valued at the evaluated bid price provided by an independent pricing service or, if a reliable price is not available, the quoted bid price from an independent broker-dealer.
Investments in registered open-end investment companies are valued at net asset value. Interests in non-registered investment vehicles that are redeemable at net asset value are fair valued at net asset value when available.
Investments which are not valued using any of the methods discussed above are valued at their fair value, as determined in good faith by the Board of Trustees of the Fund. The Board of Trustees has established a Valuation Committee comprised of the Trustees and has delegated to it the authority to take any actions regarding the valuation of portfolio securities that the Valuation Committee deems necessary or appropriate, including determining the fair value of portfolio securities, unless the determination has been delegated to the Management Valuation Team. The Board of Trustees retains the authority to make or ratify any valuation decisions or approve any changes to the Valuation Procedures as it deems appropriate. On a quarterly basis, the Board of Trustees receives reports on any valuation actions taken by the Valuation Committee or the Management Valuation Team which may include items for ratification.
Valuations of fair valued securities are compared to the next actual sales price when available, or other appropriate market values, to assess the continued appropriateness of the fair valuation methodologies used. These securities are fair valued on a day-to-day basis, taking into consideration changes to appropriate market information and any significant changes to the inputs considered in the valuation process until there is a readily available price provided on an exchange or by an independent pricing service. Valuations received from an independent pricing service or independent broker-dealer quotes are periodically validated by comparisons to most recent trades and valuations provided by other independent pricing services in addition to the review of prices by the adviser and/or subadviser. Unobservable inputs used in determining fair valuations are identified based on the type of security, taking into consideration factors utilized by market participants in valuing the investment, knowledge about the issuer and the current market environment.
Security loans
The Fund may lend its securities from time to time in order to earn additional income in the form of fees or interest on securities received as collateral or the investment of any cash received as collateral. The Fund continues to receive interest or dividends on the securities loaned. The Fund receives collateral in the form of cash or securities with a value at least equal to the value of the securities on loan. The value of the loaned securities is determined at the close of each business day and any additional required collateral is delivered to the Fund on the next business day. In a securities lending transaction, the net asset value of the Fund will be affected by an increase or decrease in the value of the
Table of Contents
| 32 | Wells Fargo Advantage VT Index Asset Allocation Fund | Notes to financial statements (unaudited) |
securities loaned and by an increase or decrease in the value of the instrument in which collateral is invested. The amount of securities lending activity undertaken by the Fund fluctuates from time to time. In the event of default or bankruptcy by the borrower, the Fund may be prevented from recovering the loaned securities or gaining access to the collateral or may experience delays or costs in doing so. In addition, the investment of any cash collateral received may lose all or part of its value. The Fund has the right under the lending agreement to recover the securities from the borrower on demand.
The Fund lends its securities through an unaffiliated securities lending agent. Cash collateral received in connection with its securities lending transactions is invested in Securities Lending Cash Investments, LLC (the “Securities Lending Fund”). The Securities Lending Fund is exempt from registration under Section 3(c)(7) of the 1940 Act and is managed by Funds Management and is subadvised by Wells Capital Management Incorporated (“WellsCap”). Funds Management receives an advisory fee starting at 0.05% and declining to 0.01% as the average daily net assets of the Securities Lending Fund increase. All of the fees received by Funds Management are paid to WellsCap for its services as subadviser. The Securities Lending Fund seeks to provide a positive return compared to the daily Fed Funds Open rate by investing in high-quality, U.S. dollar-denominated short-term money market instruments. Securities Lending Fund investments are fair valued based upon the amortized cost valuation technique. Income earned from investment in the Securities Lending Fund is included in securities lending income on the Statement of Operations.
Futures contracts
The Fund is subject to interest rate risk and equity price risk in the normal course of pursuing its investment objectives. The Fund may buy and sell futures contracts in order to gain exposure to, or protect against, changes in security values and interest rates. The primary risks associated with the use of futures contracts are the imperfect correlation between changes in market values of securities held by the Fund and the prices of futures contracts, and the possibility of an illiquid market.
The aggregate principal amounts of the contracts are not recorded in the financial statements. Fluctuations in the value of the contracts are recorded in the Statement of Assets and Liabilities as an asset or liability and in the Statement of Operations as unrealized gains or losses until the contracts are closed, at which point they are recorded as net realized gains or losses on futures contracts. With futures contracts, there is minimal counterparty risk to the Fund since futures are exchange traded and the exchange’s clearinghouse, as counterparty to all exchange traded futures, guarantees the futures against default.
Security transactions and income recognition
Securities transactions are recorded on a trade date basis. Realized gains or losses are recorded on the basis of identified cost.
Dividend income is recognized on the ex-dividend date. Dividend income is recorded net of foreign taxes withheld where recovery of such taxes is not assured.
Interest income is accrued daily and bond discounts are accreted and premiums are amortized daily based on the effective interest method. To the extent debt obligations are placed on non-accrual status, any related interest income may be reduced by writing off interest receivables when the collection of all or a portion of interest has become doubtful based on consistently applied procedures. If the issuer subsequently resumes interest payments or when the collectability of interest is reasonably assured, the debt obligation is removed from non-accrual status.
Distributions to shareholders
Distributions to shareholders from net investment income and net realized gains, if any, are recorded on the ex-dividend date. Such distributions are determined in conformity with federal income tax regulations, which may differ in amount or character from net investment income and realized gains recognized for purposes of U.S. generally accepted accounting principles.
Federal and other taxes
The Fund intends to continue to qualify as a regulated investment company by distributing substantially all of its investment company taxable income and any net realized capital gains (after reduction for capital loss carryforwards) sufficient to relieve it from all, or substantially all, federal income taxes. Accordingly, no provision for federal income taxes was required.
The Fund’s income and federal excise tax returns and all financial records supporting those returns for the prior three fiscal years are subject to examination by the federal and Delaware revenue authorities. Management has analyzed the Fund’s tax positions taken on federal, state, and foreign tax returns for all open tax years and does not believe that there are any uncertain tax positions that require recognition of a tax liability.
Table of Contents
| Notes to financial statements (unaudited) | Wells Fargo Advantage VT Index Asset Allocation Fund | 33 |
As of December 31, 2014, the Fund had capital loss carryforwards available to offset future net realized capital gains in the amount of $5,072,286 with $1,347,719 expiring in 2016 and $3,724,567 expiring in 2017.
3. FAIR VALUATION MEASUREMENTS
Fair value measurements of investments are determined within a framework that has established a fair value hierarchy based upon the various data inputs utilized in determining the value of the Fund’s investments. The three-level hierarchy gives the highest priority to unadjusted quoted prices in active markets for identical assets or liabilities (Level 1) and the lowest priority to significant unobservable inputs (Level 3). The Fund’s investments are classified within the fair value hierarchy based on the lowest level of input that is significant to the fair value measurement. The inputs are summarized into three broad levels as follows:
| n | Level 1 – quoted prices in active markets for identical securities |
| n | Level 2 – other significant observable inputs (including quoted prices for similar securities, interest rates, prepayment speeds, credit risk, use of amortized cost, etc.) |
| n | Level 3 – significant unobservable inputs (including the Fund’s own assumptions in determining the fair value of investments) |
The inputs or methodologies used for valuing investments in securities are not necessarily an indication of the risk associated with investing in those securities.
The following is a summary of the inputs used in valuing the Fund’s assets and liabilities as of June 30, 2015:
| Quoted prices (Level 1) | Other significant observable inputs (Level 2) | Significant unobservable inputs (Level 3) | Total | |||||||||||||
Assets | ||||||||||||||||
Investments in: | ||||||||||||||||
Common stocks | ||||||||||||||||
Consumer discretionary | $ | 6,696,250 | $ | 0 | $ | 0 | $ | 6,696,250 | ||||||||
Consumer staples | 4,922,995 | 0 | 0 | 4,922,995 | ||||||||||||
Energy | 4,123,680 | 0 | 0 | 4,123,680 | ||||||||||||
Financials | 8,659,124 | 0 | 0 | 8,659,124 | ||||||||||||
Health care | 8,095,168 | 0 | 0 | 8,095,168 | ||||||||||||
Industrials | 5,285,870 | 0 | 0 | 5,285,870 | ||||||||||||
Information technology | 10,323,173 | 0 | 0 | 10,323,173 | ||||||||||||
Materials | 1,641,496 | 0 | 0 | 1,641,496 | ||||||||||||
Telecommunication services | 1,186,822 | 0 | 0 | 1,186,822 | ||||||||||||
Utilities | 1,485,842 | 0 | 0 | 1,485,842 | ||||||||||||
Rights | ||||||||||||||||
Consumer staples | 0 | 0 | 0 | 0 | ||||||||||||
U.S. Treasury securities | 33,542,380 | 0 | 0 | 33,542,380 | ||||||||||||
Short-term investments | ||||||||||||||||
Investment companies | 1,788,012 | 38,975 | 0 | 1,826,987 | ||||||||||||
U.S. Treasury securities | 310,964 | 0 | 0 | 310,964 | ||||||||||||
| 88,061,776 | 38,975 | 0 | 88,100,751 | |||||||||||||
Futures contracts | 7,535 | 0 | 0 | 7,535 | ||||||||||||
Total assets | $ | 88,069,311 | $ | 38,975 | $ | 0 | $ | 88,108,286 | ||||||||
Liabilities | ||||||||||||||||
Futures contracts | $ | 547 | $ | 0 | $ | 0 | $ | 547 | ||||||||
Total liabilities | $ | 547 | $ | 0 | $ | 0 | $ | 547 | ||||||||
Futures contracts are reported at their variation margin at measurement date, which represents the amount due to/from the Fund at that date. All other assets and liabilities are reported at their market value at measurement date.
The Fund recognizes transfers between levels within the fair value hierarchy at the end of the reporting period. At June 30, 2015, the Fund did not have any transfers into/out of Level 1, Level 2, or Level 3.
Table of Contents
| 34 | Wells Fargo Advantage VT Index Asset Allocation Fund | Notes to financial statements (unaudited) |
4. TRANSACTIONS WITH AFFILIATES
Advisory fee
The Trust has entered into an advisory contract with Funds Management, an indirect wholly owned subsidiary of Wells Fargo & Company (“Wells Fargo”). The adviser is responsible for implementing investment policies and guidelines and for supervising the subadviser, who is responsible for day-to-day portfolio management of the Fund.
Pursuant to the contract, Funds Management is entitled to receive an annual advisory fee starting at 0.55% and declining to 0.40% as the average daily net assets of the Fund increase. For the six months ended June 30, 2015, the advisory fee was equivalent to an annual rate of 0.55% of the Fund’s average daily net assets.
Funds Management has retained the services of a subadviser to provide daily portfolio management to the Fund. The fee for subadvisory services is borne by Funds Management. WellsCap, an affiliate of Funds Management and an indirect wholly owned subsidiary of Wells Fargo, is the subadviser to the Fund and is entitled to receive a fee from Funds Management at an annual rate starting at 0.15% and declining to 0.10% as the average daily net assets of the Fund increase.
Administration fee
The Trust has entered into an administration agreement with Funds Management. Under this agreement, for providing administrative services, which includes paying fees and expenses for services provided by the transfer agent, sub-transfer agents, omnibus account servicers and record-keepers, Funds Management is entitled to receive from the Fund an annual administration fee starting at 0.13% and declining to 0.11% as the average daily net assets of the Fund increase.
Funds Management has contractually waived and/or reimbursed advisory and administration fees to the extent necessary to maintain certain net operating expense ratios for the Fund. Waiver of fees and/or reimbursement of expenses by Funds Management were made first from fund level expenses on a proportionate basis and then from class specific expenses. Funds Management has committed through April 30, 2016 to waive fees and/or reimburse expenses to the extent necessary to cap the Fund’s expenses at 1.00% for Class 2 shares. After this time, the cap may be increased or the commitment to maintain the cap may be terminated only with the approval of the Board of Trustees.
Distribution fee
The Trust has adopted a Distribution Plan for Class 2 shares of the Fund pursuant to Rule 12b-1 under the 1940 Act. A distribution fee is charged to Class 2 shares and paid to Wells Fargo Funds Distributor, LLC, the principal underwriter, at an annual rate of 0.25% of the average daily net assets of Class 2 shares.
5. INVESTMENT PORTFOLIO TRANSACTIONS
Purchases and sales of investments, excluding short-term securities, for the six months ended June 30, 2015 were as follows:
Purchases at cost | Sales proceeds | |||||
| U.S. government | Non-U.S. government | U.S. government | Non-U.S. government | |||
| $32,869,700 | $710,579 | $28,456,587 | $2,523,607 | |||
6. DERIVATIVE TRANSACTIONS
During the six months ended June 30, 2015, the Fund entered into futures contracts to gain market exposure to certain asset classes consistent with an active asset allocation strategy.
At June 30, 2015, the Fund had long and short futures contracts outstanding as follows:
| Expiration date | Counterparty | Contracts | Type | Contract value at | Unrealized gains (losses) | |||||||||
9-17-2015 | Goldman Sachs | 6 Long | S&P 500 Index | 3,081,600 | (45,552 | ) | ||||||||
9-21-2015 | Goldman Sachs | 21 Short | U.S. Treasury Bonds | 3,167,719 | 68,539 | |||||||||
9-30-2015 | Goldman Sachs | 14 Long | 5-Year U.S. Treasury Notes | 1,669,609 | (5,581 | ) | ||||||||
The Fund had an average notional amount of $6,770,183 and $5,978,651 in long and short futures contracts, respectively, during the six months ended June 30, 2015.
Table of Contents
| Notes to financial statements (unaudited) | Wells Fargo Advantage VT Index Asset Allocation Fund | 35 |
A summary of derivative instruments by primary risk exposure is outlined in the following tables.
The fair value of derivative instruments as of June 30, 2015 was as follows for the Fund:
Asset derivatives | Liability derivatives | |||||||||||
| Statement of Assets and Liabilities location | Fair value | Statement of Assets and Liabilities location | Fair value | |||||||||
Interest rate contracts | Receivable for daily variation margin on open futures contracts | $ | 1,685 | * | Payable for daily variation margin on open futures contracts | $ | 547 | * | ||||
Equity contracts | Receivable for daily variation margin on open futures contracts | 5,850 | * | Payable for daily variation margin on open futures contracts | 0 | |||||||
| $ | 7,535 | $ | 547 | |||||||||
| * | Only the current day’s variation margin as of June 30, 2015 is reported separately on the Statement of Assets and Liabilities. |
The effect of derivative instruments on the Statement of Operations for the six months ended June 30, 2015 was as follows for the Fund:
| Amount of realized gains on derivatives | Change in unrealized gains (losses) on derivatives | |||||||
Interest rate contracts | $ | 136,485 | $ | 387,191 | ||||
Equity contracts | 199,974 | (174,008 | ) | |||||
| $ | 336,459 | $ | 213,183 | |||||
For certain types of derivative transactions, the Fund has entered into International Swaps and Derivatives Association, Inc. master agreements (“ISDA Master Agreements”) or similar agreements with approved counterparties. The ISDA Master Agreements or similar agreements may have requirements to deliver/deposit securities or cash to/with an exchange or broker-dealer as collateral and allows the Fund to offset, with each counterparty, certain derivative financial instrument’s assets and/or liabilities with collateral held or pledged. Collateral requirements differ by type of derivative. Collateral or margin requirements are set by the broker or exchange clearing house for exchange traded derivatives while collateral terms are contract specific for over-the-counter traded derivatives. Cash collateral that has been pledged to cover obligations of the Fund under ISDA Master Agreements or similar agreements, if any, will be reported separately in the Statement of Assets and Liabilities. Securities pledged as collateral, if any, for the same purpose are noted in the Portfolio of Investments. With respect to balance sheet offsetting, absent an event of default by the counterparty or a termination of the agreement, the reported amounts of financial assets and financial liabilities in the Statement of Assets and Liabilities are not offset across transactions between the Fund and the applicable counterparty. A reconciliation of the gross amounts on the Statement of Assets and Liabilities to the net amounts by derivative type, including any collateral exposure, is as follows:
| Derivative type | Counterparty | Gross amounts of assets in the Statement of Assets and Liabilities | Amounts subject to netting agreements | Collateral received | Net amount of assets | |||||||||||||||
Futures – variation margin | Goldman Sachs | $ | 7,535 | $ | (547 | ) | $ | 0 | $ | 6,988 | ||||||||||
| Derivative type | Counterparty | Gross amounts of liabilites in the Statement of Assets and Liabilities | Amounts subject to netting agreements | Collateral | Net amount | |||||||||||||||
Futures – variation margin | Goldman Sachs | $ | 547 | $ | (547 | ) | $ | 0 | $ | 0 | ||||||||||
7. BANK BORROWINGS
The Trust and Wells Fargo Funds Trust (excluding the money market funds and certain other funds) are parties to a $150,000,000 revolving credit agreement, whereby the Fund is permitted to use bank borrowings for temporary or emergency purposes, such as to fund shareholder redemption requests. Interest under the credit agreement is charged to the Fund based
Table of Contents
| 36 | Wells Fargo Advantage VT Index Asset Allocation Fund | Notes to financial statements (unaudited) |
on a borrowing rate equal to the higher of the Federal Funds rate in effect on that day plus 1.25% or the overnight LIBOR rate in effect on that day plus 1.25%. In addition, an annual commitment fee equal to 0.10% of the unused balance is allocated to each participating fund. For the six months ended June 30, 2015, the Fund paid $66 in commitment fees.
For the six months ended June 30, 2015, there were no borrowings by the Fund under the agreement.
8. INDEMNIFICATION
Under the Trust’s organizational documents, the officers and Trustees have been granted certain indemnification rights against certain liabilities that may arise out of performance of their duties to the Trust. Additionally, in the normal course of business, the Trust may enter into contracts with service providers that contain a variety of indemnification clauses. The Trust’s maximum exposure under these arrangements is dependent on future claims that may be made against the Fund and, therefore, cannot be estimated.
9. SUBSEQUENT DISTRIBUTION
On July 9, 2015, the Fund declared a distribution from net investment income to shareholders of record on July 8, 2015. The per share amount payable on July 10, 2015 was $0.02086 for Class 2.
This distribution is not reflected in the accompanying financial statements. The final determination of the source of all distributions is subject to change and made after the Fund’s tax year-end.
Table of Contents
| Other information (unaudited) | Wells Fargo Advantage VT Index Asset Allocation Fund | 37 |
PROXY VOTING INFORMATION
A description of the policies and procedures that the Fund uses to determine how to vote proxies relating to portfolio securities is available, upon request, by calling 1-800-222-8222, visiting our website at wellsfargoadvantagefunds.com, or visiting the SEC website at sec.gov. Information regarding how the Fund voted proxies relating to portfolio securities during the most recent 12-month period ended June 30 is available on the Fund’s website at wellsfargoadvantagefunds.com or by visiting the SEC website at sec.gov.
PORTFOLIO HOLDINGS INFORMATION
The complete portfolio holdings for the Fund are publicly available monthly on the Fund’s website (wellsfargoadvantagefunds.com), on a one-month delayed basis. In addition, top ten holdings information (excluding derivative positions) for the Fund is publicly available on the Fund’s website on a monthly, seven-day or more delayed basis. The Fund files its complete schedule of portfolio holdings with the SEC for the first and third quarters of each fiscal year on Form N-Q, which is available by visiting the SEC website at sec.gov. In addition, the Fund’s Form N-Q may be reviewed and copied at the SEC’s Public Reference Room in Washington, DC, and at regional offices in New York City, at 233 Broadway, and in Chicago, at 175 West Jackson Boulevard, Suite 900. Information about the Public Reference Room may be obtained by calling 1-800-SEC-0330.
Table of Contents
| 38 | Wells Fargo Advantage VT Index Asset Allocation Fund | Other information (unaudited) |
BOARD OF TRUSTEES AND OFFICERS
Each of the Trustees and Officers1 listed in the table below acts in identical capacities for each fund in the Wells Fargo Advantage family of funds, which consists of 134 mutual funds comprising the Wells Fargo Funds Trust, Wells Fargo Variable Trust, Wells Fargo Master Trust and four closed-end funds (collectively the “Fund Complex”). This table should be read in conjunction with the Prospectus and the Statement of Additional Information2. The mailing address of each Trustee and Officer is 525 Market Street, 12th Floor, San Francisco, CA 94105. Each Trustee and Officer serves an indefinite term, however, each Trustee serves such term until reaching the mandatory retirement age established by the Trustees.
Independent Trustees
Name and year of birth | Position held and length of service* | Principal occupations during past five years or longer | Other directorships during past five years | |||
| William R. Ebsworth (Born 1957) | Trustee, since 2015** | Retired. From 1984 to 2013, equities analyst, portfolio manager, research director at Fidelity Management and Research Company and retired in 2013 as Chief Investment Officer of Fidelity Strategic Advisers, Inc. in Boston, Tokyo, and Hong Kong where he led a team of investment professionals managing client assets. Prior thereto, Board member of Hong Kong Securities Clearing Co., Hong Kong Options Clearing Corp., the Thailand International Fund, Ltd., Fidelity Investments Life Insurance Company, and Empire Fidelity Investments Life Insurance Company. Mr. Ebsworth is an Adjunct Lecturer, Finance, at Babson College and a Chartered Financial Analyst. | Asset Allocation Trust | |||
| Jane A. Freeman (Born 1953) | Trustee, since 2015** | Retired. From 2012 to 2014 and 1999 to 2008, Chief Financial Officer of Scientific Learning Corporation. From 2008 to 2012, Ms. Freeman provided consulting services related to strategic business projects. Prior to 1999, Portfolio Manager at Rockefeller & Co. and Scudder, Stevens & Clark. Board member of the Harding Loevner Funds from 1996 to 2014, serving as both Lead Independent Director and chair of the Audit Committee. Board member of the Russell Exchange Traded Funds Trust from 2011 to 2012 and the chair of the Audit Committee. Ms. Freeman is a Chartered Financial Analyst (inactive), Chair of Taproot Foundation (non-profit organization) and a Board Member of Ruth Bancroft Garden (non-profit organization). | Asset Allocation Trust | |||
| Peter G. Gordon (Born 1942) | Trustee, since 1998; Chairman, since 2005 | Co-Founder, Retired Chairman, President and CEO of Crystal Geyser Water Company. Trustee Emeritus, Colby College. | Asset Allocation Trust | |||
| Isaiah Harris, Jr. (Born 1952) | Trustee, since 2009 | Retired. Chairman of the Board of CIGNA Corporation since 2009, and Director since 2005. From 2003 to 2011, Director of Deluxe Corporation. Prior thereto, President and CEO of BellSouth Advertising and Publishing Corp. from 2005 to 2007, President and CEO of BellSouth Enterprises from 2004 to 2005 and President of BellSouth Consumer Services from 2000 to 2003. Emeritus member of the Iowa State University Foundation Board of Governors. Emeritus Member of the Advisory Board of Iowa State University School of Business. Advisory Board Member, Palm Harbor Academy. Mr. Harris is a certified public accountant. | CIGNA Corporation; Asset Allocation Trust | |||
| Judith M. Johnson (Born 1949) | Trustee, since 2008; Audit Committee Chairman, since 2008 | Retired. Prior thereto, Chief Executive Officer and Chief Investment Officer of Minneapolis Employees Retirement Fund from 1996 to 2008. Ms. Johnson is an attorney, certified public accountant and a certified managerial accountant. | Asset Allocation Trust | |||
| David F. Larcker (Born 1950) | Trustee, since 2009 | James Irvin Miller Professor of Accounting at the Graduate School of Business, Stanford University, Morgan Stanley Director of the Center for Leadership Development and Research and Senior Faculty of The Rock Center for Corporate Governance since 2006. From 2005 to 2008, Professor of Accounting at the Graduate School of Business, Stanford University. Prior thereto, Ernst & Young Professor of Accounting at The Wharton School, University of Pennsylvania from 1985 to 2005. | Asset Allocation Trust | |||
| Olivia S. Mitchell (Born 1953) | Trustee, since 2006 | International Foundation of Employee Benefit Plans Professor, Wharton School of the University of Pennsylvania since 1993. Director of Wharton’s Pension Research Council and Boettner Center on Pensions & Retirement Research, and Research Associate at the National Bureau of Economic Research. Previously, Cornell University Professor from 1978 to 1993. | Asset Allocation Trust |
Table of Contents
| Other information (unaudited) | Wells Fargo Advantage VT Index Asset Allocation Fund | 39 |
Name and year of birth | Position held and length of service* | Principal occupations during past five years or longer | Other directorships during past five years | |||
| Timothy J. Penny (Born 1951) | Trustee, since 1996 | President and Chief Executive Officer of Southern Minnesota Initiative Foundation, a non-profit organization, since 2007 and Senior Fellow at the Humphrey Institute Policy Forum at the University of Minnesota since 1995. Member of the Board of Trustees of NorthStar Education Finance, Inc., a non-profit organization, since 2007. | Asset Allocation Trust | |||
| Michael S. Scofield (Born 1943) | Trustee, since 2010 | Served on the Investment Company Institute’s Board of Governors and Executive Committee from 2008-2011 as well the Governing Council of the Independent Directors Council from 2006-2011 and the Independent Directors Council Executive Committee from 2008-2011. Chairman of the IDC from 2008-2010. Institutional Investor (Fund Directions) Trustee of Year in 2007. Trustee of the Evergreen Funds complex (and its predecessors) from 1984 to 2010. Chairman of the Evergreen Funds from 2000-2010. Former Trustee of the Mentor Funds. Retired Attorney, Law Offices of Michael S. Scofield. | Asset Allocation Trust | |||
| Donald C. Willeke (Born 1940) | Trustee, since 1996 | Principal of the law firm of Willeke & Daniels. General Counsel of the Minneapolis Employees Retirement Fund from 1984 until its consolidation into the Minnesota Public Employees Retirement Association on June 30, 2010. Director and Vice Chair of The Tree Trust (non-profit corporation). Director of the American Chestnut Foundation (non-profit corporation). | Asset Allocation Trust |
| * | Length of service dates reflect the Trustee’s commencement of service with the Trust’s predecessor entities, where applicable. |
| ** | William R. Ebsworth and Jane A. Freeman each became a Trustee effective January 1, 2015. |
Officers
Name and year of birth | Position held and length of service | Principal occupations during past five years or longer | ||||
| Karla M. Rabusch (Born 1959) | President, since 2003 | Executive Vice President of Wells Fargo Bank, N.A. and President of Wells Fargo Funds Management, LLC since 2003. | ||||
| Jeremy DePalma1 (Born 1974) | Treasurer, since 2012 | Senior Vice President of Wells Fargo Funds Management, LLC since 2009. Senior Vice President of Evergreen Investment Management Company, LLC from 2008 to 2010. Vice President, Evergreen Investment Services, Inc. from 2004 to 2007. Head of the Fund Reporting and Control Team within Fund Administration from 2005 to 2010. | ||||
| C. David Messman (Born 1960) | Secretary, since 2000; Chief Legal Officer, since 2003 | Senior Vice President and Secretary of Wells Fargo Funds Management, LLC since 2001. Assistant General Counsel of Wells Fargo Bank, N.A. since 2013 and Vice President and Managing Counsel of Wells Fargo Bank N.A. from 1996 to 2013. | ||||
| Debra Ann Early (Born 1964) | Chief Compliance Officer, since 2007 | Senior Vice President of Wells Fargo Funds Management, LLC since 2007 and Chief Compliance Officer from 2007 to 2014. Chief Compliance Officer of Parnassus Investments from 2005 to 2007. Chief Financial Officer of Parnassus Investments from 2004 to 2007 and Senior Audit Manager of PricewaterhouseCoopers LLP from 1998 to 2004. | ||||
| David Berardi (Born 1975) | Assistant Treasurer, since 2009 | Vice President of Wells Fargo Funds Management, LLC since 2009. Vice President of Evergreen Investment Management Company, LLC from 2008 to 2010. Assistant Vice President of Evergreen Investment Services, Inc. from 2004 to 2008. Manager of Fund Reporting and Control for Evergreen Investment Management Company, LLC from 2004 to 2010. |
| 1 | Jeremy DePalma acts as Treasurer of 61 funds and Assistant Treasurer of 73 funds in the Fund Complex. |
| 2 | The Statement of Additional Information includes additional information about the Trustees and is available, without charge, upon request, by calling 1-800-222-8222 or by visiting the website at wellsfargoadvantagefunds.com. |
Table of Contents
| 40 | Wells Fargo Advantage VT Index Asset Allocation Fund | Other information (unaudited) |
BOARD CONSIDERATION OF INVESTMENT ADVISORY, INVESTMENT MANAGEMENT AND SUB-ADVISORY AGREEMENTS:
Under the Investment Company Act of 1940 (the “1940 Act”), the Board of Trustees (the “Board”) of Wells Fargo Variable Trust (the “Trust”) must determine annually whether to approve the continuation of the Trust’s investment advisory and sub-advisory agreements. In this regard, at an in-person meeting held on May 19-20, 2015 (the “Meeting”), the Board, all the members of which have no direct or indirect interest in the investment advisory and sub-advisory agreements and are not “interested persons” of the Trust, as defined in the 1940 Act (the “Independent Trustees”), reviewed and approved for Wells Fargo Advantage VT Index Asset Allocation Fund (the “Fund”): (i) an investment advisory agreement (the “Advisory Agreement”) with Wells Fargo Funds Management, LLC (“Funds Management”); (ii) an investment management agreement (the “Management Agreement”) with Funds Management; and (iii) an investment sub-advisory agreement (the “Sub-Advisory Agreement”) with Wells Capital Management Incorporated (the “Sub-Adviser”), an affiliate of Funds Management. The Management Agreement combines the terms of the Advisory Agreement with the terms of the Fund’s Amended and Restated Administration Agreement applicable to Fund-level administrative services (the “Administration Agreement”). The Advisory Agreement, the Management Agreement and the Sub-Advisory Agreement are collectively referred to as the “Advisory Agreements.”
At the Meeting, the Board considered the factors and reached the conclusions described below relating to the selection of Funds Management and the Sub-Adviser and the approval of the Advisory Agreements. Prior to the Meeting, including at an in-person meeting in March 2015, the Trustees conferred extensively among themselves and with representatives of Funds Management about these matters. Also, the Board has adopted a team-based approach, with each team consisting of a sub-set of Trustees, to assist the full Board in the discharge of its duties in reviewing performance and other matters throughout the year. The Independent Trustees were assisted in their evaluation of the Advisory Agreements by independent legal counsel, from whom they received separate legal advice and with whom they met separately.
In providing information to the Board, Funds Management and the Sub-Adviser were guided by a detailed set of requests for information submitted to them by independent legal counsel on behalf of the Independent Trustees at the start of the Board’s annual contract renewal process earlier in 2015. In considering and approving the Advisory Agreements, the Trustees considered the information they believed relevant, including but not limited to the information discussed below. The Board considered not only the specific information presented in connection with the Meeting, but also the knowledge gained over time through interaction with Funds Management and the Sub-Adviser about various topics. In this regard, the Board reviewed reports of Funds Management at each of its quarterly meetings, which included, among other things, portfolio reviews and performance reports. In addition, the Board and the teams mentioned above confer with portfolio managers at various times throughout the year. The Board did not identify any particular information or consideration that was all-important or controlling, and each individual Trustee may have attributed different weights to various factors.
After its deliberations, the Board unanimously approved the continuation of the Advisory Agreement for the period from June 1, 2015 through June 30, 2015, approved the Management Agreement for the period from July 1, 2015 through May 31, 2016, and approved the continuation of the Sub-Advisory Agreement for a one-year term through May 31, 2016. The Board also determined that the compensation payable to Funds Management and the Sub-Adviser under each of the Advisory Agreements was reasonable. The Board considered the approval of the Advisory Agreements for the Fund as part of its consideration of agreements for funds across the complex, but its approvals were made on a fund-by-fund basis. The following summarizes a number of important, but not necessarily all, factors considered by the Board in support of its approvals.
Nature, extent and quality of services
The Board received and considered various information regarding the nature, extent and quality of services provided to the Fund by Funds Management and the Sub-Adviser under the Advisory Agreements. This information included, among other things, a summary of the background and experience of senior management of Funds Management, and the qualifications, background, tenure and responsibilities of each of the portfolio managers primarily responsible for the day-to-day portfolio management of the Fund. The Board noted that the services to be provided to the Fund pursuant to the Management Agreement combined the advisory services previously provided to the Fund pursuant to the Fund’s Advisory Agreement with the Fund-level administrative services previously provided to the Fund pursuant to the Fund’s Administration Agreement. The Board received a representation from Funds Management that combining these services would not result in any change to the nature or level of services provided by Funds Management to the Fund.
Table of Contents
| Other information (unaudited) | Wells Fargo Advantage VT Index Asset Allocation Fund | 41 |
The Board evaluated the ability of Funds Management and the Sub-Adviser to attract and retain qualified investment professionals, including research, advisory and supervisory personnel. The Board further considered the compliance programs and compliance records of Funds Management and the Sub-Adviser. In addition, the Board took into account the full range of services provided to the Fund by Funds Management and its affiliates.
Fund performance and expenses
The Board considered the performance results for the Fund over various time periods ended March 31, 2015. The Board considered these results in comparison to the performance of funds in a universe that was determined by Lipper Inc. (“Lipper”) to be similar to the Fund (the “Universe”), and in comparison to the Fund’s benchmark index and to other comparative data. Lipper is an independent provider of investment company data. The Board received a description of the methodology used by Lipper to select the mutual funds in the performance Universe. The Board noted that the performance of the Fund (Class 2) was higher than the average performance of the Universe for all periods under review except the first quarter of 2015. The Board also noted that the performance of the Fund was lower than its benchmark, the Index Asset Allocation Composite Index, for all periods under review except the three-year period.
The Board also received and considered information regarding the Fund’s net operating expense ratio and its various components, including actual management fees (which reflect fee waivers, if any, and include advisory, administration and transfer agent fees), custodian and other non-management fees, and Rule 12b-1 and non-Rule 12b-1 service fees. The Board considered this ratio in comparison to the median ratios of funds in a class-specific expense group that was determined by Lipper to be similar to the Fund (the “Group”). The Board received a description of the methodology used by Lipper to select the mutual funds in the expense Group and an explanation of how funds comprising expense groups and their expense ratios may vary from year-to-year. Based on the Lipper reports, the Board noted that the net operating expense ratio of the Fund was in range of the median net operating expense ratio of the expense Group.
The Board took into account the Fund performance and expense information provided to it among the factors considered in deciding to re-approve the Advisory Agreement and Sub-Advisory Agreement and approve the Management Agreement.
Investment advisory and sub-advisory fee rates
The Board reviewed and considered the contractual investment advisory fee rate that is payable by the Fund to Funds Management for investment advisory services (the “Advisory Agreement Rate”), both on a stand-alone basis and on a combined basis with the Fund’s contractual administration fee rate (the “Management Rate”). The Board noted that the Management Rate includes transfer agency and sub-transfer agency costs. The Board also noted that the fee rate to be paid by the Fund under the Management Agreement will incorporate the advisory fee and Fund-level administration fee previously payable separately by the Fund under the Fund’s Advisory Agreement and Administration Agreement with Funds Management. The Board also reviewed and considered the contractual investment sub-advisory fee rate that is payable by Funds Management to the Sub-Adviser for investment sub-advisory services (the “Sub-Advisory Agreement Rate”).
Among other information reviewed by the Board was a comparison of the Management Rate of the Fund with those of other funds in the expense Group at a common asset level. The Board noted that the Management Rate of the Fund was lower than the average rate for the Fund’s expense Group.
The Board also received and considered information about the portion of the total advisory fee that was retained by Funds Management after payment of the fee to the Sub-Adviser for sub-advisory services. In assessing the reasonableness of this amount, the Board received and evaluated information about the nature and extent of responsibilities retained and risks assumed by Funds Management and not delegated to or assumed by the Sub-Adviser, and about Funds Management’s on-going oversight services. However, given the affiliation between Funds Management and the Sub-Adviser, the Board ascribed limited relevance to the allocation of the advisory fee between them.
The Board also received and considered information about the nature and extent of services offered and fee rates charged by Funds Management and the Sub-Adviser to other types of clients with investment strategies similar to those of the Fund. In this regard, the Board received information about the significantly greater scope of services, and compliance, reporting and other legal burdens and risks of managing mutual funds compared with those associated with managing assets of non-mutual fund clients such as collective funds or institutional separate accounts.
Based on its consideration of the factors and information it deemed relevant, including those described here, the Board determined that the compensation payable to Funds Management under the Management Agreement and Advisory Agreement and to the Sub-Adviser under the Sub-Advisory Agreement was reasonable, in light of the services covered by the Advisory Agreements.
Table of Contents
| 42 | Wells Fargo Advantage VT Index Asset Allocation Fund | Other information (unaudited) |
Profitability
The Board received and considered information concerning the profitability of Funds Management and the Sub-Adviser, as well as the profitability of Wells Fargo as a whole, from providing services to the Fund and the fund family as a whole.
Funds Management and the Sub-Adviser explained the methodologies and estimates that they used in calculating profitability. Among other things, the Board noted that the levels of profitability reported on a fund-by-fund basis varied widely, depending on factors such as the size and type of fund. Based on its review, the Board did not deem the profits reported by Funds Management or the Sub-Adviser to be at a level that would prevent it from approving the continuation of the Advisory Agreements.
Economies of scale
With respect to possible economies of scale, the Board noted the existence of breakpoints in the Fund’s advisory and management fee structures, and the Fund’s administration fee structure, which operate generally to reduce the Fund’s expense ratio as the Fund grows in size. It considered that, for a small fund or a fund that shrinks in size, breakpoints conversely can result in higher fee levels. The Board also considered that fee waiver and expense reimbursement arrangements and competitive fee rates at the outset are means of sharing potential economies of scale with shareholders of the Fund and the fund family as a whole. The Board considered Funds Management’s view that any analyses of potential economies of scale in managing a particular fund are inherently limited in light of the joint and common costs and investments that Funds Management incurs across the fund family as a whole.
The Board concluded that the Fund’s fee and expense arrangements, including contractual breakpoints, constituted a reasonable approach to sharing potential economies of scale with the Fund and its shareholders.
Other benefits to Funds Management and the Sub-Adviser
The Board received and considered information regarding potential “fall-out” or ancillary benefits received by Funds Management and its affiliates, including the Sub-Adviser, as a result of their relationships with the Fund. Ancillary benefits could include, among others, benefits directly attributable to other relationships with the Fund and benefits potentially derived from an increase in Funds Management’s and the Sub-Adviser’s business as a result of their relationships with the Fund. The Board noted that various affiliates of Funds Management may receive distribution-related fees, shareholder servicing payments and sub-transfer agency fees in respect of shares sold or held through them and services provided.
The Board also reviewed information about soft dollar credits earned and utilized by the Sub-Adviser, fees earned by Funds Management and the Sub-Adviser from managing a private investment vehicle for the fund family’s securities lending collateral and commissions earned by an affiliated broker from portfolio transactions.
Based on its consideration of the factors and information it deemed relevant, including those described here, the Board did not find that any ancillary benefits received by Funds Management and its affiliates, including the Sub-Adviser, were unreasonable.
Conclusion
At the Meeting, after considering the above-described factors and based on its deliberations and its evaluation of the information described above, the Board unanimously approved the continuation of the Advisory Agreement for the period from June 1, 2015 through June 30, 2015, approved the Management Agreement for the period from July 1, 2015 through May 31, 2016, and approved the continuation of the Sub-Advisory Agreement for a one-year term through May 31, 2016. The Board also determined that the compensation payable to Funds Management and the Sub-Adviser under each of the Advisory Agreements was reasonable.
Table of Contents
| List of abbreviations | Wells Fargo Advantage VT Index Asset Allocation Fund | 43 |
The following is a list of common abbreviations for terms and entities that may have appeared in this report.
| ACA | — ACA Financial Guaranty Corporation |
| ADR | — American depositary receipt |
| ADS | — American depositary shares |
| AGC | — Assured Guaranty Corporation |
| AGM | — Assured Guaranty Municipal |
| Ambac | — Ambac Financial Group Incorporated |
| AMT | — Alternative minimum tax |
| AUD | — Australian dollar |
| BAN | — Bond anticipation notes |
| BHAC | — Berkshire Hathaway Assurance Corporation |
| BRL | — Brazilian real |
| CAB | — Capital appreciation bond |
| CAD | — Canadian dollar |
| CCAB | — Convertible capital appreciation bond |
| CDA | — Community Development Authority |
| CDO | — Collateralized debt obligation |
| CHF | — Swiss franc |
| COP | — Columbian Peso |
| CLP | — Chilean peso |
| DKK | — Danish krone |
| DRIVER | — Derivative inverse tax-exempt receipts |
| DW&P | — Department of Water & Power |
| DWR | — Department of Water Resources |
| ECFA | — Educational & Cultural Facilities Authority |
| EDA | — Economic Development Authority |
| EDFA | — Economic Development Finance Authority |
| ETF | — Exchange-traded fund |
| EUR | — Euro |
| FDIC | — Federal Deposit Insurance Corporation |
| FFCB | — Federal Farm Credit Banks |
| FGIC | — Financial Guaranty Insurance Corporation |
| FHA | — Federal Housing Administration |
| FHLB | — Federal Home Loan Bank |
| FHLMC | — Federal Home Loan Mortgage Corporation |
| FICO | — The Financing Corporation |
| FNMA | — Federal National Mortgage Association |
| FSA | — Farm Service Agency |
| GBP | — Great British pound |
| GDR | — Global depositary receipt |
| GNMA | — Government National Mortgage Association |
| GO | — General obligation |
| HCFR | — Healthcare facilities revenue |
| HEFA | — Health & Educational Facilities Authority |
| HEFAR | — Higher education facilities authority revenue |
| HFA | — Housing Finance Authority |
| HFFA | — Health Facilities Financing Authority |
| HKD | — Hong Kong dollar |
| HUD | — Department of Housing and Urban Development |
| HUF | — Hungarian forint |
| IDA | — Industrial Development Authority |
| IDAG | — Industrial Development Agency |
| IDR | — Indonesian rupiah |
| IEP | — Irish pound |
| JPY | — Japanese yen |
| KRW | — Republic of Korea won |
| LIBOR | — London Interbank Offered Rate |
| LIFER | — Long Inverse Floating Exempt Receipts |
| LIQ | — Liquidity agreement |
| LLC | — Limited liability company |
| LLLP | — Limited liability limited partnership |
| LLP | — Limited liability partnership |
| LOC | — Letter of credit |
| LP | — Limited partnership |
| MBIA | — Municipal Bond Insurance Association |
| MFHR | — Multifamily housing revenue |
| MSTR | — Municipal securities trust receipts |
| MTN | — Medium-term note |
| MUD | — Municipal Utility District |
| MXN | — Mexican peso |
| MYR | — Malaysian ringgit |
| National | — National Public Finance Guarantee Corporation |
| NGN | — Nigerian naira |
| NOK | — Norwegian krone |
| NZD | — New Zealand dollar |
| PCFA | — Pollution Control Financing Authority |
| PCL | — Public Company Limited |
| PCR | — Pollution control revenue |
| PFA | — Public Finance Authority |
| PFFA | — Public Facilities Financing Authority |
| PFOTER | — Puttable floating option tax-exempt receipts |
| plc | — Public limited company |
| PLN | — Polish zloty |
| PUTTER | — Puttable tax-exempt receipts |
| R&D | — Research & development |
| Radian | — Radian Asset Assurance |
| RAN | — Revenue anticipation notes |
| RDA | — Redevelopment Authority |
| RDFA | — Redevelopment Finance Authority |
| REIT | — Real estate investment trust |
| ROC | — Reset option certificates |
| RON | — Romanian lei |
| RUB | — Russian ruble |
| SAVRS | — Select auction variable rate securities |
| SBA | — Small Business Authority |
| SDR | — Swedish depositary receipt |
| SEK | — Swedish krona |
| SFHR | — Single-family housing revenue |
| SFMR | — Single-family mortgage revenue |
| SGD | — Singapore dollar |
| SPA | — Standby purchase agreement |
| SPDR | — Standard & Poor’s Depositary Receipts |
| SPEAR | — Short Puttable Exempt Adjustable Receipts |
| STRIPS | — Separate trading of registered interest and |
| principal securities |
| TAN | — Tax anticipation notes |
| TBA | — To be announced |
| THB | — Thai baht |
| TIPS | — Treasury inflation-protected securities |
| TRAN | — Tax revenue anticipation notes |
| TRY | — Turkish lira |
| TTFA | — Transportation Trust Fund Authority |
| TVA | — Tennessee Valley Authority |
| ZAR | — South African rand |
Table of Contents
This page is intentionally left blank.
Table of Contents


For more information
More information about Wells Fargo Advantage Funds is available free upon request. To obtain literature, please write, email, visit the Fund’s website, or call:
Wells Fargo Advantage Funds
P.O. Box 8266
Boston, MA 02266-8266
Email: wfaf@wellsfargo.com
Website: wellsfargoadvantagefunds.com
Individual investors: 1-800-222-8222
Retail investment professionals: 1-888-877-9275
Institutional investment professionals: 1-866-765-0778
This report and the financial statements contained herein are submitted for the general information of the shareholders of Wells Fargo Advantage Funds. If this report is used for promotional purposes, distribution of the report must be accompanied or preceded by a current prospectus. Before investing, please consider the investment objectives, risks, charges, and expenses of the investment. For a current prospectus and, if available, a summary prospectus, containing this information, call 1-800-222-8222 or visit the Fund’s website at wellsfargoadvantagefunds.com. Read the prospectus carefully before you invest or send money.
Wells Fargo Funds Management, LLC, a wholly owned subsidiary of Wells Fargo & Company, provides investment advisory and administrative services for Wells Fargo Advantage Funds. Other affiliates of Wells Fargo & Company provide subadvisory and other services for the Funds. The Funds are distributed by Wells Fargo Funds Distributor, LLC, Member FINRA/SIPC, an affiliate of Wells Fargo & Company.
NOT FDIC INSURED ¡ NO BANK GUARANTEE ¡ MAY LOSE VALUE
© 2015 Wells Fargo Funds Management, LLC. All rights reserved.
235286 08-15 SVT2/SAR136 06-15 |
Table of Contents

Wells Fargo Advantage
VT International Equity Fund

Semi-Annual Report
June 30, 2015

Table of Contents
Reduce clutter. Save trees.
Sign up for electronic delivery of prospectuses and shareholder reports at wellsfargo.com/advantagedelivery
| 2 | ||||
| 4 | ||||
| 6 | ||||
| 7 | ||||
Financial statements | ||||
| 10 | ||||
| 11 | ||||
| 12 | ||||
| 13 | ||||
| 15 | ||||
| 21 | ||||
| 27 | ||||
The views expressed and any forward-looking statements are as of June 30, 2015, unless otherwise noted, and are those of the Fund managers and/or Wells Fargo Funds Management, LLC. Discussions of individual securities, or the markets generally, or any Wells Fargo Advantage Fund are not intended as individual recommendations. Future events or results may vary significantly from those expressed in any forward-looking statements; the views expressed are subject to change at any time in response to changing circumstances in the market. Wells Fargo Funds Management, LLC and the Fund disclaim any obligation to publicly update or revise any views expressed or forward-looking statements.
NOT FDIC INSURED ¡ NO BANK GUARANTEE ¡ MAY LOSE VALUE
Table of Contents
| 2 | Wells Fargo Advantage VT International Equity Fund | Letter to shareholders (unaudited) |

Karla M. Rabusch
President
Wells Fargo Advantage Funds
The period was marked by continued low global interest rates and a slow but steady economic recovery in the U.S.
Further signs that Japan was emerging from its long slump, including solid 3.9% annualized GDP growth in the first quarter of 2015, also boosted investor sentiment on the market.
Dear Valued Shareholder:
We are pleased to offer you this semi-annual report for the Wells Fargo Advantage VT International Equity Fund for the six-month period that ended June 30, 2015. The period was marked by continued low global interest rates and a slow but steady economic recovery in the U.S. However, growing concern as to whether a newly elected anti-austerity government in Greece would default on the country’s debt and remove it from the eurozone resulted in late-period volatility for both U.S. and European stocks.
Major central banks continued to provide liquidity to the markets.
Throughout the reporting period, the Federal Open Market Committee (FOMC), which is the U.S. Federal Reserve’s (Fed’s) monetary policymaking body, kept its key interest rate effectively at zero. As the reporting period progressed, though, various comments by Fed Chair Janet Yellen led investors to believe that the FOMC would raise its key federal funds rate by late 2015. Moreover, the FOMC seemed confident that economic conditions would evolve in a way that it would most likely continue raising rates gradually over time.
In contrast, the European Central Bank (ECB) showed no signs of raising rates at any point in the near future. Rather, the ECB maintained a variety of measures aimed at encouraging lending, including making funds available to banks at low interest rates and imposing a negative interest rate on bank deposits held at the central bank. In January 2015, the bank announced quantitative easing via significant bond purchases in an attempt to raise the eurozone’s inflation to just under its target of 2%. The ECB also provided emergency liquidity to Greek banks while that country’s government negotiated with its creditors, which included the eurozone member states and the International Monetary Fund (IMF).
In Japan, the Bank of Japan (BOJ) continued its aggressive quantitative and qualitative easing program, which involved maintaining interest rates near zero and purchasing stocks in addition to bonds.
Developed markets stocks generally posted gains and outperformed emerging markets stocks.
The MSCI EAFE Index (Net)1, which measures non-U.S. developed markets stocks, ended the period with a 5.52% gain. The Hong Kong stock market was one of the stellar performers, boosted by the Shanghai-Hong Kong Stock Connect program, which made it easier for mainland Chinese investors to purchase Hong Kong—listed stocks (as well as for foreigners to buy Shanghai-listed stocks). Japanese stocks also posted strong returns, supported in part by asset purchases from the BOJ and government-sponsored pension funds. Further signs that Japan was emerging from its long slump, including solid 3.9% annualized GDP growth in the first quarter of 2015, also boosted investor sentiment on the market.
In Europe, uncertainty as to whether Greece would default on a June 30 payment to the IMF resulted in volatility and almost uniformly negative returns for European markets in June. While most of Europe’s stock markets ended the period
| 1 | The Morgan Stanley Capital International Europe, Australasia, and Far East (MSCI EAFE) Index (Net) is a free-float-adjusted market-capitalization-weighted index that is designed to measure the equity market performance of developed markets, excluding the U.S. and Canada. The MSCI EAFE Free Index consists of the following 21 developed markets country indexes: Australia, Austria, Belgium, Denmark, Finland, France, Germany, Hong Kong, Ireland, Israel, Italy, Japan, the Netherlands, New Zealand, Norway, Portugal, Singapore, Spain, Sweden, Switzerland, and the United Kingdom. You cannot invest directly in an index. Source: MSCI. MSCI makes no express or implied warranties or representations and shall have no liability whatsoever with respect to any MSCI data contained herein. The MSCI data may not be further redistributed or used as a basis for other indexes or any securities or financial products. This report is not approved, reviewed, or produced by MSCI. |
Table of Contents
| Letter to shareholders (unaudited) | Wells Fargo Advantage VT International Equity Fund | 3 |
with gains, only a handful—such as Denmark and Ireland—posted double-digit gains for the period. More common were the 2.23% gain for German stocks in the MSCI EAFE Index (Net)and the 5.02% gain for French stocks.
Emerging markets posted mixed returns for the period, with Hungarian, Russian, and Chinese stocks in the MSCI Emerging Markets Index2 delivering double-digit gains, and Colombian, Turkish, and Malaysian stocks delivering double-digit losses. Overall, the index returned 2.95% for the reporting period.
Don’t let short-term uncertainty derail long-term investment goals.
Periods of uncertainty can present challenges, but experience has taught us that maintaining long-term investment goals can be an effective way to plan for the future. To help you create a sound strategy based on your personal goals and risk tolerance, Wells Fargo Advantage Funds offers more than 100 mutual funds and other investments spanning a wide range of asset classes and investment styles. Although diversification cannot guarantee an investment profit or prevent losses, we believe it can be an effective way to manage investment risk and potentially smooth out overall portfolio performance. We encourage investors to know their investments and to understand that appropriate levels of risk-taking may unlock opportunities.
Thank you for choosing to invest with Wells Fargo Advantage Funds. We appreciate your confidence in us and remain committed to helping you meet your financial needs.
Sincerely,

Karla M. Rabusch
President
Wells Fargo Advantage Funds
Notice to shareholders
At a meeting held on August 11–12, 2015, the Board of Trustees of the Fund approved a change in the name of the Fund whereby the word “Advantage” will be removed from its name, effective December 15, 2015.
For current information about your fund investments, contact your investment professional, visit our website at wellsfargoadvantagefunds.com, or call us directly at 1-800-222-8222. We are available 24 hours a day, 7 days a week.
| 2 | The Morgan Stanley Capital International (MSCI) Emerging Markets Index is a free-float-adjusted market-capitalization-weighted index that is designed to measure the equity market performance of emerging markets. The MSCI Emerging Markets Index consists of the following 23 emerging markets country indexes: Brazil, Chile, China, Colombia, Czech Republic, Egypt, Greece, Hungary, India, Indonesia, Korea, Malaysia, Mexico, Peru, the Philippines, Poland, Qatar, Russia, South Africa, Taiwan, Thailand, Turkey,* and United Arab Emirates. You cannot invest directly in an index. |
Table of Contents
| 4 | Wells Fargo Advantage VT International Equity Fund | Performance highlights (unaudited) |
Investment objective
The Fund seeks long-term capital appreciation.
Adviser
Wells Fargo Funds Management, LLC
Subadviser
Wells Capital Management Incorporated
Portfolio managers
Jeffrey Everett, CFA
Dale A. Winner, CFA
Average annual total returns1 (%) as of June 30, 2015
| Expense ratios2 (%) | ||||||||||||
| Inception date | 1 year | 5 year | 10 year | Gross | Net3 | |||||||
| Class 1 | 8-17-1998 | 6.05 | 10.40 | 5.22 | 0.95 | 0.70 | ||||||
| Class 2 | 7-31-2002 | 5.73 | 10.13 | 4.96 | 1.20 | 0.95 | ||||||
| MSCI ACWI ex USA (Net)4 | – | (5.26) | 7.76 | 5.54 | – | – | ||||||
Figures quoted represent past performance, which is no guarantee of future results and do not reflect the deduction of taxes that a shareholder may pay on fund distributions or the redemption of fund shares. Investment return and principal value of an investment will fluctuate so that an investor’s shares, when redeemed, may be worth more or less than their original cost. Current performance may be lower or higher than the performance data quoted, which assumes the reinvestment of dividends and capital gains. Current month-end performance is available by calling 1-800-222-8222. Performance figures of the Fund do not reflect fees charged pursuant to the terms of variable life insurance policies and variable annuity contracts. If fees had been reflected, performance would have been lower.
Index returns do not include transaction costs associated with buying and selling securities, any mutual fund fees or expenses, or any taxes. It is not possible to invest directly in an index.
Stock values fluctuate in response to the activities of individual companies and general market and economic conditions. Foreign investments are especially volatile and can rise or fall dramatically due to differences in the political and economic conditions of the host country. These risks are generally intensified in emerging markets. The use of derivatives may reduce returns and/or increase volatility. Certain investment strategies tend to increase the total risk of an investment (relative to the broader market). The Fund is exposed to smaller-company securities risk. Consult the Fund’s prospectus for additional information on these and other risks.
Please refer to the prospectus provided by your participating insurance company for detailed information describing the separate accounts for information regarding surrender charges, mortality and expense risk fees, and other charges that may be assessed by the participating insurance companies.
Please see footnotes on page 5.
Table of Contents
| Performance highlights (unaudited) | Wells Fargo Advantage VT International Equity Fund | 5 |
| Ten largest holdings5 (%) as of June 30, 2015 | ||||
Mitsubishi UFJ Financial Group Incorporated | 3.96 | |||
Daiwa House Industry Company Limited | 3.79 | |||
Hitachi Limited | 3.22 | |||
Nomura Holdings Incorporated | 2.98 | |||
China Everbright Limited | 2.85 | |||
Wolseley plc | 2.74 | |||
Compagnie de Saint-Gobain SA | 2.69 | |||
Rheinmetall AG | 2.66 | |||
Akzo Nobel NV | 2.57 | |||
Vodafone Group plc | 2.55 | |||
| Sector distribution6 as of June 30, 2015 |
 |
| Country allocation6 as of June 30, 2015 |
 |
| 1 | Historical performance shown for all classes of the Fund prior to July 19, 2010, is based on the performance of the Fund’s predecessor, Evergreen VA International Equity Fund. Effective July 16, 2010, the Fund changed its name from Wells Fargo Advantage VT International Core Fund to Wells Fargo Advantage VT International Equity Fund. |
| 2 | Reflects the expense ratios as stated in the most recent prospectuses, which include the impact of 0.01% in acquired fund fees and expenses. The expense ratios shown are subject to change and may differ from the annualized expense ratios shown in the financial highlights of this report, which do not include acquired fund fees and expenses. |
| 3 | The Adviser has contractually committed through April 30, 2016, to waive fees and/or reimburse expenses to the extent necessary to cap the Fund’s Total Annual Fund Operating Expenses After Fee Waiver at 0.69% for Class 1 and 0.94% for Class 2. After this time, the cap may be increased or the commitment to maintain the cap may be terminated only with the approval of the Board of Trustees. Brokerage commissions, stamp duty fees, interest, taxes, acquired fund fees and expenses, and extraordinary expenses are excluded from the cap. Without this cap, the Fund’s returns would have been lower. |
| 4 | The Morgan Stanley Capital International All Country World Index ex USA (MSCI ACWI ex USA) (Net) is a free float-adjusted market capitalization weighted index that is designed to measure the equity market performance of developed and emerging markets excluding the United States. You cannot invest directly in an index. Source: MSCI. MSCI makes no express or implied warranties or representations and shall have no liability whatsoever with respect to any MSCI data contained herein. The MSCI data may not be further redistributed or used as a basis for other indexes or any securities or financial products. This report is not approved, reviewed, or produced by MSCI. |
| 5 | The ten largest holdings, excluding cash and cash equivalents, are calculated based on the value of the investments divided by total net assets of the Fund. Holdings are subject to change and may have changed since the date specified. |
| 6 | Amounts are calculated based on the total long-term investments of the Fund. These amounts are subject to change and may have changed since the date specified. |
Table of Contents
| 6 | Wells Fargo Advantage VT International Equity Fund | Fund expenses (unaudited) |
As a shareholder of the Fund, you incur ongoing costs, including management fees, distribution (12b-1) fees, and other Fund expenses. This example is intended to help you understand your ongoing costs (in dollars) of investing in the Fund and to compare these costs with the ongoing costs of investing in other mutual funds.
The example is based on an investment of $1,000 invested at the beginning of the six-month period and held for the entire period from January 1, 2015 to June 30, 2015.
Actual expenses
The “Actual” line of the table below provides information about actual account values and actual expenses. You may use the information in this line, together with the amount you invested, to estimate the expenses that you paid over the period. Simply divide your account value by $1,000 (for example, an $8,600 account value divided by $1,000 = 8.6), then multiply the result by the number in the “Actual” line under the heading entitled “Expenses Paid During Period” for your applicable class of shares to estimate the expenses you paid on your account during this period.
Hypothetical example for comparison purposes
The “Hypothetical” line of the table below provides information about hypothetical account values and hypothetical expenses based on the Fund’s actual expense ratio and an assumed rate of return of 5% per year before expenses, which is not the Fund’s actual return. The hypothetical account values and expenses may not be used to estimate the actual ending account balance or expenses you paid for the period. You may use this information to compare the ongoing costs of investing in the Fund and other funds. To do so, compare this 5% hypothetical example with the 5% hypothetical examples that appear in the shareholder reports of the other funds.
Please note that the expenses shown in the table are meant to highlight your ongoing costs only and do not reflect any separate account charges assessed by participating insurance companies. Therefore, the “Hypothetical” line of the table is useful in comparing ongoing costs only, and will not help you determine the relative total costs of owning different funds. In addition, if these separate account charges assessed by participating insurance companies were included, your costs would have been higher.
| Beginning account value 1-1-2015 | Ending account value 6-30-2015 | Expenses paid during the period1 | Net annualized expense ratio | |||||||||||||
Class 1 | ||||||||||||||||
Actual | $ | 1,000.00 | $ | 1,130.08 | $ | 3.64 | 0.69 | % | ||||||||
Hypothetical (5% return before expenses) | $ | 1,000.00 | $ | 1,021.37 | $ | 3.46 | 0.69 | % | ||||||||
Class 2 | ||||||||||||||||
Actual | $ | 1,000.00 | $ | 1,127.27 | $ | 4.96 | 0.94 | % | ||||||||
Hypothetical (5% return before expenses) | $ | 1,000.00 | $ | 1,020.13 | $ | 4.71 | 0.94 | % | ||||||||
| 1 | Expenses paid is equal to the annualized expense ratio of each class multiplied by the average account value over the period, multiplied by the number of days in the most recent fiscal half-year divided by the number of days in the fiscal year (to reflect the one-half year period). |
Table of Contents
| Portfolio of investments—June 30, 2015 (unaudited) | Wells Fargo Advantage VT International Equity Fund | 7 |
| Security name | Shares | Value | ||||||||||
Common Stocks: 92.46% | ||||||||||||
| Canada: 1.58% | ||||||||||||
Valeant Pharmaceuticals International Incorporated (Health Care, Pharmaceuticals) † | 24,752 | $ | 5,498,657 | |||||||||
|
| |||||||||||
| China: 5.02% | ||||||||||||
Biostime International Holdings Limited (Consumer Staples, Food Products) « | 838,000 | 2,454,038 | ||||||||||
Dongfeng Motor Group Company Limited H Shares (Consumer Discretionary, Automobiles) | 5,122,000 | 6,872,019 | ||||||||||
Industrial & Commercial Bank of China Limited H Shares (Financials, Banks) | 7,681,000 | 6,103,935 | ||||||||||
Xtep International Holdings Limited (Consumer Discretionary, Textiles, Apparel & Luxury Goods) | 5,467,453 | 2,003,156 | ||||||||||
| 17,433,148 | ||||||||||||
|
| |||||||||||
| France: 2.69% | ||||||||||||
Compagnie de Saint-Gobain SA (Industrials, Building Products) « | 208,601 | 9,365,140 | ||||||||||
|
| |||||||||||
| Germany: 13.59% | ||||||||||||
Bayer AG (Health Care, Pharmaceuticals) | 46,601 | 6,522,712 | ||||||||||
Hugo Boss AG (Consumer Discretionary, Textiles, Apparel & Luxury Goods) | 40,409 | 4,516,258 | ||||||||||
Metro AG (Consumer Staples, Food & Staples Retailing) | 216,050 | 6,811,613 | ||||||||||
Rheinmetall AG (Industrials, Industrial Conglomerates) | 182,357 | 9,247,129 | ||||||||||
SAP AG (Information Technology, Software) | 80,382 | 5,609,826 | ||||||||||
Siemens AG (Industrials, Industrial Conglomerates) | 77,378 | 7,794,027 | ||||||||||
Volkswagen AG (Consumer Discretionary, Automobiles) | 29,137 | 6,756,541 | ||||||||||
| 47,258,106 | ||||||||||||
|
| |||||||||||
| Hong Kong: 6.30% | ||||||||||||
China Everbright Limited (Financials, Capital Markets) | 2,854,000 | 9,904,161 | ||||||||||
China Mobile Limited (Telecommunication Services, Wireless Telecommunication Services) | 680,500 | 8,713,048 | ||||||||||
Value Partners Group Limited (Financials, Capital Markets) | 2,080,000 | 3,284,401 | ||||||||||
| 21,901,610 | ||||||||||||
|
| |||||||||||
| Italy: 9.00% | ||||||||||||
Anima Holding SpA (Financials, Capital Markets) | 938,906 | 8,248,303 | ||||||||||
Eni SpA (Energy, Oil, Gas & Consumable Fuels) | 362,386 | 6,431,774 | ||||||||||
Intesa Sanpaolo SpA (Financials, Banks) | 2,138,527 | 7,753,210 | ||||||||||
Prysmian SpA (Industrials, Electrical Equipment) | 409,496 | 8,847,482 | ||||||||||
| 31,280,769 | ||||||||||||
|
| |||||||||||
| Japan: 23.09% | ||||||||||||
Coca-Cola East Japan Company Limited (Consumer Staples, Beverages) | 219,800 | 4,067,876 | ||||||||||
Daiwa House Industry Company Limited (Financials, Real Estate Management & Development) | 564,800 | 13,166,437 | ||||||||||
Daiwa Securities Group Incorporated (Financials, Capital Markets) | 487,000 | 3,649,764 | ||||||||||
Hitachi Limited (Information Technology, Electronic Equipment, Instruments & Components) | 1,699,000 | 11,200,337 | ||||||||||
Mitsubishi UFJ Financial Group Incorporated (Financials, Banks) | 1,915,100 | 13,767,251 | ||||||||||
Mitsui Fudosan Company Limited (Financials, Real Estate Management & Development) | 275,000 | 7,700,494 | ||||||||||
Nitto Denko Corporation (Materials, Chemicals) | 71,882 | 5,908,673 | ||||||||||
Nomura Holdings Incorporated (Financials, Capital Markets) | 1,529,100 | 10,377,664 | ||||||||||
Toyota Motor Corporation (Consumer Discretionary, Automobiles) | 116,600 | 7,815,254 | ||||||||||
West Holdings Corporation (Consumer Discretionary, Household Durables) « | 251,900 | 1,811,268 | ||||||||||
Yaskawa Electric Corporation (Information Technology, Electronic Equipment, Instruments & Components) | 63,700 | 816,126 | ||||||||||
| 80,281,144 | ||||||||||||
|
| |||||||||||
The accompanying notes are an integral part of these financial statements.
Table of Contents
| 8 | Wells Fargo Advantage VT International Equity Fund | Portfolio of investments—June 30, 2015 (unaudited) |
| Security name | Shares | Value | ||||||||||||
| Netherlands: 2.57% | ||||||||||||||
Akzo Nobel NV (Materials, Chemicals) | 122,827 | $ | 8,937,658 | |||||||||||
|
| |||||||||||||
| Norway: 1.54% | ||||||||||||||
Frontline 2012 Limited (Energy, Oil, Gas & Consumable Fuels) 144A | 323,560 | 1,691,990 | ||||||||||||
Golden Ocean Group Limited (Industrials, Marine) « | 100,665 | 391,595 | ||||||||||||
Marine Harvest ASA (Consumer Staples, Food Products) | 285,852 | 3,277,630 | ||||||||||||
| 5,361,215 | ||||||||||||||
|
| |||||||||||||
| South Korea: 3.66% | ||||||||||||||
Hana Financial Group Incorporated (Financials, Banks) | 221,625 | 5,771,847 | ||||||||||||
Samsung Electronics Company Limited GDR (Information Technology, Semiconductors & Semiconductor Equipment) 144A | 10,084 | 5,752,922 | ||||||||||||
SK Telecom Company Limited (Telecommunication Services, Wireless Telecommunication Services) | 5,285 | 1,184,500 | ||||||||||||
| 12,709,269 | ||||||||||||||
|
| |||||||||||||
| Sweden: 1.40% | ||||||||||||||
Volvo AB Class B (Industrials, Machinery) | 393,200 | 4,880,701 | ||||||||||||
|
| |||||||||||||
| Switzerland: 6.24% | ||||||||||||||
ABB Limited (Industrials, Electrical Equipment) | 345,383 | 7,233,113 | ||||||||||||
Novartis AG (Health Care, Pharmaceuticals) | 72,588 | 7,154,376 | ||||||||||||
Zurich Insurance Group AG (Financials, Insurance) | 23,963 | 7,294,368 | ||||||||||||
| 21,681,857 | ||||||||||||||
|
| |||||||||||||
| United Kingdom: 14.26% | ||||||||||||||
BP plc (Energy, Oil, Gas & Consumable Fuels) | 1,232,574 | 8,136,968 | ||||||||||||
Capita plc (Industrials, Professional Services) | 184,477 | 3,588,460 | ||||||||||||
Man Group plc (Financials, Capital Markets) | 3,428,199 | 8,451,508 | ||||||||||||
Reckitt Benckiser Group plc (Consumer Staples, Household Products) | 64,815 | 5,589,010 | ||||||||||||
Smiths Group plc (Industrials, Industrial Conglomerates) | 304,503 | 5,401,704 | ||||||||||||
Vodafone Group plc (Telecommunication Services, Wireless Telecommunication Services) | 2,455,598 | 8,868,436 | ||||||||||||
Wolseley plc (Industrials, Trading Companies & Distributors) | 149,317 | 9,532,380 | ||||||||||||
| 49,568,466 | ||||||||||||||
|
| |||||||||||||
| United States: 1.52% | ||||||||||||||
QUALCOMM Incorporated (Information Technology, Communications Equipment) | 84,307 | 5,280,150 | ||||||||||||
|
| |||||||||||||
Total Common Stocks (Cost $275,706,830) | 321,437,890 | |||||||||||||
|
| |||||||||||||
| Expiration date | ||||||||||||||
| Participation Notes: 2.17% | ||||||||||||||
| China: 2.17% | ||||||||||||||
HSBC Bank plc (Kweichow Moutai Company Limited Class A) (Consumer Staples, Beverages) † | 2-19-2019 | 39,500 | 1,639,761 | |||||||||||
HSBC Bank plc (Kweichow Moutai Company Limited Class A) (Consumer Staples, Beverages) † | 12-4-2024 | 12,842 | 533,109 | |||||||||||
Standard Chartered Bank (Kweichow Moutai Company Limited Class A) (Consumer Staples, Beverages) † | 4-18-2016 | 129,526 | 5,377,004 | |||||||||||
Total Participation Notes (Cost $6,287,692) | 7,549,874 | |||||||||||||
|
| |||||||||||||
The accompanying notes are an integral part of these financial statements.
Table of Contents
| Portfolio of investments—June 30, 2015 (unaudited) | Wells Fargo Advantage VT International Equity Fund | 9 |
| Security name | Yield | Shares | Value | |||||||||||
Short-Term Investments: 5.01% | ||||||||||||||
| Investment Companies: 5.01% | ||||||||||||||
Securities Lending Cash Investments, LLC (l)(r)(u) | 0.13 | % | 1,724,690 | $ | 1,724,690 | |||||||||
Wells Fargo Advantage Cash Investment Money Market Fund, Select Class (l)(u) | 0.12 | 15,698,182 | 15,698,182 | |||||||||||
Total Short-Term Investments (Cost $17,422,872) | 17,422,872 | |||||||||||||
|
| |||||||||||||
| Total investments in securities (Cost $299,417,394) * | 99.64 | % | 346,410,636 | |||||
Other assets and liabilities, net | 0.36 | 1,250,748 | ||||||
|
|
|
| |||||
| Total net assets | 100.00 | % | $ | 347,661,384 | ||||
|
|
|
|
| † | Non-income-earning security |
| « | All or a portion of this security is on loan. |
| 144A | The security may be resold in transactions exempt from registration, normally to qualified institutional buyers, pursuant to Rule 144A under the Securities Act of 1933. |
| (l) | The security represents an affiliate of the Fund as defined in the Investment Company Act of 1940. |
| (r) | The investment is a non-registered investment vehicle purchased with cash collateral received from securities on loan. |
| (u) | The rate represents the 7-day annualized yield at period end. |
| * | Cost for federal income tax purposes is $302,160,235 and unrealized gains (losses) consists of: |
Gross unrealized gains | $ | 56,944,314 | ||
Gross unrealized losses | (12,693,913 | ) | ||
|
| |||
Net unrealized gains | $ | 44,250,401 |
The accompanying notes are an integral part of these financial statements.
Table of Contents
| 10 | Wells Fargo Advantage VT International Equity Fund | Statement of assets and liabilities—June 30, 2015 (unaudited) |
Assets | ||||
Investments | ||||
In unaffiliated securities (including $1,636,233 of securities loaned), at value (cost $281,994,522) | $ | 328,987,764 | ||
In affiliated securities, at value (cost $17,422,872) | 17,422,872 | |||
|
| |||
Total investments, at value (cost $299,417,394) | 346,410,636 | |||
Foreign currency, at value (cost $3,319,747) | 3,185,075 | |||
Receivable for Fund shares sold | 6,110 | |||
Receivable for dividends | 1,841,504 | |||
Receivable for securities lending income | 27,802 | |||
Unrealized gains on forward foreign currency contracts | 312,727 | |||
Prepaid expenses and other assets | 4,329 | |||
|
| |||
Total assets | 351,788,183 | |||
|
| |||
Liabilities | ||||
Payable for investments purchased | 747,624 | |||
Payable for Fund shares redeemed | 219,965 | |||
Unrealized losses on forward foreign currency contracts | 1,134,878 | |||
Payable upon receipt of securities loaned | 1,724,690 | |||
Advisory fee payable | 145,305 | |||
Distribution fee payable | 66,425 | |||
Administration fees payable | 38,389 | |||
Accrued expenses and other liabilities | 49,523 | |||
|
| |||
Total liabilities | 4,126,799 | |||
|
| |||
Total net assets | $ | 347,661,384 | ||
|
| |||
NET ASSETS CONSIST OF | ||||
Paid-in capital | $ | 263,556,648 | ||
Undistributed net investment income | 16,344,085 | |||
Accumulated net realized gains on investments | 21,651,347 | |||
Net unrealized gains on investments | 46,109,304 | |||
|
| |||
Total net assets | $ | 347,661,384 | ||
|
| |||
COMPUTATION OF NET ASSET VALUE PER SHARE | ||||
Net assets – Class 1 | $ | 34,617,814 | ||
Shares outstanding – Class 11 | 6,229,826 | |||
Net asset value per share – Class 1 | $5.56 | |||
Net assets – Class 2 | $ | 313,043,570 | ||
Shares outstanding – Class 21 | 56,143,405 | |||
Net asset value per share – Class 2 | $5.58 | |||
| 1 | The Fund has an unlimited number of authorized shares. |
The accompanying notes are an integral part of these financial statements.
Table of Contents
| Statement of operations—six months ended June 30, 2015 (unaudited) | Wells Fargo Advantage VT International Equity Fund | 11 |
Investment income | ||||
Dividends (net of foreign withholding taxes of $602,900) | $ | 6,617,848 | ||
Securities lending income, net | 134,467 | |||
Income from affiliated securities | 7,617 | |||
|
| |||
Total investment income | 6,759,932 | |||
|
| |||
Expenses | ||||
Advisory fee | 1,329,763 | |||
Administration fees | ||||
Fund level | 88,651 | |||
Class 1 | 13,736 | |||
Class 2 | 128,106 | |||
Distribution fee | ||||
Class 2 | 400,330 | |||
Custody and accounting fees | 51,483 | |||
Professional fees | 29,832 | |||
Shareholder report expenses | 20,756 | |||
Trustees’ fees and expenses | 6,892 | |||
Interest expense | 872 | |||
Other fees and expenses | 11,418 | |||
|
| |||
Total expenses | 2,081,839 | |||
Less: Fee waivers and/or expense reimbursements | (457,254 | ) | ||
|
| |||
Net expenses | 1,624,585 | |||
|
| |||
Net investment income | 5,135,347 | |||
|
| |||
REALIZED AND UNREALIZED GAINS (LOSSES) ON INVESTMENTS | ||||
Net realized gains on: | ||||
Unaffiliated securities | 22,210,042 | |||
Forward foreign currency contract transactions | 3,861,401 | |||
|
| |||
Net realized gains on investments | 26,071,443 | |||
|
| |||
Net change in unrealized gains (losses) on: | ||||
Unaffiliated securities | 15,330,909 | |||
Forward foreign currency contract transactions | (2,960,894 | ) | ||
|
| |||
Net change in unrealized gains (losses) on investments | 12,370,015 | |||
|
| |||
Net realized and unrealized gains (losses) on investments | 38,441,458 | |||
|
| |||
Net increase in net assets resulting from operations | $ | 43,576,805 | ||
|
| |||
The accompanying notes are an integral part of these financial statements.
Table of Contents
| 12 | Wells Fargo Advantage VT International Equity Fund | Statement of changes in net assets |
Six months ended June 30, 2015 (unaudited) | Year ended December 31, 2014 | |||||||||||||||
Operations | ||||||||||||||||
Net investment income | $ | 5,135,347 | $ | 10,834,511 | ||||||||||||
Net realized gains on investments | 26,071,443 | 2,201,263 | ||||||||||||||
Net change in unrealized gains (losses) on investments | 12,370,015 | (32,033,033 | ) | |||||||||||||
|
| |||||||||||||||
Net increase (decrease) in net assets resulting from operations | 43,576,805 | (18,997,259 | ) | |||||||||||||
|
| |||||||||||||||
Distributions to shareholders from | ||||||||||||||||
Net investment income | ||||||||||||||||
Class 1 | 0 | (1,068,920 | ) | |||||||||||||
Class 2 | 0 | (8,395,187 | ) | |||||||||||||
Net realized gains | ||||||||||||||||
Class 1 | 0 | (836,185 | ) | |||||||||||||
Class 2 | 0 | (7,242,278 | ) | |||||||||||||
|
| |||||||||||||||
Total distributions to shareholders | 0 | (17,542,570 | ) | |||||||||||||
|
| |||||||||||||||
Capital share transactions | Shares | Shares | ||||||||||||||
Proceeds from shares sold | ||||||||||||||||
Class 1 | 451,621 | 2,427,635 | 448,360 | 2,313,021 | ||||||||||||
Class 2 | 647,958 | 3,643,634 | 6,415,713 | 32,449,977 | ||||||||||||
|
| |||||||||||||||
| 6,071,269 | 34,762,998 | |||||||||||||||
|
| |||||||||||||||
Reinvestment of distributions | ||||||||||||||||
Class 1 | 0 | 0 | 367,780 | 1,905,105 | ||||||||||||
Class 2 | 0 | 0 | 3,001,422 | 15,637,465 | ||||||||||||
|
| |||||||||||||||
| 0 | 17,542,570 | |||||||||||||||
|
| |||||||||||||||
Payment for shares redeemed | ||||||||||||||||
Class 1 | (842,362 | ) | (4,552,631 | ) | (1,861,970 | ) | (9,716,924 | ) | ||||||||
Class 2 | (7,356,661 | ) | (40,942,790 | ) | (4,628,256 | ) | (24,125,462 | ) | ||||||||
|
| |||||||||||||||
| (45,495,421 | ) | (33,842,386 | ) | |||||||||||||
|
| |||||||||||||||
Net increase (decrease) in net assets resulting from capital share transactions | (39,424,152 | ) | 18,463,182 | |||||||||||||
|
| |||||||||||||||
Total increase (decrease) in net assets | 4,152,653 | (18,076,647 | ) | |||||||||||||
|
| |||||||||||||||
Net assets | ||||||||||||||||
Beginning of period | 343,508,731 | 361,585,378 | ||||||||||||||
|
| |||||||||||||||
End of period | $ | 347,661,384 | $ | 343,508,731 | ||||||||||||
|
| |||||||||||||||
Undistributed net investment income | $ | 16,344,085 | $ | 11,208,738 | ||||||||||||
|
| |||||||||||||||
The accompanying notes are an integral part of these financial statements.
Table of Contents
| Financial highlights | Wells Fargo Advantage VT International Equity Fund | 13 |
(For a share outstanding throughout each period)
| Six months ended June 30, 2015 (unaudited) | Year ended December 31 | |||||||||||||||||||||||
| CLASS 1 | 2014 | 2013 | 2012 | 2011 | 20101 | |||||||||||||||||||
Net asset value, beginning of period | $4.92 | $5.48 | $4.94 | $4.77 | $5.75 | $5.15 | ||||||||||||||||||
Net investment income | 0.13 | 0.18 | 2 | 0.12 | 2 | 0.13 | 2 | 0.11 | 2 | 0.05 | 2 | |||||||||||||
Net realized and unrealized gains (losses) on investments | 0.51 | (0.46 | ) | 0.82 | 0.45 | (0.80 | ) | 0.78 | ||||||||||||||||
|
|
|
|
|
|
|
|
|
|
|
| |||||||||||||
Total from investment operations | 0.64 | (0.28 | ) | 0.94 | 0.58 | (0.69 | ) | 0.83 | ||||||||||||||||
Distributions to shareholders from | ||||||||||||||||||||||||
Net investment income | 0.00 | (0.16 | ) | (0.13 | ) | (0.08 | ) | (0.04 | ) | (0.05 | ) | |||||||||||||
Net realized gains | 0.00 | (0.12 | ) | (0.27 | ) | (0.33 | ) | (0.25 | ) | (0.18 | ) | |||||||||||||
|
|
|
|
|
|
|
|
|
|
|
| |||||||||||||
Total distributions to shareholders | 0.00 | (0.28 | ) | (0.40 | ) | (0.41 | ) | (0.29 | ) | (0.23 | ) | |||||||||||||
Net asset value, end of period | $5.56 | $4.92 | $5.48 | $4.94 | $4.77 | $5.75 | ||||||||||||||||||
Total return3 | 13.01 | % | (5.30 | )% | 19.94 | % | 13.68 | % | (12.79 | )% | 16.79 | % | ||||||||||||
Ratios to average net assets (annualized) | ||||||||||||||||||||||||
Gross expenses | 0.95 | % | 0.94 | % | 0.95 | % | 0.98 | % | 0.97 | % | 0.85 | % | ||||||||||||
Net expenses | 0.69 | % | 0.69 | % | 0.69 | % | 0.69 | % | 0.69 | % | 0.66 | % | ||||||||||||
Net investment income | 3.15 | % | 3.44 | % | 2.36 | % | 2.68 | % | 2.06 | % | 1.04 | % | ||||||||||||
Supplemental data | ||||||||||||||||||||||||
Portfolio turnover rate | 16 | % | 39 | % | 32 | % | 140 | % | 66 | % | 60 | % | ||||||||||||
Net assets, end of period (000s omitted) | $34,618 | $32,599 | $42,021 | $43,089 | $46,017 | $67,659 | ||||||||||||||||||
| 1 | After the close of business on July 16, 2010, the Fund acquired the net assets of Evergreen VA International Equity Fund which became the accounting and performance survivor in the transaction. The information for the period prior to July 19, 2010 is that of Class 1 of Evergreen VA International Equity Fund. The per share information has been adjusted to give effect to this transaction. |
| 2 | Calculated based upon average shares outstanding |
| 3 | Returns for periods of less than one year are not annualized. |
The accompanying notes are an integral part of these financial statements.
Table of Contents
| 14 | Wells Fargo Advantage VT International Equity Fund | Financial highlights |
(For a share outstanding throughout each period)
| Six months ended June 30, 2015 (unaudited) | Year ended December 31 | |||||||||||||||||||||||
| CLASS 2 | 2014 | 2013 | 2012 | 2011 | 20101 | |||||||||||||||||||
Net asset value, beginning of period | $4.95 | $5.50 | $4.96 | $4.78 | $5.74 | $5.15 | ||||||||||||||||||
Net investment income | 0.10 | 0.16 | 0.11 | 2 | 0.11 | 0.09 | 2 | 0.06 | 2 | |||||||||||||||
Net realized and unrealized gains (losses) on investments | 0.53 | (0.45 | ) | 0.82 | 0.47 | (0.79 | ) | 0.75 | ||||||||||||||||
|
|
|
|
|
|
|
|
|
|
|
| |||||||||||||
Total from investment operations | 0.63 | (0.29 | ) | 0.93 | 0.58 | (0.70 | ) | 0.81 | ||||||||||||||||
Distributions to shareholders from | ||||||||||||||||||||||||
Net investment income | 0.00 | (0.14 | ) | (0.12 | ) | (0.07 | ) | (0.01 | ) | (0.04 | ) | |||||||||||||
Net realized gains | 0.00 | (0.12 | ) | (0.27 | ) | (0.33 | ) | (0.25 | ) | (0.18 | ) | |||||||||||||
|
|
|
|
|
|
|
|
|
|
|
| |||||||||||||
Total distributions to shareholders | 0.00 | (0.26 | ) | (0.39 | ) | (0.40 | ) | (0.26 | ) | (0.22 | ) | |||||||||||||
Net asset value, end of period | $5.58 | $4.95 | $5.50 | $4.96 | $4.78 | $5.74 | ||||||||||||||||||
Total return3 | 12.73 | % | (5.35 | )% | 19.52 | % | 13.48 | % | (12.91 | )% | 16.50 | % | ||||||||||||
Ratios to average net assets (annualized) | ||||||||||||||||||||||||
Gross expenses | 1.20 | % | 1.20 | % | 1.20 | % | 1.23 | % | 1.22 | % | 0.97 | % | ||||||||||||
Net expenses | 0.94 | % | 0.94 | % | 0.94 | % | 0.94 | % | 0.94 | % | 0.89 | % | ||||||||||||
Net investment income | 2.87 | % | 3.07 | % | 2.08 | % | 2.41 | % | 1.75 | % | 1.22 | % | ||||||||||||
Supplemental data | ||||||||||||||||||||||||
Portfolio turnover rate | 16 | % | 39 | % | 32 | % | 140 | % | 66 | % | 60 | % | ||||||||||||
Net assets, end of period (000s omitted) | $313,044 | $310,909 | $319,565 | $296,705 | $227,692 | $218,348 | ||||||||||||||||||
| 1 | After the close of business on July 16, 2010, the Fund acquired the net assets of Evergreen VA International Equity Fund which became the accounting and performance survivor in the transaction. The information for the period prior to July 19, 2010 is that of Class 2 of Evergreen VA International Equity Fund. The per share information has been adjusted to give effect to this transaction. |
| 2 | Calculated based upon average shares outstanding |
| 3 | Returns for periods of less than one year are not annualized. |
The accompanying notes are an integral part of these financial statements.
Table of Contents
| Notes to financial statements (unaudited) | Wells Fargo Advantage VT International Equity Fund | 15 |
1. ORGANIZATION
Wells Fargo Variable Trust (the “Trust”), a Delaware statutory trust organized on March 10, 1999, is an open-end management investment company registered under the Investment Company Act of 1940, as amended (the “1940 Act”). As an investment company, the Trust follows the accounting and reporting guidance in Financial Accounting Standards Board (“FASB”) Accounting Standards Codification Topic 946, Financial Services – Investment Companies. These financial statements report on the Wells Fargo Advantage VT International Equity Fund (the “Fund”) which is a diversified series of the Trust.
2. SIGNIFICANT ACCOUNTING POLICIES
The following significant accounting policies, which are consistently followed in the preparation of the financial statements of the Fund, are in conformity with U.S. generally accepted accounting principles which require management to make estimates and assumptions that affect the reported amounts of assets and liabilities, disclosure of contingent assets and liabilities at the date of the financial statements, and the reported amounts of revenues and expenses during the reporting period. Actual results could differ from those estimates.
Securities valuation
All investments are valued each business day as of the close of regular trading on the New York Stock Exchange (generally 4 p.m. Eastern Time).
Equity securities that are listed on a foreign or domestic exchange or market are valued at the official closing price or, if none, the last sales price. If no sale occurs on the primary exchange or market that day, the prior day’s price will be deemed “stale” and a fair value price will be determined in accordance with the Fund’s Valuation Procedures.
Equity securities that are not listed on a foreign or domestic exchange or market, but have a public trading market, are valued at the quoted bid price from an independent broker-dealer that the Management Valuation Team of Wells Fargo Funds Management, LLC (“Funds Management”) has determined is an acceptable source.
The values of securities denominated in foreign currencies are translated into U.S. dollars at rates provided by an independent foreign currency pricing source at a time each business day specified by the Management Valuation Team.
Many securities markets and exchanges outside the U.S. close prior to the close of the New York Stock Exchange and therefore may not fully reflect trading or events that occur after the close of the principal exchange in which the foreign securities are traded, but before the close of the New York Stock Exchange. If such trading or events are expected to materially affect the value of such securities, then fair value pricing procedures approved by the Board of Trustees of the Fund are applied. These procedures take into account multiple factors including movements in U.S. securities markets after foreign exchanges close. Foreign securities that are fair valued under these procedures are categorized as Level 2 and the application of these procedures may result in transfers between Level 1 and Level 2. Depending on market activity, such fair valuations may be frequent. Such fair value pricing may result in net asset values that are higher or lower than net asset values based on the last reported sales price or latest quoted bid price. On June 30, 2015, such fair value pricing was not used in pricing foreign securities.
Investments in registered open-end investment companies are valued at net asset value. Interests in non-registered investment vehicles that are redeemable at net asset value are fair valued at net asset value when available.
Investments which are not valued using any of the methods discussed above are valued at their fair value, as determined in good faith by the Board of Trustees. The Board of Trustees has established a Valuation Committee comprised of the Trustees and has delegated to it the authority to take any actions regarding the valuation of portfolio securities that the Valuation Committee deems necessary or appropriate, including determining the fair value of portfolio securities, unless the determination has been delegated to the Management Valuation Team. The Board of Trustees retains the authority to make or ratify any valuation decisions or approve any changes to the Valuation Procedures as it deems appropriate. On a quarterly basis, the Board of Trustees receives reports on any valuation actions taken by the Valuation Committee or the Management Valuation Team which may include items for ratification.
Valuations of fair valued securities are compared to the next actual sales price when available, or other appropriate market values, to assess the continued appropriateness of the fair valuation methodologies used. These securities are fair valued on a day-to-day basis, taking into consideration changes to appropriate market information and any significant changes to the inputs considered in the valuation process until there is a readily available price provided on an exchange or by an independent pricing service. Valuations received from an independent pricing service or independent broker-dealer quotes are periodically validated by comparisons to most recent trades and valuations provided by other independent pricing services in addition to the review of prices by the adviser and/or subadviser. Unobservable inputs used in determining fair valuations are identified based on the type of security, taking into consideration factors utilized by market participants in valuing the investment, knowledge about the issuer and the current market environment.
Table of Contents
| 16 | Wells Fargo Advantage VT International Equity Fund | Notes to financial statements (unaudited) |
Foreign currency translation
The accounting records of the Fund are maintained in U.S. dollars. The values of other assets and liabilities denominated in foreign currencies are translated into U.S. dollars at rates provided by an independent foreign currency pricing source at a time each business day specified by the Management Valuation Team. Purchases and sales of securities, and income and expenses are converted at the rate of exchange on the respective dates of such transactions. Net realized foreign exchange gains or losses arise from sales of foreign currencies, currency gains or losses realized between the trade and settlement dates on securities transactions, and the difference between the amounts of dividends, interest and foreign withholding taxes recorded and the U.S. dollar equivalent of the amounts actually paid or received. Net unrealized foreign exchange gains and losses arise from changes in the fair value of assets and liabilities other than investments in securities resulting from changes in exchange rates. The changes in net assets arising from changes in exchange rates and the changes in net assets resulting from changes in market prices of securities are not separately presented. Such changes are included in net realized and unrealized gains or losses from investments.
Forward foreign currency contracts
The Fund is subject to foreign currency exchange rate risk in the normal course of pursuing its investment objectives. A forward foreign currency contract is an agreement between two parties to purchase or sell a specific currency for an agreed-upon price at a future date. The Fund enters into forward foreign currency contracts to facilitate transactions in foreign-denominated securities and to attempt to minimize the risk to the Fund from adverse changes in the relationship between currencies. Forward foreign currency contracts are recorded at the forward rate and marked-to-market daily. When the contracts are closed, realized gains and losses arising from such transactions are recorded as realized gains or losses on forward foreign currency contract transactions. The Fund could be exposed to risks if the counterparties to the contracts are unable to meet the terms of their contracts or if the value of the foreign currency changes unfavorably. The Fund’s maximum risk of loss from counterparty credit risk is the unrealized gains on the contracts. This risk may be mitigated if there is a master netting arrangement between the Fund and the counterparty.
Security loans
The Fund may lend its securities from time to time in order to earn additional income in the form of fees or interest on securities received as collateral or the investment of any cash received as collateral. The Fund continues to receive interest or dividends on the securities loaned. The Fund receives collateral in the form of cash or securities with a value at least equal to the value of the securities on loan. The value of the loaned securities is determined at the close of each business day and any additional required collateral is delivered to the Fund on the next business day. In a securities lending transaction, the net asset value of the Fund will be affected by an increase or decrease in the value of the securities loaned and by an increase or decrease in the value of the instrument in which collateral is invested. The amount of securities lending activity undertaken by the Fund fluctuates from time to time. In the event of default or bankruptcy by the borrower, the Fund may be prevented from recovering the loaned securities or gaining access to the collateral or may experience delays or costs in doing so. In addition, the investment of any cash collateral received may lose all or part of its value. The Fund has the right under the lending agreement to recover the securities from the borrower on demand.
The Fund lends its securities through an unaffiliated securities lending agent. Cash collateral received in connection with its securities lending transactions is invested in Securities Lending Cash Investments, LLC (the “Securities Lending Fund”). The Securities Lending Fund is exempt from registration under Section 3(c)(7) of the 1940 Act and is managed by Funds Management and is subadvised by Wells Capital Management Incorporated (“WellsCap”). Funds Management receives an advisory fee starting at 0.05% and declining to 0.01% as the average daily net assets of the Securities Lending Fund increase. All of the fees received by Funds Management are paid to WellsCap for its services as subadviser. The Securities Lending Fund seeks to provide a positive return compared to the daily Fed Funds Open rate by investing in high-quality, U.S. dollar-denominated short-term money market instruments. Securities Lending Fund investments are fair valued based upon the amortized cost valuation technique. Income earned from investment in the Securities Lending Fund is included in securities lending income on the Statement of Operations.
Security transactions and income recognition
Securities transactions are recorded on a trade date basis. Realized gains or losses are recorded on the basis of identified cost.
Dividend income is recognized on the ex-dividend date, except for certain dividends from foreign securities, which are recorded as soon as the custodian verifies the ex-dividend date. Dividend income from foreign securities is recorded net of foreign taxes withheld where recovery of such taxes is not assured.
Table of Contents
| Notes to financial statements (unaudited) | Wells Fargo Advantage VT International Equity Fund | 17 |
Distributions to shareholders
Distributions to shareholders from net investment income and net realized gains, if any, are recorded on the ex-dividend date. Such distributions are determined in conformity with federal income tax regulations, which may differ in amount or character from net investment income and realized gains recognized for purposes of U.S. generally accepted accounting principles.
Federal and other taxes
The Fund intends to continue to qualify as a regulated investment company by distributing substantially all of its investment company taxable income and any net realized capital gains (after reduction for capital loss carryforwards) sufficient to relieve it from all, or substantially all, federal income taxes. Accordingly, no provision for federal income taxes was required.
The Fund’s income and federal excise tax returns and all financial records supporting those returns for the prior three fiscal years are subject to examination by the federal and Delaware revenue authorities. Management has analyzed the Fund’s tax positions taken on federal, state, and foreign tax returns for all open tax years and does not believe that there are any uncertain tax positions that require recognition of a tax liability.
Capital loss carryforwards that do not expire are required to be utilized prior to capital loss carryforwards that expire. As of December 31, 2014, capital loss carryforwards available to offset future net realized capital gains were as follows through the indicated expiration dates:
No expiration | ||||||
| 2017 | Short-term | |||||
| $2,669,056 | $642,274 |
Class allocations
The separate classes of shares offered by the Fund differ principally in distribution fees. Class specific expenses are charged directly to that share class. Investment income, common expenses, and realized and unrealized gains (losses) on investments are allocated daily to each class of shares based on the relative proportion of net assets of each class.
3. FAIR VALUATION MEASUREMENTS
Fair value measurements of investments are determined within a framework that has established a fair value hierarchy based upon the various data inputs utilized in determining the value of the Fund’s investments. The three-level hierarchy gives the highest priority to unadjusted quoted prices in active markets for identical assets or liabilities (Level 1) and the lowest priority to significant unobservable inputs (Level 3). The Fund’s investments are classified within the fair value hierarchy based on the lowest level of input that is significant to the fair value measurement. The inputs are summarized into three broad levels as follows:
| n | Level 1 – quoted prices in active markets for identical securities |
| n | Level 2 – other significant observable inputs (including quoted prices for similar securities, interest rates, prepayment speeds, credit risk, use of amortized cost, etc.) |
| n | Level 3 – significant unobservable inputs (including the Fund’s own assumptions in determining the fair value of investments) |
The inputs or methodologies used for valuing investments in securities are not necessarily an indication of the risk associated with investing in those securities.
Table of Contents
| 18 | Wells Fargo Advantage VT International Equity Fund | Notes to financial statements (unaudited) |
The following is a summary of the inputs used in valuing the Fund’s assets and liabilities as of June 30, 2015:
| Quoted prices (Level 1) | Other significant observable inputs (Level 2) | Significant unobservable inputs (Level 3) | Total | |||||||||||||
Assets | ||||||||||||||||
Investments in: | ||||||||||||||||
Common stocks | ||||||||||||||||
Canada | $ | 5,498,657 | $ | 0 | $ | 0 | $ | 5,498,657 | ||||||||
China | 17,433,148 | 0 | 0 | 17,433,148 | ||||||||||||
France | 9,365,140 | 0 | 0 | 9,365,140 | ||||||||||||
Germany | 47,258,106 | 0 | 0 | 47,258,106 | ||||||||||||
Hong Kong | 21,901,610 | 0 | 0 | 21,901,610 | ||||||||||||
Italy | 31,280,769 | 0 | 0 | 31,280,769 | ||||||||||||
Japan | 80,281,144 | 0 | 0 | 80,281,144 | ||||||||||||
Netherlands | 8,937,658 | 0 | 0 | 8,937,658 | ||||||||||||
Norway | 5,361,215 | 0 | 0 | 5,361,215 | ||||||||||||
South Korea | 12,709,269 | 0 | 0 | 12,709,269 | ||||||||||||
Sweden | 4,880,701 | 0 | 0 | 4,880,701 | ||||||||||||
Switzerland | 21,681,857 | 0 | 0 | 21,681,857 | ||||||||||||
United Kingdom | 49,568,466 | 0 | 0 | 49,568,466 | ||||||||||||
United States | 5,280,150 | 0 | 0 | 5,280,150 | ||||||||||||
Participation notes | ||||||||||||||||
China | 0 | 7,549,874 | 0 | 7,549,874 | ||||||||||||
Short-term investments | ||||||||||||||||
Investment companies | 15,698,182 | 1,724,690 | 0 | 17,422,872 | ||||||||||||
| 337,136,072 | 9,274,564 | 0 | 346,410,636 | |||||||||||||
Forward foreign currency contracts | 0 | 312,727 | 0 | 312,727 | ||||||||||||
Total assets | $ | 337,136,072 | $ | 9,587,291 | $ | 0 | $ | 346,723,363 | ||||||||
Liabilities | ||||||||||||||||
Forward foreign currency contracts | $ | 0 | $ | 1,134,878 | $ | 0 | $ | 1,134,878 | ||||||||
Total liabilities | $ | 0 | $ | 1,134,878 | $ | 0 | $ | 1,134,878 | ||||||||
Forward foreign currency contracts are reported at their unrealized gains (losses) at measurement date, which represents the change in the contract’s value from trade date. All other assets and liabilities are reported at their market value at measurement date.
The Fund recognizes transfers between levels within the fair value hierarchy at the end of the reporting period. Fair value pricing that was used in pricing certain foreign securities at the previous period end was not used at June 30, 2015. As a result, common stocks valued at $286,976,463 were transferred from Level 2 to Level 1 within the fair value hierarchy. The Fund did not have any transfers into/out of Level 3.
4. TRANSACTIONS WITH AFFILIATES
Advisory fee
The Trust has entered into an advisory contract with Funds Management, an indirect wholly owned subsidiary of Wells Fargo & Company (“Wells Fargo”). The adviser is responsible for implementing investment policies and guidelines and for supervising the subadviser, who is responsible for day-to-day portfolio management of the Fund.
Pursuant to the contract, Funds Management is entitled to receive an annual advisory fee starting at 0.75% and declining to 0.60% as the average daily net assets of the Fund increase. For the six months ended June 30, 2015, the advisory fee was equivalent to an annual rate of 0.75% of the Fund’s average daily net assets.
Funds Management has retained the services of a subadviser to provide daily portfolio management to the Fund. The fee for subadvisory services is borne by Funds Management. WellsCap, an affiliate of Funds Management and an indirect wholly owned subsidiary of Wells Fargo, is the subadviser to the Fund and is entitled to receive a fee from Funds Management at an annual rate starting at 0.45% and declining to 0.40% as the average daily net assets of the Fund increase.
Table of Contents
| Notes to financial statements (unaudited) | Wells Fargo Advantage VT International Equity Fund | 19 |
Administration fees
The Trust has entered into an administration agreement with Funds Management. Under this agreement, for providing administrative services, which includes paying fees and expenses for services provided by the transfer agent, sub-transfer agents, omnibus account servicers and record-keepers, Funds Management is entitled to receive from the Fund an annual fund level administration fee starting at 0.05% and declining to 0.03% as the average daily net assets of the Fund increase and a class level administration fee of 0.08% which is calculated based on the average daily net assets of each class.
Funds Management has contractually waived and/or reimbursed advisory and administration fees to the extent necessary to maintain certain net operating expense ratios for the Fund. Waiver of fees and/or reimbursement of expenses by Funds Management were made first from fund level expenses on a proportionate basis and then from class specific expenses. Funds Management has committed through April 30, 2016 to waive fees and/or reimburse expenses to the extent necessary to cap the Fund’s expenses at 0.69% for Class 1 shares and 0.94% for Class 2 shares. After this time, the cap may be increased or the commitment to maintain the cap may be terminated only with the approval of the Board of Trustees.
Distribution fee
The Trust has adopted a Distribution Plan for Class 2 shares of the Fund pursuant to Rule 12b-1 under the 1940 Act. A distribution fee is charged to Class 2 shares and paid to Wells Fargo Funds Distributor, LLC, the principal underwriter, at an annual rate of 0.25% of the average daily net assets of Class 2 shares.
5. INVESTMENT PORTFOLIO TRANSACTIONS
Purchases and sales of investments, excluding U.S. government obligations (if any) and short-term securities, for the six months ended June 30, 2015 were $54,395,562 and $71,838,247, respectively.
6. DERIVATIVE TRANSACTIONS
During the six months ended June 30, 2015, the Fund entered into forward foreign currency contracts for economic hedging purposes.
At June 30, 2015, the Fund had forward foreign currency contracts outstanding as follows:
Forward foreign currency contracts to buy:
| Exchange date | Counterparty | Contracts to receive | U.S. value at June 30, 2015 | In exchange for U.S. $ | Unrealized losses | |||||||||||||
| 7-9-2015 | Credit Suisse | 4,623,800 | GBP | $ | 7,264,775 | $ | 7,298,298 | $ | (33,523 | ) | ||||||||
Forward foreign currency contracts to sell:
| Exchange date | Counterparty | Contracts to deliver | U.S. value at June 30, 2015 | In exchange for U.S. $ | Unrealized gains (losses) | |||||||||||||
| 7-9-2015 | Barclays | 1,781,261,000 | JPY | $ | 14,555,729 | $ | 14,842,234 | $ | 286,505 | |||||||||
| 7-9-2015 | Credit Suisse | 13,541,851 | EUR | 15,098,616 | 14,749,784 | (348,832 | ) | |||||||||||
| 7-9-2015 | Credit Suisse | 9,247,600 | GBP | 14,529,551 | 13,777,028 | (752,523 | ) | |||||||||||
| 9-28-2015 | Credit Suisse | 9,686,300 | EUR | 10,812,167 | 10,838,389 | 26,222 | ||||||||||||
The Fund had average contract amounts of $2,553,170 and $50,787,580 in forward foreign currency contracts to buy and forward foreign currency contracts to sell, respectively, during the six months ended June 30, 2015.
The fair value, realized gains or losses and change in unrealized gains or losses, if any, on derivative instruments are reflected in the appropriate financial statements.
For certain types of derivative transactions, the Fund has entered into International Swaps and Derivatives Association, Inc. master agreements (“ISDA Master Agreements”) or similar agreements with approved counterparties. The ISDA Master Agreements or similar agreements may have requirements to deliver/deposit securities or cash to/with an exchange or broker-dealer as collateral and allows the Fund to offset, with each counterparty, certain derivative financial instrument’s assets and/or liabilities with collateral held or pledged. Collateral requirements differ by type of derivative. Collateral or margin requirements are set by the broker or exchange clearing house for exchange traded derivatives while collateral terms are contract specific for over-the-counter traded derivatives. Cash collateral that has been pledged to cover obligations of the Fund under ISDA Master Agreements or similar agreements, if any, will be reported separately in
Table of Contents
| 20 | Wells Fargo Advantage VT International Equity Fund | Notes to financial statements (unaudited) |
the Statement of Assets and Liabilities. Securities pledged as collateral, if any, for the same purpose are noted in the Portfolio of Investments. With respect to balance sheet offsetting, absent an event of default by the counterparty or a termination of the agreement, the reported amounts of financial assets and financial liabilities in the Statement of Assets and Liabilities are not offset across transactions between the Fund and the applicable counterparty. A reconciliation of the gross amounts on the Statement of Assets and Liabilities to the net amounts by derivative type, including any collateral exposure, is as follows:
| Derivative type | Counterparty | Gross amounts of assets in the Statement of Assets and Liabilities | Amounts subject to netting agreements | Collateral received | Net amount of assets | |||||||||||
Forward foreign currency contracts | Barclays | $286,505* | $ | 0 | $ | 0 | $ | 286,505 | ||||||||
Forward foreign currency contracts | Credit Suisse | 26,222* | (26,222 | ) | 0 | 0 | ||||||||||
| * | Amount represents net unrealized gains. |
| Derivative type | Counterparty | Gross amounts of liabilities in the Statement of Assets and Liabilities | Amounts subject to netting agreements | Collateral pledged | Net amount of liabilities | |||||||||||
Forward foreign currency contracts | Credit Suisse | $1,134,878** | $ | (26,222 | ) | $ | 0 | $ | 1,108,656 | |||||||
| ** | Amount represents net unrealized losses. |
7. BANK BORROWINGS
The Trust and Wells Fargo Funds Trust (excluding the money market funds and certain other funds) are parties to a $150,000,000 revolving credit agreement whereby the Fund is permitted to use bank borrowings for temporary or emergency purposes, such as to fund shareholder redemption requests. Interest under the credit agreement is charged to the Fund based on a borrowing rate equal to the higher of the Federal Funds rate in effect on that day plus 1.25% or the overnight LIBOR rate in effect on that day plus 1.25%. In addition, an annual commitment fee equal to 0.10% of the unused balance is allocated to each participating fund. For the six months ended June 30, 2015, the Fund paid $312 in commitment fees.
During the six months ended June 30, 2015, the Fund had average borrowings outstanding of $62,286 at an average rate of 1.40% and paid interest in the amount of $872.
8. CONCENTRATION RISK
Concentration risks result from exposure to a limited number of sectors. A fund that invests a substantial portion of its assets in any sector may be more affected by changes in that sector than would be a fund whose investments are not heavily weighted in any sector.
9. INDEMNIFICATION
Under the Trust’s organizational documents, the officers and Trustees have been granted certain indemnification rights against certain liabilities that may arise out of performance of their duties to the Trust. Additionally, in the normal course of business, the Trust may enter into contracts with service providers that contain a variety of indemnification clauses. The Trust’s maximum exposure under these arrangements is dependent on future claims that may be made against the Fund and, therefore, cannot be estimated.
10. SUBSEQUENT DISTRIBUTIONS
On July 9, 2015, the Fund declared distributions from net investment income to shareholders of record on July 8, 2015. The per share amounts payable on July 10, 2015 were as follows:
| Net investment income | ||||
Class 1 | $0.22710 | |||
Class 2 | 0.21273 | |||
These distributions are not reflected in the accompanying financial statements. The final determination of the source of all distributions is subject to change and made after the Fund’s tax year-end.
Table of Contents
| Other information (unaudited) | Wells Fargo Advantage VT International Equity Fund | 21 |
PROXY VOTING INFORMATION
A description of the policies and procedures that the Fund uses to determine how to vote proxies relating to portfolio securities is available, upon request, by calling 1-800-222-8222, visiting our website at wellsfargoadvantagefunds.com, or visiting the SEC website at sec.gov. Information regarding how the Fund voted proxies relating to portfolio securities during the most recent 12-month period ended June 30 is available on the Fund’s website at wellsfargoadvantagefunds.com or by visiting the SEC website at sec.gov.
PORTFOLIO HOLDINGS INFORMATION
The complete portfolio holdings for the Fund are publicly available monthly on the Fund’s website (wellsfargoadvantagefunds.com), on a one-month delayed basis. In addition, top ten holdings information (excluding derivative positions) for the Fund is publicly available on the Fund’s website on a monthly, seven-day or more delayed basis. The Fund files its complete schedule of portfolio holdings with the SEC for the first and third quarters of each fiscal year on Form N-Q, which is available by visiting the SEC website at sec.gov. In addition, the Fund’s Form N-Q may be reviewed and copied at the SEC’s Public Reference Room in Washington, DC, and at regional offices in New York City, at 233 Broadway, and in Chicago, at 175 West Jackson Boulevard, Suite 900. Information about the Public Reference Room may be obtained by calling 1-800-SEC-0330.
Table of Contents
| 22 | Wells Fargo Advantage VT International Equity Fund | Other information (unaudited) |
BOARD OF TRUSTEES AND OFFICERS
Each of the Trustees and Officers1 listed in the table below acts in identical capacities for each fund in the Wells Fargo Advantage family of funds, which consists of 134 mutual funds comprising the Wells Fargo Funds Trust, Wells Fargo Variable Trust, Wells Fargo Master Trust and four closed-end funds (collectively the “Fund Complex”). This table should be read in conjunction with the Prospectus and the Statement of Additional Information2. The mailing address of each Trustee and Officer is 525 Market Street, 12th Floor, San Francisco, CA 94105. Each Trustee and Officer serves an indefinite term, however, each Trustee serves such term until reaching the mandatory retirement age established by the Trustees.
Independent Trustees
Name and year of birth | Position held and length of service* | Principal occupations during past five years or longer | Other directorships during | |||
| William R. Ebsworth (Born 1957) | Trustee, since 2015** | Retired. From 1984 to 2013, equities analyst, portfolio manager, research director at Fidelity Management and Research Company and retired in 2013 as Chief Investment Officer of Fidelity Strategic Advisers, Inc. in Boston, Tokyo, and Hong Kong where he led a team of investment professionals managing client assets. Prior thereto, Board member of Hong Kong Securities Clearing Co., Hong Kong Options Clearing Corp., the Thailand International Fund, Ltd., Fidelity Investments Life Insurance Company, and Empire Fidelity Investments Life Insurance Company. Mr. Ebsworth is an Adjunct Lecturer, Finance, at Babson College and a Chartered Financial Analyst. | Asset Allocation Trust | |||
| Jane A. Freeman (Born 1953) | Trustee, since 2015** | Retired. From 2012 to 2014 and 1999 to 2008, Chief Financial Officer of Scientific Learning Corporation. From 2008 to 2012, Ms. Freeman provided consulting services related to strategic business projects. Prior to 1999, Portfolio Manager at Rockefeller & Co. and Scudder, Stevens & Clark. Board member of the Harding Loevner Funds from 1996 to 2014, serving as both Lead Independent Director and chair of the Audit Committee. Board member of the Russell Exchange Traded Funds Trust from 2011 to 2012 and the chair of the Audit Committee. Ms. Freeman is a Chartered Financial Analyst (inactive), Chair of Taproot Foundation (non-profit organization) and a Board Member of Ruth Bancroft Garden (non-profit organization). | Asset Allocation Trust | |||
| Peter G. Gordon (Born 1942) | Trustee, since 1998; Chairman, since 2005 | Co-Founder, Retired Chairman, President and CEO of Crystal Geyser Water Company. Trustee Emeritus, Colby College. | Asset Allocation Trust | |||
| Isaiah Harris, Jr. (Born 1952) | Trustee, since 2009 | Retired. Chairman of the Board of CIGNA Corporation since 2009, and Director since 2005. From 2003 to 2011, Director of Deluxe Corporation. Prior thereto, President and CEO of BellSouth Advertising and Publishing Corp. from 2005 to 2007, President and CEO of BellSouth Enterprises from 2004 to 2005 and President of BellSouth Consumer Services from 2000 to 2003. Emeritus member of the Iowa State University Foundation Board of Governors. Emeritus Member of the Advisory Board of Iowa State University School of Business. Advisory Board Member, Palm Harbor Academy. Mr. Harris is a certified public accountant. | CIGNA Corporation; Asset Allocation Trust | |||
| Judith M. Johnson (Born 1949) | Trustee, since 2008; Audit Committee Chairman, since 2008 | Retired. Prior thereto, Chief Executive Officer and Chief Investment Officer of Minneapolis Employees Retirement Fund from 1996 to 2008. Ms. Johnson is an attorney, certified public accountant and a certified managerial accountant. | Asset Allocation Trust | |||
| David F. Larcker (Born 1950) | Trustee, since 2009 | James Irvin Miller Professor of Accounting at the Graduate School of Business, Stanford University, Morgan Stanley Director of the Center for Leadership Development and Research and Senior Faculty of The Rock Center for Corporate Governance since 2006. From 2005 to 2008, Professor of Accounting at the Graduate School of Business, Stanford University. Prior thereto, Ernst & Young Professor of Accounting at The Wharton School, University of Pennsylvania from 1985 to 2005. | Asset Allocation Trust | |||
| Olivia S. Mitchell (Born 1953) | Trustee, since 2006 | International Foundation of Employee Benefit Plans Professor, Wharton School of the University of Pennsylvania since 1993. Director of Wharton’s Pension Research Council and Boettner Center on Pensions & Retirement Research, and Research Associate at the National Bureau of Economic Research. Previously, Cornell University Professor from 1978 to 1993. | Asset Allocation Trust |
Table of Contents
| Other information (unaudited) | Wells Fargo Advantage VT International Equity Fund | 23 |
Name and year of birth | Position held and length of service* | Principal occupations during past five years or longer | Other directorships during | |||
| Timothy J. Penny (Born 1951) | Trustee, since 1996 | President and Chief Executive Officer of Southern Minnesota Initiative Foundation, a non-profit organization, since 2007 and Senior Fellow at the Humphrey Institute Policy Forum at the University of Minnesota since 1995. Member of the Board of Trustees of NorthStar Education Finance, Inc., a non-profit organization, since 2007. | Asset Allocation Trust | |||
| Michael S. Scofield (Born 1943) | Trustee, since 2010 | Served on the Investment Company Institute’s Board of Governors and Executive Committee from 2008-2011 as well the Governing Council of the Independent Directors Council from 2006-2011 and the Independent Directors Council Executive Committee from 2008-2011. Chairman of the IDC from 2008-2010. Institutional Investor (Fund Directions) Trustee of Year in 2007. Trustee of the Evergreen Funds complex (and its predecessors) from 1984 to 2010. Chairman of the Evergreen Funds from 2000-2010. Former Trustee of the Mentor Funds. Retired Attorney, Law Offices of Michael S. Scofield. | Asset Allocation Trust | |||
| Donald C. Willeke (Born 1940) | Trustee, since 1996 | Principal of the law firm of Willeke & Daniels. General Counsel of the Minneapolis Employees Retirement Fund from 1984 until its consolidation into the Minnesota Public Employees Retirement Association on June 30, 2010. Director and Vice Chair of The Tree Trust (non-profit corporation). Director of the American Chestnut Foundation (non-profit corporation). | Asset Allocation Trust |
| * | Length of service dates reflect the Trustee’s commencement of service with the Trust’s predecessor entities, where applicable. |
| ** | William R. Ebsworth and Jane A. Freeman each became a Trustee effective January 1, 2015. |
Officers
Name and year of birth | Position held and length of service | Principal occupations during past five years or longer | ||||
| Karla M. Rabusch (Born 1959) | President, since 2003 | Executive Vice President of Wells Fargo Bank, N.A. and President of Wells Fargo Funds Management, LLC since 2003. | ||||
| Jeremy DePalma1 (Born 1974) | Treasurer, since 2012 | Senior Vice President of Wells Fargo Funds Management, LLC since 2009. Senior Vice President of Evergreen Investment Management Company, LLC from 2008 to 2010. Vice President, Evergreen Investment Services, Inc. from 2004 to 2007. Head of the Fund Reporting and Control Team within Fund Administration from 2005 to 2010. | ||||
| C. David Messman (Born 1960) | Secretary, since 2000; Chief Legal Officer, since 2003 | Senior Vice President and Secretary of Wells Fargo Funds Management, LLC since 2001. Assistant General Counsel of Wells Fargo Bank, N.A. since 2013 and Vice President and Managing Counsel of Wells Fargo Bank N.A. from 1996 to 2013. | ||||
| Debra Ann Early (Born 1964) | Chief Compliance Officer, since 2007 | Senior Vice President of Wells Fargo Funds Management, LLC since 2007 and Chief Compliance Officer from 2007 to 2014. Chief Compliance Officer of Parnassus Investments from 2005 to 2007. Chief Financial Officer of Parnassus Investments from 2004 to 2007 and Senior Audit Manager of PricewaterhouseCoopers LLP from 1998 to 2004. | ||||
| David Berardi (Born 1975) | Assistant Treasurer, since 2009 | Vice President of Wells Fargo Funds Management, LLC since 2009. Vice President of Evergreen Investment Management Company, LLC from 2008 to 2010. Assistant Vice President of Evergreen Investment Services, Inc. from 2004 to 2008. Manager of Fund Reporting and Control for Evergreen Investment Management Company, LLC from 2004 to 2010. |
| 1 | Jeremy DePalma acts as Treasurer of 61 funds and Assistant Treasurer of 73 funds in the Fund Complex. |
| 2 | The Statement of Additional Information includes additional information about the Trustees and is available, without charge, upon request, by calling 1-800-222-8222 or by visiting the website at wellsfargoadvantagefunds.com. |
Table of Contents
| 24 | Wells Fargo Advantage VT International Equity Fund | Other information (unaudited) |
BOARD CONSIDERATION OF INVESTMENT ADVISORY, INVESTMENT MANAGEMENT AND SUB-ADVISORY AGREEMENTS:
Under the Investment Company Act of 1940 (the “1940 Act”), the Board of Trustees (the “Board”) of Wells Fargo Variable Trust (the “Trust”) must determine annually whether to approve the continuation of the Trust’s investment advisory and sub-advisory agreements. In this regard, at an in-person meeting held on May 19-20, 2015 (the “Meeting”), the Board, all the members of which have no direct or indirect interest in the investment advisory and sub-advisory agreements and are not “interested persons” of the Trust, as defined in the 1940 Act (the “Independent Trustees”), reviewed and approved for Wells Fargo Advantage VT International Equity Fund (the “Fund”): (i) an investment advisory agreement (the “Advisory Agreement”) with Wells Fargo Funds Management, LLC (“Funds Management”); (ii) an investment management agreement (the “Management Agreement”) with Funds Management; and (iii) an investment sub-advisory agreement (the “Sub-Advisory Agreement”) with Wells Capital Management Incorporated (the “Sub-Adviser”), an affiliate of Funds Management. The Management Agreement combines the terms of the Advisory Agreement with the terms of the Fund’s Amended and Restated Administration Agreement (the “Administration Agreement”) applicable to Fund-level administrative services. The Advisory Agreement, the Management Agreement and the Sub-Advisory Agreement are collectively referred to as the “Advisory Agreements.”
At the Meeting, the Board considered the factors and reached the conclusions described below relating to the selection of Funds Management and the Sub-Adviser and the approval of the Advisory Agreements. Prior to the Meeting, including at an in-person meeting in March 2015, the Trustees conferred extensively among themselves and with representatives of Funds Management about these matters. Also, the Board has adopted a team-based approach, with each team consisting of a sub-set of Trustees, to assist the full Board in the discharge of its duties in reviewing performance and other matters throughout the year. The Independent Trustees were assisted in their evaluation of the Advisory Agreements by independent legal counsel, from whom they received separate legal advice and with whom they met separately.
In providing information to the Board, Funds Management and the Sub-Adviser were guided by a detailed set of requests for information submitted to them by independent legal counsel on behalf of the Independent Trustees at the start of the Board’s annual contract renewal process earlier in 2015. In considering and approving the Advisory Agreements, the Trustees considered the information they believed relevant, including but not limited to the information discussed below. The Board considered not only the specific information presented in connection with the Meeting, but also the knowledge gained over time through interaction with Funds Management and the Sub-Adviser about various topics. In this regard, the Board reviewed reports of Funds Management at each of its quarterly meetings, which included, among other things, portfolio reviews and performance reports. In addition, the Board and the teams mentioned above confer with portfolio managers at various times throughout the year. The Board did not identify any particular information or consideration that was all-important or controlling, and each individual Trustee may have attributed different weights to various factors.
After its deliberations, the Board unanimously approved the continuation of the Advisory Agreement for the period from June 1, 2015 through June 30, 2015, approved the Management Agreement for the period from July 1, 2015 through May 31, 2016, and approved the continuation of the Sub-Advisory Agreement for a one-year term through May 31, 2016. The Board also determined that the compensation payable to Funds Management and the Sub-Adviser under each of the Advisory Agreements was reasonable. The Board considered the approval of the Advisory Agreements for the Fund as part of its consideration of agreements for funds across the complex, but its approvals were made on a fund-by-fund basis. The following summarizes a number of important, but not necessarily all, factors considered by the Board in support of its approvals.
Nature, extent and quality of services
The Board received and considered various information regarding the nature, extent and quality of services provided to the Fund by Funds Management and the Sub-Adviser under the Advisory Agreements. This information included, among other things, a summary of the background and experience of senior management of Funds Management, and the qualifications, background, tenure and responsibilities of each of the portfolio managers primarily responsible for the day-to-day portfolio management of the Fund. The Board noted that the services to be provided to the Fund pursuant to the Management Agreement combined the advisory services previously provided to the Fund pursuant to the Fund’s Advisory Agreement with the Fund-level administrative services previously provided to the Fund pursuant to the Fund’s Administration Agreement. The Board received a representation from Funds Management that combining these services would not result in any change to the nature or level of services provided by Funds Management to the Fund.
The Board evaluated the ability of Funds Management and the Sub-Adviser to attract and retain qualified investment professionals, including research, advisory and supervisory personnel. The Board further considered the compliance programs and compliance records of Funds Management and the Sub-Adviser. In addition, the Board took into account the full range of services provided to the Fund by Funds Management and its affiliates.
Table of Contents
| Other information (unaudited) | Wells Fargo Advantage VT International Equity Fund | 25 |
Fund performance and expenses
The Board considered the performance results for the Fund over various time periods ended March 31, 2015. The Board considered these results in comparison to the performance of funds in a universe that was determined by Lipper Inc. (“Lipper”) to be similar to the Fund (the “Universe”), and in comparison to the Fund’s benchmark index and to other comparative data. Lipper is an independent provider of investment company data. The Board received a description of the methodology used by Lipper to select the mutual funds in the performance Universe. The Board noted that the performance of the Fund (Class A) was higher than or in range of the average performance of the Universe for all periods under review. The Board also noted that the performance of the Fund was higher than its benchmark, the MSCI ACWI Index ex USA (Net), for all periods under review except the ten-year period.
The Board received information concerning, and discussed factors contributing to, the underperformance of the Fund relative to the benchmark for the period noted above. The Board took note of the explanations for the relative underperformance, including an explanation of the market environment that affected the Fund’s performance, and the performance of the Fund relative to the Universe.
The Board also received and considered information regarding the Fund’s net operating expense ratios and their various components, including actual management fees (which reflect fee waivers, if any, and include advisory, administration and transfer agent fees), custodian and other non-management fees, and Rule 12b-1 and non-Rule 12b-1 service fees. The Board considered these ratios in comparison to the median ratios of funds in class-specific expense groups that were determined by Lipper to be similar to the Fund (the “Groups”). The Board received a description of the methodology used by Lipper to select the mutual funds in the expense Groups and an explanation of how funds comprising expense groups and their expense ratios may vary from year-to-year. Based on the Lipper reports, the Board noted that the net operating expense ratios of the Fund were lower than the median net operating expense ratios of the expense Groups.
The Board took into account the Fund performance and expense information provided to it among the factors considered in deciding to re-approve the Advisory Agreement and Sub-Advisory Agreement and approve the Management Agreement.
Investment advisory and sub-advisory fee rates
The Board reviewed and considered the contractual investment advisory fee rates that are payable by the Fund to Funds Management for investment advisory services (the “Advisory Agreement Rates”), both on a stand-alone basis and on a combined basis with the Fund’s fund-level and class-level contractual administration fee rates (the “Management Rates”). The Board noted that the Management Rates include transfer agency and sub-transfer agency costs. The Board also noted that the fee rate to be paid by the Fund under the Management Agreement will incorporate the advisory fee and Fund-level administration fee previously payable separately by the Fund under the Fund’s Advisory Agreement and Administration Agreement with Funds Management. The Board also reviewed and considered the contractual investment sub-advisory fee rates that are payable by Funds Management to the Sub-Adviser for investment sub-advisory services (the “Sub-Advisory Agreement Rates”).
Among other information reviewed by the Board was a comparison of the Management Rates of the Fund with those of other funds in the expense Groups at a common asset level. The Board noted that the Management Rates of the Fund were in range of the average rates for the Fund’s expense Groups for all share classes.
The Board also received and considered information about the portion of the total advisory fee that was retained by Funds Management after payment of the fee to the Sub-Adviser for sub-advisory services. In assessing the reasonableness of this amount, the Board received and evaluated information about the nature and extent of responsibilities retained and risks assumed by Funds Management and not delegated to or assumed by the Sub-Adviser, and about Funds Management’s on-going oversight services. However, given the affiliation between Funds Management and the Sub-Adviser, the Board ascribed limited relevance to the allocation of the advisory fee between them.
The Board also received and considered information about the nature and extent of services offered and fee rates charged by Funds Management and the Sub-Adviser to other types of clients with investment strategies similar to those of the Fund. In this regard, the Board received information about the significantly greater scope of services, and compliance, reporting and other legal burdens and risks of managing mutual funds compared with those associated with managing assets of non-mutual fund clients such as collective funds or institutional separate accounts.
Based on its consideration of the factors and information it deemed relevant, including those described here, the Board determined that the compensation payable to Funds Management under the Management Agreement and Advisory Agreement and to the Sub-Adviser under the Sub-Advisory Agreement was reasonable, in light of the services covered by the Advisory Agreements.
Table of Contents
| 26 | Wells Fargo Advantage VT International Equity Fund | Other information (unaudited) |
Profitability
The Board received and considered information concerning the profitability of Funds Management, as well as the profitability of Wells Fargo as a whole, from providing services to the Fund and the fund family as a whole. The Board also received and considered information concerning the profitability of the Sub-Adviser from providing services to the fund family as a whole, noting that the Sub-Adviser’s profitability information with respect to providing services to the Fund was subsumed in the Wells Fargo profitability analysis.
Funds Management reported on the methodologies and estimates used in calculating profitability. Among other things, the Board noted that the levels of profitability reported on a fund-by-fund basis varied widely, depending on factors such as the size and type of fund. Based on its review, the Board did not deem the profits reported by Funds Management or Wells Fargo from its services to the Fund to be at a level that would prevent it from approving the continuation of the Advisory Agreements.
Economies of scale
With respect to possible economies of scale, the Board noted the existence of breakpoints in the Fund’s advisory and management fee structures, and the Fund’s administration fee structure, which operate generally to reduce the Fund’s expense ratios as the Fund grows in size. It considered that, for a small fund or a fund that shrinks in size, breakpoints conversely can result in higher fee levels. The Board also considered that fee waiver and expense reimbursement arrangements and competitive fee rates at the outset are means of sharing potential economies of scale with shareholders of the Fund and the fund family as a whole. The Board considered Funds Management’s view that any analyses of potential economies of scale in managing a particular fund are inherently limited in light of the joint and common costs and investments that Funds Management incurs across the fund family as a whole.
The Board concluded that the Fund’s fee and expense arrangements, including contractual breakpoints, constituted a reasonable approach to sharing potential economies of scale with the Fund and its shareholders.
Other benefits to Funds Management and the Sub-Adviser
The Board received and considered information regarding potential “fall-out” or ancillary benefits received by Funds Management and its affiliates, including the Sub-Adviser, as a result of their relationships with the Fund. Ancillary benefits could include, among others, benefits directly attributable to other relationships with the Fund and benefits potentially derived from an increase in Funds Management’s and the Sub-Adviser’s business as a result of their relationships with the Fund. The Board noted that various affiliates of Funds Management may receive distribution-related fees, shareholder servicing payments and sub-transfer agency fees in respect of shares sold or held through them and services provided.
The Board also reviewed information about soft dollar credits earned and utilized by the Sub-Adviser, fees earned by Funds Management and the Sub-Adviser from managing a private investment vehicle for the fund family’s securities lending collateral and commissions earned by an affiliated broker from portfolio transactions.
Based on its consideration of the factors and information it deemed relevant, including those described here, the Board did not find that any ancillary benefits received by Funds Management and its affiliates, including the Sub-Adviser, were unreasonable.
Conclusion
At the Meeting, after considering the above-described factors and based on its deliberations and its evaluation of the information described above, the Board unanimously approved the continuation of the Advisory Agreement for the period from June 1, 2015 through June 30, 2015, approved the Management Agreement for the period from July 1, 2015 through May 31, 2016, and approved the continuation of the Sub-Advisory Agreement for a one-year term through May 31, 2016. The Board also determined that the compensation payable to Funds Management and the Sub-Adviser under each of the Advisory Agreements was reasonable.
Table of Contents
| List of abbreviations | Wells Fargo Advantage VT International Equity Fund | 27 |
The following is a list of common abbreviations for terms and entities that may have appeared in this report.
| ACA | — ACA Financial Guaranty Corporation |
| ADR | — American depositary receipt |
| ADS | — American depositary shares |
| AGC | — Assured Guaranty Corporation |
| AGM | — Assured Guaranty Municipal |
| Ambac | — Ambac Financial Group Incorporated |
| AMT | — Alternative minimum tax |
| AUD | — Australian dollar |
| BAN | — Bond anticipation notes |
| BHAC | — Berkshire Hathaway Assurance Corporation |
| BRL | — Brazilian real |
| CAB | — Capital appreciation bond |
| CAD | — Canadian dollar |
| CCAB | — Convertible capital appreciation bond |
| CDA | — Community Development Authority |
| CDO | — Collateralized debt obligation |
| CHF | — Swiss franc |
| COP | — Columbian Peso |
| CLP | — Chilean peso |
| DKK | — Danish krone |
| DRIVER | — Derivative inverse tax-exempt receipts |
| DW&P | — Department of Water & Power |
| DWR | — Department of Water Resources |
| ECFA | — Educational & Cultural Facilities Authority |
| EDA | — Economic Development Authority |
| EDFA | — Economic Development Finance Authority |
| ETF | — Exchange-traded fund |
| EUR | — Euro |
| FDIC | — Federal Deposit Insurance Corporation |
| FFCB | — Federal Farm Credit Banks |
| FGIC | — Financial Guaranty Insurance Corporation |
| FHA | — Federal Housing Administration |
| FHLB | — Federal Home Loan Bank |
| FHLMC | — Federal Home Loan Mortgage Corporation |
| FICO | — The Financing Corporation |
| FNMA | — Federal National Mortgage Association |
| FSA | — Farm Service Agency |
| GBP | — Great British pound |
| GDR | — Global depositary receipt |
| GNMA | — Government National Mortgage Association |
| GO | — General obligation |
| HCFR | — Healthcare facilities revenue |
| HEFA | — Health & Educational Facilities Authority |
| HEFAR | — Higher education facilities authority revenue |
| HFA | — Housing Finance Authority |
| HFFA | — Health Facilities Financing Authority |
| HKD | — Hong Kong dollar |
| HUD | — Department of Housing and Urban Development |
| HUF | — Hungarian forint |
| IDA | — Industrial Development Authority |
| IDAG | — Industrial Development Agency |
| IDR | — Indonesian rupiah |
| IEP | — Irish pound |
| JPY | — Japanese yen |
| KRW | — Republic of Korea won |
| LIBOR | — London Interbank Offered Rate |
| LIFER | — Long Inverse Floating Exempt Receipts |
| LIQ | — Liquidity agreement |
| LLC | — Limited liability company |
| LLLP | — Limited liability limited partnership |
| LLP | — Limited liability partnership |
| LOC | — Letter of credit |
| LP | — Limited partnership |
| MBIA | — Municipal Bond Insurance Association |
| MFHR | — Multifamily housing revenue |
| MSTR | — Municipal securities trust receipts |
| MTN | — Medium-term note |
| MUD | — Municipal Utility District |
| MXN | — Mexican peso |
| MYR | — Malaysian ringgit |
| National | — National Public Finance Guarantee Corporation |
| NGN | — Nigerian naira |
| NOK | — Norwegian krone |
| NZD | — New Zealand dollar |
| PCFA | — Pollution Control Financing Authority |
| PCL | — Public Company Limited |
| PCR | — Pollution control revenue |
| PFA | — Public Finance Authority |
| PFFA | — Public Facilities Financing Authority |
| PFOTER | — Puttable floating option tax-exempt receipts |
| plc | — Public limited company |
| PLN | — Polish zloty |
| PUTTER | — Puttable tax-exempt receipts |
| R&D | — Research & development |
| Radian | — Radian Asset Assurance |
| RAN | — Revenue anticipation notes |
| RDA | — Redevelopment Authority |
| RDFA | — Redevelopment Finance Authority |
| REIT | — Real estate investment trust |
| ROC | — Reset option certificates |
| RON | — Romanian lei |
| RUB | — Russian ruble |
| SAVRS | — Select auction variable rate securities |
| SBA | — Small Business Authority |
| SDR | — Swedish depositary receipt |
| SEK | — Swedish krona |
| SFHR | — Single-family housing revenue |
| SFMR | — Single-family mortgage revenue |
| SGD | — Singapore dollar |
| SPA | — Standby purchase agreement |
| SPDR | — Standard & Poor’s Depositary Receipts |
| SPEAR | — Short Puttable Exempt Adjustable Receipts |
| STRIPS | — Separate trading of registered interest and |
| principal securities |
| TAN | — Tax anticipation notes |
| TBA | — To be announced |
| THB | — Thai baht |
| TIPS | — Treasury inflation-protected securities |
| TRAN | — Tax revenue anticipation notes |
| TRY | — Turkish lira |
| TTFA | — Transportation Trust Fund Authority |
| TVA | — Tennessee Valley Authority |
| ZAR | — South African rand |
Table of Contents
This page is intentionally left blank.
Table of Contents


For more information
More information about Wells Fargo Advantage Funds is available free upon request. To obtain literature, please write, email, visit the Fund’s website, or call:
Wells Fargo Advantage Funds
P.O. Box 8266
Boston, MA 02266-8266
Email: wfaf@wellsfargo.com
Website: wellsfargoadvantagefunds.com
Individual investors: 1-800-222-8222
Retail investment professionals: 1-888-877-9275
Institutional investment professionals: 1-866-765-0778
This report and the financial statements contained herein are submitted for the general information of the shareholders of Wells Fargo Advantage Funds. If this report is used for promotional purposes, distribution of the report must be accompanied or preceded by a current prospectus. Before investing, please consider the investment objectives, risks, charges, and expenses of the investment. For a current prospectus and, if available, a summary prospectus, containing this information, call 1-800-222-8222 or visit the Fund’s website at wellsfargoadvantagefunds.com. Read the prospectus carefully before you invest or send money.
Wells Fargo Funds Management, LLC, a wholly owned subsidiary of Wells Fargo & Company, provides investment advisory and administrative services for Wells Fargo Advantage Funds. Other affiliates of Wells Fargo & Company provide subadvisory and other services for the Funds. The Funds are distributed by Wells Fargo Funds Distributor, LLC, Member FINRA/SIPC, an affiliate of Wells Fargo & Company.
NOT FDIC INSURED ¡ NO BANK GUARANTEE ¡ MAY LOSE VALUE
© 2015 Wells Fargo Funds Management, LLC. All rights reserved.
235287 08-15 SVT3/SAR140 06-15 |
Table of Contents

Wells Fargo Advantage VT Intrinsic Value Fund

Semi-Annual Report
June 30, 2015

Table of Contents
Reduce clutter. Save trees.
Sign up for electronic delivery of prospectuses and shareholder reports at wellsfargo.com/advantagedelivery
| 2 | ||||
| 4 | ||||
| 6 | ||||
| 7 | ||||
Financial statements | ||||
| 10 | ||||
| 11 | ||||
| 12 | ||||
| 13 | ||||
| 14 | ||||
| 18 | ||||
| 24 | ||||
The views expressed and any forward-looking statements are as of June 30, 2015, unless otherwise noted, and are those of the Fund managers and/or Wells Fargo Funds Management, LLC. Discussions of individual securities, or the markets generally, or any Wells Fargo Advantage Fund are not intended as individual recommendations. Future events or results may vary significantly from those expressed in any forward-looking statements; the views expressed are subject to change at any time in response to changing circumstances in the market. Wells Fargo Funds Management, LLC and the Fund disclaim any obligation to publicly update or revise any views expressed or forward-looking statements.
NOT FDIC INSURED ¡ NO BANK GUARANTEE ¡ MAY LOSE VALUE
Table of Contents
| 2 | Wells Fargo Advantage VT Intrinsic Value Fund | Letter to shareholders (unaudited) |

Karla M. Rabusch
President
Wells Fargo Advantage Funds
The period was marked by continued low global interest rates and a slow but steady economic recovery in the U.S.
Dear Valued Shareholder:
We are pleased to offer you this semi-annual report for the Wells Fargo Advantage VT Intrinsic Value Fund for the six-month period that ended June 30, 2015. The period was marked by continued low global interest rates and a slow but steady economic recovery in the U.S. However, growing concern as to whether a newly elected anti-austerity government in Greece would default on the country’s debt and remove it from the eurozone resulted in late-period volatility for both U.S. and European stocks.
Major central banks continued to provide liquidity to the markets.
Throughout the reporting period, the Federal Open Market Committee (FOMC), which is the U.S. Federal Reserve’s (Fed’s) monetary policymaking body, kept its key interest rate effectively at zero. As the reporting period progressed, though, various comments by Fed Chair Janet Yellen led investors to believe that the FOMC would raise its key federal funds rate by late 2015. Moreover, the FOMC seemed confident that economic conditions would evolve in a way that it would most likely continue raising rates gradually over time.
In contrast, the European Central Bank (ECB) showed no signs of raising rates at any point in the near future. Rather, the ECB maintained a variety of measures aimed at encouraging lending, including making funds available to banks at low interest rates and imposing a negative interest rate on bank deposits held at the central bank. In January 2015, the bank announced quantitative easing via significant bond purchases in an attempt to raise the eurozone’s inflation to just under its target of 2%. The ECB also provided emergency liquidity to Greek banks while that country’s government negotiated with its creditors, which included the eurozone member states and the International Monetary Fund (IMF).
The prospect of a near-term rate hike in the U.S., combined with continued easing from the ECB and other major central banks, resulted in the U.S. dollar appreciating against a basket of currencies for the six-month reporting period.
Although U.S. economic growth slowed in the first quarter, market participants believed that its recovery remained on track.
Reported U.S. gross domestic product (GDP) growth came in at a solid 2.2% annualized rate in the fourth quarter of 2014. Although the final estimate for annualized GDP growth came in at a modest 0.6% in the first quarter of 2015, the slowdown was attributed to short-term factors such as a harsh winter and a long-lived strike at West Coast ports. The U.S. unemployment rate continued its slow improvement, easing from 5.7% in January 2015 to 5.3% in June.
U.S. stocks generally posted gains for the period, aided by a solid economy. However, uncertainty as to whether Greece would default on a June 30 payment to the IMF resulted in volatility and negative returns in the last month of the reporting period. The S&P 500 Index1, a measure of U.S. large-cap stocks, ended the period with a gain of 1.23%. Growth stocks outperformed value stocks in the large-cap space, and health care delivered the best return among the index’s sectors.
| 1 | The S&P 500 Index consists of 500 stocks chosen for market size, liquidity, and industry group representation. It is a market-value-weighted index with each stock’s weight in the index proportionate to its market value. You cannot invest directly in an index. |
| 2 | The Russell 2000® Index measures the performance of the 2,000 smallest companies in the Russell 3000® Index, which represents approximately 8% of the total market capitalization of the Russell 3000 Index. You cannot invest directly in an index. |
Table of Contents
| Letter to shareholders (unaudited) | Wells Fargo Advantage VT Intrinsic Value Fund | 3 |
Small-cap stocks solidly outperformed large caps for the period, with the Russell 2000® Index2 gaining 4.75%. Smaller-cap stocks often have an advantage when the U.S. dollar strengthens, as it did during the reporting period. Because larger companies tend to be globally diversified, a stronger dollar can dampen their earnings growth; smaller companies often have more of a domestic focus and thus are less likely to face currency-related headwinds. Small-cap growth stocks significantly outperformed small-cap value stocks, with the information technology sector delivering the highest returns.
Don’t let short-term uncertainty derail long-term investment goals.
Periods of uncertainty can present challenges, but experience has taught us that maintaining long-term investment goals can be an effective way to plan for the future. To help you create a sound strategy based on your personal goals and risk tolerance, Wells Fargo Advantage Funds offers more than 100 mutual funds and other investments spanning a wide range of asset classes and investment styles. Although diversification cannot guarantee an investment profit or prevent losses, we believe it can be an effective way to manage investment risk and potentially smooth out overall portfolio performance. We encourage investors to know their investments and to understand that appropriate levels of risk-taking may unlock opportunities.
Thank you for choosing to invest with Wells Fargo Advantage Funds. We appreciate your confidence in us and remain committed to helping you meet your financial needs.
Sincerely,

Karla M. Rabusch
President
Wells Fargo Advantage Funds
Smaller-cap stocks often have an advantage when the U.S. dollar strengthens, as it did during the reporting period.
Notice to shareholders
At a meeting held on August 11–12, 2015, the Board of Trustees of the Fund approved a change in the name of the Fund whereby the word “Advantage” will be removed from its name, effective December 15, 2015.
For current information about your fund investments, contact your investment professional, visit our website at wellsfargoadvantagefunds.com, or call us directly at 1-800-222-8222. We are available 24 hours a day, 7 days a week.
Table of Contents
| 4 | Wells Fargo Advantage VT Intrinsic Value Fund | Performance highlights (unaudited) |
Investment objective
The Fund seeks long-term capital appreciation.
Adviser
Wells Fargo Funds Management, LLC
Subadviser
Metropolitan West Capital Management, LLC
Portfolio managers
Miguel E. Giaconi, CFA
Jean-Baptiste Nadal, CFA
Jeffrey Peck
Average annual total returns1 (%) as of June 30, 2015
| Expense ratios2 (%) | ||||||||||||||||||||||
| Inception date | 1 year | 5 year | 10 year | Gross | Net3 | |||||||||||||||||
| Class 2 | 5-6-1996 | 6.29 | 15.84 | 6.33 | 1.08 | 1.00 | ||||||||||||||||
| Russell 1000® Value Index4 | – | 4.13 | 16.50 | 7.05 | – | – | ||||||||||||||||
Figures quoted represent past performance, which is no guarantee of future results and do not reflect the deduction of taxes that a shareholder may pay on fund distributions or the redemption of fund shares. Investment return and principal value of an investment will fluctuate so that an investor’s shares, when redeemed, may be worth more or less than their original cost. Current performance may be lower or higher than the performance data quoted, which assumes the reinvestment of dividends and capital gains. Current month-end performance is available by calling 1-800-222-8222. Performance figures of the Fund do not reflect fees charged pursuant to the terms of variable life insurance policies and variable annuity contracts. If fees had been reflected, performance would have been lower.
Index returns do not include transaction costs associated with buying and selling securities, any mutual fund fees or expenses, or any taxes. It is not possible to invest directly in an index.
Stock values fluctuate in response to the activities of individual companies and general market and economic conditions. Certain investment strategies tend to increase the total risk of an investment (relative to the broader market). The Fund is exposed to foreign investment risk. Consult the Fund’s prospectus for additional information on these and other risks.
Please refer to the prospectus provided by your participating insurance company for detailed information describing the separate accounts for information regarding surrender charges, mortality and expense risk fees, and other charges that may be assessed by the participating insurance companies.
Please see footnotes on page 5.
Table of Contents
| Performance highlights (unaudited) | Wells Fargo Advantage VT Intrinsic Value Fund | 5 |
| Ten largest holdings5 (%) as of June 30, 2015 | ||||
Cigna Corporation | 3.67 | |||
Goldman Sachs Group Incorporated | 3.35 | |||
BB&T Corporation | 3.34 | |||
Time Warner Incorporated | 2.76 | |||
Anheuser-Busch InBev NV ADR | 2.75 | |||
The Boeing Company | 2.74 | |||
Abbott Laboratories | 2.73 | |||
The Walt Disney Company | 2.67 | |||
Sensata Technologies Holding NV | 2.57 | |||
Northern Trust Corporation | 2.53 | |||
| Sector distribution6 as of June 30, 2015 |
 |
| 1 | Historical performance shown for Class 2 of the Fund prior to July 19, 2010, is based on the performance of the Fund’s predecessor, Wells Fargo Advantage VT Equity Income Fund. |
| 2 | Reflects the expense ratios as stated in the most recent prospectus. The expense ratios shown are subject to change and may differ from the annualized expense ratios shown in the financial highlights of this report. |
| 3 | The Adviser has contractually committed through April 30, 2016, to waive fees and/or reimburse expenses to the extent necessary to cap the Fund’s Total Annual Fund Operating Expenses After Fee Waiver at the amount shown. After this time, the cap may be increased or the commitment to maintain the cap may be terminated only with the approval of the Board of Trustees. Brokerage commissions, stamp duty fees, interest, taxes, acquired fund fees and expenses, and extraordinary expenses are excluded from the cap. Without this cap, the Fund’s returns would have been lower. |
| 4 | The Russell 1000® Value Index measures the performance of those Russell 1000 companies with lower price-to-book ratios and lower forecasted growth values. You cannot invest directly in an index. |
| 5 | The ten largest holdings, excluding cash and cash equivalents, are calculated based on the value of the investments divided by total net assets of the Fund. Holdings are subject to change and may have changed since the date specified. |
| 6 | Amounts are calculated based on the total long-term investments of the Fund. These amounts are subject to change and may have changed since the date specified. |
Table of Contents
| 6 | Wells Fargo Advantage VT Intrinsic Value Fund | Fund expenses (unaudited) |
As a shareholder of the Fund, you incur ongoing costs, including management fees, distribution (12b-1) fees, and other Fund expenses. This example is intended to help you understand your ongoing costs (in dollars) of investing in the Fund and to compare these costs with the ongoing costs of investing in other mutual funds.
The example is based on an investment of $1,000 invested at the beginning of the six-month period and held for the entire period from January 1, 2015 to June 30, 2015.
Actual expenses
The “Actual” line of the table below provides information about actual account values and actual expenses. You may use the information in this line, together with the amount you invested, to estimate the expenses that you paid over the period. Simply divide your account value by $1,000 (for example, an $8,600 account value divided by $1,000 = 8.6), then multiply the result by the number in the “Actual” line under the heading entitled “Expenses Paid During Period” for your applicable class of shares to estimate the expenses you paid on your account during this period.
Hypothetical example for comparison purposes
The “Hypothetical” line of the table below provides information about hypothetical account values and hypothetical expenses based on the Fund’s actual expense ratio and an assumed rate of return of 5% per year before expenses, which is not the Fund’s actual return. The hypothetical account values and expenses may not be used to estimate the actual ending account balance or expenses you paid for the period. You may use this information to compare the ongoing costs of investing in the Fund and other funds. To do so, compare this 5% hypothetical example with the 5% hypothetical examples that appear in the shareholder reports of the other funds.
Please note that the expenses shown in the table are meant to highlight your ongoing costs only and do not reflect any separate account charges assessed by participating insurance companies. Therefore, the “Hypothetical” line of the table is useful in comparing ongoing costs only, and will not help you determine the relative total costs of owning different funds. In addition, if these separate account charges assessed by participating insurance companies were included, your costs would have been higher.
| Beginning account value 1-1-2015 | Ending account value 6-30-2015 | Expenses paid during the period¹ | Net annualized expense ratio | |||||||||||||
Class 2 | ||||||||||||||||
Actual | $ | 1,000.00 | $ | 1,022.27 | $ | 5.01 | 1.00 | % | ||||||||
Hypothetical (5% return before expenses) | $ | 1,000.00 | $ | 1,019.84 | $ | 5.01 | 1.00 | % | ||||||||
| 1 | Expenses paid is equal to the annualized expense ratio multiplied by the average account value over the period, multiplied by the number of days in the most recent fiscal half-year divided by the number of days in the fiscal year (to reflect the one-half year period). |
Table of Contents
| Portfolio of investments—June 30, 2015 (unaudited) | Wells Fargo Advantage VT Intrinsic Value Fund | 7 |
| Security name | Shares | Value | ||||||||||
Common Stocks: 97.13% | ||||||||||||
Consumer Discretionary: 9.58% | ||||||||||||
| Hotels, Restaurants & Leisure: 2.10% | ||||||||||||
Marriott International Incorporated Class A | 11,987 | $ | 891,713 | |||||||||
|
| |||||||||||
| Media: 5.42% | ||||||||||||
The Walt Disney Company | 9,939 | 1,134,437 | ||||||||||
Time Warner Incorporated | 13,405 | 1,171,731 | ||||||||||
| 2,306,168 | ||||||||||||
|
| |||||||||||
| Specialty Retail: 1.35% | ||||||||||||
The TJX Companies Incorporated | 8,685 | 574,686 | ||||||||||
|
| |||||||||||
| Textiles, Apparel & Luxury Goods: 0.71% | ||||||||||||
Kering ADR | 16,749 | 299,640 | ||||||||||
|
| |||||||||||
Consumer Staples: 10.21% | ||||||||||||
| Beverages: 5.90% | ||||||||||||
Anheuser-Busch InBev NV ADR | 9,691 | 1,169,413 | ||||||||||
Diageo plc ADR | 3,805 | 441,532 | ||||||||||
PepsiCo Incorporated | 9,650 | 900,731 | ||||||||||
| 2,511,676 | ||||||||||||
|
| |||||||||||
| Food Products: 2.00% | ||||||||||||
Unilever NV ADR | 20,301 | 849,394 | ||||||||||
|
| |||||||||||
| Household Products: 2.31% | ||||||||||||
The Procter & Gamble Company | 12,552 | 982,068 | ||||||||||
|
| |||||||||||
Energy: 8.55% | ||||||||||||
| Energy Equipment & Services: 4.05% | ||||||||||||
FMC Technologies Incorporated † | 19,361 | 803,288 | ||||||||||
Schlumberger Limited | 10,681 | 920,595 | ||||||||||
| 1,723,883 | ||||||||||||
|
| |||||||||||
| Oil, Gas & Consumable Fuels: 4.50% | ||||||||||||
BG Group plc ADR | 33,810 | 567,332 | ||||||||||
EOG Resources Incorporated | 8,692 | 760,985 | ||||||||||
Occidental Petroleum Corporation | 7,522 | 584,986 | ||||||||||
| 1,913,303 | ||||||||||||
|
| |||||||||||
Financials: 20.16% | ||||||||||||
| Banks: 7.22% | ||||||||||||
BB&T Corporation | 35,195 | 1,418,710 | ||||||||||
CIT Group Incorporated | 13,654 | 634,774 | ||||||||||
SunTrust Banks Incorporated | 23,632 | 1,016,649 | ||||||||||
| 3,070,133 | ||||||||||||
|
| |||||||||||
The accompanying notes are an integral part of these financial statements.
Table of Contents
| 8 | Wells Fargo Advantage VT Intrinsic Value Fund | Portfolio of investments—June 30, 2015 (unaudited) |
| Security name | Shares | Value | ||||||||||
| Capital Markets: 9.69% | ||||||||||||
Charles Schwab Corporation | 23,777 | $ | 776,319 | |||||||||
Goldman Sachs Group Incorporated | 6,828 | 1,425,618 | ||||||||||
Northern Trust Corporation | 14,052 | 1,074,416 | ||||||||||
UBS Group AG « | 39,925 | 846,410 | ||||||||||
| 4,122,763 | ||||||||||||
|
| |||||||||||
| Consumer Finance: 0.85% | ||||||||||||
Synchrony Financial Ǡ | 10,974 | 361,374 | ||||||||||
|
| |||||||||||
| Insurance: 2.40% | ||||||||||||
The Chubb Corporation | 10,714 | 1,019,330 | ||||||||||
|
| |||||||||||
Health Care: 13.03% | ||||||||||||
| Health Care Equipment & Supplies: 2.73% | ||||||||||||
Abbott Laboratories | 23,638 | 1,160,153 | ||||||||||
|
| |||||||||||
| Health Care Providers & Services: 6.01% | ||||||||||||
Cigna Corporation | 9,646 | 1,562,652 | ||||||||||
Express Scripts Holding Company † | 11,170 | 993,460 | ||||||||||
| 2,556,112 | ||||||||||||
|
| |||||||||||
| Pharmaceuticals: 4.29% | ||||||||||||
AbbVie Incorporated | 14,667 | 985,476 | ||||||||||
Merck & Company Incorporated | 14,754 | 839,945 | ||||||||||
| 1,825,421 | ||||||||||||
|
| |||||||||||
Industrials: 12.27% | ||||||||||||
| Aerospace & Defense: 7.67% | ||||||||||||
Honeywell International Incorporated | 10,515 | 1,072,215 | ||||||||||
Huntington Ingalls Industries Incorporated | 2,224 | 250,400 | ||||||||||
Lockheed Martin Corporation | 4,157 | 772,786 | ||||||||||
The Boeing Company | 8,414 | 1,167,190 | ||||||||||
| 3,262,591 | ||||||||||||
|
| |||||||||||
| Air Freight & Logistics: 2.03% | ||||||||||||
United Parcel Service Incorporated Class B | 8,918 | 864,243 | ||||||||||
|
| |||||||||||
| Electrical Equipment: 2.57% | ||||||||||||
Sensata Technologies Holding NV † | 20,693 | 1,091,349 | ||||||||||
|
| |||||||||||
Information Technology: 15.90% | ||||||||||||
| Communications Equipment: 3.05% | ||||||||||||
Motorola Solutions Incorporated | 12,409 | 711,532 | ||||||||||
QUALCOMM Incorporated | 9,344 | 585,215 | ||||||||||
| 1,296,747 | ||||||||||||
|
| |||||||||||
| IT Services: 2.41% | ||||||||||||
The Western Union Company | 50,391 | 1,024,449 | ||||||||||
|
| |||||||||||
The accompanying notes are an integral part of these financial statements.
Table of Contents
| Portfolio of investments—June 30, 2015 (unaudited) | Wells Fargo Advantage VT Intrinsic Value Fund | 9 |
| Security name | Shares | Value | ||||||||||||
| Semiconductors & Semiconductor Equipment: 1.98% | ||||||||||||||
Texas Instruments Incorporated | 16,337 | $ | 841,519 | |||||||||||
|
| |||||||||||||
| Software: 4.57% | ||||||||||||||
Microsoft Corporation | 22,530 | 994,700 | ||||||||||||
Oracle Corporation | 23,571 | 949,911 | ||||||||||||
| 1,944,611 | ||||||||||||||
|
| |||||||||||||
| Technology Hardware, Storage & Peripherals: 3.89% | ||||||||||||||
Apple Incorporated | 7,404 | 928,647 | ||||||||||||
EMC Corporation | 27,522 | 726,306 | ||||||||||||
| 1,654,953 | ||||||||||||||
|
| |||||||||||||
Materials: 1.67% | ||||||||||||||
| Chemicals: 1.67% | ||||||||||||||
E.I. du Pont de Nemours & Company | 11,067 | 707,735 | ||||||||||||
|
| |||||||||||||
Telecommunication Services: 1.87% | ||||||||||||||
| Diversified Telecommunication Services: 1.87% | ||||||||||||||
Verizon Communications Incorporated | 17,050 | 794,701 | ||||||||||||
|
| |||||||||||||
Utilities: 3.89% | ||||||||||||||
| Electric Utilities: 3.89% | ||||||||||||||
Eversource Energy | 14,799 | 672,022 | ||||||||||||
NextEra Energy Incorporated | 10,008 | 981,084 | ||||||||||||
| 1,653,106 | ||||||||||||||
|
| |||||||||||||
Total Common Stocks (Cost $31,606,419) | 41,303,821 | |||||||||||||
|
| |||||||||||||
| Yield | ||||||||||||||
| Short-Term Investments: 6.29% | ||||||||||||||
| Investment Companies: 6.29% | ||||||||||||||
Securities Lending Cash Investments, LLC (l)(r)(u) | 0.13 | % | 1,114,725 | 1,114,725 | ||||||||||
Wells Fargo Advantage Cash Investment Money Market Fund, Select Class (l)(u) | 0.12 | 1,561,133 | 1,561,133 | |||||||||||
Total Short-Term Investments (Cost $2,675,858) | 2,675,858 | |||||||||||||
|
| |||||||||||||
| Total investments in securities (Cost $34,282,277) * | 103.42 | % | 43,979,679 | |||||
Other assets and liabilities, net | (3.42 | ) | (1,453,217 | ) | ||||
|
|
|
| |||||
| Total net assets | 100.00 | % | $ | 42,526,462 | ||||
|
|
|
|
| † | Non-income-earning security |
| « | All or a portion of this security is on loan. |
| (l) | The security represents an affiliate of the Fund as defined in the Investment Company Act of 1940. |
| (r) | The investment is a non-registered investment vehicle purchased with cash collateral received from securities on loan. |
| (u) | The rate represents the 7-day annualized yield at period end. |
| * | Cost for federal income tax purposes is $34,287,935 and unrealized gains (losses) consists of: |
Gross unrealized gains | $ | 10,297,364 | ||
Gross unrealized losses | (605,620 | ) | ||
|
| |||
Net unrealized gains | $ | 9,691,744 |
The accompanying notes are an integral part of these financial statements.
Table of Contents
| 10 | Wells Fargo Advantage VT Intrinsic Value Fund | Statement of assets and liabilities—June 30, 2015 (unaudited) |
Assets | ||||
Investments | ||||
In unaffiliated securities (including $1,090,894 of securities loaned), at value (cost $31,606,419) | $ | 41,303,821 | ||
In affiliated securities, at value (cost $2,675,858) | 2,675,858 | |||
|
| |||
Total investments, at value (cost $34,282,277) | 43,979,679 | |||
Receivable for Fund shares sold | 1,830 | |||
Receivable for dividends | 43,011 | |||
Receivable for securities lending income | 91 | |||
Prepaid expenses and other assets | 888 | |||
|
| |||
Total assets | 44,025,499 | |||
|
| |||
Liabilities | ||||
Payable for investments purchased | 236,078 | |||
Payable for Fund shares redeemed | 97,281 | |||
Payable upon receipt of securities loaned | 1,114,725 | |||
Advisory fee payable | 14,116 | |||
Distribution fee payable | 9,009 | |||
Administration fee payable | 4,685 | |||
Accrued expenses and other liabilities | 23,143 | |||
|
| |||
Total liabilities | 1,499,037 | |||
|
| |||
Total net assets | $ | 42,526,462 | ||
|
| |||
NET ASSETS CONSIST OF | ||||
Paid-in capital | $ | 22,346,928 | ||
Undistributed net investment income | 583,065 | |||
Accumulated net realized gains on investments | 9,899,067 | |||
Net unrealized gains on investments | 9,697,402 | |||
|
| |||
Total net assets | $ | 42,526,462 | ||
|
| |||
COMPUTATION OF NET ASSET VALUE PER SHARE | ||||
Net assets – Class 2 | $ | 42,526,462 | ||
Shares outstanding – Class 21 | 2,014,002 | |||
Net asset value per share – Class 2 | $21.12 | |||
| 1 | The Fund has an unlimited number of authorized shares. |
The accompanying notes are an integral part of these financial statements.
Table of Contents
| Statement of operations—six months ended June 30, 2015 (unaudited) | Wells Fargo Advantage VT Intrinsic Value Fund | 11 |
Investment income | ||||
Dividends (net of foreign withholding taxes of $8,071) | $ | 439,421 | ||
Securities lending income, net | 1,142 | |||
Income from affiliated securities | 782 | |||
|
| |||
Total investment income | 441,345 | |||
|
| |||
Expenses | ||||
Advisory fee | 121,580 | |||
Administration fee | 28,737 | |||
Distribution fee | ||||
Class 2 | 55,264 | |||
Custody and accounting fees | 5,706 | |||
Professional fees | 23,261 | |||
Shareholder report expenses | 8,924 | |||
Trustees’ fees and expenses | 7,349 | |||
Other fees and expenses | 3,033 | |||
|
| |||
Total expenses | 253,854 | |||
Less: Fee waivers and/or expense reimbursements | (32,799 | ) | ||
|
| |||
Net expenses | 221,055 | |||
|
| |||
Net investment income | 220,290 | |||
|
| |||
REALIZED AND UNREALIZED GAINS (LOSSES) ON INVESTMENTS | ||||
Net realized gains on investments | 3,885,646 | |||
Net change in unrealized gains (losses) on investments | (3,111,868 | ) | ||
|
| |||
Net realized and unrealized gains (losses) on investments | 773,778 | |||
|
| |||
Net increase in net assets resulting from operations | $ | 994,068 | ||
|
| |||
The accompanying notes are an integral part of these financial statements.
Table of Contents
| 12 | Wells Fargo Advantage VT Intrinsic Value Fund | Statement of changes in net assets |
| Six months ended June 30, 2015 (unaudited) | Year ended December 31, 2014 | |||||||||||||||
Operations | ||||||||||||||||
Net investment income | $ | 220,290 | $ | 362,797 | ||||||||||||
Net realized gains on investments | 3,885,646 | 6,916,346 | ||||||||||||||
Net change in unrealized gains (losses) on investments | (3,111,868 | ) | (2,563,404 | ) | ||||||||||||
|
| |||||||||||||||
Net increase in net assets resulting from operations | 994,068 | 4,715,739 | ||||||||||||||
|
| |||||||||||||||
Distributions to shareholders from | ||||||||||||||||
Net investment income – Class 2 | 0 | (367,828 | ) | |||||||||||||
|
| |||||||||||||||
Capital share transactions | Shares | Shares | ||||||||||||||
Proceeds from shares sold – Class 2 | 55,324 | 1,161,454 | 68,901 | 1,337,139 | ||||||||||||
Reinvestment of distributions – Class 2 | 0 | 0 | 18,521 | 367,828 | ||||||||||||
Payment for shares redeemed – Class 2 | (281,777 | ) | (5,927,267 | ) | (568,515 | ) | (11,100,349 | ) | ||||||||
|
| |||||||||||||||
Net decrease in net assets resulting from capital share transactions | (4,765,813 | ) | (9,395,382 | ) | ||||||||||||
|
| |||||||||||||||
Total decrease in net assets | (3,771,745 | ) | (5,047,471 | ) | ||||||||||||
|
| |||||||||||||||
Net assets | ||||||||||||||||
Beginning of period | 46,298,207 | 51,345,678 | ||||||||||||||
|
| |||||||||||||||
End of period | $ | 42,526,462 | $ | 46,298,207 | ||||||||||||
|
| |||||||||||||||
Undistributed net investment income | $ | 583,065 | $ | 362,775 | ||||||||||||
|
| |||||||||||||||
The accompanying notes are an integral part of these financial statements.
Table of Contents
| Financial highlights | Wells Fargo Advantage VT Intrinsic Value Fund | 13 |
(For a share outstanding throughout each period)
| Six months ended June 30, 2015 (unaudited) | Year ended December 31 | |||||||||||||||||||||||
| CLASS 2 | 2014 | 2013 | 2012 | 2011 | 20101,2 | |||||||||||||||||||
Net asset value, beginning of period | $20.66 | $18.87 | $14.63 | $12.42 | $12.76 | $11.31 | ||||||||||||||||||
Net investment income | 0.13 | 0.18 | 0.15 | 0.18 | 0.18 | 0.16 | ||||||||||||||||||
Net realized and unrealized gains (losses) on investments | 0.33 | 1.76 | 4.27 | 2.22 | (0.45 | ) | 1.39 | |||||||||||||||||
|
|
|
|
|
|
|
|
|
|
|
| |||||||||||||
Total from investment operations | 0.46 | 1.94 | 4.42 | 2.40 | (0.27 | ) | 1.55 | |||||||||||||||||
Distributions to shareholders from | ||||||||||||||||||||||||
Net investment income | 0.00 | (0.15 | ) | (0.18 | ) | (0.19 | ) | (0.07 | ) | (0.10 | ) | |||||||||||||
Net asset value, end of period | $21.12 | $20.66 | $18.87 | $14.63 | $12.42 | $12.76 | ||||||||||||||||||
Total return3 | 2.23 | % | 10.31 | % | 30.30 | % | 19.47 | % | (2.15 | )% | 13.83 | % | ||||||||||||
Ratios to average net assets (annualized) | ||||||||||||||||||||||||
Gross expenses | 1.15 | % | 1.08 | % | 1.12 | % | 1.14 | % | 1.17 | % | 1.10 | % | ||||||||||||
Net expenses | 1.00 | % | 1.00 | % | 1.00 | % | 1.00 | % | 1.00 | % | 1.00 | % | ||||||||||||
Net investment income | 1.00 | % | 0.75 | % | 0.74 | % | 1.07 | % | 1.17 | % | 1.29 | % | ||||||||||||
Supplemental data | ||||||||||||||||||||||||
Portfolio turnover rate | 13 | % | 26 | % | 22 | % | 22 | % | 26 | % | 72 | % | ||||||||||||
Net assets, end of period (000s omitted) | $42,526 | $46,298 | $51,346 | $46,563 | $46,285 | $58,832 | ||||||||||||||||||
| 1 | After the close of business on July 16, 2010, the Fund acquired the net assets of Wells Fargo Advantage VT Equity Income Fund and Wells Fargo Advantage VT C&B Large Cap Value Fund. Wells Fargo Advantage VT Equity Income Fund became the accounting and performance survivor in the transaction. The information for the period prior to July 19, 2010 is that of Wells Fargo Advantage VT Equity Income Fund. |
| 2 | After the close of business on July 16, 2010, existing shares of Wells Fargo Advantage VT Equity Income Fund were renamed Class 2 shares. |
| 3 | Returns for periods of less than one year are not annualized. |
The accompanying notes are an integral part of these financial statements.
Table of Contents
| 14 | Wells Fargo Advantage VT Intrinsic Value Fund | Notes to financial statements (unaudited) |
1. ORGANIZATION
Wells Fargo Variable Trust (the “Trust”), a Delaware statutory trust organized on March 10, 1999, is an open-end management investment company registered under the Investment Company Act of 1940, as amended (the “1940 Act”). As an investment company, the Trust follows the accounting and reporting guidance in Financial Accounting Standards Board (“FASB”) Accounting Standards Codification Topic 946, Financial Services – Investment Companies. These financial statements report on the Wells Fargo Advantage VT Intrinsic Value Fund (the “Fund”) which is a diversified series of the Trust.
2. SIGNIFICANT ACCOUNTING POLICIES
The following significant accounting policies, which are consistently followed in the preparation of the financial statements of the Fund, are in conformity with U.S. generally accepted accounting principles which require management to make estimates and assumptions that affect the reported amounts of assets and liabilities, disclosure of contingent assets and liabilities at the date of the financial statements, and the reported amounts of revenues and expenses during the reporting period. Actual results could differ from those estimates.
Securities valuation
All investments are valued each business day as of the close of regular trading on the New York Stock Exchange (generally 4 p.m. Eastern Time).
Equity securities that are listed on a foreign or domestic exchange or market are valued at the official closing price or, if none, the last sales price. If no sale occurs on the primary exchange or market that day, the prior day’s price will be deemed “stale” and a fair value price will be determined in accordance with the Fund’s Valuation Procedures.
Equity securities that are not listed on a foreign or domestic exchange or market, but have a public trading market, are valued at the quoted bid price from an independent broker-dealer that the Management Valuation Team of Wells Fargo Funds Management, LLC (“Funds Management”) has determined is an acceptable source.
Investments in registered open-end investment companies are valued at net asset value. Interests in non-registered investment vehicles that are redeemable at net asset value are fair valued at net asset value when available.
Investments which are not valued using any of the methods discussed above are valued at their fair value, as determined in good faith by the Board of Trustees of the Fund. The Board of Trustees has established a Valuation Committee comprised of the Trustees and has delegated to it the authority to take any actions regarding the valuation of portfolio securities that the Valuation Committee deems necessary or appropriate, including determining the fair value of portfolio securities, unless the determination has been delegated to the Management Valuation Team. The Board of Trustees retains the authority to make or ratify any valuation decisions or approve any changes to the Valuation Procedures as it deems appropriate. On a quarterly basis, the Board of Trustees receives reports on any valuation actions taken by the Valuation Committee or the Management Valuation Team which may include items for ratification.
Valuations of fair valued securities are compared to the next actual sales price when available, or other appropriate market values, to assess the continued appropriateness of the fair valuation methodologies used. These securities are fair valued on a day-to-day basis, taking into consideration changes to appropriate market information and any significant changes to the inputs considered in the valuation process until there is a readily available price provided on an exchange or by an independent pricing service. Valuations received from an independent pricing service or independent broker-dealer quotes are periodically validated by comparisons to most recent trades and valuations provided by other independent pricing services in addition to the review of prices by the adviser and/or subadviser. Unobservable inputs used in determining fair valuations are identified based on the type of security, taking into consideration factors utilized by market participants in valuing the investment, knowledge about the issuer and the current market environment.
Security loans
The Fund may lend its securities from time to time in order to earn additional income in the form of fees or interest on securities received as collateral or the investment of any cash received as collateral. The Fund continues to receive interest or dividends on the securities loaned. The Fund receives collateral in the form of cash or securities with a value at least equal to the value of the securities on loan. The value of the loaned securities is determined at the close of each business day and any additional required collateral is delivered to the Fund on the next business day. In a securities lending transaction, the net asset value of the Fund will be affected by an increase or decrease in the value of the securities loaned and by an increase or decrease in the value of the instrument in which collateral is invested. The amount of securities lending activity undertaken by the Fund fluctuates from time to time. In the event of default or bankruptcy by the borrower, the Fund may be prevented from recovering the loaned securities or gaining access to the collateral or
Table of Contents
| Notes to financial statements (unaudited) | Wells Fargo Advantage VT Intrinsic Value Fund | 15 |
may experience delays or costs in doing so. In addition, the investment of any cash collateral received may lose all or part of its value. The Fund has the right under the lending agreement to recover the securities from the borrower on demand.
The Fund lends its securities through an unaffiliated securities lending agent. Cash collateral received in connection with its securities lending transactions is invested in Securities Lending Cash Investments, LLC (the “Securities Lending Fund”). The Securities Lending Fund is exempt from registration under Section 3(c)(7) of the 1940 Act and is managed by Funds Management and is subadvised by Wells Capital Management Incorporated (“WellsCap”). Funds Management receives an advisory fee starting at 0.05% and declining to 0.01% as the average daily net assets of the Securities Lending Fund increase. All of the fees received by Funds Management are paid to WellsCap for its services as subadviser. The Securities Lending Fund seeks to provide a positive return compared to the daily Fed Funds Open rate by investing in high-quality, U.S. dollar-denominated short-term money market instruments. Securities Lending Fund investments are fair valued based upon the amortized cost valuation technique. Income earned from investment in the Securities Lending Fund is included in securities lending income on the Statement of Operations.
Security transactions and income recognition
Securities transactions are recorded on a trade date basis. Realized gains or losses are recorded on the basis of identified cost.
Dividend income is recognized on the ex-dividend date. Dividend income is recorded net of foreign taxes withheld where recovery of such taxes is not assured.
Distributions to shareholders
Distributions to shareholders from net investment income and net realized gains, if any, are recorded on the ex-dividend date. Such distributions are determined in conformity with federal income tax regulations, which may differ in amount or character from net investment income and realized gains recognized for purposes of U.S. generally accepted accounting principles.
Federal and other taxes
The Fund intends to continue to qualify as a regulated investment company by distributing substantially all of its investment company taxable income and any net realized capital gains (after reduction for capital loss carryforwards) sufficient to relieve it from all, or substantially all, federal income taxes. Accordingly, no provision for federal income taxes was required.
The Fund’s income and federal excise tax returns and all financial records supporting those returns for the prior three fiscal years are subject to examination by the federal and Delaware revenue authorities. Management has analyzed the Fund’s tax positions taken on federal, state, and foreign tax returns for all open tax years and does not believe that there are any uncertain tax positions that require recognition of a tax liability.
3. FAIR VALUATION MEASUREMENTS
Fair value measurements of investments are determined within a framework that has established a fair value hierarchy based upon the various data inputs utilized in determining the value of the Fund’s investments. The three-level hierarchy gives the highest priority to unadjusted quoted prices in active markets for identical assets or liabilities (Level 1) and the lowest priority to significant unobservable inputs (Level 3). The Fund’s investments are classified within the fair value hierarchy based on the lowest level of input that is significant to the fair value measurement. The inputs are summarized into three broad levels as follows:
| n | Level 1 – quoted prices in active markets for identical securities |
| n | Level 2 – other significant observable inputs (including quoted prices for similar securities, interest rates, prepayment speeds, credit risk, use of amortized cost, etc.) |
| n | Level 3 – significant unobservable inputs (including the Fund’s own assumptions in determining the fair value of investments) |
The inputs or methodologies used for valuing investments in securities are not necessarily an indication of the risk associated with investing in those securities.
Table of Contents
| 16 | Wells Fargo Advantage VT Intrinsic Value Fund | Notes to financial statements (unaudited) |
The following is a summary of the inputs used in valuing the Fund’s assets and liabilities as of June 30, 2015:
| Quoted prices (Level 1) | Other significant (Level 2) | Significant unobservable inputs (Level 3) | Total | |||||||||||||
Assets | ||||||||||||||||
Investments in: | ||||||||||||||||
Common stocks | ||||||||||||||||
Consumer discretionary | $ | 4,072,207 | $ | 0 | $ | 0 | $ | 4,072,207 | ||||||||
Consumer staples | 4,343,138 | 0 | 0 | 4,343,138 | ||||||||||||
Energy | 3,637,186 | 0 | 0 | 3,637,186 | ||||||||||||
Financials | 8,573,600 | 0 | 0 | 8,573,600 | ||||||||||||
Health care | 5,541,686 | 0 | 0 | 5,541,686 | ||||||||||||
Industrials | 5,218,183 | 0 | 0 | 5,218,183 | ||||||||||||
Information technology | 6,762,279 | 0 | 0 | 6,762,279 | ||||||||||||
Materials | 707,735 | 0 | 0 | 707,735 | ||||||||||||
Telecommunication services | 794,701 | 0 | 0 | 794,701 | ||||||||||||
Utilities | 1,653,106 | 0 | 0 | 1,653,106 | ||||||||||||
Short-term investments | ||||||||||||||||
Investment companies | 1,561,133 | 1,114,725 | 0 | 2,675,858 | ||||||||||||
Total assets | $ | 42,864,954 | $ | 1,114,725 | $ | 0 | $ | 43,979,679 | ||||||||
The Fund recognizes transfers between levels within the fair value hierarchy at the end of the reporting period. At June 30, 2015, the Fund did not have any transfers into/out of Level 1, Level 2, or Level 3.
4. TRANSACTIONS WITH AFFILIATES
Advisory fee
The Trust has entered into an advisory contract with Funds Management, an indirect wholly owned subsidiary of Wells Fargo & Company (“Wells Fargo”). The adviser is responsible for implementing investment policies and guidelines and for supervising the subadviser, who is responsible for day-to-day portfolio management of the Fund.
Pursuant to the contract, Funds Management is entitled to receive an annual advisory fee starting at 0.55% and declining to 0.40% as the average daily net assets of the Fund increase. For the six months ended June 30, 2015, the advisory fee was equivalent to an annual rate of 0.55% of the Fund’s average daily net assets.
Funds Management has retained the services of a subadviser to provide daily portfolio management to the Fund. The fee for subadvisory services is borne by Funds Management. Metropolitan West Capital Management, LLC, an affiliate of Funds Management and an indirect wholly owned subsidiary of Wells Fargo, is the subadviser to the Fund and is entitled to receive a fee from Funds Management at an annual rate starting at 0.35% and declining to 0.25% as the average daily net assets of the Fund increase.
Administration fee
The Trust has entered into an administration agreement with Funds Management. Under this agreement, for providing administrative services, which includes paying fees and expenses for services provided by the transfer agent, sub-transfer agents, omnibus account servicers and record-keepers, Funds Management is entitled to receive from the Fund an annual fund level administration fee starting at 0.13% and declining to 0.11% as the average daily net assets of the Fund increase.
Funds Management has contractually waived and/or reimbursed advisory and administration fees to the extent necessary to maintain certain net operating expense ratios for the Fund. Waiver of fees and/or reimbursement of expenses by Funds Management were made first from fund level expenses on a proportionate basis and then from class specific expenses. Funds Management has committed through April 30, 2016 to waive fees and/or reimburse expenses to the extent necessary to cap the Fund’s expenses at 1.00% for Class 2 shares. After this time, the cap may be increased or the commitment to maintain the cap may be terminated only with the approval of the Board of Trustees.
Table of Contents
| Notes to financial statements (unaudited) | Wells Fargo Advantage VT Intrinsic Value Fund | 17 |
Distribution fee
The Trust has adopted a Distribution Plan for Class 2 shares of the Fund pursuant to Rule 12b-1 under the 1940 Act. A distribution fee is charged to Class 2 shares and paid to Wells Fargo Funds Distributor, LLC, the principal underwriter, at an annual rate of 0.25% of the average daily net assets of Class 2 shares.
5. INVESTMENT PORTFOLIO TRANSACTIONS
Purchases and sales of investments, excluding U.S. government obligations (if any) and short-term securities, for the six months ended June 30, 2015 were $5,402,908 and $10,423,390, respectively.
6. BANK BORROWINGS
The Trust and Wells Fargo Funds Trust (excluding the money market funds and certain other funds) are parties to a $150,000,000 revolving credit agreement whereby the Fund is permitted to use bank borrowings for temporary or emergency purposes, such as to fund shareholder redemption requests. Interest under the credit agreement is charged to the Fund based on a borrowing rate equal to the higher of the Federal Funds rate in effect on that day plus 1.25% or the overnight LIBOR rate in effect on that day plus 1.25%. In addition, an annual commitment fee equal to 0.10% of the unused balance is allocated to each participating fund. For the six months ended June 30, 2015, the Fund paid $33 in commitment fees.
For the six months ended June 30, 2015, there were no borrowings by the Fund under the agreement.
7. INDEMNIFICATION
Under the Trust’s organizational documents, the officers and Trustees have been granted certain indemnification rights against certain liabilities that may arise out of performance of their duties to the Trust. Additionally, in the normal course of business, the Trust may enter into contracts with service providers that contain a variety of indemnification clauses. The Trust’s maximum exposure under these arrangements is dependent on future claims that may be made against the Fund and, therefore, cannot be estimated.
8. SUBSEQUENT DISTRIBUTIONS
On July 9, 2015 the Fund declared distributions from net investment income and long-term capital gains to shareholders of record on July 8, 2015. The per share amounts payable on July 10, 2015 were as follows:
| Net investment income | Long-term capital gains | |||||||
Class 2 | $ | 0.18022 | $ | 2.98942 | ||||
These distributions are not reflected in the accompanying financial statements. The final determination of the source of all distributions is subject to change and made after the Fund’s tax year-end.
Table of Contents
| 18 | Wells Fargo Advantage VT Intrinsic Value Fund | Other information (unaudited) |
PROXY VOTING INFORMATION
A description of the policies and procedures that the Fund uses to determine how to vote proxies relating to portfolio securities is available, upon request, by calling 1-800-222-8222, visiting our website at wellsfargoadvantagefunds.com, or visiting the SEC website at sec.gov. Information regarding how the Fund voted proxies relating to portfolio securities during the most recent 12-month period ended June 30 is available on the Fund’s website at wellsfargoadvantagefunds.com or by visiting the SEC website at sec.gov.
PORTFOLIO HOLDINGS INFORMATION
The complete portfolio holdings for the Fund are publicly available monthly on the Fund’s website (wellsfargoadvantagefunds.com), on a one-month delayed basis. In addition, top ten holdings information (excluding derivative positions) for the Fund is publicly available on the Fund’s website on a monthly, seven-day or more delayed basis. The Fund files its complete schedule of portfolio holdings with the SEC for the first and third quarters of each fiscal year on Form N-Q, which is available by visiting the SEC website at sec.gov. In addition, the Fund’s Form N-Q may be reviewed and copied at the SEC’s Public Reference Room in Washington, DC, and at regional offices in New York City, at 233 Broadway, and in Chicago, at 175 West Jackson Boulevard, Suite 900. Information about the Public Reference Room may be obtained by calling 1-800-SEC-0330.
Table of Contents
| Other information (unaudited) | Wells Fargo Advantage VT Intrinsic Value Fund | 19 |
BOARD OF TRUSTEES AND OFFICERS
Each of the Trustees and Officers1 listed in the table below acts in identical capacities for each fund in the Wells Fargo Advantage family of funds, which consists of 134 mutual funds comprising the Wells Fargo Funds Trust, Wells Fargo Variable Trust, Wells Fargo Master Trust and four closed-end funds (collectively the “Fund Complex”). This table should be read in conjunction with the Prospectus and the Statement of Additional Information2. The mailing address of each Trustee and Officer is 525 Market Street, 12th Floor, San Francisco, CA 94105. Each Trustee and Officer serves an indefinite term, however, each Trustee serves such term until reaching the mandatory retirement age established by the Trustees.
Independent Trustees
Name and year of birth | Position held and length of service* | Principal occupations during past five years or longer | Other directorships during past five years | |||
| William R. Ebsworth (Born 1957) | Trustee, since 2015** | Retired. From 1984 to 2013, equities analyst, portfolio manager, research director at Fidelity Management and Research Company and retired in 2013 as Chief Investment Officer of Fidelity Strategic Advisers, Inc. in Boston, Tokyo, and Hong Kong where he led a team of investment professionals managing client assets. Prior thereto, Board member of Hong Kong Securities Clearing Co., Hong Kong Options Clearing Corp., the Thailand International Fund, Ltd., Fidelity Investments Life Insurance Company, and Empire Fidelity Investments Life Insurance Company. Mr. Ebsworth is an Adjunct Lecturer, Finance, at Babson College and a Chartered Financial Analyst. | Asset Allocation Trust | |||
| Jane A. Freeman (Born 1953) | Trustee, since 2015** | Retired. From 2012 to 2014 and 1999 to 2008, Chief Financial Officer of Scientific Learning Corporation. From 2008 to 2012, Ms. Freeman provided consulting services related to strategic business projects. Prior to 1999, Portfolio Manager at Rockefeller & Co. and Scudder, Stevens & Clark. Board member of the Harding Loevner Funds from 1996 to 2014, serving as both Lead Independent Director and chair of the Audit Committee. Board member of the Russell Exchange Traded Funds Trust from 2011 to 2012 and the chair of the Audit Committee. Ms. Freeman is a Chartered Financial Analyst (inactive), Chair of Taproot Foundation (non-profit organization) and a Board Member of Ruth Bancroft Garden (non-profit organization). | Asset Allocation Trust | |||
| Peter G. Gordon (Born 1942) | Trustee, since 1998; Chairman, since 2005 | Co-Founder, Retired Chairman, President and CEO of Crystal Geyser Water Company. Trustee Emeritus, Colby College. | Asset Allocation Trust | |||
| Isaiah Harris, Jr. (Born 1952) | Trustee, since 2009 | Retired. Chairman of the Board of CIGNA Corporation since 2009, and Director since 2005. From 2003 to 2011, Director of Deluxe Corporation. Prior thereto, President and CEO of BellSouth Advertising and Publishing Corp. from 2005 to 2007, President and CEO of BellSouth Enterprises from 2004 to 2005 and President of BellSouth Consumer Services from 2000 to 2003. Emeritus member of the Iowa State University Foundation Board of Governors. Emeritus Member of the Advisory Board of Iowa State University School of Business. Advisory Board Member, Palm Harbor Academy. Mr. Harris is a certified public accountant. | CIGNA Corporation; Asset Allocation Trust | |||
| Judith M. Johnson (Born 1949) | Trustee, since 2008; Audit Committee Chairman, since 2008 | Retired. Prior thereto, Chief Executive Officer and Chief Investment Officer of Minneapolis Employees Retirement Fund from 1996 to 2008. Ms. Johnson is an attorney, certified public accountant and a certified managerial accountant. | Asset Allocation Trust | |||
| David F. Larcker (Born 1950) | Trustee, since 2009 | James Irvin Miller Professor of Accounting at the Graduate School of Business, Stanford University, Morgan Stanley Director of the Center for Leadership Development and Research and Senior Faculty of The Rock Center for Corporate Governance since 2006. From 2005 to 2008, Professor of Accounting at the Graduate School of Business, Stanford University. Prior thereto, Ernst & Young Professor of Accounting at The Wharton School, University of Pennsylvania from 1985 to 2005. | Asset Allocation Trust |
Table of Contents
| 20 | Wells Fargo Advantage VT Intrinsic Value Fund | Other information (unaudited) |
Name and year of birth | Position held and length of service* | Principal occupations during past five years or longer | Other directorships during past five years | |||
| Olivia S. Mitchell (Born 1953) | Trustee, since 2006 | International Foundation of Employee Benefit Plans Professor, Wharton School of the University of Pennsylvania since 1993. Director of Wharton’s Pension Research Council and Boettner Center on Pensions & Retirement Research, and Research Associate at the National Bureau of Economic Research. Previously, Cornell University Professor from 1978 to 1993. | Asset Allocation Trust | |||
| Timothy J. Penny (Born 1951) | Trustee, since 1996 | President and Chief Executive Officer of Southern Minnesota Initiative Foundation, a non-profit organization, since 2007 and Senior Fellow at the Humphrey Institute Policy Forum at the University of Minnesota since 1995. Member of the Board of Trustees of NorthStar Education Finance, Inc., a non-profit organization, since 2007. | Asset Allocation Trust | |||
| Michael S. Scofield (Born 1943) | Trustee, since 2010 | Served on the Investment Company Institute’s Board of Governors and Executive Committee from 2008-2011 as well the Governing Council of the Independent Directors Council from 2006-2011 and the Independent Directors Council Executive Committee from 2008-2011. Chairman of the IDC from 2008-2010. Institutional Investor (Fund Directions) Trustee of Year in 2007. Trustee of the Evergreen Funds complex (and its predecessors) from 1984 to 2010. Chairman of the Evergreen Funds from 2000-2010. Former Trustee of the Mentor Funds. Retired Attorney, Law Offices of Michael S. Scofield. | Asset Allocation Trust | |||
| Donald C. Willeke (Born 1940) | Trustee, since 1996 | Principal of the law firm of Willeke & Daniels. General Counsel of the Minneapolis Employees Retirement Fund from 1984 until its consolidation into the Minnesota Public Employees Retirement Association on June 30, 2010. Director and Vice Chair of The Tree Trust (non-profit corporation). Director of the American Chestnut Foundation (non-profit corporation). | Asset Allocation Trust |
| * | Length of service dates reflect the Trustee’s commencement of service with the Trust’s predecessor entities, where applicable. |
| ** | William R. Ebsworth and Jane A. Freeman each became a Trustee effective January 1, 2015. |
Officers
| Name and year of birth | Position held and length of service | Principal occupations during past five years or longer | ||||
| Karla M. Rabusch (Born 1959) | President, since 2003 | Executive Vice President of Wells Fargo Bank, N.A. and President of Wells Fargo Funds Management, LLC since 2003. | ||||
| Jeremy DePalma1 (Born 1974) | Treasurer, since 2012 | Senior Vice President of Wells Fargo Funds Management, LLC since 2009. Senior Vice President of Evergreen Investment Management Company, LLC from 2008 to 2010. Vice President, Evergreen Investment Services, Inc. from 2004 to 2007. Head of the Fund Reporting and Control Team within Fund Administration from 2005 to 2010. | ||||
| C. David Messman (Born 1960) | Secretary, since 2000; Chief Legal Officer, since 2003 | Senior Vice President and Secretary of Wells Fargo Funds Management, LLC since 2001. Assistant General Counsel of Wells Fargo Bank, N.A. since 2013 and Vice President and Managing Counsel of Wells Fargo Bank N.A. from 1996 to 2013. | ||||
Debra Ann Early (Born 1964) | Chief Compliance Officer, since 2007 | Senior Vice President of Wells Fargo Funds Management, LLC since 2007 and Chief Compliance Officer from 2007 to 2014. Chief Compliance Officer of Parnassus Investments from 2005 to 2007. Chief Financial Officer of Parnassus Investments from 2004 to 2007 and Senior Audit Manager of PricewaterhouseCoopers LLP from 1998 to 2004. | ||||
David Berardi (Born 1975) | Assistant Treasurer, since 2009 | Vice President of Wells Fargo Funds Management, LLC since 2009. Vice President of Evergreen Investment Management Company, LLC from 2008 to 2010. Assistant Vice President of Evergreen Investment Services, Inc. from 2004 to 2008. Manager of Fund Reporting and Control for Evergreen Investment Management Company, LLC from 2004 to 2010. |
| 1 | Jeremy DePalma acts as Treasurer of 61 funds and Assistant Treasurer of 73 funds in the Fund Complex. |
| 2 | The Statement of Additional Information includes additional information about the Trustees and is available, without charge, upon request, by calling 1-800-222-8222 or by visiting the website at wellsfargoadvantagefunds.com. |
Table of Contents
| Other information (unaudited) | Wells Fargo Advantage VT Intrinsic Value Fund | 21 |
BOARD CONSIDERATION OF INVESTMENT ADVISORY, INVESTMENT MANAGEMENT AND SUB-ADVISORY AGREEMENTS:
Under the Investment Company Act of 1940 (the “1940 Act”), the Board of Trustees (the “Board”) of Wells Fargo Variable Trust (the “Trust”) must determine annually whether to approve the continuation of the Trust’s investment advisory and sub-advisory agreements. In this regard, at an in-person meeting held on May 19-20, 2015 (the “Meeting”), the Board, all the members of which have no direct or indirect interest in the investment advisory and sub-advisory agreements and are not “interested persons” of the Trust, as defined in the 1940 Act (the “Independent Trustees”), reviewed and approved for Wells Fargo Advantage VT Intrinsic Value Fund (the “Fund”): (i) an investment advisory agreement (the “Advisory Agreement”) with Wells Fargo Funds Management, LLC (“Funds Management”); (ii) an investment management agreement (the “Management Agreement”) with Funds Management; and (iii) an investment sub-advisory agreement (the “Sub-Advisory Agreement”) with Metropolitan West Capital Management, LLC (the “Sub-Adviser”), an affiliate of Funds Management. The Management Agreement combines the terms of the Advisory Agreement with the terms of the Fund’s Amended and Restated Administration Agreement (the “Administration Agreement”) applicable to Fund-level administrative services. The Advisory Agreement, the Management Agreement and the Sub-Advisory Agreement are collectively referred to as the “Advisory Agreements.”
At the Meeting, the Board considered the factors and reached the conclusions described below relating to the selection of Funds Management and the Sub-Adviser and the approval of the Advisory Agreements. Prior to the Meeting, including at an in-person meeting in March 2015, the Trustees conferred extensively among themselves and with representatives of Funds Management about these matters. Also, the Board has adopted a team-based approach, with each team consisting of a sub-set of Trustees, to assist the full Board in the discharge of its duties in reviewing performance and other matters throughout the year. The Independent Trustees were assisted in their evaluation of the Advisory Agreements by independent legal counsel, from whom they received separate legal advice and with whom they met separately.
In providing information to the Board, Funds Management and the Sub-Adviser were guided by a detailed set of requests for information submitted to them by independent legal counsel on behalf of the Independent Trustees at the start of the Board’s annual contract renewal process earlier in 2015. In considering and approving the Advisory Agreements, the Trustees considered the information they believed relevant, including but not limited to the information discussed below. The Board considered not only the specific information presented in connection with the Meeting, but also the knowledge gained over time through interaction with Funds Management and the Sub-Adviser about various topics. In this regard, the Board reviewed reports of Funds Management at each of its quarterly meetings, which included, among other things, portfolio reviews and performance reports. In addition, the Board and the teams mentioned above confer with portfolio managers at various times throughout the year. The Board did not identify any particular information or consideration that was all-important or controlling, and each individual Trustee may have attributed different weights to various factors.
After its deliberations, the Board unanimously approved the continuation of the Advisory Agreement for the period from June 1, 2015 through June 30, 2015, approved the Management Agreement for the period from July 1, 2015 through May 31, 2016, and approved the continuation of the Sub-Advisory Agreement for a one-year term through May 31, 2016. The Board also determined that the compensation payable to Funds Management and the Sub-Adviser under each of the Advisory Agreements was reasonable. The Board considered the approval of the Advisory Agreements for the Fund as part of its consideration of agreements for funds across the complex, but its approvals were made on a fund-by-fund basis. The following summarizes a number of important, but not necessarily all, factors considered by the Board in support of its approvals.
Nature, extent and quality of services
The Board received and considered various information regarding the nature, extent and quality of services provided to the Fund by Funds Management and the Sub-Adviser under the Advisory Agreements. This information included, among other things, a summary of the background and experience of senior management of Funds Management, and the qualifications, background, tenure and responsibilities of each of the portfolio managers primarily responsible for the day-to-day portfolio management of the Fund. The Board noted that the services to be provided to the Fund pursuant to the Management Agreement combined the advisory services previously provided to the Fund pursuant to the Fund’s Advisory Agreement with the Fund-level administrative services previously provided to the Fund pursuant to the Fund’s Administration Agreement. The Board received a representation from Funds Management that combining these services would not result in any change to the nature or level of services provided by Funds Management to the Fund.
The Board evaluated the ability of Funds Management and the Sub-Adviser to attract and retain qualified investment professionals, including research, advisory and supervisory personnel. The Board further considered the compliance
Table of Contents
| 22 | Wells Fargo Advantage VT Intrinsic Value Fund | Other information (unaudited) |
programs and compliance records of Funds Management and the Sub-Adviser. In addition, the Board took into account the full range of services provided to the Fund by Funds Management and its affiliates.
Fund performance and expenses
The Board considered the performance results for the Fund over various time periods ended March 31, 2015. The Board considered these results in comparison to the performance of funds in a universe that was determined by Lipper Inc. (“Lipper”) to be similar to the Fund (the “Universe”), and in comparison to the Fund’s benchmark index and to other comparative data. Lipper is an independent provider of investment company data. The Board received a description of the methodology used by Lipper to select the mutual funds in the performance Universe. The Board noted that the performance of the Fund (Class 2) was higher than the average performance of the Universe for all periods under review except ten-year period. The Board also noted that the performance of the Fund was lower than its benchmark, the Russell 1000® Value Index, for all periods under review except the first quarter of 2015 and the one-year period.
The Board also received and considered information regarding the Fund’s net operating expense ratio and its various components, including actual management fees (which reflect fee waivers, if any, and include advisory, administration and transfer agent fees), custodian and other non-management fees, and Rule 12b-1 and non-Rule 12b-1 service fees. The Board considered this ratio in comparison to the median ratios of funds in a class-specific expense group that was determined by Lipper to be similar to the Fund (the “Group”). The Board received a description of the methodology used by Lipper to select the mutual funds in the expense Group and an explanation of how funds comprising expense groups and their expense ratios may vary from year-to-year. Based on the Lipper reports, the Board noted that the net operating expense ratio of the Fund was lower than the median net operating expense ratio of the expense Group.
The Board took into account the Fund performance and expense information provided to it among the factors considered in deciding to re-approve the Advisory Agreement and Sub-Advisory Agreement and approve the Management Agreement.
Investment advisory and sub-advisory fee rates
The Board reviewed and considered the contractual investment advisory fee rate that is payable by the Fund to Funds Management for investment advisory services (the “Advisory Agreement Rate”), both on a stand-alone basis and on a combined basis with the Fund’s contractual administration fee rate (the “Management Rate”). The Board noted that the Management Rate includes transfer agency and sub-transfer agency costs. The Board also noted that the fee rate to be paid by the Fund under the Management Agreement will incorporate the advisory fee and Fund-level administration fee previously payable separately by the Fund under the Fund’s Advisory Agreement and Administration Agreement with Funds Management. The Board also reviewed and considered the contractual investment sub-advisory fee rate that is payable by Funds Management to the Sub-Adviser for investment sub-advisory services (the “Sub-Advisory Agreement Rate”).
Among other information reviewed by the Board was a comparison of the Management Rate of the Fund with those of other funds in the expense Group at a common asset level The Board noted that the Management Rate of the Fund was lower than the average rate for the Fund’s expense Group.
The Board also received and considered information about the portion of the total advisory fee that was retained by Funds Management after payment of the fee to the Sub-Adviser for sub-advisory services. In assessing the reasonableness of this amount, the Board received and evaluated information about the nature and extent of responsibilities retained and risks assumed by Funds Management and not delegated to or assumed by the Sub-Adviser, and about Funds Management’s on-going oversight services. However, given the affiliation between Funds Management and the Sub-Adviser, the Board ascribed limited relevance to the allocation of the advisory fee between them.
The Board also received and considered information about the nature and extent of services offered and fee rates charged by Funds Management and the Sub-Adviser to other types of clients with investment strategies similar to those of the Fund. In this regard, the Board received information about the significantly greater scope of services, and compliance, reporting and other legal burdens and risks of managing mutual funds compared with those associated with managing assets of non-mutual fund clients such as collective funds or institutional separate accounts.
Based on its consideration of the factors and information it deemed relevant, including those described here, the Board determined that the compensation payable to Funds Management under the Management Agreement and Advisory Agreement and to the Sub-Adviser under the Sub-Advisory Agreement was reasonable, in light of the services covered by the Advisory Agreements.
Table of Contents
| Other information (unaudited) | Wells Fargo Advantage VT Intrinsic Value Fund | 23 |
Profitability
The Board received and considered information concerning the profitability of Funds Management, as well as the profitability of Wells Fargo as a whole, from providing services to the Fund and the fund family as a whole. The Board also received and considered information concerning the profitability of the Sub-Adviser from providing services to the fund family as a whole, noting that the Sub-Adviser’s profitability information with respect to providing services to the Fund was subsumed in the Wells Fargo profitability analysis.
Funds Management reported on the methodologies and estimates used in calculating profitability. Among other things, the Board noted that the levels of profitability reported on a fund-by-fund basis varied widely, depending on factors such as the size and type of fund. Based on its review, the Board did not deem the profits reported by Funds Management or Wells Fargo from its services to the Fund to be at a level that would prevent it from approving the continuation of the Advisory Agreements.
Economies of scale
With respect to possible economies of scale, the Board noted the existence of breakpoints in the Fund’s advisory and management fee structures, and the Fund’s administration fee structure, which operate generally to reduce the Fund’s expense ratios as the Fund grows in size. It considered that, for a small fund or a fund that shrinks in size, breakpoints conversely can result in higher fee levels. The Board also considered that fee waiver and expense reimbursement arrangements and competitive fee rates at the outset are means of sharing potential economies of scale with shareholders of the Fund and the fund family as a whole. The Board considered Funds Management’s view that any analyses of potential economies of scale in managing a particular fund are inherently limited in light of the joint and common costs and investments that Funds Management incurs across the fund family as a whole.
The Board concluded that the Fund’s fee and expense arrangements, including contractual breakpoints, constituted a reasonable approach to sharing potential economies of scale with the Fund and its shareholders.
Other benefits to Funds Management and the Sub-Adviser
The Board received and considered information regarding potential “fall-out” or ancillary benefits received by Funds Management and its affiliates, including the Sub-Adviser, as a result of their relationships with the Fund. Ancillary benefits could include, among others, benefits directly attributable to other relationships with the Fund and benefits potentially derived from an increase in Funds Management’s and the Sub-Adviser’s business as a result of their relationships with the Fund. The Board noted that various affiliates of Funds Management may receive distribution-related fees, shareholder servicing payments and sub-transfer agency fees in respect of shares sold or held through them and services provided.
The Board also reviewed information about soft dollar credits earned and utilized by the Sub-Adviser, fees earned by Funds Management from managing a private investment vehicle for the fund family’s securities lending collateral and commissions earned by an affiliated broker from portfolio transactions.
Based on its consideration of the factors and information it deemed relevant, including those described here, the Board did not find that any ancillary benefits received by Funds Management and its affiliates, including the Sub-Adviser, were unreasonable.
Conclusion
At the Meeting, after considering the above-described factors and based on its deliberations and its evaluation of the information described above, the Board unanimously approved the continuation of the Advisory Agreement for the period from June 1, 2015 through June 30, 2015, approved the Management Agreement for the period from July 1, 2015 through May 31, 2016, and approved the continuation of the Sub-Advisory Agreement for a one-year term through May 31, 2016. The Board also determined that the compensation payable to Funds Management and the Sub-Adviser under each of the Advisory Agreements was reasonable.
Table of Contents
| 24 | Wells Fargo Advantage VT Intrinsic Value Fund | List of abbreviations |
The following is a list of common abbreviations for terms and entities that may have appeared in this report.
| ACA | — ACA Financial Guaranty Corporation |
| ADR | — American depositary receipt |
| ADS | — American depositary shares |
| AGC | — Assured Guaranty Corporation |
| AGM | — Assured Guaranty Municipal |
| Ambac | — Ambac Financial Group Incorporated |
| AMT | — Alternative minimum tax |
| AUD | — Australian dollar |
| BAN | — Bond anticipation notes |
| BHAC | — Berkshire Hathaway Assurance Corporation |
| BRL | — Brazilian real |
| CAB | — Capital appreciation bond |
| CAD | — Canadian dollar |
| CCAB | — Convertible capital appreciation bond |
| CDA | — Community Development Authority |
| CDO | — Collateralized debt obligation |
| CHF | — Swiss franc |
| COP | — Columbian Peso |
| CLP | — Chilean peso |
| DKK | — Danish krone |
| DRIVER | — Derivative inverse tax-exempt receipts |
| DW&P | — Department of Water & Power |
| DWR | — Department of Water Resources |
| ECFA | — Educational & Cultural Facilities Authority |
| EDA | — Economic Development Authority |
| EDFA | — Economic Development Finance Authority |
| ETF | — Exchange-traded fund |
| EUR | — Euro |
| FDIC | — Federal Deposit Insurance Corporation |
| FFCB | — Federal Farm Credit Banks |
| FGIC | — Financial Guaranty Insurance Corporation |
| FHA | — Federal Housing Administration |
| FHLB | — Federal Home Loan Bank |
| FHLMC | — Federal Home Loan Mortgage Corporation |
| FICO | — The Financing Corporation |
| FNMA | — Federal National Mortgage Association |
| FSA | — Farm Service Agency |
| GBP | — Great British pound |
| GDR | — Global depositary receipt |
| GNMA | — Government National Mortgage Association |
| GO | — General obligation |
| HCFR | — Healthcare facilities revenue |
| HEFA | — Health & Educational Facilities Authority |
| HEFAR | — Higher education facilities authority revenue |
| HFA | — Housing Finance Authority |
| HFFA | — Health Facilities Financing Authority |
| HKD | — Hong Kong dollar |
| HUD | — Department of Housing and Urban Development |
| HUF | — Hungarian forint |
| IDA | — Industrial Development Authority |
| IDAG | — Industrial Development Agency |
| IDR | — Indonesian rupiah |
| IEP | — Irish pound |
| JPY | — Japanese yen |
| KRW | — Republic of Korea won |
| LIBOR | — London Interbank Offered Rate |
| LIFER | — Long Inverse Floating Exempt Receipts |
| LIQ | — Liquidity agreement |
| LLC | — Limited liability company |
| LLLP | — Limited liability limited partnership |
| LLP | — Limited liability partnership |
| LOC | — Letter of credit |
| LP | — Limited partnership |
| MBIA | — Municipal Bond Insurance Association |
| MFHR | — Multifamily housing revenue |
| MSTR | — Municipal securities trust receipts |
| MTN | — Medium-term note |
| MUD | — Municipal Utility District |
| MXN | — Mexican peso |
| MYR | — Malaysian ringgit |
| National | — National Public Finance Guarantee Corporation |
| NGN | — Nigerian naira |
| NOK | — Norwegian krone |
| NZD | — New Zealand dollar |
| PCFA | — Pollution Control Financing Authority |
| PCL | — Public Company Limited |
| PCR | — Pollution control revenue |
| PFA | — Public Finance Authority |
| PFFA | — Public Facilities Financing Authority |
| PFOTER | — Puttable floating option tax-exempt receipts |
| plc | — Public limited company |
| PLN | — Polish zloty |
| PUTTER | — Puttable tax-exempt receipts |
| R&D | — Research & development |
| Radian | — Radian Asset Assurance |
| RAN | — Revenue anticipation notes |
| RDA | — Redevelopment Authority |
| RDFA | — Redevelopment Finance Authority |
| REIT | — Real estate investment trust |
| ROC | — Reset option certificates |
| RON | — Romanian lei |
| RUB | — Russian ruble |
| SAVRS | — Select auction variable rate securities |
| SBA | — Small Business Authority |
| SDR | — Swedish depositary receipt |
| SEK | — Swedish krona |
| SFHR | — Single-family housing revenue |
| SFMR | — Single-family mortgage revenue |
| SGD | — Singapore dollar |
| SPA | — Standby purchase agreement |
| SPDR | — Standard & Poor’s Depositary Receipts |
| SPEAR | — Short Puttable Exempt Adjustable Receipts |
| STRIPS | — Separate trading of registered interest and |
| principal securities |
| TAN | — Tax anticipation notes |
| TBA | — To be announced |
| THB | — Thai baht |
| TIPS | — Treasury inflation-protected securities |
| TRAN | — Tax revenue anticipation notes |
| TRY | — Turkish lira |
| TTFA | — Transportation Trust Fund Authority |
| TVA | — Tennessee Valley Authority |
| ZAR | — South African rand |
Table of Contents


For more information
More information about Wells Fargo Advantage Funds is available free upon request. To obtain literature, please write, email, visit the Fund’s website, or call:
Wells Fargo Advantage Funds
P.O. Box 8266
Boston, MA 02266-8266
Email: wfaf@wellsfargo.com
Website: wellsfargoadvantagefunds.com
Individual investors: 1-800-222-8222
Retail investment professionals: 1-888-877-9275
Institutional investment professionals: 1-866-765-0778
This report and the financial statements contained herein are submitted for the general information of the shareholders of Wells Fargo Advantage Funds. If this report is used for promotional purposes, distribution of the report must be accompanied or preceded by a current prospectus. Before investing, please consider the investment objectives, risks, charges, and expenses of the investment. For a current prospectus and, if available, a summary prospectus, containing this information, call 1-800-222-8222 or visit the Fund’s website at wellsfargoadvantagefunds.com. Read the prospectus carefully before you invest or send money.
Wells Fargo Funds Management, LLC, a wholly owned subsidiary of Wells Fargo & Company, provides investment advisory and administrative services for Wells Fargo Advantage Funds. Other affiliates of Wells Fargo & Company provide subadvisory and other services for the Funds. The Funds are distributed by Wells Fargo Funds Distributor, LLC, Member FINRA/SIPC, an affiliate of Wells Fargo & Company.
NOT FDIC INSURED ¡ NO BANK GUARANTEE ¡ MAY LOSE VALUE
© 2015 Wells Fargo Funds Management, LLC. All rights reserved.
235288 08-15 SVT4/SAR139 06-15 |
Table of Contents

Wells Fargo Advantage VT Omega Growth Fund

Semi-Annual Report
June 30, 2015

Table of Contents
Reduce clutter. Save trees.
Sign up for electronic delivery of prospectuses and shareholder reports at wellsfargo.com/advantagedelivery
| 2 | ||||
| 4 | ||||
| 6 | ||||
| 7 | ||||
Financial statements | ||||
| 11 | ||||
| 12 | ||||
| 13 | ||||
| 14 | ||||
| 16 | ||||
| 20 | ||||
| 26 | ||||
The views expressed and any forward-looking statements are as of June 30, 2015, unless otherwise noted, and are those of the Fund managers and/or Wells Fargo Funds Management, LLC. Discussions of individual securities, or the markets generally, or any Wells Fargo Advantage Fund are not intended as individual recommendations. Future events or results may vary significantly from those expressed in any forward-looking statements; the views expressed are subject to change at any time in response to changing circumstances in the market. Wells Fargo Funds Management, LLC and the Fund disclaim any obligation to publicly update or revise any views expressed or forward-looking statements.
NOT FDIC INSURED ¡ NO BANK GUARANTEE ¡ MAY LOSE VALUE
Table of Contents
| 2 | Wells Fargo Advantage VT Omega Growth Fund | Letter to shareholders (unaudited) |

Karla M. Rabusch
President
Wells Fargo Advantage Funds
The period was marked by continued low global interest rates and a slow but steady economic recovery in the U.S.
Dear Valued Shareholder:
We are pleased to offer you this semi-annual report for the Wells Fargo Advantage VT Omega Growth Fund for the six-month period that ended June 30, 2015. The period was marked by continued low global interest rates and a slow but steady economic recovery in the U.S. However, growing concern as to whether a newly elected anti-austerity government in Greece would default on the country’s debt and remove it from the eurozone resulted in late-period volatility for both U.S. and European stocks.
Major central banks continued to provide liquidity to the markets.
Throughout the reporting period, the Federal Open Market Committee (FOMC), which is the U.S. Federal Reserve’s (Fed’s) monetary policymaking body, kept its key interest rate effectively at zero. As the reporting period progressed, though, various comments by Fed Chair Janet Yellen led investors to believe that the FOMC would raise its key federal funds rate by late 2015. Moreover, the FOMC seemed confident that economic conditions would evolve in a way that it would most likely continue raising rates gradually over time.
In contrast, the European Central Bank (ECB) showed no signs of raising rates at any point in the near future. Rather, the ECB maintained a variety of measures aimed at encouraging lending, including making funds available to banks at low interest rates and imposing a negative interest rate on bank deposits held at the central bank. In January 2015, the bank announced quantitative easing via significant bond purchases in an attempt to raise the eurozone’s inflation to just under its target of 2%. The ECB also provided emergency liquidity to Greek banks while that country’s government negotiated with its creditors, which included the eurozone member states and the International Monetary Fund (IMF).
The prospect of a near-term rate hike in the U.S., combined with continued easing from the ECB and other major central banks, resulted in the U.S. dollar appreciating against a basket of currencies for the six-month reporting period.
Although U.S. economic growth slowed in the first quarter, market participants believed that its recovery remained on track.
Reported U.S. gross domestic product (GDP) growth came in at a solid 2.2% annualized rate in the fourth quarter of 2014. Although the final estimate for annualized GDP growth came in at a modest 0.6% in the first quarter of 2015, the slowdown was attributed to short-term factors such as a harsh winter and a long-lived strike at West Coast ports. The U.S. unemployment rate continued its slow improvement, easing from 5.7% in January 2015 to 5.3% in June.
U.S. stocks generally posted gains for the period, aided by a solid economy. However, uncertainty as to whether Greece would default on a June 30 payment to the IMF resulted in volatility and negative returns in the last month of the reporting period. The S&P 500 Index1, a measure of U.S. large-cap stocks, ended the period with a gain of 1.23%. Growth stocks outperformed value stocks in the large-cap space, and health care delivered the best return among the index’s sectors.
| 1 | The S&P 500 Index consists of 500 stocks chosen for market size, liquidity, and industry group representation. It is a market-value-weighted index with each stock’s weight in the index proportionate to its market value. You cannot invest directly in an index. |
| 2 | The Russell 2000® Index measures the performance of the 2,000 smallest companies in the Russell 3000® Index, which represents approximately 8% of the total market capitalization of the Russell 3000 Index. You cannot invest directly in an index. |
Table of Contents
| Letter to shareholders (unaudited) | Wells Fargo Advantage VT Omega Growth Fund | 3 |
Small-cap stocks solidly outperformed large caps for the period, with the Russell 2000® Index2 gaining 4.75%. Smaller-cap stocks often have an advantage when the U.S. dollar strengthens, as it did during the reporting period. Because larger companies tend to be globally diversified, a stronger dollar can dampen their earnings growth; smaller companies often have more of a domestic focus and thus are less likely to face currency-related headwinds. Small-cap growth stocks significantly outperformed small-cap value stocks, with the information technology sector delivering the highest returns.
Don’t let short-term uncertainty derail long-term investment goals.
Periods of uncertainty can present challenges, but experience has taught us that maintaining long-term investment goals can be an effective way to plan for the future. To help you create a sound strategy based on your personal goals and risk tolerance, Wells Fargo Advantage Funds offers more than 100 mutual funds and other investments spanning a wide range of asset classes and investment styles. Although diversification cannot guarantee an investment profit or prevent losses, we believe it can be an effective way to manage investment risk and potentially smooth out overall portfolio performance. We encourage investors to know their investments and to understand that appropriate levels of risk-taking may unlock opportunities.
Thank you for choosing to invest with Wells Fargo Advantage Funds. We appreciate your confidence in us and remain committed to helping you meet your financial needs.
Sincerely,

Karla M. Rabusch
President
Wells Fargo Advantage Funds
Smaller-cap stocks often have an advantage when the U.S. dollar strengthens, as it did during the reporting period.
Notice to shareholders
At a meeting held on August 11–12, 2015, the Board of Trustees of the Fund approved a change in the name of the Fund whereby the word “Advantage” will be removed from its name, effective December 15, 2015.
For current information about your fund investments, contact your investment professional, visit our website at wellsfargoadvantagefunds.com, or call us directly at 1-800-222-8222. We are available 24 hours a day, 7 days a week.
Table of Contents
| 4 | Wells Fargo Advantage VT Omega Growth Fund | Performance highlights (unaudited) |
Investment objective
The Fund seeks long-term capital appreciation.
Adviser
Wells Fargo Funds Management, LLC
Subadviser
Wells Capital Management Incorporated
Portfolio managers
Thomas J. Pence, CFA
Michael T. Smith, CFA
Average annual total returns (%) as of June 30, 2015
| Expense ratios1 (%) | ||||||||||||||||||||||
| Inception date | 1 year | 5 year | 10 year | Gross | Net2 | |||||||||||||||||
| Class 1 | 3-6-1997 | 5.59 | 17.74 | 10.77 | 0.75 | 0.75 | ||||||||||||||||
| Class 2 | 7-31-2002 | 5.38 | 17.45 | 10.49 | 1.00 | 1.00 | ||||||||||||||||
| Russell 3000® Growth Index3 | – | 10.69 | 18.64 | 9.17 | – | – | ||||||||||||||||
Figures quoted represent past performance, which is no guarantee of future results and do not reflect the deduction of taxes that a shareholder may pay on fund distributions or the redemption of fund shares. Investment return and principal value of an investment will fluctuate so that an investor’s shares, when redeemed, may be worth more or less than their original cost. Current performance may be lower or higher than the performance data quoted, which assumes the reinvestment of dividends and capital gains. Current month-end performance is available by calling 1-800-222-8222. Performance figures of the Fund do not reflect fees charged pursuant to the terms of variable life insurance policies and variable annuity contracts. If fees had been reflected, performance would have been lower.
Index returns do not include transaction costs associated with buying and selling securities, any mutual fund fees or expenses, or any taxes. It is not possible to invest directly in an index.
Stock values fluctuate in response to the activities of individual companies and general market and economic conditions. Certain investment strategies tend to increase the total risk of an investment (relative to the broader market). The Fund is exposed to smaller-company securities risk. Consult the Fund’s prospectus for additional information on these and other risks.
Please refer to the prospectus provided by your participating insurance company for detailed information describing the separate accounts for information regarding surrender charges, mortality and expense risk fees, and other charges that may be assessed by the participating insurance companies.
Please see footnotes on page 5.
Table of Contents
| Performance highlights (unaudited) | Wells Fargo Advantage VT Omega Growth Fund | 5 |
| Ten largest holdings4 (%) as of June 30, 2015 | ||||
Apple Incorporated | 6.86 | |||
Amazon.com Incorporated | 2.95 | |||
Facebook Incorporated Class A | 2.93 | |||
Visa Incorporated Class A | 2.50 | |||
The Home Depot Incorporated | 2.26 | |||
Biogen IDEC Incorporated | 2.22 | |||
ServiceMaster Global Holdings Incorporated | 2.21 | |||
McGraw Hill Financial Incorporated | 2.18 | |||
Liberty Global plc Class C | 2.02 | |||
SEI Investments Company | 1.99 | |||
| Sector distribution5 as of June 30, 2015 |
 |
| 1 | Reflects the expense ratios as stated in the most recent prospectuses. The expense ratios shown are subject to change and may differ from the annualized expense ratios shown in the financial highlights of this report. |
| 2 | The Adviser has contractually committed through April 30, 2016, to waive fees and/or reimburse expenses to the extent necessary to cap the Fund’s Total Annual Fund Operating Expenses After Fee Waiver at the amounts shown. After this time, the cap may be increased or the commitment to maintain the cap may be terminated only with the approval of the Board of Trustees. Brokerage commissions, stamp duty fees, interest, taxes, acquired fund fees and expenses, and extraordinary expenses are excluded from the cap. Without this cap, the Fund’s returns would have been lower. |
| 3 | The Russell 3000® Growth Index measures the performance of those Russell 3000 Index companies with higher price-to-book ratios and higher forecasted growth values. The stocks in this index are also members of either the Russell 1000® Growth Index or the Russell 2000® Growth Index. You cannot invest directly in an index. |
| 4 | The ten largest holdings, excluding cash and cash equivalents, are calculated based on the value of the investments divided by total net assets of the Fund. Holdings are subject to change and may have changed since the date specified. |
| 5 | Amounts are calculated based on the total long-term investments of the Fund. These amounts are subject to change and may have changed since the date specified. |
Table of Contents
| 6 | Wells Fargo Advantage VT Omega Growth Fund | Fund expenses (unaudited) |
As a shareholder of the Fund, you incur ongoing costs, including management fees, distribution (12b-1) fees, and other Fund expenses. This example is intended to help you understand your ongoing costs (in dollars) of investing in the Fund and to compare these costs with the ongoing costs of investing in other mutual funds.
The example is based on an investment of $1,000 invested at the beginning of the six-month period and held for the entire period from January 1, 2015 to June 30, 2015.
Actual expenses
The “Actual” line of the table below provides information about actual account values and actual expenses. You may use the information in this line, together with the amount you invested, to estimate the expenses that you paid over the period. Simply divide your account value by $1,000 (for example, an $8,600 account value divided by $1,000 = 8.6), then multiply the result by the number in the “Actual” line under the heading entitled “Expenses Paid During Period” for your applicable class of shares to estimate the expenses you paid on your account during this period.
Hypothetical example for comparison purposes
The “Hypothetical” line of the table below provides information about hypothetical account values and hypothetical expenses based on the Fund’s actual expense ratio and an assumed rate of return of 5% per year before expenses, which is not the Fund’s actual return. The hypothetical account values and expenses may not be used to estimate the actual ending account balance or expenses you paid for the period. You may use this information to compare the ongoing costs of investing in the Fund and other funds. To do so, compare this 5% hypothetical example with the 5% hypothetical examples that appear in the shareholder reports of the other funds.
Please note that the expenses shown in the table are meant to highlight your ongoing costs only and do not reflect any separate account charges assessed by participating insurance companies. Therefore, the “Hypothetical” line of the table is useful in comparing ongoing costs only, and will not help you determine the relative total costs of owning different funds. In addition, if these separate account charges assessed by participating insurance companies were included, your costs would have been higher.
Beginning account value 1-1-2015 | Ending account value 6-30-2015 | Expenses paid during | Net annualized expense ratio | |||||||||||||
Class 1 | ||||||||||||||||
Actual | $ | 1,000.00 | $ | 1,035.18 | $ | 3.78 | 0.75 | % | ||||||||
Hypothetical (5% return before expenses) | $ | 1,000.00 | $ | 1,021.08 | $ | 3.76 | 0.75 | % | ||||||||
Class 2 | ||||||||||||||||
Actual | $ | 1,000.00 | $ | 1,033.84 | $ | 5.04 | 1.00 | % | ||||||||
Hypothetical (5% return before expenses) | $ | 1,000.00 | $ | 1,019.84 | $ | 5.01 | 1.00 | % | ||||||||
| 1 | Expenses paid is equal to the annualized expense ratio of each class multiplied by the average account value over the period, multiplied by the number of days in the most recent fiscal half-year divided by the number of days in the fiscal year (to reflect the one-half year period). |
Table of Contents
| Portfolio of investments—June 30, 2015 (unaudited) | Wells Fargo Advantage VT Omega Growth Fund | 7 |
| Security name | Shares | Value | ||||||||||
Common Stocks: 97.69% | ||||||||||||
Consumer Discretionary: 20.47% | ||||||||||||
| Auto Components: 1.48% | ||||||||||||
Delphi Automotive plc | 17,330 | $ | 1,474,610 | |||||||||
|
| |||||||||||
| Diversified Consumer Services: 2.21% | ||||||||||||
ServiceMaster Global Holdings Incorporated † | 60,777 | 2,198,304 | ||||||||||
|
| |||||||||||
| Hotels, Restaurants & Leisure: 1.64% | ||||||||||||
Hilton Worldwide Holdings Incorporated † | 59,375 | 1,635,781 | ||||||||||
|
| |||||||||||
| Household Durables: 2.26% | ||||||||||||
Harman International Industries Incorporated | 8,800 | 1,046,672 | ||||||||||
Jarden Corporation † | 23,300 | 1,205,775 | ||||||||||
| 2,252,447 | ||||||||||||
|
| |||||||||||
| Internet & Catalog Retail: 2.95% | ||||||||||||
Amazon.com Incorporated † | 6,750 | 2,930,108 | ||||||||||
|
| |||||||||||
| Media: 4.95% | ||||||||||||
Cinemark Holdings Incorporated | 31,699 | 1,273,349 | ||||||||||
Liberty Global plc Class C | 39,622 | 2,006,062 | ||||||||||
Time Warner Incorporated | 18,800 | 1,643,308 | ||||||||||
| 4,922,719 | ||||||||||||
|
| |||||||||||
| Specialty Retail: 2.26% | ||||||||||||
The Home Depot Incorporated | 20,200 | 2,244,826 | ||||||||||
|
| |||||||||||
| Textiles, Apparel & Luxury Goods: 2.72% | ||||||||||||
Carter’s Incorporated | 12,500 | 1,328,750 | ||||||||||
Under Armour Incorporated Class A † | 16,460 | 1,373,422 | ||||||||||
| 2,702,172 | ||||||||||||
|
| |||||||||||
Consumer Staples: 1.70% | ||||||||||||
| Beverages: 1.43% | ||||||||||||
Constellation Brands Incorporated Class A | 12,260 | 1,422,405 | ||||||||||
|
| |||||||||||
| Food & Staples Retailing: 0.27% | ||||||||||||
Sprouts Farmers Market Incorporated † | 10,001 | 269,827 | ||||||||||
|
| |||||||||||
Energy: 0.91% | ||||||||||||
| Oil, Gas & Consumable Fuels: 0.91% | ||||||||||||
Cheniere Energy Incorporated † | 13,100 | 907,306 | ||||||||||
|
| |||||||||||
Financials: 10.87% | ||||||||||||
| Capital Markets: 5.13% | ||||||||||||
Affiliated Managers Group Incorporated † | 7,339 | 1,604,305 | ||||||||||
Raymond James Financial Incorporated | 25,631 | 1,527,095 | ||||||||||
SEI Investments Company | 40,300 | 1,975,909 | ||||||||||
| 5,107,309 | ||||||||||||
|
| |||||||||||
The accompanying notes are an integral part of these financial statements.
Table of Contents
| 8 | Wells Fargo Advantage VT Omega Growth Fund | Portfolio of investments—June 30, 2015 (unaudited) |
| Security name | Shares | Value | ||||||||||
| Diversified Financial Services: 3.51% | ||||||||||||
Intercontinental Exchange Incorporated | 5,900 | $ | 1,319,299 | |||||||||
McGraw Hill Financial Incorporated | 21,600 | 2,169,720 | ||||||||||
| 3,489,019 | ||||||||||||
|
| |||||||||||
| Real Estate Management & Development: 1.89% | ||||||||||||
CBRE Group Incorporated Class A † | 35,200 | 1,302,400 | ||||||||||
The Howard Hughes Corporation † | 4,000 | 574,160 | ||||||||||
| 1,876,560 | ||||||||||||
|
| |||||||||||
| REITs: 0.34% | ||||||||||||
Bluerock Residential Growth REIT Incorporated | 26,627 | 337,098 | ||||||||||
|
| |||||||||||
Health Care: 20.70% | ||||||||||||
| Biotechnology: 7.26% | ||||||||||||
Biogen IDEC Incorporated † | 5,470 | 2,209,552 | ||||||||||
Celgene Corporation † | 15,466 | 1,789,958 | ||||||||||
Gilead Sciences Incorporated | 9,843 | 1,152,418 | ||||||||||
Medivation Incorporated † | 9,700 | 1,107,740 | ||||||||||
Vertex Pharmaceuticals Incorporated † | 7,800 | 963,144 | ||||||||||
| 7,222,812 | ||||||||||||
|
| |||||||||||
| Health Care Equipment & Supplies: 1.02% | ||||||||||||
Alere Incorporated † | 7,226 | 381,172 | ||||||||||
Align Technology Incorporated † | 10,130 | 635,252 | ||||||||||
| 1,016,424 | ||||||||||||
|
| |||||||||||
| Health Care Providers & Services: 4.62% | ||||||||||||
Community Health Systems Incorporated † | 22,800 | 1,435,716 | ||||||||||
Envision Healthcare Holdings Incorporated † | 35,351 | 1,395,657 | ||||||||||
McKesson Corporation | 7,860 | 1,767,007 | ||||||||||
| 4,598,380 | ||||||||||||
|
| |||||||||||
| Pharmaceuticals: 7.80% | ||||||||||||
Bristol-Myers Squibb Company | 21,910 | 1,457,891 | ||||||||||
Catalent Incorporated † | 28,063 | 823,088 | ||||||||||
Eli Lilly & Company | 9,000 | 751,410 | ||||||||||
Endo International plc † | 17,900 | 1,425,735 | ||||||||||
Perrigo Company plc | 2,800 | 517,524 | ||||||||||
Shire plc ADR | 5,200 | 1,255,748 | ||||||||||
Zoetis Incorporated | 31,600 | 1,523,752 | ||||||||||
| 7,755,148 | ||||||||||||
|
| |||||||||||
Industrials: 7.50% | ||||||||||||
| Airlines: 0.98% | ||||||||||||
Delta Air Lines Incorporated | 23,690 | 973,185 | ||||||||||
|
| |||||||||||
| Industrial Conglomerates: 1.77% | ||||||||||||
Carlisle Companies Incorporated | 17,600 | 1,762,112 | ||||||||||
|
| |||||||||||
The accompanying notes are an integral part of these financial statements.
Table of Contents
| Portfolio of investments—June 30, 2015 (unaudited) | Wells Fargo Advantage VT Omega Growth Fund | 9 |
| Security name | Shares | Value | ||||||||||
| Machinery: 1.63% | ||||||||||||
Proto Labs Incorporated † | 7,438 | $ | 501,916 | |||||||||
Wabtec Corporation | 11,900 | 1,121,456 | ||||||||||
| 1,623,372 | ||||||||||||
|
| |||||||||||
| Road & Rail: 3.12% | ||||||||||||
Old Dominion Freight Line Incorporated † | 20,000 | 1,372,100 | ||||||||||
Union Pacific Corporation | 18,200 | 1,735,734 | ||||||||||
| 3,107,834 | ||||||||||||
|
| |||||||||||
Information Technology: 30.34% | ||||||||||||
| Communications Equipment: 1.11% | ||||||||||||
Palo Alto Networks Incorporated † | 6,348 | 1,108,996 | ||||||||||
|
| |||||||||||
| Electronic Equipment, Instruments & Components: 2.40% | ||||||||||||
Cognex Corporation | 24,400 | 1,173,640 | ||||||||||
TE Connectivity Limited | 18,800 | 1,208,840 | ||||||||||
| 2,382,480 | ||||||||||||
|
| |||||||||||
| Internet Software & Services: 8.47% | ||||||||||||
Akamai Technologies Incorporated † | 23,000 | 1,605,860 | ||||||||||
Facebook Incorporated Class A † | 34,005 | 2,916,439 | ||||||||||
Google Incorporated Class A † | 2,780 | 1,501,311 | ||||||||||
Google Incorporated Class C † | 3,189 | 1,659,906 | ||||||||||
LinkedIn Corporation Class A † | 3,600 | 743,868 | ||||||||||
| 8,427,384 | ||||||||||||
|
| |||||||||||
| IT Services: 5.83% | ||||||||||||
Alliance Data Systems Corporation † | 5,900 | 1,722,446 | ||||||||||
EPAM Systems Incorporated † | 8,000 | 569,840 | ||||||||||
Vantiv Incorporated Class A † | 26,618 | 1,016,541 | ||||||||||
Visa Incorporated Class A | 37,044 | 2,487,505 | ||||||||||
| 5,796,332 | ||||||||||||
|
| |||||||||||
| Software: 5.67% | ||||||||||||
CyberArk Software Limited † | 10,600 | 665,892 | ||||||||||
Mobileye NV †« | 11,700 | 622,089 | ||||||||||
Salesforce.com Incorporated † | 6,700 | 466,521 | ||||||||||
ServiceNow Incorporated † | 14,080 | 1,046,285 | ||||||||||
Splunk Incorporated † | 11,900 | 828,478 | ||||||||||
Tableau Software Incorporated Class A † | 9,300 | 1,072,290 | ||||||||||
Workday Incorporated Class A † | 12,290 | 938,833 | ||||||||||
| 5,640,388 | ||||||||||||
|
| |||||||||||
| Technology Hardware, Storage & Peripherals: 6.86% | ||||||||||||
Apple Incorporated | 54,420 | 6,825,629 | ||||||||||
|
| |||||||||||
Materials: 2.54% | ||||||||||||
| Chemicals: 1.55% | ||||||||||||
Axalta Coating Systems Limited † | 46,600 | 1,541,528 | ||||||||||
|
| |||||||||||
The accompanying notes are an integral part of these financial statements.
Table of Contents
| 10 | Wells Fargo Advantage VT Omega Growth Fund | Portfolio of investments—June 30, 2015 (unaudited) |
| Security name | Shares | Value | ||||||||||||
| Construction Materials: 0.99% | ||||||||||||||
Vulcan Materials Company | 11,800 | $ | 990,374 | |||||||||||
|
| |||||||||||||
Telecommunication Services: 2.66% | ||||||||||||||
| Diversified Telecommunication Services: 1.11% | ||||||||||||||
Level 3 Communications Incorporated † | 21,000 | 1,106,070 | ||||||||||||
|
| |||||||||||||
| Wireless Telecommunication Services: 1.55% | ||||||||||||||
SBA Communications Corporation Class A † | 13,360 | 1,535,999 | ||||||||||||
|
| |||||||||||||
Total Common Stocks (Cost $75,193,502) | 97,184,938 | |||||||||||||
|
| |||||||||||||
| Yield | ||||||||||||||
| Short-Term Investments: 2.65% | ||||||||||||||
| Investment Companies: 2.65% | ||||||||||||||
Securities Lending Cash Investments, LLC (l)(r)(u) | 0.13 | % | 599,400 | 599,400 | ||||||||||
Wells Fargo Advantage Cash Investment Money Market Fund, Select Class (l)(u) | 0.12 | 2,038,185 | 2,038,185 | |||||||||||
Total Short-Term Investments (Cost $2,637,585) | 2,637,585 | |||||||||||||
|
| |||||||||||||
| Total investments in securities (Cost $77,831,087) * | 100.34 | % | 99,822,523 | |||||
Other assets and liabilities, net | (0.34 | ) | (341,548 | ) | ||||
|
|
|
| |||||
| Total net assets | 100.00 | % | $ | 99,480,975 | ||||
|
|
|
|
| † | Non-income-earning security |
| « | All or a portion of this security is on loan. |
| (l) | The security represents an affiliate of the Fund as defined in the Investment Company Act of 1940. |
| (r) | The investment is a non-registered investment vehicle purchased with cash collateral received from securities on loan. |
| (u) | The rate represents the 7-day annualized yield at period end. |
| * | Cost for federal income tax purposes is $77,919,542 and unrealized gains (losses) consists of: |
Gross unrealized gains | $ | 23,353,004 | ||
Gross unrealized losses | (1,450,023 | ) | ||
|
| |||
Net unrealized gains | $ | 21,902,981 |
The accompanying notes are an integral part of these financial statements.
Table of Contents
| Statement of assets and liabilities—June 30, 2015 (unaudited) | Wells Fargo Advantage VT Omega Growth Fund | 11 |
Assets | ||||
Investments | ||||
In unaffiliated securities (including $586,968 of securities loaned), at value (cost $75,193,502) | $ | 97,184,938 | ||
In affiliated securities, at value (cost $2,637,585) | 2,637,585 | |||
|
| |||
Total investments, at value (cost $77,831,087) | 99,822,523 | |||
Receivable for investments sold | 2,857,223 | |||
Receivable for Fund shares sold | 18,619 | |||
Receivable for dividends | 10,617 | |||
Receivable for securities lending income | 870 | |||
Prepaid expenses and other assets | 1,154 | |||
|
| |||
Total assets | 102,711,006 | |||
|
| |||
Liabilities | ||||
Payable for investments purchased | 2,355,030 | |||
Payable for Fund shares redeemed | 176,489 | |||
Payable upon receipt of securities loaned | 599,400 | |||
Advisory fee payable | 41,947 | |||
Distribution fee payable | 11,579 | |||
Administration fees payable | 10,907 | |||
Accrued expenses and other liabilities | 34,679 | |||
|
| |||
Total liabilities | 3,230,031 | |||
|
| |||
Total net assets | $ | 99,480,975 | ||
|
| |||
NET ASSETS CONSIST OF | ||||
Paid-in capital | $ | 60,451,340 | ||
Accumulated net investment loss | (135,244 | ) | ||
Accumulated net realized gains on investments | 17,173,443 | |||
Net unrealized gains on investments | 21,991,436 | |||
|
| |||
Total net assets | $ | 99,480,975 | ||
|
| |||
COMPUTATION OF NET ASSET VALUE PER SHARE | ||||
Net assets – Class 1 | $ | 44,627,294 | ||
Shares outstanding – Class 11 | 1,563,538 | |||
Net asset value per share – Class 1 | $28.54 | |||
Net assets – Class 2 | $ | 54,853,681 | ||
Shares outstanding – Class 21 | 1,973,461 | |||
Net asset value per share – Class 2 | $27.80 | |||
| 1 | The Fund has an unlimited number of authorized shares. |
The accompanying notes are an integral part of these financial statements.
Table of Contents
| 12 | Wells Fargo Advantage VT Omega Growth Fund | Statement of operations—six months ended June 30, 2015 (unaudited) |
Investment income | ||||
Dividends | $ | 311,858 | ||
Securities lending income, net | 9,912 | |||
Income from affiliated securities | 469 | |||
|
| |||
Total investment income | 322,239 | |||
|
| |||
Expenses | ||||
Advisory fee | 281,860 | |||
Administration fees | ||||
Fund level | 25,624 | |||
Class 1 | 18,225 | |||
Class 2 | 22,773 | |||
Distribution fee | ||||
Class 2 | 71,164 | |||
Custody and accounting fees | 10,491 | |||
Professional fees | 24,352 | |||
Shareholder report expenses | 12,790 | |||
Trustees’ fees and expenses | 7,377 | |||
Other fees and expenses | 3,269 | |||
|
| |||
Total expenses | 477,925 | |||
Less: Fee waivers and/or expense reimbursements | (22,406 | ) | ||
|
| |||
Net expenses | 455,519 | |||
|
| |||
Net investment loss | (133,280 | ) | ||
|
| |||
REALIZED AND UNREALIZED GAINS (LOSSES) ON INVESTMENTS | ||||
Net realized gains on investments | 4,748,239 | |||
Net change in unrealized gains (losses) on investments | (1,035,953 | ) | ||
|
| |||
Net realized and unrealized gains (losses) on investments | 3,712,286 | |||
|
| |||
Net increase in net assets resulting from operations | $ | 3,579,006 | ||
|
| |||
The accompanying notes are an integral part of these financial statements.
Table of Contents
| Statement of changes in net assets | Wells Fargo Advantage VT Omega Growth Fund | 13 |
Six months ended June 30, 2015 (unaudited) | Year ended December 31, 2014 | |||||||||||||||
Operations | ||||||||||||||||
Net investment loss | $ | (133,280 | ) | $ | (270,649 | ) | ||||||||||
Net realized gains on investments | 4,748,239 | 18,818,280 | ||||||||||||||
Net change in unrealized gains (losses) on investments | (1,035,953 | ) | (14,397,747 | ) | ||||||||||||
| �� | |||||||||||||||
Net increase in net assets resulting from operations | 3,579,006 | 4,149,884 | ||||||||||||||
|
| |||||||||||||||
Distributions to shareholders from | ||||||||||||||||
Net realized gains | ||||||||||||||||
Class 1 | 0 | (10,058,181 | ) | |||||||||||||
Class 2 | 0 | (12,505,884 | ) | |||||||||||||
|
| |||||||||||||||
Total distributions to shareholders | 0 | (22,564,065 | ) | |||||||||||||
|
| |||||||||||||||
Capital share transactions | Shares | Shares | ||||||||||||||
Proceeds from shares sold | ||||||||||||||||
Class 1 | 38,224 | 1,048,992 | 133,823 | 4,061,419 | ||||||||||||
Class 2 | 78,109 | 2,126,086 | 157,458 | 4,688,183 | ||||||||||||
|
| |||||||||||||||
| 3,175,078 | 8,749,602 | |||||||||||||||
|
| |||||||||||||||
Reinvestment of distributions | ||||||||||||||||
Class 1 | 0 | 0 | 373,632 | 10,058,181 | ||||||||||||
Class 2 | 0 | 0 | 475,870 | 12,505,884 | ||||||||||||
|
| |||||||||||||||
| 0 | 22,564,065 | |||||||||||||||
|
| |||||||||||||||
Payment for shares redeemed | ||||||||||||||||
Class 1 | (186,776 | ) | (5,221,100 | ) | (499,773 | ) | (14,593,587 | ) | ||||||||
Class 2 | (300,420 | ) | (8,297,309 | ) | (570,468 | ) | (16,585,288 | ) | ||||||||
|
| |||||||||||||||
| (13,518,409 | ) | (31,178,875 | ) | |||||||||||||
|
| |||||||||||||||
Net increase (decrease) in net assets resulting from capital share transactions | (10,343,331 | ) | 134,792 | |||||||||||||
|
| |||||||||||||||
Total decrease in net assets | (6,764,325 | ) | (18,279,389 | ) | ||||||||||||
|
| |||||||||||||||
Net assets | ||||||||||||||||
Beginning of period | 106,245,300 | 124,524,689 | ||||||||||||||
|
| |||||||||||||||
End of period | $ | 99,480,975 | $ | 106,245,300 | ||||||||||||
|
| |||||||||||||||
Accumulated net investment loss | $ | (135,244 | ) | $ | (1,964 | ) | ||||||||||
|
| |||||||||||||||
The accompanying notes are an integral part of these financial statements.
Table of Contents
| 14 | Wells Fargo Advantage VT Omega Growth Fund | Financial highlights |
(For a share outstanding throughout each period)
| Six months ended June 30, 2015 (unaudited) | Year ended December 31 | |||||||||||||||||||||||
| CLASS 1 | 2014 | 2013 | 2012 | 2011 | 20101 | |||||||||||||||||||
Net asset value, beginning of period | $27.57 | $32.78 | $25.56 | $22.78 | $24.26 | $20.42 | ||||||||||||||||||
Net investment income (loss) | (0.00 | )2 | (0.03 | ) | (0.01 | ) | 0.11 | (0.06 | ) | 0.03 | ||||||||||||||
Net realized and unrealized gains (losses) on investments | 0.97 | 1.22 | 9.81 | 4.43 | (1.21 | ) | 3.98 | |||||||||||||||||
|
|
|
|
|
|
|
|
|
|
|
| |||||||||||||
Total from investment operations | 0.97 | 1.19 | 9.80 | 4.54 | (1.27 | ) | 4.01 | |||||||||||||||||
Distributions to shareholders from | ||||||||||||||||||||||||
Net investment income | 0.00 | 0.00 | (0.12 | ) | 0.00 | 0.00 | (0.17 | ) | ||||||||||||||||
Net realized gains | 0.00 | (6.40 | ) | (2.46 | ) | (1.76 | ) | (0.21 | ) | 0.00 | ||||||||||||||
|
|
|
|
|
|
|
|
|
|
|
| |||||||||||||
Total distributions to shareholders | 0.00 | (6.40 | ) | (2.58 | ) | (1.76 | ) | (0.21 | ) | (0.17 | ) | |||||||||||||
Net asset value, end of period | $28.54 | $27.57 | $32.78 | $25.56 | $22.78 | $24.26 | ||||||||||||||||||
Total return3 | 3.52 | % | 4.09 | % | 40.22 | % | 20.76 | % | (5.36 | )% | 19.79 | % | ||||||||||||
Ratios to average net assets (annualized) | ||||||||||||||||||||||||
Gross expenses | 0.79 | % | 0.75 | % | 0.79 | % | 0.80 | % | 0.80 | % | 0.75 | % | ||||||||||||
Net expenses | 0.75 | % | 0.75 | % | 0.75 | % | 0.75 | % | 0.75 | % | 0.74 | % | ||||||||||||
Net investment income (loss) | (0.12 | )% | (0.10 | )% | (0.12 | )% | 0.40 | % | (0.27 | )% | 0.01 | % | ||||||||||||
Supplemental data | ||||||||||||||||||||||||
Portfolio turnover rate | 51 | % | 88 | % | 95 | % | 93 | % | 110 | % | 160 | % | ||||||||||||
Net assets, end of period (000s omitted) | $44,627 | $47,210 | $55,867 | $47,842 | $45,293 | $54,246 | ||||||||||||||||||
| 1 | After the close of business on July 16, 2010, the Fund acquired the net assets of Evergreen VA Omega Fund and Wells Fargo Advantage VT Large Company Growth Fund. Evergreen VA Omega Fund became the accounting and performance survivor in the transaction. The information for the period prior to July 19, 2010 is that of Class 1 of Evergreen VA Omega Fund. |
| 2 | Amount is less than $0.005. |
| 3 | Returns for periods of less than one year are not annualized. |
The accompanying notes are an integral part of these financial statements.
Table of Contents
| Financial highlights | Wells Fargo Advantage VT Omega Growth Fund | 15 |
(For a share outstanding throughout each period)
| Six months ended June 30, 2015 (unaudited) | Year ended December 31 | |||||||||||||||||||||||
| CLASS 2 | 2014 | 2013 | 2012 | 2011 | 20101 | |||||||||||||||||||
Net asset value, beginning of period | $26.89 | $32.19 | $25.13 | $22.48 | $24.00 | $20.19 | ||||||||||||||||||
Net investment income (loss) | (0.07 | ) | (0.10 | ) | (0.12 | ) | 0.02 | (0.14 | ) | (0.07 | )2 | |||||||||||||
Net realized and unrealized gains (losses) on investments | 0.98 | 1.20 | 9.68 | 4.39 | (1.17 | ) | 3.99 | |||||||||||||||||
|
|
|
|
|
|
|
|
|
|
|
| |||||||||||||
Total from investment operations | 0.91 | 1.10 | 9.56 | 4.41 | (1.31 | ) | 3.92 | |||||||||||||||||
Distributions to shareholders from | ||||||||||||||||||||||||
Net investment income | 0.00 | 0.00 | (0.04 | ) | 0.00 | 0.00 | (0.11 | ) | ||||||||||||||||
Net realized gains | 0.00 | (6.40 | ) | (2.46 | ) | (1.76 | ) | (0.21 | ) | 0.00 | ||||||||||||||
|
|
|
|
|
|
|
|
|
|
|
| |||||||||||||
Total distributions to shareholders | 0.00 | (6.40 | ) | (2.50 | ) | (1.76 | ) | (0.21 | ) | (0.11 | ) | |||||||||||||
Net asset value, end of period | $27.80 | $26.89 | $32.19 | $25.13 | $22.48 | $24.00 | ||||||||||||||||||
Total return3 | 3.38 | % | 3.86 | % | 39.88 | % | 20.39 | % | (5.54 | )% | 19.48 | % | ||||||||||||
Ratios to average net assets (annualized) | ||||||||||||||||||||||||
Gross expenses | 1.04 | % | 1.00 | % | 1.04 | % | 1.05 | % | 1.05 | % | 1.01 | % | ||||||||||||
Net expenses | 1.00 | % | 1.00 | % | 1.00 | % | 1.00 | % | 1.00 | % | 1.00 | % | ||||||||||||
Net investment income (loss) | (0.37 | )% | (0.35 | )% | (0.37 | )% | 0.12 | % | (0.52 | )% | (0.34 | )% | ||||||||||||
Supplemental data | ||||||||||||||||||||||||
Portfolio turnover rate | 51 | % | 88 | % | 95 | % | 93 | % | 110 | % | 160 | % | ||||||||||||
Net assets, end of period (000s omitted) | $54,854 | $59,035 | $68,658 | $62,599 | $66,756 | $83,224 | ||||||||||||||||||
| 1 | After the close of business on July 16, 2010, the Fund acquired the net assets of Evergreen VA Omega Fund and Wells Fargo Advantage VT Large Company Growth Fund. Evergreen VA Omega Fund became the accounting and performance survivor in the transaction. The information for the period prior to July 19, 2010 is that of Class 2 of Evergreen VA Omega Fund. |
| 2 | Calculated based upon average shares outstanding |
| 3 | Returns for periods of less than one year are not annualized. |
The accompanying notes are an integral part of these financial statements.
Table of Contents
| 16 | Wells Fargo Advantage VT Omega Growth Fund | Notes to financial statements (unaudited) |
1. ORGANIZATION
Wells Fargo Variable Trust (the “Trust”), a Delaware statutory trust organized on March 10, 1999, is an open-end management investment company registered under the Investment Company Act of 1940, as amended (the “1940 Act”). As an investment company, the Trust follows the accounting and reporting guidance in Financial Accounting Standards Board (“FASB”) Accounting Standards Codification Topic 946, Financial Services – Investment Companies. These financial statements report on the Wells Fargo Advantage VT Omega Growth Fund (the “Fund”) which is a diversified series of the Trust.
2. SIGNIFICANT ACCOUNTING POLICIES
The following significant accounting policies, which are consistently followed in the preparation of the financial statements of the Fund, are in conformity with U.S. generally accepted accounting principles which require management to make estimates and assumptions that affect the reported amounts of assets and liabilities, disclosure of contingent assets and liabilities at the date of the financial statements, and the reported amounts of revenues and expenses during the reporting period. Actual results could differ from those estimates.
Securities valuation
All investments are valued each business day as of the close of regular trading on the New York Stock Exchange (generally 4 p.m. Eastern Time).
Equity securities that are listed on a foreign or domestic exchange or market are valued at the official closing price or, if none, the last sales price. If no sale occurs on the primary exchange or market that day, the prior day’s price will be deemed “stale” and a fair value price will be determined in accordance with the Fund’s Valuation Procedures.
Equity securities that are not listed on a foreign or domestic exchange or market, but have a public trading market, are valued at the quoted bid price from an independent broker-dealer that the Management Valuation Team of Wells Fargo Funds Management, LLC (“Funds Management”) has determined is an acceptable source.
Investments in registered open-end investment companies are valued at net asset value. Interests in non-registered investment vehicles that are redeemable at net asset value are fair valued at net asset value when available.
Investments which are not valued using any of the methods discussed above are valued at their fair value, as determined in good faith by the Board of Trustees of the Fund. The Board of Trustees has established a Valuation Committee comprised of the Trustees and has delegated to it the authority to take any actions regarding the valuation of portfolio securities that the Valuation Committee deems necessary or appropriate, including determining the fair value of portfolio securities, unless the determination has been delegated to the Management Valuation Team. The Board of Trustees retains the authority to make or ratify any valuation decisions or approve any changes to the Valuation Procedures as it deems appropriate. On a quarterly basis, the Board of Trustees receives reports on any valuation actions taken by the Valuation Committee or the Management Valuation Team which may include items for ratification.
Valuations of fair valued securities are compared to the next actual sales price when available, or other appropriate market values, to assess the continued appropriateness of the fair valuation methodologies used. These securities are fair valued on a day-to-day basis, taking into consideration changes to appropriate market information and any significant changes to the inputs considered in the valuation process until there is a readily available price provided on an exchange or by an independent pricing service. Valuations received from an independent pricing service or independent broker-dealer quotes are periodically validated by comparisons to most recent trades and valuations provided by other independent pricing services in addition to the review of prices by the adviser and/or subadviser. Unobservable inputs used in determining fair valuations are identified based on the type of security, taking into consideration factors utilized by market participants in valuing the investment, knowledge about the issuer and the current market environment.
Security loans
The Fund may lend its securities from time to time in order to earn additional income in the form of fees or interest on securities received as collateral or the investment of any cash received as collateral. The Fund continues to receive interest or dividends on the securities loaned. The Fund receives collateral in the form of cash or securities with a value at least equal to the value of the securities on loan. The value of the loaned securities is determined at the close of each business day and any additional required collateral is delivered to the Fund on the next business day. In a securities lending transaction, the net asset value of the Fund will be affected by an increase or decrease in the value of the securities loaned and by an increase or decrease in the value of the instrument in which collateral is invested. The amount of securities lending activity undertaken by the Fund fluctuates from time to time. In the event of default or bankruptcy by the borrower, the Fund may be prevented from recovering the loaned securities or gaining access to the collateral or
Table of Contents
| Notes to financial statements (unaudited) | Wells Fargo Advantage VT Omega Growth Fund | 17 |
may experience delays or costs in doing so. In addition, the investment of any cash collateral received may lose all or part of its value. The Fund has the right under the lending agreement to recover the securities from the borrower on demand.
The Fund lends its securities through an unaffiliated securities lending agent. Cash collateral received in connection with its securities lending transactions is invested in Securities Lending Cash Investments, LLC (the “Securities Lending Fund”). The Securities Lending Fund is exempt from registration under Section 3(c)(7) of the 1940 Act and is managed by Funds Management and is subadvised by Wells Capital Management Incorporated (“WellsCap”). Funds Management receives an advisory fee starting at 0.05% and declining to 0.01% as the average daily net assets of the Securities Lending Fund increase. All of the fees received by Funds Management are paid to WellsCap for its services as subadviser. The Securities Lending Fund seeks to provide a positive return compared to the daily Fed Funds Open rate by investing in high-quality, U.S. dollar-denominated short-term money market instruments. Securities Lending Fund investments are fair valued based upon the amortized cost valuation technique. Income earned from investment in the Securities Lending Fund is included in securities lending income on the Statement of Operations.
Security transactions and income recognition
Securities transactions are recorded on a trade date basis. Realized gains or losses are recorded on the basis of identified cost.
Dividend income is recognized on the ex-dividend date.
Distributions to shareholders
Distributions to shareholders from net investment income and net realized gains, if any, are recorded on the ex-dividend date. Such distributions are determined in conformity with federal income tax regulations, which may differ in amount or character from net investment income and realized gains recognized for purposes of U.S. generally accepted accounting principles.
Federal and other taxes
The Fund intends to continue to qualify as a regulated investment company by distributing substantially all of its investment company taxable income and any net realized capital gains (after reduction for capital loss carryforwards) sufficient to relieve it from all, or substantially all, federal income taxes. Accordingly, no provision for federal income taxes was required.
The Fund’s income and federal excise tax returns and all financial records supporting those returns for the prior three fiscal years are subject to examination by the federal and Delaware revenue authorities. Management has analyzed the Fund’s tax positions taken on federal, state, and foreign tax returns for all open tax years and does not believe that there are any uncertain tax positions that require recognition of a tax liability.
As of December 31, 2014, capital loss carryforwards available to offset future net realized capital gains were as follows through the indicated expiration dates:
| 2015 | 2016 | 2017 | ||
| $982,505 | $2,303,740 | $771,379 |
Class allocations
The separate classes of shares offered by the Fund differ principally in distribution fees. Class specific expenses are charged directly to that share class. Investment income, common expenses and realized and unrealized gains (losses) on investments are allocated daily to each class of shares based on the relative proportion of net assets of each class.
3. FAIR VALUATION MEASUREMENTS
Fair value measurements of investments are determined within a framework that has established a fair value hierarchy based upon the various data inputs utilized in determining the value of the Fund’s investments. The three-level hierarchy gives the highest priority to unadjusted quoted prices in active markets for identical assets or liabilities (Level 1) and the lowest priority to significant unobservable inputs (Level 3). The Fund’s investments are classified within the fair value hierarchy based on the lowest level of input that is significant to the fair value measurement. The inputs are summarized into three broad levels as follows:
| n | Level 1 – quoted prices in active markets for identical securities |
| n | Level 2 – other significant observable inputs (including quoted prices for similar securities, interest rates, prepayment speeds, credit risk, use of amortized cost, etc.) |
| n | Level 3 – significant unobservable inputs (including the Fund’s own assumptions in determining the fair value of investments) |
Table of Contents
| 18 | Wells Fargo Advantage VT Omega Growth Fund | Notes to financial statements (unaudited) |
The inputs or methodologies used for valuing investments in securities are not necessarily an indication of the risk associated with investing in those securities.
The following is a summary of the inputs used in valuing the Fund’s assets and liabilities as of June 30, 2015:
| Quoted prices (Level 1) | Other significant observable inputs (Level 2) | Significant unobservable inputs (Level 3) | Total | |||||||||||||
Assets | ||||||||||||||||
Investments in: | ||||||||||||||||
Common stocks | ||||||||||||||||
Consumer discretionary | $ | 20,360,967 | $ | 0 | $ | 0 | $ | 20,360,967 | ||||||||
Consumer staples | 1,692,232 | 0 | 0 | 1,692,232 | ||||||||||||
Energy | 907,306 | 0 | 0 | 907,306 | ||||||||||||
Financials | 10,809,986 | 0 | 0 | 10,809,986 | ||||||||||||
Health care | 20,592,764 | 0 | 0 | 20,592,764 | ||||||||||||
Industrials | 7,466,503 | 0 | 0 | 7,466,503 | ||||||||||||
Information technology | 30,181,209 | 0 | 0 | 30,181,209 | ||||||||||||
Materials | 2,531,902 | 0 | 0 | 2,531,902 | ||||||||||||
Telecommunication services | 2,642,069 | 0 | 0 | 2,642,069 | ||||||||||||
Short-term investments | ||||||||||||||||
Investment companies | 2,038,185 | 599,400 | 0 | 2,637,585 | ||||||||||||
Total assets | $ | 99,223,123 | $ | 599,400 | $ | 0 | $ | 99,822,523 | ||||||||
The Fund recognizes transfers between levels within the fair value hierarchy at the end of the reporting period. At June 30, 2015, the Fund did not have any transfers into/out of Level 1, Level 2, or Level 3.
4. TRANSACTIONS WITH AFFILIATES
Advisory fee
The Trust has entered into an advisory contract with Funds Management, an indirect wholly owned subsidiary of Wells Fargo & Company (“Wells Fargo”). The adviser is responsible for implementing investment policies and guidelines and for supervising the subadviser, who is responsible for day-to-day portfolio management of the Fund.
Pursuant to the contract, Funds Management is entitled to receive an annual advisory fee starting at 0.55% and declining to 0.40% as the average daily net assets of the Fund increase. For the six months ended June 30, 2015, the advisory fee was equivalent to an annual rate of 0.55% of the Fund’s average daily net assets.
Funds Management has retained the services of a subadviser to provide daily portfolio management to the Fund. The fee for subadvisory services is borne by Funds Management. WellsCap, an affiliate of Funds Management and an indirect wholly owned subsidiary of Wells Fargo, is the subadviser to the Fund and is entitled to receive a fee from Funds Management at an annual rate starting at 0.45% and declining to 0.30% as the average daily net assets of the Fund increase.
Administration fees
The Trust has entered into an administration agreement with Funds Management. Under this agreement, for providing administrative services, which includes paying fees and expenses for services provided by the transfer agent, sub-transfer agents, omnibus account servicers and record-keepers, Funds Management is entitled to receive from the Fund an annual fund level administration fee starting at 0.05% and declining to 0.03% as the average daily net assets of the Fund increase and a class level administration fee of 0.08% which is calculated based on the average daily net assets of each class.
Funds Management has contractually waived and/or reimbursed advisory and administration fees to the extent necessary to maintain certain net operating expense ratios for the Fund. Waiver of fees and/or reimbursement of expenses by Funds Management were made first from fund level expenses on a proportionate basis and then from class specific expenses. Funds Management has committed through April 30, 2016 to waive fees and/or reimburse expenses to the extent necessary to cap the Fund’s expenses at 0.75% for Class 1 shares and 1.00% for Class 2 shares. After this time, the cap may be increased or the commitment to maintain the cap may be terminated only with the approval of the Board of Trustees.
Table of Contents
| Notes to financial statements (unaudited) | Wells Fargo Advantage VT Omega Growth Fund | 19 |
Distribution fee
The Trust has adopted a Distribution Plan for Class 2 shares of the Fund pursuant to Rule 12b-1 under the 1940 Act. A distribution fee is charged to Class 2 shares and paid to Wells Fargo Funds Distributor, LLC, the principal underwriter, at an annual rate of 0.25% of the average daily net assets of Class 2.
5. INVESTMENT PORTFOLIO TRANSACTIONS
Purchases and sales of investments, excluding U.S. government obligations (if any) and short-term securities, for the six months ended June 30, 2015 were $52,412,662 and $63,887,870, respectively.
6. BANK BORROWINGS
The Trust and Wells Fargo Funds Trust (excluding the money market funds and certain other funds) are parties to a $150,000,000 revolving credit agreement, whereby the Fund is permitted to use bank borrowings for temporary or emergency purposes, such as to fund shareholder redemption requests. Interest under the credit agreement is charged to the Fund based on a borrowing rate equal to the higher of the Federal Funds rate in effect on that day plus 1.25% or the overnight LIBOR rate in effect on that day plus 1.25%. In addition, an annual commitment fee equal to 0.10% of the unused balance is allocated to each participating fund. For the six months ended June 30, 2015, the Fund paid $77 in commitment fees.
For the six months ended June 30, 2015, there were no borrowings by the Fund under the agreement.
7. CONCENTRATION RISK
Concentration risks result from exposure to a limited number of sectors. A fund that invests a substantial portion of its assets in any sector may be more affected by changes in that sector than would be a fund whose investments are not heavily weighted in any sector.
8. INDEMNIFICATION
Under the Trust’s organizational documents, the officers and Trustees have been granted certain indemnification rights against certain liabilities that may arise out of performance of their duties to the Trust. Additionally, in the normal course of business, the Trust may enter into contracts with service providers that contain a variety of indemnification clauses. The Trust’s maximum exposure under these arrangements is dependent on future claims that may be made against the Fund and, therefore, cannot be estimated.
9. SUBSEQUENT DISTRIBUTIONS
On July 9, 2015, the Fund declared distributions from short-term capital gains and long-term capital gains to shareholders of record on July 8, 2015. The per share amounts payable on July 10, 2015 were as follows:
| Short-term capital gains | Long-term capital gains | |||||||
Class 1 | $ | 0.23251 | $ | 4.52495 | ||||
Class 2 | 0.23251 | 4.52495 | ||||||
These distributions are not reflected in the accompanying financial statements. The final determination of the source of all distributions is subject to change and made after the Fund’s tax year-end.
Table of Contents
| 20 | Wells Fargo Advantage VT Omega Growth Fund | Other information (unaudited) |
PROXY VOTING INFORMATION
A description of the policies and procedures that the Fund uses to determine how to vote proxies relating to portfolio securities is available, upon request, by calling 1-800-222-8222, visiting our website at wellsfargoadvantagefunds.com, or visiting the SEC website at sec.gov. Information regarding how the Fund voted proxies relating to portfolio securities during the most recent 12-month period ended June 30 is available on the Fund’s website at wellsfargoadvantagefunds.com or by visiting the SEC website at sec.gov.
PORTFOLIO HOLDINGS INFORMATION
The complete portfolio holdings for the Fund are publicly available monthly on the Fund’s website (wellsfargoadvantagefunds.com), on a one-month delayed basis. In addition, top ten holdings information (excluding derivative positions) for the Fund is publicly available on the Fund’s website on a monthly, seven-day or more delayed basis. The Fund files its complete schedule of portfolio holdings with the SEC for the first and third quarters of each fiscal year on Form N-Q, which is available by visiting the SEC website at sec.gov. In addition, the Fund’s Form N-Q may be reviewed and copied at the SEC’s Public Reference Room in Washington, DC, and at regional offices in New York City, at 233 Broadway, and in Chicago, at 175 West Jackson Boulevard, Suite 900. Information about the Public Reference Room may be obtained by calling 1-800-SEC-0330.
Table of Contents
| Other information (unaudited) | Wells Fargo Advantage VT Omega Growth Fund | 21 |
BOARD OF TRUSTEES AND OFFICERS
Each of the Trustees and Officers1 listed in the table below acts in identical capacities for each fund in the Wells Fargo Advantage family of funds, which consists of 134 mutual funds comprising the Wells Fargo Funds Trust, Wells Fargo Variable Trust, Wells Fargo Master Trust and four closed-end funds (collectively the “Fund Complex”). This table should be read in conjunction with the Prospectus and the Statement of Additional Information2. The mailing address of each Trustee and Officer is 525 Market Street, 12th Floor, San Francisco, CA 94105. Each Trustee and Officer serves an indefinite term, however, each Trustee serves such term until reaching the mandatory retirement age established by the Trustees.
Independent Trustees
Name and year of birth | Position held and length of service* | Principal occupations during past five years or longer | Other directorships during past five years | |||
| William R. Ebsworth (Born 1957) | Trustee, since 2015** | Retired. From 1984 to 2013, equities analyst, portfolio manager, research director at Fidelity Management and Research Company and retired in 2013 as Chief Investment Officer of Fidelity Strategic Advisers, Inc. in Boston, Tokyo, and Hong Kong where he led a team of investment professionals managing client assets. Prior thereto, Board member of Hong Kong Securities Clearing Co., Hong Kong Options Clearing Corp., the Thailand International Fund, Ltd., Fidelity Investments Life Insurance Company, and Empire Fidelity Investments Life Insurance Company. Mr. Ebsworth is an Adjunct Lecturer, Finance, at Babson College and a Chartered Financial Analyst. | Asset Allocation Trust | |||
| Jane A. Freeman (Born 1953) | Trustee, since 2015** | Retired. From 2012 to 2014 and 1999 to 2008, Chief Financial Officer of Scientific Learning Corporation. From 2008 to 2012, Ms. Freeman provided consulting services related to strategic business projects. Prior to 1999, Portfolio Manager at Rockefeller & Co. and Scudder, Stevens & Clark. Board member of the Harding Loevner Funds from 1996 to 2014, serving as both Lead Independent Director and chair of the Audit Committee. Board member of the Russell Exchange Traded Funds Trust from 2011 to 2012 and the chair of the Audit Committee. Ms. Freeman is a Chartered Financial Analyst (inactive), Chair of Taproot Foundation (non-profit organization) and a Board Member of Ruth Bancroft Garden (non-profit organization). | Asset Allocation Trust | |||
| Peter G. Gordon (Born 1942) | Trustee, since 1998; Chairman, since 2005 | Co-Founder, Retired Chairman, President and CEO of Crystal Geyser Water Company. Trustee Emeritus, Colby College. | Asset Allocation Trust | |||
| Isaiah Harris, Jr. (Born 1952) | Trustee, since 2009 | Retired. Chairman of the Board of CIGNA Corporation since 2009, and Director since 2005. From 2003 to 2011, Director of Deluxe Corporation. Prior thereto, President and CEO of BellSouth Advertising and Publishing Corp. from 2005 to 2007, President and CEO of BellSouth Enterprises from 2004 to 2005 and President of BellSouth Consumer Services from 2000 to 2003. Emeritus member of the Iowa State University Foundation Board of Governors. Emeritus Member of the Advisory Board of Iowa State University School of Business. Advisory Board Member, Palm Harbor Academy. Mr. Harris is a certified public accountant. | CIGNA Corporation; Asset Allocation Trust | |||
| Judith M. Johnson (Born 1949) | Trustee, since 2008; Audit Committee Chairman, since 2008 | Retired. Prior thereto, Chief Executive Officer and Chief Investment Officer of Minneapolis Employees Retirement Fund from 1996 to 2008. Ms. Johnson is an attorney, certified public accountant and a certified managerial accountant. | Asset Allocation Trust | |||
| David F. Larcker (Born 1950) | Trustee, since 2009 | James Irvin Miller Professor of Accounting at the Graduate School of Business, Stanford University, Morgan Stanley Director of the Center for Leadership Development and Research and Senior Faculty of The Rock Center for Corporate Governance since 2006. From 2005 to 2008, Professor of Accounting at the Graduate School of Business, Stanford University. Prior thereto, Ernst & Young Professor of Accounting at The Wharton School, University of Pennsylvania from 1985 to 2005. | Asset Allocation Trust |
Table of Contents
| 22 | Wells Fargo Advantage VT Omega Growth Fund | Other information (unaudited) |
Name and year of birth | Position held and length of service* | Principal occupations during past five years or longer | Other directorships during past five years | |||
| Olivia S. Mitchell (Born 1953) | Trustee, since 2006 | International Foundation of Employee Benefit Plans Professor, Wharton School of the University of Pennsylvania since 1993. Director of Wharton’s Pension Research Council and Boettner Center on Pensions & Retirement Research, and Research Associate at the National Bureau of Economic Research. Previously, Cornell University Professor from 1978 to 1993. | Asset Allocation Trust | |||
| Timothy J. Penny (Born 1951) | Trustee, since 1996 | President and Chief Executive Officer of Southern Minnesota Initiative Foundation, a non-profit organization, since 2007 and Senior Fellow at the Humphrey Institute Policy Forum at the University of Minnesota since 1995. Member of the Board of Trustees of NorthStar Education Finance, Inc., a non-profit organization, since 2007. | Asset Allocation Trust | |||
| Michael S. Scofield (Born 1943) | Trustee, since 2010 | Served on the Investment Company Institute’s Board of Governors and Executive Committee from 2008-2011 as well the Governing Council of the Independent Directors Council from 2006-2011 and the Independent Directors Council Executive Committee from 2008-2011. Chairman of the IDC from 2008-2010. Institutional Investor (Fund Directions) Trustee of Year in 2007. Trustee of the Evergreen Funds complex (and its predecessors) from 1984 to 2010. Chairman of the Evergreen Funds from 2000-2010. Former Trustee of the Mentor Funds. Retired Attorney, Law Offices of Michael S. Scofield. | Asset Allocation Trust | |||
| Donald C. Willeke (Born 1940) | Trustee, since 1996 | Principal of the law firm of Willeke & Daniels. General Counsel of the Minneapolis Employees Retirement Fund from 1984 until its consolidation into the Minnesota Public Employees Retirement Association on June 30, 2010. Director and Vice Chair of The Tree Trust (non-profit corporation). Director of the American Chestnut Foundation (non-profit corporation). | Asset Allocation Trust |
| * | Length of service dates reflect the Trustee’s commencement of service with the Trust’s predecessor entities, where applicable. |
| ** | William R. Ebsworth and Jane A. Freeman each became a Trustee effective January 1, 2015. |
Officers
Name and year of birth | Position held and length of service | Principal occupations during past five years or longer | ||||
| Karla M. Rabusch (Born 1959) | President, since 2003 | Executive Vice President of Wells Fargo Bank, N.A. and President of Wells Fargo Funds Management, LLC since 2003. | ||||
| Jeremy DePalma1 (Born 1974) | Treasurer, since 2012 | Senior Vice President of Wells Fargo Funds Management, LLC since 2009. Senior Vice President of Evergreen Investment Management Company, LLC from 2008 to 2010. Vice President, Evergreen Investment Services, Inc. from 2004 to 2007. Head of the Fund Reporting and Control Team within Fund Administration from 2005 to 2010. | ||||
| C. David Messman (Born 1960) | Secretary, since 2000; Chief Legal Officer, since 2003 | Senior Vice President and Secretary of Wells Fargo Funds Management, LLC since 2001. Assistant General Counsel of Wells Fargo Bank, N.A. since 2013 and Vice President and Managing Counsel of Wells Fargo Bank N.A. from 1996 to 2013. | ||||
| Debra Ann Early (Born 1964) | Chief Compliance Officer, since 2007 | Senior Vice President of Wells Fargo Funds Management, LLC since 2007 and Chief Compliance Officer from 2007 to 2014. Chief Compliance Officer of Parnassus Investments from 2005 to 2007. Chief Financial Officer of Parnassus Investments from 2004 to 2007 and Senior Audit Manager of PricewaterhouseCoopers LLP from 1998 to 2004. | ||||
| David Berardi (Born 1975) | Assistant Treasurer, since 2009 | Vice President of Wells Fargo Funds Management, LLC since 2009. Vice President of Evergreen Investment Management Company, LLC from 2008 to 2010. Assistant Vice President of Evergreen Investment Services, Inc. from 2004 to 2008. Manager of Fund Reporting and Control for Evergreen Investment Management Company, LLC from 2004 to 2010. |
| 1 | Jeremy DePalma acts as Treasurer of 61 funds and Assistant Treasurer of 73 funds in the Fund Complex. |
| 2 | The Statement of Additional Information includes additional information about the Trustees and is available, without charge, upon request, by calling 1-800-222-8222 or by visiting the website at wellsfargoadvantagefunds.com. |
Table of Contents
| Other information (unaudited) | Wells Fargo Advantage VT Omega Growth Fund | 23 |
BOARD CONSIDERATION OF INVESTMENT ADVISORY, INVESTMENT MANAGEMENT AND SUB-ADVISORY AGREEMENTS:
Under the Investment Company Act of 1940 (the “1940 Act”), the Board of Trustees (the “Board”) of Wells Fargo Variable Trust (the “Trust”) must determine annually whether to approve the continuation of the Trust’s investment advisory and sub-advisory agreements. In this regard, at an in-person meeting held on May 19-20, 2015 (the “Meeting”), the Board, all the members of which have no direct or indirect interest in the investment advisory and sub-advisory agreements and are not “interested persons” of the Trust, as defined in the 1940 Act (the “Independent Trustees”), reviewed and approved for Wells Fargo Advantage VT Omega Growth Fund (the “Fund”): (i) an investment advisory agreement (the “Advisory Agreement”) with Wells Fargo Funds Management, LLC (“Funds Management”); (ii) an investment management agreement (the “Management Agreement”) with Funds Management; and (iii) an investment sub-advisory agreement (the “Sub-Advisory Agreement”) with Wells Capital Management Incorporated (the “Sub-Adviser”), an affiliate of Funds Management. The Management Agreement combines the terms of the Advisory Agreement with the terms of the Fund’s Amended and Restated Administration Agreement (the “Administration Agreement”) applicable to Fund-level administrative services. The Advisory Agreement, the Management Agreement and the Sub-Advisory Agreement are collectively referred to as the “Advisory Agreements.”
At the Meeting, the Board considered the factors and reached the conclusions described below relating to the selection of Funds Management and the Sub-Adviser and the approval of the Advisory Agreements. Prior to the Meeting, including at an in-person meeting in March 2015, the Trustees conferred extensively among themselves and with representatives of Funds Management about these matters. Also, the Board has adopted a team-based approach, with each team consisting of a sub-set of Trustees, to assist the full Board in the discharge of its duties in reviewing performance and other matters throughout the year. The Independent Trustees were assisted in their evaluation of the Advisory Agreements by independent legal counsel, from whom they received separate legal advice and with whom they met separately.
In providing information to the Board, Funds Management and the Sub-Adviser were guided by a detailed set of requests for information submitted to them by independent legal counsel on behalf of the Independent Trustees at the start of the Board’s annual contract renewal process earlier in 2015. In considering and approving the Advisory Agreements, the Trustees considered the information they believed relevant, including but not limited to the information discussed below. The Board considered not only the specific information presented in connection with the Meeting, but also the knowledge gained over time through interaction with Funds Management and the Sub-Adviser about various topics. In this regard, the Board reviewed reports of Funds Management at each of its quarterly meetings, which included, among other things, portfolio reviews and performance reports. In addition, the Board and the teams mentioned above confer with portfolio managers at various times throughout the year. The Board did not identify any particular information or consideration that was all-important or controlling, and each individual Trustee may have attributed different weights to various factors.
After its deliberations, the Board unanimously approved the continuation of the Advisory Agreement for the period from June 1, 2015 through June 30, 2015, approved the Management Agreement for the period from July 1, 2015 through May 31, 2016, and approved the continuation of the Sub-Advisory Agreement for a one-year term through May 31, 2016. The Board also determined that the compensation payable to Funds Management and the Sub-Adviser under each of the Advisory Agreements was reasonable. The Board considered the approval of the Advisory Agreements for the Fund as part of its consideration of agreements for funds across the complex, but its approvals were made on a fund-by-fund basis. The following summarizes a number of important, but not necessarily all, factors considered by the Board in support of its approvals.
Nature, extent and quality of services
The Board received and considered various information regarding the nature, extent and quality of services provided to the Fund by Funds Management and the Sub-Adviser under the Advisory Agreements. This information included, among other things, a summary of the background and experience of senior management of Funds Management, and the qualifications, background, tenure and responsibilities of each of the portfolio managers primarily responsible for the day-to-day portfolio management of the Fund. The Board noted that the services to be provided to the Fund pursuant to the Management Agreement combined the advisory services previously provided to the Fund pursuant to the Fund’s Advisory Agreement with the Fund-level administrative services previously provided to the Fund pursuant to the Fund’s Administration Agreement. The Board received a representation from Funds Management that combining these services would not result in any change to the nature or level of services provided by Funds Management to the Fund.
The Board evaluated the ability of Funds Management and the Sub-Adviser to attract and retain qualified investment professionals, including research, advisory and supervisory personnel. The Board further considered the compliance programs and compliance records of Funds Management and the Sub-Adviser. In addition, the Board took into account the full range of services provided to the Fund by Funds Management and its affiliates.
Table of Contents
| 24 | Wells Fargo Advantage VT Omega Growth Fund | Other information (unaudited) |
Fund performance and expenses
The Board considered the performance results for the Fund over various time periods ended March 31, 2015. The Board considered these results in comparison to the performance of funds in a universe that was determined by Lipper Inc. (“Lipper”) to be similar to the Fund (the “Universe”), and in comparison to the Fund’s benchmark index and to other comparative data. Lipper is an independent provider of investment company data. The Board received a description of the methodology used by Lipper to select the mutual funds in the performance Universe. The Board noted that the performance of the Fund (Classes 1 and 2) was lower than the average performance of the Universe for all periods under review except for the ten-year period. The Board also noted that the performance of the Fund was lower than its benchmark, the Russell 3000® Growth Index, for all periods under review except for the ten-year period.
The Board received information concerning, and discussed factors contributing to, the underperformance of the Fund relative to the Universe and benchmark for the periods identified above. The Board took note of the explanations for the relative underperformance in these periods, including with respect to market factors and investment decisions that affected the Fund’s performance, and of longer term outperformance.
The Board also received and considered information regarding the Fund’s net operating expense ratios and their various components, including actual management fees (which reflect fee waivers, if any, and include advisory, administration and transfer agent fees), custodian and other non-management fees, and Rule 12b-1 and non-Rule 12b-1 service fees. The Board considered these ratios in comparison to the median ratios of funds in class-specific expense groups that were determined by Lipper to be similar to the Fund (the “Groups”). The Board received a description of the methodology used by Lipper to select the mutual funds in the expense Groups and an explanation of how funds comprising expense groups and their expense ratios may vary from year-to-year. Based on the Lipper reports, the Board noted that the net operating expense ratios of the Fund were lower than the median net operating expense ratios of the expense Groups.
The Board took into account the Fund performance and expense information provided to it among the factors considered in deciding to re-approve the Advisory Agreement and Sub-Advisory Agreement and approve the Management Agreement.
Investment advisory and sub-advisory fee rates
The Board reviewed and considered the contractual investment advisory fee rates that are payable by the Fund to Funds Management for investment advisory services (the “Advisory Agreement Rates”), both on a stand-alone basis and on a combined basis with the Fund’s fund-level and class-level contractual administration fee rates (the “Management Rates”). The Board noted that the Management Rates include transfer agency and sub-transfer agency costs. The Board also noted that the fee rate to be paid by the Fund under the Management Agreement will incorporate the advisory fee and Fund-level administration fee previously payable separately by the Fund under the Fund’s Advisory Agreement and Administration Agreement with Funds Management. The Board also reviewed and considered the contractual investment sub-advisory fee rates that are payable by Funds Management to the Sub-Adviser for investment sub-advisory services (the “Sub-Advisory Agreement Rates”).
Among other information reviewed by the Board was a comparison of the Management Rates of the Fund with those of other funds in the expense Groups at a common asset level. The Board noted that the Management Rates of the Fund were lower than the average rates for the Fund’s expense Groups for all share classes.
The Board also received and considered information about the portion of the total advisory fee that was retained by Funds Management after payment of the fee to the Sub-Adviser for sub-advisory services. In assessing the reasonableness of this amount, the Board received and evaluated information about the nature and extent of responsibilities retained and risks assumed by Funds Management and not delegated to or assumed by the Sub-Adviser, and about Funds Management’s on-going oversight services. However, given the affiliation between Funds Management and the Sub-Adviser, the Board ascribed limited relevance to the allocation of the advisory fee between them.
The Board also received and considered information about the nature and extent of services offered and fee rates charged by Funds Management and the Sub-Adviser to other types of clients with investment strategies similar to those of the Fund. In this regard, the Board received information about the significantly greater scope of services, and compliance, reporting and other legal burdens and risks of managing mutual funds compared with those associated with managing assets of non-mutual fund clients such as collective funds or institutional separate accounts.
Based on its consideration of the factors and information it deemed relevant, including those described here, the Board determined that the compensation payable to Funds Management under the Management Agreement and Advisory Agreement and to the Sub-Adviser under the Sub-Advisory Agreement was reasonable, in light of the services covered by the Advisory Agreements.
Table of Contents
| Other information (unaudited) | Wells Fargo Advantage VT Omega Growth Fund | 25 |
Profitability
The Board received and considered information concerning the profitability of Funds Management, as well as the profitability of Wells Fargo as a whole, from providing services to the Fund and the fund family as a whole. The Board also received and considered information concerning the profitability of the Sub-Adviser from providing services to the fund family as a whole, noting that the Sub-Adviser’s profitability information with respect to providing services to the Fund was subsumed in the Wells Fargo profitability analysis.
Funds Management reported on the methodologies and estimates used in calculating profitability. Among other things, the Board noted that the levels of profitability reported on a fund-by-fund basis varied widely, depending on factors such as the size and type of fund. Based on its review, the Board did not deem the profits reported by Funds Management or Wells Fargo from its services to the Fund to be at a level that would prevent it from approving the continuation of the Advisory Agreements.
Economies of scale
With respect to possible economies of scale, the Board noted the existence of breakpoints in the Fund’s advisory and management fee structures, and the Fund’s administration fee structure, which operate generally to reduce the Fund’s expense ratios as the Fund grows in size. It considered that, for a small fund or a fund that shrinks in size, breakpoints conversely can result in higher fee levels. The Board also considered that fee waiver and expense reimbursement arrangements and competitive fee rates at the outset are means of sharing potential economies of scale with shareholders of the Fund and the fund family as a whole. The Board considered Funds Management’s view that any analyses of potential economies of scale in managing a particular fund are inherently limited in light of the joint and common costs and investments that Funds Management incurs across the fund family as a whole.
The Board concluded that the Fund’s fee and expense arrangements, including contractual breakpoints, constituted a reasonable approach to sharing potential economies of scale with the Fund and its shareholders.
Other benefits to Funds Management and the Sub-Adviser
The Board received and considered information regarding potential “fall-out” or ancillary benefits received by Funds Management and its affiliates, including the Sub-Adviser, as a result of their relationships with the Fund. Ancillary benefits could include, among others, benefits directly attributable to other relationships with the Fund and benefits potentially derived from an increase in Funds Management’s and the Sub-Adviser’s business as a result of their relationships with the Fund. The Board noted that various affiliates of Funds Management may receive distribution-related fees, shareholder servicing payments and sub-transfer agency fees in respect of shares sold or held through them and services provided.
The Board also reviewed information about soft dollar credits earned and utilized by the Sub-Adviser, fees earned by Funds Management and the Sub-Adviser from managing a private investment vehicle for the fund family’s securities lending collateral and commissions earned by an affiliated broker from portfolio transactions.
Based on its consideration of the factors and information it deemed relevant, including those described here, the Board did not find that any ancillary benefits received by Funds Management and its affiliates, including the Sub-Adviser, were unreasonable.
Conclusion
At the Meeting, after considering the above-described factors and based on its deliberations and its evaluation of the information described above, the Board unanimously approved the continuation of the Advisory Agreement for the period from June 1, 2015 through June 30, 2015, approved the Management Agreement for the period from July 1, 2015 through May 31, 2016, and approved the continuation of the Sub-Advisory Agreement for a one-year term through May 31, 2016. The Board also determined that the compensation payable to Funds Management and the Sub-Adviser under each of the Advisory Agreements was reasonable.
Table of Contents
| 26 | Wells Fargo Advantage VT Omega Growth Fund | List of abbreviations |
The following is a list of common abbreviations for terms and entities that may have appeared in this report.
| ACA | — ACA Financial Guaranty Corporation |
| ADR | — American depositary receipt |
| ADS | — American depositary shares |
| AGC | — Assured Guaranty Corporation |
| AGM | — Assured Guaranty Municipal |
| Ambac | — Ambac Financial Group Incorporated |
| AMT | — Alternative minimum tax |
| AUD | — Australian dollar |
| BAN | — Bond anticipation notes |
| BHAC | — Berkshire Hathaway Assurance Corporation |
| BRL | — Brazilian real |
| CAB | — Capital appreciation bond |
| CAD | — Canadian dollar |
| CCAB | — Convertible capital appreciation bond |
| CDA | — Community Development Authority |
| CDO | — Collateralized debt obligation |
| CHF | — Swiss franc |
| COP | — Columbian Peso |
| CLP | — Chilean peso |
| DKK | — Danish krone |
| DRIVER | — Derivative inverse tax-exempt receipts |
| DW&P | — Department of Water & Power |
| DWR | — Department of Water Resources |
| ECFA | — Educational & Cultural Facilities Authority |
| EDA | — Economic Development Authority |
| EDFA | — Economic Development Finance Authority |
| ETF | — Exchange-traded fund |
| EUR | — Euro |
| FDIC | — Federal Deposit Insurance Corporation |
| FFCB | — Federal Farm Credit Banks |
| FGIC | — Financial Guaranty Insurance Corporation |
| FHA | — Federal Housing Administration |
| FHLB | — Federal Home Loan Bank |
| FHLMC | — Federal Home Loan Mortgage Corporation |
| FICO | — The Financing Corporation |
| FNMA | — Federal National Mortgage Association |
| FSA | — Farm Service Agency |
| GBP | — Great British pound |
| GDR | — Global depositary receipt |
| GNMA | — Government National Mortgage Association |
| GO | — General obligation |
| HCFR | — Healthcare facilities revenue |
| HEFA | — Health & Educational Facilities Authority |
| HEFAR | — Higher education facilities authority revenue |
| HFA | — Housing Finance Authority |
| HFFA | — Health Facilities Financing Authority |
| HKD | — Hong Kong dollar |
| HUD | — Department of Housing and Urban Development |
| HUF | — Hungarian forint |
| IDA | — Industrial Development Authority |
| IDAG | — Industrial Development Agency |
| IDR | — Indonesian rupiah |
| IEP | — Irish pound |
| JPY | — Japanese yen |
| KRW | — Republic of Korea won |
| LIBOR | — London Interbank Offered Rate |
| LIFER | — Long Inverse Floating Exempt Receipts |
| LIQ | — Liquidity agreement |
| LLC | — Limited liability company |
| LLLP | — Limited liability limited partnership |
| LLP | — Limited liability partnership |
| LOC | — Letter of credit |
| LP | — Limited partnership |
| MBIA | — Municipal Bond Insurance Association |
| MFHR | — Multifamily housing revenue |
| MSTR | — Municipal securities trust receipts |
| MTN | — Medium-term note |
| MUD | — Municipal Utility District |
| MXN | — Mexican peso |
| MYR | — Malaysian ringgit |
| National | — National Public Finance Guarantee Corporation |
| NGN | — Nigerian naira |
| NOK | — Norwegian krone |
| NZD | — New Zealand dollar |
| PCFA | — Pollution Control Financing Authority |
| PCL | — Public Company Limited |
| PCR | — Pollution control revenue |
| PFA | — Public Finance Authority |
| PFFA | — Public Facilities Financing Authority |
| PFOTER | — Puttable floating option tax-exempt receipts |
| plc | — Public limited company |
| PLN | — Polish zloty |
| PUTTER | — Puttable tax-exempt receipts |
| R&D | — Research & development |
| Radian | — Radian Asset Assurance |
| RAN | — Revenue anticipation notes |
| RDA | — Redevelopment Authority |
| RDFA | — Redevelopment Finance Authority |
| REIT | — Real estate investment trust |
| ROC | — Reset option certificates |
| RON | — Romanian lei |
| RUB | — Russian ruble |
| SAVRS | — Select auction variable rate securities |
| SBA | — Small Business Authority |
| SDR | — Swedish depositary receipt |
| SEK | — Swedish krona |
| SFHR | — Single-family housing revenue |
| SFMR | — Single-family mortgage revenue |
| SGD | — Singapore dollar |
| SPA | — Standby purchase agreement |
| SPDR | — Standard & Poor’s Depositary Receipts |
| SPEAR | — Short Puttable Exempt Adjustable Receipts |
| STRIPS | — Separate trading of registered interest and |
| principal securities |
| TAN | — Tax anticipation notes |
| TBA | — To be announced |
| THB | — Thai baht |
| TIPS | — Treasury inflation-protected securities |
| TRAN | — Tax revenue anticipation notes |
| TRY | — Turkish lira |
| TTFA | — Transportation Trust Fund Authority |
| TVA | — Tennessee Valley Authority |
| ZAR | — South African rand |
Table of Contents
This page is intentionally left blank.
Table of Contents
This page is intentionally left blank.
Table of Contents


For more information
More information about Wells Fargo Advantage Funds is available free upon request. To obtain literature, please write, email, visit the Fund’s website, or call:
Wells Fargo Advantage Funds
P.O. Box 8266
Boston, MA 02266-8266
Email: wfaf@wellsfargo.com
Website: wellsfargoadvantagefunds.com
Individual investors: 1-800-222-8222
Retail investment professionals: 1-888-877-9275
Institutional investment professionals: 1-866-765-0778
This report and the financial statements contained herein are submitted for the general information of the shareholders of Wells Fargo Advantage Funds. If this report is used for promotional purposes, distribution of the report must be accompanied or preceded by a current prospectus. Before investing, please consider the investment objectives, risks, charges, and expenses of the investment. For a current prospectus and, if available, a summary prospectus, containing this information, call 1-800-222-8222 or visit the Fund’s website at wellsfargoadvantagefunds.com. Read the prospectus carefully before you invest or send money.
Wells Fargo Funds Management, LLC, a wholly owned subsidiary of Wells Fargo & Company, provides investment advisory and administrative services for Wells Fargo Advantage Funds. Other affiliates of Wells Fargo & Company provide subadvisory and other services for the Funds. The Funds are distributed by Wells Fargo Funds Distributor, LLC, Member FINRA/SIPC, an affiliate of Wells Fargo & Company.
NOT FDIC INSURED ¡ NO BANK GUARANTEE ¡ MAY LOSE VALUE
© 2015 Wells Fargo Funds Management, LLC. All rights reserved.
235289 08-15 SVT5/SAR142 06-15 |
Table of Contents

Wells Fargo Advantage VT Opportunity FundSM

Semi-Annual Report
June 30, 2015

Table of Contents
Reduce clutter. Save trees.
Sign up for electronic delivery of prospectuses and shareholder reports at wellsfargo.com/advantagedelivery
| 2 | ||||
| 4 | ||||
| 6 | ||||
| 7 | ||||
Financial statements | ||||
| 12 | ||||
| 13 | ||||
| 14 | ||||
| 15 | ||||
| 17 | ||||
| 21 | ||||
| 27 | ||||
The views expressed and any forward-looking statements are as of June 30, 2015, unless otherwise noted, and are those of the Fund managers and/or Wells Fargo Funds Management, LLC. Discussions of individual securities, or the markets generally, or any Wells Fargo Advantage Fund are not intended as individual recommendations. Future events or results may vary significantly from those expressed in any forward-looking statements; the views expressed are subject to change at any time in response to changing circumstances in the market. Wells Fargo Funds Management, LLC and the Fund disclaim any obligation to publicly update or revise any views expressed or forward-looking statements.
NOT FDIC INSURED ¡ NO BANK GUARANTEE ¡ MAY LOSE VALUE
Table of Contents
| 2 | Wells Fargo Advantage VT Opportunity Fund | Letter to shareholders (unaudited) |

Karla M. Rabusch
President
Wells Fargo Advantage Funds
The period was marked by continued low global interest rates and a slow but steady economic recovery in the U.S.
Smaller-cap stocks often have an advantage when the U.S. dollar strengthens, as it did during the reporting period.
Dear Valued Shareholder:
We are pleased to offer you this semi-annual report for the Wells Fargo Advantage VT Opportunity Fund for the six-month period that ended June 30, 2015. The period was marked by continued low global interest rates and a slow but steady economic recovery in the U.S. However, growing concern as to whether a newly elected anti-austerity government in Greece would default on the country’s debt and remove it from the eurozone resulted in late-period volatility for both U.S. and European stocks.
Major central banks continued to provide liquidity to the markets.
Throughout the reporting period, the Federal Open Market Committee (FOMC), which is the U.S. Federal Reserve’s (Fed’s) monetary policymaking body, kept its key interest rate effectively at zero. As the reporting period progressed, though, various comments by Fed Chair Janet Yellen led investors to believe that the FOMC would raise its key federal funds rate by late 2015. Moreover, the FOMC seemed confident that economic conditions would evolve in a way that it would most likely continue raising rates gradually over time.
In contrast, the European Central Bank (ECB) showed no signs of raising rates at any point in the near future. Rather, the ECB maintained a variety of measures aimed at encouraging lending, including making funds available to banks at low interest rates and imposing a negative interest rate on bank deposits held at the central bank. In January 2015, the bank announced quantitative easing via significant bond purchases in an attempt to raise the eurozone’s inflation to just under its target of 2%. The ECB also provided emergency liquidity to Greek banks while that country’s government negotiated with its creditors, which included the eurozone member states and the International Monetary Fund (IMF).
The prospect of a near-term rate hike in the U.S., combined with continued easing from the ECB and other major central banks, resulted in the U.S. dollar appreciating against a basket of currencies for the six-month reporting period.
Although U.S. economic growth slowed in the first quarter, market participants believed that its recovery remained on track.
Reported U.S. gross domestic product (GDP) growth came in at a solid 2.2% annualized rate in the fourth quarter of 2014. Although the final estimate for annualized GDP growth came in at a modest 0.6% in the first quarter of 2015, the slowdown was attributed to short-term factors such as a harsh winter and a long-lived strike at West Coast ports. The U.S. unemployment rate continued its slow improvement, easing from 5.7% in January 2015 to 5.3% in June.
U.S. stocks generally posted gains for the period, aided by a solid economy. However, uncertainty as to whether Greece would default on a June 30 payment to the IMF resulted in volatility and negative returns in the last month of the reporting period. The S&P 500 Index1, a measure of U.S. large-cap stocks, ended the period with a gain of 1.23%. Growth stocks outperformed value stocks in the large-cap space, and health care delivered the best return among the index’s sectors.
Small-cap stocks solidly outperformed large caps for the period, with the Russell 2000® Index2 gaining 4.75%. Smaller-cap stocks often have an advantage when the U.S. dollar strengthens, as it did during the reporting period. Because larger companies tend to be globally diversified, a stronger dollar can dampen their earnings growth; smaller companies often have more of a domestic focus and thus are less likely to face currency-related headwinds. Small-cap growth stocks significantly outperformed small-cap value stocks, with the information technology sector delivering the highest returns.
| 1 | The S&P 500 Index consists of 500 stocks chosen for market size, liquidity, and industry group representation. It is a market-value-weighted index with each stock’s weight in the index proportionate to its market value. You cannot invest directly in an index. |
| 2 | The Russell 2000® Index measures the performance of the 2,000 smallest companies in the Russell 3000® Index, which represents approximately 8% of the total market capitalization of the Russell 3000 Index. You cannot invest directly in an index. |
Table of Contents
| Letter to shareholders (unaudited) | Wells Fargo Advantage VT Opportunity Fund | 3 |
Don’t let short-term uncertainty derail long-term investment goals.
Periods of uncertainty can present challenges, but experience has taught us that maintaining long-term investment goals can be an effective way to plan for the future. To help you create a sound strategy based on your personal goals and risk tolerance, Wells Fargo Advantage Funds offers more than 100 mutual funds and other investments spanning a wide range of asset classes and investment styles. Although diversification cannot guarantee an investment profit or prevent losses, we believe it can be an effective way to manage investment risk and potentially smooth out overall portfolio performance. We encourage investors to know their investments and to understand that appropriate levels of risk-taking may unlock opportunities.
Thank you for choosing to invest with Wells Fargo Advantage Funds. We appreciate your confidence in us and remain committed to helping you meet your financial needs.
Sincerely,

Karla M. Rabusch
President
Wells Fargo Advantage Funds
Notice to shareholders
At a meeting held on August 11–12, 2015, the Board of Trustees of the Fund approved a change in the name of the Fund whereby the word “Advantage” will be removed from its name, effective December 15, 2015.
For current information about your fund investments, contact your investment professional, visit our website at wellsfargoadvantagefunds.com, or call us directly at 1-800-222-8222. We are available 24 hours a day, 7 days a week.
Table of Contents
| 4 | Wells Fargo Advantage VT Opportunity Fund | Performance highlights (unaudited) |
Investment objective
The Fund seeks long-term capital appreciation.
Adviser
Wells Fargo Funds Management, LLC
Subadviser
Wells Capital Management Incorporated
Portfolio manager
Ann M. Miletti
Average annual total returns1 (%) as of June 30, 2015
| Expense ratios2 (%) | ||||||||||||||||||||||
| Inception date | 1 year | 5 year | 10 year | Gross | Net3 | |||||||||||||||||
| Class 1 | 8-26-2011 | 4.27 | 15.62 | 8.56 | 0.82 | 0.75 | ||||||||||||||||
| Class 2 | 5-8-1992 | 3.99 | 15.39 | 8.45 | 1.07 | 1.00 | ||||||||||||||||
| Russell 3000® Index4 | – | 7.29 | 17.54 | 8.15 | – | – | ||||||||||||||||
Figures quoted represent past performance, which is no guarantee of future results and do not reflect the deduction of taxes that a shareholder may pay on fund distributions or the redemption of fund shares. Investment return and principal value of an investment will fluctuate so that an investor’s shares, when redeemed, may be worth more or less than their original cost. Current performance may be lower or higher than the performance data quoted, which assumes the reinvestment of dividends and capital gains. Current month-end performance is available by calling 1-800-222-8222. Performance figures of the Fund do not reflect fees charged pursuant to the terms of variable life insurance policies and variable annuity contracts. If fees had been reflected, performance would have been lower.
Index returns do not include transaction costs associated with buying and selling securities, any mutual fund fees or expenses, or any taxes. It is not possible to invest directly in an index.
Stock values fluctuate in response to the activities of individual companies and general market and economic conditions.Smaller-company stocks tend to be more volatile and less liquid than those of larger companies. Certain investment strategies tend to increase the total risk of an investment (relative to the broader market). The Fund is exposed to foreign investment risk. Consult the Fund’s prospectus for additional information on these and other risks.
Please refer to the prospectus provided by your participating insurance company for detailed information describing the separate accounts for information regarding surrender charges, mortality and expense risk fees, and other charges that may be assessed by the participating insurance companies.
Please see footnotes on page 5.
Table of Contents
| Performance highlights (unaudited) | Wells Fargo Advantage VT Opportunity Fund | 5 |
| Ten largest holdings5 (%) as of June 30, 2015 | ||||
Apple Incorporated | 2.62 | |||
Medtronic plc | 2.21 | |||
Bio-Rad Laboratories Incorporated Class A | 2.11 | |||
American International Group Incorporated | 2.10 | |||
Google Incorporated Class C | 1.77 | |||
PNC Financial Services Group Incorporated | 1.76 | |||
Citrix Systems Incorporated | 1.71 | |||
Johnson Controls Incorporated | 1.64 | |||
Citigroup Incorporated | 1.63 | |||
Regions Financial Corporation | 1.59 | |||
| Sector distribution6 as of June 30, 2015 |
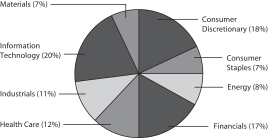 |
| 1 | Historical performance shown for Class 1 shares prior to their inception reflects the performance of Class 2 shares, and includes the higher expenses applicable to Class 2 shares. If these expenses had not been included, returns would be higher. |
| 2 | Reflects the expense ratios as stated in the most recent prospectuses. The expense ratios shown are subject to change and may differ from the annualized expense ratios shown in the financial highlights of this report. |
| 3 | The Adviser has contractually committed through April 30, 2016, to waive fees and/or reimburse expenses to the extent necessary to cap the Fund’s Total Annual Fund Operating Expenses After Fee Waiver at the amounts shown. After this time, the cap may be increased or the commitment to maintain the cap may be terminated only with the approval of the Board of Trustees. Brokerage commissions, stamp duty fees, interest, taxes, acquired fund fees and expenses, and extraordinary expenses are excluded from the cap. Without this cap, the Fund’s returns would have been lower. |
| 4 | The Russell 3000® Index measures the performance of the 3,000 largest U.S. companies based on total market capitalization, which represents approximately 98% of the investable U.S. equity market. You cannot invest directly in an index. |
| 5 | The ten largest holdings, excluding cash and cash equivalents, are calculated based on the value of the investments divided by total net assets of the Fund. Holdings are subject to change and may have changed since the date specified. |
| 6 | Amounts are calculated based on the total long-term investments of the Fund. These amounts are subject to change and may have changed since the date specified. |
Table of Contents
| 6 | Wells Fargo Advantage VT Opportunity Fund | Fund expenses (unaudited) |
As a shareholder of the Fund, you incur ongoing costs, including management fees, distribution (12b-1) fees, and other Fund expenses. This example is intended to help you understand your ongoing costs (in dollars) of investing in the Fund and to compare these costs with the ongoing costs of investing in other mutual funds.
The example is based on an investment of $1,000 invested at the beginning of the six-month period and held for the entire period from January 1, 2015 to June 30, 2015.
Actual expenses
The “Actual” line of the table below provides information about actual account values and actual expenses. You may use the information in this line, together with the amount you invested, to estimate the expenses that you paid over the period. Simply divide your account value by $1,000 (for example, an $8,600 account value divided by $1,000 = 8.6), then multiply the result by the number in the “Actual” line under the heading entitled “Expenses Paid During Period” for your applicable class of shares to estimate the expenses you paid on your account during this period.
Hypothetical example for comparison purposes
The “Hypothetical” line of the table below provides information about hypothetical account values and hypothetical expenses based on the Fund’s actual expense ratio and an assumed rate of return of 5% per year before expenses, which is not the Fund’s actual return. The hypothetical account values and expenses may not be used to estimate the actual ending account balance or expenses you paid for the period. You may use this information to compare the ongoing costs of investing in the Fund and other funds. To do so, compare this 5% hypothetical example with the 5% hypothetical examples that appear in the shareholder reports of the other funds.
Please note that the expenses shown in the table are meant to highlight your ongoing costs only and do not reflect any separate account charges assessed by participating insurance companies. Therefore, the “Hypothetical” line of the table is useful in comparing ongoing costs only, and will not help you determine the relative total costs of owning different funds. In addition, if these separate account charges assessed by participating insurance companies were included, your costs would have been higher.
| Beginning account value 1-1-2015 | Ending account value 6-30-2015 | Expenses paid during the period¹ | Net annualized expense ratio | |||||||||||||
Class 1 | ||||||||||||||||
Actual | $ | 1,000.00 | $ | 1,018.74 | $ | 3.75 | 0.75 | % | ||||||||
Hypothetical (5% return before expenses) | $ | 1,000.00 | $ | 1,021.08 | $ | 3.76 | 0.75 | % | ||||||||
Class 2 | ||||||||||||||||
Actual | $ | 1,000.00 | $ | 1,017.32 | $ | 5.00 | 1.00 | % | ||||||||
Hypothetical (5% return before expenses) | $ | 1,000.00 | $ | 1,019.84 | $ | 5.01 | 1.00 | % | ||||||||
| 1 | Expenses paid is equal to the annualized expense ratio of each class multiplied by the average account value over the period, multiplied by the number of days in the most recent fiscal half-year divided by the number of days in the fiscal year (to reflect the one-half year period). |
Table of Contents
| Portfolio of investments—June 30, 2015 (unaudited) | Wells Fargo Advantage VT Opportunity Fund | 7 |
| Security name | Shares | Value | ||||||||||
Common Stocks: 99.73% | ||||||||||||
Consumer Discretionary: 17.64% | ||||||||||||
| Auto Components: 1.64% | ||||||||||||
Johnson Controls Incorporated | 76,731 | $ | 3,800,486 | |||||||||
|
| |||||||||||
| Diversified Consumer Services: 0.71% | ||||||||||||
Apollo Education Group Incorporated † | 127,314 | 1,639,804 | ||||||||||
|
| |||||||||||
| Hotels, Restaurants & Leisure: 2.74% | ||||||||||||
Carnival Corporation | 70,040 | 3,459,276 | ||||||||||
McDonald’s Corporation | 30,269 | 2,877,674 | ||||||||||
| 6,336,950 | ||||||||||||
|
| |||||||||||
| Household Durables: 1.46% | ||||||||||||
Harman International Industries Incorporated | 28,353 | 3,372,306 | ||||||||||
|
| |||||||||||
| Media: 3.98% | ||||||||||||
Comcast Corporation Class A | 59,438 | 3,562,714 | ||||||||||
Discovery Communications Incorporated Class C † | 99,941 | 3,106,166 | ||||||||||
Omnicom Group Incorporated | 36,384 | 2,528,324 | ||||||||||
| 9,197,204 | ||||||||||||
|
| |||||||||||
| Multiline Retail: 3.82% | ||||||||||||
Macy’s Incorporated | 44,000 | 2,968,680 | ||||||||||
Nordstrom Incorporated | 37,288 | 2,777,956 | ||||||||||
Target Corporation | 37,714 | 3,078,594 | ||||||||||
| 8,825,230 | ||||||||||||
|
| |||||||||||
| Specialty Retail: 2.10% | ||||||||||||
Chico’s FAS Incorporated | 142,797 | 2,374,714 | ||||||||||
Dick’s Sporting Goods Incorporated | 47,709 | 2,469,895 | ||||||||||
| 4,844,609 | ||||||||||||
|
| |||||||||||
| Textiles, Apparel & Luxury Goods: 1.19% | ||||||||||||
Ralph Lauren Corporation | 20,779 | 2,750,308 | ||||||||||
|
| |||||||||||
Consumer Staples: 6.83% | ||||||||||||
| Food & Staples Retailing: 1.10% | ||||||||||||
The Kroger Company | 35,008 | 2,538,430 | ||||||||||
|
| |||||||||||
| Food Products: 3.47% | ||||||||||||
General Mills Incorporated | 44,535 | 2,481,490 | ||||||||||
Mead Johnson Nutrition Company | 30,541 | 2,755,409 | ||||||||||
The Hershey Company | 31,449 | 2,793,615 | ||||||||||
| 8,030,514 | ||||||||||||
|
| |||||||||||
| Household Products: 1.02% | ||||||||||||
Church & Dwight Company Incorporated | 29,066 | 2,358,125 | ||||||||||
|
| |||||||||||
The accompanying notes are an integral part of these financial statements.
Table of Contents
| 8 | Wells Fargo Advantage VT Opportunity Fund | Portfolio of investments—June 30, 2015 (unaudited) |
| Security name | Shares | Value | ||||||||||
| Personal Products: 1.24% | ||||||||||||
The Estee Lauder Companies Incorporated Class A | 33,107 | $ | 2,869,053 | |||||||||
|
| |||||||||||
Energy: 7.83% | ||||||||||||
| Energy Equipment & Services: 2.74% | ||||||||||||
Cameron International Corporation † | 39,874 | 2,088,201 | ||||||||||
Halliburton Company | 54,366 | 2,341,544 | ||||||||||
Weatherford International plc † | 154,769 | 1,899,016 | ||||||||||
| 6,328,761 | ||||||||||||
|
| |||||||||||
| Oil, Gas & Consumable Fuels: 5.09% | ||||||||||||
Cimarex Energy Company | 25,406 | 2,802,536 | ||||||||||
EOG Resources Incorporated | 38,328 | 3,355,616 | ||||||||||
Newfield Exploration Company † | 82,288 | 2,972,243 | ||||||||||
Range Resources Corporation | 53,240 | 2,628,991 | ||||||||||
| 11,759,386 | ||||||||||||
|
| |||||||||||
Financials: 17.27% | ||||||||||||
| Banks: 6.20% | ||||||||||||
Citigroup Incorporated | 68,189 | 3,766,760 | ||||||||||
KeyCorp | 187,771 | 2,820,320 | ||||||||||
PNC Financial Services Group Incorporated | 42,455 | 4,060,821 | ||||||||||
Regions Financial Corporation | 354,776 | 3,675,479 | ||||||||||
| 14,323,380 | ||||||||||||
|
| |||||||||||
| Capital Markets: 2.94% | ||||||||||||
Invesco Limited | 93,775 | 3,515,625 | ||||||||||
TD Ameritrade Holding Corporation | 89,206 | 3,284,565 | ||||||||||
| 6,800,190 | ||||||||||||
|
| |||||||||||
| Insurance: 6.66% | ||||||||||||
ACE Limited | 28,167 | 2,864,021 | ||||||||||
American International Group Incorporated | 78,335 | 4,842,670 | ||||||||||
First American Financial Corporation | 73,725 | 2,743,307 | ||||||||||
RenaissanceRe Holdings Limited | 18,014 | 1,828,601 | ||||||||||
The Progressive Corporation | 111,770 | 3,110,559 | ||||||||||
| 15,389,158 | ||||||||||||
|
| |||||||||||
| REITs: 1.47% | ||||||||||||
American Tower Corporation | 36,399 | 3,395,663 | ||||||||||
|
| |||||||||||
Health Care: 11.99% | ||||||||||||
| Health Care Equipment & Supplies: 3.53% | ||||||||||||
Medtronic plc | 68,832 | 5,100,451 | ||||||||||
Zimmer Holdings Incorporated | 27,961 | 3,054,180 | ||||||||||
| 8,154,631 | ||||||||||||
|
| |||||||||||
| Health Care Providers & Services: 0.67% | ||||||||||||
Patterson Companies Incorporated | 31,949 | 1,554,319 | ||||||||||
|
| |||||||||||
The accompanying notes are an integral part of these financial statements.
Table of Contents
| Portfolio of investments—June 30, 2015 (unaudited) | Wells Fargo Advantage VT Opportunity Fund | 9 |
| Security name | Shares | Value | ||||||||||
| Life Sciences Tools & Services: 4.69% | ||||||||||||
Agilent Technologies Incorporated | 66,220 | $ | 2,554,768 | |||||||||
Bio-Rad Laboratories Incorporated Class A † | 32,359 | 4,873,589 | ||||||||||
Thermo Fisher Scientific Incorporated | 26,382 | 3,423,328 | ||||||||||
| 10,851,685 | ||||||||||||
|
| |||||||||||
| Pharmaceuticals: 3.10% | ||||||||||||
Merck & Company Incorporated | 43,299 | 2,465,012 | ||||||||||
Novartis AG ADR | 34,794 | 3,421,642 | ||||||||||
Zoetis Incorporated | 26,504 | 1,278,023 | ||||||||||
| 7,164,677 | ||||||||||||
|
| |||||||||||
Industrials: 11.42% | ||||||||||||
| Aerospace & Defense: 1.78% | ||||||||||||
B/E Aerospace Incorporated | 28,019 | 1,538,243 | ||||||||||
United Technologies Corporation | 23,314 | 2,586,222 | ||||||||||
| 4,124,465 | ||||||||||||
|
| |||||||||||
| Airlines: 1.06% | ||||||||||||
United Continental Holdings Incorporated † | 46,440 | 2,461,784 | ||||||||||
|
| |||||||||||
| Commercial Services & Supplies: 2.48% | ||||||||||||
Republic Services Incorporated | 76,583 | 2,999,756 | ||||||||||
Tyco International plc | 70,747 | 2,722,345 | ||||||||||
| 5,722,101 | ||||||||||||
|
| |||||||||||
| Electrical Equipment: 2.72% | ||||||||||||
Regal-Beloit Corporation | 42,583 | 3,091,100 | ||||||||||
The Babcock & Wilcox Company | 97,717 | 3,205,118 | ||||||||||
| 6,296,218 | ||||||||||||
|
| |||||||||||
| Professional Services: 0.61% | ||||||||||||
Towers Watson & Company Class A | 11,148 | 1,402,418 | ||||||||||
|
| |||||||||||
| Road & Rail: 2.77% | ||||||||||||
Canadian Pacific Railway Limited | 8,924 | 1,429,893 | ||||||||||
Hertz Global Holdings Incorporated † | 144,139 | 2,611,799 | ||||||||||
J.B. Hunt Transport Services Incorporated | 28,706 | 2,356,476 | ||||||||||
| 6,398,168 | ||||||||||||
|
| |||||||||||
Information Technology: 20.05% | ||||||||||||
| Electronic Equipment, Instruments & Components: 2.67% | ||||||||||||
Amphenol Corporation Class A | 55,197 | 3,199,770 | ||||||||||
TE Connectivity Limited | 46,208 | 2,971,174 | ||||||||||
| 6,170,944 | ||||||||||||
|
| |||||||||||
| Internet Software & Services: 1.77% | ||||||||||||
Google Incorporated Class C † | 7,874 | 4,098,496 | ||||||||||
|
| |||||||||||
The accompanying notes are an integral part of these financial statements.
Table of Contents
| 10 | Wells Fargo Advantage VT Opportunity Fund | Portfolio of investments—June 30, 2015 (unaudited) |
| Security name | Shares | Value | ||||||||||||
| IT Services: 2.44% | ||||||||||||||
Global Payments Incorporated | 28,152 | $ | 2,912,324 | |||||||||||
Teradata Corporation † | 73,851 | 2,732,487 | ||||||||||||
| 5,644,811 | ||||||||||||||
|
| |||||||||||||
| Semiconductors & Semiconductor Equipment: 3.69% | ||||||||||||||
ARM Holdings plc | 145,965 | 2,378,333 | ||||||||||||
Avago Technologies Limited | 23,527 | 3,127,444 | ||||||||||||
ON Semiconductor Corporation † | 257,743 | 3,013,016 | ||||||||||||
| 8,518,793 | ||||||||||||||
|
| |||||||||||||
| Software: 6.85% | ||||||||||||||
Check Point Software Technologies Limited † | 40,454 | 3,218,116 | ||||||||||||
Citrix Systems Incorporated † | 56,245 | 3,946,149 | ||||||||||||
Oracle Corporation | 69,380 | 2,796,014 | ||||||||||||
Red Hat Incorporated † | 45,095 | 3,424,063 | ||||||||||||
Salesforce.com Incorporated † | 35,252 | 2,454,597 | ||||||||||||
| 15,838,939 | ||||||||||||||
|
| |||||||||||||
| Technology Hardware, Storage & Peripherals: 2.63% | ||||||||||||||
Apple Incorporated | 48,351 | 6,064,424 | ||||||||||||
|
| |||||||||||||
Materials: 6.70% | ||||||||||||||
| Chemicals: 3.82% | ||||||||||||||
Cytec Industries Incorporated | 49,235 | 2,980,195 | ||||||||||||
Huntsman Corporation | 130,752 | 2,885,697 | ||||||||||||
Praxair Incorporated | 24,737 | 2,957,308 | ||||||||||||
| 8,823,200 | ||||||||||||||
|
| |||||||||||||
| Containers & Packaging: 2.15% | ||||||||||||||
Crown Holdings Incorporated † | 51,357 | 2,717,299 | ||||||||||||
Owens-Illinois Incorporated † | 97,911 | 2,246,078 | ||||||||||||
| 4,963,377 | ||||||||||||||
|
| |||||||||||||
| Metals & Mining: 0.73% | ||||||||||||||
Royal Gold Incorporated | 27,447 | 1,690,460 | ||||||||||||
|
| |||||||||||||
Total Common Stocks (Cost $184,622,048) | 230,503,467 | |||||||||||||
|
| |||||||||||||
| Yield | ||||||||||||||
| Short-Term Investments: 1.72% | ||||||||||||||
| Investment Companies: 1.72% | ||||||||||||||
Wells Fargo Advantage Cash Investment Money Market Fund, Select Class (l)(u) | 0.12 | % | 3,970,632 | 3,970,632 | ||||||||||
|
| |||||||||||||
Total Short-Term Investments (Cost $3,970,632) | 3,970,632 | |||||||||||||
|
| |||||||||||||
| Total investments in securities (Cost $188,592,680) * | 101.45 | % | 234,474,099 | |||||
Other assets and liabilities, net | (1.45 | ) | (3,344,889 | ) | ||||
|
|
|
| |||||
| Total net assets | 100.00 | % | $ | 231,129,210 | ||||
|
|
|
|
The accompanying notes are an integral part of these financial statements.
Table of Contents
| Portfolio of investments—June 30, 2015 (unaudited) | Wells Fargo Advantage VT Opportunity Fund | 11 |
| † | Non-income-earning security |
| (l) | The security represents an affiliate of the Fund as defined in the Investment Company Act of 1940. |
| (u) | The rate represents the 7-day annualized yield at period end. |
| * | Cost for federal income tax purposes is $188,936,846 and unrealized gains (losses) consists of: |
Gross unrealized gains | $ | 53,100,115 | ||
Gross unrealized losses | (7,562,862 | ) | ||
|
| |||
Net unrealized gains | $ | 45,537,253 |
The accompanying notes are an integral part of these financial statements.
Table of Contents
| 12 | Wells Fargo Advantage VT Opportunity Fund | Statement of assets and liabilities—June 30, 2015 (unaudited) |
Assets | ||||
Investments | ||||
In unaffiliated securities, at value (cost $184,622,048) | $ | 230,503,467 | ||
In affiliated securities, at value (cost $3,970,632) | 3,970,632 | |||
|
| |||
Total investments, at value (cost $188,592,680) | 234,474,099 | |||
Receivable for investments sold | 531,467 | |||
Receivable for Fund shares sold | 45,489 | |||
Receivable for dividends | 254,193 | |||
Prepaid expenses and other assets | 2,263 | |||
|
| |||
Total assets | 235,307,511 | |||
|
| |||
Liabilities | ||||
Payable for investments purchased | 3,221,569 | |||
Payable for Fund shares redeemed | 745,061 | |||
Advisory fee payable | 110,399 | |||
Distribution fee payable | 40,814 | |||
Administration fees payable | 25,550 | |||
Accrued expenses and other liabilities | 34,908 | |||
|
| |||
Total liabilities | 4,178,301 | |||
|
| |||
Total net assets | $ | 231,129,210 | ||
|
| |||
NET ASSETS CONSIST OF | ||||
Paid-in capital | $ | 146,756,192 | ||
Undistributed net investment income | 825,655 | |||
Accumulated net realized gains on investments | 37,665,957 | |||
Net unrealized gains on investments | 45,881,406 | |||
|
| |||
Total net assets | $ | 231,129,210 | ||
|
| |||
COMPUTATION OF NET ASSET VALUE PER SHARE | ||||
Net assets – Class 1 | $ | 39,157,024 | ||
Shares outstanding – Class 11 | 1,333,896 | |||
Net asset value per share – Class 1 | $29.36 | |||
Net assets – Class 2 | $ | 191,972,186 | ||
Shares outstanding – Class 21 | 6,537,889 | |||
Net asset value per share – Class 2 | $29.36 | |||
| 1 | The Fund has an unlimited number of authorized shares. |
The accompanying notes are an integral part of these financial statements.
Table of Contents
| Statement of operations—six months ended June 30, 2015 (unaudited) | Wells Fargo Advantage VT Opportunity Fund | 13 |
Investment income | ||||
Dividends (net of foreign withholding taxes of $14,863) | $ | 1,570,536 | ||
Securities lending income, net | 3,789 | |||
Income from affiliated securities | 2,082 | |||
|
| |||
Total investment income | 1,576,407 | |||
|
| |||
Expenses | ||||
Advisory fee | 775,228 | |||
Administration fees | ||||
Fund level | 59,633 | |||
Class 1 | 16,347 | |||
Class 2 | 79,065 | |||
Distribution fee | ||||
Class 2 | 247,079 | |||
Custody and accounting fees | 11,336 | |||
Professional fees | 27,824 | |||
Shareholder report expenses | 18,781 | |||
Trustees’ fees and expenses | 7,330 | |||
Other fees and expenses | 3,485 | |||
|
| |||
Total expenses | 1,246,108 | |||
Less: Fee waivers and/or expense reimbursements | (104,536 | ) | ||
|
| |||
Net expenses | 1,141,572 | |||
|
| |||
Net investment income | 434,835 | |||
|
| |||
REALIZED AND UNREALIZED GAINS (LOSSES) ON INVESTMENTS | ||||
Net realized gains on investments | 15,062,338 | |||
Net change in unrealized gains (losses) on investments | (11,066,738 | ) | ||
|
| |||
Net realized and unrealized gains (losses) on investments | 3,995,600 | |||
|
| |||
Net increase in net assets resulting from operations | $ | 4,430,435 | ||
|
| |||
The accompanying notes are an integral part of these financial statements.
Table of Contents
| 14 | Wells Fargo Advantage VT Opportunity Fund | Statement of changes in net assets |
| Six months ended June 30, 2015 (unaudited) | Year ended December 31, 2014 | |||||||||||||||
Operations | ||||||||||||||||
Net investment income | $ | 434,835 | $ | 399,925 | ||||||||||||
Net realized gains on investments | 15,062,338 | 36,441,368 | ||||||||||||||
Net change in unrealized gains (losses) on investments | (11,066,738 | ) | (12,075,043 | ) | ||||||||||||
|
| |||||||||||||||
Net increase in net assets resulting from operations | 4,430,435 | 24,766,250 | ||||||||||||||
|
| |||||||||||||||
Distributions to shareholders from | ||||||||||||||||
Net investment income | ||||||||||||||||
Class 1 | 0 | (127,115 | ) | |||||||||||||
Class 2 | 0 | (116,647 | ) | |||||||||||||
|
| |||||||||||||||
Total distributions to shareholders | 0 | (243,762 | ) | |||||||||||||
|
| |||||||||||||||
Capital share transactions | Shares | Shares | ||||||||||||||
Proceeds from shares sold | ||||||||||||||||
Class 1 | 13,099 | 384,752 | 53,369 | 1,479,957 | ||||||||||||
Class 2 | 182,531 | 5,405,124 | 342,554 | 9,419,119 | ||||||||||||
|
| |||||||||||||||
| 5,789,876 | 10,899,076 | |||||||||||||||
|
| |||||||||||||||
Reinvestment of distributions | ||||||||||||||||
Class 1 | 0 | 0 | 4,533 | 127,115 | ||||||||||||
Class 2 | 0 | 0 | 4,150 | 116,647 | ||||||||||||
|
| |||||||||||||||
| 0 | 243,762 | |||||||||||||||
|
| |||||||||||||||
Payment for shares redeemed | ||||||||||||||||
Class 1 | (142,799 | ) | (4,240,682 | ) | (304,044 | ) | (8,294,961 | ) | ||||||||
Class 2 | (621,089 | ) | (18,374,999 | ) | (1,442,152 | ) | (39,558,767 | ) | ||||||||
|
| |||||||||||||||
| (22,615,681 | ) | (47,853,728 | ) | |||||||||||||
|
| |||||||||||||||
Net decrease in net assets resulting from capital share transactions | (16,825,805 | ) | (36,710,890 | ) | ||||||||||||
|
| |||||||||||||||
Total decrease in net assets | (12,395,370 | ) | (12,188,402 | ) | ||||||||||||
|
| |||||||||||||||
Net assets | ||||||||||||||||
Beginning of period | 243,524,580 | 255,712,982 | ||||||||||||||
|
| |||||||||||||||
End of period | $ | 231,129,210 | $ | 243,524,580 | ||||||||||||
|
| |||||||||||||||
Undistributed net investment income | $ | 825,655 | $ | 390,820 | ||||||||||||
|
| |||||||||||||||
The accompanying notes are an integral part of these financial statements.
Table of Contents
| Financial highlights | Wells Fargo Advantage VT Opportunity Fund | 15 |
(For a share outstanding throughout each period)
Six months ended June 30, 2015 (unaudited) | Year ended December 31 | |||||||||||||||||||
| CLASS 1 | 2014 | 2013 | 2012 | 20111 | ||||||||||||||||
Net asset value, beginning of period | $28.82 | $26.11 | $20.02 | $17.40 | $16.52 | |||||||||||||||
Net investment income | 0.09 | 0.10 | 0.08 | 0.10 | 0.04 | |||||||||||||||
Net realized and unrealized gains (losses) on investments | 0.45 | 2.69 | 6.11 | 2.64 | 0.84 | |||||||||||||||
|
|
|
|
|
|
|
|
|
| |||||||||||
Total from investment operations | 0.54 | 2.79 | 6.19 | 2.74 | 0.88 | |||||||||||||||
Distributions to shareholders from | ||||||||||||||||||||
Net investment income | 0.00 | (0.08 | ) | (0.10 | ) | (0.11 | ) | 0.00 | ||||||||||||
Net realized gains | 0.00 | 0.00 | 0.00 | (0.01 | ) | 0.00 | ||||||||||||||
|
|
|
|
|
|
|
|
|
| |||||||||||
Total distributions to shareholders | 0.00 | (0.08 | ) | (0.10 | ) | (0.12 | ) | 0.00 | ||||||||||||
Net asset value, end of period | $29.36 | $28.82 | $26.11 | $20.02 | $17.40 | |||||||||||||||
Total return2 | 1.87 | % | 10.70 | % | 30.99 | % | 15.80 | % | 5.33 | % | ||||||||||
Ratios to average net assets (annualized) | ||||||||||||||||||||
Gross expenses | 0.84 | % | 0.82 | % | 0.84 | % | 0.86 | % | 0.83 | % | ||||||||||
Net expenses | 0.75 | % | 0.75 | % | 0.75 | % | 0.75 | % | 0.75 | % | ||||||||||
Net investment income | 0.57 | % | 0.37 | % | 0.32 | % | 0.46 | % | 0.61 | % | ||||||||||
Supplemental data | ||||||||||||||||||||
Portfolio turnover rate | 17 | % | 33 | % | 26 | % | 36 | % | 35 | % | ||||||||||
Net assets, end of period (000s omitted) | $39,157 | $42,178 | $44,636 | $40,950 | $42,116 | |||||||||||||||
| 1 | For the period from August 26, 2011 (commencement of class operations) to December 31, 2011 |
| 2 | Returns for periods of less than one year are not annualized. |
The accompanying notes are an integral part of these financial statements.
Table of Contents
| 16 | Wells Fargo Advantage VT Opportunity Fund | Financial highlights |
(For a share outstanding throughout each period)
Six months ended (unaudited) | Year ended December 31 | |||||||||||||||||||||||
| CLASS 2 | 2014 | 2013 | 2012 | 2011 | 20101 | |||||||||||||||||||
Net asset value, beginning of period | $28.86 | $26.15 | $20.05 | $17.38 | $18.42 | $15.01 | ||||||||||||||||||
Net investment income | 0.05 | 0.04 | 0.02 | 0.05 | 0.03 | 0.02 | ||||||||||||||||||
Net realized and unrealized gains (losses) on investments | 0.45 | 2.69 | 6.13 | 2.65 | (1.04 | ) | 3.51 | |||||||||||||||||
|
|
|
|
|
|
|
|
|
|
|
| |||||||||||||
Total from investment operations | 0.50 | 2.73 | 6.15 | 2.70 | (1.01 | ) | 3.53 | |||||||||||||||||
Distributions to shareholders from | ||||||||||||||||||||||||
Net investment income | 0.00 | (0.02 | ) | (0.05 | ) | (0.02 | ) | (0.03 | ) | (0.12 | ) | |||||||||||||
Net realized gains | 0.00 | 0.00 | 0.00 | (0.01 | ) | 0.00 | 0.00 | |||||||||||||||||
|
|
|
|
|
|
|
|
|
|
|
| |||||||||||||
Total distributions to shareholders | 0.00 | (0.02 | ) | (0.05 | ) | (0.03 | ) | (0.03 | ) | (0.12 | ) | |||||||||||||
Net asset value, end of period | $29.36 | $28.86 | $26.15 | $20.05 | $17.38 | $18.42 | ||||||||||||||||||
Total return2 | 1.73 | % | 10.42 | % | 30.68 | % | 15.52 | % | (5.52 | )% | 23.76 | % | ||||||||||||
Ratios to average net assets (annualized) | ||||||||||||||||||||||||
Gross expenses | 1.09 | % | 1.07 | % | 1.09 | % | 1.10 | % | 1.07 | % | 1.18 | % | ||||||||||||
Net expenses | 1.00 | % | 1.00 | % | 1.00 | % | 1.00 | % | 1.04 | % | 1.07 | % | ||||||||||||
Net investment income | 0.32 | % | 0.12 | % | 0.07 | % | 0.21 | % | 0.18 | % | 0.08 | % | ||||||||||||
Supplemental data | ||||||||||||||||||||||||
Portfolio turnover rate | 17 | % | 33 | % | 26 | % | 36 | % | 35 | % | 40 | % | ||||||||||||
Net assets, end of period (000s omitted) | $191,972 | $201,347 | $211,077 | $188,313 | $201,535 | $168,307 | ||||||||||||||||||
| 1 | After the close of business on July 16, 2010, existing shares of the Fund were renamed Class 2 shares. |
| 2 | Returns for periods of less than one year are not annualized. |
The accompanying notes are an integral part of these financial statements.
Table of Contents
| Notes to financial statements (unaudited) | Wells Fargo Advantage VT Opportunity Fund | 17 |
1. ORGANIZATION
Wells Fargo Variable Trust (the “Trust”), a Delaware statutory trust organized on March 10, 1999, is an open-end management investment company registered under the Investment Company Act of 1940, as amended (the “1940 Act”). As an investment company, the Trust follows the accounting and reporting guidance in Financial Accounting Standards Board (“FASB”) Accounting Standards Codification Topic 946, Financial Services – Investment Companies. These financial statements report on the Wells Fargo Advantage VT Opportunity Fund (the “Fund”) which is a diversified series of the Trust.
2. SIGNIFICANT ACCOUNTING POLICIES
The following significant accounting policies, which are consistently followed in the preparation of the financial statements of the Fund, are in conformity with U.S. generally accepted accounting principles which require management to make estimates and assumptions that affect the reported amounts of assets and liabilities, disclosure of contingent assets and liabilities at the date of the financial statements, and the reported amounts of revenues and expenses during the reporting period. Actual results could differ from those estimates.
Securities valuation
All investments are valued each business day as of the close of regular trading on the New York Stock Exchange (generally 4 p.m. Eastern Time).
Equity securities that are listed on a foreign or domestic exchange or market are valued at the official closing price or, if none, the last sales price. If no sale occurs on the primary exchange or market that day, the prior day’s price will be deemed “stale” and a fair value price will be determined in accordance with the Fund’s Valuation Procedures.
Equity securities that are not listed on a foreign or domestic exchange or market, but have a public trading market, are valued at the quoted bid price from an independent broker-dealer that the Management Valuation Team of Wells Fargo Funds Management, LLC (“Funds Management”) has determined is an acceptable source.
The values of securities denominated in foreign currencies are translated into U.S. dollars at rates provided by an independent foreign currency pricing source at a time each business day specified by the Management Valuation Team.
Many securities markets and exchanges outside the U.S. close prior to the close of the New York Stock Exchange and therefore may not fully reflect trading or events that occur after the close of the principal exchange in which the foreign securities are traded, but before the close of the New York Stock Exchange. If such trading or events are expected to materially affect the value of such securities, then fair value pricing procedures approved by the Board of Trustees of the Fund are applied. These procedures take into account multiple factors including movements in U.S. securities markets after foreign exchanges close. Foreign securities that are fair valued under these procedures are categorized as Level 2 and the application of these procedures may result in transfers between Level 1 and Level 2. Depending on market activity, such fair valuations may be frequent. Such fair value pricing may result in net asset values that are higher or lower than net asset values based on the last reported sales price or latest quoted bid price. On June 30, 2015, such fair value pricing was not used in pricing foreign securities.
Investments in registered open-end investment companies are valued at net asset value. Interests in non-registered investment vehicles that are redeemable at net asset value are fair valued at net asset value when available.
Investments which are not valued using any of the methods discussed above are valued at their fair value, as determined in good faith by the Board of Trustees. The Board of Trustees has established a Valuation Committee comprised of the Trustees and has delegated to it the authority to take any actions regarding the valuation of portfolio securities that the Valuation Committee deems necessary or appropriate, including determining the fair value of portfolio securities, unless the determination has been delegated to the Management Valuation Team. The Board of Trustees retains the authority to make or ratify any valuation decisions or approve any changes to the Valuation Procedures as it deems appropriate. On a quarterly basis, the Board of Trustees receives reports on any valuation actions taken by the Valuation Committee or the Management Valuation Team which may include items for ratification.
Valuations of fair valued securities are compared to the next actual sales price when available, or other appropriate market values, to assess the continued appropriateness of the fair valuation methodologies used. These securities are fair valued on a day-to-day basis, taking into consideration changes to appropriate market information and any significant changes to the inputs considered in the valuation process until there is a readily available price provided on an exchange or by an independent pricing service. Valuations received from an independent pricing service or independent broker-dealer quotes are periodically validated by comparisons to most recent trades and valuations provided by other independent pricing services in addition to the review of prices by the adviser and/or subadviser. Unobservable inputs used in determining fair valuations are identified based on the type of security, taking into consideration factors utilized by market participants in valuing the investment, knowledge about the issuer and the current market environment.
Table of Contents
| 18 | Wells Fargo Advantage VT Opportunity Fund | Notes to financial statements (unaudited) |
Foreign currency translation
The accounting records of the Fund are maintained in U.S. dollars. The values of other assets and liabilities denominated in foreign currencies are translated into U.S. dollars at rates provided by an independent foreign currency pricing source at a time each business day specified by the Management Valuation Team. Purchases and sales of securities, and income and expenses are converted at the rate of exchange on the respective dates of such transactions. Net realized foreign exchange gains or losses arise from sales of foreign currencies, currency gains or losses realized between the trade and settlement dates on securities transactions, and the difference between the amounts of dividends, interest and foreign withholding taxes recorded and the U.S. dollar equivalent of the amounts actually paid or received. Net unrealized foreign exchange gains and losses arise from changes in the fair value of assets and liabilities other than investments in securities resulting from changes in exchange rates. The changes in net assets arising from changes in exchange rates and the changes in net assets resulting from changes in market prices of securities are not separately presented. Such changes are included in net realized and unrealized gains or losses from investments.
Security loans
The Fund may lend its securities from time to time in order to earn additional income in the form of fees or interest on securities received as collateral or the investment of any cash received as collateral. The Fund continues to receive interest or dividends on the securities loaned. The Fund receives collateral in the form of cash or securities with a value at least equal to the value of the securities on loan. The value of the loaned securities is determined at the close of each business day and any additional required collateral is delivered to the Fund on the next business day. In a securities lending transaction, the net asset value of the Fund will be affected by an increase or decrease in the value of the securities loaned and by an increase or decrease in the value of the instrument in which collateral is invested. The amount of securities lending activity undertaken by the Fund fluctuates from time to time. In the event of default or bankruptcy by the borrower, the Fund may be prevented from recovering the loaned securities or gaining access to the collateral or may experience delays or costs in doing so. In addition, the investment of any cash collateral received may lose all or part of its value. The Fund has the right under the lending agreement to recover the securities from the borrower on demand.
The Fund lends its securities through an unaffiliated securities lending agent. Cash collateral received in connection with its securities lending transactions is invested in Securities Lending Cash Investments, LLC (the “Securities Lending Fund”). The Securities Lending Fund is exempt from registration under Section 3(c)(7) of the 1940 Act and is managed by Funds Management and is subadvised by Wells Capital Management Incorporated (“WellsCap”). Funds Management receives an advisory fee starting at 0.05% and declining to 0.01% as the average daily net assets of the Securities Lending Fund increase. All of the fees received by Funds Management are paid to WellsCap for its services as subadviser. The Securities Lending Fund seeks to provide a positive return compared to the daily Fed Funds Open rate by investing in high-quality, U.S. dollar-denominated short-term money market instruments. Securities Lending Fund investments are fair valued based upon the amortized cost valuation technique. Income earned from investment in the Securities Lending Fund is included in securities lending income on the Statement of Operations.
Security transactions and income recognition
Securities transactions are recorded on a trade date basis. Realized gains or losses are recorded on the basis of identified cost.
Dividend income is recognized on the ex-dividend date, except for certain dividends from foreign securities, which are recorded as soon as the custodian verifies the ex-dividend date. Dividend income from foreign securities is recorded net of foreign taxes withheld where recovery of such taxes is not assured.
Distributions to shareholders
Distributions to shareholders from net investment income and net realized gains, if any, are recorded on the ex-dividend date. Such distributions are determined in conformity with federal income tax regulations, which may differ in amount or character from net investment income and realized gains recognized for purposes of U.S. generally accepted accounting principles.
Federal and other taxes
The Fund intends to continue to qualify as a regulated investment company by distributing substantially all of its investment company taxable income and any net realized capital gains (after reduction for capital loss carryforwards) sufficient to relieve it from all, or substantially all, federal income taxes. Accordingly, no provision for federal income taxes was required.
The Fund’s income and federal excise tax returns and all financial records supporting those returns for the prior three fiscal years are subject to examination by the federal and Delaware revenue authorities. Management has analyzed the Fund’s tax positions taken on federal, state, and foreign tax returns for all open tax years and does not believe that there are any uncertain tax positions that require recognition of a tax liability.
As of December 31, 2014, the Fund had capital loss carryforwards available to offset future net realized capital gains in the amount of $721,350 with $360,675 expiring in 2015 and $360,675 expiring in 2016.
Table of Contents
| Notes to financial statements (unaudited) | Wells Fargo Advantage VT Opportunity Fund | 19 |
Class allocations
The separate classes of shares offered by the Fund differ principally in distribution fees. Class specific expenses are charged directly to that share class. Investment income, common expenses and realized and unrealized gains (losses) on investments are allocated daily to each class of shares based on the relative proportion of net assets of each class.
3. FAIR VALUATION MEASUREMENTS
Fair value measurements of investments are determined within a framework that has established a fair value hierarchy based upon the various data inputs utilized in determining the value of the Fund’s investments. The three-level hierarchy gives the highest priority to unadjusted quoted prices in active markets for identical assets or liabilities (Level 1) and the lowest priority to significant unobservable inputs (Level 3). The Fund’s investments are classified within the fair value hierarchy based on the lowest level of input that is significant to the fair value measurement. The inputs are summarized into three broad levels as follows:
| n | Level 1 – quoted prices in active markets for identical securities |
| n | Level 2 – other significant observable inputs (including quoted prices for similar securities, interest rates, prepayment speeds, credit risk, use of amortized cost, etc.) |
| n | Level 3 – significant unobservable inputs (including the Fund’s own assumptions in determining the fair value of investments) |
The inputs or methodologies used for valuing investments in securities are not necessarily an indication of the risk associated with investing in those securities.
The following is a summary of the inputs used in valuing the Fund’s assets and liabilities as of June 30, 2015:
| Quoted prices (Level 1) | Other significant observable inputs (Level 2) | Significant unobservable inputs (Level 3) | Total | |||||||||||||
Assets | ||||||||||||||||
Investments in: | ||||||||||||||||
Common stocks | ||||||||||||||||
Consumer discretionary | $ | 40,766,897 | $ | 0 | $ | 0 | $ | 40,766,897 | ||||||||
Consumer staples | 15,796,122 | 0 | 0 | 15,796,122 | ||||||||||||
Energy | 18,088,147 | 0 | 0 | 18,088,147 | ||||||||||||
Financials | 39,908,391 | 0 | 0 | 39,908,391 | ||||||||||||
Health care | 27,725,312 | 0 | 0 | 27,725,312 | ||||||||||||
Industrials | 26,405,154 | 0 | 0 | 26,405,154 | ||||||||||||
Information technology | 46,336,407 | 0 | 0 | 46,336,407 | ||||||||||||
Materials | 15,477,037 | 0 | 0 | 15,477,037 | ||||||||||||
Short-term investments | ||||||||||||||||
Investment companies | 3,970,632 | 0 | 0 | 3,970,632 | ||||||||||||
Total assets | $ | 234,474,099 | $ | 0 | $ | 0 | $ | 234,474,099 | ||||||||
The Fund recognizes transfers between levels within the fair value hierarchy at the end of the reporting period. Fair value pricing that was used in pricing certain foreign securities at the previous period end was not used at June 30, 2015. As a result common stocks valued at $2,378,333 were transferred from Level 2 to Level 1 within the fair value hierarchy. The Fund did not have any transfers into/out of Level 3.
4. TRANSACTIONS WITH AFFILIATES
Advisory fee
The Trust has entered into an advisory contract with Funds Management, an indirect wholly owned subsidiary of Wells Fargo & Company (“Wells Fargo”). The adviser is responsible for implementing investment policies and guidelines and for supervising the subadviser, who is responsible for day-to-day portfolio management of the Fund.
Pursuant to the contract, Funds Management is entitled to receive an annual advisory fee starting at 0.65% and declining to 0.55% as the average daily net assets of the Fund increase. For the six months ended June 30, 2015, the advisory fee was equivalent to an annual rate of 0.65% of the Fund’s average daily net assets.
Table of Contents
| 20 | Wells Fargo Advantage VT Opportunity Fund | Notes to financial statements (unaudited) |
Funds Management has retained the services of a subadviser to provide daily portfolio management to the Fund. The fee for subadvisory services is borne by Funds Management. WellsCap, an affiliate of Funds Management and an indirect wholly owned subsidiary of Wells Fargo, is the subadviser to the Fund and is entitled to receive a fee from Funds Management at an annual rate starting at 0.45% and declining to 0.30% as the average daily net assets of the Fund increase.
Administration fees
The Trust has entered into an administration agreement with Funds Management. Under this agreement, for providing administrative services, which includes paying fees and expenses for services provided by the transfer agent, sub-transfer agents, omnibus account servicers and record-keepers, Funds Management is entitled to receive from the Fund an annual fund level administration fee starting at 0.05% and declining to 0.03% as the average daily net assets of the Fund increase and a class level administration fee of 0.08% which is calculated based on the average daily net assets of each class.
Funds Management has contractually waived and/or reimbursed advisory and administration fees to the extent necessary to maintain certain net operating expense ratios for the Fund. Waiver of fees and/or reimbursement of expenses by Funds Management were made first from fund level expenses on a proportionate basis and then from class specific expenses. Funds Management has committed through April 30, 2016 to waive fees and/or reimburse expenses to the extent necessary to cap the Fund’s expenses at 0.75% for Class 1 shares and 1.00% for Class 2 shares. After this time, the cap may be increased or the commitment to maintain the cap may be terminated only with the approval of the Board of Trustees.
Distribution fee
The Trust has adopted a Distribution Plan for Class 2 shares of the Fund pursuant to Rule 12b-1 under the 1940 Act. A distribution fee is charged to Class 2 shares and paid to Wells Fargo Funds Distributor, LLC, the principal underwriter, at an annual rate of 0.25% of the average daily net assets of Class 2 shares.
5. INVESTMENT PORTFOLIO TRANSACTIONS
Purchases and sales of investments, excluding U.S. government obligations (if any) and short-term securities, for the six months ended June 30, 2015 were $39,911,610 and $48,868,759, respectively.
6. BANK BORROWINGS
The Trust and Wells Fargo Funds Trust (excluding the money market funds and certain other funds) are parties to a $150,000,000 revolving credit agreement, whereby the Fund is permitted to use bank borrowings for temporary or emergency purposes, such as to fund shareholder redemption requests. Interest under the credit agreement is charged to the Fund based on a borrowing rate equal to the higher of the Federal Funds rate in effect on that day plus 1.25% or the overnight LIBOR rate in effect on that day plus 1.25%. In addition, an annual commitment fee equal to 0.10% of the unused balance is allocated to each participating fund. For the six months ended June 30, 2015, the Fund paid $175 in commitment fees.
For the six months ended June 30, 2015, there were no borrowings by the Fund under the agreement.
7. INDEMNIFICATION
Under the Trust’s organizational documents, the officers and Trustees have been granted certain indemnification rights against certain liabilities that may arise out of performance of their duties to the Trust. Additionally, in the normal course of business, the Trust may enter into contracts with service providers that contain a variety of indemnification clauses. The Trust’s maximum exposure under these arrangements is dependent on future claims that may be made against the Fund and, therefore, cannot be estimated.
8. SUBSEQUENT DISTRIBUTIONS
On July 9, 2015, the Fund declared distributions from net investment income and long-term capital gains to shareholders of record on July 8, 2015. The per share amounts payable on July 10, 2015 were as follows:
| Net investment income | Long-term capital gains | |||||||
Class 1 | $0.11650 | $2.99099 | ||||||
Class 2 | 0.03736 | 2.99099 | ||||||
These distributions are not reflected in the accompanying financial statements. The final determination of the source of all distributions is subject to change and made after the Fund’s tax year-end.
Table of Contents
| Other information (unaudited) | Wells Fargo Advantage VT Opportunity Fund | 21 |
PROXY VOTING INFORMATION
A description of the policies and procedures that the Fund uses to determine how to vote proxies relating to portfolio securities is available, upon request, by calling 1-800-222-8222, visiting our website at wellsfargoadvantagefunds.com, or visiting the SEC website at sec.gov. Information regarding how the Fund voted proxies relating to portfolio securities during the most recent 12-month period ended June 30 is available on the Fund’s website at wellsfargoadvantagefunds.com or by visiting the SEC website at sec.gov.
PORTFOLIO HOLDINGS INFORMATION
The complete portfolio holdings for the Fund are publicly available monthly on the Fund’s website (wellsfargoadvantagefunds.com), on a one-month delayed basis. In addition, top ten holdings information (excluding derivative positions) for the Fund is publicly available on the Fund’s website on a monthly, seven-day or more delayed basis. The Fund files its complete schedule of portfolio holdings with the SEC for the first and third quarters of each fiscal year on Form N-Q, which is available by visiting the SEC website at sec.gov. In addition, the Fund’s Form N-Q may be reviewed and copied at the SEC’s Public Reference Room in Washington, DC, and at regional offices in New York City, at 233 Broadway, and in Chicago, at 175 West Jackson Boulevard, Suite 900. Information about the Public Reference Room may be obtained by calling 1-800-SEC-0330.
Table of Contents
| 22 | Wells Fargo Advantage VT Opportunity Fund | Other information (unaudited) |
BOARD OF TRUSTEES AND OFFICERS
Each of the Trustees and Officers1 listed in the table below acts in identical capacities for each fund in the Wells Fargo Advantage family of funds, which consists of 134 mutual funds comprising the Wells Fargo Funds Trust, Wells Fargo Variable Trust, Wells Fargo Master Trust and four closed-end funds (collectively the “Fund Complex”). This table should be read in conjunction with the Prospectus and the Statement of Additional Information2. The mailing address of each Trustee and Officer is 525 Market Street, 12th Floor, San Francisco, CA 94105. Each Trustee and Officer serves an indefinite term, however, each Trustee serves such term until reaching the mandatory retirement age established by the Trustees.
Independent Trustees
| Name and year of birth | Position held and length of service* | Principal occupations during past five years or longer | Other directorships during past five years | |||
| William R. Ebsworth (Born 1957) | Trustee, since 2015** | Retired. From 1984 to 2013, equities analyst, portfolio manager, research director at Fidelity Management and Research Company and retired in 2013 as Chief Investment Officer of Fidelity Strategic Advisers, Inc. in Boston, Tokyo, and Hong Kong where he led a team of investment professionals managing client assets. Prior thereto, Board member of Hong Kong Securities Clearing Co., Hong Kong Options Clearing Corp., the Thailand International Fund, Ltd., Fidelity Investments Life Insurance Company, and Empire Fidelity Investments Life Insurance Company. Mr. Ebsworth is an Adjunct Lecturer, Finance, at Babson College and a Chartered Financial Analyst. | Asset Allocation Trust | |||
| Jane A. Freeman (Born 1953) | Trustee, since 2015** | Retired. From 2012 to 2014 and 1999 to 2008, Chief Financial Officer of Scientific Learning Corporation. From 2008 to 2012, Ms. Freeman provided consulting services related to strategic business projects. Prior to 1999, Portfolio Manager at Rockefeller & Co. and Scudder, Stevens & Clark. Board member of the Harding Loevner Funds from 1996 to 2014, serving as both Lead Independent Director and chair of the Audit Committee. Board member of the Russell Exchange Traded Funds Trust from 2011 to 2012 and the chair of the Audit Committee. Ms. Freeman is a Chartered Financial Analyst (inactive), Chair of Taproot Foundation (non-profit organization) and a Board Member of Ruth Bancroft Garden (non-profit organization). | Asset Allocation Trust | |||
| Peter G. Gordon (Born 1942) | Trustee, since 1998; Chairman, since 2005 | Co-Founder, Retired Chairman, President and CEO of Crystal Geyser Water Company. Trustee Emeritus, Colby College. | Asset Allocation Trust | |||
| Isaiah Harris, Jr. (Born 1952) | Trustee, since 2009 | Retired. Chairman of the Board of CIGNA Corporation since 2009, and Director since 2005. From 2003 to 2011, Director of Deluxe Corporation. Prior thereto, President and CEO of BellSouth Advertising and Publishing Corp. from 2005 to 2007, President and CEO of BellSouth Enterprises from 2004 to 2005 and President of BellSouth Consumer Services from 2000 to 2003. Emeritus member of the Iowa State University Foundation Board of Governors. Emeritus Member of the Advisory Board of Iowa State University School of Business. Advisory Board Member, Palm Harbor Academy. Mr. Harris is a certified public accountant. | CIGNA Corporation; Asset Allocation Trust | |||
| Judith M. Johnson (Born 1949) | Trustee, since 2008; Audit Committee Chairman, since 2008 | Retired. Prior thereto, Chief Executive Officer and Chief Investment Officer of Minneapolis Employees Retirement Fund from 1996 to 2008. Ms. Johnson is an attorney, certified public accountant and a certified managerial accountant. | Asset Allocation Trust | |||
| David F. Larcker (Born 1950) | Trustee, since 2009 | James Irvin Miller Professor of Accounting at the Graduate School of Business, Stanford University, Morgan Stanley Director of the Center for Leadership Development and Research and Senior Faculty of The Rock Center for Corporate Governance since 2006. From 2005 to 2008, Professor of Accounting at the Graduate School of Business, Stanford University. Prior thereto, Ernst & Young Professor of Accounting at The Wharton School, University of Pennsylvania from 1985 to 2005. | Asset Allocation Trust | |||
| Olivia S. Mitchell (Born 1953) | Trustee, since 2006 | International Foundation of Employee Benefit Plans Professor, Wharton School of the University of Pennsylvania since 1993. Director of Wharton’s Pension Research Council and Boettner Center on Pensions & Retirement Research, and Research Associate at the National Bureau of Economic Research. Previously, Cornell University Professor from 1978 to 1993. | Asset Allocation Trust |
Table of Contents
| Other information (unaudited) | Wells Fargo Advantage VT Opportunity Fund | 23 |
| Name and year of birth | Position held and length of service* | Principal occupations during past five years or longer | Other directorships during past five years | |||
| Timothy J. Penny (Born 1951) | Trustee, since 1996 | President and Chief Executive Officer of Southern Minnesota Initiative Foundation, a non-profit organization, since 2007 and Senior Fellow at the Humphrey Institute Policy Forum at the University of Minnesota since 1995. Member of the Board of Trustees of NorthStar Education Finance, Inc., a non-profit organization, since 2007. | Asset Allocation Trust | |||
| Michael S. Scofield (Born 1943) | Trustee, since 2010 | Served on the Investment Company Institute’s Board of Governors and Executive Committee from 2008-2011 as well the Governing Council of the Independent Directors Council from 2006-2011 and the Independent Directors Council Executive Committee from 2008-2011. Chairman of the IDC from 2008-2010. Institutional Investor (Fund Directions) Trustee of Year in 2007. Trustee of the Evergreen Funds complex (and its predecessors) from 1984 to 2010. Chairman of the Evergreen Funds from 2000-2010. Former Trustee of the Mentor Funds. Retired Attorney, Law Offices of Michael S. Scofield. | Asset Allocation Trust | |||
| Donald C. Willeke (Born 1940) | Trustee, since 1996 | Principal of the law firm of Willeke & Daniels. General Counsel of the Minneapolis Employees Retirement Fund from 1984 until its consolidation into the Minnesota Public Employees Retirement Association on June 30, 2010. Director and Vice Chair of The Tree Trust (non-profit corporation). Director of the American Chestnut Foundation (non-profit corporation). | Asset Allocation Trust |
| * | Length of service dates reflect the Trustee’s commencement of service with the Trust’s predecessor entities, where applicable. |
| ** | William R. Ebsworth and Jane A. Freeman each became a Trustee effective January 1, 2015. |
Officers
| Name and year of birth | Position held and length of service | Principal occupations during past five years or longer | ||||
| Karla M. Rabusch (Born 1959) | President, since 2003 | Executive Vice President of Wells Fargo Bank, N.A. and President of Wells Fargo Funds Management, LLC since 2003. | ||||
| Jeremy DePalma1 (Born 1974) | Treasurer, since 2012 | Senior Vice President of Wells Fargo Funds Management, LLC since 2009. Senior Vice President of Evergreen Investment Management Company, LLC from 2008 to 2010. Vice President, Evergreen Investment Services, Inc. from 2004 to 2007. Head of the Fund Reporting and Control Team within Fund Administration from 2005 to 2010. | ||||
| C. David Messman (Born 1960) | Secretary, since 2000; Chief Legal Officer, since 2003 | Senior Vice President and Secretary of Wells Fargo Funds Management, LLC since 2001. Assistant General Counsel of Wells Fargo Bank, N.A. since 2013 and Vice President and Managing Counsel of Wells Fargo Bank N.A. from 1996 to 2013. | ||||
| Debra Ann Early (Born 1964) | Chief Compliance Officer, since 2007 | Senior Vice President of Wells Fargo Funds Management, LLC since 2007 and Chief Compliance Officer from 2007 to 2014. Chief Compliance Officer of Parnassus Investments from 2005 to 2007. Chief Financial Officer of Parnassus Investments from 2004 to 2007 and Senior Audit Manager of PricewaterhouseCoopers LLP from 1998 to 2004. | ||||
| David Berardi (Born 1975) | Assistant Treasurer, since 2009 | Vice President of Wells Fargo Funds Management, LLC since 2009. Vice President of Evergreen Investment Management Company, LLC from 2008 to 2010. Assistant Vice President of Evergreen Investment Services, Inc. from 2004 to 2008. Manager of Fund Reporting and Control for Evergreen Investment Management Company, LLC from 2004 to 2010. |
| 1 | Jeremy DePalma acts as Treasurer of 61 funds and Assistant Treasurer of 73 funds in the Fund Complex. |
| 2 | The Statement of Additional Information includes additional information about the Trustees and is available, without charge, upon request, by calling 1-800-222-8222 or by visiting the website at wellsfargoadvantagefunds.com. |
Table of Contents
| 24 | Wells Fargo Advantage VT Opportunity Fund | Other information (unaudited) |
BOARD CONSIDERATION OF INVESTMENT ADVISORY, INVESTMENT MANAGEMENT AND SUB-ADVISORY AGREEMENTS:
Under the Investment Company Act of 1940 (the “1940 Act”), the Board of Trustees (the “Board”) of Wells Fargo Variable Trust (the “Trust”) must determine annually whether to approve the continuation of the Trust’s investment advisory and sub-advisory agreements. In this regard, at an in-person meeting held on May 19-20, 2015 (the “Meeting”), the Board, all the members of which have no direct or indirect interest in the investment advisory and sub-advisory agreements and are not “interested persons” of the Trust, as defined in the 1940 Act (the “Independent Trustees”), reviewed and approved for Wells Fargo Advantage VT Opportunity Fund (the “Fund”): (i) an investment advisory agreement (the “Advisory Agreement”) with Wells Fargo Funds Management, LLC (“Funds Management”); (ii) an investment management agreement (the “Management Agreement”) with Funds Management; and (iii) an investment sub-advisory agreement (the “Sub-Advisory Agreement”) with Wells Capital Management Incorporated (the “Sub-Adviser”), an affiliate of Funds Management. The Management Agreement combines the terms of the Advisory Agreement with the terms of the Fund’s Amended and Restated Administration Agreement (the “Administration Agreement”) applicable to Fund-level administrative services. The Advisory Agreement, the Management Agreement and the Sub-Advisory Agreement are collectively referred to as the “Advisory Agreements.”
At the Meeting, the Board considered the factors and reached the conclusions described below relating to the selection of Funds Management and the Sub-Adviser and the approval of the Advisory Agreements. Prior to the Meeting, including at an in-person meeting in March 2015, the Trustees conferred extensively among themselves and with representatives of Funds Management about these matters. Also, the Board has adopted a team-based approach, with each team consisting of a sub-set of Trustees, to assist the full Board in the discharge of its duties in reviewing performance and other matters throughout the year. The Independent Trustees were assisted in their evaluation of the Advisory Agreements by independent legal counsel, from whom they received separate legal advice and with whom they met separately.
In providing information to the Board, Funds Management and the Sub-Adviser were guided by a detailed set of requests for information submitted to them by independent legal counsel on behalf of the Independent Trustees at the start of the Board’s annual contract renewal process earlier in 2015. In considering and approving the Advisory Agreements, the Trustees considered the information they believed relevant, including but not limited to the information discussed below. The Board considered not only the specific information presented in connection with the Meeting, but also the knowledge gained over time through interaction with Funds Management and the Sub-Adviser about various topics. In this regard, the Board reviewed reports of Funds Management at each of its quarterly meetings, which included, among other things, portfolio reviews and performance reports. In addition, the Board and the teams mentioned above confer with portfolio managers at various times throughout the year. The Board did not identify any particular information or consideration that was all-important or controlling, and each individual Trustee may have attributed different weights to various factors.
After its deliberations, the Board unanimously approved the continuation of the Advisory Agreement for the period from June 1, 2015 through June 30, 2015, approved the Management Agreement for the period from July 1, 2015 through May 31, 2016, and approved the continuation of the Sub-Advisory Agreement for a one-year term through May 31, 2016. The Board also determined that the compensation payable to Funds Management and the Sub-Adviser under each of the Advisory Agreements was reasonable. The Board considered the approval of the Advisory Agreements for the Fund as part of its consideration of agreements for funds across the complex, but its approvals were made on a fund-by-fund basis. The following summarizes a number of important, but not necessarily all, factors considered by the Board in support of its approvals.
Nature, extent and quality of services
The Board received and considered various information regarding the nature, extent and quality of services provided to the Fund by Funds Management and the Sub-Adviser under the Advisory Agreements. This information included, among other things, a summary of the background and experience of senior management of Funds Management, and the qualifications, background, tenure and responsibilities of each of the portfolio managers primarily responsible for the day-to-day portfolio management of the Fund. The Board noted that the services to be provided to the Fund pursuant to the Management Agreement combined the advisory services previously provided to the Fund pursuant to the Fund’s Advisory Agreement with the Fund-level administrative services previously provided to the Fund pursuant to the Fund’s Administration Agreement. The Board received a representation from Funds Management that combining these services would not result in any change to the nature or level of services provided by Funds Management to the Fund.
Table of Contents
| Other information (unaudited) | Wells Fargo Advantage VT Opportunity Fund | 25 |
The Board evaluated the ability of Funds Management and the Sub-Adviser to attract and retain qualified investment professionals, including research, advisory and supervisory personnel. The Board further considered the compliance programs and compliance records of Funds Management and the Sub-Adviser. In addition, the Board took into account the full range of services provided to the Fund by Funds Management and its affiliates.
Fund performance and expenses
The Board considered the performance results for the Fund over various time periods ended March 31, 2015. The Board considered these results in comparison to the performance of funds in a universe that was determined by Lipper Inc. (“Lipper”) to be similar to the Fund (the “Universe”), and in comparison to the Fund’s benchmark index and to other comparative data. Lipper is an independent provider of investment company data. The Board received a description of the methodology used by Lipper to select the mutual funds in the performance Universe. The Board noted that the performance of the Fund (Classes 1 and 2) was higher than the average performance of the Universe for all periods under review. The Board also noted that the performance of the Fund was lower than its benchmark, the Russell 3000® Index, for all periods under review except the first quarter of 2015 and the ten-year period.
The Board received information concerning, and discussed factors contributing to, the underperformance of the Fund relative to the benchmark for the periods noted above. The Board took note of the explanations for the relative underperformance in these periods, including with respect to overall investment approach, sector allocations and investment decisions that affected the Fund’s performance, and of longer term and recent outperformance.
The Board also received and considered information regarding the Fund’s net operating expense ratios and their various components, including actual management fees (which reflect fee waivers, if any, and include advisory, administration and transfer agent fees), custodian and other non-management fees, and Rule 12b-1 and non-Rule 12b-1 service fees. The Board considered these ratios in comparison to the median ratios of funds in class-specific expense groups that were determined by Lipper to be similar to the Fund (the “Groups”). The Board received a description of the methodology used by Lipper to select the mutual funds in the expense Groups and an explanation of how funds comprising expense groups and their expense ratios may vary from year-to-year. Based on the Lipper reports, the Board noted that the net operating expense ratios of the Fund were lower than the median net operating expense ratios of the expense Groups.
The Board took into account the Fund performance and expense information provided to it among the factors considered in deciding to re-approve the Advisory Agreement and Sub-Advisory Agreement and approve the Management Agreement.
Investment advisory and sub-advisory fee rates
The Board reviewed and considered the contractual investment advisory fee rates that are payable by the Fund to Funds Management for investment advisory services (the “Advisory Agreement Rates”), both on a stand-alone basis and on a combined basis with the Fund’s fund-level and class-level contractual administration fee rates (the “Management Rates”). The Board noted that the Management Rates include transfer agency and sub-transfer agency costs. The Board also noted that the fee rate to be paid by the Fund under the Management Agreement will incorporate the advisory fee and Fund-level administration fee previously payable separately by the Fund under the Fund’s Advisory Agreement and Administration Agreement with Funds Management. The Board also reviewed and considered the contractual investment sub-advisory fee rates that are payable by Funds Management to the Sub-Adviser for investment sub-advisory services (the “Sub-Advisory Agreement Rates”).
Among other information reviewed by the Board was a comparison of the Management Rates of the Fund with those of other funds in the expense Groups at a common asset level. The Board noted that the Management Rates of the Fund were in range of the average rates for the Fund’s expense Groups for all share classes.
The Board also received and considered information about the portion of the total advisory fee that was retained by Funds Management after payment of the fee to the Sub-Adviser for sub-advisory services. In assessing the reasonableness of this amount, the Board received and evaluated information about the nature and extent of responsibilities retained and risks assumed by Funds Management and not delegated to or assumed by the Sub-Adviser, and about Funds Management’s on-going oversight services. However, given the affiliation between Funds Management and the Sub-Adviser, the Board ascribed limited relevance to the allocation of the advisory fee between them.
The Board also received and considered information about the nature and extent of services offered and fee rates charged by Funds Management and the Sub-Adviser to other types of clients with investment strategies similar to those of the Fund. In this regard, the Board received information about the significantly greater scope of services, and compliance, reporting and other legal burdens and risks of managing mutual funds compared with those associated with managing assets of non-mutual fund clients such as collective funds or institutional separate accounts.
Table of Contents
| 26 | Wells Fargo Advantage VT Opportunity Fund | Other information (unaudited) |
Based on its consideration of the factors and information it deemed relevant, including those described here, the Board determined that the compensation payable to Funds Management under the Management Agreement and Advisory Agreement and to the Sub-Adviser under the Sub-Advisory Agreement was reasonable, in light of the services covered by the Advisory Agreements.
Profitability
The Board received and considered information concerning the profitability of Funds Management, as well as the profitability of Wells Fargo as a whole, from providing services to the Fund and the fund family as a whole. The Board also received and considered information concerning the profitability of the Sub-Adviser from providing services to the fund family as a whole, noting that the Sub-Adviser’s profitability information with respect to providing services to the Fund was subsumed in the Wells Fargo profitability analysis.
Funds Management reported on the methodologies and estimates used in calculating profitability. Among other things, the Board noted that the levels of profitability reported on a fund-by-fund basis varied widely, depending on factors such as the size and type of fund. Based on its review, the Board did not deem the profits reported by Funds Management or Wells Fargo from its services to the Fund to be at a level that would prevent it from approving the continuation of the Advisory Agreements.
Economies of scale
With respect to possible economies of scale, the Board noted the existence of breakpoints in the Fund’s advisory and management fee structures, and the Fund’s administration fee structure, which operate generally to reduce the Fund’s expense ratios as the Fund grows in size. It considered that, for a small fund or a fund that shrinks in size, breakpoints conversely can result in higher fee levels. The Board also considered that fee waiver and expense reimbursement arrangements and competitive fee rates at the outset are means of sharing potential economies of scale with shareholders of the Fund and the fund family as a whole. The Board considered Funds Management’s view that any analyses of potential economies of scale in managing a particular fund are inherently limited in light of the joint and common costs and investments that Funds Management incurs across the fund family as a whole.
The Board concluded that the Fund’s fee and expense arrangements, including contractual breakpoints, constituted a reasonable approach to sharing potential economies of scale with the Fund and its shareholders.
Other benefits to Funds Management and the Sub-Adviser
The Board received and considered information regarding potential “fall-out” or ancillary benefits received by Funds Management and its affiliates, including the Sub-Adviser, as a result of their relationships with the Fund. Ancillary benefits could include, among others, benefits directly attributable to other relationships with the Fund and benefits potentially derived from an increase in Funds Management’s and the Sub-Adviser’s business as a result of their relationships with the Fund. The Board noted that various affiliates of Funds Management may receive distribution-related fees, shareholder servicing payments and sub-transfer agency fees in respect of shares sold or held through them and services provided.
The Board also reviewed information about soft dollar credits earned and utilized by the Sub-Adviser, fees earned by Funds Management and the Sub-Adviser from managing a private investment vehicle for the fund family’s securities lending collateral and commissions earned by an affiliated broker from portfolio transactions.
Based on its consideration of the factors and information it deemed relevant, including those described here, the Board did not find that any ancillary benefits received by Funds Management and its affiliates, including the Sub-Adviser, were unreasonable.
Conclusion
At the Meeting, after considering the above-described factors and based on its deliberations and its evaluation of the information described above, the Board unanimously approved the continuation of the Advisory Agreement for the period from June 1, 2015 through June 30, 2015, approved the Management Agreement for the period from July 1, 2015 through May 31, 2016, and approved the continuation of the Sub-Advisory Agreement for a one-year term through May 31, 2016. The Board also determined that the compensation payable to Funds Management and the Sub-Adviser under each of the Advisory Agreements was reasonable.
Table of Contents
| List of abbreviations | Wells Fargo Advantage VT Opportunity Fund | 27 |
The following is a list of common abbreviations for terms and entities that may have appeared in this report.
| ACA | — ACA Financial Guaranty Corporation |
| ADR | — American depositary receipt |
| ADS | — American depositary shares |
| AGC | — Assured Guaranty Corporation |
| AGM | — Assured Guaranty Municipal |
| Ambac | — Ambac Financial Group Incorporated |
| AMT | — Alternative minimum tax |
| AUD | — Australian dollar |
| BAN | — Bond anticipation notes |
| BHAC | — Berkshire Hathaway Assurance Corporation |
| BRL | — Brazilian real |
| CAB | — Capital appreciation bond |
| CAD | — Canadian dollar |
| CCAB | — Convertible capital appreciation bond |
| CDA | — Community Development Authority |
| CDO | — Collateralized debt obligation |
| CHF | — Swiss franc |
| COP | — Columbian Peso |
| CLP | — Chilean peso |
| DKK | — Danish krone |
| DRIVER | — Derivative inverse tax-exempt receipts |
| DW&P | — Department of Water & Power |
| DWR | — Department of Water Resources |
| ECFA | — Educational & Cultural Facilities Authority |
| EDA | — Economic Development Authority |
| EDFA | — Economic Development Finance Authority |
| ETF | — Exchange-traded fund |
| EUR | — Euro |
| FDIC | — Federal Deposit Insurance Corporation |
| FFCB | — Federal Farm Credit Banks |
| FGIC | — Financial Guaranty Insurance Corporation |
| FHA | — Federal Housing Administration |
| FHLB | — Federal Home Loan Bank |
| FHLMC | — Federal Home Loan Mortgage Corporation |
| FICO | — The Financing Corporation |
| FNMA | — Federal National Mortgage Association |
| FSA | — Farm Service Agency |
| GBP | — Great British pound |
| GDR | — Global depositary receipt |
| GNMA | — Government National Mortgage Association |
| GO | — General obligation |
| HCFR | — Healthcare facilities revenue |
| HEFA | — Health & Educational Facilities Authority |
| HEFAR | — Higher education facilities authority revenue |
| HFA | — Housing Finance Authority |
| HFFA | — Health Facilities Financing Authority |
| HKD | — Hong Kong dollar |
| HUD | — Department of Housing and Urban Development |
| HUF | — Hungarian forint |
| IDA | — Industrial Development Authority |
| IDAG | — Industrial Development Agency |
| IDR | — Indonesian rupiah |
| IEP | — Irish pound |
| JPY | — Japanese yen |
| KRW | — Republic of Korea won |
| LIBOR | — London Interbank Offered Rate |
| LIFER | — Long Inverse Floating Exempt Receipts |
| LIQ | — Liquidity agreement |
| LLC | — Limited liability company |
| LLLP | — Limited liability limited partnership |
| LLP | — Limited liability partnership |
| LOC | — Letter of credit |
| LP | — Limited partnership |
| MBIA | — Municipal Bond Insurance Association |
| MFHR | — Multifamily housing revenue |
| MSTR | — Municipal securities trust receipts |
| MTN | — Medium-term note |
| MUD | — Municipal Utility District |
| MXN | — Mexican peso |
| MYR | — Malaysian ringgit |
| National | — National Public Finance Guarantee Corporation |
| NGN | — Nigerian naira |
| NOK | — Norwegian krone |
| NZD | — New Zealand dollar |
| PCFA | — Pollution Control Financing Authority |
| PCL | — Public Company Limited |
| PCR | — Pollution control revenue |
| PFA | — Public Finance Authority |
| PFFA | — Public Facilities Financing Authority |
| PFOTER | — Puttable floating option tax-exempt receipts |
| plc | — Public limited company |
| PLN | — Polish zloty |
| PUTTER | — Puttable tax-exempt receipts |
| R&D | — Research & development |
| Radian | — Radian Asset Assurance |
| RAN | — Revenue anticipation notes |
| RDA | — Redevelopment Authority |
| RDFA | — Redevelopment Finance Authority |
| REIT | — Real estate investment trust |
| ROC | — Reset option certificates |
| RON | — Romanian lei |
| RUB | — Russian ruble |
| SAVRS | — Select auction variable rate securities |
| SBA | — Small Business Authority |
| SDR | — Swedish depositary receipt |
| SEK | — Swedish krona |
| SFHR | — Single-family housing revenue |
| SFMR | — Single-family mortgage revenue |
| SGD | — Singapore dollar |
| SPA | — Standby purchase agreement |
| SPDR | — Standard & Poor’s Depositary Receipts |
| SPEAR | — Short Puttable Exempt Adjustable Receipts |
| STRIPS | — Separate trading of registered interest and |
| principal securities |
| TAN | — Tax anticipation notes |
| TBA | — To be announced |
| THB | — Thai baht |
| TIPS | — Treasury inflation-protected securities |
| TRAN | — Tax revenue anticipation notes |
| TRY | — Turkish lira |
| TTFA | — Transportation Trust Fund Authority |
| TVA | — Tennessee Valley Authority |
| ZAR | — South African rand |
Table of Contents
This page is intentionally left blank.
Table of Contents


For more information
More information about Wells Fargo Advantage Funds is available free upon request. To obtain literature, please write, email, visit the Fund’s website, or call:
Wells Fargo Advantage Funds
P.O. Box 8266
Boston, MA 02266-8266
Email: wfaf@wellsfargo.com
Website: wellsfargoadvantagefunds.com
Individual investors: 1-800-222-8222
Retail investment professionals: 1-888-877-9275
Institutional investment professionals: 1-866-765-0778
This report and the financial statements contained herein are submitted for the general information of the shareholders of Wells Fargo Advantage Funds. If this report is used for promotional purposes, distribution of the report must be accompanied or preceded by a current prospectus. Before investing, please consider the investment objectives, risks, charges, and expenses of the investment. For a current prospectus and, if available, a summary prospectus, containing this information, call 1-800-222-8222 or visit the Fund’s website at wellsfargoadvantagefunds.com. Read the prospectus carefully before you invest or send money.
Wells Fargo Funds Management, LLC, a wholly owned subsidiary of Wells Fargo & Company, provides investment advisory and administrative services for Wells Fargo Advantage Funds. Other affiliates of Wells Fargo & Company provide subadvisory and other services for the Funds. The Funds are distributed by Wells Fargo Funds Distributor, LLC, Member FINRA/SIPC, an affiliate of Wells Fargo & Company.
NOT FDIC INSURED ¡ NO BANK GUARANTEE ¡ MAY LOSE VALUE
© 2015 Wells Fargo Funds Management, LLC. All rights reserved.
235290 08-15 SVT6/SAR143 06-15 |
Table of Contents

Wells Fargo Advantage
VT Small Cap Growth Fund

Semi-Annual Report
June 30, 2015

Table of Contents
Reduce clutter. Save trees.
Sign up for electronic delivery of prospectuses and shareholder reports at wellsfargo.com/advantagedelivery
| 2 | ||||
| 4 | ||||
| 6 | ||||
| 7 | ||||
Financial statements | ||||
| 12 | ||||
| 13 | ||||
| 14 | ||||
| 15 | ||||
| 17 | ||||
| 21 | ||||
| 27 | ||||
The views expressed and any forward-looking statements are as of June 30, 2015, unless otherwise noted, and are those of the Fund managers and/or Wells Fargo Funds Management, LLC. Discussions of individual securities, or the markets generally, or any Wells Fargo Advantage Fund are not intended as individual recommendations. Future events or results may vary significantly from those expressed in any forward-looking statements; the views expressed are subject to change at any time in response to changing circumstances in the market. Wells Fargo Funds Management, LLC and the Fund disclaim any obligation to publicly update or revise any views expressed or forward-looking statements.
NOT FDIC INSURED ¡ NO BANK GUARANTEE ¡ MAY LOSE VALUE
Table of Contents
| 2 | Wells Fargo Advantage VT Small Cap Growth Fund | Letter to shareholders (unaudited) |

Karla M. Rabusch
President
Wells Fargo Advantage Funds
The period was marked by continued low global interest rates and a slow but steady economic recovery in the U.S.
Dear Valued Shareholder:
We are pleased to offer you this semi-annual report for the Wells Fargo Advantage VT Small Cap Growth Fund for the six-month period that ended June 30, 2015. The period was marked by continued low global interest rates and a slow but steady economic recovery in the U.S. However, growing concern as to whether a newly elected anti-austerity government in Greece would default on the country’s debt and remove it from the eurozone resulted in late-period volatility for both U.S. and European stocks.
Major central banks continued to provide liquidity to the markets.
Throughout the reporting period, the Federal Open Market Committee (FOMC), which is the U.S. Federal Reserve’s (Fed’s) monetary policymaking body, kept its key interest rate effectively at zero. As the reporting period progressed, though, various comments by Fed Chair Janet Yellen led investors to believe that the FOMC would raise its key federal funds rate by late 2015. Moreover, the FOMC seemed confident that economic conditions would evolve in a way that it would most likely continue raising rates gradually over time.
In contrast, the European Central Bank (ECB) showed no signs of raising rates at any point in the near future. Rather, the ECB maintained a variety of measures aimed at encouraging lending, including making funds available to banks at low interest rates and imposing a negative interest rate on bank deposits held at the central bank. In January 2015, the bank announced quantitative easing via significant bond purchases in an attempt to raise the eurozone’s inflation to just under its target of 2%. The ECB also provided emergency liquidity to Greek banks while that country’s government negotiated with its creditors, which included the eurozone member states and the International Monetary Fund (IMF).
The prospect of a near-term rate hike in the U.S., combined with continued easing from the ECB and other major central banks, resulted in the U.S. dollar appreciating against a basket of currencies for the six-month reporting period.
Although U.S. economic growth slowed in the first quarter, market participants believed that its recovery remained on track.
Reported U.S. gross domestic product (GDP) growth came in at a solid 2.2% annualized rate in the fourth quarter of 2014. Although the final estimate for annualized GDP growth came in at a modest 0.6% in the first quarter of 2015, the slowdown was attributed to short-term factors such as a harsh winter and a long-lived strike at West Coast ports. The U.S. unemployment rate continued its slow improvement, easing from 5.7% in January 2015 to 5.3% in June.
U.S. stocks generally posted gains for the period, aided by a solid economy. However, uncertainty as to whether Greece would default on a June 30 payment to the IMF resulted in volatility and negative returns in the last month of the reporting period. The S&P 500 Index1, a measure of U.S. large-cap stocks, ended the period with a gain of 1.23%. Growth stocks outperformed value stocks in the large-cap space, and health care delivered the best return among the index’s sectors.
| 1 | The S&P 500 Index consists of 500 stocks chosen for market size, liquidity, and industry group representation. It is a market-value-weighted index with each stock’s weight in the index proportionate to its market value. You cannot invest directly in an index. |
| 2 | The Russell 2000® Index measures the performance of the 2,000 smallest companies in the Russell 3000® Index, which represents approximately 8% of the total market capitalization of the Russell 3000 Index. You cannot invest directly in an index. |
Table of Contents
| Letter to shareholders (unaudited) | Wells Fargo Advantage VT Small Cap Growth Fund | 3 |
Small-cap stocks solidly outperformed large caps for the period, with the Russell 2000® Index2 gaining 4.75%. Smaller-cap stocks often have an advantage when the U.S. dollar strengthens, as it did during the reporting period. Because larger companies tend to be globally diversified, a stronger dollar can dampen their earnings growth; smaller companies often have more of a domestic focus and thus are less likely to face currency-related headwinds. Small-cap growth stocks significantly outperformed small-cap value stocks, with the information technology sector delivering the highest returns.
Don’t let short-term uncertainty derail long-term investment goals.
Periods of uncertainty can present challenges, but experience has taught us that maintaining long-term investment goals can be an effective way to plan for the future. To help you create a sound strategy based on your personal goals and risk tolerance, Wells Fargo Advantage Funds offers more than 100 mutual funds and other investments spanning a wide range of asset classes and investment styles. Although diversification cannot guarantee an investment profit or prevent losses, we believe it can be an effective way to manage investment risk and potentially smooth out overall portfolio performance. We encourage investors to know their investments and to understand that appropriate levels of risk-taking may unlock opportunities.
Thank you for choosing to invest with Wells Fargo Advantage Funds. We appreciate your confidence in us and remain committed to helping you meet your financial needs.
Sincerely,

Karla M. Rabusch
President
Wells Fargo Advantage Funds
Smaller-cap stocks often have an advantage when the U.S. dollar strengthens, as it did during the reporting period.
Notice to shareholders
At a meeting held on August 11–12, 2015, the Board of Trustees of the Fund approved a change in the name of the Fund whereby the word “Advantage” will be removed from its name, effective December 15, 2015.
For current information about your fund investments, contact your investment professional, visit our website at wellsfargoadvantagefunds.com, or call us directly at 1-800-222-8222. We are available 24 hours a day, 7 days a week.
Table of Contents
| 4 | Wells Fargo Advantage VT Small Cap Growth Fund | Performance highlights (unaudited) |
The Fund is currently closed to new insurance companies1.
Investment objective
The Fund seeks long-term capital appreciation.
Adviser
Wells Fargo Funds Management, LLC
Subadviser
Wells Capital Management Incorporated
Portfolio managers
Joseph M. Eberhardy, CFA, CFP
Thomas C. Ognar, CFA
Bruce C. Olson, CFA
Average annual total returns2 (%) as of June 30, 2015
| Expense ratios3 (%) | ||||||||||||||||||||||
| Inception date | 1 year | 5 year | 10 year | Gross | Net4 | |||||||||||||||||
| Class 1 | 7-16-2010 | 18.80 | 17.55 | 11.74 | 0.93 | 0.93 | ||||||||||||||||
| Class 2 | 5-1-1995 | 18.49 | 17.26 | 11.60 | 1.18 | 1.18 | ||||||||||||||||
| Russell 2000™ Growth Index5 | – | 12.34 | 19.33 | 9.86 | – | – | ||||||||||||||||
Figures quoted represent past performance, which is no guarantee of future results and do not reflect the deduction of taxes that a shareholder may pay on fund distributions or the redemption of fund shares. Investment return and principal value of an investment will fluctuate so that an investor’s shares, when redeemed, may be worth more or less than their original cost. Current performance may be lower or higher than the performance data quoted, which assumes the reinvestment of dividends and capital gains. Current month-end performance is available by calling 1-800-222-8222. Performance figures of the Fund do not reflect fees charged pursuant to the terms of variable life insurance policies and variable annuity contracts. If fees had been reflected, performance would have been lower.
Index returns do not include transaction costs associated with buying and selling securities, any mutual fund fees or expenses, or any taxes. It is not possible to invest directly in an index.
Stock values fluctuate in response to the activities of individual companies and general market and economic conditions. Smaller-company stocks tend to be more volatile and less liquid than those of larger companies. Consult the Fund’s prospectus for additional information on these and other risks.
Please refer to the prospectus provided by your participating insurance company for detailed information describing the separate accounts for information regarding surrender charges, mortality and expense risk fees, and other charges that may be assessed by the participating insurance companies.
Please see footnotes on page 5.
Table of Contents
| Performance highlights (unaudited) | Wells Fargo Advantage VT Small Cap Growth Fund | 5 |
| Ten largest holdings6 (%) as of June 30, 2015 | ||||
MarketAxess Holdings Incorporated | 3.97 | |||
Acadia Healthcare Company Incorporated | 3.58 | |||
Proofpoint Incorporated | 3.37 | |||
ExamWorks Group Incorporated | 2.75 | |||
SPS Commerce Incorporated | 2.72 | |||
Envestnet Incorporated | 2.42 | |||
G-III Apparel Group Limited | 2.14 | |||
Fiesta Restaurant Group Incorporated | 2.04 | |||
The Spectranetics Corporation | 2.02 | |||
Demandware Incorporated | 1.80 | |||
| Sector distribution7 as of June 30, 2015 |
 |
| 1 | Please see the Fund’s current Statement of Additional Information for further details. |
| 2 | Historical performance shown for Class 1 shares prior to their inception reflects the performance of Class 2 shares, and includes the higher expenses applicable to Class 2 shares. If these expenses had not been included, returns would be higher. |
| 3 | Reflects the expense ratios as stated in the most recent prospectuses. The expense ratios shown are subject to change and may differ from the annualized expense ratios shown in the financial highlights of this report. |
| 4 | The Adviser has contractually committed through April 30, 2016, to waive fees and/or reimburse expenses to the extent necessary to cap the Fund’s Total Annual Fund Operating Expenses After Fee Waiver at 0.95% for Class 1 and 1.20% for Class 2. After this time, the cap may be increased or the commitment to maintain the cap may be terminated only with the approval of the Board of Trustees. Brokerage commissions, stamp duty fees, interest, taxes, acquired fund fees and expenses, and extraordinary expenses are excluded from the cap. Without this cap, the Fund’s returns would have been lower. |
| 5 | The Russell 2000® Growth Index measures the performance of those Russell 2000 companies with higher price-to-book ratios and higher forecasted growth values. You cannot invest directly in an index. |
| 6 | The ten largest holdings, excluding cash and cash equivalents, are calculated based on the value of the investments divided by total net assets of the Fund. Holdings are subject to change and may have changed since the date specified. |
| 7 | Amounts are calculated based on the total long-term investments of the Fund. These percentages are subject to change and may have changed since the date specified. |
Table of Contents
| 6 | Wells Fargo Advantage VT Small Cap Growth Fund | Fund expenses (unaudited) |
As a shareholder of the Fund, you incur ongoing costs, including management fees, distribution (12b-1) fees, and other Fund expenses. This example is intended to help you understand your ongoing costs (in dollars) of investing in the Fund and to compare these costs with the ongoing costs of investing in other mutual funds.
The example is based on an investment of $1,000 invested at the beginning of the six-month period and held for the entire period from January 1, 2015 to June 30, 2015.
Actual expenses
The “Actual” line of the table below provides information about actual account values and actual expenses. You may use the information in this line, together with the amount you invested, to estimate the expenses that you paid over the period. Simply divide your account value by $1,000 (for example, an $8,600 account value divided by $1,000 = 8.6), then multiply the result by the number in the “Actual” line under the heading entitled “Expenses Paid During Period” for your applicable class of shares to estimate the expenses you paid on your account during this period.
Hypothetical example for comparison purposes
The “Hypothetical” line of the table below provides information about hypothetical account values and hypothetical expenses based on the Fund’s actual expense ratio and an assumed rate of return of 5% per year before expenses, which is not the Fund’s actual return. The hypothetical account values and expenses may not be used to estimate the actual ending account balance or expenses you paid for the period. You may use this information to compare the ongoing costs of investing in the Fund and other funds. To do so, compare this 5% hypothetical example with the 5% hypothetical examples that appear in the shareholder reports of the other funds.
Please note that the expenses shown in the table are meant to highlight your ongoing costs only and do not reflect any separate account charges assessed by participating insurance companies. Therefore, the “Hypothetical” line of the table is useful in comparing ongoing costs only, and will not help you determine the relative total costs of owning different funds. In addition, if these separate account charges assessed by participating insurance companies were included, your costs would have been higher.
| Beginning account value 1-1-2015 | Ending account value 6-30-2015 | Expenses paid during the period¹ | Net annualized expense ratio | |||||||||||||
Class 1 | ||||||||||||||||
Actual | $ | 1,000.00 | $ | 1,138.89 | $ | 4.93 | 0.93 | % | ||||||||
Hypothetical (5% return before expenses) | $ | 1,000.00 | $ | 1,020.18 | $ | 4.66 | 0.93 | % | ||||||||
Class 2 | ||||||||||||||||
Actual | $ | 1,000.00 | $ | 1,136.55 | $ | 6.25 | 1.18 | % | ||||||||
Hypothetical (5% return before expenses) | $ | 1,000.00 | $ | 1,018.94 | $ | 5.91 | 1.18 | % | ||||||||
| 1 | Expenses paid is equal to the annualized expense ratio of each class multiplied by the average account value over the period, multiplied by the number of days in the most recent fiscal half-year divided by the number of days in the fiscal year (to reflect the one-half year period). |
Table of Contents
| Portfolio of investments—June 30, 2015 (unaudited) | Wells Fargo Advantage VT Small Cap Growth Fund | 7 |
| Security name | Shares | Value | ||||||||||
Common Stocks: 95.93% | ||||||||||||
Consumer Discretionary: 15.80% | ||||||||||||
| Auto Components: 2.51% | ||||||||||||
Gentherm Incorporated † | 90,500 | $ | 4,969,355 | |||||||||
Motorcar Parts of America Incorporated † | 72,633 | 2,185,527 | ||||||||||
| 7,154,882 | ||||||||||||
|
| |||||||||||
| Diversified Consumer Services: 1.55% | ||||||||||||
Grand Canyon Education Incorporated † | 81,100 | 3,438,640 | ||||||||||
LifeLock Incorporated † | 60,800 | 997,120 | ||||||||||
| 4,435,760 | ||||||||||||
|
| |||||||||||
| Hotels, Restaurants & Leisure: 5.50% | ||||||||||||
Fiesta Restaurant Group Incorporated † | 116,376 | 5,818,800 | ||||||||||
Jack in the Box Incorporated | 30,200 | 2,662,432 | ||||||||||
La Quinta Holdings Incorporated † | 141,866 | 3,241,638 | ||||||||||
The Habit Restaurants Incorporated Class A †« | 76,091 | 2,380,887 | ||||||||||
Zoe’s Kitchen Incorporated †« | 39,253 | 1,607,018 | ||||||||||
| 15,710,775 | ||||||||||||
|
| |||||||||||
| Leisure Products: 0.70% | ||||||||||||
Performance Sports Group Limited † | 110,963 | 1,997,334 | ||||||||||
|
| |||||||||||
| Media: 0.93% | ||||||||||||
IMAX Corporation † | 66,000 | 2,657,820 | ||||||||||
|
| |||||||||||
| Specialty Retail: 2.46% | ||||||||||||
Boot Barn Holdings Incorporated † | 102,211 | 3,270,752 | ||||||||||
Five Below Incorporated † | 51,478 | 2,034,925 | ||||||||||
Lithia Motors Incorporated Class A | 15,200 | 1,720,032 | ||||||||||
| 7,025,709 | ||||||||||||
|
| |||||||||||
| Textiles, Apparel & Luxury Goods: 2.15% | ||||||||||||
G-III Apparel Group Limited † | 87,000 | 6,120,450 | ||||||||||
|
| |||||||||||
Consumer Staples: 0.76% | ||||||||||||
| Food & Staples Retailing: 0.76% | ||||||||||||
United Natural Foods Incorporated † | 34,100 | 2,171,488 | ||||||||||
|
| |||||||||||
Energy: 2.73% | ||||||||||||
| Oil, Gas & Consumable Fuels: 2.73% | ||||||||||||
Matador Resources Company † | 53,123 | 1,328,075 | ||||||||||
Parsley Energy Incorporated Class A † | 107,520 | 1,872,998 | ||||||||||
PDC Energy Incorporated † | 35,900 | 1,925,676 | ||||||||||
RSP Permian Incorporated † | 94,551 | 2,657,829 | ||||||||||
| 7,784,578 | ||||||||||||
|
| |||||||||||
The accompanying notes are an integral part of these financial statements.
Table of Contents
| 8 | Wells Fargo Advantage VT Small Cap Growth Fund | Portfolio of investments—June 30, 2015 (unaudited) |
| Security name | Shares | Value | ||||||||||
Financials: 6.63% | ||||||||||||
| Capital Markets: 1.24% | ||||||||||||
Financial Engines Incorporated « | 83,300 | $ | 3,538,584 | |||||||||
|
| |||||||||||
| Consumer Finance: 1.29% | ||||||||||||
Portfolio Recovery Associates Incorporated † | 59,295 | 3,694,671 | ||||||||||
|
| |||||||||||
| Diversified Financial Services: 3.97% | ||||||||||||
MarketAxess Holdings Incorporated | 122,278 | 11,343,730 | ||||||||||
|
| |||||||||||
| Thrifts & Mortgage Finance: 0.13% | ||||||||||||
LendingTree Incorporated † | 4,600 | 361,606 | ||||||||||
|
| |||||||||||
Health Care: 33.47% | ||||||||||||
| Biotechnology: 6.13% | ||||||||||||
Exact Sciences Corporation †« | 99,108 | 2,947,472 | ||||||||||
Ligand Pharmaceuticals Incorporated † | 17,300 | 1,745,570 | ||||||||||
PTC Therapeutics Incorporated † | 75,600 | 3,638,628 | ||||||||||
Radius Health Incorporated † | 8,638 | 584,793 | ||||||||||
Repligen Corporation † | 89,400 | 3,689,538 | ||||||||||
Retrophin Incorporated † | 44,000 | 1,458,600 | ||||||||||
Spark Therapeutics Incorporated †« | 24,117 | 1,453,532 | ||||||||||
Ultragenyx Pharmaceutical Incorporated † | 19,400 | 1,986,366 | ||||||||||
| 17,504,499 | ||||||||||||
|
| |||||||||||
| Health Care Equipment & Supplies: 9.42% | ||||||||||||
Align Technology Incorporated † | 21,600 | 1,354,536 | ||||||||||
Cardiovascular Systems Incorporated † | 143,901 | 3,806,181 | ||||||||||
Cynosure Incorporated Class A † | 91,977 | 3,548,473 | ||||||||||
DexCom Incorporated † | 58,060 | 4,643,639 | ||||||||||
Endologix Incorporated † | 80,545 | 1,235,560 | ||||||||||
Entellus Medical Incorporated †« | 34,492 | 892,308 | ||||||||||
Glaukos Corporation † | 47,890 | 1,387,852 | ||||||||||
Nevro Corporation † | 23,239 | 1,249,096 | ||||||||||
NxStage Medical Incorporated † | 186,320 | 2,661,581 | ||||||||||
Tandem Diabetes Care Incorporated †« | 33,575 | 363,953 | ||||||||||
The Spectranetics Corporation † | 250,267 | 5,758,644 | ||||||||||
| 26,901,823 | ||||||||||||
|
| |||||||||||
| Health Care Providers & Services: 11.85% | ||||||||||||
AAC Holdings Incorporated †« | 56,468 | 2,459,746 | ||||||||||
Acadia Healthcare Company Incorporated † | 130,500 | 10,222,065 | ||||||||||
Adeptus Health Incorporated Class A † | 32,668 | 3,103,133 | ||||||||||
Diplomat Pharmacy Incorporated † | 62,439 | 2,794,145 | ||||||||||
ExamWorks Group Incorporated † | 200,556 | 7,841,740 | ||||||||||
HealthEquity Incorporated † | 131,685 | 4,220,504 | ||||||||||
Team Health Holdings Incorporated † | 44,100 | 2,881,053 | ||||||||||
Teladoc Incorporated † | 16,106 | 306,014 | ||||||||||
| 33,828,400 | ||||||||||||
|
| |||||||||||
The accompanying notes are an integral part of these financial statements.
Table of Contents
| Portfolio of investments—June 30, 2015 (unaudited) | Wells Fargo Advantage VT Small Cap Growth Fund | 9 |
| Security name | Shares | Value | ||||||||||
| Health Care Technology: 0.48% | ||||||||||||
Medidata Solutions Incorporated † | 25,500 | $ | 1,385,160 | |||||||||
|
| |||||||||||
| Life Sciences Tools & Services: 1.09% | ||||||||||||
ICON plc ADR † | 30,900 | 2,079,570 | ||||||||||
INC Research Holdings Incorporated Class A † | 25,400 | 1,019,048 | ||||||||||
| 3,098,618 | ||||||||||||
|
| |||||||||||
| Pharmaceuticals: 4.50% | ||||||||||||
Akorn Incorporated † | 88,515 | 3,864,565 | ||||||||||
ANI Pharmaceuticals Incorporated †« | 31,300 | 1,942,165 | ||||||||||
Horizon Pharma plc †« | 101,954 | 3,541,882 | ||||||||||
Intersect ENT Incorporated † | 121,951 | 3,491,457 | ||||||||||
| 12,840,069 | ||||||||||||
|
| |||||||||||
Industrials: 8.12% | ||||||||||||
| Aerospace & Defense: 0.40% | ||||||||||||
TASER International Incorporated †« | 34,300 | 1,142,533 | ||||||||||
|
| |||||||||||
| Air Freight & Logistics: 1.22% | ||||||||||||
XPO Logistics Incorporated †« | 77,200 | 3,487,896 | ||||||||||
|
| |||||||||||
| Building Products: 1.19% | ||||||||||||
Apogee Enterprises Incorporated | 33,200 | 1,747,648 | ||||||||||
Trex Company Incorporated † | 33,600 | 1,660,848 | ||||||||||
| 3,408,496 | ||||||||||||
|
| |||||||||||
| Electrical Equipment: 1.12% | ||||||||||||
Power Solutions International Incorporated †« | 58,919 | 3,182,804 | ||||||||||
|
| |||||||||||
| Machinery: 0.60% | ||||||||||||
Milacron Holdings Corporation † | 86,697 | 1,706,197 | ||||||||||
|
| |||||||||||
| Professional Services: 3.59% | ||||||||||||
CEB Incorporated | 17,241 | 1,501,001 | ||||||||||
On Assignment Incorporated † | 121,381 | 4,767,846 | ||||||||||
Wageworks Incorporated † | 98,328 | 3,977,368 | ||||||||||
| 10,246,215 | ||||||||||||
|
| |||||||||||
Information Technology: 28.22% | ||||||||||||
| Communications Equipment: 0.68% | ||||||||||||
Infinera Corporation † | 91,800 | 1,925,964 | ||||||||||
|
| |||||||||||
| Internet Software & Services: 10.60% | ||||||||||||
Demandware Incorporated † | 72,200 | 5,131,976 | ||||||||||
Envestnet Incorporated † | 170,641 | 6,899,016 | ||||||||||
HomeAway Incorporated † | 99,754 | 3,104,344 | ||||||||||
Hortonworks Incorporated †« | 39,118 | 990,468 | ||||||||||
Marketo Incorporated † | 48,000 | 1,346,880 | ||||||||||
MaxPoint Interactive Incorporated † | 118,784 | 959,775 | ||||||||||
The accompanying notes are an integral part of these financial statements.
Table of Contents
| 10 | Wells Fargo Advantage VT Small Cap Growth Fund | Portfolio of investments—June 30, 2015 (unaudited) |
| Security name | Shares | Value | ||||||||||||
| Internet Software & Services (continued) | ||||||||||||||
Q2 Holdings Incorporated † | 113,696 | $ | 3,211,912 | |||||||||||
SPS Commerce Incorporated † | 117,971 | 7,762,492 | ||||||||||||
Xactly Corporation † | 100,398 | 862,419 | ||||||||||||
| 30,269,282 | ||||||||||||||
|
| |||||||||||||
| IT Services: 1.77% | ||||||||||||||
InterXion Holding NV † | 100,100 | 2,767,765 | ||||||||||||
MAXIMUS Incorporated | 21,600 | 1,419,768 | ||||||||||||
WEX Incorporated † | 7,494 | 854,091 | ||||||||||||
| 5,041,624 | ||||||||||||||
|
| |||||||||||||
| Semiconductors & Semiconductor Equipment: 0.61% | ||||||||||||||
Cavium Incorporated † | 25,200 | 1,734,012 | ||||||||||||
|
| |||||||||||||
| Software: 14.56% | ||||||||||||||
Barracuda Networks Incorporated † | 47,496 | 1,881,792 | ||||||||||||
Callidus Software Incorporated † | 187,334 | 2,918,664 | ||||||||||||
Fleetmatics Group plc † | 87,409 | 4,093,363 | ||||||||||||
Guidewire Software Incorporated † | 41,000 | 2,170,130 | ||||||||||||
HubSpot Incorporated † | 49,358 | 2,447,170 | ||||||||||||
MobileIron Incorporated †« | 177,045 | 1,046,336 | ||||||||||||
Paycom Software Incorporated † | 41,600 | 1,420,640 | ||||||||||||
Paylocity Holding Corporation † | 51,527 | 1,847,243 | ||||||||||||
Proofpoint Incorporated † | 151,300 | 9,633,271 | ||||||||||||
PROS Holdings Incorporated † | 30,127 | 635,981 | ||||||||||||
Qlik Technologies Incorporated † | 62,300 | 2,178,008 | ||||||||||||
Qualys Incorporated †« | 40,700 | 1,642,245 | ||||||||||||
Synchronoss Technologies Incorporated † | 95,858 | 4,383,586 | ||||||||||||
Tyler Technologies Incorporated † | 22,270 | 2,881,293 | ||||||||||||
Ultimate Software Group Incorporated † | 14,600 | 2,399,364 | ||||||||||||
| 41,579,086 | ||||||||||||||
|
| |||||||||||||
Telecommunication Services: 0.20% | ||||||||||||||
| Wireless Telecommunication Services: 0.20% | ||||||||||||||
Ringcentral Incorporated Class A † | 31,200 | 576,888 | ||||||||||||
|
| |||||||||||||
Total Common Stocks (Cost $204,613,974) | 273,856,953 | |||||||||||||
|
| |||||||||||||
| Yield | ||||||||||||||
| Short-Term Investments: 15.58% | ||||||||||||||
| Investment Companies: 15.58% | ||||||||||||||
Securities Lending Cash Investments, LLC (l)(r)(u) | 0.13 | % | 31,039,575 | 31,039,575 | ||||||||||
Wells Fargo Advantage Cash Investment Money Market Fund, Select Class (l)(u) | 0.12 | 13,447,356 | 13,447,356 | |||||||||||
Total Short-Term Investments (Cost $44,486,931) | 44,486,931 | |||||||||||||
|
| |||||||||||||
| Total investments in securities (Cost $249,100,905) * | 111.51 | % | 318,343,884 | |||||
Other assets and liabilities, net | (11.51 | ) | (32,859,544 | ) | ||||
|
|
|
| |||||
| Total net assets | 100.00 | % | $ | 285,484,340 | ||||
|
|
|
|
The accompanying notes are an integral part of these financial statements.
Table of Contents
| Portfolio of investments—June 30, 2015 (unaudited) | Wells Fargo Advantage VT Small Cap Growth Fund | 11 |
| † | Non-income-earning security |
| « | All or a portion of this security is on loan. |
| (l) | The security represents an affiliate of the Fund as defined in the Investment Company Act of 1940. |
| (r) | The investment is a non-registered investment vehicle purchased with cash collateral received from securities on loan. |
| (u) | The rate represents the 7-day annualized yield at period end. |
| * | Cost for federal income tax purposes is $249,362,208 and unrealized gains (losses) consists of: |
Gross unrealized gains | $ | 74,450,230 | ||
Gross unrealized losses | (5,468,554 | ) | ||
|
| |||
Net unrealized gains | $ | 68,981,676 |
The accompanying notes are an integral part of these financial statements.
Table of Contents
| 12 | Wells Fargo Advantage VT Small Cap Growth Fund | Statement of assets and liabilities—June 30, 2015 (unaudited) |
Assets | ||||
Investments | ||||
In unaffiliated securities (including $30,291,855 of securities loaned), at value (cost $204,613,974) | $ | 273,856,953 | ||
In affiliated securities, at value (cost $44,486,931) | 44,486,931 | |||
|
| |||
Total investments, at value (cost $249,100,905) | 318,343,884 | |||
Receivable for investments sold | 1,578,066 | |||
Receivable for Fund shares sold | 82,054 | |||
Receivable for dividends | 6,806 | |||
Receivable for securities lending income | 18,614 | |||
|
| |||
Total assets | 320,029,424 | |||
|
| |||
Liabilities | ||||
Payable for investments purchased | 2,971,938 | |||
Payable for Fund shares redeemed | 235,479 | |||
Payable upon receipt of securities loaned | 31,039,575 | |||
Advisory fee payable | 174,663 | |||
Distribution fee payable | 52,120 | |||
Administration fees payable | 30,275 | |||
Accrued expenses and other liabilities | 41,034 | |||
|
| |||
Total liabilities | 34,545,084 | |||
|
| |||
Total net assets | $ | 285,484,340 | ||
|
| |||
NET ASSETS CONSIST OF | ||||
Paid-in capital | $ | 165,128,968 | ||
Accumulated net investment loss | (1,310,641 | ) | ||
Accumulated net realized gains on investments | 52,423,034 | |||
Net unrealized gains on investments | 69,242,979 | |||
|
| |||
Total net assets | $ | 285,484,340 | ||
|
| |||
COMPUTATION OF NET ASSET VALUE PER SHARE | ||||
Net assets – Class 1 | $ | 29,787,698 | ||
Shares outstanding – Class 11 | 2,595,973 | |||
Net asset value per share – Class 1 | $11.47 | |||
Net assets – Class 2 | $ | 255,696,642 | ||
Shares outstanding – Class 21 | 22,589,364 | |||
Net asset value per share – Class 2 | $11.32 | |||
| 1 | The Fund has an unlimited number of authorized shares. |
The accompanying notes are an integral part of these financial statements.
Table of Contents
| Statement of operations—six months ended June 30, 2015 (unaudited) | Wells Fargo Advantage VT Small Cap Growth Fund | 13 |
Investment income | ||||
Securities lending income, net | $ | 111,679 | ||
Dividends | 101,055 | |||
Income from affiliated securities | 3,607 | |||
|
| |||
Total investment income | 216,341 | |||
|
| |||
Expenses | ||||
Advisory fee | 992,117 | |||
Administration fees | ||||
Fund level | 66,141 | |||
Class 1 | 11,357 | |||
Class 2 | 94,469 | |||
Distribution fee | ||||
Class 2 | 295,216 | |||
Custody and accounting fees | 13,037 | |||
Professional fees | 21,726 | |||
Shareholder report expenses | 18,814 | |||
Trustees’ fees and expenses | 6,971 | |||
Other fees and expenses | 5,837 | |||
|
| |||
Total expenses | 1,525,685 | |||
|
| |||
Net investment loss | (1,309,344 | ) | ||
|
| |||
REALIZED AND UNREALIZED GAINS (LOSSES) ON INVESTMENTS | ||||
Net realized gains on investments | 20,073,373 | |||
Net change in unrealized gains (losses) on investments | 15,153,182 | |||
|
| |||
Net realized and unrealized gains (losses) on investments | 35,226,555 | |||
|
| |||
Net increase in net assets resulting from operations | $ | 33,917,211 | ||
|
| |||
The accompanying notes are an integral part of these financial statements.
Table of Contents
| 14 | Wells Fargo Advantage VT Small Cap Growth Fund | Statement of changes in net assets |
Six months ended (unaudited) | Year ended December 31, 2014 | |||||||||||||||
Operations | ||||||||||||||||
Net investment loss | $ | (1,309,344 | ) | $ | (2,505,133 | ) | ||||||||||
Net realized gains on investments | 20,073,373 | 32,565,720 | ||||||||||||||
Net change in unrealized gains (losses) on investments | 15,153,182 | (37,633,951 | ) | |||||||||||||
|
| |||||||||||||||
Net increase (decrease) in net assets resulting from operations | 33,917,211 | (7,573,364 | ) | |||||||||||||
|
| |||||||||||||||
Distributions to shareholders from | ||||||||||||||||
Net realized gains | ||||||||||||||||
Class 1 | 0 | (2,634,770 | ) | |||||||||||||
Class 2 | 0 | (21,413,772 | ) | |||||||||||||
|
| |||||||||||||||
Total distributions to shareholders | 0 | (24,048,542 | ) | |||||||||||||
|
| |||||||||||||||
Capital share transactions | Shares | Shares | ||||||||||||||
Proceeds from shares sold | ||||||||||||||||
Class 1 | 149,048 | 1,645,182 | 336,122 | 3,459,281 | ||||||||||||
Class 2 | 2,553,751 | 27,719,590 | 2,516,342 | 25,941,725 | ||||||||||||
|
| |||||||||||||||
| 29,364,772 | 29,401,006 | |||||||||||||||
|
| |||||||||||||||
Reinvestment of distributions | ||||||||||||||||
Class 1 | 0 | 0 | 284,840 | 2,634,770 | ||||||||||||
Class 2 | 0 | 0 | 2,340,303 | 21,413,772 | ||||||||||||
|
| |||||||||||||||
| 0 | 24,048,542 | |||||||||||||||
|
| |||||||||||||||
Payment for shares redeemed | ||||||||||||||||
Class 1 | (342,131 | ) | (3,643,849 | ) | (939,801 | ) | (9,527,061 | ) | ||||||||
Class 2 | (2,755,915 | ) | (29,240,493 | ) | (4,381,681 | ) | (42,879,278 | ) | ||||||||
|
| |||||||||||||||
| (32,884,342 | ) | (52,406,339 | ) | |||||||||||||
|
| |||||||||||||||
Net increase (decrease) in net assets resulting from capital share transactions | (3,519,570 | ) | 1,043,209 | |||||||||||||
|
| |||||||||||||||
Total increase (decrease) in net assets | 30,397,641 | (30,578,697 | ) | |||||||||||||
|
| |||||||||||||||
Net assets | ||||||||||||||||
Beginning of period | 255,086,699 | 285,665,396 | ||||||||||||||
|
| |||||||||||||||
End of period | $ | 285,484,340 | $ | 255,086,699 | ||||||||||||
|
| |||||||||||||||
Accumulated net investment loss | $ | (1,310,641 | ) | $ | (1,297 | ) | ||||||||||
|
| |||||||||||||||
The accompanying notes are an integral part of these financial statements.
Table of Contents
| Financial highlights | Wells Fargo Advantage VT Small Cap Growth Fund | 15 |
(For a share outstanding throughout each period)
| Six months ended June 30, 2015 (unaudited) | Year ended December 31 | |||||||||||||||||||||||
| CLASS 1 | 2014 | 2013 | 2012 | 2011 | 20101 | |||||||||||||||||||
Net asset value, beginning of period | $10.08 | $11.32 | $7.93 | $7.71 | $8.06 | $6.26 | ||||||||||||||||||
Net investment loss | (0.03 | ) | (0.07 | ) | (0.07 | ) | (0.04 | ) | (0.06 | ) | (0.02 | ) | ||||||||||||
Net realized and unrealized gains (losses) on investments | 1.42 | (0.21 | ) | 3.98 | 0.65 | (0.29 | ) | 1.82 | ||||||||||||||||
|
|
|
|
|
|
|
|
|
|
|
| |||||||||||||
Total from investment operations | 1.39 | (0.28 | ) | 3.91 | 0.61 | (0.35 | ) | 1.80 | ||||||||||||||||
Distributions to shareholders from | ||||||||||||||||||||||||
Net realized gains | 0.00 | (0.96 | ) | (0.52 | ) | (0.39 | ) | 0.00 | 0.00 | |||||||||||||||
Net asset value, end of period | $11.47 | $10.08 | $11.32 | $7.93 | $7.71 | $8.06 | ||||||||||||||||||
Total return2 | 13.89 | % | (1.67 | )% | 50.55 | % | 8.11 | % | (4.34 | )% | 26.93 | % | ||||||||||||
Ratios to average net assets (annualized) | ||||||||||||||||||||||||
Gross expenses | 0.93 | % | 0.93 | % | 0.93 | % | 0.94 | % | 0.94 | % | 0.95 | % | ||||||||||||
Net expenses | 0.93 | % | 0.93 | % | 0.93 | % | 0.94 | % | 0.94 | % | 0.95 | % | ||||||||||||
Net investment loss | (0.77 | )% | (0.75 | )% | (0.73 | )% | (0.56 | )% | (0.73 | )% | (0.58 | )% | ||||||||||||
Supplemental data | ||||||||||||||||||||||||
Portfolio turnover rate | 38 | % | 54 | % | 67 | % | 65 | % | 118 | % | 71 | % | ||||||||||||
Net assets, end of period (000s omitted) | $29,788 | $28,121 | $35,192 | $25,699 | $29,351 | $42,434 | ||||||||||||||||||
| 1 | For the period from July 16, 2010 (commencement of class operations) to December 31, 2010 |
| 2 | Returns for periods of less than one year are not annualized. |
The accompanying notes are an integral part of these financial statements.
Table of Contents
| 16 | Wells Fargo Advantage VT Small Cap Growth Fund | Financial highlights |
(For a share outstanding throughout each period)
| Six months ended June 30, 2015 (unaudited) | Year ended December 31 | |||||||||||||||||||||||
| CLASS 2 | 2014 | 2013 | 2012 | 2011 | 20101 | |||||||||||||||||||
Net asset value, beginning of period | $9.96 | $11.22 | $7.88 | $7.68 | $8.05 | $6.35 | ||||||||||||||||||
Net investment loss | (0.05 | ) | (0.10 | ) | (0.09 | ) | (0.07 | ) | (0.09 | ) | (0.06 | ) | ||||||||||||
Net realized and unrealized gains (losses) on investments | 1.41 | (0.20 | ) | 3.95 | 0.66 | (0.28 | ) | 1.76 | ||||||||||||||||
|
|
|
|
|
|
|
|
|
|
|
| |||||||||||||
Total from investment operations | 1.36 | (0.30 | ) | 3.86 | 0.59 | (0.37 | ) | 1.70 | ||||||||||||||||
Distributions to shareholders from | ||||||||||||||||||||||||
Net realized gains | 0.00 | (0.96 | ) | (0.52 | ) | (0.39 | ) | 0.00 | 0.00 | |||||||||||||||
Net asset value, end of period | $11.32 | $9.96 | $11.22 | $7.88 | $7.68 | $8.05 | ||||||||||||||||||
Total return2 | 13.65 | % | (1.88 | )% | 50.23 | % | 7.87 | % | (4.60 | )% | 26.77 | % | ||||||||||||
Ratios to average net assets (annualized) | ||||||||||||||||||||||||
Gross expenses | 1.18 | % | 1.18 | % | 1.18 | % | 1.19 | % | 1.20 | % | 1.22 | % | ||||||||||||
Net expenses | 1.18 | % | 1.18 | % | 1.18 | % | 1.19 | % | 1.19 | % | 1.20 | % | ||||||||||||
Net investment loss | (1.02 | )% | (1.00 | )% | (0.98 | )% | (0.81 | )% | (0.98 | )% | (0.82 | )% | ||||||||||||
Supplemental data | ||||||||||||||||||||||||
Portfolio turnover rate | 38 | % | 54 | % | 67 | % | 65 | % | 118 | % | 71 | % | ||||||||||||
Net assets, end of period (000s omitted) | $255,697 | $226,966 | $250,473 | $182,213 | $203,348 | $247,246 | ||||||||||||||||||
| 1 | After the close of business on July 16, 2010, existing shares of the Fund were renamed Class 2 shares. |
| 2 | Returns for periods of less than one year are not annualized. |
The accompanying notes are an integral part of these financial statements.
Table of Contents
| Notes to financial statements (unaudited) | Wells Fargo Advantage VT Small Cap Growth Fund | 17 |
1. ORGANIZATION
Wells Fargo Variable Trust (the “Trust”), a Delaware statutory trust organized on March 10, 1999, is an open-end management investment company registered under the Investment Company Act of 1940, as amended (the “1940 Act”). As an investment company, the Trust follows the accounting and reporting guidance in Financial Accounting Standards Board (“FASB”) Accounting Standards Codification Topic 946, Financial Services – Investment Companies. These financial statements report on the Wells Fargo Advantage VT Small Cap Growth Fund (the “Fund”) which is a diversified series of the Trust.
2. SIGNIFICANT ACCOUNTING POLICIES
The following significant accounting policies, which are consistently followed in the preparation of the financial statements of the Fund, are in conformity with U.S. generally accepted accounting principles which require management to make estimates and assumptions that affect the reported amounts of assets and liabilities, disclosure of contingent assets and liabilities at the date of the financial statements, and the reported amounts of revenues and expenses during the reporting period. Actual results could differ from those estimates.
Securities valuation
All investments are valued each business day as of the close of regular trading on the New York Stock Exchange (generally 4 p.m. Eastern Time).
Equity securities that are listed on a foreign or domestic exchange or market are valued at the official closing price or, if none, the last sales price. If no sale occurs on the primary exchange or market that day, the prior day’s price will be deemed “stale” and a fair value price will be determined in accordance with the Fund’s Valuation Procedures.
Equity securities that are not listed on a foreign or domestic exchange or market, but have a public trading market, are valued at the quoted bid price from an independent broker-dealer that the Management Valuation Team of Wells Fargo Funds Management, LLC (“Funds Management”) has determined is an acceptable source.
Investments in registered open-end investment companies are valued at net asset value. Interests in non-registered investment vehicles that are redeemable at net asset value are fair valued at net asset value when available.
Investments which are not valued using any of the methods discussed above are valued at their fair value, as determined in good faith by the Board of Trustees of the Fund. The Board of Trustees has established a Valuation Committee comprised of the Trustees and has delegated to it the authority to take any actions regarding the valuation of portfolio securities that the Valuation Committee deems necessary or appropriate, including determining the fair value of portfolio securities, unless the determination has been delegated to the Management Valuation Team. The Board of Trustees retains the authority to make or ratify any valuation decisions or approve any changes to the Valuation Procedures as it deems appropriate. On a quarterly basis, the Board of Trustees receives reports on any valuation actions taken by the Valuation Committee or the Management Valuation Team which may include items for ratification.
Valuations of fair valued securities are compared to the next actual sales price when available, or other appropriate market values, to assess the continued appropriateness of the fair valuation methodologies used. These securities are fair valued on a day-to-day basis, taking into consideration changes to appropriate market information and any significant changes to the inputs considered in the valuation process until there is a readily available price provided on an exchange or by an independent pricing service. Valuations received from an independent pricing service or independent broker-dealer quotes are periodically validated by comparisons to most recent trades and valuations provided by other independent pricing services in addition to the review of prices by the adviser and/or subadviser. Unobservable inputs used in determining fair valuations are identified based on the type of security, taking into consideration factors utilized by market participants in valuing the investment, knowledge about the issuer and the current market environment.
Security loans
The Fund may lend its securities from time to time in order to earn additional income in the form of fees or interest on securities received as collateral or the investment of any cash received as collateral. The Fund continues to receive interest or dividends on the securities loaned. The Fund receives collateral in the form of cash or securities with a value at least equal to the value of the securities on loan. The value of the loaned securities is determined at the close of each business day and any additional required collateral is delivered to the Fund on the next business day. In a securities lending transaction, the net asset value of the Fund will be affected by an increase or decrease in the value of the securities loaned and by an increase or decrease in the value of the instrument in which collateral is invested. The amount of securities lending activity undertaken by the Fund fluctuates from time to time. In the event of default or bankruptcy by the borrower, the Fund may be prevented from recovering the loaned securities or gaining access to the collateral or
Table of Contents
| 18 | Wells Fargo Advantage VT Small Cap Growth Fund | Notes to financial statements (unaudited) |
may experience delays or costs in doing so. In addition, the investment of any cash collateral received may lose all or part of its value. The Fund has the right under the lending agreement to recover the securities from the borrower on demand.
The Fund lends its securities through an unaffiliated securities lending agent. Cash collateral received in connection with its securities lending transactions is invested in Securities Lending Cash Investments, LLC (the “Securities Lending Fund”). The Securities Lending Fund is exempt from registration under Section 3(c)(7) of the 1940 Act and is managed by Funds Management and is subadvised by Wells Capital Management Incorporated (“WellsCap”). Funds Management receives an advisory fee starting at 0.05% and declining to 0.01% as the average daily net assets of the Securities Lending Fund increase. All of the fees received by Funds Management are paid to WellsCap for its services as subadviser. The Securities Lending Fund seeks to provide a positive return compared to the daily Fed Funds Open rate by investing in high-quality, U.S. dollar-denominated short-term money market instruments. Securities Lending Fund investments are fair valued based upon the amortized cost valuation technique. Income earned from investment in the Securities Lending Fund is included in securities lending income on the Statement of Operations.
Security transactions and income recognition
Securities transactions are recorded on a trade date basis. Realized gains or losses are recorded on the basis of identified cost.
Dividend income is recognized on the ex-dividend date.
Distributions to shareholders
Distributions to shareholders from net investment income and net realized gains, if any, are recorded on the ex-dividend date. Such distributions are determined in conformity with federal income tax regulations, which may differ in amount or character from net investment income and realized gains recognized for purposes of U.S. generally accepted accounting principles.
Federal and other taxes
The Fund intends to continue to qualify as a regulated investment company by distributing substantially all of its investment company taxable income and any net realized capital gains (after reduction for capital loss carryforwards) sufficient to relieve it from all, or substantially all, federal income taxes. Accordingly, no provision for federal income taxes was required.
The Fund’s income and federal excise tax returns and all financial records supporting those returns for the prior three fiscal years are subject to examination by the federal and Delaware revenue authorities. Management has analyzed the Fund’s tax positions taken on federal, state, and foreign tax returns for all open tax years and does not believe that there are any uncertain tax positions that require recognition of a tax liability.
Class allocations
The separate classes of shares offered by the Fund differ principally in distribution fees. Class specific expenses are charged directly to that share class. Investment income, common expenses and realized and unrealized gains (losses) on investments are allocated daily to each class of shares based on the relative proportion of net assets of each class.
3. FAIR VALUATION MEASUREMENTS
Fair value measurements of investments are determined within a framework that has established a fair value hierarchy based upon the various data inputs utilized in determining the value of the Fund’s investments. The three-level hierarchy gives the highest priority to unadjusted quoted prices in active markets for identical assets or liabilities (Level 1) and the lowest priority to significant unobservable inputs (Level 3). The Fund’s investments are classified within the fair value hierarchy based on the lowest level of input that is significant to the fair value measurement. The inputs are summarized into three broad levels as follows:
| n | Level 1 – quoted prices in active markets for identical securities |
| n | Level 2 – other significant observable inputs (including quoted prices for similar securities, interest rates, prepayment speeds, credit risk, use of amortized cost, etc.) |
| n | Level 3 – significant unobservable inputs (including the Fund’s own assumptions in determining the fair value of investments) |
The inputs or methodologies used for valuing investments in securities are not necessarily an indication of the risk associated with investing in those securities.
Table of Contents
| Notes to financial statements (unaudited) | Wells Fargo Advantage VT Small Cap Growth Fund | 19 |
The following is a summary of the inputs used in valuing the Fund’s assets and liabilities as of June 30, 2015:
| Quoted prices (Level 1) | Other significant observable inputs (Level 2) | Significant unobservable inputs (Level 3) | Total | |||||||||||||
Assets | ||||||||||||||||
Investments in: | ||||||||||||||||
Common stocks | ||||||||||||||||
Consumer discretionary | $ | 45,102,730 | $ | 0 | $ | 0 | $ | 45,102,730 | ||||||||
Consumer staples | 2,171,488 | 0 | 0 | 2,171,488 | ||||||||||||
Energy | 7,784,578 | 0 | 0 | 7,784,578 | ||||||||||||
Financials | 18,938,591 | 0 | 0 | 18,938,591 | ||||||||||||
Health care | 95,558,569 | 0 | 0 | 95,558,569 | ||||||||||||
Industrials | 23,174,141 | 0 | 0 | 23,174,141 | ||||||||||||
Information technology | 80,549,968 | 0 | 0 | 80,549,968 | ||||||||||||
Telecommunication services | 576,888 | 0 | 0 | 576,888 | ||||||||||||
Short-term investments | ||||||||||||||||
Investment companies | 13,447,356 | 31,039,575 | 0 | 44,486,931 | ||||||||||||
Total assets | $ | 287,304,309 | $ | 31,039,575 | $ | 0 | $ | 318,343,884 | ||||||||
The Fund recognizes transfers between levels within the fair value hierarchy at the end of the reporting period. At June 30, 2015, the Fund did not have any transfers into/out of Level 1, Level 2, or Level 3.
4. TRANSACTIONS WITH AFFILIATES
Advisory fee
The Trust has entered into an advisory contract with Funds Management, an indirect wholly owned subsidiary of Wells Fargo & Company (“Wells Fargo”). The adviser is responsible for implementing investment policies and guidelines and for supervising the subadviser, who is responsible for day-to-day portfolio management of the Fund.
Pursuant to the contract, Funds Management is entitled to receive an annual advisory fee starting at 0.75% and declining to 0.60% as the average daily net assets of the Fund increase. For the six months ended June 30, 2015, the advisory fee was equivalent to an annual rate of 0.75% of the Fund’s average daily net assets.
Funds Management has retained the services of a subadviser to provide daily portfolio management to the Fund. The fee for subadvisory services is borne by Funds Management. WellsCap, an affiliate of Funds Management and an indirect wholly owned subsidiary of Wells Fargo, is the subadviser to the Fund and is entitled to receive a fee from Funds Management at an annual rate starting at 0.55% and declining to 0.40% as the average daily net assets of the Fund increase.
Administration fees
The Trust has entered into an administration agreement with Funds Management. Under this agreement, for providing administrative services, which includes paying fees and expenses for services provided by the transfer agent, sub-transfer agents, omnibus account servicers and record-keepers, Funds Management is entitled to receive from the Fund an annual fund level administration fee starting at 0.05% and declining to 0.03% as the average daily net assets of the Fund increase and a class level administration fee of 0.08% of the average daily net assets of each class.
Funds Management has contractually waived and/or reimbursed advisory and administration fees to the extent necessary to maintain certain net operating expense ratios for the Fund. Waiver of fees and/or reimbursement of expenses by Funds Management were made first from fund level expenses on a proportionate basis and then from class specific expenses. Funds Management has committed through April 30, 2016 to waive fees and/or reimburse expenses to the extent necessary to cap the Fund’s expenses at 0.95% for Class 1 shares and 1.20% for Class 2 shares. After this time, the cap may be increased or the commitment to maintain the cap may be terminated only with the approval of the Board of Trustees.
Distribution fee
The Trust has adopted a Distribution Plan for Class 2 shares of the Fund pursuant to Rule 12b-1 under the 1940 Act. A distribution fee is charged to Class 2 shares and paid to Wells Fargo Funds Distributor, LLC, the principal underwriter, at an annual rate of 0.25% of the average daily net assets for Class 2 shares.
Table of Contents
| 20 | Wells Fargo Advantage VT Small Cap Growth Fund | Notes to financial statements (unaudited) |
5. INVESTMENT PORTFOLIO TRANSACTIONS
Purchases and sales of investments, excluding U.S. government obligations (if any) and short-term securities, for the six months ended June 30, 2015 were $97,734,781 and $111,672,421, respectively.
6. BANK BORROWINGS
The Trust and Wells Fargo Funds Trust (excluding the money market funds and certain other funds) are parties to a $150,000,000 revolving credit agreement whereby the Fund is permitted to use bank borrowings for temporary or emergency purposes, such as to fund shareholder redemption requests. Interest under the credit agreement is charged to the Fund based on a borrowing rate equal to the higher of the Federal Funds rate in effect on that day plus 1.25% or the overnight LIBOR rate in effect on that day plus 1.25%. In addition, an annual commitment fee equal to 0.10% of the unused balance is allocated to each participating fund. For the six months ended June 30, 2015, the Fund paid $229 in commitment fees.
For the six months ended June 30, 2015, there were no borrowings by the Fund under the agreement.
7. CONCENTRATION RISK
Concentration risks result from exposure to a limited number of sectors. A fund that invests a substantial portion of its assets in any sector may be more affected by changes in that sector than would be a fund whose investments are not heavily weighted in any sector.
8. INDEMNIFICATION
Under the Trust’s organizational documents, the officers and Trustees have been granted certain indemnification rights against certain liabilities that may arise out of performance of their duties to the Trust. Additionally, in the normal course of business, the Trust may enter into contracts with service providers that contain a variety of indemnification clauses. The Trust’s maximum exposure under these arrangements is dependent on future claims that may be made against the Fund and, therefore, cannot be estimated.
9. SUBSEQUENT DISTRIBUTION
On July 9, 2015, the Fund declared distributions from long-term capital gains to shareholders of record on July 8, 2015. The per share amounts payable on July 10, 2015 were as follows:
Long-term capital gains | ||||
Class 1 | $ | 1.30147 | ||
Class 2 | 1.30147 | |||
These distributions are not reflected in the accompanying financial statements. The final determination of the source of all distributions is subject to change and made after the Fund’s tax year-end.
Table of Contents
| Other information (unaudited) | Wells Fargo Advantage VT Small Cap Growth Fund | 21 |
PROXY VOTING INFORMATION
A description of the policies and procedures that the Fund uses to determine how to vote proxies relating to portfolio securities is available, upon request, by calling 1-800-222-8222, visiting our website at wellsfargoadvantagefunds.com, or visiting the SEC website at sec.gov. Information regarding how the Fund voted proxies relating to portfolio securities during the most recent 12-month period ended June 30 is available on the Fund’s website at wellsfargoadvantagefunds.com or by visiting the SEC website at sec.gov.
PORTFOLIO HOLDINGS INFORMATION
The complete portfolio holdings for the Fund are publicly available monthly on the Fund’s website (wellsfargoadvantagefunds.com), on a one-month delayed basis. In addition, top ten holdings information (excluding derivative positions) for the Fund is publicly available on the Fund’s website on a monthly, seven-day or more delayed basis. The Fund files its complete schedule of portfolio holdings with the SEC for the first and third quarters of each fiscal year on Form N-Q, which is available by visiting the SEC website at sec.gov. In addition, the Fund’s Form N-Q may be reviewed and copied at the SEC’s Public Reference Room in Washington, DC, and at regional offices in New York City, at 233 Broadway, and in Chicago, at 175 West Jackson Boulevard, Suite 900. Information about the Public Reference Room may be obtained by calling 1-800-SEC-0330.
Table of Contents
| 22 | Wells Fargo Advantage VT Small Cap Growth Fund | Other information (unaudited) |
BOARD OF TRUSTEES AND OFFICERS
Each of the Trustees and Officers1 listed in the table below acts in identical capacities for each fund in the Wells Fargo Advantage family of funds, which consists of 134 mutual funds comprising the Wells Fargo Funds Trust, Wells Fargo Variable Trust, Wells Fargo Master Trust and four closed-end funds (collectively the “Fund Complex”). This table should be read in conjunction with the Prospectus and the Statement of Additional Information2. The mailing address of each Trustee and Officer is 525 Market Street, 12th Floor, San Francisco, CA 94105. Each Trustee and Officer serves an indefinite term, however, each Trustee serves such term until reaching the mandatory retirement age established by the Trustees.
Independent Trustees
| Name and year of birth | Position held and length of service* | Principal occupations during past five years or longer | Other directorships during past five years | |||
| William R. Ebsworth (Born 1957) | Trustee, since 2015** | Retired. From 1984 to 2013, equities analyst, portfolio manager, research director at Fidelity Management and Research Company and retired in 2013 as Chief Investment Officer of Fidelity Strategic Advisers, Inc. in Boston, Tokyo, and Hong Kong where he led a team of investment professionals managing client assets. Prior thereto, Board member of Hong Kong Securities Clearing Co., Hong Kong Options Clearing Corp., the Thailand International Fund, Ltd., Fidelity Investments Life Insurance Company, and Empire Fidelity Investments Life Insurance Company. Mr. Ebsworth is an Adjunct Lecturer, Finance, at Babson College and a Chartered Financial Analyst. | Asset Allocation Trust | |||
| Jane A. Freeman (Born 1953) | Trustee, since 2015** | Retired. From 2012 to 2014 and 1999 to 2008, Chief Financial Officer of Scientific Learning Corporation. From 2008 to 2012, Ms. Freeman provided consulting services related to strategic business projects. Prior to 1999, Portfolio Manager at Rockefeller & Co. and Scudder, Stevens & Clark. Board member of the Harding Loevner Funds from 1996 to 2014, serving as both Lead Independent Director and chair of the Audit Committee. Board member of the Russell Exchange Traded Funds Trust from 2011 to 2012 and the chair of the Audit Committee. Ms. Freeman is a Chartered Financial Analyst (inactive), Chair of Taproot Foundation (non-profit organization) and a Board Member of Ruth Bancroft Garden (non-profit organization). | Asset Allocation Trust | |||
| Peter G. Gordon (Born 1942) | Trustee, since 1998; Chairman, since 2005 | Co-Founder, Retired Chairman, President and CEO of Crystal Geyser Water Company. Trustee Emeritus, Colby College. | Asset Allocation Trust | |||
| Isaiah Harris, Jr. (Born 1952) | Trustee, since 2009 | Retired. Chairman of the Board of CIGNA Corporation since 2009, and Director since 2005. From 2003 to 2011, Director of Deluxe Corporation. Prior thereto, President and CEO of BellSouth Advertising and Publishing Corp. from 2005 to 2007, President and CEO of BellSouth Enterprises from 2004 to 2005 and President of BellSouth Consumer Services from 2000 to 2003. Emeritus member of the Iowa State University Foundation Board of Governors. Emeritus Member of the Advisory Board of Iowa State University School of Business. Advisory Board Member, Palm Harbor Academy. Mr. Harris is a certified public accountant. | CIGNA Corporation; Asset Allocation Trust | |||
| Judith M. Johnson (Born 1949) | Trustee, since 2008; Audit Committee Chairman, since 2008 | Retired. Prior thereto, Chief Executive Officer and Chief Investment Officer of Minneapolis Employees Retirement Fund from 1996 to 2008. Ms. Johnson is an attorney, certified public accountant and a certified managerial accountant. | Asset Allocation Trust | |||
| David F. Larcker (Born 1950) | Trustee, since 2009 | James Irvin Miller Professor of Accounting at the Graduate School of Business, Stanford University, Morgan Stanley Director of the Center for Leadership Development and Research and Senior Faculty of The Rock Center for Corporate Governance since 2006. From 2005 to 2008, Professor of Accounting at the Graduate School of Business, Stanford University. Prior thereto, Ernst & Young Professor of Accounting at The Wharton School, University of Pennsylvania from 1985 to 2005. | Asset Allocation Trust |
Table of Contents
| Other information (unaudited) | Wells Fargo Advantage VT Small Cap Growth Fund | 23 |
| Name and year of birth | Position held and length of service* | Principal occupations during past five years or longer | Other directorships during past five years | |||
| Olivia S. Mitchell (Born 1953) | Trustee, since 2006 | International Foundation of Employee Benefit Plans Professor, Wharton School of the University of Pennsylvania since 1993. Director of Wharton’s Pension Research Council and Boettner Center on Pensions & Retirement Research, and Research Associate at the National Bureau of Economic Research. Previously, Cornell University Professor from 1978 to 1993. | Asset Allocation Trust | |||
| Timothy J. Penny (Born 1951) | Trustee, since 1996 | President and Chief Executive Officer of Southern Minnesota Initiative Foundation, a non-profit organization, since 2007 and Senior Fellow at the Humphrey Institute Policy Forum at the University of Minnesota since 1995. Member of the Board of Trustees of NorthStar Education Finance, Inc., a non-profit organization, since 2007. | Asset Allocation Trust | |||
| Michael S. Scofield (Born 1943) | Trustee, since 2010 | Served on the Investment Company Institute’s Board of Governors and Executive Committee from 2008-2011 as well the Governing Council of the Independent Directors Council from 2006-2011 and the Independent Directors Council Executive Committee from 2008-2011. Chairman of the IDC from 2008-2010. Institutional Investor (Fund Directions) Trustee of Year in 2007. Trustee of the Evergreen Funds complex (and its predecessors) from 1984 to 2010. Chairman of the Evergreen Funds from 2000-2010. Former Trustee of the Mentor Funds. Retired Attorney, Law Offices of Michael S. Scofield. | Asset Allocation Trust | |||
| Donald C. Willeke (Born 1940) | Trustee, since 1996 | Principal of the law firm of Willeke & Daniels. General Counsel of the Minneapolis Employees Retirement Fund from 1984 until its consolidation into the Minnesota Public Employees Retirement Association on June 30, 2010. Director and Vice Chair of The Tree Trust (non-profit corporation). Director of the American Chestnut Foundation (non-profit corporation). | Asset Allocation Trust |
| * | Length of service dates reflect the Trustee’s commencement of service with the Trust’s predecessor entities, where applicable. |
| ** | William R. Ebsworth and Jane A. Freeman each became a Trustee effective January 1, 2015. |
Officers
| Name and year of birth | Position held and length of service | Principal occupations during past five years or longer | ||||
| Karla M. Rabusch (Born 1959) | President, since 2003 | Executive Vice President of Wells Fargo Bank, N.A. and President of Wells Fargo Funds Management, LLC since 2003. | ||||
| Jeremy DePalma1 (Born 1974) | Treasurer, since 2012 | Senior Vice President of Wells Fargo Funds Management, LLC since 2009. Senior Vice President of Evergreen Investment Management Company, LLC from 2008 to 2010. Vice President, Evergreen Investment Services, Inc. from 2004 to 2007. Head of the Fund Reporting and Control Team within Fund Administration from 2005 to 2010. | ||||
| C. David Messman (Born 1960) | Secretary, since 2000; Chief Legal Officer, since 2003 | Senior Vice President and Secretary of Wells Fargo Funds Management, LLC since 2001. Assistant General Counsel of Wells Fargo Bank, N.A. since 2013 and Vice President and Managing Counsel of Wells Fargo Bank N.A. from 1996 to 2013. | ||||
| Debra Ann Early (Born 1964) | Chief Compliance Officer, since 2007 | Senior Vice President of Wells Fargo Funds Management, LLC since 2007 and Chief Compliance Officer from 2007 to 2014. Chief Compliance Officer of Parnassus Investments from 2005 to 2007. Chief Financial Officer of Parnassus Investments from 2004 to 2007 and Senior Audit Manager of PricewaterhouseCoopers LLP from 1998 to 2004. | ||||
| David Berardi (Born 1975) | Assistant Treasurer, since 2009 | Vice President of Wells Fargo Funds Management, LLC since 2009. Vice President of Evergreen Investment Management Company, LLC from 2008 to 2010. Assistant Vice President of Evergreen Investment Services, Inc. from 2004 to 2008. Manager of Fund Reporting and Control for Evergreen Investment Management Company, LLC from 2004 to 2010. |
| 1 | Jeremy DePalma acts as Treasurer of 61 funds and Assistant Treasurer of 73 funds in the Fund Complex. |
| 2 | The Statement of Additional Information includes additional information about the Trustees and is available, without charge, upon request, by calling 1-800-222-8222 or by visiting the website at wellsfargoadvantagefunds.com. |
Table of Contents
| 24 | Wells Fargo Advantage VT Small Cap Growth Fund | Other information (unaudited) |
BOARD CONSIDERATION OF INVESTMENT ADVISORY, INVESTMENT MANAGEMENT AND SUB-ADVISORY AGREEMENTS:
Under the Investment Company Act of 1940 (the “1940 Act”), the Board of Trustees (the “Board”) of Wells Fargo Variable Trust (the “Trust”) must determine annually whether to approve the continuation of the Trust’s investment advisory and sub-advisory agreements. In this regard, at an in-person meeting held on May 19-20, 2015 (the “Meeting”), the Board, all the members of which have no direct or indirect interest in the investment advisory and sub-advisory agreements and are not “interested persons” of the Trust, as defined in the 1940 Act (the “Independent Trustees”), reviewed and approved for Wells Fargo Advantage VT Small Cap Growth Fund (the “Fund”): (i) an investment advisory agreement (the “Advisory Agreement”) with Wells Fargo Funds Management, LLC (“Funds Management”); (ii) an investment management agreement (the “Management Agreement”) with Funds Management; and (iii) an investment sub-advisory agreement (the “Sub-Advisory Agreement”) with Wells Capital Management Incorporated (the “Sub-Adviser”), an affiliate of Funds Management. The Management Agreement combines the terms of the Advisory Agreement with the terms of the Fund’s Amended and Restated Administration Agreement applicable to Fund-level administrative services (the “Administration Agreement”). The Advisory Agreement, the Management Agreement and the Sub-Advisory Agreement are collectively referred to as the “Advisory Agreements.”
At the Meeting, the Board considered the factors and reached the conclusions described below relating to the selection of Funds Management and the Sub-Adviser and the approval of the Advisory Agreements. Prior to the Meeting, including at an in-person meeting in March 2015, the Trustees conferred extensively among themselves and with representatives of Funds Management about these matters. Also, the Board has adopted a team-based approach, with each team consisting of a sub-set of Trustees, to assist the full Board in the discharge of its duties in reviewing performance and other matters throughout the year. The Independent Trustees were assisted in their evaluation of the Advisory Agreements by independent legal counsel, from whom they received separate legal advice and with whom they met separately.
In providing information to the Board, Funds Management and the Sub-Adviser were guided by a detailed set of requests for information submitted to them by independent legal counsel on behalf of the Independent Trustees at the start of the Board’s annual contract renewal process earlier in 2015. In considering and approving the Advisory Agreements, the Trustees considered the information they believed relevant, including but not limited to the information discussed below. The Board considered not only the specific information presented in connection with the Meeting, but also the knowledge gained over time through interaction with Funds Management and the Sub-Adviser about various topics. In this regard, the Board reviewed reports of Funds Management at each of its quarterly meetings, which included, among other things, portfolio reviews and performance reports. In addition, the Board and the teams mentioned above confer with portfolio managers at various times throughout the year. The Board did not identify any particular information or consideration that was all-important or controlling, and each individual Trustee may have attributed different weights to various factors.
After its deliberations, the Board unanimously approved the continuation of the Advisory Agreement for the period from June 1, 2015 through June 30, 2015, approved the Management Agreement for the period from July 1, 2015 through May 31, 2016, and approved the continuation of the Sub-Advisory Agreement for a one-year term through May 31, 2016. The Board also determined that the compensation payable to Funds Management and the Sub-Adviser under each of the Advisory Agreements was reasonable. The Board considered the approval of the Advisory Agreements for the Fund as part of its consideration of agreements for funds across the complex, but its approvals were made on a fund-by-fund basis. The following summarizes a number of important, but not necessarily all, factors considered by the Board in support of its approvals.
Nature, extent and quality of services
The Board received and considered various information regarding the nature, extent and quality of services provided to the Fund by Funds Management and the Sub-Adviser under the Advisory Agreements. This information included, among other things, a summary of the background and experience of senior management of Funds Management, and the qualifications, background, tenure and responsibilities of each of the portfolio managers primarily responsible for the day-to-day portfolio management of the Fund. The Board noted that the services to be provided to the Fund pursuant to the Management Agreement combined the advisory services previously provided to the Fund pursuant to the Fund’s Advisory Agreement with the Fund-level administrative services previously provided to the Fund pursuant to the Fund’s Administration Agreement. The Board received a representation from Funds Management that combining these services would not result in any change to the nature or level of services provided by Funds Management to the Fund.
Table of Contents
| Other information (unaudited) | Wells Fargo Advantage VT Small Cap Growth Fund | 25 |
The Board evaluated the ability of Funds Management and the Sub-Adviser to attract and retain qualified investment professionals, including research, advisory and supervisory personnel. The Board further considered the compliance programs and compliance records of Funds Management and the Sub-Adviser. In addition, the Board took into account the full range of services provided to the Fund by Funds Management and its affiliates.
Fund performance and expenses
The Board considered the performance results for the Fund over various time periods ended March 31, 2015. The Board considered these results in comparison to the performance of funds in a universe that was determined by Lipper Inc. (“Lipper”) to be similar to the Fund (the “Universe”), and in comparison to the Fund’s benchmark index and to other comparative data. Lipper is an independent provider of investment company data. The Board received a description of the methodology used by Lipper to select the mutual funds in the performance Universe. The Board noted that the performance of the Fund (Class 1) was higher than the average performance of the Universe for all periods under review except the three- and five-year periods. The Board also noted that the performance of the Fund (Class 1) was higher than or in range of its benchmark, the Russell 2000® Growth Index, for all periods under review except the three- and five-year periods.
The Funds Trust Board received information concerning, and discussed factors contributing to the underperformance of the Fund relative to the Universe and benchmark for the periods noted above. Funds Management advised the Board about certain market conditions and investment decisions that it believed contributed to such underperformance.
The Board also received and considered information regarding the Fund’s net operating expense ratios and their various components, including actual management fees (which reflect fee waivers, if any, and include advisory, administration and transfer agent fees), custodian and other non-management fees, and Rule 12b-1 and non-Rule 12b-1 service fees. The Board considered these ratios in comparison to the median ratios of funds in class-specific expense groups that were determined by Lipper to be similar to the Fund (the “Groups”). The Board received a description of the methodology used by Lipper to select the mutual funds in the expense Groups and an explanation of how funds comprising expense groups and their expense ratios may vary from year-to-year. Based on the Lipper reports, the Board noted that the net operating expense ratios of the Fund were in range of the median net operating expense ratios of the expense Groups.
The Board took into account the Fund performance and expense information provided to it among the factors considered in deciding to re-approve the Advisory Agreement and Sub-Advisory Agreement and approve the Management Agreement.
Investment advisory and sub-advisory fee rates
The Board reviewed and considered the contractual investment advisory fee rates that are payable by the Fund to Funds Management for investment advisory services (the “Advisory Agreement Rates”), both on a stand-alone basis and on a combined basis with the Fund’s fund-level and class-level contractual administration fee rates (the “Management Rates”). The Board noted that the Management Rates include transfer agency and sub-transfer agency costs. The Board also noted that the fee rate to be paid by the Fund under the Management Agreement will incorporate the advisory fee and Fund-level administration fee previously payable separately by the Fund under the Fund’s Advisory Agreement and Administration Agreement with Funds Management. The Board also reviewed and considered the contractual investment sub-advisory fee rates that are payable by Funds Management to the Sub-Adviser for investment sub-advisory services (the “Sub-Advisory Agreement Rates”).
Among other information reviewed by the Board was a comparison of the Management Rates of the Fund with those of other funds in the expense Groups at a common asset level. The Board noted that the Management Rates of the Fund were in range of the average rates for the Fund’s expense Groups for all share classes.
The Board also received and considered information about the portion of the total advisory fee that was retained by Funds Management after payment of the fee to the Sub-Adviser for sub-advisory services. In assessing the reasonableness of this amount, the Board received and evaluated information about the nature and extent of responsibilities retained and risks assumed by Funds Management and not delegated to or assumed by the Sub-Adviser, and about Funds Management’s on-going oversight services. However, given the affiliation between Funds Management and the Sub-Adviser, the Board ascribed limited relevance to the allocation of the advisory fee between them.
The Board also received and considered information about the nature and extent of services offered and fee rates charged by Funds Management and the Sub-Adviser to other types of clients with investment strategies similar to those of the Fund. In this regard, the Board received information about the significantly greater scope of services, and compliance, reporting and other legal burdens and risks of managing mutual funds compared with those associated with managing assets of non-mutual fund clients such as collective funds or institutional separate accounts.
Table of Contents
| 26 | Wells Fargo Advantage VT Small Cap Growth Fund | Other information (unaudited) |
Based on its consideration of the factors and information it deemed relevant, including those described here, the Board determined that the compensation payable to Funds Management under the Management Agreement and Advisory Agreement and to the Sub-Adviser under the Sub-Advisory Agreement was reasonable, in light of the services covered by the Advisory Agreements.
Profitability
The Board received and considered information concerning the profitability of Funds Management and the Sub-Adviser, as well as the profitability of Wells Fargo as a whole, from providing services to the Fund and the fund family as a whole.
Funds Management and the Sub-Adviser explained the methodologies and estimates that they used in calculating profitability. Among other things, the Board noted that the levels of profitability reported on a fund-by-fund basis varied widely, depending on factors such as the size and type of fund. Based on its review, the Board did not deem the profits reported by Funds Management or the Sub-Adviser to be at a level that would prevent it from approving the continuation of the Advisory Agreements.
Economies of scale
With respect to possible economies of scale, the Board noted the existence of breakpoints in the Fund’s advisory and management fee structures, and the Fund’s administration fee structure, which operate generally to reduce the Fund’s expense ratios as the Fund grows in size. It considered that, for a small fund or a fund that shrinks in size, breakpoints conversely can result in higher fee levels. The Board also considered that fee waiver and expense reimbursement arrangements and competitive fee rates at the outset are means of sharing potential economies of scale with shareholders of the Fund and the fund family as a whole. The Board considered Funds Management’s view that any analyses of potential economies of scale in managing a particular fund are inherently limited in light of the joint and common costs and investments that Funds Management incurs across the fund family as a whole.
The Board concluded that the Fund’s fee and expense arrangements, including contractual breakpoints, constituted a reasonable approach to sharing potential economies of scale with the Fund and its shareholders.
Other benefits to Funds Management and the Sub-Adviser
The Board received and considered information regarding potential “fall-out” or ancillary benefits received by Funds Management and its affiliates, including the Sub-Adviser, as a result of their relationships with the Fund. Ancillary benefits could include, among others, benefits directly attributable to other relationships with the Fund and benefits potentially derived from an increase in Funds Management’s and the Sub-Adviser’s business as a result of their relationships with the Fund. The Board noted that various affiliates of Funds Management may receive distribution-related fees, shareholder servicing payments and sub-transfer agency fees in respect of shares sold or held through them and services provided.
The Board also reviewed information about soft dollar credits earned and utilized by the Sub-Adviser, fees earned by Funds Management and the Sub-Adviser from managing a private investment vehicle for the fund family’s securities lending collateral and commissions earned by an affiliated broker from portfolio transactions.
Based on its consideration of the factors and information it deemed relevant, including those described here, the Board did not find that any ancillary benefits received by Funds Management and its affiliates, including the Sub-Adviser, were unreasonable.
Conclusion
At the Meeting, after considering the above-described factors and based on its deliberations and its evaluation of the information described above, the Board unanimously approved the continuation of the Advisory Agreement for the period from June 1, 2015 through June 30, 2015, approved the Management Agreement for the period from July 1, 2015 through May 31, 2016, and approved the continuation of the Sub-Advisory Agreement for a one-year term through May 31, 2016. The Board also determined that the compensation payable to Funds Management and the Sub-Adviser under each of the Advisory Agreements was reasonable.
Table of Contents
| List of abbreviations | Wells Fargo Advantage VT Small Cap Growth Fund | 27 |
The following is a list of common abbreviations for terms and entities that may have appeared in this report.
| ACA | — ACA Financial Guaranty Corporation |
| ADR | — American depositary receipt |
| ADS | — American depositary shares |
| AGC | — Assured Guaranty Corporation |
| AGM | — Assured Guaranty Municipal |
| Ambac | — Ambac Financial Group Incorporated |
| AMT | — Alternative minimum tax |
| AUD | — Australian dollar |
| BAN | — Bond anticipation notes |
| BHAC | — Berkshire Hathaway Assurance Corporation |
| BRL | — Brazilian real |
| CAB | — Capital appreciation bond |
| CAD | — Canadian dollar |
| CCAB | — Convertible capital appreciation bond |
| CDA | — Community Development Authority |
| CDO | — Collateralized debt obligation |
| CHF | — Swiss franc |
| COP | — Columbian Peso |
| CLP | — Chilean peso |
| DKK | — Danish krone |
| DRIVER | — Derivative inverse tax-exempt receipts |
| DW&P | — Department of Water & Power |
| DWR | — Department of Water Resources |
| ECFA | — Educational & Cultural Facilities Authority |
| EDA | — Economic Development Authority |
| EDFA | — Economic Development Finance Authority |
| ETF | — Exchange-traded fund |
| EUR | — Euro |
| FDIC | — Federal Deposit Insurance Corporation |
| FFCB | — Federal Farm Credit Banks |
| FGIC | — Financial Guaranty Insurance Corporation |
| FHA | — Federal Housing Administration |
| FHLB | — Federal Home Loan Bank |
| FHLMC | — Federal Home Loan Mortgage Corporation |
| FICO | — The Financing Corporation |
| FNMA | — Federal National Mortgage Association |
| FSA | — Farm Service Agency |
| GBP | — Great British pound |
| GDR | — Global depositary receipt |
| GNMA | — Government National Mortgage Association |
| GO | — General obligation |
| HCFR | — Healthcare facilities revenue |
| HEFA | — Health & Educational Facilities Authority |
| HEFAR | — Higher education facilities authority revenue |
| HFA | — Housing Finance Authority |
| HFFA | — Health Facilities Financing Authority |
| HKD | — Hong Kong dollar |
| HUD | — Department of Housing and Urban Development |
| HUF | — Hungarian forint |
| IDA | — Industrial Development Authority |
| IDAG | — Industrial Development Agency |
| IDR | — Indonesian rupiah |
| IEP | — Irish pound |
| JPY | — Japanese yen |
| KRW | — Republic of Korea won |
| LIBOR | — London Interbank Offered Rate |
| LIFER | — Long Inverse Floating Exempt Receipts |
| LIQ | — Liquidity agreement |
| LLC | — Limited liability company |
| LLLP | — Limited liability limited partnership |
| LLP | — Limited liability partnership |
| LOC | — Letter of credit |
| LP | — Limited partnership |
| MBIA | — Municipal Bond Insurance Association |
| MFHR | — Multifamily housing revenue |
| MSTR | — Municipal securities trust receipts |
| MTN | — Medium-term note |
| MUD | — Municipal Utility District |
| MXN | — Mexican peso |
| MYR | — Malaysian ringgit |
| National | — National Public Finance Guarantee Corporation |
| NGN | — Nigerian naira |
| NOK | — Norwegian krone |
| NZD | — New Zealand dollar |
| PCFA | — Pollution Control Financing Authority |
| PCL | — Public Company Limited |
| PCR | — Pollution control revenue |
| PFA | — Public Finance Authority |
| PFFA | — Public Facilities Financing Authority |
| PFOTER | — Puttable floating option tax-exempt receipts |
| plc | — Public limited company |
| PLN | — Polish zloty |
| PUTTER | — Puttable tax-exempt receipts |
| R&D | — Research & development |
| Radian | — Radian Asset Assurance |
| RAN | — Revenue anticipation notes |
| RDA | — Redevelopment Authority |
| RDFA | — Redevelopment Finance Authority |
| REIT | — Real estate investment trust |
| ROC | — Reset option certificates |
| RON | — Romanian lei |
| RUB | — Russian ruble |
| SAVRS | — Select auction variable rate securities |
| SBA | — Small Business Authority |
| SDR | — Swedish depositary receipt |
| SEK | — Swedish krona |
| SFHR | — Single-family housing revenue |
| SFMR | — Single-family mortgage revenue |
| SGD | — Singapore dollar |
| SPA | — Standby purchase agreement |
| SPDR | — Standard & Poor’s Depositary Receipts |
| SPEAR | — Short Puttable Exempt Adjustable Receipts |
| STRIPS | — Separate trading of registered interest and |
| principal securities |
| TAN | — Tax anticipation notes |
| TBA | — To be announced |
| THB | — Thai baht |
| TIPS | — Treasury inflation-protected securities |
| TRAN | — Tax revenue anticipation notes |
| TRY | — Turkish lira |
| TTFA | — Transportation Trust Fund Authority |
| TVA | — Tennessee Valley Authority |
| ZAR | — South African rand |
Table of Contents
This page is intentionally left blank.
Table of Contents


For more information
More information about Wells Fargo Advantage Funds is available free upon request. To obtain literature, please write, email, visit the Fund’s website, or call:
Wells Fargo Advantage Funds
P.O. Box 8266
Boston, MA 02266-8266
Email: wfaf@wellsfargo.com
Website: wellsfargoadvantagefunds.com
Individual investors: 1-800-222-8222
Retail investment professionals: 1-888-877-9275
Institutional investment professionals: 1-866-765-0778
This report and the financial statements contained herein are submitted for the general information of the shareholders of Wells Fargo Advantage Funds. If this report is used for promotional purposes, distribution of the report must be accompanied or preceded by a current prospectus. Before investing, please consider the investment objectives, risks, charges, and expenses of the investment. For a current prospectus and, if available, a summary prospectus, containing this information, call 1-800-222-8222 or visit the Fund’s website at wellsfargoadvantagefunds.com. Read the prospectus carefully before you invest or send money.
Wells Fargo Funds Management, LLC, a wholly owned subsidiary of Wells Fargo & Company, provides investment advisory and administrative services for Wells Fargo Advantage Funds. Other affiliates of Wells Fargo & Company provide subadvisory and other services for the Funds. The Funds are distributed by Wells Fargo Funds Distributor, LLC, Member FINRA/SIPC, an affiliate of Wells Fargo & Company.
NOT FDIC INSURED ¡ NO BANK GUARANTEE ¡ MAY LOSE VALUE
© 2015 Wells Fargo Funds Management, LLC. All rights reserved.
235291 08-15 SVT7/SAR144 06-15 |
Table of Contents

Wells Fargo Advantage
VT Small Cap Value Fund

Semi-Annual Report
June 30, 2015

Table of Contents
Reduce clutter. Save trees.
Sign up for electronic delivery of prospectuses and shareholder reports at wellsfargo.com/advantagedelivery
| 2 | ||||
| 4 | ||||
| 6 | ||||
| 7 | ||||
Financial statements | ||||
| 12 | ||||
| 13 | ||||
| 14 | ||||
| 15 | ||||
| 17 | ||||
| 22 | ||||
| 28 | ||||
The views expressed and any forward-looking statements are as of June 30, 2015, unless otherwise noted, and are those of the Fund managers and/or Wells Fargo Funds Management, LLC. Discussions of individual securities, or the markets generally, or any Wells Fargo Advantage Fund are not intended as individual recommendations. Future events or results may vary significantly from those expressed in any forward-looking statements; the views expressed are subject to change at any time in response to changing circumstances in the market. Wells Fargo Funds Management, LLC and the Fund disclaim any obligation to publicly update or revise any views expressed or forward-looking statements.
NOT FDIC INSURED ¡ NO BANK GUARANTEE ¡ MAY LOSE VALUE
Table of Contents
| 2 | Wells Fargo Advantage VT Small Cap Value Fund | Letter to shareholders (unaudited) |

Karla M. Rabusch
President
Wells Fargo Advantage Funds
The period was marked by continued low global interest rates and a slow but steady economic recovery in the U.S.
Dear Valued Shareholder:
We are pleased to offer you this semi-annual report for the Wells Fargo Advantage VT Small Cap Value Fund for the six-month period that ended June 30, 2015. The period was marked by continued low global interest rates and a slow but steady economic recovery in the U.S. However, growing concern as to whether a newly elected anti-austerity government in Greece would default on the country’s debt and remove it from the eurozone resulted in late-period volatility for both U.S. and European stocks.
Major central banks continued to provide liquidity to the markets.
Throughout the reporting period, the Federal Open Market Committee (FOMC), which is the U.S. Federal Reserve’s (Fed’s) monetary policymaking body, kept its key interest rate effectively at zero. As the reporting period progressed, though, various comments by Fed Chair Janet Yellen led investors to believe that the FOMC would raise its key federal funds rate by late 2015. Moreover, the FOMC seemed confident that economic conditions would evolve in a way that it would most likely continue raising rates gradually over time.
In contrast, the European Central Bank (ECB) showed no signs of raising rates at any point in the near future. Rather, the ECB maintained a variety of measures aimed at encouraging lending, including making funds available to banks at low interest rates and imposing a negative interest rate on bank deposits held at the central bank. In January 2015, the bank announced quantitative easing via significant bond purchases in an attempt to raise the eurozone’s inflation to just under its target of 2%. The ECB also provided emergency liquidity to Greek banks while that country’s government negotiated with its creditors, which included the eurozone member states and the International Monetary Fund (IMF).
The prospect of a near-term rate hike in the U.S., combined with continued easing from the ECB and other major central banks, resulted in the U.S. dollar appreciating against a basket of currencies for the six-month reporting period.
Although U.S. economic growth slowed in the first quarter, market participants believed that its recovery remained on track.
Reported U.S. gross domestic product (GDP) growth came in at a solid 2.2% annualized rate in the fourth quarter of 2014. Although the final estimate for annualized GDP growth came in at a modest 0.6% in the first quarter of 2015, the slowdown was attributed to short-term factors such as a harsh winter and a long-lived strike at West Coast ports. The U.S. unemployment rate continued its slow improvement, easing from 5.7% in January 2015 to 5.3% in June.
U.S. stocks generally posted gains for the period, aided by a solid economy. However, uncertainty as to whether Greece would default on a June 30 payment to the IMF resulted in volatility and negative returns in the last month of the reporting period. The S&P 500 Index1, a measure of U.S. large-cap stocks, ended the period with a gain of 1.23%. Growth stocks outperformed value stocks in the large-cap space, and health care delivered the best return among the index’s sectors.
| 1 | The S&P 500 Index consists of 500 stocks chosen for market size, liquidity, and industry group representation. It is a market-value-weighted index with each stock’s weight in the index proportionate to its market value. You cannot invest directly in an index. |
Table of Contents
| Letter to shareholders (unaudited) | Wells Fargo Advantage VT Small Cap Value Fund | 3 |
Small-cap stocks solidly outperformed large caps for the period, with the Russell 2000® Index2 gaining 4.75%. Smaller-cap stocks often have an advantage when the U.S. dollar strengthens, as it did during the reporting period. Because larger companies tend to be globally diversified, a stronger dollar can dampen their earnings growth; smaller companies often have more of a domestic focus and thus are less likely to face currency-related headwinds. Small-cap growth stocks significantly outperformed small-cap value stocks, with the information technology sector delivering the highest returns.
Don’t let short-term uncertainty derail long-term investment goals.
Periods of uncertainty can present challenges, but experience has taught us that maintaining long-term investment goals can be an effective way to plan for the future. To help you create a sound strategy based on your personal goals and risk tolerance, Wells Fargo Advantage Funds offers more than 100 mutual funds and other investments spanning a wide range of asset classes and investment styles. Although diversification cannot guarantee an investment profit or prevent losses, we believe it can be an effective way to manage investment risk and potentially smooth out overall portfolio performance. We encourage investors to know their investments and to understand that appropriate levels of risk-taking may unlock opportunities.
Thank you for choosing to invest with Wells Fargo Advantage Funds. We appreciate your confidence in us and remain committed to helping you meet your financial needs.
Sincerely,

Karla M. Rabusch
President
Wells Fargo Advantage Funds
Smaller-cap stocks often have an advantage when the U.S. dollar strengthens, as it did during the reporting period.
Notice to shareholders
At a meeting held on August 11–12, 2015, the Board of Trustees of the Fund approved a change in the name of the Fund whereby the word “Advantage” will be removed from its name, effective December 15, 2015.
For current information about your fund investments, contact your investment professional, visit our website at wellsfargoadvantagefunds.com, or call us directly at 1-800-222-8222. We are available 24 hours a day, 7 days a week.
| 2 | The Russell 2000® Index measures the performance of the 2,000 smallest companies in the Russell 3000® Index, which represents approximately 8% of the total market capitalization of the Russell 3000 Index. You cannot invest directly in an index. |
Table of Contents
| 4 | Wells Fargo Advantage VT Small Cap Value Fund | Performance highlights (unaudited) |
Investment objective
The Fund seeks long-term capital appreciation.
Adviser
Wells Fargo Funds Management, LLC
Subadviser
Wells Capital Management Incorporated
Portfolio managers
Erik C. Astheimer
I. Charles Rinaldi
Michael Schneider, CFA
Average annual total returns1 (%) as of June 30, 2015
| Expense ratios2 (%) | ||||||||||||||||||||||
| Inception date | 1 year | 5 year | 10 year | Gross | Net3 | |||||||||||||||||
| Class 1 | 7-16-2010 | (8.75 | ) | 9.12 | 5.54 | 1.10 | 0.90 | |||||||||||||||
| Class 2 | 10-10-1997 | (8.93 | ) | 8.85 | 5.41 | 1.35 | 1.15 | |||||||||||||||
| Russell 2000® Value Index4 | – | 0.78 | 14.81 | 6.87 | – | – | ||||||||||||||||
Figures quoted represent past performance, which is no guarantee of future results and do not reflect the deduction of taxes that a shareholder may pay on fund distributions or the redemption of fund shares. Investment return and principal value of an investment will fluctuate so that an investor’s shares, when redeemed, may be worth more or less than their original cost. Current performance may be lower or higher than the performance data quoted, which assumes the reinvestment of dividends and capital gains. Current month-end performance is available by calling 1-800-222-8222. Performance figures of the und do not reflect fees charged pursuant to the terms of variable life insurance policies and variable annuity contracts. If fees had been reflected, performance would have been lower.
Index returns do not include transaction costs associated with buying and selling securities, any mutual fund fees or expenses, or any taxes. It is not possible to invest directly in an index.
Stock values fluctuate in response to the activities of individual companies and general market and economic conditions. Smaller-company stocks tend to be more volatile and less liquid than those of larger companies. The use of derivatives may reduce returns and/or increase volatility. Certain investment strategies tend to increase the total risk of an investment (relative to the broader market). The Fund is exposed to foreign investment risk. Consult the Fund’s prospectus for additional information on these and other risks.
Please refer to the prospectus provided by your participating insurance company for detailed information describing the separate accounts for information regarding surrender charges, mortality and expense risk fees, and other charges that may be assessed by the participating insurance companies.
Please see footnotes on page 5.
Table of Contents
| Performance highlights (unaudited) | Wells Fargo Advantage VT Small Cap Value Fund | 5 |
| Ten largest holdings5 (%) as of June 30, 2015 | ||||
InterOil Corporation | 7.11 | |||
Randgold Resources Limited ADR | 6.32 | |||
Cavco Industries Incorporated | 3.53 | |||
OSI Systems Incorporated | 3.30 | |||
Cray Incorporated | 3.11 | |||
Argo Group International Holdings Limited | 2.84 | |||
Delta Air Lines Incorporated | 2.48 | |||
Coherent Incorporated | 1.88 | |||
United Continental Holdings Incorporated | 1.81 | |||
Cincinnati Bell Incorporated | 1.79 | |||
| Sector distribution6 as of June 30, 2015 |
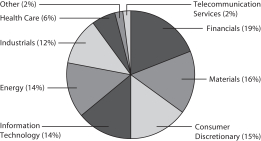 |
| 1 | Historical performance shown for Class 1 shares prior to their inception reflects the performance of Class 2 shares, and includes the higher expenses applicable to Class 2 shares. If these expenses had not been included, returns would be higher. |
| 2 | Reflects the expense ratios as stated in the most recent prospectuses, which include the impact of 0.01% in acquired fund fees and expenses. The expense ratios shown are subject to change and may differ from the annualized expense ratios shown in the financial highlights of this report, which do not include acquired fund fees and expenses. |
| 3 | The Adviser has contractually committed through April 30, 2016, to waive fees and/or reimburse expenses to the extent necessary to cap the Fund’s Total Annual Fund Operating Expenses After Fee Waiver at 0.89% for Class 1 and 1.14% for Class 2. After this time, the cap may be increased or the commitment to maintain the cap may be terminated only with the approval of the Board of Trustees. Brokerage commissions, stamp duty fees, interest, taxes, acquired fund fees and expenses, and extraordinary expenses are excluded from the cap. Without this cap, the Fund’s returns would have been lower. |
| 4 | The Russell 2000® Value Index measures the performance of those Russell 2000 companies with lower price-to-book ratios and lower forecasted growth values. You cannot invest directly in an index. |
| 5 | The ten largest holdings, excluding cash and cash equivalents, are calculated based on the value of the investments divided by total net assets of the Fund. Holdings are subject to change and may have changed since the date specified. |
| 6 | Amounts are calculated based on the total long-term investments of the Fund. These amounts are subject to change and may have changed since the date specified. |
Table of Contents
| 6 | Wells Fargo Advantage VT Small Cap Value Fund | Fund expenses (unaudited) |
As a shareholder of the Fund, you incur ongoing costs, including management fees, distribution (12b-1) fees, and other Fund expenses. This example is intended to help you understand your ongoing costs (in dollars) of investing in the Fund and to compare these costs with the ongoing costs of investing in other mutual funds.
The example is based on an investment of $1,000 invested at the beginning of the six-month period and held for the entire period from January 1, 2015 to June 30, 2015.
Actual expenses
The “Actual” line of the table below provides information about actual account values and actual expenses. You may use the information in this line, together with the amount you invested, to estimate the expenses that you paid over the period. Simply divide your account value by $1,000 (for example, an $8,600 account value divided by $1,000 = 8.6), then multiply the result by the number in the “Actual” line under the heading entitled “Expenses Paid During Period” for your applicable class of shares to estimate the expenses you paid on your account during this period.
Hypothetical example for comparison purposes
The “Hypothetical” line of the table below provides information about hypothetical account values and hypothetical expenses based on the Fund’s actual expense ratio and an assumed rate of return of 5% per year before expenses, which is not the Fund’s actual return. The hypothetical account values and expenses may not be used to estimate the actual ending account balance or expenses you paid for the period. You may use this information to compare the ongoing costs of investing in the Fund and other funds. To do so, compare this 5% hypothetical example with the 5% hypothetical examples that appear in the shareholder reports of the other funds.
Please note that the expenses shown in the table are meant to highlight your ongoing costs only and do not reflect any separate account charges assessed by participating insurance companies. Therefore, the “Hypothetical” line of the table is useful in comparing ongoing costs only, and will not help you determine the relative total costs of owning different funds. In addition, if these separate account charges assessed by participating insurance companies were included, your costs would have been higher.
| Beginning account value 1-1-2015 | Ending account value 6-30-2015 | Expenses paid during the period1 | Net annualized expense ratio | |||||||||||||
Class 1 | ||||||||||||||||
Actual | $ | 1,000.00 | $ | 980.27 | $ | 4.37 | 0.89 | % | ||||||||
Hypothetical (5% return before expenses) | $ | 1,000.00 | $ | 1,020.38 | $ | 4.46 | 0.89 | % | ||||||||
Class 2 | ||||||||||||||||
Actual | $ | 1,000.00 | $ | 978.48 | $ | 5.59 | 1.14 | % | ||||||||
Hypothetical (5% return before expenses) | $ | 1,000.00 | $ | 1,019.14 | $ | 5.71 | 1.14 | % | ||||||||
| 1 | Expenses paid is equal to the annualized expense ratio of each class multiplied by the average account value over the period, multiplied by the number of days in the most recent fiscal half-year divided by the number of days in the fiscal year (to reflect the one-half year period). |
Table of Contents
| Portfolio of investments—June 30, 2015 (unaudited) | Wells Fargo Advantage VT Small Cap Value Fund | 7 |
| Security name | Shares | Value | ||||||||||
Common Stocks: 87.21% | ||||||||||||
Consumer Discretionary: 13.18% | ||||||||||||
| Auto Components: 1.22% | ||||||||||||
Fox Factory Holding Corporation † | 16,800 | $ | 270,144 | |||||||||
Gentex Corporation | 13,600 | 223,312 | ||||||||||
| 493,456 | ||||||||||||
|
| |||||||||||
| Hotels, Restaurants & Leisure: 4.77% | ||||||||||||
Century Casinos Incorporated † | 40,900 | 257,670 | ||||||||||
Denny’s Corporation † | 52,600 | 610,686 | ||||||||||
Peak Resorts Incorporated | 15,900 | 113,844 | ||||||||||
Scientific Games Corporation Class A † | 26,900 | 418,026 | ||||||||||
The Wendy’s Company | 46,800 | 527,904 | ||||||||||
| 1,928,130 | ||||||||||||
|
| |||||||||||
| Household Durables: 6.02% | ||||||||||||
Cavco Industries Incorporated † | 18,900 | 1,425,816 | ||||||||||
Harman International Industries Incorporated | 1,450 | 172,463 | ||||||||||
KB Home Incorporated | 16,700 | 277,220 | ||||||||||
Skyline Corporation † | 17,300 | 50,862 | ||||||||||
Taylor Morrison Home Corporation Class A † | 10,300 | 209,708 | ||||||||||
The New Home Company Incorporated † | 17,000 | 292,910 | ||||||||||
| 2,428,979 | ||||||||||||
|
| |||||||||||
| Media: 0.40% | ||||||||||||
Starz Incorporated Class A † | 3,600 | 160,992 | ||||||||||
|
| |||||||||||
| Multiline Retail: 0.16% | ||||||||||||
Fred’s Incorporated Class A | 3,300 | 63,657 | ||||||||||
|
| |||||||||||
| Specialty Retail: 0.46% | ||||||||||||
Vitamin Shoppe Incorporated † | 5,000 | 186,350 | ||||||||||
|
| |||||||||||
| Textiles, Apparel & Luxury Goods: 0.15% | ||||||||||||
Movado Group Incorporated | 2,200 | 59,752 | ||||||||||
|
| |||||||||||
Energy: 12.56% | ||||||||||||
| Energy Equipment & Services: 3.62% | ||||||||||||
Glori Energy Incorporated † | 14,600 | 20,878 | ||||||||||
Helix Energy Solutions Group Incorporated † | 8,500 | 107,355 | ||||||||||
Helmerich & Payne Incorporated | 1,050 | 73,941 | ||||||||||
ION Geophysical Corporation † | 106,500 | 113,955 | ||||||||||
Key Energy Services Incorporated † | 54,800 | 98,640 | ||||||||||
Newpark Resources Incorporated † | 70,800 | 575,604 | ||||||||||
Parker Drilling Company † | 53,000 | 175,960 | ||||||||||
PHI Incorporated (non-voting) † | 8,900 | 267,178 | ||||||||||
Willbros Group Incorporated † | 23,500 | 30,080 | ||||||||||
| 1,463,591 | ||||||||||||
|
| |||||||||||
The accompanying notes are an integral part of these financial statements.
Table of Contents
| 8 | Wells Fargo Advantage VT Small Cap Value Fund | Portfolio of investments—June 30, 2015 (unaudited) |
| Security name | Shares | Value | ||||||||||
| Oil, Gas & Consumable Fuels: 8.94% | ||||||||||||
Clean Energy Fuels Corporation † | 17,800 | $ | 100,036 | |||||||||
InterOil Corporation † | 47,700 | 2,871,540 | ||||||||||
Range Resources Corporation | 5,250 | 259,245 | ||||||||||
Sanchez Energy Corporation † | 9,000 | 88,200 | ||||||||||
Stone Energy Corporation † | 7,000 | 88,130 | ||||||||||
Trilogy Energy Corporation (a) | 44,500 | 201,269 | ||||||||||
| 3,608,420 | ||||||||||||
|
| |||||||||||
Financials: 16.85% | ||||||||||||
| Banks: 8.26% | ||||||||||||
Ameris Bancorp | 11,500 | 290,835 | ||||||||||
BBCN Bancorp Incorporated | 19,900 | 294,321 | ||||||||||
CenterState Banks Incorporated | 28,100 | 379,631 | ||||||||||
First Horizon National Corporation | 30,000 | 470,100 | ||||||||||
First Niagara Financial Group Incorporated | 40,500 | 382,320 | ||||||||||
Hilltop Holdings Incorporated † | 10,100 | 243,309 | ||||||||||
IBERIABANK Corporation | 5,500 | 375,265 | ||||||||||
Park Sterling Corporation | 25,300 | 182,160 | ||||||||||
The Bancorp Incorporated † | 36,700 | 340,576 | ||||||||||
Valley National Bancorp | 8,400 | 86,604 | ||||||||||
Wilshire Bancorp Incorporated | 23,100 | 291,753 | ||||||||||
| 3,336,874 | ||||||||||||
|
| |||||||||||
| Capital Markets: 0.62% | ||||||||||||
Medley Management Incorporated Class A | 21,200 | 251,008 | ||||||||||
|
| |||||||||||
| Consumer Finance: 0.48% | ||||||||||||
Cash America International Incorporated | 1,500 | 39,285 | ||||||||||
Enova International Incorporated † | 8,200 | 153,176 | ||||||||||
| 192,461 | ||||||||||||
|
| |||||||||||
| Insurance: 4.45% | ||||||||||||
Argo Group International Holdings Limited | 20,600 | 1,147,420 | ||||||||||
James River Group Holdings Limited | 2,500 | 64,675 | ||||||||||
National General Holdings Corporation | 11,800 | 245,794 | ||||||||||
OneBeacon Insurance Group Limited Class A | 23,200 | 336,632 | ||||||||||
| 1,794,521 | ||||||||||||
|
| |||||||||||
| REITs: 2.52% | ||||||||||||
Potlatch Corporation | 4,900 | 173,068 | ||||||||||
Redwood Trust Incorporated | 39,900 | 626,430 | ||||||||||
UMH Properties Incorporated | 22,400 | 219,520 | ||||||||||
| 1,019,018 | ||||||||||||
|
| |||||||||||
| Thrifts & Mortgage Finance: 0.52% | ||||||||||||
Northwest Bancshares Incorporated | 16,400 | 210,248 | ||||||||||
|
| |||||||||||
The accompanying notes are an integral part of these financial statements.
Table of Contents
| Portfolio of investments—June 30, 2015 (unaudited) | Wells Fargo Advantage VT Small Cap Value Fund | 9 |
| Security name | Shares | Value | ||||||||||
Health Care: 5.41% | ||||||||||||
| Health Care Equipment & Supplies: 1.84% | ||||||||||||
Hologic Incorporated † | 7,400 | $ | 281,644 | |||||||||
OraSure Technologies Incorporated † | 85,600 | 461,384 | ||||||||||
| 743,028 | ||||||||||||
|
| |||||||||||
| Health Care Providers & Services: 2.37% | ||||||||||||
Air Methods Corporation † | 5,400 | 223,236 | ||||||||||
Cross Country Healthcare Incorporated † | 45,000 | 570,600 | ||||||||||
Healthways Incorporated † | 13,300 | 159,334 | ||||||||||
Teladoc Incorporated † | 121 | 2,299 | ||||||||||
| 955,469 | ||||||||||||
|
| |||||||||||
| Health Care Technology: 0.68% | ||||||||||||
Allscripts Healthcare Solutions Incorporated † | 20,200 | 276,336 | ||||||||||
|
| |||||||||||
| Life Sciences Tools & Services: 0.29% | ||||||||||||
PAREXEL International Corporation † | 1,850 | 118,973 | ||||||||||
|
| |||||||||||
| Pharmaceuticals: 0.23% | ||||||||||||
Prestige Brands Holdings Incorporated † | 2,000 | 92,480 | ||||||||||
|
| |||||||||||
Industrials: 10.68% | ||||||||||||
| Airlines: 5.48% | ||||||||||||
American Airlines Group Incorporated | 8,100 | 323,473 | ||||||||||
Delta Air Lines Incorporated | 24,400 | 1,002,352 | ||||||||||
LATAM Airlines Group SP ADR † | 22,000 | 154,880 | ||||||||||
United Continental Holdings Incorporated † | 13,800 | 731,538 | ||||||||||
| 2,212,243 | ||||||||||||
|
| |||||||||||
| Commercial Services & Supplies: 2.98% | ||||||||||||
ABM Industries Incorporated | 12,400 | 407,588 | ||||||||||
ACCO Brands Corporation † | 74,700 | 580,419 | ||||||||||
Healthcare Services Group Incorporated | 6,500 | 214,825 | ||||||||||
| 1,202,832 | ||||||||||||
|
| |||||||||||
| Construction & Engineering: 0.24% | ||||||||||||
Tutor Perini Corporation † | 4,400 | 94,952 | ||||||||||
|
| |||||||||||
| Machinery: 0.41% | ||||||||||||
Actuant Corporation Class A | 7,100 | 163,939 | ||||||||||
|
| |||||||||||
| Professional Services: 0.67% | ||||||||||||
Hill International Incorporated † | 51,612 | 271,479 | ||||||||||
|
| |||||||||||
| Road & Rail: 0.25% | ||||||||||||
Covenant Transport Incorporated Class A † | 4,100 | 102,746 | ||||||||||
|
| |||||||||||
| Trading Companies & Distributors: 0.65% | ||||||||||||
Applied Industrial Technologies Incorporated | 6,650 | 263,673 | ||||||||||
|
| |||||||||||
The accompanying notes are an integral part of these financial statements.
Table of Contents
| 10 | Wells Fargo Advantage VT Small Cap Value Fund | Portfolio of investments—June 30, 2015 (unaudited) |
| Security name | Shares | Value | ||||||||||
Information Technology: 12.79% | ||||||||||||
| Communications Equipment: 0.99% | ||||||||||||
Brocade Communications Systems Incorporated | 6,200 | $ | 73,656 | |||||||||
Harmonic Incorporated † | 29,700 | 202,851 | ||||||||||
Ruckus Wireless Incorporated † | 12,100 | 125,114 | ||||||||||
| 401,621 | ||||||||||||
|
| |||||||||||
| Electronic Equipment, Instruments & Components: 6.85% | ||||||||||||
Checkpoint Systems Incorporated | 28,600 | 291,148 | ||||||||||
Cognex Corporation | 7,900 | 379,990 | ||||||||||
Coherent Incorporated † | 11,950 | 758,586 | ||||||||||
OSI Systems Incorporated † | 18,850 | 1,334,391 | ||||||||||
| 2,764,115 | ||||||||||||
|
| |||||||||||
| IT Services: 0.17% | ||||||||||||
TeleTech Holdings Incorporated | 2,500 | 67,700 | ||||||||||
|
| |||||||||||
| Semiconductors & Semiconductor Equipment: 0.36% | ||||||||||||
Kulicke & Soffa Industries Incorporated † | 12,500 | 146,375 | ||||||||||
|
| |||||||||||
| Software: 0.28% | ||||||||||||
Tangoe Incorporated † | 8,900 | 111,962 | ||||||||||
|
| |||||||||||
| Technology Hardware, Storage & Peripherals: 4.14% | ||||||||||||
Cray Incorporated † | 42,500 | 1,254,175 | ||||||||||
Diebold Incorporated | 5,800 | 203,000 | ||||||||||
Quantum Corporation † | 128,200 | 215,376 | ||||||||||
| 1,672,551 | ||||||||||||
|
| |||||||||||
Materials: 13.96% | ||||||||||||
| Chemicals: 0.34% | ||||||||||||
Calgon Carbon Corporation | 7,200 | 139,536 | ||||||||||
|
| |||||||||||
| Containers & Packaging: 0.24% | ||||||||||||
Intertape Polymer Group Incorporated | 6,300 | 95,823 | ||||||||||
|
| |||||||||||
| Metals & Mining: 12.27% | ||||||||||||
Agnico-Eagle Mines Limited | 10,800 | 306,396 | ||||||||||
Carpenter Technology Corporation | 7,900 | 305,572 | ||||||||||
NovaGold Resources Incorporated † | 38,800 | 132,696 | ||||||||||
Randgold Resources Limited ADR | 38,100 | 2,550,795 | ||||||||||
Royal Gold Incorporated | 8,200 | 505,038 | ||||||||||
Sandstorm Gold Limited † | 45,500 | 133,770 | ||||||||||
Silver Standard Resources Incorporated † | 37,100 | 232,988 | ||||||||||
Steel Dynamics Incorporated | 31,900 | 660,809 | ||||||||||
Webco Industries Incorporated †(a)(i) | 2,200 | 126,500 | ||||||||||
| 4,954,564 | ||||||||||||
|
| |||||||||||
| Paper & Forest Products: 1.11% | ||||||||||||
Deltic Timber Corporation | 3,500 | 236,740 | ||||||||||
The accompanying notes are an integral part of these financial statements.
Table of Contents
| Portfolio of investments—June 30, 2015 (unaudited) | Wells Fargo Advantage VT Small Cap Value Fund | 11 |
| Security name | Shares | Value | ||||||||||||
| Paper & Forest Products (continued) | ||||||||||||||
Wausau Paper Corporation | 22,900 | $ | 210,222 | |||||||||||
| 446,962 | ||||||||||||||
|
| |||||||||||||
Telecommunication Services: 1.78% | ||||||||||||||
| Diversified Telecommunication Services: 1.78% | ||||||||||||||
Cincinnati Bell Incorporated † | 188,900 | 721,598 | ||||||||||||
|
| |||||||||||||
Total Common Stocks (Cost $32,740,019) | 35,218,414 | |||||||||||||
|
| |||||||||||||
Exchange-Traded Funds: 1.82% | ||||||||||||||
Market Vectors Gold Miners ETF | 15,879 | 282,011 | ||||||||||||
Market Vectors Junior Gold Miners ETF | 5,004 | 120,847 | ||||||||||||
SPDR S&P Regional Banking ETF | 7,530 | 332,525 | ||||||||||||
Total Exchange-Traded Funds (Cost $1,008,931) | 735,383 | |||||||||||||
|
| |||||||||||||
| Yield | ||||||||||||||
| Short-Term Investments: 11.07% | ||||||||||||||
| Investment Companies: 11.07% | ||||||||||||||
Wells Fargo Advantage Cash Investment Money Market Fund, Select Class (l)(u) | 0.12 | % | 4,470,582 | 4,470,582 | ||||||||||
|
| |||||||||||||
Total Short-Term Investments (Cost $4,470,582) | 4,470,582 | |||||||||||||
|
| |||||||||||||
| Total investments in securities (Cost $38,219,532) * | 100.10 | % | 40,424,379 | |||||
Other assets and liabilities, net | (0.10 | ) | (41,964 | ) | ||||
|
|
|
| |||||
| Total net assets | 100.00 | % | $ | 40,382,415 | ||||
|
|
|
|
| † | Non-income-earning security |
| (a) | The security is fair valued in accordance with procedures approved by the Board of Trustees. |
| (i) | Illiquid security |
| (l) | The security represents an affiliate of the Fund as defined in the Investment Company Act of 1940. |
| (u) | The rate represents the 7-day annualized yield at period end. |
| * | Cost for federal income tax purposes is $38,618,249 and unrealized gains (losses) consists of: |
Gross unrealized gains | $ | 7,254,561 | ||
Gross unrealized losses | (5,448,431 | ) | ||
|
| |||
Net unrealized gains | $ | 1,806,130 |
The accompanying notes are an integral part of these financial statements.
Table of Contents
| 12 | Wells Fargo Advantage VT Small Cap Value Fund | Statement of assets and liabilities—June 30, 2015 (unaudited) |
Assets | ||||
Investments | ||||
In unaffiliated securities, at value (cost $33,748,950) | $ | 35,953,797 | ||
In affiliated securities, at value (cost $4,470,582) | 4,470,582 | |||
|
| |||
Total investments, at value (cost $38,219,532) | 40,424,379 | |||
Receivable for investments sold | 152,183 | |||
Receivable for Fund shares sold | 8,268 | |||
Receivable for dividends | 15,783 | |||
Prepaid expenses and other assets | 3,065 | |||
|
| |||
Total assets | 40,603,678 | |||
|
| |||
Liabilities | ||||
Payable for investments purchased | 123,452 | |||
Payable for Fund shares redeemed | 43,825 | |||
Advisory fee payable | 16,340 | |||
Distribution fee payable | 2,546 | |||
Administration fees payable | 4,413 | |||
Professional fees payable | 17,671 | |||
Accrued expenses and other liabilities | 13,016 | |||
|
| |||
Total liabilities | 221,263 | |||
|
| |||
Total net assets | $ | 40,382,415 | ||
|
| |||
NET ASSETS CONSIST OF | ||||
Paid-in capital | $ | 39,205,675 | ||
Undistributed net investment income | 217,234 | |||
Accumulated net realized losses on investments | (1,245,341 | ) | ||
Net unrealized gains on investments | 2,204,847 | |||
|
| |||
Total net assets | $ | 40,382,415 | ||
|
| |||
COMPUTATION OF NET ASSET VALUE PER SHARE | ||||
Net assets – Class 1 | $ | 28,321,671 | ||
Shares outstanding – Class 11 | 2,592,146 | |||
Net asset value per share – Class 1 | $10.93 | |||
Net assets – Class 2 | $ | 12,060,744 | ||
Shares outstanding – Class 21 | 1,105,947 | |||
Net asset value per share – Class 2 | $10.91 | |||
| 1 | The Fund has an unlimited number of authorized shares. |
The accompanying notes are an integral part of these financial statements.
Table of Contents
| Statement of operations—six months ended June 30, 2015 (unaudited) | Wells Fargo Advantage VT Small Cap Value Fund | 13 |
Investment income | ||||
Dividends (net of foreign withholding taxes of $468) | $ | 242,400 | ||
Income from affiliated securities | 1,552 | |||
|
| |||
Total investment income | 243,952 | |||
|
| |||
Expenses | ||||
Advisory fee | 157,073 | |||
Administration fees | ||||
Fund level | 10,471 | |||
Class 1 | 11,690 | |||
Class 2 | 5,065 | |||
Distribution fee | ||||
Class 2 | 15,827 | |||
Custody and accounting fees | 9,714 | |||
Professional fees | 22,131 | |||
Shareholder report expenses | 11,015 | |||
Trustees’ fees and expenses | 6,918 | |||
Other fees and expenses | 5,009 | |||
|
| |||
Total expenses | 254,913 | |||
Less: Fee waivers and/or expense reimbursements | (52,693 | ) | ||
|
| |||
Net expenses | 202,220 | |||
|
| |||
Net investment income | 41,732 | |||
|
| |||
REALIZED AND UNREALIZED GAINS (LOSSES) ON INVESTMENTS | ||||
Net realized gains on investments | 2,770,039 | |||
Net change in unrealized gains (losses) on investments | (3,717,437 | ) | ||
|
| |||
Net realized and unrealized gains (losses) on investments | (947,398 | ) | ||
|
| |||
Net decrease in net assets resulting from operations | $ | (905,666 | ) | |
|
| |||
The accompanying notes are an integral part of these financial statements.
Table of Contents
| 14 | Wells Fargo Advantage VT Small Cap Value Fund | Statement of changes in net assets |
| Six months ended June 30, 2015 (unaudited) | Year ended December 31, 2014 | |||||||||||||||
Operations | ||||||||||||||||
Net investment income | $ | 41,732 | $ | 384,531 | ||||||||||||
Net realized gains on investments | 2,770,039 | 4,649,149 | ||||||||||||||
Net change in unrealized gains (losses) on investments | (3,717,437 | ) | (2,514,959 | ) | ||||||||||||
|
| |||||||||||||||
Net increase (decrease) in net assets resulting from operations | (905,666 | ) | 2,518,721 | |||||||||||||
|
| |||||||||||||||
Distributions to shareholders from | ||||||||||||||||
Net investment income | ||||||||||||||||
Class 1 | 0 | (214,385 | ) | |||||||||||||
Class 2 | 0 | (53,163 | ) | |||||||||||||
|
| |||||||||||||||
Total distributions to shareholders | 0 | (267,548 | ) | |||||||||||||
|
| |||||||||||||||
Capital share transactions | Shares | Shares | ||||||||||||||
Proceeds from shares sold | ||||||||||||||||
Class 1 | 43,494 | 476,677 | 145,789 | 1,586,802 | ||||||||||||
Class 2 | 34,307 | 377,106 | 190,581 | 2,169,735 | ||||||||||||
|
| |||||||||||||||
| 853,783 | 3,756,537 | |||||||||||||||
|
| |||||||||||||||
Reinvestment of distributions | ||||||||||||||||
Class 1 | 0 | 0 | 18,168 | 214,385 | ||||||||||||
Class 2 | 0 | 0 | 4,505 | 53,163 | ||||||||||||
|
| |||||||||||||||
| 0 | 267,548 | |||||||||||||||
|
| |||||||||||||||
Payment for shares redeemed | ||||||||||||||||
Class 1 | (257,460 | ) | (2,827,288 | ) | (707,033 | ) | (8,020,383 | ) | ||||||||
Class 2 | (152,278 | ) | (1,675,623 | ) | (355,425 | ) | (4,044,288 | ) | ||||||||
|
| |||||||||||||||
| (4,502,911 | ) | (12,064,671 | ) | |||||||||||||
|
| |||||||||||||||
Net decrease in net assets resulting from capital share transactions | (3,649,128 | ) | (8,040,586 | ) | ||||||||||||
|
| |||||||||||||||
Total decrease in net assets | (4,554,794 | ) | (5,789,413 | ) | ||||||||||||
|
| |||||||||||||||
Net assets | ||||||||||||||||
Beginning of period | 44,937,209 | 50,726,622 | ||||||||||||||
|
| |||||||||||||||
End of period | $ | 40,382,415 | $ | 44,937,209 | ||||||||||||
|
| |||||||||||||||
Undistributed net investment income | $ | 217,234 | $ | 175,502 | ||||||||||||
|
| |||||||||||||||
The accompanying notes are an integral part of these financial statements.
Table of Contents
| Financial highlights | Wells Fargo Advantage VT Small Cap Value Fund | 15 |
(For a share outstanding throughout each period)
| Six months ended June 30, 2015 (unaudited) | Year ended December 31 | |||||||||||||||||||||||
| CLASS 1 | 2014 | 2013 | 2012 | 2011 | 20101 | |||||||||||||||||||
Net asset value, beginning of period | $11.15 | $10.72 | $9.41 | $8.33 | $9.04 | $7.36 | ||||||||||||||||||
Net investment income | 0.02 | 0.11 | 0.10 | 0.12 | 0.11 | 0.05 | 2 | |||||||||||||||||
Net realized and unrealized gains (losses) on investments | (0.24 | ) | 0.39 | 1.31 | 1.06 | (0.74 | ) | 1.63 | ||||||||||||||||
|
|
|
|
|
|
|
|
|
|
|
| |||||||||||||
Total from investment operations | (0.22 | ) | 0.50 | 1.41 | 1.18 | (0.63 | ) | 1.68 | ||||||||||||||||
Distributions to shareholders from | ||||||||||||||||||||||||
Net investment income | 0.00 | (0.07 | ) | (0.10 | ) | (0.10 | ) | (0.08 | ) | 0.00 | ||||||||||||||
Net asset value, end of period | $10.93 | $11.15 | $10.72 | $9.41 | $8.33 | $9.04 | ||||||||||||||||||
Total return3 | (1.97 | )% | 4.63 | % | 15.03 | % | 14.33 | % | (7.06 | )% | 22.83 | % | ||||||||||||
Ratios to average net assets (annualized) | ||||||||||||||||||||||||
Gross expenses | 1.14 | % | 1.09 | % | 1.10 | % | 1.09 | % | 1.14 | % | 0.96 | % | ||||||||||||
Net expenses | 0.89 | % | 0.89 | % | 0.89 | % | 0.89 | % | 0.89 | % | 0.89 | % | ||||||||||||
Net investment income | 0.27 | % | 0.85 | % | 0.81 | % | 1.10 | % | 1.07 | % | 1.43 | % | ||||||||||||
Supplemental data | ||||||||||||||||||||||||
Portfolio turnover rate | 12 | % | 27 | % | 18 | % | 17 | % | 16 | % | 61 | % | ||||||||||||
Net assets, end of period (000s omitted) | $28,322 | $31,296 | $35,900 | $38,113 | $43,155 | $58,255 | ||||||||||||||||||
| 1 | For the period from July 16, 2010 (commencement of class operations) to December 31, 2010 |
| 2 | Calculated based upon average shares outstanding |
| 3 | Returns for periods of less than one year are not annualized. |
The accompanying notes are an integral part of these financial statements.
Table of Contents
| 16 | Wells Fargo Advantage VT Small Cap Value Fund | Financial highlights |
(For a share outstanding throughout each period)
| Six months ended June 30, 2015 (unaudited) | Year ended December 31 | |||||||||||||||||||||||
| CLASS 2 | 2014 | 2013 | 2012 | 2011 | 20101 | |||||||||||||||||||
Net asset value, beginning of period | $11.15 | $10.71 | $9.40 | $8.32 | $9.03 | $7.83 | ||||||||||||||||||
Net investment income | 0.00 | 2 | 0.07 | 0.07 | 0.09 | 0.09 | 0.12 | |||||||||||||||||
Net realized and unrealized gains (losses) on investments | (0.24 | ) | 0.41 | 1.31 | 1.07 | (0.74 | ) | 1.20 | ||||||||||||||||
|
|
|
|
|
|
|
|
|
|
|
| |||||||||||||
Total from investment operations | (0.24 | ) | 0.48 | 1.38 | 1.16 | (0.65 | ) | 1.32 | ||||||||||||||||
Distributions to shareholders from | ||||||||||||||||||||||||
Net investment income | 0.00 | (0.04 | ) | (0.07 | ) | (0.08 | ) | (0.06 | ) | (0.12 | ) | |||||||||||||
Net asset value, end of period | $10.91 | $11.15 | $10.71 | $9.40 | $8.32 | $9.03 | ||||||||||||||||||
Total return3 | (2.15 | )% | 4.46 | % | 14.75 | % | 14.00 | % | (7.26 | )% | 17.25 | % | ||||||||||||
Ratios to average net assets (annualized) | ||||||||||||||||||||||||
Gross expenses | 1.39 | % | 1.34 | % | 1.35 | % | 1.34 | % | 1.39 | % | 1.52 | % | ||||||||||||
Net expenses | 1.14 | % | 1.14 | % | 1.14 | % | 1.14 | % | 1.14 | % | 1.14 | % | ||||||||||||
Net investment income | 0.02 | % | 0.58 | % | 0.55 | % | 0.90 | % | 0.82 | % | 1.06 | % | ||||||||||||
Supplemental data | ||||||||||||||||||||||||
Portfolio turnover rate | 12 | % | 27 | % | 18 | % | 17 | % | 16 | % | 61 | % | ||||||||||||
Net assets, end of period (000s omitted) | $12,061 | $13,641 | $14,826 | $16,245 | $14,681 | $19,606 | ||||||||||||||||||
| 1 | After the close of business on July 16, 2010, existing shares of the Fund were renamed Class 2 shares. |
| 2 | Amount is less than $0.005 per share. |
| 3 | Returns for periods of less than one year are not annualized. |
The accompanying notes are an integral part of these financial statements.
Table of Contents
| Notes to financial statements (unaudited) | Wells Fargo Advantage VT Small Cap Value Fund | 17 |
1. ORGANIZATION
Wells Fargo Variable Trust (the “Trust”), a Delaware statutory trust organized on March 10, 1999, is an open-end management investment company registered under the Investment Company Act of 1940, as amended (the “1940 Act”). As an investment company, the Trust follows the accounting and reporting guidance in Financial Accounting Standards Board (“FASB”) Accounting Standards Codification Topic 946, Financial Services – Investment Companies. These financial statements report on the Wells Fargo Advantage VT Small Cap Value Fund (the “Fund”) which is a diversified series of the Trust.
2. SIGNIFICANT ACCOUNTING POLICIES
The following significant accounting policies, which are consistently followed in the preparation of the financial statements of the Fund, are in conformity with U.S. generally accepted accounting principles which require management to make estimates and assumptions that affect the reported amounts of assets and liabilities, disclosure of contingent assets and liabilities at the date of the financial statements, and the reported amounts of revenues and expenses during the reporting period. Actual results could differ from those estimates.
Securities valuation
All investments are valued each business day as of the close of regular trading on the New York Stock Exchange (generally 4 p.m. Eastern Time).
Equity securities and options that are listed on a foreign or domestic exchange or market are valued at the official closing price or, if none, the last sales price. If no sale occurs on the primary exchange or market that day, the prior day’s price will be deemed “stale” and a fair value price will be determined in accordance with the Fund’s Valuation Procedures.
Equity securities that are not listed on a foreign or domestic exchange or market, but have a public trading market, are valued at the quoted bid price from an independent broker-dealer that the Management Valuation Team of Wells Fargo Funds Management, LLC (“Funds Management”) has determined is an acceptable source.
Non-listed OTC options are valued at the evaluated price provided by an independent pricing service or, if a reliable price is not available, the quoted bid price from an independent broker-dealer.
The values of securities denominated in foreign currencies are translated into U.S. dollars at rates provided by an independent foreign currency pricing source at a time each business day specified by the Management Valuation.
Many securities markets and exchanges outside the U.S. close prior to the close of the New York Stock Exchange and therefore may not fully reflect trading or events that occur after the close of the principal exchange in which the foreign securities are traded, but before the close of the New York Stock Exchange. If such trading or events are expected to materially affect the value of such securities, then fair value pricing procedures approved by the Board of Trustees of the Fund are applied. These procedures take into account multiple factors including movements in U.S. securities markets after foreign exchanges close. Foreign securities that are fair valued under these procedures are categorized as Level 2 and the application of these procedures may result in transfers between Level 1 and Level 2. Depending on market activity, such fair valuations may be frequent. Such fair value pricing may result in net asset values that are higher or lower than net asset values based on the last reported sales price or latest quoted bid price. On June 30, 2015, such fair value pricing was not used in pricing foreign securities.
Investments in registered open-end investment companies are valued at net asset value.
Investments which are not valued using any of the methods discussed above are valued at their fair value, as determined in good faith by the Board of Trustees of the Fund. The Board of Trustees has established a Valuation Committee comprised of the Trustees and has delegated to it the authority to take any actions regarding the valuation of portfolio securities that the Valuation Committee deems necessary or appropriate, including determining the fair value of portfolio securities, unless the determination has been delegated to the Management Valuation Team. The Board of Trustees retains the authority to make or ratify any valuation decisions or approve any changes to the Valuation Procedures as it deems appropriate. On a quarterly basis, the Board of Trustees receives reports on any valuation actions taken by the Valuation Committee or the Management Valuation Team which may include items for ratification.
Valuations of fair valued securities are compared to the next actual sales price when available, or other appropriate market values, to assess the continued appropriateness of the fair valuation methodologies used. These securities are fair valued on a day-to-day basis, taking into consideration changes to appropriate market information and any significant changes to the inputs considered in the valuation process until there is a readily available price provided on an exchange or by an independent pricing service. Valuations received from an independent pricing service or independent broker-dealer quotes are periodically validated by comparisons to most recent trades and valuations provided by other
Table of Contents
| 18 | Wells Fargo Advantage VT Small Cap Value Fund | Notes to financial statements (unaudited) |
independent pricing services in addition to the review of prices by the adviser and/or subadviser. Unobservable inputs used in determining fair valuations are identified based on the type of security, taking into consideration factors utilized by market participants in valuing the investment, knowledge about the issuer and the current market environment.
Foreign currency translation
The accounting records of the Fund are maintained in U.S. dollars. The values of other assets and liabilities denominated in foreign currencies are translated into U.S. dollars at rates provided by an independent foreign currency pricing source at a time each business day specified by the Management Valuation Team. Purchases and sales of securities, and income and expenses are converted at the rate of exchange on the respective dates of such transactions. Net realized foreign exchange gains or losses arise from sales of foreign currencies, currency gains or losses realized between the trade and settlement dates on securities transactions, and the difference between the amounts of dividends, interest and foreign withholding taxes recorded and the U.S. dollar equivalent of the amounts actually paid or received. Net unrealized foreign exchange gains and losses arise from changes in the fair value of assets and liabilities other than investments in securities resulting from changes in exchange rates. The changes in net assets arising from changes in exchange rates and the changes in net assets resulting from changes in market prices of securities are not separately presented. Such changes are included in net realized and unrealized gains or losses from investments.
Options
The Fund is subject to equity price risk in the normal course of pursuing its investment objectives. The Fund may write covered call options or secured put options on individual securities and/or indexes. When the Fund writes an option, an amount equal to the premium received is recorded as a liability and is subsequently adjusted to the current market value of the written option. Premiums received from written options that expire unexercised are recognized as realized gains on the expiration date. For exercised options, the difference between the premium received and the amount paid on effecting a closing purchase transaction, including brokerage commissions, is treated as a realized gain or loss. If a call option is exercised, the premium is added to the proceeds from the sale of the underlying security in calculating the realized gain or loss on the sale. If a put option is exercised, the premium reduces the cost of the security purchased. The Fund, as a writer of an option, bears the market risk of an unfavorable change in the price of the security and/or index underlying the written option.
The Fund may also purchase call or put options. The premium is included in the Statement of Assets and Liabilities as an investment, the value of which is subsequently adjusted based on the current market value of the option. Premiums paid for purchased options that expire are recognized as realized losses on the expiration date. Premiums paid for purchased options that are exercised or closed are added to the amount paid or offset against the proceeds received for the underlying security to determine the realized gain or loss. The risk of loss associated with purchased options is limited to the premium paid.
Options traded on an exchange are regulated and terms of the options are standardized. Purchased options traded over-the-counter expose the Fund to counterparty risk in the event the counterparty does not perform. This risk can be mitigated by having a master netting arrangement between the Fund and the counterparty and by having the counterparty post collateral to cover the Fund’s exposure to the counterparty.
Security transactions and income recognition
Securities transactions are recorded on a trade date basis. Realized gains or losses are recorded on the basis of identified cost.
Dividend income is recognized on the ex-dividend date, except for certain dividends from foreign securities, which are recorded as soon as the custodian verifies the ex-dividend date. Dividend income from foreign securities is recorded net of foreign taxes withheld where recovery of such taxes is not assured.
Distributions to shareholders
Distributions to shareholders from net investment income and net realized gains, if any, are recorded on the ex-dividend date. Such distributions are determined in conformity with federal income tax regulations, which may differ in amount or character from net investment income and realized gains recognized for purposes of U.S. generally accepted accounting principles.
Federal and other taxes
The Fund intends to continue to qualify as a regulated investment company by distributing substantially all of its investment company taxable income and any net realized capital gains (after reduction for capital loss carryforwards) sufficient to relieve it from all, or substantially all, federal income taxes. Accordingly, no provision for federal income taxes was required.
Table of Contents
| Notes to financial statements (unaudited) | Wells Fargo Advantage VT Small Cap Value Fund | 19 |
The Fund’s income and federal excise tax returns and all financial records supporting those returns for the prior three fiscal years are subject to examination by the federal and Delaware revenue authorities. Management has analyzed the Fund’s tax positions taken on federal, state, and foreign tax returns for all open tax years and does not believe that there are any uncertain tax positions that require recognition of a tax liability.
As of December 31, 2014, the Fund had capital loss carryforwards available to offset future net realized capital gains in the amount of $3,716,042 expiring in 2017.
Class allocations
The separate classes of shares offered by the Fund differ principally in distribution fees. Class specific expenses are charged directly to that share class. Investment income, common expenses and realized and unrealized gains (losses) on investments are allocated daily to each class of shares based on the relative proportion of net assets of each class.
3. FAIR VALUATION MEASUREMENTS
Fair value measurements of investments are determined within a framework that has established a fair value hierarchy based upon the various data inputs utilized in determining the value of the Fund’s investments. The three-level hierarchy gives the highest priority to unadjusted quoted prices in active markets for identical assets or liabilities (Level 1) and the lowest priority to significant unobservable inputs (Level 3). The Fund’s investments are classified within the fair value hierarchy based on the lowest level of input that is significant to the fair value measurement. The inputs are summarized into three broad levels as follows:
| n | Level 1 – quoted prices in active markets for identical securities |
| n | Level 2 – other significant observable inputs (including quoted prices for similar securities, interest rates, prepayment speeds, credit risk, use of amortized cost, etc.) |
| n | Level 3 – significant unobservable inputs (including the Fund’s own assumptions in determining the fair value of investments) |
The inputs or methodologies used for valuing investments in securities are not necessarily an indication of the risk associated with investing in those securities.
The following is a summary of the inputs used in valuing the Fund’s assets and liabilities as of June 30, 2015:
| Quoted prices (Level 1) | Other significant observable inputs (Level 2) | Significant unobservable inputs (Level 3) | Total | |||||||||||||
Assets | ||||||||||||||||
Investments in: | ||||||||||||||||
Common stocks | ||||||||||||||||
Consumer discretionary | $ | 5,321,316 | $ | 0 | $ | 0 | $ | 5,321,316 | ||||||||
Energy | 4,870,742 | 201,269 | 0 | 5,072,011 | ||||||||||||
Financials | 6,804,130 | 0 | 0 | 6,804,130 | ||||||||||||
Health care | 2,186,286 | 0 | 0 | 2,186,286 | ||||||||||||
Industrials | 4,311,864 | 0 | 0 | 4,311,864 | ||||||||||||
Information technology | 5,164,324 | 0 | 0 | 5,164,324 | ||||||||||||
Materials | 5,414,562 | 222,323 | 0 | 5,636,885 | ||||||||||||
Telecommunication services | 721,598 | 0 | 0 | 721,598 | ||||||||||||
Exchange-traded funds | 735,383 | 0 | 0 | 735,383 | ||||||||||||
Short-term investments | ||||||||||||||||
Investment companies | 4,470,582 | 0 | 0 | 4,470,582 | ||||||||||||
Total assets | $ | 40,000,787 | $ | 423,592 | $ | 0 | $ | 40,424,379 | ||||||||
The Fund recognizes transfers between levels within the fair value hierarchy at the end of the reporting period. At June 30, 2015, the Fund did not have any transfers into/out of Level 1, Level 2, or Level 3.
Table of Contents
| 20 | Wells Fargo Advantage VT Small Cap Value Fund | Notes to financial statements (unaudited) |
4. TRANSACTIONS WITH AFFILIATES
Advisory fee
The Trust has entered into an advisory contract with Funds Management, an indirect wholly owned subsidiary of Wells Fargo & Company (“Wells Fargo”). The adviser is responsible for implementing investment policies and guidelines and for supervising the subadviser, who is responsible for day-to-day portfolio management of the Fund.
Pursuant to the contract, Funds Management is entitled to receive an annual advisory fee starting at 0.75% and declining to 0.60% as the average daily net assets of the Fund increase. For the six months ended June 30, 2015, the advisory fee was equivalent to an annual rate of 0.75% of the Fund’s average daily net assets.
Funds Management has retained the services of a subadviser to provide daily portfolio management to the Fund. The fee for subadvisory services is borne by Funds Management. Wells Capital Management Incorporated, an affiliate of Funds Management and an indirect wholly owned subsidiary of Wells Fargo, is the subadviser to the Fund and is entitled to receive a fee from Funds Management at an annual rate starting at 0.55% and declining to 0.40% as the average daily net assets of the Fund increase.
Administration fees
The Trust has entered into an administration agreement with Funds Management. Under this agreement, for providing administrative services, which includes paying fees and expenses for services provided by the transfer agent, sub-transfer agents, omnibus account servicers and record-keepers, Funds Management is entitled to receive from the Fund an annual fund level administration fee starting at 0.05% and declining to 0.03% as the average daily net assets of the Fund increase and a class level administration fee of 0.08% which is calculated based on the average daily net assets of each class.
Funds Management has contractually waived and/or reimbursed advisory and administration fees to the extent necessary to maintain certain net operating expense ratios for the Fund. Waiver of fees and/or reimbursement of expenses by Funds Management were made first from fund level expenses on a proportionate basis and then from class specific expenses. Funds Management has committed through April 30, 2016 to waive fees and/or reimburse expenses to the extent necessary to cap the Fund’s expenses at 0.89% for Class 1 and 1.14% for Class 2 shares. After this time, the cap may be increased or the commitment to maintain the cap may be terminated only with the approval of the Board of Trustees.
Distribution fee
The Trust has adopted a Distribution Plan for Class 2 shares of the Fund pursuant to Rule 12b-1 under the 1940 Act. A distribution fee is charged to Class 2 shares and paid to Wells Fargo Funds Distributor, LLC, the principal underwriter, at an annual rate of 0.25% of the average daily net assets of Class 2 shares.
5. INVESTMENT PORTFOLIO TRANSACTIONS
Purchases and sales of investments, excluding U.S. government obligations (if any) and short-term securities, for the six months ended June 30, 2015 were $4,737,133 and $12,312,320, respectively.
6. BANK BORROWINGS
The Trust and Wells Fargo Funds Trust (excluding the money market funds and certain other funds) are parties to a $150,000,000 revolving credit agreement whereby the Fund is permitted to use bank borrowings for temporary or emergency purposes, such as to fund shareholder redemption requests. Interest under the credit agreement is charged to the Fund based on a borrowing rate equal to the higher of the Federal Funds rate in effect on that day plus 1.25% or the overnight LIBOR rate in effect on that day plus 1.25%. In addition, an annual commitment fee equal to 0.10% of the unused balance is allocated to each participating fund. For the six months ended June 30, 2015, the Fund paid $40 in commitment fees.
For the six months ended June 30, 2015, there were no borrowings by the Fund under the agreement.
7. SUBSEQUENT DISTRIBUTION
On July 9, 2015, the Fund declared distributions from net investment income to shareholders of record on July 8, 2015. The per share amounts payable on July 10, 2015 were as follows:
| Net investment income | ||||
Class 1 | $0.05988 | |||
Class 2 | $0.02586 | |||
Table of Contents
| Notes to financial statements (unaudited) | Wells Fargo Advantage VT Small Cap Value Fund | 21 |
These distributions are not reflected in the accompanying financial statements. The final determination of the source of all distributions is subject to change and made after the Fund’s tax year-end.
8. INDEMNIFICATION
Under the Trust’s organizational documents, the officers and Trustees have been granted certain indemnification rights against certain liabilities that may arise out of performance of their duties to the Trust. Additionally, in the normal course of business, the Trust may enter into contracts with service providers that contain a variety of indemnification clauses. The Trust’s maximum exposure under these arrangements is dependent on future claims that may be made against the Fund and, therefore, cannot be estimated.
Table of Contents
| 22 | Wells Fargo Advantage VT Small Cap Value Fund | Other information (unaudited) |
PROXY VOTING INFORMATION
A description of the policies and procedures that the Fund uses to determine how to vote proxies relating to portfolio securities is available, upon request, by calling 1-800-222-8222, visiting our website at wellsfargoadvantagefunds.com, or visiting the SEC website at sec.gov. Information regarding how the Fund voted proxies relating to portfolio securities during the most recent 12-month period ended June 30 is available on the Fund’s website at wellsfargoadvantagefunds.com or by visiting the SEC website at sec.gov.
PORTFOLIO HOLDINGS INFORMATION
The complete portfolio holdings for the Fund are publicly available monthly on the Fund’s website (wellsfargoadvantagefunds.com), on a one-month delayed basis. In addition, top ten holdings information (excluding derivative positions) for the Fund is publicly available on the Fund’s website on a monthly, seven-day or more delayed basis. The Fund files its complete schedule of portfolio holdings with the SEC for the first and third quarters of each fiscal year on Form N-Q, which is available by visiting the SEC website at sec.gov. In addition, the Fund’s Form N-Q may be reviewed and copied at the SEC’s Public Reference Room in Washington, DC, and at regional offices in New York City, at 233 Broadway, and in Chicago, at 175 West Jackson Boulevard, Suite 900. Information about the Public Reference Room may be obtained by calling 1-800-SEC-0330.
Table of Contents
| Other information (unaudited) | Wells Fargo Advantage VT Small Cap Value Fund | 23 |
BOARD OF TRUSTEES AND OFFICERS
Each of the Trustees and Officers1 listed in the table below acts in identical capacities for each fund in the Wells Fargo Advantage family of funds, which consists of 134 mutual funds comprising the Wells Fargo Funds Trust, Wells Fargo Variable Trust, Wells Fargo Master Trust and four closed-end funds (collectively the “Fund Complex”). This table should be read in conjunction with the Prospectus and the Statement of Additional Information2. The mailing address of each Trustee and Officer is 525 Market Street, 12th Floor, San Francisco, CA 94105. Each Trustee and Officer serves an indefinite term, however, each Trustee serves such term until reaching the mandatory retirement age established by the Trustees.
Independent Trustees
Name and year of birth | Position held and length of service* | Principal occupations during past five years or longer | Other directorships during | |||
| William R. Ebsworth (Born 1957) | Trustee, since 2015** | Retired. From 1984 to 2013, equities analyst, portfolio manager, research director at Fidelity Management and Research Company and retired in 2013 as Chief Investment Officer of Fidelity Strategic Advisers, Inc. in Boston, Tokyo, and Hong Kong where he led a team of investment professionals managing client assets. Prior thereto, Board member of Hong Kong Securities Clearing Co., Hong Kong Options Clearing Corp., the Thailand International Fund, Ltd., Fidelity Investments Life Insurance Company, and Empire Fidelity Investments Life Insurance Company. Mr. Ebsworth is an Adjunct Lecturer, Finance, at Babson College and a Chartered Financial Analyst. | Asset Allocation Trust | |||
| Jane A. Freeman (Born 1953) | Trustee, since 2015** | Retired. From 2012 to 2014 and 1999 to 2008, Chief Financial Officer of Scientific Learning Corporation. From 2008 to 2012, Ms. Freeman provided consulting services related to strategic business projects. Prior to 1999, Portfolio Manager at Rockefeller & Co. and Scudder, Stevens & Clark. Board member of the Harding Loevner Funds from 1996 to 2014, serving as both Lead Independent Director and chair of the Audit Committee. Board member of the Russell Exchange Traded Funds Trust from 2011 to 2012 and the chair of the Audit Committee. Ms. Freeman is a Chartered Financial Analyst (inactive), Chair of Taproot Foundation (non-profit organization) and a Board Member of Ruth Bancroft Garden (non-profit organization). | Asset Allocation Trust | |||
| Peter G. Gordon (Born 1942) | Trustee, since 1998; Chairman, since 2005 | Co-Founder, Retired Chairman, President and CEO of Crystal Geyser Water Company. Trustee Emeritus, Colby College. | Asset Allocation Trust | |||
| Isaiah Harris, Jr. (Born 1952) | Trustee, since 2009 | Retired. Chairman of the Board of CIGNA Corporation since 2009, and Director since 2005. From 2003 to 2011, Director of Deluxe Corporation. Prior thereto, President and CEO of BellSouth Advertising and Publishing Corp. from 2005 to 2007, President and CEO of BellSouth Enterprises from 2004 to 2005 and President of BellSouth Consumer Services from 2000 to 2003. Emeritus member of the Iowa State University Foundation Board of Governors. Emeritus Member of the Advisory Board of Iowa State University School of Business. Advisory Board Member, Palm Harbor Academy. Mr. Harris is a certified public accountant. | CIGNA Corporation; Asset Allocation Trust | |||
| Judith M. Johnson (Born 1949) | Trustee, since 2008; Audit Committee Chairman, since 2008 | Retired. Prior thereto, Chief Executive Officer and Chief Investment Officer of Minneapolis Employees Retirement Fund from 1996 to 2008. Ms. Johnson is an attorney, certified public accountant and a certified managerial accountant. | Asset Allocation Trust | |||
| David F. Larcker (Born 1950) | Trustee, since 2009 | James Irvin Miller Professor of Accounting at the Graduate School of Business, Stanford University, Morgan Stanley Director of the Center for Leadership Development and Research and Senior Faculty of The Rock Center for Corporate Governance since 2006. From 2005 to 2008, Professor of Accounting at the Graduate School of Business, Stanford University. Prior thereto, Ernst & Young Professor of Accounting at The Wharton School, University of Pennsylvania from 1985 to 2005. | Asset Allocation Trust | |||
| Olivia S. Mitchell (Born 1953) | Trustee, since 2006 | International Foundation of Employee Benefit Plans Professor, Wharton School of the University of Pennsylvania since 1993. Director of Wharton’s Pension Research Council and Boettner Center on Pensions & Retirement Research, and Research Associate at the National Bureau of Economic Research. Previously, Cornell University Professor from 1978 to 1993. | Asset Allocation Trust |
Table of Contents
| 24 | Wells Fargo Advantage VT Small Cap Value Fund | Other information (unaudited) |
Name and year of birth | Position held and length of service* | Principal occupations during past five years or longer | Other directorships during | |||
| Timothy J. Penny (Born 1951) | Trustee, since 1996 | President and Chief Executive Officer of Southern Minnesota Initiative Foundation, a non-profit organization, since 2007 and Senior Fellow at the Humphrey Institute Policy Forum at the University of Minnesota since 1995. Member of the Board of Trustees of NorthStar Education Finance, Inc., a non-profit organization, since 2007. | Asset Allocation Trust | |||
| Michael S. Scofield (Born 1943) | Trustee, since 2010 | Served on the Investment Company Institute’s Board of Governors and Executive Committee from 2008-2011 as well the Governing Council of the Independent Directors Council from 2006-2011 and the Independent Directors Council Executive Committee from 2008-2011. Chairman of the IDC from 2008-2010. Institutional Investor (Fund Directions) Trustee of Year in 2007. Trustee of the Evergreen Funds complex (and its predecessors) from 1984 to 2010. Chairman of the Evergreen Funds from 2000-2010. Former Trustee of the Mentor Funds. Retired Attorney, Law Offices of Michael S. Scofield. | Asset Allocation Trust | |||
| Donald C. Willeke (Born 1940) | Trustee, since 1996 | Principal of the law firm of Willeke & Daniels. General Counsel of the Minneapolis Employees Retirement Fund from 1984 until its consolidation into the Minnesota Public Employees Retirement Association on June 30, 2010. Director and Vice Chair of The Tree Trust (non-profit corporation). Director of the American Chestnut Foundation (non-profit corporation). | Asset Allocation Trust |
| * | Length of service dates reflect the Trustee’s commencement of service with the Trust’s predecessor entities, where applicable. |
| ** | William R. Ebsworth and Jane A. Freeman each became a Trustee effective January 1, 2015. |
Officers
Name and year of birth | Position held and length of service | Principal occupations during past five years or longer | ||||
| Karla M. Rabusch (Born 1959) | President, since 2003 | Executive Vice President of Wells Fargo Bank, N.A. and President of Wells Fargo Funds Management, LLC since 2003. | ||||
| Jeremy DePalma1 (Born 1974) | Treasurer, since 2012 | Senior Vice President of Wells Fargo Funds Management, LLC since 2009. Senior Vice President of Evergreen Investment Management Company, LLC from 2008 to 2010. Vice President, Evergreen Investment Services, Inc. from 2004 to 2007. Head of the Fund Reporting and Control Team within Fund Administration from 2005 to 2010. | ||||
| C. David Messman (Born 1960) | Secretary, since 2000; Chief Legal Officer, since 2003 | Senior Vice President and Secretary of Wells Fargo Funds Management, LLC since 2001. Assistant General Counsel of Wells Fargo Bank, N.A. since 2013 and Vice President and Managing Counsel of Wells Fargo Bank N.A. from 1996 to 2013. | ||||
| Debra Ann Early (Born 1964) | Chief Compliance Officer, since 2007 | Senior Vice President of Wells Fargo Funds Management, LLC since 2007 and Chief Compliance Officer from 2007 to 2014. Chief Compliance Officer of Parnassus Investments from 2005 to 2007. Chief Financial Officer of Parnassus Investments from 2004 to 2007 and Senior Audit Manager of PricewaterhouseCoopers LLP from 1998 to 2004. | ||||
| David Berardi (Born 1975) | Assistant Treasurer, since 2009 | Vice President of Wells Fargo Funds Management, LLC since 2009. Vice President of Evergreen Investment Management Company, LLC from 2008 to 2010. Assistant Vice President of Evergreen Investment Services, Inc. from 2004 to 2008. Manager of Fund Reporting and Control for Evergreen Investment Management Company, LLC from 2004 to 2010. |
| 1 | Jeremy DePalma acts as Treasurer of 61 funds and Assistant Treasurer of 73 funds in the Fund Complex. |
| 2 | The Statement of Additional Information includes additional information about the Trustees and is available, without charge, upon request, by calling 1-800-222-8222 or by visiting the website at wellsfargoadvantagefunds.com. |
Table of Contents
| Other information (unaudited) | Wells Fargo Advantage VT Small Cap Value Fund | 25 |
BOARD CONSIDERATION OF INVESTMENT ADVISORY, INVESTMENT MANAGEMENT AND SUB-ADVISORY AGREEMENTS:
Under the Investment Company Act of 1940 (the “1940 Act”), the Board of Trustees (the “Board”) of Wells Fargo Variable Trust (the “Trust”) must determine annually whether to approve the continuation of the Trust’s investment advisory and sub-advisory agreements. In this regard, at an in-person meeting held on May 19-20, 2015 (the “Meeting”), the Board, all the members of which have no direct or indirect interest in the investment advisory and sub-advisory agreements and are not “interested persons” of the Trust, as defined in the 1940 Act (the “Independent Trustees”), reviewed and approved for Wells Fargo Advantage VT Small Cap Value Fund (the “Fund”): (i) an investment advisory agreement (the “Advisory Agreement”) with Wells Fargo Funds Management, LLC (“Funds Management”); (ii) an investment management agreement (the “Management Agreement”) with Funds Management; and (iii) an investment sub-advisory agreement (the “Sub-Advisory Agreement”) with Wells Capital Management Incorporated (the “Sub-Adviser”), an affiliate of Funds Management. The Management Agreement combines the terms of the Advisory Agreement with the terms of the Fund’s Amended and Restated Administration Agreement (the “Administration Agreement”) applicable to Fund-level administrative services. The Advisory Agreement, the Management Agreement and the Sub-Advisory Agreement are collectively referred to as the “Advisory Agreements.”
At the Meeting, the Board considered the factors and reached the conclusions described below relating to the selection of Funds Management and the Sub-Adviser and the approval of the Advisory Agreements. Prior to the Meeting, including at an in-person meeting in March 2015, the Trustees conferred extensively among themselves and with representatives of Funds Management about these matters. Also, the Board has adopted a team-based approach, with each team consisting of a sub-set of Trustees, to assist the full Board in the discharge of its duties in reviewing performance and other matters throughout the year. The Independent Trustees were assisted in their evaluation of the Advisory Agreements by independent legal counsel, from whom they received separate legal advice and with whom they met separately.
In providing information to the Board, Funds Management and the Sub-Adviser were guided by a detailed set of requests for information submitted to them by independent legal counsel on behalf of the Independent Trustees at the start of the Board’s annual contract renewal process earlier in 2015. In considering and approving the Advisory Agreements, the Trustees considered the information they believed relevant, including but not limited to the information discussed below. The Board considered not only the specific information presented in connection with the Meeting, but also the knowledge gained over time through interaction with Funds Management and the Sub-Adviser about various topics. In this regard, the Board reviewed reports of Funds Management at each of its quarterly meetings, which included, among other things, portfolio reviews and performance reports. In addition, the Board and the teams mentioned above confer with portfolio managers at various times throughout the year. The Board did not identify any particular information or consideration that was all-important or controlling, and each individual Trustee may have attributed different weights to various factors.
After its deliberations, the Board unanimously approved the continuation of the Advisory Agreement for the period from June 1, 2015 through June 30, 2015, approved the Management Agreement for the period from July 1, 2015 through May 31, 2016, and approved the continuation of the Sub-Advisory Agreement for a one-year term through May 31, 2016. The Board also determined that the compensation payable to Funds Management and the Sub-Adviser under each of the Advisory Agreements was reasonable. The Board considered the approval of the Advisory Agreements for the Fund as part of its consideration of agreements for funds across the complex, but its approvals were made on a fund-by-fund basis. The following summarizes a number of important, but not necessarily all, factors considered by the Board in support of its approvals.
Nature, extent and quality of services
The Board received and considered various information regarding the nature, extent and quality of services provided to the Fund by Funds Management and the Sub-Adviser under the Advisory Agreements. This information included, among other things, a summary of the background and experience of senior management of Funds Management, and the qualifications, background, tenure and responsibilities of each of the portfolio managers primarily responsible for the day-to-day portfolio management of the Fund. The Board noted that the services to be provided to the Fund pursuant to the Management Agreement combined the advisory services previously provided to the Fund pursuant to the Fund’s Advisory Agreement with the Fund-level administrative services previously provided to the Fund pursuant to the Fund’s Administration Agreement. The Board received a representation from Funds Management that combining these services would not result in any change to the nature or level of services provided by Funds Management to the Fund.
The Board evaluated the ability of Funds Management and the Sub-Adviser to attract and retain qualified investment professionals, including research, advisory and supervisory personnel. The Board further considered the compliance
Table of Contents
| 26 | Wells Fargo Advantage VT Small Cap Value Fund | Other information (unaudited) |
programs and compliance records of Funds Management and the Sub-Adviser. In addition, the Board took into account the full range of services provided to the Fund by Funds Management and its affiliates.
Fund performance and expenses
The Board considered the performance results for the Fund over various time periods ended March 31, 2015. The Board considered these results in comparison to the performance of funds in a universe that was determined by Lipper Inc. (“Lipper”) to be similar to the Fund (the “Universe”), and in comparison to the Fund’s benchmark index and to other comparative data. Lipper is an independent provider of investment company data. The Board received a description of the methodology used by Lipper to select the mutual funds in the performance Universe. The Board noted that the performance of the Fund (Classes 1 and 2) was lower than the average performance of the Universe for all periods under review. The Board also noted that the performance of the Fund was lower than its benchmark, the Russell 2000® Value Index, for all periods under review.
The Board received information concerning, and discussed factors contributing to, the underperformance of the Fund relative to the Universe and benchmark for all periods. The Board took note of the explanations for the relative underperformance, including with respect to overall investment approach, sector allocations and investment decisions that affected the Fund’s performance.
The Board also received and considered information regarding the Fund’s net operating expense ratios and their various components, including actual management fees (which reflect fee waivers, if any, and include advisory, administration and transfer agent fees), custodian and other non-management fees, and Rule 12b-1 and non-Rule 12b-1 service fees. The Board considered these ratios in comparison to the median ratios of funds in class-specific expense groups that were determined by Lipper to be similar to the Fund (the “Groups”). The Board received a description of the methodology used by Lipper to select the mutual funds in the expense Groups and an explanation of how funds comprising expense groups and their expense ratios may vary from year-to-year. Based on the Lipper reports, the Board noted that the net operating expense ratios of the Fund were lower than or equal to the median net operating expense ratios of the expense Groups.
The Board took into account the Fund performance and expense information provided to it among the factors considered in deciding to re-approve the Advisory Agreement and Sub-Advisory Agreement and approve the Management Agreement.
Investment advisory and sub-advisory fee rates
The Board reviewed and considered the contractual investment advisory fee rates that are payable by the Fund to Funds Management for investment advisory services (the “Advisory Agreement Rates”), both on a stand-alone basis and on a combined basis with the Fund’s fund-level and class-level contractual administration fee rates (the “Management Rates”). The Board noted that the Management Rates include transfer agency and sub-transfer agency costs. The Board also noted that the fee rate to be paid by the Fund under the Management Agreement will incorporate the advisory fee and Fund-level administration fee previously payable separately by the Fund under the Fund’s Advisory Agreement and Administration Agreement with Funds Management. The Board also reviewed and considered the contractual investment sub-advisory fee rates that are payable by Funds Management to the Sub-Adviser for investment sub-advisory services (the “Sub-Advisory Agreement Rates”).
Among other information reviewed by the Board was a comparison of the Management Rates of the Fund with those of other funds in the expense Groups at a common asset level. The Board noted that the Management Rate for Class 1 was higher than the average rate for its expense Group, while the Management Rate for Class 2 was in range of the average rate for its expense Group. The Board noted that the net operating expense ratios of the Fund were lower than or equal to the median net operating expense ratios of the expense Groups for all share classes.
The Board also received and considered information about the portion of the total advisory fee that was retained by Funds Management after payment of the fee to the Sub-Adviser for sub-advisory services. In assessing the reasonableness of this amount, the Board received and evaluated information about the nature and extent of responsibilities retained and risks assumed by Funds Management and not delegated to or assumed by the Sub-Adviser, and about Funds Management’s on-going oversight services. However, given the affiliation between Funds Management and the Sub-Adviser, the Board ascribed limited relevance to the allocation of the advisory fee between them.
The Board also received and considered information about the nature and extent of services offered and fee rates charged by Funds Management and the Sub-Adviser to other types of clients with investment strategies similar to those of the Fund. In this regard, the Board received information about the significantly greater scope of services, and compliance, reporting and other legal burdens and risks of managing mutual funds compared with those associated with managing assets of non-mutual fund clients such as collective funds or institutional separate accounts.
Table of Contents
| Other information (unaudited) | Wells Fargo Advantage VT Small Cap Value Fund | 27 |
Based on its consideration of the factors and information it deemed relevant, including those described here, the Board determined that the compensation payable to Funds Management under the Management Agreement and Advisory Agreement and to the Sub-Adviser under the Sub-Advisory Agreement was reasonable, in light of the services covered by the Advisory Agreements.
Profitability
The Board received and considered information concerning the profitability of Funds Management, as well as the profitability of Wells Fargo as a whole, from providing services to the Fund and the fund family as a whole. The Board also received and considered information concerning the profitability of the Sub-Adviser from providing services to the fund family as a whole, noting that the Sub-Adviser’s profitability information with respect to providing services to the Fund was subsumed in the Wells Fargo profitability analysis.
Funds Management reported on the methodologies and estimates used in calculating profitability. Among other things, the Board noted that the levels of profitability reported on a fund-by-fund basis varied widely, depending on factors such as the size and type of fund. Based on its review, the Board did not deem the profits reported by Funds Management or Wells Fargo from its services to the Fund to be at a level that would prevent it from approving the continuation of the Advisory Agreements.
Economies of scale
With respect to possible economies of scale, the Board noted the existence of breakpoints in the Fund’s advisory and management fee structures, and the Fund’s administration fee structure, which operate generally to reduce the Fund’s expense ratios as the Fund grows in size. It considered that, for a small fund or a fund that shrinks in size, breakpoints conversely can result in higher fee levels. The Board also considered that fee waiver and expense reimbursement arrangements and competitive fee rates at the outset are means of sharing potential economies of scale with shareholders of the Fund and the fund family as a whole. The Board considered Funds Management’s view that any analyses of potential economies of scale in managing a particular fund are inherently limited in light of the joint and common costs and investments that Funds Management incurs across the fund family as a whole.
The Board concluded that the Fund’s fee and expense arrangements, including contractual breakpoints, constituted a reasonable approach to sharing potential economies of scale with the Fund and its shareholders.
Other benefits to Funds Management and the Sub-Adviser
The Board received and considered information regarding potential “fall-out” or ancillary benefits received by Funds Management and its affiliates, including the Sub-Adviser, as a result of their relationships with the Fund. Ancillary benefits could include, among others, benefits directly attributable to other relationships with the Fund and benefits potentially derived from an increase in Funds Management’s and the Sub-Adviser’s business as a result of their relationships with the Fund. The Board noted that various affiliates of Funds Management may receive distribution-related fees, shareholder servicing payments and sub-transfer agency fees in respect of shares sold or held through them and services provided.
The Board also reviewed information about soft dollar credits earned and utilized by the Sub-Adviser, fees earned by Funds Management and the Sub-Adviser from managing a private investment vehicle for the fund family’s securities lending collateral and commissions earned by an affiliated broker from portfolio transactions.
Based on its consideration of the factors and information it deemed relevant, including those described here, the Board did not find that any ancillary benefits received by Funds Management and its affiliates, including the Sub-Adviser, were unreasonable.
Conclusion
At the Meeting, after considering the above-described factors and based on its deliberations and its evaluation of the information described above, the Board unanimously approved the continuation of the Advisory Agreement for the period from June 1, 2015 through June 30, 2015, approved the Management Agreement for the period from July 1, 2015 through May 31, 2016, and approved the continuation of the Sub-Advisory Agreement for a one-year term through May 31, 2016. The Board also determined that the compensation payable to Funds Management and the Sub-Adviser under each of the Advisory Agreements was reasonable.
Table of Contents
| 28 | Wells Fargo Advantage VT Small Cap Value Fund | List of abbreviations |
The following is a list of common abbreviations for terms and entities that may have appeared in this report.
| ACA | — ACA Financial Guaranty Corporation |
| ADR | — American depositary receipt |
| ADS | — American depositary shares |
| AGC | — Assured Guaranty Corporation |
| AGM | — Assured Guaranty Municipal |
| Ambac | — Ambac Financial Group Incorporated |
| AMT | — Alternative minimum tax |
| AUD | — Australian dollar |
| BAN | — Bond anticipation notes |
| BHAC | — Berkshire Hathaway Assurance Corporation |
| BRL | — Brazilian real |
| CAB | — Capital appreciation bond |
| CAD | — Canadian dollar |
| CCAB | — Convertible capital appreciation bond |
| CDA | — Community Development Authority |
| CDO | — Collateralized debt obligation |
| CHF | — Swiss franc |
| COP | — Columbian Peso |
| CLP | — Chilean peso |
| DKK | — Danish krone |
| DRIVER | — Derivative inverse tax-exempt receipts |
| DW&P | — Department of Water & Power |
| DWR | — Department of Water Resources |
| ECFA | — Educational & Cultural Facilities Authority |
| EDA | — Economic Development Authority |
| EDFA | — Economic Development Finance Authority |
| ETF | — Exchange-traded fund |
| EUR | — Euro |
| FDIC | — Federal Deposit Insurance Corporation |
| FFCB | — Federal Farm Credit Banks |
| FGIC | — Financial Guaranty Insurance Corporation |
| FHA | — Federal Housing Administration |
| FHLB | — Federal Home Loan Bank |
| FHLMC | — Federal Home Loan Mortgage Corporation |
| FICO | — The Financing Corporation |
| FNMA | — Federal National Mortgage Association |
| FSA | — Farm Service Agency |
| GBP | — Great British pound |
| GDR | — Global depositary receipt |
| GNMA | — Government National Mortgage Association |
| GO | — General obligation |
| HCFR | — Healthcare facilities revenue |
| HEFA | — Health & Educational Facilities Authority |
| HEFAR | — Higher education facilities authority revenue |
| HFA | — Housing Finance Authority |
| HFFA | — Health Facilities Financing Authority |
| HKD | — Hong Kong dollar |
| HUD | — Department of Housing and Urban Development |
| HUF | — Hungarian forint |
| IDA | — Industrial Development Authority |
| IDAG | — Industrial Development Agency |
| IDR | — Indonesian rupiah |
| IEP | — Irish pound |
| JPY | — Japanese yen |
| KRW | — Republic of Korea won |
| LIBOR | — London Interbank Offered Rate |
| LIFER | — Long Inverse Floating Exempt Receipts |
| LIQ | — Liquidity agreement |
| LLC | — Limited liability company |
| LLLP | — Limited liability limited partnership |
| LLP | — Limited liability partnership |
| LOC | — Letter of credit |
| LP | — Limited partnership |
| MBIA | — Municipal Bond Insurance Association |
| MFHR | — Multifamily housing revenue |
| MSTR | — Municipal securities trust receipts |
| MTN | — Medium-term note |
| MUD | — Municipal Utility District |
| MXN | — Mexican peso |
| MYR | — Malaysian ringgit |
| National | — National Public Finance Guarantee Corporation |
| NGN | — Nigerian naira |
| NOK | — Norwegian krone |
| NZD | — New Zealand dollar |
| PCFA | — Pollution Control Financing Authority |
| PCL | — Public Company Limited |
| PCR | — Pollution control revenue |
| PFA | — Public Finance Authority |
| PFFA | — Public Facilities Financing Authority |
| PFOTER | — Puttable floating option tax-exempt receipts |
| plc | — Public limited company |
| PLN | — Polish zloty |
| PUTTER | — Puttable tax-exempt receipts |
| R&D | — Research & development |
| Radian | — Radian Asset Assurance |
| RAN | — Revenue anticipation notes |
| RDA | — Redevelopment Authority |
| RDFA | — Redevelopment Finance Authority |
| REIT | — Real estate investment trust |
| ROC | — Reset option certificates |
| RON | — Romanian lei |
| RUB | — Russian ruble |
| SAVRS | — Select auction variable rate securities |
| SBA | — Small Business Authority |
| SDR | — Swedish depositary receipt |
| SEK | — Swedish krona |
| SFHR | — Single-family housing revenue |
| SFMR | — Single-family mortgage revenue |
| SGD | — Singapore dollar |
| SPA | — Standby purchase agreement |
| SPDR | — Standard & Poor’s Depositary Receipts |
| SPEAR | — Short Puttable Exempt Adjustable Receipts |
| STRIPS | — Separate trading of registered interest and |
| principal securities |
| TAN | — Tax anticipation notes |
| TBA | — To be announced |
| THB | — Thai baht |
| TIPS | — Treasury inflation-protected securities |
| TRAN | — Tax revenue anticipation notes |
| TRY | — Turkish lira |
| TTFA | — Transportation Trust Fund Authority |
| TVA | — Tennessee Valley Authority |
| ZAR | — South African rand |
Table of Contents


For more information
More information about Wells Fargo Advantage Funds is available free upon request. To obtain literature, please write, email, visit the Fund’s website, or call:
Wells Fargo Advantage Funds
P.O. Box 8266
Boston, MA 02266-8266
Email: wfaf@wellsfargo.com
Website: wellsfargoadvantagefunds.com
Individual investors: 1-800-222-8222
Retail investment professionals: 1-888-877-9275
Institutional investment professionals: 1-866-765-0778
This report and the financial statements contained herein are submitted for the general information of the shareholders of Wells Fargo Advantage Funds. If this report is used for promotional purposes, distribution of the report must be accompanied or preceded by a current prospectus. Before investing, please consider the investment objectives, risks, charges, and expenses of the investment. For a current prospectus and, if available, a summary prospectus, containing this information, call 1-800-222-8222 or visit the Fund’s website at wellsfargoadvantagefunds.com. Read the prospectus carefully before you invest or send money.
Wells Fargo Funds Management, LLC, a wholly owned subsidiary of Wells Fargo & Company, provides investment advisory and administrative services for Wells Fargo Advantage Funds. Other affiliates of Wells Fargo & Company provide subadvisory and other services for the Funds. The Funds are distributed by Wells Fargo Funds Distributor, LLC, Member FINRA/SIPC, an affiliate of Wells Fargo & Company.
NOT FDIC INSURED ¡ NO BANK GUARANTEE ¡ MAY LOSE VALUE
© 2015 Wells Fargo Funds Management, LLC. All rights reserved.
235292 08-15 SVT8/SAR145 06-15 |
Table of Contents

Wells Fargo Advantage
VT Total Return Bond Fund

Semi-Annual Report
June 30, 2015

Table of Contents
Reduce clutter. Save trees.
Sign up for electronic delivery of prospectuses and shareholder reports at wellsfargo.com/advantagedelivery
| 2 | ||||
| 4 | ||||
| 6 | ||||
| 7 | ||||
Financial statements | ||||
| 25 | ||||
| 26 | ||||
| 27 | ||||
| 28 | ||||
| 29 | ||||
| 33 | ||||
| 39 | ||||
The views expressed and any forward-looking statements are as of June 30, 2015, unless otherwise noted, and are those of the Fund managers and/or Wells Fargo Funds Management, LLC. Discussions of individual securities, or the markets generally, or any Wells Fargo Advantage Fund are not intended as individual recommendations. Future events or results may vary significantly from those expressed in any forward-looking statements; the views expressed are subject to change at any time in response to changing circumstances in the market. Wells Fargo Funds Management, LLC and the Fund disclaim any obligation to publicly update or revise any views expressed or forward-looking statements.
NOT FDIC INSURED ¡ NO BANK GUARANTEE ¡ MAY LOSE VALUE
Table of Contents
| 2 | Wells Fargo Advantage VT Total Return Bond Fund | Letter to shareholders (unaudited) |

Karla M. Rabusch
President
Wells Fargo Advantage Funds
Major central banks continued to inject liquidity into global banks and markets through various accommodative monetary policies, including quantitative easing.
Dear Valued Shareholder:
We are pleased to offer you this semi-annual report for the Wells Fargo Advantage VT Total Return Bond Fund for the six-month period that ended June 30, 2015. The period was marked by low interest rates, low oil prices, and moderate U.S. economic growth. Investment-grade bonds, as measured by the Barclays U.S. Aggregate Bond Index1, returned -0.10% during the period.
Major central banks continued to provide stimulus.
Major central banks continued to inject liquidity into global banks and markets through various accommodative monetary policies, including quantitative easing. In the U.S., the Federal Reserve (Fed) kept its key interest rate near zero in order to support the economy and the financial system. It set expectations for it to begin normalizing monetary policy with higher target ranges for the federal funds rate in 2015.
Meanwhile, European markets continued to benefit from the European Central Bank’s (ECB’s) willingness to maintain low interest rates. In addition to its targeted longer-term refinancing operations that are designed to increase bank lending, the ECB expanded its quantitative easing program to include the purchase of eurozone government bonds. In Japan, the Bank of Japan maintained an aggressive monetary program aimed at combating deflation.
U.S. economic growth advanced during the reporting period, the unemployment rate ticked lower to 5.3% as of June 2015, and inflation remained below the Fed’s longer-run objective of a 2% pace. The June Federal Open Market Committee minutes said “the Committee expects inflation to rise gradually toward 2% over the medium term as the labor market improves further and the transitory effects of earlier declines in energy and import prices dissipate.” The period was also marked by lower oil prices, which fell to below $50 per barrel in early 2015 before stabilizing near $60 per barrel at the end of June 2015. While lower oil prices benefited consumers of oil products, the lower prices pressured companies within the energy sector.
Longer-term yields rose ahead of expectations for the Fed to raise rates.
Ten-year U.S. Treasury yields were as low as 1.64% in January 2015, benefiting from safe-haven status as well as relative attractiveness to global investors. Ten-year U.S. Treasury yields then rose throughout the period, ending with a yield of 2.36%. As longer-term rates rose, longer-term bond returns were negative as investors unwound positions in which they had reached for yield via longer-term bonds. Treasury bonds with maturities greater than 10 years returned -4.41% during the six-month period that ended June 30, 2015, according to the Barclays U.S. Aggregate Bond Index. Investment-grade corporate bonds returned -0.92% during the period, hurt by a large amount of new issuance that was driven by a rush to lock in attractive funding levels before rates moved higher as well as by strong merger and acquisition activity. Securitized debt returned 0.35%, according to the Barclays U.S. Aggregate Bond Index. Meanwhile, AAA-rated bonds had higher returns than BBB-rated bonds.
While yields have been at historically low levels, there is a risk of rising rates and negative bond returns. However, fixed-income markets appear to have functioned well over the past year with sufficient liquidity and muted volatility.
| 1 | The Barclays U.S. Aggregate Bond Index is a broad-based benchmark that measures the investment-grade, U.S. dollar–denominated, fixed-rate taxable bond market, including Treasuries, government-related and corporate securities, MBS (agency fixed-rate and hybrid ARM pass-throughs), ABS, and CMBS. You cannot invest directly in an index. |
Table of Contents
| Letter to shareholders (unaudited) | Wells Fargo Advantage VT Total Return Bond Fund | 3 |
Don’t let short-term uncertainty derail long-term investment goals.
Periods of uncertainty can present challenges, but experience has taught us that maintaining long-term investment goals can be an effective way to plan for the future. To help you create a sound strategy based on your personal goals and risk tolerance, Wells Fargo Advantage Funds offers more than 100 mutual funds spanning a wide range of asset classes and investment styles. Although diversification cannot guarantee an investment profit or prevent losses, we believe it can be an effective way to manage investment risk and potentially smooth out overall portfolio performance. We encourage investors to know their investments and to understand that appropriate levels of risk-taking may unlock opportunities.
Thank you for choosing to invest in Wells Fargo Advantage Funds. We appreciate your confidence in us and remain committed to helping you meet your financial needs.
Sincerely,

Karla M. Rabusch
President
Wells Fargo Advantage Funds
Periods of uncertainty can present challenges, but experience has taught us that maintaining long-term investment goals can be an effective way to plan for the future.
Notice to shareholders
At a meeting held on August 11-12, 2015, the Board of Trustees of the Fund approved a change in the name of the Fund whereby the word “Advantage” will be removed from its name, effective December 15, 2015.
For current information about your fund investments, contact your investment professional, visit our website at wellsfargoadvantagefunds.com, or call us directly at 1-800-222-8222. We are available 24 hours a day, 7 days a week.
Table of Contents
| 4 | Wells Fargo Advantage VT Total Return Bond Fund | Performance highlights (unaudited) |
Investment objective
The Fund seeks total return, consisting of income and capital appreciation.
Adviser
Wells Fargo Funds Management, LLC
Subadviser
Wells Capital Management Incorporated
Portfolio managers
Troy Ludgood
Thomas O’Connor, CFA
Average annual total returns (%) as of June 30, 2015
| Expense ratios1 (%) | ||||||||||||||||||||||
| Inception date | 1 year | 5 year | 10 year | Gross | Net2 | |||||||||||||||||
| Class 2 | 9-20-1999 | 1.58 | 3.70 | 4.77 | 0.92 | 0.90 | ||||||||||||||||
| Barclays U.S. Aggregate Bond Index3 | – | 1.86 | 3.35 | 4.44 | – | – | ||||||||||||||||
Figures quoted represent past performance, which is no guarantee of future results and do not reflect the deduction of taxes that a shareholder may pay on fund distributions or the redemption of fund shares. Investment return and principal value of an investment will fluctuate so that an investor’s shares, when redeemed, may be worth more or less than their original cost. Current performance may be lower or higher than the performance data quoted, which assumes the reinvestment of dividends and capital gains. Current month-end performance is available by calling
1-800-222-8222. Performance figures of the Fund do not reflect fees charged pursuant to the terms of variable life insurance policies and variable annuity contracts. If fees had been reflected, performance would have been lower.
Index returns do not include transaction costs associated with buying and selling securities, any mutual fund fees or expenses, or any taxes. It is not possible to invest directly in an index.
Bond values fluctuate in response to the financial condition of individual issuers, general market and economic conditions, and changes in interest rates. Changes in market conditions and government policies may lead to periods of heightened volatility in the bond market and reduced liquidity for certain bonds held by the Fund. In general, when interest rates rise, bond values fall and investors may lose principal value. Interest-rate changes and their impact on the Fund and its share price can be sudden and unpredictable. The use of derivatives may reduce returns and/or increase volatility. Certain investment strategies tend to increase the total risk of an investment (relative to the broader market). The Fund is exposed to foreign investment risk and mortgage- and asset-backed securities risk. Consult the Fund’s prospectus for additional information on these and other risks.
Please refer to the prospectus provided by your participating insurance company for detailed information describing the separate accounts for information regarding surrender charges, mortality and expense risk fees, and other charges that may be assessed by the participating insurance companies.
Please see footnotes on page 5.
Table of Contents
| Performance highlights (unaudited) | Wells Fargo Advantage VT Total Return Bond Fund | 5 |
| Ten largest holdings4 (%) as of June 30, 2015 | ||||
U.S. Treasury Note, 1.75%, 9-30-2019 | 3.35 | |||
U.S. Treasury Note, 0.75%, 4-15-2018 | 3.04 | |||
U.S. Treasury Note, 0.88%, 8-15-2017 | 3.03 | |||
FNMA, 3.50%, 8-13-2045 | 2.82 | |||
GNMA, 3.50%, 8-20-2045 | 2.48 | |||
FNMA, 3.50%, 7-14-2045 | 2.00 | |||
U.S. Treasury Note, 1.38%, 4-30-2020 | 1.65 | |||
U.S. Treasury Note, 1.50%, 1-31-2019 | 1.48 | |||
U.S. Treasury Note, 0.63%, 9-30-2017 | 1.42 | |||
U.S. Treasury Note, 0.63%, 2-15-2017 | 1.32 | |||
| Portfolio allocation5 as of June 30, 2015 |
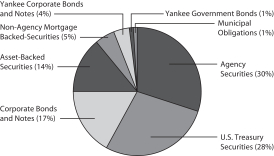 |
| 1 | Reflects the expense ratios as stated in the most recent prospectus. The expense ratios shown are subject to change and may differ from the annualized expense ratios shown in the financial highlights of this report. |
| 2 | The Adviser has contractually committed through April 30, 2016, to waive fees and/or reimburse expenses to the extent necessary to cap the Fund’s Total Annual Fund Operating Expenses After Fee Waiver at the amount shown. After this time, the cap may be increased or the commitment to maintain the cap may be terminated only with the approval of the Board of Trustees. Brokerage commissions, stamp duty fees, interest, taxes, acquired fund fees and expenses, and extraordinary expenses are excluded from the cap. Without this cap, the Fund’s returns would have been lower. |
| 3 | The Barclays U.S. Aggregate Bond Index is a broad-based benchmark that measures the investment grade, U.S. dollar-denominated, fixed-rate taxable bond market, including Treasuries, government-related and corporate securities, MBS (agency fixed-rate and hybrid ARM passthroughs), ABS, and CMBS. You cannot invest directly in an index. |
| 4 | The ten largest holdings, excluding cash and cash equivalents, are calculated based on the value of the investments divided by total net assets of the Fund. Holdings are subject to change and may have changed since the date specified. |
| 5 | Amounts are calculated based on the total long-term investments of the Fund. These amounts are subject to change and may have changed since the date specified. |
Table of Contents
| 6 | Wells Fargo Advantage VT Total Return Bond Fund | Fund expenses (unaudited) |
As a shareholder of the Fund, you incur ongoing costs, including management fees, distribution (12b-1) fees, and other Fund expenses. This example is intended to help you understand your ongoing costs (in dollars) of investing in the Fund and to compare these costs with the ongoing costs of investing in other mutual funds.
The example is based on an investment of $1,000 invested at the beginning of the six-month period and held for the entire period from January 1, 2015 to June 30, 2015.
Actual expenses
The “Actual” line of the table below provides information about actual account values and actual expenses. You may use the information in this line, together with the amount you invested, to estimate the expenses that you paid over the period. Simply divide your account value by $1,000 (for example, an $8,600 account value divided by $1,000 = 8.6), then multiply the result by the number in the “Actual” line under the heading entitled “Expenses Paid During Period” for your applicable class of shares to estimate the expenses you paid on your account during this period.
Hypothetical example for comparison purposes
The “Hypothetical” line of the table below provides information about hypothetical account values and hypothetical expenses based on the Fund’s actual expense ratio and an assumed rate of return of 5% per year before expenses, which is not the Fund’s actual return. The hypothetical account values and expenses may not be used to estimate the actual ending account balance or expenses you paid for the period. You may use this information to compare the ongoing costs of investing in the Fund and other funds. To do so, compare this 5% hypothetical example with the 5% hypothetical examples that appear in the shareholder reports of the other funds.
Please note that the expenses shown in the table are meant to highlight your ongoing costs only and do not reflect any separate account charges assessed by participating insurance companies. Therefore, the “Hypothetical” line of the table is useful in comparing ongoing costs only, and will not help you determine the relative total costs of owning different funds. In addition, if these separate account charges assessed by participating insurance companies were included, your costs would have been higher.
| Beginning account value 1-1-2015 | Ending account value 6-30-2015 | Expenses paid during the period1 | Net annualized expense ratio | |||||||||||||
Class 2 | ||||||||||||||||
Actual | $ | 1,000.00 | $ | 998.45 | $ | 4.46 | 0.90 | % | ||||||||
Hypothetical (5% return before expenses) | $ | 1,000.00 | $ | 1,020.33 | $ | 4.51 | 0.90 | % | ||||||||
| 1 | Expenses paid is equal to the annualized expense ratio multiplied by the average account value over the period, multiplied by the number of days in the most recent fiscal half-year divided by the number of days in the fiscal year (to reflect the one-half year period). |
Table of Contents
| Portfolio of investments—June 30, 2015 (unaudited) | Wells Fargo Advantage VT Total Return Bond Fund | 7 |
| Security name | Interest rate | Maturity date | Principal | Value | ||||||||||||
Agency Securities: 31.88% | ||||||||||||||||
FHLMC ± | 2.74 | % | 8-1-2044 | $ | 37,862 | $ | 38,853 | |||||||||
FHLMC ± | 2.75 | 5-1-2045 | 70,652 | 72,306 | ||||||||||||
FHLMC ± | 2.75 | 6-1-2045 | 71,000 | 72,549 | ||||||||||||
FHLMC ± | 2.83 | 7-1-2045 | 102,000 | 104,641 | ||||||||||||
FHLMC (a) | 2.85 | 7-1-2045 | 72,000 | 73,821 | ||||||||||||
FHLMC ± | 2.90 | 8-1-2044 | 62,435 | 64,394 | ||||||||||||
FHLMC | 3.00 | 2-15-2045 | 657,487 | 655,222 | ||||||||||||
FHLMC | 3.50 | 12-1-2028 | 21,060 | 22,314 | ||||||||||||
FHLMC | 3.50 | 11-1-2029 | 218,825 | 231,541 | ||||||||||||
FHLMC | 3.50 | 4-1-2030 | 251,752 | 267,008 | ||||||||||||
FHLMC | 3.50 | 8-1-2034 | 130,462 | 136,055 | ||||||||||||
FHLMC | 3.50 | 10-1-2034 | 23,720 | 24,743 | ||||||||||||
FHLMC | 3.50 | 11-1-2034 | 24,287 | 25,333 | ||||||||||||
FHLMC | 3.50 | 1-1-2035 | 24,562 | 25,591 | ||||||||||||
FHLMC %% | 3.50 | 7-14-2045 | 300,000 | 307,998 | ||||||||||||
FHLMC %% | 3.50 | 8-13-2045 | 700,000 | 716,802 | ||||||||||||
FHLMC | 4.00 | 10-1-2029 | 58,268 | 62,092 | ||||||||||||
FHLMC | 4.00 | 11-1-2032 | 68,537 | 73,338 | ||||||||||||
FHLMC | 4.00 | 6-1-2033 | 21,165 | 22,920 | ||||||||||||
FHLMC | 4.00 | 11-1-2033 | 26,552 | 28,527 | ||||||||||||
FHLMC | 4.00 | 4-15-2040 | 22,898 | 24,544 | ||||||||||||
FHLMC | 4.00 | 11-1-2043 | 22,856 | 24,365 | ||||||||||||
FHLMC | 4.50 | 8-1-2020 | 439,490 | 457,597 | ||||||||||||
FHLMC | 4.50 | 8-1-2026 | 50,637 | 54,327 | ||||||||||||
FHLMC | 4.50 | 6-1-2042 | 203,676 | 223,821 | ||||||||||||
FHLMC | 4.50 | 6-1-2045 | 24,972 | 27,503 | ||||||||||||
FHLMC | 5.00 | 8-1-2039 | 334,266 | 376,558 | ||||||||||||
FHLMC | 5.00 | 7-1-2044 | 90,044 | 101,858 | ||||||||||||
FHLMC | 5.50 | 7-1-2038 | 140,987 | 161,012 | ||||||||||||
FHLMC Series 271 Class 30 | 3.00 | 8-15-2042 | 303,794 | 300,938 | ||||||||||||
FHLMC Series 2980 Class QA | 6.00 | 5-15-2035 | 309,608 | 340,442 | ||||||||||||
FHLMC Series 300 Class 300 | 3.00 | 1-15-2043 | 343,017 | 342,194 | ||||||||||||
FHLMC Series 3664 Class DA | 4.00 | 11-15-2037 | 56,208 | 59,370 | ||||||||||||
FHLMC Series 3876 Class NB | 5.00 | 8-15-2038 | 81,642 | 88,085 | ||||||||||||
FHLMC Series 4227 Class AB | 3.50 | 10-15-2037 | 181,017 | 190,786 | ||||||||||||
FHLMC Series 4425 Class A | 4.00 | 9-15-2040 | 181,216 | 194,020 | ||||||||||||
FHLMC Series 4430 Class A | 4.00 | 4-15-2041 | 270,106 | 292,386 | ||||||||||||
FHLMC Series 4483 Class PA (a) | 2.50 | 6-15-2045 | 389,000 | 395,576 | ||||||||||||
FHLMC Series T-48 Class 1A3 ± | 5.58 | 7-25-2033 | 2,133 | 2,433 | ||||||||||||
FHLMC Series T-57 Class 1A2 | 7.00 | 7-25-2043 | 356 | 411 | ||||||||||||
FHLMC Series T-57 Class 1A3 | 7.50 | 7-25-2043 | 22,572 | 26,923 | ||||||||||||
FHLMC Series T-59 Class 1A3 | 7.50 | 10-25-2043 | 31,925 | 38,144 | ||||||||||||
FHLMC Series T-60 Class 1A3 | 7.50 | 3-25-2044 | 32,371 | 39,374 | ||||||||||||
FNMA ¤ | 0.00 | �� | 10-9-2019 | 260,000 | 237,268 | |||||||||||
FNMA (a) | 2.60 | 7-1-2045 | 106,000 | 108,091 | ||||||||||||
FNMA (a) | 2.51 | 8-1-2045 | 36,000 | 36,526 | ||||||||||||
FNMA ± | 2.39 | 1-1-2036 | 43,075 | 46,064 | ||||||||||||
FNMA ± | 2.56 | 3-1-2045 | 32,323 | 32,960 | ||||||||||||
FNMA | 2.63 | 9-6-2024 | 102,000 | 101,883 | ||||||||||||
FNMA ± | 2.72 | 1-1-2045 | 90,292 | 92,640 | ||||||||||||
The accompanying notes are an integral part of these financial statements.
Table of Contents
| 8 | Wells Fargo Advantage VT Total Return Bond Fund | Portfolio of investments—June 30, 2015 (unaudited) |
| Security name | Interest rate | Maturity date | Principal | Value | ||||||||||||
Agency Securities (continued) | ||||||||||||||||
FNMA ± | 2.74 | % | 1-1-2045 | $ | 125,853 | $ | 129,125 | |||||||||
FNMA ± | 2.76 | 2-1-2045 | 105,315 | 108,130 | ||||||||||||
FNMA ± | 2.83 | 5-1-2043 | 41,507 | 42,817 | ||||||||||||
FNMA | 3.00 | 3-1-2033 | 145,467 | 147,347 | ||||||||||||
FNMA | 3.00 | 10-25-2042 | 456,646 | 456,056 | ||||||||||||
FNMA %% | 3.00 | 7-14-2045 | 300,000 | 298,172 | ||||||||||||
FNMA | 3.50 | 12-1-2029 | 93,122 | 98,638 | ||||||||||||
FNMA | 3.50 | 1-1-2030 | 190,088 | 201,646 | ||||||||||||
FNMA | 3.50 | 2-1-2030 | 136,940 | 145,451 | ||||||||||||
FNMA | 3.50 | 4-1-2030 | 127,132 | 135,271 | ||||||||||||
FNMA | 3.50 | 6-1-2042 | 35,648 | 36,722 | ||||||||||||
FNMA | 3.50 | 6-1-2042 | 61,770 | 63,635 | ||||||||||||
FNMA | 3.50 | 7-1-2042 | 58,119 | 59,869 | ||||||||||||
FNMA | 3.50 | 7-1-2042 | 111,159 | 114,499 | ||||||||||||
FNMA | 3.50 | 7-1-2042 | 156,656 | 161,385 | ||||||||||||
FNMA | 3.50 | 8-1-2042 | 117,531 | 121,071 | ||||||||||||
FNMA | 3.50 | 10-1-2042 | 54,182 | 55,819 | ||||||||||||
FNMA | 3.50 | 11-1-2043 | 127,664 | 131,516 | ||||||||||||
FNMA | 3.50 | 3-1-2044 | 310,122 | 319,481 | ||||||||||||
FNMA | 3.50 | 6-1-2045 | 464,394 | 478,992 | ||||||||||||
FNMA %% | 3.50 | 7-14-2045 | 1,700,000 | 1,748,576 | ||||||||||||
FNMA %% | 3.50 | 8-13-2045 | 2,400,000 | 2,462,203 | ||||||||||||
FNMA %% | 3.50 | 9-14-2045 | 300,000 | 306,914 | ||||||||||||
FNMA | 4.00 | 3-1-2025 | 8,180 | 8,722 | ||||||||||||
FNMA | 4.00 | 5-1-2025 | 16,320 | 17,446 | ||||||||||||
FNMA | 4.00 | 6-1-2025 | 104,530 | 111,748 | ||||||||||||
FNMA | 4.00 | 6-1-2026 | 21,980 | 23,492 | ||||||||||||
FNMA | 4.00 | 12-1-2028 | 52,321 | 55,804 | ||||||||||||
FNMA | 4.00 | 1-1-2029 | 212,331 | 226,472 | ||||||||||||
FNMA | 4.00 | 1-1-2029 | 35,314 | 37,667 | ||||||||||||
FNMA | 4.00 | 2-1-2029 | 84,870 | 90,520 | ||||||||||||
FNMA | 4.00 | 2-1-2029 | 81,468 | 86,901 | ||||||||||||
FNMA | 4.00 | 2-1-2029 | 58,036 | 61,897 | ||||||||||||
FNMA | 4.00 | 3-1-2029 | 82,656 | 88,150 | ||||||||||||
FNMA | 4.00 | 3-1-2029 | 56,801 | 60,585 | ||||||||||||
FNMA | 4.00 | 3-1-2029 | 75,760 | 80,615 | ||||||||||||
FNMA | 4.00 | 4-1-2029 | 90,699 | 96,736 | ||||||||||||
FNMA | 4.00 | 7-1-2029 | 58,373 | 62,256 | ||||||||||||
FNMA | 4.00 | 11-1-2029 | 121,403 | 129,467 | ||||||||||||
FNMA | 4.00 | 8-1-2033 | 194,972 | 208,728 | ||||||||||||
FNMA | 4.00 | 9-1-2033 | 43,823 | 47,630 | ||||||||||||
FNMA | 4.00 | 9-1-2033 | 36,856 | 39,514 | ||||||||||||
FNMA | 4.00 | 9-1-2033 | 37,314 | 39,903 | ||||||||||||
FNMA | 4.00 | 11-1-2033 | 24,743 | 26,893 | ||||||||||||
FNMA | 4.00 | 2-1-2034 | 47,047 | 50,458 | ||||||||||||
FNMA | 4.00 | 2-1-2034 | 80,556 | 86,400 | ||||||||||||
FNMA | 4.00 | 3-1-2034 | 239,441 | 257,843 | ||||||||||||
FNMA | 4.00 | 4-1-2034 | 158,337 | 169,808 | ||||||||||||
FNMA | 4.00 | 5-1-2034 | 32,944 | 35,331 | ||||||||||||
FNMA | 4.00 | 6-1-2034 | 31,294 | 33,564 | ||||||||||||
The accompanying notes are an integral part of these financial statements.
Table of Contents
| Portfolio of investments—June 30, 2015 (unaudited) | Wells Fargo Advantage VT Total Return Bond Fund | 9 |
| Security name | Interest rate | Maturity date | Principal | Value | ||||||||||||
Agency Securities (continued) | ||||||||||||||||
FNMA | 4.00 | % | 6-1-2034 | $ | 24,422 | $ | 26,299 | |||||||||
FNMA | 4.00 | 6-1-2034 | 53,543 | 57,658 | ||||||||||||
FNMA | 4.00 | 6-1-2034 | 50,325 | 53,976 | ||||||||||||
FNMA | 4.00 | 7-1-2034 | 56,838 | 60,962 | ||||||||||||
FNMA | 4.00 | 7-1-2034 | 43,110 | 46,238 | ||||||||||||
FNMA | 4.00 | 7-1-2034 | 38,726 | 41,702 | ||||||||||||
FNMA | 4.00 | 8-1-2034 | 87,439 | 93,782 | ||||||||||||
FNMA | 4.00 | 8-1-2034 | 53,892 | 57,802 | ||||||||||||
FNMA | 4.00 | 9-1-2034 | 57,917 | 62,118 | ||||||||||||
FNMA | 4.00 | 6-1-2035 | 25,916 | 27,909 | ||||||||||||
FNMA | 4.00 | 6-1-2035 | 133,000 | 142,282 | ||||||||||||
FNMA | 4.00 | 6-25-2039 | 108,679 | 116,257 | ||||||||||||
FNMA | 4.00 | 7-1-2042 | 490,772 | 522,972 | ||||||||||||
FNMA | 4.00 | 3-1-2044 | 36,407 | 38,861 | ||||||||||||
FNMA | 4.00 | 4-1-2044 | 56,167 | 59,953 | ||||||||||||
FNMA | 4.00 | 11-1-2044 | 145,732 | 155,588 | ||||||||||||
FNMA | 4.00 | 11-1-2044 | 92,287 | 98,527 | ||||||||||||
FNMA | 4.00 | 1-1-2045 | 25,814 | 27,560 | ||||||||||||
FNMA | 4.00 | 2-1-2045 | 51,692 | 55,190 | ||||||||||||
FNMA | 4.00 | 3-1-2045 | 28,820 | 30,770 | ||||||||||||
FNMA | 4.00 | 3-1-2045 | 100,322 | 107,113 | ||||||||||||
FNMA | 4.00 | 4-1-2045 | 24,904 | 26,590 | ||||||||||||
FNMA | 4.00 | 4-1-2045 | 121,176 | 129,382 | ||||||||||||
FNMA | 4.00 | 5-1-2045 | 24,962 | 26,654 | ||||||||||||
FNMA | 4.00 | 5-1-2045 | 60,916 | 65,046 | ||||||||||||
FNMA ± | 4.37 | 4-1-2040 | 72,430 | 76,774 | ||||||||||||
FNMA | 4.50 | 10-1-2033 | 62,366 | 67,856 | ||||||||||||
FNMA | 4.50 | 5-1-2034 | 93,691 | 103,503 | ||||||||||||
FNMA | 4.50 | 5-1-2034 | 35,194 | 38,792 | ||||||||||||
FNMA | 4.50 | 2-1-2044 | 370,031 | 407,305 | ||||||||||||
FNMA | 4.50 | 3-1-2044 | 114,746 | 126,079 | ||||||||||||
FNMA | 4.50 | 4-1-2044 | 265,087 | 291,918 | ||||||||||||
FNMA | 4.50 | 6-1-2044 | 50,193 | 55,273 | ||||||||||||
FNMA | 4.50 | 2-1-2045 | 67,607 | 74,466 | ||||||||||||
FNMA | 5.00 | 7-1-2041 | 648,045 | 732,737 | ||||||||||||
FNMA | 5.00 | 8-1-2041 | 42,646 | 48,220 | ||||||||||||
FNMA | 5.00 | 7-1-2044 | 35,707 | 40,428 | ||||||||||||
FNMA | 5.50 | 9-1-2034 | 23,215 | 25,701 | ||||||||||||
FNMA | 5.50 | 4-1-2036 | 13,969 | 15,659 | ||||||||||||
FNMA | 5.50 | 7-1-2039 | 32,485 | 37,182 | ||||||||||||
FNMA | 5.50 | 4-25-2042 | 7,337 | 8,250 | ||||||||||||
FNMA Series 2002-33 Class A2 | 7.50 | 6-25-2032 | 23,217 | 27,817 | ||||||||||||
FNMA Series 2002-95 Class DB | 6.00 | 1-25-2033 | 82,466 | 95,141 | ||||||||||||
FNMA Series 2003-W17 Class 1A7 | 5.75 | 8-25-2033 | 84,750 | 91,971 | ||||||||||||
FNMA Series 2005-5 Class PA | 5.00 | 1-25-2035 | 23,670 | 25,944 | ||||||||||||
FNMA Series 2006-56 Class CA | 6.00 | 7-25-2036 | 17,721 | 20,286 | ||||||||||||
FNMA Series 2012-134 Class LC | 3.00 | 12-25-2042 | 75,757 | 76,202 | ||||||||||||
FNMA Series 2012-411 Class A3 | 3.00 | 8-25-2042 | 81,880 | 81,832 | ||||||||||||
FNMA Series 2013-94 Class HA | 4.00 | 1-25-2040 | 48,241 | 51,959 | ||||||||||||
FNMA Series 2014-49 Class LC | 3.00 | 7-25-2054 | 242,692 | 249,764 | ||||||||||||
The accompanying notes are an integral part of these financial statements.
Table of Contents
| 10 | Wells Fargo Advantage VT Total Return Bond Fund | Portfolio of investments—June 30, 2015 (unaudited) |
| Security name | Interest rate | Maturity date | Principal | Value | ||||||||||||
Agency Securities (continued) | ||||||||||||||||
FNMA Series 2014-9 Class A | 4.00 | % | 5-25-2037 | $ | 91,855 | $ | 98,561 | |||||||||
GNMA %% | 3.00 | 7-20-2045 | 400,000 | 403,039 | ||||||||||||
GNMA %% | 3.00 | 8-20-2045 | 100,000 | 100,506 | ||||||||||||
GNMA %% | 3.50 | 7-20-2045 | 500,000 | 517,949 | ||||||||||||
GNMA %% | 3.50 | 8-20-2045 | 2,100,000 | 2,169,726 | ||||||||||||
GNMA %% | 4.00 | 7-20-2045 | 700,000 | 740,961 | ||||||||||||
GNMA %% | 4.00 | 8-20-2045 | 600,000 | 634,219 | ||||||||||||
GNMA | 4.50 | 4-20-2045 | 24,853 | 27,495 | ||||||||||||
GNMA | 4.50 | 4-20-2045 | 24,917 | 27,566 | ||||||||||||
GNMA | 4.50 | 4-20-2045 | 24,936 | 27,527 | ||||||||||||
GNMA | 4.50 | 5-15-2045 | 79,871 | 88,395 | ||||||||||||
GNMA | 4.50 | 5-20-2045 | 79,865 | 87,866 | ||||||||||||
GNMA | 4.50 | 5-20-2045 | 25,967 | 28,496 | ||||||||||||
GNMA | 5.00 | 12-20-2044 | 119,606 | 133,929 | ||||||||||||
Tennessee Valley Authority | 2.88 | 9-15-2024 | 280,000 | 280,886 | ||||||||||||
Total Agency Securities (Cost $27,784,804) | 27,871,403 | |||||||||||||||
|
| |||||||||||||||
Asset-Backed Securities: 14.73% | ||||||||||||||||
Ally Auto Receivables Trust Series 2013-1 Class A3 | 0.63 | 5-15-2017 | 13,736 | 13,737 | ||||||||||||
Ally Auto Receivables Trust Series 2014-1 Class A4 | 1.53 | 4-15-2019 | 355,000 | 355,678 | ||||||||||||
Ally Auto Receivables Trust Series 2014-2 Class A4 | 1.84 | 1-15-2020 | 42,000 | 42,283 | ||||||||||||
Ally Auto Receivables Trust Series 2014-4 Class A2 | 1.43 | 6-17-2019 | 186,000 | 186,437 | ||||||||||||
Ally Master Owner Trust Series 2012-5 Class A | 1.54 | 9-15-2019 | 130,000 | 130,330 | ||||||||||||
Ally Master Owner Trust Series 2014-5 Class A1 ± | 0.68 | 10-15-2019 | 273,000 | 273,569 | ||||||||||||
Ally Master Owner Trust Series 2015-2 Class A1 ± | 0.75 | 1-15-2021 | 161,000 | 161,185 | ||||||||||||
American Express Credit Accounts Series 2014-1 Class A ± | 0.56 | 12-15-2021 | 100,000 | 99,889 | ||||||||||||
Avis Budget Rental Car Aesop Series 2013-1A Class A 144A | 1.92 | 9-20-2019 | 152,000 | 151,439 | ||||||||||||
Avis Budget Rental Car Funding LLC Series 2012-3A Class A 144A | 2.10 | 3-20-2019 | 100,000 | 100,661 | ||||||||||||
Bank of the West Auto Trust Series 2014-1 Class A3 144A | 1.09 | 3-15-2019 | 100,000 | 100,063 | ||||||||||||
California Republic Auto Receivables Trust Series 2014-2 Class A4 | 1.57 | 12-16-2019 | 52,000 | 52,155 | ||||||||||||
California Republic Auto Receivables Trust Series 2014-3 Class A4 | 1.79 | 3-16-2020 | 50,000 | 50,333 | ||||||||||||
California Republic Auto Receivables Trust Series 2015-1 Class A3 | 1.33 | 4-15-2019 | 79,000 | 79,199 | ||||||||||||
California Republic Auto Receivables Trust Series 2015-1 Class A4 | 1.82 | 9-15-2020 | 91,000 | 91,327 | ||||||||||||
California Republic Auto Receivables Trust Series 2015-2 Class A3 | 1.31 | 8-15-2019 | 100,000 | 99,958 | ||||||||||||
Capital Auto Receivables Asset Trust Series 2013-2 Class A4 | 1.56 | 7-20-2018 | 79,000 | 79,534 | ||||||||||||
Capital Auto Receivables Asset Trust Series 2013-3 Class A4 | 1.68 | 4-20-2018 | 50,000 | 50,423 | ||||||||||||
Capital Auto Receivables Asset Trust Series 2013-4 Class A3 | 1.09 | 3-20-2018 | 136,000 | 136,149 | ||||||||||||
Capital Auto Receivables Asset Trust Series 2013-4 Class A4 | 1.47 | 7-20-2018 | 172,000 | 173,016 | ||||||||||||
Capital Auto Receivables Asset Trust Series 2014-1 Class A3 | 1.32 | 6-20-2018 | 118,000 | 118,325 | ||||||||||||
Capital Auto Receivables Asset Trust Series 2014-1 Class A4 | 1.69 | 10-22-2018 | 107,000 | 107,170 | ||||||||||||
Capital Auto Receivables Asset Trust Series 2014-2 Class A1 ± | 0.49 | 6-20-2016 | 116,295 | 116,285 | ||||||||||||
Capital Auto Receivables Asset Trust Series 2014-2 Class A3 | 1.26 | 5-21-2018 | 177,000 | 177,558 | ||||||||||||
Capital Auto Receivables Asset Trust Series 2014-2 Class A4 | 1.62 | 10-22-2018 | 51,000 | 51,387 | ||||||||||||
Capital Auto Receivables Asset Trust Series 2014-3 Class A3 | 1.48 | 11-20-2018 | 196,000 | 196,808 | ||||||||||||
Capital Auto Receivables Asset Trust Series 2014-3 Class A4 | 1.83 | 4-22-2019 | 29,000 | 29,245 | ||||||||||||
Capital Auto Receivables Asset Trust Series 2015-1 Class A2 | 1.42 | 6-20-2018 | 267,000 | 267,672 | ||||||||||||
Capital Auto Receivables Asset Trust Series 2015-1 Class A3 | 1.61 | 6-20-2019 | 113,000 | 113,032 | ||||||||||||
Capital Auto Receivables Asset Trust Series 2015-1 Class A4 | 1.86 | 10-21-2019 | 62,000 | 61,993 | ||||||||||||
Capital Auto Receivables Asset Trust Series 2015-2 Class A2 | 1.39 | 9-20-2018 | 73,000 | 72,990 | ||||||||||||
Capital Auto Receivables Asset Trust Series 2015-2 Class A3 | 1.73 | 9-20-2019 | 105,000 | 105,056 | ||||||||||||
The accompanying notes are an integral part of these financial statements.
Table of Contents
| Portfolio of investments—June 30, 2015 (unaudited) | Wells Fargo Advantage VT Total Return Bond Fund | 11 |
| Security name | Interest rate | Maturity date | Principal | Value | ||||||||||||
Asset-Backed Securities (continued) | ||||||||||||||||
Capital Auto Receivables Asset Trust Series 2015-2 Class A4 | 1.97 | % | 1-21-2020 | $ | 156,000 | $ | 155,869 | |||||||||
Capital One Multi-Asset Execution Trust Series 2007-A1 Class A1 ± | 0.24 | 11-15-2019 | 100,000 | 99,656 | ||||||||||||
Citibank Credit Card Issuance Trust Series 2013-A6 Class A6 | 1.32 | 9-7-2018 | 157,000 | 157,782 | ||||||||||||
Citibank Credit Card Issuance Trust Series 2014-A6 Class A6 | 2.15 | 7-15-2021 | 608,000 | 614,116 | ||||||||||||
Discover Card Execution Note Trust Series 2015-A2 Class A | 1.90 | 10-17-2022 | 135,000 | 133,909 | ||||||||||||
Ford Credit Auto Owner Trust Series 2013-B Class A3 | 0.57 | 10-15-2017 | 75,758 | 75,735 | ||||||||||||
Ford Credit Auto Owner Trust Series 2013-D Class A3 | 0.67 | 4-15-2018 | 59,654 | 59,601 | ||||||||||||
Ford Credit Auto Owner Trust Series 2014-1 Class A 144A | 2.26 | 11-15-2025 | 273,000 | 276,185 | ||||||||||||
Ford Credit Auto Owner Trust Series 2014-1 Class A2 ± | 0.59 | 2-15-2019 | 46,000 | 46,002 | ||||||||||||
Ford Credit Auto Owner Trust Series 2014-B Class A3 | 0.90 | 10-15-2018 | 104,000 | 103,978 | ||||||||||||
Ford Credit Auto Owner Trust Series 2015-A Class A4 | 1.64 | 6-15-2020 | 47,000 | 47,118 | ||||||||||||
Ford Credit Floorplan Master Owner Trust Series 2012-2 Class A | 1.92 | 1-15-2019 | 140,000 | 141,768 | ||||||||||||
Ford Credit Floorplan Master Owner Trust Series 2013-5 Class A2 ± | 0.66 | 9-15-2018 | 105,000 | 105,167 | ||||||||||||
Ford Credit Floorplan Master Owner Trust Series 2014-1 Class A1 | 1.20 | 2-15-2019 | 141,000 | 140,997 | ||||||||||||
Ford Credit Floorplan Master Owner Trust Series 2014-2 Class A ± | 0.67 | 2-15-2021 | 150,000 | 149,921 | ||||||||||||
Ford Credit Floorplan Master Owner Trust Series 2015-1 Class A2 ± | 0.59 | 1-15-2020 | 58,000 | 57,945 | ||||||||||||
Ford Credit Floorplan Master Owner Trust Series 2015-2 Class A2 ± | 0.76 | 1-15-2022 | 279,000 | 278,631 | ||||||||||||
Honda Auto Receivables Owner Trust Series 2013-3 Class A3 | 0.77 | 5-15-2017 | 90,520 | 90,542 | ||||||||||||
Honda Auto Receivables Owner Trust Series 2013-4 Class A3 | 0.69 | 9-18-2017 | 94,196 | 94,127 | ||||||||||||
Honda Auto Receivables Owner Trust Series 2014-1 Class A3 | 0.67 | 11-21-2017 | 189,000 | 188,694 | ||||||||||||
Honda Auto Receivables Owner Trust Series 2014-4 Class A4 | 1.46 | 10-15-2020 | 42,000 | 42,025 | ||||||||||||
Honda Auto Receivables Owner Trust Series 2014-B Class A3 | 0.90 | 12-17-2018 | 83,000 | 82,938 | ||||||||||||
Hyundai Auto Receivables Trust Series 2011-C Class A4 | 1.30 | 2-15-2018 | 34,819 | 34,912 | ||||||||||||
Hyundai Auto Receivables Trust Series 2013-A Class A4 | 0.75 | 9-17-2018 | 42,000 | 41,953 | ||||||||||||
Hyundai Auto Receivables Trust Series 2013-B Class A4 | 1.01 | 2-15-2019 | 37,000 | 37,020 | ||||||||||||
MBNA Credit Card Master Note Trust Series 2004-A3 Class A3 ± | 0.45 | 8-16-2021 | 231,000 | 230,243 | ||||||||||||
Navient Student Loan Trust Series 2014-1 Class A2 ± | 0.50 | 3-27-2023 | 100,000 | 99,828 | ||||||||||||
Navient Student Loan Trust Series 2014-8 Class A2 ± | 0.63 | 4-25-2023 | 96,000 | 96,156 | ||||||||||||
Nelnet Student Loan Trust Series 2004-4 Class A5 ± | 0.44 | 1-25-2037 | 131,043 | 129,736 | ||||||||||||
Nelnet Student Loan Trust Series 2004-5 Class A5 ± | 0.46 | 10-27-2036 | 137,216 | 135,730 | ||||||||||||
Nelnet Student Loan Trust Series 2005-1 Class A5 ± | 0.39 | 10-25-2033 | 124,000 | 120,160 | ||||||||||||
Nelnet Student Loan Trust Series 2005-2 Class A5 ± | 0.38 | 3-23-2037 | 125,000 | 122,124 | ||||||||||||
Nelnet Student Loan Trust Series 2005-3 Class A5 ± | 0.40 | 12-24-2035 | 136,000 | 133,625 | ||||||||||||
Nelnet Student Loan Trust Series 2005-4 Class A4 ± | 0.46 | 3-22-2032 | 100,000 | 96,453 | ||||||||||||
Nelnet Student Loan Trust Series 2006-1 Class A4 ± | 0.37 | 11-23-2022 | 24,993 | 24,992 | ||||||||||||
Nelnet Student Loan Trust Series 2006-2 Class A4 ± | 0.36 | 10-26-2026 | 85,408 | 85,344 | ||||||||||||
Nelnet Student Loan Trust Series 2010-4A Class A 144A± | 0.99 | 4-25-2046 | 55,866 | 56,563 | ||||||||||||
SLC Student Loan Trust Series 2007-2 Class A2 ± | 0.67 | 5-15-2028 | 67,020 | 67,038 | ||||||||||||
SLM Student Loan Trust Series 2004-10 Class A6A 144A± | 0.83 | 4-27-2026 | 209,000 | 209,006 | ||||||||||||
SLM Student Loan Trust Series 2004-3 Class A5 ± | 0.45 | 7-25-2023 | 189,781 | 188,872 | ||||||||||||
SLM Student Loan Trust Series 2004-9 Class A5 ± | 0.43 | 1-27-2020 | 212,074 | 211,418 | ||||||||||||
SLM Student Loan Trust Series 2005-2 Class A5 ± | 0.37 | 4-27-2020 | 239,155 | 238,271 | ||||||||||||
SLM Student Loan Trust Series 2005-5 Class A4 ± | 0.42 | 10-25-2028 | 180,000 | 175,512 | ||||||||||||
SLM Student Loan Trust Series 2005-6 Class A5 ± | 1.48 | 7-27-2026 | 59,063 | 59,635 | ||||||||||||
SLM Student Loan Trust Series 2005-6 Class A6 ± | 0.42 | 10-27-2031 | 120,000 | 115,676 | ||||||||||||
SLM Student Loan Trust Series 2005-7 Class A4 ± | 0.43 | 10-25-2029 | 108,000 | 105,497 | ||||||||||||
SLM Student Loan Trust Series 2005-9 Class A ± | 0.40 | 1-27-2025 | 132,393 | 132,094 | ||||||||||||
SLM Student Loan Trust Series 2006-3 Class A5 ± | 0.38 | 1-25-2021 | 181,000 | 178,692 | ||||||||||||
SLM Student Loan Trust Series 2007-2 Class A4 ± | 0.34 | 7-25-2022 | 187,000 | 180,680 | ||||||||||||
SLM Student Loan Trust Series 2007-2 Class B ± | 0.45 | 7-25-2025 | 100,000 | 89,393 | ||||||||||||
The accompanying notes are an integral part of these financial statements.
Table of Contents
| 12 | Wells Fargo Advantage VT Total Return Bond Fund | Portfolio of investments—June 30, 2015 (unaudited) |
| Security name | Interest rate | Maturity date | Principal | Value | ||||||||||||
Asset-Backed Securities (continued) | ||||||||||||||||
SLM Student Loan Trust Series 2007-3 Class A3 ± | 0.32 | % | 4-25-2019 | $ | 281,000 | $ | 278,192 | |||||||||
SLM Student Loan Trust Series 2007-3 Class A4 ± | 0.34 | 1-25-2022 | 184,000 | 177,498 | ||||||||||||
SLM Student Loan Trust Series 2010-1 Class A ± | 0.59 | 3-25-2025 | 111,965 | 111,827 | ||||||||||||
SLM Student Loan Trust Series 2012-6 Class A3 ± | 0.94 | 5-26-2026 | 100,000 | 101,252 | ||||||||||||
SLM Student Loan Trust Series 2012-6 Class B ± | 1.19 | 4-27-2043 | 100,000 | 94,512 | ||||||||||||
SLM Student Loan Trust Series 2012-C Class A1 144A± | 1.29 | 8-15-2023 | 25,630 | 25,709 | ||||||||||||
SLM Student Loan Trust Series 2012-D Class A2 144A | 2.95 | 2-15-2046 | 155,000 | 159,184 | ||||||||||||
SLM Student Loan Trust Series 2012-E Class A1 144A± | 0.94 | 10-16-2023 | 53,340 | 53,458 | ||||||||||||
SLM Student Loan Trust Series 2013-1 Class B ± | 1.99 | 11-25-2043 | 100,000 | 100,434 | ||||||||||||
SLM Student Loan Trust Series 2013-5 Class A2 ± | 0.59 | 10-26-2020 | 100,000 | 100,131 | ||||||||||||
SLM Student Loan Trust Series 2013-B Class A1 144A± | 0.84 | 7-15-2022 | 81,197 | 81,317 | ||||||||||||
SLM Student Loan Trust Series 2014-1 Class A2 ± | 0.57 | 7-26-2021 | 100,000 | 99,760 | ||||||||||||
SLM Student Loan Trust Series 2014-2 Class A3 ± | 0.78 | 3-26-2029 | 119,000 | 119,574 | ||||||||||||
SLM Student Loan Trust Series 2014-A Class A1 144A± | 0.79 | 7-15-2022 | 63,298 | 63,387 | ||||||||||||
SLM Student Loan Trust Series 2014-A Class A2A 144A | 2.59 | 1-15-2026 | 101,000 | 102,551 | ||||||||||||
SMB Private Education Loan Trust Series 2015-A Class A1 144A± | 0.79 | 7-17-2023 | 156,791 | 156,945 | ||||||||||||
SMB Private Education Loan Trust Series 2015-A Class A2A 144A | 2.49 | 6-15-2027 | 205,000 | 201,940 | ||||||||||||
SMB Private Education Loan Trust Series 2015-A Class A2B 144A± | 1.18 | 6-15-2027 | 100,000 | 100,319 | ||||||||||||
Trade Maps Limited Series 2013-1A Class A 144A± | 0.89 | 12-10-2018 | 268,000 | 267,987 | ||||||||||||
World Financial Network Credit Card Master Trust Series 2014-B Class A | 0.61 | 7-15-2019 | 98,000 | 98,003 | ||||||||||||
Total Asset-Backed Securities (Cost $12,850,958) | 12,878,195 | |||||||||||||||
|
| |||||||||||||||
Corporate Bonds and Notes: 18.18% | ||||||||||||||||
Consumer Discretionary: 1.68% | ||||||||||||||||
| Auto Components: 0.03% | ||||||||||||||||
Johnson Controls Incorporated | 4.95 | 7-2-2064 | 25,000 | 23,655 | ||||||||||||
|
| |||||||||||||||
| Automobiles: 0.33% | ||||||||||||||||
General Motors Company | 3.45 | 4-10-2022 | 90,000 | 87,999 | ||||||||||||
General Motors Company | 3.50 | 10-2-2018 | 115,000 | 118,739 | ||||||||||||
General Motors Company | 5.00 | 4-1-2035 | 50,000 | 49,093 | ||||||||||||
General Motors Company | 5.20 | 4-1-2045 | 30,000 | 29,742 | ||||||||||||
| 285,573 | ||||||||||||||||
|
| |||||||||||||||
| Hotels, Restaurants & Leisure: 0.17% | ||||||||||||||||
McDonald’s Corporation | 2.20 | 5-26-2020 | 60,000 | 59,336 | ||||||||||||
McDonald’s Corporation | 4.60 | 5-26-2045 | 40,000 | 38,878 | ||||||||||||
Yum! Brands Incorporated | 5.35 | 11-1-2043 | 50,000 | 47,842 | ||||||||||||
| 146,056 | ||||||||||||||||
|
| |||||||||||||||
| Internet & Catalog Retail: 0.12% | ||||||||||||||||
Amazon.com Incorporated | 4.95 | 12-5-2044 | 110,000 | 106,813 | ||||||||||||
|
| |||||||||||||||
| Media: 0.90% | ||||||||||||||||
Comcast Corporation | 4.40 | 8-15-2035 | 40,000 | 39,596 | ||||||||||||
Cox Communications Incorporated 144A | 4.80 | 2-1-2035 | 35,000 | 32,214 | ||||||||||||
DIRECTV Holdings LLC | 3.80 | 3-15-2022 | 40,000 | 40,185 | ||||||||||||
DIRECTV Holdings LLC | 3.95 | 1-15-2025 | 130,000 | 127,265 | ||||||||||||
DIRECTV Holdings LLC | 4.45 | 4-1-2024 | 95,000 | 96,949 | ||||||||||||
The accompanying notes are an integral part of these financial statements.
Table of Contents
| Portfolio of investments—June 30, 2015 (unaudited) | Wells Fargo Advantage VT Total Return Bond Fund | 13 |
| Security name | Interest rate | Maturity date | Principal | Value | ||||||||||||
| Media (continued) | ||||||||||||||||
Scripps Networks Interactive Incorporated | 2.80 | % | 6-15-2020 | $ | 60,000 | $ | 59,055 | |||||||||
Scripps Networks Interactive Incorporated | 3.50 | 6-15-2022 | 40,000 | 39,314 | ||||||||||||
Scripps Networks Interactive Incorporated | 3.90 | 11-15-2024 | 75,000 | 73,610 | ||||||||||||
Scripps Networks Interactive Incorporated | 3.95 | 6-15-2025 | 70,000 | 68,640 | ||||||||||||
Thomson Reuters Corporation | 3.85 | 9-29-2024 | 45,000 | 44,652 | ||||||||||||
Time Warner Cable Incorporated | 6.55 | 5-1-2037 | 25,000 | 25,954 | ||||||||||||
Viacom Incorporated | 4.85 | 12-15-2034 | 115,000 | 106,050 | ||||||||||||
Viacom Incorporated | 5.25 | 4-1-2044 | 35,000 | 32,704 | ||||||||||||
| 786,188 | ||||||||||||||||
|
| |||||||||||||||
| Specialty Retail: 0.06% | ||||||||||||||||
Bed Bath & Beyond Incorporated | 5.17 | 8-1-2044 | 55,000 | 54,411 | ||||||||||||
|
| |||||||||||||||
| Textiles, Apparel & Luxury Goods: 0.07% | ||||||||||||||||
Coach Incorporated | 4.25 | 4-1-2025 | 65,000 | 62,335 | ||||||||||||
|
| |||||||||||||||
Consumer Staples: 1.42% | ||||||||||||||||
| Beverages: 0.20% | ||||||||||||||||
Anheuser-Busch InBev Finance Company | 2.63 | 1-17-2023 | 35,000 | 33,480 | ||||||||||||
PepsiCo Incorporated | 1.25 | 4-30-2018 | 55,000 | 54,743 | ||||||||||||
PepsiCo Incorporated | 1.85 | 4-30-2020 | 85,000 | 83,986 | ||||||||||||
| 172,209 | ||||||||||||||||
|
| |||||||||||||||
| Food & Staples Retailing: 0.06% | ||||||||||||||||
Walgreens Boots Alliance Incorporated | 4.80 | 11-18-2044 | 55,000 | 51,570 | ||||||||||||
|
| |||||||||||||||
| Food Products: 0.79% | ||||||||||||||||
H. J. Heinz Company 144A%% | 2.80 | 7-2-2020 | 140,000 | 139,982 | ||||||||||||
H. J. Heinz Company 144A%% | 3.95 | 7-15-2025 | 165,000 | 165,929 | ||||||||||||
H. J. Heinz Company 144A%% | 5.00 | 7-15-2035 | 5,000 | 5,064 | ||||||||||||
H. J. Heinz Company 144A%% | 5.20 | 7-15-2045 | 70,000 | 71,631 | ||||||||||||
WM Wrigley Jr Company 144A | 2.00 | 10-20-2017 | 35,000 | 35,300 | ||||||||||||
WM Wrigley Jr Company 144A | 2.40 | 10-21-2018 | 55,000 | 55,749 | ||||||||||||
WM Wrigley Jr Company 144A | 2.90 | 10-21-2019 | 107,000 | 108,866 | ||||||||||||
WM Wrigley Jr Company 144A | 3.38 | 10-21-2020 | 105,000 | 108,097 | ||||||||||||
| 690,618 | ||||||||||||||||
|
| |||||||||||||||
| Tobacco: 0.37% | ||||||||||||||||
Altria Group Incorporated | 2.63 | 1-14-2020 | 110,000 | 109,481 | ||||||||||||
Altria Group Incorporated | 4.50 | 5-2-2043 | 60,000 | 55,372 | ||||||||||||
Reynolds American Incorporated | 4.45 | 6-12-2025 | 85,000 | 86,472 | ||||||||||||
Reynolds American Incorporated | 5.70 | 8-15-2035 | 70,000 | 72,379 | ||||||||||||
| 323,704 | ||||||||||||||||
|
| |||||||||||||||
Energy: 2.80% | ||||||||||||||||
| Oil, Gas & Consumable Fuels: 2.80% | ||||||||||||||||
Chevron Corporation | 1.37 | 3-2-2018 | 155,000 | 154,638 | ||||||||||||
Chevron Corporation | 2.41 | 3-3-2022 | 125,000 | 121,427 | ||||||||||||
The accompanying notes are an integral part of these financial statements.
Table of Contents
| 14 | Wells Fargo Advantage VT Total Return Bond Fund | Portfolio of investments—June 30, 2015 (unaudited) |
| Security name | Interest rate | Maturity date | Principal | Value | ||||||||||||
| Oil, Gas & Consumable Fuels (continued) | ||||||||||||||||
ConocoPhillips Company | 2.88 | % | 11-15-2021 | $ | 60,000 | $ | 60,454 | |||||||||
Continental Resources Incorporated | 4.50 | 4-15-2023 | 25,000 | 24,076 | ||||||||||||
El Paso Pipeline Partners Operating LLC | 4.10 | 11-15-2015 | 105,000 | 106,091 | ||||||||||||
El Paso Pipeline Partners Operating LLC | 4.30 | 5-1-2024 | 75,000 | 73,912 | ||||||||||||
Energy Transfer Partners LP | 2.50 | 6-15-2018 | 80,000 | 80,068 | ||||||||||||
Energy Transfer Partners LP | 4.05 | 3-15-2025 | 75,000 | 70,730 | ||||||||||||
Energy Transfer Partners LP | 4.15 | 10-1-2020 | 40,000 | 41,074 | ||||||||||||
Energy Transfer Partners LP | 4.75 | 1-15-2026 | 115,000 | 113,352 | ||||||||||||
Energy Transfer Partners LP | 6.13 | 12-15-2045 | 55,000 | 55,136 | ||||||||||||
Enlink Midstream Partners LP | 5.05 | 4-1-2045 | 95,000 | 85,858 | ||||||||||||
Enterprise Products Operating LLC | 3.70 | 2-15-2026 | 80,000 | 77,737 | ||||||||||||
Enterprise Products Operating LLC | 3.75 | 2-15-2025 | 60,000 | 58,716 | ||||||||||||
Enterprise Products Operating LLC | 4.85 | 3-15-2044 | 30,000 | 28,116 | ||||||||||||
Enterprise Products Operating LLC | 4.90 | 5-15-2046 | 10,000 | 9,399 | ||||||||||||
Exxon Mobil Corporation | 1.31 | 3-6-2018 | 110,000 | 109,842 | ||||||||||||
Exxon Mobil Corporation | 1.91 | 3-6-2020 | 130,000 | 129,111 | ||||||||||||
Exxon Mobil Corporation | 2.71 | 3-6-2025 | 125,000 | 121,193 | ||||||||||||
Kerr-McGee Corporation | 6.95 | 7-1-2024 | 160,000 | 192,646 | ||||||||||||
Kinder Morgan Energy Partners LP | 5.30 | 12-1-2034 | 30,000 | 27,652 | ||||||||||||
Kinder Morgan Energy Partners LP | 5.55 | 6-1-2045 | 50,000 | 46,064 | ||||||||||||
Marathon Oil Corporation | 3.85 | 6-1-2025 | 70,000 | 68,501 | ||||||||||||
Marathon Oil Corporation | 5.20 | 6-1-2045 | 45,000 | 43,529 | ||||||||||||
Marathon Petroleum Corporation | 5.00 | 9-15-2054 | 20,000 | 18,052 | ||||||||||||
MPLX LP | 4.00 | 2-15-2025 | 10,000 | 9,742 | ||||||||||||
Newfield Exploration Company | 5.63 | 7-1-2024 | 40,000 | 40,400 | ||||||||||||
ONEOK Partners LP | 2.00 | 10-1-2017 | 80,000 | 80,155 | ||||||||||||
Phillips 66 | 4.88 | 11-15-2044 | 15,000 | 14,276 | ||||||||||||
Rowan Companies Incorporated | 5.40 | 12-1-2042 | 54,000 | 43,879 | ||||||||||||
Rowan Companies Incorporated | 5.85 | 1-15-2044 | 30,000 | 25,322 | ||||||||||||
Sunoco Logistics Partner LP | 5.35 | 5-15-2045 | 60,000 | 54,593 | ||||||||||||
TC Pipelines LP | 4.65 | 6-15-2021 | 28,000 | 29,120 | ||||||||||||
Valero Energy Corporation | 4.90 | 3-15-2045 | 65,000 | 60,696 | ||||||||||||
Western Gas Partners LP | 3.95 | 6-1-2025 | 75,000 | 72,077 | ||||||||||||
Western Gas Partners LP | 5.38 | 6-1-2021 | 30,000 | 32,351 | ||||||||||||
Williams Partners LP | 4.00 | 9-15-2025 | 75,000 | 70,144 | ||||||||||||
| 2,450,129 | ||||||||||||||||
|
| |||||||||||||||
Financials: 6.61% | ||||||||||||||||
| Banks: 1.75% | ||||||||||||||||
Bank of America Corporation | 1.50 | 10-9-2015 | 235,000 | 235,539 | ||||||||||||
Bank of America Corporation | 3.95 | 4-21-2025 | 35,000 | 33,755 | ||||||||||||
Bank of America Corporation | 6.00 | 9-1-2017 | 120,000 | 130,452 | ||||||||||||
BB&T Corporation | 2.63 | 6-29-2020 | 175,000 | 175,231 | ||||||||||||
Citigroup Incorporated | 1.55 | 8-14-2017 | 175,000 | 174,665 | ||||||||||||
Citigroup Incorporated | 1.70 | 7-25-2016 | 120,000 | 120,786 | ||||||||||||
Citigroup Incorporated | 3.30 | 4-27-2025 | 125,000 | 120,013 | ||||||||||||
Citigroup Incorporated | 4.40 | 6-10-2025 | 100,000 | 99,477 | ||||||||||||
JPMorgan Chase & Company | 2.25 | 1-23-2020 | 90,000 | 88,443 | ||||||||||||
JPMorgan Chase & Company | 2.75 | 6-23-2020 | 193,000 | 192,854 | ||||||||||||
The accompanying notes are an integral part of these financial statements.
Table of Contents
| Portfolio of investments—June 30, 2015 (unaudited) | Wells Fargo Advantage VT Total Return Bond Fund | 15 |
| Security name | Interest rate | Maturity date | Principal | Value | ||||||||||||
| Banks (continued) | ||||||||||||||||
JPMorgan Chase & Company | 4.85 | % | 2-1-2044 | $ | 60,000 | $ | 61,770 | |||||||||
JPMorgan Chase & Company | 4.95 | 6-1-2045 | 100,000 | 96,858 | ||||||||||||
| 1,529,843 | ||||||||||||||||
|
| |||||||||||||||
| Capital Markets: 1.30% | ||||||||||||||||
Goldman Sachs Group Incorporated | 3.75 | 5-22-2025 | 225,000 | 221,697 | ||||||||||||
Goldman Sachs Group Incorporated | 5.15 | 5-22-2045 | 90,000 | 86,523 | ||||||||||||
Goldman Sachs Group Incorporated | 6.75 | 10-1-2037 | 40,000 | 46,840 | ||||||||||||
Lazard Group LLC | 3.75 | 2-13-2025 | 145,000 | 137,782 | ||||||||||||
Lazard Group LLC | 4.25 | 11-14-2020 | 80,000 | 84,038 | ||||||||||||
Morgan Stanley | 2.65 | 1-27-2020 | 80,000 | 79,790 | ||||||||||||
Morgan Stanley | 2.80 | 6-16-2020 | 175,000 | 175,310 | ||||||||||||
Morgan Stanley | 3.95 | 4-23-2027 | 120,000 | 112,949 | ||||||||||||
Morgan Stanley | 4.30 | 1-27-2045 | 30,000 | 27,926 | ||||||||||||
Morgan Stanley | 4.35 | 9-8-2026 | 65,000 | 63,754 | ||||||||||||
Morgan Stanley | 5.38 | 10-15-2015 | 100,000 | 101,333 | ||||||||||||
| 1,137,942 | ||||||||||||||||
|
| |||||||||||||||
| Consumer Finance: 1.89% | ||||||||||||||||
American Express Credit Corporation | 2.38 | 5-26-2020 | 125,000 | 123,992 | ||||||||||||
Daimler Finance North America LLC 144A | 1.88 | 1-11-2018 | 150,000 | 150,258 | ||||||||||||
Daimler Finance North America LLC 144A | 2.38 | 8-1-2018 | 150,000 | 152,003 | ||||||||||||
Discover Financial Services | 3.75 | 3-4-2025 | 70,000 | 66,737 | ||||||||||||
ERAC USA Finance LLC 144A | 4.50 | 2-15-2045 | 25,000 | 22,891 | ||||||||||||
ERAC USA Finance LLC 144A | 5.63 | 3-15-2042 | 82,000 | 87,587 | ||||||||||||
Ford Motor Credit Company LLC | 3.66 | 9-8-2024 | 200,000 | 197,059 | ||||||||||||
Hyundai Capital America 144A | 2.00 | 3-19-2018 | 40,000 | 39,995 | ||||||||||||
Hyundai Capital America 144A | 2.60 | 3-19-2020 | 100,000 | 99,948 | ||||||||||||
Murray Street Investment Trust I | 4.65 | 3-9-2017 | 188,000 | 197,455 | ||||||||||||
Synchrony Financial | 2.70 | 2-3-2020 | 105,000 | 103,634 | ||||||||||||
Synchrony Financial | 4.25 | 8-15-2024 | 70,000 | 70,203 | ||||||||||||
Toyota Motor Credit Corporation | 1.13 | 5-16-2017 | 210,000 | 210,434 | ||||||||||||
Toyota Motor Credit Corporation | 2.75 | 5-17-2021 | 125,000 | 126,684 | ||||||||||||
| 1,648,880 | ||||||||||||||||
|
| |||||||||||||||
| Diversified Financial Services: 0.19% | ||||||||||||||||
CME Group Incorporated | 3.00 | 3-15-2025 | 40,000 | 38,782 | ||||||||||||
General Electric Capital Corporation | 5.88 | 1-14-2038 | 110,000 | 132,030 | ||||||||||||
| 170,812 | ||||||||||||||||
|
| |||||||||||||||
| Insurance: 0.40% | ||||||||||||||||
American International Group Incorporated | 4.38 | 1-15-2055 | 40,000 | 35,479 | ||||||||||||
American International Group Incorporated | 4.50 | 7-16-2044 | 45,000 | 42,648 | ||||||||||||
Assurant Incorporated | 2.50 | 3-15-2018 | 105,000 | 106,500 | ||||||||||||
MetLife Incorporated | 1.90 | 12-15-2017 | 55,000 | 55,236 | ||||||||||||
MetLife Incorporated | 3.00 | 3-1-2025 | 40,000 | 38,260 | ||||||||||||
Principal Financial Group Incorporated | 3.40 | 5-15-2025 | 55,000 | 53,643 | ||||||||||||
Prudential Financial Incorporated | 4.60 | 5-15-2044 | 20,000 | 19,326 | ||||||||||||
| 351,092 | ||||||||||||||||
|
| |||||||||||||||
The accompanying notes are an integral part of these financial statements.
Table of Contents
| 16 | Wells Fargo Advantage VT Total Return Bond Fund | Portfolio of investments—June 30, 2015 (unaudited) |
| Security name | Interest rate | Maturity date | Principal | Value | ||||||||||||
| REITs: 1.08% | ||||||||||||||||
American Tower Corporation | 2.80 | % | 6-1-2020 | $ | 50,000 | $ | 49,261 | |||||||||
American Tower Corporation | 3.45 | 9-15-2021 | 105,000 | 104,381 | ||||||||||||
American Tower Corporation | 3.50 | 1-31-2023 | 96,000 | 92,100 | ||||||||||||
American Tower Corporation | 4.00 | 6-1-2025 | 55,000 | 53,545 | ||||||||||||
DDR Corporation | 3.38 | 5-15-2023 | 100,000 | 95,685 | ||||||||||||
DDR Corporation | 4.63 | 7-15-2022 | 120,000 | 125,866 | ||||||||||||
Federal Realty Investment Trust | 3.00 | 8-1-2022 | 40,000 | 39,359 | ||||||||||||
HCP Incorporated | 4.00 | 6-1-2025 | 40,000 | 39,100 | ||||||||||||
Healthcare Trust of America Holdings LP | 3.38 | 7-15-2021 | 70,000 | 69,587 | ||||||||||||
Mid-America Apartments LP | 3.75 | 6-15-2024 | 90,000 | 88,784 | ||||||||||||
Mid-America Apartments LP | 4.30 | 10-15-2023 | 80,000 | 82,797 | ||||||||||||
Tanger Properties LP | 3.75 | 12-1-2024 | 45,000 | 44,401 | ||||||||||||
Tanger Properties LP | 3.88 | 12-1-2023 | 55,000 | 55,478 | ||||||||||||
| 940,344 | ||||||||||||||||
|
| |||||||||||||||
Health Care: 1.37% | ||||||||||||||||
| Biotechnology: 0.56% | ||||||||||||||||
Amgen Incorporated | 2.13 | 5-1-2020 | 30,000 | 29,350 | ||||||||||||
Amgen Incorporated | 2.20 | 5-22-2019 | 80,000 | 79,730 | ||||||||||||
Amgen Incorporated | 2.70 | 5-1-2022 | 60,000 | 57,950 | ||||||||||||
Amgen Incorporated | 4.40 | 5-1-2045 | 65,000 | 60,055 | ||||||||||||
Baxalta Incorporated 144A | 2.88 | 6-23-2020 | 75,000 | 74,823 | ||||||||||||
Baxalta Incorporated 144A | 3.60 | 6-23-2022 | 35,000 | 34,966 | ||||||||||||
Baxalta Incorporated 144A | 4.00 | 6-23-2025 | 70,000 | 69,542 | ||||||||||||
Baxalta Incorporated 144A | 5.25 | 6-23-2045 | 20,000 | 20,039 | ||||||||||||
Celgene Corporation | 5.25 | 8-15-2043 | 60,000 | 62,254 | ||||||||||||
| 488,709 | ||||||||||||||||
|
| |||||||||||||||
| Health Care Equipment & Supplies: 0.18% | ||||||||||||||||
Boston Scientific Corporation | 3.38 | 5-15-2022 | 40,000 | 39,127 | ||||||||||||
Medtronic Incorporated 144A | 3.15 | 3-15-2022 | 75,000 | 75,265 | ||||||||||||
Medtronic Incorporated 144A | 4.38 | 3-15-2035 | 45,000 | 44,518 | ||||||||||||
| 158,910 | ||||||||||||||||
|
| |||||||||||||||
| Health Care Providers & Services: 0.09% | ||||||||||||||||
WellPoint Incorporated | 3.50 | 8-15-2024 | 50,000 | 47,957 | ||||||||||||
WellPoint Incorporated | 5.10 | 1-15-2044 | 35,000 | 34,092 | ||||||||||||
| 82,049 | ||||||||||||||||
|
| |||||||||||||||
| Pharmaceuticals: 0.54% | ||||||||||||||||
AbbVie Incorporated | 1.80 | 5-14-2018 | 125,000 | 124,533 | ||||||||||||
AbbVie Incorporated | 2.50 | 5-14-2020 | 200,000 | 197,862 | ||||||||||||
AbbVie Incorporated | 3.60 | 5-14-2025 | 100,000 | 98,686 | ||||||||||||
Mylan Incorporated | 5.40 | 11-29-2043 | 45,000 | 45,868 | ||||||||||||
| 466,949 | ||||||||||||||||
|
| |||||||||||||||
The accompanying notes are an integral part of these financial statements.
Table of Contents
| Portfolio of investments—June 30, 2015 (unaudited) | Wells Fargo Advantage VT Total Return Bond Fund | 17 |
| Security name | Interest rate | Maturity date | Principal | Value | ||||||||||||
Industrials: 0.69% | ||||||||||||||||
| Aerospace & Defense: 0.18% | ||||||||||||||||
Northrop Grumman Corporation | 3.25 | % | 8-1-2023 | $ | 110,000 | $ | 107,622 | |||||||||
Northrop Grumman Corporation | 3.85 | 4-15-2045 | 55,000 | 48,365 | ||||||||||||
| 155,987 | ||||||||||||||||
|
| |||||||||||||||
| Air Freight & Logistics: 0.06% | ||||||||||||||||
FedEx Corporation | 4.10 | 2-1-2045 | 60,000 | 53,689 | ||||||||||||
|
| |||||||||||||||
| Machinery: 0.06% | ||||||||||||||||
Valmont Industries Incorporated | 5.25 | 10-1-2054 | 55,000 | 49,121 | ||||||||||||
|
| |||||||||||||||
| Professional Services: 0.06% | ||||||||||||||||
Verisk Analytics Incorporated | 4.00 | 6-15-2025 | 40,000 | 39,128 | ||||||||||||
Verisk Analytics Incorporated | 5.50 | 6-15-2045 | 15,000 | 14,703 | ||||||||||||
| 53,831 | ||||||||||||||||
|
| |||||||||||||||
| Road & Rail: 0.31% | ||||||||||||||||
Penske Truck Leasing Company LP 144A | 2.50 | 6-15-2019 | 125,000 | 123,717 | ||||||||||||
Penske Truck Leasing Company LP 144A | 3.05 | 1-9-2020 | 50,000 | 50,183 | ||||||||||||
Penske Truck Leasing Company LP 144A | 3.38 | 2-1-2022 | 105,000 | 101,669 | ||||||||||||
| 275,569 | ||||||||||||||||
|
| |||||||||||||||
| Trading Companies & Distributors: 0.02% | ||||||||||||||||
W.W. Grainger Incorporated | 4.60 | 6-15-2045 | 15,000 | 14,959 | ||||||||||||
|
| |||||||||||||||
Information Technology: 0.73% | ||||||||||||||||
| Communications Equipment: 0.09% | ||||||||||||||||
Cisco Systems Incorporated | 3.00 | 6-15-2022 | 80,000 | 79,254 | ||||||||||||
|
| |||||||||||||||
| Electronic Equipment, Instruments & Components: 0.09% | ||||||||||||||||
L-3 Communications Corporation | 3.95 | 5-28-2024 | 80,000 | 77,656 | ||||||||||||
|
| |||||||||||||||
| Software: 0.26% | ||||||||||||||||
Oracle Corporation | 2.50 | 5-15-2022 | 100,000 | 97,006 | ||||||||||||
Oracle Corporation | 2.95 | 5-15-2025 | 65,000 | 62,510 | ||||||||||||
Oracle Corporation | 3.90 | 5-15-2035 | 25,000 | 23,177 | ||||||||||||
Oracle Corporation | 4.13 | 5-15-2045 | 40,000 | 37,071 | ||||||||||||
Oracle Corporation | 4.38 | 5-15-2055 | 15,000 | 13,929 | ||||||||||||
| 233,693 | ||||||||||||||||
|
| |||||||||||||||
| Technology Hardware, Storage & Peripherals: 0.29% | ||||||||||||||||
Apple Incorporated | 2.70 | 5-13-2022 | 210,000 | 207,653 | ||||||||||||
Apple Incorporated | 4.38 | 5-13-2045 | 45,000 | 44,247 | ||||||||||||
| 251,900 | ||||||||||||||||
|
| |||||||||||||||
Materials: 0.30% | ||||||||||||||||
| Chemicals: 0.23% | ||||||||||||||||
Albemarle Corporation | 5.45 | 12-1-2044 | 65,000 | 64,837 | ||||||||||||
The accompanying notes are an integral part of these financial statements.
Table of Contents
| 18 | Wells Fargo Advantage VT Total Return Bond Fund | Portfolio of investments—June 30, 2015 (unaudited) |
| Security name | Interest rate | Maturity date | Principal | Value | ||||||||||||
| Chemicals (continued) | ||||||||||||||||
Eastman Chemical Company | 3.80 | % | 3-15-2025 | $ | 30,000 | $ | 29,901 | |||||||||
Eastman Chemical Company | 4.65 | 10-15-2044 | 40,000 | 37,758 | ||||||||||||
Mosaic Company | 5.45 | 11-15-2033 | 30,000 | 31,848 | ||||||||||||
Mosaic Company | 5.63 | 11-15-2043 | 35,000 | 37,164 | ||||||||||||
| 201,508 | ||||||||||||||||
|
| |||||||||||||||
| Metals & Mining: 0.03% | ||||||||||||||||
Vale Overseas Limited | 8.25 | 1-17-2034 | 25,000 | 27,545 | ||||||||||||
|
| |||||||||||||||
| Paper & Forest Products: 0.04% | ||||||||||||||||
International Paper Company | 5.15 | 5-15-2046 | 35,000 | 33,505 | ||||||||||||
|
| |||||||||||||||
Telecommunication Services: 1.12% | ||||||||||||||||
| Diversified Telecommunication Services: 1.12% | ||||||||||||||||
AT&T Incorporated | 3.00 | 6-30-2022 | 165,000 | 159,163 | ||||||||||||
AT&T Incorporated | 3.40 | 5-15-2025 | 150,000 | 142,421 | ||||||||||||
AT&T Incorporated | 4.30 | 12-15-2042 | 25,000 | 21,351 | ||||||||||||
AT&T Incorporated | 4.35 | 6-15-2045 | 15,000 | 12,799 | ||||||||||||
AT&T Incorporated | 4.50 | 5-15-2035 | 55,000 | 50,411 | ||||||||||||
AT&T Incorporated | 4.75 | 5-15-2046 | 50,000 | 45,265 | ||||||||||||
Verizon Communications Incorporated | 2.50 | 9-15-2016 | 105,000 | 106,694 | ||||||||||||
Verizon Communications Incorporated 144A | 4.27 | 1-15-2036 | 57,000 | 51,125 | ||||||||||||
Verizon Communications Incorporated | 4.40 | 11-1-2034 | 113,000 | 105,762 | ||||||||||||
Verizon Communications Incorporated | 4.86 | 8-21-2046 | 305,000 | 284,423 | ||||||||||||
| 979,414 | ||||||||||||||||
|
| |||||||||||||||
Utilities: 1.46% | ||||||||||||||||
| Electric Utilities: 1.04% | ||||||||||||||||
Alabama Power Company | 3.75 | 3-1-2045 | 60,000 | 53,693 | ||||||||||||
American Electric Power Company | 1.65 | 12-15-2017 | 130,000 | 130,127 | ||||||||||||
Appalachian Power Company | 4.45 | 6-1-2045 | 70,000 | 66,909 | ||||||||||||
Commonwealth Edison Company | 3.70 | 3-1-2045 | 20,000 | 17,885 | ||||||||||||
Consolidated Edison Company of New York Incorporated | 4.63 | 12-1-2054 | 40,000 | 38,787 | ||||||||||||
Exelon Corporation | 2.85 | 6-15-2020 | 60,000 | 60,254 | ||||||||||||
Exelon Corporation | 3.95 | 6-15-2025 | 60,000 | 60,263 | ||||||||||||
Niagara Mohawk Power Corporation 144A | 4.28 | 10-1-2034 | 60,000 | 59,694 | ||||||||||||
PacifiCorp | 3.60 | 4-1-2024 | 110,000 | 113,409 | ||||||||||||
Potomac Electric Power Company | 4.15 | 3-15-2043 | 50,000 | 48,032 | ||||||||||||
Potomac Electric Power Company | 3.60 | 3-15-2024 | 55,000 | 56,164 | ||||||||||||
Public Service Company of Colorado | 4.30 | 3-15-2044 | 30,000 | 30,112 | ||||||||||||
Public Service Electric & Gas Company | 3.05 | 11-15-2024 | 50,000 | 49,395 | ||||||||||||
Southwestern Electric Power Company | 3.55 | 2-15-2022 | 40,000 | 41,205 | ||||||||||||
Southwestern Electric Power Company | 3.90 | 4-1-2045 | 55,000 | 47,695 | ||||||||||||
Virginia Electric & Power Company | 4.45 | 2-15-2044 | 35,000 | 35,016 | ||||||||||||
| 908,640 | ||||||||||||||||
|
| |||||||||||||||
| Multi-Utilities: 0.42% | ||||||||||||||||
Ameren Illinois Company | 4.30 | 7-1-2044 | 15,000 | 14,836 | ||||||||||||
Berkshire Hathaway Energy | 4.50 | 2-1-2045 | 60,000 | 58,400 | ||||||||||||
The accompanying notes are an integral part of these financial statements.
Table of Contents
| Portfolio of investments—June 30, 2015 (unaudited) | Wells Fargo Advantage VT Total Return Bond Fund | 19 |
| Security name | Interest rate | Maturity date | Principal | Value | ||||||||||||
| Multi-Utilities (continued) | ||||||||||||||||
Dominion Resources Incorporated | 4.70 | % | 12-1-2044 | $ | 60,000 | $ | 58,258 | |||||||||
Pacific Gas & Electric Corporation | 3.25 | 6-15-2023 | 45,000 | 44,656 | ||||||||||||
Puget Energy Incorporated | 6.00 | 9-1-2021 | 145,000 | 165,998 | ||||||||||||
Puget Sound Energy Incorporated | 4.30 | 5-20-2045 | 30,000 | 29,716 | ||||||||||||
| 371,864 | ||||||||||||||||
|
| |||||||||||||||
Total Corporate Bonds and Notes (Cost $16,187,338) | 15,896,926 | |||||||||||||||
|
| |||||||||||||||
Municipal Obligations: 0.99% | ||||||||||||||||
| California: 0.28% | ||||||||||||||||
California Build America Bonds (GO) | 7.60 | 11-1-2040 | 80,000 | 118,537 | ||||||||||||
Los Angeles CA Community College District Build America Bonds (GO) | 6.75 | 8-1-2049 | 90,000 | 124,526 | ||||||||||||
| 243,063 | ||||||||||||||||
|
| |||||||||||||||
| Nevada: 0.20% | ||||||||||||||||
Clark County NV Airport Authority Build America Bonds Series C (Airport Revenue) | 6.82 | 7-1-2045 | 130,000 | 175,683 | ||||||||||||
|
| |||||||||||||||
| New Jersey: 0.18% | ||||||||||||||||
New Jersey Turnpike Authority Build America Bonds Series A (Transportation Revenue) | 7.10 | 1-1-2041 | 119,000 | 159,847 | ||||||||||||
|
| |||||||||||||||
| New York: 0.13% | ||||||||||||||||
Port Authority of New York & New Jersey Consolidated Bonds Series 174 (Airport Revenue) | 4.46 | 10-1-2062 | 120,000 | 114,875 | ||||||||||||
|
| |||||||||||||||
| Ohio: 0.04% | ||||||||||||||||
Ohio State University General Receipts Taxable Bonds Series A (Education Revenue) | 4.80 | 6-1-2111 | 36,000 | 34,571 | ||||||||||||
|
| |||||||||||||||
| Texas: 0.16% | ||||||||||||||||
North Texas Tollway Authority (Transportation Revenue) | 6.72 | 1-1-2049 | 104,000 | 139,690 | ||||||||||||
|
| |||||||||||||||
Total Municipal Obligations (Cost $736,738) | 867,729 | |||||||||||||||
|
| |||||||||||||||
Non-Agency Mortgage-Backed Securities: 5.32% | ||||||||||||||||
Bank of America Commercial Mortgage Incorporated Series 2005-4 Class A5A | 4.93 | 7-10-2045 | 5,614 | 5,610 | ||||||||||||
CFCRE Commercial Mortgage Trust Series 2011-C1 Series A4 144A± | 4.96 | 4-15-2044 | 100,000 | 110,750 | ||||||||||||
Citigroup Commercial Mortgage Trust Series 2013-GC17 Class A4 | 4.13 | 11-10-2046 | 31,000 | 33,094 | ||||||||||||
Citigroup Commercial Mortgage Trust Series 2013-GC31 Class AS (a)%% | 4.01 | 6-10-2045 | 43,000 | 44,287 | ||||||||||||
Commercial Mortgage Pass-Through Certificate Series 2012-CR1 Class A2 | 2.35 | 5-15-2045 | 84,097 | 85,668 | ||||||||||||
Commercial Mortgage Pass-Through Certificate Series 2013-CR10 Class A2 | 2.97 | 8-10-2046 | 35,000 | 36,190 | ||||||||||||
Commercial Mortgage Pass-Through Certificate Series 2015-LC21 Class A4 | 3.71 | 7-10-2048 | 76,000 | 77,891 | ||||||||||||
Commercial Mortgage Pass-Through Certificate Trust Series 2010-C1 Class A3 144A | 4.21 | 7-10-2046 | 138,000 | 149,326 | ||||||||||||
Commercial Mortgage Pass-Through Certificate Trust Series 2012-CR4 Class A2 | 1.80 | 10-15-2045 | 30,000 | 30,166 | ||||||||||||
Commercial Mortgage Pass-Through Certificate Trust Series 2012-UBS5 Class A3 | 3.55 | 9-10-2047 | 35,000 | 36,483 | ||||||||||||
Commercial Mortgage Pass-Through Certificate Trust Series 2013-CR12 Class A4 | 4.05 | 10-10-2046 | 19,000 | 20,280 | ||||||||||||
Commercial Mortgage Pass-Through Certificate Trust Series 2014-C4 Class A5 | 3.69 | 8-10-2047 | 156,000 | 160,028 | ||||||||||||
Commercial Mortgage Pass-Through Certificate Trust Series 2014-CR18 Class ASB | 3.45 | 7-15-2047 | 58,000 | 60,249 | ||||||||||||
Commercial Mortgage Pass-Through Certificate Trust Series 2014-UBS3 Class A4 | 3.82 | 6-10-2047 | 73,000 | 75,974 | ||||||||||||
Commercial Mortgage Pass-Through Certificate Trust Series 2014-UBS5 Class A4 | 3.84 | 9-10-2047 | 50,000 | 51,899 | ||||||||||||
Commercial Mortgage Pass-Through Certificate Trust Series 2014-UBS6 Class AM ± | 4.05 | 12-10-2047 | 120,000 | 123,878 | ||||||||||||
Commercial Mortgage Pass-Through Certificate Trust Series 2014-UBS6 Class ASB | 3.39 | 12-10-2047 | 24,000 | 24,653 | ||||||||||||
Credit Suisse First Boston Mortgage Securities Corporation Series 2005-C5 | 5.10 | 8-15-2038 | 1,743 | 1,741 | ||||||||||||
CSAIL Commercial Mortgage Trust Series 2015-C2 Class AS | 3.85 | 6-15-2057 | 90,000 | 91,085 | ||||||||||||
The accompanying notes are an integral part of these financial statements.
Table of Contents
| 20 | Wells Fargo Advantage VT Total Return Bond Fund | Portfolio of investments—June 30, 2015 (unaudited) |
| Security name | Interest rate | Maturity date | Principal | Value | ||||||||||||
Non-Agency Mortgage-Backed Securities (continued) | ||||||||||||||||
CSAIL Commercial Mortgage Trust Series 2015-C2 Class ASB | 3.22 | % | 6-15-2057 | $ | 178,000 | $ | 181,610 | |||||||||
Deutsche Bank UBS Securities Mortgage Trust Series 2011-LC1A Class A1 144A | 3.74 | 11-10-2046 | 83,592 | 84,509 | ||||||||||||
Deutsche Bank UBS Securities Mortgage Trust Series 2011-LC2A Class A4 144A | 4.54 | 7-10-2044 | 111,000 | 121,678 | ||||||||||||
Greenwich Capital Commercial Funding Corporation | 5.22 | 4-10-2037 | 56,163 | 56,232 | ||||||||||||
GS Mortgage Securities Trust Series 2011-GC3 Class A2 144A | 3.65 | 3-10-2044 | 73,823 | 74,428 | ||||||||||||
GS Mortgage Securities Trust Series 2012-GC6 Class A1 | 1.28 | 1-10-2045 | 1,760 | 1,763 | ||||||||||||
GS Mortgage Securities Trust Series 2012-GCJ7 Class A1 | 1.14 | 5-10-2045 | 21,716 | 21,753 | ||||||||||||
GS Mortgage Securities Trust Series 2012-GCJ7 Class A2 | 2.32 | 5-10-2045 | 108,000 | 109,680 | ||||||||||||
GS Mortgage Securities Trust Series 2013-GC16 Class A1 | 1.26 | 11-10-2046 | 20,108 | 20,081 | ||||||||||||
GS Mortgage Securities Trust Series 2014-GC18 Class A4 | 4.07 | 1-10-2047 | 22,000 | 23,341 | ||||||||||||
GS Mortgage Securities Trust Series 2014-GC18 Class AAB | 3.65 | 1-10-2047 | 60,000 | 63,055 | ||||||||||||
GS Mortgage Securities Trust Series 2014-GC20 Class AAB | 3.66 | 4-10-2047 | 67,000 | 70,162 | ||||||||||||
GS Mortgage Securities Trust Series 2014-GC26 Class AAB | 3.37 | 11-10-2047 | 71,000 | 72,865 | ||||||||||||
GS Mortgage Securities Trust Series 2015-GC28 Class A5 | 3.40 | 2-10-2048 | 25,000 | 25,000 | ||||||||||||
GS Mortgage Securities Trust Series 2015-GC28 Class AS | 3.76 | 2-10-2048 | 60,000 | 59,892 | ||||||||||||
GS Mortgage Securities Trust Series 2015-GC30 Class A3 | 3.12 | 5-10-2050 | 82,000 | 80,579 | ||||||||||||
GS Mortgage Securities Trust Series 2015-GC30 Class AAB | 3.12 | 5-10-2050 | 64,000 | 64,485 | ||||||||||||
GS Mortgage Securities Trust Series 2015-GC30 Class AS | 3.78 | 5-10-2050 | 79,000 | 78,980 | ||||||||||||
Impact Funding LLC Series 2010-1 Class A1 144A | 5.31 | 1-25-2051 | 322,590 | 365,657 | ||||||||||||
JPMorgan Chase Commercial Mortgage Securities Corporation Series 2004-LN2 Class A2 | 5.12 | 7-15-2041 | 3,857 | 3,862 | ||||||||||||
JPMorgan Chase Commercial Mortgage Securities Corporation Series 2006-CB14 Class A4 ± | 5.48 | 12-12-2044 | 31,259 | 31,553 | ||||||||||||
JPMorgan Chase Commercial Mortgage Securities Corporation Series 2010-C2 Class A3 144A | 4.07 | 11-15-2043 | 266,000 | 285,353 | ||||||||||||
JPMorgan Chase Commercial Mortgage Securities Corporation Series 2010-CNTR Class A1 144A | 3.30 | 8-5-2032 | 59,748 | 61,501 | ||||||||||||
JPMorgan Chase Commercial Mortgage Securities Corporation Series 2011-C4 Class A3 144A | 4.11 | 7-15-2046 | 117,000 | 124,032 | ||||||||||||
JPMorgan Chase Commercial Mortgage Securities Corporation Series 2012-LC9 Class A2 | 1.68 | 12-15-2047 | 39,000 | 39,165 | ||||||||||||
JPMorgan Chase Commercial Mortgage Securities Corporation Series 2014-C25 Class ASB | 3.41 | 11-15-2047 | 15,000 | 15,415 | ||||||||||||
JPMorgan Chase Commercial Mortgage Securities Corporation Series 2015-C28 Class A3 | 2.91 | 10-15-2048 | 47,000 | 45,507 | ||||||||||||
JPMorgan Chase Commercial Mortgage Securities Corporation Series 2015-C28 Class ASB | 3.04 | 10-15-2048 | 64,000 | 64,090 | ||||||||||||
JPMorgan Chase Commercial Mortgage Securities Corporation Series 2015-C29 Class A4 | 3.61 | 5-15-2048 | 65,000 | 66,136 | ||||||||||||
JPMorgan Chase Commercial Mortgage Securities Corporation Series 2015-C29 Class AS ± | 3.92 | 5-15-2048 | 31,000 | 31,568 | ||||||||||||
JPMorgan Chase Commercial Mortgage Securities Trust | 3.80 | 9-15-2047 | 36,000 | 37,258 | ||||||||||||
JPMorgan Chase Commercial Mortgage Securities Trust | 2.77 | 1-25-2045 | 91,974 | 92,853 | ||||||||||||
Morgan Stanley Bank of America Merrill Lynch Trust | 1.39 | 7-15-2046 | 108,501 | 108,923 | ||||||||||||
Morgan Stanley Bank of America Merrill Lynch Trust Series 2013-C9 Class A2 | 1.97 | 5-15-2046 | 39,000 | 39,254 | ||||||||||||
Morgan Stanley Bank of America Merrill Lynch Trust | 3.05 | 5-15-2046 | 39,000 | 38,102 | ||||||||||||
Morgan Stanley Bank of America Merrill Lynch Trust | 3.45 | 7-15-2050 | 140,000 | 141,049 | ||||||||||||
Morgan Stanley Capital I Trust Series 2011-C2 Class A2 144A | 3.48 | 6-15-2044 | 194,197 | 197,403 | ||||||||||||
Morgan Stanley Capital I Trust Series 2015-MS1 Class A3 %% | 3.51 | 5-15-2048 | 38,000 | 38,378 | ||||||||||||
Morgan Stanley Dean Witter Capital I Series 2011-C3 Class A2 | 3.22 | 7-15-2049 | 74,146 | 75,667 | ||||||||||||
Structured Agency Credit Risk Debt Note Series 2015-DN1 | 1.44 | 1-25-2025 | 222,222 | 222,009 | ||||||||||||
UBS Barclays Commercial Mortgage Trust Series 2012-C2 Class A2 | 2.11 | 5-10-2063 | 63,000 | 63,924 | ||||||||||||
UBS Barclays Commercial Mortgage Trust Series 2013-C5 Class A4 | 3.18 | 3-10-2046 | 33,000 | 33,274 | ||||||||||||
Total Non-Agency Mortgage-Backed Securities (Cost $4,622,020) | 4,651,278 | |||||||||||||||
|
| |||||||||||||||
The accompanying notes are an integral part of these financial statements.
Table of Contents
| Portfolio of investments—June 30, 2015 (unaudited) | Wells Fargo Advantage VT Total Return Bond Fund | 21 |
| Security name | Interest rate | Maturity date | Principal | Value | ||||||||||||
U.S. Treasury Securities: 30.19% | ||||||||||||||||
U.S. Treasury Bond | 2.50 | % | 2-15-2045 | $ | 427,000 | $ | 374,026 | |||||||||
U.S. Treasury Bond | 3.00 | 11-15-2044 | 57,000 | 55,490 | ||||||||||||
U.S. Treasury Bond | 3.00 | 5-15-2045 | 379,000 | 369,643 | ||||||||||||
U.S. Treasury Bond | 3.13 | 2-15-2043 | 415,000 | 413,606 | ||||||||||||
U.S. Treasury Bond | 3.38 | 5-15-2044 | 64,000 | 66,905 | ||||||||||||
U.S. Treasury Bond | 3.63 | 8-15-2043 | 485,000 | 531,113 | ||||||||||||
U.S. Treasury Bond | 3.63 | 2-15-2044 | 498,000 | 545,076 | ||||||||||||
U.S. Treasury Bond | 3.75 | 11-15-2043 | 209,000 | 233,982 | ||||||||||||
U.S. Treasury Bond | 4.50 | 8-15-2039 | 384,000 | 478,770 | ||||||||||||
U.S. Treasury Note ## | 0.63 | 12-15-2016 | 63,000 | 63,118 | ||||||||||||
U.S. Treasury Note | 0.63 | 2-15-2017 | 1,150,000 | 1,151,168 | ||||||||||||
U.S. Treasury Note ## | 0.63 | 5-31-2017 | 739,000 | 738,596 | ||||||||||||
U.S. Treasury Note ## | 0.63 | 9-30-2017 | 1,243,000 | 1,239,213 | ||||||||||||
U.S. Treasury Note | 0.75 | 10-31-2017 | 807,000 | 805,928 | ||||||||||||
U.S. Treasury Note | 0.75 | 4-15-2018 | 2,675,000 | 2,659,330 | ||||||||||||
U.S. Treasury Note | 0.88 | 1-31-2017 | 520,000 | 522,681 | ||||||||||||
U.S. Treasury Note | 0.88 | 4-30-2017 | 808,000 | 811,851 | ||||||||||||
U.S. Treasury Note ## | 0.88 | 7-15-2017 | 176,000 | 176,687 | ||||||||||||
U.S. Treasury Note ## | 0.88 | 8-15-2017 | 2,644,000 | 2,653,296 | ||||||||||||
U.S. Treasury Note | 1.00 | 9-15-2017 | 712,000 | 715,949 | ||||||||||||
U.S. Treasury Note | 1.00 | 5-15-2018 | 493,000 | 493,231 | ||||||||||||
U.S. Treasury Note | 1.13 | 6-15-2018 | 340,000 | 341,089 | ||||||||||||
U.S. Treasury Note | 1.38 | 3-31-2020 | 94,000 | 93,001 | ||||||||||||
U.S. Treasury Note | 1.38 | 4-30-2020 | 1,461,000 | 1,443,765 | ||||||||||||
U.S. Treasury Note | 1.50 | 1-31-2019 | 1,279,000 | 1,289,792 | ||||||||||||
U.S. Treasury Note | 1.50 | 5-31-2019 | 406,000 | 408,030 | ||||||||||||
U.S. Treasury Note | 1.50 | 10-31-2019 | 394,000 | 393,877 | ||||||||||||
U.S. Treasury Note | 1.50 | 5-31-2020 | 380,000 | 377,536 | ||||||||||||
U.S. Treasury Note | 1.63 | 6-30-2019 | 741,000 | 747,484 | ||||||||||||
U.S. Treasury Note | 1.63 | 7-31-2019 | 238,000 | 239,897 | ||||||||||||
U.S. Treasury Note | 1.63 | 6-30-2020 | 810,000 | 809,177 | ||||||||||||
U.S. Treasury Note ## | 1.75 | 9-30-2019 | 2,897,000 | 2,929,365 | ||||||||||||
U.S. Treasury Note | 1.88 | 5-31-2022 | 209,000 | 206,469 | ||||||||||||
U.S. Treasury Note | 2.13 | 6-30-2022 | 248,000 | 248,794 | ||||||||||||
U.S. Treasury Note | 2.13 | 5-15-2025 | 593,000 | 581,279 | ||||||||||||
U.S. Treasury Note | 2.50 | 5-15-2024 | 807,000 | 819,735 | ||||||||||||
U.S. Treasury Note | 2.63 | 8-15-2020 | 350,000 | 365,832 | ||||||||||||
Total U.S. Treasury Securities (Cost $26,304,676) | 26,394,781 | |||||||||||||||
|
| |||||||||||||||
Yankee Corporate Bonds and Notes: 4.72% | ||||||||||||||||
Consumer Discretionary: 0.18% | ||||||||||||||||
| Media: 0.12% | ||||||||||||||||
British Sky Broadcasting Group plc 144A | 3.75 | 9-16-2024 | 105,000 | 102,358 | ||||||||||||
|
| |||||||||||||||
| Textiles, Apparel & Luxury Goods: 0.06% | ||||||||||||||||
LVMH Moet Hennessy Louis Vuitton SA 144A | 1.63 | 6-29-2017 | 53,000 | 53,322 | ||||||||||||
|
| |||||||||||||||
The accompanying notes are an integral part of these financial statements.
Table of Contents
| 22 | Wells Fargo Advantage VT Total Return Bond Fund | Portfolio of investments—June 30, 2015 (unaudited) |
| Security name | Interest rate | Maturity date | Principal | Value | ||||||||||||
Consumer Staples: 0.51% | ||||||||||||||||
| Beverages: 0.20% | ||||||||||||||||
Pernod Ricard SA 144A | 5.75 | % | 4-7-2021 | $ | 150,000 | $ | 168,717 | |||||||||
|
| |||||||||||||||
| Tobacco: 0.31% | ||||||||||||||||
BAT International Finance plc 144A | 2.75 | 6-15-2020 | 145,000 | 145,959 | ||||||||||||
BAT International Finance plc 144A | 3.95 | 6-15-2025 | 125,000 | 126,224 | ||||||||||||
| 272,183 | ||||||||||||||||
|
| |||||||||||||||
Energy: 1.04% | ||||||||||||||||
| Energy Equipment & Services: 0.08% | ||||||||||||||||
Ensco plc « | 5.20 | 3-15-2025 | 25,000 | 24,716 | ||||||||||||
TransCanada Trust ± | 5.63 | 5-20-2075 | 45,000 | 45,394 | ||||||||||||
| 70,110 | ||||||||||||||||
|
| |||||||||||||||
| Oil, Gas & Consumable Fuels: 0.96% | ||||||||||||||||
Canadian Oil Sands Trust Limited 144A | 6.00 | 4-1-2042 | 60,000 | 53,798 | ||||||||||||
Ecopetrol SA | 5.38 | 6-26-2026 | 85,000 | 84,150 | ||||||||||||
Ecopetrol SA | 5.88 | 5-28-2045 | 45,000 | 39,713 | ||||||||||||
Ecopetrol SA | 7.38 | 9-18-2043 | 45,000 | 47,169 | ||||||||||||
Petrobras Global Finance BV | 4.88 | 3-17-2020 | 100,000 | 95,084 | ||||||||||||
Petrobras Global Finance BV | 6.25 | 3-17-2024 | 30,000 | 28,964 | ||||||||||||
Petrobras Global Finance BV | 7.25 | 3-17-2044 | 20,000 | 18,589 | ||||||||||||
Petroleos Mexicanos Company | 2.38 | 4-15-2025 | 120,000 | 121,007 | ||||||||||||
Petroleos Mexicanos Company 144A | 4.50 | 1-23-2026 | 40,000 | 39,096 | ||||||||||||
Petroleos Mexicanos Company 144A | 5.63 | 1-23-2046 | 65,000 | 60,691 | ||||||||||||
Statoil ASA | 2.90 | 11-8-2020 | 95,000 | 97,335 | ||||||||||||
Talisman Energy Incorporated | 3.75 | 2-1-2021 | 65,000 | 64,286 | ||||||||||||
Weatherford International Limited | 4.50 | 4-15-2022 | 45,000 | 42,212 | ||||||||||||
Weatherford International Limited | 5.95 | 4-15-2042 | 60,000 | 50,573 | ||||||||||||
| 842,667 | ||||||||||||||||
|
| |||||||||||||||
Financials: 1.89% | ||||||||||||||||
| Banks: 1.45% | ||||||||||||||||
Barclays plc | 3.65 | 3-16-2025 | 200,000 | 189,160 | ||||||||||||
Credit Agricole SA 144A | 4.38 | 3-17-2025 | 200,000 | 191,584 | ||||||||||||
DNB Boligkreditt AS 144A | 2.00 | 5-28-2021 | 200,000 | 198,136 | ||||||||||||
ING Bank NV 144A | 5.80 | 9-25-2023 | 90,000 | 98,149 | ||||||||||||
Japan Bank for International Cooperation | 1.75 | 5-28-2020 | 200,000 | 198,114 | ||||||||||||
Lloyds TSB Bank plc | 3.50 | 5-14-2025 | 100,000 | 98,030 | ||||||||||||
Stadshypotek AB 144A | 1.75 | 4-9-2020 | 305,000 | 300,534 | ||||||||||||
| 1,273,707 | ||||||||||||||||
|
| |||||||||||||||
| Consumer Finance: 0.24% | ||||||||||||||||
Volkswagen International Finance NV 144A | 1.13 | 11-18-2016 | 210,000 | 210,277 | ||||||||||||
|
| |||||||||||||||
| Diversified Financial Services: 0.15% | ||||||||||||||||
Shell International Finance BV | 2.13 | 5-11-2020 | 70,000 | 69,835 | ||||||||||||
Shell International Finance BV | 4.13 | 5-11-2035 | 45,000 | 43,913 | ||||||||||||
The accompanying notes are an integral part of these financial statements.
Table of Contents
| Portfolio of investments—June 30, 2015 (unaudited) | Wells Fargo Advantage VT Total Return Bond Fund | 23 |
| Security name | Interest rate | Maturity date | Principal | Value | ||||||||||||
| Diversified Financial Services (continued) | ||||||||||||||||
Shell International Finance BV | 4.38 | % | 5-11-2045 | $ | 15,000 | $ | 14,749 | |||||||||
| 128,497 | ||||||||||||||||
|
| |||||||||||||||
| Insurance: 0.05% | ||||||||||||||||
AON Corporation | 4.75 | 5-15-2045 | 45,000 | 43,217 | ||||||||||||
|
| |||||||||||||||
Health Care: 0.30% | ||||||||||||||||
| Pharmaceuticals: 0.30% | ||||||||||||||||
Actavis Funding SCS | 2.35 | 3-12-2018 | 70,000 | 70,372 | ||||||||||||
Actavis Funding SCS | 3.00 | 3-12-2020 | 90,000 | 90,244 | ||||||||||||
Actavis Funding SCS | 3.80 | 3-15-2025 | 35,000 | 34,329 | ||||||||||||
Actavis Funding SCS | 4.75 | 3-15-2045 | 75,000 | 71,091 | ||||||||||||
| 266,036 | ||||||||||||||||
|
| |||||||||||||||
Industrials: 0.18% | ||||||||||||||||
| Aerospace & Defense: 0.05% | ||||||||||||||||
Embraer Netherlands Finance BV | 5.05 | 6-15-2025 | 45,000 | 45,000 | ||||||||||||
|
| |||||||||||||||
| Electrical Equipment: 0.13% | ||||||||||||||||
Siemens Financieringsmaatschappij NV 144A | 2.15 | 5-27-2020 | 70,000 | 69,065 | ||||||||||||
Siemens Financieringsmaatschappij NV 144A | 3.25 | 5-27-2025 | 45,000 | 44,138 | ||||||||||||
| 113,203 | ||||||||||||||||
|
| |||||||||||||||
Materials: 0.35% | ||||||||||||||||
| Chemicals: 0.09% | ||||||||||||||||
LYB International Finance BV | 4.88 | 3-15-2044 | 40,000 | 38,725 | ||||||||||||
LyondellBasell Industries NV | 4.63 | 2-26-2055 | 40,000 | 35,087 | ||||||||||||
| 73,812 | ||||||||||||||||
|
| |||||||||||||||
| Metals & Mining: 0.26% | ||||||||||||||||
Barrick Gold Corporation | 4.10 | 5-1-2023 | 45,000 | 43,705 | ||||||||||||
Rio Tinto Finance USA Limited | 3.75 | 6-15-2025 | 85,000 | 83,678 | ||||||||||||
Teck Resources Limited | 3.75 | 2-1-2023 | 35,000 | 30,071 | ||||||||||||
Xstrata Finance Canada 144A | 2.05 | 10-23-2015 | 71,000 | 71,182 | ||||||||||||
| 228,636 | ||||||||||||||||
|
| |||||||||||||||
Telecommunication Services: 0.27% | ||||||||||||||||
| Wireless Telecommunication Services: 0.27% | ||||||||||||||||
America Movil SAB de CV | 3.13 | 7-16-2022 | 235,000 | 231,860 | ||||||||||||
|
| |||||||||||||||
Total Yankee Corporate Bonds and Notes (Cost $4,210,034) | 4,123,602 | |||||||||||||||
|
| |||||||||||||||
Yankee Government Bonds: 1.41% | ||||||||||||||||
Hashemite Kingdom of Jordan | 2.58 | 6-30-2022 | 201,000 | 202,005 | ||||||||||||
Province of Ontario | 1.88 | 5-21-2020 | 125,000 | 124,491 | ||||||||||||
Republic of Paraguay 144A | �� | 6.10 | 8-11-2044 | 100,000 | 101,250 | |||||||||||
Republic of Slovenia 144A | 5.25 | 2-18-2024 | 200,000 | 218,000 | ||||||||||||
Slovak Republic 144A | 4.38 | 5-21-2022 | 375,000 | 408,873 | ||||||||||||
The accompanying notes are an integral part of these financial statements.
Table of Contents
| 24 | Wells Fargo Advantage VT Total Return Bond Fund | Portfolio of investments—June 30, 2015 (unaudited) |
| Security name | Interest rate | Maturity date | Principal | Value | ||||||||||||
Yankee Government Bonds (continued) | ||||||||||||||||
United Mexican States | 5.75 | % | 10-12-2049 | $ | 185,000 | $ | 182,225 | |||||||||
Total Yankee Government Bonds (Cost $1,192,706) | 1,236,844 | |||||||||||||||
|
| |||||||||||||||
| Yield | Shares | |||||||||||||||
| Short-Term Investments: 3.97% | ||||||||||||||||
| Investment Companies: 3.97% | ||||||||||||||||
Securities Lending Cash Investments, LLC (l)(r)(u) | 0.13 | 24,411 | 24,411 | |||||||||||||
Wells Fargo Advantage Cash Investment Money Market Fund, Select Class ##(l)(u) | 0.12 | 3,444,333 | 3,444,333 | |||||||||||||
Total Short-Term Investments (Cost $3,468,744) | 3,468,744 | |||||||||||||||
|
| |||||||||||||||
| Total investments in securities (Cost $97,358,018) * | 111.39 | % | 97,389,502 | |||||
Other assets and liabilities, net | (11.39 | ) | (9,959,613 | ) | ||||
|
|
|
| |||||
| Total net assets | 100.00 | % | $ | 87,429,889 | ||||
|
|
|
|
| ± | Variable rate investment. The rate shown is the rate in effect at period end. |
| (a) | The security is fair valued in accordance with procedures approved by the Board of Trustees. |
| %% | The security is issued on a when-issued basis. |
| ¤ | The security is issued in zero coupon form with no periodic interest payments. |
| 144A | The security may be resold in transactions exempt from registration, normally to qualified institutional buyers, pursuant to Rule 144A under the Securities Act of 1933. |
| ## | All or a portion of this security is segregated for when-issued securities. |
| « | All or a portion of this security is on loan. |
| (l) | The security represents an affiliate of the Fund as defined in the Investment Company Act of 1940. |
| (r) | The investment is a non-registered investment vehicle purchased with cash collateral received from securities on loan. |
| (u) | The rate represents the 7-day annualized yield at period end. |
| * | Cost for federal income tax purposes is $97,597,464 and unrealized gains (losses) consists of: |
Gross unrealized gains | $ | 755,481 | ||
Gross unrealized losses | (963,443 | ) | ||
|
| |||
Net unrealized losses | $ | (207,962 | ) |
The accompanying notes are an integral part of these financial statements.
Table of Contents
| Statement of assets and liabilities—June 30, 2015 (unaudited) | Wells Fargo Advantage VT Total Return Bond Fund | 25 |
Assets | ||||
Investments | ||||
In unaffiliated securities (including $23,921 of securities loaned), at value (cost $93,889,274) | $ | 93,920,758 | ||
In affiliated securities, at value (cost $3,468,744) | 3,468,744 | |||
|
| |||
Total investments, at value (cost $97,358,018) | 97,389,502 | |||
Receivable for investments sold | 16,447,429 | |||
Principal paydown receivable | 1,613 | |||
Receivable for Fund shares sold | 101,414 | |||
Receivable for interest | 382,534 | |||
Receivable for securities lending income | 8 | |||
Prepaid expenses and other assets | 2,730 | |||
|
| |||
Total assets | 114,325,230 | |||
|
| |||
Liabilities | ||||
Payable for investments purchased | 26,710,719 | |||
Payable for Fund shares redeemed | 66,725 | |||
Payable upon receipt of securities loaned | 24,411 | |||
Advisory fee payable | 25,293 | |||
Distribution fee payable | 18,054 | |||
Administration fee payable | 9,388 | |||
Accrued expenses and other liabilities | 40,751 | |||
|
| |||
Total liabilities | 26,895,341 | |||
|
| |||
Total net assets | $ | 87,429,889 | ||
|
| |||
NET ASSETS CONSIST OF | ||||
Paid-in capital | $ | 90,187,216 | ||
Undistributed net investment income | 13,543 | |||
Accumulated net realized losses on investments | (2,802,354 | ) | ||
Net unrealized gains on investments | 31,484 | |||
|
| |||
Total net assets | $ | 87,429,889 | ||
|
| |||
COMPUTATION OF NET ASSET VALUE PER SHARE | ||||
Net assets – Class 2 | $ | 87,429,889 | ||
Shares outstanding – Class 21 | 8,381,356 | |||
Net asset value per share – Class 2 | $10.43 | |||
| 1 | The Fund has an unlimited number of authorized shares. |
The accompanying notes are an integral part of these financial statements.
Table of Contents
| 26 | Wells Fargo Advantage VT Total Return Bond Fund | Statement of operations—six months ended June 30, 2015 (unaudited) |
Investment income | ||||
Interest (net of foreign interest withholding taxes of $118) | $ | 946,216 | ||
Income from affiliated securities | 2,015 | |||
Securities lending income, net | 66 | |||
|
| |||
Total investment income | 948,297 | |||
|
| |||
Expenses | ||||
Advisory fee | 178,075 | |||
Administration fee | 57,874 | |||
Distribution fee | ||||
Class 2 | 111,297 | |||
Custody and accounting fees | 26,003 | |||
Professional fees | 23,057 | |||
Shareholder report expenses | 11,398 | |||
Trustees’ fees and expenses | 6,968 | |||
Other fees and expenses | 4,169 | |||
|
| |||
Total expenses | 418,841 | |||
Less: Fee waivers and/or expense reimbursements | (18,173 | ) | ||
|
| |||
Net expenses | 400,668 | |||
|
| |||
Net investment income | 547,629 | |||
|
| |||
REALIZED AND UNREALIZED GAINS (LOSSES) ON INVESTMENTS | ||||
Net realized gains on investments | 603,581 | |||
Net change in unrealized gains (losses) on investments | (1,309,358 | ) | ||
|
| |||
Net realized and unrealized gains (losses) on investments | (705,777 | ) | ||
|
| |||
Net decrease in net assets resulting from operations | $ | (158,148 | ) | |
|
| |||
The accompanying notes are an integral part of these financial statements.
Table of Contents
| Statement of changes in net assets | Wells Fargo Advantage VT Total Return Bond Fund | 27 |
Six months ended June 30, 2015 (unaudited) | Year ended December 31, 2014 | |||||||||||||||
Operations | ||||||||||||||||
Net investment income | $ | 547,629 | $ | 1,192,314 | ||||||||||||
Net realized gains on investments | 603,581 | 1,761,202 | ||||||||||||||
Net change in unrealized gains (losses) on investments | (1,309,358 | ) | 2,039,702 | |||||||||||||
|
| |||||||||||||||
Net increase (decrease) in net assets resulting from operations | (158,148 | ) | 4,993,218 | |||||||||||||
|
| |||||||||||||||
Distributions to shareholders from | ||||||||||||||||
Net investment income – Class 2 | (547,873 | ) | (1,240,908 | ) | ||||||||||||
|
| |||||||||||||||
Capital share transactions | Shares | Shares | ||||||||||||||
Proceeds from shares sold – Class 2 | 513,307 | 5,453,265 | 1,245,757 | 12,903,246 | ||||||||||||
Reinvestment of distributions – Class 2 | 51,983 | 547,873 | 119,606 | 1,240,908 | ||||||||||||
Payment for shares redeemed – Class 2 | (738,001 | ) | (7,801,752 | ) | (1,765,773 | ) | (18,312,667 | ) | ||||||||
|
| |||||||||||||||
Net decrease in net assets resulting from capital share transactions | (1,800,614 | ) | (4,168,513 | ) | ||||||||||||
|
| |||||||||||||||
Total decrease in net assets | (2,506,635 | ) | (416,203 | ) | ||||||||||||
|
| |||||||||||||||
Net assets | ||||||||||||||||
Beginning of period | 89,936,524 | 90,352,727 | ||||||||||||||
|
| |||||||||||||||
End of period | $ | 87,429,889 | $ | 89,936,524 | ||||||||||||
|
| |||||||||||||||
Undistributed net investment income | $ | 13,543 | $ | 13,787 | ||||||||||||
|
| |||||||||||||||
The accompanying notes are an integral part of these financial statements.
Table of Contents
| 28 | Wells Fargo Advantage VT Total Return Bond Fund | Financial highlights |
(For a share outstanding throughout each period)
Six months ended (unaudited) | Year ended December 31 | |||||||||||||||||||||||
| CLASS 2 | 2014 | 2013 | 2012 | 2011 | 20101 | |||||||||||||||||||
Net asset value, beginning of period | $10.51 | $10.09 | $10.82 | $10.54 | $10.41 | $10.34 | ||||||||||||||||||
Net investment income | 0.06 | 0.14 | 0.12 | 0.15 | 0.22 | 0.29 | ||||||||||||||||||
Net realized and unrealized gains (losses) on investments | (0.08 | ) | 0.42 | (0.38 | ) | 0.48 | 0.62 | 0.43 | ||||||||||||||||
|
|
|
|
|
|
|
|
|
|
|
| |||||||||||||
Total from investment operations | (0.02 | ) | 0.56 | (0.26 | ) | 0.63 | 0.84 | 0.72 | ||||||||||||||||
Distributions to shareholders from | ||||||||||||||||||||||||
Net investment income | (0.06 | ) | (0.14 | ) | (0.13 | ) | (0.15 | ) | (0.28 | ) | (0.36 | ) | ||||||||||||
Net realized gains | 0.00 | 0.00 | (0.34 | ) | (0.20 | ) | (0.43 | ) | (0.29 | ) | ||||||||||||||
|
|
|
|
|
|
|
|
|
|
|
| |||||||||||||
Total distributions to shareholders | (0.06 | ) | (0.14 | ) | (0.47 | ) | (0.35 | ) | (0.71 | ) | (0.65 | ) | ||||||||||||
Net asset value, end of period | $10.43 | $10.51 | $10.09 | $10.82 | $10.54 | $10.41 | ||||||||||||||||||
Total return2 | (0.15 | )% | 5.59 | % | (2.43 | )% | 6.10 | % | 8.31 | % | 7.04 | % | ||||||||||||
Ratios to average net assets (annualized) | ||||||||||||||||||||||||
Gross expenses | 0.94 | % | 0.92 | % | 0.93 | % | 0.94 | % | 0.91 | % | 0.91 | % | ||||||||||||
Net expenses | 0.90 | % | 0.90 | % | 0.90 | % | 0.90 | % | 0.88 | % | 0.86 | % | ||||||||||||
Net investment income | 1.23 | % | 1.31 | % | 1.19 | % | 1.37 | % | 2.09 | % | 2.76 | % | ||||||||||||
Supplemental data | ||||||||||||||||||||||||
Portfolio turnover rate | 293 | % | 593 | % | 613 | % | 574 | % | 843 | % | 838 | % | ||||||||||||
Net assets, end of period (000s omitted) | $87,430 | $89,937 | $90,353 | $91,858 | $87,138 | $85,416 | ||||||||||||||||||
| 1 | After the close of business of July 16, 2010, existing shares of the Fund were renamed Class 2 shares. |
| 2 | Returns for periods of less than one year are not annualized. |
The accompanying notes are an integral part of these financial statements.
Table of Contents
| Notes to financial statements (unaudited) | Wells Fargo Advantage VT Total Return Bond Fund | 29 |
1. ORGANIZATION
Wells Fargo Variable Trust (the “Trust”), a Delaware statutory trust organized on March 10, 1999, is an open-end management investment company registered under the Investment Company Act of 1940, as amended (the “1940 Act”). As an investment company, the Trust follows the accounting and reporting guidance in Financial Accounting Standards Board (“FASB”) Accounting Standards Codification Topic 946, Financial Services—Investment Companies. These financial statements report on the Wells Fargo Advantage VT Total Return Bond Fund (the “Fund”) which is a diversified series of the Trust.
2. SIGNIFICANT ACCOUNTING POLICIES
The following significant accounting policies, which are consistently followed in the preparation of the financial statements of the Fund, are in conformity with U.S. generally accepted accounting principles which require management to make estimates and assumptions that affect the reported amounts of assets and liabilities, disclosure of contingent assets and liabilities at the date of the financial statements, and the reported amounts of revenues and expenses during the reporting period. Actual results could differ from those estimates.
Securities valuation
All investments are valued each business day as of the close of regular trading on the New York Stock Exchange (generally 4 p.m. Eastern Time).
Debt securities are valued at the evaluated bid price provided by an independent pricing service or, if a reliable price is not available, the quoted bid price from an independent broker-dealer.
Investments in registered open-end investment companies are valued at net asset value. Interests in non-registered investment vehicles that are redeemable at net asset value are fair valued at net asset value when available.
Investments which are not valued using any of the methods discussed above are valued at their fair value, as determined in good faith by the Board of Trustees of the Fund. The Board of Trustees has established a Valuation Committee comprised of the Trustees and has delegated to it the authority to take any actions regarding the valuation of portfolio securities that the Valuation Committee deems necessary or appropriate, including determining the fair value of portfolio securities, unless the determination has been delegated to the Management Valuation Team of Wells Fargo Funds Management, LLC (“Funds Management”). The Board of Trustees retains the authority to make or ratify any valuation decisions or approve any changes to the Valuation Procedures as it deems appropriate. On a quarterly basis, the Board of Trustees receives reports on any valuation actions taken by the Valuation Committee or the Management Valuation Team which may include items for ratification.
Valuations of fair valued securities are compared to the next actual sales price when available, or other appropriate market values, to assess the continued appropriateness of the fair valuation methodologies used. These securities are fair valued on a day-to-day basis, taking into consideration changes to appropriate market information and any significant changes to the inputs considered in the valuation process until there is a readily available price provided on an exchange or by an independent pricing service. Valuations received from an independent pricing service or independent broker-dealer quotes are periodically validated by comparisons to most recent trades and valuations provided by other independent pricing services in addition to the review of prices by the adviser and/or subadviser. Unobservable inputs used in determining fair valuations are identified based on the type of security, taking into consideration factors utilized by market participants in valuing the investment, knowledge about the issuer and the current market environment.
Security loans
The Fund may lend its securities from time to time in order to earn additional income in the form of fees or interest on securities received as collateral or the investment of any cash received as collateral. The Fund continues to receive interest or dividends on the securities loaned. The Fund receives collateral in the form of cash or securities with a value at least equal to the value of the securities on loan. The value of the loaned securities is determined at the close of each business day and any additional required collateral is delivered to the Fund on the next business day. In a securities lending transaction, the net asset value of the Fund will be affected by an increase or decrease in the value of the securities loaned and by an increase or decrease in the value of the instrument in which collateral is invested. The amount of securities lending activity undertaken by the Fund fluctuates from time to time. In the event of default or bankruptcy by the borrower, the Fund may be prevented from recovering the loaned securities or gaining access to the collateral or may experience delays or costs in doing so. In addition, the investment of any cash collateral received may lose all or part of its value. The Fund has the right under the lending agreement to recover the securities from the borrower on demand.
Table of Contents
| 30 | Wells Fargo Advantage VT Total Return Bond Fund | Notes to financial statements (unaudited) |
The Fund lends its securities through an unaffiliated securities lending agent. Cash collateral received in connection with its securities lending transactions is invested in Securities Lending Cash Investments, LLC (the “Securities Lending Fund”). The Securities Lending Fund is exempt from registration under Section 3(c)(7) of the 1940 Act and is managed by Funds Management and is subadvised by Wells Capital Management Incorporated (“WellsCap”). Funds Management receives an advisory fee starting at 0.05% and declining to 0.01% as the average daily net assets of the Securities Lending Fund increase. All of the fees received by Funds Management are paid to WellsCap for its services as subadviser. The Securities Lending Fund seeks to provide a positive return compared to the daily Fed Funds Open rate by investing in high-quality, U.S. dollar-denominated short-term money market instruments. Securities Lending Fund investments are fair valued based upon the amortized cost valuation technique. Income earned from investment in the Securities Lending Fund is included in securities lending income on the Statement of Operations.
When-issued transactions
The Fund may purchase securities on a forward commitment or when-issued basis. The Fund records a when-issued transaction on the trade date and will segregate assets in an amount at least equal in value to the Fund’s commitment to purchase when-issued securities. Securities purchased on a when-issued basis are marked-to-market daily and the Fund begins earning interest on the settlement date. Losses may arise due to changes in the market value of the underlying securities or if the counterparty does not perform under the contract.
TBA sale commitments
The Fund may enter into To Be Announced (“TBA”) sale commitments to hedge its portfolio positions or to sell mortgage-backed securities it owns under delayed delivery arrangements. Proceeds of TBA sale commitments are not received until the contractual settlement date. During the time a TBA sale commitment is outstanding, equivalent deliverable securities or offsetting TBA purchase commitments, which are deliverable on or before the sale commitment date, are held as “cover” for the transaction. Unsettled TBA sale commitments are valued at the current market value of the underlying securities, according to the procedures described under “Securities valuation”. The contract is marked-to-market daily and the change in market value is recorded by the Fund as an unrealized gain or loss. If the TBA sale commitment is closed through the acquisition of an offsetting purchase commitment, the Fund realizes a gain or loss. If the Fund delivers securities under the commitment, the Fund realizes a gain or a loss from the sale of the securities based upon the unit price established at the date the commitment was entered into.
Mortgage dollar roll transactions
The Fund may engage in mortgage dollar roll transactions through TBA mortgage-backed securities issued by Government National Mortgage Association (GNMA), Federal National Mortgage Association (FNMA) and Federal Home Loan Mortgage Corporation (FHLMC). In a mortgage dollar roll transaction, the Fund sells a mortgage-backed security to a financial institution, such as a bank or broker-dealer and simultaneously agrees to repurchase a substantially similar security from the institution at a later date at an agreed upon price. The mortgage-backed securities that are repurchased will bear the same interest rate as those sold, but generally will be collateralized by different pools of mortgages with different pre-payment histories. During the roll period, the Fund foregoes principal and interest paid on the securities. The Fund is compensated by the difference between the current sales price and the forward price for the future purchase as well as by the earnings on the cash proceeds of the initial sale. Mortgage dollar rolls may be renewed without physical delivery of the securities subject to the contract. The Fund accounts for TBA dollar roll transactions as purchases and sales which, as a result, may increase its portfolio turnover rate.
Security transactions and income recognition
Securities transactions are recorded on a trade date basis. Realized gains or losses are recorded on the basis of identified cost.
Interest income is accrued daily and bond discounts are accreted and premiums are amortized daily based on the effective interest method. To the extent debt obligations are placed on non-accrual status, any related interest income may be reduced by writing off interest receivables when the collection of all or a portion of interest has become doubtful based on consistently applied procedures. If the issuer subsequently resumes interest payments or when the collectability of interest is reasonably assured, the debt obligation is removed from non-accrual status.
Income is recorded net of foreign taxes withheld where recovery of such taxes is not assured.
Distributions to shareholders
Distributions to shareholders from net investment income are accrued daily and paid monthly. Distributions from net realized gains, if any, are recorded on the ex-dividend date. Such distributions are determined in conformity with federal income tax regulations, which may differ in amount or character from net investment income and realized gains recognized for purposes of U.S. generally accepted accounting principles.
Table of Contents
| Notes to financial statements (unaudited) | Wells Fargo Advantage VT Total Return Bond Fund | 31 |
Federal and other taxes
The Fund intends to continue to qualify as a regulated investment company by distributing substantially all of its investment company taxable income and any net realized capital gains (after reduction for capital loss carryforwards) sufficient to relieve it from all, or substantially all, federal income taxes. Accordingly, no provision for federal income taxes was required.
The Fund’s income and federal excise tax returns and all financial records supporting those returns for the prior three fiscal years are subject to examination by the federal and Delaware revenue authorities. Management has analyzed the Fund’s tax positions taken on federal, state, and foreign tax returns for all open tax years and does not believe that there are any uncertain tax positions that require recognition of a tax liability.
As of December 31, 2014, the Fund had capital loss carryforwards available to offset future net realized capital gains in the amount of $3,283,804 expiring in 2016.
3. FAIR VALUATION MEASUREMENTS
Fair value measurements of investments are determined within a framework that has established a fair value hierarchy based upon the various data inputs utilized in determining the value of the Fund’s investments. The three-level hierarchy gives the highest priority to unadjusted quoted prices in active markets for identical assets or liabilities (Level 1) and the lowest priority to significant unobservable inputs (Level 3). The Fund’s investments are classified within the fair value hierarchy based on the lowest level of input that is significant to the fair value measurement. The inputs are summarized into three broad levels as follows:
| n | Level 1 – quoted prices in active markets for identical securities |
| n | Level 2 – other significant observable inputs (including quoted prices for similar securities, interest rates, prepayment speeds, credit risk, use of amortized cost, etc.) |
| n | Level 3 – significant unobservable inputs (including the Fund’s own assumptions in determining the fair value of investments) |
The inputs or methodologies used for valuing investments in securities are not necessarily an indication of the risk associated with investing in those securities.
The following is a summary of the inputs used in valuing the Fund’s assets and liabilities as of June 30, 2015:
Quoted prices (Level 1) | Other significant observable inputs (Level 2) | Significant unobservable inputs (Level 3) | Total | |||||||||||||
Assets | ||||||||||||||||
Investments in: | ||||||||||||||||
Agency securities | $ | 0 | $ | 27,871,403 | $ | 0 | $ | 27,871,403 | ||||||||
Asset-backed securities | 0 | 12,878,195 | 0 | 12,878,195 | ||||||||||||
Corporate bonds and notes | 0 | 15,896,926 | 0 | 15,896,926 | ||||||||||||
Municipal obligations | 0 | 867,729 | 0 | 867,729 | ||||||||||||
Non-agency mortgage-backed securities | 0 | 4,651,278 | 0 | 4,651,278 | ||||||||||||
U.S. Treasury securities | 26,394,781 | 0 | 0 | 26,394,781 | ||||||||||||
Yankee corporate bonds and notes | 0 | 4,123,602 | 0 | 4,123,602 | ||||||||||||
Yankee government bonds | 0 | 1,236,844 | 0 | 1,236,844 | ||||||||||||
Short-term investments | ||||||||||||||||
Investment companies | 3,444,333 | 24,411 | 0 | 3,468,744 | ||||||||||||
Total assets | $ | 29,839,114 | $ | 67,550,388 | $ | 0 | $ | 97,389,502 | ||||||||
The Fund recognizes transfers between levels within the fair value hierarchy at the end of the reporting period. At June 30, 2015, the Fund did not have any transfers into/out of Level 1, Level 2, or Level 3.
Table of Contents
| 32 | Wells Fargo Advantage VT Total Return Bond Fund | Notes to financial statements (unaudited) |
4. TRANSACTIONS WITH AFFILIATES
Advisory fee
The Trust has entered into an advisory contract with Funds Management, an indirect wholly owned subsidiary of Wells Fargo & Company (“Wells Fargo”). The adviser is responsible for implementing investment policies and guidelines and for supervising the subadviser, who is responsible for day-to-day portfolio management of the Fund.
Pursuant to the contract, Funds Management is entitled to receive an annual advisory fee starting at 0.40% and declining to 0.30% as the average daily net assets of the Fund increase. For the six months ended June 30, 2015, the advisory fee was equivalent to an annual rate of 0.40% of the Fund’s average daily net assets.
Funds Management has retained the services of a subadviser to provide daily portfolio management to the Fund. The fee for subadvisory services is borne by Funds Management. WellsCap, an affiliate of Funds Management and an indirect wholly owned subsidiary of Wells Fargo, is the subadviser to the Fund and is entitled to receive a fee from Funds Management at an annual rate starting at 0.20% and declining to 0.10% as the average daily net assets of the Fund increase.
Administration fee
The Trust has entered into an administration agreement with Funds Management. Under this agreement, for providing administrative services, which includes paying fees and expenses for services provided by the transfer agent, sub-transfer agents, omnibus account servicers and record-keepers, Funds Management is entitled to receive from the Fund an annual administration fee starting at 0.13% and declining to 0.11% as the average daily net assets of the Fund increase.
Funds Management has contractually waived and/or reimbursed advisory and administration fees to the extent necessary to maintain certain net operating expense ratios for the Fund. Waiver of fees and/or reimbursement of expenses by Funds Management were made first from fund level expenses on a proportionate basis and then from class specific expenses. Funds Management has committed through April 30, 2016 to waive fees and/or reimburse expenses to the extent necessary to cap the Fund’s expenses at 0.90% for Class 2 shares. After this time, the cap may be increased or the commitment to maintain the cap may be terminated only with the approval of the Board of Trustees.
Distribution fee
The Trust has adopted a Distribution Plan for Class 2 shares of the Fund pursuant to Rule 12b-1 under the 1940 Act. A distribution fee is charged to Class 2 shares and paid to Wells Fargo Funds Distributor, LLC, the principal underwriter, at an annual rate of 0.25% of the average daily net assets of Class 2 shares.
5. INVESTMENT PORTFOLIO TRANSACTIONS
Purchases and sales of investments, excluding short-term securities, for the six months ended June 30, 2015 were as follows:
Purchases at cost | Sales proceeds | |||||
U.S. government | Non-U.S. government | U.S. government | Non-U.S. government | |||
| $240,570,351 | $43,150,051 | $240,890,958 | $42,550,526 | |||
6. BANK BORROWINGS
The Trust and Wells Fargo Funds Trust (excluding the money market funds and certain other funds) are parties to a $150,000,000 revolving credit agreement whereby the Fund is permitted to use bank borrowings for temporary or emergency purposes, such as to fund shareholder redemption requests. Interest under the credit agreement is charged to the Fund based on a borrowing rate equal to the higher of the Federal Funds rate in effect on that day plus 1.25% or the overnight LIBOR rate in effect on that day plus 1.25%. In addition, an annual commitment fee equal to 0.10% of the unused balance is allocated to each participating fund. For the six months ended June 30, 2015, the Fund paid $49 in commitment fees.
For the six months ended June 30, 2015, there were no borrowings by the Fund under the agreement.
7. INDEMNIFICATION
Under the Trust’s organizational documents, the officers and Trustees have been granted certain indemnification rights against certain liabilities that may arise out of performance of their duties to the Trust. Additionally, in the normal course of business, the Trust may enter into contracts with service providers that contain a variety of indemnification clauses. The Trust’s maximum exposure under these arrangements is dependent on future claims that may be made against the Fund and, therefore, cannot be estimated.
Table of Contents
| Other information (unaudited) | Wells Fargo Advantage VT Total Return Bond Fund | 33 |
PROXY VOTING INFORMATION
A description of the policies and procedures that the Fund uses to determine how to vote proxies relating to portfolio securities is available, upon request, by calling 1-800-222-8222, visiting our website at wellsfargoadvantagefunds.com, or visiting the SEC website at sec.gov. Information regarding how the Fund voted proxies relating to portfolio securities during the most recent 12-month period ended June 30 is available on the Fund’s website at wellsfargoadvantagefunds.com or by visiting the SEC website at sec.gov.
PORTFOLIO HOLDINGS INFORMATION
The complete portfolio holdings for the Fund are publicly available monthly on the Fund’s website (wellsfargoadvantagefunds.com), on a one-month delayed basis. In addition, top ten holdings information (excluding derivative positions) for the Fund is publicly available on the Fund’s website on a monthly, seven-day or more delayed basis. The Fund files its complete schedule of portfolio holdings with the SEC for the first and third quarters of each fiscal year on Form N-Q, which is available by visiting the SEC website at sec.gov. In addition, the Fund’s Form N-Q may be reviewed and copied at the SEC’s Public Reference Room in Washington, DC, and at regional offices in New York City, at 233 Broadway, and in Chicago, at 175 West Jackson Boulevard, Suite 900. Information about the Public Reference Room may be obtained by calling 1-800-SEC-0330.
Table of Contents
| 34 | Wells Fargo Advantage VT Total Return Bond Fund | Other information (unaudited) |
BOARD OF TRUSTEES AND OFFICERS
Each of the Trustees and Officers1 listed in the table below acts in identical capacities for each fund in the Wells Fargo Advantage family of funds, which consists of 134 mutual funds comprising the Wells Fargo Funds Trust, Wells Fargo Variable Trust, Wells Fargo Master Trust and four closed-end funds (collectively the “Fund Complex”). This table should be read in conjunction with the Prospectus and the Statement of Additional Information2. The mailing address of each Trustee and Officer is 525 Market Street, 12th Floor, San Francisco, CA 94105. Each Trustee and Officer serves an indefinite term, however, each Trustee serves such term until reaching the mandatory retirement age established by the Trustees.
Independent Trustees
| Name and year of birth | Position held and length of service* | Principal occupations during past five years or longer | Other directorships during past five years | |||
| William R. Ebsworth (Born 1957) | Trustee, since 2015** | Retired. From 1984 to 2013, equities analyst, portfolio manager, research director at Fidelity Management and Research Company and retired in 2013 as Chief Investment Officer of Fidelity Strategic Advisers, Inc. in Boston, Tokyo, and Hong Kong where he led a team of investment professionals managing client assets. Prior thereto, Board member of Hong Kong Securities Clearing Co., Hong Kong Options Clearing Corp., the Thailand International Fund, Ltd., Fidelity Investments Life Insurance Company, and Empire Fidelity Investments Life Insurance Company. Mr. Ebsworth is an Adjunct Lecturer, Finance, at Babson College and a Chartered Financial Analyst. | Asset Allocation Trust | |||
| Jane A. Freeman (Born 1953) | Trustee, since 2015** | Retired. From 2012 to 2014 and 1999 to 2008, Chief Financial Officer of Scientific Learning Corporation. From 2008 to 2012, Ms. Freeman provided consulting services related to strategic business projects. Prior to 1999, Portfolio Manager at Rockefeller & Co. and Scudder, Stevens & Clark. Board member of the Harding Loevner Funds from 1996 to 2014, serving as both Lead Independent Director and chair of the Audit Committee. Board member of the Russell Exchange Traded Funds Trust from 2011 to 2012 and the chair of the Audit Committee. Ms. Freeman is a Chartered Financial Analyst (inactive), Chair of Taproot Foundation (non-profit organization) and a Board Member of Ruth Bancroft Garden (non-profit organization). | Asset Allocation Trust | |||
| Peter G. Gordon (Born 1942) | Trustee, since 1998; Chairman, since 2005 | Co-Founder, Retired Chairman, President and CEO of Crystal Geyser Water Company. Trustee Emeritus, Colby College. | Asset Allocation Trust | |||
| Isaiah Harris, Jr. (Born 1952) | Trustee, since 2009 | Retired. Chairman of the Board of CIGNA Corporation since 2009, and Director since 2005. From 2003 to 2011, Director of Deluxe Corporation. Prior thereto, President and CEO of BellSouth Advertising and Publishing Corp. from 2005 to 2007, President and CEO of BellSouth Enterprises from 2004 to 2005 and President of BellSouth Consumer Services from 2000 to 2003. Emeritus member of the Iowa State University Foundation Board of Governors. Emeritus Member of the Advisory Board of Iowa State University School of Business. Advisory Board Member, Palm Harbor Academy. Mr. Harris is a certified public accountant. | CIGNA Corporation; Asset Allocation Trust | |||
| Judith M. Johnson (Born 1949) | Trustee, since 2008; Audit Committee Chairman, since 2008 | Retired. Prior thereto, Chief Executive Officer and Chief Investment Officer of Minneapolis Employees Retirement Fund from 1996 to 2008. Ms. Johnson is an attorney, certified public accountant and a certified managerial accountant. | Asset Allocation Trust | |||
| David F. Larcker (Born 1950) | Trustee, since 2009 | James Irvin Miller Professor of Accounting at the Graduate School of Business, Stanford University, Morgan Stanley Director of the Center for Leadership Development and Research and Senior Faculty of The Rock Center for Corporate Governance since 2006. From 2005 to 2008, Professor of Accounting at the Graduate School of Business, Stanford University. Prior thereto, Ernst & Young Professor of Accounting at The Wharton School, University of Pennsylvania from 1985 to 2005. | Asset Allocation Trust | |||
| Olivia S. Mitchell (Born 1953) | Trustee, since 2006 | International Foundation of Employee Benefit Plans Professor, Wharton School of the University of Pennsylvania since 1993. Director of Wharton’s Pension Research Council and Boettner Center on Pensions & Retirement Research, and Research Associate at the National Bureau of Economic Research. Previously, Cornell University Professor from 1978 to 1993. | Asset Allocation Trust |
Table of Contents
| Other information (unaudited) | Wells Fargo Advantage VT Total Return Bond Fund | 35 |
| Name and year of birth | Position held and length of service* | Principal occupations during past five years or longer | Other directorships during past five years | |||
| Timothy J. Penny (Born 1951) | Trustee, since 1996 | President and Chief Executive Officer of Southern Minnesota Initiative Foundation, a non-profit organization, since 2007 and Senior Fellow at the Humphrey Institute Policy Forum at the University of Minnesota since 1995. Member of the Board of Trustees of NorthStar Education Finance, Inc., a non-profit organization, since 2007. | Asset Allocation Trust | |||
| Michael S. Scofield (Born 1943) | Trustee, since 2010 | Served on the Investment Company Institute’s Board of Governors and Executive Committee from 2008-2011 as well the Governing Council of the Independent Directors Council from 2006-2011 and the Independent Directors Council Executive Committee from 2008-2011. Chairman of the IDC from 2008-2010. Institutional Investor (Fund Directions) Trustee of Year in 2007. Trustee of the Evergreen Funds complex (and its predecessors) from 1984 to 2010. Chairman of the Evergreen Funds from 2000-2010. Former Trustee of the Mentor Funds. Retired Attorney, Law Offices of Michael S. Scofield. | Asset Allocation Trust | |||
| Donald C. Willeke (Born 1940) | Trustee, since 1996 | Principal of the law firm of Willeke & Daniels. General Counsel of the Minneapolis Employees Retirement Fund from 1984 until its consolidation into the Minnesota Public Employees Retirement Association on June 30, 2010. Director and Vice Chair of The Tree Trust (non-profit corporation). Director of the American Chestnut Foundation (non-profit corporation). | Asset Allocation Trust |
| * | Length of service dates reflect the Trustee’s commencement of service with the Trust’s predecessor entities, where applicable. |
| ** | William R. Ebsworth and Jane A. Freeman each became a Trustee effective January 1, 2015. |
Officers
| Name and year of birth | Position held and length of service | Principal occupations during past five years or longer | ||||
| Karla M. Rabusch (Born 1959) | President, since 2003 | Executive Vice President of Wells Fargo Bank, N.A. and President of Wells Fargo Funds Management, LLC since 2003. | ||||
| Jeremy DePalma1 (Born 1974) | Treasurer, since 2012 | Senior Vice President of Wells Fargo Funds Management, LLC since 2009. Senior Vice President of Evergreen Investment Management Company, LLC from 2008 to 2010. Vice President, Evergreen Investment Services, Inc. from 2004 to 2007. Head of the Fund Reporting and Control Team within Fund Administration from 2005 to 2010. | ||||
| C. David Messman (Born 1960) | Secretary, since 2000; Chief Legal Officer, since 2003 | Senior Vice President and Secretary of Wells Fargo Funds Management, LLC since 2001. Assistant General Counsel of Wells Fargo Bank, N.A. since 2013 and Vice President and Managing Counsel of Wells Fargo Bank N.A. from 1996 to 2013. | ||||
| Debra Ann Early (Born 1964) | Chief Compliance Officer, since 2007 | Senior Vice President of Wells Fargo Funds Management, LLC since 2007 and Chief Compliance Officer from 2007 to 2014. Chief Compliance Officer of Parnassus Investments from 2005 to 2007. Chief Financial Officer of Parnassus Investments from 2004 to 2007 and Senior Audit Manager of PricewaterhouseCoopers LLP from 1998 to 2004. | ||||
| David Berardi (Born 1975) | Assistant Treasurer, since 2009 | Vice President of Wells Fargo Funds Management, LLC since 2009. Vice President of Evergreen Investment Management Company, LLC from 2008 to 2010. Assistant Vice President of Evergreen Investment Services, Inc. from 2004 to 2008. Manager of Fund Reporting and Control for Evergreen Investment Management Company, LLC from 2004 to 2010. |
| 1 | Jeremy DePalma acts as Treasurer of 61 funds and Assistant Treasurer of 73 funds in the Fund Complex. |
| 2 | The Statement of Additional Information includes additional information about the Trustees and is available, without charge, upon request, by calling 1-800-222-8222 or by visiting the website at wellsfargoadvantagefunds.com. |
Table of Contents
| 36 | Wells Fargo Advantage VT Total Return Bond Fund | Other information (unaudited) |
BOARD CONSIDERATION OF INVESTMENT ADVISORY, INVESTMENT MANAGEMENT AND SUB-ADVISORY AGREEMENTS:
Under the Investment Company Act of 1940 (the “1940 Act”), the Board of Trustees (the “Board”) of Wells Fargo Variable Trust (the “Trust”) must determine annually whether to approve the continuation of the Trust’s investment advisory and sub-advisory agreements. In this regard, at an in-person meeting held on May 19-20, 2015 (the “Meeting”), the Board, all the members of which have no direct or indirect interest in the investment advisory and sub-advisory agreements and are not “interested persons” of the Trust, as defined in the 1940 Act (the “Independent Trustees”), reviewed and approved for Wells Fargo Advantage VT Total Return Bond Fund (the “Fund”): (i) an investment advisory agreement (the “Advisory Agreement”) with Wells Fargo Funds Management, LLC (“Funds Management”); (ii) an investment management agreement (the “Management Agreement”) with Funds Management; and (iii) an investment sub-advisory agreement (the “Sub-Advisory Agreement”) with Wells Capital Management Incorporated (the “Sub-Adviser”), an affiliate of Funds Management. The Management Agreement combines the terms of the Advisory Agreement with the terms of the Fund’s Amended and Restated Administration Agreement applicable to Fund-level administrative services (the “Administration Agreement”). The Advisory Agreement, the Management Agreement and the Sub-Advisory Agreement are collectively referred to as the “Advisory Agreements.”
At the Meeting, the Board considered the factors and reached the conclusions described below relating to the selection of Funds Management and the Sub-Adviser and the approval of the Advisory Agreements. Prior to the Meeting, including at an in-person meeting in March 2015, the Trustees conferred extensively among themselves and with representatives of Funds Management about these matters. Also, the Board has adopted a team-based approach, with each team consisting of a sub-set of Trustees, to assist the full Board in the discharge of its duties in reviewing performance and other matters throughout the year. The Independent Trustees were assisted in their evaluation of the Advisory Agreements by independent legal counsel, from whom they received separate legal advice and with whom they met separately.
In providing information to the Board, Funds Management and the Sub-Adviser were guided by a detailed set of requests for information submitted to them by independent legal counsel on behalf of the Independent Trustees at the start of the Board’s annual contract renewal process earlier in 2015. In considering and approving the Advisory Agreements, the Trustees considered the information they believed relevant, including but not limited to the information discussed below. The Board considered not only the specific information presented in connection with the Meeting, but also the knowledge gained over time through interaction with Funds Management and the Sub-Adviser about various topics. In this regard, the Board reviewed reports of Funds Management at each of its quarterly meetings, which included, among other things, portfolio reviews and performance reports. In addition, the Board and the teams mentioned above confer with portfolio managers at various times throughout the year. The Board did not identify any particular information or consideration that was all-important or controlling, and each individual Trustee may have attributed different weights to various factors.
After its deliberations, the Board unanimously approved the continuation of the Advisory Agreement for the period from June 1, 2015 through June 30, 2015, approved the Management Agreement for the period from July 1, 2015 through May 31, 2016, and approved the continuation of the Sub-Advisory Agreement for a one-year term through May 31, 2016. The Board also determined that the compensation payable to Funds Management and the Sub-Adviser under each of the Advisory Agreements was reasonable. The Board considered the approval of the Advisory Agreements for the Fund as part of its consideration of agreements for funds across the complex, but its approvals were made on a fund-by-fund basis. The following summarizes a number of important, but not necessarily all, factors considered by the Board in support of its approvals.
Nature, extent and quality of services
The Board received and considered various information regarding the nature, extent and quality of services provided to the Fund by Funds Management and the Sub-Adviser under the Advisory Agreements. This information included, among other things, a summary of the background and experience of senior management of Funds Management, and the qualifications, background, tenure and responsibilities of each of the portfolio managers primarily responsible for the day-to-day portfolio management of the Fund. The Board noted that the services to be provided to the Fund pursuant to the Management Agreement combined the advisory services previously provided to the Fund pursuant to the Fund’s Advisory Agreement with the Fund-level administrative services previously provided to the Fund pursuant to the Fund’s Administration Agreement. The Board received a representation from Funds Management that combining these services would not result in any change to the nature or level of services provided by Funds Management to the Fund.
Table of Contents
| Other information (unaudited) | Wells Fargo Advantage VT Total Return Bond Fund | 37 |
The Board evaluated the ability of Funds Management and the Sub-Adviser to attract and retain qualified investment professionals, including research, advisory and supervisory personnel. The Board further considered the compliance programs and compliance records of Funds Management and the Sub-Adviser. In addition, the Board took into account the full range of services provided to the Fund by Funds Management and its affiliates.
Fund performance and expenses
The Board considered the performance results for the Fund over various time periods ended March 31, 2015. The Board considered these results in comparison to the performance of funds in a universe that was determined by Lipper Inc. (“Lipper”) to be similar to the Fund (the “Universe”), and in comparison to the Fund’s benchmark index and to other comparative data. Lipper is an independent provider of investment company data. The Board received a description of the methodology used by Lipper to select the mutual funds in the performance Universe. The Board noted that the performance of the Fund (Class 2) was higher than the average performance of the Universe for all periods under review. The Board also noted that the performance of the Fund was higher than or in range of its benchmark, the Barclays U.S. Aggregate Bond Index, for all periods under review.
The Board also received and considered information regarding the Fund’s net operating expense ratio and its various components, including actual management fees (which reflect fee waivers, if any, and include advisory, administration and transfer agent fees), custodian and other non-management fees, and Rule 12b-1 and non-Rule 12b-1 service fees. The Board considered this ratio in comparison to the median ratios of funds in a class-specific expense group that was determined by Lipper to be similar to the Fund (the “Group”). The Board received a description of the methodology used by Lipper to select the mutual funds in the expense Group and an explanation of how funds comprising expense groups and their expense ratios may vary from year-to-year. Based on the Lipper reports, the Board noted that the net operating expense ratio of the Fund was in range of the median net operating expense ratio of the expense Group.
The Board took into account the Fund performance and expense information provided to it among the factors considered in deciding to re-approve the Advisory Agreement and Sub-Advisory Agreement and approve the Management Agreement.
Investment advisory and sub-advisory fee rates
The Board reviewed and considered the contractual investment advisory fee rate that is payable by the Fund to Funds Management for investment advisory services (the “Advisory Agreement Rate”), both on a stand-alone basis and on a combined basis with the Fund’s contractual administration fee rate (the “Management Rate”). The Board noted that the Management Rate includes transfer agency and sub-transfer agency costs. The Board also noted that the fee rate to be paid by the Fund under the Management Agreement will incorporate the advisory fee and Fund-level administration fee previously payable separately by the Fund under the Fund’s Advisory Agreement and Administration Agreement with Funds Management. The Board also reviewed and considered the contractual investment sub-advisory fee rate that is payable by Funds Management to the Sub-Adviser for investment sub-advisory services (the “Sub-Advisory Agreement Rate”).
Among other information reviewed by the Board was a comparison of the Management Rate of the Fund with those of other funds in the expense Group at a common asset level. The Board noted that the Management Rate of the Fund was lower than the average rates for the Fund’s expense Group.
The Board also received and considered information about the portion of the total advisory fee that was retained by Funds Management after payment of the fee to the Sub-Adviser for sub-advisory services. In assessing the reasonableness of this amount, the Board received and evaluated information about the nature and extent of responsibilities retained and risks assumed by Funds Management and not delegated to or assumed by the Sub-Adviser, and about Funds Management’s on-going oversight services. However, given the affiliation between Funds Management and the Sub-Adviser, the Board ascribed limited relevance to the allocation of the advisory fee between them.
The Board also received and considered information about the nature and extent of services offered and fee rates charged by Funds Management and the Sub-Adviser to other types of clients with investment strategies similar to those of the Fund. In this regard, the Board received information about the significantly greater scope of services, and compliance, reporting and other legal burdens and risks of managing mutual funds compared with those associated with managing assets of non-mutual fund clients such as collective funds or institutional separate accounts.
Based on its consideration of the factors and information it deemed relevant, including those described here, the Board determined that the compensation payable to Funds Management under the Management Agreement and Advisory Agreement and to the Sub-Adviser under the Sub-Advisory Agreement was reasonable, in light of the services covered by the Advisory Agreements.
Table of Contents
| 38 | Wells Fargo Advantage VT Total Return Bond Fund | Other information (unaudited) |
Profitability
The Board received and considered information concerning the profitability of Funds Management and the Sub-Adviser, as well as the profitability of Wells Fargo as a whole, from providing services to the Fund and the fund family as a whole.
Funds Management and the Sub-Adviser explained the methodologies and estimates that they used in calculating profitability. Among other things, the Board noted that the levels of profitability reported on a fund-by-fund basis varied widely, depending on factors such as the size and type of fund. Based on its review, the Board did not deem the profits reported by Funds Management or the Sub-Adviser to be at a level that would prevent it from approving the continuation of the Advisory Agreements.
Economies of scale
With respect to possible economies of scale, the Board noted the existence of breakpoints in the Fund’s advisory and management fee structures, and the Fund’s administration fee structure, which operate generally to reduce the Fund’s expense ratios as the Fund grows in size. It considered that, for a small fund or a fund that shrinks in size, breakpoints conversely can result in higher fee levels. The Board also considered that fee waiver and expense reimbursement arrangements and competitive fee rates at the outset are means of sharing potential economies of scale with shareholders of the Fund and the fund family as a whole. The Board considered Funds Management’s view that any analyses of potential economies of scale in managing a particular fund are inherently limited in light of the joint and common costs and investments that Funds Management incurs across the fund family as a whole.
The Board concluded that the Fund’s fee and expense arrangements, including contractual breakpoints, constituted a reasonable approach to sharing potential economies of scale with the Fund and its shareholders.
Other benefits to Funds Management and the Sub-Adviser
The Board received and considered information regarding potential “fall-out” or ancillary benefits received by Funds Management and its affiliates, including the Sub-Adviser, as a result of their relationships with the Fund. Ancillary benefits could include, among others, benefits directly attributable to other relationships with the Fund and benefits potentially derived from an increase in Funds Management’s and the Sub-Adviser’s business as a result of their relationships with the Fund. The Board noted that various affiliates of Funds Management may receive distribution-related fees, shareholder servicing payments and sub-transfer agency fees in respect of shares sold or held through them and services provided.
The Board also reviewed information about soft dollar credits earned and utilized by the Sub-Adviser, fees earned by Funds Management and the Sub-Adviser from managing a private investment vehicle for the fund family’s securities lending collateral and commissions earned by an affiliated broker from portfolio transactions.
Based on its consideration of the factors and information it deemed relevant, including those described here, the Board did not find that any ancillary benefits received by Funds Management and its affiliates, including the Sub-Adviser, were unreasonable.
Conclusion
At the Meeting, after considering the above-described factors and based on its deliberations and its evaluation of the information described above, the Board unanimously approved the continuation of the Advisory Agreement for the period from June 1, 2015 through June 30, 2015, approved the Management Agreement for the period from July 1, 2015 through May 31, 2016, and approved the continuation of the Sub-Advisory Agreement for a one-year term through May 31, 2016. The Board also determined that the compensation payable to Funds Management and the Sub-Adviser under each of the Advisory Agreements was reasonable.
Table of Contents
| List of abbreviations | Wells Fargo Advantage VT Total Return Bond Fund | 39 |
The following is a list of common abbreviations for terms and entities that may have appeared in this report.
| ACA | — ACA Financial Guaranty Corporation |
| ADR | — American depositary receipt |
| ADS | — American depositary shares |
| AGC | — Assured Guaranty Corporation |
| AGM | — Assured Guaranty Municipal |
| Ambac | — Ambac Financial Group Incorporated |
| AMT | — Alternative minimum tax |
| AUD | — Australian dollar |
| BAN | — Bond anticipation notes |
| BHAC | — Berkshire Hathaway Assurance Corporation |
| BRL | — Brazilian real |
| CAB | — Capital appreciation bond |
| CAD | — Canadian dollar |
| CCAB | — Convertible capital appreciation bond |
| CDA | — Community Development Authority |
| CDO | — Collateralized debt obligation |
| CHF | — Swiss franc |
| COP | — Columbian Peso |
| CLP | — Chilean peso |
| DKK | — Danish krone |
| DRIVER | — Derivative inverse tax-exempt receipts |
| DW&P | — Department of Water & Power |
| DWR | — Department of Water Resources |
| ECFA | — Educational & Cultural Facilities Authority |
| EDA | — Economic Development Authority |
| EDFA | — Economic Development Finance Authority |
| ETF | — Exchange-traded fund |
| EUR | — Euro |
| FDIC | — Federal Deposit Insurance Corporation |
| FFCB | — Federal Farm Credit Banks |
| FGIC | — Financial Guaranty Insurance Corporation |
| FHA | — Federal Housing Administration |
| FHLB | — Federal Home Loan Bank |
| FHLMC | — Federal Home Loan Mortgage Corporation |
| FICO | — The Financing Corporation |
| FNMA | — Federal National Mortgage Association |
| FSA | — Farm Service Agency |
| GBP | — Great British pound |
| GDR | — Global depositary receipt |
| GNMA | — Government National Mortgage Association |
| GO | — General obligation |
| HCFR | — Healthcare facilities revenue |
| HEFA | — Health & Educational Facilities Authority |
| HEFAR | — Higher education facilities authority revenue |
| HFA | — Housing Finance Authority |
| HFFA | — Health Facilities Financing Authority |
| HKD | — Hong Kong dollar |
| HUD | — Department of Housing and Urban Development |
| HUF | — Hungarian forint |
| IDA | — Industrial Development Authority |
| IDAG | — Industrial Development Agency |
| IDR | — Indonesian rupiah |
| IEP | — Irish pound |
| JPY | — Japanese yen |
| KRW | — Republic of Korea won |
| LIBOR | — London Interbank Offered Rate |
| LIFER | — Long Inverse Floating Exempt Receipts |
| LIQ | — Liquidity agreement |
| LLC | — Limited liability company |
| LLLP | — Limited liability limited partnership |
| LLP | — Limited liability partnership |
| LOC | — Letter of credit |
| LP | — Limited partnership |
| MBIA | — Municipal Bond Insurance Association |
| MFHR | — Multifamily housing revenue |
| MSTR | — Municipal securities trust receipts |
| MTN | — Medium-term note |
| MUD | — Municipal Utility District |
| MXN | — Mexican peso |
| MYR | — Malaysian ringgit |
| National | — National Public Finance Guarantee Corporation |
| NGN | — Nigerian naira |
| NOK | — Norwegian krone |
| NZD | — New Zealand dollar |
| PCFA | — Pollution Control Financing Authority |
| PCL | — Public Company Limited |
| PCR | — Pollution control revenue |
| PFA | — Public Finance Authority |
| PFFA | — Public Facilities Financing Authority |
| PFOTER | — Puttable floating option tax-exempt receipts |
| plc | — Public limited company |
| PLN | — Polish zloty |
| PUTTER | — Puttable tax-exempt receipts |
| R&D | — Research & development |
| Radian | — Radian Asset Assurance |
| RAN | — Revenue anticipation notes |
| RDA | — Redevelopment Authority |
| RDFA | — Redevelopment Finance Authority |
| REIT | — Real estate investment trust |
| ROC | — Reset option certificates |
| RON | — Romanian lei |
| RUB | — Russian ruble |
| SAVRS | — Select auction variable rate securities |
| SBA | — Small Business Authority |
| SDR | — Swedish depositary receipt |
| SEK | — Swedish krona |
| SFHR | — Single-family housing revenue |
| SFMR | — Single-family mortgage revenue |
| SGD | — Singapore dollar |
| SPA | — Standby purchase agreement |
| SPDR | — Standard & Poor’s Depositary Receipts |
| SPEAR | — Short Puttable Exempt Adjustable Receipts |
| STRIPS | — Separate trading of registered interest and |
| principal securities |
| TAN | — Tax anticipation notes |
| TBA | — To be announced |
| THB | — Thai baht |
| TIPS | — Treasury inflation-protected securities |
| TRAN | — Tax revenue anticipation notes |
| TRY | — Turkish lira |
| TTFA | — Transportation Trust Fund Authority |
| TVA | — Tennessee Valley Authority |
| ZAR | — South African rand |
Table of Contents
This page is intentionally left blank.
Table of Contents


For more information
More information about Wells Fargo Advantage Funds is available free upon request. To obtain literature, please write, email, visit the Fund’s website, or call:
Wells Fargo Advantage Funds
P.O. Box 8266
Boston, MA 02266-8266
Email: wfaf@wellsfargo.com
Website: wellsfargoadvantagefunds.com
Individual investors: 1-800-222-8222
Retail investment professionals: 1-888-877-9275
Institutional investment professionals: 1-866-765-0778
This report and the financial statements contained herein are submitted for the general information of the shareholders of Wells Fargo Advantage Funds. If this report is used for promotional purposes, distribution of the report must be accompanied or preceded by a current prospectus. Before investing, please consider the investment objectives, risks, charges, and expenses of the investment. For a current prospectus and, if available, a summary prospectus, containing this information, call 1-800-222-8222 or visit the Fund’s website at wellsfargoadvantagefunds.com. Read the prospectus carefully before you invest or send money.
Wells Fargo Funds Management, LLC, a wholly owned subsidiary of Wells Fargo & Company, provides investment advisory and administrative services for Wells Fargo Advantage Funds. Other affiliates of Wells Fargo & Company provide subadvisory and other services for the Funds. The Funds are distributed by Wells Fargo Funds Distributor, LLC, Member FINRA/SIPC, an affiliate of Wells Fargo & Company.
NOT FDIC INSURED ¡ NO BANK GUARANTEE ¡ MAY LOSE VALUE
© 2015 Wells Fargo Funds Management, LLC. All rights reserved.
235293 08-15 SVT9/SAR146 06-15 |
Table of Contents
| ITEM 2. | CODE OF ETHICS |
Not applicable.
| ITEM 3. | AUDIT COMMITTEE FINANCIAL EXPERT |
Not applicable.
| ITEM 4. | PRINCIPAL ACCOUNTANT FEES AND SERVICES |
Not applicable.
| ITEM 5. | AUDIT COMMITTEE OF LISTED REGISTRANTS |
Not applicable.
| ITEM 6. | INVESTMENTS |
A Portfolio of Investments for each series of Wells Fargo Variable Trust is included as part of the report to shareholders filed under Item 1 of this Form.
Table of Contents
| ITEM 7. | DISCLOSURE OF PROXY VOTING POLICIES AND PROCEDURES FOR CLOSED-END MANAGEMENT INVESTMENT COMPANIES |
Not applicable.
| ITEM 8. | PORTFOLIO MANAGERS OF CLOSED-END MANAGEMENT INVESTMENT COMPANIES |
Not applicable.
| ITEM 9. | PURCHASES OF EQUITY SECURITIES BY CLOSED-END MANAGEMEENT INVESTMENT COMPANY AND AFFILIATED PURCHASERS |
Not applicable.
| ITEM 10. | SUBMISSION OF MATTERS TO A VOTE OF SECURITY HOLDERS |
There have been no material changes to the procedures by which shareholders may recommend nominees to the registrant’s Board of Trustees that have been implemented since the registrant’s last provided disclosure in response to the requirements of this Item.
| ITEM 11. | CONTROLS AND PROCEDURES |
(a) The President and Treasurer have concluded that the Wells Fargo Variable Trust (the “Trust”) disclosure controls and procedures (as defined in Rule 30a-3(c) under the Investment Company Act of 1940) provide reasonable assurances that material information relating to the Trust is made known to them by the appropriate
Table of Contents
persons, based on their evaluation of these controls and procedures as of a date within 90 days of the filing of this report.
(b) There were no significant changes in the Trust’s internal controls over financial reporting (as defined in Rule 30a-3(d) under the Investment Company Act of 1940) that occurred during the second fiscal quarter of the period covered by this report that materially affected, or is reasonably likely to materially affect, the registrant’s internal control over financial reporting.
| ITEM 12. | EXHIBITS |
(a)(1) Not applicable.
(a)(2) Certification pursuant to Rule 30a-2(a) under the Investment Company Act of 1940 (17 CFR 270.30a-2(a)) is filed and attached hereto as Exhibit 99.CERT.
(a)(3) Not applicable.
(b) Certification pursuant to Rule 30a-2(b) under the Investment Company Act of 1940 (17 CFR 270.30a-2(b)) is filed and attached hereto as Exhibit 99.906CERT.
Table of Contents
SIGNATURES
Pursuant to the requirements of the Securities Exchange Act of 1934 and the Investment Company Act of 1940, the registrant has duly caused this report to be signed on its behalf by the undersigned, thereunto duly authorized.
| Wells Fargo Variable Trust | ||
| By: | /s/ Karla M. Rabusch | |
| Karla M. Rabusch | ||
| President | ||
| Date: | August 24, 2015 | |
Pursuant to the requirements of the Securities Exchange Act of 1934 and the Investment Company Act of 1940, this report has been signed below by the following persons on behalf of the registrant and in the capacities and on the date indicated.
| Wells Fargo Variable Trust | ||
| By: | /s/ Karla M. Rabusch | |
| Karla M. Rabusch | ||
| President | ||
| Date: | August 24, 2015 | |
| By: | /s/ Jeremy DePalma | |
| Jeremy DePalma | ||
| Treasurer | ||
| Date: | August 24, 2015 | |