
UNITED STATES
SECURITIES AND EXCHANGE COMMISSION
Washington, D.C. 20549
FORM N-CSRS
CERTIFIED SHAREHOLDER REPORT OF REGISTERED
MANAGEMENT INVESTMENT COMPANIES
Investment Company Act file number: 811-09255
Wells Fargo Variable Trust
(Exact name of registrant as specified in charter)
525 Market St., San Francisco, CA 94105
(Address of principal executive offices) (Zip code)
C. David Messman
Wells Fargo Funds Management, LLC
525 Market St., San Francisco, CA 94105
(Name and address of agent for service)
Registrant’s telephone number, including area code: 800-222-8222
Date of fiscal year end: December 31
Registrant is making a filing for 6 of its series:
Wells Fargo VT Discovery Fund, Wells Fargo VT Index Asset Allocation Fund, Wells Fargo VT International Equity Fund, Wells Fargo VT Omega Growth Fund, Wells Fargo VT Opportunity Fund, and Wells Fargo VT Small Cap Growth Fund.
Date of reporting period: June 30, 2018
| ITEM 1. | REPORT TO STOCKHOLDERS |
Semi-Annual Report
June 30, 2018

Wells Fargo VT Discovery Fund


Reduce clutter. Save trees.
Sign up for electronic delivery of prospectuses and shareholder reports at wellsfargo.com/advantagedelivery
Contents
The views expressed and any forward-looking statements are as of June 30, 2018, unless otherwise noted, and are those of the Fund managers and/or Wells Fargo Funds Management, LLC. Discussions of individual securities, or the markets generally, or any Wells Fargo Fund are not intended as individual recommendations. Future events or results may vary significantly from those expressed in any forward-looking statements. The views expressed are subject to change at any time in response to changing circumstances in the market. Wells Fargo Funds Management, LLC and the Fund disclaim any obligation to publicly update or revise any views expressed or forward-looking statements.
NOT FDIC INSURED ◾ NO BANK GUARANTEE ◾ MAY LOSE VALUE
| | | | |
| 2 | | Wells Fargo VT Discovery Fund | | Letter to shareholders (unaudited) |

Andrew Owen
President
Wells Fargo Funds
Globally, economies strengthened, equity markets advanced, and foreign bonds outperformed fixed-income investments in the U.S.
During February 2018, the U.S. stock market endured a loss of more than 10% before recovering in March and April.
Dear Shareholder:
We are pleased to offer you this semi-annual report for the Wells Fargo VT Discovery Fund for the six-month period that ended June 30, 2018. Globally, economies strengthened, equity markets advanced, and foreign bonds outperformed fixed-income investments in the U.S.
For the period, U.S. stocks, as measured by the S&P 500 Index,1 gained 2.65%, and international stocks, as measured by the MSCI ACWI ex USA Index (Net),2 dropped 3.77%. Emerging market stocks, as measured by the MSCI EM Index (Net),3 fell 6.66%. In bond markets, the Bloomberg Barclays U.S. Aggregate Bond Index4 declined 1.62% while fixed-income investments outside the U.S. lost 1.31 %, according to the Bloomberg Barclays Global Aggregate ex-USD Index.5 The Bloomberg Barclays Municipal Bond Index6 fell 0.25%, and the ICE BofAML U.S. High Yield Index7 was up 0.08%.
Volatility reemerged during the first quarter of 2018 as economic signals were mixed.
The first quarter of 2018 began with stock market gains in January after the U.S. announced tax reform measures intended to lower rates for individuals and corporations. Then, investor optimism was supplanted by several concerns. Trade tensions emerged, particularly between the U.S. and China, as the U.S. threatened to impose tariffs on a broad range of imported products. Increasing interest rates and inflation also caused concern. During February 2018, the U.S. stock market endured a loss of more than 10% before recovering in March and April. The S&P 500 Index closed the first quarter with a negative return, the first negative quarterly return for the index since 2014.
The U.S. Federal Reserve (Fed) increased the federal funds rate by 25 basis points (bps; 100 bps equal 1.00%) in March and the rate of inflation reached the Fed’s 2% target for the first time in a year. The unemployment rate fell to 4.1% by March 2018 and wage growth data improved. The third revision of gross domestic product growth for the first quarter by the U.S. Bureau of Economic Analysis released during June was lowered to 2.0%.
Overseas, investment market returns reversed the strong returns of 2017—the MSCI ACWI ex USA Index (Net) gained 27.19% for the 12-month period—falling 0.43% through the end of the second quarter of 2018. Although central banks, including the European Central Bank and the Bank of Japan, maintained low interest rates and quantitative easing measures that are generally supportive of
| 1 | The S&P 500 Index consists of 500 stocks chosen for market size, liquidity, and industry group representation. It is a market-value-weighted index with each stock’s weight in the index proportionate to its market value. You cannot invest directly in an index. |
| 2 | The Morgan Stanley Capital International (MSCI) All Country World Index (ACWI) ex USA Index (Net) is a free-float-adjusted market-capitalization-weighted index that is designed to measure the equity market performance of developed markets, excluding the United States and Canada. Source: MSCI. MSCI makes no express or implied warranties or representations and shall have no liability whatsoever with respect to any MSCI data contained herein. The MSCI data may not be further redistributed or used as a basis for other indices or any securities or financial products. This report is not approved, reviewed, or produced by MSCI. You cannot invest directly in an index. |
| 3 | The MSCI Emerging Markets (EM) Index (Net) is a free-float-adjusted market-capitalization-weighted index that is designed to measure large- and mid-cap equity market performance of emerging markets. The MSCI EM Index (Net) consists of the following 24 emerging market country indices: Brazil, Chile, China, Colombia, Czech Republic, Egypt, Greece, Hungary, India, Indonesia, Korea, Malaysia, Mexico, Pakistan, Peru, the Philippines, Poland, Qatar, Russia, South Africa, Taiwan, Thailand, Turkey, and the United Arab Emirates. You cannot invest directly in an index. |
| 4 | The Bloomberg Barclays U.S. Aggregate Bond Index is a broad-based benchmark that measures the investment-grade, U.S. dollar-denominated, fixed-rate taxable bond market, including Treasuries, government-related and corporate securities, mortgage-backed securities (agency fixed-rate and hybrid adjustable-rate mortgage pass-throughs), asset-backed securities, and commercial mortgage-backed securities. You cannot invest directly in an index. |
| 5 | The Bloomberg Barclays Global Aggregate ex-USD Index is an unmanaged index that provides a broad-based measure of the global investment-grade fixed-income markets excluding the U.S. dollar-denominated debt market. You cannot invest directly in an index. |
| 6 | The Bloomberg Barclays Municipal Bond Index is an unmanaged index composed of long-term tax-exempt bonds with a minimum credit rating of Baa. You cannot invest directly in an index. |
| 7 | The ICE BofAML U.S. High Yield Index is a market-capitalization-weighted index of domestic and Yankee high-yield bonds. The index tracks the performance of high-yield securities traded in the U.S. bond market. You cannot invest directly in an index. Copyright 2018. ICE Data Indices, LLC. All rights reserved. |
| 8 | The Consumer Price Index (CPI) is a measure of the average change over time in the prices paid by urban consumers for a market basket of consumer goods and services. You cannot invest directly in an index. |
| | | | | | |
| Letter to shareholders (unaudited) | | Wells Fargo VT Discovery Fund | | | 3 | |
businesses and equity markets, the U.S. dollar strengthened relative to local currencies, which served to restrain returns.
Global trade tensions escalated during the second quarter of 2018.
Global trade tensions escalated as the second quarter of 2018 opened and equity markets fell in response before resuming upward momentum later in April. The CPI8 for All Urban Consumers added 0.2% in May after a similar increase in April. On a year-over-year basis, the all-items index rose 2.8% for the 12 months that ended May 31, continuing its upward trend since the beginning of the year. The index for all items less food and energy rose 2.2% for the same 12-month period.
During June 2018, the Fed increased the federal funds rate by another 25 bps. Market expectations increased that the Fed might announce two more rate increases in 2018. The unemployment rate fell to an 18-year low of 3.8% in May and wage growth data improved. Internationally, central banks maintained their low interest rates and monetary policies that were accommodative of business activity.
Interest rates generally increased and the bond markets tended to decline. Long-term interest rates in the U.S. trended higher—rates on the 10-year and 30-year Treasury bonds moved from 2.46% and 2.81%, respectively, at the beginning of the year on January 1, 2018, to 2.85% and 2.98%, respectively, on June 30, 2018, well off their highest levels during the first half of the year of 3.11% and 3.25%, respectively, on May 17, 2018.
Despite the positive economic and business trends globally, international stock values fell and U.S. stock gains moderated during most of the second quarter of 2018 due to escalating tensions as the U.S. imposed tariffs on foreign goods and countries outside of the U.S. imposed tariffs of their own on U.S. products in response.
Don’t let short-term uncertainty derail long-term investment goals.
Periods of investment uncertainty can present challenges, but experience has taught us that maintaining long-term investment goals can be an effective way to plan for the future. To help you create a sound strategy based on your personal goals and risk tolerance, Wells Fargo Funds offers more than 100 mutual funds spanning a wide range of asset classes and investment styles. Although diversification cannot guarantee an investment profit or prevent losses, we believe it can be an effective way to manage investment risk and potentially smooth out overall portfolio performance. We encourage investors to know their investments and to understand that appropriate levels of risk-taking may unlock opportunities.
Thank you for choosing to invest with Wells Fargo Funds. We appreciate your confidence in us and remain committed to helping you meet your financial needs.
Sincerely,

Andrew Owen
President
Wells Fargo Funds
For further information about your Fund, contact your investment professional, visit our website at wellsfargofunds.com, or call us directly at 1-800-260-5969.
| | | | |
| 4 | | Wells Fargo VT Discovery Fund | | Performance highlights (unaudited) |
Investment objective
The Fund seeks long-term capital appreciation.
Manager
Wells Fargo Funds Management, LLC
Subadviser
Wells Capital Management Incorporated
Portfolio managers
Michael T. Smith, CFA®
Christopher J. Warner, CFA®
Average annual total returns (%) as of June 30, 2018
| | | | | | | | | | | | | | | | | | | | | | |
| | | | | | | | Expense ratios1 (%) | |
| | | Inception date | | 1 year | | | 5 year | | | 10 year | | | Gross | | | Net2 | |
| Class 2 | | 5-8-1992 | | | 20.59 | | | | 12.46 | | | | 10.58 | | | | 1.17 | | | | 1.16 | |
| Russell 2500TM Growth Index3 | | – | | | 21.53 | | | | 13.87 | | | | 11.38 | | | | – | | | | – | |
Figures quoted represent past performance, which is no guarantee of future results. Investment return and principal value of an investment will fluctuate so that an investor’s shares, when redeemed, may be worth more or less than their original cost. Current performance may be lower or higher than the performance data quoted and assumes the reinvestment of dividends and capital gains. Current month-end performance is available by calling 1-800-260-5969. Performance figures of the Fund do not reflect fees charged pursuant to the terms of variable life insurance policies and variable annuity contracts. If these charges had been reflected, performance would have been lower.
Shares are sold without a front-end sales charge or a contingent deferred sales charge.
Index returns do not include transaction costs associated with buying and selling securities, any mutual fund fees or expenses, or any taxes. It is not possible to invest directly in an index.
Stock values fluctuate in response to the activities of individual companies and general market and economic conditions. Smaller-company stocks tend to be more volatile and less liquid than those of larger companies. Certain investment strategies tend to increase the total risk of an investment (relative to the broader market). The Fund is exposed to foreign investment risk. Consult the Fund’s prospectus for additional information on these and other risks.
Please refer to the prospectus provided by your participating insurance company for detailed information describing the separate accounts for information regarding surrender charges, mortality and expense risk fees, and other charges that may be assessed by the participating insurance companies.
Please see footnotes on page 5.
| | | | | | |
| Performance highlights (unaudited) | | Wells Fargo VT Discovery Fund | | | 5 | |
| | | | |
| Ten largest holdings (%) as of June 30, 20184 | |
Waste Connections Incorporated | | | 2.67 | |
WEX Incorporated | | | 2.52 | |
Take-Two Interactive Software Incorporated | | | 2.10 | |
Gartner Incorporated | | | 2.05 | |
The Brink’s Company | | | 1.85 | |
Vail Resorts Incorporated | | | 1.85 | |
WellCare Health Plans Incorporated | | | 1.81 | |
Veeva Systems Incorporated Class A | | | 1.80 | |
Bright Horizons Family Solutions Incorporated | | | 1.78 | |
ICU Medical Incorporated | | | 1.77 | |
|
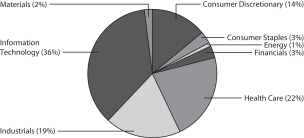
| Sector distribution as of June 30, 20185 |
|
 |
| 1 | Reflects the expense ratios as stated in the most recent prospectuses, which include the impact of 0.01% in acquired fund fees and expenses. The expense ratios shown are subject to change and may differ from the annualized expense ratios shown in the financial highlights of this report. |
| 2 | The manager has committed through April 30, 2019, to waive fees and/or reimburse expenses to the extent necessary to cap the Fund’s Total Annual Fund Operating Expenses After Fee Waiver at 1.15% for Class 2. After this time, the cap may be increased or the commitment to maintain the cap may be terminated only with the approval of the Board of Trustees. Brokerage commissions, stamp duty fees, interest, taxes, acquired fund fees and expenses (if any), and extraordinary expenses are excluded from the expense cap. Without this cap, the Fund’s returns would have been lower. The expense ratio paid by an investor is the net expense ratio (the total annual fund operating expenses after fee waivers) as stated in the prospectus. |
| 3 | The Russell 2500TM Growth Index measures the performance of those Russell 2500 companies with higher price/book ratios and higher forecasted growth values. You cannot invest directly in an index. |
| 4 | The ten largest holdings, excluding cash, cash equivalents and any money markets funds, are calculated based on the value of the investments divided by total net assets of the Fund. Holdings are subject to change and may have changed since the date specified. |
| 5 | Amounts are calculated based on the total long-term investments of the Fund. These amounts are subject to change and may have changed since the date specified. |
| | | | |
| 6 | | Wells Fargo VT Discovery Fund | | Fund expenses (unaudited) |
As a shareholder of the Fund, you incur ongoing costs, including management fees, distribution (12b-1) fees, and other Fund expenses. This example is intended to help you understand your ongoing costs (in dollars) of investing in the Fund and to compare these costs with the ongoing costs of investing in other mutual funds.
The example is based on an investment of $1,000 invested at the beginning of the six-month period and held for the entire period from January 1, 2018 to June 30, 2018.
Actual expenses
The “Actual” line of the table below provides information about actual account values and actual expenses. You may use the information in this line, together with the amount you invested, to estimate the expenses that you paid over the period. Simply divide your account value by $1,000 (for example, an $8,600 account value divided by $1,000 = 8.6), then multiply the result by the number in the “Actual” line under the heading entitled “Expenses paid during period” for your applicable class of shares to estimate the expenses you paid on your account during this period.
Hypothetical example for comparison purposes
The “Hypothetical” line of the table below provides information about hypothetical account values and hypothetical expenses based on the Fund’s actual expense ratio and an assumed rate of return of 5% per year before expenses, which is not the Fund’s actual return. The hypothetical account values and expenses may not be used to estimate the actual ending account balance or expenses you paid for the period. You may use this information to compare the ongoing costs of investing in the Fund and other funds. To do so, compare this 5% hypothetical example with the 5% hypothetical examples that appear in the shareholder reports of the other funds.
Please note that the expenses shown in the table are meant to highlight your ongoing costs only and do not reflect any separate account charges assessed by participating insurance companies. Therefore, the “Hypothetical” line of the table is useful in comparing ongoing costs only, and will not help you determine the relative total costs of owning different funds. In addition, if these separate account charges assessed by participating insurance companies were included, your costs would have been higher.
| | | | | | | | | | | | | | | | |
| | | Beginning
account value
1-1-2018 | | | Ending
account value
6-30-2018 | | | Expenses
paid during
the period¹ | | | Annualized net
expense ratio | |
Class 2 | | | | | | | | | | | | | | | | |
Actual | | $ | 1,000.00 | | | $ | 1,155.15 | | | $ | 6.15 | | | | 1.15 | % |
Hypothetical (5% return before expenses) | | $ | 1,000.00 | | | $ | 1,019.09 | | | $ | 5.76 | | | | 1.15 | % |
| 1 | Expenses paid is equal to the annualized net expense ratio multiplied by the average account value over the period, multiplied by the number of days in the most recent fiscal half-year divided by the number of days in the fiscal year (to reflect the one-half-year period). |
| | | | | | |
| Portfolio of investments—June 30, 2018 (unaudited) | | Wells Fargo VT Discovery Fund | | | 7 | |
| | | | | | | | | | | | | | | | |
| Security name | | | | | | | | Shares | | | Value | |
| | | | |
Common Stocks: 97.24% | | | | | | | | | | | | | | | | |
| | | | |
Consumer Discretionary: 13.59% | | | | | | | | | | | | | | | | |
| | | | |
| Diversified Consumer Services: 3.31% | | | | | | | | | | | | | | | | |
Adtalem Global Education Incorporated † | | | | | | | | | | | 48,400 | | | $ | 2,328,040 | |
Bright Horizons Family Solutions Incorporated † | | | | | | | | | | | 26,200 | | | | 2,686,024 | |
| | | | |
| | | | | | | | | | | | | | | 5,014,064 | |
| | | | | | | | | | | | | | | | |
| | | | |
| Hotels, Restaurants & Leisure: 7.36% | | | | | | | | | | | | | | | | |
Eldorado Resorts Incorporated Ǡ | | | | | | | | | | | 44,600 | | | | 1,743,860 | |
Hilton Grand Vacations Incorporated † | | | | | | | | | | | 60,800 | | | | 2,109,760 | |
Melco Crown Entertainment Limited ADR | | | | | | | | | | | 72,100 | | | | 2,018,800 | |
Six Flags Entertainment Corporation « | | | | | | | | | | | 35,092 | | | | 2,458,195 | |
Vail Resorts Incorporated | | | | | | | | | | | 10,200 | | | | 2,796,738 | |
| | | | |
| | | | | | | | | | | | | | | 11,127,353 | |
| | | | | | | | | | | | | | | | |
| | | | |
| Household Durables: 1.38% | | | | | | | | | | | | | | | | |
NVR Incorporated † | | | | | | | | | | | 700 | | | | 2,079,245 | |
| | | | | | | | | | | | | | | | |
| | | | |
| Specialty Retail: 1.54% | | | | | | | | | | | | | | | | |
Burlington Stores Incorporated † | | | | | | | | | | | 15,516 | | | | 2,335,623 | |
| | | | | | | | | | | | | | | | |
| | | | |
Consumer Staples: 3.07% | | | | | | | | | | | | | | | | |
| | | | |
| Beverages: 1.58% | | | | | | | | | | | | | | | | |
National Beverage Corporation Ǡ | | | | | | | | | | | 22,400 | | | | 2,394,560 | |
| | | | | | | | | | | | | | | | |
| | | | |
| Food Products: 1.49% | | | | | | | | | | | | | | | | |
Lamb Weston Holdings Incorporated | | | | | | | | | | | 32,900 | | | | 2,253,979 | |
| | | | | | | | | | | | | | | | |
| | | | |
Energy: 1.18% | | | | | | | | | | | | | | | | |
| | | | |
| Oil, Gas & Consumable Fuels: 1.18% | | | | | | | | | | | | | | | | |
Diamondback Energy Incorporated | | | | | | | | | | | 13,600 | | | | 1,789,352 | |
| | | | | | | | | | | | | | | | |
| | | | |
Financials: 2.68% | | | | | | | | | | | | | | | | |
| | | | |
| Capital Markets: 1.44% | | | | | | | | | | | | | | | | |
Raymond James Financial Incorporated | | | | | | | | | | | 24,400 | | | | 2,180,140 | |
| | | | | | | | | | | | | | | | |
| | | | |
| Consumer Finance: 1.24% | | | | | | | | | | | | | | | | |
SLM Corporation † | | | | | | | | | | | 163,200 | | | | 1,868,640 | |
| | | | | | | | | | | | | | | | |
| | | | |
Health Care: 20.99% | | | | | | | | | | | | | | | | |
| | | | |
| Biotechnology: 4.26% | | | | | | | | | | | | | | | | |
Array BioPharma Incorporated † | | | | | | | | | | | 68,007 | | | | 1,141,157 | |
CRISPR Therapeutics AG Ǡ | | | | | | | | | | | 12,827 | | | | 753,715 | |
Exelixis Incorporated † | | | | | | | | | | | 57,710 | | | | 1,241,919 | |
Flexion Therapeutics Incorporated Ǡ | | | | | | | | | | | 63,568 | | | | 1,643,233 | |
Sarepta Therapeutics Incorporated † | | | | | | | | | | | 9,403 | | | | 1,242,889 | |
TG Therapeutics Incorporated Ǡ | | | | | | | | | | | 31,800 | | | | 418,170 | |
| | | | |
| | | | | | | | | | | | | | | 6,441,083 | |
| | | | | | | | | | | | | | | | |
The accompanying notes are an integral part of these financial statements.
| | | | |
| 8 | | Wells Fargo VT Discovery Fund | | Portfolio of investments—June 30, 2018 (unaudited) |
| | | | | | | | | | | | | | | | |
| Security name | | | | | | | | Shares | | | Value | |
| | | | |
| Health Care Equipment & Supplies: 8.51% | | | | | | | | | | | | | | | | |
Haemonetics Corporation † | | | | | | | | | | | 14,300 | | | $ | 1,282,424 | |
Hill-Rom Holdings Incorporated | | | | | | | | | | | 26,300 | | | | 2,297,042 | |
Hologic Incorporated † | | | | | | | | | | | 42,700 | | | | 1,697,325 | |
ICU Medical Incorporated † | | | | | | | | | | | 9,100 | | | | 2,672,215 | |
Insulet Corporation † | | | | | | | | | | | 24,899 | | | | 2,133,844 | |
iRhythm Technologies Incorporated † | | | | | | | | | | | 18,000 | | | | 1,460,340 | |
Nevro Corporation † | | | | | | | | | | | 16,600 | | | | 1,325,510 | |
| | | | |
| | | | | | | | | | | | | | | 12,868,700 | |
| | | | | | | | | | | | | | | | |
| | | | |
| Health Care Providers & Services: 3.94% | | | | | | | | | | | | | | | | |
Amedisys Incorporated † | | | | | | | | | | | 22,922 | | | | 1,958,914 | |
Molina Healthcare Incorporated † | | | | | | | | | | | 13,000 | | | | 1,273,220 | |
WellCare Health Plans Incorporated † | | | | | | | | | | | 11,100 | | | | 2,733,264 | |
| | | | |
| | | | | | | | | | | | | | | 5,965,398 | |
| | | | | | | | | | | | | | | | |
| | | | |
| Health Care Technology: 1.80% | | | | | | | | | | | | | | | | |
Veeva Systems Incorporated Class A † | | | | | | | | | | | 35,400 | | | | 2,720,844 | |
| | | | | | | | | | | | | | | | |
| | | | |
| Life Sciences Tools & Services: 1.24% | | | | | | | | | | | | | | | | |
Bio-Rad Laboratories Incorporated Class A † | | | | | | | | | | | 6,500 | | | | 1,875,510 | |
| | | | | | | | | | | | | | | | |
| | | | |
| Pharmaceuticals: 1.24% | | | | | | | | | | | | | | | | |
GW Pharmaceuticals plc Ǡ | | | | | | | | | | | 6,600 | | | | 920,964 | |
MyoKardia Incorporated † | | | | | | | | | | | 9,079 | | | | 450,772 | |
Wave Life Sciences Limited † | | | | | | | | | | | 13,200 | | | | 504,900 | |
| | | | |
| | | | | | | | | | | | | | | 1,876,636 | |
| | | | | | | | | | | | | | | | |
| | | | |
Industrials: 18.43% | | | | | | | | | | | | | | | | |
| | | | |
| Aerospace & Defense: 4.25% | | | | | | | | | | | | | | | | |
BWX Technologies Incorporated | | | | | | | | | | | 34,200 | | | | 2,131,344 | |
Curtiss-Wright Corporation | | | | | | | | | | | 19,694 | | | | 2,343,980 | |
Mercury Computer Systems Incorporated † | | | | | | | | | | | 51,260 | | | | 1,950,956 | |
| | | | |
| | | | | | | | | | | | | | | 6,426,280 | |
| | | | | | | | | | | | | | | | |
| | | | |
| Building Products: 1.46% | | | | | | | | | | | | | | | | |
A.O. Smith Corporation | | | | | | | | | | | 37,400 | | | | 2,212,210 | |
| | | | | | | | | | | | | | | | |
| | | | |
| Commercial Services & Supplies: 4.52% | | | | | | | | | | | | | | | | |
The Brink’s Company | | | | | | | | | | | 35,100 | | | | 2,799,225 | |
Waste Connections Incorporated | | | | | | | | | | | 53,743 | | | | 4,045,773 | |
| | | | |
| | | | | | | | | | | | | | | 6,844,998 | |
| | | | | | | | | | | | | | | | |
| | | | |
| Machinery: 2.45% | | | | | | | | | | | | | | | | |
Evoqua Water Technologies Company † | | | | | | | | | | | 106,437 | | | | 2,181,959 | |
Nordson Corporation | | | | | | | | | | | 11,900 | | | | 1,528,079 | |
| | | | |
| | | | | | | | | | | | | | | 3,710,038 | |
| | | | | | | | | | | | | | | | |
The accompanying notes are an integral part of these financial statements.
| | | | | | |
| Portfolio of investments—June 30, 2018 (unaudited) | | Wells Fargo VT Discovery Fund | | | 9 | |
| | | | | | | | | | | | | | | | |
| Security name | | | | | | | | Shares | | | Value | |
| | | | |
| Professional Services: 1.32% | | | | | | | | | | | | | | | | |
TransUnion | | | | | | | | | | | 27,850 | | | $ | 1,995,174 | |
| | | | | | | | | | | | | | | | |
| | | | |
| Road & Rail: 1.26% | | | | | | | | | | | | | | | | |
Saia Incorporated † | | | | | | | | | | | 23,600 | | | | 1,908,060 | |
| | | | | | | | | | | | | | | | |
| | | | |
| Trading Companies & Distributors: 3.17% | | | | | | | | | | | | | | | | |
SiteOne Landscape Supply Incorporated † | | | | | | | | | | | 30,150 | | | | 2,531,696 | |
Univar Incorporated † | | | | | | | | | | | 86,080 | | | | 2,258,739 | |
| | | | |
| | | | | | | | | | | | | | | 4,790,435 | |
| | | | | | | | | | | | | | | | |
| | | | |
Information Technology: 35.36% | | | | | | | | | | | | | | | | |
| | | | |
| Electronic Equipment, Instruments & Components: 5.11% | | | | | | | | | | | | | | | | |
Littelfuse Incorporated | | | | | | | | | | | 8,357 | | | | 1,906,900 | |
Novanta Incorporated † | | | | | | | | | | | 29,800 | | | | 1,856,540 | |
Universal Display Corporation « | | | | | | | | | | | 17,200 | | | | 1,479,200 | |
Zebra Technologies Corporation Class A † | | | | | | | | | | | 17,400 | | | | 2,492,550 | |
| | | | |
| | | | | | | | | | | | | | | 7,735,190 | |
| | | | | | | | | | | | | | | | |
| | | | |
| Internet Software & Services: 8.84% | | | | | | | | | | | | | | | | |
Box Incorporated Class A † | | | | | | | | | | | 53,600 | | | | 1,339,464 | |
DocuSign Incorporated Ǡ | | | | | | | | | | | 16,626 | | | | 880,347 | |
Envestnet Incorporated † | | | | | | | | | | | 28,200 | | | | 1,549,590 | |
Etsy Incorporated † | | | | | | | | | | | 53,000 | | | | 2,236,070 | |
LogMeIn Incorporated | | | | | | | | | | | 18,300 | | | | 1,889,475 | |
Match Group Incorporated Ǡ | | | | | | | | | | | 32,200 | | | | 1,247,428 | |
MercadoLibre Incorporated | | | | | | | | | | | 7,560 | | | | 2,259,911 | |
Yandex NV Class A † | | | | | | | | | | | 54,885 | | | | 1,970,372 | |
| | | | |
| | | | | | | | | | | | | | | 13,372,657 | |
| | | | | | | | | | | | | | | | |
| | | | |
| IT Services: 13.31% | | | | | | | | | | | | | | | | |
Black Knight Incorporated † | | | | | | | | | | | 47,900 | | | | 2,565,045 | |
EPAM Systems Incorporated † | | | | | | | | | | | 15,719 | | | | 1,954,343 | |
Euronet Worldwide Incorporated † | | | | | | | | | | | 26,793 | | | | 2,244,450 | |
First Data Corporation Class A † | | | | | | | | | | | 126,100 | | | | 2,639,273 | |
Gartner Incorporated † | | | | | | | | | | | 23,300 | | | | 3,096,570 | |
GreenSky Incorporated Class A † | | | | | | | | | | | 31,185 | | | | 659,563 | |
Switch Incorporated Class A « | | | | | | | | | | | 129,999 | | | | 1,582,088 | |
Total System Services Incorporated | | | | | | | | | | | 18,700 | | | | 1,580,524 | |
WEX Incorporated † | | | | | | | | | | | 20,000 | | | | 3,809,600 | |
| | | | |
| | | | | | | | | | | | | | | 20,131,456 | |
| | | | | | | | | | | | | | | | |
| | | | |
| Semiconductors & Semiconductor Equipment: 1.11% | | | | | | | | | | | | | | | | |
Teradyne Incorporated | | | | | | | | | | | 43,900 | | | | 1,671,273 | |
| | | | | | | | | | | | | | | | |
| | | | |
| Software: 6.21% | | | | | | | | | | | | | | | | |
Globant SA Ǡ | | | | | | | | | | | 34,800 | | | | 1,976,292 | |
Proofpoint Incorporated † | | | | | | | | | | | 17,121 | | | | 1,974,223 | |
Take-Two Interactive Software Incorporated † | | | | | | | | | | | 26,900 | | | | 3,183,884 | |
The Ultimate Software Group Incorporated † | | | | | | | | | | | 8,800 | | | | 2,264,328 | |
| | | | |
| | | | | | | | | | | | | | | 9,398,727 | |
| | | | | | | | | | | | | | | | |
The accompanying notes are an integral part of these financial statements.
| | | | |
| 10 | | Wells Fargo VT Discovery Fund | | Portfolio of investments—June 30, 2018 (unaudited) |
| | | | | | | | | | | | | | | | |
| Security name | | | | | | | | Shares | | | Value | |
| | | | |
| Technology Hardware, Storage & Peripherals: 0.78% | | | | | | | | | | | | | | | | |
NCR Corporation † | | | | | | | | | | | 39,500 | | | $ | 1,184,210 | |
| | | | | | | | | | | | | | | | |
| | | | |
Materials: 1.94% | | | | | | | | | | | | | | | | |
| | | | |
| Chemicals: 0.70% | | | | | | | | | | | | | | | | |
Albemarle Corporation « | | | | | | | | | | | 11,300 | | | | 1,065,929 | |
| | | | | | | | | | | | | | | | |
| | | | |
| Construction Materials: 1.24% | | | | | | | | | | | | | | | | |
Vulcan Materials Company | | | | | | | | | | | 14,500 | | | | 1,871,367 | |
| | | | | | | | | | | | | | | | |
| | | | |
Total Common Stocks (Cost $114,703,030) | | | | | | | | | | | | | | | 147,109,131 | |
| | | | | | | | | | | | | | | | |
| | | | |
| | | Yield | | | | | | | | | | |
| Short-Term Investments: 13.15% | | | | | | | | | | | | | | | | |
| | | | |
| Investment Companies: 13.15% | | | | | | | | | | | | | | | | |
Securities Lending Cash Investment LLC (l)(r)(u) | | | 2.09 | % | | | | | | | 15,443,361 | | | | 15,444,905 | |
Wells Fargo Government Money Market Fund Select Class (l)(u) | | | 1.83 | | | | | | | | 4,457,195 | | | | 4,457,195 | |
| | | | |
Total Short-Term Investments (Cost $19,901,840) | | | | | | | | | | | | | | | 19,902,100 | |
| | | | | | | | | | | | | | | | |
| | | | | | | | |
| Total investments in securities (Cost $134,604,870) | | | 110.39 | % | | | 167,011,231 | |
Other assets and liabilities, net | | | (10.39 | ) | | | (15,721,206 | ) |
| | | | | | | | |
| Total net assets | | | 100.00 | % | | $ | 151,290,025 | |
| | | | | | | | |
| † | Non-income-earning security |
| « | All or a portion of this security is on loan. |
| (l) | The issuer of the security is an affiliated person of the Fund as defined in the Investment Company Act of 1940. |
| (r) | The investment is a non-registered investment company purchased with cash collateral received from securities on loan. |
| (u) | The rate represents the 7-day annualized yield at period end. |
Abbreviations:
| ADR | American depositary receipt |
Investments in Affiliates
An affiliated investment is an investment in which the Fund owns at least 5% of the outstanding voting shares of the issuer or as a result of other relationships, such as the Fund and the issuer having the same investment manager. Transactions with issuers that were either affiliated persons of the Fund at the beginning of the period or the end of the period were as follows:
| | | | | | | | | | | | | | | | | | | | | | | | | | | | | | | | | | | | |
| | | Shares,
beginning of
period | | | Shares
purchased | | | Shares
sold | | | Shares,
end of
period | | | Net
realized
gains
(losses) | | | Net
change in
unrealized
gains
(losses) | | | Income
from
affiliated
securities | | | Value,
end
of period | | | % of net assets | |
Short-Term Investments | | | | | | | | | | | | | | | | | | | | | | | | | | | | | | | | | | | | |
Investment Companies | | | | | | | | | | | | | | | | | | | | | | | | | | | | | | | | | | | | |
Securities Lending Cash Investment LLC | | | 9,357,894 | | | | 56,603,949 | | | | 50,518,482 | | | | 15,443,361 | | | $ | 0 | | | $ | 0 | | | $ | 51,518 | | | $ | 15,444,905 | | | | | |
Wells Fargo Government Money Market Fund Select Class | | | 1,291,715 | | | | 21,770,303 | | | | 18,604,823 | | | | 4,457,195 | | | | 0 | | | | 0 | | | | 20,814 | | | | 4,457,195 | | | | | |
| | | | | | | | | | | | | | | | | | | | | | | | | | | | | | | | | | | | |
| | | | | | | | | | | | | | | | | | $ | 0 | | | $ | 0 | | | $ | 72,332 | | | $ | 19,902,100 | | | | 13.15 | % |
| | | | | | | | | | | | | | | | | | | | | | | | | | | | | | | | | | | | |
The accompanying notes are an integral part of these financial statements.
| | | | | | |
| Statement of assets and liabilities—June 30, 2018 (unaudited) | | Wells Fargo VT Discovery Fund | | | 11 | |
| | | | |
| | | | |
| |
Assets | | | | |
Investments in unaffiliated securities (including $15,115,500 of securities loaned), at value (cost $114,703,030) | | $ | 147,109,131 | |
Investments in affiliated securities, at value (cost $19,901,840) | | | 19,902,100 | |
Receivable for investments sold | | | 208,663 | |
Receivable for Fund shares sold | | | 51,945 | |
Receivable for dividends | | | 38,658 | |
Receivable for securities lending income | | | 6,538 | |
Prepaid expenses and other assets | | | 2,528 | |
| | | | |
Total assets | | | 167,319,563 | |
| | | | |
| |
Liabilities | | | | |
Payable upon receipt of securities loaned | | | 15,444,650 | |
Payable for investments purchased | | | 365,458 | |
Management fee payable | | | 97,245 | |
Payable for Fund shares redeemed | | | 61,175 | |
Distribution fee payable | | | 32,650 | |
Administration fee payable | | | 10,448 | |
Trustees’ fees and expenses payable | | | 639 | |
Accrued expenses and other liabilities | | | 17,273 | |
| | | | |
Total liabilities | | | 16,029,538 | |
| | | | |
Total net assets | | $ | 151,290,025 | |
| | | | |
| |
NET ASSETS CONSIST OF | | | | |
Paid-in capital | | $ | 92,169,245 | |
Accumulated net investment loss | | | (414,685 | ) |
Accumulated net realized gains on investments | | | 27,129,104 | |
Net unrealized gains on investments | | | 32,406,361 | |
| | | | |
Total net assets | | $ | 151,290,025 | |
| | | | |
| |
COMPUTATION OF NET ASSET VALUE PER SHARE | | | | |
Net assets – Class 2 | | $ | 151,290,025 | |
Shares outstanding – Class 21 | | | 4,418,648 | |
Net asset value per share – Class 2 | | | $34.24 | |
| 1 | The Fund has an unlimited number of authorized shares. |
The accompanying notes are an integral part of these financial statements.
| | | | |
| 12 | | Wells Fargo VT Discovery Fund | | Statement of operations—six months ended June 30, 2018 (unaudited) |
| | | | |
| | | | |
| |
Investment income | | | | |
Dividends (net of foreign withholding taxes of $2,288) | | $ | 366,891 | |
Securities lending income from affiliates, net | | | 51,518 | |
Income from affiliated securities | | | 20,814 | |
| | | | |
Total investment income | | | 439,223 | |
| | | | |
| |
Expenses | | | | |
Management fee | | | 556,897 | |
Administration fee | | | | |
Class 2 | | | 59,402 | |
Distribution fee | | | | |
Class 2 | | | 185,632 | |
Custody and accounting fees | | | 10,979 | |
Professional fees | | | 19,065 | |
Shareholder report expenses | | | 14,028 | |
Trustees’ fees and expenses | | | 9,095 | |
Other fees and expenses | | | 3,892 | |
| | | | |
Total expenses | | | 858,990 | |
Less: Fee waivers and/or expense reimbursements | | | (5,082 | ) |
| | | | |
Net expenses | | | 853,908 | |
| | | | |
Net investment loss | | | (414,685 | ) |
| | | | |
| |
REALIZED AND UNREALIZED GAINS (LOSSES) ON INVESTMENTS | | | | |
Net realized gains on investments | | | 9,465,083 | |
Net change in unrealized gains (losses) on investments | | | 2,250,765 | |
| | | | |
Net realized and unrealized gains (losses) on investments | | | 11,715,848 | |
| | | | |
Net increase in net assets resulting from operations | | $ | 11,301,163 | |
| | | | |
The accompanying notes are an integral part of these financial statements.
| | | | | | |
| Statement of changes in net assets | | Wells Fargo VT Discovery Fund | | | 13 | |
| | | | | | | | | | | | | | | | |
| | | Six months ended
June 30, 2018 (unaudited) | | | Year ended
December 31, 2017 | |
| | | | |
Operations | | | | | | | | | | | | | | | | |
Net investment loss | | | | | | $ | (414,685 | ) | | | | | | $ | (908,347 | ) |
Net realized gains on investments | | | | | | | 9,465,083 | | | | | | | | 18,740,756 | |
Net change in unrealized gains (losses) on investments | | | | | | | 2,250,765 | | | | | | | | 16,114,650 | |
| | | | |
Net increase in net assets resulting from operations | | | | | | | 11,301,163 | | | | | | | | 33,947,059 | |
| | | | |
| | | | |
Distributions to shareholders from | | | | | | | | | | | | | | | | |
Net realized gains – Class 2 | | | | | | | 0 | | | | | | | | (7,089,124 | ) |
| | | | |
| | | | |
Capital share transactions | | | Shares | | | | | | | | Shares | | | | | |
Proceeds from shares sold – Class 2 | | | 152,453 | | | | 5,059,927 | | | | 374,458 | | | | 10,970,353 | |
Reinvestment of distributions – Class 2 | | | 0 | | | | 0 | | | | 244,790 | | | | 7,089,124 | |
Payment for shares redeemed – Class 2 | | | (307,907 | ) | | | (10,245,764 | ) | | | (674,278 | ) | | | (19,662,185 | ) |
| | | | |
Net decrease in net assets resulting from capital share transactions | | | | | | | (5,185,837 | ) | | | | | | | (1,602,708 | ) |
| | | | |
Total increase in net assets | | | | | | | 6,115,326 | | | | | | | | 25,255,227 | |
| | | | |
| | | | |
Net assets | | | | | | | | | | | | | | | | |
Beginning of period | | | | | | | 145,174,699 | | | | | | | | 119,919,472 | |
| | | | |
End of period | | | | | | $ | 151,290,025 | | | | | | | $ | 145,174,699 | |
| | | | |
Undistributed (accumulated) net investment income (loss) | | | | | | $ | (414,685 | ) | | | | | | $ | 0 | |
| | | | |
The accompanying notes are an integral part of these financial statements.
| | | | |
| 14 | | Wells Fargo VT Discovery Fund | | Financial highlights |
(For a share outstanding throughout each period)
| | | | | | | | | | | | | | | | | | | | | | | | |
| | | Six months ended June 30, 2018 (unaudited) | | | Year ended December 31 | |
| CLASS 2 | | 2017 | | | 2016 | | | 2015 | | | 2014 | | | 2013 | |
Net asset value, beginning of period | | | $31.74 | | | | $25.91 | | | | $25.99 | | | | $30.71 | | | | $35.20 | | | | $25.16 | |
Net investment loss | | | (0.09 | ) | | | (0.20 | ) | | | (0.13 | ) | | | (0.21 | ) | | | (0.22 | ) | | | (0.17 | ) |
Net realized and unrealized gains (losses) on investments | | | 2.59 | | | | 7.60 | | | | 2.00 | | | | 0.21 | | | | 0.16 | | | | 11.06 | |
| | | | | | | | | | | | | | | | | | | | | | | | |
Total from investment operations | | | 2.50 | | | | 7.40 | | | | 1.87 | | | | 0.00 | | | | (0.06 | ) | | | 10.89 | |
Distributions to shareholders from | | | | | | | | | | | | | | | | | | | | | | | | |
Net investment income | | | 0.00 | | | | 0.00 | | | | 0.00 | | | | 0.00 | | | | 0.00 | | | | (0.00 | )1 |
Net realized gains | | | 0.00 | | | | (1.57 | ) | | | (1.95 | ) | | | (4.72 | ) | | | (4.43 | ) | | | (0.85 | ) |
| | | | | | | | | | | | | | | | | | | | | | | | |
Total distributions to shareholders | | | 0.00 | | | | (1.57 | ) | | | (1.95 | ) | | | (4.72 | ) | | | (4.43 | ) | | | (0.85 | ) |
Net asset value, end of period | | | $34.24 | | | | $31.74 | | | | $25.91 | | | | $25.99 | | | | $30.71 | | | | $35.20 | |
Total return2 | | | 7.88 | % | | | 29.13 | % | | | 7.65 | % | | | (1.46 | )% | | | 0.36 | % | | | 43.80 | % |
Ratios to average net assets (annualized) | | | | | | | | | | | | | | | | | | | | | | | | |
Gross expenses | | | 1.16 | % | | | 1.16 | % | | | 1.18 | % | | | 1.17 | % | | | 1.14 | % | | | 1.16 | % |
Net expenses | | | 1.15 | % | | | 1.15 | % | | | 1.15 | % | | | 1.15 | % | | | 1.14 | % | | | 1.15 | % |
Net investment loss | | | (0.56 | )% | | | (0.68 | )% | | | (0.52 | )% | | | (0.72 | )% | | | (0.68 | )% | | | (0.56 | )% |
Supplemental data | | | | | | | | | | | | | | | | | | | | | | | | |
Portfolio turnover rate | | | 28 | % | | | 75 | % | | | 85 | % | | | 90 | % | | | 79 | % | | | 88 | % |
Net assets, end of period (000s omitted) | | | $151,290 | | | | $145,175 | | | | $119,919 | | | | $126,839 | | | | $138,490 | | | | $158,451 | |
| 1 | Amount is less than $0.005. |
| 2 | Returns for periods of less than one year are not annualized. Performance figures of the Fund do not reflect fees charged pursuant to the terms of variable life insurance policies and variable annuity contracts. |
The accompanying notes are an integral part of these financial statements.
| | | | | | |
| Notes to financial statements (unaudited) | | Wells Fargo VT Discovery Fund | | | 15 | |
1. ORGANIZATION
Wells Fargo Variable Trust (the “Trust”), a Delaware statutory trust organized on March 10, 1999, is an open-end management investment company registered under the Investment Company Act of 1940, as amended (the “1940 Act”). As an investment company, the Trust follows the accounting and reporting guidance in Financial Accounting Standards Board Accounting Standards Codification Topic 946, Financial Services – Investment Companies. These financial statements report on the Wells Fargo VT Discovery Fund (the “Fund”) which is a diversified series of the Trust. The Trust offers shares of the Fund to separate accounts of various life insurance companies as funding vehicles for certain variable annuity contracts and variable life insurance policies.
2. SIGNIFICANT ACCOUNTING POLICIES
The following significant accounting policies, which are consistently followed in the preparation of the financial statements of the Fund, are in conformity with U.S. generally accepted accounting principles which require management to make estimates and assumptions that affect the reported amounts of assets and liabilities, disclosure of contingent assets and liabilities at the date of the financial statements, and the reported amounts of revenues and expenses during the reporting period. Actual results could differ from those estimates.
Securities valuation
All investments are valued each business day as of the close of regular trading on the New York Stock Exchange (generally 4 p.m. Eastern Time), although the Fund may deviate from this calculation time under unusual or unexpected circumstances.
Equity securities that are listed on a foreign or domestic exchange or market are valued at the official closing price or, if none, the last sales price. If no sale occurs on the principal exchange or market that day, a fair value price will be determined in accordance with the Fund’s Valuation Procedures.
Investments in registered open-end investment companies are valued at net asset value. Interests in non-registered investment companies that are redeemable at net asset value are fair valued normally at net asset value.
Investments which are not valued using any of the methods discussed above are valued at their fair value, as determined in good faith by the Board of Trustees of the Fund. The Board of Trustees has established a Valuation Committee comprised of the Trustees and has delegated to it the authority to take any actions regarding the valuation of portfolio securities that the Valuation Committee deems necessary or appropriate, including determining the fair value of portfolio securities, unless the determination has been delegated to the Wells Fargo Asset Management Pricing Committee at Wells Fargo Funds Management, LLC (“Funds Management”). The Board of Trustees retains the authority to make or ratify any valuation decisions or approve any changes to the Valuation Procedures as it deems appropriate. On a quarterly basis, the Board of Trustees receives reports on any valuation actions taken by the Valuation Committee or the Wells Fargo Asset Management Pricing Committee which may include items for ratification.
Valuations of fair valued securities are compared to the next actual sales price when available, or other appropriate market values, to assess the continued appropriateness of the fair valuation methodologies used. These securities are fair valued on a day-to-day basis, taking into consideration changes to appropriate market information and any significant changes to the inputs considered in the valuation process until there is a readily available price provided on an exchange or by an independent pricing service. Valuations received from an independent pricing service or independent broker-dealer quotes are periodically validated by comparisons to most recent trades and valuations provided by other independent pricing services in addition to the review of prices by the manager and/or subadviser. Unobservable inputs used in determining fair valuations are identified based on the type of security, taking into consideration factors utilized by market participants in valuing the investment, knowledge about the issuer and the current market environment.
Securities lending
The Fund may lend its securities from time to time in order to earn additional income in the form of fees or interest on securities received as collateral or the investment of any cash received as collateral. The Fund continues to receive interest or dividends on the securities loaned. The Fund receives collateral in the form of cash or securities with a value at least equal to the value of the securities on loan. The value of the loaned securities is determined at the close of each business day and any additional required collateral is delivered to the Fund on the next business day. In a securities lending transaction, the net asset value of the Fund will be affected by an increase or decrease in the value of the securities loaned and by an increase or decrease in the value of the instrument in which collateral is invested. The amount of securities lending activity undertaken by the Fund fluctuates from time to time. In the event of default or bankruptcy by the borrower, the Fund may be prevented from recovering the loaned securities or gaining access to the collateral or may experience delays or costs in doing so. In addition, the investment of any cash collateral received may lose all or part of its value. The Fund has the right under the lending agreement to recover the securities from the borrower on demand.
| | | | |
| 16 | | Wells Fargo VT Discovery Fund | | Notes to financial statements (unaudited) |
The Fund lends its securities through an unaffiliated securities lending agent. Cash collateral received in connection with its securities lending transactions is invested in Securities Lending Cash Investments, LLC (the “Securities Lending Fund”). The Securities Lending Fund is exempt from registration under Section 3(c)(7) of the 1940 Act and is managed by Funds Management and is subadvised by Wells Capital Management Incorporated (“WellsCap”), an affiliate of Funds Management and an indirect wholly owned subsidiary of Wells Fargo & Company (“Wells Fargo”). Funds Management receives an advisory fee starting at 0.05% and declining to 0.01% as the average daily net assets of the Securities Lending Fund increase. All of the fees received by Funds Management are paid to WellsCap for its services as subadviser. The Securities Lending Fund seeks to provide a positive return compared to the daily Fed Funds Open Rate by investing in high-quality, U.S. dollar-denominated short-term money market instruments. Securities Lending Fund investments are valued at the evaluated bid price provided by an independent pricing service. Income earned from investment in the Securities Lending Fund is included in securities lending income from affiliates (net of fees and rebates) on the Statement of Operations.
Security transactions and income recognition
Securities transactions are recorded on a trade date basis. Realized gains or losses are recorded on the basis of identified cost.
Dividend income is recognized on the ex-dividend date. Dividend income is recorded net of foreign taxes withheld where recovery of such taxes is not assured.
Distributions to shareholders
Distributions to shareholders from net investment income and any net realized gains are recorded on the ex-dividend date and paid at least annually. Such distributions are determined in accordance with income tax regulations and may differ from U.S. generally accepted accounting principles. Dividend sources are estimated at the time of declaration. The tax character of distributions is determined as of the Fund’s fiscal year end. Therefore, a portion of the Fund’s distributions made prior to the Fund’s fiscal year end may be categorized as a tax return of capital at year end.
Federal and other taxes
The Fund intends to continue to qualify as a regulated investment company by distributing substantially all of its investment company taxable income and any net realized capital gains (after reduction for capital loss carryforwards) sufficient to relieve it from all, or substantially all, federal income taxes. Accordingly, no provision for federal income taxes was required.
The Fund’s income and federal excise tax returns and all financial records supporting those returns for the prior three fiscal years are subject to examination by the federal and Delaware revenue authorities. Management has analyzed the Fund’s tax positions taken on federal, state, and foreign tax returns for all open tax years and does not believe that there are any uncertain tax positions that require recognition of a tax liability.
As of June 30, 2018, the aggregate cost of all investments for federal income tax purposes was $134,859,463 and the unrealized gains (losses) consisted of:
| | | | |
Gross unrealized gains | | $ | 35,194,753 | |
Gross unrealized losses | | | (3,042,985 | ) |
Net unrealized gains | | $ | 32,151,768 | |
3. FAIR VALUATION MEASUREMENTS
Fair value measurements of investments are determined within a framework that has established a fair value hierarchy based upon the various data inputs utilized in determining the value of the Fund’s investments. The three-level hierarchy gives the highest priority to unadjusted quoted prices in active markets for identical assets or liabilities (Level 1) and the lowest priority to unobservable inputs (Level 3). The Fund’s investments are classified within the fair value hierarchy based on the lowest level of input that is significant to the fair value measurement. The inputs are summarized into three broad levels as follows:
| ∎ | | Level 1 – quoted prices in active markets for identical securities |
| ∎ | | Level 2 – other significant observable inputs (including quoted prices for similar securities, interest rates, prepayment speeds, credit risk, etc.) |
| ∎ | | Level 3 – significant unobservable inputs (including the Fund’s own assumptions in determining the fair value of investments) |
| | | | | | |
| Notes to financial statements (unaudited) | | Wells Fargo VT Discovery Fund | | | 17 | |
The inputs or methodologies used for valuing investments in securities are not necessarily an indication of the risk associated with investing in those securities.
The following is a summary of the inputs used in valuing the Fund’s assets and liabilities as of June 30, 2018:
| | | | | | | | | | | | | | | | |
| | | Quoted prices
(Level 1) | | | Other significant
observable inputs
(Level 2) | | | Significant
unobservable inputs (Level 3) | | | Total | |
Assets | | | | | | | | | | | | | | | | |
Investments in: | | | | | | | | | | | | | | | | |
| | | | |
Common stocks | | | | | | | | | | | | | | | | |
Consumer discretionary | | $ | 20,556,285 | | | $ | 0 | | | $ | 0 | | | $ | 20,556,285 | |
Consumer staples | | | 4,648,539 | | | | 0 | | | | 0 | | | | 4,648,539 | |
Energy | | | 1,789,352 | | | | 0 | | | | 0 | | | | 1,789,352 | |
Financials | | | 4,048,780 | | | | 0 | | | | 0 | | | | 4,048,780 | |
Health care | | | 31,748,171 | | | | 0 | | | | 0 | | | | 31,748,171 | |
Industrials | | | 27,887,195 | | | | 0 | | | | 0 | | | | 27,887,195 | |
Information technology | | | 53,493,513 | | | | 0 | | | | 0 | | | | 53,493,513 | |
Materials | | | 2,937,296 | | | | 0 | | | | 0 | | | | 2,937,296 | |
| | | | |
Short-term investments | | | | | | | | | | | | | | | | |
Investment companies | | | 4,457,195 | | | | 0 | | | | 0 | | | | 4,457,195 | |
Investments measured at net asset value* | | | | | | | | | | | | | | | 15,444,905 | |
Total assets | | $ | 151,566,326 | | | $ | 0 | | | $ | 0 | | | $ | 167,011,231 | |
| * | Investments that are measured at fair value using the net asset value per share (or its equivalent) as a practical expedient have not been categorized in the fair value hierarchy. The fair value amount presented in the table is intended to permit reconciliation of the fair value hierarchy to the amounts presented in the Statement of Assets and Liabilities. The Fund’s investment in Securities Lending Cash Investments, LLC valued at $15,444,905 does not have a redemption period notice, can be redeemed daily and does not have any unfunded commitments. |
The Fund recognizes transfers between levels within the fair value hierarchy at the end of the reporting period. At June 30, 2018, the Fund did not have any transfers into/out of Level 1, Level 2, or Level 3.
4. TRANSACTIONS WITH AFFILIATES
Management fee
Funds Management, an indirect wholly owned subsidiary of Wells Fargo, is the manager of the Fund and provides advisory and fund-level administrative services under an investment management agreement. Under the investment management agreement, Funds Management is responsible for, among other services, implementing the investment objectives and strategies of the Fund, supervising the subadviser and providing fund-level administrative services in connection with the Fund’s operations. As compensation for its services under the investment management agreement, Funds Management is entitled to receive an annual management fee starting at 0.75% and declining to 0.58% as the average daily net assets of the Fund increase. For the six months ended June 30, 2018, the management fee was equivalent to an annual rate of 0.75% of the Fund’s average daily net assets.
Funds Management has retained the services of a subadviser to provide daily portfolio management to the Fund. The fee for subadvisory services is borne by Funds Management. WellsCap is the subadviser to the Fund and is entitled to receive a fee from Funds Management at an annual rate starting at 0.45% and declining to 0.35% as the average daily net assets of the Fund increase.
Administration fee
Under a class-level administration agreement, Funds Management provides class-level administrative services to the Fund, which includes paying fees and expenses for services provided by the transfer agent, sub-transfer agents, omnibus account servicers and record-keepers. As compensation for its services under the class-level administration agreement, Funds Management receives a class level administration fee of 0.08% which is calculated based on the average daily net assets of Class 2 shares.
Funds Management has contractually waived and/or reimbursed management and administration fees to the extent necessary to maintain certain net operating expense ratios for the Fund. When Class 2 of the Fund has exceeded its
| | | | |
| 18 | | Wells Fargo VT Discovery Fund | | Notes to financial statements (unaudited) |
expense cap, Funds Management has waived fees and/or reimbursed expenses from fund level expenses on a proportionate basis and then from class specific expenses; otherwise, waivers and/or reimbursements are applied against class specific expenses before fund level expenses. Funds Management has committed through April 30, 2019 to waive fees and/or reimburse expenses to the extent necessary to cap the Fund’s expenses at 1.15% for Class 2 shares. After this time, the cap may be increased or the commitment to maintain the cap may be terminated only with the approval of the Board of Trustees.
Distribution fee
The Trust has adopted a distribution plan for Class 2 shares of the Fund pursuant to Rule 12b-1 under the 1940 Act. A distribution fee is charged to Class 2 shares and paid to Wells Fargo Funds Distributor, LLC (“Funds Distributor”), the principal underwriter, at an annual rate of 0.25% of the average daily net assets of Class 2 shares.
Interfund transactions
The Fund may purchase or sell portfolio investment securities to certain other Wells Fargo affiliates pursuant to Rule 17a-7 under the 1940 Act and under procedures adopted by the Board of Trustees. The procedures have been designed to ensure that these interfund transactions, which do not incur broker commissions, are effected at current market prices.
5. INVESTMENT PORTFOLIO TRANSACTIONS
Purchases and sales of investments, excluding U.S. government obligations (if any) and short-term securities, for the six months ended June 30, 2018 were $41,033,368 and $49,418,213, respectively.
6. BANK BORROWINGS
The Trust and Wells Fargo Funds Trust (excluding the money market funds and certain other funds) are parties to a $280,000,000 revolving credit agreement whereby the Fund is permitted to use bank borrowings for temporary or emergency purposes, such as to fund shareholder redemption requests. Interest under the credit agreement is charged to the Fund based on a borrowing rate equal to the higher of the Federal Funds rate in effect on that day plus 1.25% or the overnight LIBOR rate in effect on that day plus 1.25%. In addition, an annual commitment fee equal to 0.25% of the unused balance is allocated to each participating fund.
For the six months ended June 30, 2018, there were no borrowings by the Fund under the agreement.
7. CONCENTRATION RISK
Concentration risks result from exposure to a limited number of sectors. A fund that invests a substantial portion of its assets in any sector may be more affected by changes in that sector than would be a fund whose investments are not heavily weighted in any sector.
8. INDEMNIFICATION
Under the Trust’s organizational documents, the officers and Trustees have been granted certain indemnification rights against certain liabilities that may arise out of performance of their duties to the Trust. Additionally, in the normal course of business, the Trust may enter into contracts with service providers that contain a variety of indemnification clauses. The Trust’s maximum exposure under these arrangements is dependent on future claims that may be made against the Fund and, therefore, cannot be estimated.
9. SUBSEQUENT DISTRIBUTIONS
On July 13, 2018, the Fund declared distributions from short-term capital gains and long-term capital gains to shareholders of record on July 12, 2018. The per share amounts payable on July 16, 2018 were as follows:
| | | | | | | | |
| | | Short-term
capital gains | | | Long-term
capital gains | |
Class 2 | | | $0.37573 | | | | $3.66118 | |
These distributions are not reflected in the accompanying financial statements.
| | | | | | |
| Other information (unaudited) | | Wells Fargo VT Discovery Fund | | | 19 | |
PROXY VOTING INFORMATION
A description of the policies and procedures that the Fund uses to determine how to vote proxies relating to portfolio securities is available, upon request, by calling 1-800-260-5969, visiting our website at wellsfargofunds.com, or visiting the SEC website at sec.gov. Information regarding how the Fund voted proxies relating to portfolio securities during the most recent 12-month period ended June 30 is available on the Fund’s website at wellsfargofunds.com or by visiting the SEC website at sec.gov.
PORTFOLIO HOLDINGS INFORMATION
The complete portfolio holdings for the Fund are publicly available monthly on the Fund’s website (wellsfargofunds.com), on a one-month delayed basis. In addition, top ten holdings information (excluding derivative positions) for the Fund is publicly available on the Fund’s website on a monthly, seven-day or more delayed basis. The Fund files its complete schedule of portfolio holdings with the SEC for the first and third quarters of each fiscal year on Form N-Q, which is available by visiting the SEC website at sec.gov. In addition, the Fund’s Form N-Q may be reviewed and copied at the SEC’s Public Reference Room in Washington, DC, and at regional offices in New York City, at 233 Broadway, and in Chicago, at 175 West Jackson Boulevard, Suite 900. Information about the Public Reference Room may be obtained by calling 1-800-SEC-0330.
| | | | |
| 20 | | Wells Fargo VT Discovery Fund | | Other information (unaudited) |
BOARD OF TRUSTEES AND OFFICERS
Each of the Trustees and Officers1 listed in the table below acts in identical capacities for each fund in the Wells Fargo family of funds, which consists of 154 mutual funds comprising the Wells Fargo Funds Trust, Wells Fargo Variable Trust, Wells Fargo Master Trust and four closed-end funds (collectively the “Fund Complex”). This table should be read in conjunction with the Prospectus and the Statement of Additional Information2. The mailing address of each Trustee and Officer is 525 Market Street, 12th Floor, San Francisco, CA 94105. Each Trustee and Officer serves an indefinite term, however, each Trustee serves such term until reaching the mandatory retirement age established by the Trustees.
Independent Trustees
| | | | | | |
Name and year of birth | | Position held and length of service* | | Principal occupations during past five years or longer | | Current other public company or investment company directorships |
William R. Ebsworth (Born 1957) | | Trustee, since 2015 | | Retired. From 1984 to 2013, equities analyst, portfolio manager, research director and chief investment officer at Fidelity Management and Research Company in Boston, Tokyo, and Hong Kong, and retired in 2013 as Chief Investment Officer of Fidelity Strategic Advisers, Inc. where he led a team of investment professionals managing client assets. Prior thereto, Board member of Hong Kong Securities Clearing Co., Hong Kong Options Clearing Corp., the Thailand International Fund, Ltd., Fidelity Investments Life Insurance Company, and Empire Fidelity Investments Life Insurance Company. Board member of the Forté Foundation (non-profit organization) and the Vincent Memorial Hospital Endowment (non-profit organization), where he serves on the Investment Committee and as a Chair of the Audit Committee. Mr. Ebsworth is a CFA® charterholder. | | Asset Allocation Trust |
Jane A. Freeman (Born 1953) | | Trustee, since 2015; Chair Liaison, since 2018 | | Retired. From 2012 to 2014 and 1999 to 2008, Chief Financial Officer of Scientific Learning Corporation. From 2008 to 2012, Ms. Freeman provided consulting services related to strategic business projects. Prior to 1999, Portfolio Manager at Rockefeller & Co. and Scudder, Stevens & Clark. Board member of the Harding Loevner Funds from 1996 to 2014, serving as both Lead Independent Director and chair of the Audit Committee. Board member of the Russell Exchange Traded Funds Trust from 2011 to 2012 and the chair of the Audit Committee. Ms. Freeman is a Board Member of Ruth Bancroft Garden (non-profit organization) and the Glimmerglass Festival. She is also an inactive Chartered Financial Analyst. | | Asset Allocation Trust |
Isaiah Harris, Jr. (Born 1952) | | Trustee, since 2009 | | Retired. Chairman of the Board of CIGNA Corporation since 2009, and Director since 2005. From 2003 to 2011, Director of Deluxe Corporation. Prior thereto, President and CEO of BellSouth Advertising and Publishing Corp. from 2005 to 2007, President and CEO of BellSouth Enterprises from 2004 to 2005 and President of BellSouth Consumer Services from 2000 to 2003. Emeritus member of the Iowa State University Foundation Board of Governors. Emeritus Member of the Advisory Board of Iowa State University School of Business. Advisory Board Member, Palm Harbor Academy (charter school). Advisory Board Member, Child Evangelism Fellowship (non-profit). Mr. Harris is a certified public accountant (inactive status). | | CIGNA Corporation; Asset Allocation Trust |
Judith M. Johnson (Born 1949) | | Trustee, since 2008; Audit Committee Chairman, since 2009 | | Retired. Prior thereto, Chief Executive Officer and Chief Investment Officer of Minneapolis Employees Retirement Fund from 1996 to 2008. Ms. Johnson is an attorney, certified public accountant and a certified managerial accountant. | | Asset Allocation Trust |
David F. Larcker (Born 1950) | | Trustee, since 2009 | | James Irvin Miller Professor of Accounting at the Graduate School of Business, Stanford University, Director of the Corporate Governance Research Initiative and Senior Faculty of The Rock Center for Corporate Governance since 2006. From 2005 to 2008, Professor of Accounting at the Graduate School of Business, Stanford University. Prior thereto, Ernst & Young Professor of Accounting at The Wharton School, University of Pennsylvania from 1985 to 2005. | | Asset Allocation Trust |
| | | | | | |
| Other information (unaudited) | | Wells Fargo VT Discovery Fund | | | 21 | |
| | | | | | |
Name and year of birth | | Position held and length of service* | | Principal occupations during past five years or longer | | Current other public company or investment company directorships |
Olivia S. Mitchell (Born 1953) | | Trustee, since 2006; Governance Committee Chairman, since 2018 | | International Foundation of Employee Benefit Plans Professor, Wharton School of the University of Pennsylvania since 1993. Director of Wharton’s Pension Research Council and Boettner Center on Pensions & Retirement Research, and Research Associate at the National Bureau of Economic Research. Previously, Cornell University Professor from 1978 to 1993. | | Asset Allocation Trust |
Timothy J. Penny (Born 1951) | | Trustee, since 1996; Chairman, since 2018; Vice Chairman, from 2017 to 2018 | | President and Chief Executive Officer of Southern Minnesota Initiative Foundation, a non-profit organization, since 2007. Member of the Board of Trustees of NorthStar Education Finance, Inc., a non-profit organization, since 2007. | | Asset Allocation Trust |
James G. Polisson (Born 1959) | | Trustee, since 2018; Advisory Board Member, from 2017 to 2018 | | Retired. Chief Marketing Officer, Source (ETF) UK Services, Ltd, from 2015 to 2017. From 2012 to 2015, Principal of The Polisson Group, LLC, a management consulting, corporate advisory and principal investing company. Chief Executive Officer and Managing Director at Russell Investments, Global Exchange Traded Funds from 2010 to 2012. Managing Director of Barclays Global Investors from 1998 to 2010 and Global Chief Marketing Officer for iShares and Barclays Global Investors from 2000 to 2010. Trustee of the San Francisco Mechanics’ Institute, a non-profit organization, from 2013 to 2015. Board member of the Russell Exchange Traded Fund Trust from 2011 to 2012. Director of Barclays Global Investors Holdings Deutschland GmbH from 2006 to 2009. Mr. Polisson is an attorney and has a retired status with the Massachusetts and District of Columbia Bar Associations. | | Asset Allocation Trust |
Michael S. Scofield (Born 1943) | | Trustee, since 2010 | | Served on the Investment Company Institute’s Board of Governors and Executive Committee from 2008-2011 as well the Governing Council of the Independent Directors Council from 2006-2011 and the Independent Directors Council Executive Committee from 2008-2011. Trustee of the Evergreen Fund complex (and its predecessors) from 1984 to 2010. Chairman of the Evergreen Funds from 2000-2010. Former Trustee of the Mentor Funds. Retired Attorney, Law Offices of Michael S. Scofield. | | Asset Allocation Trust |
Pamela Wheelock (Born 1959) | | Trustee, since 2018; Advisory Board Member, from 2017 to 2018 | | Chief Operating Officer, Twin Cities Habitat for Humanity, since January, 2017. Vice President of University Services, University of Minnesota from 2012 to 2017. Prior thereto, on the Board of Directors, Goverance Committee and Finance Committee for the Minnesota Philanthropy Partners (Saint Paul Foundation) from 2012 to 2018, Interim President and Chief Executive Officer of Blue Cross Blue shield of Minnesota of Minnesota from 2010 to 2011, Chairman of the Board from 2009 to 2011 and Board Director 2003 to 2015. Vice President, Leadership and Community Engagement, Bush Foundation, Saint Paul, Minnesota (a private foundation) from 2009 to 2011. Executive Vice President and Chief Financial Officer, Minnesota Sports and Entertainment from 2004 to 2009 and Senior Vice President from 2002 to 2004. Commissioner of Finance, State of Minnesota, from 1999 to 2002. Currently the Board Chair of the Minnesota Wild Foundation since 2010. | | Asset Allocation Trust |
| * | Length of service dates reflect the Trustee’s commencement of service with the Trust’s predecessor entities, where applicable. |
| | | | |
| 22 | | Wells Fargo VT Discovery Fund | | Other information (unaudited) |
Officers
| | | | | | |
Name and year of birth | | Position held and length of service | | Principal occupations during past five years or longer | | |
Andrew Owen (Born 1960) | | President, since 2017 | | Executive Vice President of Wells Fargo & Company and Head of Affiliated Managers, Wells Fargo Asset Management, since 2014. In addition, Mr. Owen is currently President, Chief Executive Officer and Director of Wells Fargo Funds Management, LLC since 2017. Prior thereto, Executive Vice President responsible for marketing, investments and product development for Wells Fargo Funds Management, LLC, from 2009 to 2014. | | |
Jeremy DePalma1 (Born 1974) | | Treasurer, since 2012 | | Senior Vice President of Wells Fargo Funds Management, LLC since 2009. Senior Vice President of Evergreen Investment Management Company, LLC from 2008 to 2010 and head of the Fund Reporting and Control Team within Fund Administration from 2005 to 2010. | | |
Alexander Kymn3 (Born 1973) | | Secretary, since 2018; Chief Legal Officer, since 2018 | | Senior Company Counsel of Wells Fargo Bank, N.A. since 2018 (previously Senior Counsel from 2007 to 2018). Vice President of Wells Fargo Funds Management, LLC from 2008 to 2014. | | |
Michael H. Whitaker (Born 1967) | | Chief Compliance Officer, since 2016 | | Senior Vice President and Chief Compliance Officer since 2016. Senior Vice President and Chief Compliance Officer for Fidelity Investments from 2007 to 2016. | | |
David Berardi (Born 1975) | | Assistant Treasurer, since 2009 | | Vice President of Wells Fargo Funds Management, LLC since 2009. Vice President of Evergreen Investment Management Company, LLC from 2008 to 2010. Manager of Fund Reporting and Control for Evergreen Investment Management Company, LLC from 2004 to 2010. | | |
| 1 | Jeremy DePalma acts as Treasurer of 77 funds and Assistant Treasurer of 77 funds in the Fund Complex. |
| 2 | The Statement of Additional Information includes additional information about the Trustees and is available, without charge, upon request, by calling 1-800-260-5969 or by visiting the website at wellsfargofunds.com. |
| 3 | Alexander Kymn became the Secretary and Chief Legal Officer effective April 17, 2018. |
| | | | | | |
| Other information (unaudited) | | Wells Fargo VT Discovery Fund | | | 23 | |
BOARD CONSIDERATION OF INVESTMENT MANAGEMENT AND SUB-ADVISORY AGREEMENTS:
Wells Fargo VT Discovery Fund
Under the Investment Company Act of 1940 (the “1940 Act”), the Board of Trustees (the “Board”) of Wells Fargo Variable Trust (the “Trust”) must determine annually whether to approve the continuation of the Trust’s investment management and sub-advisory agreements. In this regard, at an in-person meeting held on May 22-23, 2018 (the “Meeting”), the Board, all the members of which have no direct or indirect interest in the investment management and sub-advisory agreements and are not “interested persons” of the Trust, as defined in the 1940 Act (the “Independent Trustees”), reviewed and approved for Wells Fargo VT Discovery Fund (the “Fund”): (i) an investment management agreement (the “Management Agreement”) with Wells Fargo Funds Management, LLC (“Funds Management”); and (ii) an investment sub-advisory agreement (the “Sub-Advisory Agreement”) with Wells Capital Management Incorporated (the “Sub-Adviser”), an affiliate of Funds Management. The Management Agreement and the Sub-Advisory Agreement are collectively referred to as the “Advisory Agreements.”
At the Meeting, the Board considered the factors and reached the conclusions described below relating to the selection of Funds Management and the Sub-Adviser and the approval of the Advisory Agreements. Prior to the Meeting, including at an in-person meeting in April 2018, the Trustees conferred extensively among themselves and with representatives of Funds Management about these matters. Also, the Board has adopted a team-based approach, with each team consisting of a sub-set of Trustees, to assist the full Board in the discharge of its duties in reviewing investment performance and other matters throughout the year. The Independent Trustees were assisted in their evaluation of the Advisory Agreements by independent legal counsel, from whom they received separate legal advice and with whom they met separately.
In providing information to the Board, Funds Management and the Sub-Adviser were guided by a detailed set of requests for information submitted to them by independent legal counsel on behalf of the Independent Trustees at the start of the Board’s annual contract renewal process earlier in 2018. In considering and approving the Advisory Agreements, the Trustees considered the information they believed relevant, including but not limited to the information discussed below. The Board considered not only the specific information presented in connection with the Meeting, but also the knowledge gained over time through interaction with Funds Management and the Sub-Adviser about various topics. In this regard, the Board reviewed reports of Funds Management at each of its quarterly meetings, which included, among other things, portfolio reviews and investment performance reports. In addition, the Board and the teams mentioned above confer with portfolio managers at various times throughout the year. The Board did not identify any particular information or consideration that was all-important or controlling, and each individual Trustee may have attributed different weights to various factors.
After its deliberations, the Board unanimously approved the continuation of the Advisory Agreements for a one-year term and determined that the compensation payable to Funds Management and the Sub-Adviser under each of the Advisory Agreements was reasonable. The Board considered the approval of the Advisory Agreements for the Fund as part of its consideration of agreements for funds across the complex, but its approvals were made on a fund-by-fund basis. The following summarizes a number of important, but not necessarily all, factors considered by the Board in support of its approvals.
Nature, extent and quality of services
The Board received and considered various information regarding the nature, extent and quality of services provided to the Fund by Funds Management and the Sub-Adviser under the Advisory Agreements. This information included a description of the investment advisory services and Fund-level administrative services covered by the Management Agreement, as well as, among other things, a summary of the background and experience of senior management of Wells Fargo Asset Management (“WFAM”), of which Funds Management and the Sub-Adviser are a part, a summary of investments made in the business of WFAM, a summary of certain organizational and personnel changes involving Funds Management and the Sub-Adviser, and a description of Funds Management’s and the Sub-Adviser’s business continuity planning programs and of their approaches to data privacy and cybersecurity. The Board also considered the qualifications, background, tenure and responsibilities of each of the portfolio managers primarily responsible for the day-to-day portfolio management of the Fund.
The Board evaluated the ability of Funds Management and the Sub-Adviser to attract and retain qualified investment professionals, including research, advisory and supervisory personnel. The Board further considered the compliance programs and compliance records of Funds Management and the Sub-Adviser. In addition, the Board took into account the full range of services provided to the Fund by Funds Management and its affiliates.
| | | | |
| 24 | | Wells Fargo VT Discovery Fund | | Other information (unaudited) |
Fund investment performance and expenses
The Board considered the investment performance results for the Fund over various time periods ended December 31, 2017. The Board considered these results in comparison to the investment performance of funds in a universe that was determined by Broadridge Inc. (“Broadridge”) to be similar to the Fund (the “Universe”), and in comparison to the Fund’s benchmark index and to other comparative data. Broadridge is an independent provider of investment company data. The Board received a description of the methodology used by Broadridge to select the mutual funds in the performance Universe. The Board noted that the investment performance of the Fund was higher than the average investment performance of the Universe for all periods under review. The Board also noted that the investment performance of the Fund was higher than or in range of its benchmark index, the Russell 2500 Growth Index, for the one-, three- and ten-year periods under review, but lower than its benchmark index for the five-year period under review.
The Board received information concerning, and discussed factors contributing to, the underperformance of the Fund relative to the benchmark for the period identified above. The Board took note of the explanations for the relative underperformance during this period, including with respect to investment decisions and market factors that affected the Fund’s investment performance. The Board also took note of the Fund’s outperformance relative to the Universe for all periods under review.
The Board also received and considered information regarding the Fund’s net operating expense ratio and its various components, including actual management fees, custodian and other non-management fees, and Rule 12b-1 and non-Rule 12b-1 shareholder service fees. The Board considered these ratios in comparison to the median ratio of funds in a class-specific expense group that was determined by Broadridge to be similar to the Fund (the “Group”). The Board received a description of the methodology used by Broadridge to select the mutual funds in the expense Group and an explanation of how funds comprising expense groups and their expense ratios may vary from year-to-year. Based on the Broadridge reports, the Board noted that the net operating expense ratio of the Fund was in range of the median net operating expense ratio of the expense Group.
The Board took into account the Fund performance and expense information provided to it among the factors considered in deciding to re-approve the Advisory Agreements.
Investment management and sub-advisory fee rates
The Board reviewed and considered the contractual fee rates payable by the Fund to Funds Management under the Management Agreement, as well as the contractual fee rates payable by the Fund to Funds Management for class-level administrative services under a Class-Level Administration Agreement, which include, among other things, class-level transfer agency and sub-transfer agency costs (collectively, the “Management Rate”). The Board also reviewed and considered the contractual investment sub-advisory fee rates that are payable by Funds Management to the Sub-Adviser for investment sub-advisory services.
Among other information reviewed by the Board was a comparison of the Fund’s Management Rate with the average contractual investment management fee rate of funds in the expense Group at a common asset level as well as transfer agency costs of the funds in the expense Groups. The Board noted that the Management Rate of the Fund was equal to the sum of these average rates for the Fund’s expense Group.
The Board also received and considered information about the portion of the total management fee that was retained by Funds Management after payment of the fee to the Sub-Adviser for sub-advisory services. In assessing the reasonableness of this amount, the Board received and evaluated information about the nature and extent of responsibilities retained and risks assumed by Funds Management and not delegated to or assumed by the Sub-Adviser, and about Funds Management’s on-going oversight services. Given the affiliation between Funds Management and the Sub-Adviser, the Board ascribed limited relevance to the allocation of fees between them.
The Board also received and considered information about the nature and extent of services offered and fee rates charged by Funds Management and the Sub-Adviser to other types of clients with investment strategies similar to those of the Fund. In this regard, the Board received information about the significantly greater scope of services, and compliance, reporting and other legal burdens and risks of managing mutual funds compared with those associated with managing assets of non-mutual fund clients such as institutional separate accounts.
Based on its consideration of the factors and information it deemed relevant, including those described here, the Board determined that the compensation payable to Funds Management under the Management Agreement and to the Sub-Adviser under the Sub-Advisory Agreement was reasonable.
| | | | | | |
| Other information (unaudited) | | Wells Fargo VT Discovery Fund | | | 25 | |
Profitability
The Board received and considered information concerning the profitability of Funds Management, as well as the profitability of both WFAM and Wells Fargo & Co. (“Wells Fargo”) as a whole, from providing services to the Fund and the fund family as a whole. The Board noted that the Sub-Adviser’s profitability information with respect to providing services to the Fund was subsumed in the WFAM and Wells Fargo profitability analysis.
Funds Management reported on the methodologies and estimates used in calculating profitability, including a description of the methodology used to allocate certain expenses and recent enhancements made to the methodology. Among other things, the Board noted that the levels of profitability reported on a fund-by-fund basis varied widely, depending on factors such as the size and type of fund. Based on its review, the Board did not deem the profits reported by Funds Management, WFAM or Wells Fargo from services provided to the Fund to be at a level that would prevent it from approving the continuation of the Advisory Agreements.
Economies of scale
The Board considered the extent to which Funds Management may experience economies of scale in the provision of management services, and the extent to which scale benefits, if any, would be shared with shareholders. In particular, the Board noted the existence of breakpoints in the Fund’s management fee structure, which operate generally to reduce the Fund’s expense ratios as the Fund grows in size. It considered that, for a small fund or a fund that shrinks in size, breakpoints conversely can result in higher fee levels. The Board also considered that in addition to management fee breakpoints, competitive management fee rates set at the outset without regard to breakpoints and fee waiver and expense reimbursement arrangements, as well as investments in the business intended to enhance services available to Fund shareholders, are means of sharing potential economies of scale with shareholders of the Fund.
The Board concluded that the Fund’s fee and expense arrangements, including contractual breakpoints, constituted a reasonable approach to sharing potential economies of scale with the Fund and its shareholders.
Other benefits to Funds Management and the Sub-Adviser
The Board received and considered information regarding potential “fall-out” or ancillary benefits received by Funds Management and its affiliates, including the Sub-Adviser, as a result of their relationships with the Fund. Ancillary benefits could include, among others, benefits directly attributable to other relationships with the Fund and benefits potentially derived from an increase in Funds Management’s and the Sub-Adviser’s business as a result of their relationships with the Fund. The Board noted that various affiliates of Funds Management may receive distribution-related fees, shareholder servicing payments and sub-transfer agency fees in respect of shares sold or held through them and services provided.
The Board also reviewed information about soft dollar credits earned and utilized by the Sub-Adviser, fees earned by Funds Management and the Sub-Adviser from managing a private investment vehicle for the fund family’s securities lending collateral and commissions earned by an affiliated broker from portfolio transactions.
Based on its consideration of the factors and information it deemed relevant, including those described here, the Board did not find that any ancillary benefits received by Funds Management and its affiliates, including the Sub-Adviser, were unreasonable.
Conclusion
At the Meeting, after considering the above-described factors and based on its deliberations and its evaluation of the information described above, the Board unanimously approved the continuation of the Advisory Agreements for a one-year term and determined that the compensation payable to Funds Management and the Sub-Adviser under each of the Advisory Agreements was reasonable.
This page is intentionally left blank.
This page is intentionally left blank.
This page is intentionally left blank.

For more information
More information about Wells Fargo Funds is available free upon request. To obtain literature, please write, email, visit the Fund’s website, or call:
Wells Fargo Funds
P.O. Box 8266
Boston, MA 02266-8266
Email: fundservice@wellsfargo.com
Website: wellsfargofunds.com
Individual investors: 1-800-222-8222
Retail investment professionals: 1-888-877-9275
Institutional investment professionals: 1-866-765-0778
This report and the financial statements contained herein are submitted for the general information of the shareholders of the Fund. If this report is used for promotional purposes, distribution of the report must be accompanied or preceded by a current prospectus. Before investing, please consider the investment objectives, risks, charges, and expenses of the investment. For a current prospectus and, if available, a summary prospectus, containing this information, call 1-800-260-5969 or visit the Fund’s website at wellsfargofunds.com. Read the prospectus carefully before you invest or send money.
Wells Fargo Asset Management (WFAM) is the trade name for certain investment advisory/management firms owned by Wells Fargo & Company. These firms include but are not limited to Wells Capital Management Incorporated and Wells Fargo Funds Management, LLC. Certain products managed by WFAM entities are distributed by Wells Fargo Funds Distributor, LLC (a broker/dealer and Member FINRA).
This material is for general informational and educational purposes only and is NOT intended to provide investment advice or a recommendation of any kind—including a recommendation for any specific investment, strategy, or plan.
NOT FDIC INSURED ◾ NO BANK GUARANTEE ◾ MAY LOSE VALUE
© 2018 Wells Fargo Funds Management, LLC. All rights reserved.
| | |
| | 314252 08-18 SVT1/SAR138 06-18 |
Semi-Annual Report
June 30, 2018

Wells Fargo VT Index Asset Allocation Fund


Reduce clutter. Save trees.
Sign up for electronic delivery of prospectuses and shareholder reports at wellsfargo.com/advantagedelivery
Contents
The views expressed and any forward-looking statements are as of June 30, 2018, unless otherwise noted, and are those of the Fund managers and/or Wells Fargo Funds Management, LLC. Discussions of individual securities, or the markets generally, or any Wells Fargo Fund are not intended as individual recommendations. Future events or results may vary significantly from those expressed in any forward-looking statements. The views expressed are subject to change at any time in response to changing circumstances in the market. Wells Fargo Funds Management, LLC and the Fund disclaim any obligation to publicly update or revise any views expressed or forward-looking statements.
NOT FDIC INSURED ◾ NO BANK GUARANTEE ◾ MAY LOSE VALUE
| | | | |
| 2 | | Wells Fargo VT Index Asset Allocation Fund | | Letter to shareholders (unaudited) |

Andrew Owen
President
Wells Fargo Funds
Globally, economies strengthened, equity markets advanced, and foreign bonds outperformed fixed-income investments in the U.S.
During February 2018, the U.S. stock market endured a loss of more than 10% before recovering in March and April.
Dear Shareholder:
We are pleased to offer you this semi-annual report for the Wells Fargo VT Index Asset Allocation Fund for the six-month period that ended June 30, 2018. Globally, economies strengthened, equity markets advanced, and foreign bonds outperformed fixed-income investments in the U.S.
For the period, U.S. stocks, as measured by the S&P 500 Index,1 gained 2.65%, and international stocks, as measured by the MSCI ACWI ex USA Index (Net),2 dropped 3.77%. Emerging market stocks, as measured by the MSCI EM Index (Net),3 fell 6.66%. In bond markets, the Bloomberg Barclays U.S. Aggregate Bond Index4 declined 1.62% while fixed-income investments outside the U.S. lost 1.31%, according to the Bloomberg Barclays Global Aggregate ex-USD Index.5 The Bloomberg Barclays Municipal Bond Index6 fell 0.25%, and the ICE BofAML U.S. High Yield Index7 was up 0.08%.
Volatility reemerged during the first quarter of 2018 as economic signals were mixed.
The first quarter of 2018 began with stock market gains in January after the U.S. announced tax reform measures intended to lower rates for individuals and corporations. Then, investor optimism was supplanted by several concerns. Trade tensions emerged, particularly between the U.S. and China, as the U.S. threatened to impose tariffs on a broad range of imported products. Increasing interest rates and inflation also caused concern. During February 2018, the U.S. stock market endured a loss of more than 10% before recovering in March and April. The S&P 500 Index closed the first quarter with a negative return, the first negative quarterly return for the index since 2014.
The U.S. Federal Reserve (Fed) increased the federal funds rate by 25 basis points (bps; 100 bps equal 1.00%) in March and the rate of inflation reached the Fed’s 2% target for the first time in a year. The unemployment rate fell to 4.1% by March 2018 and wage growth data improved. The third revision of gross domestic product growth for the first quarter by the U.S. Bureau of Economic Analysis released during June was lowered to 2.0%.
Overseas, investment market returns reversed the strong returns of 2017—the MSCI ACWI ex USA Index (Net) gained 27.19% for the 12-month period—falling 0.43% through the end of the second quarter of 2018. Although central banks, including the European Central Bank and the Bank of Japan, maintained low interest rates and quantitative easing measures that are generally supportive of
| 1 | The S&P 500 Index consists of 500 stocks chosen for market size, liquidity, and industry group representation. It is a market-value-weighted index with each stock’s weight in the index proportionate to its market value. You cannot invest directly in an index. |
| 2 | The Morgan Stanley Capital International (MSCI) All Country World Index (ACWI) ex USA Index (Net) is a free-float-adjusted market-capitalization-weighted index that is designed to measure the equity market performance of developed markets, excluding the United States and Canada. Source: MSCI. MSCI makes no express or implied warranties or representations and shall have no liability whatsoever with respect to any MSCI data contained herein. The MSCI data may not be further redistributed or used as a basis for other indices or any securities or financial products. This report is not approved, reviewed, or produced by MSCI. You cannot invest directly in an index. |
| 3 | The MSCI Emerging Markets (EM) Index (Net) is a free-float-adjusted market-capitalization-weighted index that is designed to measure large- and mid-cap equity market performance of emerging markets. The MSCI EM Index (Net) consists of the following 24 emerging market country indices: Brazil, Chile, China, Colombia, Czech Republic, Egypt, Greece, Hungary, India, Indonesia, Korea, Malaysia, Mexico, Pakistan, Peru, the Philippines, Poland, Qatar, Russia, South Africa, Taiwan, Thailand, Turkey, and the United Arab Emirates. You cannot invest directly in an index. |
| 4 | The Bloomberg Barclays U.S. Aggregate Bond Index is a broad-based benchmark that measures the investment-grade, U.S. dollar-denominated, fixed-rate taxable bond market, including Treasuries, government-related and corporate securities, mortgage-backed securities (agency fixed-rate and hybrid adjustable-rate mortgage pass-throughs), asset-backed securities, and commercial mortgage-backed securities. You cannot invest directly in an index. |
| 5 | The Bloomberg Barclays Global Aggregate ex-USD Index is an unmanaged index that provides a broad-based measure of the global investment-grade fixed-income markets excluding the U.S. dollar-denominated debt market. You cannot invest directly in an index. |
| 6 | The Bloomberg Barclays Municipal Bond Index is an unmanaged index composed of long-term tax-exempt bonds with a minimum credit rating of Baa. You cannot invest directly in an index. |
| 7 | The ICE BofAML U.S. High Yield Index is a market-capitalization-weighted index of domestic and Yankee high-yield bonds. The index tracks the performance of high-yield securities traded in the U.S. bond market. You cannot invest directly in an index. Copyright 2018. ICE Data Indices, LLC. All rights reserved. |
| 8 | The Consumer Price Index (CPI) is a measure of the average change over time in the prices paid by urban consumers for a market basket of consumer goods and services. You cannot invest directly in an index. |
| | | | | | |
| Letter to shareholders (unaudited) | | Wells Fargo VT Index Asset Allocation Fund | | | 3 | |
businesses and equity markets, the U.S. dollar strengthened relative to local currencies, which served to restrain returns.
Global trade tensions escalated during the second quarter of 2018.
Global trade tensions escalated as the second quarter of 2018 opened and equity markets fell in response before resuming upward momentum later in April. The CPI8 for All Urban Consumers added 0.2% in May after a similar increase in April. On a year-over-year basis, the all-items index rose 2.8% for the 12 months that ended May 31, continuing its upward trend since the beginning of the year. The index for all items less food and energy rose 2.2% for the same 12-month period.
During June 2018, the Fed increased the federal funds rate by another 25 bps. Market expectations increased that the Fed might announce two more rate increases in 2018. The unemployment rate fell to an 18-year low of 3.8% in May and wage growth data improved. Internationally, central banks maintained their low interest rates and monetary policies that were accommodative of business activity.
Interest rates generally increased and the bond markets tended to decline. Long-term interest rates in the U.S. trended higher—rates on the 10-year and 30-year Treasury bonds moved from 2.46% and 2.81%, respectively, at the beginning of the year on January 1, 2018, to 2.85% and 2.98%, respectively, on June 30, 2018, well off their highest levels during the first half of the year of 3.11% and 3.25%, respectively, on May 17, 2018.
Despite the positive economic and business trends globally, international stock values fell and U.S. stock gains moderated during most of the second quarter of 2018 due to escalating tensions as the U.S. imposed tariffs on foreign goods and countries outside of the U.S. imposed tariffs of their own on U.S. products in response.
Don’t let short-term uncertainty derail long-term investment goals.
Periods of investment uncertainty can present challenges, but experience has taught us that maintaining long-term investment goals can be an effective way to plan for the future. To help you create a sound strategy based on your personal goals and risk tolerance, Wells Fargo Funds offers more than 100 mutual funds spanning a wide range of asset classes and investment styles. Although diversification cannot guarantee an investment profit or prevent losses, we believe it can be an effective way to manage investment risk and potentially smooth out overall portfolio performance. We encourage investors to know their investments and to understand that appropriate levels of risk-taking may unlock opportunities.
Thank you for choosing to invest with Wells Fargo Funds. We appreciate your confidence in us and remain committed to helping you meet your financial needs.
Sincerely,

Andrew Owen
President
Wells Fargo Funds
For further information about your Fund, contact your investment professional, visit our website at wellsfargofunds.com, or call us directly at 1-800-260-5969.
| | | | |
| 4 | | Wells Fargo VT Index Asset Allocation Fund | | Performance highlights (unaudited) |
Investment objective
The Fund seeks long-term total return, consisting of capital appreciation and current income.
Manager
Wells Fargo Funds Management, LLC
Subadviser
Wells Capital Management Incorporated
Portfolio managers
Kandarp Acharya, CFA®, FRM
Petros Bocray, CFA®, FRM
Christian L. Chan, CFA®
Average annual total returns (%) as of June 30, 2018
| | | | | | | | | | | | | | | | | | | | | | |
| | | | | | | | Expense ratios1 (%) | |
| | | Inception date | | 1 year | | | 5 year | | | 10 year | | | Gross | | | Net2 | |
| Class 2 | | 4-15-1994 | | | 7.45 | | | | 9.77 | | | | 8.13 | | | | 1.16 | | | | 1.00 | |
| Index Asset Allocation Blended Index3 | | – | | | 8.24 | | | | 10.17 | | | | 9.22 | | | | – | | | | – | |
| Bloomberg Barclays U.S. Treasury Index4 | | – | | | (0.65 | ) | | | 1.48 | | | | 2.97 | | | | – | | | | – | |
| S&P 500 Index5 | | – | | | 14.37 | | | | 13.42 | | | | 10.17 | | | | – | | | | – | |
Figures quoted represent past performance, which is no guarantee of future results. Investment return and principal value of an investment will fluctuate so that an investor’s shares, when redeemed, may be worth more or less than their original cost. Current performance may be lower or higher than the performance data quoted and assumes the reinvestment of dividends and capital gains. Current month-end performance is available by calling 1-800-260-5969. Performance figures of the Fund do not reflect fees charged pursuant to the terms of variable life insurance policies and variable annuity contracts. If these charges had been reflected, performance would have been lower.
Shares are sold without a front-end sales charge or contingent deferred sales charge.
Index returns do not include transaction costs associated with buying and selling securities, any mutual fund fees or expenses, or any taxes. It is not possible to invest directly in an index.
Balanced funds may invest in stocks and bonds. Stock values fluctuate in response to the activities of individual companies and general market and economic conditions. Bond values fluctuate in response to the financial condition of individual issuers, general market and economic conditions, and changes in interest rates. Changes in market conditions and government policies may lead to periods of heightened volatility in the bond market and reduced liquidity for certain bonds held by the Fund. In general, when interest rates rise, bond values fall and investors may lose principal value. Interest rate changes and their impact on the Fund and its share price can be sudden and unpredictable. The use of derivatives may reduce returns and/or increase volatility. Consult the Fund’s prospectus for additional information on these and other risks.
Please refer to the prospectus provided by your participating insurance company for detailed information describing the separate accounts for information regarding surrender charges, mortality and expense risk fees, and other charges that may be assessed by the participating insurance companies.
Please see footnotes on page 5.
| | | | | | |
| Performance highlights (unaudited) | | Wells Fargo VT Index Asset Allocation Fund | | | 5 | |
| | | | |
| Ten largest holdings (%) as of June 30, 20186 | |
Apple Incorporated | | | 2.39 | |
Microsoft Corporation | | | 1.96 | |
Amazon.com Incorporated | | | 1.78 | |
Facebook Incorporated Class A | | | 1.21 | |
Berkshire Hathaway Incorporated Class B | | | 0.93 | |
JPMorgan Chase & Company | | | 0.92 | |
Exxon Mobil Corporation | | | 0.91 | |
Alphabet Incorporated Class C | | | 0.88 | |
Alphabet Incorporated Class A | | | 0.87 | |
Johnson & Johnson | | | 0.84 | |
|
| Current target allocation as of June 30, 20188 |
|
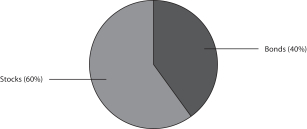 |
|
| Equity sector distribution as of June 30, 20187 |
|
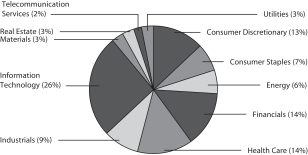
|
|
| Neutral target allocation |
|
|
| 1 | Reflects the expense ratios as stated in the most recent prospectus. The expense ratios shown are subject to change and may differ from the annualized expense ratios shown in the financial highlights of this report. |
| 2 | The manager has contractually committed through April 30, 2019, to waive fees and/or reimburse expenses to the extent necessary to cap the Fund’s Total Annual Fund Operating Expenses After Fee Waiver at the amount shown. After this time, the cap may be increased or the commitment to maintain the cap may be terminated only with the approval of the Board of Trustees. Brokerage commissions, stamp duty fees, interest, taxes, acquired fund fees and expenses (if any), and extraordinary expenses are excluded from the expense cap. Without this cap, the Fund’s returns would have been lower. The expense ratio paid by an investor is the net expense ratio (the total annual fund operating expenses after fee waivers) as stated in the prospectus. |
| 3 | Source: Wells Fargo Funds Management, LLC. The Index Asset Allocation Blended Index is weighted 60% in the S&P 500 Index and 40% in the Bloomberg Barclays U.S. Treasury Index. You cannot invest directly in an index. |
| 4 | The Bloomberg Barclays U.S. Treasury Index is an unmanaged index of prices of U.S. Treasury bonds with maturities of 1 to 30 years. You cannot invest directly in an index. |
| 5 | The S&P 500 Index consists of 500 stocks chosen for market size, liquidity, and industry group representation. It is a market-value-weighted index with each stock’s weight in the index proportionate to its market value. You cannot invest directly in an index. |
| 6 | The ten largest holdings, excluding cash, cash equivalents and any money market funds, are calculated based on the value of the investments divided by total net assets of the Fund. Holdings are subject to change and may have changed since the date specified. |
| 7 | Amounts are calculated based on the total long-term investments of the Fund. These amounts are subject to change and may have changed since the date specified. |
| 8 | Current target allocation includes the effect of any tactical futures overlay that may be in place. These amounts are subject to change and may have changed since the date specified. |
| | | | |
| 6 | | Wells Fargo VT Index Asset Allocation Fund | | Fund expenses (unaudited) |
As a shareholder of the Fund, you incur ongoing costs, including management fees, distribution (12b-1) fees, and other Fund expenses. This example is intended to help you understand your ongoing costs (in dollars) of investing in the Fund and to compare these costs with the ongoing costs of investing in other mutual funds.
The example is based on an investment of $1,000 invested at the beginning of the six-month period and held for the entire period from January 1, 2018 to June 30, 2018.
Actual expenses
The “Actual” line of the table below provides information about actual account values and actual expenses. You may use the information in this line, together with the amount you invested, to estimate the expenses that you paid over the period. Simply divide your account value by $1,000 (for example, an $8,600 account value divided by $1,000 = 8.6), then multiply the result by the number in the “Actual” line under the heading entitled “Expenses paid during period” for your applicable class of shares to estimate the expenses you paid on your account during this period.
Hypothetical example for comparison purposes
The “Hypothetical” line of the table below provides information about hypothetical account values and hypothetical expenses based on the Fund’s actual expense ratio and an assumed rate of return of 5% per year before expenses, which is not the Fund’s actual return. The hypothetical account values and expenses may not be used to estimate the actual ending account balance or expenses you paid for the period. You may use this information to compare the ongoing costs of investing in the Fund and other funds. To do so, compare this 5% hypothetical example with the 5% hypothetical examples that appear in the shareholder reports of the other funds.
Please note that the expenses shown in the table are meant to highlight your ongoing costs only and do not reflect any separate account charges assessed by participating insurance companies. Therefore, the “Hypothetical” line of the table is useful in comparing ongoing costs only, and will not help you determine the relative total costs of owning different funds. In addition, if these separate account charges assessed by participating insurance companies were included, your costs would have been higher.
| | | | | | | | | | | | | | | | |
| | | Beginning
account value
1-1-2018 | | | Ending
account value
6-30-2018 | | | Expenses
paid during
the period¹ | | | Annualized net
expense ratio | |
Class 2 | | | | | | | | | | | | | | | | |
Actual | | $ | 1,000.00 | | | $ | 1,055.50 | | | $ | 5.10 | | | | 1.00 | % |
Hypothetical (5% return before expenses) | | $ | 1,000.00 | | | $ | 1,019.84 | | | $ | 5.01 | | | | 1.00 | % |
| 1 | Expenses paid is equal to the annualized net expense ratio multiplied by the average account value over the period, multiplied by the number of days in the most recent fiscal half-year divided by the number of days in the fiscal year (to reflect the one-half-year period). |
| | | | | | |
| Portfolio of investments—June 30, 2018 (unaudited) | | Wells Fargo VT Index Asset Allocation Fund | | | 7 | |
| | | | | | | | | | | | | | | | |
| Security name | | | | | | | | Shares | | | Value | |
|
Common Stocks: 59.67% | |
|
Consumer Discretionary: 7.71% | |
|
| Auto Components: 0.10% | |
Aptiv plc | | | | | | | | | | | 524 | | | $ | 48,014 | |
BorgWarner Incorporated | | | | | | | | | | | 391 | | | | 16,876 | |
The Goodyear Tire & Rubber Company | | | | | | | | | | | 476 | | | | 11,086 | |
| | | | |
| | | | | | | | | | | | | | | 75,976 | |
| | | | | | | | | | | | | | | | |
|
| Automobiles: 0.26% | |
Ford Motor Company | | | | | | | | | | | 7,762 | | | | 85,925 | |
General Motors Company | | | | | | | | | | | 2,516 | | | | 99,130 | |
Harley-Davidson Incorporated | | | | | | | | | | | 329 | | | | 13,844 | |
| | | | |
| | | | | | | | | | | | | | | 198,899 | |
| | | | | | | | | | | | | | | | |
|
| Distributors: 0.06% | |
Genuine Parts Company | | | | | | | | | | | 290 | | | | 26,619 | |
LKQ Corporation † | | | | | | | | | | | 614 | | | | 19,587 | |
| | | | |
| | | | | | | | | | | | | | | 46,206 | |
| | | | | | | | | | | | | | | | |
|
| Diversified Consumer Services: 0.01% | |
H&R Block Incorporated | | | | | | | | | | | 414 | | | | 9,431 | |
| | | | | | | | | | | | | | | | |
|
| Hotels, Restaurants & Leisure: 0.98% | |
Carnival Corporation | | | | | | | | | | | 805 | | | | 46,135 | |
Chipotle Mexican Grill Incorporated † | | | | | | | | | | | 48 | | | | 20,706 | |
Darden Restaurants Incorporated | | | | | | | | | | | 245 | | | | 26,230 | |
Hilton Worldwide Holdings Incorporated | | | | | | | | | | | 553 | | | | 43,775 | |
Marriott International Incorporated Class A | | | | | | | | | | | 588 | | | | 74,441 | |
McDonald’s Corporation | | | | | | | | | | | 1,557 | | | | 243,966 | |
MGM Resorts International | | | | | | | | | | | 994 | | | | 28,856 | |
Norwegian Cruise Line Holdings Limited † | | | | | | | | | | | 409 | | | | 19,325 | |
Royal Caribbean Cruises Limited | | | | | | | | | | | 335 | | | | 34,706 | |
Starbucks Corporation | | | | | | | | | | | 2,737 | | | | 133,702 | |
Wynn Resorts Limited | | | | | | | | | | | 167 | | | | 27,946 | |
Yum! Brands Incorporated | | | | | | | | | | | 641 | | | | 50,139 | |
| | | | |
| | | | | | | | | | | | | | | 749,927 | |
| | | | | | | | | | | | | | | | |
|
| Household Durables: 0.22% | |
D.R. Horton Incorporated | | | | | | | | | | | 681 | | | | 27,921 | |
Garmin Limited | | | | | | | | | | | 220 | | | | 13,420 | |
Leggett & Platt Incorporated | | | | | | | | | | | 260 | | | | 11,606 | |
Lennar Corporation Class A | | | | | | | | | | | 542 | | | | 28,455 | |
Mohawk Industries Incorporated † | | | | | | | | | | | 125 | | | | 26,784 | |
Newell Rubbermaid Incorporated | | | | | | | | | | | 963 | | | | 24,836 | |
Pulte Group Incorporated | | | | | | | | | | | 520 | | | | 14,950 | |
Whirlpool Corporation | | | | | | | | | | | 127 | | | | 18,571 | |
| | | | |
| | | | | | | | | | | | | | | 166,543 | |
| | | | | | | | | | | | | | | | |
The accompanying notes are an integral part of these financial statements.
| | | | |
| 8 | | Wells Fargo VT Index Asset Allocation Fund | | Portfolio of investments—June 30, 2018 (unaudited) |
| | | | | | | | | | | | | | | | |
| Security name | | | | | | | | Shares | | | Value | |
|
| Internet & Direct Marketing Retail: 2.52% | |
Amazon.com Incorporated † | | | | | | | | | | | 799 | | | $ | 1,358,140 | |
Booking Holdings Incorporated † | | | | | | | | | | | 95 | | | | 192,574 | |
Expedia Incorporated | | | | | | | | | | | 239 | | | | 28,725 | |
Netflix Incorporated † | | | | | | | | | | | 862 | | | | 337,413 | |
TripAdvisor Incorporated † | | | | | | | | | | | 212 | | | | 11,811 | |
| | | | |
| | | | | | | | | | | | | | | 1,928,663 | |
| | | | | | | | | | | | | | | | |
|
| Leisure Products: 0.04% | |
Hasbro Incorporated | | | | | | | | | | | 225 | | | | 20,770 | |
Mattel Incorporated | | | | | | | | | | | 682 | | | | 11,198 | |
| | | | |
| | | | | | | | | | | | | | | 31,968 | |
| | | | | | | | | | | | | | | | |
|
| Media: 1.35% | |
CBS Corporation Class B | | | | | | | | | | | 677 | | | | 38,061 | |
Charter Communications Incorporated Class A † | | | | | | | | | | | 367 | | | | 107,608 | |
Comcast Corporation Class A | | | | | | | | | | | 9,107 | | | | 298,801 | |
Discovery Communications Incorporated Class A † | | | | | | | | | | | 309 | | | | 8,498 | |
Discovery Communications Incorporated Class C † | | | | | | | | | | | 678 | | | | 17,289 | |
DISH Network Corporation Class A † | | | | | | | | | | | 453 | | | | 15,225 | |
Interpublic Group of Companies Incorporated | | | | | | | | | | | 765 | | | | 17,932 | |
News Corporation Class A | | | | | | | | | | | 760 | | | | 11,780 | |
News Corporation Class B | | | | | | | | | | | 241 | | | | 3,820 | |
Omnicom Group Incorporated | | | | | | | | | | | 450 | | | | 34,322 | |
The Walt Disney Company | | | | | | | | | | | 2,948 | | | | 308,980 | |
Twenty-First Century Fox Incorporated Class A | | | | | | | | | | | 2,090 | | | | 103,852 | |
Twenty-First Century Fox Incorporated Class B | | | | | | | | | | | 871 | | | | 42,914 | |
Viacom Incorporated Class B | | | | | | | | | | | 700 | | | | 21,112 | |
| | | | |
| | | | | | | | | | | | | | | 1,030,194 | |
| | | | | | | | | | | | | | | | |
|
| Multiline Retail: 0.30% | |
Dollar General Corporation | | | | | | | | | | | 503 | | | | 49,596 | |
Dollar Tree Incorporated † | | | | | | | | | | | 471 | | | | 40,035 | |
Kohl’s Corporation | | | | | | | | | | | 333 | | | | 24,276 | |
Macy’s Incorporated | | | | | | | | | | | 608 | | | | 22,757 | |
Nordstrom Incorporated | | | | | | | | | | | 232 | | | | 12,013 | |
Target Corporation | | | | | | | | | | | 1,057 | | | | 80,459 | |
| | | | |
| | | | | | | | | | | | | | | 229,136 | |
| | | | | | | | | | | | | | | | |
|
| Specialty Retail: 1.39% | |
Advance Auto Parts Incorporated | | | | | | | | | | | 146 | | | | 19,812 | |
AutoZone Incorporated † | | | | | | | | | | | 52 | | | | 34,888 | |
Best Buy Company Incorporated | | | | | | | | | | | 486 | | | | 36,246 | |
CarMax Incorporated † | | | | | | | | | | | 352 | | | | 25,650 | |
Foot Locker Incorporated | | | | | | | | | | | 234 | | | | 12,320 | |
L Brands Incorporated | | | | | | | | | | | 480 | | | | 17,702 | |
Lowe’s Companies Incorporated | | | | | | | | | | | 1,630 | | | | 155,779 | |
O’Reilly Automotive Incorporated † | | | | | | | | | | | 162 | | | | 44,318 | |
Ross Stores Incorporated | | | | | | | | | | | 751 | | | | 63,647 | |
The Gap Incorporated | | | | | | | | | | | 430 | | | | 13,928 | |
The accompanying notes are an integral part of these financial statements.
| | | | | | |
| Portfolio of investments—June 30, 2018 (unaudited) | | Wells Fargo VT Index Asset Allocation Fund | | | 9 | |
| | | | | | | | | | | | | | | | |
| Security name | | | | | | | | Shares | | | Value | |
|
| Specialty Retail (continued) | |
The Home Depot Incorporated | | | | | | | | | | | 2,287 | | | $ | 446,194 | |
The TJX Companies Incorporated | | | | | | | | | | | 1,243 | | | | 118,309 | |
Tiffany & Company | | | | | | | | | | | 201 | | | | 26,452 | |
Tractor Supply Company | | | | | | | | | | | 241 | | | | 18,434 | |
ULTA Beauty Incorporated † | | | | | | | | | | | 113 | | | | 26,381 | |
| | | | |
| | | | | | | | | | | | | | | 1,060,060 | |
| | | | | | | | | | | | | | | | |
|
| Textiles, Apparel & Luxury Goods: 0.48% | |
HanesBrands Incorporated | | | | | | | | | | | 715 | | | | 15,744 | |
Michael Kors Holdings Limited † | | | | | | | | | | | 297 | | | | 19,780 | |
Nike Incorporated Class B | | | | | | | | | | | 2,544 | | | | 202,706 | |
PVH Corporation | | | | | | | | | | | 152 | | | | 22,757 | |
Ralph Lauren Corporation | | | | | | | | | | | 110 | | | | 13,829 | |
Tapestry Incorporated | | | | | | | | | | | 570 | | | | 26,625 | |
Under Armour Incorporated Class A † | | | | | | | | | | | 368 | | | | 8,273 | |
Under Armour Incorporated Class C † | | | | | | | | | | | 373 | | | | 7,863 | |
VF Corporation | | | | | | | | | | | 649 | | | | 52,906 | |
| | | | |
| | | | | | | | | | | | | | | 370,483 | |
| | | | | | | | | | | | | | | | |
|
Consumer Staples: 4.10% | |
|
| Beverages: 1.06% | |
Brown-Forman Corporation Class B | | | | | | | | | | | 519 | | | | 25,436 | |
Constellation Brands Incorporated Class A | | | | | | | | | | | 333 | | | | 72,884 | |
Molson Coors Brewing Company Class B | | | | | | | | | | | 366 | | | | 24,903 | |
Monster Beverage Corporation † | | | | | | | | | | | 815 | | | | 46,700 | |
PepsiCo Incorporated | | | | | | | | | | | 2,812 | | | | 306,142 | |
The Coca-Cola Company | | | | | | | | | | | 7,595 | | | | 333,117 | |
| | | | |
| | | | | | | | | | | | | | | 809,182 | |
| | | | | | | | | | | | | | | | |
|
| Food & Staples Retailing: 0.84% | |
Costco Wholesale Corporation | | | | | | | | | | | 870 | | | | 181,813 | |
Sysco Corporation | | | | | | | | | | | 950 | | | | 64,876 | |
The Kroger Company | | | | | | | | | | | 1,612 | | | | 45,861 | |
Wal-Mart Stores Incorporated | | | | | | | | | | | 2,869 | | | | 245,730 | |
Walgreens Boots Alliance Incorporated | | | | | | | | | | | 1,691 | | | | 101,485 | |
| | | | |
| | | | | | | | | | | | | | | 639,765 | |
| | | | | | | | | | | | | | | | |
|
| Food Products: 0.67% | |
Archer Daniels Midland Company | | | | | | | | | | | 1,109 | | | | 50,825 | |
Campbell Soup Company | | | | | | | | | | | 381 | | | | 15,446 | |
ConAgra Foods Incorporated | | | | | | | | | | | 780 | | | | 27,869 | |
General Mills Incorporated | | | | | | | | | | | 1,176 | | | | 52,050 | |
Hormel Foods Corporation | | | | | | | | | | | 535 | | | | 19,907 | |
Kellogg Company | | | | | | | | | | | 494 | | | | 34,516 | |
McCormick & Company Incorporated | | | | | | | | | | | 240 | | | | 27,862 | |
Mondelez International Incorporated Class A | | | | | | | | | | | 2,925 | | | | 119,925 | |
The Hershey Company | | | | | | | | | | | 276 | | | | 25,685 | |
The J.M. Smucker Company | | | | | | | | | | | 225 | | | | 24,183 | |
The Kraft Heinz Company | | | | | | | | | | | 1,185 | | | | 74,442 | |
The accompanying notes are an integral part of these financial statements.
| | | | |
| 10 | | Wells Fargo VT Index Asset Allocation Fund | | Portfolio of investments—June 30, 2018 (unaudited) |
| | | | | | | | | | | | | | | | |
| Security name | | | | | | | | Shares | | | Value | |
|
| Food Products (continued) | |
Tyson Foods Incorporated Class A | | | | | | | | | | | 589 | | | $ | 40,553 | |
| | | | |
| | | | | | | | | | | | | | | 513,263 | |
| | | | | | | | | | | | | | | | |
|
| Household Products: 0.83% | |
Church & Dwight Company Incorporated | | | | | | | | | | | 485 | | | | 25,783 | |
Colgate-Palmolive Company | | | | | | | | | | | 1,729 | | | | 112,056 | |
Kimberly-Clark Corporation | | | | | | | | | | | 693 | | | | 73,001 | |
The Clorox Company | | | | | | | | | | | 256 | | | | 34,624 | |
The Procter & Gamble Company | | | | | | | | | | | 4,986 | | | | 389,207 | |
| | | | |
| | | | | | | | | | | | | | | 634,671 | |
| | | | | | | | | | | | | | | | |
|
| Personal Products: 0.10% | |
Coty Incorporated Class A | | | | | | | | | | | 938 | | | | 13,226 | |
The Estee Lauder Companies Incorporated Class A | | | | | | | | | | | 443 | | | | 63,212 | |
| | | | |
| | | | | | | | | | | | | | | 76,438 | |
| | | | | | | | | | | | | | | | |
|
| Tobacco: 0.60% | |
Altria Group Incorporated | | | | | | | | | | | 3,753 | | | | 213,133 | |
Philip Morris International | | | | | | | | | | | 3,081 | | | | 248,760 | |
| | | | |
| | | | | | | | | | | | | | | 461,893 | |
| | | | | | | | | | | | | | | | |
|
Energy: 3.78% | |
|
| Energy Equipment & Services: 0.47% | |
Baker Hughes Incorporated | | | | | | | | | | | 826 | | | | 27,283 | |
Halliburton Company | | | | | | | | | | | 1,737 | | | | 78,269 | |
Helmerich & Payne Incorporated | | | | | | | | | | | 215 | | | | 13,708 | |
National Oilwell Varco Incorporated | | | | | | | | | | | 758 | | | | 32,897 | |
Schlumberger Limited | | | | | | | | | | | 2,747 | | | | 184,131 | |
TechnipFMC plc | | | | | | | | | | | 861 | | | | 27,328 | |
| | | | |
| | | | | | | | | | | | | | | 363,616 | |
| | | | | | | | | | | | | | | | |
|
| Oil, Gas & Consumable Fuels: 3.31% | |
Anadarko Petroleum Corporation | | | | | | | | | | | 1,021 | | | | 74,788 | |
Andeavor Corporation | | | | | | | | | | | 275 | | | | 36,075 | |
Apache Corporation | | | | | | | | | | | 758 | | | | 35,437 | |
Cabot Oil & Gas Corporation | | | | | | | | | | | 895 | | | | 21,301 | |
Chevron Corporation | | | | | | | | | | | 3,789 | | | | 479,043 | |
Cimarex Energy Company | | | | | | | | | | | 189 | | | | 19,229 | |
Concho Resources Incorporated † | | | | | | | | | | | 295 | | | | 40,813 | |
ConocoPhillips | | | | | | | | | | | 2,320 | | | | 161,518 | |
Devon Energy Corporation | | | | | | | | | | | 1,038 | | | | 45,630 | |
EOG Resources Incorporated | | | | | | | | | | | 1,148 | | | | 142,846 | |
EQT Corporation | | | | | | | | | | | 499 | | | | 27,535 | |
Exxon Mobil Corporation | | | | | | | | | | | 8,396 | | | | 694,601 | |
Hess Corporation | | | | | | | | | | | 518 | | | | 34,649 | |
HollyFrontier Corporation | | | | | | | | | | | 349 | | | | 23,882 | |
Kinder Morgan Incorporated | | | | | | | | | | | 3,762 | | | | 66,475 | |
Marathon Oil Corporation | | | | | | | | | | | 1,692 | | | | 35,295 | |
The accompanying notes are an integral part of these financial statements.
| | | | | | |
| Portfolio of investments—June 30, 2018 (unaudited) | | Wells Fargo VT Index Asset Allocation Fund | | | 11 | |
| | | | | | | | | | | | | | | | |
| Security name | | | | | | | | Shares | | | Value | |
|
| Oil, Gas & Consumable Fuels (continued) | |
Marathon Petroleum Corporation | | | | | | | | | | | 916 | | | $ | 64,267 | |
Newfield Exploration Company † | | | | | | | | | | | 395 | | | | 11,949 | |
Noble Energy Incorporated | | | | | | | | | | | 961 | | | | 33,904 | |
Occidental Petroleum Corporation | | | | | | | | | | | 1,518 | | | | 127,026 | |
ONEOK Incorporated | | | | | | | | | | | 815 | | | | 56,911 | |
Phillips 66 Company | | | | | | | | | | | 832 | | | | 93,442 | |
Pioneer Natural Resources Company | | | | | | | | | | | 337 | | | | 63,774 | |
The Williams Companies Incorporated | | | | | | | | | | | 1,641 | | | | 44,488 | |
Valero Energy Corporation | | | | | | | | | | | 855 | | | | 94,760 | |
| | | | |
| | | | | | | | | | | | | | | 2,529,638 | |
| | | | | | | | | | | | | | | | |
|
Financials: 8.26% | |
|
| Banks: 3.66% | |
Bank of America Corporation | | | | | | | | | | | 18,701 | | | | 527,181 | |
BB&T Corporation | | | | | | | | | | | 1,546 | | | | 77,980 | |
Citigroup Incorporated | | | | | | | | | | | 5,056 | | | | 338,348 | |
Citizens Financial Group Incorporated | | | | | | | | | | | 961 | | | | 37,383 | |
Comerica Incorporated | | | | | | | | | | | 340 | | | | 30,913 | |
Fifth Third Bancorp | | | | | | | | | | | 1,359 | | | | 39,003 | |
Huntington Bancshares Incorporated | | | | | | | | | | | 2,191 | | | | 32,339 | |
JPMorgan Chase & Company | | | | | | | | | | | 6,752 | | | | 703,558 | |
KeyCorp | | | | | | | | | | | 2,105 | | | | 41,132 | |
M&T Bank Corporation | | | | | | | | | | | 287 | | | | 48,833 | |
People’s United Financial Incorporated | | | | | | | | | | | 690 | | | | 12,482 | |
PNC Financial Services Group Incorporated | | | | | | | | | | | 931 | | | | 125,778 | |
Regions Financial Corporation | | | | | | | | | | | 2,227 | | | | 39,596 | |
SunTrust Banks Incorporated | | | | | | | | | | | 922 | | | | 60,870 | |
SVB Financial Group † | | | | | | | | | | | 104 | | | | 30,031 | |
US Bancorp | | | | | | | | | | | 3,094 | | | | 154,762 | |
Wells Fargo & Company (l) | | | | | | | | | | | 8,670 | | | | 480,665 | |
Zions Bancorporation | | | | | | | | | | | 390 | | | | 20,549 | |
| | | | |
| | | | | | | | | | | | | | | 2,801,403 | |
| | | | | | | | | | | | | | | | |
|
| Capital Markets: 1.80% | |
Affiliated Managers Group Incorporated | | | | | | | | | | | 107 | | | | 15,908 | |
Ameriprise Financial Incorporated | | | | | | | | | | | 286 | | | | 40,006 | |
Bank of New York Mellon Corporation | | | | | | | | | | | 2,004 | | | | 108,076 | |
BlackRock Incorporated | | | | | | | | | | | 244 | | | | 121,766 | |
CBOE Holdings Incorporated | | | | | | | | | | | 222 | | | | 23,104 | |
CME Group Incorporated | | | | | | | | | | | 675 | | | | 110,646 | |
E*TRADE Financial Corporation † | | | | | | | | | | | 523 | | | | 31,987 | |
Franklin Resources Incorporated | | | | | | | | | | | 632 | | | | 20,256 | |
Intercontinental Exchange Incorporated | | | | | | | | | | | 1,149 | | | | 84,509 | |
Invesco Limited | | | | | | | | | | | 815 | | | | 21,646 | |
Moody’s Corporation | | | | | | | | | | | 330 | | | | 56,285 | |
Morgan Stanley | | | | | | | | | | | 2,703 | | | | 128,122 | |
MSCI Incorporated | | | | | | | | | | | 176 | | | | 29,116 | |
Northern Trust Corporation | | | | | | | | | | | 419 | | | | 43,111 | |
Raymond James Financial Incorporated | | | | | | | | | | | 257 | | | | 22,963 | |
The accompanying notes are an integral part of these financial statements.
| | | | |
| 12 | | Wells Fargo VT Index Asset Allocation Fund | | Portfolio of investments—June 30, 2018 (unaudited) |
| | | | | | | | | | | | | | | | |
| Security name | | | | | | | | Shares | | | Value | |
|
| Capital Markets (continued) | |
S&P Global Incorporated | | | | | | | | | | | 498 | | | $ | 101,537 | |
State Street Corporation | | | | | | | | | | | 725 | | | | 67,490 | |
T. Rowe Price Group Incorporated | | | | | | | | | | | 479 | | | | 55,607 | |
The Charles Schwab Corporation | | | | | | | | | | | 2,380 | | | | 121,618 | |
The Goldman Sachs Group Incorporated | | | | | | | | | | | 697 | | | | 153,737 | |
The NASDAQ OMX Group Incorporated | | | | | | | | | | | 231 | | | | 21,083 | |
| | | | |
| | | | | | | | | | | | | | | 1,378,573 | |
| | | | | | | | | | | | | | | | |
|
| Consumer Finance: 0.42% | |
American Express Company | | | | | | | | | | | 1,416 | | | | 138,768 | |
Capital One Financial Corporation | | | | | | | | | | | 965 | | | | 88,684 | |
Discover Financial Services | | | | | | | | | | | 692 | | | | 48,724 | |
Synchrony Financial | | | | | | | | | | | 1,407 | | | | 46,966 | |
| | | | |
| | | | | | | | | | | | | | | 323,142 | |
| | | | | | | | | | | | | | | | |
|
| Diversified Financial Services: 0.95% | |
Berkshire Hathaway Incorporated Class B † | | | | | | | | | | | 3,816 | | | | 712,256 | |
Jefferies Financial Group Incorporated | | | | | | | | | | | 601 | | | | 13,667 | |
| | | | |
| | | | | | | | | | | | | | | 725,923 | |
| | | | | | | | | | | | | | | | |
|
| Insurance: 1.43% | |
AFLAC Incorporated | | | | | | | | | | | 1,535 | | | | 66,036 | |
American International Group Incorporated | | | | | | | | | | | 1,780 | | | | 94,376 | |
Aon plc | | | | | | | | | | | 484 | | | | 66,390 | |
Arthur J. Gallagher & Company | | | | | | | | | | | 361 | | | | 23,566 | |
Assurant Incorporated | | | | | | | | | | | 104 | | | | 10,763 | |
Brighthouse Financial Incorporated † | | | | | | | | | | | 237 | | | | 9,497 | |
Chubb Limited | | | | | | | | | | | 924 | | | | 117,366 | |
Cincinnati Financial Corporation | | | | | | | | | | | 296 | | | | 19,791 | |
Everest Reinsurance Group Limited | | | | | | | | | | | 81 | | | | 18,669 | |
Lincoln National Corporation | | | | | | | | | | | 433 | | | | 26,954 | |
Loews Corporation | | | | | | | | | | | 518 | | | | 25,009 | |
Marsh & McLennan Companies Incorporated | | | | | | | | | | | 1,006 | | | | 82,462 | |
MetLife Incorporated | | | | | | | | | | | 2,015 | | | | 87,854 | |
Principal Financial Group Incorporated | | | | | | | | | | | 527 | | | | 27,905 | |
Prudential Financial Incorporated | | | | | | | | | | | 833 | | | | 77,894 | |
The Allstate Corporation | | | | | | | | | | | 697 | | | | 63,615 | |
The Hartford Financial Services Group Incorporated | | | | | | | | | | | 710 | | | | 36,302 | |
The Progressive Corporation | | | | | | | | | | | 1,155 | | | | 68,318 | |
The Travelers Companies Incorporated | | | | | | | | | | | 535 | | | | 65,452 | |
Torchmark Corporation | | | | | | | | | | | 209 | | | | 17,015 | |
UnumProvident Corporation | | | | | | | | | | | 438 | | | | 16,202 | |
Willis Towers Watson plc | | | | | | | | | | | 261 | | | | 39,568 | |
XL Group Limited | | | | | | | | | | | 511 | | | | 28,590 | |
| | | | |
| | | | | | | | | | | | | | | 1,089,594 | |
| | | | | | | | | | | | | | | | |
The accompanying notes are an integral part of these financial statements.
| | | | | | |
| Portfolio of investments—June 30, 2018 (unaudited) | | Wells Fargo VT Index Asset Allocation Fund | | | 13 | |
| | | | | | | | | | | | | | | | |
| Security name | | | | | | | | Shares | | | Value | |
|
Health Care: 8.40% | |
|
| Biotechnology: 1.51% | |
AbbVie Incorporated | | | | | | | | | | | 3,005 | | | $ | 278,413 | |
Alexion Pharmaceuticals Incorporated † | | | | | | | | | | | 440 | | | | 54,626 | |
Amgen Incorporated | | | | | | | | | | | 1,321 | | | | 243,843 | |
Biogen Incorporated † | | | | | | | | | | | 418 | | | | 121,320 | |
Celgene Corporation † | | | | | | | | | | | 1,401 | | | | 111,267 | |
Gilead Sciences Incorporated | | | | | | | | | | | 2,579 | | | | 182,696 | |
Incyte Corporation † | | | | | | | | | | | 348 | | | | 23,316 | |
Regeneron Pharmaceuticals Incorporated † | | | | | | | | | | | 153 | | | | 52,783 | |
Vertex Pharmaceuticals Incorporated † | | | | | | | | | | | 505 | | | | 85,830 | |
| | | | |
| | | | | | | | | | | | | | | 1,154,094 | |
| | | | | | | | | | | | | | | | |
|
| Health Care Equipment & Supplies: 1.84% | |
Abbott Laboratories | | | | | | | | | | | 3,476 | | | | 212,001 | |
ABIOMED Incorporated † | | | | | | | | | | | 83 | | | | 33,951 | |
Align Technology Incorporated † | | | | | | | | | | | 142 | | | | 48,584 | |
Baxter International Incorporated | | | | | | | | | | | 977 | | | | 72,142 | |
Becton Dickinson & Company | | | | | | | | | | | 529 | | | | 126,727 | |
Boston Scientific Corporation † | | | | | | | | | | | 2,736 | | | | 89,467 | |
Danaher Corporation | | | | | | | | | | | 1,219 | | | | 120,291 | |
Dentsply Sirona Incorporated | | | | | | | | | | | 450 | | | | 19,697 | |
Edwards Lifesciences Corporation † | | | | | | | | | | | 417 | | | | 60,703 | |
Hologic Incorporated † | | | | | | | | | | | 541 | | | | 21,505 | |
IDEXX Laboratories Incorporated † | | | | | | | | | | | 172 | | | | 37,486 | |
Intuitive Surgical Incorporated † | | | | | | | | | | | 224 | | | | 107,180 | |
Medtronic plc | | | | | | | | | | | 2,686 | | | | 229,948 | |
ResMed Incorporated | | | | | | | | | | | 282 | | | | 29,210 | |
Stryker Corporation | | | | | | | | | | | 637 | | | | 107,564 | |
The Cooper Companies Incorporated | | | | | | | | | | | 97 | | | | 22,839 | |
Varian Medical Systems Incorporated † | | | | | | | | | | | 181 | | | | 20,583 | |
Zimmer Biomet Holdings Incorporated | | | | | | | | | | | 402 | | | | 44,799 | |
| | | | |
| | | | | | | | | | | | | | | 1,404,677 | |
| | | | | | | | | | | | | | | | |
|
| Health Care Providers & Services: 1.88% | |
Aetna Incorporated | | | | | | | | | | | 649 | | | | 119,092 | |
AmerisourceBergen Corporation | | | | | | | | | | | 322 | | | | 27,457 | |
Anthem Incorporated | | | | | | | | | | | 505 | | | | 120,205 | |
Cardinal Health Incorporated | | | | | | | | | | | 616 | | | | 30,079 | |
Centene Corporation † | | | | | | | | | | | 406 | | | | 50,023 | |
Cigna Corporation | | | | | | | | | | | 482 | | | | 81,916 | |
CVS Health Corporation | | | | | | | | | | | 2,015 | | | | 129,665 | |
DaVita HealthCare Partners Incorporated † | | | | | | | | | | | 276 | | | | 19,165 | |
Envision Healthcare Corporation † | | | | | | | | | | | 240 | | | | 10,562 | |
Express Scripts Holding Company † | | | | | | | | | | | 1,114 | | | | 86,012 | |
HCA Holdings Incorporated | | | | | | | | | | | 553 | | | | 56,738 | |
Henry Schein Incorporated † | | | | | | | | | | | 305 | | | | 22,155 | |
Humana Incorporated | | | | | | | | | | | 272 | | | | 80,955 | |
Laboratory Corporation of America Holdings † | | | | | | | | | | | 202 | | | | 36,265 | |
McKesson Corporation | | | | | | | | | | | 400 | | | | 53,360 | |
Quest Diagnostics Incorporated | | | | | | | | | | | 269 | | | | 29,574 | |
The accompanying notes are an integral part of these financial statements.
| | | | |
| 14 | | Wells Fargo VT Index Asset Allocation Fund | | Portfolio of investments—June 30, 2018 (unaudited) |
| | | | | | | | | | | | | | | | |
| Security name | | | | | | | | Shares | | | Value | |
|
| Health Care Providers & Services (continued) | |
UnitedHealth Group Incorporated | | | | | | | | | | | 1,905 | | | $ | 467,373 | |
Universal Health Services Incorporated Class B | | | | | | | | | | | 172 | | | | 19,168 | |
| | | | |
| | | | | | | | | | | | | | | 1,439,764 | |
| | | | | | | | | | | | | | | | |
|
| Health Care Technology: 0.05% | |
Cerner Corporation † | | | | | | | | | | | 625 | | | | 37,369 | |
| | | | | | | | | | | | | | | | |
|
| Life Sciences Tools & Services: 0.51% | |
Agilent Technologies Incorporated | | | | | | | | | | | 635 | | | | 39,268 | |
Illumina Incorporated † | | | | | | | | | | | 291 | | | | 81,273 | |
IQVIA Holdings Incorporated † | | | | | | | | | | | 320 | | | | 31,942 | |
Mettler-Toledo International Incorporated † | | | | | | | | | | | 50 | | | | 28,932 | |
PerkinElmer Incorporated | | | | | | | | | | | 219 | | | | 16,037 | |
Thermo Fisher Scientific Incorporated | | | | | | | | | | | 798 | | | | 165,298 | |
Waters Corporation † | | | | | | | | | | | 155 | | | | 30,006 | |
| | | | |
| | | | | | | | | | | | | | | 392,756 | |
| | | | | | | | | | | | | | | | |
|
| Pharmaceuticals: 2.61% | |
Allergan plc | | | | | | | | | | | 673 | | | | 112,203 | |
Bristol-Myers Squibb Company | | | | | | | | | | | 3,241 | | | | 179,357 | |
Eli Lilly & Company | | | | | | | | | | | 1,894 | | | | 161,615 | |
Johnson & Johnson | | | | | | | | | | | 5,319 | | | | 645,407 | |
Merck & Company Incorporated | | | | | | | | | | | 5,335 | | | | 323,835 | |
Mylan NV † | | | | | | | | | | | 1,022 | | | | 36,935 | |
Nektar Therapeutics † | | | | | | | | | | | 319 | | | | 15,577 | |
Perrigo Company plc | | | | | | | | | | | 255 | | | | 18,592 | |
Pfizer Incorporated | | | | | | | | | | | 11,600 | | | | 420,848 | |
Zoetis Incorporated | | | | | | | | | | | 960 | | | | 81,782 | |
| | | | |
| | | | | | | | | | | | | | | 1,996,151 | |
| | | | | | | | | | | | | | | | |
|
Industrials: 5.71% | |
|
| Aerospace & Defense: 1.60% | |
Arconic Incorporated | | | | | | | | | | | 843 | | | | 14,339 | |
General Dynamics Corporation | | | | | | | | | | | 547 | | | | 101,966 | |
Harris Corporation | | | | | | | | | | | 235 | | | | 33,967 | |
Huntington Ingalls Industries Incorporated | | | | | | | | | | | 88 | | | | 19,078 | |
L-3 Technologies Incorporated | | | | | | | | | | | 155 | | | | 29,810 | |
Lockheed Martin Corporation | | | | | | | | | | | 492 | | | | 145,352 | |
Northrop Grumman Corporation | | | | | | | | | | | 345 | | | | 106,157 | |
Raytheon Company | | | | | | | | | | | 569 | | | | 109,919 | |
Rockwell Collins Incorporated | | | | | | | | | | | 325 | | | | 43,771 | |
Textron Incorporated | | | | | | | | | | | 507 | | | | 33,416 | |
The Boeing Company | | | | | | | | | | | 1,086 | | | | 364,364 | |
TransDigm Group Incorporated | | | | | | | | | | | 96 | | | | 33,133 | |
United Technologies Corporation | | | | | | | | | | | 1,475 | | | | 184,419 | |
| | | | |
| | | | | | | | | | | | | | | 1,219,691 | |
| | | | | | | | | | | | | | | | |
|
| Air Freight & Logistics: 0.40% | |
C.H. Robinson Worldwide Incorporated | | | | | | | | | | | 275 | | | | 23,007 | |
Expeditors International of Washington Incorporated | | | | | | | | | | | 346 | | | | 25,293 | |
The accompanying notes are an integral part of these financial statements.
| | | | | | |
| Portfolio of investments—June 30, 2018 (unaudited) | | Wells Fargo VT Index Asset Allocation Fund | | | 15 | |
| | | | | | | | | | | | | | | | |
| Security name | | | | | | | | Shares | | | Value | |
|
| Air Freight & Logistics (continued) | |
FedEx Corporation | | | | | | | | | | | 487 | | | $ | 110,578 | |
United Parcel Service Incorporated Class B | | | | | | | | | | | 1,367 | | | | 145,216 | |
| | | | |
| | | | | | | | | | | | | | | 304,094 | |
| | | | | | | | | | | | | | | | |
|
| Airlines: 0.26% | |
Alaska Air Group Incorporated | | | | | | | | | | | 244 | | | | 14,735 | |
American Airlines Group Incorporated | | | | | | | | | | | 826 | | | | 31,355 | |
Delta Air Lines Incorporated | | | | | | | | | | | 1,280 | | | | 63,411 | |
Southwest Airlines Company | | | | | | | | | | | 1,058 | | | | 53,831 | |
United Continental Holdings Incorporated † | | | | | | | | | | | 467 | | | | 32,564 | |
| | | | |
| | | | | | | | | | | | | | | 195,896 | |
| | | | | | | | | | | | | | | | |
|
| Building Products: 0.17% | |
A.O. Smith Corporation | | | | | | | | | | | 287 | | | | 16,976 | |
Allegion plc | | | | | | | | | | | 188 | | | | 14,544 | |
Fortune Brands Home & Security Incorporated | | | | | | | | | | | 289 | | | | 15,516 | |
Johnson Controls International plc | | | | | | | | | | | 1,836 | | | | 61,414 | |
Masco Corporation | | | | | | | | | | | 616 | | | | 23,051 | |
| | | | |
| | | | | | | | | | | | | | | 131,501 | |
| | | | | | | | | | | | | | | | |
|
| Commercial Services & Supplies: 0.21% | |
Cintas Corporation | | | | | | | | | | | 171 | | | | 31,647 | |
Copart Incorporated † | | | | | | | | | | | 400 | | | | 22,627 | |
Republic Services Incorporated | | | | | | | | | | | 441 | | | | 30,147 | |
Stericycle Incorporated † | | | | | | | | | | | 169 | | | | 11,034 | |
Waste Management Incorporated | | | | | | | | | | | 789 | | | | 64,177 | |
| | | | |
| | | | | | | | | | | | | | | 159,632 | |
| | | | | | | | | | | | | | | | |
|
| Construction & Engineering: 0.05% | |
Fluor Corporation | | | | | | | | | | | 278 | | | | 13,561 | |
Jacobs Engineering Group Incorporated | | | | | | | | | | | 238 | | | | 15,111 | |
Quanta Services Incorporated † | | | | | | | | | | | 296 | | | | 9,886 | |
| | | | |
| | | | | | | | | | | | | | | 38,558 | |
| | | | | | | | | | | | | | | | |
|
| Electrical Equipment: 0.29% | |
AMETEK Incorporated | | | | | | | | | | | 458 | | | | 33,049 | |
Eaton Corporation plc | | | | | | | | | | | 867 | | | | 64,800 | |
Emerson Electric Company | | | | | | | | | | | 1,249 | | | | 86,356 | |
Rockwell Automation Incorporated | | | | | | | | | | | 248 | | | | 41,225 | |
| | | | |
| | | | | | | | | | | | | | | 225,430 | |
| | | | | | | | | | | | | | | | |
|
| Industrial Conglomerates: 0.96% | |
3M Company | | | | | | | | | | | 1,177 | | | | 231,539 | |
General Electric Company | | | | | | | | | | | 17,224 | | | | 234,419 | |
Honeywell International Incorporated | | | | | | | | | | | 1,481 | | | | 213,338 | |
Roper Industries Incorporated | | | | | | | | | | | 204 | | | | 56,286 | |
| | | | |
| | | | | | | | | | | | | | | 735,582 | |
| | | | | | | | | | | | | | | | |
The accompanying notes are an integral part of these financial statements.
| | | | |
| 16 | | Wells Fargo VT Index Asset Allocation Fund | | Portfolio of investments—June 30, 2018 (unaudited) |
| | | | | | | | | | | | | | | | |
| Security name | | | | | | | | Shares | | | Value | |
|
| Machinery: 0.89% | |
Caterpillar Incorporated | | | | | | | | | | | 1,186 | | | $ | 160,905 | |
Cummins Incorporated | | | | | | | | | | | 306 | | | | 40,698 | |
Deere & Company | | | | | | | | | | | 643 | | | | 89,891 | |
Dover Corporation | | | | | | | | | | | 306 | | | | 22,399 | |
Flowserve Corporation | | | | | | | | | | | 259 | | | | 10,464 | |
Fortive Corporation | | | | | | | | | | | 608 | | | | 46,883 | |
Illinois Tool Works Incorporated | | | | | | | | | | | 605 | | | | 83,817 | |
Ingersoll-Rand plc | | | | | | | | | | | 491 | | | | 44,057 | |
Paccar Incorporated | | | | | | | | | | | 698 | | | | 43,248 | |
Parker-Hannifin Corporation | | | | | | | | | | | 263 | | | | 40,989 | |
Pentair plc | | | | | | | | | | | 321 | | | | 13,508 | |
Snap-on Incorporated | | | | | | | | | | | 112 | | | | 18,001 | |
Stanley Black & Decker Incorporated | | | | | | | | | | | 305 | | | | 40,507 | |
Xylem Incorporated | | | | | | | | | | | 356 | | | | 23,987 | |
| | | | |
| | | | | | | | | | | | | | | 679,354 | |
| | | | | | | | | | | | | | | | |
|
| Professional Services: 0.18% | |
Equifax Incorporated | | | | | | | | | | | 238 | | | | 29,776 | |
IHS Markit Limited † | | | | | | | | | | | 706 | | | | 36,423 | |
Nielsen Holdings plc | | | | | | | | | | | 664 | | | | 20,538 | |
Robert Half International Incorporated | | | | | | | | | | | 244 | | | | 15,884 | |
Verisk Analytics Incorporated † | | | | | | | | | | | 307 | | | | 33,045 | |
| | | | |
| | | | | | | | | | | | | | | 135,666 | |
| | | | | | | | | | | | | | | | |
|
| Road & Rail: 0.59% | |
CSX Corporation | | | | | | | | | | | 1,735 | | | | 110,658 | |
J.B. Hunt Transport Services Incorporated | | | | | | | | | | | 169 | | | | 20,542 | |
Kansas City Southern | | | | | | | | | | | 203 | | | | 21,510 | |
Norfolk Southern Corporation | | | | | | | | | | | 559 | | | | 84,336 | |
Union Pacific Corporation | | | | | | | | | | | 1,538 | | | | 217,904 | |
| | | | |
| | | | | | | | | | | | | | | 454,950 | |
| | | | | | | | | | | | | | | | |
|
| Trading Companies & Distributors: 0.11% | |
Fastenal Company | | | | | | | | | | | 570 | | | | 27,434 | |
United Rentals Incorporated † | | | | | | | | | | | 165 | | | | 24,357 | |
W.W. Grainger Incorporated | | | | | | | | | | | 101 | | | | 31,148 | |
| | | | |
| | | | | | | | | | | | | | | 82,939 | |
| | | | | | | | | | | | | | | | |
|
Information Technology: 15.50% | |
|
| Communications Equipment: 0.63% | |
Cisco Systems Incorporated | | | | | | | | | | | 9,327 | | | | 401,341 | |
F5 Networks Incorporated † | | | | | | | | | | | 121 | | | | 20,866 | |
Juniper Networks Incorporated | | | | | | | | | | | 693 | | | | 19,002 | |
Motorola Solutions Incorporated | | | | | | | | | | | 321 | | | | 37,355 | |
| | | | |
| | | | | | | | | | | | | | | 478,564 | |
| | | | | | | | | | | | | | | | |
The accompanying notes are an integral part of these financial statements.
| | | | | | |
| Portfolio of investments—June 30, 2018 (unaudited) | | Wells Fargo VT Index Asset Allocation Fund | | | 17 | |
| | | | | | | | | | | | | | | | |
| Security name | | | | | | | | Shares | | | Value | |
|
| Electronic Equipment, Instruments & Components: 0.25% | |
Amphenol Corporation Class A | | | | | | | | | | | 598 | | | $ | 52,116 | |
Corning Incorporated | | | | | | | | | | | 1,646 | | | | 45,281 | |
FLIR Systems Incorporated | | | | | | | | | | | 271 | | | | 14,084 | |
IPG Photonics Corporation † | | | | | | | | | | | 74 | | | | 16,327 | |
TE Connectivity Limited | | | | | | | | | | | 694 | | | | 62,502 | |
| | | | |
| | | | | | | | | | | | | | | 190,310 | |
| | | | | | | | | | | | | | | | |
|
| Internet Software & Services: 3.19% | |
Akamai Technologies Incorporated † | | | | | | | | | | | 338 | | | | 24,752 | |
Alphabet Incorporated Class A † | | | | | | | | | | | 591 | | | | 667,351 | |
Alphabet Incorporated Class C † | | | | | | | | | | | 602 | | | | 671,621 | |
eBay Incorporated † | | | | | | | | | | | 1,833 | | | | 66,465 | |
Facebook Incorporated Class A † | | | | | | | | | | | 4,756 | | | | 924,186 | |
Twitter Incorporated † | | | | | | | | | | | 1,298 | | | | 56,684 | |
VeriSign Incorporated † | | | | | | | | | | | 190 | | | | 26,110 | |
| | | | |
| | | | | | | | | | | | | | | 2,437,169 | |
| | | | | | | | | | | | | | | | |
|
| IT Services: 2.71% | |
Accenture plc Class A | | | | | | | | | | | 1,275 | | | | 208,577 | |
Alliance Data Systems Corporation | | | | | | | | | | | 95 | | | | 22,154 | |
Automatic Data Processing Incorporated | | | | | | | | | | | 874 | | | | 117,238 | |
Broadridge Financial Solutions Incorporated | | | | | | | | | | | 233 | | | | 26,818 | |
Cognizant Technology Solutions Corporation Class A | | | | | | | | | | | 1,162 | | | | 91,786 | |
DXC Technology Company | | | | | | | | | | | 564 | | | | 45,464 | |
Fidelity National Information Services Incorporated | | | | | | | | | | | 657 | | | | 69,662 | |
Fiserv Incorporated † | | | | | | | | | | | 812 | | | | 60,161 | |
FleetCor Technologies Incorporated † | | | | | | | | | | | 177 | | | | 37,285 | |
Gartner Incorporated † | | | | | | | | | | | 180 | | | | 23,922 | |
Global Payments Incorporated | | | | | | | | | | | 316 | | | | 35,231 | |
International Business Machines Corporation | | | | | | | | | | | 1,693 | | | | 236,512 | |
MasterCard Incorporated Class A | | | | | | | | | | | 1,818 | | | | 357,273 | |
Paychex Incorporated | | | | | | | | | | | 634 | | | | 43,334 | |
PayPal Holdings Incorporated † | | | | | | | | | | | 2,213 | | | | 184,277 | |
The Western Union Company | | | | | | | | | | | 914 | | | | 18,582 | |
Total System Services Incorporated | | | | | | | | | | | 328 | | | | 27,723 | |
Visa Incorporated Class A | | | | | | | | | | | 3,542 | | | | 469,138 | |
| | | | |
| | | | | | | | | | | | | | | 2,075,137 | |
| | | | | | | | | | | | | | | | |
|
| Semiconductors & Semiconductor Equipment: 2.41% | |
Advanced Micro Devices Incorporated † | | | | | | | | | | | 1,634 | | | | 24,494 | |
Analog Devices Incorporated | | | | | | | | | | | 736 | | | | 70,597 | |
Applied Materials Incorporated | | | | | | | | | | | 1,998 | | | | 92,288 | |
Broadcom Incorporated | | | | | | | | | | | 815 | | | | 197,752 | |
Intel Corporation | | | | | | | | | | | 9,241 | | | | 459,370 | |
KLA-Tencor Corporation | | | | | | | | | | | 308 | | | | 31,579 | |
Lam Research Corporation | | | | | | | | | | | 325 | | | | 56,176 | |
Microchip Technology Incorporated | | | | | | | | | | | 465 | | | | 42,292 | |
Micron Technology Incorporated † | | | | | | | | | | | 2,299 | | | | 120,560 | |
NVIDIA Corporation | | | | | | | | | | | 1,204 | | | | 285,228 | |
The accompanying notes are an integral part of these financial statements.
| | | | |
| 18 | | Wells Fargo VT Index Asset Allocation Fund | | Portfolio of investments—June 30, 2018 (unaudited) |
| | | | | | | | | | | | | | | | |
| Security name | | | | | | | | Shares | | | Value | |
|
| Semiconductors & Semiconductor Equipment (continued) | |
Qorvo Incorporated † | | | | | | | | | | | 250 | | | $ | 20,043 | |
QUALCOMM Incorporated | | | | | | | | | | | 2,940 | | | | 164,993 | |
Skyworks Solutions Incorporated | | | | | | | | | | | 360 | | | | 34,794 | |
Texas Instruments Incorporated | | | | | | | | | | | 1,941 | | | | 213,995 | |
Xilinx Incorporated | | | | | | | | | | | 502 | | | | 32,761 | |
| | | | |
| | | | | | | | | | | | | | | 1,846,922 | |
| | | | | | | | | | | | | | | | |
|
| Software: 3.63% | |
Activision Blizzard Incorporated | | | | | | | | | | | 1,509 | | | | 115,167 | |
Adobe Systems Incorporated † | | | | | | | | | | | 977 | | | | 238,202 | |
Ansys Incorporated † | | | | | | | | | | | 166 | | | | 28,914 | |
Autodesk Incorporated † | | | | | | | | | | | 434 | | | | 56,893 | |
CA Incorporated | | | | | | | | | | | 620 | | | | 22,103 | |
Cadence Design Systems Incorporated † | | | | | | | | | | | 558 | | | | 24,167 | |
Citrix Systems Incorporated † | | | | | | | | | | | 255 | | | | 26,734 | |
Electronic Arts Incorporated † | | | | | | | | | | | 609 | | | | 85,881 | |
Intuit Incorporated | | | | | | | | | | | 483 | | | | 98,679 | |
Microsoft Corporation | | | | | | | | | | | 15,237 | | | | 1,502,521 | |
Oracle Corporation | | | | | | | | | | | 5,910 | | | | 260,395 | |
Red Hat Incorporated † | | | | | | | | | | | 352 | | | | 47,298 | |
Salesforce.com Incorporated † | | | | | | | | | | | 1,398 | | | | 190,687 | |
Symantec Corporation | | | | | | | | | | | 1,232 | | | | 25,441 | |
Synopsys Incorporated † | | | | | | | | | | | 295 | | | | 25,243 | |
Take-Two Interactive Software Incorporated † | | | | | | | | | | | 226 | | | | 26,749 | |
| | | | |
| | | | | | | | | | | | | | | 2,775,074 | |
| | | | | | | | | | | | | | | | |
|
| Technology Hardware, Storage & Peripherals: 2.68% | |
Apple Incorporated | | | | | | | | | | | 9,747 | | | | 1,804,267 | |
Hewlett Packard Enterprise Company | | | | | | | | | | | 3,028 | | | | 44,239 | |
HP Incorporated | | | | | | | | | | | 3,255 | | | | 73,856 | |
NetApp Incorporated | | | | | | | | | | | 531 | | | | 41,699 | |
Seagate Technology plc | | | | | | | | | | | 568 | | | | 32,075 | |
Western Digital Corporation | | | | | | | | | | | 593 | | | | 45,904 | |
Xerox Corporation | | | | | | | | | | | 424 | | | | 10,176 | |
| | | | |
| | | | | | | | | | | | | | | 2,052,216 | |
| | | | | | | | | | | | | | | | |
|
Materials: 1.56% | |
|
| Chemicals: 1.12% | |
Air Products & Chemicals Incorporated | | | | | | | | | | | 434 | | | | 67,587 | |
Albemarle Corporation | | | | | | | | | | | 219 | | | | 20,658 | |
CF Industries Holdings Incorporated | | | | | | | | | | | 462 | | | | 20,513 | |
DowDuPont Incorporated | | | | | | | | | | | 4,602 | | | | 303,364 | |
Eastman Chemical Company | | | | | | | | | | | 282 | | | | 28,189 | |
Ecolab Incorporated | | | | | | | | | | | 514 | | | | 72,130 | |
FMC Corporation | | | | | | | | | | | 266 | | | | 23,730 | |
International Flavors & Fragrances Incorporated | | | | | | | | | | | 156 | | | | 19,338 | |
LyondellBasell Industries NV Class A | | | | | | | | | | | 638 | | | | 70,084 | |
PPG Industries Incorporated | | | | | | | | | | | 494 | | | | 51,243 | |
The accompanying notes are an integral part of these financial statements.
| | | | | | |
| Portfolio of investments—June 30, 2018 (unaudited) | | Wells Fargo VT Index Asset Allocation Fund | | | 19 | |
| | | | | | | | | | | | | | | | |
| Security name | | | | | | | | Shares | | | Value | |
|
| Chemicals (continued) | |
Praxair Incorporated | | | | | | | | | | | 569 | | | $ | 89,987 | |
The Mosaic Company | | | | | | | | | | | 696 | | | | 19,523 | |
The Sherwin-Williams Company | | | | | | | | | | | 163 | | | | 66,434 | |
| | | | |
| | | | | | | | | | | | | | | 852,780 | |
| | | | | | | | | | | | | | | | |
|
| Construction Materials: 0.08% | |
Martin Marietta Materials Incorporated | | | | | | | | | | | 124 | | | | 27,693 | |
Vulcan Materials Company | | | | | | | | | | | 261 | | | | 33,685 | |
| | | | |
| | | | | | | | | | | | | | | 61,378 | |
| | | | | | | | | | | | | | | | |
|
| Containers & Packaging: 0.20% | |
Avery Dennison Corporation | | | | | | | | | | | 174 | | | | 17,765 | |
Ball Corporation | | | | | | | | | | | 693 | | | | 24,636 | |
International Paper Company | | | | | | | | | | | 821 | | | | 42,758 | |
Packaging Corporation of America | | | | | | | | | | | 186 | | | | 20,793 | |
Sealed Air Corporation | | | | | | | | | | | 319 | | | | 13,542 | |
WestRock Company | | | | | | | | | | | 508 | | | | 28,966 | |
| | | | |
| | | | | | | | | | | | | | | 148,460 | |
| | | | | | | | | | | | | | | | |
|
| Metals & Mining: 0.16% | |
Freeport-McMoRan Incorporated | | | | | | | | | | | 2,672 | | | | 46,119 | |
Newmont Mining Corporation | | | | | | | | | | | 1,058 | | | | 39,897 | |
Nucor Corporation | | | | | | | | | | | 631 | | | | 39,438 | |
| | | | |
| | | | | | | | | | | | | | | 125,454 | |
| | | | | | | | | | | | | | | | |
|
Real Estate: 1.70% | |
|
| Equity REITs: 1.66% | |
Alexandria Real Estate Equities Incorporated | | | | | | | | | | | 204 | | | | 25,739 | |
American Tower Corporation | | | | | | | | | | | 876 | | | | 126,293 | |
Apartment Investment & Management Company Class A | | | | | | | | | | | 311 | | | | 13,155 | |
AvalonBay Communities Incorporated | | | | | | | | | | | 273 | | | | 46,926 | |
Boston Properties Incorporated | | | | | | | | | | | 305 | | | | 38,253 | |
Crown Castle International Corporation | | | | | | | | | | | 823 | | | | 88,736 | |
Digital Realty Trust Incorporated | | | | | | | | | | | 408 | | | | 45,525 | |
Duke Realty Corporation | | | | | | | | | | | 708 | | | | 20,553 | |
Equinix Incorporated | | | | | | | | | | | 157 | | | | 67,493 | |
Equity Residential | | | | | | | | | | | 730 | | | | 46,494 | |
Essex Property Trust Incorporated | | | | | | | | | | | 130 | | | | 31,079 | |
Extra Space Storage Incorporated | | | | | | | | | | | 249 | | | | 24,853 | |
Federal Realty Investment Trust | | | | | | | | | | | 145 | | | | 18,350 | |
GGP Incorporated | | | | | | | | | | | 1,254 | | | | 25,619 | |
HCP Incorporated | | | | | | | | | | | 932 | | | | 24,064 | |
Host Hotels & Resorts Incorporated | | | | | | | | | | | 1,470 | | | | 30,973 | |
Iron Mountain Incorporated | | | | | | | | | | | 557 | | | | 19,501 | |
Kimco Realty Corporation | | | | | | | | | | | 843 | | | | 14,323 | |
Mid-America Apartment Communities Incorporated | | | | | | | | | | | 225 | | | | 22,651 | |
Prologis Incorporated | | | | | | | | | | | 1,057 | | �� | | 69,434 | |
Public Storage Incorporated | | | | | | | | | | | 296 | | | | 67,151 | |
The accompanying notes are an integral part of these financial statements.
| | | | |
| 20 | | Wells Fargo VT Index Asset Allocation Fund | | Portfolio of investments—June 30, 2018 (unaudited) |
| | | | | | | | | | | | | | | | |
| Security name | | | | | | | | Shares | | | Value | |
|
| Equity REITs (continued) | |
Realty Income Corporation | | | | | | | | | | | 563 | | | $ | 30,284 | |
Regency Centers Corporation | | | | | | | | | | | 292 | | | | 18,127 | |
SBA Communications Corporation † | | | | | | | | | | | 228 | | | | 37,647 | |
Simon Property Group Incorporated | | | | | | | | | | | 614 | | | | 104,497 | |
SL Green Realty Corporation | | | | | | | | | | | 175 | | | | 17,593 | |
The Macerich Company | | | | | | | | | | | 215 | | | | 12,218 | |
UDR Incorporated | | | | | | | | | | | 530 | | | | 19,896 | |
Ventas Incorporated | | | | | | | | | | | 707 | | | | 40,264 | |
Vornado Realty Trust | | | | | | | | | | | 342 | | | | 25,281 | |
Welltower Incorporated | | | | | | | | | | | 738 | | | | 46,265 | |
Weyerhaeuser Company | | | | | | | | | | | 1,501 | | | | 54,726 | |
| | | | |
| | | | | | | | | | | | | | | 1,273,963 | |
| | | | | | | | | | | | | | | | |
|
| Real Estate Management & Development: 0.04% | |
CBRE Group Incorporated Class A † | | | | | | | | | | | 600 | | | | 28,644 | |
| | | | | | | | | | | | | | | | |
|
Telecommunication Services: 1.19% | |
|
| Diversified Telecommunication Services: 1.19% | |
AT&T Incorporated | | | | | | | | | | | 14,376 | | | | 461,613 | |
CenturyLink Incorporated | | | | | | | | | | | 1,946 | | | | 36,273 | |
Verizon Communications Incorporated | | | | | | | | | | | 8,194 | | | | 412,240 | |
| | | | |
| | | | | | | | | | | | | | | 910,126 | |
| | | | | | | | | | | | | | | | |
|
Utilities: 1.76% | |
|
| Electric Utilities: 1.10% | |
Alliant Energy Corporation | | | | | | | | | | | 458 | | | | 19,383 | |
American Electric Power Company Incorporated | | | | | | | | | | | 977 | | | | 67,657 | |
Duke Energy Corporation | | | | | | | | | | | 1,390 | | | | 109,921 | |
Edison International | | | | | | | | | | | 646 | | | | 40,872 | |
Entergy Corporation | | | | | | | | | | | 358 | | | | 28,923 | |
Evergy Incorporated | | | | | | | | | | | 537 | | | | 30,153 | |
Eversource Energy | | | | | | | | | | | 629 | | | | 36,866 | |
Exelon Corporation | | | | | | | | | | | 1,914 | | | | 81,536 | |
FirstEnergy Corporation | | | | | | | | | | | 889 | | | | 31,924 | |
NextEra Energy Incorporated | | | | | | | | | | | 935 | | | | 156,173 | |
PG&E Corporation | | | | | | | | | | | 1,024 | | | | 43,581 | |
Pinnacle West Capital Corporation | | | | | | | | | | | 221 | | | | 17,804 | |
PPL Corporation | | | | | | | | | | | 1,386 | | | | 39,570 | |
The Southern Company | | | | | | | | | | | 2,006 | | | | 92,898 | |
Xcel Energy Incorporated | | | | | | | | | | | 1,009 | | | | 46,091 | |
| | | | |
| | | | | | | | | | | | | | | 843,352 | |
| | | | | | | | | | | | | | | | |
|
| Independent Power & Renewable Electricity Producers: 0.05% | |
AES Corporation | | | | | | | | | | | 1,311 | | | | 17,581 | |
NRG Energy Incorporated | | | | | | | | | | | 592 | | | | 18,174 | |
| | | | |
| | | | | | | | | | | | | | | 35,755 | |
| | | | | | | | | | | | | | | | |
The accompanying notes are an integral part of these financial statements.
| | | | | | |
| Portfolio of investments—June 30, 2018 (unaudited) | | Wells Fargo VT Index Asset Allocation Fund | | | 21 | |
| | | | | | | | | | | | | | | | |
| Security name | | | | | | | | Shares | | | Value | |
|
| Multi-Utilities: 0.57% | |
Ameren Corporation | | | | | | | | | | | 482 | | | $ | 29,330 | |
CenterPoint Energy Incorporated | | | | | | | | | | | 856 | | | | 23,720 | |
CMS Energy Corporation | | | | | | | | | | | 559 | | | | 26,430 | |
Consolidated Edison Incorporated | | | | | | | | | | | 616 | | | | 48,036 | |
Dominion Resources Incorporated | | | | | | | | | | | 1,294 | | | | 88,225 | |
DTE Energy Company | | | | | | | | | | | 359 | | | | 37,203 | |
NiSource Incorporated | | | | | | | | | | | 669 | | | | 17,581 | |
Public Service Enterprise Group Incorporated | | | | 1,002 | | | | 54,248 | |
SCANA Corporation | | | | 282 | | | | 10,863 | |
Sempra Energy | | | | 523 | | | | 60,726 | |
WEC Energy Group Incorporated | | | | 626 | | | | 40,471 | |
| | | | |
| | | | | | | | | | | | | | | 436,833 | |
| | | | | | | | | | | | | | | | |
|
| Water Utilities: 0.04% | |
American Water Works Company Incorporated | | | | 352 | | | | 30,054 | |
| | | | | | | | | | | | | | | | |
| |
Total Common Stocks (Cost $22,991,868) | | | | 45,634,882 | |
| | | | | | | | | | | | | | | | |
| | | | |
| | | Interest rate | | | Maturity date | | | Principal | | | | |
| U.S. Treasury Securities: 39.83% | |
U.S. Treasury Bond | | | 2.13 | % | | | 9-30-2024 | | | $ | 118,000 | | | | 113,418 | |
U.S. Treasury Bond | | | 2.13 | | | | 11-30-2024 | | | | 119,000 | | | | 114,245 | |
U.S. Treasury Bond | | | 2.25 | | | | 8-15-2046 | | | | 165,000 | | | | 141,952 | |
U.S. Treasury Bond | | | 2.50 | | | | 2-15-2045 | | | | 182,000 | | | | 165,769 | |
U.S. Treasury Bond | | | 2.50 | | | | 2-15-2046 | | | | 164,000 | | | | 148,952 | |
U.S. Treasury Bond | | | 2.50 | | | | 5-15-2046 | | | | 163,000 | | | | 147,967 | |
U.S. Treasury Bond | | | 2.75 | | | | 8-15-2042 | | | | 126,000 | | | | 121,073 | |
U.S. Treasury Bond | | | 2.75 | | | | 11-15-2042 | | | | 126,000 | | | | 121,014 | |
U.S. Treasury Bond | | | 2.75 | | | | 8-15-2047 | | | | 160,000 | | | | 152,519 | |
U.S. Treasury Bond | | | 2.75 | | | | 11-15-2047 | | | | 161,000 | | | | 153,459 | |
U.S. Treasury Bond | | | 2.88 | | | | 5-15-2043 | | | | 182,000 | | | | 178,580 | |
U.S. Treasury Bond | | | 2.88 | | | | 8-15-2045 | | | | 174,000 | | | | 170,357 | |
U.S. Treasury Bond | | | 2.88 | | | | 11-15-2046 | | | | 163,000 | | | | 159,441 | |
U.S. Treasury Bond | | | 3.00 | | | | 5-15-2042 | | | | 84,000 | | | | 84,390 | |
U.S. Treasury Bond | | | 3.00 | | | | 11-15-2044 | | | | 178,000 | | | | 178,466 | |
U.S. Treasury Bond | | | 3.00 | | | | 5-15-2045 | | | | 183,000 | | | | 183,536 | |
U.S. Treasury Bond | | | 3.00 | | | | 11-15-2045 | | | | 175,000 | | | | 175,444 | |
U.S. Treasury Bond | | | 3.00 | | | | 2-15-2047 | | | | 164,000 | | | | 164,429 | |
U.S. Treasury Bond | | | 3.00 | | | | 5-15-2047 | | | | 162,000 | | | | 162,297 | |
U.S. Treasury Bond | | | 3.00 | | | | 2-15-2048 | | | | 174,000 | | | | 174,408 | |
U.S. Treasury Bond | | | 3.13 | | | | 11-15-2041 | | | | 66,000 | | | | 67,733 | |
U.S. Treasury Bond | | | 3.13 | | | | 2-15-2042 | | | | 87,000 | | | | 89,260 | |
U.S. Treasury Bond | | | 3.13 | | | | 2-15-2043 | | | | 129,000 | | | | 132,240 | |
U.S. Treasury Bond | | | 3.13 | | | | 8-15-2044 | | | | 181,000 | | | | 185,553 | |
U.S. Treasury Bond | | | 3.38 | | | | 5-15-2044 | | | | 187,000 | | | | 200,112 | |
U.S. Treasury Bond | | | 3.50 | | | | 2-15-2039 | | | | 61,000 | | | | 66,368 | |
U.S. Treasury Bond | | | 3.63 | | | | 8-15-2043 | | | | 156,000 | | | | 173,654 | |
U.S. Treasury Bond | | | 3.63 | | | | 2-15-2044 | | | | 218,000 | | | | 242,934 | |
U.S. Treasury Bond | | | 3.75 | | | | 8-15-2041 | | | | 68,000 | | | | 76,880 | |
U.S. Treasury Bond | | | 3.75 | | | | 11-15-2043 | | | | 187,000 | | | | 212,318 | |
The accompanying notes are an integral part of these financial statements.
| | | | |
| 22 | | Wells Fargo VT Index Asset Allocation Fund | | Portfolio of investments—June 30, 2018 (unaudited) |
| | | | | | | | | | | | | | | | |
| Security name | | Interest rate | | | Maturity date | | | Principal | | | Value | |
|
U.S. Treasury Securities (continued) | |
U.S. Treasury Bond | | | 3.88 | % | | | 8-15-2040 | | | $ | 71,000 | | | $ | 81,600 | |
U.S. Treasury Bond | | | 4.25 | | | | 5-15-2039 | | | | 57,000 | | | | 68,689 | |
U.S. Treasury Bond | | | 4.25 | | | | 11-15-2040 | | | | 74,000 | | | | 89,618 | |
U.S. Treasury Bond | | | 4.38 | | | | 2-15-2038 | | | | 32,000 | | | | 38,968 | |
U.S. Treasury Bond | | | 4.38 | | | | 11-15-2039 | | | | 57,000 | | | | 69,916 | |
U.S. Treasury Bond | | | 4.38 | | | | 5-15-2040 | | | | 83,000 | | | | 102,015 | |
U.S. Treasury Bond | | | 4.38 | | | | 5-15-2041 | | | | 65,000 | | | | 80,186 | |
U.S. Treasury Bond | | | 4.50 | | | | 2-15-2036 | | | | 70,000 | | | | 85,531 | |
U.S. Treasury Bond | | | 4.50 | | | | 5-15-2038 | | | | 36,000 | | | | 44,585 | |
U.S. Treasury Bond | | | 4.50 | | | | 8-15-2039 | | | | 59,000 | | | | 73,476 | |
U.S. Treasury Bond | | | 4.63 | | | | 2-15-2040 | | | | 102,000 | | | | 129,301 | |
U.S. Treasury Bond | | | 4.75 | | | | 2-15-2037 | | | | 24,000 | | | | 30,393 | |
U.S. Treasury Bond | | | 4.75 | | | | 2-15-2041 | | | | 88,000 | | | | 113,926 | |
U.S. Treasury Bond | | | 5.00 | | | | 5-15-2037 | | | | 29,000 | | | | 37,833 | |
U.S. Treasury Bond | | | 5.25 | | | | 11-15-2028 | | | | 45,000 | | | | 54,570 | |
U.S. Treasury Bond | | | 5.25 | | | | 2-15-2029 | | | | 33,000 | | | | 40,161 | |
U.S. Treasury Bond | | | 5.38 | | | | 2-15-2031 | | | | 70,000 | | | | 88,394 | |
U.S. Treasury Bond | | | 5.50 | | | | 8-15-2028 | | | | 35,000 | | | | 43,062 | |
U.S. Treasury Bond | | | 6.13 | | | | 11-15-2027 | | | | 49,000 | | | | 62,104 | |
U.S. Treasury Bond | | | 6.13 | | | | 8-15-2029 | | | | 25,000 | | | | 32,699 | |
U.S. Treasury Bond | | | 6.25 | | | | 5-15-2030 | | | | 45,000 | | | | 60,186 | |
U.S. Treasury Bond | | | 6.38 | | | | 8-15-2027 | | | | 21,000 | | | | 26,941 | |
U.S. Treasury Bond | | | 6.88 | | | | 8-15-2025 | | | | 21,000 | | | | 26,499 | |
U.S. Treasury Note | | | 0.75 | | | | 7-15-2019 | | | | 108,000 | | | | 106,211 | |
U.S. Treasury Note | | | 0.75 | | | | 8-15-2019 | | | | 108,000 | | | | 106,034 | |
U.S. Treasury Note | | | 0.88 | | | | 5-15-2019 | | | | 110,000 | | | | 108,616 | |
U.S. Treasury Note | | | 0.88 | | | | 6-15-2019 | | | | 108,000 | | | | 106,498 | |
U.S. Treasury Note | | | 0.88 | | | | 7-31-2019 | | | | 76,000 | | | | 74,777 | |
U.S. Treasury Note | | | 0.88 | | | | 9-15-2019 | | | | 106,000 | | | | 104,058 | |
U.S. Treasury Note | | | 1.00 | | | | 6-30-2019 | | | | 58,000 | | | | 57,225 | |
U.S. Treasury Note | | | 1.00 | | | | 8-31-2019 | | | | 79,000 | | | | 77,719 | |
U.S. Treasury Note | | | 1.00 | | | | 9-30-2019 | | | | 80,000 | | | | 78,600 | |
U.S. Treasury Note | | | 1.00 | | | | 10-15-2019 | | | | 109,000 | | | | 107,016 | |
U.S. Treasury Note | | | 1.00 | | | | 11-15-2019 | | | | 96,000 | | | | 94,110 | |
U.S. Treasury Note | | | 1.00 | | | | 11-30-2019 | | | | 90,000 | | | | 88,172 | |
U.S. Treasury Note | | | 1.13 | | | | 5-31-2019 | | | | 65,000 | | | | 64,287 | |
U.S. Treasury Note | | | 1.13 | | | | 12-31-2019 | | | | 95,000 | | | | 93,115 | |
U.S. Treasury Note | | | 1.13 | | | | 3-31-2020 | | | | 93,000 | | | | 90,788 | |
U.S. Treasury Note | | | 1.13 | | | | 4-30-2020 | | | | 104,000 | | | | 101,408 | |
U.S. Treasury Note | | | 1.13 | | | | 2-28-2021 | | | | 142,000 | | | | 136,614 | |
U.S. Treasury Note | | | 1.13 | | | | 6-30-2021 | | | | 142,000 | | | | 135,860 | |
U.S. Treasury Note | | | 1.13 | | | | 7-31-2021 | | | | 153,000 | | | | 146,187 | |
U.S. Treasury Note | | | 1.13 | | | | 8-31-2021 | | | | 153,000 | | | | 145,942 | |
U.S. Treasury Note | | | 1.13 | | | | 9-30-2021 | | | | 152,000 | | | | 144,810 | |
U.S. Treasury Note | | | 1.25 | | | | 5-31-2019 | | | | 114,000 | | | | 112,891 | |
U.S. Treasury Note | | | 1.25 | | | | 6-30-2019 | | | | 114,000 | | | | 112,749 | |
U.S. Treasury Note | | | 1.25 | | | | 8-31-2019 | | | | 114,000 | | | | 112,468 | |
U.S. Treasury Note | | | 1.25 | | | | 10-31-2019 | | | | 75,000 | | | | 73,825 | |
U.S. Treasury Note | | | 1.25 | | | | 1-31-2020 | | | | 145,000 | | | | 142,219 | |
U.S. Treasury Note | | | 1.25 | | | | 2-29-2020 | | | | 82,000 | | | | 80,318 | |
The accompanying notes are an integral part of these financial statements.
| | | | | | |
| Portfolio of investments—June 30, 2018 (unaudited) | | Wells Fargo VT Index Asset Allocation Fund | | | 23 | |
| | | | | | | | | | | | | | | | |
| Security name | | Interest rate | | | Maturity date | | | Principal | | | Value | |
| | | |
U.S. Treasury Securities (continued) | | | | | | | | | | | | | |
U.S. Treasury Note | | | 1.25 | % | | | 3-31-2021 | | | $ | 145,000 | | | $ | 139,783 | |
U.S. Treasury Note | | | 1.25 | | | | 10-31-2021 | | | | 151,000 | | | | 144,252 | |
U.S. Treasury Note | | | 1.25 | | | | 7-31-2023 | | | | 125,000 | | | | 116,143 | |
U.S. Treasury Note | | | 1.38 | | | | 7-31-2019 | | | | 114,000 | | | | 112,780 | |
U.S. Treasury Note | | | 1.38 | | | | 9-30-2019 | | | | 111,000 | | | | 109,565 | |
U.S. Treasury Note | | | 1.38 | | | | 12-15-2019 | | | | 111,000 | | | | 109,261 | |
U.S. Treasury Note | | | 1.38 | | | | 1-15-2020 | | | | 109,000 | | | | 107,161 | |
U.S. Treasury Note | | | 1.38 | | | | 1-31-2020 | | | | 101,000 | | | | 99,264 | |
U.S. Treasury Note | | | 1.38 | | | | 2-15-2020 | | | | 109,000 | | | | 107,054 | |
U.S. Treasury Note | | | 1.38 | | | | 2-29-2020 | | | | 145,000 | | | | 142,321 | |
U.S. Treasury Note | | | 1.38 | | | | 3-31-2020 | | | | 149,000 | | | | 146,101 | |
U.S. Treasury Note | | | 1.38 | | | | 4-30-2020 | | | | 148,000 | | | | 144,971 | |
U.S. Treasury Note | | | 1.38 | | | | 5-31-2020 | | | | 106,000 | | | | 103,710 | |
U.S. Treasury Note | | | 1.38 | | | | 8-31-2020 | | | | 146,000 | | | | 142,373 | |
U.S. Treasury Note | | | 1.38 | | | | 9-15-2020 | | | | 102,000 | | | | 99,414 | |
U.S. Treasury Note | | | 1.38 | | | | 9-30-2020 | | | | 147,000 | | | | 143,181 | |
U.S. Treasury Note | | | 1.38 | | | | 10-31-2020 | | | | 232,000 | | | | 225,665 | |
U.S. Treasury Note | | | 1.38 | | | | 1-31-2021 | | | | 147,000 | | | | 142,510 | |
U.S. Treasury Note | | | 1.38 | | | | 4-30-2021 | | | | 144,000 | | | | 139,140 | |
U.S. Treasury Note | | | 1.38 | | | | 5-31-2021 | | | | 144,000 | | | | 138,960 | |
U.S. Treasury Note | | | 1.38 | | | | 6-30-2023 | | | | 126,000 | | | | 117,977 | |
U.S. Treasury Note | | | 1.38 | | | | 8-31-2023 | | | | 124,000 | | | | 115,795 | |
U.S. Treasury Note | | | 1.38 | | | | 9-30-2023 | | | | 90,000 | | | | 83,932 | |
U.S. Treasury Note | | | 1.50 | | | | 5-31-2019 | | | | 158,000 | | | | 156,790 | |
U.S. Treasury Note | | | 1.50 | | | | 10-31-2019 | | | | 225,000 | | | | 222,205 | |
U.S. Treasury Note | | | 1.50 | | | | 11-30-2019 | | | | 147,000 | | | | 145,013 | |
U.S. Treasury Note | | | 1.50 | | | | 4-15-2020 | | | | 107,000 | | | | 105,098 | |
U.S. Treasury Note | | | 1.50 | | | | 5-15-2020 | | | | 107,000 | | | | 105,002 | |
U.S. Treasury Note | | | 1.50 | | | | 5-31-2020 | | | | 148,000 | | | | 145,144 | |
U.S. Treasury Note | | | 1.50 | | | | 6-15-2020 | | | | 107,000 | | | | 104,893 | |
U.S. Treasury Note | | | 1.50 | | | | 7-15-2020 | | | | 107,000 | | | | 104,785 | |
U.S. Treasury Note | | | 1.50 | | | | 8-15-2020 | | | | 107,000 | | | | 104,676 | |
U.S. Treasury Note | | | 1.50 | | | | 1-31-2022 | | | | 128,000 | | | | 122,850 | |
U.S. Treasury Note | | | 1.50 | | | | 2-28-2023 | | | | 126,000 | | | | 119,247 | |
U.S. Treasury Note | | | 1.50 | | | | 3-31-2023 | | | | 126,000 | | | | 119,129 | |
U.S. Treasury Note | | | 1.50 | | | | 8-15-2026 | | | | 102,000 | | | | 92,091 | |
U.S. Treasury Note | | | 1.63 | | | | 6-30-2019 | | | | 157,000 | | | | 155,872 | |
U.S. Treasury Note | | | 1.63 | | | | 7-31-2019 | | | | 155,000 | | | | 153,722 | |
U.S. Treasury Note | | | 1.63 | | | | 8-31-2019 | | | | 144,000 | | | | 142,695 | |
U.S. Treasury Note | | | 1.63 | | | | 12-31-2019 | | | | 147,000 | | | | 145,163 | |
U.S. Treasury Note | | | 1.63 | | | | 3-15-2020 | | | | 107,000 | | | | 105,408 | |
U.S. Treasury Note | | | 1.63 | | | | 6-30-2020 | | | | 148,000 | | | | 145,370 | |
U.S. Treasury Note | | | 1.63 | | | | 7-31-2020 | | | | 148,000 | | | | 145,213 | |
U.S. Treasury Note | | | 1.63 | | | | 10-15-2020 | | | | 102,000 | | | | 99,844 | |
U.S. Treasury Note | | | 1.63 | | | | 11-30-2020 | | | | 155,000 | | | | 151,500 | |
U.S. Treasury Note | | | 1.63 | | | | 8-15-2022 | | | | 117,000 | | | | 112,069 | |
U.S. Treasury Note | | | 1.63 | | | | 8-31-2022 | | | | 151,000 | | | | 144,577 | |
U.S. Treasury Note | | | 1.63 | | | | 11-15-2022 | | | | 150,000 | | | | 143,273 | |
U.S. Treasury Note | | | 1.63 | | | | 4-30-2023 | | | | 128,000 | | | | 121,580 | |
U.S. Treasury Note | | | 1.63 | | | | 5-31-2023 | | | | 128,000 | | | | 121,480 | |
The accompanying notes are an integral part of these financial statements.
| | | | |
| 24 | | Wells Fargo VT Index Asset Allocation Fund | | Portfolio of investments—June 30, 2018 (unaudited) |
| | | | | | | | | | | | | | | | |
| Security name | | Interest rate | | | Maturity date | | | Principal | | | Value | |
| | | |
U.S. Treasury Securities (continued) | | | | | | | | | | | | | |
U.S. Treasury Note | | | 1.63 | % | | | 10-31-2023 | | | $ | 90,000 | | | $ | 84,941 | |
U.S. Treasury Note | | | 1.63 | | | | 2-15-2026 | | | | 102,000 | | | | 93,561 | |
U.S. Treasury Note | | | 1.63 | | | | 5-15-2026 | | | | 105,000 | | | | 96,034 | |
U.S. Treasury Note | | | 1.75 | | | | 9-30-2019 | | | | 144,000 | | | | 142,791 | |
U.S. Treasury Note | | | 1.75 | | | | 11-30-2019 | | | | 111,000 | | | | 109,881 | |
U.S. Treasury Note | | | 1.75 | | | | 10-31-2020 | | | | 148,000 | | | | 145,225 | |
U.S. Treasury Note | | | 1.75 | | | | 11-15-2020 | | | | 102,000 | | | | 100,048 | |
U.S. Treasury Note | | | 1.75 | | | | 12-31-2020 | | | | 148,000 | | | | 144,988 | |
U.S. Treasury Note | | | 1.75 | | | | 11-30-2021 | | | | 134,000 | | | | 130,022 | |
U.S. Treasury Note | | | 1.75 | | | | 2-28-2022 | | | | 129,000 | | | | 124,792 | |
U.S. Treasury Note | | | 1.75 | | | | 3-31-2022 | | | | 128,000 | | | | 123,745 | |
U.S. Treasury Note | | | 1.75 | | | | 4-30-2022 | | | | 126,000 | | | | 121,674 | |
U.S. Treasury Note | | | 1.75 | | | | 5-15-2022 | | | | 111,000 | | | | 107,158 | |
U.S. Treasury Note | | | 1.75 | | | | 5-31-2022 | | | | 149,000 | | | | 143,756 | |
U.S. Treasury Note | | | 1.75 | | | | 6-30-2022 | | | | 149,000 | | | | 143,628 | |
U.S. Treasury Note | | | 1.75 | | | | 9-30-2022 | | | | 144,000 | | | | 138,471 | |
U.S. Treasury Note | | | 1.75 | | | | 1-31-2023 | | | | 129,000 | | | | 123,583 | |
U.S. Treasury Note | | | 1.75 | | | | 5-15-2023 | | | | 226,000 | | | | 215,839 | |
U.S. Treasury Note | | | 1.88 | | | | 12-31-2019 | | | | 109,000 | | | | 108,029 | |
U.S. Treasury Note | | | 1.88 | | | | 6-30-2020 | | | | 86,000 | | | | 84,891 | |
U.S. Treasury Note | | | 1.88 | | | | 12-15-2020 | | | | 100,000 | | | | 98,316 | |
U.S. Treasury Note | | | 1.88 | | | | 11-30-2021 | | | | 128,000 | | | | 124,715 | |
U.S. Treasury Note | | | 1.88 | | | | 1-31-2022 | | | | 157,000 | | | | 152,695 | |
U.S. Treasury Note | | | 1.88 | | | | 2-28-2022 | | | | 153,000 | | | | 148,715 | |
U.S. Treasury Note | | | 1.88 | | | | 3-31-2022 | | | | 153,000 | | | | 148,583 | |
U.S. Treasury Note | | | 1.88 | | | | 4-30-2022 | | | | 153,000 | | | | 148,452 | |
U.S. Treasury Note | | | 1.88 | | | | 5-31-2022 | | | | 128,000 | | | | 124,110 | |
U.S. Treasury Note | | | 1.88 | | | | 7-31-2022 | | | | 149,000 | | | | 144,210 | |
U.S. Treasury Note | | | 1.88 | | | | 8-31-2022 | | | | 142,000 | | | | 137,335 | |
U.S. Treasury Note | | | 1.88 | | | | 9-30-2022 | | | | 144,000 | | | | 139,179 | |
U.S. Treasury Note | | | 1.88 | | | | 10-31-2022 | | | | 143,000 | | | | 138,107 | |
U.S. Treasury Note | | | 1.88 | | | | 8-31-2024 | | | | 125,000 | | | | 118,545 | |
U.S. Treasury Note | | | 2.00 | | | | 1-31-2020 | | | | 109,000 | | | | 108,178 | |
U.S. Treasury Note | | | 2.00 | | | | 7-31-2020 | | | | 101,000 | | | | 99,864 | |
U.S. Treasury Note | | | 2.00 | | | | 9-30-2020 | | | | 106,000 | | | | 104,671 | |
U.S. Treasury Note | | | 2.00 | | | | 11-30-2020 | | | | 122,000 | | | | 120,327 | |
U.S. Treasury Note | | | 2.00 | | | | 1-15-2021 | | | | 100,000 | | | | 98,527 | |
U.S. Treasury Note | | | 2.00 | | | | 2-28-2021 | | | | 105,000 | | | | 103,355 | |
U.S. Treasury Note | | | 2.00 | | | | 5-31-2021 | | | | 146,000 | | | | 143,462 | |
U.S. Treasury Note | | | 2.00 | | | | 8-31-2021 | | | | 127,000 | | | | 124,515 | |
U.S. Treasury Note | | | 2.00 | | | | 10-31-2021 | | | | 126,000 | | | | 123,352 | |
U.S. Treasury Note | | | 2.00 | | | | 11-15-2021 | | | | 178,000 | | | | 174,238 | |
U.S. Treasury Note | | | 2.00 | | | | 12-31-2021 | | | | 155,000 | | | | 151,531 | |
U.S. Treasury Note | | | 2.00 | | | | 2-15-2022 | | | | 133,000 | | | | 129,898 | |
U.S. Treasury Note | | | 2.00 | | | | 7-31-2022 | | | | 144,000 | | | | 140,068 | |
U.S. Treasury Note | | | 2.00 | | | | 10-31-2022 | | | | 143,000 | | | | 138,822 | |
U.S. Treasury Note | | | 2.00 | | | | 11-30-2022 | | | | 129,000 | | | | 125,180 | |
U.S. Treasury Note | | | 2.00 | | | | 2-15-2023 | | | | 220,000 | | | | 213,091 | |
U.S. Treasury Note | | | 2.00 | | | | 4-30-2024 | | | | 123,000 | | | | 117,801 | |
U.S. Treasury Note | | | 2.00 | | | | 5-31-2024 | | | | 123,000 | | | | 117,705 | |
The accompanying notes are an integral part of these financial statements.
| | | | | | |
| Portfolio of investments—June 30, 2018 (unaudited) | | Wells Fargo VT Index Asset Allocation Fund | | | 25 | |
| | | | | | | | | | | | | | | | |
| Security name | | Interest rate | | | Maturity date | | | Principal | | | Value | |
| | | |
U.S. Treasury Securities (continued) | | | | | | | | | | | | | |
U.S. Treasury Note | | | 2.00 | % | | | 6-30-2024 | | | $ | 123,000 | | | $ | 117,609 | |
U.S. Treasury Note | | | 2.00 | | | | 2-15-2025 | | | | 289,000 | | | | 274,775 | |
U.S. Treasury Note | | | 2.00 | | | | 8-15-2025 | | | | 220,000 | | | | 208,355 | |
U.S. Treasury Note | | | 2.00 | | | | 11-15-2026 | | | | 170,000 | | | | 159,262 | |
U.S. Treasury Note | | | 2.13 | | | | 8-31-2020 | | | | 138,000 | | | | 136,739 | |
U.S. Treasury Note | | | 2.13 | | | | 1-31-2021 | | | | 132,000 | | | | 130,412 | |
U.S. Treasury Note | | | 2.13 | | | | 6-30-2021 | | | | 142,000 | | | | 139,937 | |
U.S. Treasury Note | | | 2.13 | | | | 8-15-2021 | | | | 178,000 | | | | 175,240 | |
U.S. Treasury Note | | | 2.13 | | | | 9-30-2021 | | | | 128,000 | | | | 125,905 | |
U.S. Treasury Note | | | 2.13 | | | | 12-31-2021 | | | | 126,000 | | | | 123,701 | |
U.S. Treasury Note | | | 2.13 | | | | 6-30-2022 | | | | 126,000 | | | | 123,249 | |
U.S. Treasury Note | | | 2.13 | | | | 12-31-2022 | | | | 129,000 | | | | 125,730 | |
U.S. Treasury Note | | | 2.13 | | | | 11-30-2023 | | | | 110,000 | | | | 106,459 | |
U.S. Treasury Note | | | 2.13 | | | | 2-29-2024 | | | | 128,000 | | | | 123,625 | |
U.S. Treasury Note | | | 2.13 | | | | 3-31-2024 | | | | 127,000 | | | | 122,570 | |
U.S. Treasury Note | | | 2.13 | | | | 7-31-2024 | | | | 123,000 | | | | 118,368 | |
U.S. Treasury Note | | | 2.13 | | | | 5-15-2025 | | | | 234,000 | | | | 223,881 | |
U.S. Treasury Note | | | 2.25 | | | | 2-29-2020 | | | | 118,000 | | | | 117,511 | |
U.S. Treasury Note | | | 2.25 | | | | 2-15-2021 | | | | 109,000 | | | | 108,033 | |
U.S. Treasury Note | | | 2.25 | | | | 3-31-2021 | | | | 135,000 | | | | 133,687 | |
U.S. Treasury Note | | | 2.25 | | | | 4-30-2021 | | | | 142,000 | | | | 140,580 | |
U.S. Treasury Note | | | 2.25 | | | | 7-31-2021 | | | | 120,000 | | | | 118,636 | |
U.S. Treasury Note | | | 2.25 | | | | 12-31-2023 | | | | 127,000 | | | | 123,627 | |
U.S. Treasury Note | | | 2.25 | | | | 1-31-2024 | | | | 127,000 | | | | 123,542 | |
U.S. Treasury Note | | | 2.25 | | | | 10-31-2024 | | | | 121,000 | | | | 117,105 | |
U.S. Treasury Note | | | 2.25 | | | | 11-15-2024 | | | | 290,000 | | | | 280,541 | |
U.S. Treasury Note | | | 2.25 | | | | 12-31-2024 | | | | 118,000 | | | | 114,087 | |
U.S. Treasury Note | | | 2.25 | | | | 11-15-2025 | | | | 219,000 | | | | 210,591 | |
U.S. Treasury Note | | | 2.25 | | | | 2-15-2027 | | | | 196,000 | | | | 186,989 | |
U.S. Treasury Note | | | 2.25 | | | | 8-15-2027 | | | | 101,000 | | | | 96,100 | |
U.S. Treasury Note | | | 2.25 | | | | 11-15-2027 | | | | 99,000 | | | | 94,073 | |
U.S. Treasury Note | | | 2.38 | | | | 12-31-2020 | | | | 123,000 | | | | 122,351 | |
U.S. Treasury Note | | | 2.38 | | | | 1-31-2023 | | | | 144,000 | | | | 141,818 | |
U.S. Treasury Note | | | 2.38 | | | | 8-15-2024 | | | | 289,000 | | | | 282,080 | |
U.S. Treasury Note | | | 2.38 | | | | 5-15-2027 | | | | 283,000 | | | | 272,432 | |
U.S. Treasury Note | | | 2.50 | | | | 8-15-2023 | | | | 190,000 | | | | 187,744 | |
U.S. Treasury Note | | | 2.50 | | | | 5-15-2024 | | | | 281,000 | | | | 276,544 | |
U.S. Treasury Note | | | 2.50 | | | | 1-31-2025 | | | | 116,000 | | | | 113,857 | |
U.S. Treasury Note | | | 2.63 | | | | 8-15-2020 | | | | 142,000 | | | | 142,172 | |
U.S. Treasury Note | | | 2.63 | | | | 11-15-2020 | | | | 230,000 | | | | 230,198 | |
U.S. Treasury Note | | | 2.63 | | | | 2-28-2023 | | | | 146,000 | | | | 145,373 | |
U.S. Treasury Note | | | 2.75 | | | | 11-15-2023 | | | | 251,000 | | | | 250,863 | |
U.S. Treasury Note | | | 2.75 | | | | 2-15-2024 | | | | 217,000 | | | | 216,669 | |
U.S. Treasury Note | | | 2.75 | | | | 2-28-2025 | | | | 121,000 | | | | 120,546 | |
U.S. Treasury Note | | | 2.75 | | | | 2-15-2028 | | | | 189,000 | | | | 187,309 | |
U.S. Treasury Note | | | 3.13 | | | | 5-15-2019 | | | | 142,000 | | | | 142,932 | |
U.S. Treasury Note | | | 3.13 | | | | 5-15-2021 | | | | 155,000 | | | | 157,125 | |
U.S. Treasury Note | | | 3.38 | | | | 11-15-2019 | | | | 159,000 | | | | 160,907 | |
U.S. Treasury Note | | | 3.50 | | | | 5-15-2020 | | | | 138,000 | | | | 140,426 | |
U.S. Treasury Note | | | 3.63 | | | | 8-15-2019 | | | | 113,000 | | | | 114,514 | |
The accompanying notes are an integral part of these financial statements.
| | | | |
| 26 | | Wells Fargo VT Index Asset Allocation Fund | | Portfolio of investments—June 30, 2018 (unaudited) |
| | | | | | | | | | | | | | | | |
| Security name | | Interest rate | | | Maturity date | | | Principal | | | Value | |
|
U.S. Treasury Securities (continued) | |
U.S. Treasury Note | | | 3.63 | % | | | 2-15-2020 | | | $ | 191,000 | | | $ | 194,380 | |
U.S. Treasury Note | | | 3.63 | | | | 2-15-2021 | | | | 199,000 | | | | 204,068 | |
U.S. Treasury Note | | | 6.00 | | | | 2-15-2026 | | | | 42,000 | | | | 51,135 | |
U.S. Treasury Note | | | 6.25 | | | | 8-15-2023 | | | | 35,000 | | | | 40,838 | |
U.S. Treasury Note | | | 6.50 | | | | 11-15-2026 | | | | 28,000 | | | | 35,645 | |
U.S. Treasury Note | | | 6.63 | | | | 2-15-2027 | | | | 18,000 | | | | 23,214 | |
U.S. Treasury Note | | | 6.75 | | | | 8-15-2026 | | | | 21,000 | | | | 26,984 | |
U.S. Treasury Note | | | 7.13 | | | | 2-15-2023 | | | | 24,000 | | | | 28,553 | |
U.S. Treasury Note | | | 7.25 | | | | 8-15-2022 | | | | 24,000 | | | | 28,249 | |
U.S. Treasury Note | | | 7.50 | | | | 11-15-2024 | | | | 22,000 | | | | 28,029 | |
U.S. Treasury Note | | | 7.63 | | | | 11-15-2022 | | | | 12,000 | | | | 14,418 | |
U.S. Treasury Note | | | 7.63 | | | | 2-15-2025 | | | | 20,000 | | | | 25,798 | |
U.S. Treasury Note | | | 7.88 | | | | 2-15-2021 | | | | 15,000 | | | | 16,994 | |
U.S. Treasury Note | | | 8.00 | | | | 11-15-2021 | | | | 48,000 | | | | 56,216 | |
U.S. Treasury Note | | | 8.13 | | | | 8-15-2019 | | | | 29,000 | | | | 30,815 | |
U.S. Treasury Note | | | 8.13 | | | | 5-15-2021 | | | | 17,000 | | | | 19,568 | |
U.S. Treasury Note | | | 8.13 | | | | 8-15-2021 | | | | 15,000 | | | | 17,453 | |
U.S. Treasury Note | | | 8.50 | | | | 2-15-2020 | | | | 15,000 | | | | 16,425 | |
U.S. Treasury Note | | | 8.75 | | | | 5-15-2020 | | | | 12,000 | | | | 13,372 | |
U.S. Treasury Note | | | 8.75 | | | | 8-15-2020 | | | | 27,000 | | | | 30,425 | |
| |
Total U.S. Treasury Securities (Cost $31,071,919) | | | | 30,457,902 | |
| | | | | | | | | | | | | | | | |
| | | | |
| | | Yield | | | | | | | | | | |
| Short-Term Investments: 0.40% | |
|
| U.S. Treasury Securities: 0.40% | |
U.S. Treasury Bill (z)# | | | 1.62 | | | | 7-19-2018 | | | | 311,000 | | | | 310,747 | |
| | | | | | | | | | | | | | | | |
| |
Total Short-Term Investments (Cost $310,734) | | | | 310,747 | |
| | | | | | | | | | | | | | | | |
| | | | | | | | |
| Total investments in securities (Cost $54,374,521) | | | 99.90 | % | | | 76,403,531 | |
Other assets and liabilities, net | | | 0.10 | | | | 73,126 | |
| | | | | | | | |
| Total net assets | | | 100.00 | % | | $ | 76,476,657 | |
| | | | | | | | |
| † | Non-income-earning security |
| (l) | The issuer of the security is an affiliated person of the Fund as defined in the Investment Company Act of 1940. |
| (z) | Zero coupon security. The rate represents the current yield to maturity. |
| # | All or a portion of this security is segregated as collateral for investments in derivative instruments. |
Abbreviations:
| REIT | Real estate investment trust |
The accompanying notes are an integral part of these financial statements.
| | | | | | |
| Portfolio of investments—June 30, 2018 (unaudited) | | Wells Fargo VT Index Asset Allocation Fund | | | 27 | |
Futures Contracts
| | | | | | | | | | | | | | | | | | | | | | | | |
| Description | | Number of
contracts | | | Expiration
date | | | Notional
cost | | | Notional
value | | | Unrealized
gains | | | Unrealized
losses | |
Long | | | | | | | | | | | | | | | | | | | | | | | | |
S&P 500 E-Mini Index | | | 42 | | | | 9-21-2018 | | | $ | 5,852,996 | | | $ | 5,715,360 | | | $ | 0 | | | $ | (137,636 | ) |
Short | | | | | | | | | | | | | | | | | | | | | | | | |
10-Year U.S. Treasury Notes | | | (24) | | | | 9-19-2018 | | | | (2,869,431 | ) | | | (2,884,500 | ) | | | 0 | | | | (15,069 | ) |
| | | | | | | | | | | | | | | | | | | | | | | | |
| | | | | | | | | | | | | | | | | | $ | 0 | | | $ | (152,705 | ) |
| | | | | | | | | | | | | | | | | | | | | | | | |
Investments in Affiliates
An affiliated investment is an investment in which the Fund owns at least 5% of the outstanding voting shares of the issuer or as a result of other relationships, such as the Fund and the issuer having the same investment manager. Transactions with issuers that were either affiliated persons of the Fund at the beginning of the period or the end of the period were as follows:
| | | | | | | | | | | | | | | | | | | | | | | | | | | | | | | | | | | | |
| | | Shares,
beginning of
period | | | Shares
purchased | | | Shares
sold | | | Shares,
end of
period | | | Net
realized
gains
(losses) | | | Net
change in
unrealized
gains
(losses) | | | Income
from
affiliated
securities | | | Value,
end
of period | | | % of
net
assets | |
Common Stocks | | | | | | | | | | | | | | | | | | | | | | | | | | | | | | | | | | | | |
Financials | | | | | | | | | | | | | | | | | | | | | | | | | | | | | | | | | | | | |
Banks | | | | | | | | | | | | | | | | | | | | | | | | | | | | | | | | | | | | |
Wells Fargo & Company | | | 9,538 | | | | 0 | | | | 868 | | | | 8,670 | | | $ | 25,791 | | | $ | (77,221 | ) | | $ | 7,192 | | | $ | 480,665 | | | | 0.63 | % |
| | | | | | | | | |
Short-Term Investments | | | | | | | | | | | | | | | | | | | | | | | | | | | | | | | | | | | | |
Investment Companies | | | | | | | | | | | | | | | | | | | | | | | | | | | | | | | | | | | | |
Securities Lending Cash Investment LLC * | | | 17,598 | | | | 242,626 | | | | 260,224 | | | | 0 | | | | 0 | | | | 0 | | | | 47 | | | | | | | | | |
Wells Fargo Government MoneyMarket Fund Select * | | | 1,676,790 | | | | 5,117,047 | | | | 6,793,837 | | | | 0 | | | | 0 | | | | 0 | | | | 2,217 | | | | | | | | | |
| | | | | | | | | | | | | | | | | | | | | | | | | | | | | | | | | | | | |
| | | | | | | | | | | | | | | | | | $ | 25,791 | | | $ | (77,221 | ) | | $ | 9,456 | | | $ | 480,665 | | | | 0.63 | % |
| | | | | | | | | | | | | | | | | | | | | | | | | | | | | | | | | | | | |
| | * | No longer held at the end of the period. |
The accompanying notes are an integral part of these financial statements.
| | | | |
| 28 | | Wells Fargo VT Index Asset Allocation Fund | | Statement of assets and liabilities—June 30, 2018 (unaudited) |
| | | | |
| | | | |
| |
Assets | | | | |
Investments | | | | |
In unaffiliated securities, at value (cost $54,117,839) | | $ | 75,922,865 | |
In affiliated securities, at value (cost $256,682) | | | 480,665 | |
Receivable for investments sold | | | 43,551 | |
Receivable for Fund shares sold | | | 1,389 | |
Receivable for daily variation margin on open futures contracts | | | 4,931 | |
Receivable for dividends and interest | | | 227,216 | |
| | | | |
Total assets | | | 76,680,617 | |
| | | | |
| |
Liabilities | | | | |
Payable for Fund shares redeemed | | | 40,077 | |
Management fee payable | | | 37,876 | |
Payable for investments purchased | | | 22,627 | |
Professional fees payable | | | 22,378 | |
Custodian and accounting fees payable | | | 22,122 | |
Distribution fee payable | | | 16,450 | |
Shareholder report expenses payable | | | 13,173 | |
Due to custodian bank | | | 12,353 | |
Administration fees payable | | | 5,263 | |
Trustees’ fees and expenses payable | | | 4,257 | |
Accrued expenses and other liabilities | | | 7,384 | |
| | | | |
Total liabilities | | | 203,960 | |
| | | | |
Total net assets | | $ | 76,476,657 | |
| | | | |
| |
NET ASSETS CONSIST OF | | | | |
Paid-in capital | | $ | 48,134,148 | |
Undistributed net investment income | | | 12,040 | |
Accumulated net realized gains on investments | | | 6,454,164 | |
Net unrealized gains on investments | | | 21,876,305 | |
| | | | |
Total net assets | | $ | 76,476,657 | |
| | | | |
| |
COMPUTATION OF NET ASSET VALUE PER SHARE | | | | |
Net assets – Class 2 | | $ | 76,476,657 | |
Shares outstanding – Class 21 | | | 3,721,164 | |
Net asset value per share – Class 2 | | | $20.55 | |
| 1 | The Fund has an unlimited number of authorized shares. |
The accompanying notes are an integral part of these financial statements.
| | | | | | |
| Statement of operations—six months ended June 30, 2018 (unaudited) | | Wells Fargo VT Index Asset Allocation Fund | | | 29 | |
| | | | |
| | | | |
| |
Investment income | | | | |
Dividends | | $ | 452,449 | |
Interest | | | 289,336 | |
Income from affiliated securities | | | 9,456 | |
| | | | |
Total investment income | | | 751,241 | |
| | | | |
| |
Expenses | | | | |
Management fee | | | 236,734 | |
Administration fee | | | | |
Class 2 | | | 31,565 | |
Distribution fee | | | | |
Class 2 | | | 98,639 | |
Custody and accounting fees | | | 9,660 | |
Professional fees | | | 18,054 | |
Shareholder report expenses | | | 6,690 | |
Trustees’ fees and expenses | | | 12,551 | |
Other fees and expenses | | | 7,207 | |
| | | | |
Total expenses | | | 421,100 | |
Less: Fee waivers and/or expense reimbursements | | | (26,542 | ) |
| | | | |
Net expenses | | | 394,558 | |
| | | | |
Net investment income | | | 356,683 | |
| | | | |
| |
REALIZED AND UNREALIZED GAINS (LOSSES) ON INVESTMENTS | | | | |
| |
Net realized gains on: | | | | |
Unaffiliated securities | | | 2,675,038 | |
Affiliated securities | | | 25,791 | |
Futures contracts | | | 408,904 | |
| | | | |
Net realized gains on investments | | | 3,109,733 | |
| | | | |
| |
Net change in unrealized gains (losses) on: | | | | |
Unaffiliated securities | | | (2,373,955 | ) |
Affiliated securities | | | (77,221 | ) |
Futures contracts | | | (199,867 | ) |
| | | | |
Net change in unrealized gains (losses) on investments | | | (2,651,043 | ) |
| | | | |
Net realized and unrealized gains (losses) on investments | | | 458,690 | |
| | | | |
Net increase in net assets resulting from operations | | $ | 815,373 | |
| | | | |
The accompanying notes are an integral part of these financial statements.
| | | | |
| 30 | | Wells Fargo VT Index Asset Allocation Fund | | Statement of changes in net assets |
| | | | | | | | | | | | | | | | |
| | | Six months ended
June 30, 2018
(unaudited) | | | Year ended
December 31, 2017 | |
| | | | |
Operations | | | | | | | | | | | | | | | | |
Net investment income | | | | | | $ | 356,683 | | | | | | | $ | 682,858 | |
Net realized gains on investments | | | | | | | 3,109,733 | | | | | | | | 4,968,552 | |
Net change in unrealized gains (losses) on investments | | | | | | | (2,651,043 | ) | | | | | | | 3,831,851 | |
| | | | |
Net increase in net assets resulting from operations | | | | | | | 815,373 | | | | | | | | 9,483,261 | |
| | | | |
| | | | |
Distributions to shareholders from | | | | | | | | | | | | | | | | |
Net investment income – Class 2 | | | | | | | (421,706 | ) | | | | | | | (608,003 | ) |
Net realized gains – Class 2 | | | | | | | 0 | | | | | | | | (3,450,453 | ) |
| | | | |
Total distributions to shareholders | | | | | | | (421,706 | ) | | | | | | | (4,058,456 | ) |
| | | | |
| | | | |
Capital share transactions | | | Shares | | | | | | | | Shares | | | | | |
Proceeds from shares sold – Class 2 | | | 37,158 | | | | 764,472 | | | | 146,463 | | | | 2,893,484 | |
Reinvestment of distributions – Class 2 | | | 20,922 | | | | 421,706 | | | | 207,706 | | | | 4,058,456 | |
Payment for shares redeemed – Class 2 | | | (344,309 | ) | | | (7,059,154 | ) | | | (601,794 | ) | | | (11,926,259 | ) |
| | | | |
Net decrease in net assets resulting from capital share transactions | | | | | | | (5,872,976 | ) | | | | | | | (4,974,319 | ) |
| | | | |
Total increase (decrease) in net assets | | | | | | | (5,479,309 | ) | | | | | | | 450,486 | |
| | | | |
| | | | |
Net assets | | | | | | | | | | | | | | | | |
Beginning of period | | | | | | | 81,955,966 | | | | | | | | 81,505,480 | |
| | | | |
End of period | | | | | | $ | 76,476,657 | | | | | | | $ | 81,955,966 | |
| | | | |
Undistributed net investment income | | | | | | $ | 12,040 | | | | | | | $ | 77,063 | |
| | | | |
The accompanying notes are an integral part of these financial statements.
| | | | | | |
| Financial highlights | | Wells Fargo VT Index Asset Allocation Fund | | | 31 | |
(For a share outstanding throughout each period)
| | | | | | | | | | | | | | | | | | | | | | | | |
| | | Six months ended
June 30, 2018
(unaudited) | | | Year ended December 31 | |
| CLASS 2 | | 2017 | | | 2016 | | | 2015 | | | 2014 | | | 2013 | |
Net asset value, beginning of period | | | $20.45 | | | | $19.16 | | | | $18.47 | | | | $18.43 | | | | $15.85 | | | | $13.47 | |
Net investment income | | | 0.09 | | | | 0.17 | | | | 0.17 | | | | 0.18 | | | | 0.27 | | | | 0.24 | |
Net realized and unrealized gains (losses) on investments | | | 0.12 | | | | 2.12 | | | | 1.21 | | | | 0.05 | | | | 2.57 | | | | 2.39 | |
| | | | | | | | | | | | | | | | | | | | | | | | |
Total from investment operations | | | 0.21 | | | | 2.29 | | | | 1.39 | | | | 0.23 | | | | 2.84 | | | | 2.63 | |
Distributions to shareholders from | | | | | | | | | | | | | | | | | | | | | | | | |
Net investment income | | | (0.11 | ) | | | (0.15 | ) | | | (0.17 | ) | | | (0.19 | ) | | | (0.26 | ) | | | (0.25 | ) |
Net realized gains | | | 0.00 | | | | (0.85 | ) | | | (0.53 | ) | | | 0.00 | | | | 0.00 | | | | 0.00 | |
| | | | | | | | | | | | | | | | | | | | | | | | |
Total distributions to shareholders | | | (0.11 | ) | | | (1.00 | ) | | | (0.70 | ) | | | (0.19 | ) | | | (0.26 | ) | | | (0.25 | ) |
Net asset value, end of period | | | $20.55 | | | | $20.45 | | | | $19.16 | | | | $18.47 | | | | $18.43 | | | | $15.85 | |
Total return1 | | | 1.04 | % | | | 12.25 | % | | | 7.67 | % | | | 1.25 | % | | | 18.06 | % | | | 19.63 | % |
Ratios to average net assets (annualized) | | | | | | | | | | | | | | | | | | | | | | | | |
Gross expenses | | | 1.07 | % | | | 1.16 | % | | | 1.10 | % | | | 1.10 | % | | | 1.02 | % | | | 1.11 | % |
Net expenses | | | 1.00 | % | | | 1.00 | % | | | 1.00 | % | | | 1.00 | % | | | 0.99 | % | | | 1.00 | % |
Net investment income | | | 0.90 | % | | | 0.86 | % | | | 0.93 | % | | | 0.95 | % | | | 1.58 | % | | | 1.57 | % |
Supplemental data | | | | | | | | | | | | | | | | | | | | | | | | |
Portfolio turnover rate | | | 5 | % | | | 10 | % | | | 15 | % | | | 44 | % | | | 3 | % | | | 11 | % |
Net assets, end of period (000s omitted) | | | $76,477 | | | | $81,956 | | | | $81,505 | | | | $81,495 | | | | $92,146 | | | | $86,935 | |
| 1 | Returns for periods of less than one year are not annualized. Performance figures of the Fund do not reflect fees charged pursuant to the terms of variable life insurance policies and variable annuity contracts. |
The accompanying notes are an integral part of these financial statements.
| | | | |
| 32 | | Wells Fargo VT Index Asset Allocation Fund | | Notes to financial statements (unaudited) |
1. ORGANIZATION
Wells Fargo Variable Trust (the “Trust”), a Delaware statutory trust organized on March 10, 1999, is an open-end management investment company registered under the Investment Company Act of 1940, as amended (the “1940 Act”). As an investment company, the Trust follows the accounting and reporting guidance in Financial Accounting Standards Board Accounting Standards Codification Topic 946, Financial Services – Investment Companies. These financial statements report on the Wells Fargo VT Index Asset Allocation Fund (the “Fund”) which is a diversified series of the Trust. The Trust offers shares of the Fund to seperate accounts of various life insurance companies as funding vehicles for certain variable annuity contracts and variable life insurance policies.
2. SIGNIFICANT ACCOUNTING POLICIES
The following significant accounting policies, which are consistently followed in the preparation of the financial statements of the Fund, are in conformity with U.S. generally accepted accounting principles which require management to make estimates and assumptions that affect the reported amounts of assets and liabilities, disclosure of contingent assets and liabilities at the date of the financial statements, and the reported amounts of revenues and expenses during the reporting period. Actual results could differ from those estimates.
Securities valuation
All investments are valued each business day as of the close of regular trading on the New York Stock Exchange (generally 4 p.m. Eastern Time), although the Fund may deviate from this calculation time under unusual or unexpected circumstances.
Equity securities and futures that are listed on a foreign or domestic exchange or market are valued at the official closing price or, if none, the last sales price. If no sale occurs on the principal exchange or market that day, a fair value price will be determined in accordance with the Fund’s Valuation Procedures.
Debt securities are valued at the evaluated bid price provided by an independent pricing service or, if a reliable price is not available, the quoted bid price from an independent broker-dealer.
Investments in registered open-end investment companies are valued at net asset value. Interests in non-registered investment companies that are redeemable at net asset value are fair valued normally at net asset value.
Investments which are not valued using any of the methods discussed above are valued at their fair value, as determined in good faith by the Board of Trustees of the Fund. The Board of Trustees has established a Valuation Committee comprised of the Trustees and has delegated to it the authority to take any actions regarding the valuation of portfolio securities that the Valuation Committee deems necessary or appropriate, including determining the fair value of portfolio securities, unless the determination has been delegated to the Wells Fargo Asset Management Pricing Committee at Wells Fargo Funds Management, LLC (“Funds Management”). The Board of Trustees retains the authority to make or ratify any valuation decisions or approve any changes to the Valuation Procedures as it deems appropriate. On a quarterly basis, the Board of Trustees receives reports on any valuation actions taken by the Valuation Committee or the Wells Fargo Asset Management Pricing Committee which may include items for ratification.
Valuations of fair valued securities are compared to the next actual sales price when available, or other appropriate market values, to assess the continued appropriateness of the fair valuation methodologies used. These securities are fair valued on a day-to-day basis, taking into consideration changes to appropriate market information and any significant changes to the inputs considered in the valuation process until there is a readily available price provided on an exchange or by an independent pricing service. Valuations received from an independent pricing service or independent broker-dealer quotes are periodically validated by comparisons to most recent trades and valuations provided by other independent pricing services in addition to the review of prices by the manager and/or subadviser. Unobservable inputs used in determining fair valuations are identified based on the type of security, taking into consideration factors utilized by market participants in valuing the investment, knowledge about the issuer and the current market environment.
Securities lending
The Fund may lend its securities from time to time in order to earn additional income in the form of fees or interest on securities received as collateral or the investment of any cash received as collateral. The Fund continues to receive interest or dividends on the securities loaned. The Fund receives collateral in the form of cash or securities with a value at least equal to the value of the securities on loan. The value of the loaned securities is determined at the close of each business day and any additional required collateral is delivered to the Fund on the next business day. In a securities lending transaction, the net asset value of the Fund will be affected by an increase or decrease in the value of the
| | | | | | |
| Notes to financial statements (unaudited) | | Wells Fargo VT Index Asset Allocation Fund | | | 33 | |
securities loaned and by an increase or decrease in the value of the instrument in which collateral is invested. The amount of securities lending activity undertaken by the Fund fluctuates from time to time. In the event of default or bankruptcy by the borrower, the Fund may be prevented from recovering the loaned securities or gaining access to the collateral or may experience delays or costs in doing so. In addition, the investment of any cash collateral received may lose all or part of its value. The Fund has the right under the lending agreement to recover the securities from the borrower on demand.
The Fund lends its securities through an unaffiliated securities lending agent. Cash collateral received in connection with its securities lending transactions is invested in Securities Lending Cash Investments, LLC (the “Securities Lending Fund”). The Securities Lending Fund is exempt from registration under Section 3(c)(7) of the 1940 Act and is managed by Funds Management and is subadvised by Wells Capital Management Incorporated (“WellsCap”), an affiliate of Funds Management and an indirect wholly owned subsidiary of Wells Fargo & Company (“Wells Fargo”). Funds Management receives an advisory fee starting at 0.05% and declining to 0.01% as the average daily net assets of the Securities Lending Fund increase. All of the fees received by Funds Management are paid to WellsCap for its services as subadviser. The Securities Lending Fund seeks to provide a positive return compared to the daily Fed Funds Open Rate by investing in high-quality, U.S. dollar-denominated short-term money market instruments. Securities Lending Fund investments are valued at the evaluated bid price provided by an independent pricing service. Income earned from investment in the Securities Lending Fund, if any, is included in income from affiliated securities on the Statement of Operations.
Futures contracts
The Fund is subject to interest rate risk and equity price risk in the normal course of pursuing its investment objectives. Futures contracts are agreements between the Fund and a counterparty to buy or sell a specific amount of a commodity, financial instrument or currency at specified price and on a specified date. The Fund may buy and sell futures contracts in order to gain exposure to, or protect against, changes in interest rates or security values. The primary risks associated with the use of futures contracts are the imperfect correlation between changes in market values of securities held by the Fund and the prices of futures contracts, and the possibility of an illiquid market. Futures contracts are generally entered into on a regulated futures exchange and cleared through a clearinghouse associated with the exchange. With futures contracts, there is minimal counterparty risk to the Fund since futures contracts are exchange traded and the exchange’s clearinghouse, as counterparty to all exchange traded futures, guarantees the futures contracts against default.
Upon entering into a futures contracts, the Fund is required to deposit either cash or securities (initial margin) with the broker in an amount equal to a certain percentage of the contract value. Subsequent payments (variation margin) are paid to or from the broker each day equal to the daily changes in the contract value. Such payments are recorded as unrealized gains or losses and, if any, shown as variation margin receivable (payable) in the Statement of Assets and Liabilities. Should the Fund fail to make requested variation margin payments, the broker can gain access to the initial margin to satisfy the Fund’s payment obligations. When the contracts are closed, a realized gain or loss is recorded in the Statement of Operations.
Security transactions and income recognition
Securities transactions are recorded on a trade date basis. Realized gains or losses are recorded on the basis of identified cost.
Interest income is accrued daily and bond discounts are accreted and premiums are amortized daily.To the extent debt obligations are placed on non-accrual status, any related interest income may be reduced by writing off interest receivables when the collection of all or a portion of interest has been determined to be doubtful based on consistently applied procedures and the fair value has decreased. If the issuer subsequently resumes interest payments or when the collectability of interest is reasonably assured, the debt obligation is removed from non-accrual status.
Dividend income is recognized on the ex-dividend date.
Distributions to shareholders
Distributions to shareholders are recorded on the ex-dividend date and paid from net investment income quarterly and any net realized gains are paid at least annually. Such distributions are determined in accordance with income tax regulations and may differ from U.S. generally accepted accounting principles. Dividend sources are estimated at the time of declaration. The tax character of distributions is determined as of the Fund’s fiscal year end. Therefore, a portion of the Fund’s distributions made prior to the Fund’s fiscal year end may be categorized as a tax return of capital at year end.
| | | | |
| 34 | | Wells Fargo VT Index Asset Allocation Fund | | Notes to financial statements (unaudited) |
Federal and other taxes
The Fund intends to continue to qualify as a regulated investment company by distributing substantially all of its investment company taxable income and any net realized capital gains (after reduction for capital loss carryforwards) sufficient to relieve it from all, or substantially all, federal income taxes. Accordingly, no provision for federal income taxes was required.
The Fund’s income and federal excise tax returns and all financial records supporting those returns for the prior three fiscal years are subject to examination by the federal and Delaware revenue authorities. Management has analyzed the Fund’s tax positions taken on federal, state, and foreign tax returns for all open tax years and does not believe that there are any uncertain tax positions that require recognition of a tax liability.
As of June 30, 2018, the aggregate cost of all investments for federal income tax purposes was $54,591,754 and the unrealized gains (losses) consisted of:
| | | | |
Gross unrealized gains | | $ | 22,063,944 | |
Gross unrealized losses | | | (404,872 | ) |
Net unrealized gains | | $ | 21,659,072 | |
3. FAIR VALUATION MEASUREMENTS
Fair value measurements of investments are determined within a framework that has established a fair value hierarchy based upon the various data inputs utilized in determining the value of the Fund’s investments. The three-level hierarchy gives the highest priority to unadjusted quoted prices in active markets for identical assets or liabilities (Level 1) and the lowest priority to unobservable inputs (Level 3). The Fund’s investments are classified within the fair value hierarchy based on the lowest level of input that is significant to the fair value measurement. The inputs are summarized into three broad levels as follows:
| ∎ | | Level 1 – quoted prices in active markets for identical securities |
| ∎ | | Level 2 – other significant observable inputs (including quoted prices for similar securities, interest rates, prepayment speeds, credit risk, etc.) |
| ∎ | | Level 3 – significant unobservable inputs (including the Fund’s own assumptions in determining the fair value of investments) |
The inputs or methodologies used for valuing investments in securities are not necessarily an indication of the risk associated with investing in those securities.
| | | | | | |
| Notes to financial statements (unaudited) | | Wells Fargo VT Index Asset Allocation Fund | | | 35 | |
The following is a summary of the inputs used in valuing the Fund’s assets and liabilities as of June 30, 2018:
| | | | | | | | | | | | | | | | |
| | | Quoted prices
(Level 1) | | | Other significant
observable inputs
(Level 2) | | | Significant
unobservable inputs (Level 3) | | | Total | |
Assets | | | | | | | | | | | | | | | | |
Investments in: | | | | | | | | | | | | | | | | |
| | | | |
Common stocks | | | | | | | | | | | | | | | | |
Consumer discretionary | | $ | 5,897,486 | | | $ | 0 | | | $ | 0 | | | $ | 5,897,486 | |
Consumer staples | | | 3,135,212 | | | | 0 | | | | 0 | | | | 3,135,212 | |
Energy | | | 2,893,254 | | | | 0 | | | | 0 | | | | 2,893,254 | |
Financials | | | 6,318,635 | | | | 0 | | | | 0 | | | | 6,318,635 | |
Health care | | | 6,424,811 | | | | 0 | | | | 0 | | | | 6,424,811 | |
Industrials | | | 4,363,293 | | | | 0 | | | | 0 | | | | 4,363,293 | |
Information technology | | | 11,855,392 | | | | 0 | | | | 0 | | | | 11,855,392 | |
Materials | | | 1,188,072 | | | | 0 | | | | 0 | | | | 1,188,072 | |
Real estate | | | 1,302,607 | | | | 0 | | | | 0 | | | | 1,302,607 | |
Telecommunication services | | | 910,126 | | | | 0 | | | | 0 | | | | 910,126 | |
Utilities | | | 1,345,994 | | | | 0 | | | | 0 | | | | 1,345,994 | |
| | | | |
U.S. Treasury securities | | | 30,457,902 | | | | 0 | | | | 0 | | | | 30,457,902 | |
| | | | |
Short-term investments | | | | | | | | | | | | | | | | |
U.S. Treasury securities | | | 310,747 | | | | 0 | | | | 0 | | | | 310,747 | |
Total assets | | $ | 76,403,531 | | | $ | 0 | | | $ | 0 | | | $ | 76,403,531 | |
Liabilities | | | | | | | | | | | | | | | | |
Futures contracts | | $ | 152,705 | | | $ | 0 | | | $ | 0 | | | $ | 152,705 | |
Total liabilities | | $ | 152,705 | | | $ | 0 | | | $ | 0 | | | $ | 152,705 | |
Futures contracts are reported at their cumulative unrealized gains (losses) at measurement date as reported in the table following the Portfolio of investments. The current day’s variation margin is reported on the Statement of assets and liabilities. All other assets and liabilities are reported at their market value at measurement date.
The Fund recognizes transfers between levels within the fair value hierarchy at the end of the reporting period. At June 30, 2018, the Fund did not have any transfers into/out of Level 1, Level 2, or Level 3.
4. TRANSACTIONS WITH AFFILIATES
Management fee
Funds Management, an indirect wholly owned subsidiary of Wells Fargo, is the manager of the Fund and provides advisory and fund-level administrative services under an investment management agreement. Under the investment management agreement, Funds Management is responsible for, among other services, implementing the investment objectives and strategies of the Fund, supervising the subadviser and providing fund-level administrative services in connection with the Fund’s operations. As compensation for its services under the investment management agreement, Funds Management is entitled to receive an annual management fee starting at 0.60% and declining to 0.43% as the average daily net assets of the Fund increase. For the six months ended June 30, 2018, the management fee was equivalent to an annual rate of 0.60% of the Fund’s average daily net assets.
Funds Management has retained the services of a subadviser to provide daily portfolio management to the Fund. The fee for subadvisory services is borne by Funds Management. WellsCap is the subadviser to the Fund and is entitled to receive a fee from Funds Management at an annual rate starting at 0.15% and declining to 0.10% as the average daily net assets of the Fund increase.
Administration fees
Under a class-level administration agreement, Funds Management provides class-level administrative services to the Fund, which includes paying fees and expenses for services provided by the transfer agent, sub-transfer agents, omnibus account servicers and record-keepers. As compensation for its services under the class-level administration agreement, Funds Management receives a class level administration fee of 0.08% which is calculated based on the average daily net assets of Class 2 shares.
| | | | |
| 36 | | Wells Fargo VT Index Asset Allocation Fund | | Notes to financial statements (unaudited) |
Funds Management has contractually waived and/or reimbursed management and administration fees to the extent necessary to maintain certain net operating expense ratios for the Fund. When Class 2 of the Fund has exceeded its expense cap, Funds Management has waived fees and/or reimbursed expenses from fund level expenses on a proportionate basis and then from class specific expenses; otherwise, waivers and/or reimbursements are applied against class specific expenses before fund level expenses. Funds Management has committed through April 30, 2019 to waive fees and/or reimburse expenses to the extent necessary to cap the Fund’s expenses at 1.00% for Class 2 shares. After this time, the cap may be increased or the commitment to maintain the cap may be terminated only with the approval of the Board of Trustees.
Distribution fee
The Trust has adopted a distribution plan for Class 2 shares of the Fund pursuant to Rule 12b-1 under the 1940 Act. A distribution fee is charged to Class 2 shares and paid to Wells Fargo Funds Distributor, LLC, the principal underwriter, at an annual rate of 0.25% of the average daily net assets of Class 2 shares.
Interfund transactions
The Fund may purchase or sell investment securities to other Wells Fargo affiliates pursuant to Rule 17a-7 under the 1940 Act and under procedures adopted by the Board of Trustees. The procedures have been designed to ensure that these interfund transactions, which do not incur broker commissions, are effected at current market prices.
5. INVESTMENT PORTFOLIO TRANSACTIONS
Purchases and sales of investments, excluding U.S. government obligations (if any) and short-term securities, for the six months ended June 30, 2018 were $4,268,255 and $8,095,601, respectively.
6. DERIVATIVE TRANSACTIONS
During the six months ended June 30, 2018, the Fund entered into futures contracts to gain market exposure to certain asset classes consistent with an active asset allocation strategy. The Fund had an average notional amount of $5,494,874 in long futures contracts and $5,487,217 in short futures contracts during the six months ended June 30, 2018.
A summary of the location of derivative instruments on the financial statements by primary risk exposure is outlined following tables.
The fair value of derivative instruments as of June 30, 2018 was as follows for the Fund:
| | | | | | | | | | | | |
| | | Asset derivatives | | | Liability derivatives | |
| | | Statement of Assets and
Liabilities location | | Fair value | | | Statement of Assets and
Liabilities location | | Fair value | |
Interest rate risk | | Unrealized gains on futures contracts | | $ | 0 | * | | Unrealized losses on futures contracts | | $ | 15,069 | * |
Equity risk | | Unrealized gains on futures contracts | | | 0 | * | | Unrealized losses on futures contracts | | | 137,636 | * |
| | | | | $ | 0 | | | | | $ | 152,705 | |
| * | Amount represents cumulative unrealized gains (losses) on futures contracts as reported in the table following the Portfolio of Investments. Only the current day’s variation margin as of June 30, 2018 is reported separately on the Statement of Assets and Liabilities. |
The effect of derivative instruments on the Statement of Operations for the six months ended June 30, 2018, was as follows for the Fund:
| | | | | | | | |
| | | Amount of realized
gains on
derivatives | | | Change in unrealized
gains (losses) on
derivatives | |
Equity risk | | $ | 108,982 | | | $ | (14,802 | ) |
Interest rate risk | | | 299,922 | | | | (185,065 | ) |
| | | $ | 408,904 | | | $ | (199,867 | ) |
| | | | | | |
| Notes to financial statements (unaudited) | | Wells Fargo VT Index Asset Allocation Fund | | | 37 | |
7. BANK BORROWINGS
The Trust and Wells Fargo Funds Trust (excluding the money market funds and certain other funds) are parties to a $280,000,000 revolving credit agreement whereby the Fund is permitted to use bank borrowings for temporary or emergency purposes, such as to fund shareholder redemption requests. Interest under the credit agreement is charged to the Fund based on a borrowing rate equal to the higher of the Federal Funds rate in effect on that day plus 1.25% or the overnight LIBOR rate in effect on that day plus 1.25%. In addition, an annual commitment fee equal to 0.25% of the unused balance is allocated to each participating fund.
For the six months ended June 30, 2018 there were no borrowings by the Fund under the agreement.
8. CONCENTRATION RISK
Concentration risks result from exposure to a limited number of sectors. A fund that invests a substantial portion of its assets in any sector may be more affected by changes in that sector than would be a fund whose investments are not heavily weighted in any sector.
9. INDEMNIFICATION
Under the Trust’s organizational documents, the officers and Trustees have been granted certain indemnification rights against certain liabilities that may arise out of performance of their duties to the Trust. Additionally, in the normal course of business, the Trust may enter into contracts with service providers that contain a variety of indemnification clauses. The Trust’s maximum exposure under these arrangements is dependent on future claims that may be made against the Fund and, therefore, cannot be estimated.
10. SUBSEQUENT DISTRIBUTIONS
On July 13, 2018, the Fund declared distributions from short-term capital gains and long-term capital gains to shareholders of record on July 12, 2018. The per share amounts payable on July 16, 2018 were as follows:
| | | | | | |
| | | Short-term
capital gains | | Long-term
capital gains | |
Class 2 | | $0.00943 | | $ | 1.31529 | |
These distributions are not reflected in the accompanying financial statements.
| | | | |
| 38 | | Wells Fargo VT Index Asset Allocation Fund | | Other information (unaudited) |
PROXY VOTING INFORMATION
A description of the policies and procedures that the Fund uses to determine how to vote proxies relating to portfolio securities is available, upon request, by calling 1-800-260-5969, visiting our website at wellsfargofunds.com, or visiting the SEC website at sec.gov. Information regarding how the Fund voted proxies relating to portfolio securities during the most recent 12-month period ended June 30 is available on the Fund’s website at wellsfargofunds.com or by visiting the SEC website at sec.gov.
PORTFOLIO HOLDINGS INFORMATION
The complete portfolio holdings for the Fund are publicly available monthly on the Fund’s website (wellsfargofunds.com), on a one-month delayed basis. In addition, top ten holdings information (excluding derivative positions) for the Fund is publicly available on the Fund’s website on a monthly, seven-day or more delayed basis. The Fund files its complete schedule of portfolio holdings with the SEC for the first and third quarters of each fiscal year on Form N-Q, which is available by visiting the SEC website at sec.gov. In addition, the Fund’s Form N-Q may be reviewed and copied at the SEC’s Public Reference Room in Washington, DC, and at regional offices in New York City, at 233 Broadway, and in Chicago, at 175 West Jackson Boulevard, Suite 900. Information about the Public Reference Room may be obtained by calling 1-800-SEC-0330.
| | | | | | |
| Other information (unaudited) | | Wells Fargo VT Index Asset Allocation Fund | | | 39 | |
BOARD OF TRUSTEES AND OFFICERS
Each of the Trustees and Officers1 listed in the table below acts in identical capacities for each fund in the Wells Fargo family of funds, which consists of 154 mutual funds comprising the Wells Fargo Funds Trust, Wells Fargo Variable Trust, Wells Fargo Master Trust and four closed-end funds (collectively the “Fund Complex”). This table should be read in conjunction with the Prospectus and the Statement of Additional Information2. The mailing address of each Trustee and Officer is 525 Market Street, 12th Floor, San Francisco, CA 94105. Each Trustee and Officer serves an indefinite term, however, each Trustee serves such term until reaching the mandatory retirement age established by the Trustees.
Independent Trustees
| | | | | | |
Name and
year of birth | | Position held and
length of service* | | Principal occupations during past five years or longer | | Current other
public company or
investment company
directorships |
William R. Ebsworth
(Born 1957) | | Trustee, since 2015 | | Retired. From 1984 to 2013, equities analyst, portfolio manager, research director and chief investment officer at Fidelity Management and Research Company in Boston, Tokyo, and Hong Kong, and retired in 2013 as Chief Investment Officer of Fidelity Strategic Advisers, Inc. where he led a team of investment professionals managing client assets. Prior thereto, Board member of Hong Kong Securities Clearing Co., Hong Kong Options Clearing Corp., the Thailand International Fund, Ltd., Fidelity Investments Life Insurance Company, and Empire Fidelity Investments Life Insurance Company. Board member of the Forté Foundation (non-profit organization) and the Vincent Memorial Hospital Endowment (non-profit organization), where he serves on the Investment Committee and as a Chair of the Audit Committee. Mr. Ebsworth is a CFA® charterholder. | | Asset Allocation Trust |
Jane A. Freeman
(Born 1953) | | Trustee, since 2015; Chair Liaison, since 2018 | | Retired. From 2012 to 2014 and 1999 to 2008, Chief Financial Officer of Scientific Learning Corporation. From 2008 to 2012, Ms. Freeman provided consulting services related to strategic business projects. Prior to 1999, Portfolio Manager at Rockefeller & Co. and Scudder, Stevens & Clark. Board member of the Harding Loevner Funds from 1996 to 2014, serving as both Lead Independent Director and chair of the Audit Committee. Board member of the Russell Exchange Traded Funds Trust from 2011 to 2012 and the chair of the Audit Committee. Ms. Freeman is a Board Member of Ruth Bancroft Garden (non-profit organization) and the Glimmerglass Festival. She is also an inactive Chartered Financial Analyst. | | Asset Allocation Trust |
Isaiah Harris, Jr.
(Born 1952) | | Trustee, since 2009 | | Retired. Chairman of the Board of CIGNA Corporation since 2009, and Director since 2005. From 2003 to 2011, Director of Deluxe Corporation. Prior thereto, President and CEO of BellSouth Advertising and Publishing Corp. from 2005 to 2007, President and CEO of BellSouth Enterprises from 2004 to 2005 and President of BellSouth Consumer Services from 2000 to 2003. Emeritus member of the Iowa State University Foundation Board of Governors. Emeritus Member of the Advisory Board of Iowa State University School of Business. Advisory Board Member, Palm Harbor Academy (charter school). Advisory Board Member, Child Evangelism Fellowship (non-profit). Mr. Harris is a certified public accountant (inactive status). | | CIGNA Corporation; Asset Allocation Trust |
Judith M. Johnson
(Born 1949) | | Trustee, since 2008; Audit Committee Chairman, since 2009 | | Retired. Prior thereto, Chief Executive Officer and Chief Investment Officer of Minneapolis Employees Retirement Fund from 1996 to 2008. Ms. Johnson is an attorney, certified public accountant and a certified managerial accountant. | | Asset Allocation Trust |
David F. Larcker
(Born 1950) | | Trustee, since 2009 | | James Irvin Miller Professor of Accounting at the Graduate School of Business, Stanford University, Director of the Corporate Governance Research Initiative and Senior Faculty of The Rock Center for Corporate Governance since 2006. From 2005 to 2008, Professor of Accounting at the Graduate School of Business, Stanford University. Prior thereto, Ernst & Young Professor of Accounting at The Wharton School, University of Pennsylvania from 1985 to 2005. | | Asset Allocation Trust |
| | | | |
| 40 | | Wells Fargo VT Index Asset Allocation Fund | | Other information (unaudited) |
| | | | | | |
Name and
year of birth | | Position held and
length of service* | | Principal occupations during past five years or longer | | Current other
public company or
investment company
directorships |
Olivia S. Mitchell
(Born 1953) | | Trustee, since 2006; Governance Committee Chairman, since 2018 | | International Foundation of Employee Benefit Plans Professor, Wharton School of the University of Pennsylvania since 1993. Director of Wharton’s Pension Research Council and Boettner Center on Pensions & Retirement Research, and Research Associate at the National Bureau of Economic Research. Previously, Cornell University Professor from 1978 to 1993. | | Asset Allocation Trust |
Timothy J. Penny
(Born 1951) | | Trustee, since 1996; Chairman, since 2018; Vice Chairman, from 2017 to 2018 | | President and Chief Executive Officer of Southern Minnesota Initiative Foundation, a non-profit organization, since 2007. Member of the Board of Trustees of NorthStar Education Finance, Inc., a non-profit organization, since 2007. | | Asset Allocation Trust |
James G. Polisson
(Born 1959) | | Trustee, since 2018; Advisory Board Member, from 2017 to 2018 | | Retired. Chief Marketing Officer, Source (ETF) UK Services, Ltd, from 2015 to 2017. From 2012 to 2015, Principal of The Polisson Group, LLC, a management consulting, corporate advisory and principal investing company. Chief Executive Officer and Managing Director at Russell Investments, Global Exchange Traded Funds from 2010 to 2012. Managing Director of Barclays Global Investors from 1998 to 2010 and Global Chief Marketing Officer for iShares and Barclays Global Investors from 2000 to 2010. Trustee of the San Francisco Mechanics’ Institute, a non-profit organization, from 2013 to 2015. Board member of the Russell Exchange Traded Fund Trust from 2011 to 2012. Director of Barclays Global Investors Holdings Deutschland GmbH from 2006 to 2009. Mr. Polisson is an attorney and has a retired status with the Massachusetts and District of Columbia Bar Associations. | | Asset Allocation Trust |
Michael S. Scofield
(Born 1943) | | Trustee, since 2010 | | Served on the Investment Company Institute’s Board of Governors and Executive Committee from 2008-2011 as well the Governing Council of the Independent Directors Council from 2006-2011 and the Independent Directors Council Executive Committee from 2008-2011. Trustee of the Evergreen Fund complex (and its predecessors) from 1984 to 2010. Chairman of the Evergreen Funds from 2000-2010. Former Trustee of the Mentor Funds. Retired Attorney, Law Offices of Michael S. Scofield. | | Asset Allocation Trust |
Pamela Wheelock
(Born 1959) | | Trustee, since 2018; Advisory Board Member, from 2017 to 2018 | | Chief Operating Officer, Twin Cities Habitat for Humanity, since January, 2017. Vice President of University Services, University of Minnesota from 2012 to 2017. Prior thereto, on the Board of Directors, Goverance Committee and Finance Committee for the Minnesota Philanthropy Partners (Saint Paul Foundation) from 2012 to 2018, Interim President and Chief Executive Officer of Blue Cross Blue shield of Minnesota of Minnesota from 2010 to 2011, Chairman of the Board from 2009 to 2011 and Board Director 003 to 2015. Vice President, Leadership and Community Engagement, Bush Foundation, Saint Paul, Minnesota (a private foundation) from 2009 to 2011. Executive Vice President and Chief Financial Officer, Minnesota Sports and Entertainment from 2004 to 2009 and Senior Vice President from 2002 to 2004. Commissioner of Finance, State of Minnesota, from 1999 to 2002. Currently the Board Chair of the Minnesota Wild Foundation since 2010. | | Asset Allocation Trust |
| * | Length of service dates reflect the Trustee’s commencement of service with the Trust’s predecessor entities, where applicable. |
| | | | | | |
| Other information (unaudited) | | Wells Fargo VT Index Asset Allocation Fund | | | 41 | |
Officers
| | | | | | |
Name and
year of birth | | Position held and
length of service | | Principal occupations during past five years or longer | | |
Andrew Owen
(Born 1960) | | President, since 2017 | | Executive Vice President of Wells Fargo & Company and Head of Affiliated Managers, Wells Fargo Asset Management, since 2014. In addition, Mr. Owen is currently President, Chief Executive Officer and Director of Wells Fargo Funds Management, LLC since 2017. Prior thereto, Executive Vice President responsible for marketing, investments and product development for Wells Fargo Funds Management, LLC, from 2009 to 2014. | | |
Jeremy DePalma1
(Born 1974) | | Treasurer, since 2012 | | Senior Vice President of Wells Fargo Funds Management, LLC since 2009. Senior Vice President of Evergreen Investment Management Company, LLC from 2008 to 2010 and head of the Fund Reporting and Control Team within Fund Administration from 2005 to 2010. | | |
Alexander Kymn3
(Born 1973) | | Secretary, since 2018; Chief Legal Officer, since 2018 | | Senior Company Counsel of Wells Fargo Bank, N.A. since 2018 (previously Senior Counsel from 2007 to 2018). Vice President of Wells Fargo Funds Management, LLC from 2008 to 2014. | | |
Michael H. Whitaker
(Born 1967) | | Chief Compliance Officer, since 2016 | | Senior Vice President and Chief Compliance Officer since 2016. Senior Vice President and Chief Compliance Officer for Fidelity Investments from 2007 to 2016. | | |
David Berardi
(Born 1975) | | Assistant Treasurer, since 2009 | | Vice President of Wells Fargo Funds Management, LLC since 2009. Vice President of Evergreen Investment Management Company, LLC from 2008 to 2010. Manager of Fund Reporting and Control for Evergreen Investment Management Company, LLC from 2004 to 2010. | | |
| 1 | Jeremy DePalma acts as Treasurer of 77 funds and Assistant Treasurer of 77 funds in the Fund Complex. |
| 2 | The Statement of Additional Information includes additional information about the Trustees and is available, without charge, upon request, by calling 1-800-260-5969 or by visiting the website at wellsfargofunds.com. |
| 3 | Alexander Kymn became the Secretary and Chief Legal Officer effective April 17, 2018. |
| | | | |
| 42 | | Wells Fargo VT Index Asset Allocation Fund | | Other information (unaudited) |
BOARD CONSIDERATION OF INVESTMENT MANAGEMENT AND SUB-ADVISORY AGREEMENTS:
Wells Fargo VT Index Asset Allocation Fund
Under the Investment Company Act of 1940 (the “1940 Act”), the Board of Trustees (the “Board”) of Wells Fargo Variable Trust (the “Trust”) must determine annually whether to approve the continuation of the Trust’s investment management and sub-advisory agreements. In this regard, at an in-person meeting held on May 22-23, 2018 (the “Meeting”), the Board, all the members of which have no direct or indirect interest in the investment management and sub-advisory agreements and are not “interested persons” of the Trust, as defined in the 1940 Act (the “Independent Trustees”), reviewed and approved for Wells Fargo VT Index Asset Allocation Fund (the “Fund”): (i) an investment management agreement (the “Management Agreement”) with Wells Fargo Funds Management, LLC (“Funds Management”); and (ii) an investment sub-advisory agreement (the “Sub-Advisory Agreement”) with Wells Capital Management Incorporated (the “Sub-Adviser”), an affiliate of Funds Management. The Management Agreement and the Sub-Advisory Agreement are collectively referred to as the “Advisory Agreements.”
At the Meeting, the Board considered the factors and reached the conclusions described below relating to the selection of Funds Management and the Sub-Adviser and the approval of the Advisory Agreements. Prior to the Meeting, including at an in-person meeting in April 2018, the Trustees conferred extensively among themselves and with representatives of Funds Management about these matters. Also, the Board has adopted a team-based approach, with each team consisting of a sub-set of Trustees, to assist the full Board in the discharge of its duties in reviewing investment performance and other matters throughout the year. The Independent Trustees were assisted in their evaluation of the Advisory Agreements by independent legal counsel, from whom they received separate legal advice and with whom they met separately.
In providing information to the Board, Funds Management and the Sub-Adviser were guided by a detailed set of requests for information submitted to them by independent legal counsel on behalf of the Independent Trustees at the start of the Board’s annual contract renewal process earlier in 2018. In considering and approving the Advisory Agreements, the Trustees considered the information they believed relevant, including but not limited to the information discussed below. The Board considered not only the specific information presented in connection with the Meeting, but also the knowledge gained over time through interaction with Funds Management and the Sub-Adviser about various topics. In this regard, the Board reviewed reports of Funds Management at each of its quarterly meetings, which included, among other things, portfolio reviews and investment performance reports. In addition, the Board and the teams mentioned above confer with portfolio managers at various times throughout the year. The Board did not identify any particular information or consideration that was all-important or controlling, and each individual Trustee may have attributed different weights to various factors.
After its deliberations, the Board unanimously approved the continuation of the Advisory Agreements for a one-year term and determined that the compensation payable to Funds Management and the Sub-Adviser under each of the Advisory Agreements was reasonable. The Board considered the approval of the Advisory Agreements for the Fund as part of its consideration of agreements for funds across the complex, but its approvals were made on a fund-by-fund basis. The following summarizes a number of important, but not necessarily all, factors considered by the Board in support of its approvals.
Nature, extent and quality of services
The Board received and considered various information regarding the nature, extent and quality of services provided to the Fund by Funds Management and the Sub-Adviser under the Advisory Agreements. This information included a description of the investment advisory services and Fund-level administrative services covered by the Management Agreement, as well as, among other things, a summary of the background and experience of senior management of Wells Fargo Asset Management (“WFAM”), of which Funds Management and the Sub-Adviser are a part, a summary of investments made in the business of WFAM, a summary of certain organizational and personnel changes involving Funds Management and the Sub-Adviser, and a description of Funds Management’s and the Sub-Adviser’s business continuity planning programs and of their approaches to data privacy and cybersecurity. The Board also considered the qualifications, background, tenure and responsibilities of each of the portfolio managers primarily responsible for the day-to-day portfolio management of the Fund.
The Board evaluated the ability of Funds Management and the Sub-Adviser to attract and retain qualified investment professionals, including research, advisory and supervisory personnel. The Board further considered the compliance programs and compliance records of Funds Management and the Sub-Adviser. In addition, the Board took into account the full range of services provided to the Fund by Funds Management and its affiliates.
| | | | | | |
| Other information (unaudited) | | Wells Fargo VT Index Asset Allocation Fund | | | 43 | |
Fund investment performance and expenses
The Board considered the investment performance results for the Fund over various time periods ended December 31, 2017. The Board considered these results in comparison to the investment performance of funds in a universe that was determined by Broadridge Inc. (“Broadridge”) to be similar to the Fund (the “Universe”), and in comparison to the Fund’s benchmark index and to other comparative data. Broadridge is an independent provider of investment company data. The Board received a description of the methodology used by Broadridge to select the mutual funds in the performance Universe. The Board noted that the investment performance of the Fund was higher than or in range of the average investment performance of the Universe for all periods under review. The Board also noted that the investment performance of the Fund was lower than its benchmark index, the Index Asset Allocation Blended Index, for all periods under review other than the five-year period.
The Board also received and considered information regarding the Fund’s net operating expense ratio and its various components, including actual management fees, custodian and other non-management fees, and Rule 12b-1 and non-Rule 12b-1 shareholder service fees. The Board considered these ratios in comparison to the median ratio of funds in a class-specific expense group that was determined by Broadridge to be similar to the Fund (the “Group”). The Board received a description of the methodology used by Broadridge to select the mutual funds in the expense Group and an explanation of how funds comprising expense groups and their expense ratios may vary from year-to-year. Based on the Broadridge reports, the Board noted that the net operating expense ratio of the Fund was lower than the median net operating expense ratio of the expense Group.
The Board took into account the Fund performance and expense information provided to it among the factors considered in deciding to re-approve the Advisory Agreements.
Investment management and sub-advisory fee rates
The Board reviewed and considered the contractual fee rates payable by the Fund to Funds Management under the Management Agreement, as well as the contractual fee rates payable by the Fund to Funds Management for class-level administrative services under a Class-Level Administration Agreement, which include, among other things, class-level transfer agency and sub-transfer agency costs (collectively, the “Management Rate”). The Board also reviewed and considered the contractual investment sub-advisory fee rates that are payable by Funds Management to the Sub-Adviser for investment sub-advisory services.
Among other information reviewed by the Board was a comparison of the Fund’s Management Rate with the average contractual investment management fee rate of funds in the expense Group at a common asset level as well as transfer agency costs of the funds in the expense Groups. The Board noted that the Management Rate of the Fund was lower than the sum of these average rates for the Fund’s expense Group.
The Board also received and considered information about the portion of the total management fee that was retained by Funds Management after payment of the fee to the Sub-Adviser for sub-advisory services. In assessing the reasonableness of this amount, the Board received and evaluated information about the nature and extent of responsibilities retained and risks assumed by Funds Management and not delegated to or assumed by the Sub-Adviser, and about Funds Management’s on-going oversight services. Given the affiliation between Funds Management and the Sub-Adviser, the Board ascribed limited relevance to the allocation of fees between them.
The Board also received and considered information about the nature and extent of services offered and fee rates charged by Funds Management and the Sub-Adviser to other types of clients with investment strategies similar to those of the Fund. In this regard, the Board received information about the significantly greater scope of services, and compliance, reporting and other legal burdens and risks of managing mutual funds compared with those associated with managing assets of non-mutual fund clients such as institutional separate accounts.
Based on its consideration of the factors and information it deemed relevant, including those described here, the Board determined that the compensation payable to Funds Management under the Management Agreement and to the Sub-Adviser under the Sub-Advisory Agreement was reasonable.
Profitability
The Board received and considered information concerning the profitability of Funds Management, as well as the profitability of both WFAM and Wells Fargo & Co. (“Wells Fargo”) as a whole, from providing services to the Fund and the fund family as a whole. The Board noted that the Sub-Adviser’s profitability information with respect to providing services to the Fund was subsumed in the WFAM and Wells Fargo profitability analysis.
Funds Management reported on the methodologies and estimates used in calculating profitability, including a description of the methodology used to allocate certain expenses and recent enhancements made to the methodology.
| | | | |
| 44 | | Wells Fargo VT Index Asset Allocation Fund | | Other information (unaudited) |
Among other things, the Board noted that the levels of profitability reported on a fund-by-fund basis varied widely, depending on factors such as the size and type of fund. Based on its review, the Board did not deem the profits reported by Funds Management, WFAM or Wells Fargo from services provided to the Fund to be at a level that would prevent it from approving the continuation of the Advisory Agreements.
Economies of scale
The Board considered the extent to which Funds Management may experience economies of scale in the provision of management services, and the extent to which scale benefits, if any, would be shared with shareholders. In particular, the Board noted the existence of breakpoints in the Fund’s management fee structure, which operate generally to reduce the Fund’s expense ratios as the Fund grows in size. It considered that, for a small fund or a fund that shrinks in size, breakpoints conversely can result in higher fee levels. The Board also considered that in addition to management fee breakpoints, competitive management fee rates set at the outset without regard to breakpoints and fee waiver and expense reimbursement arrangements, as well as investments in the business intended to enhance services available to Fund shareholders, are means of sharing potential economies of scale with shareholders of the Fund.
The Board concluded that the Fund’s fee and expense arrangements, including contractual breakpoints, constituted a reasonable approach to sharing potential economies of scale with the Fund and its shareholders.
Other benefits to Funds Management and the Sub-Adviser
The Board received and considered information regarding potential “fall-out” or ancillary benefits received by Funds Management and its affiliates, including the Sub-Adviser, as a result of their relationships with the Fund. Ancillary benefits could include, among others, benefits directly attributable to other relationships with the Fund and benefits potentially derived from an increase in Funds Management’s and the Sub-Adviser’s business as a result of their relationships with the Fund. The Board noted that various affiliates of Funds Management may receive distribution-related fees, shareholder servicing payments and sub-transfer agency fees in respect of shares sold or held through them and services provided.
The Board also reviewed information about soft dollar credits earned and utilized by the Sub-Adviser, fees earned by Funds Management and the Sub-Adviser from managing a private investment vehicle for the fund family’s securities lending collateral and commissions earned by an affiliated broker from portfolio transactions.
Based on its consideration of the factors and information it deemed relevant, including those described here, the Board did not find that any ancillary benefits received by Funds Management and its affiliates, including the Sub-Adviser, were unreasonable.
Conclusion
At the Meeting, after considering the above-described factors and based on its deliberations and its evaluation of the information described above, the Board unanimously approved the continuation of the Advisory Agreements for a one-year term and determined that the compensation payable to Funds Management and the Sub-Adviser under each of the Advisory Agreements was reasonable.

For more information
More information about Wells Fargo Funds is available free upon request. To obtain literature, please write, email, visit the Fund’s website, or call:
Wells Fargo Funds
P.O. Box 8266
Boston, MA 02266-8266
Email: fundservice@wellsfargo.com
Website: wellsfargofunds.com
Individual investors: 1-800-222-8222
Retail investment professionals: 1-888-877-9275
Institutional investment professionals: 1-866-765-0778
This report and the financial statements contained herein are submitted for the general information of the shareholders of the Fund. If this report is used for promotional purposes, distribution of the report must be accompanied or preceded by a current prospectus. Before investing, please consider the investment objectives, risks, charges, and expenses of the investment. For a current prospectus and, if available, a summary prospectus, containing this information, call 1-800-260-5969 or visit the Fund’s website at wellsfargofunds.com. Read the prospectus carefully before you invest or send money.
Wells Fargo Asset Management (WFAM) is the trade name for certain investment advisory/management firms owned by Wells Fargo & Company. These firms include but are not limited to Wells Capital Management Incorporated and Wells Fargo Funds Management, LLC. Certain products managed by WFAM entities are distributed by Wells Fargo Funds Distributor, LLC (a broker/dealer and Member FINRA).
This material is for general informational and educational purposes only and is NOT intended to provide investment advice or a recommendation of any kind—including a recommendation for any specific investment, strategy, or plan.
NOT FDIC INSURED ◾ NO BANK GUARANTEE ◾ MAY LOSE VALUE
© 2018 Wells Fargo Funds Management, LLC. All rights reserved.
| | |
| | 314253 08-18 SVT2/SAR136 06-18 |
Semi-Annual Report
June 30, 2018

Wells Fargo VT International Equity Fund


Reduce clutter. Save trees.
Sign up for electronic delivery of prospectuses and shareholder reports at wellsfargo.com/advantagedelivery
Contents
The views expressed and any forward-looking statements are as of June 30, 2018, unless otherwise noted, and are those of the Fund managers and/or Wells Fargo Funds Management, LLC. Discussions of individual securities, or the markets generally, or any Wells Fargo Fund are not intended as individual recommendations. Future events or results may vary significantly from those expressed in any forward-looking statements. The views expressed are subject to change at any time in response to changing circumstances in the market. Wells Fargo Funds Management, LLC and the Fund disclaim any obligation to publicly update or revise any views expressed or forward-looking statements.
NOT FDIC INSURED ◾ NO BANK GUARANTEE ◾ MAY LOSE VALUE
| | | | |
| 2 | | Wells Fargo VT International Equity Fund | | Letter to shareholders (unaudited) |

Andrew Owen
President
Wells Fargo Funds
Globally, economies strengthened, equity markets advanced, and foreign bonds outperformed fixed-income investments in the U.S.
During February 2018, the U.S. stock market endured a loss of more than 10% before recovering in March and April.
Dear Shareholder:
We are pleased to offer you this semi-annual report for the Wells Fargo VT International Equity Fund for the six-month period that ended June 30, 2018. Globally, economies strengthened, equity markets advanced, and foreign bonds outperformed fixed-income investments in the U.S.
For the period, U.S. stocks, as measured by the S&P 500 Index,1 gained 2.65%, and international stocks, as measured by the MSCI ACWI ex USA Index (Net),2 dropped 3.77%. Emerging market stocks, as measured by the MSCI EM Index (Net),3 fell 6.66%. In bond markets, the Bloomberg Barclays U.S. Aggregate Bond Index4 declined 1.62% while fixed-income investments outside the U.S. lost 1.31 %, according to the Bloomberg Barclays Global Aggregate ex-USD Index.5 The Bloomberg Barclays Municipal Bond Index6 fell 0.25%, and the ICE BofAML U.S. High Yield Index7 was up 0.08%.
Volatility reemerged during the first quarter of 2018 as economic signals were mixed.
The first quarter of 2018 began with stock market gains in January after the U.S. announced tax reform measures intended to lower rates for individuals and corporations. Then, investor optimism was supplanted by several concerns. Trade tensions emerged, particularly between the U.S. and China, as the U.S. threatened to impose tariffs on a broad range of imported products. Increasing interest rates and inflation also caused concern. During February 2018, the U.S. stock market endured a loss of more than 10% before recovering in March and April. The S&P 500 Index closed the first quarter with a negative return, the first negative quarterly return for the index since 2014.
The U.S. Federal Reserve (Fed) increased the federal funds rate by 25 basis points (bps; 100 bps equal 1.00%) in March and the rate of inflation reached the Fed’s 2% target for the first time in a year. The unemployment rate fell to 4.1% by March 2018 and wage growth data improved. The third revision of gross domestic product growth for the first quarter by the U.S. Bureau of Economic Analysis released during June was lowered to 2.0%.
Overseas, investment market returns reversed the strong returns of 2017—the MSCI ACWI ex USA Index (Net) gained 27.19% for the 12-month period—falling 0.43% through the end of the second quarter of 2018. Although central banks, including the European Central Bank and the Bank of Japan, maintained low interest rates and quantitative easing measures that are generally supportive of
| 1 | The S&P 500 Index consists of 500 stocks chosen for market size, liquidity, and industry group representation. It is a market-value-weighted index with each stock’s weight in the index proportionate to its market value. You cannot invest directly in an index. |
| 2 | The Morgan Stanley Capital International (MSCI) All Country World Index (ACWI) ex USA Index (Net) is a free-float-adjusted market-capitalization-weighted index that is designed to measure the equity market performance of developed markets, excluding the United States and Canada. Source: MSCI. MSCI makes no express or implied warranties or representations and shall have no liability whatsoever with respect to any MSCI data contained herein. The MSCI data may not be further redistributed or used as a basis for other indices or any securities or financial products. This report is not approved, reviewed, or produced by MSCI. You cannot invest directly in an index. |
| 3 | The MSCI Emerging Markets (EM) Index (Net) is a free-float-adjusted market-capitalization-weighted index that is designed to measure large- and mid-cap equity market performance of emerging markets. The MSCI EM Index (Net) consists of the following 24 emerging market country indices: Brazil, Chile, China, Colombia, Czech Republic, Egypt, Greece, Hungary, India, Indonesia, Korea, Malaysia, Mexico, Pakistan, Peru, the Philippines, Poland, Qatar, Russia, South Africa, Taiwan, Thailand, Turkey, and the United Arab Emirates. You cannot invest directly in an index. |
| 4 | The Bloomberg Barclays U.S. Aggregate Bond Index is a broad-based benchmark that measures the investment-grade, U.S. dollar-denominated, fixed-rate taxable bond market, including Treasuries, government-related and corporate securities, mortgage-backed securities (agency fixed-rate and hybrid adjustable-rate mortgage pass-throughs), asset-backed securities, and commercial mortgage-backed securities. You cannot invest directly in an index. |
| 5 | The Bloomberg Barclays Global Aggregate ex-USD Index is an unmanaged index that provides a broad-based measure of the global investment-grade fixed-income markets excluding the U.S. dollar-denominated debt market. You cannot invest directly in an index. |
| 6 | The Bloomberg Barclays Municipal Bond Index is an unmanaged index composed of long-term tax-exempt bonds with a minimum credit rating of Baa. You cannot invest directly in an index. |
| 7 | The ICE BofAML U.S. High Yield Index is a market-capitalization-weighted index of domestic and Yankee high-yield bonds. The index tracks the performance of high-yield securities traded in the U.S. bond market. You cannot invest directly in an index. Copyright 2018. ICE Data Indices, LLC. All rights reserved. |
| 8 | The Consumer Price Index (CPI) is a measure of the average change over time in the prices paid by urban consumers for a market basket of consumer goods and services. You cannot invest directly in an index. |
| | | | | | |
| Letter to shareholders (unaudited) | | Wells Fargo VT International Equity Fund | | | 3 | |
businesses and equity markets, the U.S. dollar strengthened relative to local currencies, which served to restrain returns.
Global trade tensions escalated during the second quarter of 2018.
Global trade tensions escalated as the second quarter of 2018 opened and equity markets fell in response before resuming upward momentum later in April. The CPI8 for All Urban Consumers added 0.2% in May after a similar increase in April. On a year-over-year basis, the all-items index rose 2.8% for the 12 months that ended May 31, continuing its upward trend since the beginning of the year. The index for all items less food and energy rose 2.2% for the same 12-month period.
During June 2018, the Fed increased the federal funds rate by another 25 bps. Market expectations increased that the Fed might announce two more rate increases in 2018. The unemployment rate fell to an 18-year low of 3.8% in May and wage growth data improved. Internationally, central banks maintained their low interest rates and monetary policies that were accommodative of business activity.
Interest rates generally increased and the bond markets tended to decline. Long-term interest rates in the U.S. trended higher—rates on the 10-year and 30-year Treasury bonds moved from 2.46% and 2.81%, respectively, at the beginning of the year on January 1, 2018, to 2.85% and 2.98%, respectively, on June 30, 2018, well off their highest levels during the first half of the year of 3.11% and 3.25%, respectively, on May 17, 2018.
Despite the positive economic and business trends globally, international stock values fell and U.S. stock gains moderated during most of the second quarter of 2018 due to escalating tensions as the U.S. imposed tariffs on foreign goods and countries outside of the U.S. imposed tariffs of their own on U.S. products in response.
Don’t let short-term uncertainty derail long-term investment goals.
Periods of investment uncertainty can present challenges, but experience has taught us that maintaining long-term investment goals can be an effective way to plan for the future. To help you create a sound strategy based on your personal goals and risk tolerance, Wells Fargo Funds offers more than 100 mutual funds spanning a wide range of asset classes and investment styles. Although diversification cannot guarantee an investment profit or prevent losses, we believe it can be an effective way to manage investment risk and potentially smooth out overall portfolio performance. We encourage investors to know their investments and to understand that appropriate levels of risk-taking may unlock opportunities.
Thank you for choosing to invest with Wells Fargo Funds. We appreciate your confidence in us and remain committed to helping you meet your financial needs.
Sincerely,

Andrew Owen
President
Wells Fargo Funds
For further information about your Fund, contact your investment professional, visit our website at wellsfargofunds.com, or call us directly at 1-800-260-5969.
| | | | |
| 4 | | Wells Fargo VT International Equity Fund | | Performance highlights (unaudited) |
Investment objective
The Fund seeks long-term capital appreciation.
Manager
Wells Fargo Funds Management, LLC
Subadviser
Wells Capital Management Incorporated
Portfolio managers
Venkateshwar Lal
Dale A. Winner, CFA®
Average annual total returns (%) as of June 30, 20181
| | | | | | | | | | | | | | | | | | | | | | |
| | | | | | | | Expense ratios2 (%) | |
| | | Inception date | | 1 year | | | 5 year | | | 10 year | | | Gross | | | Net3 | |
| Class 1 | | 8-17-1998 | | | 4.36 | | | | 6.40 | | | | 2.20 | | | | 0.96 | | | | 0.70 | |
| Class 2 | | 7-31-2002 | | | 4.08 | | | | 6.15 | | | | 1.95 | | | | 1.21 | | | | 0.95 | |
| MSCI ACWI ex USA Index (Net)4 | | – | | | 7.28 | | | | 5.99 | | | | 2.54 | | | | – | | | | – | |
Figures quoted represent past performance, which is no guarantee of future results. Investment return and principal value of an investment will fluctuate so that an investor’s shares, when redeemed, may be worth more or less than their original cost. Current performance may be lower or higher than the performance data quoted and assumes the reinvestment of dividends and capital gains. Current month-end performance is available by calling 1-800-260-5969. Performance figures of the Fund do not reflect fees charged pursuant to the terms of variable life insurance policies and variable annuity contracts. If these charges had been reflected, performance would have been lower.
Shares are sold without a front-end sales charge or contingent deferred sales charge.
Index returns do not include transaction costs associated with buying and selling securities, any mutual fund fees or expenses, or any taxes. It is not possible to invest directly in an index.
Stock values fluctuate in response to the activities of individual companies and general market and economic conditions. Foreign investments are especially volatile and can rise or fall dramatically due to differences in the political and economic conditions of the host country. These risks are generally intensified in emerging markets. The use of derivatives may reduce returns and/or increase volatility. Certain investment strategies tend to increase the total risk of an investment (relative to the broader market). The Fund is exposed to smaller-company securities risk. Consult the Fund’s prospectus for additional information on these and other risks.
Please refer to the prospectus provided by your participating insurance company for detailed information describing the separate accounts for information regarding surrender charges, mortality and expense risk fees, and other charges that may be assessed by the participating insurance companies.
Please see footnotes on page 5.
| | | | | | |
| Performance highlights (unaudited) | | Wells Fargo VT International Equity Fund | | | 5 | |
| | | | |
| Ten largest holdings (%) as of June 30, 20185 | |
Den Norske Bank ASA | | | 3.60 | |
Bayer AG | | | 3.46 | |
Muenchener Rueckversicherungs Gesellschaft AG | | | 3.40 | |
Hitachi Limited | | | 3.25 | |
Orange SA | | | 3.10 | |
Novartis AG | | | 3.07 | |
Kingfisher plc | | | 3.04 | |
Compagnie de Saint-Gobain SA | | | 2.96 | |
Nomura Holdings Incorporated | | | 2.95 | |
SK Telecom Company Limited | | | 2.89 | |
|
| Sector distribution as of June 30, 20186 |
|
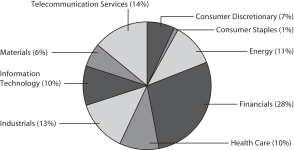
|
|
| Country allocation as of June 30, 20186 |
|
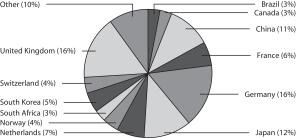 |
| 1 | Historical performance shown for all classes of the Fund prior to July 19, 2010, is based on the performance of the Fund’s predecessor, Evergreen VA International Equity Fund. |
| 2 | Reflects the expense ratios as stated in the most recent prospectuses, which include the impact of 0.01% in acquired fund fees and expenses. The expense ratios shown are subject to change and may differ from the annualized expense ratios shown in the financial highlights of this report, which do not include acquired fund fees and expenses. |
| 3 | The manager has contractually committed through April 30, 2019, to waive fees and/or reimburse expenses to the extent necessary to cap the Fund’s Total Annual Fund Operating Expenses After Fee Waivers at 0.69% for Class 1 and 0.94% for Class 2. After this time, the cap may be increased or the commitment to maintain the cap may be terminated only with the approval of the Board of Trustees. Brokerage commissions, stamp duty fees, interest, taxes, acquired fund fees and expenses (if any), and extraordinary expenses are excluded from the expense cap. Without this cap, the Fund’s returns would have been lower. The expense ratio paid by an investor is the net expense ratio (the total annual fund operating expenses after fee waivers) as stated in the prospectuses. |
| 4 | The Morgan Stanley Capital International (MSCI) All Country World Index (ACWI) ex USA Index (Net) is a free-float-adjusted market-capitalization weighted index that is designed to measure the equity market performance of developed markets, excluding the United States and Canada. Source: MSCI. MSCI makes no express or implied warranties or representations and shall have no liability whatsoever with respect to any MSCI data contained herein. The MSCI data may not be further redistributed or used as a basis for other indexes or any securities or financial products. This report is not approved, reviewed, or produced by MSCI. You cannot invest directly in an index. |
| 5 | The ten largest holdings, excluding cash, cash equivalents and any money market funds, are calculated based on the value of the investments divided by total net assets of the Fund. Holdings are subject to change and may have changed since the date specified. |
| 6 | Amounts are calculated based on the total long-term investments of the Fund. These amounts are subject to change and may have changed since the date specified. |
| | | | |
| 6 | | Wells Fargo VT International Equity Fund | | Fund expenses (unaudited) |
As a shareholder of the Fund, you incur ongoing costs, including management fees, distribution (12b-1) fees, and other Fund expenses. This example is intended to help you understand your ongoing costs (in dollars) of investing in the Fund and to compare these costs with the ongoing costs of investing in other mutual funds.
The example is based on an investment of $1,000 invested at the beginning of the six-month period and held for the entire period from January 1, 2018 to June 30, 2018.
Actual expenses
The “Actual” line of the table below provides information about actual account values and actual expenses. You may use the information in this line, together with the amount you invested, to estimate the expenses that you paid over the period. Simply divide your account value by $1,000 (for example, an $8,600 account value divided by $1,000 = 8.6), then multiply the result by the number in the “Actual” line under the heading entitled “Expenses paid during period” for your applicable class of shares to estimate the expenses you paid on your account during this period.
Hypothetical example for comparison purposes
The “Hypothetical” line of the table below provides information about hypothetical account values and hypothetical expenses based on the Fund’s actual expense ratio and an assumed rate of return of 5% per year before expenses, which is not the Fund’s actual return. The hypothetical account values and expenses may not be used to estimate the actual ending account balance or expenses you paid for the period. You may use this information to compare the ongoing costs of investing in the Fund and other funds. To do so, compare this 5% hypothetical example with the 5% hypothetical examples that appear in the shareholder reports of the other funds.
Please note that the expenses shown in the table are meant to highlight your ongoing costs only and do not reflect any separate account charges assessed by participating insurance companies. Therefore, the “Hypothetical” line of the table is useful in comparing ongoing costs only, and will not help you determine the relative total costs of owning different funds. In addition, if these separate account charges assessed by participating insurance companies were included, your costs would have been higher.
| | | | | | | | | | | | | | | | |
| | | Beginning
account value
1-1-2018 | | | Ending
account value
6-30-2018 | | | Expenses
paid during
the period¹ | | | Annualized net
expense ratio | |
Class 1 | | | | | | | | | | | | | | | | |
Actual | | $ | 1,000.00 | | | $ | 1,122.45 | | | $ | 3.63 | | | | 0.69 | % |
Hypothetical (5% return before expenses) | | $ | 1,000.00 | | | $ | 1,021.37 | | | $ | 3.46 | | | | 0.69 | % |
Class 2 | | | | | | | | | | | | | | | | |
Actual | | $ | 1,000.00 | | | $ | 1,119.10 | | | $ | 4.94 | | | | 0.94 | % |
Hypothetical (5% return before expenses) | | $ | 1,000.00 | | | $ | 1,020.13 | | | $ | 4.71 | | | | 0.94 | % |
| 1 | Expenses paid is equal to the annualized net expense ratio of each class multiplied by the average account value over the period, multiplied by the number of days in the most recent fiscal half-year divided by the number of days in the fiscal year (to reflect the one-half-year period). |
| | | | | | |
| Portfolio of investments—June 30, 2018 (unaudited) | | Wells Fargo VT International Equity Fund | | | 7 | |
| | | | | | | | | | | | | | | | |
| Security name | | | | | | | | Shares | | | Value | |
|
Common Stocks: 94.07% | |
| | | | |
| Australia: 2.15% | | | | | | | | | | | | | | | | |
Origin Energy Limited (Energy, Oil, Gas & Consumable Fuels) † | | | | | | | | | | | 274,558 | | | $ | 2,036,438 | |
| | | | | | | | | | | | | | | | |
| | | | |
| Brazil: 2.71% | | | | | | | | | | | | | | | | |
Cosan Limited Class A (Energy, Oil, Gas & Consumable Fuels) | | | | | | | | | | | 335,918 | | | | 2,563,054 | |
| | | | | | | | | | | | | | | | |
| | | | |
| Canada: 2.59% | | | | | | | | | | | | | | | | |
Home Capital Group Incorporated (Financials, Thrifts & Mortgage Finance) †« | | | | | | | | | | | 129,900 | | | | 1,483,132 | |
Lundin Mining Corporation (Materials, Metals & Mining) | | | | | | | | | | | 173,451 | | | | 964,460 | |
| |
| | | | 2,447,592 | |
| | | | | | | | | | | | | | | | |
| | | | |
| China: 10.65% | | | | | | | | | | | | | | | | |
China Everbright Limited (Financials, Capital Markets) | | | | | | | | | | | 1,034,000 | | | | 1,891,806 | |
China Mobile Limited (Telecommunication Services, Wireless Telecommunication Services) | | | | | | | | | | | 278,500 | | | | 2,471,115 | |
HollySys Automation Technologies Limited (Information Technology, Electronic Equipment, Instruments & Components) | | | | | | | | | | | 121,934 | | | | 2,699,619 | |
Shanghai Pharmaceuticals Holding Company Limited H Shares (Health Care, Health Care Providers & Services) | | | | | | | | | | | 950,000 | | | | 2,614,680 | |
Yixin Group Limited (Financials, Consumer Finance) †« | | | | | | | | | | | 947,000 | | | | 395,685 | |
| |
| | | | 10,072,905 | |
| | | | | | | | | | | | | | | | |
| | | | |
| France: 6.06% | | | | | | | | | | | | | | | | |
Compagnie de Saint-Gobain SA (Industrials, Building Products) | | | | | | | | | | | 62,858 | | | | 2,800,006 | |
Orange SA (Telecommunication Services, Diversified Telecommunication Services) | | | | | | | | | | | 175,784 | | | | 2,934,210 | |
| |
| | | | 5,734,216 | |
| | | | | | | | | | | | | | | | |
| | | | |
| Germany: 14.61% | | | | | | | | | | | | | | | | |
Bayer AG (Health Care, Pharmaceuticals) | | | | | | | | | | | 29,835 | | | | 3,276,584 | |
Ceconomy AG (Consumer Discretionary, Specialty Retail) | | | | | | | | | | | 203,575 | | | | 1,693,045 | |
Metro AG (Consumer Staples, Food & Staples Retailing) « | | | | | | | | | | | 73,077 | | | | 900,589 | |
Muenchener Rueckversicherungs Gesellschaft AG (Financials, Insurance) | | | | | | | | | | | 15,300 | | | | 3,216,715 | |
Rheinmetall AG (Industrials, Industrial Conglomerates) | | | | | | | | | | | 6,671 | | | | 733,959 | |
SAP SE (Information Technology, Software) | | | | | | | | | | | 14,126 | | | | 1,630,390 | |
Siemens AG (Industrials, Industrial Conglomerates) | | | | | | | | | | | 17,982 | | | | 2,369,233 | |
| |
| | | | 13,820,515 | |
| | | | | | | | | | | | | | | | |
| | | | |
| Hong Kong: 1.74% | | | | | | | | | | | | | | | | |
Xinyi Glass Holdings Limited (Consumer Discretionary, Auto Components) | | | | | | | | | | | 1,358,000 | | | | 1,647,176 | |
| | | | | | | | | | | | | | | | |
| | | | |
| Israel: 1.26% | | | | | | | | | | | | | | | | |
Check Point Software Technologies Limited (Information Technology, Software) † | | | | | | | | | | | 12,253 | | | | 1,196,873 | |
| | | | | | | | | | | | | | | | |
| | | | |
| Italy: 1.96% | | | | | | | | | | | | | | | | |
Eni SpA (Energy, Oil, Gas & Consumable Fuels) | | | | | | | | | | | 53,589 | | | | 993,613 | |
Prysmian SpA (Industrials, Electrical Equipment) | | | | | | | | | | | 8,332 | | | | 206,740 | |
UniCredit SpA (Financials, Banks) | | | | | | | | | | | 39,740 | | | | 658,667 | |
| |
| | | | 1,859,020 | |
| | | | | | | | | | | | | | | | |
The accompanying notes are an integral part of these financial statements.
| | | | |
| 8 | | Wells Fargo VT International Equity Fund | | Portfolio of investments—June 30, 2018 (unaudited) |
| | | | | | | | | | | | | | | | |
| Security name | | | | | | | | Shares | | | Value | |
| | | | |
| Japan: 10.89% | | | | | | | | | | | | | | | | |
Daiwa Securities Group Incorporated (Financials, Capital Markets) | | | | | | | | | | | 462,000 | | | $ | 2,677,690 | |
Hitachi Limited (Information Technology, Electronic Equipment, Instruments & Components) | | | | | | | | | | | 436,000 | | | | 3,071,612 | |
Mitsubishi UFJ Financial Group Incorporated (Financials, Banks) | | | | | | | | | | | 310,600 | | | | 1,759,512 | |
Nomura Holdings Incorporated (Financials, Capital Markets) | | | | | | | | | | | 577,100 | | | | 2,792,619 | |
| |
| | | | 10,301,433 | |
| | | | | | | | | | | | | | | | |
|
| Malaysia: 1.73% | |
CIMB Group Holdings Bhd (Financials, Banks) | | | | | | | | | | | 1,210,884 | | | | 1,632,558 | |
| | | | | | | | | | | | | | | | |
| | | | |
| Netherlands: 6.61% | | | | | | | | | | | | | | | | |
Koninklijke Philips NV (Industrials, Industrial Conglomerates) | | | | | | | | | | | 53,649 | | | | 2,272,998 | |
NN Group NV (Financials, Insurance) | | | | | | | | | | | 52,261 | | | | 2,119,518 | |
OCI NV (Materials, Chemicals) †« | | | | | | | | | | | 69,170 | | | | 1,857,456 | |
| |
| | | | 6,249,972 | |
| | | | | | | | | | | | | | | | |
| | | | |
| Norway: 3.60% | | | | | | | | | | | | | | | | |
Den Norske Bank ASA (Financials, Banks) | | | | | | | | | | | 174,962 | | | | 3,407,046 | |
| | | | | | | | | | | | | | | | |
| | | | |
| Russia: 1.86% | | | | | | | | | | | | | | | | |
Mobile TeleSystems PJSC ADR (Telecommunication Services, Wireless Telecommunication Services) | | | | | | | | | | | 199,374 | | | | 1,760,472 | |
| | | | | | | | | | | | | | | | |
| | | | |
| South Africa: 2.19% | | | | | | | | | | | | | | | | |
Sasol Limited (Materials, Chemicals) | | | | | | | | | | | 57,073 | | | | 2,075,563 | |
| | | | | | | | | | | | | | | | |
| | | | |
| South Korea: 4.43% | | | | | | | | | | | | | | | | |
Hana Financial Group Incorporated (Financials, Banks) | | | | | | | | | | | 24,405 | | | | 937,170 | |
Samsung Electronics Company Limited GDR (Information Technology, Technology Hardware, Storage & Peripherals) 144A | | | | | | | | | | | 502 | | | | 520,656 | |
SK Telecom Company Limited (Telecommunication Services, Wireless Telecommunication Services) | | | | | | | | | | | 13,086 | | | | 2,735,098 | |
| |
| | | | 4,192,924 | |
| | | | | | | | | | | | | | | | |
| | | | |
| Switzerland: 3.51% | | | | | | | | | | | | | | | | |
Novartis AG (Health Care, Pharmaceuticals) | | | | | | | | | | | 38,306 | | | | 2,901,715 | |
Zurich Insurance Group AG (Financials, Insurance) | | | | | | | | | | | 1,427 | | | | 422,006 | |
| |
| | | | 3,323,721 | |
| | | | | | | | | | | | | | | | |
| | | | |
| United Kingdom: 15.52% | | | | | | | | | | | | | | | | |
BP plc (Energy, Oil, Gas & Consumable Fuels) | | | | | | | | | | | 209,677 | | | | 1,595,331 | |
John Wood Group plc (Energy, Energy Equipment & Services) | | | | | | | | | | | 289,048 | | | | 2,386,959 | |
Kingfisher plc (Consumer Discretionary, Specialty Retail) | | | | | | | | | | | 735,016 | | | | 2,874,359 | |
Man Group plc (Financials, Capital Markets) | | | | | | | | | | | 836,979 | | | | 1,940,213 | |
Sensata Technologies Holding plc (Industrials, Electrical Equipment) † | | | | | | | | | | | 49,234 | | | | 2,342,554 | |
Smiths Group plc (Industrials, Industrial Conglomerates) | | | | | | | | | | | 42,071 | | | | 939,759 | |
Vodafone Group plc (Telecommunication Services, Wireless Telecommunication Services) | | | | | | | | | | | 1,074,002 | | | | 2,601,545 | |
| |
| | | | 14,680,720 | |
| | | | | | | | | | | | | | | | |
| |
Total Common Stocks (Cost $86,109,821) | | | | 89,002,198 | |
| | | | | | | | | | | | | | | | |
The accompanying notes are an integral part of these financial statements.
| | | | | | |
| Portfolio of investments—June 30, 2018 (unaudited) | | Wells Fargo VT International Equity Fund | | | 9 | |
| | | | | | | | | | | | | | | | |
| Security name | | Yield | | | | | | Shares | | | Value | |
| | | | |
Short-Term Investments: 7.47% | | | | | | | | | | | | | | | | |
| | | | |
| Investment Companies: 7.47% | | | | | | | | | | | | | | | | |
Securities Lending Cash Investment LLC (l)(r)(u) | | | 2.09 | % | | | | | | | 4,965,056 | | | $ | 4,965,552 | |
Wells Fargo Government Money Market Fund Select Class (l)(u) | | | 1.83 | | | | | | | | 2,101,386 | | | | 2,101,386 | |
| | | | |
Total Short-Term Investments (Cost $7,066,938) | | | | | | | | | | | | | | | 7,066,938 | |
| | | | | | | | | | | | | | | | |
| | | | | | | | |
| Total investments in securities (Cost $93,176,759) | | | 101.54 | % | | | 96,069,136 | |
Other assets and liabilities, net | | | (1.54 | ) | | | (1,455,072 | ) |
| | | | | | | | |
| Total net assets | | | 100.00 | % | | $ | 94,614,064 | |
| | | | | | | | |
| † | Non-income-earning security |
| « | All or a portion of this security is on loan. |
| 144A | The security may be resold in transactions exempt from registration, normally to qualified institutional buyers, pursuant to Rule 144A under the Securities Act of 1933. |
| (l) | The issuer of the security is an affiliated person of the Fund as defined in the Investment Company Act of 1940. |
| (r) | The investment is a non-registered investment company purchased with cash collateral received from securities on loan. |
| (u) | The rate represents the 7-day annualized yield at period end. |
Abbreviations:
| ADR | American depositary receipt |
| GDR | Global depositary receipt |
Forward Foreign Currency Contracts
| | | | | | | | | | | | | | |
Currency to be
received | | Currency to be
delivered | | Counterparty¤¤ | | Settlement date | | Unrealized
gains | | | Unrealized
losses | |
| 5,309,241 USD | | 4,525,000 EUR | | Goldman Sachs | | 9-5-2018 | | $ | 5,969 | | | $ | 0 | |
| 6,826,457 USD | | 5,158,000 GBP | | Morgan Stanley | | 9-5-2018 | | | 86,405 | | | | 0 | |
| | | | | | | | | | | | | | |
| | | | | | | | $ | 92,374 | | | $ | 0 | |
| | | | | | | | | | | | | | |
| | ¤¤ | Transaction can only be closed with the originating counterparty. |
Investments in Affiliates
An affiliated investment is an investment in which the Fund owns at least 5% of the outstanding voting shares of the issuer or as a result of other relationships, such as the Fund and the issuer having the same investment manager. Transactions with issuers that were either affiliated persons of the Fund at the beginning of the period or the end of the period were as follows:
| | | | | | | | | | | | | | | | | | | | | | | | | | | | | | | | | | | | |
| | | Shares,
beginning of
period | | | Shares
purchased | | | Shares
sold | | | Shares,
end of
period | | | Net
realized
gains
(losses) | | | Net
change in
unrealized
gains
(losses) | | | Income
from
affiliated
securities | | | Value,
end
of period | | | % of
net
assets | |
Short-Term Investments | | | | | | | | | | | | | | | | | | | | | | | | | | | | | | | | | | | | |
Investment Companies | | | | | | | | | | | | | | | | | | | | | | | | | | | | | | | | | | | | |
Securities Lending Cash Investment LLC | | | 12,050,503 | | | | 75,749,956 | | | | 82,835,403 | | | | 4,965,056 | | | $ | 25 | | | $ | (25 | ) | | $ | 102,798 | | | $ | 4,965,552 | | | | | |
Wells Fargo Government Money Market Fund Select Class | | | 12,257,057 | | | | 80,008,042 | | | | 90,163,713 | | | | 2,101,386 | | | | 0 | | | | 0 | | | | 56,290 | | | | 2,101,386 | | | | | |
| | | | | | | | | | | | | | | | | | | | | | | | | | | | | | | | | | | | |
| | | | | | | | | | | | | | | | | | $ | 25 | | | $ | (25 | ) | | $ | 159,088 | | | $ | 7,066,938 | | | | 7.47 | % |
| | | | | | | | | | | | | | | | | | | | | | | | | | | | | | | | | | | | |
The accompanying notes are an integral part of these financial statements.
| | | | |
| 10 | | Wells Fargo VT International Equity Fund | | Statement of assets and liabilities—June 30, 2018 (unaudited) |
| | | | |
| | | | |
| |
Assets | | | | |
Investments in unaffiliated securities (including $4,655,990 of securities loaned), at value (cost $86,109,821) | | $ | 89,002,198 | |
Investments in affiliated securities, at value (cost $7,066,938) | | | 7,066,938 | |
Cash segregated for forward foreign currency contracts | | | 280,000 | |
Foreign currency, at value (cost $2,051,096) | | | 2,048,947 | |
Receivable for investments sold | | | 1,095,885 | |
Receivable for Fund shares sold | | | 28,928 | |
Receivable for dividends | | | 1,263,409 | |
Receivable for securities lending income | | | 15,374 | |
Unrealized gains on forward foreign currency contracts | | | 92,374 | |
Prepaid expenses and other assets | | | 2,981 | |
| | | | |
Total assets | | | 100,897,034 | |
| | | | |
| |
Liabilities | | | | |
Payable upon receipt of securities loaned | | | 4,965,314 | |
Payable for investments purchased | | | 1,214,382 | |
Management fee payable | | | 26,260 | |
Payable for Fund shares redeemed | | | 17,627 | |
Distribution fee payable | | | 15,540 | |
Administration fees payable | | | 6,687 | |
Trustees’ fees and expenses payable | | | 2,265 | |
Accrued expenses and other liabilities | | | 34,895 | |
| | | | |
Total liabilities | | | 6,282,970 | |
| | | | |
Total net assets | | $ | 94,614,064 | |
| | | | |
| |
NET ASSETS CONSIST OF | | | | |
Paid-in capital | | $ | 24,949,078 | |
Undistributed net investment income | | | 14,063,637 | |
Accumulated net realized gains on investments | | | 52,574,132 | |
Net unrealized gains on investments | | | 3,027,217 | |
| | | | |
Total net assets | | $ | 94,614,064 | |
| | | | |
| |
COMPUTATION OF NET ASSET VALUE PER SHARE | | | | |
Net assets – Class 1 | | $ | 24,130,465 | |
Shares outstanding – Class 11 | | | 4,815,744 | |
Net asset value per share – Class 1 | | | $5.01 | |
Net assets – Class 2 | | $ | 70,483,599 | |
Shares outstanding – Class 21 | | | 13,984,762 | |
Net asset value per share – Class 2 | | | $5.04 | |
| 1 | The Fund has an unlimited number of authorized shares. |
The accompanying notes are an integral part of these financial statements.
| | | | | | |
| Statement of operations—six months ended June 30, 2018 (unaudited) | | Wells Fargo VT International Equity Fund | | | 11 | |
| | | | |
| | | | |
| |
Investment income | | | | |
Dividends (net of foreign withholding taxes of $437,527) | | $ | 3,413,317 | |
Income from affiliated securities | | | 159,088 | |
| | | | |
Total investment income | | | 3,572,405 | |
| | | | |
| |
Expenses | | | | |
Management fee | | | 921,502 | |
Administration fees | | | | |
Class 1 | | | 10,746 | |
Class 2 | | | 81,405 | |
Distribution fee | | | | |
Class 2 | | | 254,389 | |
Custody and accounting fees | | | 63,065 | |
Professional fees | | | 24,400 | |
Shareholder report expenses | | | 30,431 | |
Trustees’ fees and expenses | | | 9,870 | |
Other fees and expenses | | | 5,997 | |
| | | | |
Total expenses | | | 1,401,805 | |
Less: Fee waivers and/or expense reimbursements | | | (352,621 | ) |
| | | | |
Net expenses | | | 1,049,184 | |
| | | | |
Net investment income | | | 2,523,221 | |
| | | | |
| |
REALIZED AND UNREALIZED GAINS (LOSSES) ON INVESTMENTS | | | | |
| |
Net realized gains (losses) on: | | | | |
Unaffiliated securities | | | 37,716,559 | |
Affiliated securities | | | 25 | |
Forward foreign currency contracts | | | (967,549 | ) |
| | | | |
Net realized gains on investments | | | 36,749,035 | |
| | | | |
| |
Net change in unrealized gains (losses) on: | | | | |
Unaffiliated securities | | | (47,259,309 | ) |
Affiliated securities | | | (25 | ) |
Forward foreign currency contracts | | | 513,067 | |
| | | | |
Net change in unrealized gains (losses) on investments | | | (46,746,267 | ) |
| | | | |
Net realized and unrealized gains (losses) on investments | | | (9,997,232 | ) |
| | | | |
Net decrease in net assets resulting from operations | | $ | (7,474,011 | ) |
| | | | |
The accompanying notes are an integral part of these financial statements.
| | | | |
| 12 | | Wells Fargo VT International Equity Fund | | Statement of changes in net assets |
| | | | | | | | | | | | | | | | |
| | | Six months ended
June 30, 2018 (unaudited) | | | Year ended
December 31, 2017 | |
| | | |
Operations | | | | | | | | | | | | |
Net investment income | | | | | | $ | 2,523,221 | | | | | | | $ | 7,288,710 | |
Net realized gains on investments | | | | | | | 36,749,035 | | | | | | | | 31,414,269 | |
Net change in unrealized gains (losses) on investments | | | | | | | (46,746,267 | ) | | | | | | | 33,943,918 | |
| | | | |
Net increase (decrease) in net assets resulting from operations | | | | | | | (7,474,011 | ) | | | | | | | 72,646,897 | |
| | | | |
| | | |
Distributions to shareholders from | | | | | | | | | | | | |
Net investment income | | | | | | | | | | | | | | | | |
Class 1 | | | | | | | 0 | | | | | | | | (806,868 | ) |
Class 2 | | | | | | | 0 | | | | | | | | (8,561,142 | ) |
| | | | |
Total distributions to shareholders | | | | | | | 0 | | | | | | | | (9,368,010 | ) |
| | | | |
| | | | |
Capital share transactions | | | Shares | | | | | | | | Shares | | | | | |
Proceeds from shares sold | | | | | | | | | | | | | | | | |
Class 1 | | | 100,014 | | | | 544,027 | | | | 376,263 | | | | 1,876,925 | |
Class 2 | | | 319,812 | | | | 1,753,761 | | | | 962,895 | | | | 4,831,998 | |
| | | | |
| | | | | | | 2,297,788 | | | | | | | | 6,708,923 | |
| | | | |
Reinvestment of distributions | | | | | | | | | | | | | | | | |
Class 1 | | | 0 | | | | 0 | | | | 164,667 | | | | 806,868 | |
Class 2 | | | 0 | | | | 0 | | | | 1,733,025 | | | | 8,561,142 | |
| | | | |
| | | | | | | 0 | | | | | | | | 9,368,010 | |
| | | | |
Payment for shares redeemed | | | | | | | | | | | | | | | | |
Class 1 | | | (527,051 | ) | | | (2,837,720 | ) | | | (992,988 | ) | | | (4,886,469 | ) |
Class 2 | | | (45,494,605 | ) | | | (243,575,054 | ) | | | (8,469,095 | ) | | | (42,031,034 | ) |
| | | | |
| | | | | | | (246,412,774 | ) | | | | | | | (46,917,503 | ) |
| | | | |
Net decrease in net assets resulting from capital share transactions | | | | | | | (244,114,986 | ) | | | | | | | (30,840,570 | ) |
| | | | |
Total increase (decrease) in net assets | | | | | | | (251,588,997 | ) | | | | | | | 32,438,317 | |
| | | | |
| | |
Net assets | | | | | | | | |
Beginning of period | | | | | | | 346,203,061 | | | | | | | | 313,764,744 | |
| | | | |
End of period | | | | | | $ | 94,614,064 | | | | | | | $ | 346,203,061 | |
| | | | |
Undistributed net investment income | | | | | | $ | 14,063,637 | | | | | | | $ | 11,540,416 | |
| | | | |
The accompanying notes are an integral part of these financial statements.
| | | | | | |
| Financial highlights | | Wells Fargo VT International Equity Fund | | | 13 | |
(For a share outstanding throughout each period)
| | | | | | | | | | | | | | | | | | | | | | | | |
| | | Six months ended
June 30, 2018 (unaudited) | | | Year ended December 31 | |
| CLASS 1 | | 2017 | | | 2016 | | | 2015 | | | 2014 | | | 2013 | |
Net asset value, beginning of period | | | $5.34 | | | | $4.41 | | | | $4.82 | | | | $4.92 | | | | $5.48 | | | | $4.94 | |
Net investment income | | | 0.09 | 1 | | | 0.12 | 1 | | | 0.11 | 1 | | | 0.11 | 1 | | | 0.18 | 1 | | | 0.12 | 1 |
Net realized and unrealized gains (losses) on investments | | | (0.42 | ) | | | 0.96 | | | | (0.01 | ) | | | 0.02 | | | | (0.46 | ) | | | 0.82 | |
| | | | | | | | | | | | | | | | | | | | | | | | |
Total from investment operations | | | (0.33 | ) | | | 1.08 | | | | 0.10 | | | | 0.13 | | | | (0.28 | ) | | | 0.94 | |
Distributions to shareholders from | | | | | | | | | | | | | | | | | | | | | | | | |
Net investment income | | | 0.00 | | | | (0.15 | ) | | | (0.15 | ) | | | (0.23 | ) | | | (0.16 | ) | | | (0.13 | ) |
Net realized gains | | | 0.00 | | | | 0.00 | | | | (0.36 | ) | | | 0.00 | | | | (0.12 | ) | | | (0.27 | ) |
| | | | | | | | | | | | | | | | | | | | | | | | |
Total distributions to shareholders | | | 0.00 | | | | (0.15 | ) | | | (0.51 | ) | | | (0.23 | ) | | | (0.28 | ) | | | (0.40 | ) |
Net asset value, end of period | | | $5.01 | | | | $5.34 | | | | $4.41 | | | | $4.82 | | | | $4.92 | | | | $5.48 | |
Total return2 | | | (6.18 | )% | | | 24.86 | % | | | 3.25 | % | | | 2.30 | % | | | (5.30 | )% | | | 19.94 | % |
Ratios to average net assets (annualized) | | | | | | | | | | | | | | | | | | | | | | | | |
Gross expenses | | | 1.05 | % | | | 0.95 | % | | | 0.95 | % | | | 0.95 | % | | | 0.94 | % | | | 0.95 | % |
Net expenses | | | 0.69 | % | | | 0.69 | % | | | 0.69 | % | | | 0.69 | % | | | 0.69 | % | | | 0.69 | % |
Net investment income | | | 3.26 | % | | | 2.41 | % | | | 2.49 | % | | | 2.04 | % | | | 3.44 | % | | | 2.36 | % |
Supplemental data | | | | | | | | | | | | | | | | | | | | | | | | |
Portfolio turnover rate | | | 26 | % | | | 55 | % | | | 77 | % | | | 34 | % | | | 39 | % | | | 32 | % |
Net assets, end of period (000s omitted) | | | $24,130 | | | | $28,001 | | | | $25,137 | | | | $30,254 | | | | $32,599 | | | | $42,021 | |
| 1 | Calculated based upon average shares outstanding |
| 2 | Returns for periods of less than one year are not annualized. Performance figures of the Fund do not reflect fees charged pursuant to the terms of variable life insurance policies and variable annuity contracts. |
The accompanying notes are an integral part of these financial statements.
| | | | |
| 14 | | Wells Fargo VT International Equity Fund | | Financial highlights |
(For a share outstanding throughout each period)
| | | | | | | | | | | | | | | | | | | | | | | | |
| | | Six months ended
June 30, 2018 (unaudited) | | | Year ended December 31 | |
| CLASS 2 | | 2017 | | | 2016 | | | 2015 | | | 2014 | | | 2013 | |
Net asset value, beginning of period | | | $5.38 | | | | $4.45 | | | | $4.84 | | | | $4.95 | | | | $5.50 | | | | $4.96 | |
Net investment income | | | 0.06 | 1 | | | 0.11 | 1 | | | 0.10 | | | | 0.09 | 1 | | | 0.16 | | | | 0.11 | 1 |
Net realized and unrealized gains (losses) on investments | | | (0.40 | ) | | | 0.96 | | | | 0.00 | | | | 0.01 | | | | (0.45 | ) | | | 0.82 | |
| | | | | | | | | | | | | | | | | | | | | | | | |
Total from investment operations | | | (0.34 | ) | | | 1.07 | | | | 0.10 | | | | 0.10 | | | | (0.29 | ) | | | 0.93 | |
Distributions to shareholders from | | | | | | | | | | | | | | | | | | | | | | | | |
Net investment income | | | 0.00 | | | | (0.14 | ) | | | (0.13 | ) | | | (0.21 | ) | | | (0.14 | ) | | | (0.12 | ) |
Net realized gains | | | 0.00 | | | | 0.00 | | | | (0.36 | ) | | | 0.00 | | | | (0.12 | ) | | | (0.27 | ) |
| | | | | | | | | | | | | | | | | | | | | | | | |
Total distributions to shareholders | | | 0.00 | | | | (0.14 | ) | | | (0.49 | ) | | | (0.21 | ) | | | (0.26 | ) | | | (0.39 | ) |
Net asset value, end of period | | | $5.04 | | | | $5.38 | | | | $4.45 | | | | $4.84 | | | | $4.95 | | | | $5.50 | |
Total return2 | | | (6.32 | )% | | | 24.34 | % | | | 3.30 | % | | | 1.80 | % | | | (5.35 | )% | | | 19.52 | % |
Ratios to average net assets (annualized) | | | | | | | | | | | | | | | | | | | | | | | | |
Gross expenses | | | 1.24 | % | | | 1.20 | % | | | 1.20 | % | | | 1.20 | % | | | 1.20 | % | | | 1.20 | % |
Net expenses | | | 0.94 | % | | | 0.94 | % | | | 0.94 | % | | | 0.94 | % | | | 0.94 | % | | | 0.94 | % |
Net investment income | | | 2.05 | % | | | 2.18 | % | | | 2.25 | % | | | 1.77 | % | | | 3.07 | % | | | 2.08 | % |
Supplemental data | | | | | | | | | | | | | | | | | | | | | | | | |
Portfolio turnover rate | | | 26 | % | | | 55 | % | | | 77 | % | | | 34 | % | | | 39 | % | | | 32 | % |
Net assets, end of period (000s omitted) | | | $70,484 | | | | $318,202 | | | | $288,628 | | | | $295,215 | | | | $310,909 | | | | $319,565 | |
| 1 | Calculated based upon average shares outstanding |
| 2 | Returns for periods of less than one year are not annualized. Performance figures of the Fund do not reflect fees charged pursuant to the terms of variable life insurance policies and variable annuity contracts. |
The accompanying notes are an integral part of these financial statements.
| | | | | | |
| Notes to financial statements (unaudited) | | Wells Fargo VT International Equity Fund | | | 15 | |
1. ORGANIZATION
Wells Fargo Variable Trust (the “Trust”), a Delaware statutory trust organized on March 10, 1999, is an open-end management investment company registered under the Investment Company Act of 1940, as amended (the “1940 Act”). As an investment company, the Trust follows the accounting and reporting guidance in Financial Accounting Standards Board Accounting Standards Codification Topic 946, Financial Services – Investment Companies. These financial statements report on the Wells Fargo VT International Equity Fund (the “Fund”) which is a diversified series of the Trust. The Trust offers shares of the Fund to separate accounts of various life insurance companies as funding vehicles for certain variable annuity contracts and variable life insurance policies.
2. SIGNIFICANT ACCOUNTING POLICIES
The following significant accounting policies, which are consistently followed in the preparation of the financial statements of the Fund, are in conformity with U.S. generally accepted accounting principles which require management to make estimates and assumptions that affect the reported amounts of assets and liabilities, disclosure of contingent assets and liabilities at the date of the financial statements, and the reported amounts of revenues and expenses during the reporting period. Actual results could differ from those estimates.
Securities valuation
All investments are valued each business day as of the close of regular trading on the New York Stock Exchange (generally 4 p.m. Eastern Time), although the Fund may deviate from this calculation time under unusual or unexpected circumstances.
Equity securities that are listed on a foreign or domestic exchange or market are valued at the official closing price or, if none, the last sales price. If no sale occurs on the principal exchange or market that day, a fair value price will be determined in accordance with the Fund’s Valuation Procedures.
The values of securities denominated in foreign currencies are translated into U.S. dollars at rates provided by an independent foreign currency pricing source at a time each business day specified by the Wells Fargo Asset Management Pricing Committee at Wells Fargo Funds Management, LLC (“Funds Management”).
Many securities markets and exchanges outside the U.S. close prior to the close of the New York Stock Exchange and therefore may not fully reflect trading or events that occur after the close of the principal exchange in which the foreign securities are traded, but before the close of the New York Stock Exchange. If such trading or events are expected to materially affect the value of such securities, then fair value pricing procedures approved by the Board of Trustees of the Fund are applied. These procedures take into account multiple factors including movements in U.S. securities markets after foreign exchanges close. Foreign securities that are fair valued under these procedures are categorized as Level 2 and the application of these procedures may result in transfers between Level 1 and Level 2. Depending on market activity, such fair valuations may be frequent. Such fair value pricing may result in net asset values that are higher or lower than net asset values based on the last reported sales price or latest quoted bid price. On June 30, 2018, such fair value pricing was used in pricing certain foreign securities.
Investments in registered open-end investment companies are valued at net asset value. Interests in non-registered investment companies that are redeemable at net asset value are fair valued normally at net asset value.
Investments which are not valued using any of the methods discussed above are valued at their fair value, as determined in good faith by the Board of Trustees. The Board of Trustees has established a Valuation Committee comprised of the Trustees and has delegated to it the authority to take any actions regarding the valuation of portfolio securities that the Valuation Committee deems necessary or appropriate, including determining the fair value of portfolio securities, unless the determination has been delegated to the Wells Fargo Asset Management Pricing Committee. The Board of Trustees retains the authority to make or ratify any valuation decisions or approve any changes to the Valuation Procedures as it deems appropriate. On a quarterly basis, the Board of Trustees receives reports on any valuation actions taken by the Valuation Committee or the Wells Fargo Asset Management Pricing Committee which may include items for ratification.
Valuations of fair valued securities are compared to the next actual sales price when available, or other appropriate market values, to assess the continued appropriateness of the fair valuation methodologies used. These securities are fair valued on a day-to-day basis, taking into consideration changes to appropriate market information and any significant changes to the inputs considered in the valuation process until there is a readily available price provided on an exchange or by an independent pricing service. Valuations received from an independent pricing service or independent broker-dealer quotes are periodically validated by comparisons to most recent trades and valuations provided by other independent pricing services in addition to the review of prices by the manager and/or subadviser. Unobservable inputs used in determining fair
| | | | |
| 16 | | Wells Fargo VT International Equity Fund | | Notes to financial statements (unaudited) |
valuations are identified based on the type of security, taking into consideration factors utilized by market participants in valuing the investment, knowledge about the issuer and the current market environment.
Foreign currency translation
The accounting records of the Fund are maintained in U.S. dollars. The values of other assets and liabilities denominated in foreign currencies are translated into U.S. dollars at rates provided by an independent foreign currency pricing source at a time each business day specified by the Wells Fargo Asset Management Pricing Committee. Purchases and sales of securities, and income and expenses are converted at the rate of exchange on the respective dates of such transactions. Net realized foreign exchange gains or losses arise from sales of foreign currencies, currency gains or losses realized between the trade and settlement dates on securities transactions, and the difference between the amounts of dividends, interest and foreign withholding taxes recorded and the U.S. dollar equivalent of the amounts actually paid or received. Net unrealized foreign exchange gains and losses arise from changes in the fair value of assets and liabilities other than investments in securities resulting from changes in exchange rates. The changes in net assets arising from changes in exchange rates of securities and the changes in net assets resulting from changes in market prices of securities are not separately presented. Such changes are included in net realized and unrealized gains or losses from investments.
Forward foreign currency contracts
The Fund is subject to foreign currency risk in the normal course of pursuing its investment objectives. A forward foreign currency contract is an agreement between two parties to purchase or sell a specific currency for an agreed-upon price at a future date. The Fund enters into forward foreign currency contracts to facilitate transactions in foreign-denominated securities and to attempt to minimize the risk to the Fund from adverse changes in the relationship between currencies. Forward foreign currency contracts are recorded at the forward rate and marked-to-market daily. When the contracts are closed, realized gains and losses arising from such transactions are recorded as realized gains or losses on forward foreign currency contracts. The Fund could be exposed to risks if the counterparties to the contracts are unable to meet the terms of their contracts or if the value of the foreign currency changes unfavorably. The Fund’s maximum risk of loss from counterparty credit risk is the unrealized gains on the contracts. This risk may be mitigated if there is a master netting arrangement between the Fund and the counterparty.
Participation notes
The Fund may invest in participation notes to gain exposure to securities in certain foreign markets. Participation notes are issued by banks or broker-dealers and are designed to offer a return linked to a particular underlying foreign security. Participation notes involve transaction costs, which may be higher than those applicable to the underlying foreign security. The holder of the participation note is entitled to receive from the bank or broker-dealer, an amount equal to the dividend paid by the issuer of the underlying foreign security; however, the holder is not entitled to the same rights (i.e. voting rights) as an owner of the underlying foreign security. Investments in participation notes involve risks beyond those normally associated with a direct investment in an underlying security. The Fund has no rights against the issuer of the underlying foreign security and participation notes expose the Fund to counterparty risk in the event the counterparty does not perform. There is also no assurance there will be a secondary trading market for the participation note or that the trading price of the participation note will equal the underlying value of the foreign security that it seeks to replicate.
Securities lending
The Fund may lend its securities from time to time in order to earn additional income in the form of fees or interest on securities received as collateral or the investment of any cash received as collateral. The Fund continues to receive interest or dividends on the securities loaned. The Fund receives collateral in the form of cash or securities with a value at least equal to the value of the securities on loan. The value of the loaned securities is determined at the close of each business day and any additional required collateral is delivered to the Fund on the next business day. In a securities lending transaction, the net asset value of the Fund will be affected by an increase or decrease in the value of the securities loaned and by an increase or decrease in the value of the instrument in which collateral is invested. The amount of securities lending activity undertaken by the Fund fluctuates from time to time. In the event of default or bankruptcy by the borrower, the Fund may be prevented from recovering the loaned securities or gaining access to the collateral or may experience delays or costs in doing so. In addition, the investment of any cash collateral received may lose all or part of its value. The Fund has the right under the lending agreement to recover the securities from the borrower on demand.
The Fund lends its securities through an unaffiliated securities lending agent. Cash collateral received in connection with its securities lending transactions is invested in Securities Lending Cash Investments, LLC (the “Securities Lending Fund”). The Securities Lending Fund is exempt from registration under Section 3(c)(7) of the 1940 Act and is managed by Funds
| | | | | | |
| Notes to financial statements (unaudited) | | Wells Fargo VT International Equity Fund | | | 17 | |
Management and is subadvised by Wells Capital Management Incorporated (“WellsCap”), an affiliate of Funds Management and an indirect wholly owned subsidiary of Wells Fargo & Company (“Wells Fargo”). Funds Management receives an advisory fee starting at 0.05% and declining to 0.01% as the average daily net assets of the Securities Lending Fund increase. All of the fees received by Funds Management are paid to WellsCap for its services as subadviser. The Securities Lending Fund seeks to provide a positive return compared to the daily Fed Funds Open Rate by investing in high-quality, U.S. dollar-denominated short-term money market instruments. Securities Lending Fund investments are valued at the evaluated bid price provided by an independent pricing service. Income earned from investment in the Securities Lending Fund, if any, is included in income from affiliated securities on the Statement of Operations.
Security transactions and income recognition
Securities transactions are recorded on a trade date basis. Realized gains or losses are recorded on the basis of identified cost.
Dividend income is recognized on the ex-dividend date, except for certain dividends from foreign securities, which are recorded as soon as the custodian verifies the ex-dividend date. Dividend income from foreign securities is recorded net of foreign taxes withheld where recovery of such taxes is not assured.
Distributions to shareholders
Distributions to shareholders from net investment income and any net realized gains are recorded on the ex-dividend date and paid at least annually. Such distributions are determined in accordance with income tax regulations and may differ from U.S. generally accepted accounting principles. Dividend sources are estimated at the time of declaration. The tax character of distributions is determined as of the Fund’s fiscal year end. Therefore, a portion of the Fund’s distributions made prior to the Fund’s fiscal year end may be categorized as a tax return of capital at year end.
Federal and other taxes
The Fund intends to continue to qualify as a regulated investment company by distributing substantially all of its investment company taxable income and any net realized capital gains (after reduction for capital loss carryforwards) sufficient to relieve it from all, or substantially all, federal income taxes. Accordingly, no provision for federal income taxes was required.
The Fund’s income and federal excise tax returns and all financial records supporting those returns for the prior three fiscal years are subject to examination by the federal and Delaware revenue authorities. Management has analyzed the Fund’s tax positions taken on federal, state, and foreign tax returns for all open tax years and does not believe that there are any uncertain tax positions that require recognition of a tax liability.
As of June 30, 2018, the aggregate cost of all investments for federal income tax purposes was $99,628,951 and the unrealized gains (losses) consisted of:
| | | | |
Gross unrealized gains | | $ | 4,262,445 | |
Gross unrealized losses | | | (7,729,886 | ) |
Net unrealized losses | | $ | (3,467,441 | ) |
Class allocations
The separate classes of shares offered by the Fund differ principally in distribution fees. Class specific expenses are charged directly to that share class. Investment income, common expenses, and realized and unrealized gains (losses) on investments are allocated daily to each class of shares based on the relative proportion of net assets of each class.
4. FAIR VALUATION MEASUREMENTS
Fair value measurements of investments are determined within a framework that has established a fair value hierarchy based upon the various data inputs utilized in determining the value of the Fund’s investments. The three-level hierarchy gives the highest priority to unadjusted quoted prices in active markets for identical assets or liabilities (Level 1) and the lowest priority to unobservable inputs (Level 3). The Fund’s investments are classified within the fair value hierarchy based on the lowest level of input that is significant to the fair value measurement. The inputs are summarized into three broad levels as follows:
| ∎ | | Level 1 – quoted prices in active markets for identical securities |
| ∎ | | Level 2 – other significant observable inputs (including quoted prices for similar securities, interest rates, prepayment speeds, credit risk, etc.) |
| ∎ | | Level 3 – significant unobservable inputs (including the Fund’s own assumptions in determining the fair value of investments) |
| | | | |
| 18 | | Wells Fargo VT International Equity Fund | | Notes to financial statements (unaudited) |
The inputs or methodologies used for valuing investments in securities are not necessarily an indication of the risk associated with investing in those securities.
The following is a summary of the inputs used in valuing the Fund’s assets and liabilities as of June 30, 2018:
| | | | | | | | | | | | | | | | |
| | | Quoted prices
(Level 1) | | | Other significant
observable inputs
(Level 2) | | | Significant
unobservable inputs (Level 3) | | | Total | |
Assets | | | | | | | | | | | | | | | | |
Investments in: | | | | | | | | | |
| | |
Common stocks | | | | | | | | | |
Australia | | $ | 0 | | | $ | 2,036,438 | | | $ | 0 | | | $ | 2,036,438 | |
Brazil | | | 2,563,054 | | | | 0 | | | | 0 | | | | 2,563,054 | |
Canada | | | 2,447,592 | | | | 0 | | | | 0 | | | | 2,447,592 | |
China | | | 2,699,619 | | | | 7,373,286 | | | | 0 | | | | 10,072,905 | |
France | | | 0 | | | | 5,734,216 | | | | 0 | | | | 5,734,216 | |
Germany | | | 0 | | | | 13,820,515 | | | | 0 | | | | 13,820,515 | |
Hong Kong | | | 0 | | | | 1,647,176 | | | | 0 | | | | 1,647,176 | |
Israel | | | 1,196,873 | | | | 0 | | | | 0 | | | | 1,196,873 | |
Italy | | | 0 | | | | 1,859,020 | | | | 0 | | | | 1,859,020 | |
Japan | | | 0 | | | | 10,301,433 | | | | 0 | | | | 10,301,433 | |
Malaysia | | | 0 | | | | 1,632,558 | | | | 0 | | | | 1,632,558 | |
Netherlands | | | 0 | | | | 6,249,972 | | | | 0 | | | | 6,249,972 | |
Norway | | | 0 | | | | 3,407,046 | | | | 0 | | | | 3,407,046 | |
Russia | | | 1,760,472 | | | | 0 | | | | 0 | | | | 1,760,472 | |
South Africa | | | 0 | | | | 2,075,563 | | | | 0 | | | | 2,075,563 | |
South Korea | | | 0 | | | | 4,192,924 | | | | 0 | | | | 4,192,924 | |
Switzerland | | | 0 | | | | 3,323,721 | | | | 0 | | | | 3,323,721 | |
United Kingdom | | | 2,342,554 | | | | 12,338,166 | | | | 0 | | | | 14,680,720 | |
| | | |
Short-term investments | | | | | | | | | | | | |
Investment companies | | | 2,101,386 | | | | 0 | | | | 0 | | | | 2,101,386 | |
Investments measured at net asset value* | | | | | | | | | | | 4,965,552 | |
| | | 15,111,550 | | | | 75,992,034 | | | | 0 | | | | 96,069,136 | |
Forward foreign currency contracts | | | 0 | | | | 92,374 | | | | 0 | | | | 92,374 | |
Total assets | | $ | 15,111,550 | | | $ | 76,084,408 | | | $ | 0 | | | $ | 96,161,510 | |
| * | Investments that are measured at fair value using the net asset value per share (or its equivalent) as a practical expedient have not been categorized in the fair value hierarchy. The fair value amount presented in the table is intended to permit reconciliation of the fair value hierarchy to the amounts presented in the Statement of Assets and Liabilities. The Fund’s investment in Securities Lending Cash Investments, LLC valued at $4,965,552 does not have a redemption period notice, can be redeemed daily and does not have any unfunded commitments. |
Forward foreign currency contracts are reported at their cumulative unrealized gains (losses) at measurement date as reported in the table following the Portfolio of investments. All other assets and liabilities are reported at their market value at measurement date.
The Fund recognizes transfers between levels within the fair value hierarchy at the end of the reporting period. At June 30, 2018, fair value pricing was used in pricing certain foreign securities and common stocks valued at $68,298,593 were transferred from Level 1 to Level 2 within the fair value hierarchy. The Fund did not have any transfers into/out of Level 3.
5. TRANSACTIONS WITH AFFILIATES
Management fee
Funds Management, an indirect wholly owned subsidiary of Wells Fargo, is the manager of the Fund and provides advisory and fund-level administrative services under an investment management agreement. Under the investment management agreement, Funds Management is responsible for, among other services, implementing the investment objectives and strategies of the Fund, supervising the subadviser and providing fund-level administrative services in connection with the Fund’s operations. As compensation for its services under the investment management agreement,
| | | | | | |
| Notes to financial statements (unaudited) | | Wells Fargo VT International Equity Fund | | | 19 | |
Funds Management is entitled to receive an annual management fee starting at 0.80% and declining to 0.63% as the average daily net assets of the Fund increase. For the six months ended June 30, 2018, the management fee was equivalent to an annual rate of 0.80% of the Fund’s average daily net assets.
Funds Management has retained the services of a subadviser to provide daily portfolio management to the Fund. The fee for subadvisory services is borne by Funds Management. WellsCap is the subadviser to the Fund and is entitled to receive a fee from Funds Management at an annual rate starting at 0.45% and declining to 0.40% as the average daily net assets of the Fund increase.
Administration fees
Under a class-level administration agreement, Funds Management provides class-level administrative services to the Fund, which includes paying fees and expenses for services provided by the transfer agent, sub-transfer agents, omnibus account servicers and record-keepers. As compensation for its services under the class-level administration agreement, Funds Management receives an annual fee of 0.08% which is calculated based on the average daily net assets of each class.
Funds Management has contractually waived and/or reimbursed management and administration fees to the extent necessary to maintain certain net operating expense ratios for the Fund. When each class of the Fund has exceeded its expense cap, Funds Management has waived fees and/or reimbursed expenses from fund level expenses on a proportionate basis and then from class specific expenses; otherwise, waivers and/or reimbursements are applied against class specific expenses before fund level expenses. Funds Management has committed through April 30, 2019 to waive fees and/or reimburse expenses to the extent necessary to cap the Fund’s expenses at 0.69% for Class 1 shares and 0.94% for Class 2 shares. After this time, the cap may be increased or the commitment to maintain the cap may be terminated only with the approval of the Board of Trustees.
Distribution fee
The Trust has adopted a distribution plan for Class 2 shares of the Fund pursuant to Rule 12b-1 under the 1940 Act. A distribution fee is charged to Class 2 shares and paid to Wells Fargo Funds Distributor, LLC, the principal underwriter, at an annual rate of 0.25% of the average daily net assets of Class 2 shares.
Interfund transactions
The Fund may purchase or sell portfolio investment securities to certain other Wells Fargo affiliates pursuant to Rule 17a-7 under the 1940 Act and under procedures adopted by the Board of Trustees. The procedures have been designed to ensure that these interfund transactions, which do not incur broker commissions, are effected at current market prices.
6. INVESTMENT PORTFOLIO TRANSACTIONS
Purchases and sales of investments, excluding U.S. government obligations (if any) and short-term securities, for the six months ended June 30, 2018 were $58,736,123 and $289,659,730, respectively.
7. DERIVATIVE TRANSACTIONS
During the six months ended June 30, 2018, the Fund entered into forward foreign currency contracts for economic hedging purposes. The Fund had average contract amounts of $8,371,865 and $9,814,217 in forward foreign currency contracts to buy and forward foreign currency contracts to sell, respectively, during the six months ended June 30, 2018.
The fair value, realized gains or losses and change in unrealized gains or losses, if any, on derivative instruments are reflected in the corresponding financial statement captions.
For certain types of derivative transactions, the Fund has entered into International Swaps and Derivatives Association, Inc. master agreements (“ISDA Master Agreements”) or similar agreements with approved counterparties. The ISDA Master Agreements or similar agreements may have requirements to deliver/deposit securities or cash to/with an exchange or broker-dealer as collateral and allows the Fund to offset, with each counterparty, certain derivative financial instrument’s assets and/or liabilities with collateral held or pledged. Collateral requirements differ by type of derivative. Collateral or margin requirements are set by the broker or exchange clearinghouse for exchange traded derivatives while collateral terms are contract specific for over-the-counter traded derivatives. Cash collateral that has been pledged to cover obligations of the Fund under ISDA Master Agreements or similar agreements, if any, are reported separately in the Statement of Assets and Liabilities. Securities pledged as collateral, if any, are noted in the Portfolio of Investments. With respect to balance sheet offsetting, absent an event of default by the counterparty or a termination of the agreement, the reported amounts of financial assets and financial liabilities in the Statement of Assets and Liabilities are not offset across
| | | | |
| 20 | | Wells Fargo VT International Equity Fund | | Notes to financial statements (unaudited) |
transactions between the Fund and the applicable counterparty. A reconciliation of the gross amounts on the Statement of Assets and Liabilities to the net amounts by counterparty, including any collateral exposure, is as follows:
| | | | | | | | | | | | | | | | |
| Counterparty | | Gross amounts
of assets in the
Statement of
Assets and
Liabilities | | | Amounts
subject to
netting
agreements | | | Collateral
received | | | Net amount
of assets | |
Goldman Sachs | | $ | 5,969 | * | | $ | 0 | | | $ | 0 | | | $ | 5,969 | |
Morgan Stanley | | | 86,405 | * | | | 0 | | | | 0 | | | | 86,405 | |
| | * | Amount represents cumulative unrealized gains (losses) on forward foreign currency contracts as reported in the table following the Portfolio of investments. | |
8. BANK BORROWINGS
The Trust and Wells Fargo Funds Trust (excluding the money market funds and certain other funds) are parties to a $280,000,000 revolving credit agreement whereby the Fund is permitted to use bank borrowings for temporary or emergency purposes, such as to fund shareholder redemption requests. Interest under the credit agreement is charged to the Fund based on a borrowing rate equal to the higher of the Federal Funds rate in effect on that day plus 1.25% or the overnight LIBOR rate in effect on that day plus 1.25%. In addition, an annual commitment fee equal to 0.25% of the unused balance is allocated to each participating fund.
For the six months ended June 30, 2018, there were no borrowings by the Fund under the agreement.
9. CONCENTRATION RISK
Concentration risks result from exposure to a limited number of sectors. A fund that invests a substantial portion of its assets in any sector may be more affected by changes in that sector than would be a fund whose investments are not heavily weighted in any sector.
10. INDEMNIFICATION
Under the Trust’s organizational documents, the officers and Trustees have been granted certain indemnification rights against certain liabilities that may arise out of performance of their duties to the Trust. Additionally, in the normal course of business, the Trust may enter into contracts with service providers that contain a variety of indemnification clauses. The Trust’s maximum exposure under these arrangements is dependent on future claims that may be made against the Fund and, therefore, cannot be estimated.
10. SUBSEQUENT DISTRIBUTIONS
On July 13, 2018, the Fund declared distributions from net investment income and long-term capital gains to shareholders of record on July 12, 2018. The per share amounts payable on July 16, 2018 were as follows:
| | | | | | | | |
| | | Net investment
income | | | Long-term
capital gains | |
Class 1 | | $ | 0.61080 | | | $ | 1.20688 | |
Class 2 | | | 0.58499 | | | | 1.20688 | |
These distributions are not reflected in the accompanying financial statements.
| | | | | | |
| Other information (unaudited) | | Wells Fargo VT International Equity Fund | | | 21 | |
PROXY VOTING INFORMATION
A description of the policies and procedures that the Fund uses to determine how to vote proxies relating to portfolio securities is available, upon request, by calling 1-800-260-5969, visiting our website at wellsfargofunds.com, or visiting the SEC website at sec.gov. Information regarding how the Fund voted proxies relating to portfolio securities during the most recent 12-month period ended June 30 is available on the Fund’s website at wellsfargofunds.com or by visiting the SEC website at sec.gov.
PORTFOLIO HOLDINGS INFORMATION
The complete portfolio holdings for the Fund are publicly available monthly on the Fund’s website (wellsfargofunds.com), on a one-month delayed basis. In addition, top ten holdings information (excluding derivative positions) for the Fund is publicly available on the Fund’s website on a monthly, seven-day or more delayed basis. The Fund files its complete schedule of portfolio holdings with the SEC for the first and third quarters of each fiscal year on Form N-Q, which is available by visiting the SEC website at sec.gov. In addition, the Fund’s Form N-Q may be reviewed and copied at the SEC’s Public Reference Room in Washington, DC, and at regional offices in New York City, at 233 Broadway, and in Chicago, at 175 West Jackson Boulevard, Suite 900. Information about the Public Reference Room may be obtained by calling 1-800-SEC-0330.
| | | | |
| 22 | | Wells Fargo VT International Equity Fund | | Other information (unaudited) |
BOARD OF TRUSTEES AND OFFICERS
Each of the Trustees and Officers1 listed in the table below acts in identical capacities for each fund in the Wells Fargo family of funds, which consists of 154 mutual funds comprising the Wells Fargo Funds Trust, Wells Fargo Variable Trust, Wells Fargo Master Trust and four closed-end funds (collectively the “Fund Complex”). This table should be read in conjunction with the Prospectus and the Statement of Additional Information2. The mailing address of each Trustee and Officer is 525 Market Street, 12th Floor, San Francisco, CA 94105. Each Trustee and Officer serves an indefinite term, however, each Trustee serves such term until reaching the mandatory retirement age established by the Trustees.
Independent Trustees
| | | | | | |
Name and year of birth | | Position held and length of service* | | Principal occupations during past five years or longer | | Current other
public company or
investment company
directorships |
William R. Ebsworth (Born 1957) | | Trustee, since 2015 | | Retired. From 1984 to 2013, equities analyst, portfolio manager, research director and chief investment officer at Fidelity Management and Research Company in Boston, Tokyo, and Hong Kong, and retired in 2013 as Chief Investment Officer of Fidelity Strategic Advisers, Inc. where he led a team of investment professionals managing client assets. Prior thereto, Board member of Hong Kong Securities Clearing Co., Hong Kong Options Clearing Corp., the Thailand International Fund, Ltd., Fidelity Investments Life Insurance Company, and Empire Fidelity Investments Life Insurance Company. Board member of the Forté Foundation (non-profit organization) and the Vincent Memorial Hospital Endowment (non-profit organization), where he serves on the Investment Committee and as a Chair of the Audit Committee. Mr. Ebsworth is a CFA® charterholder. | | Asset Allocation Trust |
Jane A. Freeman (Born 1953) | | Trustee, since 2015; Chair Liaison, since 2018 | | Retired. From 2012 to 2014 and 1999 to 2008, Chief Financial Officer of Scientific Learning Corporation. From 2008 to 2012, Ms. Freeman provided consulting services related to strategic business projects. Prior to 1999, Portfolio Manager at Rockefeller & Co. and Scudder, Stevens & Clark. Board member of the Harding Loevner Funds from 1996 to 2014, serving as both Lead Independent Director and chair of the Audit Committee. Board member of the Russell Exchange Traded Funds Trust from 2011 to 2012 and the chair of the Audit Committee. Ms. Freeman is a Board Member of Ruth Bancroft Garden (non-profit organization) and the Glimmerglass Festival. She is also an inactive Chartered Financial Analyst. | | Asset Allocation Trust |
Isaiah Harris, Jr. (Born 1952) | | Trustee, since 2009 | | Retired. Chairman of the Board of CIGNA Corporation since 2009, and Director since 2005. From 2003 to 2011, Director of Deluxe Corporation. Prior thereto, President and CEO of BellSouth Advertising and Publishing Corp. from 2005 to 2007, President and CEO of BellSouth Enterprises from 2004 to 2005 and President of BellSouth Consumer Services from 2000 to 2003. Emeritus member of the Iowa State University Foundation Board of Governors. Emeritus Member of the Advisory Board of Iowa State University School of Business. Advisory Board Member, Palm Harbor Academy (charter school). Advisory Board Member, Child Evangelism Fellowship (non-profit). Mr. Harris is a certified public accountant (inactive status). | | CIGNA Corporation; Asset Allocation Trust |
Judith M. Johnson (Born 1949) | | Trustee, since 2008; Audit Committee Chairman, since 2009 | | Retired. Prior thereto, Chief Executive Officer and Chief Investment Officer of Minneapolis Employees Retirement Fund from 1996 to 2008. Ms. Johnson is an attorney, certified public accountant and a certified managerial accountant. | | Asset Allocation Trust |
David F. Larcker (Born 1950) | | Trustee, since 2009 | | James Irvin Miller Professor of Accounting at the Graduate School of Business, Stanford University, Director of the Corporate Governance Research Initiative and Senior Faculty of The Rock Center for Corporate Governance since 2006. From 2005 to 2008, Professor of Accounting at the Graduate School of Business, Stanford University. Prior thereto, Ernst & Young Professor of Accounting at The Wharton School, University of Pennsylvania from 1985 to 2005. | | Asset Allocation Trust |
| | | | | | |
| Other information (unaudited) | | Wells Fargo VT International Equity Fund | | | 23 | |
| | | | | | |
Name and year of birth | | Position held and length of service* | | Principal occupations during past five years or longer | | Current other
public company or
investment company
directorships |
Olivia S. Mitchell (Born 1953) | | Trustee, since 2006; Governance Committee Chairman, since 2018 | | International Foundation of Employee Benefit Plans Professor, Wharton School of the University of Pennsylvania since 1993. Director of Wharton’s Pension Research Council and Boettner Center on Pensions & Retirement Research, and Research Associate at the National Bureau of Economic Research. Previously, Cornell University Professor from 1978 to 1993. | | Asset Allocation Trust |
Timothy J. Penny (Born 1951) | | Trustee, since 1996; Chairman, since 2018; Vice Chairman, from 2017 to 2018 | | President and Chief Executive Officer of Southern Minnesota Initiative Foundation, a non-profit organization, since 2007. Member of the Board of Trustees of NorthStar Education Finance, Inc., a non-profit organization, since 2007. | | Asset Allocation Trust |
James G. Polisson (Born 1959) | | Trustee, since 2018; Advisory Board Member, from 2017 to 2018 | | Retired. Chief Marketing Officer, Source (ETF) UK Services, Ltd, from 2015 to 2017. From 2012 to 2015, Principal of The Polisson Group, LLC, a management consulting, corporate advisory and principal investing company. Chief Executive Officer and Managing Director at Russell Investments, Global Exchange Traded Funds from 2010 to 2012. Managing Director of Barclays Global Investors from 1998 to 2010 and Global Chief Marketing Officer for iShares and Barclays Global Investors from 2000 to 2010. Trustee of the San Francisco Mechanics’ Institute, a non-profit organization, from 2013 to 2015. Board member of the Russell Exchange Traded Fund Trust from 2011 to 2012. Director of Barclays Global Investors Holdings Deutschland GmbH from 2006 to 2009. Mr. Polisson is an attorney and has a retired status with the Massachusetts and District of Columbia Bar Associations. | | Asset Allocation Trust |
Michael S. Scofield (Born 1943) | | Trustee, since 2010 | | Served on the Investment Company Institute’s Board of Governors and Executive Committee from 2008-2011 as well the Governing Council of the Independent Directors Council from 2006-2011 and the Independent Directors Council Executive Committee from 2008-2011. Trustee of the Evergreen Fund complex (and its predecessors) from 1984 to 2010. Chairman of the Evergreen Funds from 2000-2010. Former Trustee of the Mentor Funds. Retired Attorney, Law Offices of Michael S. Scofield. | | Asset Allocation Trust |
Pamela Wheelock (Born 1959) | | Trustee, since 2018; Advisory Board Member, from 2017 to 2018 | | Chief Operating Officer, Twin Cities Habitat for Humanity, since January, 2017. Vice President of University Services, University of Minnesota from 2012 to 2017. Prior thereto, on the Board of Directors, Goverance Committee and Finance Committee for the Minnesota Philanthropy Partners (Saint Paul Foundation) from 2012 to 2018, Interim President and Chief Executive Officer of Blue Cross Blue shield of Minnesota of Minnesota from 2010 to 2011, Chairman of the Board from 2009 to 2011 and Board Director 003 to 2015. Vice President, Leadership and Community Engagement, Bush Foundation, Saint Paul, Minnesota (a private foundation) from 2009 to 2011. Executive Vice President and Chief Financial Officer, Minnesota Sports and Entertainment from 2004 to 2009 and Senior Vice President from 2002 to 2004. Commissioner of Finance, State of Minnesota, from 1999 to 2002. Currently the Board Chair of the Minnesota Wild Foundation since 2010. | | Asset Allocation Trust |
| * | Length of service dates reflect the Trustee’s commencement of service with the Trust’s predecessor entities, where applicable. |
| | | | |
| 24 | | Wells Fargo VT International Equity Fund | | Other information (unaudited) |
Officers
| | | | | | |
Name and year of birth | | Position held and length of service | | Principal occupations during past five years or longer | | |
Andrew Owen (Born 1960) | | President, since 2017 | | Executive Vice President of Wells Fargo & Company and Head of Affiliated Managers, Wells Fargo Asset Management, since 2014. In addition, Mr. Owen is currently President, Chief Executive Officer and Director of Wells Fargo Funds Management, LLC since 2017. Prior thereto, Executive Vice President responsible for marketing, investments and product development for Wells Fargo Funds Management, LLC, from 2009 to 2014. | | |
Jeremy DePalma1 (Born 1974) | | Treasurer, since 2012 | | Senior Vice President of Wells Fargo Funds Management, LLC since 2009. Senior Vice President of Evergreen Investment Management Company, LLC from 2008 to 2010 and head of the Fund Reporting and Control Team within Fund Administration from 2005 to 2010. | | |
Alexander Kymn3 (Born 1973) | | Secretary, since 2018; Chief Legal Officer, since 2018 | | Senior Company Counsel of Wells Fargo Bank, N.A. since 2018 (previously Senior Counsel from 2007 to 2018). Vice President of Wells Fargo Funds Management, LLC from 2008 to 2014. | | |
Michael H. Whitaker (Born 1967) | | Chief Compliance Officer, since 2016 | | Senior Vice President and Chief Compliance Officer since 2016. Senior Vice President and Chief Compliance Officer for Fidelity Investments from 2007 to 2016. | | |
David Berardi (Born 1975) | | Assistant Treasurer, since 2009 | | Vice President of Wells Fargo Funds Management, LLC since 2009. Vice President of Evergreen Investment Management Company, LLC from 2008 to 2010. Manager of Fund Reporting and Control for Evergreen Investment Management Company, LLC from 2004 to 2010. | | |
| 1 | Jeremy DePalma acts as Treasurer of 77 funds and Assistant Treasurer of 77 funds in the Fund Complex. |
| 2 | The Statement of Additional Information includes additional information about the Trustees and is available, without charge, upon request, by calling 1-800-260-5969 or by visiting the website at wellsfargofunds.com. |
| 3 | Alexander Kymn became the Secretary and Chief Legal Officer effective April 17, 2018. |
| | | | | | |
| Other information (unaudited) | | Wells Fargo VT International Equity Fund | | | 25 | |
BOARD CONSIDERATION OF INVESTMENT MANAGEMENT AND SUB-ADVISORY AGREEMENTS:
Wells Fargo VT International Equity Fund
Under the Investment Company Act of 1940 (the “1940 Act”), the Board of Trustees (the “Board”) of Wells Fargo Variable Trust (the “Trust”) must determine annually whether to approve the continuation of the Trust’s investment management and sub-advisory agreements. In this regard, at an in-person meeting held on May 22-23, 2018 (the “Meeting”), the Board, all the members of which have no direct or indirect interest in the investment management and sub-advisory agreements and are not “interested persons” of the Trust, as defined in the 1940 Act (the “Independent Trustees”), reviewed and approved for Wells Fargo VT International Equity Fund (the “Fund”): (i) an investment management agreement (the “Management Agreement”) with Wells Fargo Funds Management, LLC (“Funds Management”); and (ii) an investment sub-advisory agreement (the “Sub-Advisory Agreement”) with Wells Capital Management Incorporated (the “Sub-Adviser”), an affiliate of Funds Management. The Management Agreement and the Sub-Advisory Agreement are collectively referred to as the “Advisory Agreements.”
At the Meeting, the Board considered the factors and reached the conclusions described below relating to the selection of Funds Management and the Sub-Adviser and the approval of the Advisory Agreements. Prior to the Meeting, including at an in-person meeting in April 2018, the Trustees conferred extensively among themselves and with representatives of Funds Management about these matters. Also, the Board has adopted a team-based approach, with each team consisting of a sub-set of Trustees, to assist the full Board in the discharge of its duties in reviewing investment performance and other matters throughout the year. The Independent Trustees were assisted in their evaluation of the Advisory Agreements by independent legal counsel, from whom they received separate legal advice and with whom they met separately.
In providing information to the Board, Funds Management and the Sub-Adviser were guided by a detailed set of requests for information submitted to them by independent legal counsel on behalf of the Independent Trustees at the start of the Board’s annual contract renewal process earlier in 2018. In considering and approving the Advisory Agreements, the Trustees considered the information they believed relevant, including but not limited to the information discussed below. The Board considered not only the specific information presented in connection with the Meeting, but also the knowledge gained over time through interaction with Funds Management and the Sub-Adviser about various topics. In this regard, the Board reviewed reports of Funds Management at each of its quarterly meetings, which included, among other things, portfolio reviews and investment performance reports. In addition, the Board and the teams mentioned above confer with portfolio managers at various times throughout the year. The Board did not identify any particular information or consideration that was all-important or controlling, and each individual Trustee may have attributed different weights to various factors.
After its deliberations, the Board unanimously approved the continuation of the Advisory Agreements for a one-year term and determined that the compensation payable to Funds Management and the Sub-Adviser under each of the Advisory Agreements was reasonable. The Board considered the approval of the Advisory Agreements for the Fund as part of its consideration of agreements for funds across the complex, but its approvals were made on a fund-by-fund basis. The following summarizes a number of important, but not necessarily all, factors considered by the Board in support of its approvals.
Nature, extent and quality of services
The Board received and considered various information regarding the nature, extent and quality of services provided to the Fund by Funds Management and the Sub-Adviser under the Advisory Agreements. This information included a description of the investment advisory services and Fund-level administrative services covered by the Management Agreement, as well as, among other things, a summary of the background and experience of senior management of Wells Fargo Asset Management (“WFAM”), of which Funds Management and the Sub-Adviser are a part, a summary of investments made in the business of WFAM, a summary of certain organizational and personnel changes involving Funds Management and the Sub-Adviser, and a description of Funds Management’s and the Sub-Adviser’s business continuity planning programs and of their approaches to data privacy and cybersecurity. The Board also considered the qualifications, background, tenure and responsibilities of each of the portfolio managers primarily responsible for the day-to-day portfolio management of the Fund.
The Board evaluated the ability of Funds Management and the Sub-Adviser to attract and retain qualified investment professionals, including research, advisory and supervisory personnel. The Board further considered the compliance programs and compliance records of Funds Management and the Sub-Adviser. In addition, the Board took into account the full range of services provided to the Fund by Funds Management and its affiliates.
| | | | |
| 26 | | Wells Fargo VT International Equity Fund | | Other information (unaudited) |
Fund investment performance and expenses
The Board considered the investment performance results for the Fund over various time periods ended December 31, 2017. The Board considered these results in comparison to the investment performance of funds in a universe that was determined by Broadridge Inc. (“Broadridge”) to be similar to the Fund (the “Universe”), and in comparison to the Fund’s benchmark index and to other comparative data. Broadridge is an independent provider of investment company data. The Board received a description of the methodology used by Broadridge to select the mutual funds in the performance Universe. The Board noted that the investment performance of the Fund was higher than the average investment performance of the Universe for all periods under review. The Board also noted that the investment performance of the Fund was higher than or in range of its benchmark index, the MSCI ACWI Index, for the three-, five-, and ten-year periods under review, but lower than its benchmark for the one-year period under review.
The Board also received and considered information regarding the Fund’s net operating expense ratios and their various components, including actual management fees, custodian and other non-management fees, and Rule 12b-1 and non-Rule 12b-1 shareholder service fees. The Board considered these ratios in comparison to the median ratios of funds in class-specific expense groups that were determined by Broadridge to be similar to the Fund (the “Groups”). The Board received a description of the methodology used by Broadridge to select the mutual funds in the expense Groups and an explanation of how funds comprising expense groups and their expense ratios may vary from year-to-year. Based on the Broadridge reports, the Board noted that the net operating expense ratios of the Fund were lower the median net operating expense ratios of the expense Groups for each share class.
The Board took into account the Fund’s investment performance and expense information provided to it among the factors considered in deciding to re-approve the Advisory Agreements.
Investment management and sub-advisory fee rates
The Board reviewed and considered the contractual fee rates payable by the Fund to Funds Management under the Management Agreement, as well as the contractual fee rates payable by the Fund to Funds Management for class-level administrative services under a Class-Level Administration Agreement, which include, among other things, class-level transfer agency and sub-transfer agency costs (collectively, the “Management Rates”). The Board also reviewed and considered the contractual investment sub-advisory fee rates that are payable by Funds Management to the Sub-Adviser for investment sub-advisory services.
Among other information reviewed by the Board was a comparison of the Fund’s Management Rates with the average contractual investment management fee rates of funds in the expense Groups at a common asset level as well as transfer agency costs of the funds in the expense Groups. The Board noted that the Management Rates of the Fund were in range of the sum of these average rates for the Fund’s expense Groups for all share classes.
The Board also received and considered information about the portion of the total management fee that was retained by Funds Management after payment of the fee to the Sub-Adviser for sub-advisory services. In assessing the reasonableness of this amount, the Board received and evaluated information about the nature and extent of responsibilities retained and risks assumed by Funds Management and not delegated to or assumed by the Sub-Adviser, and about Funds Management’s on-going oversight services. Given the affiliation between Funds Management and the Sub-Adviser, the Board ascribed limited relevance to the allocation of fees between them.
The Board also received and considered information about the nature and extent of services offered and fee rates charged by Funds Management and the Sub-Adviser to other types of clients with investment strategies similar to those of the Fund. In this regard, the Board received information about the significantly greater scope of services, and compliance, reporting and other legal burdens and risks of managing mutual funds compared with those associated with managing assets of non-mutual fund clients such as institutional separate accounts.
Based on its consideration of the factors and information it deemed relevant, including those described here, the Board determined that the compensation payable to Funds Management under the Management Agreement and to the Sub-Adviser under the Sub-Advisory Agreement was reasonable.
Profitability
The Board received and considered information concerning the profitability of Funds Management, as well as the profitability of both WFAM and Wells Fargo & Co. (“Wells Fargo”) as a whole, from providing services to the Fund and the fund family as a whole. The Board noted that the Sub-Adviser’s profitability information with respect to providing services to the Fund was subsumed in the WFAM and Wells Fargo profitability analysis.
| | | | | | |
| Other information (unaudited) | | Wells Fargo VT International Equity Fund | | | 27 | |
Funds Management reported on the methodologies and estimates used in calculating profitability, including a description of the methodology used to allocate certain expenses and recent enhancements made to the methodology. Among other things, the Board noted that the levels of profitability reported on a fund-by-fund basis varied widely, depending on factors such as the size and type of fund. Based on its review, the Board did not deem the profits reported by Funds Management, WFAM or Wells Fargo from services provided to the Fund to be at a level that would prevent it from approving the continuation of the Advisory Agreements.
Economies of scale
The Board considered the extent to which Funds Management may experience economies of scale in the provision of management services, and the extent to which scale benefits, if any, would be shared with shareholders. In particular, the Board noted the existence of breakpoints in the Fund’s management fee structure, which operate generally to reduce the Fund’s expense ratios as the Fund grows in size. It considered that, for a small fund or a fund that shrinks in size, breakpoints conversely can result in higher fee levels. The Board also considered that in addition to management fee breakpoints, competitive management fee rates set at the outset without regard to breakpoints and fee waiver and expense reimbursement arrangements, as well as investments in the business intended to enhance services available to Fund shareholders, are means of sharing potential economies of scale with shareholders of the Fund.
The Board concluded that the Fund’s fee and expense arrangements, including contractual breakpoints, constituted a reasonable approach to sharing potential economies of scale with the Fund and its shareholders.
Other benefits to Funds Management and the Sub-Adviser
The Board received and considered information regarding potential “fall-out” or ancillary benefits received by Funds Management and its affiliates, including the Sub-Adviser, as a result of their relationships with the Fund. Ancillary benefits could include, among others, benefits directly attributable to other relationships with the Fund and benefits potentially derived from an increase in Funds Management’s and the Sub-Adviser’s business as a result of their relationships with the Fund. The Board noted that various affiliates of Funds Management may receive distribution-related fees, shareholder servicing payments and sub-transfer agency fees in respect of shares sold or held through them and services provided.
The Board also reviewed information about soft dollar credits earned and utilized by the Sub-Adviser, fees earned by Funds Management and the Sub-Adviser from managing a private investment vehicle for the fund family’s securities lending collateral and commissions earned by an affiliated broker from portfolio transactions.
Based on its consideration of the factors and information it deemed relevant, including those described here, the Board did not find that any ancillary benefits received by Funds Management and its affiliates, including the Sub-Adviser, were unreasonable.
Conclusion
At the Meeting, after considering the above-described factors and based on its deliberations and its evaluation of the information described above, the Board unanimously approved the continuation of the Advisory Agreements for a one-year term and determined that the compensation payable to Funds Management and the Sub-Adviser under each of the Advisory Agreements was reasonable.
This page is intentionally left blank.

For more information
More information about Wells Fargo Funds is available free upon request. To obtain literature, please write, email, visit the Fund’s website, or call:
Wells Fargo Funds
P.O. Box 8266
Boston, MA 02266-8266
Email: fundservice@wellsfargo.com
Website: wellsfargofunds.com
Individual investors: 1-800-222-8222
Retail investment professionals: 1-888-877-9275
Institutional investment professionals: 1-866-765-0778
This report and the financial statements contained herein are submitted for the general information of the shareholders of the Fund. If this report is used for promotional purposes, distribution of the report must be accompanied or preceded by a current prospectus. Before investing, please consider the investment objectives, risks, charges, and expenses of the investment. For a current prospectus and, if available, a summary prospectus, containing this information, call 1-800-260-5969 or visit the Fund’s website at wellsfargofunds.com. Read the prospectus carefully before you invest or send money.
Wells Fargo Asset Management (WFAM) is the trade name for certain investment advisory/management firms owned by Wells Fargo & Company. These firms include but are not limited to Wells Capital Management Incorporated and Wells Fargo Funds Management, LLC. Certain products managed by WFAM entities are distributed by Wells Fargo Funds Distributor, LLC (a broker/dealer and Member FINRA).
This material is for general informational and educational purposes only and is NOT intended to provide investment advice or a recommendation of any kind—including a recommendation for any specific investment, strategy, or plan.
NOT FDIC INSURED ◾ NO BANK GUARANTEE ◾ MAY LOSE VALUE
© 2018 Wells Fargo Funds Management, LLC. All rights reserved.
| | |
| | 314254 08-18 SVT3/SAR140 06-18 |
Semi-Annual Report
June 30, 2018

Wells Fargo VT Omega Growth Fund


Reduce clutter. Save trees.
Sign up for electronic delivery of prospectuses and shareholder reports at wellsfargo.com/advantagedelivery
Contents
The views expressed and any forward-looking statements are as of June 30, 2018, unless otherwise noted, and are those of the Fund managers and/or Wells Fargo Funds Management, LLC. Discussions of individual securities, or the markets generally, or any Wells Fargo Fund are not intended as individual recommendations. Future events or results may vary significantly from those expressed in any forward-looking statements. The views expressed are subject to change at any time in response to changing circumstances in the market. Wells Fargo Funds Management, LLC and the Fund disclaim any obligation to publicly update or revise any views expressed or forward-looking statements.
NOT FDIC INSURED ◾ NO BANK GUARANTEE ◾ MAY LOSE VALUE
| | | | |
| 2 | | Wells Fargo VT Omega Growth Fund | | Letter to shareholders (unaudited) |

Andrew Owen
President
Wells Fargo Funds
Globally, economies strengthened, equity markets advanced, and foreign bonds outperformed fixed-income investments in the U.S.
During February 2018, the U.S. stock market endured a loss of more than 10% before recovering in March and April.
Dear Shareholder:
We are pleased to offer you this semi-annual report for the Wells Fargo VT Omega Growth Fund for the six-month period that ended June 30, 2018. Globally, economies strengthened, equity markets advanced, and foreign bonds outperformed fixed-income investments in the U.S.
For the period, U.S. stocks, as measured by the S&P 500 Index,1 gained 2.65%, and international stocks, as measured by the MSCI ACWI ex USA Index (Net),2 dropped 3.77%. Emerging market stocks, as measured by the MSCI EM Index (Net),3 fell 6.66%. In bond markets, the Bloomberg Barclays U.S. Aggregate Bond Index4 declined 1.62% while fixed-income investments outside the U.S. lost 1.31 %, according to the Bloomberg Barclays Global Aggregate ex-USD Index.5 The Bloomberg Barclays Municipal Bond Index6 fell 0.25%, and the ICE BofAML U.S. High Yield Index7 was up 0.08%.
Volatility reemerged during the first quarter of 2018 as economic signals were mixed.
The first quarter of 2018 began with stock market gains in January after the U.S. announced tax reform measures intended to lower rates for individuals and corporations. Then, investor optimism was supplanted by several concerns. Trade tensions emerged, particularly between the U.S. and China, as the U.S. threatened to impose tariffs on a broad range of imported products. Increasing interest rates and inflation also caused concern. During February 2018, the U.S. stock market endured a loss of more than 10% before recovering in March and April. The S&P 500 Index closed the first quarter with a negative return, the first negative quarterly return for the index since 2014.
The U.S. Federal Reserve (Fed) increased the federal funds rate by 25 basis points (bps; 100 bps equal 1.00%) in March and the rate of inflation reached the Fed’s 2% target for the first time in a year. The unemployment rate fell to 4.1% by March 2018 and wage growth data improved. The third revision of gross domestic product growth for the first quarter by the U.S. Bureau of Economic Analysis released during June was lowered to 2.0%.
Overseas, investment market returns reversed the strong returns of 2017—the MSCI ACWI ex USA Index (Net) gained 27.19% for the 12-month period—falling 0.43% through the end of the second quarter of 2018. Although central banks, including the European Central Bank and the Bank of Japan, maintained low interest rates and quantitative easing measures that are generally supportive of
| 1 | The S&P 500 Index consists of 500 stocks chosen for market size, liquidity, and industry group representation. It is a market-value-weighted index with each stock’s weight in the index proportionate to its market value. You cannot invest directly in an index. |
| 2 | The Morgan Stanley Capital International (MSCI) All Country World Index (ACWI) ex USA Index (Net) is a free-float-adjusted market-capitalization-weighted index that is designed to measure the equity market performance of developed markets, excluding the United States and Canada. Source: MSCI. MSCI makes no express or implied warranties or representations and shall have no liability whatsoever with respect to any MSCI data contained herein. The MSCI data may not be further redistributed or used as a basis for other indices or any securities or financial products. This report is not approved, reviewed, or produced by MSCI. You cannot invest directly in an index. |
| 3 | The MSCI Emerging Markets (EM) Index (Net) is a free-float-adjusted market-capitalization-weighted index that is designed to measure large- and mid-cap equity market performance of emerging markets. The MSCI EM Index (Net) consists of the following 24 emerging market country indices: Brazil, Chile, China, Colombia, Czech Republic, Egypt, Greece, Hungary, India, Indonesia, Korea, Malaysia, Mexico, Pakistan, Peru, the Philippines, Poland, Qatar, Russia, South Africa, Taiwan, Thailand, Turkey, and the United Arab Emirates. You cannot invest directly in an index. |
| 4 | The Bloomberg Barclays U.S. Aggregate Bond Index is a broad-based benchmark that measures the investment-grade, U.S. dollar-denominated, fixed-rate taxable bond market, including Treasuries, government-related and corporate securities, mortgage-backed securities (agency fixed-rate and hybrid adjustable-rate mortgage pass-throughs), asset-backed securities, and commercial mortgage-backed securities. You cannot invest directly in an index. |
| 5 | The Bloomberg Barclays Global Aggregate ex-USD Index is an unmanaged index that provides a broad-based measure of the global investment-grade fixed-income markets excluding the U.S. dollar-denominated debt market. You cannot invest directly in an index. |
| 6 | The Bloomberg Barclays Municipal Bond Index is an unmanaged index composed of long-term tax-exempt bonds with a minimum credit rating of Baa. You cannot invest directly in an index. |
| 7 | The ICE BofAML U.S. High Yield Index is a market-capitalization-weighted index of domestic and Yankee high-yield bonds. The index tracks the performance of high-yield securities traded in the U.S. bond market. You cannot invest directly in an index. Copyright 2018. ICE Data Indices, LLC. All rights reserved. |
| 8 | The Consumer Price Index (CPI) is a measure of the average change over time in the prices paid by urban consumers for a market basket of consumer goods and services. You cannot invest directly in an index. |
| | | | | | |
| Letter to shareholders (unaudited) | | Wells Fargo VT Omega Growth Fund | | | 3 | |
businesses and equity markets, the U.S. dollar strengthened relative to local currencies, which served to restrain returns.
Global trade tensions escalated during the second quarter of 2018.
Global trade tensions escalated as the second quarter of 2018 opened and equity markets fell in response before resuming upward momentum later in April. The CPI8 for All Urban Consumers added 0.2% in May after a similar increase in April. On a year-over-year basis, the all-items index rose 2.8% for the 12 months that ended May 31, continuing its upward trend since the beginning of the year. The index for all items less food and energy rose 2.2% for the same 12-month period.
During June 2018, the Fed increased the federal funds rate by another 25 bps. Market expectations increased that the Fed might announce two more rate increases in 2018. The unemployment rate fell to an 18-year low of 3.8% in May and wage growth data improved. Internationally, central banks maintained their low interest rates and monetary policies that were accommodative of business activity.
Interest rates generally increased and the bond markets tended to decline. Long-term interest rates in the U.S. trended higher—rates on the 10-year and 30-year Treasury bonds moved from 2.46% and 2.81%, respectively, at the beginning of the year on January 1, 2018, to 2.85% and 2.98%, respectively, on June 30, 2018, well off their highest levels during the first half of the year of 3.11% and 3.25%, respectively, on May 17, 2018.
Despite the positive economic and business trends globally, international stock values fell and U.S. stock gains moderated during most of the second quarter of 2018 due to escalating tensions as the U.S. imposed tariffs on foreign goods and countries outside of the U.S. imposed tariffs of their own on U.S. products in response.
Don’t let short-term uncertainty derail long-term investment goals.
Periods of investment uncertainty can present challenges, but experience has taught us that maintaining long-term investment goals can be an effective way to plan for the future. To help you create a sound strategy based on your personal goals and risk tolerance, Wells Fargo Funds offers more than 100 mutual funds spanning a wide range of asset classes and investment styles. Although diversification cannot guarantee an investment profit or prevent losses, we believe it can be an effective way to manage investment risk and potentially smooth out overall portfolio performance. We encourage investors to know their investments and to understand that appropriate levels of risk-taking may unlock opportunities.
Thank you for choosing to invest with Wells Fargo Funds. We appreciate your confidence in us and remain committed to helping you meet your financial needs.
Sincerely,

Andrew Owen
President
Wells Fargo Funds
For further information about your Fund, contact your investment professional, visit our website at wellsfargofunds.com, or call us directly at 1-800-260-5969.
| | | | |
| 4 | | Wells Fargo VT Omega Growth Fund | | Performance highlights (unaudited) |
Investment objective
The Fund seeks long-term capital appreciation.
Manager
Wells Fargo Funds Management, LLC
Subadviser
Wells Capital Management Incorporated
Portfolio managers
Michael T. Smith, CFA®
Christopher J. Warner, CFA®
Average annual total returns (%) as of June 30, 20181
| | | | | | | | | | | | | | | | | | | | | | |
| | | | | | | | Expense ratios2 (%) | |
| | | Inception date | | 1 year | | | 5 year | | | 10 year | | | Gross | | | Net3 | |
| Class 1 | | 3-6-1997 | | | 26.64 | | | | 14.81 | | | | 13.44 | | | | 0.82 | | | | 0.75 | |
| Class 2 | | 7-31-2002 | | | 26.29 | | | | 14.53 | | | | 13.15 | | | | 1.07 | | | | 1.00 | |
| Russell 3000® Growth Index4 | | – | | | 22.47 | | | | 16.14 | | | | 11.78 | | | | – | | | | – | |
Figures quoted represent past performance, which is no guarantee of future results. Investment return and principal value of an investment will fluctuate so that an investor’s shares, when redeemed, may be worth more or less than their original cost. Current performance may be lower or higher than the performance data quoted and assumes the reinvestment of dividends and capital gains. Current month-end performance is available by calling 1-800-260-5969. Performance figures of the Fund do not reflect fees charged pursuant to the terms of variable life insurance policies and variable annuity contracts. If these charges had been reflected, performance would have been lower.
Shares are sold without a front-end sales charge or contingent deferred sales charge.
Please keep in mind that high double-digit returns were primarily achieved during favorable market conditions. You should not expect that such favorable returns can be consistently achieved. A fund’s performance, especially for short time periods, should not be the sole factor in making your investment decision.
Index returns do not include transaction costs associated with buying and selling securities, any mutual fund fees or expenses, or any taxes. It is not possible to invest directly in an index.
Stock values fluctuate in response to the activities of individual companies and general market and economic conditions. Certain investment strategies tend to increase the total risk of an investment (relative to the broader market). Foreign investments are especially volatile and can rise or fall dramatically due to differences in the political and economic conditions of the host country. These risks are generally intensified in emerging markets. The Fund is exposed to smaller company securities risk. Consult the Fund’s prospectus for additional information on these and other risks.
Please refer to the prospectus provided by your participating insurance company for detailed information describing the separate accounts for information regarding surrender charges, mortality and expense risk fees, and other charges that may be assessed by the participating insurance companies.
Please see footnotes on page 5.
| | | | | | |
| Performance highlights (unaudited) | | Wells Fargo VT Omega Growth Fund | | | 5 | |
| | | | |
| Ten largest holdings (%) as of June 30, 20185 | |
Amazon.com Incorporated | | | 6.57 | |
Microsoft Corporation | | | 6.12 | |
Visa Incorporated Class A | | | 4.03 | |
UnitedHealth Group Incorporated | | | 3.92 | |
Alphabet Incorporated Class A | | | 3.75 | |
First Data Corporation Class A | | | 2.35 | |
Waste Connections Incorporated | | | 2.29 | |
Cintas Corporation | | | 1.90 | |
SiteOne Landscape Supply Incorporated | | | 1.86 | |
Netflix Incorporated | | | 1.84 | |
|
| Sector distribution as of June 30, 20186 |
|
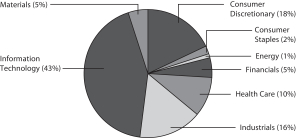
|
| 1 | Historical performance shown prior to July 19, 2010 is based on the performance of the Fund’s predecessor, Evergreen VA Omega Fund. |
| 2 | Reflects the expense ratios as stated in the most recent prospectuses. The expense ratios shown are subject to change and may differ from the annualized expense ratios shown in the financial highlights of this report. |
| 3 | The manager has contractually committed through April 30, 2019, to waive fees and/or reimburse expenses to the extent necessary to cap the Fund’s Total Annual Fund Operating Expenses After Fee Waivers at the amounts shown. After this time, the cap may be increased or the commitment to maintain the cap may be terminated only with the approval of the Board of Trustees. Brokerage commissions, stamp duty fees, interest, taxes, acquired fund fees and expenses (if any), and extraordinary expenses are excluded from the expense cap. Without this cap, the Fund’s returns would have been lower. The expense ratio paid by an investor is the net expense ratio (the total annual fund operating expenses after fee waivers) as stated in the prospectuses. |
| 4 | The Russell 3000® Growth Index measures the performance of those Russell 3000® Index companies with higher price/book ratios and higher forecasted growth values. You cannot invest directly in an index. |
| 5 | The ten largest holdings, excluding cash, cash equivalents and any money market funds, are calculated based on the value of the investments divided by total net assets of the Fund. Holdings are subject to change and may have changed since the date specified. |
| 6 | Amounts are calculated based on the total long-term investments of the Fund. These amounts are subject to change and may have changed since the date specified. |
| | | | |
| 6 | | Wells Fargo VT Omega Growth Fund | | Fund expenses (unaudited) |
As a shareholder of the Fund, you incur ongoing costs, including management fees, distribution (12b-1) fees, and other Fund expenses. This example is intended to help you understand your ongoing costs (in dollars) of investing in the Fund and to compare these costs with the ongoing costs of investing in other mutual funds.
The example is based on an investment of $1,000 invested at the beginning of the six-month period and held for the entire period from January 1, 2018 to June 30, 2018.
Actual expenses
The “Actual” line of the table below provides information about actual account values and actual expenses. You may use the information in this line, together with the amount you invested, to estimate the expenses that you paid over the period. Simply divide your account value by $1,000 (for example, an $8,600 account value divided by $1,000 = 8.6), then multiply the result by the number in the “Actual” line under the heading entitled “Expenses paid during period” for your applicable class of shares to estimate the expenses you paid on your account during this period.
Hypothetical example for comparison purposes
The “Hypothetical” line of the table below provides information about hypothetical account values and hypothetical expenses based on the Fund’s actual expense ratio and an assumed rate of return of 5% per year before expenses, which is not the Fund’s actual return. The hypothetical account values and expenses may not be used to estimate the actual ending account balance or expenses you paid for the period. You may use this information to compare the ongoing costs of investing in the Fund and other funds. To do so, compare this 5% hypothetical example with the 5% hypothetical examples that appear in the shareholder reports of the other funds.
Please note that the expenses shown in the table are meant to highlight your ongoing costs only and do not reflect any separate account charges assessed by participating insurance companies. Therefore, the “Hypothetical” line of the table is useful in comparing ongoing costs only, and will not help you determine the relative total costs of owning different funds. In addition, if these separate account charges assessed by participating insurance companies were included, your costs would have been higher.
| | | | | | | | | | | | | | | | |
| | | Beginning
account value
1-1-2018 | | | Ending
account value
6-30-2018 | | | Expenses
paid during
the period¹ | | | Annualized net
expense ratio | |
Class 1 | | | | | | | | | | | | | | | | |
Actual | | $ | 1,000.00 | | | $ | 1,184.68 | | | $ | 4.06 | | | | 0.75 | % |
Hypothetical (5% return before expenses) | | $ | 1,000.00 | | | $ | 1,021.08 | | | $ | 3.76 | | | | 0.75 | % |
Class 2 | | | | | | | | | | | | | | | | |
Actual | | $ | 1,000.00 | | | $ | 1,183.35 | | | $ | 5.41 | | | | 1.00 | % |
Hypothetical (5% return before expenses) | | $ | 1,000.00 | | | $ | 1,019.84 | | | $ | 5.01 | | | | 1.00 | % |
| 1 | Expenses paid is equal to the annualized net expense ratio of each class multiplied by the average account value over the period, multiplied by the number of days in the most recent fiscal half-year divided by the number of days in the fiscal year (to reflect the one-half-year period). |
| | | | | | |
| Portfolio of investments—June 30, 2018 (unaudited) | | Wells Fargo VT Omega Growth Fund | | | 7 | |
| | | | | | | | | | | | | | | | |
| Security name | | | | | | | | Shares | | | Value | |
|
Common Stocks: 99.79% | |
|
Consumer Discretionary: 17.83% | |
|
| Auto Components: 1.43% | |
Aptiv plc | | | | | | | | | | | 14,900 | | | $ | 1,365,287 | |
| | | | | | | | | | | | | | | | |
|
| Automobiles: 0.79% | |
Ferrari NV | | | | | | | | | | | 5,600 | | | | 756,056 | |
| | | | | | | | | | | | | | | | |
|
| Diversified Consumer Services: 3.07% | |
Adtalem Global Education Incorporated † | | | | | | | | | | | 29,800 | | | | 1,433,380 | |
Bright Horizons Family Solutions Incorporated † | | | | | | | | | | | 14,700 | | | | 1,507,044 | |
| | | | |
| | | | | | | | | | | | | | | 2,940,424 | |
| | | | | | | | | | | | | | | | |
|
| Hotels, Restaurants & Leisure: 2.52% | |
Melco Crown Entertainment Limited ADR | | | | | | | | | | | 44,800 | | | | 1,254,400 | |
Vail Resorts Incorporated | | | | | | | | | | | 4,200 | | | | 1,151,598 | |
| | | | |
| | | | | | | | | | | | | | | 2,405,998 | |
| | | | | | | | | | | | | | | | |
|
| Internet & Direct Marketing Retail: 8.41% | |
Amazon.com Incorporated † | | | | | | | | | | | 3,700 | | | | 6,289,260 | |
Netflix Incorporated † | | | | | | | | | | | 4,500 | | | | 1,761,435 | |
| | | | |
| | | | | | | | | | | | | | | 8,050,695 | |
| | | | | | | | | | | | | | | | |
|
| Specialty Retail: 1.61% | |
The Home Depot Incorporated | | | | | | | | | | | 7,900 | | | | 1,541,290 | |
| | | | | | | | | | | | | | | | |
|
Consumer Staples: 1.55% | |
|
| Food Products: 1.55% | |
Lamb Weston Holdings Incorporated | | | | | | | | | | | 21,600 | | | | 1,479,816 | |
| | | | | | | | | | | | | | | | |
|
Energy: 0.73% | |
|
| Oil, Gas & Consumable Fuels: 0.73% | |
Pioneer Natural Resources Company | | | | | | | | | | | 3,700 | | | | 700,188 | |
| | | | | | | | | | | | | | | | |
|
Financials: 4.52% | |
|
| Capital Markets: 3.13% | |
Intercontinental Exchange Incorporated | | | | | | | | | | | 21,500 | | | | 1,581,325 | |
Raymond James Financial Incorporated | | | | | | | | | | | 15,806 | | | | 1,412,266 | |
| | | | |
| | | | | | | | | | | | | | | 2,993,591 | |
| | | | | | | | | | | | | | | | |
|
| Consumer Finance: 1.39% | |
SLM Corporation † | | | | | | | | | | | 116,400 | | | | 1,332,780 | |
| | | | | | | | | | | | | | | | |
|
Health Care: 10.35% | |
|
| Biotechnology: 1.75% | |
Celgene Corporation † | | | | | | | | | | �� | 12,566 | | | | 997,992 | |
Exelixis Incorporated † | | | | | | | | | | | 31,500 | | | | 677,880 | |
| | | | |
| | | | | | | | | | | | | | | 1,675,872 | |
| | | | | | | | | | | | | | | | |
The accompanying notes are an integral part of these financial statements.
| | | | |
| 8 | | Wells Fargo VT Omega Growth Fund | | Portfolio of investments—June 30, 2018 (unaudited) |
| | | | | | | | | | | | | | | | |
| Security name | | | | | | | | Shares | | | Value | |
|
| Health Care Equipment & Supplies: 2.52% | |
Baxter International Incorporated | | | | | | | | | | | 10,500 | | | $ | 775,320 | |
Edwards Lifesciences Corporation † | | | | | | | | | | | 6,400 | | | | 931,648 | |
Hologic Incorporated † | | | | | | | | | | | 17,600 | | | | 699,600 | |
| | | | |
| | | | | | | | | | | | | | | 2,406,568 | |
| | | | | | | | | | | | | | | | |
|
| Health Care Providers & Services: 4.74% | |
Amedisys Incorporated † | | | | | | | | | | | 9,188 | | | | 785,206 | |
UnitedHealth Group Incorporated | | | | | | | | | | | 15,300 | | | | 3,753,702 | |
| | | | |
| | | | | | | | | | | | | | | 4,538,908 | |
| | | | | | | | | | | | | | | | |
|
| Life Sciences Tools & Services: 1.34% | |
Illumina Incorporated † | | | | | | | | | | | 4,600 | | | | 1,284,734 | |
| | | | | | | | | | | | | | | | |
|
Industrials: 15.65% | |
|
| Aerospace & Defense: 2.54% | |
BWX Technologies Incorporated | | | | | | | | | | | 22,800 | | | | 1,420,896 | |
Mercury Computer Systems Incorporated † | | | | | | | | | | | 26,500 | | | | 1,008,590 | |
| | | | |
| | | | | | | | | | | | | | | 2,429,486 | |
| | | | | | | | | | | | | | | | |
|
| Commercial Services & Supplies: 4.19% | |
Cintas Corporation | | | | | | | | | | | 9,800 | | | | 1,813,686 | |
Waste Connections Incorporated | | | | | | | | | | | 29,146 | | | | 2,194,111 | |
| | | | |
| | | | | | | | | | | | | | | 4,007,797 | |
| | | | | | | | | | | | | | | | |
|
| Electrical Equipment: 0.71% | |
Rockwell Automation Incorporated | | | | | | | | | | | 4,100 | | | | 681,543 | |
| | | | | | | | | | | | | | | | |
|
| Machinery: 2.30% | |
Evoqua Water Technologies Company † | | | | | | | | | | | 64,259 | | | | 1,317,310 | |
Nordson Corporation | | | | | | | | | | | 6,900 | | | | 886,029 | |
| | | | |
| | | | | | | | | | | | | | | 2,203,339 | |
| | | | | | | | | | | | | | | | |
|
| Professional Services: 0.86% | |
TransUnion | | | | | | | | | | | 11,494 | | | | 823,430 | |
| | | | | | | | | | | | | | | | |
|
| Road & Rail: 1.69% | |
Union Pacific Corporation | | | | | | | | | | | 11,400 | | | | 1,615,152 | |
| | | | | | | | | | | | | | | | |
|
| Trading Companies & Distributors: 3.36% | |
SiteOne Landscape Supply Incorporated † | | | | | | | | | | | 21,200 | | | | 1,780,164 | |
Univar Incorporated † | | | | | | | | | | | 54,712 | | | | 1,435,643 | |
| | | | |
| | | | | | | | | | | | | | | 3,215,807 | |
| | | | | | | | | | | | | | | | |
|
Information Technology: 43.38% | |
|
| Electronic Equipment, Instruments & Components: 0.83% | |
Littelfuse Incorporated | | | | | | | | | | | 3,500 | | | | 798,630 | |
| | | | | | | | | | | | | | | | |
The accompanying notes are an integral part of these financial statements.
| | | | | | |
| Portfolio of investments—June 30, 2018 (unaudited) | | Wells Fargo VT Omega Growth Fund | | | 9 | |
| | | | | | | | | | | | | | | | |
| Security name | | | | | | | | Shares | | | Value | |
|
| Internet Software & Services: 11.71% | |
Alibaba Group Holding Limited ADR † | | | | | | | | | | | 7,400 | | | $ | 1,372,922 | |
Alphabet Incorporated Class A † | | | | | | | | | | | 3,180 | | | | 3,590,824 | |
Alphabet Incorporated Class C † | | | | | | | | | | | 1,089 | | | | 1,214,943 | |
Box Incorporated Class A † | | | | | | | | | | | 35,700 | | | | 892,143 | |
Facebook Incorporated Class A † | | | | | | | | | | | 5,205 | | | | 1,011,436 | |
MercadoLibre Incorporated | | | | | | | | | | | 3,900 | | | | 1,165,827 | |
Tencent Holdings Limited ADR | | | | | | | | | | | 24,100 | | | | 1,211,025 | |
Yandex NV Class A † | | | | | | | | | | | 20,700 | | | | 743,130 | |
| | | | |
| | | | | | | | | | | | | | | 11,202,250 | |
| | | | | | | | | | | | | | | | |
|
| IT Services: 15.93% | |
Black Knight Incorporated † | | | | | | | | | | | 25,100 | | | | 1,344,105 | |
EPAM Systems Incorporated † | | | | | | | | | | | 11,315 | | | | 1,406,794 | |
Euronet Worldwide Incorporated † | | | | | | | | | | | 8,700 | | | | 728,799 | |
Fidelity National Information Services Incorporated | | | | | | | | | | | 8,300 | | | | 880,049 | |
First Data Corporation Class A † | | | | | | | | | | | 107,300 | | | | 2,245,789 | |
FleetCor Technologies Incorporated † | | | | | | | | | | | 3,900 | | | | 821,535 | |
Gartner Incorporated † | | | | | | | | | | | 7,800 | | | | 1,036,620 | |
PayPal Holdings Incorporated † | | | | | | | | | | | 6,500 | | | | 541,255 | |
Total System Services Incorporated | | | | | | | | | | | 9,700 | | | | 819,844 | |
Visa Incorporated Class A | | | | | | | | | | | 29,144 | | | | 3,860,123 | |
WEX Incorporated † | | | | | | | | | | | 8,212 | | | | 1,564,221 | |
| | | | |
| | | | | | | | | | | | | | | 15,249,134 | |
| | | | | | | | | | | | | | | | |
|
| Semiconductors & Semiconductor Equipment: 0.69% | |
Infineon Technologies AG ADR | | | | | | | | | | | 25,700 | | | | 657,149 | |
| | | | | | | | | | | | | | | | |
|
| Software: 14.22% | |
Activision Blizzard Incorporated | | | | | | | | | | | 13,500 | | | | 1,030,320 | |
Autodesk Incorporated † | | | | | | | | | | | 6,300 | | | | 825,867 | |
Microsoft Corporation | | | | | | | | | | | 59,400 | | | | 5,857,434 | |
Nintendo Company Limited | | | | | | | | | | | 24,600 | | | | 1,003,434 | |
Salesforce.com Incorporated † | | | | | | | | | | | 12,400 | | | | 1,691,360 | |
ServiceNow Incorporated † | | | | | | | | | | | 5,250 | | | | 905,468 | |
Take-Two Interactive Software Incorporated † | | | | | | | | | | | 13,300 | | | | 1,574,188 | |
Ultimate Software Group Incorporated † | | | | | | | | | | | 2,800 | | | | 720,468 | |
| | | | |
| | | | | | | | | | | | | | | 13,608,539 | |
| | | | | | | | | | | | | | | | |
|
Materials: 5.38% | |
|
| Chemicals: 3.76% | |
Air Products & Chemicals Incorporated | | | | | | | | | | | 8,400 | | | | 1,308,132 | |
Albemarle Corporation « | | | | | | | | | | | 7,000 | | | | 660,310 | |
The Sherwin-Williams Company | | | | | | | | | | | 4,000 | | | | 1,630,280 | |
| | | | |
| | | | | | | | | | | | | | | 3,598,722 | |
| | | | | | | | | | | | | | | | |
|
| Construction Materials: 1.62% | |
Vulcan Materials Company | | | | | | | | | | | 12,000 | | | | 1,548,720 | |
| | | | | | | | | | | | | | | | |
The accompanying notes are an integral part of these financial statements.
| | | | |
| 10 | | Wells Fargo VT Omega Growth Fund | | Portfolio of investments—June 30, 2018 (unaudited) |
| | | | | | | | | | | | | | | | |
| Security name | | | | | | | | Shares | | | Value | |
|
Real Estate: 0.40% | |
|
| Equity REITs: 0.40% | |
SBA Communications Corporation † | | | | | | | | | | | 2,300 | | | $ | 379,776 | |
| | | | | | | | | | | | | | | | |
| |
Total Common Stocks (Cost $62,933,826) | | | | 95,491,681 | |
| | | | | | | | | | | | | | | | |
| | | | |
| | | Yield | | | | | | | | | | |
|
Short-Term Investments: 1.25% | |
|
| Investment Companies: 1.25% | |
Securities Lending Cash Investment LLC (l)(r)(u) | | | 2.09 | % | | | | | | | 631,887 | | | | 631,950 | |
Wells Fargo Government Money Market Fund Select Class (l)(u) | | | 1.83 | | | | | | | | 566,105 | | | | 566,105 | |
| |
Total Short-Term Investments (Cost $1,198,055) | | | | 1,198,055 | |
| | | | | | | | | | | | | | | | |
| | | | | | | | |
| Total investments in securities (Cost $64,131,881) | | | 101.04 | % | | | 96,689,736 | |
Other assets and liabilities, net | | | (1.04 | ) | | | (991,829 | ) |
| | | | | | | | |
| Total net assets | | | 100.00 | % | | $ | 95,697,907 | |
| | | | | | | | |
| † | Non-income-earning security |
| « | All or a portion of this security is on loan. |
| (l) | The issuer of the security is an affiliated person of the Fund as defined in the Investment Company Act of 1940. |
| (r) | The investment is a non-registered investment company purchased with cash collateral received from securities on loan. |
| (u) | The rate represents the 7-day annualized yield at period end. |
Abbreviations:
| ADR | American depositary receipt |
| REIT | Real estate investment trust |
Investments in Affiliates
An affiliated investment is an investment in which the Fund owns at least 5% of the outstanding voting shares of the issuer or as a result of other relationships, such as the Fund and the issuer having the same investment manager. Transactions with issuers that were either affiliated persons of the Fund at the beginning of the period or the end of the period were as follows:
| | | | | | | | | | | | | | | | | | | | | | | | | | | | | | | | | | | | |
| | | Shares,
beginning of
period | | | Shares
purchased | | | Shares
sold | | | Shares,
end of
period | | | Net
realized
gains
(losses) | | | Net
change in
unrealized
gains
(losses) | | | Income
from
affiliated
securities | | | Value,
end
of period | | | % of
net
assets | |
Short-Term Investments | | | | | | | | | | | | | | | | | | | | | | | | | | | | | | | | | | | | |
Investment Companies | | | | | | | | | | | | | | | | | | | | | | | | | | | | | | | | | | | | |
Securities Lending Cash Investment LLC | | | 551,145 | | | | 16,444,681 | | | | 16,363,939 | | | | 631,887 | | | $ | 0 | | | $ | 0 | | | $ | 1,336 | | | $ | 631,950 | | | | | |
Wells Fargo Government Money Market Fund Select Class | | | 549,089 | | | | 10,284,956 | | | | 10,267,940 | | | | 566,105 | | | | 0 | | | | 0 | | | | 4,961 | | | | 566,105 | | | | | |
| | | | | | | | | | | | | | | | | | | | | | | | | | | | | | | | | | | | |
| | | | | | | | | | | | | | | | | | $ | 0 | | | $ | 0 | | | $ | 6,297 | | | $ | 1,198,055 | | | | 1.25 | % |
| | | | | | | | | | | | | | | | | | | | | | | | | | | | | | | | | | | | |
The accompanying notes are an integral part of these financial statements.
| | | | | | |
| Statement of assets and liabilities—June 30, 2018 (unaudited) | | Wells Fargo VT Omega Growth Fund | | | 11 | |
| | | | |
| | | | |
| |
Assets | | | | |
Investments in unaffiliated securities (including $618,024 of securities loaned), at value (cost $62,933,826) | | $ | 95,491,681 | |
Investments in affiliated securities, at value (cost $1,198,055) | | | 1,198,055 | |
Receivable for investments sold | | | 746,579 | |
Receivable for Fund shares sold | | | 81 | |
Receivable for dividends | | | 28,058 | |
Receivable for securities lending income | | | 146 | |
Prepaid expenses and other assets | | | 1,319 | |
| | | | |
Total assets | | | 97,465,919 | |
| | | | |
| |
Liabilities | | | | |
Payable for investments purchased | | | 982,098 | |
Payable upon receipt of securities loaned | | | 631,950 | |
Payable for Fund shares redeemed | | | 56,596 | |
Management fee payable | | | 45,338 | |
Distribution fee payable | | | 12,294 | |
Administration fees payable | | | 6,608 | |
Trustees’ fees and expenses payable | | | 2,307 | |
Accrued expenses and other liabilities | | | 30,821 | |
| | | | |
Total liabilities | | | 1,768,012 | |
| | | | |
Total net assets | | $ | 95,697,907 | |
| | | | |
| |
NET ASSETS CONSIST OF | | | | |
Paid-in capital | | $ | 46,845,531 | |
Accumulated net investment loss | | | (99,323 | ) |
Accumulated net realized gains on investments | | | 16,393,844 | |
Net unrealized gains on investments | | | 32,557,855 | |
| | | | |
Total net assets | | $ | 95,697,907 | |
| | | | |
| |
COMPUTATION OF NET ASSET VALUE PER SHARE | | | | |
Net assets – Class 1 | | $ | 38,646,216 | |
Shares outstanding – Class 11 | | | 1,198,926 | |
Net asset value per share – Class 1 | | | $32.23 | |
Net assets – Class 2 | | $ | 57,051,691 | |
Shares outstanding – Class 21 | | | 1,840,685 | |
Net asset value per share – Class 2 | | | $30.99 | |
| 1 | The Fund has an unlimited number of authorized shares. |
The accompanying notes are an integral part of these financial statements.
| | | | |
| 12 | | Wells Fargo VT Omega Growth Fund | | Statement of operations—six months ended June 30, 2018 (unaudited) |
| | | | |
| | | | |
| |
Investment income | | | | |
Dividends (net of foreign withholding taxes of $2,064) | | $ | 324,122 | |
Income from affiliated securities | | | 6,297 | |
| | | | |
Total investment income | | | 330,419 | |
| | | | |
| |
Expenses | | | | |
Management fee | | | 286,432 | |
Administration fees | |
Class 1 | | | 15,745 | |
Class 2 | | | 22,446 | |
Distribution fee | |
Class 2 | | | 70,144 | |
Custody and accounting fees | | | 6,407 | |
Professional fees | | | 24,108 | |
Shareholder report expenses | | | 14,565 | |
Trustees’ fees and expenses | | | 10,378 | |
Other fees and expenses | | | 3,063 | |
| | | | |
Total expenses | | | 453,288 | |
Less: Fee waivers and/or expense reimbursements | | | (25,104 | ) |
| | | | |
Net expenses | | | 428,184 | |
| | | | |
Net investment loss | | | (97,765 | ) |
| | | | |
| |
REALIZED AND UNREALIZED GAINS (LOSSES) ON INVESTMENTS | | | | |
Net realized gains on investments | | | 6,755,537 | |
Net change in unrealized gains (losses) on investments | | | 3,416,188 | |
| | | | |
Net realized and unrealized gains (losses) on investments | | | 10,171,725 | |
| | | | |
Net increase in net assets resulting from operations | | $ | 10,073,960 | |
| | | | |
The accompanying notes are an integral part of these financial statements.
| | | | | | |
| Statement of changes in net assets | | Wells Fargo VT Omega Growth Fund | | | 13 | |
| | | | | | | | | | | | | | | | |
| | | Six months ended
June 30, 2018
(unaudited) | | | Year ended
December 31, 2017 | |
| |
Operations | | | | | |
Net investment loss | | | | | | $ | (97,765 | ) | | | | | | $ | (177,609 | ) |
Net realized gains on investments | | | | | | | 6,755,537 | | | | | | | | 10,095,655 | |
Net change in unrealized gains (losses) on investments | | | | | | | 3,416,188 | | | | | | | | 15,304,268 | |
| | | | |
Net increase in net assets resulting from operations | | | | | | | 10,073,960 | | | | | | | | 25,222,314 | |
| | | | |
| |
Distributions to shareholders from | | | | | |
Net investment income | |
Class 1 | | | | | | | 0 | | | | | | | | (89,539 | ) |
Class 2 | | | | | | | 0 | | | | | | | | (5,604 | ) |
Net realized gains | |
Class 1 | | | | | | | 0 | | | | | | | | (1,142,282 | ) |
Class 2 | | | | | | | 0 | | | | | | | | (1,424,939 | ) |
| | | | |
Total distributions to shareholders | | | | | | | 0 | | | | | | | | (2,662,364 | ) |
| | | | |
| | | | |
Capital share transactions | | | Shares | | | | | | | | Shares | | | | | |
Proceeds from shares sold | |
Class 1 | | | 27,592 | | | | 857,272 | | | | 120,268 | | | | 3,106,930 | |
Class 2 | | | 91,553 | | | | 2,750,199 | | | | 281,240 | | | | 7,004,117 | |
| | | | |
| | | | | | | 3,607,471 | | | | | | | | 10,111,047 | |
| | | | |
Reinvestment of distributions | |
Class 1 | | | 0 | | | | 0 | | | | 47,341 | | | | 1,231,821 | |
Class 2 | | | 0 | | | | 0 | | | | 57,039 | | | | 1,430,543 | |
| | | | |
| | | | | | | 0 | | | | | | | | 2,662,364 | |
| | | | |
Payment for shares redeemed | |
Class 1 | | | (163,280 | ) | | | (5,109,093 | ) | | | (336,089 | ) | | | (8,699,569 | ) |
Class 2 | | | (197,816 | ) | | | (5,895,103 | ) | | | (387,758 | ) | | | (9,670,121 | ) |
| | | | |
| | | | | | | (11,004,196 | ) | | | | | | | (18,369,690 | ) |
| | | | |
Net decrease in net assets resulting from capital share transactions | | | | | | | (7,396,725 | ) | | | | | | | (5,596,279 | ) |
| | | | |
Total increase in net assets | | | | | | | 2,677,235 | | | | | | | | 16,963,671 | |
| | | | |
| | |
Net assets | | | | | | | | |
Beginning of period | | | | | | | 93,020,672 | | | | | | | | 76,057,001 | |
| | | | |
End of period | | | | | | $ | 95,697,907 | | | | | | | $ | 93,020,672 | |
| | | | |
Accumulated net investment loss | | | | | | $ | (99,323 | ) | | | | | | $ | (1,558 | ) |
| | | | |
The accompanying notes are an integral part of these financial statements.
| | | | |
| 14 | | Wells Fargo VT Omega Growth Fund | | Financial highlights |
(For a share outstanding throughout each period)
| | | | | | | | | | | | | | | | | | | | | | | | |
| | | Six months ended
June 30, 2018 (unaudited) | | | Year ended December 31 | |
| CLASS 1 | | 2017 | | | 2016 | | | 2015 | | | 2014 | | | 2013 | |
Net asset value, beginning of period | | | $28.99 | | | | $22.20 | | | | $23.30 | | | | $27.57 | | | | $32.78 | | | | $25.56 | |
Net investment income (loss) | | | (0.01 | )1 | | | (0.02 | )1 | | | 0.10 | | | | (0.03 | ) | | | (0.03 | ) | | | (0.01 | ) |
Net realized and unrealized gains (losses) on investments | | | 3.25 | | | | 7.68 | | | | 0.05 | | | | 0.52 | | | | 1.22 | | | | 9.81 | |
| | | | | | | | | | | | | | | | | | | | | | | | |
Total from investment operations | | | 3.24 | | | | 7.66 | | | | 0.15 | | | | 0.49 | | | | 1.19 | | | | 9.80 | |
Distributions to shareholders from | | | | | | | | | | | | | | | | | | | | | | | | |
Net investment income | | | 0.00 | | | | (0.06 | ) | | | 0.00 | | | | 0.00 | | | | 0.00 | | | | (0.12 | ) |
Net realized gains | | | 0.00 | | | | (0.81 | ) | | | (1.25 | ) | | | (4.76 | ) | | | (6.40 | ) | | | (2.46 | ) |
| | | | | | | | | | | | | | | | | | | | | | | | |
Total distributions to shareholders | | | 0.00 | | | | (0.87 | ) | | | (1.25 | ) | | | (4.76 | ) | | | (6.40 | ) | | | (2.58 | ) |
Net asset value, end of period | | | $32.23 | | | | $28.99 | | | | $22.20 | | | | $23.30 | | | | $27.57 | | | | $32.78 | |
Total return2 | | | 11.18 | % | | | 34.95 | % | | | 0.77 | % | | | 1.62 | % | | | 4.09 | % | | | 40.22 | % |
Ratios to average net assets (annualized) | | | | | | | | | | | | | | | | | | | | | | | | |
Gross expenses | | | 0.80 | % | | | 0.82 | % | | | 0.82 | % | | | 0.79 | % | | | 0.75 | % | | | 0.75 | % |
Net expenses | | | 0.75 | % | | | 0.75 | % | | | 0.75 | % | | | 0.75 | % | | | 0.75 | % | | | 0.75 | % |
Net investment income (loss) | | | (0.06 | )% | | | (0.07 | )% | | | 0.26 | % | | | (0.11 | )% | | | (0.10 | )% | | | (0.12 | )% |
Supplemental data | | | | | | | | | | | | | | | | | | | | | | | | |
Portfolio turnover rate | | | 23 | % | | | 67 | % | | | 90 | % | | | 101 | % | | | 88 | % | | | 95 | % |
Net assets, end of period (000s omitted) | | | $38,646 | | | | $38,687 | | | | $33,373 | | | | $40,362 | | | | $47,210 | | | | $55,867 | |
| 1 | Calculated based upon average shares outstanding |
| 2 | Returns for periods of less than one year are not annualized. Performance figures of the Fund do not reflect fees charged pursuant to the terms of variable life insurance policies and variable annuity contracts. |
The accompanying notes are an integral part of these financial statements.
| | | | | | |
| Financial highlights | | Wells Fargo VT Omega Growth Fund | | | 15 | |
(For a share outstanding throughout each period)
| | | | | | | | | | | | | | | | | | | | | | | | |
| | | Six months ended
June 30, 2018 (unaudited) | | | Year ended December 31 | |
| CLASS 2 | | 2017 | | | 2016 | | | 2015 | | | 2014 | | | 2013 | |
Net asset value, beginning of period | | | $27.91 | | | | $21.38 | | | | $22.54 | | | | $26.89 | | | | $32.19 | | | | $25.13 | |
Net investment income (loss) | | | (0.06 | ) | | | (0.08 | ) | | | 0.00 | 1,2 | | | (0.09 | ) | | | (0.10 | ) | | | (0.12 | ) |
Net realized and unrealized gains (losses) on investments | | | 3.14 | | | | 7.39 | | | | 0.09 | | | | 0.50 | | | | 1.20 | | | | 9.68 | |
| | | | | | | | | | | | | | | | | | | | | | | | |
Total from investment operations | | | 3.08 | | | | 7.31 | | | | 0.09 | | | | 0.41 | | | | 1.10 | | | | 9.56 | |
Distributions to shareholders from | | | | | | | | | | | | | | | | | | | | | | | | |
Net investment income | | | 0.00 | | | | (0.00 | )2 | | | 0.00 | | | | 0.00 | | | | 0.00 | | | | (0.04 | ) |
Net realized gains | | | 0.00 | | | | (0.78 | ) | | | (1.25 | ) | | | (4.76 | ) | | | (6.40 | ) | | | (2.46 | ) |
| | | | | | | | | | | | | | | | | | | | | | | | |
Total distributions to shareholders | | | 0.00 | | | | (0.78 | ) | | | (1.25 | ) | | | (4.76 | ) | | | (6.40 | ) | | | (2.50 | ) |
Net asset value, end of period | | | $30.99 | | | | $27.91 | | | | $21.38 | | | | $22.54 | | | | $26.89 | | | | $32.19 | |
Total return3 | | | 11.04 | % | | | 34.60 | % | | | 0.52 | % | | | 1.34 | % | | | 3.86 | % | | | 39.88 | % |
Ratios to average net assets (annualized) | | | | | | | | | | | | | | | | | | | | | | | | |
Gross expenses | | | 1.05 | % | | | 1.07 | % | | | 1.07 | % | | | 1.04 | % | | | 1.00 | % | | | 1.04 | % |
Net expenses | | | 1.00 | % | | | 1.00 | % | | | 1.00 | % | | | 1.00 | % | | | 1.00 | % | | | 1.00 | % |
Net investment income (loss) | | | (0.31 | )% | | | (0.31 | )% | | | 0.01 | % | | | (0.36 | )% | | | (0.35 | )% | | | (0.37 | )% |
Supplemental data | | | | | | | | | | | | | | | | | | | | | | | | |
Portfolio turnover rate | | | 23 | % | | | 67 | % | | | 90 | % | | | 101 | % | | | 88 | % | | | 95 | % |
Net assets, end of period (000s omitted) | | | $57,052 | | | | $54,334 | | | | $42,684 | | | | $49,963 | | | | $59,035 | | | | $68,658 | |
| 1 | Calculated based upon average shares outstanding |
| 2 | Amount is less than $0.005. |
| 3 | Returns for periods of less than one year are not annualized. Performance figures of the Fund do not reflect fees charged pursuant to the terms of variable life insurance policies and variable annuity contracts. |
The accompanying notes are an integral part of these financial statements.
| | | | |
| 16 | | Wells Fargo VT Omega Growth Fund | | Notes to financial statements (unaudited) |
1. ORGANIZATION
Wells Fargo Variable Trust (the “Trust”), a Delaware statutory trust organized on March 10, 1999, is an open-end management investment company registered under the Investment Company Act of 1940, as amended (the “1940 Act”). As an investment company, the Trust follows the accounting and reporting guidance in Financial Accounting Standards Board Accounting Standards Codification Topic 946, Financial Services – Investment Companies. These financial statements report on the Wells Fargo VT Omega Growth Fund (the “Fund”) which is a diversified series of the Trust. The Trust offers shares of the Fund to separate accounts of various life insurance companies as funding vehicles for certain variable annuity contracts and variable life insurance policies.
2. SIGNIFICANT ACCOUNTING POLICIES
The following significant accounting policies, which are consistently followed in the preparation of the financial statements of the Fund, are in conformity with U.S. generally accepted accounting principles which require management to make estimates and assumptions that affect the reported amounts of assets and liabilities, disclosure of contingent assets and liabilities at the date of the financial statements, and the reported amounts of revenues and expenses during the reporting period. Actual results could differ from those estimates.
Securities valuation
All investments are valued each business day as of the close of regular trading on the New York Stock Exchange (generally 4 p.m. Eastern Time), although the Fund may deviate from this calculation time under unusual or unexpected circumstances.
Equity securities that are listed on a foreign or domestic exchange or market are valued at the official closing price or, if none, the last sales price. If no sale occurs on the principal exchange or market that day, a fair value price will be determined in accordance with the Fund’s Valuation Procedures.
Investments in registered open-end investment companies are valued at net asset value. Interests in non-registered investment companies that are redeemable at net asset value are fair valued normally at net asset value.
Investments which are not valued using any of the methods discussed above are valued at their fair value, as determined in good faith by the Board of Trustees of the Fund. The Board of Trustees has established a Valuation Committee comprised of the Trustees and has delegated to it the authority to take any actions regarding the valuation of portfolio securities that the Valuation Committee deems necessary or appropriate, including determining the fair value of portfolio securities, unless the determination has been delegated to the Wells Fargo Asset Management Pricing Committee at Wells Fargo Funds Management, LLC (“Funds Management”). The Board of Trustees retains the authority to make or ratify any valuation decisions or approve any changes to the Valuation Procedures as it deems appropriate. On a quarterly basis, the Board of Trustees receives reports on any valuation actions taken by the Valuation Committee or the Wells Fargo Asset Management Pricing Committee which may include items for ratification.
Valuations of fair valued securities are compared to the next actual sales price when available, or other appropriate market values, to assess the continued appropriateness of the fair valuation methodologies used. These securities are fair valued on a day-to-day basis, taking into consideration changes to appropriate market information and any significant changes to the inputs considered in the valuation process until there is a readily available price provided on an exchange or by an independent pricing service. Valuations received from an independent pricing service or independent broker-dealer quotes are periodically validated by comparisons to most recent trades and valuations provided by other independent pricing services in addition to the review of prices by the manager and/or subadviser. Unobservable inputs used in determining fair valuations are identified based on the type of security, taking into consideration factors utilized by market participants in valuing the investment, knowledge about the issuer and the current market environment.
Securities lending
The Fund may lend its securities from time to time in order to earn additional income in the form of fees or interest on securities received as collateral or the investment of any cash received as collateral. The Fund continues to receive interest or dividends on the securities loaned. The Fund receives collateral in the form of cash or securities with a value at least equal to the value of the securities on loan. The value of the loaned securities is determined at the close of each business day and any additional required collateral is delivered to the Fund on the next business day. In a securities lending transaction, the net asset value of the Fund will be affected by an increase or decrease in the value of the securities loaned and by an increase or decrease in the value of the instrument in which collateral is invested. The amount of securities lending activity undertaken by the Fund fluctuates from time to time. In the event of default or bankruptcy by the borrower, the Fund may be prevented from recovering the loaned securities or gaining access to the collateral or
| | | | | | |
| Notes to financial statements (unaudited) | | Wells Fargo VT Omega Growth Fund | | | 17 | |
may experience delays or costs in doing so. In addition, the investment of any cash collateral received may lose all or part of its value. The Fund has the right under the lending agreement to recover the securities from the borrower on demand.
The Fund lends its securities through an unaffiliated securities lending agent. Cash collateral received in connection with its securities lending transactions is invested in Securities Lending Cash Investments, LLC (the “Securities Lending Fund”). The Securities Lending Fund is exempt from registration under Section 3(c)(7) of the 1940 Act and is managed by Funds Management and is subadvised by Wells Capital Management Incorporated (“WellsCap”), an affiliate of Funds Management and an indirect wholly owned subsidiary of Wells Fargo & Company (“Wells Fargo”). Funds Management receives an advisory fee starting at 0.05% and declining to 0.01% as the average daily net assets of the Securities Lending Fund increase. All of the fees received by Funds Management are paid to WellsCap for its services as subadviser. The Securities Lending Fund seeks to provide a positive return compared to the daily Fed Funds Open Rate by investing in high-quality, U.S. dollar-denominated short-term money market instruments. Securities Lending Fund investments are valued at the evaluated bid price provided by an independent pricing service. Income earned from investment in the Securities Lending Fund, if any, is included in income from affiliated securities on the Statement of Operations.
Security transactions and income recognition
Securities transactions are recorded on a trade date basis. Realized gains or losses are recorded on the basis of identified cost.
Dividend income is recognized on the ex-dividend date. Dividend income is recorded net of foreign taxes withheld where recovery of such taxes is not assured.
Distributions to shareholders
Distributions to shareholders from net investment income and any net realized gains are recorded on the ex-dividend date and paid at least annually. Such distributions are determined in accordance with income tax regulations and may differ from U.S. generally accepted accounting principles. Dividend sources are estimated at the time of declaration. The tax character of distributions is determined as of the Fund’s fiscal year end. Therefore, a portion of the Fund’s distributions made prior to the Fund’s fiscal year end may be categorized as a tax return of capital at year end.
Federal and other taxes
The Fund intends to continue to qualify as a regulated investment company by distributing substantially all of its investment company taxable income and any net realized capital gains (after reduction for capital loss carryforwards) sufficient to relieve it from all, or substantially all, federal income taxes. Accordingly, no provision for federal income taxes was required.
The Fund’s income and federal excise tax returns and all financial records supporting those returns for the prior three fiscal years are subject to examination by the federal and Delaware revenue authorities. Management has analyzed the Fund’s tax positions taken on federal, state, and foreign tax returns for all open tax years and does not believe that there are any uncertain tax positions that require recognition of a tax liability.
As of June 30, 2018, the aggregate cost of all investments for federal income tax purposes was $64,182,129 and the unrealized gains (losses) consisted of:
| | | | |
Gross unrealized gains | | $ | 33,724,162 | |
Gross unrealized losses | | | (1,216,555 | ) |
Net unrealized gains | | $ | 32,507,607 | |
Class allocations
The separate classes of shares offered by the Fund differ principally in distribution fees. Class specific expenses are charged directly to that share class. Investment income, common expenses, and realized and unrealized gains (losses) on investments are allocated daily to each class of shares based on the relative proportion of net assets of each class.
3. FAIR VALUATION MEASUREMENTS
Fair value measurements of investments are determined within a framework that has established a fair value hierarchy based upon the various data inputs utilized in determining the value of the Fund’s investments. The three-level hierarchy gives the highest priority to unadjusted quoted prices in active markets for identical assets or liabilities (Level 1) and the lowest priority to unobservable inputs (Level 3). The Fund’s investments are classified within the fair value hierarchy based on the lowest level of input that is significant to the fair value measurement. The inputs are summarized into three broad levels as follows:
| | | | |
| 18 | | Wells Fargo VT Omega Growth Fund | | Notes to financial statements (unaudited) |
| ∎ | | Level 1 – quoted prices in active markets for identical securities |
| ∎ | | Level 2 – other significant observable inputs (including quoted prices for similar securities, interest rates, prepayment speeds, credit risk, etc.) |
| ∎ | | Level 3 – significant unobservable inputs (including the Fund’s own assumptions in determining the fair value of investments) |
The inputs or methodologies used for valuing investments in securities are not necessarily an indication of the risk associated with investing in those securities.
The following is a summary of the inputs used in valuing the Fund’s assets and liabilities as of June 30, 2018:
| | | | | | | | | | | | | | | | |
| | | Quoted prices
(Level 1) | | | Other significant
observable inputs
(Level 2) | | | Significant
unobservable inputs (Level 3) | | | Total | |
|
Assets | | | | | | | | | | | | | | | | |
Investments in: | | | | | | | | | | | | | | | | |
| | | | |
Common stocks | | | | | | | | | | | | | | | | |
Consumer discretionary | | $ | 17,059,750 | | | $ | 0 | | | $ | 0 | | | $ | 17,059,750 | |
Consumer staples | | | 1,479,816 | | | | 0 | | | | 0 | | | | 1,479,816 | |
Energy | | | 700,188 | | | | 0 | | | | 0 | | | | 700,188 | |
Financials | | | 4,326,371 | | | | 0 | | | | 0 | | | | 4,326,371 | |
Health care | | | 9,906,082 | | | | 0 | | | | 0 | | | | 9,906,082 | |
Industrials | | | 14,976,554 | | | | 0 | | | | 0 | | | | 14,976,554 | |
Information technology | | | 41,515,702 | | | | 0 | | | | 0 | | | | 41,515,702 | |
Materials | | | 5,147,442 | | | | 0 | | | | 0 | | | | 5,147,442 | |
Real estate | | | 379,776 | | | | 0 | | | | 0 | | | | 379,776 | |
| | | | |
Short-term investments | | | | | | | | | | | | | | | | |
Investment companies | | | 566,105 | | | | 0 | | | | 0 | | | | 566,105 | |
Investments measured at net asset value* | | | | | | | | | | | | | | | 631,950 | |
Total assets | | $ | 96,057,786 | | | $ | 0 | | | $ | 0 | | | $ | 96,689,736 | |
| * | Investments that are measured at fair value using the net asset value per share (or its equivalent) as a practical expedient have not been categorized in the fair value hierarchy. The fair value amount presented in the table is intended to permit reconciliation of the fair value hierarchy to the amounts presented in the Statement of Assets and Liabilities. The Fund’s investment in Securities Lending Cash Investments, LLC valued at $631,950 does not have a redemption period notice, can be redeemed daily and does not have any unfunded commitments. |
The Fund recognizes transfers between levels within the fair value hierarchy at the end of the reporting period. At June 30, 2018, the Fund did not have any transfers into/out of Level 1, Level 2, or Level 3.
4. TRANSACTIONS WITH AFFILIATES
Management fee
Funds Management, an indirect wholly owned subsidiary of Wells Fargo, is the manager of the Fund and provides advisory and fund-level administrative services under an investment management agreement. Under the investment management agreement, Funds Management is responsible for, among other services, implementing the investment objectives and strategies of the Fund, supervising the subadviser and providing fund-level administrative services in connection with the Fund’s operations. As compensation for its services under the investment management agreement, Funds Management is entitled to receive an annual management fee starting at 0.60% and declining to 0.43% as the average daily net assets of the Fund increase. For the six months ended June 30, 2018, the management fee was equivalent to an annual rate of 0.60% of the Fund’s average daily net assets.
Funds Management has retained the services of a subadviser to provide daily portfolio management to the Fund. The fee for subadvisory services is borne by Funds Management. WellsCap is the subadviser to the Fund and is entitled to receive a fee from Funds Management at an annual rate starting at 0.45% and declining to 0.30% as the average daily net assets of the Fund increase.
| | | | | | |
| Notes to financial statements (unaudited) | | Wells Fargo VT Omega Growth Fund | | | 19 | |
Administration fees
Under a class-level administration agreement, Funds Management provides class-level administrative services to the Fund, which includes paying fees and expenses for services provided by the transfer agent, sub-transfer agents, omnibus account servicers and record-keepers. As compensation for its services under the class-level administration agreement, Funds Management receives an annual fee of 0.08% which is calculated based on the average daily net assets of each class.
Funds Management has contractually waived and/or reimbursed management and administration fees to the extent necessary to maintain certain net operating expense ratios for the Fund. When each class of the Fund has exceeded its expense cap, Funds Management has waived fees and/or reimbursed expenses from fund level expenses on a proportionate basis and then from class specific expenses; otherwise, waivers and/or reimbursements are applied against class specific expenses before fund level expenses. Funds Management has committed through April 30, 2019 to waive fees and/or reimburse expenses to the extent necessary to cap the Fund’s expenses at 0.75% for Class 1 shares and 1.00% for Class 2 shares. After this time, the cap may be increased or the commitment to maintain the cap may be terminated only with the approval of the Board of Trustees.
Distribution fee
The Trust has adopted a distribution plan for Class 2 shares of the Fund pursuant to Rule 12b-1 under the 1940 Act. A distribution fee is charged to Class 2 shares and paid to Wells Fargo Funds Distributor, LLC, the principal underwriter, at an annual rate of 0.25% of the average daily net assets of Class 2 shares.
Interfund transactions
The Fund may purchase or sell portfolio investment securities to certain other Wells Fargo affiliates pursuant to Rule 17a-7 under the 1940 Act and under procedures adopted by the Board of Trustees. The procedures have been designed to ensure that these interfund transactions, which do not incur broker commissions, are effected at current market prices.
5. INVESTMENT PORTFOLIO TRANSACTIONS
Purchases and sales of investments, excluding U.S. government obligations (if any) and short-term securities, for the six months ended June 30, 2018 were $21,572,366 and $28,337,355, respectively.
6. BANK BORROWINGS
The Trust and Wells Fargo Funds Trust (excluding the money market funds and certain other funds) are parties to a $280,000,000 revolving credit agreement whereby the Fund is permitted to use bank borrowings for temporary or emergency purposes, such as to fund shareholder redemption requests. Interest under the credit agreement is charged to the Fund based on a borrowing rate equal to the higher of the Federal Funds rate in effect on that day plus 1.25% or the overnight LIBOR rate in effect on that day plus 1.25%. In addition, an annual commitment fee equal to 0.25% of the unused balance is allocated to each participating fund.
For the six months ended June 30, 2018, there were no borrowings by the Fund under the agreement.
7. CONCENTRATION RISK
Concentration risks result from exposure to a limited number of sectors. A fund that invests a substantial portion of its assets in any sector may be more affected by changes in that sector than would be a fund whose investments are not heavily weighted in any sector.
8. INDEMNIFICATION
Under the Trust’s organizational documents, the officers and Trustees have been granted certain indemnification rights against certain liabilities that may arise out of performance of their duties to the Trust. Additionally, in the normal course of business, the Trust may enter into contracts with service providers that contain a variety of indemnification clauses. The Trust’s maximum exposure under these arrangements is dependent on future claims that may be made against the Fund and, therefore, cannot be estimated.
| | | | |
| 20 | | Wells Fargo VT Omega Growth Fund | | Notes to financial statements (unaudited) |
9. SUBSEQUENT DISTRIBUTIONS
On July 13, 2018, the Fund declared distributions from short-term capital gains and long-term capital gains to shareholders of record on July 12, 2018. The per share amounts payable on July 16, 2018 were as follows:
| | | | | | | | |
| | | Short-term
capital gains | | | Long-term
capital gains | |
Class 1 | | | $0.97948 | | | | $2.33037 | |
Class 2 | | | 0.94175 | | | | 2.24058 | |
These distributions are not reflected in the accompanying financial statements.
| | | | | | |
| Other information (unaudited) | | Wells Fargo VT Omega Growth Fund | | | 21 | |
PROXY VOTING INFORMATION
A description of the policies and procedures that the Fund uses to determine how to vote proxies relating to portfolio securities is available, upon request, by calling 1-800-260-5969, visiting our website at wellsfargofunds.com, or visiting the SEC website at sec.gov. Information regarding how the Fund voted proxies relating to portfolio securities during the most recent 12-month period ended June 30 is available on the Fund’s website at wellsfargofunds.com or by visiting the SEC website at sec.gov.
PORTFOLIO HOLDINGS INFORMATION
The complete portfolio holdings for the Fund are publicly available monthly on the Fund’s website (wellsfargofunds.com), on a one-month delayed basis. In addition, top ten holdings information (excluding derivative positions) for the Fund is publicly available on the Fund’s website on a monthly, seven-day or more delayed basis. The Fund files its complete schedule of portfolio holdings with the SEC for the first and third quarters of each fiscal year on Form N-Q, which is available by visiting the SEC website at sec.gov. In addition, the Fund’s Form N-Q may be reviewed and copied at the SEC’s Public Reference Room in Washington, DC, and at regional offices in New York City, at 233 Broadway, and in Chicago, at 175 West Jackson Boulevard, Suite 900. Information about the Public Reference Room may be obtained by calling 1-800-SEC-0330.
| | | | |
| 22 | | Wells Fargo VT Omega Growth Fund | | Other information (unaudited) |
BOARD OF TRUSTEES AND OFFICERS
Each of the Trustees and Officers1 listed in the table below acts in identical capacities for each fund in the Wells Fargo family of funds, which consists of 154 mutual funds comprising the Wells Fargo Funds Trust, Wells Fargo Variable Trust, Wells Fargo Master Trust and four closed-end funds (collectively the “Fund Complex”). This table should be read in conjunction with the Prospectus and the Statement of Additional Information2. The mailing address of each Trustee and Officer is 525 Market Street, 12th Floor, San Francisco, CA 94105. Each Trustee and Officer serves an indefinite term, however, each Trustee serves such term until reaching the mandatory retirement age established by the Trustees.
Independent Trustees
| | | | | | |
Name and year of birth | | Position held and length of service* | | Principal occupations during past five years or longer | | Current other public company or
investment company
directorships |
| William R. Ebsworth (Born 1957) | | Trustee, since 2015 | | Retired. From 1984 to 2013, equities analyst, portfolio manager, research director and chief investment officer at Fidelity Management and Research Company in Boston, Tokyo, and Hong Kong, and retired in 2013 as Chief Investment Officer of Fidelity Strategic Advisers, Inc. where he led a team of investment professionals managing client assets. Prior thereto, Board member of Hong Kong Securities Clearing Co., Hong Kong Options Clearing Corp., the Thailand International Fund, Ltd., Fidelity Investments Life Insurance Company, and Empire Fidelity Investments Life Insurance Company. Board member of the Forté Foundation (non-profit organization) and the Vincent Memorial Hospital Endowment (non-profit organization), where he serves on the Investment Committee and as a Chair of the Audit Committee. Mr. Ebsworth is a CFA® charterholder. | | Asset Allocation Trust |
| Jane A. Freeman (Born 1953) | | Trustee, since 2015; Chair Liaison, since 2018 | | Retired. From 2012 to 2014 and 1999 to 2008, Chief Financial Officer of Scientific Learning Corporation. From 2008 to 2012, Ms. Freeman provided consulting services related to strategic business projects. Prior to 1999, Portfolio Manager at Rockefeller & Co. and Scudder, Stevens & Clark. Board member of the Harding Loevner Funds from 1996 to 2014, serving as both Lead Independent Director and chair of the Audit Committee. Board member of the Russell Exchange Traded Funds Trust from 2011 to 2012 and the chair of the Audit Committee. Ms. Freeman is a Board Member of Ruth Bancroft Garden (non-profit organization) and the Glimmerglass Festival. She is also an inactive Chartered Financial Analyst. | | Asset Allocation Trust |
| Isaiah Harris, Jr. (Born 1952) | | Trustee, since 2009 | | Retired. Chairman of the Board of CIGNA Corporation since 2009, and Director since 2005. From 2003 to 2011, Director of Deluxe Corporation. Prior thereto, President and CEO of BellSouth Advertising and Publishing Corp. from 2005 to 2007, President and CEO of BellSouth Enterprises from 2004 to 2005 and President of BellSouth Consumer Services from 2000 to 2003. Emeritus member of the Iowa State University Foundation Board of Governors. Emeritus Member of the Advisory Board of Iowa State University School of Business. Advisory Board Member, Palm Harbor Academy (charter school). Advisory Board Member, Child Evangelism Fellowship (non-profit). Mr. Harris is a certified public accountant (inactive status). | | CIGNA Corporation; Asset Allocation Trust |
| Judith M. Johnson (Born 1949) | | Trustee, since 2008; Audit Committee Chairman, since 2009 | | Retired. Prior thereto, Chief Executive Officer and Chief Investment Officer of Minneapolis Employees Retirement Fund from 1996 to 2008. Ms. Johnson is an attorney, certified public accountant and a certified managerial accountant. | | Asset Allocation Trust |
| David F. Larcker (Born 1950) | | Trustee, since 2009 | | James Irvin Miller Professor of Accounting at the Graduate School of Business, Stanford University, Director of the Corporate Governance Research Initiative and Senior Faculty of The Rock Center for Corporate Governance since 2006. From 2005 to 2008, Professor of Accounting at the Graduate School of Business, Stanford University. Prior thereto, Ernst & Young Professor of Accounting at The Wharton School, University of Pennsylvania from 1985 to 2005. | | Asset Allocation Trust |
| | | | | | |
| Other information (unaudited) | | Wells Fargo VT Omega Growth Fund | | | 23 | |
| | | | | | |
Name and year of birth | | Position held and length of service* | | Principal occupations during past five years or longer | | Current other public company or
investment company
directorships |
| Olivia S. Mitchell (Born 1953) | | Trustee, since 2006; Governance Committee Chairman, since 2018 | | International Foundation of Employee Benefit Plans Professor, Wharton School of the University of Pennsylvania since 1993. Director of Wharton’s Pension Research Council and Boettner Center on Pensions & Retirement Research, and Research Associate at the National Bureau of Economic Research. Previously, Cornell University Professor from 1978 to 1993. | | Asset Allocation Trust |
| Timothy J. Penny (Born 1951) | | Trustee, since 1996; Chairman, since 2018; Vice Chairman, from 2017 to 2018 | | President and Chief Executive Officer of Southern Minnesota Initiative Foundation, a non-profit organization, since 2007. Member of the Board of Trustees of NorthStar Education Finance, Inc., a non-profit organization, since 2007. | | Asset Allocation Trust |
| James G. Polisson (Born 1959) | | Trustee, since 2018; Advisory Board Member, from 2017 to 2018 | | Retired. Chief Marketing Officer, Source (ETF) UK Services, Ltd, from 2015 to 2017. From 2012 to 2015, Principal of The Polisson Group, LLC, a management consulting, corporate advisory and principal investing company. Chief Executive Officer and Managing Director at Russell Investments, Global Exchange Traded Funds from 2010 to 2012. Managing Director of Barclays Global Investors from 1998 to 2010 and Global Chief Marketing Officer for iShares and Barclays Global Investors from 2000 to 2010. Trustee of the San Francisco Mechanics’ Institute, a non-profit organization, from 2013 to 2015. Board member of the Russell Exchange Traded Fund Trust from 2011 to 2012. Director of Barclays Global Investors Holdings Deutschland GmbH from 2006 to 2009. Mr. Polisson is an attorney and has a retired status with the Massachusetts and District of Columbia Bar Associations. | | Asset Allocation Trust |
| Michael S. Scofield (Born 1943) | | Trustee, since 2010 | | Served on the Investment Company Institute’s Board of Governors and Executive Committee from 2008-2011 as well the Governing Council of the Independent Directors Council from 2006-2011 and the Independent Directors Council Executive Committee from 2008-2011. Trustee of the Evergreen Fund complex (and its predecessors) from 1984 to 2010. Chairman of the Evergreen Funds from 2000-2010. Former Trustee of the Mentor Funds. Retired Attorney, Law Offices of Michael S. Scofield. | | Asset Allocation Trust |
| Pamela Wheelock (Born 1959) | | Trustee, since 2018; Advisory Board Member, from 2017 to 2018 | | Chief Operating Officer, Twin Cities Habitat for Humanity, since January, 2017. Vice President of University Services, University of Minnesota from 2012 to 2017. Prior thereto, on the Board of Directors, Goverance Committee and Finance Committee for the Minnesota Philanthropy Partners (Saint Paul Foundation) from 2012 to 2018, Interim President and Chief Executive Officer of Blue Cross Blue shield of Minnesota of Minnesota from 2010 to 2011, Chairman of the Board from 2009 to 2011 and Board Director 003 to 2015. Vice President, Leadership and Community Engagement, Bush Foundation, Saint Paul, Minnesota (a private foundation) from 2009 to 2011. Executive Vice President and Chief Financial Officer, Minnesota Sports and Entertainment from 2004 to 2009 and Senior Vice President from 2002 to 2004. Commissioner of Finance, State of Minnesota, from 1999 to 2002. Currently the Board Chair of the Minnesota Wild Foundation since 2010. | | Asset Allocation Trust |
| * | Length of service dates reflect the Trustee’s commencement of service with the Trust’s predecessor entities, where applicable. |
| | | | |
| 24 | | Wells Fargo VT Omega Growth Fund | | Other information (unaudited) |
Officers
| | | | | | |
Name and year of birth | | Position held and length of service | | Principal occupations during past five years or longer | | |
| Andrew Owen (Born 1960) | | President, since 2017 | | Executive Vice President of Wells Fargo & Company and Head of Affiliated Managers, Wells Fargo Asset Management, since 2014. In addition, Mr. Owen is currently President, Chief Executive Officer and Director of Wells Fargo Funds Management, LLC since 2017. Prior thereto, Executive Vice President responsible for marketing, investments and product development for Wells Fargo Funds Management, LLC, from 2009 to 2014. | | |
| Jeremy DePalma1 (Born 1974) | | Treasurer, since 2012 | | Senior Vice President of Wells Fargo Funds Management, LLC since 2009. Senior Vice President of Evergreen Investment Management Company, LLC from 2008 to 2010 and head of the Fund Reporting and Control Team within Fund Administration from 2005 to 2010. | | |
| Alexander Kymn3 (Born 1973) | | Secretary, since 2018; Chief Legal Officer, since 2018 | | Senior Company Counsel of Wells Fargo Bank, N.A. since 2018 (previously Senior Counsel from 2007 to 2018). Vice President of Wells Fargo Funds Management, LLC from 2008 to 2014. | | |
| Michael H. Whitaker (Born 1967) | | Chief Compliance Officer, since 2016 | | Senior Vice President and Chief Compliance Officer since 2016. Senior Vice President and Chief Compliance Officer for Fidelity Investments from 2007 to 2016. | | |
David Berardi (Born 1975) | | Assistant Treasurer, since 2009 | | Vice President of Wells Fargo Funds Management, LLC since 2009. Vice President of Evergreen Investment Management Company, LLC from 2008 to 2010. Manager of Fund Reporting and Control for Evergreen Investment Management Company, LLC from 2004 to 2010. | | |
| 1 | Jeremy DePalma acts as Treasurer of 77 funds and Assistant Treasurer of 77 funds in the Fund Complex. |
| 2 | The Statement of Additional Information includes additional information about the Trustees and is available, without charge, upon request, by calling 1-800-260-5969 or by visiting the website at wellsfargofunds.com. |
| 3 | Alexander Kymn became the Secretary and Chief Legal Officer effective April 17, 2018. |
| | | | | | |
| Other information (unaudited) | | Wells Fargo VT Omega Growth Fund | | | 25 | |
BOARD CONSIDERATION OF INVESTMENT MANAGEMENT AND SUB-ADVISORY AGREEMENTS:
Wells Fargo VT Omega Growth Fund
Under the Investment Company Act of 1940 (the “1940 Act”), the Board of Trustees (the “Board”) of Wells Fargo Variable Trust (the “Trust”) must determine annually whether to approve the continuation of the Trust’s investment management and sub-advisory agreements. In this regard, at an in-person meeting held on May 22-23, 2018 (the “Meeting”), the Board, all the members of which have no direct or indirect interest in the investment management and sub-advisory agreements and are not “interested persons” of the Trust, as defined in the 1940 Act (the “Independent Trustees”), reviewed and approved for Wells Fargo VT Omega Growth Fund (the “Fund”): (i) an investment management agreement (the “Management Agreement”) with Wells Fargo Funds Management, LLC (“Funds Management”); and (ii) an investment sub-advisory agreement (the “Sub-Advisory Agreement”) with Wells Capital Management Incorporated (the “Sub-Adviser”), an affiliate of Funds Management. The Management Agreement and the Sub-Advisory Agreement are collectively referred to as the “Advisory Agreements.”
At the Meeting, the Board considered the factors and reached the conclusions described below relating to the selection of Funds Management and the Sub-Adviser and the approval of the Advisory Agreements. Prior to the Meeting, including at an in-person meeting in April 2018, the Trustees conferred extensively among themselves and with representatives of Funds Management about these matters. Also, the Board has adopted a team-based approach, with each team consisting of a sub-set of Trustees, to assist the full Board in the discharge of its duties in reviewing investment performance and other matters throughout the year. The Independent Trustees were assisted in their evaluation of the Advisory Agreements by independent legal counsel, from whom they received separate legal advice and with whom they met separately.
In providing information to the Board, Funds Management and the Sub-Adviser were guided by a detailed set of requests for information submitted to them by independent legal counsel on behalf of the Independent Trustees at the start of the Board’s annual contract renewal process earlier in 2018. In considering and approving the Advisory Agreements, the Trustees considered the information they believed relevant, including but not limited to the information discussed below. The Board considered not only the specific information presented in connection with the Meeting, but also the knowledge gained over time through interaction with Funds Management and the Sub-Adviser about various topics. In this regard, the Board reviewed reports of Funds Management at each of its quarterly meetings, which included, among other things, portfolio reviews and investment performance reports. In addition, the Board and the teams mentioned above confer with portfolio managers at various times throughout the year. The Board did not identify any particular information or consideration that was all-important or controlling, and each individual Trustee may have attributed different weights to various factors.
After its deliberations, the Board unanimously approved the continuation of the Advisory Agreements for a one-year term and determined that the compensation payable to Funds Management and the Sub-Adviser under each of the Advisory Agreements was reasonable. The Board considered the approval of the Advisory Agreements for the Fund as part of its consideration of agreements for funds across the complex, but its approvals were made on a fund-by-fund basis. The following summarizes a number of important, but not necessarily all, factors considered by the Board in support of its approvals.
Nature, extent and quality of services
The Board received and considered various information regarding the nature, extent and quality of services provided to the Fund by Funds Management and the Sub-Adviser under the Advisory Agreements. This information included a description of the investment advisory services and Fund-level administrative services covered by the Management Agreement, as well as, among other things, a summary of the background and experience of senior management of Wells Fargo Asset Management (“WFAM”), of which Funds Management and the Sub-Adviser are a part, a summary of investments made in the business of WFAM, a summary of certain organizational and personnel changes involving Funds Management and the Sub-Adviser, and a description of Funds Management’s and the Sub-Adviser’s business continuity planning programs and of their approaches to data privacy and cybersecurity. The Board also considered the qualifications, background, tenure and responsibilities of each of the portfolio managers primarily responsible for the day-to-day portfolio management of the Fund.
The Board evaluated the ability of Funds Management and the Sub-Adviser to attract and retain qualified investment professionals, including research, advisory and supervisory personnel. The Board further considered the compliance programs and compliance records of Funds Management and the Sub-Adviser. In addition, the Board took into account the full range of services provided to the Fund by Funds Management and its affiliates.
| | | | |
| 26 | | Wells Fargo VT Omega Growth Fund | | Other information (unaudited) |
Fund investment performance and expenses
The Board considered the investment performance results for the Fund over various time periods ended December 31, 2017. The Board considered these results in comparison to the investment performance of funds in a universe that was determined by Broadridge Inc. (“Broadridge”) to be similar to the Fund (the “Universe”), and in comparison to the Fund’s benchmark index and to other comparative data. Broadridge is an independent provider of investment company data. The Board received a description of the methodology used by Broadridge to select the mutual funds in the performance Universe. The Board noted that the investment performance of the Fund (Administrator Class) was higher than or in range of the average investment performance of the Universe for all periods under review. The Board also noted that the investment performance of the Fund was higher than its benchmark index, the Russell 3000 Growth Index, for the one- and ten-year periods under review, but lower than its benchmark index for the three- and five-year periods under review.
The Board received information concerning, and discussed factors contributing to, the underperformance of the Fund relative to the Universe and benchmark for the periods identified above. The Board took note of the explanations for the relative underperformance during these periods, including with respect to investment decisions and market factors that affected the Fund’s investment performance. The Board also took note of the Fund’s outperformance relative to the Universe and benchmark over the more recent time periods under review.
The Board also received and considered information regarding the Fund’s net operating expense ratios and their various components, including actual management fees, custodian and other non-management fees, and Rule 12b-1 and non-Rule 12b-1 shareholder service fees. The Board considered these ratios in comparison to the median ratios of funds in class-specific expense groups that were determined by Broadridge to be similar to the Fund (the “Groups”). The Board received a description of the methodology used by Broadridge to select the mutual funds in the expense Groups and an explanation of how funds comprising expense groups and their expense ratios may vary from year-to-year. Based on the Broadridge reports, the Board noted that the net operating expense ratios of the Fund were lower than or in range of the median net operating expense ratios of the expense Groups for each share class.
The Board took into account the Fund’s investment performance and expense information provided to it among the factors considered in deciding to re-approve the Advisory Agreements.
Investment management and sub-advisory fee rates
The Board reviewed and considered the contractual fee rates payable by the Fund to Funds Management under the Management Agreement, as well as the contractual fee rates payable by the Fund to Funds Management for class-level administrative services under a Class-Level Administration Agreement, which include, among other things, class-level transfer agency and sub-transfer agency costs (collectively, the “Management Rates”). The Board also reviewed and considered the contractual investment sub-advisory fee rates that are payable by Funds Management to the Sub-Adviser for investment sub-advisory services.
Among other information reviewed by the Board was a comparison of the Fund’s Management Rates with the average contractual investment management fee rates of funds in the expense Groups at a common asset level as well as transfer agency costs of the funds in the expense Groups. The Board noted that the Management Rates of the Fund were lower than the sum of these average rates for the Fund’s expense Groups for all share classes.
The Board also received and considered information about the portion of the total management fee that was retained by Funds Management after payment of the fee to the Sub-Adviser for sub-advisory services. In assessing the reasonableness of this amount, the Board received and evaluated information about the nature and extent of responsibilities retained and risks assumed by Funds Management and not delegated to or assumed by the Sub-Adviser, and about Funds Management’s on-going oversight services. Given the affiliation between Funds Management and the Sub-Adviser, the Board ascribed limited relevance to the allocation of fees between them.
The Board also received and considered information about the nature and extent of services offered and fee rates charged by Funds Management and the Sub-Adviser to other types of clients with investment strategies similar to those of the Fund. In this regard, the Board received information about the significantly greater scope of services, and compliance, reporting and other legal burdens and risks of managing mutual funds compared with those associated with managing assets of non-mutual fund clients such as institutional separate accounts.
Based on its consideration of the factors and information it deemed relevant, including those described here, the Board determined that the compensation payable to Funds Management under the Management Agreement and to the Sub-Adviser under the Sub-Advisory Agreement was reasonable.
| | | | | | |
| Other information (unaudited) | | Wells Fargo VT Omega Growth Fund | | | 27 | |
Profitability
The Board received and considered information concerning the profitability of Funds Management, as well as the profitability of both WFAM and Wells Fargo & Co. (“Wells Fargo”) as a whole, from providing services to the Fund and the fund family as a whole. The Board noted that the Sub-Adviser’s profitability information with respect to providing services to the Fund was subsumed in the WFAM and Wells Fargo profitability analysis.
Funds Management reported on the methodologies and estimates used in calculating profitability, including a description of the methodology used to allocate certain expenses and recent enhancements made to the methodology. Among other things, the Board noted that the levels of profitability reported on a fund-by-fund basis varied widely, depending on factors such as the size and type of fund. Based on its review, the Board did not deem the profits reported by Funds Management, WFAM or Wells Fargo from services provided to the Fund to be at a level that would prevent it from approving the continuation of the Advisory Agreements.
Economies of scale
The Board considered the extent to which Funds Management may experience economies of scale in the provision of management services, and the extent to which scale benefits, if any, would be shared with shareholders. In particular, the Board noted the existence of breakpoints in the Fund’s management fee structure, which operate generally to reduce the Fund’s expense ratios as the Fund grows in size. It considered that, for a small fund or a fund that shrinks in size, breakpoints conversely can result in higher fee levels. The Board also considered that in addition to management fee breakpoints, competitive management fee rates set at the outset without regard to breakpoints and fee waiver and expense reimbursement arrangements, as well as investments in the business intended to enhance services available to Fund shareholders, are means of sharing potential economies of scale with shareholders of the Fund.
The Board concluded that the Fund’s fee and expense arrangements, including contractual breakpoints, constituted a reasonable approach to sharing potential economies of scale with the Fund and its shareholders.
Other benefits to Funds Management and the Sub-Adviser
The Board received and considered information regarding potential “fall-out” or ancillary benefits received by Funds Management and its affiliates, including the Sub-Adviser, as a result of their relationships with the Fund. Ancillary benefits could include, among others, benefits directly attributable to other relationships with the Fund and benefits potentially derived from an increase in Funds Management’s and the Sub-Adviser’s business as a result of their relationships with the Fund. The Board noted that various affiliates of Funds Management may receive distribution-related fees, shareholder servicing payments and sub-transfer agency fees in respect of shares sold or held through them and services provided.
The Board also reviewed information about soft dollar credits earned and utilized by the Sub-Adviser, fees earned by Funds Management and the Sub-Adviser from managing a private investment vehicle for the fund family’s securities lending collateral and commissions earned by an affiliated broker from portfolio transactions.
Based on its consideration of the factors and information it deemed relevant, including those described here, the Board did not find that any ancillary benefits received by Funds Management and its affiliates, including the Sub-Adviser, were unreasonable.
Conclusion
At the Meeting, after considering the above-described factors and based on its deliberations and its evaluation of the information described above, the Board unanimously approved the continuation of the Advisory Agreements for a one-year term and determined that the compensation payable to Funds Management and the Sub-Adviser under each of the Advisory Agreements was reasonable.
This page is intentionally left blank.

For more information
More information about Wells Fargo Funds is available free upon request. To obtain literature, please write, email, visit the Fund’s website, or call:
Wells Fargo Funds
P.O. Box 8266
Boston, MA 02266-8266
Email: fundservice@wellsfargo.com
Website: wellsfargofunds.com
Individual investors: 1-800-222-8222
Retail investment professionals: 1-888-877-9275
Institutional investment professionals: 1-866-765-0778
This report and the financial statements contained herein are submitted for the general information of the shareholders of the Fund. If this report is used for promotional purposes, distribution of the report must be accompanied or preceded by a current prospectus. Before investing, please consider the investment objectives, risks, charges, and expenses of the investment. For a current prospectus and, if available, a summary prospectus, containing this information, call 1-800-260-5969 or visit the Fund’s website at wellsfargofunds.com. Read the prospectus carefully before you invest or send money.
Wells Fargo Asset Management (WFAM) is the trade name for certain investment advisory/management firms owned by Wells Fargo & Company. These firms include but are not limited to Wells Capital Management Incorporated and Wells Fargo Funds Management, LLC. Certain products managed by WFAM entities are distributed by Wells Fargo Funds Distributor, LLC (a broker/dealer and Member FINRA).
This material is for general informational and educational purposes only and is NOT intended to provide investment advice or a recommendation of any kind—including a recommendation for any specific investment, strategy, or plan.
NOT FDIC INSURED ◾ NO BANK GUARANTEE ◾ MAY LOSE VALUE
© 2018 Wells Fargo Funds Management, LLC. All rights reserved.
| | |
| | 314255 08-18 SVT5/SAR142 06-18 |
Semi-Annual Report
June 30, 2018

Wells Fargo VT Opportunity Fund


Reduce clutter. Save trees.
Sign up for electronic delivery of prospectuses and shareholder reports at wellsfargo.com/advantagedelivery
Contents
The views expressed and any forward-looking statements are as of June 30, 2018, unless otherwise noted, and are those of the Fund managers and/or Wells Fargo Funds Management, LLC. Discussions of individual securities, or the markets generally, or any Wells Fargo Fund are not intended as individual recommendations. Future events or results may vary significantly from those expressed in any forward-looking statements. The views expressed are subject to change at any time in response to changing circumstances in the market. Wells Fargo Funds Management, LLC and the Fund disclaim any obligation to publicly update or revise any views expressed or forward-looking statements.
NOT FDIC INSURED ◾ NO BANK GUARANTEE ◾ MAY LOSE VALUE
| | | | |
| 2 | | Wells Fargo VT Opportunity Fund | | Letter to shareholders (unaudited) |

Andrew Owen
President
Wells Fargo Funds
Globally, economies strengthened, equity markets advanced, and foreign bonds outperformed fixed-income investments in the U.S.
During February 2018, the U.S. stock market endured a loss of more than 10% before recovering in March and April.
Dear Shareholder:
We are pleased to offer you this semi-annual report for the Wells Fargo VT Opportunity Fund for the six-month period that ended June 30, 2018. Globally, economies strengthened, equity markets advanced, and foreign bonds outperformed fixed-income investments in the U.S.
For the period, U.S. stocks, as measured by the S&P 500 Index,1 gained 2.65%, and international stocks, as measured by the MSCI ACWI ex USA Index (Net),2 dropped 3.77%. Emerging market stocks, as measured by the MSCI EM Index (Net),3 fell 6.66%. In bond markets, the Bloomberg Barclays U.S. Aggregate Bond Index4 declined 1.62% while fixed-income investments outside the U.S. lost 1.31 %, according to the Bloomberg Barclays Global Aggregate ex-USD Index.5 The Bloomberg Barclays Municipal Bond Index6 fell 0.25%, and the ICE BofAML U.S. High Yield Index7 was up 0.08%.
Volatility reemerged during the first quarter of 2018 as economic signals were mixed.
The first quarter of 2018 began with stock market gains in January after the U.S. announced tax reform measures intended to lower rates for individuals and corporations. Then, investor optimism was supplanted by several concerns. Trade tensions emerged, particularly between the U.S. and China, as the U.S. threatened to impose tariffs on a broad range of imported products. Increasing interest rates and inflation also caused concern. During February 2018, the U.S. stock market endured a loss of more than 10% before recovering in March and April. The S&P 500 Index closed the first quarter with a negative return, the first negative quarterly return for the index since 2014.
The U.S. Federal Reserve (Fed) increased the federal funds rate by 25 basis points (bps; 100 bps equal 1.00%) in March and the rate of inflation reached the Fed’s 2% target for the first time in a year. The unemployment rate fell to 4.1% by March 2018 and wage growth data improved. The third revision of gross domestic product growth for the first quarter by the U.S. Bureau of Economic Analysis released during June was lowered to 2.0%.
Overseas, investment market returns reversed the strong returns of 2017—the MSCI ACWI ex USA Index (Net) gained 27.19% for the 12-month period—falling 0.43% through the end of the second quarter of 2018. Although central banks, including the European Central Bank and the Bank of Japan, maintained low interest rates and quantitative easing measures that are generally supportive of
| 1 | The S&P 500 Index consists of 500 stocks chosen for market size, liquidity, and industry group representation. It is a market-value-weighted index with each stock’s weight in the index proportionate to its market value. You cannot invest directly in an index. |
| 2 | The Morgan Stanley Capital International (MSCI) All Country World Index (ACWI) ex USA Index (Net) is a free-float-adjusted market-capitalization-weighted index that is designed to measure the equity market performance of developed markets, excluding the United States and Canada. Source: MSCI. MSCI makes no express or implied warranties or representations and shall have no liability whatsoever with respect to any MSCI data contained herein. The MSCI data may not be further redistributed or used as a basis for other indices or any securities or financial products. This report is not approved, reviewed, or produced by MSCI. You cannot invest directly in an index. |
| 3 | The MSCI Emerging Markets (EM) Index (Net) is a free-float-adjusted market-capitalization-weighted index that is designed to measure large- and mid-cap equity market performance of emerging markets. The MSCI EM Index (Net) consists of the following 24 emerging market country indices: Brazil, Chile, China, Colombia, Czech Republic, Egypt, Greece, Hungary, India, Indonesia, Korea, Malaysia, Mexico, Pakistan, Peru, the Philippines, Poland, Qatar, Russia, South Africa, Taiwan, Thailand, Turkey, and the United Arab Emirates. You cannot invest directly in an index. |
| 4 | The Bloomberg Barclays U.S. Aggregate Bond Index is a broad-based benchmark that measures the investment-grade, U.S. dollar-denominated, fixed-rate taxable bond market, including Treasuries, government-related and corporate securities, mortgage-backed securities (agency fixed-rate and hybrid adjustable-rate mortgage pass-throughs), asset-backed securities, and commercial mortgage-backed securities. You cannot invest directly in an index. |
| 5 | The Bloomberg Barclays Global Aggregate ex-USD Index is an unmanaged index that provides a broad-based measure of the global investment-grade fixed-income markets excluding the U.S. dollar-denominated debt market. You cannot invest directly in an index. |
| 6 | The Bloomberg Barclays Municipal Bond Index is an unmanaged index composed of long-term tax-exempt bonds with a minimum credit rating of Baa. You cannot invest directly in an index. |
| 7 | The ICE BofAML U.S. High Yield Index is a market-capitalization-weighted index of domestic and Yankee high-yield bonds. The index tracks the performance of high-yield securities traded in the U.S. bond market. You cannot invest directly in an index. Copyright 2018. ICE Data Indices, LLC. All rights reserved. |
| 8 | The Consumer Price Index (CPI) is a measure of the average change over time in the prices paid by urban consumers for a market basket of consumer goods and services. You cannot invest directly in an index. |
| | | | | | |
| Letter to shareholders (unaudited) | | Wells Fargo VT Opportunity Fund | | | 3 | |
businesses and equity markets, the U.S. dollar strengthened relative to local currencies, which served to restrain returns.
Global trade tensions escalated during the second quarter of 2018.
Global trade tensions escalated as the second quarter of 2018 opened and equity markets fell in response before resuming upward momentum later in April. The CPI8 for All Urban Consumers added 0.2% in May after a similar increase in April. On a year-over-year basis, the all-items index rose 2.8% for the 12 months that ended May 31, continuing its upward trend since the beginning of the year. The index for all items less food and energy rose 2.2% for the same 12-month period.
During June 2018, the Fed increased the federal funds rate by another 25 bps. Market expectations increased that the Fed might announce two more rate increases in 2018. The unemployment rate fell to an 18-year low of 3.8% in May and wage growth data improved. Internationally, central banks maintained their low interest rates and monetary policies that were accommodative of business activity.
Interest rates generally increased and the bond markets tended to decline. Long-term interest rates in the U.S. trended higher—rates on the 10-year and 30-year Treasury bonds moved from 2.46% and 2.81%, respectively, at the beginning of the year on January 1, 2018, to 2.85% and 2.98%, respectively, on June 30, 2018, well off their highest levels during the first half of the year of 3.11% and 3.25%, respectively, on May 17, 2018.
Despite the positive economic and business trends globally, international stock values fell and U.S. stock gains moderated during most of the second quarter of 2018 due to escalating tensions as the U.S. imposed tariffs on foreign goods and countries outside of the U.S. imposed tariffs of their own on U.S. products in response.
Don’t let short-term uncertainty derail long-term investment goals.
Periods of investment uncertainty can present challenges, but experience has taught us that maintaining long-term investment goals can be an effective way to plan for the future. To help you create a sound strategy based on your personal goals and risk tolerance, Wells Fargo Funds offers more than 100 mutual funds spanning a wide range of asset classes and investment styles. Although diversification cannot guarantee an investment profit or prevent losses, we believe it can be an effective way to manage investment risk and potentially smooth out overall portfolio performance. We encourage investors to know their investments and to understand that appropriate levels of risk-taking may unlock opportunities.
Thank you for choosing to invest with Wells Fargo Funds. We appreciate your confidence in us and remain committed to helping you meet your financial needs.
Sincerely,

Andrew Owen
President
Wells Fargo Funds
For further information about your Fund, contact your investment professional, visit our website at wellsfargofunds.com, or call us directly at 1-800-260-5969.
| | | | |
| 4 | | Wells Fargo VT Opportunity Fund | | Performance highlights (unaudited) |
Investment objective
The Fund seeks long-term capital appreciation.
Manager
Wells Fargo Funds Management, LLC
Subadviser
Wells Capital Management Incorporated
Portfolio managers
Ann M. Miletti
Christopher J. Miller, CFA®
Average annual total returns (%) as of June 30, 20181
| | | | | | | | | | | | | | | | | | | | | | |
| | | | | | | | Expense ratios2 (%) | |
| | | Inception date | | 1 year | | | 5 year | | | 10 year | | | Gross | | | Net3 | |
| Class 1 | | 8-26-2011 | | | 14.17 | | | | 11.85 | | | | 9.62 | | | | 0.86 | | | | 0.75 | |
| Class 2 | | 5-8-1992 | | | 13.92 | | | | 11.57 | | | | 9.44 | | | | 1.11 | | | | 1.00 | |
| Russell 3000® Index4 | | – | | | 14.78 | | | | 13.29 | | | | 10.23 | | | | – | | | | – | |
Figures quoted represent past performance, which is no guarantee of future results. Investment return and principal value of an investment will fluctuate so that an investor’s shares, when redeemed, may be worth more or less than their original cost. Current performance may be lower or higher than the performance data quoted and assumes the reinvestment of dividends and capital gains. Current month-end performance is available by calling 1-800-260-5969. Performance figures of the Fund do not reflect fees charged pursuant to the terms of variable life insurance policies and variable annuity contracts. If these charges had been reflected, performance would have been lower.
Shares are sold without a front-end sales charge or contingent deferred sales charge.
Index returns do not include transaction costs associated with buying and selling securities, any mutual fund fees or expenses, or any taxes. It is not possible to invest directly in an index.
Stock values fluctuate in response to the activities of individual companies and general market and economic conditions. Smaller-company stocks tend to be more volatile and less liquid than those of larger companies. Certain investment strategies tend to increase the total risk of an investment (relative to the broader market). The Fund is exposed to foreign investment risk. Consult the Fund’s prospectus for additional information on these and other risks.
Please refer to the prospectus provided by your participating insurance company for detailed information describing the separate accounts for information regarding surrender charges, mortality and expense risk fees, and other charges that may be assessed by the participating insurance companies.
Please see footnotes on page 5.
| | | | | | |
| Performance highlights (unaudited) | | Wells Fargo VT Opportunity Fund | | | 5 | |
| | | | |
| Ten largest holdings (%) as of June 30, 20185 | |
Alphabet Incorporated Class C | | | 3.64 | |
E*TRADE Financial Corporation | | | 3.01 | |
Salesforce.com Incorporated | | | 2.87 | |
LivaNova plc | | | 2.81 | |
MasterCard Incorporated Class A | | | 2.46 | |
EOG Resources Incorporated | | | 2.45 | |
Facebook Incorporated Class A | | | 2.32 | |
The Sherwin-Williams Company | | | 2.30 | |
Webster Financial Corporation | | | 2.27 | |
Bio-Rad Laboratories Incorporated Class A | | | 2.12 | |
|
| Sector distribution as of June 30, 20186 |
|
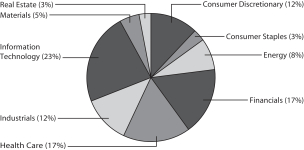 |
| 1 | Historical performance shown for Class 1 shares prior to their inception reflects the performance of Class 2 shares, and includes the higher expenses applicable to Class 2 shares. If these expenses had not been included, returns for Class 1 shares would be higher. |
| 2 | Reflects the expense ratios as stated in the most recent prospectuses. The expense ratios shown are subject to change and may differ from the annualized expense ratios shown in the financial highlights of this report. |
| 3 | The manager has contractually committed through April 30, 2019, to waive fees and/or reimburse expenses to the extent necessary to cap the Fund’s Total Annual Fund Operating Expenses After Fee Waivers at the amounts shown. After this time, the cap may be increased or the commitment to maintain the cap may be terminated only with the approval of the Board of Trustees. Brokerage commissions, stamp duty fees, interest, taxes, acquired fund fees and expenses (if any), and extraordinary expenses are excluded from the expense cap. Without this cap, the Fund’s returns would have been lower. The expense ratio paid by an investor is the net expense ratio (the total annual fund operating expenses after fee waivers) as stated in the prospectuses. |
| 4 | The Russell 3000® Index measures the performance of the 3,000 largest U.S. companies based on total market capitalization, which represents approximately 98% of the investable U.S. equity market. You cannot invest directly in an index. |
| 5 | The ten largest holdings, excluding cash, cash equivalents and any money market funds, are calculated based on the value of the investments divided by total net assets of the Fund. Holdings are subject to change and may have changed since the date specified. |
| 6 | Amounts are calculated based on the total long-term investments of the Fund. These amounts are subject to change and may have changed since the date specified. |
| | | | |
| 6 | | Wells Fargo VT Opportunity Fund | | Fund expenses (unaudited) |
As a shareholder of the Fund, you incur ongoing costs, including management fees, distribution (12b-1) fees, and other Fund expenses. This example is intended to help you understand your ongoing costs (in dollars) of investing in the Fund and to compare these costs with the ongoing costs of investing in other mutual funds.
The example is based on an investment of $1,000 invested at the beginning of the six-month period and held for the entire period from January 1, 2018 to June 30, 2018.
Actual expenses
The “Actual” line of the table below provides information about actual account values and actual expenses. You may use the information in this line, together with the amount you invested, to estimate the expenses that you paid over the period. Simply divide your account value by $1,000 (for example, an $8,600 account value divided by $1,000 = 8.6), then multiply the result by the number in the “Actual” line under the heading entitled “Expenses paid during period” for your applicable class of shares to estimate the expenses you paid on your account during this period.
Hypothetical example for comparison purposes
The “Hypothetical” line of the table below provides information about hypothetical account values and hypothetical expenses based on the Fund’s actual expense ratio and an assumed rate of return of 5% per year before expenses, which is not the Fund’s actual return. The hypothetical account values and expenses may not be used to estimate the actual ending account balance or expenses you paid for the period. You may use this information to compare the ongoing costs of investing in the Fund and other funds. To do so, compare this 5% hypothetical example with the 5% hypothetical examples that appear in the shareholder reports of the other funds.
Please note that the expenses shown in the table are meant to highlight your ongoing costs only and do not reflect any separate account charges assessed by participating insurance companies. Therefore, the “Hypothetical” line of the table is useful in comparing ongoing costs only, and will not help you determine the relative total costs of owning different funds. In addition, if these separate account charges assessed by participating insurance companies were included, your costs would have been higher.
| | | | | | | | | | | | | | | | |
| | | Beginning
account value
1-1-2018 | | | Ending
account value
6-30-2018 | | | Expenses
paid during
the period¹ | | | Annualized net
expense ratio | |
Class 1 | | | | | | | | | | | | | | | | |
Actual | | $ | 1,000.00 | | | $ | 1,089.43 | | | $ | 3.89 | | | | 0.75 | % |
Hypothetical (5% return before expenses) | | $ | 1,000.00 | | | $ | 1,021.08 | | | $ | 3.76 | | | | 0.75 | % |
Class 2 | | | | | | | | | | | | | | | | |
Actual | | $ | 1,000.00 | | | $ | 1,087.96 | | | $ | 5.18 | | | | 1.00 | % |
Hypothetical (5% return before expenses) | | $ | 1,000.00 | | | $ | 1,019.84 | | | $ | 5.01 | | | | 1.00 | % |
| 1 | Expenses paid is equal to the annualized net expense ratio of each class multiplied by the average account value over the period, multiplied by the number of days in the most recent fiscal half-year divided by the number of days in the fiscal year (to reflect the one-half-year period). |
| | | | | | |
| Portfolio of investments—June 30, 2018 (unaudited) | | Wells Fargo VT Opportunity Fund | | | 7 | |
| | | | | | | | | | | | | | | | |
| Security name | | | | | | | | Shares | | | Value | |
| | | | |
Common Stocks: 99.41% | | | | | | | | | | | | | | | | |
| | | | |
Consumer Discretionary: 11.48% | | | | | | | | | | | | | | | | |
| | | | |
| Automobiles: 1.92% | | | | | | | | | | | | | | | | |
General Motors Company | | | | | | | | | | | 93,183 | | | $ | 3,671,410 | |
| | | | | | | | | | | | | | | | |
| | | | |
| Hotels, Restaurants & Leisure: 1.92% | | | | | | | | | | | | | | | | |
Starbucks Corporation | | | | | | | | | | | 75,151 | | | | 3,671,126 | |
| | | | | | | | | | | | | | | | |
| | | | |
| Internet & Direct Marketing Retail: 1.82% | | | | | | | | | | | | | | | | |
Amazon.com Incorporated † | | | | | | | | | | | 2,049 | | | | 3,482,890 | |
| | | | | | | | | | | | | | | | |
| | | | |
| Media: 3.11% | | | | | | | | | | | | | | | | |
Comcast Corporation Class A | | | | | | | | | | | 91,161 | | | | 2,990,992 | |
Twenty-First Century Fox Incorporated Class B | | | | | | | | | | | 59,722 | | | | 2,942,503 | |
| | | | |
| | | | | | | | | | | | | | | 5,933,495 | |
| | | | | | | | | | | | | | | | |
| | | | |
| Multiline Retail: 1.80% | | | | | | | | | | | | | | | | |
Dollar General Corporation | | | | | | | | | | | 34,841 | | | | 3,435,323 | |
| | | | | | | | | | | | | | | | |
| | | | |
| Specialty Retail: 0.91% | | | | | | | | | | | | | | | | |
L Brands Incorporated | | | | | | | | | | | 47,296 | | | | 1,744,276 | |
| | | | | | | | | | | | | | | | |
| | | | |
Consumer Staples: 2.67% | | | | | | | | | | | | | | | | |
| | | | |
| Beverages: 1.42% | | | | | | | | | | | | | | | | |
Molson Coors Brewing Company Class B | | | | | | | | | | | 39,914 | | | | 2,715,749 | |
| | | | | | | | | | | | | | | | |
| | | | |
| Household Products: 1.25% | | | | | | | | | | | | | | | | |
Church & Dwight Company Incorporated | | | | | | | | | | | 45,001 | | | | 2,392,253 | |
| | | | | | | | | | | | | | | | |
| | | | |
Energy: 8.13% | | | | | | | | | | | | | | | | |
| | | | |
| Oil, Gas & Consumable Fuels: 8.13% | | | | | | | | | | | | | | | | |
Concho Resources Incorporated † | | | | | | | | | | | 11,814 | | | | 1,634,467 | |
EOG Resources Incorporated | | | | | | | | | | | 37,664 | | | | 4,686,532 | |
Noble Energy Incorporated | | | | | | | | | | | 93,919 | | | | 3,313,462 | |
Pioneer Natural Resources Company | | | | | | | | | | | 10,694 | | | | 2,023,733 | |
RSP Permian Incorporated † | | | | | | | | | | | 88,075 | | | | 3,877,062 | |
| | | | |
| | | | | | | | | | | | | | | 15,535,256 | |
| | | | | | | | | | | | | | | | |
| | | | |
Financials: 16.70% | | | | | | | | | | | | | | | | |
| | | | |
| Banks: 7.50% | | | | | | | | | | | | | | | | |
KeyCorp | | | | | | | | | | | 190,043 | | | | 3,713,440 | |
Pinnacle Financial Partners Incorporated | | | | | | | | | | | 47,728 | | | | 2,928,113 | |
PNC Financial Services Group Incorporated | | | | | | | | | | | 24,851 | | | | 3,357,370 | |
Webster Financial Corporation | | | | | | | | | | | 67,968 | | | | 4,329,562 | |
| | | | |
| | | | | | | | | | | | | | | 14,328,485 | |
| | | | | | | | | | | | | | | | |
| | | | |
| Capital Markets: 4.68% | | | | | | | | | | | | | | | | |
E*TRADE Financial Corporation † | | | | | | | | | | | 93,911 | | | | 5,743,597 | |
Intercontinental Exchange Incorporated | | | | | | | | | | | 43,493 | | | | 3,198,910 | |
| | | | |
| | | | | | | | | | | | | | | 8,942,507 | |
| | | | | | | | | | | | | | | | |
The accompanying notes are an integral part of these financial statements.
| | | | |
| 8 | | Wells Fargo VT Opportunity Fund | | Portfolio of investments—June 30, 2018 (unaudited) |
| | | | | | | | | | | | | | | | |
| Security name | | | | | | | | Shares | | | Value | |
| | | | |
| Insurance: 4.52% | | | | | | | | | | | | | | | | |
Chubb Limited | | | | | | | | | | | 28,326 | | | $ | 3,597,969 | |
Marsh & McLennan Companies Incorporated | | | | | | | | | | | 29,237 | | | | 2,396,557 | |
Willis Towers Watson plc | | | | | | | | | | | 17,465 | | | | 2,647,694 | |
| | | | |
| | | | | | | | | | | | | | | 8,642,220 | |
| | | | | | | | | | | | | | | | |
| | | | |
Health Care: 17.19% | | | | | | | | | | | | | | | | |
| | | | |
| Biotechnology: 2.03% | | | | | | | | | | | | | | | | |
Alexion Pharmaceuticals Incorporated † | | | | | | | | | | | 11,726 | | | | 1,455,783 | |
Celgene Corporation † | | | | | | | | | | | 30,461 | | | | 2,419,213 | |
| | | | |
| | | | | | | | | | | | | | | 3,874,996 | |
| | | | | | | | | | | | | | | | |
| | | | |
| Health Care Equipment & Supplies: 5.41% | | | | | | | | | | | | | | | | |
LivaNova plc † | | | | | | | | | | | 53,713 | | | | 5,361,632 | |
Medtronic plc | | | | | | | | | | | 33,511 | | | | 2,868,877 | |
Zimmer Biomet Holdings Incorporated | | | | | | | | | | | 19,052 | | | | 2,123,155 | |
| | | | |
| | | | | | | | | | | | | | | 10,353,664 | |
| | | | | | | | | | | | | | | | |
| | | | |
| Health Care Providers & Services: 1.21% | | | | | | | | | | | | | | | | |
Cigna Corporation | | | | | | | | | | | 13,632 | | | | 2,316,758 | |
| | | | | | | | | | | | | | | | |
| | | | |
| Health Care Technology: 0.61% | | | | | | | | | | | | | | | | |
Cerner Corporation † | | | | | | | | | | | 19,392 | | | | 1,159,448 | |
| | | | | | | | | | | | | | | | |
| | | | |
| Life Sciences Tools & Services: 4.68% | | | | | | | | | | | | | | | | |
Agilent Technologies Incorporated | | | | | | | | | | | 37,094 | | | | 2,293,893 | |
Bio-Rad Laboratories Incorporated Class A † | | | | | | | | | | | 14,012 | | | | 4,043,022 | |
Thermo Fisher Scientific Incorporated | | | | | | | | | | | 12,578 | | | | 2,605,407 | |
| | | | |
| | | | | | | | | | | | | | | 8,942,322 | |
| | | | | | | | | | | | | | | | |
| | | | |
| Pharmaceuticals: 3.25% | | | | | | | | | | | | | | | | |
Mylan NV † | | | | | | | | | | | 60,981 | | | | 2,203,853 | |
Novartis AG ADR | | | | | | | | | | | 53,140 | | | | 4,014,196 | |
| | | | |
| | | | | | | | | | | | | | | 6,218,049 | |
| | | | | | | | | | | | | | | | |
| | | | |
Industrials: 12.35% | | | | | | | | | | | | | | | | |
| | | | |
| Aerospace & Defense: 4.82% | | | | | | | | | | | | | | | | |
Airbus SE | | | | | | | | | | | 31,738 | | | | 3,703,659 | |
Lockheed Martin Corporation | | | | | | | | | | | 11,363 | | | | 3,356,971 | |
Safran SA | | | | | | | | | | | 17,819 | | | | 2,157,967 | |
| | | | |
| | | | | | | | | | | | | | | 9,218,597 | |
| | | | | | | | | | | | | | | | |
| | | | |
| Airlines: 1.86% | | | | | | | | | | | | | | | | |
Delta Air Lines Incorporated | | | | | | | | | | | 21,524 | | | | 1,066,299 | |
United Continental Holdings Incorporated † | | | | | | | | | | | 35,829 | | | | 2,498,356 | |
| | | | |
| | | | | | | | | | | | | | | 3,564,655 | |
| | | | | | | | | | | | | | | | |
| | | | |
| Building Products: 1.22% | | | | | | | | | | | | | | | | |
Fortune Brands Home & Security Incorporated | | | | | | | | | | | 43,464 | | | | 2,333,582 | |
| | | | | | | | | | | | | | | | |
The accompanying notes are an integral part of these financial statements.
| | | | | | |
| Portfolio of investments—June 30, 2018 (unaudited) | | Wells Fargo VT Opportunity Fund | | | 9 | |
| | | | | | | | | | | | | | | | |
| Security name | | | | | | | | Shares | | | Value | |
| | | | |
| Commercial Services & Supplies: 1.24% | | | | | | | | | | | | | | | | |
Republic Services Incorporated | | | | | | | | | | | 34,561 | | | $ | 2,362,590 | |
| | | | | | | | | | | | | | | | |
| | | | |
| Machinery: 2.72% | | | | | | | | | | | | | | | | |
Gardner Denver Holdings Incorporated † | | | | | | | | | | | 93,991 | | | | 2,762,395 | |
The Timken Company | | | | | | | | | | | 55,861 | | | | 2,432,747 | |
| | | | |
| | | | | | | | | | | | | | | 5,195,142 | |
| | | | | | | | | | | | | | | | |
| | | | |
| Road & Rail: 0.49% | | | | | | | | | | | | | | | | |
Hertz Global Holdings Incorporated Ǡ | | | | | | | | | | | 60,534 | | | | 928,592 | |
| | | | | | | | | | | | | | | | |
| | | | |
Information Technology: 23.26% | | | | | | | | | | | | | | | | |
| | | | |
| Electronic Equipment, Instruments & Components: 1.64% | | | | | | | | | | | | | | | | |
Amphenol Corporation Class A | | | | | | | | | | | 36,086 | | | | 3,144,895 | |
| | | | | | | | | | | | | | | | |
| | | | |
| Internet Software & Services: 5.96% | | | | | | | | | | | | | | | | |
Alphabet Incorporated Class C † | | | | | | | | | | | 6,241 | | | | 6,962,769 | |
Facebook Incorporated Class A † | | | | | | | | | | | 22,850 | | | | 4,440,212 | |
| | | | |
| | | | | | | | | | | | | | | 11,402,981 | |
| | | | | | | | | | | | | | | | |
| | | | |
| IT Services: 4.13% | | | | | | | | | | | | | | | | |
Fidelity National Information Services Incorporated | | | | | | | | | | | 30,029 | | | | 3,183,975 | |
MasterCard Incorporated Class A | | | | | | | | | | | 23,942 | | | | 4,705,082 | |
| | | | |
| | | | | | | | | | | | | | | 7,889,057 | |
| | | | | | | | | | | | | | | | |
| | | | |
| Semiconductors & Semiconductor Equipment: 3.74% | | | | | | | | | | | | | | | | |
Broadcom Incorporated | | | | | | | | | | | 12,828 | | | | 3,112,586 | |
Texas Instruments Incorporated | | | | | | | | | | | 36,546 | | | | 4,029,197 | |
| | | | |
| | | | | | | | | | | | | | | 7,141,783 | |
| | | | | | | | | | | | | | | | |
| | | | |
| Software: 5.79% | | | | | | | | | | | | | | | | |
Oracle Corporation | | | | | | | | | | | 82,129 | | | | 3,618,604 | |
Red Hat Incorporated † | | | | | | | | | | | 14,567 | | | | 1,957,368 | |
Salesforce.com Incorporated † | | | | | | | | | | | 40,206 | | | | 5,484,098 | |
| | | | |
| | | | | | | | | | | | | | | 11,060,070 | |
| | | | | | | | | | | | | | | | |
| | | | |
| Technology Hardware, Storage & Peripherals: 2.00% | | | | | | | | | | | | | | | | |
Apple Incorporated | | | | | | | | | | | 20,675 | | | | 3,827,149 | |
| | | | | | | | | | | | | | | | |
| | | | |
Materials: 4.97% | | | | | | | | | | | | | | | | |
| | | | |
| Chemicals: 2.30% | | | | | | | | | | | | | | | | |
The Sherwin-Williams Company | | | | | | | | | | | 10,799 | | | | 4,401,348 | |
| | | | | | | | | | | | | | | | |
| | | | |
| Metals & Mining: 2.67% | | | | | | | | | | | | | | | | |
Goldcorp Incorporated | | | | | | | | | | | 143,337 | | | | 1,965,150 | |
Steel Dynamics Incorporated | | | | | | | | | | | 68,160 | | | | 3,131,952 | |
| | | | |
| | | | | | | | | | | | | | | 5,097,102 | |
| | | | | | | | | | | | | | | | |
The accompanying notes are an integral part of these financial statements.
| | | | |
| 10 | | Wells Fargo VT Opportunity Fund | | Portfolio of investments—June 30, 2018 (unaudited) |
| | | | | | | | | | | | | | | | |
| Security name | | | | | | | | Shares | | | Value | |
| | | | |
Real Estate: 2.66% | | | | | | | | | | | | | | | | |
| | | | |
| Equity REITs: 2.66% | | | | | | | | | | | | | | | | |
American Tower Corporation | | | | | | | | | | | 17,133 | | | $ | 2,470,065 | |
Equinix Incorporated | | | | | | | | | | | 6,065 | | | | 2,607,283 | |
| | | | |
| | | | | | | | | | | | | | | 5,077,348 | |
| | | | | | | | | | | | | | | | |
| | | | |
Total Common Stocks (Cost $143,176,035) | | | | | | | | | | | | | | | 190,005,118 | |
| | | | | | | | | | | | | | | | |
| | | | |
| | | Yield | | | | | | | | | | |
| Short-Term Investments: 1.44% | | | | | | | | | | | | | | | | |
| | | | |
| Investment Companies: 1.44% | | | | | | | | | | | | | | | | |
Securities Lending Cash Investment LLC (l)(r)(u) | | | 2.09 | % | | | | | | | 940,181 | | | | 940,275 | |
Wells Fargo Government Money Market Fund Select Class (l)(u) | | | 1.83 | | | | | | | | 1,817,407 | | | | 1,817,407 | |
| | | | |
Total Short-Term Investments (Cost $2,757,682) | | | | | | | | | | | | | | | 2,757,682 | |
| | | | | | | | | | | | | | | | |
| | | | | | | | |
| Total investments in securities (Cost $145,933,717) | | | 100.85 | % | | | 192,762,800 | |
Other assets and liabilities, net | | | (0.85 | ) | | | (1,616,956 | ) |
| | | | | | | | |
| Total net assets | | | 100.00 | % | | $ | 191,145,844 | |
| | | | | | | | |
| † | Non-income-earning security |
| « | All or a portion of this security is on loan. |
| (l) | The issuer of the security is an affiliated person of the Fund as defined in the Investment Company Act of 1940. |
| (r) | The investment is a non-registered investment company purchased with cash collateral received from securities on loan. |
| (u) | The rate represents the 7-day annualized yield at period end. |
Abbreviations:
| ADR | American depositary receipt |
| REIT | Real estate investment trust |
Investments in Affiliates
An affiliated investment is an investment in which the Fund owns at least 5% of the outstanding voting shares of the issuer or as a result of other relationships, such as the Fund and the issuer having the same investment manager. Transactions with issuers that were either affiliated persons of the Fund at the beginning of the period or the end of the period were as follows:
| | | | | | | | | | | | | | | | | | | | | | | | | | | | | | | | | | | | |
| | | Shares,
beginning of
period | | | Shares
purchased | | | Shares
sold | | | Shares,
end of
period | | | Net
realized
gains
(losses) | | | Net
change in
unrealized
gains
(losses) | | | Income
from
affiliated
securities | | | Value,
end
of period | | | % of
net
assets | |
Short-Term Investments | | | | | | | | | | | | | | | | | | | | | | | | | | | | | | | | | | | | |
Investment Companies | | | | | | | | | | | | | | | | | | | | | | | | | | | | | | | | | | | | |
Securities Lending Cash Investment LLC | | | 1,834,271 | | | | 16,963,336 | | | | 17,857,426 | | | | 940,181 | | | $ | 0 | | | $ | 0 | | | $ | 3,299 | | | $ | 940,275 | | | | | |
Wells Fargo Government Money Market Fund Select Class | | | 1,281,721 | | | | 25,338,111 | | | | 24,802,425 | | | | 1,817,407 | | | | 0 | | | | 0 | | | | 13,216 | | | | 1,817,407 | | | | | |
| | | | | | | | | | | | | | | | | | | | | | | | | | | | | | | | | | | | |
| | | | | | | | | | | | | | | | | | $ | 0 | | | $ | 0 | | | $ | 16,515 | | | $ | 2,757,682 | | | | 1.44 | % |
| | | | | | | | | | | | | | | | | | | | | | | | | | | | | | | | | | | | |
The accompanying notes are an integral part of these financial statements.
| | | | | | |
| Statement of assets and liabilities—June 30, 2018 (unaudited) | | Wells Fargo VT Opportunity Fund | | | 11 | |
| | | | |
| | | | |
| |
Assets | | | | |
Investments in unaffiliated securities (including $918,186 of securities loaned), at value (cost $143,176,035) | | $ | 190,005,118 | |
Investments in affiliated securities, at value (cost $2,757,682) | | | 2,757,682 | |
Receivable for Fund shares sold | | | 3,105 | |
Receivable for dividends | | | 138,161 | |
Receivable for securities lending income | | | 269 | |
Prepaid expenses and other assets | | | 1,458 | |
| | | | |
Total assets | | | 192,905,793 | |
| | | | |
| |
Liabilities | | | | |
Payable upon receipt of securities loaned | | | 940,064 | |
Payable for investments purchased | | | 433,074 | |
Payable for Fund shares redeemed | | | 199,708 | |
Management fee payable | | | 102,520 | |
Distribution fee payable | | | 34,325 | |
Administration fees payable | | | 13,238 | |
Trustees’ fees and expenses payable | | | 1,973 | |
Accrued expenses and other liabilities | | | 35,047 | |
| | | | |
Total liabilities | | | 1,759,949 | |
| | | | |
Total net assets | | $ | 191,145,844 | |
| | | | |
| |
NET ASSETS CONSIST OF | | | | |
Paid-in capital | | $ | 115,237,220 | |
Undistributed net investment income | | | 1,393,873 | |
Accumulated net realized gains on investments | | | 27,685,668 | |
Net unrealized gains on investments | | | 46,829,083 | |
| | | | |
Total net assets | | $ | 191,145,844 | |
| | | | |
| |
COMPUTATION OF NET ASSET VALUE PER SHARE | | | | |
Net assets – Class 1 | | $ | 32,630,050 | |
Shares outstanding – Class 11 | | | 1,170,689 | |
Net asset value per share – Class 1 | | | $27.87 | |
Net assets – Class 2 | | $ | 158,515,794 | |
Shares outstanding – Class 21 | | | 5,675,247 | |
Net asset value per share – Class 2 | | | $27.93 | |
| 1 | The Fund has an unlimited number of authorized shares. |
The accompanying notes are an integral part of these financial statements.
| | | | |
| 12 | | Wells Fargo VT Opportunity Fund | | Statement of operations—six months ended June 30, 2018 (unaudited) |
| | | | |
| | | | |
| |
Investment income | | | | |
Dividends (net of foreign withholding taxes of $39,320) | | $ | 1,877,976 | |
Income from affiliated securities | | | 16,515 | |
| | | | |
Total investment income | | | 1,894,491 | |
| | | | |
| |
Expenses | | | | |
Management fee | | | 681,822 | |
Administration fees | | | | |
Class 1 | | | 13,207 | |
Class 2 | | | 64,715 | |
Distribution fee | | | | |
Class 2 | | | 202,235 | |
Custody and accounting fees | | | 6,013 | |
Professional fees | | | 24,261 | |
Shareholder report expenses | | | 13,008 | |
Trustees’ fees and expenses | | | 9,997 | |
Other fees and expenses | | | 3,851 | |
| | | | |
Total expenses | | | 1,019,109 | |
Less: Fee waivers and/or expense reimbursements | | | (86,350 | ) |
| | | | |
Net expenses | | | 932,759 | |
| | | | |
Net investment income | | | 961,732 | |
| | | | |
| |
REALIZED AND UNREALIZED GAINS (LOSSES) ON INVESTMENTS | | | | |
Net realized gains on investments | | | 10,626,885 | |
Net change in unrealized gains (losses) on investments | | | (5,800,961 | ) |
| | | | |
Net realized and unrealized gains (losses) on investments | | | 4,825,924 | |
| | | | |
Net increase in net assets resulting from operations | | $ | 5,787,656 | |
| | | | |
The accompanying notes are an integral part of these financial statements.
| | | | | | |
| Statement of changes in net assets | | Wells Fargo VT Opportunity Fund | | | 13 | |
| | | | | | | | | | | | | | | | |
| | | Six months ended
June 30, 2018 (unaudited) | | | Year ended
December 31, 2017 | |
| | | | |
Operations | | | | | | | | | | | | | | | | |
Net investment income | | | | | | $ | 961,732 | | | | | | | $ | 440,303 | |
Net realized gains on investments | | | | | | | 10,626,885 | | | | | | | | 18,015,602 | |
Net change in unrealized gains (losses) on investments | | | | | | | (5,800,961 | ) | | | | | | | 18,001,678 | |
| | | | |
Net increase in net assets resulting from operations | | | | | | | 5,787,656 | | | | | | | | 36,457,583 | |
| | | | |
| | | | |
Distributions to shareholders from | | | | | | | | | | | | | | | | |
Net investment income | | | | | | | | | | | | | | | | |
Class 1 | | | | | | | 0 | | | | | | | | (307,324 | ) |
Class 2 | | | | | | | 0 | | | | | | | | (1,087,465 | ) |
Net realized gains | | | | | | | | | | | | | | | | |
Class 1 | | | | | | | 0 | | | | | | | | (2,694,738 | ) |
Class 2 | | | | | | | 0 | | | | | | | | (13,073,633 | ) |
| | | | |
Total distributions to shareholders | | | | | | | 0 | | | | | | | | (17,163,160 | ) |
| | | | |
| | | | |
Capital share transactions | | | Shares | | | | | | | | Shares | | | | | |
Proceeds from shares sold | | | | | | | | | | | | | | | | |
Class 1 | | | 6,867 | | | | 183,562 | | | | 8,545 | | | | 222,675 | |
Class 2 | | | 44,902 | | | | 1,242,292 | | | | 140,928 | | | | 3,674,333 | |
| | | | |
| | | | | | | 1,425,854 | | | | | | | | 3,897,008 | |
| | | | |
Reinvestment of distributions | | | | | | | | | | | | | | | | |
Class 1 | | | 0 | | | | 0 | | | | 120,130 | | | | 3,002,062 | |
Class 2 | | | 0 | | | | 0 | | | | 564,187 | | | | 14,161,098 | |
| | | | |
| | | | | | | 0 | | | | | | | | 17,163,160 | |
| | | | |
Payment for shares redeemed | | | | | | | | | | | | | | | | |
Class 1 | | | (87,387 | ) | | | (2,415,556 | ) | | | (220,389 | ) | | | (5,708,178 | ) |
Class 2 | | | (486,056 | ) | | | (13,486,940 | ) | | | (1,024,313 | ) | | | (26,629,848 | ) |
| | | | |
| | | | | | | (15,902,496 | ) | | | | | | | (32,338,026 | ) |
| | | | |
Net decrease in net assets resulting from capital share transactions | | | | | | | (14,476,642 | ) | | | | | | | (11,277,858 | ) |
| | | | |
Total increase (decrease) in net assets | | | | | | | (8,688,986 | ) | | | | | | | 8,016,565 | |
| | | | |
| | | | |
Net assets | | | | | | | | | | | | | | | | |
Beginning of period | | | | | | | 199,834,830 | | | | | | | | 191,818,265 | |
| | | | |
End of period | | | | | | $ | 191,145,844 | | | | | | | $ | 199,834,830 | |
| | | | |
Undistributed net investment income | | | | | | $ | 1,393,873 | | | | | | | $ | 432,141 | |
| | | | |
The accompanying notes are an integral part of these financial statements.
| | | | |
| 14 | | Wells Fargo VT Opportunity Fund | | Financial highlights |
(For a share outstanding throughout each period)
| | | | | | | | | | | | | | | | | | | | | | | | |
| | | Six months ended
June 30, 2018 (unaudited) | | | Year ended December 31 | |
| CLASS 1 | | 2017 | | | 2016 | | | 2015 | | | 2014 | | | 2013 | |
Net asset value, beginning of period | | | $27.05 | | | | $24.60 | | | | $25.00 | | | | $28.82 | | | | $26.11 | | | | $20.02 | |
Net investment income | | | 0.16 | 1 | | | 0.13 | | | | 0.22 | | | | 0.57 | | | | 0.10 | | | | 0.08 | |
Net realized and unrealized gains (losses) on investments | | | 0.66 | | | | 4.77 | | | | 2.59 | | | | (1.28 | ) | | | 2.69 | | | | 6.11 | |
| | | | | | | | | | | | | | | | | | | | | | | | |
Total from investment operations | | | 0.82 | | | | 4.90 | | | | 2.81 | | | | (0.71 | ) | | | 2.79 | | | | 6.19 | |
Distributions to shareholders from | | | | | | | | | | | | | | | | | | | | | | | | |
Net investment income | | | 0.00 | | | | (0.25 | ) | | | (0.60 | ) | | | (0.12 | ) | | | (0.08 | ) | | | (0.10 | ) |
Net realized gains | | | 0.00 | | | | (2.20 | ) | | | (2.61 | ) | | | (2.99 | ) | | | 0.00 | | | | 0.00 | |
| | | | | | | | | | | | | | | | | | | | | | | | |
Total distributions to shareholders | | | 0.00 | | | | (2.45 | ) | | | (3.21 | ) | | | (3.11 | ) | | | (0.08 | ) | | | (0.10 | ) |
Net asset value, end of period | | | $27.87 | | | | $27.05 | | | | $24.60 | | | | $25.00 | | | | $28.82 | | | | $26.11 | |
Total return2 | | | 3.03 | % | | | 20.72 | % | | | 12.52 | % | | | (2.85 | )% | | | 10.70 | % | | | 30.99 | % |
Ratios to average net assets (annualized) | | | | | | | | | | | | | | | | | | | | | | | | |
Gross expenses | | | 0.84 | % | | | 0.86 | % | | | 0.85 | % | | | 0.84 | % | | | 0.82 | % | | | 0.84 | % |
Net expenses | | | 0.75 | % | | | 0.75 | % | | | 0.75 | % | | | 0.75 | % | | | 0.75 | % | | | 0.75 | % |
Net investment income | | | 1.20 | % | | | 0.43 | % | | | 0.65 | % | | | 2.02 | % | | | 0.37 | % | | | 0.32 | % |
Supplemental data | | | | | | | | | | | | | | | | | | | | | | | | |
Portfolio turnover rate | | | 15 | % | | | 36 | % | | | 47 | % | | | 41 | % | | | 33 | % | | | 26 | % |
Net assets, end of period (000s omitted) | | | $32,630 | | | | $33,843 | | | | $33,035 | | | | $35,539 | | | | $42,178 | | | | $44,636 | |
| 1 | Calculated based upon average shares outstanding |
| 2 | Returns for periods of less than one year are not annualized. Performance figures of the Fund do not reflect fees charged pursuant to the terms of variable life insurance policies and variable annuity contracts. |
The accompanying notes are an integral part of these financial statements.
| | | | | | |
| Financial highlights | | Wells Fargo VT Opportunity Fund | | | 15 | |
(For a share outstanding throughout each period)
| | | | | | | | | | | | | | | | | | | | | | | | |
| | | Six months ended
June 30, 2018 (unaudited) | | | Year ended December 31 | |
| CLASS 2 | | 2017 | | | 2016 | | | 2015 | | | 2014 | | | 2013 | |
Net asset value, beginning of period | | | $27.14 | | | | $24.67 | | | | $25.05 | | | | $28.86 | | | | $26.15 | | | | $20.05 | |
Net investment income | | | 0.13 | 1 | | | 0.06 | | | | 0.13 | | | | 0.50 | | | | 0.04 | | | | 0.02 | |
Net realized and unrealized gains (losses) on investments | | | 0.66 | | | | 4.79 | | | | 2.63 | | | | (1.28 | ) | | | 2.69 | | | | 6.13 | |
| | | | | | | | | | | | | | | | | | | | | | | | |
Total from investment operations | | | 0.79 | | | | 4.85 | | | | 2.76 | | | | (0.78 | ) | | | 2.73 | | | | 6.15 | |
Distributions to shareholders from | | | | | | | | | | | | | | | | | | | | | | | | |
Net investment income | | | 0.00 | | | | (0.18 | ) | | | (0.53 | ) | | | (0.04 | ) | | | (0.02 | ) | | | (0.05 | ) |
Net realized gains | | | 0.00 | | | | (2.20 | ) | | | (2.61 | ) | | | (2.99 | ) | | | 0.00 | | | | 0.00 | |
| | | | | | | | | | | | | | | | | | | | | | | | |
Total distributions to shareholders | | | 0.00 | | | | (2.38 | ) | | | (3.14 | ) | | | (3.03 | ) | | | (0.02 | ) | | | (0.05 | ) |
Net asset value, end of period | | | $27.93 | | | | $27.14 | | | | $24.67 | | | | $25.05 | | | | $28.86 | | | | $26.15 | |
Total return2 | | | 2.91 | % | | | 20.44 | % | | | 12.23 | % | | | (3.08 | )% | | | 10.42 | % | | | 30.68 | % |
Ratios to average net assets (annualized) | | | | | | | | | | | | | | | | | | | | | | | | |
Gross expenses | | | 1.09 | % | | | 1.11 | % | | | 1.10 | % | | | 1.09 | % | | | 1.07 | % | | | 1.09 | % |
Net expenses | | | 1.00 | % | | | 1.00 | % | | | 1.00 | % | | | 1.00 | % | | | 1.00 | % | | | 1.00 | % |
Net investment income | | | 0.94 | % | | | 0.18 | % | | | 0.39 | % | | | 1.76 | % | | | 0.12 | % | | | 0.07 | % |
Supplemental data | | | | | | | | | | | | | | | | | | | | | | | | |
Portfolio turnover rate | | | 15 | % | | | 36 | % | | | 47 | % | | | 41 | % | | | 33 | % | | | 26 | % |
Net assets, end of period (000s omitted) | | | $158,516 | | | | $165,992 | | | | $158,783 | | | | $169,090 | | | | $201,347 | | | | $211,077 | |
| 1 | Calculated based upon average shares outstanding |
| 2 | Returns for periods of less than one year are not annualized. Performance figures of the Fund do not reflect fees charged pursuant to the terms of variable life insurance policies and variable annuity contracts. |
The accompanying notes are an integral part of these financial statements.
| | | | |
| 16 | | Wells Fargo VT Opportunity Fund | | Notes to financial statements (unaudited) |
1. ORGANIZATION
Wells Fargo Variable Trust (the “Trust”), a Delaware statutory trust organized on March 10, 1999, is an open-end management investment company registered under the Investment Company Act of 1940, as amended (the “1940 Act”). As an investment company, the Trust follows the accounting and reporting guidance in Financial Accounting Standards Board Accounting Standards Codification Topic 946, Financial Services – Investment Companies. These financial statements report on the Wells Fargo VT Opportunity Fund (the “Fund”) which is a diversified series of the Trust. The Trust offers shares of the Fund to separate accounts of various life insurance companies as funding vehicles for certain variable annuity contracts and variable life insurance policies.
2. SIGNIFICANT ACCOUNTING POLICIES
The following significant accounting policies, which are consistently followed in the preparation of the financial statements of the Fund, are in conformity with U.S. generally accepted accounting principles which require management to make estimates and assumptions that affect the reported amounts of assets and liabilities, disclosure of contingent assets and liabilities at the date of the financial statements, and the reported amounts of revenues and expenses during the reporting period. Actual results could differ from those estimates.
Securities valuation
All investments are valued each business day as of the close of regular trading on the New York Stock Exchange (generally 4 p.m. Eastern Time), although the Fund may deviate from this calculation time under unusual or unexpected circumstances.
Equity securities that are listed on a foreign or domestic exchange or market are valued at the official closing price or, if none, the last sales price. If no sale occurs on the principal exchange or market that day, a fair value price will be determined in accordance with the Fund’s Valuation Procedures.
The values of securities denominated in foreign currencies are translated into U.S. dollars at rates provided by an independent foreign currency pricing source at a time each business day specified by the Wells Fargo Asset Management Pricing Committee at Wells Fargo Funds Management, LLC (“Funds Management”)
Many securities markets and exchanges outside the U.S. close prior to the close of the New York Stock Exchange and therefore may not fully reflect trading or events that occur after the close of the principal exchange in which the foreign securities are traded, but before the close of the New York Stock Exchange. If such trading or events are expected to materially affect the value of such securities, then fair value pricing procedures approved by the Board of Trustees of the Fund are applied. These procedures take into account multiple factors including movements in U.S. securities markets after foreign exchanges close. Foreign securities that are fair valued under these procedures are categorized as Level 2 and the application of these procedures may result in transfers between Level 1 and Level 2. Depending on market activity, such fair valuations may be frequent. Such fair value pricing may result in net asset values that are higher or lower than net asset values based on the last reported sales price or latest quoted bid price. On June 30, 2018, such fair value pricing was used in pricing certain foreign securities.
Investments in registered open-end investment companies are valued at net asset value. Interests in non-registered investment companies that are redeemable at net asset value are fair valued normally at net asset value.
Investments which are not valued using any of the methods discussed above are valued at their fair value, as determined in good faith by the Board of Trustees. The Board of Trustees has established a Valuation Committee comprised of the Trustees and has delegated to it the authority to take any actions regarding the valuation of portfolio securities that the Valuation Committee deems necessary or appropriate, including determining the fair value of portfolio securities, unless the determination has been delegated to the Wells Fargo Asset Management Pricing Committee. The Board of Trustees retains the authority to make or ratify any valuation decisions or approve any changes to the Valuation Procedures as it deems appropriate. On a quarterly basis, the Board of Trustees receives reports on any valuation actions taken by the Valuation Committee or the Wells Fargo Asset Management Pricing Committee which may include items for ratification.
Valuations of fair valued securities are compared to the next actual sales price when available, or other appropriate market values, to assess the continued appropriateness of the fair valuation methodologies used. These securities are fair valued on a day-to-day basis, taking into consideration changes to appropriate market information and any significant changes to the inputs considered in the valuation process until there is a readily available price provided on an exchange or by an independent pricing service. Valuations received from an independent pricing service or independent broker-dealer quotes are periodically validated by comparisons to most recent trades and valuations provided by other independent pricing services in addition to the review of prices by the manager and/or subadviser. Unobservable inputs used in determining fair valuations are identified based on the type of security, taking into consideration factors utilized by market participants in valuing the investment, knowledge about the issuer and the current market environment.
| | | | | | |
| Notes to financial statements (unaudited) | | Wells Fargo VT Opportunity Fund | | | 17 | |
Foreign currency translation
The accounting records of the Fund are maintained in U.S. dollars. The values of other assets and liabilities denominated in foreign currencies are translated into U.S. dollars at rates provided by an independent foreign currency pricing source at a time each business day specified by the Wells Fargo Asset Management Pricing Committee. Purchases and sales of securities, and income and expenses are converted at the rate of exchange on the respective dates of such transactions. Net realized foreign exchange gains or losses arise from sales of foreign currencies, currency gains or losses realized between the trade and settlement dates on securities transactions, and the difference between the amounts of dividends, interest and foreign withholding taxes recorded and the U.S. dollar equivalent of the amounts actually paid or received. Net unrealized foreign exchange gains and losses arise from changes in the fair value of assets and liabilities other than investments in securities resulting from changes in exchange rates. The changes in net assets arising from changes in exchange rates of securities and the changes in net assets resulting from changes in market prices of securities are not separately presented. Such changes are included in net realized and unrealized gains or losses from investments.
Securities lending
The Fund may lend its securities from time to time in order to earn additional income in the form of fees or interest on securities received as collateral or the investment of any cash received as collateral. The Fund continues to receive interest or dividends on the securities loaned. The Fund receives collateral in the form of cash or securities with a value at least equal to the value of the securities on loan. The value of the loaned securities is determined at the close of each business day and any additional required collateral is delivered to the Fund on the next business day. In a securities lending transaction, the net asset value of the Fund will be affected by an increase or decrease in the value of the securities loaned and by an increase or decrease in the value of the instrument in which collateral is invested. The amount of securities lending activity undertaken by the Fund fluctuates from time to time. In the event of default or bankruptcy by the borrower, the Fund may be prevented from recovering the loaned securities or gaining access to the collateral or may experience delays or costs in doing so. In addition, the investment of any cash collateral received may lose all or part of its value. The Fund has the right under the lending agreement to recover the securities from the borrower on demand.
The Fund lends its securities through an unaffiliated securities lending agent. Cash collateral received in connection with its securities lending transactions is invested in Securities Lending Cash Investments, LLC (the “Securities Lending Fund”). The Securities Lending Fund is exempt from registration under Section 3(c)(7) of the 1940 Act and is managed by Funds Management and is subadvised by Wells Capital Management Incorporated (“WellsCap”), an affiliate of Funds Management and an indirect wholly owned subsidiary of Wells Fargo & Company (“Wells Fargo”). Funds Management receives an advisory fee starting at 0.05% and declining to 0.01% as the average daily net assets of the Securities Lending Fund increase. All of the fees received by Funds Management are paid to WellsCap for its services as subadviser. The Securities Lending Fund seeks to provide a positive return compared to the daily Fed Funds Open Rate by investing in high-quality, U.S. dollar-denominated short-term money market instruments. Securities Lending Fund investments are valued at the evaluated bid price provided by an independent pricing service. Income earned from investment in the Securities Lending Fund, if any, is included in income from affiliated securities on the Statement of Operations.
Security transactions and income recognition
Securities transactions are recorded on a trade date basis. Realized gains or losses are recorded on the basis of identified cost.
Dividend income is recognized on the ex-dividend date. Dividend income is recorded net of foreign taxes withheld where recovery of such taxes is not assured.
Distributions to shareholders
Distributions to shareholders from net investment income and any net realized gains are recorded on the ex-dividend date and paid at least annually. Such distributions are determined in accordance with income tax regulations and may differ from U.S. generally accepted accounting principles. Dividend sources are estimated at the time of declaration. The tax character of distributions is determined as of the Fund’s fiscal year end. Therefore, a portion of the Fund’s distributions made prior to the Fund’s fiscal year end may be categorized as a tax return of capital at year end.
Federal and other taxes
The Fund intends to continue to qualify as a regulated investment company by distributing substantially all of its investment company taxable income and any net realized capital gains (after reduction for capital loss carryforwards) sufficient to relieve it from all, or substantially all, federal income taxes. Accordingly, no provision for federal income taxes was required.
The Fund’s income and federal excise tax returns and all financial records supporting those returns for the prior three fiscal years are subject to examination by the federal and Delaware revenue authorities. Management has analyzed the Fund’s tax positions taken on federal, state, and foreign tax returns for all open tax years and does not believe that there are any uncertain tax positions that require recognition of a tax liability.
| | | | |
| 18 | | Wells Fargo VT Opportunity Fund | | Notes to financial statements (unaudited) |
As of June 30, 2018, the aggregate cost of all investments for federal income tax purposes was $146,329,488 and the unrealized gains (losses) consisted of:
| | | | |
Gross unrealized gains | | $ | 51,508,761 | |
Gross unrealized losses | | | (5,075,449 | ) |
Net unrealized gains | | $ | 46,433,312 | |
Class allocations
The separate classes of shares offered by the Fund differ principally in distribution fees. Class specific expenses are charged directly to that share class. Investment income, common expenses, and realized and unrealized gains (losses) on investments are allocated daily to each class of shares based on the relative proportion of net assets of each class.
3. FAIR VALUATION MEASUREMENTS
Fair value measurements of investments are determined within a framework that has established a fair value hierarchy based upon the various data inputs utilized in determining the value of the Fund’s investments. The three-level hierarchy gives the highest priority to unadjusted quoted prices in active markets for identical assets or liabilities (Level 1) and the lowest priority to unobservable inputs (Level 3). The Fund’s investments are classified within the fair value hierarchy based on the lowest level of input that is significant to the fair value measurement. The inputs are summarized into three broad levels as follows:
| ∎ | | Level 1 – quoted prices in active markets for identical securities |
| ∎ | | Level 2 – other significant observable inputs (including quoted prices for similar securities, interest rates, prepayment speeds, credit risk, etc.) |
| ∎ | | Level 3 – significant unobservable inputs (including the Fund’s own assumptions in determining the fair value of investments) |
The inputs or methodologies used for valuing investments in securities are not necessarily an indication of the risk associated with investing in those securities.
The following is a summary of the inputs used in valuing the Fund’s assets and liabilities as of June 30, 2018:
| | | | | | | | | | | | | | | | |
| | | Quoted prices (Level 1) | | | Other significant
observable inputs
(Level 2) | | | Significant
unobservable inputs (Level 3) | | | Total | |
Assets | | | | | | | | | | | | | | | | |
Investments in: | | | | | | | | | | | | | | | | |
| | | | |
Common stocks | | | | | | | | | | | | | | | | |
Consumer discretionary | | $ | 21,938,520 | | | $ | 0 | | | $ | 0 | | | $ | 21,938,520 | |
Consumer staples | | | 5,108,002 | | | | 0 | | | | 0 | | | | 5,108,002 | |
Energy | | | 15,535,256 | | | | 0 | | | | 0 | | | | 15,535,256 | |
Financials | | | 31,913,212 | | | | 0 | | | | 0 | | | | 31,913,212 | |
Health care | | | 32,865,237 | | | | 0 | | | | 0 | | | | 32,865,237 | |
Industrials | | | 17,741,532 | | | | 5,861,626 | | | | 0 | | | | 23,603,158 | |
Information technology | | | 44,465,935 | | | | 0 | | | | 0 | | | | 44,465,935 | |
Materials | | | 9,498,450 | | | | 0 | | | | 0 | | | | 9,498,450 | |
Real estate | | | 5,077,348 | | | | 0 | | | | 0 | | | | 5,077,348 | |
| | | | |
Short-term investments | | | | | | | | | | | | | | | | |
Investment companies | | | 1,817,407 | | | | 0 | | | | 0 | | | | 1,817,407 | |
Investments measured at net asset value* | | | | | | | | | | | | | | | 940,275 | |
Total assets | | $ | 185,960,899 | | | $ | 5,861,626 | | | $ | 0 | | | $ | 192,762,800 | |
| * | Investments that are measured at fair value using the net asset value per share (or its equivalent) as a practical expedient have not been categorized in the fair value hierarchy. The fair value amount presented in the table is intended to permit reconciliation of the fair value hierarchy to the amounts presented in the Statement of Assets and Liabilities. The Fund’s investment in Securities Lending Cash Investments, LLC valued at $940,275 does not have a redemption period notice, can be redeemed daily and does not have any unfunded commitments. |
| | | | | | |
| Notes to financial statements (unaudited) | | Wells Fargo VT Opportunity Fund | | | 19 | |
The Fund recognizes transfers between levels within the fair value hierarchy at the end of the reporting period. At June 30, 2018, fair value pricing was used in pricing certain foreign securities and common stocks valued at $3,703,659 were transferred from Level 1 to Level 2 within the fair value hierarchy. The Fund did not have any transfers into/out of Level 3.
4. TRANSACTIONS WITH AFFILIATES
Management fee
Funds Management, an indirect wholly owned subsidiary of Wells Fargo, is the manager of the Fund and provides advisory and fund-level administrative services under an investment management agreement. Under the investment management agreement, Funds Management is responsible for, among other services, implementing the investment objectives and strategies of the Fund, supervising the subadviser and providing fund-level administrative services in connection with the Fund’s operations. As compensation for its services under the investment management agreement, Funds Management is entitled to receive an annual management fee starting at 0.70% and declining to 0.58% as the average daily net assets of the Fund increase. For the six months ended June 30, 2018, the management fee was equivalent to an annual rate of 0.70% of the Fund’s average daily net assets.
Funds Management has retained the services of a subadviser to provide daily portfolio management to the Fund. The fee for subadvisory services is borne by Funds Management. WellsCap is the subadviser to the Fund and is entitled to receive a fee from Funds Management at an annual rate starting at 0.45% and declining to 0.30% as the average daily net assets of the Fund increase.
Administration fees
Under a class-level administration agreement, Funds Management provides class-level administrative services to the Fund, which includes paying fees and expenses for services provided by the transfer agent, sub-transfer agents, omnibus account servicers and record-keepers. As compensation for its services under the class-level administration agreement, Funds Management receives an annual fee of 0.08% which is calculated based on the average daily net assets of each class.
Funds Management has contractually waived and/or reimbursed management and administration fees to the extent necessary to maintain certain net operating expense ratios for the Fund. When each class of the Fund has exceeded its expense cap, Funds Management has waived fees and/or reimbursed expenses from fund level expenses on a proportionate basis and then from class specific expenses; otherwise, waivers and/or reimbursements are applied against class specific expenses before fund level expenses. Funds Management has committed through April 30, 2019 to waive fees and/or reimburse expenses to the extent necessary to cap the Fund’s expenses at 0.75% for Class 1 shares and 1.00% for Class 2 Class shares. After this time, the cap may be increased or the commitment to maintain the cap may be terminated only with the approval of the Board of Trustees.
Distribution fee
The Trust has adopted a distribution plan for Class 2 shares of the Fund pursuant to Rule 12b-1 under the 1940 Act. A distribution fee is charged to Class 2 shares and paid to Wells Fargo Funds Distributor, LLC, the principal underwriter, at an annual rate of 0.25% of the average daily net assets of Class 2 shares.
Interfund transactions
The Fund may purchase or sell portfolio investment securities to certain other Wells Fargo affiliates pursuant to Rule 17a-7 under the 1940 Act and under procedures adopted by the Board of Trustees. The procedures have been designed to ensure that these interfund transactions, which do not incur broker commissions, are effected at current market prices.
5. INVESTMENT PORTFOLIO TRANSACTIONS
Purchases and sales of investments, excluding U.S. government obligations (if any) and short-term securities, for the six months ended June 30, 2018 were $28,693,605 and $43,005,338, respectively.
6. BANK BORROWINGS
The Trust and Wells Fargo Funds Trust (excluding the money market funds and certain other funds) are parties to a $280,000,000 revolving credit agreement whereby the Fund is permitted to use bank borrowings for temporary or emergency purposes, such as to fund shareholder redemption requests. Interest under the credit agreement is charged to the Fund based on a borrowing rate equal to the higher of the Federal Funds rate in effect on that day plus 1.25% or the overnight LIBOR rate in effect on that day plus 1.25%. In addition, an annual commitment fee equal to 0.25% of the unused balance is allocated to each participating fund.
| | | | |
| 20 | | Wells Fargo VT Opportunity Fund | | Notes to financial statements (unaudited) |
For the six months ended June 30, 2018, there were no borrowings by the Fund under the agreement.
7. INDEMNIFICATION
Under the Trust’s organizational documents, the officers and Trustees have been granted certain indemnification rights against certain liabilities that may arise out of performance of their duties to the Trust. Additionally, in the normal course of business, the Trust may enter into contracts with service providers that contain a variety of indemnification clauses. The Trust’s maximum exposure under these arrangements is dependent on future claims that may be made against the Fund and, therefore, cannot be estimated.
8. SUBSEQUENT DISTRIBUTIONS
On July 13, 2018, the Fund declared distributions from net investment income, short-term capital gains and long-term capital gains to shareholders of record on July 12, 2018. The per share amounts payable on July 16, 2018 were as follows:
| | | | | | | | | | | | |
| | | Net investment
income | | | Short-term
capital gains | | | Long-term
capital gains | |
Class 1 | | | $0.12359 | | | | $0.27822 | | | | $2.34628 | |
Class 2 | | | 0.05216 | | | | 0.27822 | | | | 2.34628 | |
These distributions are not reflected in the accompanying financial statements.
| | | | | | |
| Other information (unaudited) | | Wells Fargo VT Opportunity Fund | | | 21 | |
PROXY VOTING INFORMATION
A description of the policies and procedures that the Fund uses to determine how to vote proxies relating to portfolio securities is available, upon request, by calling 1-800-260-5969, visiting our website at wellsfargofunds.com, or visiting the SEC website at sec.gov. Information regarding how the Fund voted proxies relating to portfolio securities during the most recent 12-month period ended June 30 is available on the Fund’s website at wellsfargofunds.com or by visiting the SEC website at sec.gov.
PORTFOLIO HOLDINGS INFORMATION
The complete portfolio holdings for the Fund are publicly available monthly on the Fund’s website (wellsfargofunds.com), on a one-month delayed basis. In addition, top ten holdings information (excluding derivative positions) for the Fund is publicly available on the Fund’s website on a monthly, seven-day or more delayed basis. The Fund files its complete schedule of portfolio holdings with the SEC for the first and third quarters of each fiscal year on Form N-Q, which is available by visiting the SEC website at sec.gov. In addition, the Fund’s Form N-Q may be reviewed and copied at the SEC’s Public Reference Room in Washington, DC, and at regional offices in New York City, at 233 Broadway, and in Chicago, at 175 West Jackson Boulevard, Suite 900. Information about the Public Reference Room may be obtained by calling 1-800-SEC-0330.
| | | | |
| 22 | | Wells Fargo VT Opportunity Fund | | Other information (unaudited) |
BOARD OF TRUSTEES AND OFFICERS
Each of the Trustees and Officers1 listed in the table below acts in identical capacities for each fund in the Wells Fargo family of funds, which consists of 154 mutual funds comprising the Wells Fargo Funds Trust, Wells Fargo Variable Trust, Wells Fargo Master Trust and four closed-end funds (collectively the “Fund Complex”). This table should be read in conjunction with the Prospectus and the Statement of Additional Information2. The mailing address of each Trustee and Officer is 525 Market Street, 12th Floor, San Francisco, CA 94105. Each Trustee and Officer serves an indefinite term, however, each Trustee serves such term until reaching the mandatory retirement age established by the Trustees.
Independent Trustees
| | | | | | |
Name and year of birth | | Position held and length of service* | | Principal occupations during past five years or longer | | Current other public company or investment company directorships |
William R. Ebsworth (Born 1957) | | Trustee, since 2015 | | Retired. From 1984 to 2013, equities analyst, portfolio manager, research director and chief investment officer at Fidelity Management and Research Company in Boston, Tokyo, and Hong Kong, and retired in 2013 as Chief Investment Officer of Fidelity Strategic Advisers, Inc. where he led a team of investment professionals managing client assets. Prior thereto, Board member of Hong Kong Securities Clearing Co., Hong Kong Options Clearing Corp., the Thailand International Fund, Ltd., Fidelity Investments Life Insurance Company, and Empire Fidelity Investments Life Insurance Company. Board member of the Forté Foundation (non-profit organization) and the Vincent Memorial Hospital Endowment (non-profit organization), where he serves on the Investment Committee and as a Chair of the Audit Committee. Mr. Ebsworth is a CFA® charterholder. | | Asset Allocation Trust |
Jane A. Freeman (Born 1953) | | Trustee, since 2015; Chair Liaison, since 2018 | | Retired. From 2012 to 2014 and 1999 to 2008, Chief Financial Officer of Scientific Learning Corporation. From 2008 to 2012, Ms. Freeman provided consulting services related to strategic business projects. Prior to 1999, Portfolio Manager at Rockefeller & Co. and Scudder, Stevens & Clark. Board member of the Harding Loevner Funds from 1996 to 2014, serving as both Lead Independent Director and chair of the Audit Committee. Board member of the Russell Exchange Traded Funds Trust from 2011 to 2012 and the chair of the Audit Committee. Ms. Freeman is a Board Member of Ruth Bancroft Garden (non-profit organization) and the Glimmerglass Festival. She is also an inactive Chartered Financial Analyst. | | Asset Allocation Trust |
Isaiah Harris, Jr. (Born 1952) | | Trustee, since 2009 | | Retired. Chairman of the Board of CIGNA Corporation since 2009, and Director since 2005. From 2003 to 2011, Director of Deluxe Corporation. Prior thereto, President and CEO of BellSouth Advertising and Publishing Corp. from 2005 to 2007, President and CEO of BellSouth Enterprises from 2004 to 2005 and President of BellSouth Consumer Services from 2000 to 2003. Emeritus member of the Iowa State University Foundation Board of Governors. Emeritus Member of the Advisory Board of Iowa State University School of Business. Advisory Board Member, Palm Harbor Academy (charter school). Advisory Board Member, Child Evangelism Fellowship (non-profit). Mr. Harris is a certified public accountant (inactive status). | | CIGNA Corporation; Asset Allocation Trust |
Judith M. Johnson (Born 1949) | | Trustee, since 2008; Audit Committee Chairman, since 2009 | | Retired. Prior thereto, Chief Executive Officer and Chief Investment Officer of Minneapolis Employees Retirement Fund from 1996 to 2008. Ms. Johnson is an attorney, certified public accountant and a certified managerial accountant. | | Asset Allocation Trust |
David F. Larcker (Born 1950) | | Trustee, since 2009 | | James Irvin Miller Professor of Accounting at the Graduate School of Business, Stanford University, Director of the Corporate Governance Research Initiative and Senior Faculty of The Rock Center for Corporate Governance since 2006. From 2005 to 2008, Professor of Accounting at the Graduate School of Business, Stanford University. Prior thereto, Ernst & Young Professor of Accounting at The Wharton School, University of Pennsylvania from 1985 to 2005. | | Asset Allocation Trust |
| | | | | | |
| Other information (unaudited) | | Wells Fargo VT Opportunity Fund | | | 23 | |
| | | | | | |
Name and year of birth | | Position held and length of service* | | Principal occupations during past five years or longer | | Current other public company or investment company directorships |
Olivia S. Mitchell (Born 1953) | | Trustee, since 2006; Governance Committee Chairman, since 2018 | | International Foundation of Employee Benefit Plans Professor, Wharton School of the University of Pennsylvania since 1993. Director of Wharton’s Pension Research Council and Boettner Center on Pensions & Retirement Research, and Research Associate at the National Bureau of Economic Research. Previously, Cornell University Professor from 1978 to 1993. | | Asset Allocation Trust |
Timothy J. Penny (Born 1951) | | Trustee, since 1996; Chairman, since 2018; Vice Chairman, from 2017 to 2018 | | President and Chief Executive Officer of Southern Minnesota Initiative Foundation, a non-profit organization, since 2007. Member of the Board of Trustees of NorthStar Education Finance, Inc., a non-profit organization, since 2007. | | Asset Allocation Trust |
James G. Polisson (Born 1959) | | Trustee, since 2018; Advisory Board Member, from 2017 to 2018 | | Retired. Chief Marketing Officer, Source (ETF) UK Services, Ltd, from 2015 to 2017. From 2012 to 2015, Principal of The Polisson Group, LLC, a management consulting, corporate advisory and principal investing company. Chief Executive Officer and Managing Director at Russell Investments, Global Exchange Traded Funds from 2010 to 2012. Managing Director of Barclays Global Investors from 1998 to 2010 and Global Chief Marketing Officer for iShares and Barclays Global Investors from 2000 to 2010. Trustee of the San Francisco Mechanics’ Institute, a non-profit organization, from 2013 to 2015. Board member of the Russell Exchange Traded Fund Trust from 2011 to 2012. Director of Barclays Global Investors Holdings Deutschland GmbH from 2006 to 2009. Mr. Polisson is an attorney and has a retired status with the Massachusetts and District of Columbia Bar Associations. | | Asset Allocation Trust |
Michael S. Scofield (Born 1943) | | Trustee, since 2010 | | Served on the Investment Company Institute’s Board of Governors and Executive Committee from 2008-2011 as well the Governing Council of the Independent Directors Council from 2006-2011 and the Independent Directors Council Executive Committee from 2008-2011. Trustee of the Evergreen Fund complex (and its predecessors) from 1984 to 2010. Chairman of the Evergreen Funds from 2000-2010. Former Trustee of the Mentor Funds. Retired Attorney, Law Offices of Michael S. Scofield. | | Asset Allocation Trust |
Pamela Wheelock (Born 1959) | | Trustee, since 2018; Advisory Board Member, from 2017 to 2018 | | Chief Operating Officer, Twin Cities Habitat for Humanity, since January, 2017. Vice President of University Services, University of Minnesota from 2012 to 2017. Prior thereto, on the Board of Directors, Goverance Committee and Finance Committee for the Minnesota Philanthropy Partners (Saint Paul Foundation) from 2012 to 2018, Interim President and Chief Executive Officer of Blue Cross Blue shield of Minnesota of Minnesota from 2010 to 2011, Chairman of the Board from 2009 to 2011 and Board Director 003 to 2015. Vice President, Leadership and Community Engagement, Bush Foundation, Saint Paul, Minnesota (a private foundation) from 2009 to 2011. Executive Vice President and Chief Financial Officer, Minnesota Sports and Entertainment from 2004 to 2009 and Senior Vice President from 2002 to 2004. Commissioner of Finance, State of Minnesota, from 1999 to 2002. Currently the Board Chair of the Minnesota Wild Foundation since 2010. | | Asset Allocation Trust |
| * | Length of service dates reflect the Trustee’s commencement of service with the Trust’s predecessor entities, where applicable. |
| | | | |
| 24 | | Wells Fargo VT Opportunity Fund | | Other information (unaudited) |
Officers
| | | | | | |
Name and year of birth | | Position held and length of service | | Principal occupations during past five years or longer | | |
Andrew Owen (Born 1960) | | President, since 2017 | | Executive Vice President of Wells Fargo & Company and Head of Affiliated Managers, Wells Fargo Asset Management, since 2014. In addition, Mr. Owen is currently President, Chief Executive Officer and Director of Wells Fargo Funds Management, LLC since 2017. Prior thereto, Executive Vice President responsible for marketing, investments and product development for Wells Fargo Funds Management, LLC, from 2009 to 2014. | | |
Jeremy DePalma1 (Born 1974) | | Treasurer, since 2012 | | Senior Vice President of Wells Fargo Funds Management, LLC since 2009. Senior Vice President of Evergreen Investment Management Company, LLC from 2008 to 2010 and head of the Fund Reporting and Control Team within Fund Administration from 2005 to 2010. | | |
Alexander Kymn3 (Born 1973) | | Secretary, since 2018; Chief Legal Officer, since 2018 | | Senior Company Counsel of Wells Fargo Bank, N.A. since 2018 (previously Senior Counsel from 2007 to 2018). Vice President of Wells Fargo Funds Management, LLC from 2008 to 2014. | | |
Michael H. Whitaker (Born 1967) | | Chief Compliance Officer, since 2016 | | Senior Vice President and Chief Compliance Officer since 2016. Senior Vice President and Chief Compliance Officer for Fidelity Investments from 2007 to 2016. | | |
David Berardi (Born 1975) | | Assistant Treasurer, since 2009 | | Vice President of Wells Fargo Funds Management, LLC since 2009. Vice President of Evergreen Investment Management Company, LLC from 2008 to 2010. Manager of Fund Reporting and Control for Evergreen Investment Management Company, LLC from 2004 to 2010. | | |
| 1 | Jeremy DePalma acts as Treasurer of 77 funds and Assistant Treasurer of 77 funds in the Fund Complex. |
| 2 | The Statement of Additional Information includes additional information about the Trustees and is available, without charge, upon request, by calling 1-800-260-5969 or by visiting the website at wellsfargofunds.com. |
| 3 | Alexander Kymn became the Secretary and Chief Legal Officer effective April 17, 2018. |
| | | | | | |
| Other information (unaudited) | | Wells Fargo VT Opportunity Fund | | | 25 | |
BOARD CONSIDERATION OF INVESTMENT MANAGEMENT AND SUB-ADVISORY AGREEMENTS:
Wells Fargo VT Opportunity Fund
Under the Investment Company Act of 1940 (the “1940 Act”), the Board of Trustees (the “Board”) of Wells Fargo Variable Trust (the “Trust”) must determine annually whether to approve the continuation of the Trust’s investment management and sub-advisory agreements. In this regard, at an in-person meeting held on May 22-23, 2018 (the “Meeting”), the Board, all the members of which have no direct or indirect interest in the investment management and sub-advisory agreements and are not “interested persons” of the Trust, as defined in the 1940 Act (the “Independent Trustees”), reviewed and approved for Wells Fargo VT Opportunity Fund (the “Fund”): (i) an investment management agreement (the “Management Agreement”) with Wells Fargo Funds Management, LLC (“Funds Management”); and (ii) an investment sub-advisory agreement (the “Sub-Advisory Agreement”) with Wells Capital Management Incorporated (the “Sub-Adviser”), an affiliate of Funds Management. The Management Agreement and the Sub-Advisory Agreement are collectively referred to as the “Advisory Agreements.”
At the Meeting, the Board considered the factors and reached the conclusions described below relating to the selection of Funds Management and the Sub-Adviser and the approval of the Advisory Agreements. Prior to the Meeting, including at an in-person meeting in April 2018, the Trustees conferred extensively among themselves and with representatives of Funds Management about these matters. Also, the Board has adopted a team-based approach, with each team consisting of a sub-set of Trustees, to assist the full Board in the discharge of its duties in reviewing investment performance and other matters throughout the year. The Independent Trustees were assisted in their evaluation of the Advisory Agreements by independent legal counsel, from whom they received separate legal advice and with whom they met separately.
In providing information to the Board, Funds Management and the Sub-Adviser were guided by a detailed set of requests for information submitted to them by independent legal counsel on behalf of the Independent Trustees at the start of the Board’s annual contract renewal process earlier in 2018. In considering and approving the Advisory Agreements, the Trustees considered the information they believed relevant, including but not limited to the information discussed below. The Board considered not only the specific information presented in connection with the Meeting, but also the knowledge gained over time through interaction with Funds Management and the Sub-Adviser about various topics. In this regard, the Board reviewed reports of Funds Management at each of its quarterly meetings, which included, among other things, portfolio reviews and investment performance reports. In addition, the Board and the teams mentioned above confer with portfolio managers at various times throughout the year. The Board did not identify any particular information or consideration that was all-important or controlling, and each individual Trustee may have attributed different weights to various factors.
After its deliberations, the Board unanimously approved the continuation of the Advisory Agreements for a one-year term and determined that the compensation payable to Funds Management and the Sub-Adviser under each of the Advisory Agreements was reasonable. The Board considered the approval of the Advisory Agreements for the Fund as part of its consideration of agreements for funds across the complex, but its approvals were made on a fund-by-fund basis. The following summarizes a number of important, but not necessarily all, factors considered by the Board in support of its approvals.
Nature, extent and quality of services
The Board received and considered various information regarding the nature, extent and quality of services provided to the Fund by Funds Management and the Sub-Adviser under the Advisory Agreements. This information included a description of the investment advisory services and Fund-level administrative services covered by the Management Agreement, as well as, among other things, a summary of the background and experience of senior management of Wells Fargo Asset Management (“WFAM”), of which Funds Management and the Sub-Adviser are a part, a summary of investments made in the business of WFAM, a summary of certain organizational and personnel changes involving Funds Management and the Sub-Adviser, and a description of Funds Management’s and the Sub-Adviser’s business continuity planning programs and of their approaches to data privacy and cybersecurity. The Board also considered the qualifications, background, tenure and responsibilities of each of the portfolio managers primarily responsible for the day-to-day portfolio management of the Fund.
The Board evaluated the ability of Funds Management and the Sub-Adviser to attract and retain qualified investment professionals, including research, advisory and supervisory personnel. The Board further considered the compliance programs and compliance records of Funds Management and the Sub-Adviser. In addition, the Board took into account the full range of services provided to the Fund by Funds Management and its affiliates.
| | | | |
| 26 | | Wells Fargo VT Opportunity Fund | | Other information (unaudited) |
Fund investment performance and expenses
The Board considered the investment performance results for the Fund over various time periods ended December 31, 2017. The Board considered these results in comparison to the investment performance of funds in a universe that was determined by Broadridge Inc. (“Broadridge”) to be similar to the Fund (the “Universe”), and in comparison to the Fund’s benchmark index and to other comparative data. Broadridge is an independent provider of investment company data. The Board received a description of the methodology used by Broadridge to select the mutual funds in the performance Universe. The Board noted that the investment performance of the Fund was higher than or in range of the average investment performance of the Universe for all periods under review. The Board also noted that the investment performance of the Fund was lower than its benchmark index, the Russell 3000 Index, for all periods under review.
The Board received information concerning, and discussed factors contributing to, the underperformance of the Fund relative to the benchmark for the periods identified above. The Board took note of the explanations for the relative underperformance during these periods, including with respect to investment decisions and market factors that affected the Fund’s investment performance. The Board also took note of the Fund’s performance relative to the Universe.
The Board also received and considered information regarding the Fund’s net operating expense ratios and their various components, including actual management fees, custodian and other non-management fees, and Rule 12b-1 and non-Rule 12b-1 shareholder service fees. The Board considered these ratios in comparison to the median ratios of funds in class-specific expense groups that were determined by Broadridge to be similar to the Fund (the “Groups”). The Board received a description of the methodology used by Broadridge to select the mutual funds in the expense Groups and an explanation of how funds comprising expense groups and their expense ratios may vary from year-to-year. Based on the Broadridge reports, the Board noted that the net operating expense ratios of the Fund were lower than the median net operating expense ratios of the expense Groups for each share class.
The Board took into account the Fund’s investment performance and expense information provided to it among the factors considered in deciding to re-approve the Advisory Agreements.
Investment management and sub-advisory fee rates
The Board reviewed and considered the contractual fee rates payable by the Fund to Funds Management under the Management Agreement, as well as the contractual fee rates payable by the Fund to Funds Management for class-level administrative services under a Class-Level Administration Agreement, which include, among other things, class-level transfer agency and sub-transfer agency costs (collectively, the “Management Rates”). The Board also reviewed and considered the contractual investment sub-advisory fee rates that are payable by Funds Management to the Sub-Adviser for investment sub-advisory services.
Among other information reviewed by the Board was a comparison of the Fund’s Management Rates with the average contractual investment management fee rates of funds in the expense Groups at a common asset level as well as transfer agency costs of the funds in the expense Groups. The Board noted that the Management Rates of the Fund were in range of the sum of these average rates for the Fund’s expense Groups for all share classes.
The Board also received and considered information about the portion of the total management fee that was retained by Funds Management after payment of the fee to the Sub-Adviser for sub-advisory services. In assessing the reasonableness of this amount, the Board received and evaluated information about the nature and extent of responsibilities retained and risks assumed by Funds Management and not delegated to or assumed by the Sub-Adviser, and about Funds Management’s on-going oversight services. Given the affiliation between Funds Management and the Sub-Adviser, the Board ascribed limited relevance to the allocation of fees between them.
The Board also received and considered information about the nature and extent of services offered and fee rates charged by Funds Management and the Sub-Adviser to other types of clients with investment strategies similar to those of the Fund. In this regard, the Board received information about the significantly greater scope of services, and compliance, reporting and other legal burdens and risks of managing mutual funds compared with those associated with managing assets of non-mutual fund clients such as institutional separate accounts.
Based on its consideration of the factors and information it deemed relevant, including those described here, the Board determined that the compensation payable to Funds Management under the Management Agreement and to the Sub-Adviser under the Sub-Advisory Agreement was reasonable.
Profitability
The Board received and considered information concerning the profitability of Funds Management, as well as the profitability of both WFAM and Wells Fargo & Co. (“Wells Fargo”) as a whole, from providing services to the Fund and the fund family as a whole. The Board noted that the Sub-Adviser’s profitability information with respect to providing services to the Fund was subsumed in the WFAM and Wells Fargo profitability analysis.
| | | | | | |
| Other information (unaudited) | | Wells Fargo VT Opportunity Fund | | | 27 | |
Funds Management reported on the methodologies and estimates used in calculating profitability, including a description of the methodology used to allocate certain expenses and recent enhancements made to the methodology. Among other things, the Board noted that the levels of profitability reported on a fund-by-fund basis varied widely, depending on factors such as the size and type of fund. Based on its review, the Board did not deem the profits reported by Funds Management, WFAM or Wells Fargo from services provided to the Fund to be at a level that would prevent it from approving the continuation of the Advisory Agreements.
Economies of scale
The Board considered the extent to which Funds Management may experience economies of scale in the provision of management services, and the extent to which scale benefits, if any, would be shared with shareholders. In particular, the Board noted the existence of breakpoints in the Fund’s management fee structure, which operate generally to reduce the Fund’s expense ratios as the Fund grows in size. It considered that, for a small fund or a fund that shrinks in size, breakpoints conversely can result in higher fee levels. The Board also considered that in addition to management fee breakpoints, competitive management fee rates set at the outset without regard to breakpoints and fee waiver and expense reimbursement arrangements, as well as investments in the business intended to enhance services available to Fund shareholders, are means of sharing potential economies of scale with shareholders of the Fund.
The Board concluded that the Fund’s fee and expense arrangements, including contractual breakpoints, constituted a reasonable approach to sharing potential economies of scale with the Fund and its shareholders.
Other benefits to Funds Management and the Sub-Adviser
The Board received and considered information regarding potential “fall-out” or ancillary benefits received by Funds Management and its affiliates, including the Sub-Adviser, as a result of their relationships with the Fund. Ancillary benefits could include, among others, benefits directly attributable to other relationships with the Fund and benefits potentially derived from an increase in Funds Management’s and the Sub-Adviser’s business as a result of their relationships with the Fund. The Board noted that various affiliates of Funds Management may receive distribution-related fees, shareholder servicing payments and sub-transfer agency fees in respect of shares sold or held through them and services provided.
The Board also reviewed information about soft dollar credits earned and utilized by the Sub-Adviser, fees earned by Funds Management and the Sub-Adviser from managing a private investment vehicle for the fund family’s securities lending collateral and commissions earned by an affiliated broker from portfolio transactions.
Based on its consideration of the factors and information it deemed relevant, including those described here, the Board did not find that any ancillary benefits received by Funds Management and its affiliates, including the Sub-Adviser, were unreasonable.
Conclusion
At the Meeting, after considering the above-described factors and based on its deliberations and its evaluation of the information described above, the Board unanimously approved the continuation of the Advisory Agreements for a one-year term and determined that the compensation payable to Funds Management and the Sub-Adviser under each of the Advisory Agreements was reasonable.
This page is intentionally left blank.

For more information
More information about Wells Fargo Funds is available free upon request. To obtain literature, please write, email, visit the Fund’s website, or call:
Wells Fargo Funds
P.O. Box 8266
Boston, MA 02266-8266
Email: fundservice@wellsfargo.com
Website: wellsfargofunds.com
Individual investors: 1-800-222-8222
Retail investment professionals: 1-888-877-9275
Institutional investment professionals: 1-866-765-0778
This report and the financial statements contained herein are submitted for the general information of the shareholders of the Fund. If this report is used for promotional purposes, distribution of the report must be accompanied or preceded by a current prospectus. Before investing, please consider the investment objectives, risks, charges, and expenses of the investment. For a current prospectus and, if available, a summary prospectus, containing this information, call 1-800-260-5969 or visit the Fund’s website at wellsfargofunds.com. Read the prospectus carefully before you invest or send money.
Wells Fargo Asset Management (WFAM) is the trade name for certain investment advisory/management firms owned by Wells Fargo & Company. These firms include but are not limited to Wells Capital Management Incorporated and Wells Fargo Funds Management, LLC. Certain products managed by WFAM entities are distributed by Wells Fargo Funds Distributor, LLC (a broker/dealer and Member FINRA).
This material is for general informational and educational purposes only and is NOT intended to provide investment advice or a recommendation of any kind—including a recommendation for any specific investment, strategy, or plan.
NOT FDIC INSURED ◾ NO BANK GUARANTEE ◾ MAY LOSE VALUE
© 2018 Wells Fargo Funds Management, LLC. All rights reserved.
| | |
| | 314256 08-18 SVT6/SAR143 06-18 |
Semi-Annual Report
June 30, 2018

Wells Fargo VT Small Cap Growth Fund


Reduce clutter. Save trees.
Sign up for electronic delivery of prospectuses and shareholder reports at wellsfargo.com/advantagedelivery
Contents
The views expressed and any forward-looking statements are as of June 30, 2018, unless otherwise noted, and are those of the Fund managers and/or Wells Fargo Funds Management, LLC. Discussions of individual securities, or the markets generally, or any Wells Fargo Fund are not intended as individual recommendations. Future events or results may vary significantly from those expressed in any forward-looking statements. The views expressed are subject to change at any time in response to changing circumstances in the market. Wells Fargo Funds Management, LLC and the Fund disclaim any obligation to publicly update or revise any views expressed or forward-looking statements.
NOT FDIC INSURED ◾ NO BANK GUARANTEE ◾ MAY LOSE VALUE
| | | | |
| 2 | | Wells Fargo VT Small Cap Growth Fund | | Letter to shareholders (unaudited) |

Andrew Owen
President
Wells Fargo Funds
Globally, economies strengthened, equity markets advanced, and foreign bonds outperformed fixed-income investments in the U.S.
During February 2018, the U.S. stock market endured a loss of more than 10% before recovering in March and April.
Dear Shareholder:
We are pleased to offer you this semi-annual report for the Wells Fargo VT Small Cap Growth Fund for the six-month period that ended June 30, 2018. Globally, economies strengthened, equity markets advanced, and foreign bonds outperformed fixed-income investments in the U.S.
For the period, U.S. stocks, as measured by the S&P 500 Index,1 gained 2.65%, and international stocks, as measured by the MSCI ACWI ex USA Index (Net),2 dropped 3.77%. Emerging market stocks, as measured by the MSCI EM Index (Net),3 fell 6.66%. In bond markets, the Bloomberg Barclays U.S. Aggregate Bond Index4 declined 1.62% while fixed-income investments outside the U.S. lost 1.31 %, according to the Bloomberg Barclays Global Aggregate ex-USD Index.5 The Bloomberg Barclays Municipal Bond Index6 fell 0.25%, and the ICE BofAML U.S. High Yield Index7 was up 0.08%.
Volatility reemerged during the first quarter of 2018 as economic signals were mixed.
The first quarter of 2018 began with stock market gains in January after the U.S. announced tax reform measures intended to lower rates for individuals and corporations. Then, investor optimism was supplanted by several concerns. Trade tensions emerged, particularly between the U.S. and China, as the U.S. threatened to impose tariffs on a broad range of imported products. Increasing interest rates and inflation also caused concern. During February 2018, the U.S. stock market endured a loss of more than 10% before recovering in March and April. The S&P 500 Index closed the first quarter with a negative return, the first negative quarterly return for the index since 2014.
The U.S. Federal Reserve (Fed) increased the federal funds rate by 25 basis points (bps; 100 bps equal 1.00%) in March and the rate of inflation reached the Fed’s 2% target for the first time in a year. The unemployment rate fell to 4.1% by March 2018 and wage growth data improved. The third revision of gross domestic product growth for the first quarter by the U.S. Bureau of Economic Analysis released during June was lowered to 2.0%.
Overseas, investment market returns reversed the strong returns of 2017—the MSCI ACWI ex USA Index (Net) gained 27.19% for the 12-month period—falling 0.43% through the end of the second quarter of 2018. Although central banks, including the European Central Bank and the Bank of Japan, maintained low interest rates and quantitative easing measures that are generally supportive of
| 1 | The S&P 500 Index consists of 500 stocks chosen for market size, liquidity, and industry group representation. It is a market-value-weighted index with each stock’s weight in the index proportionate to its market value. You cannot invest directly in an index. |
| 2 | The Morgan Stanley Capital International (MSCI) All Country World Index (ACWI) ex USA Index (Net) is a free-float-adjusted market-capitalization-weighted index that is designed to measure the equity market performance of developed markets, excluding the United States and Canada. Source: MSCI. MSCI makes no express or implied warranties or representations and shall have no liability whatsoever with respect to any MSCI data contained herein. The MSCI data may not be further redistributed or used as a basis for other indices or any securities or financial products. This report is not approved, reviewed, or produced by MSCI. You cannot invest directly in an index. |
| 3 | The MSCI Emerging Markets (EM) Index (Net) is a free-float-adjusted market-capitalization-weighted index that is designed to measure large- and mid-cap equity market performance of emerging markets. The MSCI EM Index (Net) consists of the following 24 emerging market country indices: Brazil, Chile, China, Colombia, Czech Republic, Egypt, Greece, Hungary, India, Indonesia, Korea, Malaysia, Mexico, Pakistan, Peru, the Philippines, Poland, Qatar, Russia, South Africa, Taiwan, Thailand, Turkey, and the United Arab Emirates. You cannot invest directly in an index. |
| 4 | The Bloomberg Barclays U.S. Aggregate Bond Index is a broad-based benchmark that measures the investment-grade, U.S. dollar-denominated, fixed-rate taxable bond market, including Treasuries, government-related and corporate securities, mortgage-backed securities (agency fixed-rate and hybrid adjustable-rate mortgage pass-throughs), asset-backed securities, and commercial mortgage-backed securities. You cannot invest directly in an index. |
| 5 | The Bloomberg Barclays Global Aggregate ex-USD Index is an unmanaged index that provides a broad-based measure of the global investment-grade fixed-income markets excluding the U.S. dollar-denominated debt market. You cannot invest directly in an index. |
| 6 | The Bloomberg Barclays Municipal Bond Index is an unmanaged index composed of long-term tax-exempt bonds with a minimum credit rating of Baa. You cannot invest directly in an index. |
| 7 | The ICE BofAML U.S. High Yield Index is a market-capitalization-weighted index of domestic and Yankee high-yield bonds. The index tracks the performance of high-yield securities traded in the U.S. bond market. You cannot invest directly in an index. Copyright 2018. ICE Data Indices, LLC. All rights reserved. |
| 8 | The Consumer Price Index (CPI) is a measure of the average change over time in the prices paid by urban consumers for a market basket of consumer goods and services. You cannot invest directly in an index. |
| | | | | | |
| Letter to shareholders (unaudited) | | Wells Fargo VT Small Cap Growth Fund | | | 3 | |
businesses and equity markets, the U.S. dollar strengthened relative to local currencies, which served to restrain returns.
Global trade tensions escalated during the second quarter of 2018.
Global trade tensions escalated as the second quarter of 2018 opened and equity markets fell in response before resuming upward momentum later in April. The CPI8 for All Urban Consumers added 0.2% in May after a similar increase in April. On a year-over-year basis, the all-items index rose 2.8% for the 12 months that ended May 31, continuing its upward trend since the beginning of the year. The index for all items less food and energy rose 2.2% for the same 12-month period.
During June 2018, the Fed increased the federal funds rate by another 25 bps. Market expectations increased that the Fed might announce two more rate increases in 2018. The unemployment rate fell to an 18-year low of 3.8% in May and wage growth data improved. Internationally, central banks maintained their low interest rates and monetary policies that were accommodative of business activity.
Interest rates generally increased and the bond markets tended to decline. Long-term interest rates in the U.S. trended higher—rates on the 10-year and 30-year Treasury bonds moved from 2.46% and 2.81%, respectively, at the beginning of the year on January 1, 2018, to 2.85% and 2.98%, respectively, on June 30, 2018, well off their highest levels during the first half of the year of 3.11% and 3.25%, respectively, on May 17, 2018.
Despite the positive economic and business trends globally, international stock values fell and U.S. stock gains moderated during most of the second quarter of 2018 due to escalating tensions as the U.S. imposed tariffs on foreign goods and countries outside of the U.S. imposed tariffs of their own on U.S. products in response.
Don’t let short-term uncertainty derail long-term investment goals.
Periods of investment uncertainty can present challenges, but experience has taught us that maintaining long-term investment goals can be an effective way to plan for the future. To help you create a sound strategy based on your personal goals and risk tolerance, Wells Fargo Funds offers more than 100 mutual funds spanning a wide range of asset classes and investment styles. Although diversification cannot guarantee an investment profit or prevent losses, we believe it can be an effective way to manage investment risk and potentially smooth out overall portfolio performance. We encourage investors to know their investments and to understand that appropriate levels of risk-taking may unlock opportunities.
Thank you for choosing to invest with Wells Fargo Funds. We appreciate your confidence in us and remain committed to helping you meet your financial needs.
Sincerely,

Andrew Owen
President
Wells Fargo Funds
For further information about your Fund, contact your investment professional, visit our website at wellsfargofunds.com, or call us directly at 1-800-260-5969.
| | | | |
| 4 | | Wells Fargo VT Small Cap Growth Fund | | Performance highlights (unaudited) |
Investment objective
The Fund seeks long-term capital appreciation.
Manager
Wells Fargo Funds Management, LLC
Subadviser
Wells Capital Management Incorporated
Portfolio managers
Joseph M. Eberhardy, CFA®, CFP
Thomas C. Ognar, CFA®
Average annual total returns (%) as of June 30, 20181
| | | | | | | | | | | | | | | | | | | | | | |
| | | | | | | | Expense ratios2 (%) | |
| | | Inception date | | 1 year | | | 5 year | | | 10 year | | | Gross | | | Net3 | |
| Class 1 | | 7-16-2010 | | | 30.12 | | | | 14.30 | | | | 12.43 | | | | 0.95 | | | | 0.95 | |
| Class 2 | | 5-1-1995 | | | 29.73 | | | | 14.02 | | | | 12.21 | | | | 1.20 | | | | 1.20 | |
| Russell 2000® Growth Index4 | | - | | | 21.86 | | | | 13.65 | | | | 11.24 | | | | - | | | | - | |
Figures quoted represent past performance, which is no guarantee of future results. Investment return and principal value of an investment will fluctuate so that an investor’s shares, when redeemed, may be worth more or less than their original cost. Current performance may be lower or higher than the performance data quoted and assumes the reinvestment of dividends and capital gains. Current month-end performance is available by calling 1-800-260-5969. Performance figures of the Fund do not reflect fees charged pursuant to the terms of variable life insurance policies and variable annuity contracts. If these charges had been reflected, performance would have been lower.
Please keep in mind that high double-digit returns were primarily achieved during favorable market conditions. You should not expect that such favorable returns can be consistently achieved. A fund’s performance, especially for short time periods, should not be the sole factor in making your investment decision.
Shares are sold without a front-end sales charge or contingent deferred sales charge.
Index returns do not include transaction costs associated with buying and selling securities, any mutual fund fees or expenses, or any taxes. It is not possible to invest directly in an index.
Stock values fluctuate in response to the activities of individual companies and general market and economic conditions. Smaller-company stocks tend to be more volatile and less liquid than those of larger companies. Consult the Fund’s prospectus for additional information on these and other risks.
Please refer to the prospectus provided by your participating insurance company for detailed information describing the separate accounts for information regarding surrender charges, mortality and expense risk fees, and other charges that may be assessed by the participating insurance companies.
Please see footnotes on page 5.
| | | | | | |
| Performance highlights (unaudited) | | Wells Fargo VT Small Cap Growth Fund | | | 5 | |
| | | | |
| Ten largest holdings (%) as of June 30, 20185 | |
Ligand Pharmaceuticals Incorporated | | | 2.91 | |
InterXion Holding NV | | | 2.66 | |
ASGN Incorporated | | | 2.64 | |
Q2 Holdings Incorporated | | | 2.24 | |
Axogen Incorporated | | | 2.11 | |
Repligen Corporation | | | 2.01 | |
MasTec Incorporated | | | 1.89 | |
HealthEquity Incorporated | | | 1.89 | |
Envestnet Incorporated | | | 1.88 | |
Inogen Incorporated | | | 1.83 | |
|
| Sector distribution as of June 30, 20186 |
|
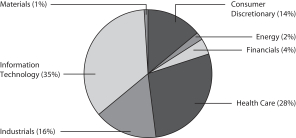
|
| 1 | Historical performance shown for Class 1 shares prior to their inception reflects the performance of Class 2 shares, and includes the higher expenses applicable to Class 2 shares. If these expenses had not been included, returns for Class 1 shares would be higher. |
| 2 | Reflects the expense ratios as stated in the most recent prospectuses, which inclue 0.01% in acquired fund fees. The expense ratios shown are subject to change and may differ from the annualized expense ratios shown in the financial highlights of this report. |
| 3 | The manager has contractually committed through April 30, 2019, to waive fees and/or reimburse expenses to the extent necessary to cap the Fund’s Total Annual Fund Operating Expenses After Fee Waivers at the amounts shown. After this time, the cap may be increased or the commitment to maintain the cap may be terminated only with the approval of the Board of Trustees. Brokerage commissions, stamp duty fees, interest, taxes, acquired fund fees and expenses (if any), and extraordinary expenses are excluded from the expense cap. Without this cap, the Fund’s returns would have been lower. The expense ratio paid by an investor is the net expense ratio (the total annual fund operating expenses after fee waivers) as stated in the prospectuses. |
| 4 | The Russell 2000® Growth Index measures the performance of those Russell 2000 companies with higher price/book ratios and higher forecasted growth values. You cannot invest directly in an index. |
| 5 | The ten largest holdings, excluding cash, cash equivalents and any money market funds, are calculated based on the value of the investments divided by total net assets of the Fund. Holdings are subject to change and may have changed since the date specified. |
| 6 | Amounts are calculated based on the total long-term investments of the Fund. These amounts are subject to change and may have changed since the date specified. |
| | | | |
| 6 | | Wells Fargo VT Small Cap Growth Fund | | Fund expenses (unaudited) |
As a shareholder of the Fund, you incur ongoing costs, including management fees, distribution (12b-1) fees, and other Fund expenses. This example is intended to help you understand your ongoing costs (in dollars) of investing in the Fund and to compare these costs with the ongoing costs of investing in other mutual funds.
The example is based on an investment of $1,000 invested at the beginning of the six-month period and held for the entire period from January 1, 2018 to June 30, 2018.
Actual expenses
The “Actual” line of the table below provides information about actual account values and actual expenses. You may use the information in this line, together with the amount you invested, to estimate the expenses that you paid over the period. Simply divide your account value by $1,000 (for example, an $8,600 account value divided by $1,000 = 8.6), then multiply the result by the number in the “Actual” line under the heading entitled “Expenses paid during period” for your applicable class of shares to estimate the expenses you paid on your account during this period.
Hypothetical example for comparison purposes
The “Hypothetical” line of the table below provides information about hypothetical account values and hypothetical expenses based on the Fund’s actual expense ratio and an assumed rate of return of 5% per year before expenses, which is not the Fund’s actual return. The hypothetical account values and expenses may not be used to estimate the actual ending account balance or expenses you paid for the period. You may use this information to compare the ongoing costs of investing in the Fund and other funds. To do so, compare this 5% hypothetical example with the 5% hypothetical examples that appear in the shareholder reports of the other funds.
Please note that the expenses shown in the table are meant to highlight your ongoing costs only and do not reflect any separate account charges assessed by participating insurance companies. Therefore, the “Hypothetical” line of the table is useful in comparing ongoing costs only, and will not help you determine the relative total costs of owning different funds. In addition, if these separate account charges assessed by participating insurance companies were included, your costs would have been higher.
| | | | | | | | | | | | | | | | |
| | | Beginning
account value
1-1-2018 | | | Ending
account value
6-30-2018 | | | Expenses
paid during
the period¹ | | | Annualized net
expense ratio | |
Class 1 | | | | | | | | | | | | | | | | |
Actual | | $ | 1,000.00 | | | $ | 1,151.59 | | | $ | 4.91 | | | | 0.92 | % |
Hypothetical (5% return before expenses) | | $ | 1,000.00 | | | $ | 1,020.23 | | | $ | 4.61 | | | | 0.92 | % |
Class 2 | | | | | | | | | | | | | | | | |
Actual | | $ | 1,000.00 | | | $ | 1,151.26 | | | $ | 6.24 | | | | 1.17 | % |
Hypothetical (5% return before expenses) | | $ | 1,000.00 | | | $ | 1,018.99 | | | $ | 5.86 | | | | 1.17 | % |
| 1 | Expenses paid is equal to the annualized net expense ratio of each class multiplied by the average account value over the period, multiplied by the number of days in the most recent fiscal half-year divided by the number of days in the fiscal year (to reflect the one-half-year period). |
| | | | | | |
| Portfolio of investments—June 30, 2018 (unaudited) | | Wells Fargo VT Small Cap Growth Fund | | | 7 | |
| | | | | | | | | | | | | | | | |
| Security name | | | | | | | | Shares | | | Value | |
| | | | |
Common Stocks: 97.90% | | | | | | | | | | | | | | | | |
| | | | |
Consumer Discretionary: 13.31% | | | | | | | | | | | | | | | | |
| | | | |
| Auto Components: 1.33% | | | | | | | | | | | | | | | | |
Cooper-Standard Holdings Incorporated † | | | | | | | | | | | 27,490 | | | $ | 3,592,118 | |
LCI Industries | | | | | | | | | | | 7,020 | | | | 632,853 | |
| |
| | | | 4,224,971 | |
| | | | | | | | | | | | | | | | |
| | | | |
| Diversified Consumer Services: 2.41% | | | | | | | | | | | | | | | | |
Chegg Incorporated † | | | | | | | | | | | 166,086 | | | | 4,615,530 | |
Grand Canyon Education Incorporated † | | | | | | | | | | | 27,020 | | | | 3,015,702 | |
| |
| | | | 7,631,232 | |
| | | | | | | | | | | | | | | | |
| | | | |
| Hotels, Restaurants & Leisure: 3.63% | | | | | | | | | | | | | | | | |
Golden Entertainment Incorporated † | | | | | | | | | | | 61,250 | | | | 1,653,138 | |
Planet Fitness Incorporated Class A † | | | | | | | | | | | 121,220 | | | | 5,326,407 | |
Playa Hotels & Resorts NV † | | | | | | | | | | | 150,880 | | | | 1,629,504 | |
Wingstop Incorporated | | | | | | | | | | | 55,189 | | | | 2,876,451 | |
| |
| | | | 11,485,500 | |
| | | | | | | | | | | | | | | | |
| | | | |
| Leisure Products: 0.92% | | | | | | | | | | | | | | | | |
MCBC Holdings Incorporated † | | | | | | | | | | | 100,482 | | | | 2,908,954 | |
| | | | | | | | | | | | | | | | |
| | | | |
| Media: 0.91% | | | | | | | | | | | | | | | | |
Nexstar Media Group Incorporated Class A « | | | | | | | | | | | 39,200 | | | | 2,877,280 | |
| | | | | | | | | | | | | | | | |
| | | | |
| Multiline Retail: 1.49% | | | | | | | | | | | | | | | | |
Ollie’s Bargain Outlet Holdings Incorporated † | | | | | | | | | | | 65,010 | | | | 4,713,225 | |
| | | | | | | | | | | | | | | | |
| | | | |
| Specialty Retail: 2.62% | | | | | | | | | | | | | | | | |
Five Below Incorporated † | | | | | | | | | | | 19,008 | | | | 1,857,272 | |
Lithia Motors Incorporated Class A | | | | | | | | | | | 51,930 | | | | 4,911,020 | |
National Vision Holdings Incorporated † | | | | | | | | | | | 41,336 | | | | 1,511,658 | |
| |
| | | | 8,279,950 | |
| | | | | | | | | | | | | | | | |
| | | | |
Energy: 1.70% | | | | | | | | | | | | | | | | |
| | | | |
| Energy Equipment & Services: 0.61% | | | | | | | | | | | | | | | | |
Cactus Incorporated Class A † | | | | | | | | | | | 30,901 | | | | 1,044,145 | |
FTS International Incorporated † | | | | | | | | | | | 61,612 | | | | 877,355 | |
| |
| | | | 1,921,500 | |
| | | | | | | | | | | | | | | | |
| | | | |
| Oil, Gas & Consumable Fuels: 1.09% | | | | | | | | | | | | | | | | |
Matador Resources Company † | | | | | | | | | | | 60,363 | | | | 1,813,908 | |
PDC Energy Incorporated † | | | | | | | | | | | 27,400 | | | | 1,656,330 | |
| |
| | | | 3,470,238 | |
| | | | | | | | | | | | | | | | |
| | | | |
Financials: 3.90% | | | | | | | | | | | | | | | | |
| | | | |
| Capital Markets: 1.16% | | | | | | | | | | | | | | | | |
Stifel Financial Corporation | | | | | | | | | | | 70,600 | | | | 3,688,850 | |
| | | | | | | | | | | | | | | | |
The accompanying notes are an integral part of these financial statements.
| | | | |
| 8 | | Wells Fargo VT Small Cap Growth Fund | | Portfolio of investments—June 30, 2018 (unaudited) |
| | | | | | | | | | | | | | | | |
| Security name | | | | | | | | Shares | | | Value | |
| | | | |
| Insurance: 1.70% | | | | | | | | | | | | | | | | |
Kinsale Capital Group Incorporated | | | | | | | | | | | 97,851 | | | $ | 5,368,106 | |
| | | | | | | | | | | | | | | | |
| | | | |
| Thrifts & Mortgage Finance: 1.04% | | | | | | | | | | | | | | | | |
LendingTree Incorporated †« | | | | | | | | | | | 15,428 | | | | 3,298,506 | |
| | | | | | | | | | | | | | | | |
| | | | |
Health Care: 27.99% | | | | | | | | | | | | | | | | |
| | | | |
| Biotechnology: 6.99% | | | | | | | | | | | | | | | | |
Audentes Therapeutics Incorporated † | | | | | | | | | | | 70,968 | | | | 2,711,687 | |
Clovis Oncology Incorporated † | | | | | | | | | | | 23,500 | | | | 1,068,545 | |
Heron Therapeutics Incorporated † | | | | | | | | | | | 36,220 | | | | 1,407,147 | |
Ligand Pharmaceuticals Incorporated †« | | | | | | | | | | | 44,438 | | | | 9,206,220 | |
Repligen Corporation † | | | | | | | | | | | 135,100 | | | | 6,355,104 | |
Sarepta Therapeutics Incorporated † | | | | | | | | | | | 7,169 | | | | 947,598 | |
Spark Therapeutics Incorporated † | | | | | | | | | | | 2,222 | | | | 183,893 | |
Translate BIO Incorporated † | | | | | | | | | | | 20,612 | | | | 260,742 | |
| | | | |
| | | | | | | | | | | | | | | 22,140,936 | |
| | | | | | | | | | | | | | | | |
| | | | |
| Health Care Equipment & Supplies: 12.55% | | | | | | | | | | | | | | | | |
Axogen Incorporated † | | | | | | | | | | | 132,890 | | | | 6,677,723 | |
Cantel Medical Corporation | | | | | | | | | | | 21,700 | | | | 2,134,412 | |
Glaukos Corporation †« | | | | | | | | | | | 35,640 | | | | 1,448,410 | |
Inogen Incorporated † | | | | | | | | | | | 31,030 | | | | 5,781,820 | |
Integra LifeSciences Holdings Corporation † | | | | | | | | | | | 89,260 | | | | 5,749,237 | |
iRhythm Technologies Incorporated † | | | | | | | | | | | 55,226 | | | | 4,480,485 | |
Merit Medical Systems Incorporated † | | | | | | | | | | | 70,500 | | | | 3,609,600 | |
Neogen Corporation † | | | | | | | | | | | 16,900 | | | | 1,355,211 | |
Neuronetics Incorporated † | | | | | | | | | | | 54,335 | | | | 1,445,854 | |
Nevro Corporation † | | | | | | | | | | | 65,579 | | | | 5,236,483 | |
NxStage Medical Incorporated † | | | | | | | | | | | 64,310 | | | | 1,794,249 | |
| | | | |
| | | | | | | | | | | | | | | 39,713,484 | |
| | | | | | | | | | | | | | | | |
| | | | |
| Health Care Providers & Services: 2.32% | | | | | | | | | | | | | | | | |
Amedisys Incorporated † | | | | | | | | | | | 16,000 | | | | 1,367,360 | |
HealthEquity Incorporated † | | | | | | | | | | | 79,525 | | | | 5,972,328 | |
| | | | |
| | | | | | | | | | | | | | | 7,339,688 | |
| | | | | | | | | | | | | | | | |
| | | | |
| Health Care Technology: 2.50% | | | | | | | | | | | | | | | | |
Teladoc Incorporated †« | | | | | | | | | | | 94,046 | | | | 5,459,370 | |
Vocera Communications Incorporated † | | | | | | | | | | | 82,130 | | | | 2,454,866 | |
| | | | |
| | | | | | | | | | | | | | | 7,914,236 | |
| | | | | | | | | | | | | | | | |
| | | | |
| Life Sciences Tools & Services: 0.64% | | | | | | | | | | | | | | | | |
Codexis Incorporated † | | | | | | | | | | | 140,720 | | | | 2,026,368 | |
| | | | | | | | | | | | | | | | |
| | | | |
| Pharmaceuticals: 2.99% | | | | | | | | | | | | | | | | |
Dova Pharmaceuticals Incorporated †« | | | | | | | | | | | 65,565 | | | | 1,961,705 | |
Kala Pharmaceuticals Incorporated † | | | | | | | | | | | 69,338 | | | | 952,011 | |
Optinose Incorporated †« | | | | | | | | | | | 79,330 | | | | 2,219,653 | |
Supernus Pharmaceuticals Incorporated † | | | | | | | | | | | 72,600 | | | | 4,345,110 | |
| | | | |
| | | | | | | | | | | | | | | 9,478,479 | |
| | | | | | | | | | | | | | | | |
The accompanying notes are an integral part of these financial statements.
| | | | | | |
| Portfolio of investments—June 30, 2018 (unaudited) | | Wells Fargo VT Small Cap Growth Fund | | | 9 | |
| | | | | | | | | | | | | | | | |
| Security name | | | | | | | | Shares | | | Value | |
| | | | |
Industrials: 15.74% | | | | | | | | | | | | | | | | |
| | | | |
| Aerospace & Defense: 0.99% | | | | | | | | | | | | | | | | |
Mercury Computer Systems Incorporated † | | | | | | | | | | | 81,968 | | | $ | 3,119,702 | |
| | | | | | | | | | | | | | | | |
| | | | |
| Airlines: 1.02% | | | | | | | | | | | | | | | | |
SkyWest Incorporated | | | | | | | | | | | 62,140 | | | | 3,225,066 | |
| | | | | | | | | | | | | | | | |
| | | | |
| Commercial Services & Supplies: 0.90% | | | | | | | | | | | | | | | | |
Advanced Disposal Services Incorporated † | | | | | | | | | | | 101,525 | | | | 2,515,790 | |
Healthcare Services Group Incorporated « | | | | | | | | | | | 7,900 | | | | 341,201 | |
| | | | |
| | | | | | | | | | | | | | | 2,856,991 | |
| | | | | | | | | | | | | | | | |
| | | | |
| Construction & Engineering: 3.61% | | | | | | | | | | | | | | | | |
Dycom Industries Incorporated † | | | | | | | | | | | 30,310 | | | | 2,864,598 | |
Granite Construction Incorporated | | | | | | | | | | | 46,180 | | | | 2,570,379 | |
MasTec Incorporated † | | | | | | | | | | | 118,200 | | | | 5,998,650 | |
| | | | |
| | | | | | | | | | | | | | | 11,433,627 | |
| | | | | | | | | | | | | | | | |
| | | | |
| Machinery: 4.04% | | | | | | | | | | | | | | | | |
John Bean Technologies Corporation | | | | | | | | | | | 37,740 | | | | 3,355,086 | |
Milacron Holdings Corporation † | | | | | | | | | | | 190,147 | | | | 3,599,483 | |
Mueller Water Products Incorporated Class A | | | | | | | | | | | 86,350 | | | | 1,012,022 | |
Rexnord Corporation † | | | | | | | | | | | 165,620 | | | | 4,812,917 | |
| | | | |
| | | | | | | | | | | | | | | 12,779,508 | |
| | | | | | | | | | | | | | | | |
| | | | |
| Professional Services: 3.77% | | | | | | | | | | | | | | | | |
ASGN Incorporated † | | | | | | | | | | | 106,981 | | | | 8,364,844 | |
WageWorks Incorporated † | | | | | | | | | | | 71,567 | | | | 3,578,350 | |
| | | | |
| | | | | | | | | | | | | | | 11,943,194 | |
| | | | | | | | | | | | | | | | |
| | | | |
| Trading Companies & Distributors: 1.41% | | | | | | | | | | | | | | | | |
Beacon Roofing Supply Incorporated † | | | | | | | | | | | 33,470 | | | | 1,426,491 | |
BMC Stock Holdings Incorporated † | | | | | | | | | | | 37,190 | | | | 775,412 | |
SiteOne Landscape Supply Incorporated † | | | | | | | | | | | 27,100 | | | | 2,275,587 | |
| | | | |
| | | | | | | | | | | | | | | 4,477,490 | |
| | | | | | | | | | | | | | | | |
| | | | |
Information Technology: 34.59% | | | | | | | | | | | | | | | | |
| | | | |
| Electronic Equipment, Instruments & Components: 2.78% | | | | | | | | | | | | | | | | |
Littelfuse Incorporated | | | | | | | | | | | 18,940 | | | | 4,321,729 | |
nLight Incorporated † | | | | | | | | | | | 12,438 | | | | 411,200 | |
Novanta Incorporated † | | | | | | | | | | | 65,400 | | | | 4,074,420 | |
| | | | |
| | | | | | | | | | | | | | | 8,807,349 | |
| | | | | | | | | | | | | | | | |
| | | | |
| Internet Software & Services: 13.55% | | | | | | | | | | | | | | | | |
2U Incorporated † | | | | | | | | | | | 33,360 | | | | 2,787,562 | |
Alarm.com Holdings Incorporated †« | | | | | | | | | | | 51,210 | | | | 2,067,860 | |
Cision Limited †« | | | | | | | | | | | 95,740 | | | | 1,431,313 | |
Coupa Software Incorporated † | | | | | | | | | | | 26,231 | | | | 1,632,617 | |
The accompanying notes are an integral part of these financial statements.
| | | | |
| 10 | | Wells Fargo VT Small Cap Growth Fund | | Portfolio of investments—June 30, 2018 (unaudited) |
| | | | | | | | | | | | | | | | |
| Security name | | | | | | | | Shares | | | Value | |
| | | | |
| Internet Software & Services (continued) | | | | | | | | | | | | | | | | |
Envestnet Incorporated † | | | | | | | | | | | 108,511 | | | $ | 5,962,679 | |
EverQuote Incorporated Class A † | | | | | | | | | | | 21,167 | | | | 383,546 | |
Five9 Incorporated † | | | | | | | | | | | 145,440 | | | | 5,027,861 | |
GTT Communications Incorporated †« | | | | | | | | | | | 72,440 | | | | 3,259,800 | |
Instructure Incorporated † | | | | | | | | | | | 51,910 | | | | 2,208,771 | |
Q2 Holdings Incorporated † | | | | | | | | | | | 124,376 | | | | 7,095,651 | |
SendGrid Incorporated † | | | | | | | | | | | 139,702 | | | | 3,704,897 | |
SPS Commerce Incorporated † | | | | | | | | | | | 68,082 | | | | 5,002,665 | |
Wix.com Limited † | | | | | | | | | | | 23,300 | | | | 2,336,990 | |
| | | | |
| | | | | | | | | | | | | | | 42,902,212 | |
| | | | | | | | | | | | | | | | |
| | | | |
| IT Services: 3.13% | | | | | | | | | | | | | | | | |
EVO Payments Incorporated Class A †« | | | | | | | | | | | 71,891 | | | | 1,479,517 | |
InterXion Holding NV † | | | | | | | | | | | 134,790 | | | | 8,413,592 | |
| | | | |
| | | | | | | | | | | | | | | 9,893,109 | |
| | | | | | | | | | | | | | | | |
| | | | |
| Semiconductors & Semiconductor Equipment: 3.29% | | | | | | | | | | | | | | | | |
Diodes Incorporated † | | | | | | | | | | | 99,430 | | | | 3,427,352 | |
Monolithic Power Systems Incorporated | | | | | | | | | | | 33,890 | | | | 4,530,076 | |
Semtech Corporation † | | | | | | | | | | | 51,900 | | | | 2,441,895 | |
| | | | |
| | | | | | | | | | | | | | | 10,399,323 | |
| | | | | | | | | | | | | | | | |
| | | | |
| Software: 11.84% | | | | | | | | | | | | | | | | |
Altair Engineering Incorporated Class A † | | | | | | | | | | | 91,862 | | | | 3,139,843 | |
BlackLine Incorporated † | | | | | | | | | | | 65,453 | | | | 2,842,624 | |
Bottomline Technologies (DE) Incorporated † | | | | | | | | | | | 67,020 | | | | 3,339,607 | |
HubSpot Incorporated † | | | | | | | | | | | 29,648 | | | | 3,717,859 | |
Pivotal Software Incorporated Class A † | | | | | | | | | | | 38,728 | | | | 939,929 | |
Proofpoint Incorporated † | | | | | | | | | | | 44,280 | | | | 5,105,927 | |
Rapid7 Incorporated † | | | | | | | | | | | 110,678 | | | | 3,123,333 | |
RealPage Incorporated † | | | | | | | | | | | 84,500 | | | | 4,655,950 | |
RingCentral Incorporated Class A † | | | | | | | | | | | 27,430 | | | | 1,929,701 | |
SailPoint Technologies Holdings Incorporated † | | | | | | | | | | | 61,169 | | | | 1,501,087 | |
Talend SA ADR † | | | | | | | | | | | 72,239 | | | | 4,499,045 | |
Zendesk Incorporated † | | | | | | | | | | | 46,900 | | | | 2,555,581 | |
Zscaler Incorporated †« | | | | | | | | | | | 3,495 | | | | 124,946 | |
| | | | |
| | | | | | | | | | | | | | | 37,475,432 | |
| | | | | | | | | | | | | | | | |
| | | | |
Materials: 0.67% | | | | | | | | | | | | | | | | |
| | | | |
| Chemicals: 0.67% | | | | | | | | | | | | | | | | |
PQ Group Holdings Incorporated † | | | | | | | | | | | 117,080 | | | | 2,107,438 | |
| | | | | | | | | | | | | | | | |
| | | | |
Total Common Stocks (Cost $225,187,038) | | | | | | | | | | | | | | | 309,901,944 | |
| | | | | | | | | | | | | | | | |
The accompanying notes are an integral part of these financial statements.
| | | | | | |
| Portfolio of investments—June 30, 2018 (unaudited) | | Wells Fargo VT Small Cap Growth Fund | | | 11 | |
| | | | | | | | | | | | | | | | |
| Security name | | Yield | | | | | | Shares | | | Value | |
| | | | |
Short-Term Investments: 14.03% | | | | | | | | | | | | | | | | |
| | | | |
| Investment Companies: 14.03% | | | | | | | | | | | | | | | | |
Securities Lending Cash Investment LLC (l)(r)(u) | | | 2.09 | % | | | | | | | 25,792,870 | | | $ | 25,795,450 | |
Wells Fargo Government Money Market Fund Select Class (l)(u) | | | 1.83 | | | | | | | | 18,637,769 | | | | 18,637,769 | |
| | | | |
Total Short-Term Investments (Cost $44,432,214) | | | | | | | | | | | | | | | 44,433,219 | |
| | | | | | | | | | | | | | | | |
| | | | | | | | |
| Total investments in securities (Cost $269,619,252) | | | 111.93 | % | | | 354,335,163 | |
Other assets and liabilities, net | | | (11.93 | ) | | | (37,776,309 | ) |
| | | | | | | | |
| Total net assets | | | 100.00 | % | | $ | 316,558,854 | |
| | | | | | | | |
| † | Non-income-earning security |
| « | All or a portion of this security is on loan. |
| (l) | The issuer of the security is an affiliated person of the Fund as defined in the Investment Company Act of 1940. |
| (r) | The investment is a non-registered investment company purchased with cash collateral received from securities on loan. |
| (u) | The rate represents the 7-day annualized yield at period end. |
Abbreviations:
| ADR | American depositary receipt |
Investments in Affiliates
An affiliated investment is an investment in which the Fund owns at least 5% of the outstanding voting shares of the issuer or as a result of other relationships, such as the Fund and the issuer having the same investment manager. Transactions with issuers that were either affiliated persons of the Fund at the beginning of the period or the end of the period were as follows:
| | | | | | | | | | | | | | | | | | | | | | | | | | | | | | | | | | | | |
| | | Shares,
beginning of
period | | | Shares
purchased | | | Shares
sold | | | Shares,
end of
period | | | Net
realized
gains
(losses) | | | Net
change in
unrealized
gains
(losses) | | | Income
from
affiliated
securities | | | Value,
end
of period | | | % of
net
assets | |
Short-Term Investments | | | | | | | | | | | | | | | | | | | | | | | | | | | | | | | | | | | | |
Investment Companies | | | | | | | | | | | | | | | | | | | | | | | | | | | | | | | | | | | | |
Securities Lending Cash Investment LLC | | | 15,127,864 | | | | 112,125,820 | | | | 101,460,814 | | | | 25,792,870 | | | $ | 0 | | | $ | 0 | | | $ | 135,627 | | | $ | 25,795,450 | | | | | |
Wells Fargo Government Money Market Fund Select Class | | | 3,242,460 | | | | 56,084,831 | | | | 40,689,522 | | | | 18,637,769 | | | | 0 | | | | 0 | | | | 43,213 | | | | 18,637,769 | | | | | |
| | | | | | | | | | | | | | | | | | | | | | | | | | | | | | | | | | | | |
| | | | | | | | | | | | | | | | | | $ | 0 | | | $ | 0 | | | $ | 178,840 | | | $ | 44,433,219 | | | | 14.03 | % |
| | | | | | | | | | | | | | | | | | | | | | | | | | | | | | | | | | | | |
The accompanying notes are an integral part of these financial statements.
| | | | |
| 12 | | Wells Fargo VT Small Cap Growth Fund | | Statement of assets and liabilities—June 30, 2018 (unaudited) |
| | | | |
| | | | |
| |
Assets | | | | |
Investments in unaffiliated securities (including $22,138,827 of securities loaned), at value (cost $225,187,038) | | $ | 309,901,944 | |
Investments in affiliated securities, at value (cost $44,432,214) | | | 44,433,219 | |
Receivable for investments sold | | | 5,537,991 | |
Receivable for Fund shares sold | | | 2,182,842 | |
Receivable for dividends | | | 35,620 | |
Receivable for securities lending income | | | 15,543 | |
Prepaid expenses and other assets | | | 4,650 | |
| | | | |
Total assets | | | 362,111,809 | |
| | | | |
| |
Liabilities | | | | |
Payable upon receipt of securities loaned | | | 25,791,945 | |
Payable for investments purchased | | | 19,253,736 | |
Management fee payable | | | 215,871 | |
Payable for Fund shares redeemed | | | 171,683 | |
Distribution fee payable | | | 61,942 | |
Administration fees payable | | | 21,588 | |
Trustees’ fees and expenses payable | | | 1,525 | |
Accrued expenses and other liabilities | | | 34,665 | |
| | | | |
Total liabilities | | | 45,552,955 | |
| | | | |
Total net assets | | $ | 316,558,854 | |
| | | | |
| |
NET ASSETS CONSIST OF | | | | |
Paid-in capital | | $ | 174,404,193 | |
Accumulated net investment loss | | | (1,030,500 | ) |
Accumulated net realized gains on investments | | | 58,469,250 | |
Net unrealized gains on investments | | | 84,715,911 | |
| | | | |
Total net assets | | $ | 316,558,854 | |
| | | | |
| |
COMPUTATION OF NET ASSET VALUE PER SHARE | | | | |
Net assets – Class 1 | | $ | 25,578,566 | |
Shares outstanding – Class 11 | | | 2,064,042 | |
Net asset value per share – Class 1 | | | $12.39 | |
Net assets – Class 2 | | $ | 290,980,288 | |
Shares outstanding – Class 21 | | | 24,084,607 | |
Net asset value per share – Class 2 | | | $12.08 | |
| 1 | The Fund has an unlimited number of authorized shares. |
The accompanying notes are an integral part of these financial statements.
| | | | | | |
| Statement of operations—six months ended June 30, 2018 (unaudited) | | Wells Fargo VT Small Cap Growth Fund | | | 13 | |
| | | | |
| | | | |
| |
Investment income | | | | |
Dividends | | $ | 421,720 | |
Securities lending income from affiliates, net | | | 135,627 | |
Income from affiliated securities | | | 43,213 | |
| | | | |
Total investment income | | | 600,560 | |
| | | | |
| |
Expenses | | | | |
Management fee | | | 1,136,314 | |
Administration fees | | | | |
Class 1 | | | 9,490 | |
Class 2 | | | 104,141 | |
Distribution fee | | | | |
Class 2 | | | 325,441 | |
Custody and accounting fees | | | 9,453 | |
Professional fees | | | 21,628 | |
Shareholder report expenses | | | 8,386 | |
Trustees’ fees and expenses | | | 9,645 | |
Other fees and expenses | | | 5,534 | |
| | | | |
Total expenses | | | 1,630,032 | |
| | | | |
Net investment loss | | | (1,029,472 | ) |
| | | | |
| |
REALIZED AND UNREALIZED GAINS (LOSSES) ON INVESTMENTS | | | | |
Net realized gains on investments | | | 29,490,375 | |
Net change in unrealized gains (losses) on investments | | | 19,938,480 | |
| | | | |
Net realized and unrealized gains (losses) on investments | | | 49,428,855 | |
| | | | |
Net increase in net assets resulting from operations | | $ | 48,399,383 | |
| | | | |
The accompanying notes are an integral part of these financial statements.
| | | | |
| 14 | | Wells Fargo VT Small Cap Growth Fund | | Statement of changes in net assets |
| | | | | | | | | | | | | | | | |
| | | Six months ended
June 30, 2018
(unaudited) | | | Year ended
December 31, 2017 | |
| | | |
Operations | | | | | | | | | | | | |
Net investment loss | | | | | | $ | (1,029,472 | ) | | | | | | $ | (2,165,942 | ) |
Net realized gains on investments | | | | | | | 29,490,375 | | | | | | | | 29,813,894 | |
Net change in unrealized gains (losses) on investments | | | | | | | 19,938,480 | | | | | | | | 28,513,468 | |
| | | | |
Net increase in net assets resulting from operations | | | | | | | 48,399,383 | | | | | | | | 56,161,420 | |
| | | | |
| | | |
Distributions to shareholders from | | | | | | | | | | | | |
Net realized gains | | | | | | | | | | | | | | | | |
Class 1 | | | | | | | 0 | | | | | | | | (638,351 | ) |
Class 2 | | | | | | | 0 | | | | | | | | (6,508,667 | ) |
| | | | |
Total distributions to shareholders | | | | | | | 0 | | | | | | | | (7,147,018 | ) |
| | | | |
| | | | |
Capital share transactions | | | Shares | | | | | | | | Shares | | | | | |
Proceeds from shares sold | | | | | | | | | | | | | | | | |
Class 1 | | | 136,164 | | | | 1,602,821 | | | | 164,104 | | | | 1,539,941 | |
Class 2 | | | 2,591,867 | | | | 29,447,296 | | | | 3,302,688 | | | | 31,270,811 | |
| | | | |
| | | | | | | 31,050,117 | | | | | | | | 32,810,752 | |
| | | | |
Reinvestment of distributions | | | | | | | | | | | | | | | | |
Class 1 | | | 0 | | | | 0 | | | | 66,150 | | | | 638,351 | |
Class 2 | | | 0 | | | | 0 | | | | 690,209 | | | | 6,508,667 | |
| | | | |
| | | | | | | 0 | | | | | | | | 7,147,018 | |
| | | | |
Payment for shares redeemed | | | | | | | | | | | | | | | | |
Class 1 | | | (238,099 | ) | | | (2,708,069 | ) | | | (479,821 | ) | | | (4,610,025 | ) |
Class 2 | | | (1,929,245 | ) | | | (21,233,175 | ) | | | (4,899,352 | ) | | | (46,583,769 | ) |
| | | | |
| | | | | | | (23,941,244 | ) | | | | | | | (51,193,794 | ) |
| | | | |
Net increase (decrease) in net assets resulting from capital share transactions | | | | | | | 7,108,873 | | | | | | | | (11,236,024 | ) |
| | | | |
Total increase in net assets | | | | | | | 55,508,256 | | | | | | | | 37,778,378 | |
| | | | |
| | |
Net assets | | | | | | | | |
Beginning of period | | | | | | | 261,050,598 | | | | | | | | 223,272,220 | |
| | | | |
End of period | | | | | | $ | 316,558,854 | | | | | | | $ | 261,050,598 | |
| | | | |
Accumulated net investment loss | | | | | | $ | (1,030,500 | ) | | | | | | $ | (1,028 | ) |
| | | | |
The accompanying notes are an integral part of these financial statements.
| | | | | | |
| Financial highlights | | Wells Fargo VT Small Cap Growth Fund | | | 15 | |
(For a share outstanding throughout each period)
| | | | | | | | | | | | | | | | | | | | | | | | |
| | | Six months ended
June 30, 2018
(unaudited) | | | Year ended December 31 | |
| CLASS 1 | | 2017 | | | 2016 | | | 2015 | | | 2014 | | | 2013 | |
Net asset value, beginning of period | | | $10.43 | | | | $8.51 | | | | $8.70 | | | | $10.08 | | | | $11.32 | | | | $7.93 | |
Net investment loss | | | (0.01 | ) | | | (0.04 | ) | | | (0.01 | )1 | | | (0.06 | ) | | | (0.07 | ) | | | (0.07 | ) |
Net realized and unrealized gains (losses) on investments | | | 1.97 | | | | 2.24 | | | | 0.65 | | | | (0.02 | ) | | | (0.21 | ) | | | 3.98 | |
| | | | | | | | | | | | | | | | | | | | | | | | |
Total from investment operations | | | 1.96 | | | | 2.20 | | | | 0.64 | | | | (0.08 | ) | | | (0.28 | ) | | | 3.91 | |
Distributions to shareholders from | | | | | | | | | | | | | | | | | | | | | | | | |
Net realized gains | | | 0.00 | | | | (0.28 | ) | | | (0.83 | ) | | | (1.30 | ) | | | (0.96 | ) | | | (0.52 | ) |
Net asset value, end of period | | | $12.39 | | | | $10.43 | | | | $8.51 | | | | $8.70 | | | | $10.08 | | | | $11.32 | |
Total return2 | | | 18.79 | % | | | 26.14 | % | | | 8.10 | % | | | (2.63 | )% | | | (1.67 | )% | | | 50.55 | % |
Ratios to average net assets (annualized) | | | | | | | | | | | | | | | | | | | | | | | | |
Gross expenses | | | 0.92 | % | | | 0.94 | % | | | 0.94 | % | | | 0.93 | % | | | 0.93 | % | | | 0.93 | % |
Net expenses | | | 0.92 | % | | | 0.94 | % | | | 0.94 | % | | | 0.93 | % | | | 0.93 | % | | | 0.93 | % |
Net investment loss | | | (0.49 | )% | | | (0.65 | )% | | | (0.10 | )% | | | (0.69 | )% | | | (0.75 | )% | | | (0.73 | )% |
Supplemental data | | | | | | | | | | | | | | | | | | | | | | | | |
Portfolio turnover rate | | | 33 | % | | | 72 | % | | | 89 | % | | | 77 | % | | | 54 | % | | | 67 | % |
Net assets, end of period (000s omitted) | | | $25,579 | | | | $22,591 | | | | $20,554 | | | | $22,402 | | | | $28,121 | | | | $35,192 | |
| 1 | Calculated based upon average shares outstanding |
| 2 | Returns for periods of less than one year are not annualized. Performance figures of the Fund do not reflect fees charged pursuant to the terms of variable life insurance policies and variable annuity contracts. |
The accompanying notes are an integral part of these financial statements.
| | | | |
| 16 | | Wells Fargo VT Small Cap Growth Fund | | Financial highlights |
(For a share outstanding throughout each period)
| | | | | | | | | | | | | | | | | | | | | | | | |
| | | Six months ended
June 30, 2018 (unaudited) | | | Year ended December 31 | |
| CLASS 2 | | 2017 | | | 2016 | | | 2015 | | | 2014 | | | 2013 | |
Net asset value, beginning of period | | | $10.18 | | | | $8.33 | | | | $8.56 | | | | $9.96 | | | | $11.22 | | | | $7.88 | |
Net investment loss | | | (0.04 | ) | | | (0.09 | ) | | | (0.03 | ) | | | (0.08 | ) | | | (0.10 | ) | | | (0.09 | ) |
Net realized and unrealized gains (losses) on investments | | | 1.94 | | | | 2.22 | | | | 0.63 | | | | (0.02 | ) | | | (0.20 | ) | | | 3.95 | |
| | | | | | | | | | | | | | | | | | | | | | | | |
Total from investment operations | | | 1.90 | | | | 2.13 | | | | 0.60 | | | | (0.10 | ) | | | (0.30 | ) | | | 3.86 | |
Distributions to shareholders from | | | | | | | | | | | | | | | | | | | | | | | | |
Net realized gains | | | 0.00 | | | | (0.28 | ) | | | (0.83 | ) | | | (1.30 | ) | | | (0.96 | ) | | | (0.52 | ) |
Net asset value, end of period | | | $12.08 | | | | $10.18 | | | | $8.33 | | | | $8.56 | | | | $9.96 | | | | $11.22 | |
Total return1 | | | 18.66 | % | | | 25.86 | % | | | 7.75 | % | | | (2.88 | )% | | | (1.88 | )% | | | 50.23 | % |
Ratios to average net assets (annualized) | | | | | | | | | | | | | | | | | | | | | | | | |
Gross expenses | | | 1.17 | % | | | 1.19 | % | | | 1.19 | % | | | 1.18 | % | | | 1.18 | % | | | 1.18 | % |
Net expenses | | | 1.17 | % | | | 1.19 | % | | | 1.19 | % | | | 1.18 | % | | | 1.18 | % | | | 1.18 | % |
Net investment loss | | | (0.75 | )% | | | (0.90 | )% | | | (0.35 | )% | | | (0.93 | )% | | | (1.00 | )% | | | (0.98 | )% |
Supplemental data | | | | | | | | | | | | | | | | | | | | | | | | |
Portfolio turnover rate | | | 33 | % | | | 72 | % | | | 89 | % | | | 77 | % | | | 54 | % | | | 67 | % |
Net assets, end of period (000s omitted) | | | $290,980 | | | | $238,460 | | | | $202,718 | | | | $226,867 | | | | $226,966 | | | | $250,473 | |
| 1 | Returns for periods of less than one year are not annualized. Performance figures of the Fund do not reflect fees charged pursuant to the terms of variable life insurance policies and variable annuity contracts. |
The accompanying notes are an integral part of these financial statements.
| | | | | | |
| Notes to financial statements (unaudited) | | Wells Fargo VT Small Cap Growth Fund | | | 17 | |
1. ORGANIZATION
Wells Fargo Variable Trust (the “Trust”), a Delaware statutory trust organized on March 10, 1999, is an open-end management investment company registered under the Investment Company Act of 1940, as amended (the “1940 Act”). As an investment company, the Trust follows the accounting and reporting guidance in Financial Accounting Standards Board Accounting Standards Codification Topic 946, Financial Services – Investment Companies. These financial statements report on the Wells Fargo VT Small Cap Growth Fund (the “Fund”) which is a diversified series of the Trust. The Trust offers shares of the Fund to separate accounts of various life insurance companies as funding vehicles for certain variable annuity contracts and variable life insurance policies.
2. SIGNIFICANT ACCOUNTING POLICIES
The following significant accounting policies, which are consistently followed in the preparation of the financial statements of the Fund, are in conformity with U.S. generally accepted accounting principles which require management to make estimates and assumptions that affect the reported amounts of assets and liabilities, disclosure of contingent assets and liabilities at the date of the financial statements, and the reported amounts of revenues and expenses during the reporting period. Actual results could differ from those estimates.
Securities valuation
All investments are valued each business day as of the close of regular trading on the New York Stock Exchange (generally 4 p.m. Eastern Time), although the Fund may deviate from this calculation time under unusual or unexpected circumstances.
Equity securities that are listed on a foreign or domestic exchange or market are valued at the official closing price or, if none, the last sales price. If no sale occurs on the principal exchange or market that day, a fair value price will be determined in accordance with the Fund’s Valuation Procedures.
Investments in registered open-end investment companies are valued at net asset value. Interests in non-registered investment companies that are redeemable at net asset value are fair valued normally at net asset value.
Investments which are not valued using any of the methods discussed above are valued at their fair value, as determined in good faith by the Board of Trustees of the Fund. The Board of Trustees has established a Valuation Committee comprised of the Trustees and has delegated to it the authority to take any actions regarding the valuation of portfolio securities that the Valuation Committee deems necessary or appropriate, including determining the fair value of portfolio securities, unless the determination has been delegated to the Wells Fargo Asset Management Pricing Committee at Wells Fargo Funds Management, LLC (“Funds Management”). The Board of Trustees retains the authority to make or ratify any valuation decisions or approve any changes to the Valuation Procedures as it deems appropriate. On a quarterly basis, the Board of Trustees receives reports on any valuation actions taken by the Valuation Committee or the Wells Fargo Asset Management Pricing Committee which may include items for ratification.
Valuations of fair valued securities are compared to the next actual sales price when available, or other appropriate market values, to assess the continued appropriateness of the fair valuation methodologies used. These securities are fair valued on a day-to-day basis, taking into consideration changes to appropriate market information and any significant changes to the inputs considered in the valuation process until there is a readily available price provided on an exchange or by an independent pricing service. Valuations received from an independent pricing service or independent broker-dealer quotes are periodically validated by comparisons to most recent trades and valuations provided by other independent pricing services in addition to the review of prices by the manager and/or subadviser. Unobservable inputs used in determining fair valuations are identified based on the type of security, taking into consideration factors utilized by market participants in valuing the investment, knowledge about the issuer and the current market environment.
Securities lending
The Fund may lend its securities from time to time in order to earn additional income in the form of fees or interest on securities received as collateral or the investment of any cash received as collateral. The Fund continues to receive interest or dividends on the securities loaned. The Fund receives collateral in the form of cash or securities with a value at least equal to the value of the securities on loan. The value of the loaned securities is determined at the close of each business day and any additional required collateral is delivered to the Fund on the next business day. In a securities lending transaction, the net asset value of the Fund will be affected by an increase or decrease in the value of the securities loaned and by an increase or decrease in the value of the instrument in which collateral is invested. The amount of securities lending activity undertaken by the Fund fluctuates from time to time. In the event of default or bankruptcy by the borrower, the Fund may be prevented from recovering the loaned securities or gaining access to the collateral or may experience delays or costs in doing so. In addition, the investment of any cash collateral received may lose all or part of its value. The Fund has the right under the lending agreement to recover the securities from the borrower on demand.
| | | | |
| 18 | | Wells Fargo VT Small Cap Growth Fund | | Notes to financial statements (unaudited) |
The Fund lends its securities through an unaffiliated securities lending agent. Cash collateral received in connection with its securities lending transactions is invested in Securities Lending Cash Investments, LLC (the “Securities Lending Fund”). The Securities Lending Fund is exempt from registration under Section 3(c)(7) of the 1940 Act and is managed by Funds Management and is subadvised by Wells Capital Management Incorporated (“WellsCap”), an affiliate of Funds Management and an indirect wholly owned subsidiary of Wells Fargo & Company (“Wells Fargo”). Funds Management receives an advisory fee starting at 0.05% and declining to 0.01% as the average daily net assets of the Securities Lending Fund increase. All of the fees received by Funds Management are paid to WellsCap for its services as subadviser. The Securities Lending Fund seeks to provide a positive return compared to the daily Fed Funds Open Rate by investing in high-quality, U.S. dollar-denominated short-term money market instruments. Securities Lending Fund investments are valued at the evaluated bid price provided by an independent pricing service. Income earned from investment in the Securities Lending Fund is included in securities lending income from affiliates (net of fees and rebates) on the Statement of Operations
Security transactions and income recognition
Securities transactions are recorded on a trade date basis. Realized gains or losses are recorded on the basis of identified cost.
Dividend income is recognized on the ex-dividend date.
Distributions to shareholders
Distributions to shareholders from net investment income and any net realized gains are recorded on the ex-dividend date and paid at least annually. Such distributions are determined in accordance with income tax regulations and may differ from U.S. generally accepted accounting principles. Dividend sources are estimated at the time of declaration. The tax character of distributions is determined as of the Fund’s fiscal year end. Therefore, a portion of the Fund’s distributions made prior to the Fund’s fiscal year end may be categorized as a tax return of capital at year end.
Federal and other taxes
The Fund intends to continue to qualify as a regulated investment company by distributing substantially all of its investment company taxable income and any net realized capital gains (after reduction for capital loss carryforwards) sufficient to relieve it from all, or substantially all, federal income taxes. Accordingly, no provision for federal income taxes was required.
The Fund’s income and federal excise tax returns and all financial records supporting those returns for the prior three fiscal years are subject to examination by the federal and Delaware revenue authorities. Management has analyzed the Fund’s tax positions taken on federal, state, and foreign tax returns for all open tax years and does not believe that there are any uncertain tax positions that require recognition of a tax liability.
As of June 30, 2018, the aggregate cost of all investments for federal income tax purposes was $269,486,510 and the unrealized gains (losses) consisted of:
| | | | |
Gross unrealized gains | | $ | 87,142,663 | |
Gross unrealized losses | | | (2,294,010 | ) |
Net unrealized gains | | $ | 84,848,653 | |
Class allocations
The separate classes of shares offered by the Fund differ principally in distribution fees. Class specific expenses are charged directly to that share class. Investment income, common expenses, and realized and unrealized gains (losses) on investments are allocated daily to each class of shares based on the relative proportion of net assets of each class.
3. FAIR VALUATION MEASUREMENTS
Fair value measurements of investments are determined within a framework that has established a fair value hierarchy based upon the various data inputs utilized in determining the value of the Fund’s investments. The three-level hierarchy gives the highest priority to unadjusted quoted prices in active markets for identical assets or liabilities (Level 1) and the lowest priority to unobservable inputs (Level 3). The Fund’s investments are classified within the fair value hierarchy based on the lowest level of input that is significant to the fair value measurement. The inputs are summarized into three broad levels as follows:
| ∎ | | Level 1 – quoted prices in active markets for identical securities |
| ∎ | | Level 2 – other significant observable inputs (including quoted prices for similar securities, interest rates, prepayment speeds, credit risk, etc.) |
| ∎ | | Level 3 – significant unobservable inputs (including the Fund’s own assumptions in determining the fair value of investments) |
| | | | | | |
| Notes to financial statements (unaudited) | | Wells Fargo VT Small Cap Growth Fund | | | 19 | |
The inputs or methodologies used for valuing investments in securities are not necessarily an indication of the risk associated with investing in those securities.
The following is a summary of the inputs used in valuing the Fund’s assets and liabilities as of June 30, 2018:
| | | | | | | | | | | | | | | | |
| | | Quoted prices (Level 1) | | | Other significant
observable inputs
(Level 2) | | | Significant
unobservable inputs (Level 3) | | | Total | |
Assets | | | | | | | | | | | | | | | | |
Investments in: | | | | | | | | | | | | | | | | |
| | | | |
Common stocks | | | | | | | | | | | | | | | | |
Consumer discretionary | | $ | 42,121,112 | | | $ | 0 | | | $ | 0 | | | $ | 42,121,112 | |
Energy | | | 5,391,738 | | | | 0 | | | | 0 | | | | 5,391,738 | |
Financials | | | 12,355,462 | | | | 0 | | | | 0 | | | | 12,355,462 | |
Health care | | | 88,613,191 | | | | 0 | | | | 0 | | | | 88,613,191 | |
Industrials | | | 49,835,578 | | | | 0 | | | | 0 | | | | 49,835,578 | |
Information technology | | | 109,477,425 | | | | 0 | | | | 0 | | | | 109,477,425 | |
Materials | | | 2,107,438 | | | | 0 | | | | 0 | | | | 2,107,438 | |
| | | | |
Short-term investments | | | | | | | | | | | | | | | | |
Investment companies | | | 18,637,769 | | | | 0 | | | | 0 | | | | 18,637,769 | |
Investments measured at net asset value* | | | | | | | | | | | | | | | 25,795,450 | |
Total assets | | $ | 328,539,713 | | | $ | 0 | | | $ | 0 | | | $ | 354,335,163 | |
| * | Investments that are measured at fair value using the net asset value per share (or its equivalent) as a practical expedient have not been categorized in the fair value hierarchy. The fair value amount presented in the table is intended to permit reconciliation of the fair value hierarchy to the amounts presented in the Statement of Assets and Liabilities. The Fund’s investment in Securities Lending Cash Investments, LLC valued at $25,795,450 does not have a redemption period notice, can be redeemed daily and does not have any unfunded commitments. |
The Fund recognizes transfers between levels within the fair value hierarchy at the end of the reporting period. At June 30, 2018, the Fund did not have any transfers into/out of Level 1, Level 2, or Level 3.
4. TRANSACTIONS WITH AFFILIATES
Management fee
Funds Management, an indirect wholly owned subsidiary of Wells Fargo, is the manager of the Fund and provides advisory and fund-level administrative services under an investment management agreement. Under the investment management agreement, Funds Management is responsible for, among other services, implementing the investment objectives and strategies of the Fund, supervising the subadviser and providing fund-level administrative services in connection with the Fund’s operations. As compensation for its services under the investment management agreement, Funds Management is entitled to receive an annual management fee starting at 0.80% and declining to 0.63% as the average daily net assets of the Fund increase. For the six months ended June 30, 2018, the management fee was equivalent to an annual rate of 0.80% of the Fund’s average daily net assets.
Funds Management has retained the services of a subadviser to provide daily portfolio management to the Fund. The fee for subadvisory services is borne by Funds Management. WellsCap is the subadviser to the Fund and is entitled to receive a fee from Funds Management at an annual rate starting at 0.55% and declining to 0.40% as the average daily net assets of the Fund increase.
Administration fees
Under a class-level administration agreement, Funds Management provides class-level administrative services to the Fund, which includes paying fees and expenses for services provided by the transfer agent, sub-transfer agents, omnibus account servicers and record-keepers. As compensation for its services under the class-level administration agreement, Funds Management receives a class level administration fee of 0.08% which is calculated based on the average daily net assets of each class.
Funds Management has contractually waived and/or reimbursed management and administration fees to the extent necessary to maintain certain net operating expense ratios for the Fund. When each class of the Fund has exceeded its expense cap, Funds Management has waived fees and/or reimbursed expenses from fund level expenses on a proportionate basis and then
| | | | |
| 20 | | Wells Fargo VT Small Cap Growth Fund | | Notes to financial statements (unaudited) |
from class specific expenses; otherwise, waivers and/or reimbursements are applied against class specific expenses before fund level expenses. Funds Management has committed through April 30, 2019 to waive fees and/or reimburse expenses to the extent necessary to cap the Fund’s expenses at 0.95% for Class 1 shares and 1.20% for Class shares. After this time, the cap may be increased or the commitment to maintain the cap may be terminated only with the approval of the Board of Trustees.
Distribution fee
The Trust has adopted a distribution plan for Class 2 shares of the Fund pursuant to Rule 12b-1 under the 1940 Act. A distribution fee is charged to Class 2 shares and paid to Wells Fargo Funds Distributor, LLC, the principal underwriter, at an annual rate of 0.25% of the average daily net assets of Class 2 shares.
Interfund transactions
The Fund may purchase or sell portfolio investment securities to certain other Wells Fargo affiliates pursuant to Rule 17a-7 under the 1940 Act and under procedures adopted by the Board of Trustees. The procedures have been designed to ensure that these interfund transactions, which do not incur broker commissions, are effected at current market prices.
5. INVESTMENT PORTFOLIO TRANSACTIONS
Purchases and sales of investments, excluding U.S. government obligations (if any) and short-term securities, for the six months ended June 30, 2018 were $95,544,370 and $91,795,481, respectively.
6. BANK BORROWINGS
The Trust and Wells Fargo Funds Trust (excluding the money market funds and certain other funds) are parties to a $280,000,000 revolving credit agreement whereby the Fund is permitted to use bank borrowings for temporary or emergency purposes, such as to fund shareholder redemption requests. Interest under the credit agreement is charged to the Fund based on a borrowing rate equal to the higher of the Federal Funds rate in effect on that day plus 1.25% or the overnight LIBOR rate in effect on that day plus 1.25%. In addition, an annual commitment fee equal to 0.25% of the unused balance is allocated to each participating fund.
For the six months ended June 30, 2018, there were no borrowings by the Fund under the agreement.
7. CONCENTRATION RISK
Concentration risks result from exposure to a limited number of sectors. A fund that invests a substantial portion of its assets in any sector may be more affected by changes in that sector than would be a fund whose investments are not heavily weighted in any sector.
8. INDEMNIFICATION
Under the Trust’s organizational documents, the officers and Trustees have been granted certain indemnification rights against certain liabilities that may arise out of performance of their duties to the Trust. Additionally, in the normal course of business, the Trust may enter into contracts with service providers that contain a variety of indemnification clauses. The Trust’s maximum exposure under these arrangements is dependent on future claims that may be made against the Fund and, therefore, cannot be estimated.
9. SUBSEQUENT DISTRIBUTIONS
On July 13, 2018, the Fund declared distributions from long-term capital gains to shareholders of record on July 12, 2018. The per share amounts payable on July 16, 2018 were as follows:
| | | | |
| | | Long-term
capital gains | |
Class 1 | | $ | 1.11705 | |
Class 2 | | | 1.11705 | |
These distributions are not reflected in the accompanying financial statements.
| | | | | | |
| Other information (unaudited) | | Wells Fargo VT Small Cap Growth Fund | | | 21 | |
PROXY VOTING INFORMATION
A description of the policies and procedures that the Fund uses to determine how to vote proxies relating to portfolio securities is available, upon request, by calling 1-800-260-5969, visiting our website at wellsfargofunds.com, or visiting the SEC website at sec.gov. Information regarding how the Fund voted proxies relating to portfolio securities during the most recent 12-month period ended June 30 is available on the Fund’s website at wellsfargofunds.com or by visiting the SEC website at sec.gov.
PORTFOLIO HOLDINGS INFORMATION
The complete portfolio holdings for the Fund are publicly available monthly on the Fund’s website (wellsfargofunds.com), on a one-month delayed basis. In addition, top ten holdings information (excluding derivative positions) for the Fund is publicly available on the Fund’s website on a monthly, seven-day or more delayed basis. The Fund files its complete schedule of portfolio holdings with the SEC for the first and third quarters of each fiscal year on Form N-Q, which is available by visiting the SEC website at sec.gov. In addition, the Fund’s Form N-Q may be reviewed and copied at the SEC’s Public Reference Room in Washington, DC, and at regional offices in New York City, at 233 Broadway, and in Chicago, at 175 West Jackson Boulevard, Suite 900. Information about the Public Reference Room may be obtained by calling 1-800-SEC-0330.
| | | | |
| 22 | | Wells Fargo VT Small Cap Growth Fund | | Other information (unaudited) |
BOARD OF TRUSTEES AND OFFICERS
Each of the Trustees and Officers1 listed in the table below acts in identical capacities for each fund in the Wells Fargo family of funds, which consists of 154 mutual funds comprising the Wells Fargo Funds Trust, Wells Fargo Variable Trust, Wells Fargo Master Trust and four closed-end funds (collectively the “Fund Complex”). This table should be read in conjunction with the Prospectus and the Statement of Additional Information2. The mailing address of each Trustee and Officer is 525 Market Street, 12th Floor, San Francisco, CA 94105. Each Trustee and Officer serves an indefinite term, however, each Trustee serves such term until reaching the mandatory retirement age established by the Trustees.
Independent Trustees
| | | | | | |
Name and
year of birth | | Position held and
length of service* | | Principal occupations during past five years or longer | | Current other
public company or
investment company
directorships |
William R. Ebsworth (Born 1957) | | Trustee, since 2015 | | Retired. From 1984 to 2013, equities analyst, portfolio manager, research director and chief investment officer at Fidelity Management and Research Company in Boston, Tokyo, and Hong Kong, and retired in 2013 as Chief Investment Officer of Fidelity Strategic Advisers, Inc. where he led a team of investment professionals managing client assets. Prior thereto, Board member of Hong Kong Securities Clearing Co., Hong Kong Options Clearing Corp., the Thailand International Fund, Ltd., Fidelity Investments Life Insurance Company, and Empire Fidelity Investments Life Insurance Company. Board member of the Forté Foundation (non-profit organization) and the Vincent Memorial Hospital Endowment (non-profit organization), where he serves on the Investment Committee and as a Chair of the Audit Committee. Mr. Ebsworth is a CFA® charterholder. | | Asset Allocation Trust |
Jane A. Freeman (Born 1953) | | Trustee, since 2015; Chair Liaison, since 2018 | | Retired. From 2012 to 2014 and 1999 to 2008, Chief Financial Officer of Scientific Learning Corporation. From 2008 to 2012, Ms. Freeman provided consulting services related to strategic business projects. Prior to 1999, Portfolio Manager at Rockefeller & Co. and Scudder, Stevens & Clark. Board member of the Harding Loevner Funds from 1996 to 2014, serving as both Lead Independent Director and chair of the Audit Committee. Board member of the Russell Exchange Traded Funds Trust from 2011 to 2012 and the chair of the Audit Committee. Ms. Freeman is a Board Member of Ruth Bancroft Garden (non-profit organization) and the Glimmerglass Festival. She is also an inactive Chartered Financial Analyst. | | Asset Allocation Trust |
Isaiah Harris, Jr. (Born 1952) | | Trustee, since 2009 | | Retired. Chairman of the Board of CIGNA Corporation since 2009, and Director since 2005. From 2003 to 2011, Director of Deluxe Corporation. Prior thereto, President and CEO of BellSouth Advertising and Publishing Corp. from 2005 to 2007, President and CEO of BellSouth Enterprises from 2004 to 2005 and President of BellSouth Consumer Services from 2000 to 2003. Emeritus member of the Iowa State University Foundation Board of Governors. Emeritus Member of the Advisory Board of Iowa State University School of Business. Advisory Board Member, Palm Harbor Academy (charter school). Advisory Board Member, Child Evangelism Fellowship (non-profit). Mr. Harris is a certified public accountant (inactive status). | | CIGNA Corporation; Asset Allocation Trust |
Judith M. Johnson (Born 1949) | | Trustee, since 2008; Audit Committee Chairman, since 2009 | | Retired. Prior thereto, Chief Executive Officer and Chief Investment Officer of Minneapolis Employees Retirement Fund from 1996 to 2008. Ms. Johnson is an attorney, certified public accountant and a certified managerial accountant. | | Asset Allocation Trust |
David F. Larcker (Born 1950) | | Trustee, since 2009 | | James Irvin Miller Professor of Accounting at the Graduate School of Business, Stanford University, Director of the Corporate Governance Research Initiative and Senior Faculty of The Rock Center for Corporate Governance since 2006. From 2005 to 2008, Professor of Accounting at the Graduate School of Business, Stanford University. Prior thereto, Ernst & Young Professor of Accounting at The Wharton School, University of Pennsylvania from 1985 to 2005. | | Asset Allocation Trust |
| | | | | | |
| Other information (unaudited) | | Wells Fargo VT Small Cap Growth Fund | | | 23 | |
| | | | | | |
Name and
year of birth | | Position held and
length of service* | | Principal occupations during past five years or longer | | Current other
public company or
investment company
directorships |
Olivia S. Mitchell (Born 1953) | | Trustee, since 2006; Governance Committee Chairman, since 2018 | | International Foundation of Employee Benefit Plans Professor, Wharton School of the University of Pennsylvania since 1993. Director of Wharton’s Pension Research Council and Boettner Center on Pensions & Retirement Research, and Research Associate at the National Bureau of Economic Research. Previously, Cornell University Professor from 1978 to 1993. | | Asset Allocation Trust |
Timothy J. Penny (Born 1951) | | Trustee, since 1996; Chairman, since 2018; Vice Chairman, from 2017 to 2018 | | President and Chief Executive Officer of Southern Minnesota Initiative Foundation, a non-profit organization, since 2007. Member of the Board of Trustees of NorthStar Education Finance, Inc., a non-profit organization, since 2007. | | Asset Allocation Trust |
James G. Polisson (Born 1959) | | Trustee, since 2018; Advisory Board Member, from 2017 to 2018 | | Retired. Chief Marketing Officer, Source (ETF) UK Services, Ltd, from 2015 to 2017. From 2012 to 2015, Principal of The Polisson Group, LLC, a management consulting, corporate advisory and principal investing company. Chief Executive Officer and Managing Director at Russell Investments, Global Exchange Traded Funds from 2010 to 2012. Managing Director of Barclays Global Investors from 1998 to 2010 and Global Chief Marketing Officer for iShares and Barclays Global Investors from 2000 to 2010. Trustee of the San Francisco Mechanics’ Institute, a non-profit organization, from 2013 to 2015. Board member of the Russell Exchange Traded Fund Trust from 2011 to 2012. Director of Barclays Global Investors Holdings Deutschland GmbH from 2006 to 2009. Mr. Polisson is an attorney and has a retired status with the Massachusetts and District of Columbia Bar Associations. | | Asset Allocation Trust |
Michael S. Scofield (Born 1943) | | Trustee, since 2010 | | Served on the Investment Company Institute’s Board of Governors and Executive Committee from 2008-2011 as well the Governing Council of the Independent Directors Council from 2006-2011 and the Independent Directors Council Executive Committee from 2008-2011. Trustee of the Evergreen Fund complex (and its predecessors) from 1984 to 2010. Chairman of the Evergreen Funds from 2000-2010. Former Trustee of the Mentor Funds. Retired Attorney, Law Offices of Michael S. Scofield. | | Asset Allocation Trust |
Pamela Wheelock (Born 1959) | | Trustee, since 2018; Advisory Board Member, from 2017 to 2018 | | Chief Operating Officer, Twin Cities Habitat for Humanity, since January, 2017. Vice President of University Services, University of Minnesota from 2012 to 2017. Prior thereto, on the Board of Directors, Goverance Committee and Finance Committee for the Minnesota Philanthropy Partners (Saint Paul Foundation) from 2012 to 2018, Interim President and Chief Executive Officer of Blue Cross Blue shield of Minnesota of Minnesota from 2010 to 2011, Chairman of the Board from 2009 to 2011 and Board Director 003 to 2015. Vice President, Leadership and Community Engagement, Bush Foundation, Saint Paul, Minnesota (a private foundation) from 2009 to 2011. Executive Vice President and Chief Financial Officer, Minnesota Sports and Entertainment from 2004 to 2009 and Senior Vice President from 2002 to 2004. Commissioner of Finance, State of Minnesota, from 1999 to 2002. Currently the Board Chair of the Minnesota Wild Foundation since 2010. | | Asset Allocation Trust |
| * | Length of service dates reflect the Trustee’s commencement of service with the Trust’s predecessor entities, where applicable. |
| | | | |
| 24 | | Wells Fargo VT Small Cap Growth Fund | | Other information (unaudited) |
Officers
| | | | | | |
Name and
year of birth | | Position held and
length of service | | Principal occupations during past five years or longer |
Andrew Owen (Born 1960) | | President, since 2017 | | Executive Vice President of Wells Fargo & Company and Head of Affiliated Managers, Wells Fargo Asset Management, since 2014. In addition, Mr. Owen is currently President, Chief Executive Officer and Director of Wells Fargo Funds Management, LLC since 2017. Prior thereto, Executive Vice President responsible for marketing, investments and product development for Wells Fargo Funds Management, LLC, from 2009 to 2014. | | |
Jeremy DePalma1 (Born 1974) | | Treasurer, since 2012 | | Senior Vice President of Wells Fargo Funds Management, LLC since 2009. Senior Vice President of Evergreen Investment Management Company, LLC from 2008 to 2010 and head of the Fund Reporting and Control Team within Fund Administration from 2005 to 2010. | | |
Alexander Kymn3 (Born 1973) | | Secretary, since 2018; Chief Legal Officer, since 2018 | | Senior Company Counsel of Wells Fargo Bank, N.A. since 2018 (previously Senior Counsel from 2007 to 2018). Vice President of Wells Fargo Funds Management, LLC from 2008 to 2014. | | |
Michael H. Whitaker (Born 1967) | | Chief Compliance Officer, since 2016 | | Senior Vice President and Chief Compliance Officer since 2016. Senior Vice President and Chief Compliance Officer for Fidelity Investments from 2007 to 2016. | | |
David Berardi (Born 1975) | | Assistant Treasurer, since 2009 | | Vice President of Wells Fargo Funds Management, LLC since 2009. Vice President of Evergreen Investment Management Company, LLC from 2008 to 2010. Manager of Fund Reporting and Control for Evergreen Investment Management Company, LLC from 2004 to 2010. | | |
| 1 | Jeremy DePalma acts as Treasurer of 77 funds and Assistant Treasurer of 77 funds in the Fund Complex. |
| 2 | The Statement of Additional Information includes additional information about the Trustees and is available, without charge, upon request, by calling 1-800-260-5969 or by visiting the website at wellsfargofunds.com. |
| 3 | Alexander Kymn became the Secretary and Chief Legal Officer effective April 17, 2018. |
| | | | | | |
| Other information (unaudited) | | Wells Fargo VT Small Cap Growth Fund | | | 25 | |
BOARD CONSIDERATION OF INVESTMENT MANAGEMENT AND SUB-ADVISORY AGREEMENTS:
Wells Fargo VT Small Cap Growth Fund
Under the Investment Company Act of 1940 (the “1940 Act”), the Board of Trustees (the “Board”) of Wells Fargo Variable Trust (the “Trust”) must determine annually whether to approve the continuation of the Trust’s investment management and sub-advisory agreements. In this regard, at an in-person meeting held on May 22-23, 2018 (the “Meeting”), the Board, all the members of which have no direct or indirect interest in the investment management and sub-advisory agreements and are not “interested persons” of the Trust, as defined in the 1940 Act (the “Independent Trustees”), reviewed and approved for Wells Fargo VT Small Cap Growth Fund (the “Fund”): (i) an investment management agreement (the “Management Agreement”) with Wells Fargo Funds Management, LLC (“Funds Management”); and (ii) an investment sub-advisory agreement (the “Sub-Advisory Agreement”) with Wells Capital Management Incorporated (the “Sub-Adviser”), an affiliate of Funds Management. The Management Agreement and the Sub-Advisory Agreement are collectively referred to as the “Advisory Agreements.”
At the Meeting, the Board considered the factors and reached the conclusions described below relating to the selection of Funds Management and the Sub-Adviser and the approval of the Advisory Agreements. Prior to the Meeting, including at an in-person meeting in April 2018, the Trustees conferred extensively among themselves and with representatives of Funds Management about these matters. Also, the Board has adopted a team-based approach, with each team consisting of a sub-set of Trustees, to assist the full Board in the discharge of its duties in reviewing investment performance and other matters throughout the year. The Independent Trustees were assisted in their evaluation of the Advisory Agreements by independent legal counsel, from whom they received separate legal advice and with whom they met separately.
In providing information to the Board, Funds Management and the Sub-Adviser were guided by a detailed set of requests for information submitted to them by independent legal counsel on behalf of the Independent Trustees at the start of the Board’s annual contract renewal process earlier in 2018. In considering and approving the Advisory Agreements, the Trustees considered the information they believed relevant, including but not limited to the information discussed below. The Board considered not only the specific information presented in connection with the Meeting, but also the knowledge gained over time through interaction with Funds Management and the Sub-Adviser about various topics. In this regard, the Board reviewed reports of Funds Management at each of its quarterly meetings, which included, among other things, portfolio reviews and investment performance reports. In addition, the Board and the teams mentioned above confer with portfolio managers at various times throughout the year. The Board did not identify any particular information or consideration that was all-important or controlling, and each individual Trustee may have attributed different weights to various factors.
After its deliberations, the Board unanimously approved the continuation of the Advisory Agreements for a one-year term and determined that the compensation payable to Funds Management and the Sub-Adviser under each of the Advisory Agreements was reasonable. The Board considered the approval of the Advisory Agreements for the Fund as part of its consideration of agreements for funds across the complex, but its approvals were made on a fund-by-fund basis. The following summarizes a number of important, but not necessarily all, factors considered by the Board in support of its approvals.
Nature, extent and quality of services
The Board received and considered various information regarding the nature, extent and quality of services provided to the Fund by Funds Management and the Sub-Adviser under the Advisory Agreements. This information included a description of the investment advisory services and Fund-level administrative services covered by the Management Agreement, as well as, among other things, a summary of the background and experience of senior management of Wells Fargo Asset Management (“WFAM”), of which Funds Management and the Sub-Adviser are a part, a summary of investments made in the business of WFAM, a summary of certain organizational and personnel changes involving Funds Management and the Sub-Adviser, and a description of Funds Management’s and the Sub-Adviser’s business continuity planning programs and of their approaches to data privacy and cybersecurity. The Board also considered the qualifications, background, tenure and responsibilities of each of the portfolio managers primarily responsible for the day-to-day portfolio management of the Fund.
The Board evaluated the ability of Funds Management and the Sub-Adviser to attract and retain qualified investment professionals, including research, advisory and supervisory personnel. The Board further considered the compliance programs and compliance records of Funds Management and the Sub-Adviser. In addition, the Board took into account the full range of services provided to the Fund by Funds Management and its affiliates.
| | | | |
| 26 | | Wells Fargo VT Small Cap Growth Fund | | Other information (unaudited) |
Fund investment performance and expenses
The Board considered the investment performance results for the Fund over various time periods ended December 31, 2017. The Board considered these results in comparison to the investment performance of funds in a universe that was determined by Broadridge Inc. (“Broadridge”) to be similar to the Fund (the “Universe”), and in comparison to the Fund’s benchmark index and to other comparative data. Broadridge is an independent provider of investment company data. The Board received a description of the methodology used by Broadridge to select the mutual funds in the performance Universe. The Board noted that the investment performance of the Fund was higher than or in range of the average investment performance of the Universe for the one-, three, and five-year periods under review, but lower than the average investment performance of the Universe for the ten-year period under review. The Board also noted that the investment performance of the Fund was higher than its benchmark index, the Russell 2000® Growth Index, for the one-year period under review, but lower than its benchmark for the three-, five-, and ten-year periods under review.
The Board received information concerning, and discussed factors contributing to, the underperformance of the Fund relative to the Universe and benchmark for the periods identified above. The Board took note of the explanations for the relative underperformance during these periods, including with respect to investment decisions and market factors that affected the Fund’s investment performance.
The Board also received and considered information regarding the Fund’s net operating expense ratios and their various components, including actual management fees, custodian and other non-management fees, and Rule 12b-1 and non-Rule 12b-1 shareholder service fees. The Board considered these ratios in comparison to the median ratios of funds in class-specific expense groups that were determined by Broadridge to be similar to the Fund (the “Groups”). The Board received a description of the methodology used by Broadridge to select the mutual funds in the expense Groups and an explanation of how funds comprising expense groups and their expense ratios may vary from year-to-year. Based on the Broadridge reports, the Board noted that the net operating expense ratios of the Fund were in range of the median net operating expense ratios of the expense Groups for each share class.
The Board took into account the Fund’s investment performance and expense information provided to it among the factors considered in deciding to re-approve the Advisory Agreements.
Investment management and sub-advisory fee rates
The Board reviewed and considered the contractual fee rates payable by the Fund to Funds Management under the Management Agreement, as well as the contractual fee rates payable by the Fund to Funds Management for class-level administrative services under a Class-Level Administration Agreement, which include, among other things, class-level transfer agency and sub-transfer agency costs (collectively, the “Management Rates”). The Board also reviewed and considered the contractual investment sub-advisory fee rates that are payable by Funds Management to the Sub-Adviser for investment sub-advisory services.
Among other information reviewed by the Board was a comparison of the Fund’s Management Rates with the average contractual investment management fee rates of funds in the expense Groups at a common asset level as well as transfer agency costs of the funds in the expense Groups. The Board noted that the Management Rates of the Fund were in range of the sum of these average rates for the Fund’s expense Groups for all share classes.
The Board also received and considered information about the portion of the total management fee that was retained by Funds Management after payment of the fee to the Sub-Adviser for sub-advisory services. In assessing the reasonableness of this amount, the Board received and evaluated information about the nature and extent of responsibilities retained and risks assumed by Funds Management and not delegated to or assumed by the Sub-Adviser, and about Funds Management’s on-going oversight services. Given the affiliation between Funds Management and the Sub-Adviser, the Board ascribed limited relevance to the allocation of fees between them.
The Board also received and considered information about the nature and extent of services offered and fee rates charged by Funds Management and the Sub-Adviser to other types of clients with investment strategies similar to those of the Fund. In this regard, the Board received information about the significantly greater scope of services, and compliance, reporting and other legal burdens and risks of managing mutual funds compared with those associated with managing assets of non-mutual fund clients such as institutional separate accounts.
Based on its consideration of the factors and information it deemed relevant, including those described here, the Board determined that the compensation payable to Funds Management under the Management Agreement and to the Sub-Adviser under the Sub-Advisory Agreement was reasonable.
| | | | | | |
| Other information (unaudited) | | Wells Fargo VT Small Cap Growth Fund | | | 27 | |
Profitability
The Board received and considered information concerning the profitability of Funds Management, as well as the profitability of both WFAM and Wells Fargo & Co. (“Wells Fargo”) as a whole, from providing services to the Fund and the fund family as a whole. The Board noted that the Sub-Adviser’s profitability information with respect to providing services to the Fund was subsumed in the WFAM and Wells Fargo profitability analysis.
Funds Management reported on the methodologies and estimates used in calculating profitability, including a description of the methodology used to allocate certain expenses and recent enhancements made to the methodology. Among other things, the Board noted that the levels of profitability reported on a fund-by-fund basis varied widely, depending on factors such as the size and type of fund. Based on its review, the Board did not deem the profits reported by Funds Management, WFAM or Wells Fargo from services provided to the Fund to be at a level that would prevent it from approving the continuation of the Advisory Agreements.
Economies of scale
The Board considered the extent to which Funds Management may experience economies of scale in the provision of management services, and the extent to which scale benefits, if any, would be shared with shareholders. In particular, the Board noted the existence of breakpoints in the Fund’s management fee structure, which operate generally to reduce the Fund’s expense ratios as the Fund grows in size. It considered that, for a small fund or a fund that shrinks in size, breakpoints conversely can result in higher fee levels. The Board also considered that in addition to management fee breakpoints, competitive management fee rates set at the outset without regard to breakpoints and fee waiver and expense reimbursement arrangements, as well as investments in the business intended to enhance services available to Fund shareholders, are means of sharing potential economies of scale with shareholders of the Fund.
The Board concluded that the Fund’s fee and expense arrangements, including contractual breakpoints, constituted a reasonable approach to sharing potential economies of scale with the Fund and its shareholders.
Other benefits to Funds Management and the Sub-Adviser
The Board received and considered information regarding potential “fall-out” or ancillary benefits received by Funds Management and its affiliates, including the Sub-Adviser, as a result of their relationships with the Fund. Ancillary benefits could include, among others, benefits directly attributable to other relationships with the Fund and benefits potentially derived from an increase in Funds Management’s and the Sub-Adviser’s business as a result of their relationships with the Fund. The Board noted that various affiliates of Funds Management may receive distribution-related fees, shareholder servicing payments and sub-transfer agency fees in respect of shares sold or held through them and services provided.
The Board also reviewed information about soft dollar credits earned and utilized by the Sub-Adviser, fees earned by Funds Management and the Sub-Adviser from managing a private investment vehicle for the fund family’s securities lending collateral and commissions earned by an affiliated broker from portfolio transactions.
Based on its consideration of the factors and information it deemed relevant, including those described here, the Board did not find that any ancillary benefits received by Funds Management and its affiliates, including the Sub-Adviser, were unreasonable.
Conclusion
At the Meeting, after considering the above-described factors and based on its deliberations and its evaluation of the information described above, the Board unanimously approved the continuation of the Advisory Agreements for a one-year term and determined that the compensation payable to Funds Management and the Sub-Adviser under each of the Advisory Agreements was reasonable.
This page is intentionally left blank.

For more information
More information about Wells Fargo Funds is available free upon request. To obtain literature, please write, email, visit the Fund’s website, or call:
Wells Fargo Funds
P.O. Box 8266
Boston, MA 02266-8266
Email: fundservice@wellsfargo.com
Website: wellsfargofunds.com
Individual investors: 1-800-222-8222
Retail investment professionals: 1-888-877-9275
Institutional investment professionals: 1-866-765-0778
This report and the financial statements contained herein are submitted for the general information of the shareholders of the Fund. If this report is used for promotional purposes, distribution of the report must be accompanied or preceded by a current prospectus. Before investing, please consider the investment objectives, risks, charges, and expenses of the investment. For a current prospectus and, if available, a summary prospectus, containing this information, call 1-800-260-5969 or visit the Fund’s website at wellsfargofunds.com. Read the prospectus carefully before you invest or send money.
Wells Fargo Asset Management (WFAM) is the trade name for certain investment advisory/management firms owned by Wells Fargo & Company. These firms include but are not limited to Wells Capital Management Incorporated and Wells Fargo Funds Management, LLC. Certain products managed by WFAM entities are distributed by Wells Fargo Funds Distributor, LLC (a broker/dealer and Member FINRA).
This material is for general informational and educational purposes only and is NOT intended to provide investment advice or a recommendation of any kind—including a recommendation for any specific investment, strategy, or plan.
NOT FDIC INSURED ◾ NO BANK GUARANTEE ◾ MAY LOSE VALUE
© 2018 Wells Fargo Funds Management, LLC. All rights reserved.
| | |
| | 314257 08-18 SVT7/SAR144 06-18 |
Not applicable.
| ITEM 3. | AUDIT COMMITTEE FINANCIAL EXPERT |
Not applicable.
| ITEM 4. | PRINCIPAL ACCOUNTANT FEES AND SERVICES |
Not applicable.
| ITEM 5. | AUDIT COMMITTEE OF LISTED REGISTRANTS |
Not applicable.
A Portfolio of Investments for each series of Wells Fargo Variable Trust is included as part of the report to shareholders filed under Item 1 of this Form.
| ITEM 7. | DISCLOSURE OF PROXY VOTING POLICIES AND PROCEDURES FOR CLOSED-END MANAGEMENT INVESTMENT COMPANIES |
Not applicable.
| ITEM 8. | PORTFOLIO MANAGERS OF CLOSED-END MANAGEMENT INVESTMENT COMPANIES |
Not applicable.
| ITEM 9. | PURCHASES OF EQUITY SECURITIES BY CLOSED-END MANAGEMEENT INVESTMENT COMPANY AND AFFILIATED PURCHASERS |
Not applicable.
| ITEM 10. | SUBMISSION OF MATTERS TO A VOTE OF SECURITY HOLDERS |
There have been no material changes to the procedures by which shareholders may recommend nominees to the registrant’s Board of Trustees that have been implemented since the registrant’s last provided disclosure in response to the requirements of this Item.
| ITEM 11. | CONTROLS AND PROCEDURES |
(a) The President and Treasurer have concluded that the Wells Fargo Variable Trust (the “Trust”) disclosure controls and procedures (as defined in Rule 30a-3(c) under the Investment Company Act of 1940) provide reasonable assurances that material information relating to the Trust is made known to them by the appropriate persons, based on their evaluation of these controls and procedures as of a date within 90 days of the filing of this report.
(b) There were no significant changes in the Trust’s internal controls over financial reporting (as defined in Rule 30a-3(d) under the Investment Company Act of 1940) that occurred during the second fiscal quarter of the period covered by this report that materially affected, or is reasonably likely to materially affect, the registrant’s internal control over financial reporting.
(a)(1) Not applicable.
(a)(2) Certification pursuant to Rule 30a-2(a) under the Investment Company Act of 1940 (17 CFR 270.30a-2(a)) is filed and attached hereto as Exhibit 99.CERT.
(a)(3) Not applicable.
(b) Certification pursuant to Rule 30a-2(b) under the Investment Company Act of 1940 (17 CFR 270.30a-2(b)) is filed and attached hereto as Exhibit 99.906CERT.
SIGNATURES
Pursuant to the requirements of the Securities Exchange Act of 1934 and the Investment Company Act of 1940, the registrant has duly caused this report to be signed on its behalf by the undersigned, thereunto duly authorized.
| | |
Wells Fargo Variable Trust |
| By: | | |
| | /s/ Andrew Owen |
| |
| | Andrew Owen |
| | President |
| |
| Date: | | August 24, 2018 |
Pursuant to the requirements of the Securities Exchange Act of 1934 and the Investment Company Act of 1940, this report has been signed below by the following persons on behalf of the registrant and in the capacities and on the date indicated.
| | |
Wells Fargo Variable Trust |
| By: | | |
| | /s/ Andrew Owen |
| |
| | Andrew Owen |
| | President |
| |
| Date: | | August 24, 2018 |
| |
| By: | | |
| | /s/ Jeremy DePalma |
| |
| | Jeremy DePalma |
| | Treasurer |
| |
| Date: | | August 24, 2018 |