As filed with the Securities and Exchange Commission on March 8, 2013
UNITED STATES
SECURITIES AND EXCHANGE COMMISSION
Washington, D.C. 20549
FORM N-CSR
CERTIFIED SHAREHOLDER REPORT OF REGISTERED MANAGEMENT INVESTMENT COMPANIES
Investment Company Act file number 811-09303 & 811-09923
Kinetics Mutual Funds, Inc. & Kinetics Portfolios Trust
(Exact name of registrant as specified in charter)
555 Taxter Road, Suite 175
Elmsford, NY 10523
(Address of principal executive offices) (Zip code)
U.S. Bancorp Fund Services, LLC
615 E. Michigan Street
Milwaukee, WI 53202
(Name and address of agent for service)
(800) 930-3828
Registrant's telephone number, including area code
Date of fiscal year end: December 31, 2012
Date of reporting period: December 31, 2012
Item 1. Report to Stockholders.
| KINETICS MUTUAL FUNDS, INC. |
| Table of Contents |
| December 31, 2012 |
| | Page |
| Shareholders’ Letter | 2 |
| Year 2012 Annual Investment Commentary | 7 |
| KINETICS MUTUAL FUNDS, INC. — FEEDER FUNDS | |
| Growth of 10,000 Investment | 13 |
| Expense Example | 23 |
| Statements of Assets & Liabilities | 33 |
| Statements of Operations | 37 |
| Statements of Changes in Net Assets | 41 |
| Notes to Financial Statements | 52 |
| Results of Shareholder Meeting | 67 |
| Financial Highlights | 68 |
| Report of Independent Registered Public Accounting Firm | 97 |
| KINETICS PORTFOLIOS TRUST — MASTER INVESTMENT PORTFOLIOS | |
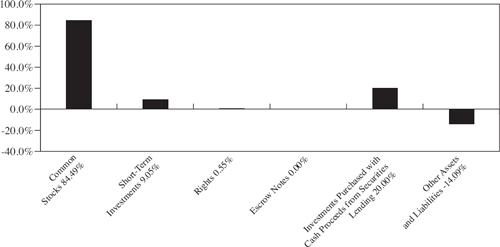
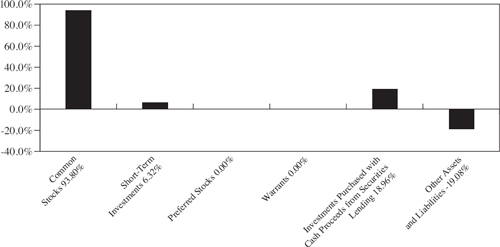
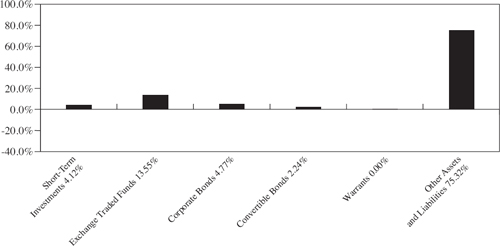
| Allocation of Portfolio Assets | 98 |
| Portfolio of Investments — The Internet Portfolio | 106 |
| Portfolio of Investments — The Global Portfolio | 111 |
| Portfolio of Investments — The Paradigm Portfolio | 115 |
| Portfolio of Investments — The Medical Portfolio | 121 |
| Portfolio of Investments — The Small Cap Opportunities Portfolio | 124 |
| Portfolio of Investments — The Market Opportunities Portfolio | 128 |
| Portfolio of Investments — The Water Infrastructure Portfolio | 132 |
| Portfolio of Investments — The Multi-Disciplinary Portfolio | 134 |
| Portfolio of Options Written — The Water Infrastructure Portfolio | 139 |
| Portfolio of Options Written — The Multi-Disciplinary Portfolio | 145 |
| Portfolio of Securities Sold Short | 167 |
| Statements of Assets & Liabilities | 168 |
| Statements of Operations | 172 |
| Statements of Changes in Net Assets | 176 |
| Notes to Financial Statements | 180 |
| Report of Independent Registered Public Accounting Firm | 205 |
| Results of Shareholder Meeting | 206 |
| Management of the Funds and the Portfolios | 207 |
| Privacy Policy | 212 |
| KINETICS MUTUAL FUNDS, INC. |
| Shareholders’ Letter |
Dear Fellow Shareholders:
We are pleased to present the Kinetics Mutual Funds (“Funds”) Annual Report for the twelve-month period ended December 31, 2012. As of our last letter, at mid-year, there were various uncertainties weighing heavily on equity prices, namely the presidential election, the “fiscal cliff,” instability in the European currency union, and slowing economic data in emerging markets, among others. These concerns have since been resolved or assuaged, at least in part, and equity prices have reacted positively worldwide. Typically, such broad market and broad asset class (macro) rallies are not the most constructive for fundamental value investors; however, the latter half of 2012 proved to be fruitful for our Funds, as the No-load Classes of the Funds completed the year as follows (No-Load Class): The Paradigm Fund +21.78%, The Multi-Disciplinary Fund +15.38%, The Small Cap Opportunities Fund +26.74%, The Market Opportunities Fund +17.52%, The Internet Fund +23.24%, The Medical Fund +8.86%, The Water Infrastructure Fund (now, the Alternative Income Fund) +9.90%, and The Global Fund +23.16%. These results compare to returns of 16.00% for the S&P 500 Index and 16.13% for the MSCI All Country World Index.
Our Funds achieved attractive returns for 2012 in both absolute and relative terms. As a result, investors might be concerned about the risk of complacency; however, we recognize that the investment process must be perpetual. We continue to diligently monitor our existing portfolio positions in addition to myriad potential new investments. We believe that it is futile to attempt to determine the precise driver(s) of gains in security prices, as there may be a multitude of drivers, particularly in shorter time periods. Regardless, we have analyzed all of the companies whose securities we own and compared their business fundamentals with those of one and two years ago, when their shares were trading at materially lower levels. In aggregate, our portfolio companies have grown intrinsic value at rates consistent with or
above those of their respective equity prices. Accordingly, we remain quite optimistic with regard to many investment opportunities.
In 2012, many equity prices were driven higher by the combination of slightly higher earnings and/or cash flows and expansion of the valuation multiples assigned to them. In short, the fundamentals of the companies did in fact improve, but the improvements were not on the same scale as was their share price appreciation. In many cases, such multiples expansion is justified, particularly in light of the continued near-zero percent interest rate policy maintained by much of the developed world. However, we prefer to rely on the underlying returns of the businesses to drive shares prices, and view multiples expansion as a potential enhancement to base returns. Not all companies are capable of consistently growing underlying business values at high levels, particularly in the current environment of low economic growth and tepid inflation; hence, we must be very selective in our investment process. A common characteristic that we have identified amongst the “compounders,” companies that reliably compound underlying value, is the existence of an owner-operator.
Owner-operators are broadly defined as corporate management teams that have considerable personal wealth invested alongside their shareholders. The actions of these management teams over the past several years stand in stark contrast to “agent” managers. Owner-operators have actively allocated capital into attractive opportunities and engaged in various corporate actions (share repurchases and spin-offs, to name but a few) aimed at enhancing shareholder value. Compare this to the actions undertaken by most “agent” corporate managers, who have focused on cost-cutting measures to maintain margins (at the possible expense of future growth) and who have amassed large cash balances earning nearly no return. The latter group of companies is likely to find it difficult to grow revenues or earnings at historical levels. Additionally, should confidence in equity markets continue to recover, these
companies will struggle to effectively allocate capital in an increasingly competitive environment. An easily observable divide exists between companies that have positioned themselves aggressively during an advantageous environment and those that will need to chase opportunities as prices rise; we are pleased to own many of the former.
It is a relief that none of the perceived catastrophic macroeconomic events came to fruition over the past two years. It is important for us as value investors to attempt to ignore this “noise” to the greatest extent possible, while always purchasing securities with a considerable embedded margin of safety. Even if a severely disruptive event were to occur, a company with a conservative valuation, appropriate business model and proven management team is likely to minimize or avoid permanent impairment of value. This is not to be confused with temporary price volatility, which we expect will remain a part of capital markets for the foreseeable future. We hope that communicating these attributes of our holdings to investors in all of our funds will enable you to share our confidence.
Shareholders can continue to access additional information from our website, www.kineticsfunds.com. This website provides a broad array of information, including recent portfolio holdings, quarterly investment commentaries, conference call transcripts, newsflashes, recent performance data, and online access to account information.
Kinetics offers the following funds to investors:
The Paradigm Fund focuses on companies that are valued attractively and currently have, or are expected to soon have, sustainable high business returns. The Fund has produced attractive returns since its inception in an environment that should be described as difficult for equity investors. The Paradigm Fund is Kinetics’ flagship fund.
The Multi-Disciplinary Fund seeks to utilize stock options and fixed-income investments in order to provide investors with equity-like returns, but with more muted volatility. At times, the options strategies of the Fund may cause the manager to purchase equity securities.
The Small Cap Opportunities Fund focuses on undervalued and special situation small capitalization equities that have the potential for rewarding long-term investment results. The same investment fundamentals employed by The Paradigm Fund are used to identify such opportunities.
The Medical Fund is a sector fund, offering an investment in scientific discovery within the promising field of medical research, particularly in the development of cancer treatments and therapies. As a sector fund, The Medical Fund is likely to have heightened volatility.
The Internet Fund is a sector fund that focuses on companies engaged in the evolution of Internet-related developments. As such, this Fund has been, and is likely to continue to be, quite volatile. The Internet Fund is not designed to be a major component of one’s equity exposure. More recently, this Fund has been focusing on content companies, which we believe will be the winners in the next generation of Internet development.
The Global Fund is focused on selecting long life cycle international companies that can generate long-term wealth through their business operations. This Fund is presently finding exciting opportunities in the more developed markets.
The Market Opportunities Fund focuses on those companies that benefit from increasing transactional volume or throughput, such as publicly-traded exchanges and credit card processors, or companies that act as facilitators, such as gaming companies, airports and publicly-traded toll roads.
The Alternative Income Fund underwent a proxy vote on December 21, 2012, wherein the shareholders approved a change from the Kinetics Water Infrastructure Fund’s investment objective and to one of the Fund’s fundamental investment restrictions. As a result of the proxy, The Water Infrastructure Fund has been renamed The Alternative Income Fund. The primary investment objective of the Alternative Income Fund is to provide current income and gains, with a secondary objective of obtaining long-term growth of capital. Consistent with this change, prospectively, the Fund will seek to generate a total return that exceeds that of most short-term U.S. fixed income indexes, with limited market value variability.
Peter B. Doyle
President
Kinetics Mutual Funds, Inc.
| KINETICS MUTUAL FUNDS, INC. |
| Investment Commentary |
Dear Fellow Shareholders,
The S&P 500 Index completed 2012 by returning 16.00%, while the NASDAQ Composite returned 15.91% over the same period. Equity markets ultimately achieved strong gains for the year despite episodes of increased volatility and high correlation. In the second half of the year, markets began to stabilize, and many of the high quality companies whose stock price declined unreasonably in 2011 led the rebound. As such, the Funds prospered and achieved (No-Load Class) returns of 21.78% in the Paradigm Fund, 26.74% in the Small Cap Opportunities Fund, 17.52% in the Market Opportunities Fund, 8.86% in the Medical Fund, 23.24% in the Internet Fund, 15.38% in the Multi-Disciplinary Fund, 23.16% in the Global Fund and 9.90% in the Water Infrastructure Fund (now, the Alternative Income Fund).
Steadfast investors were able to achieve very attractive returns in global capital markets during 2012, with price performance generally increasing as one moved further out on the perceived risk spectrum (i.e., most equity benchmarks outperformed most fixed income benchmarks). It’s important to recognize that this is the perceived risk spectrum, which is not necessarily reflective of the actual risk incurred. Academic thought generally concludes that outsized gains can be achieved solely by assuming outsized risk; hence, an equity investor should have the potential for a larger return than a U.S. Treasury investor. Further, the Treasury investor sacrifices some potential investment appreciation in exchange for the relative certainty that the interest payments will be made and the principal capital returned. This relationship holds true only in the rare occasions where markets are efficiently priced. In contrast, great opportunities lie in the extremes of inefficient pricing. We do not believe that capital markets are currently at an extreme in terms of prices, but it is our view that there is likely far more risk in safe haven fixed income assets than many realize and less risk in some assets described as higher risk than many believe.
Consider an investor in investment grade U.S. corporate bonds, an asset class that has steadily attracted investor capital over the past several years. These bonds currently trade at a relatively small premium to U.S. Treasury bonds of similar duration in terms of yield to maturity. Many such corporate bonds that were issued prior to the credit crisis currently trade well above par value,
reflecting their high coupon payments. Now also consider an investor in the equity of a consumer company that enjoys reliable cash flows, moderate pricing power and is traded at an earnings multiple in line with the broader markets. In the scenario where interest rates increase in the United States, one could argue that the corporate bond investor will incur more severe and more permanent losses. Nonetheless, the bond investor is commonly recognized as assuming less risk than the equity investor.
The well documented and widely recognized risks are rarely those that cause the most damage to investors. The list of global macro concerns is expansive and well appreciated by the marketplace. However, few have seriously considered the impact of interest rate increases on low yielding (both nominal and real) fixed income securities. What about the risk of reinvesting new capital into fixed income as earlier vintage bonds paying higher coupons mature? Even though we are confident that our equity portfolios currently have less real risk than such fixed income portfolios, we acknowledge that many investors are simply unwillingly to accept the volatility of equity markets. As a solution, we offer two distinct yield-generating strategies in funds that we encourage investors to consider, the Multi-Disciplinary Fund and Alternative Income Fund.
The performance of the Paradigm Fund continues to be driven by owner-operated companies with business activities primarily in the United States. Top contributing owner-operator positions include several consumer businesses that exhibited resiliency during the crisis and subsequent tepid recovery. We believe that these businesses are currently much better positioned compared to five years ago as a result of attrition and astute capital allocation; however, their market valuations fail to reflect this development.
The Small Cap Opportunities Fund also maintains a high weighting in owner-operated companies, predominately those conducting business in the United States. The Fund benefitted from strong performance amongst allocations to real estate oriented owner-operators. A number of North American real estate companies in the small capitalization universe are in various stages of development. Accordingly, most of these companies do not currently generate a yield; hence, their equity is available at a material discount to the yield being generating by their REIT peers. We believe that investors are paying a
premium for dividend yield and, accordingly, are ignoring the fundamentals of most REIT opportunities.
The Market Opportunities Fund continues to hold a variety of owner-operated companies that facilitate capital market activity. In aggregate the financial industry performed well, although the “facilitators” lagged the strong gains achieved by the conventional, lending based financial companies. We believe that these facilitators are capable of achieving equal or greater unleveraged returns on equity (i.e., adjusted returns on assets) than their leveraged peers, but with far less risk. We expect such companies to be primary beneficiaries of a continued upswing in the investment cycle.
The Medical Fund maintained its large allocation to multi-national major pharmaceutical companies and later stage biotechnology firms. The share prices of most major pharmaceutical companies appreciated for the year and continue to appear inexpensive on a quantitative basis. However these companies largely underperformed broad equity indexes. Concerns regarding patent expirations and cash flow disruptions outweighed attractive dividend yields and product pipelines. Further, many of the mature biotechnology firms also recorded gains for the year, but underperformed their less developed peers.
The Internet Fund maintained its historic methodology of allocating capital to companies that are beneficiaries of the Internet and related disruptive technologies. The Fund’s performance was driven by its focus upon owner-operated companies that own and provide media content. We believe that the technological innovation that facilitated additional channels for content to be distributed to consumers (i.e., satellite radio, internet TV, among others) will ultimately result in original content commanding an ever higher price premium.
The Multi-Disciplinary Fund was able to achieve “equity-like” returns with materially less price volatility through a two-pronged approach of selling put options related to high quality owner-operator companies and utilizing the resulting income to make advantageous fixed income investments. The Fund benefitted from high implied volatility experienced in the middle of the year. As a result, the premiums received from selling put securities were elevated and high yield bonds prices were subdued, both trends ultimately reversing throughout the second half of the year.
The Global Fund is primarily positioned with a diverse selection of global owner-operated companies. Many of these companies have various lines of business, with revenues generated across several countries. The performance of the Fund was bolstered by investments in consumer companies located in continental Europe, but with internationally diverse sales. The Fund also benefitted from companies that had meaningful exposures to secular trends in unique local or regional economies.
The Alternative Income Fund (formerly, The Water Infrastructure Fund) experienced a mandate shift effective January 1, 2013, effectively replacing a multi-disciplinary approach to water infrastructure investing with a more conservative broad option income strategy. The performance of the Fund during the year ended December 31, 2012, was primarily driven by premiums received on water related companies, bolstered by income and capital appreciation on related fixed income securities. Over the next several years the performance of the Fund will likely be primarily driven by income generated on conservative, far out of the money put options. The complimentary short-term fixed income portfolio will probably contribute minimal performance until interest rates rise and/or corporate bond spreads widen in the United States.
Peter B. Doyle
Chief Investment Strategist
Disclosure
This material is intended to be reviewed in conjunction with a current prospectus, which includes all fees and expenses that apply to a continued investment, as well as information regarding the risk factors, policies and objectives of the Funds. Read it carefully before investing.
Mutual Fund investing involves risk. Principal loss is possible. Because The Internet Fund, The Medical Fund and The Market Opportunities Fund invest in a single industry or geographic region, their shares are subject to a higher degree of risk than funds with a higher level of diversification. Internet, biotechnology and certain capital markets or gaming stocks are subject to a rate of change in technology, obsolescence and competition that is generally higher than that of other industries, hence they may experience extreme price and volume fluctuations.
International investing [for all Funds] presents special risks including currency exchange fluctuation, government regulations, and the potential for political and economic instability. Accordingly, the share prices for these Funds are expected to be more volatile than that of U.S.-only funds. Past performance is no guarantee of future performance.
Because smaller companies [for The Small Cap Opportunities Fund] often have narrower markets and limited financial resources, they present more risk than larger, more well established, companies.
Non-investment grade debt securities [for all Funds], i.e., junk bonds, are subject to greater credit risk, price volatility and risk of loss than investment grade securities.
Further, options contain special risks including the imperfect correlation between the value of the option and the value of the underlying asset. Investments [for The Multi- Disciplinary Fund and The Alternative Income Fund] in futures, swaps and other derivative instruments may result in loss as derivative instruments may be illiquid, difficult to price and leveraged so that small changes may produce disproportionate losses to the Funds. To the extent the Funds segregate assets to cover derivative positions, they may impair their ability to meet current obligations, to honor requests for redemption
and to manage the investments in a manner consistent with their respective investment objectives. Purchasing and writing put and call options and, in particular, writing “uncovered” options are highly specialized activities that entail greater than ordinary investment risk.
As non-diversified Funds, the value of Fund shares may fluctuate more than shares invested in a broader range of industries and companies. Unlike other investment companies that directly acquire and manage their own portfolios of securities, The Kinetics Mutual Funds pursue their investment objectives by investing all of their investable assets in a corresponding portfolio series of the Kinetics Portfolios Trust.
The information concerning the Funds included in the shareholder report contains certain forward-looking statements about the factors that may affect the performance of the Funds in the future. These statements are based on Fund management’s predictions and expectations concerning certain future events and their expected impact on the Funds, such as performance of the economy as a whole and of specific industry sectors, changes in the levels of interest rates, the impact of developing world events, and other factors that may influence the future performance of the Funds. Management believes these forward-looking statements to be reasonable, although they are inherently uncertain and difficult to predict. Actual events may cause adjustments in portfolio management strategies from those currently expected to be employed.
The Nasdaq Composite (NASDAQ) and the Standard & Poor’s 500 Index (S&P 500) each represent an unmanaged, broad-basket of stocks. They are typically used as a proxy for overall market performance.
Distributor: Kinetics Funds Distributor LLC is not an affiliate of Kinetics Mutual Funds, Inc. Kinetics Funds Distributor LLC is an affiliate of Kinetics Asset Management LLC, Investment Adviser to Kinetics Mutual Funds, Inc.
For more information, log onto www.kineticsfunds.com.January 1, 2013 — Kinetics Asset Management LLC ®
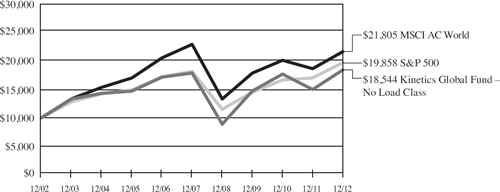
How a $10,000 Investment Has Grown: The charts show the growth of a $10,000 investment in the Feeder Funds as compared to the performance of two or more representative market indices. The tables below the charts show the average annual total returns on an investment over various periods. Returns for periods greater than one year are average annual total returns. The annual returns assume the reinvestment of all dividends and distributions, however, the graph and table do not reflect the deduction of taxes that a shareholder would pay on fund distributions or the redemption of fund shares. Past performance is not predictive of future performance. Current performance may be lower or higher than the returns quoted below. The performance data reflects voluntary fee waivers and expense reimbursements made by the Adviser and the returns would have been lower if these waivers and expense reimbursements were not in effect. Investment return and principal value will fluctuate, so that your shares, when redeemed, may be worth more or less than their original costs. S&P 500 Index — The S&P 500 Index is a capital-weighted index, representing the aggregate market value of the common equity of 500 stocks primarily traded on the New York Stock Exchange. The S&P 500 is unmanaged and includes the reinvestment of dividends and does not reflect the payments of transaction costs and advisory fees associated with an investment in the Funds. The securities that comprise the S&P 500 may differ substantially from the securities in the Funds’ portfolios. It is not possible to directly invest in an index. NASDAQ Composite Index — The NASDAQ Composite Index is a broad-based capitalization-weighted index of all NASDAQ stocks. The NASDAQ Composite is unmanaged and does not include the reinvestment of dividends and does not reflect the payment of transaction costs or advisory fees associated with an investment in the Funds. The securities that comprise the NASDAQ Composite may differ substantially from the securities in the Funds’ portfolios. It is not possible to directly invest in an index. CBOE S&P 500 BuyWrite Index (BXM) — The CBOE S&P 500 BuyWrite Index (BXM) is a benchmark index designed to track the performance of a hypothetical buy-write strategy on the S&P 500 Index. The securities that comprise the CBOE S&P 500 BuyWrite Index may differ substantially from the securities in The Multi-Disciplinary Fund’s portfolio. It is not possible to directly invest in an index. CBOE S&P 500 PutWrite Index (PUT) — The CBOE S&P 500 Put-Write Index (PUT) is a benchmark index designed to track the performance of a passive program that sells near-term, at-the-money S&P 500 Index puts. |
The securities that comprise the CBOE S&P 500 Put-Write Index may differ substantially from the securities in The Multi-Disciplinary Fund’s portfolio. It is not possible to directly invest in an index. MSCI ACWI Index — The MSCI ACWI Index is a free float-adjusted market capitalization weighted index that is designed to measure the equity market performance of developed and emerging markets. The MSCI ACWI consists of 45 country indices comprising 24 developed and 21 emerging market country indices. MSCI EAFE Index — The MSCI EAFE Index is a free float-adjusted market capitalization index that is designed to measure the equity market performance of developed markets, excluding the US & Canada. RUSSELL 2000 Index — The Russell 2000 Index is a subset of the Russell 3000® Index representing approximately 10% of the total market capitalization of that index. It includes approximately 2000 of the smallest securities based on a combination of their market cap and current index membership. The Russell 2000 Index measures the performance of the small-cap segment of the U.S. equity universe. ISE Water Index — The ISE Water Index includes companies engaged in water distribution, water filtration, flow technology, and other water solutions. Palisades Water Index — The Palisades Water Index is a modified equal-dollar weighted index comprised of companies publicly traded in the United States that are positioned to benefit significantly from the escalating global demand for water and the ecological imperative of sustainable water resource governance. Accordingly, the Index serves as a proxy for measuring the increasing value of water resulting from the impact of temporal and spatial scarcity on the relationship between human health, ecological sustainability and economic growth. |
The Internet Fund
December 31, 2002 — December 31, 2012
| | | Ended 12/31/2012 |
| | | | | Advisor | Advisor | | | | | | |
| | | No Load | Class A | Class A | Advisor | | | NASDAQ |
| | | Class | (No Load) | (Load Adjusted)(1) | Class C | S&P 500 | Composite |
| One Year | | 23.24 | % | 22.92 | % | 15.86 | % | 22.32 | % | 16.00 | % | 15.91 | % |
| Five Years | | 4.68 | % | 4.42 | % | 3.19 | % | 3.90 | % | 1.66 | % | 2.63 | % |
| Ten Years | | 10.90 | % | 10.69 | % | 10.04 | % | N/A | | 7.10 | % | 8.50 | % |
| Since Inception | | | | | | | | | | | | | |
| No Load Class | | | | | | | | | | | | | |
| (10/21/96) | | 14.84 | % | N/A | | N/A | | N/A | | 6.31 | % | 5.67 | % |
| Since Inception | | | | | | | | | | | | | |
| Advisor Class A | | | | | | | | | | | | | |
| (4/26/01) | | N/A | | 5.82 | % | 5.28 | % | N/A | | 3.25 | % | 3.44 | % |
| Since Inception | | | | | | | | | | | | | |
| Advisor Class C | | | | | | | | | | | | | |
| (2/16/07) | | N/A | | N/A | | N/A | | 7.20 | % | 1.85 | % | 3.29 | % |
(1) Reflects front-end sales charge of 5.75%.
Returns for periods greater than one year are average annual total returns.
The Global Fund
December 31, 2002 — December 31, 2012
| | | Ended 12/31/2012 |
| | | | | Advisor | Advisor | | | | | | |
| | | No Load | Class A | Class A | Advisor | | | MSCI AC |
| | | Class | (No Load) | (Load Adjusted)(1) | Class C | S&P 500 | World |
| One Year | | 23.16 | % | 22.94 | % | 15.85 | % | 22.04 | % | 16.00 | % | 16.13 | % |
| Five Years | | 0.60 | % | N/A | | N/A | | N/A | | 1.66 | % | –1.16 | % |
| Ten Years | | 6.37 | % | N/A | | N/A | | N/A | | 7.10 | % | 8.11 | % |
| Since Inception | | | | | | | | | | | | | |
| No Load Class | | | | | | | | | | | | | |
| (12/31/99) | | –3.84 | % | N/A | | N/A | | N/A | | 1.66 | % | 1.82 | % |
| Since Inception | | | | | | | | | | | | | |
| Advisor Class A | | | | | | | | | | | | | |
| (5/19/08) | | N/A | | 2.10 | % | 0.79 | % | N/A | | 2.26 | % | –1.14 | % |
| Since Inception | | | | | | | | | | | | | |
| Advisor Class C | | | | | | | | | | | | | |
| (5/19/08) | | N/A | | N/A | | N/A | | 1.42 | % | 2.26 | % | –1.14 | % |
(1) Reflects front-end sales charge of 5.75%.
Returns for periods greater than one year are average annual total returns.
The Paradigm Fund
December 31, 2002 — December 31, 2012
| | | Ended 12/31/2012 |
| | | | | Advisor | Advisor | | | | | | | | |
| | | No Load | Class A | Class A | Advisor | Institutional | | | MSCI AC |
| | | Class | (No Load) | (Load Adjusted)(1) | Class C | Class | S&P 500 | World |
| One Year | | 21.78 | % | 21.49 | % | 14.48 | % | 20.85 | % | 21.99 | % | 16.00 | % | 16.13 | % |
| Five Years | | –4.15 | % | –4.39 | % | –5.51 | % | –4.88 | % | –3.98 | % | 1.66 | % | –1.16 | % |
| Ten Years | | 10.02 | % | 9.72 | % | 9.08 | % | 9.17 | % | N/A | | 7.10 | % | 8.11 | % |
| Since Inception | | | | | | | | | | | | | | | |
| No Load Class | | | | | | | | | | | | | | | |
| (12/31/99) | | 7.72 | % | N/A | | N/A | | N/A | | N/A | | 1.66 | % | 1.82 | % |
| Since Inception | | | | | | | | | | | | | | | |
| Advisor Class A | | | | | | | | | | | | | | | |
| (4/26/01) | | N/A | | 7.95 | % | 7.40 | % | N/A | | N/A | | 3.25 | % | 4.02 | % |
| Since Inception | | | | | | | | | | | | | | | |
| Advisor Class C | | | | | | | | | | | | | | | |
| (6/28/02) | | N/A | | N/A | | N/A | | 8.12 | % | N/A | | 5.65 | % | 6.40 | % |
| Since Inception | | | | | | | | | | | | | | | |
| Institutional Class | | | | | | | | | | | | | | | |
| (5/27/05) | | N/A | | N/A | | N/A | | N/A | | 4.77 | % | 4.49 | % | 4.75 | % |
(1) Reflects front-end sales charge of 5.75%.
Returns for periods greater than one year are average annual total returns.
The Medical Fund
December 31, 2002 — December 31, 2012
| | | Ended 12/31/2012 | |
| | | | | Advisor | Advisor | | | | | | |
| | | No Load | Class A | Class A | Advisor | | | NASDAQ |
| | | Class | (No Load) | (Load Adjusted)(1) | Class C | S&P 500 | Composite |
| One Year | | 8.86 | % | 8.60 | % | 2.33 | % | 8.08 | % | 16.00 | % | 15.91 | % |
| Five Years | | 3.40 | % | 3.19 | % | 1.97 | % | 2.64 | % | 1.66 | % | 2.63 | % |
| Ten Years | | 7.44 | % | 7.17 | % | 6.54 | % | N/A | | 7.10 | % | 8.50 | % |
| Since Inception | | | | | | | | | | | | | |
| No Load Class | | | | | | | | | | | | | |
| (9/30/99) | | 7.56 | % | N/A | | N/A | | N/A | | 2.70 | % | 0.72 | % |
| Since Inception | | | | | | | | | | | | | |
| Advisor Class A | | | | | | | | | | | | | |
| (4/26/01) | | N/A | | 2.87 | % | 2.36 | % | N/A | | 3.25 | % | 3.44 | % |
| Since Inception | | | | | | | | | | | | | |
| Advisor Class C | | | | | | | | | | | | | |
| (2/16/07) | | N/A | | N/A | | N/A | | 3.85 | % | 1.85 | % | 3.29 | % |
(1) Reflects front-end sales charge of 5.75%.
Returns for periods greater than one year are average annual total returns.
The Small Cap Opportunities Fund
December 31, 2002 — December 31, 2012
| | | Ended 12/31/2012 |
| | | | | Advisor | Advisor | | | | | | | | |
| | | No Load | Class A | Class A | Advisor | Institutional | | | | |
| | | Class | (No Load) | (Load Adjusted)(1) | Class C | Class | S&P 500 | Russell 2000 |
| One Year | | 26.74 | % | 26.44 | % | 19.14 | % | 25.77 | % | 27.04 | % | 16.00 | % | 16.35 | % |
| Five Years | | –3.66 | % | –3.90 | % | –5.03 | % | –4.39 | % | –3.47 | % | 1.66 | % | 3.56 | % |
| Ten Years | | 10.83 | % | 10.55 | % | 9.90 | % | N/A | | N/A | | 7.10 | % | 9.72 | % |
| Since Inception | | | | | | | | | | | | | | | |
| No Load Class | | | | | | | | | | | | | | | |
| (3/20/00) | | 8.47 | % | N/A | | N/A | | N/A | | N/A | | 1.74 | % | 4.85 | % |
| Since Inception | | | | | | | | | | | | | | | |
| Advisor Class A | | | | | | | | | | | | | | | |
| (12/30/01) | | N/A | | 6.00 | % | 5.43 | % | N/A | | N/A | | 4.05 | % | 6.55 | % |
| Since Inception | | | | | | | | | | | | | | | |
| Advisor Class C | | | | | | | | | | | | | | | |
| (2/16/07) | | N/A | | N/A | | N/A | | –2.03 | % | N/A | | 1.85 | % | 2.06 | % |
| Since Inception | | | | | | | | | | | | | | | |
| Institutional Class | | | | | | | | | | | | | | | |
| (8/12/05) | | N/A | | N/A | | N/A | | N/A | | 3.97 | % | 4.21 | % | 4.88 | % |
(1) Reflects front-end sales charge of 5.75%.
Returns for periods greater than one year are average annual total returns.
The Market Opportunities Fund
January 31, 2006 — December 31, 2012
| | | Ended 12/31/2012 |
| | | | | Advisor | Advisor | | | | | | | | |
| | | No Load | Class A | Class A | Advisor | Institutional | | | | |
| | | Class | (No Load) | (Load Adjusted)(1) | Class C | Class | S&P 500 | MSCI EAFE |
| One Year | | 17.52 | % | 17.26 | % | 10.48 | % | 16.70 | % | 17.83 | % | 16.00 | % | 17.32 | % |
| Five Years | | –3.94 | % | –4.17 | % | –5.30 | % | –4.61 | % | N/A | | 1.66 | % | –3.69 | % |
| Since Inception | | | | | | | | | | | | | | | |
| No Load Class | | | | | | | | | | | | | | | |
| (1/31/06) | | 4.15 | % | N/A | | N/A | | N/A | | N/A | | 3.78 | % | 1.34 | % |
| Since Inception | | | | | | | | | | | | | | | |
| Advisor Class A | | | | | | | | | | | | | | | |
| (1/31/06) | | N/A | | 3.89 | % | 3.01 | % | N/A | | N/A | | 3.78 | % | 1.34 | % |
| Since Inception | | | | | | | | | | | | | | | |
| Advisor Class C | | | | | | | | | | | | | | | |
| (2/16/07) | | N/A | | N/A | | N/A | | –0.46 | % | N/A | | 1.85 | % | –2.09 | % |
| Since Inception | | | | | | | | | | | | | | | |
| Institutional Class | | | | | | | | | | | | | | | |
| (5/19/08) | | N/A | | N/A | | N/A | | N/A | | –0.59 | % | 2.26 | % | –3.88 | % |
(1) Reflects front-end sales charge of 5.75%.
Returns for periods greater than one year are average annual total returns.
The Water Infrastructure Fund
June 29, 2007 — December 31, 2012
| | | Ended 12/31/2012 | |
| | | | | | | Advisor | | | | | | | | | | |
| | | | | Advisor | Class A | | | | | | | | | |
| | | No Load | Class A | (Load | Advisor | Institutional | S&P | ISE | Palisades |
| | | Class | (No Load) | Adjusted)(1) | Class C | Class | 500 | Water | Water |
| One Year | | 9.90 | % | 9.61 | % | 3.37 | % | 8.96 | % | 10.17 | % | 16.00 | % | 25.61 | % | 28.73 | % |
| Five Years | | –2.77 | % | –2.99 | % | –4.14 | % | –3.49 | % | –2.47 | % | 1.66 | % | 3.04 | % | 0.77 | % |
| Since Inception | | | | | | | | | | | | | | | | | |
| No Load Class | | | | | | | | | | | | | | | | | |
| (6/29/07) | | –2.05 | % | N/A | | N/A | | N/A | | N/A | | 1.25 | % | 3.26 | % | 1.56 | % |
| Since Inception | | | | | | | | | | | | | | | | | |
| Advisor Class A | | | | | | | | | | | | | | | | | |
| ( 6/29/07) | | N/A | | –2.28 | % | –3.32 | % | N/A | | N/A | | 1.25 | % | 3.26 | % | 1.56 | % |
| Since Inception | | | | | | | | | | | | | | | | | |
| Advisor Class C | | | | | | | | | | | | | | | | | |
| ( 6/29/07) | | N/A | | N/A | | N/A | | –2.77 | % | N/A | | 1.25 | % | 3.26 | % | 1.56 | % |
| Since Inception | | | | | | | | | | | | | | | | | |
| Institutional Class | | | | | | | | | | | | | | | | | |
| ( 6/29/07) | | N/A | | N/A | | N/A | | N/A | | –1.76 | % | 1.25 | % | 3.26 | % | 1.56 | % |
(1) Reflects front-end sales charge of 5.75%.
Returns for periods greater than one year are average annual total returns.
The Multi-Disciplinary Fund
February 11, 2008 — December 31, 2012
| | | Ended 12/31/2012 | |
| | | | | | | Advisor | | | | | | | | | | |
| | | | | Advisor | Class A | | | | | | | | | | |
| | | No Load | Class A | (Load | Advisor | Institutional | S&P | CBOE | CBOE |
| | | Class | (No Load) | Adjusted)(1) | Class C | Class | 500 | Buy | Put |
| One Year | | 15.38 | % | 15.12 | % | 8.53 | % | 14.48 | % | 15.55 | % | 16.00 | % | 5.20 | % | 8.14 | % |
| Since Inception | | | | | | | | | | | | | | | | | |
| No Load Class | | | | | | | | | | | | | | | | | |
| (2/11/08) | | 5.87 | % | N/A | | N/A | | N/A | | N/A | | 3.59 | % | 2.46 | % | 5.04 | % |
| Since Inception | | | | | | | | | | | | | | | | | |
| Advisor Class A | | | | | | | | | | | | | | | | | |
| ( 2/11/08) | | N/A | | 5.60 | % | 4.33 | % | N/A | | N/A | | 3.59 | % | 2.46 | % | 5.04 | % |
| Since Inception | | | | | | | | | | | | | | | | | |
| Advisor Class C | | | | | | | | | | | | | | | | | |
| ( 2/11/08) | | N/A | | N/A | | N/A | | 5.07 | % | N/A | | 3.59 | % | 2.46 | % | 5.04 | % |
| Since Inception | | | | | | | | | | | | | | | | | |
| Institutional Class | | | | | | | | | | | | | | | | | |
| ( 2/11/08) | | N/A | | N/A | | N/A | | N/A | | 6.06 | % | 3.59 | % | 2.46 | % | 5.04 | % |
(1) Reflects front-end sales charge of 5.75%.
Returns for periods greater than one year are average annual total returns.
| KINETICS MUTUAL FUNDS, INC. — THE FEEDER FUNDS |
| Expense Example |
| December 31, 2012 |
Shareholders incur two types of costs: (1) transaction costs, including sales charges (loads) on purchase payments, reinvestments of dividends or other distributions made by a Fund, redemption fees, and exchange fees, and (2), ongoing costs, including management fees, distribution and/or service (12b-1) fees, and other Fund expenses. This example is intended to help investors understand the ongoing costs (in dollars) of investing in a series of Kinetics Mutual Funds, Inc. (each a “Feeder Fund” and collectively the “Feeder Funds”), and to compare these costs with the ongoing costs of investing in other mutual funds. The example is based on an investment of $1,000 invested on July 1, 2012 and held for the entire period from July 1, 2012 to December 31, 2012.
Actual Expenses
The first line and second line items of the table below provide information about actual account values and actual expenses before and after expense reimbursement. Unlike other mutual funds that directly acquire and manage their own portfolio securities, each Feeder Fund invests all or generally all of its investable assets in a corresponding series of The Kinetics Portfolios Trust (each, a “Master Portfolio”, and together the “Master Portfolios”), a separately registered investment company. The Master Portfolio, in turn, invests in securities. With this type of organization, expenses can accrue specifically to the Master Portfolio or the Feeder Fund or both. Each Feeder Fund records its proportionate share of the Master Portfolio’s expenses, including directed brokerage credits, on a daily basis. Any expense reductions include Fund-specific expenses as well as the expenses allocated from the Master Portfolio.
The Feeder Funds will charge shareholder fees for outgoing wire transfers, returned checks, and exchanges executed by telephone between a Feeder Fund and any other Feeder Fund. The Feeder Funds’ transfer agent charges a $5.00 transaction fee to shareholder accounts for telephone exchanges between any two Feeder Funds. The Feeder Funds’ transfer agent does not charge a transaction fee for written exchange requests. IRA accounts are assessed a $15.00 annual fee. Finally, as a disincentive to market-timing transactions, the Feeder Funds will assess a 2.00% fee on the redemption or exchange of Fund shares held for less than 30 days. These fees will be paid to the Feeder Funds to help offset transaction costs. The Feeder Funds reserve the right to waive the redemption fee, subject to their sole discretion, in instances deemed not to be disadvantageous to the Feeder Funds or shareholders as described in the Feeder Funds’ prospectus.
| KINETICS MUTUAL FUNDS, INC. — THE FEEDER FUNDS |
Expense Example — (Continued) |
| December 31, 2012 |
You may use the information provided in the first line, together with the amounts you invested, to estimate the expenses that you paid over the period. Simply divide your account value by $1,000 (for example, an $8,600 account value divided by $1,000 = 8.6), then multiply the result by the number in the first line under the heading entitled “Expenses Paid During Period” to estimate the expenses you paid on your account during this period.
Hypothetical Example for Comparison Purposes
The third and fourth line items of the table below provide information about hypothetical account values and hypothetical expenses before and after expense reimbursements based on the Feeder Funds’ actual expense ratios and an assumed rate of return of 5% per year before expenses, which are not the Feeder Funds’ actual returns. The hypothetical account values and expenses may not be used to estimate the actual ending account balance or expenses one paid for the period. You may use this information to compare the ongoing costs of investing in the Feeder Funds and other funds. To do so, compare this 5% hypothetical example with the 5% hypothetical examples that appear in the shareholder reports of the other funds. Please note that the expenses shown in the table are meant to highlight one’s ongoing costs only and do not reflect any transactional costs, such as sales charges (loads), redemption fees, or exchange fees. Therefore, the second line of the table is useful in comparing ongoing costs only, and will not help one determine the relative total costs of owning different funds. If these transactional costs had been included, one’s costs would have been higher.
| KINETICS MUTUAL FUNDS, INC. — THE FEEDER FUNDS |
Expense Example — (Continued) |
| December 31, 2012 |
| | | Beginning | | | Ending | | | | | | | |
| | | Account | | | Account | | | | | | Expenses Paid | |
| | | Value | | | Value | | | Annualized | | During Period* | |
| | | (7/1/12) | | | (12/31/12) | | | Expense Ratio | | (7/1/12 to 12/31/12) | |
| | | | | | | | | | | | | |
| The Internet Fund | | | | | | | | | | | | |
| No Load Class Actual — before | | | | | | | | | | | | |
| expense reimbursement | | $ | 1,000.00 | | | $ | 1,135.30 | | | | 1.91 | % | | $ | 10.25 | |
| No Load Class Actual — after | | | | | | | | | | | | | | | | |
| expense reimbursement | | $ | 1,000.00 | | | $ | 1,135.30 | | | | 1.89 | % | | $ | 10.14 | |
| No Load Class Hypothetical | | | | | | | | | | | | | | | | |
| (5% return before expenses) — | | | | | | | | | | | | | | | | |
| before expense | | | | | | | | | | | | | | | | |
| reimbursement | | $ | 1,000.00 | | | $ | 1,015.50 | | | | 1.91 | % | | $ | 9.68 | |
| No Load Class Hypothetical | | | | | | | | | | | | | | | | |
| (5% return before expenses) — | | | | | | | | | | | | | | | | |
| after expense | | | | | | | | | | | | | | | | |
| reimbursement | | $ | 1,000.00 | | | $ | 1,015.60 | | | | 1.89 | % | | $ | 9.58 | |
| Advisor Class A Actual — | | | | | | | | | | | | | | | | |
| before expense | | | | | | | | | | | | | | | | |
| reimbursement | | $ | 1,000.00 | | | $ | 1,133.80 | | | | 2.16 | % | | $ | 11.59 | |
| Advisor Class A Actual — | | | | | | | | | | | | | | | | |
| after expense | | | | | | | | | | | | | | | | |
| reimbursement | | $ | 1,000.00 | | | $ | 1,133.80 | | | | 2.14 | % | | $ | 11.48 | |
| Advisor Class A Hypothetical | | | | | | | | | | | | | | | | |
| (5% return before expenses) — | | | | | | | | | | | | | | | | |
| before expense | | | | | | | | | | | | | | | | |
| reimbursement | | $ | 1,000.00 | | | $ | 1,014.24 | | | | 2.16 | % | | $ | 10.94 | |
| Advisor Class A Hypothetical | | | | | | | | | | | | | | | | |
| (5% return before expenses) — | | | | | | | | | | | | | | | | |
| after expense | | | | | | | | | | | | | | | | |
| reimbursement | | $ | 1,000.00 | | | $ | 1,014.34 | | | | 2.14 | % | | $ | 10.84 | |
| Advisor Class C Actual — before | | | | | | | | | | | | | | | | |
| expense reimbursement | | $ | 1,000.00 | | | $ | 1,130.90 | | | | 2.66 | % | | $ | 14.25 | |
| Advisor Class C Actual — after | | | | | | | | | | | | | | | | |
| expense reimbursement | | $ | 1,000.00 | | | $ | 1,130.90 | | | | 2.64 | % | | $ | 14.14 | |
| Advisor Class C Hypothetical | | | | | | | | | | | | | | | | |
| (5% return before expenses) — | | | | | | | | | | | | | | | | |
| before expense | | | | | | | | | | | | | | | | |
| reimbursement | | $ | 1,000.00 | | | $ | 1,011.73 | | | | 2.66 | % | | $ | 13.45 | |
| Advisor Class C Hypothetical | | | | | | | | | | | | | | | | |
| (5% return before expenses) — | | | | | | | | | | | | | | | | |
| after expense | | | | | | | | | | | | | | | | |
| reimbursement | | $ | 1,000.00 | | | $ | 1,011.83 | | | | 2.64 | % | | $ | 13.35 | |
| | | | | | | | | | | | | | | | | |
| The Global Fund | | | | | | | | | | | | | | | | |
| No Load Class Actual — before | | | | | | | | | | | | | | | | |
| expense reimbursement | | $ | 1,000.00 | | | $ | 1,146.80 | | | | 3.36 | % | | $ | 18.13 | |
| No Load Class Actual — after | | | | | | | | | | | | | | | | |
| expense reimbursement | | $ | 1,000.00 | | | $ | 1,146.80 | | | | 1.39 | % | | $ | 7.50 | |
| KINETICS MUTUAL FUNDS, INC. — THE FEEDER FUNDS |
Expense Example — (Continued) |
| December 31, 2012 |
| | | Beginning | | | Ending | | | | | | | |
| | | Account | | | Account | | | | | | Expenses Paid | |
| | | Value | | | Value | | | Annualized | | During Period* | |
| | | (7/1/12) | | | (12/31/12) | | | Expense Ratio | | (7/1/12 to 12/31/12) | |
| No Load Class Hypothetical | | | | | | | | | | | | |
| (5% return before expenses) — | | | | | | | | | | | | |
| before expense | | | | | | | | | | | | |
| reimbursement | | $ | 1,000.00 | | | $ | 1,008.21 | | | | 3.36 | % | | $ | 16.96 | |
| No Load Class Hypothetical | | | | | | | | | | | | | | | | |
| (5% return before expenses) — | | | | | | | | | | | | | | | | |
| after expense | | | | | | | | | | | | | | | | |
| reimbursement | | $ | 1,000.00 | | | $ | 1,018.11 | | | | 1.39 | % | | $ | 7.05 | |
| Advisor Class A Actual — before | | | | | | | | | | | | | | | | |
| expense reimbursement | | $ | 1,000.00 | | | $ | 1,144.70 | | | | 3.61 | % | | $ | 19.46 | |
| Advisor Class A Actual — after | | | | | | | | | | | | | | | | |
| expense reimbursement | | $ | 1,000.00 | | | $ | 1,144.70 | | | | 1.64 | % | | $ | 8.84 | |
| Advisor Class A Hypothetical | | | | | | | | | | | | | | | | |
| (5% return before expenses) — | | | | | | | | | | | | | | | | |
| before expense | | | | | | | | | | | | | | | | |
| reimbursement | | $ | 1,000.00 | | | $ | 1,006.95 | | | | 3.61 | % | | $ | 18.21 | |
| Advisor Class A Hypothetical | | | | | | | | | | | | | | | | |
| (5% return before expenses) — | | | | | | | | | | | | | | | | |
| after expense | | | | | | | | | | | | | | | | |
| reimbursement | | $ | 1,000.00 | | | $ | 1,016.86 | | | | 1.64 | % | | $ | 8.31 | |
| Advisor Class C Actual — before | | | | | | | | | | | | | | | | |
| expense reimbursement | | $ | 1,000.00 | | | $ | 1,140.80 | | | | 4.11 | % | | $ | 22.12 | |
| Advisor Class C Actual — after | | | | | | | | | | | | | | | | |
| expense reimbursement | | $ | 1,000.00 | | | $ | 1,140.80 | | | | 2.14 | % | | $ | 11.52 | |
| Advisor Class C Hypothetical | | | | | | | | | | | | | | | | |
| (5% return before expenses) — | | | | | | | | | | | | | | | | |
| before expense | | | | | | | | | | | | | | | | |
| reimbursement | | $ | 1,000.00 | | | $ | 1,004.44 | | | | 4.11 | % | | $ | 20.71 | |
| Advisor Class C Hypothetical | | | | | | | | | | | | | | | | |
| (5% return before expenses) — | | | | | | | | | | | | | | | | |
| after expense | | | | | | | | | | | | | | | | |
| reimbursement | | $ | 1,000.00 | | | $ | 1,014.34 | | | | 2.14 | % | | $ | 10.84 | |
| | | | | | | | | | | | | | | | | |
| The Paradigm Fund | | | | | | | | | | | | | | | | |
| No Load Class Actual — before | | | | | | | | | | | | | | | | |
| expense reimbursement | | $ | 1,000.00 | | | $ | 1,106.60 | | | | 1.78 | % | | $ | 9.43 | |
| No Load Class Actual — after | | | | | | | | | | | | | | | | |
| expense reimbursement | | $ | 1,000.00 | | | $ | 1,106.60 | | | | 1.64 | % | | $ | 8.68 | |
| No Load Class Hypothetical | | | | | | | | | | | | | | | | |
| (5% return before expenses) — | | | | | | | | | | | | | | | | |
| before expense | | | | | | | | | | | | | | | | |
| reimbursement | | $ | 1,000.00 | | | $ | 1,016.15 | | | | 1.78 | % | | $ | 9.02 | |
| No Load Class Hypothetical | | | | | | | | | | | | | | | | |
| (5% return before expenses) — | | | | | | | | | | | | | | | | |
| after expense | | | | | | | | | | | | | | | | |
| reimbursement | | $ | 1,000.00 | | | $ | 1,016.86 | | | | 1.64 | % | | $ | 8.31 | |
| KINETICS MUTUAL FUNDS, INC. — THE FEEDER FUNDS |
Expense Example — (Continued) |
| December 31, 2012 |
| | | Beginning | | | Ending | | | | | | | |
| | | Account | | | Account | | | | | | Expenses Paid | |
| | | Value | | | Value | | | Annualized | | During Period* | |
| | | (7/1/12) | | | (12/31/12) | | | Expense Ratio | | (7/1/12 to 12/31/12) | |
| Advisor Class A Actual — before | | | | | | | | | | | | |
| expense reimbursement | | $ | 1,000.00 | | | $ | 1,105.20 | | | | 2.03 | % | | $ | 10.74 | |
| Advisor Class A Actual — after | | | | | | | | | | | | | | | | |
| expense reimbursement | | $ | 1,000.00 | | | $ | 1,105.20 | | | | 1.89 | % | | $ | 10.00 | |
| Advisor Class A Hypothetical | | | | | | | | | | | | | | | | |
| (5% return before expenses) — | | | | | | | | | | | | | | | | |
| before expense | | | | | | | | | | | | | | | | |
| reimbursement | | $ | 1,000.00 | | | $ | 1,014.89 | | | | 2.03 | % | | $ | 10.28 | |
| Advisor Class A Hypothetical | | | | | | | | | | | | | | | | |
| (5% return before expenses) — | | | | | | | | | | | | | | | | |
| after expense | | | | | | | | | | | | | | | | |
| reimbursement | | $ | 1,000.00 | | | $ | 1,015.60 | | | | 1.89 | % | | $ | 9.58 | |
| Advisor Class C Actual — before | | | | | | | | | | | | | | | | |
| expense reimbursement | | $ | 1,000.00 | | | $ | 1,102.10 | | | | 2.53 | % | | $ | 13.37 | |
| Advisor Class C Actual — after | | | | | | | | | | | | | | | | |
| expense reimbursement | | $ | 1,000.00 | | | $ | 1,102.10 | | | | 2.39 | % | | $ | 12.63 | |
| Advisor Class C Hypothetical | | | | | | | | | | | | | | | | |
| (5% return before expenses) — | | | | | | | | | | | | | | | | |
| before expense | | | | | | | | | | | | | | | | |
| reimbursement | | $ | 1,000.00 | | | $ | 1,012.38 | | | | 2.53 | % | | $ | 12.80 | |
| Advisor Class C Hypothetical | | | | | | | | | | | | | | | | |
| (5% return before expenses) — | | | | | | | | | | | | | | | | |
| after expense | | | | | | | | | | | | | | | | |
| reimbursement | | $ | 1,000.00 | | | $ | 1,013.08 | | | | 2.39 | % | | $ | 12.09 | |
| Institutional Class Actual — before | | | | | | | | | | | | | | | | |
| expense reimbursement | | $ | 1,000.00 | | | $ | 1,107.40 | | | | 1.73 | % | | $ | 9.16 | |
| Institutional Class Actual — after | | | | | | | | | | | | | | | | |
| expense reimbursement | | $ | 1,000.00 | | | $ | 1,107.40 | | | | 1.44 | % | | $ | 7.63 | |
| Institutional Class Hypothetical | | | | | | | | | | | | | | | | |
| (5% return before expenses) — | | | | | | | | | | | | | | | | |
| before expense | | | | | | | | | | | | | | | | |
| reimbursement | | $ | 1,000.00 | | | $ | 1,016.40 | | | | 1.73 | % | | $ | 8.77 | |
| Institutional Class Hypothetical | | | | | | | | | | | | | | | | |
| (5% return before expenses) — | | | | | | | | | | | | | | | | |
| after expense | | | | | | | | | | | | | | | | |
| reimbursement | | $ | 1,000.00 | | | $ | 1,017.86 | | | | 1.44 | % | | $ | 7.30 | |
| | | | | | | | | | | | | | | | | |
| The Medical Fund | | | | | | | | | | | | | | | | |
| No Load Class Actual — before | | | | | | | | | | | | | | | | |
| expense reimbursement | | $ | 1,000.00 | | | $ | 1,002.50 | | | | 2.20 | % | | $ | 11.07 | |
| No Load Class Actual — after | | | | | | | | | | | | | | | | |
| expense reimbursement | | $ | 1,000.00 | | | $ | 1,002.50 | | | | 1.39 | % | | $ | 7.00 | |
| No Load Class Hypothetical | | | | | | | | | | | | | | | | |
| (5% return before expenses) — | | | | | | | | | | | | | | | | |
| before expense | | | | | | | | | | | | | | | | |
| reimbursement | | $ | 1,000.00 | | | $ | 1,014.04 | | | | 2.20 | % | | $ | 11.14 | |
| KINETICS MUTUAL FUNDS, INC. — THE FEEDER FUNDS |
Expense Example — (Continued) |
| December 31, 2012 |
| | | Beginning | | | Ending | | | | | | | |
| | | Account | | | Account | | | | | | Expenses Paid | |
| | | Value | | | Value | | | Annualized | | During Period* | |
| | | (7/1/12) | | | (12/31/12) | | | Expense Ratio | | (7/1/12 to 12/31/12) | |
| No Load Class Hypothetical | | | | | | | | | | | | |
| (5% return before expenses) — | | | | | | | | | | | | |
| after expense | | | | | | | | | | | | |
| reimbursement | | $ | 1,000.00 | | | $ | 1,018.11 | | | | 1.39 | % | | $ | 7.05 | |
| Advisor Class A Actual — before | | | | | | | | | | | | | | | | |
| expense reimbursement | | $ | 1,000.00 | | | $ | 1,001.10 | | | | 2.45 | % | | $ | 12.32 | |
| Advisor Class A Actual — after | | | | | | | | | | | | | | | | |
| expense reimbursement | | $ | 1,000.00 | | | $ | 1,001.10 | | | | 1.64 | % | | $ | 8.25 | |
| Advisor Class A Hypothetical | | | | | | | | | | | | | | | | |
| (5% return before expenses) — | | | | | | | | | | | | | | | | |
| before expense | | | | | | | | | | | | | | | | |
| reimbursement | | $ | 1,000.00 | | | $ | 1,012.78 | | | | 2.45 | % | | $ | 12.40 | |
| Advisor Class A Hypothetical | | | | | | | | | | | | | | | | |
| (5% return before expenses) — | | | | | | | | | | | | | | | | |
| after expense | | | | | | | | | | | | | | | | |
| reimbursement | | $ | 1,000.00 | | | $ | 1,016.86 | | | | 1.64 | % | | $ | 8.31 | |
| Advisor Class C Actual — before | | | | | | | | | | | | | | | | |
| expense reimbursement | | $ | 1,000.00 | | | $ | 999.30 | | | | 2.95 | % | | $ | 14.83 | |
| Advisor Class C Actual — after | | | | | | | | | | | | | | | | |
| expense reimbursement | | $ | 1,000.00 | | | $ | 999.30 | | | | 2.14 | % | | $ | 10.75 | |
| Advisor Class C Hypothetical | | | | | | | | | | | | | | | | |
| (5% return before expenses) — | | | | | | | | | | | | | | | | |
| before expense | | | | | | | | | | | | | | | | |
| reimbursement | | $ | 1,000.00 | | | $ | 1,010.27 | | | | 2.95 | % | | $ | 14.91 | |
| Advisor Class C Hypothetical | | | | | | | | | | | | | | | | |
| (5% return before expenses) — | | | | | | | | | | | | | | | | |
| after expense | | | | | | | | | | | | | | | | |
| reimbursement | | $ | 1,000.00 | | | $ | 1,014.34 | | | | 2.14 | % | | $ | 10.84 | |
| | | | | | | | | | | | | | | | | |
| The Small Cap Opportunities Fund | | | | | | | | | | | | | | | | |
| No Load Class Actual — before | | | | | | | | | | | | | | | | |
| expense reimbursement | | $ | 1,000.00 | | | $ | 1,129.20 | | | | 1.90 | % | | $ | 10.17 | |
| No Load Class Actual — after | | | | | | | | | | | | | | | | |
| expense reimbursement | | $ | 1,000.00 | | | $ | 1,129.20 | | | | 1.64 | % | | $ | 8.78 | |
| No Load Class Hypothetical | | | | | | | | | | | | | | | | |
| (5% return before expenses) — | | | | | | | | | | | | | | | | |
| before expense | | | | | | | | | | | | | | | | |
| reimbursement | | $ | 1,000.00 | | | $ | 1,015.55 | | | | 1.90 | % | | $ | 9.63 | |
| No Load Class Hypothetical | | | | | | | | | | | | | | | | |
| (5% return before expenses) — | | | | | | | | | | | | | | | | |
| after expense | | | | | | | | | | | | | | | | |
| reimbursement | | $ | 1,000.00 | | | $ | 1,016.86 | | | | 1.64 | % | | $ | 8.31 | |
| Advisor Class A Actual — before | | | | | | | | | | | | | | | | |
| expense reimbursement | | $ | 1,000.00 | | | $ | 1,128.00 | | | | 2.15 | % | | $ | 11.50 | |
| Advisor Class A Actual — after | | | | | | | | | | | | | | | | |
| expense reimbursement | | $ | 1,000.00 | | | $ | 1,128.00 | | | | 1.89 | % | | $ | 10.11 | |
| KINETICS MUTUAL FUNDS, INC. — THE FEEDER FUNDS |
Expense Example — (Continued) |
| December 31, 2012 |
| | | Beginning | | | Ending | | | | | | | |
| | | Account | | | Account | | | | | | Expenses Paid | |
| | | Value | | | Value | | | Annualized | | During Period* | |
| | | (7/1/12) | | | (12/31/12) | | | Expense Ratio | | (7/1/12 to 12/31/12) | |
| Advisor Class A Hypothetical | | | | | | | | | | | | |
| (5% return before expenses) — | | | | | | | | | | | | |
| before expense | | | | | | | | | | | | |
| reimbursement | | $ | 1,000.00 | | | $ | 1,014.29 | | | | 2.15 | % | | $ | 10.89 | |
| Advisor Class A Hypothetical | | | | | | | | | | | | | | | | |
| (5% return before expenses) — | | | | | | | | | | | | | | | | |
| after expense | | | | | | | | | | | | | | | | |
| reimbursement | | $ | 1,000.00 | | | $ | 1,015.60 | | | | 1.89 | % | | $ | 9.58 | |
| Advisor Class C Actual — before | | | | | | | | | | | | | | | | |
| expense reimbursement | | $ | 1,000.00 | | | $ | 1,124.70 | | | | 2.65 | % | | $ | 14.15 | |
| Advisor Class C Actual — after | | | | | | | | | | | | | | | | |
| expense reimbursement | | $ | 1,000.00 | | | $ | 1,124.70 | | | | 2.39 | % | | $ | 12.76 | |
| Advisor Class C Hypothetical | | | | | | | | | | | | | | | | |
| (5% return before expenses) — | | | | | | | | | | | | | | | | |
| before expense | | | | | | | | | | | | | | | | |
| reimbursement | | $ | 1,000.00 | | | $ | 1,011.78 | | | | 2.65 | % | | $ | 13.40 | |
| Advisor Class C Hypothetical | | | | | | | | | | | | | | | | |
| (5% return before expenses) — | | | | | | | | | | | | | | | | |
| after expense | | | | | | | | | | | | | | | | |
| reimbursement | | $ | 1,000.00 | | | $ | 1,013.08 | | | | 2.39 | % | | $ | 12.09 | |
| Institutional Class Actual — before | | | | | | | | | | | | | | | | |
| expense reimbursement | | $ | 1,000.00 | | | $ | 1,130.40 | | | | 1.85 | % | | $ | 9.91 | |
| Institutional Class Actual — after | | | | | | | | | | | | | | | | |
| expense reimbursement | | $ | 1,000.00 | | | $ | 1,130.40 | | | | 1.44 | % | | $ | 7.71 | |
| Institutional Class Hypothetical | | | | | | | | | | | | | | | | |
| (5% return before expenses) — | | | | | | | | | | | | | | | | |
| before expense | | | | | | | | | | | | | | | | |
| reimbursement | | $ | 1,000.00 | | | $ | 1,015.80 | | | | 1.85 | % | | $ | 9.37 | |
| Institutional Class Hypothetical | | | | | | | | | | | | | | | | |
| (5% return before expenses) — | | | | | | | | | | | | | | | | |
| after expense | | | | | | | | | | | | | | | | |
| reimbursement | | $ | 1,000.00 | | | $ | 1,017.86 | | | | 1.44 | % | | $ | 7.30 | |
| | | | | | | | | | | | | | | | | |
| The Market Opportunities Fund | | | | | | | | | | | | | | | | |
| No Load Class Actual — before | | | | | | | | | | | | | | | | |
| expense reimbursement | | $ | 1,000.00 | | | $ | 1,088.70 | | | | 1.98 | % | | $ | 10.40 | |
| No Load Class Actual — after | | | | | | | | | | | | | | | | |
| expense reimbursement | | $ | 1,000.00 | | | $ | 1,088.70 | | | | 1.64 | % | | $ | 8.61 | |
| No Load Class Hypothetical | | | | | | | | | | | | | | | | |
| (5% return before expenses) — | | | | | | | | | | | | | | | | |
| before expense | | | | | | | | | | | | | | | | |
| reimbursement | | $ | 1,000.00 | | | $ | 1,015.15 | | | | 1.98 | % | | $ | 10.03 | |
| No Load Class Hypothetical | | | | | | | | | | | | | | | | |
| (5% return before expenses) — | | | | | | | | | | | | | | | | |
| after expense | | | | | | | | | | | | | | | | |
| reimbursement | | $ | 1,000.00 | | | $ | 1,016.86 | | | | 1.64 | % | | $ | 8.31 | |
| Advisor Class A Actual — before | | | | | | | | | | | | | | | | |
| expense reimbursement | | $ | 1,000.00 | | | $ | 1,088.10 | | | | 2.23 | % | | $ | 11.70 | |
| KINETICS MUTUAL FUNDS, INC. — THE FEEDER FUNDS |
Expense Example — (Continued) |
| December 31, 2012 |
| | | Beginning | | | Ending | | | | | | | |
| | | Account | | | Account | | | | | | Expenses Paid | |
| | | Value | | | Value | | | Annualized | | During Period* | |
| | | (7/1/12) | | | (12/31/12) | | | Expense Ratio | | (7/1/12 to 12/31/12) | |
| Advisor Class A Actual — after | | | | | | | | | | | | |
| expense reimbursement | | $ | 1,000.00 | | | $ | 1,088.10 | | | | 1.89 | % | | $ | 9.92 | |
| Advisor Class A Hypothetical | | | | | | | | | | | | | | | | |
| (5% return before expenses) — | | | | | | | | | | | | | | | | |
| before expense | | | | | | | | | | | | | | | | |
| reimbursement | | $ | 1,000.00 | | | $ | 1,013.89 | | | | 2.23 | % | | $ | 11.29 | |
| Advisor Class A Hypothetical | | | | | | | | | | | | | | | | |
| (5% return before expenses) — | | | | | | | | | | | | | | | | |
| after expense | | | | | | | | | | | | | | | | |
| reimbursement | | $ | 1,000.00 | | | $ | 1,015.60 | | | | 1.89 | % | | $ | 9.58 | |
| Advisor Class C Actual — before | | | | | | | | | | | | | | | | |
| expense reimbursement | | $ | 1,000.00 | | | $ | 1,085.00 | | | | 2.73 | % | | $ | 14.31 | |
| Advisor Class C Actual — after | | | | | | | | | | | | | | | | |
| expense reimbursement | | $ | 1,000.00 | | | $ | 1,085.00 | | | | 2.39 | % | | $ | 12.53 | |
| Advisor Class C Hypothetical | | | | | | | | | | | | | | | | |
| (5% return before expenses) — | | | | | | | | | | | | | | | | |
| before expense | | | | | | | | | | | | | | | | |
| reimbursement | | $ | 1,000.00 | | | $ | 1,011.38 | | | | 2.73 | % | | $ | 13.80 | |
| Advisor Class C Hypothetical | | | | | | | | | | | | | | | | |
| (5% return before expenses) — | | | | | | | | | | | | | | | | |
| after expense | | | | | | | | | | | | | | | | |
| reimbursement | | $ | 1,000.00 | | | $ | 1,013.08 | | | | 2.39 | % | | $ | 12.09 | |
| Institutional Class Actual — before | | | | | | | | | | | | | | | | |
| expense reimbursement | | $ | 1,000.00 | | | $ | 1,089.70 | | | | 1.93 | % | | $ | 10.14 | |
| Institutional Class Actual — after | | | | | | | | | | | | | | | | |
| expense reimbursement | | $ | 1,000.00 | | | $ | 1,089.70 | | | | 1.44 | % | | $ | 7.56 | |
| Institutional Class Hypothetical | | | | | | | | | | | | | | | | |
| (5% return before expenses) — | | | | | | | | | | | | | | | | |
| before expense | | | | | | | | | | | | | | | | |
| reimbursement | | $ | 1,000.00 | | | $ | 1,015.40 | | | | 1.93 | % | | $ | 9.78 | |
| Institutional Class Hypothetical | | | | | | | | | | | | | | | | |
| (5% return before expenses) — | | | | | | | | | | | | | | | | |
| after expense | | | | | | | | | | | | | | | | |
| reimbursement | | $ | 1,000.00 | | | $ | 1,017.86 | | | | 1.44 | % | | $ | 7.30 | |
| | | | | | | | | | | | | | | | | |
| The Water Infrastructure Fund | | | | | | | | | | | | | | | | |
| No Load Class Actual — before | | | | | | | | | | | | | | | | |
| expense reimbursement | | $ | 1,000.00 | | | $ | 1,037.70 | | | | 2.50 | % | | $ | 12.81 | |
| No Load Class Actual — after | | | | | | | | | | | | | | | | |
| expense reimbursement | | $ | 1,000.00 | | | $ | 1,037.70 | | | | 1.64 | % | | $ | 8.40 | |
| No Load Class Hypothetical | | | | | | | | | | | | | | | | |
| (5% return before expenses) — | | | | | | | | | | | | | | | | |
| before expense | | | | | | | | | | | | | | | | |
| reimbursement | | $ | 1,000.00 | | | $ | 1,012.53 | | | | 2.50 | % | | $ | 12.65 | |
| No Load Class Hypothetical | | | | | | | | | | | | | | | | |
| (5% return before expenses) — | | | | | | | | | | | | | | | | |
| after expense | | | | | | | | | | | | | | | | |
| reimbursement | | $ | 1,000.00 | | | $ | 1,016.86 | | | | 1.64 | % | | $ | 8.31 | |
| KINETICS MUTUAL FUNDS, INC. — THE FEEDER FUNDS |
Expense Example — (Continued) |
| December 31, 2012 |
| | | Beginning | | | Ending | | | | | | | |
| | | Account | | | Account | | | | | | Expenses Paid | |
| | | Value | | | Value | | | Annualized | | During Period* | |
| | | (7/1/12) | | | (12/31/12) | | | Expense Ratio | | (7/1/12 to 12/31/12) | |
| Advisor Class A Actual — before | | | | | | | | | | | | |
| expense reimbursement | | $ | 1,000.00 | | | $ | 1,036.20 | | | | 2.75 | % | | $ | 14.08 | |
| Advisor Class A Actual — after | | | | | | | | | | | | | | | | |
| expense reimbursement | | $ | 1,000.00 | | | $ | 1,036.20 | | | | 1.89 | % | | $ | 9.67 | |
| Advisor Class A Hypothetical | | | | | | | | | | | | | | | | |
| (5% return before expenses) — | | | | | | | | | | | | | | | | |
| before expense | | | | | | | | | | | | | | | | |
| reimbursement | | $ | 1,000.00 | | | $ | 1,011.27 | | | | 2.75 | % | | $ | 13.90 | |
| Advisor Class A Hypothetical | | | | | | | | | | | | | | | | |
| (5% return before expenses) — | | | | | | | | | | | | | | | | |
| after expense | | | | | | | | | | | | | | | | |
| reimbursement | | $ | 1,000.00 | | | $ | 1,015.60 | | | | 1.89 | % | | $ | 9.58 | |
| Advisor Class C Actual — before | | | | | | | | | | | | | | | | |
| expense reimbursement | | $ | 1,000.00 | | | $ | 1,033.10 | | | | 3.25 | % | | $ | 16.61 | |
| Advisor Class C Actual — after | | | | | | | | | | | | | | | | |
| expense reimbursement | | $ | 1,000.00 | | | $ | 1,033.10 | | | | 2.39 | % | | $ | 12.21 | |
| Advisor Class C Hypothetical | | | | | | | | | | | | | | | | |
| (5% return before expenses) — | | | | | | | | | | | | | | | | |
| before expense | | | | | | | | | | | | | | | | |
| reimbursement | | $ | 1,000.00 | | | $ | 1,008.76 | | | | 3.25 | % | | $ | 16.41 | |
| Advisor Class C Hypothetical | | | | | | | | | | | | | | | | |
| (5% return before expenses) — | | | | | | | | | | | | | | | | |
| after expense | | | | | | | | | | | | | | | | |
| reimbursement | | $ | 1,000.00 | | | $ | 1,013.08 | | | | 2.39 | % | | $ | 12.09 | |
| Institutional Class Actual — before | | | | | | | | | | | | | | | | |
| expense reimbursement | | $ | 1,000.00 | | | $ | 1,038.20 | | | | 2.45 | % | | $ | 12.55 | |
| Institutional Class Actual — after | | | | | | | | | | | | | | | | |
| expense reimbursement | | $ | 1,000.00 | | | $ | 1,038.20 | | | | 1.44 | % | | $ | 7.38 | |
| Institutional Class Hypothetical | | | | | | | | | | | | | | | | |
| (5% return before expenses) — | | | | | | | | | | | | | | | | |
| before expense | | | | | | | | | | | | | | | | |
| reimbursement | | $ | 1,000.00 | | | $ | 1,012.78 | | | | 2.45 | % | | $ | 12.40 | |
| Institutional Class Hypothetical | | | | | | | | | | | | | | | | |
| (5% return before expenses) — | | | | | | | | | | | | | | | | |
| after expense | | | | | | | | | | | | | | | | |
| reimbursement | | $ | 1,000.00 | | | $ | 1,017.86 | | | | 1.44 | % | | $ | 7.30 | |
| | | | | | | | | | | | | | | | | |
| The Multi-Disciplinary Fund | | | | | | | | | | | | | | | | |
| No Load Class Actual — before | | | | | | | | | | | | | | | | |
| expense reimbursement | | $ | 1,000.00 | | | $ | 1,083.80 | | | | 1.96 | % | | $ | 10.27 | |
| No Load Class Actual — after | | | | | | | | | | | | | | | | |
| expense reimbursement | | $ | 1,000.00 | | | $ | 1,083.80 | | | | 1.49 | % | | $ | 7.80 | |
| No Load Class Hypothetical | | | | | | | | | | | | | | | | |
| (5% return before expenses) — | | | | | | | | | | | | | | | | |
| before expense | | | | | | | | | | | | | | | | |
| reimbursement | | $ | 1,000.00 | | | $ | 1,015.25 | | | | 1.96 | % | | $ | 9.93 | |
| KINETICS MUTUAL FUNDS, INC. — THE FEEDER FUNDS |
Expense Example — (Continued) |
| December 31, 2012 |
| | | Beginning | | | Ending | | | | | | | |
| | | Account | | | Account | | | | | | Expenses Paid | |
| | | Value | | | Value | | | Annualized | | During Period* | |
| | | (7/1/12) | | | (12/31/12) | | | Expense Ratio | | (7/1/12 to 12/31/12) | |
| No Load Class Hypothetical | | | | | | | | | | | | |
| (5% return before expenses) — | | | | | | | | | | | | |
| after expense | | | | | | | | | | | | |
| reimbursement | | $ | 1,000.00 | | | $ | 1,017.61 | | | | 1.49 | % | | $ | 7.56 | |
| Advisor Class A Actual — before | | | | | | | | | | | | | | | | |
| expense reimbursement | | $ | 1,000.00 | | | $ | 1,082.90 | | | | 2.21 | % | | $ | 11.57 | |
| Advisor Class A Actual — after | | | | | | | | | | | | | | | | |
| expense reimbursement | | $ | 1,000.00 | | | $ | 1,082.90 | | | | 1.74 | % | | $ | 9.11 | |
| Advisor Class A Hypothetical | | | | | | | | | | | | | | | | |
| (5% return before expenses) — | | | | | | | | | | | | | | | | |
| before expense | | | | | | | | | | | | | | | | |
| reimbursement | | $ | 1,000.00 | | | $ | 1,013.99 | | | | 2.21 | % | | $ | 11.19 | |
| Advisor Class A Hypothetical | | | | | | | | | | | | | | | | |
| (5% return before expenses) — | | | | | | | | | | | | | | | | |
| after expense | | | | | | | | | | | | | | | | |
| reimbursement | | $ | 1,000.00 | | | $ | 1,016.35 | | | | 1.74 | % | | $ | 8.82 | |
| Advisor Class C Actual — before | | | | | | | | | | | | | | | | |
| expense reimbursement | | $ | 1,000.00 | | | $ | 1,079.80 | | | | 2.71 | % | | $ | 14.17 | |
| Advisor Class C Actual — after | | | | | | | | | | | | | | | | |
| expense reimbursement | | $ | 1,000.00 | | | $ | 1,079.80 | | | | 2.24 | % | | $ | 11.71 | |
| Advisor Class C Hypothetical | | | | | | | | | | | | | | | | |
| (5% return before expenses) — | | | | | | | | | | | | | | | | |
| before expense | | | | | | | | | | | | | | | | |
| reimbursement | | $ | 1,000.00 | | | $ | 1,011.48 | | | | 2.71 | % | | $ | 13.70 | |
| Advisor Class C Hypothetical | | | | | | | | | | | | | | | | |
| (5% return before expenses) — | | | | | | | | | | | | | | | | |
| after expense | | | | | | | | | | | | | | | | |
| reimbursement | | $ | 1,000.00 | | | $ | 1,013.84 | | | | 2.24 | % | | $ | 11.34 | |
| Institutional Class Actual — before | | | | | | | | | | | | | | | | |
| expense reimbursement | | $ | 1,000.00 | | | $ | 1,084.50 | | | | 1.91 | % | | $ | 10.01 | |
| Institutional Class Actual — after | | | | | | | | | | | | | | | | |
| expense reimbursement | | $ | 1,000.00 | | | $ | 1,084.50 | | | | 1.29 | % | | $ | 6.76 | |
| Institutional Class Hypothetical | | | | | | | | | | | | | | | | |
| (5% return before expenses) — | | | | | | | | | | | | | | | | |
| before expense | | | | | | | | | | | | | | | | |
| reimbursement | | $ | 1,000.00 | | | $ | 1,015.50 | | | | 1.91 | % | | $ | 9.68 | |
| Institutional Class Hypothetical | | | | | | | | | | | | | | | | |
| (5% return before expenses) — | | | | | | | | | | | | | | | | |
| after expense | | | | | | | | | | | | | | | | |
| reimbursement | | $ | 1,000.00 | | | $ | 1,018.61 | | | | 1.29 | % | | $ | 6.55 | |
| | | |
| Note: | Each Feeder Fund records its proportionate share of the respective Master Portfolio’s expenses on a daily basis. Any expense reductions include Feeder Fund-specific expenses as well as the expenses allocated for the Master Portfolio. |
| * | Expenses are equal to the Feeder Fund’s annualized expense ratio before expense reimbursement and after expense reimbursement multiplied by the average account value over the period, multiplied by 184/366. |
| KINETICS MUTUAL FUNDS, INC. — THE FEEDER FUNDS |
| Statements of Assets & Liabilities |
| December 31, 2012 |
| | | The Internet Fund | | | The Global Fund | |
| ASSETS: | | | | | | |
| Investments in the Master Portfolio, at value* | | $ | 156,697,785 | | | $ | 6,530,964 | |
| Receivable from Adviser | | | — | | | | 15,645 | |
| Receivable for Fund shares sold | | | 510,784 | | | | 1,038 | |
| Prepaid expenses and other assets | | | 21,904 | | | | 14,030 | |
| Total Assets | | | 157,230,473 | | | | 6,561,677 | |
| LIABILITIES: | | | | | | | | |
| Payable for Master Portfolio interest purchased | | | 51,396 | | | | 770 | |
| Payable to Directors and Officers | | | 2,738 | | | | 117 | |
| Payable for Fund shares repurchased | | | 459,388 | | | | 268 | |
| Payable for shareholder servicing fees | | | 32,906 | | | | 1,361 | |
| Payable for distribution fees | | | 597 | | | | 454 | |
| Accrued expenses and other liabilities | | | 83,020 | | | | 13,245 | |
| Total Liabilities | | | 630,045 | | | | 16,215 | |
| Net Assets | | $ | 156,600,428 | | | $ | 6,545,462 | |
| NET ASSETS CONSIST OF: | | | | | | | | |
| Paid in capital | | $ | 116,134,188 | | | $ | 6,395,325 | |
| Accumulated net investment income (loss) | | | 43,841 | | | | (78,186 | ) |
| Accumulated net realized gain (loss) on investments | | | | | | | | |
| and foreign currency | | | 2,435,857 | | | | (409,858 | ) |
| Net unrealized appreciation on: | | | | | | | | |
| Investments and foreign currency | | | 37,986,542 | | | | 638,181 | |
| Net Assets | | $ | 156,600,428 | | | $ | 6,545,462 | |
| CALCULATION OF NET ASSET VALUE PER SHARE — NO LOAD CLASS: | | | | | | | | |
| Net Assets | | $ | 155,036,350 | | | $ | 5,068,976 | |
| Shares outstanding | | | 3,590,465 | | | | 1,076,195 | |
| Net asset value per share (offering price and redemption price) | | $ | 43.18 | | | $ | 4.71 | |
| CALCULATION OF NET ASSET VALUE PER SHARE — ADVISOR CLASS A: | | | | | | | | |
| Net Assets | | $ | 1,379,053 | | | $ | 1,093,010 | |
| Shares outstanding | | | 32,605 | | | | 232,238 | |
| Net asset value per share (redemption price) | | $ | 42.30 | | | $ | 4.71 | |
| Offering price per share ($42.30 divided by .9425 and $4.71 | | | | | | | | |
| divided by .9425) | | $ | 44.88 | | | $ | 5.00 | |
| CALCULATION OF NET ASSET VALUE PER SHARE — ADVISOR CLASS C: | | | | | | | | |
| Net Assets | | $ | 185,025 | | | $ | 383,476 | |
| Shares outstanding | | | 4,536 | | | | 82,947 | |
| Net asset value per share (offering price and redemption price) | | $ | 40.79 | | | $ | 4.62 | |
| | | |
| * | Each Feeder Fund invests all or generally all its assets directly in the corresponding Master Portfolio.The financial statements for the Master Portfolios, along with the portfolio of investments in securities, are contained elsewhere in this report and should be read in conjunction with the Feeder Funds’ financial statements. |
The accompanying notes are an integral part of these financial statements.
| KINETICS MUTUAL FUNDS, INC. — THE FEEDER FUNDS |
Statements of Assets & Liabilities — (Continued) |
| December 31, 2012 |
| | | The Paradigm | | | The Medical | |
| | | Fund | | | Fund | |
| ASSETS: | | | | | | |
| Investments in the Master Portfolio, at value* | | $ | 846,812,609 | | | $ | 17,290,258 | |
| Receivable from Adviser | | | 102,460 | | | | 11,070 | |
| Receivable for Master Portfolio interest sold | | | — | | | | 501 | |
| Receivable for Fund shares sold | | | 10,102,454 | | | | 36,521 | |
| Prepaid expenses and other assets | | | 55,700 | | | | 10,355 | |
| Total Assets | | | 857,073,223 | | | | 17,348,705 | |
| LIABILITIES: | | | | | | | | |
| Payable for Master Portfolio interest purchased | | | 7,982,527 | | | | — | |
| Payable to Directors and Officers | | | 18,929 | | | | 413 | |
| Payable for Fund shares repurchased | | | 2,119,926 | | | | 37,022 | |
| Payable for shareholder servicing fees | | | 144,117 | | | | 3,705 | |
| Payable for distribution fees | | | 189,276 | | | | 1,959 | |
| Accrued expenses and other liabilities | | | 292,808 | | | | 18,762 | |
| Total Liabilities | | | 10,747,583 | | | | 61,861 | |
| Net Assets | | $ | 846,325,640 | | | $ | 17,286,844 | |
| NET ASSETS CONSIST OF: | | | | | | | | |
| Paid in capital | | $ | 1,594,235,372 | | | $ | 18,361,010 | |
| Accumulated net investment income (loss) | | | (9,449,805 | ) | | | 28,372 | |
| Accumulated net realized gain (loss) on investments and | | | | | | | | |
| foreign currency | | | (782,445,966 | ) | | | 73,596 | |
| Net unrealized appreciation (depreciation) on: | | | | | | | | |
| Investments and foreign currency | | | 43,986,039 | | | | (1,176,134 | ) |
| Net Assets | | $ | 846,325,640 | | | $ | 17,286,844 | |
| CALCULATION OF NET ASSET VALUE PER SHARE — NO LOAD CLASS: | | | | | | | | |
| Net Assets | | $ | 416,695,930 | | | $ | 14,253,738 | |
| Shares outstanding | | | 17,371,289 | | | | 799,707 | |
| Net asset value per share (offering price and redemption price) | | $ | 23.99 | | | $ | 17.82 | |
| CALCULATION OF NET ASSET VALUE PER SHARE — ADVISOR CLASS A: | | | | | | | | |
| Net Assets | | $ | 135,746,930 | | | $ | 2,583,130 | |
| Shares outstanding | | | 5,755,426 | | | | 149,029 | |
| Net asset value per share (redemption price) | | $ | 23.59 | | | $ | 17.33 | |
| Offering price per share ($23.59 divided by .9425 and $17.33 | | | | | | | | |
| divided by .9425) | | $ | 25.03 | | | $ | 18.39 | |
| CALCULATION OF NET ASSET VALUE PER SHARE — ADVISOR CLASS C: | | | | | | | | |
| Net Assets | | $ | 101,404,993 | | | $ | 449,976 | |
| Shares outstanding | | | 4,474,445 | | | | 26,182 | |
| Net asset value per share (offering price and redemption price) | | $ | 22.66 | | | $ | 17.19 | |
| CALCULATION OF NET ASSET VALUE PER SHARE — INSTITUTIONAL CLASS: | | | | | | | | |
| Net Assets | | $ | 192,477,787 | | | | N/A | |
| Shares outstanding | | | 8,041,850 | | | | N/A | |
| Net asset value per share (offering price and redemption price) | | $ | 23.93 | | | | N/A | |
| | | |
| * | Each Feeder Fund invests all or generally all its assets directly in the corresponding Master Portfolio. The financial statements for the Master Portfolios, along with the portfolio of investments in securities, are contained elsewhere in this report and should be read in conjunction with the Feeder Funds’ financial statements. |
The accompanying notes are an integral part of these financial statements.
| KINETICS MUTUAL FUNDS, INC. — THE FEEDER FUNDS |
Statements of Assets & Liabilities — (Continued) |
| December 31, 2012 |
| | | | | | | |
| | | The Small Cap | | | The Market | |
| | | Opportunities | | | Opportunities | |
| | | Fund | | | Fund | |
| ASSETS: | | | | | | |
| Investments in the Master Portfolio, at value* | | $ | 81,561,915 | | | $ | 43,627,159 | |
| Receivable from Adviser | | | 12,579 | | | | 11,339 | |
| Receivable for Master Portfolio interest sold | | | 97,774 | | | | 46,888 | |
| Receivable for Fund shares sold | | | 35,400 | | | | 307 | |
| Prepaid expenses and other assets | | | 17,806 | | | | 7,829 | |
| Total Assets | | | 81,725,474 | | | | 43,693,522 | |
| LIABILITIES: | | | | | | | | |
| Payable to Directors and Officers | | | 1,881 | | | | 1,016 | |
| Payable for Fund shares repurchased | | | 133,174 | | | | 47,195 | |
| Payable for shareholder servicing fees | | | 15,794 | | | | 9,038 | |
| Payable for distribution fees | | | 6,785 | | | | 6,820 | |
| Accrued expenses and other liabilities | | | 44,445 | | | | 21,198 | |
| Total Liabilities | | | 202,079 | | | | 85,267 | |
| Net Assets | | $ | 81,523,395 | | | $ | 43,608,255 | |
| NET ASSETS CONSIST OF: | | | | | | | | |
| Paid in capital | | $ | 233,178,932 | | | $ | 70,660,142 | |
| Accumulated net investment loss | | | (747,038 | ) | | | (1,156,606 | ) |
| Accumulated net realized loss on investments and | | | | | | | | |
| foreign currency | | | (160,630,266 | ) | | | (29,750,789 | ) |
| Net unrealized appreciation on: | | | | | | | | |
| Investments and foreign currency | | | 9,721,767 | | | | 3,855,508 | |
| Net Assets | | $ | 81,523,395 | | | $ | 43,608,255 | |
| CALCULATION OF NET ASSET VALUE PER SHARE — NO LOAD CLASS: | | | | | | | | |
| Net Assets | | $ | 63,947,015 | | | $ | 32,929,424 | |
| Shares outstanding | | | 2,540,972 | | | | 2,726,015 | |
| Net asset value per share (offering price and redemption price) | | $ | 25.17 | | | $ | 12.08 | |
| CALCULATION OF NET ASSET VALUE PER SHARE — ADVISOR CLASS A: | | | | | | | | |
| Net Assets | | $ | 7,558,368 | | | $ | 6,517,719 | |
| Shares outstanding | | | 305,193 | | | | 539,905 | |
| Net asset value per share (redemption price) | | $ | 24.77 | | | $ | 12.07 | |
| Offering price per share ($24.77 divided by .9425 and $12.07 | | | | | | | | |
| divided by .9425) | | $ | 26.28 | | | $ | 12.81 | |
| CALCULATION OF NET ASSET VALUE PER SHARE — ADVISOR CLASS C: | | | | | | | | |
| Net Assets | | $ | 2,536,166 | | | $ | 3,931,849 | |
| Shares outstanding | | | 104,157 | | | | 329,392 | |
| Net asset value per share (offering price and redemption price) | | $ | 24.35 | | | $ | 11.94 | |
| CALCULATION OF NET ASSET VALUE PER SHARE — INSTITUTIONAL CLASS: | | | | | | | | |
| Net Assets | | $ | 7,481,846 | | | $ | 229,263 | |
| Shares outstanding | | | 295,513 | | | | 18,946 | |
| Net asset value per share (offering price and redemption price) | | $ | 25.32 | | | $ | 12.10 | |
| | | |
| * | Each Feeder Fund invests all or generally all its assets directly in the corresponding Master Portfolio. The financial statements for the Master Portfolios, along with the portfolio of investments in securities, are contained elsewhere in this report and should be read in conjunction with the Feeder Funds’ financial statements. |
The accompanying notes are an integral part of these financial statements.
| KINETICS MUTUAL FUNDS, INC. — THE FEEDER FUNDS |
Statements of Assets & Liabilities — (Continued) |
| December 31, 2012 |
| | | The Water | | | The Multi- | |
| | | Infrastructure | | | Disciplinary | |
| | | Fund | | | Fund | |
| ASSETS: | | | | | | |
| Investments in the Master Portfolio, at value* | | $ | 10,687,314 | | | $ | 59,407,989 | |
| Receivable from Adviser | | | 8,237 | | | | 20,981 | |
| Receivable for Fund shares sold | | | 17,756 | | | | 827,786 | |
| Prepaid expenses and other assets | | | 15,002 | | | | 5,963 | |
| Total Assets | | | 10,728,309 | | | | 60,262,719 | |
| LIABILITIES: | | | | | �� | | | |
| Payable for Master Portfolio interest purchased | | | 5,632 | | | | 739,060 | |
| Payable to Directors and Officers | | | 267 | | | | 995 | |
| Payable for Fund shares repurchased | | | 12,124 | | | | 88,726 | |
| Payable for shareholder servicing fees | | | 2,035 | | | | 10,938 | |
| Payable for distribution fees | | | 4,113 | | | | 9,993 | |
| Accrued expenses and other liabilities | | | 14,920 | | | | 21,398 | |
| Total Liabilities | | | 39,091 | | | | 871,110 | |
| Net Assets | | $ | 10,689,218 | | | $ | 59,391,609 | |
| NET ASSETS CONSIST OF: | | | | | | | | |
| Paid in capital | | $ | 19,220,635 | | | $ | 57,480,401 | |
| Accumulated net investment loss | | | (72,455 | ) | | | (433,001 | ) |
| Accumulated net realized gain (loss) on investments, | | | | | | | | |
| foreign currency and written option contracts | | | (8,409,529 | ) | | | 998,902 | |
| Net unrealized appreciation (depreciation) on: | | | | | | | | |
| Investments and foreign currency | | | (49,601 | ) | | | (1,115,667 | ) |
| Written option contracts | | | 168 | | | | 2,450,782 | |
| Short sales | | | — | | | | 10,192 | |
| Net Assets | | $ | 10,689,218 | | | $ | 59,391,609 | |
| CALCULATION OF NET ASSET VALUE PER SHARE — NO LOAD CLASS: | | | | | | | | |
| Net Assets | | $ | 4,699,438 | | | $ | 19,566,013 | |
| Shares outstanding | | | 564,061 | | | | 1,766,444 | |
| Net asset value per share (offering price and redemption price) | | $ | 8.33 | | | $ | 11.08 | |
| CALCULATION OF NET ASSET VALUE PER SHARE — ADVISOR CLASS A: | | | | | | | | |
| Net Assets | | $ | 2,597,348 | | | $ | 25,764,483 | |
| Shares outstanding | | | 311,491 | | | | 2,335,526 | |
| Net asset value per share (redemption price) | | $ | 8.34 | | | $ | 11.03 | |
| Offering price per share ($8.34 divided by .9425 and $11.03 | | | | | | | | |
| divided by .9425) | | $ | 8.85 | | | $ | 11.70 | |
| CALCULATION OF NET ASSET VALUE PER SHARE — ADVISOR CLASS C: | | | | | | | | |
| Net Assets | | $ | 1,763,421 | | | $ | 7,484,710 | |
| Shares outstanding | | | 214,374 | | | | 682,960 | |
| Net asset value per share (offering price and redemption price) | | $ | 8.23 | | | $ | 10.96 | |
| CALCULATION OF NET ASSET VALUE PER SHARE — INSTITUTIONAL CLASS: | | | | | | | | |
| Net Assets | | $ | 1,629,011 | | | $ | 6,576,403 | |
| Shares outstanding | | | 193,941 | | | | 591,854 | |
| Net asset value per share (offering price and redemption price) | | $ | 8.40 | | | $ | 11.11 | |
| | | |
| * | Each Feeder Fund invests all or generally all its assets directly in the corresponding Master Portfolio. The financial statements for the Master Portfolios, along with the portfolio of investments in securities, are contained elsewhere in this report and should be read in conjunction with the Feeder Funds’ financial statements. |
The accompanying notes are an integral part of these financial statements.
| KINETICS MUTUAL FUNDS, INC. — THE FEEDER FUNDS |
| Statements of Operations |
| For the Year Ended December 31, 2012 |
| | | The Internet | | | The Global | |
| | | Fund | | | Fund | |
| INVESTMENT INCOME (LOSS) ALLOCATED FROM MASTER PORTFOLIOS: | | | | | | |
| Dividends† | | $ | 1,741,117 | | | $ | 98,481 | |
| Interest | | | 564 | | | | 71 | |
| Income from securities lending | | | 74,799 | | | | 23,120 | |
| Expenses allocated from Master Portfolio | | | (1,627,229 | ) | | | (99,368 | ) |
| Net investment income from Master Portfolio | | | 189,251 | | | | 22,304 | |
| EXPENSES: | | | | | | | | |
| Distribution fees – Advisor Class A | | | 2,789 | | | | 2,183 | |
| Distribution fees – Advisor Class C | | | 955 | | | | 1,533 | |
| Shareholder servicing fees – Advisor Class A | | | 2,789 | | | | 2,183 | |
| Shareholder servicing fees – Advisor Class C | | | 318 | | | | 511 | |
| Shareholder servicing fees – No Load Class | | | 294,163 | | | | 11,402 | |
| Transfer agent fees and expenses | | | 161,735 | | | | 19,510 | |
| Reports to shareholders | | | 85,070 | | | | 2,508 | |
| Administration fees | | | 51,211 | | | | 3,209 | |
| Professional fees | | | 20,300 | | | | 8,348 | |
| Directors’ and Officers’ fees and expenses | | | 11,652 | | | | 549 | |
| Registration fees | | | 40,897 | | | | 42,513 | |
| Fund accounting fees | | | 5,835 | | | | 282 | |
| Other expenses | | | 4,691 | | | | 246 | |
| Total expenses | | | 682,405 | | | | 94,977 | |
| Less, expense reimbursement | | | (59,425 | ) | | | (112,253 | ) |
| Net expenses | | | 622,980 | | | | (17,276 | ) |
| Net investment income (loss) | | | (433,729 | ) | | | 39,580 | |
| REALIZED AND UNREALIZED GAIN ON INVESTMENTS | | | | | | | | |
| ALLOCATED FROM MASTER PORTFOLIOS: | | | | | | | | |
| Net realized gain on: | | | | | | | | |
| Investments and foreign currency | | | 4,839,728 | | | | 104,946 | |
| Net change in unrealized appreciation of: | | | | | | | | |
| Investments and foreign currency | | | 19,949,877 | | | | 1,011,339 | |
| Net gain on investments | | | 24,789,605 | | | | 1,116,285 | |
| Net increase in net assets resulting from operations | | $ | 24,355,876 | | | $ | 1,155,865 | |
| † Net of foreign taxes withheld of: | | $ | 14,402 | | | $ | 6,294 | |
The accompanying notes are an integral part of these financial statements.
| KINETICS MUTUAL FUNDS, INC. — THE FEEDER FUNDS |
Statements of Operations — (Continued) |
| For the Year Ended December 31, 2012 |
| | | The Paradigm | | | The Medical | |
| | | Fund | | | Fund | |
| INVESTMENT INCOME ALLOCATED FROM MASTER PORTFOLIOS: | | | | | | |
| Dividends† | | $ | 11,550,442 | | | $ | 540,708 | |
| Interest | | | 528,834 | | | | 88 | |
| Income from securities lending | | | 3,493,243 | | | | 41,991 | |
| Expenses allocated from Master Portfolio | | | (11,346,975 | ) | | | (274,245 | ) |
| Net investment income from Master Portfolio | | | 4,225,544 | | | | 308,542 | |
| EXPENSES: | | | | | | | | |
| Distribution fees – Advisor Class A | | | 344,370 | | | | 7,667 | |
| Distribution fees – Advisor Class C | | | 788,064 | | | | 3,830 | |
| Shareholder servicing fees – Advisor Class A | | | 344,370 | | | | 7,667 | |
| Shareholder servicing fees – Advisor Class C | | | 262,688 | | | | 1,277 | |
| Shareholder servicing fees – No Load Class | | | 1,056,270 | | | | 38,797 | |
| Shareholder servicing fees – Institutional Class | | | 341,048 | | | | — | |
| Transfer agent fees and expenses | | | 415,098 | | | | 28,797 | |
| Reports to shareholders | | | 353,598 | | | | 9,193 | |
| Administration fees | | | 361,545 | | | | 8,334 | |
| Professional fees | | | 99,635 | | | | 9,912 | |
| Directors’ and Officers’ fees and expenses | | | 83,388 | | | | 1,939 | |
| Registration fees | | | 64,648 | | | | 40,689 | |
| Fund accounting fees | | | 42,026 | | | | 966 | |
| Other expenses | | | 43,219 | | | | 1,184 | |
| Total expenses | | | 4,599,967 | | | | 160,252 | |
| Less, expense waiver for Institutional Class shareholder | | | | | | | | |
| servicing fees | | | (255,786 | ) | | | — | |
| Less, expense reimbursement | | | (1,191,745 | ) | | | (157,559 | ) |
| Net expenses | | | 3,152,436 | | | | 2,693 | |
| Net investment income | | | 1,073,108 | | | | 305,849 | |
| REALIZED AND UNREALIZED GAIN ON INVESTMENTS ALLOCATED | | | | | | | | |
| FROM MASTER PORTFOLIOS: | | | | | | | | |
| Net realized gain on: | | | | | | | | |
| Investments and foreign currency | | | 36,593,980 | | | | 522,636 | |
| Realized gain distributions received from other investment companies | | | 690,182 | | | | — | |
| Net change in unrealized appreciation of: | | | | | | | | |
| Investments and foreign currency | | | 127,689,744 | | | | 852,539 | |
| Net gain on investments | | | 164,973,906 | | | | 1,375,175 | |
| Net increase in net assets resulting from operations | | $ | 166,047,014 | | | $ | 1,681,024 | |
| † Net of foreign taxes withheld of: | | $ | 322,029 | | | $ | 21,354 | |
The accompanying notes are an integral part of these financial statements.
| KINETICS MUTUAL FUNDS, INC. — THE FEEDER FUNDS |
Statements of Operations — (Continued) |
| For the Year Ended December 31, 2012 |
| | | The Small Cap | | | The Market | |
| | | Opportunities | | | Opportunities | |
| | | Fund | | | Fund | |
| INVESTMENT INCOME ALLOCATED FROM MASTER PORTFOLIOS: | | | | | | |
| Dividends† | | $ | 1,352,631 | | | $ | 772,612 | |
| Interest | | | 115 | | | | 558 | |
| Income from securities lending | | | 73,536 | | | | 54,569 | |
| Expenses allocated from Master Portfolio | | | (1,201,322 | ) | | | (631,718 | ) |
| Net investment income from Master Portfolio | | | 224,960 | | | | 196,021 | |
| EXPENSES: | | | | | | | | |
| Distribution fees — Advisor Class A | | | 18,637 | | | | 18,743 | |
| Distribution fees — Advisor Class C | | | 18,397 | | | | 30,983 | |
| Shareholder servicing fees — Advisor Class A | | | 18,637 | | | | 18,743 | |
| Shareholder servicing fees — Advisor Class C | | | 6,133 | | | | 10,328 | |
| Shareholder servicing fees — No Load Class | | | 167,819 | | | | 80,975 | |
| Shareholder servicing fees — Institutional Class | | | 13,227 | | | | 466 | |
| Transfer agent fees and expenses | | | 57,626 | | | | 29,279 | |
| Reports to shareholders | | | 48,402 | | | | 8,670 | |
| Administration fees | | | 36,214 | | | | 19,833 | |
| Professional fees | | | 16,986 | | | | 12,736 | |
| Directors’ and Officers’ fees and expenses | | | 8,301 | | | | 4,550 | |
| Registration fees | | | 52,289 | | | | 49,142 | |
| Fund accounting fees | | | 4,219 | | | | 2,229 | |
| Other expenses | | | 4,294 | | | | 1,956 | |
| Total expenses | | | 471,181 | | | | 288,633 | |
| Less, expense waiver for Institutional Class shareholder | | | | | | | | |
| servicing fees | | | (9,920 | ) | | | (350 | ) |
| Less, expense reimbursement | | | (266,933 | ) | | | (145,018 | ) |
| Net expenses | | | 194,328 | | | | 143,265 | |
| Net investment income | | | 30,632 | | | | 52,756 | |
| REALIZED AND UNREALIZED GAIN ON INVESTMENTS ALLOCATED | | | | | | | | |
| FROM MASTER PORTFOLIOS: | | | | | | | | |
| Net realized gain on: | | | | | | | | |
| Investments and foreign currency | | | 7,737,037 | | | | 4,862,677 | |
| Realized gain distributions received from other | | | | | | | | |
| investment companies | | | 97,569 | | | | — | |
| Net change in unrealized appreciation of: | | | | | | | | |
| Investments and foreign currency | | | 12,106,767 | | | | 2,198,282 | |
| Net gain on investments | | | 19,941,373 | | | | 7,060,959 | |
| Net increase in net assets resulting from operations | | $ | 19,972,005 | | | $ | 7,113,715 | |
| † Net of foreign taxes withheld of: | | $ | 15,388 | | | $ | 33,073 | |
The accompanying notes are an integral part of these financial statements.
| KINETICS MUTUAL FUNDS, INC. — THE FEEDER FUNDS |
Statements of Operations — (Continued) |
| For the Year Ended December 31, 2012 |
| | | The Water | | | The Multi- | |
| | | Infrastructure | | | Disciplinary | |
| | | Fund | | | Fund | |
| INVESTMENT INCOME ALLOCATED FROM MASTER PORTFOLIOS: | | | | | | |
| Dividends† | | $ | 5,389 | | | $ | 62,720 | |
| Interest | | | 391,545 | | | | 1,906,264 | |
| Income from securities lending | | | 1,519 | | | | 5,235 | |
| Expenses allocated from Master Portfolio | | | (170,594 | ) | | | (610,628 | ) |
| Net investment income from Master Portfolio | | | 227,859 | | | | 1,363,591 | |
| EXPENSES: | | | | | | | | |
| Distribution fees — Advisor Class A | | | 9,623 | | | | 39,429 | |
| Distribution fees — Advisor Class C | | | 16,457 | | | | 36,636 | |
| Shareholder servicing fees — Advisor Class A | | | 9,623 | | | | 39,429 | |
| Shareholder servicing fees — Advisor Class C | | | 5,486 | | | | 12,212 | |
| Shareholder servicing fees — No Load Class | | | 10,965 | | | | 41,323 | |
| Shareholder servicing fees — Institutional Class | | | 2,078 | | | | 10,582 | |
| Transfer agent fees and expenses | | | 22,392 | | | | 30,215 | |
| Reports to shareholders | | | 4,820 | | | | 4,996 | |
| Administration fees | | | 4,989 | | | | 19,557 | |
| Professional fees | | | 9,943 | | | | 13,042 | |
| Directors’ and Officers’ fees and expenses | | | 1,140 | | | | 4,263 | |
| Registration fees | | | 48,404 | | | | 55,779 | |
| Fund accounting fees | | | 574 | | | | 2,155 | |
| Other expenses | | | 662 | | | | 673 | |
| Total expenses | | | 147,156 | | | | 310,291 | |
| Less, expense waiver for Institutional Class shareholder | | | | | | | | |
| servicing fees | | | (1,558 | ) | | | (7,936 | ) |
| Less, expense reimbursement | | | (104,109 | ) | | | (214,592 | ) |
| Net expenses | | | 41,489 | | | | 87,763 | |
| Net investment income | | | 186,370 | | | | 1,275,828 | |
| REALIZED AND UNREALIZED GAIN (LOSS) ON INVESTMENTS ALLOCATED | | | | | | | | |
| FROM MASTER PORTFOLIOS: | | | | | | | | |
| Net realized gain (loss) on: | | | | | | | | |
| Investments and foreign currency | | | (584,280 | ) | | | (544,721 | ) |
| Written option contracts expired or closed | | | 893,762 | | | | 1,721,731 | |
| Realized gain distributions received from other | | | | | | | | |
| investment companies | | | 35 | | | | — | |
| Net change in unrealized appreciation (depreciation) of: | | | | | | | | |
| Investments and foreign currency | | | 675,730 | | | | 218,823 | |
| Written option contracts | | | (70,908 | ) | | | 2,515,131 | |
| Securities sold short | | | — | | | | 10,192 | |
| Net gain on investments | | | 914,339 | | | | 3,921,156 | |
| Net increase in net assets resulting from operations | | $ | 1,100,709 | | | $ | 5,196,984 | |
| † Net of foreign taxes withheld of: | | $ | 328 | | | $ | — | |
The accompanying notes are an integral part of these financial statements.
| KINETICS MUTUAL FUNDS, INC. — THE FEEDER FUNDS |
| Statements of Changes in Net Assets |
| | | The Internet Fund | | | The Global Fund | |
| | | For the | | | For the | | | For the | | | For the | |
| | | Year Ended | | | Year Ended | | | Year Ended | | | Year Ended | |
| | | December 31, | | | December 31, | | | December 31, | | | December 31, | |
| | | 2012 | | | 2011 | | | 2012 | | | 2011 | |
| OPERATIONS: | | | | | | | | | | | | |
| Net investment Income (loss) | | $ | (433,729 | ) | | $ | (1,096,299 | ) | | $ | 39,580 | | | $ | 71,310 | |
| Net realized gain (loss) on sale of | | | | | | | | | | | | | | | | |
| investments and foreign currency | | | 4,839,728 | | | | 27,593,691 | | | | 104,946 | | | | (78,534 | ) |
| Net change in unrealized appreciation | | | | | | | | | | | | | | | | |
| (depreciation) of investments and | | | | | | | | | | | | | | | | |
| foreign currency | | | 19,949,877 | | | | (28,535,697 | ) | | | 1,011,339 | | | | (940,717 | ) |
| Net increase (decrease) in net assets | | | | | | | | | | | | | | | | |
| resulting from operations | | | 24,355,876 | | | | (2,038,305 | ) | | | 1,155,865 | | | | (947,941 | ) |
| DISTRIBUTIONS TO SHAREHOLDERS — | | | | | | | | | | | | | | | | |
| NO LOAD CLASS: | | | | | | | | | | | | | | | | |
| Net investment income | | | — | | | | — | | | | (123,429 | ) | | | (27,956 | ) |
| Net realized gains | | | (5,207,093 | ) | | | (726,004 | ) | | | — | | | | — | |
| Total distributions | | | (5,207,093 | ) | | | (726,004 | ) | | | (123,429 | ) | | | (27,956 | ) |
| DISTRIBUTIONS TO SHAREHOLDERS — | | | | | | | | | | | | | | | | |
| ADVISOR CLASS A: | | | | | | | | | | | | | | | | |
| Net investment income | | | — | | | | — | | | | (24,753 | ) | | | (3,015 | ) |
| Net realized gains | | | (46,661 | ) | | | (7,458 | ) | | | — | | | | — | |
| Total distributions | | | (46,661 | ) | | | (7,458 | ) | | | (24,753 | ) | | | (3,015 | ) |
| DISTRIBUTIONS TO SHAREHOLDERS — | | | | | | | | | | | | | | | | |
| ADVISOR CLASS C: | | | | | | | | | | | | | | | | |
| Net investment income | | | — | | | | — | | | | (8,334 | ) | | | (862 | ) |
| Net realized gains | | | (6,516 | ) | | | (750 | ) | | | — | | | | — | |
| Total distributions | | | (6,516 | ) | | | (750 | ) | | | (8,334 | ) | | | (862 | ) |
| CAPITAL SHARE TRANSACTIONS — | | | | | | | | | | | | | | | | |
| NO LOAD CLASS: | | | | | | | | | | | | | | | | |
| Proceeds from shares sold | | | 46,371,634 | | | | 9,007,831 | | | | 1,878,282 | | | | 854,112 | |
| Redemption fees | | | 4,548 | | | | 1,415 | | | | 6 | | | | 67 | |
| Proceeds from shares issued to holders | | | | | | | | | | | | | | | | |
| in reinvestment of dividends | | | 5,050,816 | | | | 700,007 | | | | 115,580 | | | | 26,809 | |
| Cost of shares redeemed | | | (19,118,564 | ) | | | (16,207,678 | ) | | | (1,366,910 | ) | | | (1,074,958 | ) |
| Net increase (decrease) in net assets | | | | | | | | | | | | | | | | |
| resulting from capital share | | | | | | | | | | | | | | | | |
| transactions | | | 32,308,434 | | | | (6,498,425 | ) | | | 626,958 | | | | (193,970 | ) |
| CAPITAL SHARE TRANSACTIONS — | | | | | | | | | | | | | | | | |
| ADVISOR CLASS A: | | | | | | | | | | | | | | | | |
| Proceeds from shares sold | | | 509,770 | | | | 456,786 | | | | 1,116,949 | | | | 1,393,642 | |
| Redemption fees | | | — | | | | 472 | | | | 385 | | | | 24 | |
| Proceeds from shares issued to holders | | | | | | | | | | | | | | | | |
| in reinvestment of dividends | | | 38,332 | | | | 6,259 | | | | 22,174 | | | | 2,535 | |
| Cost of shares redeemed | | | (394,222 | ) | | | (1,285,526 | ) | | | (591,598 | ) | | | (1,465,527 | ) |
| Net increase (decrease) in net assets | | | | | | | | | | | | | | | | |
| resulting from capital share | | | | | | | | | | | | | | | | |
| transactions | | | 153,880 | | | | (822,009 | ) | | | 547,910 | | | | (69,326 | ) |
The accompanying notes are an integral part of these financial statements.
| KINETICS MUTUAL FUNDS, INC. — THE FEEDER FUNDS |
Statements of Changes in Net Assets — (Continued) |
| | | The Internet Fund | | | The Global Fund | |
| | | For the | | | For the | | | For the | | | For the | |
| | | Year Ended | | | Year Ended | | | Year Ended | | | Year Ended | |
| | | December 31, | | | December 31, | | | December 31, | | | December 31, | |
| | | 2012 | | | 2011 | | | 2012 | | | 2011 | |
| CAPITAL SHARE TRANSACTIONS — | | | | | | | | | | | | |
| ADVISOR CLASS C: | | | | | | | | | | | | | | | | |
| Proceeds from shares sold | | $ | 82,925 | | | $ | 72,209 | | | $ | 238,490 | | | $ | 81,516 | |
| Redemption fees | | | — | | | | 48 | | | | — | | | | — | |
| Proceeds from shares issued to holders | | | | | | | | | | | | | | | | |
| in reinvestment of dividends | | | 4,595 | | | | 587 | | | | 7,789 | | | | 690 | |
| Cost of shares redeemed | | | (25,134 | ) | | | (173,561 | ) | | | (8,967 | ) | | | (17,713 | ) |
| Net increase (decrease) in net assets | | | | | | | | | | | | | | | | |
| resulting from capital share | | | | | | | | | | | | | | | | |
| transactions | | | 62,386 | | | | (100,717 | ) | | | 237,312 | | | | 64,493 | |
| TOTAL INCREASE (DECREASE) | | | | | | | | | | | | | | | | |
| IN NET ASSETS: | | | 51,620,306 | | | | (10,193,668 | ) | | | 2,411,529 | | | | (1,178,577 | ) |
| NET ASSETS: | | | | | | | | | | | | | | | | |
| Beginning of year | | | 104,980,122 | | | | 115,173,790 | | | | 4,133,933 | | | | 5,312,510 | |
| End of year* | | $ | 156,600,428 | | | $ | 104,980,122 | | | $ | 6,545,462 | | | $ | 4,133,933 | |
| * Including undistributed net investment | | | | | | | | | | | | | | | | |
| income (loss) of: | | $ | 43,841 | | | $ | (76,659 | ) | | $ | (78,186 | ) | | $ | (14,339 | ) |
| CHANGES IN SHARES OUTSTANDING — | | | | | | | | | | | | | | | | |
| NO LOAD CLASS: | | | | | | | | | | | | | | | | |
| Shares sold | | | 1,069,839 | | | | 230,227 | | | | 427,158 | | | | 187,091 | |
| Shares issued in reinvestments of | | | | | | | | | | | | | | | | |
| dividends and distributions | | | 118,341 | | | | 19,268 | | | | 24,697 | | | | 6,839 | |
| Shares redeemed | | | (461,243 | ) | | | (421,841 | ) | | | (301,524 | ) | | | (239,805 | ) |
| Net increase (decrease) in | | | | | | | | | | | | | | | | |
| shares outstanding | | | 726,937 | | | | (172,346 | ) | | | 150,331 | | | | (45,875 | ) |
| CHANGES IN SHARES OUTSTANDING — | | | | | | | | | | | | | | | | |
| ADVISOR CLASS A: | | | | | | | | | | | | | | | | |
| Shares sold | | | 12,322 | | | | 11,867 | | | | 258,844 | | | | 327,883 | |
| Shares issued in reinvestments of | | | | | | | | | | | | | | | | |
| dividends and distributions | | | 917 | | | | 175 | | | | 4,738 | | | | 647 | |
| Shares redeemed | | | (10,094 | ) | | | (34,153 | ) | | | (131,342 | ) | | | (379,627 | ) |
| Net increase (decrease) in | | | | | | | | | | | | | | | | |
| shares outstanding | | | 3,145 | | | | (22,111 | ) | | | 132,240 | | | | (51,097 | ) |
| CHANGES IN SHARES OUTSTANDING — | | | | | | | | | | | | | | | | |
| ADVISOR CLASS C: | | | | | | | | | | | | | | | | |
| Shares sold | | | 2,130 | | | | 1,950 | | | | 54,697 | | | | 18,569 | |
| Shares issued in reinvestments of | | | | | | | | | | | | | | | | |
| dividends and distributions | | | 114 | | | | 17 | | | | 1,693 | | | | 178 | |
| Shares redeemed | | | (674 | ) | | | (4,487 | ) | | | (2,056 | ) | | | (3,952 | ) |
| Net increase (decrease) in | | | | | | | | | | | | | | | | |
| shares outstanding | | | 1,570 | | | | (2,520 | ) | | | 54,334 | | | | 14,795 | |
The accompanying notes are an integral part of these financial statements.
| KINETICS MUTUAL FUNDS, INC. — THE FEEDER FUNDS |
Statements of Changes in Net Assets — (Continued) |
| | | The Paradigm Fund | | | The Medical Fund | |
| | | For the | | | For the | | | For the | | | For the | |
| | | Year Ended | | | Year Ended | | | Year Ended | | | Year Ended | |
| | | December 31, | | | December 31, | | | December 31, | | | December 31, | |
| | | 2012 | | | 2011 | | | 2012 | | | 2011 | |
| OPERATIONS: | | | | | | | | | | | | |
| Net investment income (loss) | | $ | 1,073,108 | | | $ | (46,910 | ) | | $ | 305,849 | | | $ | 239,555 | |
| Net realized gain on sale of investments, | | | | | | | | | | | | | | | | |
| foreign currency and distributions | | | | | | | | | | | | | | | | |
| received from other investment | | | | | | | | | | | | | | | | |
| companies | | | 37,284,162 | | | | 212,406,328 | | | | 522,636 | | | | 3,617,656 | |
| Net change in unrealized appreciation | | | | | | | | | | | | | | | | |
| (depreciation) of investments and | | | | | | | | | | | | | | | | |
| foreign currency | | | 127,689,744 | | | | (365,310,403 | ) | | | 852,539 | | | | (2,711,129 | ) |
| Net increase (decrease) in net assets | | | | | | | | | | | | | | | | |
| resulting from operations | | | 166,047,014 | | | | (152,950,985 | ) | | | 1,681,024 | | | | 1,146,082 | |
| DISTRIBUTIONS TO SHAREHOLDERS — | | | | | | | | | | | | | | | | |
| NO LOAD CLASS: | | | | | | | | | | | | | | | | |
| Net investment income | | | (2,091,661 | ) | | | (4,007,796 | ) | | | (256,326 | ) | | | (200,893 | ) |
| Net realized gains | | | — | | | | — | | | | (1,561,461 | ) | | | (1,192,805 | ) |
| Total distributions | | | (2,091,661 | ) | | | (4,007,796 | ) | | | (1,817,787 | ) | | | (1,393,698 | ) |
| DISTRIBUTIONS TO SHAREHOLDERS — | | | | | | | | | | | | | | | | |
| ADVISOR CLASS A: | | | | | | | | | | | | | | | | |
| Net investment income | | | (146,854 | ) | | | (1,391,271 | ) | | | (40,937 | ) | | | (34,435 | ) |
| Net realized gains | | | — | | | | — | | | | (297,758 | ) | | | (246,769 | ) |
| Total distributions | | | (146,854 | ) | | | (1,391,271 | ) | | | (338,695 | ) | | | (281,204 | ) |
| DISTRIBUTIONS TO SHAREHOLDERS — | | | | | | | | | | | | | | | | |
| ADVISOR CLASS C: | | | | | | | | | | | | | | | | |
| Net investment income | | | — | | | | (1,004,773 | ) | | | (4,623 | ) | | | (2,620 | ) |
| Net realized gains | | | — | | | | — | | | | (51,491 | ) | | | (43,898 | ) |
| Total distributions | | | — | | | | (1,004,773 | ) | | | (56,114 | ) | | | (46,518 | ) |
| DISTRIBUTIONS TO SHAREHOLDERS — | | | | | | | | | | | | | | | | |
| INSTITUTIONAL CLASS: | | | | | | | | | | | | | | | | |
| Net investment income | | | (1,577,657 | ) | | | (1,249,019 | ) | | | N/A | | | | N/A | |
| Total distributions | | | (1,577,657 | ) | | | (1,249,019 | ) | | | N/A | | | | N/A | |
| CAPITAL SHARE TRANSACTIONS — | | | | | | | | | | | | | | | | |
| NO LOAD CLASS: | | | | | | | | | | | | | | | | |
| Proceeds from shares sold | | | 64,026,639 | | | | 81,461,468 | | | | 726,629 | | | | 5,372,018 | |
| Redemption fees | | | 3,832 | | | | 14,659 | | | | 179 | | | | 1,103 | |
| Proceeds from shares issued to holders | | | | | | | | | | | | | | | | |
| in reinvestment of dividends | | | 1,971,657 | | | | 3,758,915 | | | | 1,796,827 | | | | 1,372,906 | |
| Cost of shares redeemed | | | (161,429,928 | ) | | | (255,358,638 | ) | | | (4,192,023 | ) | | | (15,711,342 | ) |
| Net decrease in net assets resulting | | | | | | | | | | | | | | | | |
| from capital share transactions | | | (95,427,800 | ) | | | (170,123,596 | ) | | | (1,668,388 | ) | | | (8,965,315 | ) |
| CAPITAL SHARE TRANSACTIONS — | | | | | | | | | | | | | | | | |
| ADVISOR CLASS A: | | | | | | | | | | | | | | | | |
| Proceeds from shares sold | | | 18,086,486 | | | | 19,748,265 | | | | 313,634 | | | | 556,628 | |
| Redemption fees | | | 796 | | | | 4,492 | | | | 2 | | | | 2 | |
| Proceeds from shares issued to holders | | | | | | | | | | | | | | | | |
| in reinvestment of dividends | | | 132,398 | | | | 1,191,438 | | | | 201,396 | | | | 154,881 | |
| Cost of shares redeemed | | | (57,418,386 | ) | | | (71,780,253 | ) | | | (1,109,278 | ) | | | (1,561,750 | ) |
| Net decrease in net assets resulting | | | | | | | | | | | | | | | | |
| from capital share transactions | | | (39,198,706 | ) | | | (50,836,058 | ) | | | (594,246 | ) | | | (850,239 | ) |
The accompanying notes are an integral part of these financial statements.
| KINETICS MUTUAL FUNDS, INC. — THE FEEDER FUNDS |
Statements of Changes in Net Assets — (Continued) |
| | | The Paradigm Fund | | | The Medical Fund | |
| | | For the | | | For the | | | For the | | | For the | |
| | | Year Ended | | | Year Ended | | | Year Ended | | | Year Ended | |
| | | December 31, | | | December 31, | | | December 31, | | | December 31, | |
| | | 2012 | | | 2011 | | | 2012 | | | 2011 | |
| CAPITAL SHARE TRANSACTIONS — | | | | | | | | | | | | |
| ADVISOR CLASS C: | | | | | | | | | | | | |
| Proceeds from shares sold | | $ | 3,849,753 | | | $ | 6,896,487 | | | $ | 36,059 | | | $ | 69,329 | |
| Redemption fees | | | 52 | | | | 700 | | | | — | | | | 4 | |
| Proceeds from shares issued to holders in | | | | | | | | | | | | | | | | |
| reinvestment of dividends | | | — | | | | 888,903 | | | | 29,798 | | | | 27,593 | |
| Cost of shares redeemed | | | (25,024,304 | ) | | | (37,182,568 | ) | | | (181,789 | ) | | | (185,030 | ) |
| Net decrease in net assets resulting | | | | | | | | | | | | | | | | |
| from capital share | | | | | | | | | | | | | | | | |
| transactions | | | (21,174,499 | ) | | | (29,396,478 | ) | | | (115,932 | ) | | | (88,104 | ) |
| CAPITAL SHARE TRANSACTIONS — | | | | | | | | | | | | | | | | |
| INSTITUTIONAL CLASS: | | | | | | | | | | | | | | | | |
| Proceeds from shares sold | | | 81,609,346 | | | | 56,872,249 | | | | N/A | | | | N/A | |
| Redemption fees | | | 6,189 | | | | 1,164 | | | | N/A | | | | N/A | |
| Proceeds from shares issued to holders in | | | | | | | | | | | | | | | | |
| reinvestment of dividends | | | 1,311,574 | | | | 1,124,859 | | | | N/A | | | | N/A | |
| Cost of shares redeemed | | | (57,342,208 | ) | | | (40,879,049 | ) | | | N/A | | | | N/A | |
| Net increase in net assets resulting | | | | | | | | | | | | | | | | |
| from capital share | | | | | | | | | | | | | | | | |
| transactions | | | 25,584,901 | | | | 17,119,223 | | | | N/A | | | | N/A | |
| TOTAL INCREASE (DECREASE) | | | | | | | | | | | | | | | | |
| IN NET ASSETS: | | | 32,014,738 | | | | (393,840,753 | ) | | | (2,910,138 | ) | | | (10,478,996 | ) |
| NET ASSETS: | | | | | | | | | | | | | | | | |
| Beginning of year | | | 814,310,902 | | | | 1,208,151,655 | | | | 20,196,982 | | | | 30,675,978 | |
| End of year* | | $ | 846,325,640 | | | $ | 814,310,902 | | | $ | 17,286,844 | | | $ | 20,196,982 | |
| * Including undistributed net investment | | | | | | | | | | | | | | | | |
| income (loss) of: | | $ | (9,449,805 | ) | | $ | (13,044,636 | ) | | $ | 28,372 | | | $ | 27,668 | |
| CHANGES IN SHARES OUTSTANDING — | | | | | | | | | | | | | | | | |
| NO LOAD CLASS: | | | | | | | | | | | | | | | | |
| Shares sold | | | 2,761,190 | | | | 3,493,271 | | | | 36,993 | | | | 261,332 | |
| Shares issued in reinvestments of dividends | | | | | | | | | | | | | | | | |
| and distributions | | | 83,157 | | | | 189,470 | | | | 101,230 | | | | 73,183 | |
| Shares redeemed | | | (7,210,869 | ) | | | (11,423,061 | ) | | | (211,946 | ) | | | (784,017 | ) |
| Net decrease in shares | | | | | | | | | | | | | | | | |
| outstanding | | | (4,366,522 | ) | | | (7,740,320 | ) | | | (73,723 | ) | | | (449,502 | ) |
| CHANGES IN SHARES OUTSTANDING — | | | | | | | | | | | | | | | | |
| ADVISOR CLASS A: | | | | | | | | | | | | | | | | |
| Shares sold | | | 793,709 | | | | 878,122 | | | | 16,529 | | | | 27,758 | |
| Shares issued in reinvestments of dividends | | | | | | | | | | | | | | | | |
| and distributions | | | 5,675 | | | | 61,179 | | | | 11,668 | | | | 8,463 | |
| Shares redeemed | | | (2,600,387 | ) | | | (3,243,049 | ) | | | (56,326 | ) | | | (79,836 | ) |
| Net decrease in shares | | | | | | | | | | | | | | | | |
| outstanding | | | (1,801,003 | ) | | | (2,303,748 | ) | | | (28,129 | ) | | | (43,615 | ) |
The accompanying notes are an integral part of these financial statements.
| ]KINETICS MUTUAL FUNDS, INC. — THE FEEDER FUNDS |
Statements of Changes in Net Assets — (Continued) |
| | | The Paradigm Fund | | | The Medical Fund | |
| | | For the | | | For the | | | For the | | | For the | |
| | | Year Ended | | | Year Ended | | | Year Ended | | | Year Ended | |
| | | December 31, | | | December 31, | | | December 31, | | | December 31, | |
| | | 2012 | | | 2011 | | | 2012 | | | 2011 | |
| CHANGES IN SHARES OUTSTANDING — | | | | | | | | | | | | |
| ADVISOR CLASS C: | | | | | | | | | | | | |
| Shares sold | | | 180,440 | | | | 309,869 | | | | 1,995 | | | | 3,452 | |
| Shares issued in reinvestments of dividends | | | | | | | | | | | | | | | | |
| and distributions | | | — | | | | 47,307 | | | | 1,741 | | | | 1,519 | |
| Shares redeemed | | | (1,172,251 | ) | | | (1,746,653 | ) | | | (9,532 | ) | | | (9,606 | ) |
| Net decrease in shares | | | | | | | | | | | | | | | | |
| outstanding | | | (991,811 | ) | | | (1,389,477 | ) | | | (5,796 | ) | | | (4,635 | ) |
| CHANGES IN SHARES OUTSTANDING — | | | | | | | | | | | | | | | | |
| INSTITUTIONAL CLASS: | | | | | | | | | | | | | | | | |
| Shares sold | | | 3,733,029 | | | | 2,493,278 | | | | N/A | | | | N/A | |
| Shares issued in reinvestments of | | | | | | | | | | | | | | | | |
| dividends and distributions | | | 55,434 | | | | 56,754 | | | | N/A | | | | N/A | |
| Shares redeemed | | | (2,534,864 | ) | | | (1,881,051 | ) | | | N/A | | | | N/A | |
| Net increase in shares | | | | | | | | | | | | | | | | |
| outstanding | | | 1,253,599 | | | | 668,981 | | | | N/A | | | | N/A | |
The accompanying notes are an integral part of these financial statements.
| KINETICS MUTUAL FUNDS, INC. — THE FEEDER FUNDS |
Statements of Changes in Net Assets — (Continued) |
| | | The Small Cap Opportunities Fund | | | The Market Opportunities Fund | |
| | | For the | | | For the | | | For the | | | For the | |
| | | Year Ended | | | Year Ended | | | Year Ended | | | Year Ended | |
| | | December 31, 2012 | | | December 31, 2011 | | | December 31, 2012 | | | December 31, 2011 | |
| OPERATIONS: | | | | | | | | | | | | |
| Net investment income (loss) | | $ | 30,632 | | | $ | (236,372 | ) | | $ | 52,756 | | | $ | (20,909 | ) |
| Net realized gain on sale of investments, | | | | | | | | | | | | | | | | |
| foreign currency and distributions | | | | | | | | | | | | | | | | |
| received from other investment | | | | | | | | | | | | | | | | |
| companies | | | 7,834,606 | | | | 18,650,142 | | | | 4,862,677 | | | | 2,024,529 | |
| Net change in unrealized appreciation | | | | | | | | | | | | | | | | |
| (depreciation) of investments and | | | | | | | | | | | | | | | | |
| foreign currency | | | 12,106,767 | | | | (32,960,313 | ) | | | 2,198,282 | | | | (5,576,160 | ) |
| Net increase (decrease) in net assets | | | | | | | | | | | | | | | | |
| resulting from operations | | | 19,972,005 | | | | (14,546,543 | ) | | | 7,113,715 | | | | (3,572,540 | ) |
| DISTRIBUTIONS TO SHAREHOLDERS — | | | | | | | | | | | | | | | | |
| NO LOAD CLASS: | | | | | | | | | | | | | | | | |
| Net investment income | | | — | | | | (952,070 | ) | | | (532,781 | ) | | | (315,801 | ) |
| Total distributions | | | — | | | | (952,070 | ) | | | (532,781 | ) | | | (315,801 | ) |
| DISTRIBUTIONS TO SHAREHOLDERS — | | | | | | | | | | | | | | | | |
| ADVISOR CLASS A: | | | | | | | | | | | | | | | | |
| Net investment income | | | — | | | | (75,653 | ) | | | (84,630 | ) | | | (62,348 | ) |
| Total distributions | | | — | | | | (75,653 | ) | | | (84,630 | ) | | | (62,348 | ) |
| DISTRIBUTIONS TO SHAREHOLDERS — | | | | | | | | | | | | | | | | |
| ADVISOR CLASS C: | | | | | | | | | | | | | | | | |
| Net investment income | | | — | | | | (9,932 | ) | | | (33,350 | ) | | | (7,494 | ) |
| Total distributions | | | — | | | | (9,932 | ) | | | (33,350 | ) | | | (7,494 | ) |
| DISTRIBUTIONS TO SHAREHOLDERS — | | | | | | | | | | | | | | | | |
| INSTITUTIONAL CLASS: | | | | | | | | | | | | | | | | |
| Net investment income | | | — | | | | (95,993 | ) | | | (4,195 | ) | | | (2,363 | ) |
| Total distributions | | | — | | | | (95,993 | ) | | | (4,195 | ) | | | (2,363 | ) |
| CAPITAL SHARE TRANSACTIONS — | | | | | | | | | | | | | | | | |
| NO LOAD CLASS: | | | | | | | | | | | | | | | | |
| Proceeds from shares sold | | | 1,841,937 | | | | 2,296,721 | | | | 630,318 | | | | 1,692,138 | |
| Redemption fees | | | 434 | | | | 362 | | | | 455 | | | | 562 | |
| Proceeds from shares issued to holders | | | | | | | | | | | | | | | | |
| in reinvestment of dividends | | | — | | | | 911,472 | | | | 531,266 | | | | 314,608 | |
| Cost of shares redeemed | | | (21,727,814 | ) | | | (52,799,981 | ) | | | (3,055,029 | ) | | | (7,504,122 | ) |
| Net decrease in net assets resulting | | | | | | | | | | | | | | | | |
| from capital share transactions | | | (19,885,443 | ) | | | (49,591,426 | ) | | | (1,892,990 | ) | | | (5,496,814 | ) |
| CAPITAL SHARE TRANSACTIONS — | | | | | | | | | | | | | | | | |
| ADVISOR CLASS A: | | | | | | | | | | | | | | | | |
| Proceeds from shares sold | | | 712,257 | | | | 754,533 | | | | 400,180 | | | | 1,610,815 | |
| Redemption fees | | | 23 | | | | 203 | | | | 280 | | | | 30 | |
| Proceeds from shares issued to holders | | | | | | | | | | | | | | | | |
| in reinvestment of dividends | | | — | | | | 67,489 | | | | 69,282 | | | | 50,424 | |
| Cost of shares redeemed | | | (2,129,011 | ) | | | (3,763,794 | ) | | | (3,721,538 | ) | | | (6,562,768 | ) |
| Net decrease in net assets resulting | | | | | | | | | | | | | | | | |
| from capital share transactions | | | (1,416,731 | ) | | | (2,941,569 | ) | | | (3,251,796 | ) | | | (4,901,499 | ) |
The accompanying notes are an integral part of these financial statements.
| KINETICS MUTUAL FUNDS, INC. — THE FEEDER FUNDS |
Statements of Changes in Net Assets — (Continued) |
| | | The Small Cap Opportunities Fund | | | The Market Opportunities Fund | |
| | | For the | | | For the | | | For the | | | For the | |
| | | Year Ended | | | Year Ended | | | Year Ended | | | Year Ended | |
| | | December 31, | | | December 31, | | | December 31, | | | December 31, | |
| | | 2012 | | | 2011 | | | 2012 | | | 2011 | |
| CAPITAL SHARE TRANSACTIONS — | | | | | | | | | | | | |
| ADVISOR CLASS C: | | | | | | | | | | | | |
| Proceeds from shares sold | | $ | 162,437 | | | $ | 158,678 | | | $ | 162,143 | | | $ | 279,004 | |
| Redemption fees | | | — | | | | — | | | | 101 | | | | — | |
| Proceeds from shares issued to holders | | | | | | | | | | | | | | | | |
| in reinvestment of dividends | | | — | | | | 6,701 | | | | 29,824 | | | | 6,429 | |
| Cost of shares redeemed | | | (634,738 | ) | | | (741,964 | ) | | | (1,117,534 | ) | | | (1,222,668 | ) |
| Net decrease in net assets resulting | | | | | | | | | | | | | | | | |
| from capital share transactions | | | (472,301 | ) | | | (576,585 | ) | | | (925,466 | ) | | | (937,235 | ) |
| CAPITAL SHARE TRANSACTIONS — | | | | | | | | | | | | | | | | |
| INSTITUTIONAL CLASS: | | | | | | | | | | | | | | | | |
| Proceeds from shares sold | | | 2,959,815 | | | | 1,004,159 | | | | 57,706 | | | | 46,133 | |
| Redemption fees | | | 532 | | | | 17 | | | | — | | | | — | |
| Proceeds from shares issued to holders | | | | | | | | | | | | | | | | |
| in reinvestment of dividends | | | — | | | | 66,389 | | | | 1,417 | | | | 623 | |
| Cost of shares redeemed | | | (2,620,000 | ) | | | (4,341,338 | ) | | | (48,403 | ) | | | (52,364 | ) |
| Net increase (decrease) in net assets | | | | | | | | | | | | | | | | |
| resulting from capital share | | | | | | | | | | | | | | | | |
| transactions | | | 340,347 | | | | (3,270,773 | ) | | | 10,720 | | | | (5,608 | ) |
| TOTAL INCREASE (DECREASE) | | | | | | | | | | | | | | | | |
| IN NET ASSETS: | | | (1,462,123 | ) | | | (72,060,544 | ) | | | 399,227 | | | | (15,301,702 | ) |
| NET ASSETS: | | | | | | | | | | | | | | | | |
| Beginning of year | | | 82,985,518 | | | | 155,046,062 | | | | 43,209,028 | | | | 58,510,730 | |
| End of year* | | $ | 81,523,395 | | | $ | 82,985,518 | | | $ | 43,608,255 | | | $ | 43,209,028 | |
| * Including undistributed net investment | | | | | | | | | | | | | | | | |
| loss of: | | $ | (747,038 | ) | | $ | (810,693 | ) | | $ | (1,156,606 | ) | | $ | (2,147,929 | ) |
| CHANGES IN SHARES OUTSTANDING — | | | | | | | | | | | | | | | | |
| NO LOAD CLASS: | | | | | | | | | | | | | | | | |
| Shares sold | | | 80,246 | | | | 102,256 | | | | 54,575 | | | | 152,217 | |
| Shares issued in reinvestments of | | | | | | | | | | | | | | | | |
| dividends and distributions | | | — | | | | 45,964 | | | | 44,495 | | | | 30,106 | |
| Shares redeemed | | | (953,945 | ) | | | (2,320,613 | ) | | | (263,041 | ) | | | (658,545 | ) |
| Net decrease in shares | | | | | | | | | | | | | | | | |
| outstanding | | | (873,699 | ) | | | (2,172,393 | ) | | | (163,971 | ) | | | (476,222 | ) |
| CHANGES IN SHARES OUTSTANDING — | | | | | | | | | | | | | | | | |
| ADVISOR CLASS A: | | | | | | | | | | | | | | | | |
| Shares sold | | | 30,501 | | | | 33,526 | | | | 34,816 | | | | 148,917 | |
| Shares issued in reinvestments of | | | | | | | | | | | | | | | | |
| dividends and distributions | | | — | | | | 3,449 | | | | 5,807 | | | | 4,835 | |
| Shares redeemed | | | (95,419 | ) | | | (167,640 | ) | | | (325,109 | ) | | | (568,829 | ) |
| Net decrease in shares | | | | | | | | | | | | | | | | |
| outstanding | | | (64,918 | ) | | | (130,665 | ) | | | (284,486 | ) | | | (415,077 | ) |
The accompanying notes are an integral part of these financial statements.
| KINETICS MUTUAL FUNDS, INC. — THE FEEDER FUNDS |
Statements of Changes in Net Assets — (Continued) |
| | | The Small Cap Opportunities Fund | | | The Market Opportunities Fund | |
| | | For the | | | For the | | | For the | | | For the | |
| | | Year Ended | | | Year Ended | | | Year Ended | | | Year Ended | |
| | | December 31, | | | December 31, | | | December 31, | | | December 31, | |
| | | 2012 | | | 2011 | | | 2012 | | | 2011 | |
| CHANGES IN SHARES OUTSTANDING — | | | | | | | | | | | | |
| ADVISOR CLASS C: | | | | | | | | | | | | |
| Shares sold | | | 7,094 | | | | 7,423 | | | | 14,383 | | | | 25,770 | |
| Shares issued in reinvestments of | | | | | | | | | | | | | | | | |
| dividends and distributions | | | — | | | | 346 | | | | 2,527 | | | | 623 | |
| Shares redeemed | | | (29,018 | ) | | | (33,840 | ) | | | (97,683 | ) | | | (109,015 | ) |
| Net decrease in shares | | | | | | | | | | | | | | | | |
| outstanding | | | (21,924 | ) | | | (26,071 | ) | | | (80,773 | ) | | | (82,622 | ) |
| CHANGES IN SHARES OUTSTANDING — | | | | | | | | | | | | | | | | |
| INSTITUTIONAL CLASS: | | | | | | | | | | | | | | | | |
| Shares sold | | | 133,450 | | | | 43,809 | | | | 5,247 | | | | 3,845 | |
| Shares issued in reinvestments of | | | | | | | | | | | | | | | | |
| dividends and distributions | | | 3 | | | | 3,334 | | | | 118 | | | | 59 | |
| Shares redeemed | | | (113,744 | ) | | | (189,618 | ) | | | (4,211 | ) | | | (4,571 | ) |
| Net increase (decrease) in shares | | | | | | | | | | | | | | | | |
| outstanding | | | 19,709 | | | | (142,475 | ) | | | 1,154 | | | | (667 | ) |
The accompanying notes are an integral part of these financial statements.
| KINETICS MUTUAL FUNDS, INC. — THE FEEDER FUNDS |
Statements of Changes in Net Assets — (Continued) |
| | | The Water Infrastructure Fund | | | The Multi- Disciplinary Fund | |
| | | For the | | | For the | | | For the | | | For the | |
| | | Year Ended | | | Year Ended | | | Year Ended | | | Year Ended | |
| | | December 31, | | | December 31, | | | December 31, | | | December 31, | |
| | | 2012 | | | 2011 | | | 2012 | | | 2011 | |
| OPERATIONS: | | | | | | | | | | | | |
| Net investment income | | $ | 186,370 | | | $ | 181,990 | | | $ | 1,275,828 | | | $ | 1,219,080 | |
| Net realized gain (loss) on sale of | | | | | | | | | | | | | | | | |
| investments, foreign currency, | | | | | | | | | | | | | | | | |
| written option contracts expired | | | | | | | | | | | | | | | | |
| or closed and distributions received | | | | | | | | | | | | | | | | |
| from other investment companies | | | 309,517 | | | | 797,322 | | | | 1,177,010 | | | | (68,730 | ) |
| Net change in unrealized appreciation | | | | | | | | | | | | | | | | |
| (depreciation) of investments, | | | | | | | | | | | | | | | | |
| foreign currency, written options | | | | | | | | | | | | | | | | |
| and securities sold short | | | 604,822 | | | | (1,838,423 | ) | | | 2,744,146 | | | | (1,634,191 | ) |
| Net increase (decrease) in net assets | | | | | | | | | | | | | | | | |
| resulting from operations | | | 1,100,709 | | | | (859,111 | ) | | | 5,196,984 | | | | (483,841 | ) |
| DISTRIBUTIONS TO SHAREHOLDERS — | | | | | | | | | | | | | | | | |
| NO LOAD CLASS: | | | | | | | | | | | | | | | | |
| Net investment income | | | (121,802 | ) | | | (129,304 | ) | | | (679,067 | ) | | | (400,588 | ) |
| Net realized gains | | | — | | | | — | | | | (200,492 | ) | | | (66,876 | ) |
| Total distributions | | | (121,802 | ) | | | (129,304 | ) | | | (879,559 | ) | | | (467,464 | ) |
| DISTRIBUTIONS TO SHAREHOLDERS — | | | | | | | | | | | | | | | | |
| ADVISOR CLASS A: | | | | | | | | | | | | | | | | |
| Net investment income | | | (54,584 | ) | | | (84,275 | ) | | | (647,761 | ) | | | (82,135 | ) |
| Net realized gains | | | — | | | | — | | | | (258,629 | ) | | | (23,639 | ) |
| Total distributions | | | (54,584 | ) | | | (84,275 | ) | | | (906,390 | ) | | | (105,774 | ) |
| DISTRIBUTIONS TO SHAREHOLDERS — | | | | | | | | | | | | | | | | |
| ADVISOR CLASS C: | | | | | | | | | | | | | | | | |
| Net investment income | | | (29,650 | ) | | | (34,810 | ) | | | (173,702 | ) | | | (36,526 | ) |
| Net realized gains | | | — | | | | — | | | | (77,474 | ) | | | (8,257 | ) |
| Total distributions | | | (29,650 | ) | | | (34,810 | ) | | | (251,176 | ) | | | (44,783 | ) |
| DISTRIBUTIONS TO SHAREHOLDERS — | | | | | | | | | | | | | | | | |
| INSTITUTIONAL CLASS: | | | | | | | | | | | | | | | | |
| Net investment income | | | (45,289 | ) | | | (20,174 | ) | | | (218,586 | ) | | | (131,145 | ) |
| Net realized gains | | | — | | | | — | | | | (67,014 | ) | | | (19,194 | ) |
| Total distributions | | | (45,289 | ) | | | (20,174 | ) | | | (285,600 | ) | | | (150,339 | ) |
| CAPITAL SHARE TRANSACTIONS — | | | | | | | | | | | | | | | | |
| NO LOAD CLASS: | | | | | | | | | | | | | | | | |
| Proceeds from shares sold | | | 1,553,283 | | | | 1,132,460 | | | | 9,228,811 | | | | 12,347,701 | |
| Redemption fees | | | 78 | | | | 24 | | | | 725 | | | | 2,464 | |
| Proceeds from shares issued to holders | | | | | | | | | | | | | | | | |
| in reinvestment of dividends | | | 108,785 | | | | 117,685 | | | | 651,115 | | | | 293,827 | |
| Cost of shares redeemed | | | (2,871,859 | ) | | | (2,201,535 | ) | | | (5,059,428 | ) | | | (2,074,045 | ) |
| Net increase (decrease) in net assets | | | | | | | | | | | | | | | | |
| resulting from capital share | | | | | | | | | | | | | | | | |
| transactions | | | (1,209,713 | ) | | | (951,366 | ) | | | 4,821,223 | | | | 10,569,947 | |
The accompanying notes are an integral part of these financial statements.
| KINETICS MUTUAL FUNDS, INC. — THE FEEDER FUNDS |
Statements of Changes in Net Assets — (Continued) |
| | | The Water Infrastructure Fund | | | The Multi- Disciplinary Fund | |
| | | For the | | | For the | | | For the | | | For the | |
| | | Year Ended | | | Year Ended | | | Year Ended | | | Year Ended | |
| | | December 31, | | | December 31, | | | December 31, | | | December 31, | |
| | | 2012 | | | 2011 | | | 2012 | | | 2011 | |
| CAPITAL SHARE TRANSACTIONS — | | | | | | | | | | | | |
| ADVISOR CLASS A: | | | | | | | | | | | | |
| Proceeds from shares sold | | $ | 255,900 | | | $ | 882,166 | | | $ | 22,935,328 | | | $ | 4,785,955 | |
| Redemption fees | | | — | | | | 495 | | | | 5,989 | | | | — | |
| Proceeds from shares issued to holders | | | | | | | | | | | | | | | | |
| in reinvestment of dividends | | | 46,863 | | | | 73,772 | | | | 851,763 | | | | 90,577 | |
| Cost of shares redeemed | | | (2,604,163 | ) | | | (6,074,229 | ) | | | (3,459,167 | ) | | | (307,232 | ) |
| Net increase (decrease) in net assets | | | | | | | | | | | | | | | | |
| resulting from capital share | | | | | | | | | | | | | | | | |
| transactions | | | (2,301,400 | ) | | | (5,117,796 | ) | | | 20,333,913 | | | | 4,569,300 | |
| CAPITAL SHARE TRANSACTIONS — | | | | | | | | | | | | | | | | |
| ADVISOR CLASS C: | | | | | | | | | | | | | | | | |
| Proceeds from shares sold | | | 250,862 | | | | 727,761 | | | | 6,096,378 | | | | 1,634,271 | |
| Redemption fees | | | — | | | | 222 | | | | — | | | | — | |
| Proceeds from shares issued to holders | | | | | | | | | | | | | | | | |
| in reinvestment of dividends | | | 19,420 | | | | 22,357 | | | | 240,039 | | | | 42,860 | |
| Cost of shares redeemed | | | (992,794 | ) | | | (1,079,180 | ) | | | (801,065 | ) | | | (72,488 | ) |
| Net increase (decrease) in net assets | | | | | | | | | | | | | | | | |
| resulting from capital share | | | | | | | | | | | | | | | | |
| transactions | | | (722,512 | ) | | | (328,840 | ) | | | 5,535,352 | | | | 1,604,643 | |
| CAPITAL SHARE TRANSACTIONS — | | | | | | | | | | | | | | | | |
| INSTITUTIONAL CLASS: | | | | | | | | | | | | | | | | |
| Proceeds from shares sold | | | 1,083,914 | | | | 587,279 | | | | 2,153,101 | | | | 3,926,500 | |
| Redemption fees | | | 159 | | | | 2,793 | | | | — | | | | — | |
| Proceeds from shares issued to holders | | | | | | | | | | | | | | | | |
| in reinvestment of dividends | | | 31,108 | | | | 3,061 | | | | 276,678 | | | | 145,307 | |
| Cost of shares redeemed | | | (327,778 | ) | | | (3,905,363 | ) | | | (240,894 | ) | | | (41,159 | ) |
| Net increase (decrease) in net assets | | | | | | | | | | | | | | | | |
| resulting from capital share | | | | | | | | | | | | | | | | |
| transactions | | | 787,403 | | | | (3,312,230 | ) | | | 2,188,885 | | | | 4,030,648 | |
| TOTAL INCREASE (DECREASE) | | | | | | | | | | | | | | | | |
| IN NET ASSETS: | | | (2,596,838 | ) | | | (10,837,906 | ) | | | 35,753,632 | | | | 19,522,337 | |
| NET ASSETS: | | | | | | | | | | | | | | | | |
| Beginning of year | | | 13,286,056 | | | | 24,123,962 | | | | 23,637,977 | | | | 4,115,640 | |
| End of year* | | $ | 10,689,218 | | | $ | 13,286,056 | | | $ | 59,391,609 | | | $ | 23,637,977 | |
| * Including undistributed net investment | | | | | | | | | | | | | | | | |
| loss of: | | $ | (72,455 | ) | | $ | (108,858 | ) | | $ | (433,001 | ) | | $ | (133,086 | ) |
| CHANGES IN SHARES OUTSTANDING — | | | | | | | | | | | | | | | | |
| NO LOAD CLASS: | | | | | | | | | | | | | | | | |
| Shares sold | | | 183,153 | | | | 137,875 | | | | 848,038 | | | | 1,162,165 | |
| Shares issued in reinvestments of | | | | | | | | | | | | | | | | |
| dividends and distributions | | | 13,044 | | | | 15,049 | | | | 59,656 | | | | 28,689 | |
| Shares redeemed | | | (352,741 | ) | | | (267,598 | ) | | | (467,948 | ) | | | (197,567 | ) |
| Net increase (decrease) in | | | | | | | | | | | | | | | | |
| shares outstanding | | | (156,544 | ) | | | (114,674 | ) | | | 439,746 | | | | 993,287 | |
The accompanying notes are an integral part of these financial statements.
| KINETICS MUTUAL FUNDS, INC. — THE FEEDER FUNDS |
Statements of Changes in Net Assets — (Continued) |
| | | The Water Infrastructure Fund | | | The Multi- Disciplinary Fund | |
| | | For the | | | For the | | | For the | | | For the | |
| | | Year Ended | | | Year Ended | | | Year Ended | | | Year Ended | |
| | | December 31, | | | December 31, | | | December 31, | | | December 31, | |
| | | 2012 | | | 2011 | | | 2012 | | | 2011 | |
| CHANGES IN SHARES OUTSTANDING — | | | | | | | | | | | | |
| ADVISOR CLASS A: | | | | | | | | | | | | |
| Shares sold | | | 30,908 | | | | 104,034 | | | | 2,108,470 | | | | 456,913 | |
| Shares issued in reinvestments of | | | | | | | | | | | | | | | | |
| dividends and distributions | | | 5,612 | | | | 9,446 | | | | 78,399 | | | | 8,949 | |
| Shares redeemed | | | (311,285 | ) | | | (736,625 | ) | | | (321,378 | ) | | | (29,920 | ) |
| Net increase (decrease) in | | | | | | | | | | | | | | | | |
| shares outstanding | | | (274,765 | ) | | | (623,145 | ) | | | 1,865,491 | | | | 435,942 | |
| CHANGES IN SHARES OUTSTANDING — | | | | | | | | | | | | | | | | |
| ADVISOR CLASS C: | | | | | | | | | | | | | | | | |
| Shares sold | | | 30,770 | | | | 87,295 | | | | 570,311 | | | | 155,056 | |
| Shares issued in reinvestments of | | | | | | | | | | | | | | | | |
| dividends and distributions | | | 2,357 | | | | 2,903 | | | | 22,235 | | | | 4,155 | |
| Shares redeemed | | | (120,473 | ) | | | (132,547 | ) | | | (74,099 | ) | | | (7,007 | ) |
| Net increase (decrease) in | | | | | | | | | | | | | | | | |
| shares outstanding | | | (87,346 | ) | | | (42,349 | ) | | | 518,447 | | | | 152,204 | |
| CHANGES IN SHARES OUTSTANDING — | | | | | | | | | | | | | | | | |
| INSTITUTIONAL CLASS: | | | | | | | | | | | | | | | | |
| Shares sold | | | 127,757 | | | | 68,978 | | | | 205,219 | | | | 359,586 | |
| Shares issued in reinvestments of | | | | | | | | | | | | | | | | |
| dividends and distributions | | | 3,699 | | | | 388 | | | | 25,267 | | | | 14,009 | |
| Shares redeemed | | | (39,174 | ) | | | (464,289 | ) | | | (21,810 | ) | | | (3,981 | ) |
| Net increase (decrease) in | | | | | | | | | | | | | | | | |
| shares outstanding | | | 92,282 | | | | (394,923 | ) | | | 208,676 | | | | 369,614 | |
The accompanying notes are an integral part of these financial statements.
| KINETICS MUTUAL FUNDS, INC. — THE FEEDER FUNDS |
| Notes to Financial Statements |
| December 31, 2012 |
1. Organization
Kinetics Mutual Funds, Inc. (the “Company”) is registered under the Investment Company Act of 1940, as amended (the “1940 Act”), and is incorporated in the State of Maryland. The Company is an open-end management investment company issuing its shares in series. One billion shares are authorized for the Company with a par value of $0.001 per share. The series of the Company presently authorized are The Internet Fund (“Internet”), The Global Fund (“Global”), The Paradigm Fund (“Paradigm”), The Medical Fund (“Medical”), The Small Cap Opportunities Fund (“Small Cap”), The Market Opportunities Fund (“Market Opportunities”), The Water Infrastructure Fund (“Water Infrastructure”), and The Multi-Disciplinary Fund (“Multi-Disciplinary”). Investment operations of the Company began on October 21, 1996 (Internet), September 30, 1999 (Medical), December 31, 1999 (Global and Paradigm), March 20, 2000 (Small Cap), January 31, 2006 (Market Opportunities), June 29, 2007 (Water Infrastructure), and February 11, 2008 (Multi- Disciplinary). Each series, unlike many other investment companies which directly acquire and manage their own portfolios of securities, seeks to achieve its investment objective by investing all of its investable assets in a corresponding portfolio series (each a “Master Portfolio” and collectively the “Master Portfolios”) of Kinetics Portfolios Trust (the “Trust”).
On April 28, 2000 (January 31, 2006 with respect to Market Opportunities, June 29, 2007 with respect to Water Infrastructure, and February 11, 2008 with respect to Multi-Disciplinary), each series in the Company entered into a master-feeder fund structure. By entering into this structure, each series (each a “Feeder Fund” and collectively, the “Feeder Funds”) invested all of its assets in a corresponding Master Portfolio which had the same investment objective as the Feeder Fund. Each Master Portfolio has multiple feeder funds. Each Feeder Fund receives a proportionate amount of interest in the Master Portfolio equal to its relative contribution of capital. Thus, each Feeder Fund is allocated its portion of income, gains (losses) and expenses from the Master Portfolio.
| KINETICS MUTUAL FUNDS, INC. — THE FEEDER FUNDS |
Notes to Financial Statements — (Continued) |
| December 31, 2012 |
Each Feeder Fund’s respective interest in the corresponding Master Portfolio as of December 31, 2012 is as follows:
| | |
| | Interest in |
| | Master Portfolio |
| Internet Fund | 99.991% |
| Global Fund | 99.901% |
| Paradigm Fund | 95.875% |
| Medical Fund | 99.892% |
| Small Cap Fund | 99.968% |
| Market Opportunities Fund | 99.974% |
| Water Infrastructure Fund | 98.999% |
| Multi-Disciplinary Fund | 99.760% |
Prior to the conversion to a master-feeder fund structure on April 28, 2000, each then existing series conducted its own investment operations.
As of December 31, 2012 each of the Feeder Funds offers Advisor Class A shares. Advisor Class A shares are subject to an annual Rule 12b-1 fee of 0.25% of average daily net assets and a shareholder servicing fee of 0.25% of average daily net assets. The Advisor Class A shares are also subject to a front-end sales charge of 5.75%.
As of December 31, 2012, each of the Feeder Funds offers Advisor Class C shares. Advisor Class C shares are subject to an annual Rule 12b-1 fee of 0.75% of average daily net assets and a shareholder servicing fee of 0.25% of average daily net assets. Advisor Class C shares do not have a sales charge.
As of December 31, 2012, each of the Feeder Funds offers No Load Class shares. No Load Class shares are subject to a shareholder servicing fee of 0.25% of average daily net assets but do not have 12b-1 fees or a sales charge.
As of December 31, 2012 the Paradigm, Small Cap, Market Opportunities, Water Infrastructure, and Multi-Disciplinary Funds offer Institutional Class shares. Institutional Class shares are subject to a shareholder servicing fee of 0.20% of average daily net assets but do not have 12b-1 fees or a sales charge.
Each class of shares for each Fund has identical rights and privileges except with respect to the Rule 12b-1 fees paid by the Advisor Class A and Advisor Class C shares, the sales charge on the Advisor Class A shares, the shareholder servicing fees paid by the Advisor Class A, Advisor Class C, No Load Class and
| KINETICS MUTUAL FUNDS, INC. — THE FEEDER FUNDS |
Notes to Financial Statements — (Continued) |
| December 31, 2012 |
Institutional Class shares, voting rights on matters pertaining to a single class of shares and the exchange privileges of each class of shares. Shares of each Feeder Fund will assess a 2.00% redemption fee (with exceptions) on shares redeemed or exchanged within 30 days of purchase. Income, expenses (other than expenses attributable to a specific class), and realized and unrealized gains or losses on investments are allocated to each class based on its relative net assets.
Refer to the Master Portfolio’s financial statements to obtain information about the investment objective of the corresponding Feeder Fund. The financial statements of the Master Portfolios, including the portfolios of investments, are contained elsewhere in this report and should be read in conjunction with the Feeder Funds’ financial statements.
2. Significant Accounting Policies
Security Valuation
Master Portfolio securities that are listed on a U.S. securities exchange for which market quotations are readily available are valued at the last quoted sale price on the day the valuation is made. Price information on listed securities is taken from the exchange where the security is primarily traded. All equity securities that are traded using the National Association of Securities Dealers’ Automated Quotation System (“NASDAQ”) are valued using the NASDAQ Official Closing Price (“NOCP”). Foreign securities are valued by an independent pricing service. In the event market quotations are not readily available or if events occur that may materially affect the value of a particular security between the time trading ends on a particular security and the close of regular trading on the New York Stock Exchange (“NYSE”), “fair value” will be determined. Unlisted U.S. securities and listed U.S. securities not traded on the valuation date for which market quotations are readily available are valued at the last bid price. Exchange traded options are valued at the composite price, using the National Best Bid and Offer quotes (“NBBO”). NBBO consists of the highest bid price and lowest ask price across any of the exchanges on which an option is quoted, thus providing a view across the entire U.S. options marketplace. Composite option pricing calculates the mean of the highest bid price and lowest ask price across the exchanges where the option is traded. If the composite option price is not available, the mean between the highest bid and the lowest asked quotations at the close of the exchanges will be used. If none of the above are available, exchange traded options are valued at the last
| KINETICS MUTUAL FUNDS, INC. — THE FEEDER FUNDS |
Notes to Financial Statements — (Continued) |
| December 31, 2012 |
quoted sales price. Non-exchange traded options for which over-the-counter quotations are not readily available are valued at the mean of the current bid and asked prices. Fixed-income securities (other than obligations having a maturity of 60 days or less) are normally valued on the basis of quotes obtained from pricing services, which take into account appropriate factors such as institutional-sized trading in similar groups of securities, yield, quality, coupon rate, maturity, type of issue, trading characteristics and other market data.
Instruments with remaining maturities of 60 days or less are valued at amortized cost, which approximates fair value. Other assets and securities for which no quotations are readily available (including restricted securities) will be valued in good faith at fair value using methods determined by the Board of Trustees of the Master Portfolios. In determining the fair value of a security, the Board of Trustees shall take into account the relevant factors and surrounding circumstances, which may include: (i) the nature and pricing history (if any) of the security; (ii) whether any dealer quotations for the security are available; (iii) possible valuation methodologies that could be used to determine the fair value of the security; (iv) the recommendation of the portfolio manager of the Portfolios with respect to the valuation of the security; (v) whether the same or similar securities are held by other funds managed by the Advisor or other funds and the method used to price the security in those funds; (vi) the extent to which the fair value to be determined for the security will result from the use of data or formula produced by third parties independent of the Advisor; and (vii) the liquidity or illiquidity of the market for the security; and (viii) the value of a foreign security traded on other foreign markets. At December 31, 2012, 0.00%, 0.00% and 0.00% of the net assets of The Internet Portfolio, The Paradigm Portfolio and The Market Opportunities Portfolio, respectively, were fair valued securities. The other Master Portfolios did not hold any fair valued securities at December 31, 2012.
Repurchase Agreements
Each Master Portfolio may enter into repurchase agreements with banks that are members of the Federal Reserve System or securities dealers who are members of a national securities exchange or are primary dealers in U.S. Government Securities. In connection with transactions in repurchase agreements, it is the Trust’s policy that the Master Portfolio receive, as collateral, securities whose market value, including accrued interest, at all times will be at least equal to 102% of the amount invested by the Master Portfolio in each repurchase
| KINETICS MUTUAL FUNDS, INC. — THE FEEDER FUNDS |
Notes to Financial Statements — (Continued) |
| December 31, 2012 |
agreement. If the seller defaults and the value of the collateral declines, realization of the collateral by the Master Portfolio may be delayed or limited.
Written Option Accounting
The Master Portfolios may write (sell) call or put options for trading or hedging purposes. When the Master Portfolio writes an option, an amount equal to the premium received by the Master Portfolio is included in the Statement of Assets and Liabilities as an asset and an equivalent liability. The amount of the liability is subsequently marked-to-market to reflect the current value of the option written. By writing the option, the Master Portfolio may become obligated during the term of the option to deliver or purchase the securities underlying the option at the exercise price if the option is exercised. When an option expires on its stipulated expiration date or the Master Portfolio enters into a closing purchase transaction, the Master Portfolio realizes a gain or loss if the cost of the closing transaction differs from the premium received when the option was sold, without regard to any unrealized gain or loss on the underlying security, and the liability related to such option is eliminated. When an option is exercised, the premium originally received decreases the cost basis of the underlying security (or increases the proceeds on the security sold short) and the Master Portfolio realizes a gain or loss from the sale of the security (or closing of the short sale). As collateral for uncovered written options, the Master Portfolio is required under the 1940 Act to maintain assets consisting of cash, cash equivalents or liquid securities. This collateral is required to be adjusted daily to reflect the exercise price of the purchase obligation for put options or the market value of the instrument underlying the contract for call options.
Foreign Currency Translations
The books and records of the Master Portfolios are maintained in U.S. dollars. For the Master Portfolios, foreign currency transactions are translated into U.S. dollars on the following basis: (i) market values of investment securities and other assets and liabilities are translated at the exchange rate of such currencies against the U.S. dollar, as provided by an approved pricing service, and (ii) purchases and sales of investment securities, dividend and interest income and certain expenses at the rates of exchange prevailing on the respective dates of such transactions. The Company does not isolate that portion of the results of operations resulting from changes in foreign exchange rates on investments from the fluctuations arising from changes to market prices of securities held. Such fluctuations are included with the net realized and unrealized gain or loss
| KINETICS MUTUAL FUNDS, INC. — THE FEEDER FUNDS |
Notes to Financial Statements — (Continued) |
| December 31, 2012 |
from investments. However, for federal income tax purposes, the Master Portfolios do isolate and treat as ordinary income the effect of changes in foreign exchange rates arising from actual foreign currency transactions and the effect of changes in foreign exchange rates arising between trade date and settlement date.
Restricted and Illiquid Securities
The Master Portfolios may invest in restricted securities. These securities are valued by the Master Portfolios after giving due consideration to pertinent factors including recent private sales, market conditions and the issuer’s financial performance. The Master Portfolios have no right to require registration of unregistered securities. At December 31, 2012 the following Master Portfolio held securities restricted to institutional investors (144A securities):
| | | | | |
| | | | | Percentage of |
| | | Market Value | | Net Assets |
| The Multi-Disciplinary Portfolio | | $10,272,656 | | 17.25% |
An illiquid asset is any asset which may not be sold or disposed of in the ordinary course of business within seven days at approximately the value at which the Master Portfolio has valued the investment. At December 31, 2012, the following Master Portfolios held illiquid securities:
| | | | | Percentage of |
| | | Market Value | | Net Assets |
| Internet Portfolio | | $ 3 | | | 0.00% |
| The Paradigm Portfolio | | 31 | | | 0.00% |
| The Market Opportunities Portfolio | | — | * | | 0.00% |
| ________________ | | | | | |
| * Amount is less than $0.50. | | | | | |
When-Issued Securities
The Master Portfolios may purchase securities on a when-issued or delayed delivery basis. Although the purchase amounts of these securities are established at the time the purchaser enters into the agreement, these securities may be delivered and paid for at a future date. The Master Portfolios record purchases of when-issued securities and reflect the values of such securities in determining net asset value in the same manner as other portfolio securities. The Master Portfolios maintain at all times cash or other liquid assets in an amount at least equal to the amount of outstanding commitments for when-issued securities.
| KINETICS MUTUAL FUNDS, INC. — THE FEEDER FUNDS |
Notes to Financial Statements — (Continued) |
| December 31, 2012 |
Securities Lending
Each Master Portfolio may lend its portfolio securities to broker-dealers by entering directly into lending arrangements with such broker-dealers or indirectly through repurchase agreements with respect to no more than 331/3% of the total assets of each Master Portfolio (including any collateral posted) or 50% of the total assets of each Master Portfolio (excluding any collateral posted). Securities lending and repurchase transactions will be fully collateralized at all times with cash and/or short-term debt obligations. The Master Portfolios receive interest on the collateral received as well as a fee for the securities loaned.
Expense Allocation
Common expenses incurred by Feeder Funds are allocated among the Feeder Funds (i) based upon relative average net assets, (ii) as incurred on a specific identification basis, or (iii) equally among the Feeder Funds, depending on the nature of the expenditure.
Each Feeder Fund records its proportionate share of the corresponding Master Portfolio’s expenses on a daily basis. In addition, each Feeder Fund accrues its own separate expenses. Any cap on expenses includes Feeder Fund-specific expenses as well as the expenses allocated from the Master Portfolio.
Federal Income Taxes
Each Master Portfolio will be treated as a partnership for federal income tax purposes. As such, each investor in the Master Portfolio via its investment in a Feeder Fund will be subject to taxation on its share of the Master Portfolio’s ordinary income and capital gains. It is intended that the Master Portfolio’s assets will be managed so an investor in the Master Portfolio via its investment in a Feeder Fund can satisfy the requirements of subchapter M of the Internal Revenue Code.
It is the Feeder Funds’ policy to meet the requirements of the Internal Revenue Code applicable to regulated investment companies and the Feeder Funds intend to distribute investment company net taxable income and net capital gains to shareholders. Therefore, no federal income tax provision is recorded.
Dividends from net investment income and distributions of net realized capital gains, if any, will be declared and paid at least annually. The character of
| KINETICS MUTUAL FUNDS, INC. — THE FEEDER FUNDS |
Notes to Financial Statements — (Continued) |
| December 31, 2012 |
distributions made during the year from net investment income or net realized gains may differ from the characterization for federal income tax purposes due to differences in the recognition of income, expenses and gain items for financial statement and tax purposes. Additionally, the Feeder Funds may utilize earnings and profits distributed to shareholders on redemption of shares as part of the dividends paid deduction for income tax purposes. Where appropriate, reclassifications between capital accounts are made for such differences that are permanent in nature.
There is no tax liability resulting from unrecognized tax benefits relating to uncertain income tax positions taken or expected to be taken in future tax returns. As of December 31, 2012, open tax years include the tax years ended December 31, 2009 through 2012. The Funds are also not aware of any tax positions for which it is reasonably possible that the total amounts of unrecognized tax benefits will significantly change in the next twelve months.
Use of Estimates
The preparation of financial statements in conformity with U.S. generally accepted accounting principles (“GAAP”) requires management to make estimates and assumptions that affect the reported amounts in the financial statements. Actual results could differ from those estimates.
Other
Realized gains and losses on the sale of investments are calculated on the identified cost basis. Dividend income is recorded on the ex-dividend date. Interest income is accounted for on the accrual basis and includes amortization of premiums and discounts on the interest method. Other noncash dividends are recognized as investment income at the fair value of the property received. Withholding taxes on foreign dividends have been provided for in accordance with the Company’s understanding of the applicable country’s tax rules and rates.
3. Investment Adviser
The Trust has entered into Investment Advisory Agreements (the “Agreements”) with Kinetics Asset Management LLC (the “Adviser”), with whom certain officers and trustees of the Trust are affiliated, to furnish investment advisory services to the Master Portfolios. The Adviser is a wholly-owned subsidiary of Horizon Kinetics LLC. Under the terms of the Agreements, the Master Portfolios
| KINETICS MUTUAL FUNDS, INC. — THE FEEDER FUNDS |
Notes to Financial Statements — (Continued) |
| December 31, 2012 |
compensate the Adviser for its management services at the annual rate of 1.25% of each Master Portfolio’s average daily net assets.
The Adviser has voluntarily agreed to waive a portion of its advisory fee and/or reimburse certain operating expenses as deemed appropriate. The Adviser may discontinue the voluntary waiver/reimbursement at any time; these waivers/reimbursements are not subject to recapture.
For the year ended December 31, 2012, the rate earned by the Adviser from the Master Portfolios and the waived fees/reimbursed expenses for the Feeder Funds are as follows:
| | | | | | | |
| | | The Internet | | The Global |
| | | Fund | | Fund |
| Annual advisory rate | | | 1.25% | | | | 1.25% | |
| Expenses reimbursed by Adviser through | | | | | | | | |
| voluntary waiver | | $ | 59,425 | | | $ | 112,253 | |
| Expenses reimbursed by Adviser through | | | | | | | | |
| Institutional Class shareholder servicing | | | | | | | | |
| fee waiver | | $ | — | | | $ | — | |
| | | | | | | | | |
| | | The Paradigm | | The Medical |
| | | Fund | | Fund |
| Annual advisory rate | | | 1.25% | | | | 1.25% | |
| Expenses reimbursed by Adviser through | | | | | | | | |
| voluntary waiver | | $ | 1,191,745 | | | $ | 157,559 | |
| Expenses reimbursed by Adviser through | | | | | | | | |
| Institutional Class shareholder servicing | | | | | | | | |
| fee waiver | | $ | 255,786 | | | $ | — | |
| | | | | | | | | |
| | | The Small Cap | | The Market |
| | | Opportunities | | Opportunities |
| | | Fund | | Fund |
| Annual advisory rate | | | 1.25% | | | | 1.25% | |
| Expenses reimbursed by Adviser through | | | | | | | | |
| voluntary waiver | | $ | 266,933 | | | $ | 145,018 | |
| Expenses reimbursed by Adviser through | | | | | | | | |
| Institutional Class shareholder servicing | | | | | | | | |
| fee waiver | | $ | 9,920 | | | $ | 350 | |
| | | | | | | | | |
| | | The Water | | The Multi- |
| | | Infrastructure | | Disciplinary |
| | | Fund | | Fund |
| Annual advisory rate | | | 1.25% | | | | 1.25% | |
| Expenses reimbursed by Adviser through | | | | | | | | |
| voluntary waiver | | $ | 104,109 | | | $ | 214,592 | |
| Expenses reimbursed by Adviser through | | | | | | | | |
| Institutional Class shareholder servicing | | | | | | | | |
| fee waiver | | $ | 1,558 | | | $ | 7,936 | |
| KINETICS MUTUAL FUNDS, INC. — THE FEEDER FUNDS |
Notes to Financial Statements — (Continued) |
| December 31, 2012 |
The Adviser receives a shareholder servicing fee from the No Load Class, Advisor Class A and Advisor Class C shares of a Feeder Fund pursuant to a Shareholder Servicing Agreement in the amount equal to 0.25% of the Feeder Fund’s average daily net assets attributable to No Load Class, Advisor Class A and Advisor Class C shares, respectively. For the Institutional Class, the Adviser receives a shareholder servicing fee pursuant to a shareholder servicing agreement in the amount equal to 0.20% of a Feeder Fund’s average daily net assets attributable to Institutional Class shares. At this time, the Adviser has contractually agreed to waive and/or reimburse the portion of the Institutional Class shareholder servicing fee in excess of 0.05% of a Feeder Fund’s average daily net assets attributable to Institutional Class shares until at least May 1, 2013. For the year ended December 31, 2012, the Adviser waived amounts depicted in the above table in shareholder servicing fees for the Institutional Class of the Paradigm, Small Cap, Market Opportunities, Water Infrastructure, and Multi-Disciplinary Funds. The Adviser is responsible for paying a portion of these shareholder servicing fees to various agents that have a written shareholder servicing agreement with the Adviser and that perform shareholder servicing functions and maintenance of shareholder accounts on behalf of their clients who own shares of the Feeder Funds.
For the year ended December 31, 2012, the Feeder Funds were allocated $24,000 for the services of the Chief Compliance Officer employed by the Adviser.
The Company, on behalf of the Feeder Funds, has adopted two Retail Distribution Plans pursuant to Rule 12b-1 under the 1940 Act (the “12b-1 Plans”). One Plan is for Advisor Class A shares, while the other Plan is for Advisor Class C shares. Under the first Plan, Advisor Class A shares may pay up to an annual rate of 0.50% of the average daily net asset value of Advisor Class A shares to the Distributor or other qualified recipients under the Plan. During the year ended December 31, 2012, payments under the 12b-1 Plan for the Advisor Class A shares of the Internet, Global, Paradigm, Medical, Small Cap, Market Opportunities, Water Infrastructure, and Multi-Disciplinary Funds were limited to 0.25% of the average daily net asset value of such shares of such Funds. During the year ended December 31, 2012, the Advisor Class A shares of the Internet, Global, Paradigm, Medical, Small Cap, Market Opportunities, Water Infrastructure, and Multi-Disciplinary Funds incurred expenses of $2,789, $2,183, $344,370, $7,667, $18,637, $18,743, $9,623 and $39,429, respectively, pursuant to the 12b-1 Plan. Under the second Plan, Advisor Class C shares pay an annual rate of 0.75% of the average daily net asset value
| KINETICS MUTUAL FUNDS, INC. — THE FEEDER FUNDS |
Notes to Financial Statements — (Continued) |
| December 31, 2012 |
of such shares. During the year ended December 31, 2012, Internet, Global, Paradigm, Medical, Small Cap, Market Opportunities, Water Infrastructure, and Multi-Disciplinary Funds Advisor Class C Shares incurred expenses of $955, $1,533, $788,064, $3,830, $18,397, $30,983, $16,457 and $36,636, respectively, pursuant to the 12b-1 Plan.
Kinetics Funds Distributor, LLC (the “Distributor”) acts as the Feeder Funds’ principal underwriter in a continuous public offering of the Funds’ shares. The Distributor is an affiliate of the Adviser. For the year ended December 31, 2012, the Distributor received $282, $1,142, $10,845, $253, $409, $488, $648, and $21,848 from sales loads from the Internet, Global, Paradigm, Medical, Small Cap, Market Opportunities, Water Infrastructure, and Multi-Disciplinary Funds.
4. Reclassification of Capital Accounts
GAAP requires that certain components of net assets relating to permanent differences be reclassified between financial and tax reporting. These reclassifications have no effect on net assets or net asset value per share. For the year ended December 31, 2012, each Feeder Fund recorded the following reclassifications to the accounts listed below:
| | | | | | | | | | | |
| | | INCREASE (DECREASE) | |
| | | Paid in capital | | Accumulated Net Investment Income (Loss) | | Accumulated Net Realized Gain (Loss) | |
| The Internet Fund | | $ | (562,313 | ) | $ | 554,229 | | $ | 8,084 | |
| The Global Fund | | | — | | | 53,089 | | | (53,089 | ) |
| The Paradigm Fund | | | — | | | 6,337,895 | | | (6,337,895 | ) |
| The Medical Fund | | | — | | | (3,259 | ) | | 3,259 | |
| The Small Cap Fund | | | (536,024 | ) | | 33,023 | | | 503,001 | |
| The Market Opportunities Fund | | | (126,217 | ) | | 1,593,523 | | | (1,467,306 | ) |
| The Water Infrastructure Fund | | | (9,435 | ) | | 101,358 | | | (91,923 | ) |
| The Multi-Disciplinary Fund | | | (50,734 | ) | | 143,373 | | | (92,639 | ) |
| KINETICS MUTUAL FUNDS, INC. — THE FEEDER FUNDS |
Notes to Financial Statements — (Continued) |
| December 31, 2012 |
5. Income Taxes
At December 31, 2012 the Internet, Global, Paradigm, Medical, Small Cap, Market Opportunities, Water Infrastructure, and Multi-Disciplinary Funds had $0, $12,171, $8,045,811, $28,372, $0, $220,821, $0 and $392,566, respectively, of undistributed net investment income on a tax basis.
At December 31, 2012, Internet and Medical Funds had $3,213,576 and $144,235, respectively, of accumulated net realized gains on a tax basis.
At December 31, 2012, the Feeder Funds had accumulated net realized capital loss carryforwards expiring in the following years:
| | | | | | | | | | | | | | | | | | | | |
| Feeder Fund | | 2018 | | 2017 | | 2016 | | 2015 | | 2014 | | 2013 | |
| Global | | $ | — | | $ | 391,787 | | $ | — | | $ | — | | $ | — | | $ | — | |
| Paradigm | | | 115,786,082 | | | 445,505,345 | | | 206,736,423 | | | — | | | — | | | — | |
| Small Cap | | | 8,224,702 | | | 96,486,615 | | | 53,815,879 | | | — | | | — | | | — | |
| Market Opportunities | | | 2,108,533 | | | 6,623,055 | | | 20,630,375 | | | — | | | — | | | — | |
| Water Infrastructure | | | 2,203,647 | | | 4,868,599 | | | 988,771 | | | — | | | — | | | — | |
As a result of the Regulated Investment Company Modernization Act of 2010 (“the Modernization Act”), losses incurred in this fiscal year and beyond retain their character, short-term or long-term, have no expiration date and are utilized prior to capital loss carryforwards accumulated before the enactment of the Modernization Act.
For the year ended December 31, 2012, the following Feeder Funds utilized capital loss carryforwards:
| | | | | |
| | | Capital Loss | |
| Feeder Fund | | Carryforward | |
| Global | | $ | 60,657 | |
| Paradigm | | $ | 30,509,870 | |
| Small Cap | | | 9,136,443 | |
| Market Opportunities | | | 3,392,052 | |
| Water Infrastructure | | | 442,025 | |
| KINETICS MUTUAL FUNDS, INC. — THE FEEDER FUNDS |
Notes to Financial Statements — (Continued) |
| December 31, 2012 |
At December 31, 2012, the following Feeder Funds deferred, on a tax basis, post-October losses:
| | | | | | | | |
| Feeder Fund | | Post-October Losses | | Post-October Currency Losses | |
| Internet | | $ | — | | $ | — | |
| Global | | | — | | | — | |
| Paradigm | | | 591,431 | | | — | |
| Medical | | | — | | | — | |
| Small Cap | | | 32,888 | | | 182,544 | |
| Market Opportunities | | | — | | | — | |
| Water Infrastructure | | | 348,512 | | | 72,455 | |
| Multi-Disciplinary | | | — | | | — | |
The tax components of dividends paid during the years ended December 31, 2012 and December 31, 2011, are:
| | | | | | | | | | | | | | |
| | | Internet | | Global | |
| | | Ordinary | | Long-Term | | Ordinary | | Long-Term | |
| | | Income | | Capital Gains | | Income | | Capital Gains | |
| | | Distribution | | Distribution | | Distribution | | Distribution | |
| 2012 | | $ | — | | $ | 5,260,270 | | $ | 156,516 | | $ | — | |
| 2011 | | $ | — | | $ | 734,212 | | $ | 31,833 | | $ | — | |
| | | | | | | | | | | | | | |
| | | Paradigm | | Medical | |
| | | Ordinary | | Long-Term | | Ordinary | | Long-Term | |
| | | Income | | Capital Gains | | Income | | Capital Gains | |
| | | Distribution | | Distribution | | Distribution | | Distribution | |
| 2012 | | $ | 3,816,172 | | $ | — | | $ | 301,886 | | $ | 1,910,710 | |
| 2011 | | $ | 7,652,859 | | $ | — | | $ | 237,948 | | $ | 1,483,472 | |
| | | | | | | | | | | | | | |
| | | Small Cap | | Market Opportunities | |
| | | Ordinary | | Long-Term | | Ordinary | | Long-Term | |
| | | Income | | Capital Gains | | Income | | Capital Gains | |
| | | Distribution | | Distribution | | Distribution | | Distribution | |
| 2012 | | $ | — | | $ | — | | $ | 654,956 | | $ | — | |
| 2011 | | $ | 1,133,648 | | $ | — | | $ | 388,006 | | $ | — | |
| | | | | | | | | | | | | | |
| | | Water Infrastructure | | Multi-Disciplinary | |
| | | Ordinary | | Long-Term | | Ordinary | | Long-Term | |
| | | Income | | Capital Gains | | Income | | Capital Gains | |
| | | Distribution | | Distribution | | Distribution | | Distribution | |
| 2012 | | $ | 251,325 | | $ | — | | $ | 2,322,725 | | $ | — | |
| 2011 | | $ | 268,563 | | $ | — | | $ | 727,453 | | $ | 40,907 | |
| KINETICS MUTUAL FUNDS, INC. — THE FEEDER FUNDS |
Notes to Financial Statements — (Continued) |
| December 31, 2012 |
6. Recent Accounting Pronouncements
In December 2011, the Financial Accounting Standards Board issued Accounting Standards Update No. 2011-11 “Disclosures about Offsetting Assets and Liabilities” (“ASU 2011-11”). ASU 2011-11 requires disclosures to make financial statements that are prepared under U.S. GAAP more comparable to those prepared under the International Financial Reporting Standards. The new disclosure requirements mandate that entities disclose both gross and net information about instruments and transactions eligible for offset in the Statements of Assets & Liabilities as well as instruments and transactions subject to an agreement similar to a master netting arrangement. In addition, ASU 2011-11 requires disclosure of collateral received and posted in connection with master netting agreements or similar arrangements. New disclosures are required for annual reporting periods beginning on or after January 1, 2013, and interim periods within those annual periods. Management is currently evaluating the impact ASU 2011-11 will have on the Feeder Funds’ financial statements and disclosures.
7. Tax Information (Unaudited)
The Global, Paradigm, Medical, and Market Opportunities Funds designate 54%, 100%, 100% and 100%, respectively, of dividends declared after December 31, 2012 from net investment income as qualified dividend income under the Jobs and Growth Tax Relief Reconciliation Act of 2003.
The Internet, Global, Paradigm, Medical, Small Cap, Market Opportunities, Water Infrastructure, and Multi-Disciplinary Funds hereby designate 0%, 100%, 100%, 14%, 0%, 100%, 100% and 100%, respectively, as ordinary income distributions and 100% and 86% for the Internet and Medical Funds as long-term capital gain distributions for the purposes of the dividends paid deduction, which include earnings and profits distributed to shareholders on redemptions of Fund shares.
For corporate shareholders in the Feeder Funds, the percentage of ordinary dividend income distributed for the year ended December 31, 2012, which is designated as qualifying for the dividends-received deduction, is as follows: Global 22%, Paradigm 100%, Medical 100%, and Market Opportunities 63%.
| KINETICS MUTUAL FUNDS, INC. — THE FEEDER FUNDS |
Notes to Financial Statements — (Continued) |
| December 31, 2012 |
The Water Infrastructure and Multi-Disciplinary Funds designate 96% and 91%, respectively, of their ordinary income distributions for the fiscal year ended December 31, 2012 as interest-related dividends under Internal Revenue Code Section 871(k)(l)(C).
The Multi-Disciplinary Fund designates 26% of its ordinary income distribution as a short-term capital gain distribution under Internal Revenue Code Section 871(k)(2)(C).
8. Information about Proxy Voting (Unaudited)
Information regarding how the Company and the Master Portfolios vote proxies relating to portfolio securities is available without charge, upon request by calling toll-free at 1-800-930-3828 or by accessing the Company’s website at www.kineticsfunds.com and by accessing the SEC’s website at www.sec.gov. Information regarding how the Feeder Funds and the Master Portfolios voted proxies relating to portfolio securities during the most recent twelve month period ended June 30, is available without charge, upon request, by calling toll-free at 1-800-930-3828 or by accessing the SEC’s website at www.sec.gov.
9. Information about the Portfolio Holdings (Unaudited)
The Feeder Funds file their complete schedule of portfolio holdings for their first and third fiscal quarters with the SEC on Form N-Q. The Feeder Funds’ Form N-Q is available without charge, upon request, by calling toll-free at 1-800-930-3828. Furthermore, you can obtain the Form N-Q on the SEC’s website at www.sec.gov. Finally, the Form N-Q may be reviewed and copied at the SEC’s Public Reference Room in Washington, D.C. Information on the operation of the Public Reference Room may be obtained by calling 1-800-SEC-0330.
10. Subsequent Events
In preparing these financial statements, management has evaluated Fund related events and transactions for potential recognition or disclosure through the date the financial statements were issued. On January 1, 2013, The Water Infrastructure Fund changed its name and investment mandate and began
| KINETICS MUTUAL FUNDS, INC. — THE FEEDER FUNDS |
Notes to Financial Statements — (Continued) |
| December 31, 2012 |
operations as The Alternative Income Fund. The Water Infrastructure Portfolio made corresponding changes to its name and investment mandate on January 1, 2013. The Alternative Income Portfolio will compensate the Adviser for its management services at the annual rate of 0.90% of the Master Portfolio’s average daily net assets beginning January 1, 2013.
Results of Shareholder Meeting (Unaudited)
At a meeting held on September 21, 2012, the Board of Directors of the Company and the Board of Trustees of the Trust, approved: (1) changing the investment objective of the Water Infrastructure Fund/Water Infrastructure Portfolio (the “Fund/Portfolio”) investment strategy to provide current income and gains, and adding secondary objective to seek to obtain long-term growth of capital; (2) changing the investment strategy of the Portfolio; (3) changing the Fund’s/Portfolio’s fundamental investment restriction relating to industry concentration by eliminating the requirement to concentrate its investments in water and water infrastructure-related industries; and (4) changing the name of the Fund to the Alternative Income Fund and changing the name of the Portfolio to the Alternative Income Portfolio. On December 21, 2012, a special meeting of shareholders of the Fund was held and the changes in the Fund’s/Portfolio’s investment objective and fundamental restriction relating to industry concentration were approved. The Fund/Portfolio’s new investment strategy is described in the prospectus dated January 1, 2013. The voting results of the special meeting of shareholders are shown below:
| | | | | | | |
| 1. | | | | | | |
| Votes for the | | Votes against the | | | | |
| Resolution: | | Resolution | | Abstain: | | Uninstructed: |
| 1,173,885 | | 145,328 | | 55,315 | | 23,348 |
| | | | | | | |
| 2. | | | | | | |
| Votes for the | | Votes against the | | | | |
| Resolution: | | Resolution | | Abstain: | | Uninstructed: |
| 1,158,432 | | 159,682 | | 56,414 | | 23,348 |
| KINETICS MUTUAL FUNDS, INC. — THE FEEDER FUNDS |
| Financial Highlights |
| | | The Internet Fund | |
| | | For the Year Ended December 31, 2012 | | | For the Year Ended December 31, 2011 | | | No Load Class For the Year Ended December 31, 2010 | | | For the Year Ended December 31, 2009 | | | For the Year Ended December 31, 2008 | |
PER SHARE DATA:(1) | | | | | | | | | | | | | | | |
| Net Asset Value Beginning of Year | | $ | 36.26 | | | $ | 37.25 | | | $ | 30.74 | | | $ | 20.71 | | | $ | 35.94 | |
| Income from Investment Operations: | | | | | | | | | | | | | | | | | | | | |
Net investment income (loss)(2) | | | (0.15 | ) | | | (0.37 | ) | | | (0.28 | ) | | | (0.14 | ) | | | 0.29 | |
| Net realized and unrealized gain | | | | | | | | | | | | | | | | | | | | |
| (loss) on investments | | | 8.56 | | | | (0.37 | ) | | | 6.79 | | | | 10.21 | | | | (15.47 | ) |
| Total from investment | | | | | | | | | | | | | | | | | | | | |
| operations | | | 8.41 | | | | (0.74 | ) | | | 6.51 | | | | 10.07 | | | | (15.18 | ) |
Redemption Fees(3) | | | 0.00 | | | | 0.00 | | | | 0.00 | | | | 0.00 | | | | 0.00 | |
| Less Distributions: | | | | | | | | | | | | | | | | | | | | |
| From net investment income | | | — | | | | — | | | | — | | | | (0.04 | ) | | | (0.05 | ) |
| From net realized gains | | | (1.49 | ) | | | (0.25 | ) | | | — | | | | — | | | | — | |
| Total distributions | | | (1.49 | ) | | | (0.25 | ) | | | — | | | | (0.04 | ) | | | (0.05 | ) |
| Net Asset Value, End of Year | | $ | 43.18 | | | $ | 36.26 | | | $ | 37.25 | | | $ | 30.74 | | | $ | 20.71 | |
| Total return | | | 23.24 | % | | | (1.98 | )% | | | 21.18 | % | | | 48.61 | % | | | (42.24 | )% |
| | | | | | | | | | | | | | | | | | | | | |
| SUPPLEMENTAL DATA AND RATIOS | | | | | | | | | | | | | | | | | | | | |
| Net assets, end of year (000’s) | | $ | 155,036 | | | $ | 103,828 | | | $ | 113,085 | | | $ | 104,666 | | | $ | 75,112 | |
| Ratio of operating expenses to average | | | | | | | | | | | | | | | | | | | | |
| net assets: | | | | | | | | | | | | | | | | | | | | |
| Before expense reimbursement | | | 1.94 | % | | | 1.94 | % | | | 1.95 | % | | | 1.98 | % | | | 2.03 | % |
After expense reimbursement(4) | | | 1.89 | % | | | 1.89 | % | | | 1.89 | % | | | 1.89 | % | | | 1.90 | % |
| Ratio of net investment income (loss) | | | | | | | | | | | | | | | | | | | | |
| to average net assets: | | | | | | | | | | | | | | | | | | | | |
| Before expense reimbursement | | | (0.41 | )% | | | (0.99 | )% | | | (0.91 | )% | | | (0.64 | )% | | | 0.90 | % |
After expense reimbursement(4) | | | (0.36 | )% | | | (0.94 | )% | | | (0.85 | )% | | | (0.55 | )% | | | 1.03 | % |
Portfolio turnover rate(5) | | | 9 | % | | | 32 | % | | | 12 | % | | | 14 | % | | | 19 | % |
| | | |
| (1) | Information presented relates to a share of capital stock outstanding for each period. |
| (2) | Net investment income per share represents net investment income divided by the average shares outstanding throughout the period. |
| (3) | Amount calculated is less than $0.005. |
| (4) | See Note #3, Investment Adviser, for the waiver and expense reimbursement discussion. |
| (5) | Portfolio turnover of The Internet Portfolio. |
The accompanying notes are an integral part of these financial statements.
| KINETICS MUTUAL FUNDS, INC. — THE FEEDER FUNDS |
Financial Highlights — (Continued) |
| | | The Internet Fund | |
| | | For the Year Ended December 31, 2012 | | | For the Year Ended December 31, 2011 | | | Advisor Class A For the Year Ended December 31, 2010 | | | For the Year Ended December 31, 2009 | | | For the Year Ended December 31, 2008 | |
PER SHARE DATA:(1) | | | | | | | | | | | | | | | |
| Net Asset Value Beginning of Year | | $ | 35.63 | | | $ | 36.69 | | | $ | 30.35 | | | $ | 20.50 | | | $ | 35.66 | |
| Income from Investment Operations: | | | | | | | | | | | | | | | | | | | | |
Net investment income (loss)(2) | | | (0.24 | ) | | | (0.46 | ) | | | (0.36 | ) | | | (0.21 | ) | | | 0.22 | |
| Net realized and unrealized gain | | | | | | | | | | | | | | | | | | | | |
| (loss) on investments | | | 8.40 | | | | (0.36 | ) | | | 6.70 | | | | 10.09 | | | | (15.33 | ) |
| Total from investment | | | | | | | | | | | | | | | | | | | | |
| operations | | | 8.16 | | | | (0.82 | ) | | | 6.34 | | | | 9.88 | | | | (15.11 | ) |
| Redemption Fees | | | — | | | | 0.01 | | | | 0.00 | (3) | | | 0.01 | | | | 0.00 | (3) |
| Less Distributions: | | | | | | | | | | | | | | | | | | | | |
| From net investment income | | | — | | | | — | | | | — | | | | (0.04 | ) | | | (0.05 | ) |
| From net realized gains | | | (1.49 | ) | | | (0.25 | ) | | | — | | | | — | | | | — | |
| Total distributions | | | (1.49 | ) | | | (0.25 | ) | | | — | | | | (0.04 | ) | | | (0.05 | ) |
| Net Asset Value, End of Year | | $ | 42.30 | | | $ | 35.63 | | | $ | 36.69 | | | $ | 30.35 | | | $ | 20.50 | |
Total return(4) | | | 22.92 | % | | | (2.20 | )% | | | 20.89 | % | | | 48.23 | % | | | (42.37 | )% |
| | | | | | | | | | | | | | | | | | | | | |
| SUPPLEMENTAL DATA AND RATIOS | | | | | | | | | | | | | | | | | | | | |
| Net assets, end of year (000’s) | | $ | 1,379 | | | $ | 1,050 | | | $ | 1,892 | | | $ | 738 | | | $ | 318 | |
| Ratio of operating expenses to average | | | | | | | | | | | | | | | | | | | | |
| net assets: | | | | | | | | | | | | | | | | | | | | |
| Before expense reimbursement | | | 2.19 | % | | | 2.19 | % | | | 2.20 | % | | | 2.23 | % | | | 2.28 | % |
After expense reimbursement(5) | | | 2.14 | % | | | 2.14 | % | | | 2.14 | % | | | 2.14 | % | | | 2.15 | % |
| Ratio of net investment income (loss) | | | | | | | | | | | | | | | | | | | | |
| to average net assets: | | | | | | | | | | | | | | | | | | | | |
| Before expense reimbursement | | | (0.66 | )% | | | (1.24 | )% | | | (1.16 | )% | | | (0.89 | )% | | | 0.65 | % |
After expense reimbursement(5) | | | (0.61 | )% | | | (1.19 | )% | | | (1.10 | )% | | | (0.80 | )% | | | 0.78 | % |
Portfolio turnover rate(6) | | | 9 | % | | | 32 | % | | | 12 | % | | | 14 | % | | | 19 | % |
| | |
| (1) | Information presented relates to a share of capital stock outstanding for each period. |
| (2) | Net investment income per share represents net investment income divided by the average shares outstanding throughout the period. |
| (3) | Amount calculated is less than $0.005. |
| (4) | The total return calculation does not reflect the 5.75% front end sales charge on Advisor Class A shares. |
| (5) | See Note #3, Investment Adviser, for the waiver and expense reimbursement discussion. |
| (6) | Portfolio turnover of The Internet Portfolio. |
The accompanying notes are an integral part of these financial statements.
| KINETICS MUTUAL FUNDS, INC. — THE FEEDER FUNDS |
Financial Highlights — (Continued) |
| | | The Internet Fund | |
| | | For the Year Ended December 31, 2012 | | | For the Year Ended December 31, 2011 | | | Advisor Class C For the Year Ended December 31, 2010 | | | For the Year Ended December 31, 2009 | | | For the Year Ended December 31, 2008 | |
PER SHARE DATA:(1) | | | | | | | | | | | | | | | |
| Net Asset Value Beginning of Year | | $ | 34.58 | | | $ | 35.79 | | | $ | 29.76 | | | $ | 20.20 | | | $ | 35.31 | |
| Income from Investment Operations: | | | | | | | | | | | | | | | | | | | | |
Net investment income (loss)(2) | | | (0.43 | ) | | | (0.63 | ) | | | (0.51 | ) | | | (0.31 | ) | | | 0.08 | |
| Net realized and unrealized gain | | | | | | | | | | | | | | | | | | | | |
| (loss) on investments | | | 8.13 | | | | (0.34 | ) | | | 6.54 | | | | 9.91 | | | | (15.15 | ) |
| Total from investment | | | | | | | | | | | | | | | | | | | | |
| operations | | | 7.70 | | | | (0.97 | ) | | | 6.03 | | | | 9.60 | | | | (15.07 | ) |
| Redemption Fees | | | — | | | | 0.01 | | | | — | | | | — | | | | — | |
| Less Distributions: | | | | | | | | | | | | | | | | | | | | |
| From net investment income | | | — | | | | — | | | | — | | | | (0.04 | ) | | | (0.04 | ) |
| From net realized gains | | | (1.49 | ) | | | (0.25 | ) | | | — | | | | — | | | | — | |
| Total distributions | | | (1.49 | ) | | | (0.25 | ) | | | — | | | | (0.04 | ) | | | (0.04 | ) |
| Net Asset Value, End of Year | | $ | 40.79 | | | $ | 34.58 | | | $ | 35.79 | | | $ | 29.76 | | | $ | 20.20 | |
| Total return | | | 22.32 | % | | | (2.67 | )% | | | 20.26 | % | | | 47.51 | % | | | (42.67 | )% |
| | | | | | | | | | | | | | | | | | | | | |
| SUPPLEMENTAL DATA AND RATIOS | | | | | | | | | | | | | | | | | | | | |
| Net assets, end of year (000’s) | | $ | 185 | | | $ | 103 | | | $ | 196 | | | $ | 120 | | | $ | 113 | |
| Ratio of operating expenses to | | | | | | | | | | | | | | | | | | | | |
| average net assets: | | | | | | | | | | | | | | | | | | | | |
| Before expense reimbursement | | | 2.69 | % | | | 2.69 | % | | | 2.70 | % | | | 2.73 | % | | | 2.78 | % |
After expense reimbursement(3) | | | 2.64 | % | | | 2.64 | % | | | 2.64 | % | | | 2.64 | % | | | 2.65 | % |
| Ratio of net investment income (loss) | | | | | | | | | | | | | | | | | | | | |
| to average net assets: | | | | | | | | | | | | | | | | | | | | |
| Before expense reimbursement | | | (1.16 | )% | | | (1.74 | )% | | | (1.66 | )% | | | (1.39 | )% | | | 0.15 | % |
After expense reimbursement(3) | | | (1.11 | )% | | | (1.69 | )% | | | (1.60 | )% | | | (1.30 | )% | | | 0.28 | % |
Portfolio turnover rate(4) | | | 9 | % | | | 32 | % | | | 12 | % | | | 14 | % | | | 19 | % |
| | |
| (1) | Information presented relates to a share of capital stock outstanding for each period. |
| (2) | Net investment income per share represents net investment income divided by the average shares outstanding throughout the period. |
| (3) | See Note #3, Investment Adviser, for the waiver and expense reimbursement discussion. |
| (4) | Portfolio turnover of The Internet Portfolio. |
The accompanying notes are an integral part of these financial statements.
| KINETICS MUTUAL FUNDS, INC. — THE FEEDER FUNDS |
Financial Highlights — (Continued) |
| | | The Global Fund |
| | | For the Year Ended December 31, 2012 | | For the Year Ended December 31, 2011 | | No Load Class For the Year Ended December 31, 2010 | | For the Year Ended December 31, 2009 | | For the Year Ended December 31, 2008 | |
PER SHARE DATA:(1) | | | | | | | | | | | | | | | | |
| Net Asset Value Beginning of Year | | $ | 3.92 | | $ | 4.67 | | $ | 3.92 | | $ | 2.36 | | $ | 4.90 | |
| Income from Investment Operations: | | | | | | | | | | | | | | | | |
Net investment income(2) | | | 0.03 | | | 0.06 | | | 0.02 | | | 0.02 | | | 0.07 | |
| Net realized and unrealized gain | | | | | | | | | | | | | | | | |
| (loss) on investments | | | 0.88 | | | (0.78 | ) | | 0.78 | | | 1.55 | | | (2.56 | ) |
| Total from investment | | | | | | | | | | | | | | | | |
| operations | | | 0.91 | | | (0.72 | ) | | 0.80 | | | 1.57 | | | (2.49 | ) |
| Redemption Fees | | | 0.00 | (3) | | 0.00 | (3) | | 0.00 | (3) | | 0.01 | | | 0.00 | (3) |
| Less Distributions: | | | | | | | | | | | | | | | | |
| From net investment income | | | (0.12 | ) | | (0.03 | ) | | (0.05 | ) | | (0.02 | ) | | (0.05 | ) |
| Total distributions | | | (0.12 | ) | | (0.03 | ) | | (0.05 | ) | | (0.02 | ) | | (0.05 | ) |
| Net Asset Value, End of Year | | $ | 4.71 | | $ | 3.92 | | $ | 4.67 | | $ | 3.92 | | $ | 2.36 | |
| Total return | | | 23.16 | % | | (15.41 | )% | | 20.30 | % | | 66.86 | % | | (50.72 | )% |
| | | | | | | | | | | | | | | | | |
| SUPPLEMENTAL DATA AND RATIOS | | | | | | | | | | | | | | | | |
| Net assets, end of year (000’s) | | $ | 5,069 | | $ | 3,631 | | $ | 4,541 | | $ | 4,370 | | $ | 1,863 | |
| Ratio of operating expenses to | | | | | | | | | | | | | | | | |
| average net assets: | | | | | | | | | | | | | | | | |
| Before expense reimbursement | | | 3.38 | % | | 3.94 | % | | 4.17 | % | | 5.32 | % | | 5.98 | % |
After expense reimbursement(4) | | | 1.39 | % | | 1.39 | % | | 1.39 | % | | 1.39 | % | | 1.41 | % |
| Ratio of net investment income (loss) | | | | | | | | | | | | | | | | |
| to average net assets: | | | | | | | | | | | | | | | | |
| Before expense reimbursement | | | (1.22 | )% | | (1.11 | )% | | (2.26 | )% | | (3.27 | )% | | (2.72 | )% |
After expense reimbursement(4) | | | 0.77 | % | | 1.44 | % | | 0.52 | % | | 0.66 | % | | 1.85 | % |
Portfolio turnover rate(5) | | | 23 | % | | 135 | % | | 122 | % | | 53 | % | | 98 | % |
| | |
| (1) | Information presented relates to a share of capital stock outstanding for each period. |
| (2) | Net investment income per share represents net investment income divided by the average shares outstanding throughout the period. |
| (3) | Amount calculated is less than $0.005. |
| (4) | See Note #3, Investment Adviser, for the waiver and expense reimbursement discussion. |
| (5) | Portfolio turnover of The Global Portfolio. |
The accompanying notes are an integral part of these financial statements.
| KINETICS MUTUAL FUNDS, INC. — THE FEEDER FUNDS |
Financial Highlights — (Continued) |
| | | The Global Fund | |
| | | For the Year Ended December 31, 2012 | | | For the Year Ended December 31, 2011 | | | Advisor Class A For the Year Ended December 31, 2010 | | | For the Year Ended December 31, 2009 | | | May 19, 2008^ through December 31, 2008 | |
PER SHARE DATA:(1) | | | | | | | | | | | | | | | |
| Net Asset Value Beginning of Period | | $ | 3.92 | | | $ | 4.68 | | | $ | 3.93 | | | $ | 2.36 | | | $ | 4.56 | |
| Income from Investment Operations: | | | | | | | | | | | | | | | | | | | | |
Net investment income(2) | | | 0.02 | | | | 0.05 | | | | 0.01 | | | | 0.01 | | | | 0.03 | |
| Net realized and unrealized gain | | | | | | | | | | | | | | | | | | | | |
| (loss) on investments | | | 0.88 | | | | (0.78 | ) | | | 0.78 | | | | 1.57 | | | | (2.18 | ) |
| Total from investment | | | | | | | | | | | | | | | | | | | | |
| operations | | | 0.90 | | | | (0.73 | ) | | | 0.79 | | | | 1.58 | | | | (2.15 | ) |
| Redemption Fees | | | 0.00 | (3) | | | 0.00 | (3) | | | 0.00 | (3) | | | — | | | | — | |
| Less Distributions: | | | | | | | | | | | | | | | | | | | | |
| From net investment income | | | (0.11 | ) | | | (0.03 | ) | | | (0.04 | ) | | | (0.01 | ) | | | (0.05 | ) |
| Total distributions | | | (0.11 | ) | | | (0.03 | ) | | | (0.04 | ) | | | (0.01 | ) | | | (0.05 | ) |
| Net Asset Value, End of Period | | $ | 4.71 | | | $ | 3.92 | | | $ | 4.68 | | | $ | 3.93 | | | $ | 2.36 | |
Total return(4) | | | 22.94 | % | | | (15.59 | )% | | | 20.04 | % | | | 67.11 | % | | | (47.12 | )%(5) |
| | | | | | | | | | | | | | | | | | | | | |
| SUPPLEMENTAL DATA AND RATIOS | | | | | | | | | | | | | | | | | | | | |
| Net assets, end of period (000’s) | | $ | 1,093 | | | $ | 392 | | | $ | 707 | | | $ | 368 | | | $ | 106 | |
| Ratio of operating expenses to average | | | | | | | | | | | | | | | | | | | | |
| net assets: | | | | | | | | | | | | | | | | | | | | |
| Before expense reimbursement | | | 3.63 | % | | | 4.19 | % | | | 4.42 | % | | | 5.57 | % | | | 8.28 | %(6) |
After expense reimbursement(7) | | | 1.64 | % | | | 1.64 | % | | | 1.64 | % | | | 1.64 | % | | | 1.65 | %(6) |
| Ratio of net investment income (loss) to | | | | | | | | | | | | | | | | | | | | |
| average net assets: | | | | | | | | | | | | | | | | | | | | |
| Before expense reimbursement | | | (1.47 | )% | | | (1.36 | )% | | | (2.51 | )% | | | (3.52 | )% | | | (5.16 | )%(6) |
After expense reimbursement(7) | | | 0.52 | % | | | 1.19 | % | | | 0.27 | % | | | 0.41 | % | | | 1.47 | %(6) |
Portfolio turnover rate(8) | | | 23 | % | | | 135 | % | | | 122 | % | | | 53 | % | | | 98 | % |
| | |
| ^ | Commencement of operations. |
| (1) | Information presented relates to a share of capital stock outstanding for each period. |
| (2) | Net investment income per share represents net investment income divided by the average shares outstanding throughout the period. |
| (3) | Amount calculated is less than $0.005. |
| (4) | The total return calculation does not reflect the 5.75% front end sales charge on Advisor Class A shares. |
| (5) | Not annualized. |
| (6) | Annualized. |
| (7) | See Note #3, Investment Adviser, for the waiver and expense reimbursement discussion. |
| (8) | Portfolio turnover of The Global Portfolio. |
The accompanying notes are an integral part of these financial statements.
| KINETICS MUTUAL FUNDS, INC. — THE FEEDER FUNDS |
Financial Highlights — (Continued) |
| | | The Global Fund |
| | | For the Year Ended December 31, 2012 | | For the Year Ended December 31, 2011 | | Advisor Class C For the Year Ended December 31, 2010 | | For the Year Ended December 31, 2009 | | May 19, 2008^ through December 31, 2008 | |
PER SHARE DATA:(1) | | | | | | | | | | | | | | | | |
| Net Asset Value Beginning of Period | | $ | 3.87 | | $ | 4.64 | | $ | 3.90 | | $ | 2.37 | | $ | 4.56 | |
| Income from Investment Operations: | | | | | | | | | | | | | | | | |
Net investment income (loss)(2) | | | 0.00 | (3) | | 0.03 | | | (0.01 | ) | | 0.00 | (3) | | 0.02 | |
| Net realized and unrealized gain (loss) | | | | | | | | | | | | | | | | |
| on investments | | | 0.85 | | | (0.77 | ) | | 0.77 | | | 1.53 | | | (2.17 | ) |
| Total from investment | | | | | | | | | | | | | | | | |
| operations | | | 0.85 | | | (0.74 | ) | | 0.76 | | | 1.53 | | | (2.15 | ) |
| Redemption Fees | | | — | | | — | | | — | | | — | | | — | |
| Less Distributions: | | | | | | | | | | | | | | | | |
| From net investment income | | | (0.10 | ) | | (0.03 | ) | | (0.02 | ) | | (0.00 | )(3) | | (0.04 | ) |
| Total distributions | | | (0.10 | ) | | (0.03 | ) | | (0.02 | ) | | (0.00 | )(3) | | (0.04 | ) |
| Net Asset Value, End of Period | | $ | 4.62 | | $ | 3.87 | | $ | 4.64 | | $ | 3.90 | | $ | 2.37 | |
| Total return | | | 22.04 | % | | (15.94 | )% | | 19.24 | % | | 65.08 | % | | (47.14 | )%(4) |
| | | | | | | | | | | | | | | | | |
| SUPPLEMENTAL DATA AND RATIOS | | | | | | | | | | | | | | | | |
| Net assets, end of period (000’s) | | $ | 383 | | $ | 111 | | $ | 64 | | $ | 36 | | $ | 5 | |
| Ratio of operating expenses to | | | | | | | | | | | | | | | | |
| average net assets: | | | | | | | | | | | | | | | | |
| Before expense reimbursement | | | 4.13 | % | | 4.69 | % | | 4.92 | % | | 6.07 | % | | 8.78 | %(5) |
After expense reimbursement(6) | | | 2.14 | % | | 2.14 | % | | 2.14 | % | | 2.14 | % | | 2.15 | %(5) |
| Ratio of net investment income (loss) to | | | | | | | | | | | | | | | | |
| average net assets: | | | | | | | | | | | | | | | | |
| Before expense reimbursement | | | (1.97 | )% | | (1.86 | )% | | (3.01 | )% | | (4.02 | )% | | (5.66 | )%(5) |
After expense reimbursement(6) | | | 0.02 | % | | 0.69 | % | | (0.23 | )% | | (0.09 | )% | | 0.97 | %(5) |
Portfolio turnover rate(7) | | | 23 | % | | 135 | % | | 122 | % | | 53 | % | | 98 | % |
| | |
| ^ | Commencement of operations. |
| (1) | Information presented relates to a share of capital stock outstanding for each period. |
| (2) | Net investment income per share represents net investment income divided by the average shares outstanding throughout the period. |
| (3) | Amount calculated is less than $0.005. |
| (4) | Not annualized. |
| (5) | Annualized. |
| (6) | See Note #3, Investment Adviser, for the waiver and expense reimbursement discussion. |
| (7) | Portfolio turnover of The Global Portfolio. |
The accompanying notes are an integral part of these financial statements.
| KINETICS MUTUAL FUNDS, INC. — THE FEEDER FUNDS |
Financial Highlights — (Continued) |
| | | The Paradigm Fund | |
| | | For the Year Ended December 31, 2012 | | | For the Year Ended December 31, 2011 | | | No Load Class For the Year Ended December 31, 2010 | | | For the Year Ended December 31, 2009 | | | For the Year Ended December 31, 2008 | |
PER SHARE DATA:(1) | | | | | | | | | | | | | | | |
| Net Asset Value Beginning of Year | | $ | 19.81 | | | $ | 23.31 | | | $ | 20.18 | | | $ | 14.42 | | | $ | 30.99 | |
| Income from Investment Operations: | | | | | | | | | | | | | | | | | | | | |
Net investment income(2) | | | 0.05 | | | | 0.02 | | | | 0.11 | | | | 0.15 | | | | 0.12 | |
| Net realized and unrealized gain | | | | | | | | | | | | | | | | | | | | |
| (loss) on investments | | | 4.25 | | | | (3.34 | ) | | | 3.39 | | | | 5.78 | | | | (16.62 | )(6) |
| Total from investment | | | | | | | | | | | | | | | | | | | | |
| operations | | | 4.30 | | | | (3.32 | ) | | | 3.50 | | | | 5.93 | | | | 16.50 | |
| Redemption Fees | | | 0.00 | (3) | | | 0.00 | (3) | | | 0.00 | (3) | | | 0.00 | (3) | | | 0.01 | |
| Less Distributions: | | | | | | | | | | | | | | | | | | | | |
| From net investment income | | | (0.12 | ) | | | (0.18 | ) | | | (0.37 | ) | | | (0.17 | ) | | | — | |
| From net realized gains | | | — | | | | — | | | | — | | | | — | | | | (0.08 | ) |
| Total distributions | | | (0.12 | ) | | | (0.18 | ) | | | (0.37 | ) | | | (0.17 | ) | | | (0.08 | ) |
| Net Asset Value, End of Year | | $ | 23.99 | | | $ | 19.81 | | | $ | 23.31 | | | $ | 20.18 | | | $ | 14.42 | |
| Total return | | | 21.78 | % | | | (14.27 | )% | | | 17.37 | % | | | 41.02 | % | | | (53.17 | )%(6) |
| | | | | | | | | | | | | | | | | | | | | |
| SUPPLEMENTAL DATA AND RATIOS | | | | | | | | | | | | | | | | | | | | |
| Net assets, end of year (000’s) | | $ | 416,696 | | | $ | 430,528 | | | $ | 687,056 | | | $ | 825,278 | | | $ | 740,983 | |
| Ratio of operating expenses to | | | | | | | | | | | | | | | | | | | | |
| average net assets: | | | | | | | | | | | | | | | | | | | | |
| Before expense reimbursement | | | 1.78 | % | | | 1.78 | % | | | 1.76 | % | | | 1.73 | % | | | 1.72 | % |
After expense reimbursement(4) | | | 1.64 | % | | | 1.64 | % | | | 1.64 | % | | | 1.64 | % | | | 1.66 | % |
| Ratio of net investment income (loss) | | | | | | | | | | | | | | | | | | | | |
| to average net assets: | | | | | | | | | | | | | | | | | | | | |
| Before expense reimbursement | | | 0.08 | % | | | (0.03 | )% | | | 0.43 | % | | | 0.78 | % | | | 0.46 | % |
After expense reimbursement(4) | | | 0.22 | % | | | 0.11 | % | | | 0.55 | % | | | 0.87 | % | | | 0.52 | % |
Portfolio turnover rate(5) | | | 6 | % | | | 58 | % | | | 7 | % | | | 15 | % | | | 34 | % |
| | |
| (1) | Information presented relates to a share of capital stock outstanding for each period. |
| (2) | Net investment income per share represents net investment income divided by the average shares outstanding throughout the period. |
| (3) | Amount calculated is less than $0.005. |
| (4) | See Note #3, Investment Adviser, for the waiver and expense reimbursement discussion. |
| (5) | Portfolio turnover of The Paradigm Portfolio. |
| (6) | Includes adviser reimbursement from the net realized loss on the disposal of investments in violation of restrictions. The reimbursement comprises less than $0.005 of the NAVs for each class at the time of reimbursement and 0.03% of the total return for the Adviser Class C for the fiscal year ended December 31, 2008. There was no impact on the other classes. |
The accompanying notes are an integral part of these financial statements.
| KINETICS MUTUAL FUNDS, INC. — THE FEEDER FUNDS |
Financial Highlights — (Continued) |
| | | The Paradigm Fund | |
| | | For the Year Ended December 31, 2012 | | | For the Year Ended December 31, 2011 | | | Advisor Class A For the Year Ended December 31, 2010 | | | For the Year Ended December 31, 2009 | | | For the Year Ended December 31, 2008 | |
PER SHARE DATA:(1) | | | | | | | | | | | | | | | |
| Net Asset Value Beginning of Year | | $ | 19.45 | | | $ | 22.95 | | | $ | 19.88 | | | $ | 14.16 | | | $ | 30.52 | |
| Income from Investment Operations: | | | | | | | | | | | | | | | | | | | | |
Net investment income (loss)(2) | | | (0.01 | ) | | | (0.03 | ) | | | 0.06 | | | | 0.10 | | | | 0.06 | |
| Net realized and unrealized gain | | | | | | | | | | | | | | | | | | | | |
| (loss) on investments | | | 4.18 | | | | (3.29 | ) | | | 3.33 | | | | 5.68 | | | | (16.34 | )(7) |
| Total from investment | | | | | | | | | | | | | | | | | | | | |
| operations | | | 4.17 | | | | (3.32 | ) | | | 3.39 | | | | 5.78 | | | | (16.28 | ) |
| Redemption Fees | | | 0.00 | (3) | | | 0.00 | (3) | | | 0.00 | (3) | | | — | | | | 0.00 | (3) |
| Less Distributions: | | | | | | | | | | | | | | | | | | | | |
| From net investment income | | | (0.03 | ) | | | (0.18 | ) | | | (0.32 | ) | | | (0.06 | ) | | | — | |
| From net realized gains | | | — | | | | — | | | | — | | | | — | | | | (0.08 | ) |
| Total distributions | | | (0.03 | ) | | | (0.18 | ) | | | (0.32 | ) | | | (0.06 | ) | | | (0.08 | ) |
| Net Asset Value, End of Year | | $ | 23.59 | | | $ | 19.45 | | | $ | 22.95 | | | $ | 19.88 | | | $ | 14.16 | |
Total return(4) | | | 21.49 | % | | | (14.49 | )% | | | 17.11 | % | | | 40.64 | % | | | (53.30 | )%(7) |
| | | | | | | | | | | | | | | | | | | | | |
| SUPPLEMENTAL DATA AND RATIOS | | | | | | | | | | | | | | | | | | | | |
| Net assets, end of year (000’s) | | $ | 135,747 | | | $ | 146,939 | | | $ | 226,264 | | | $ | 252,106 | | | $ | 249,424 | |
| Ratio of operating expenses to | | | | | | | | | | | | | | | | | | | | |
| average net assets: | | | | | | | | | | | | | | | | | | | | |
| Before expense reimbursement | | | 2.03 | % | | | 2.03 | % | | | 2.01 | % | | | 1.98 | % | | | 1.97 | % |
After expense reimbursement(5) | | | 1.89 | % | | | 1.89 | % | | | 1.89 | % | | | 1.89 | % | | | 1.91 | % |
| Ratio of net investment income (loss) | | | | | | | | | | | | | | | | | | | | |
| to average net assets: | | | | | | | | | | | | | | | | | | | | |
| Before expense reimbursement | | | (0.17 | )% | | | (0.28 | )% | | | 0.18 | % | | | 0.53 | % | | | 0.21 | % |
After expense reimbursement(5) | | | (0.03 | )% | | | (0.14 | )% | | | 0.30 | % | | | 0.62 | % | | | 0.27 | % |
Portfolio turnover rate(6) | | | 6 | % | | | 58 | % | | | 7 | % | | | 15 | % | | | 34 | % |
| | |
| (1) | Information presented relates to a share of capital stock outstanding for each period. |
| (2) | Net investment income per share represents net investment income divided by the average shares outstanding throughout the period. |
| (3) | Amount calculated is less than $0.005. |
| (4) | The total return calculation does not reflect the 5.75% front end sales charge on Advisor Class A shares. |
| (5) | See Note #3, Investment Adviser, for the waiver and expense reimbursement discussion. |
| (6) | Portfolio turnover of The Paradigm Portfolio. |
| (7) | Includes adviser reimbursement from the net realized loss on the disposal of investments in violation of restrictions. The reimbursement comprises less than $0.005 of the NAVs for each class at the time of reimbursement and 0.03% of the total return for the Adviser Class C for the fiscal year ended December 31, 2008. There was no impact on the other classes. |
The accompanying notes are an integral part of these financial statements.
| KINETICS MUTUAL FUNDS, INC. — THE FEEDER FUNDS |
Financial Highlights — (Continued) |
| | | The Paradigm Fund | |
| | | For the Year Ended December 31, 2012 | | | For the Year Ended December 31, 2011 | | | Advisor Class C For the Year Ended December 31, 2010 | | | For the Year Ended December 31, 2009 | | | For the Year Ended December 31, 2008 | |
PER SHARE DATA:(1) | | | | | | | | | | | | | | | |
| Net Asset Year Beginning of Year | | $ | 18.76 | | | $ | 22.25 | | | $ | 19.33 | | | $ | 13.80 | | | $ | 29.90 | |
| Income from Investment Operations: | | | | | | | | | | | | | | | | | | | | |
Net investment income (loss)(2) | | | (0.11 | ) | | | (0.14 | ) | | | (0.04 | ) | | | 0.02 | | | | (0.05 | ) |
| Net realized and unrealized gain | | | | | | | | | | | | | | | | | | | | |
| (loss) on investments | | | 4.01 | | | | (3.17 | ) | | | 3.22 | | | | 5.51 | | | | (15.97 | )(6) |
| Total from investment | | | | | | | | | | | | | | | | | | | | |
| operations | | | 3.90 | | | | (3.31 | ) | | | 3.18 | | | | 5.53 | | | | (16.02 | ) |
Redemption Fees(3) | | | 0.00 | | | | 0.00 | | | | 0.00 | | | | 0.00 | | | | 0.00 | |
| Less Distributions: | | | | | | | | | | | | | | | | | | | | |
| From net investment income | | | — | | | | (0.18 | ) | | | (0.26 | ) | | | — | | | | — | |
| From net realized gains | | | — | | | | — | | | | — | | | | — | | | | (0.08 | ) |
| Total distributions | | | — | | | | (0.18 | ) | | | (0.26 | ) | | | — | | | | (0.08 | ) |
| Net Asset Value, End of Year | | $ | 22.66 | | | $ | 18.76 | | | $ | 22.25 | | | $ | 19.33 | | | $ | 13.80 | |
| Total return | | | 20.85 | % | | | (14.90 | )% | | | 16.45 | % | | | 39.97 | % | | | (53.54 | )%(6) |
| | | | | | | | | | | | | | | | | | | | | |
| SUPPLEMENTAL DATA AND RATIOS | | | | | | | | | | | | | | | | | | | | |
| Net assets, end of year (000’s) | | $ | 101,405 | | | $ | 102,534 | | | $ | 152,571 | | | $ | 169,578 | | | $ | 147,915 | |
| Ratio of operating expenses to | | | | | | | | | | | | | | | | | | | | |
| average net assets: | | | | | | | | | | | | | | | | | | | | |
| Before expense reimbursement | | | 2.53 | % | | | 2.53 | % | | | 2.51 | % | | | 2.48 | % | | | 2.47 | % |
After expense reimbursement(4) | | | 2.39 | % | | | 2.39 | % | | | 2.39 | % | | | 2.39 | % | | | 2.41 | % |
| Ratio of net investment income (loss) | | | | | | | | | | | | | | | | | | | | |
| to average net assets: | | | | | | | | | | | | | | | | | | | | |
| Before expense reimbursement | | | (0.67 | )% | | | (0.78 | )% | | | (0.32 | )% | | | 0.03 | % | | | (0.29 | )% |
After expense reimbursement(4) | | | (0.53 | )% | | | (0.64 | )% | | | (0.20 | )% | | | 0.12 | % | | | (0.23 | )% |
Portfolio turnover rate(5) | | | 6 | % | | | 58 | % | | | 7 | % | | | 15 | % | | | 34 | % |
| | |
| (1) | Information presented relates to a share of capital stock outstanding for each period. |
| (2) | Net investment income per share represents net investment income divided by the average shares outstanding throughout the period. |
| (3) | Amount calculated is less than $0.005. |
| (4) | See Note #3, Investment Adviser, for the waiver and expense reimbursement discussion. |
| (5) | Portfolio turnover of The Paradigm Portfolio. |
| (6) | Includes adviser reimbursement from the net realized loss on the disposal of investments in violation of restrictions. The reimbursement comprises less than $0.005 of the NAVs for each class at the time of reimbursement and 0.03% of the total return for the Adviser Class C for the fiscal year ended December 31, 2008. There was no impact on the other classes. |
The accompanying notes are an integral part of these financial statements.
| KINETICS MUTUAL FUNDS, INC. — THE FEEDER FUNDS |
Financial Highlights — (Continued) |
| | | The Paradigm Fund | |
| | | For the Year Ended December 31, 2012 | | | For the Year Ended December 31, 2011 | | | Institutional Class For the Year Ended December 31, 2010 | | | For the Year Ended December 31, 2009 | | | For the Year Ended December 31, 2008 | |
PER SHARE DATA:(1) | | | | | | | | | | | | | | | |
| Net Asset Value Beginning of Year | | $ | 19.79 | | | $ | 23.25 | | | $ | 20.13 | | | $ | 14.44 | | | $ | 30.97 | |
| Income from Investment Operations: | | | | | | | | | | | | | | | | | | | | |
Net investment income(2) | | | 0.10 | | | | 0.07 | | | | 0.16 | | | | 0.18 | | | | 0.18 | |
| Net realized and unrealized gain | | | | | | | | | | | | | | | | | | | | |
| (loss) on investments | | | 4.24 | | | | (3.35 | ) | | | 3.38 | | | | 5.78 | | | | (16.63 | )(6) |
| Total from investment | | | | | | | | | | | | | | | | | | | | |
| operations | | | 4.34 | | | | (3.28 | ) | | | 3.54 | | | | 5.96 | | | | (16.45 | ) |
Redemption Fees(3) | | | 0.00 | | | | 0.00 | | | | 0.00 | | | | 0.00 | | | | 0.00 | |
| Less Distributions: | | | | | | | | | | | | | | | | | | | | |
| From net investment income | | | (0.20 | ) | | | (0.18 | ) | | | (0.42 | ) | | | (0.27 | ) | | | — | |
| From net realized gains | | | — | | | | — | | | | — | | | | — | | | | (0.08 | ) |
| Total distributions | | | (0.20 | ) | | | (0.18 | ) | | | (0.42 | ) | | | (0.27 | ) | | | (0.08 | ) |
| Net Asset Value, End of Year | | $ | 23.93 | | | $ | 19.79 | | | $ | 23.25 | | | $ | 20.13 | | | $ | 14.44 | |
| Total return | | | 21.99 | % | | | (14.13 | )% | | | 17.62 | % | | | 41.31 | % | | | (53.11 | )%(6) |
| | | | | | | | | | | | | | | | | | | | | |
| SUPPLEMENTAL DATA AND RATIOS | | | | | | | | | | | | | | | | | | | | |
| Net assets, end of year (000’s) | | $ | 192,478 | | | $ | 134,309 | | | $ | 142,261 | | | $ | 125,372 | | | $ | 128,129 | |
| Ratio of operating expenses to | | | | | | | | | | | | | | | | | | | | |
| average net assets: | | | | | | | | | | | | | | | | | | | | |
| Before expense reimbursement | | | 1.73 | % | | | 1.73 | % | | | 1.71 | % | | | 1.68 | % | | | 1.67 | % |
After expense reimbursement(4) | | | 1.44 | % | | | 1.44 | % | | | 1.44 | % | | | 1.44 | % | | | 1.46 | % |
| Ratio of net investment income | | | | | | | | | | | | | | | | | | | | |
| to average net assets: | | | | | | | | | | | | | | | | | | | | |
| Before expense reimbursement | | | 0.13 | % | | | 0.02 | % | | | 0.48 | % | | | 0.83 | % | | | 0.51 | % |
After expense reimbursement(4) | | | 0.42 | % | | | 0.31 | % | | | 0.75 | % | | | 1.07 | % | | | 0.72 | % |
Portfolio turnover rate(5) | | | 6 | % | | | 58 | % | | | 7 | % | | | 15 | % | | | 34 | % |
| | |
| (1) | Information presented relates to a share of capital stock outstanding for each period. |
| (2) | Net investment income per share represents net investment income divided by the average shares outstanding throughout the period. |
| (3) | Amount calculated is less than $0.005. |
| (4) | See Note #3, Investment Adviser, for the waiver and expense reimbursement discussion. |
| (5) | Portfolio turnover of The Paradigm Portfolio. |
| (6) | Includes adviser reimbursement from the net realized loss on the disposal of investments in violation of restrictions. The reimbursement comprises less than $0.005 of the NAVs for each class at the time of reimbursement and 0.03% of the total return for the Adviser Class C for the fiscal year ended December 31, 2008. There was no impact on the other classes. |
The accompanying notes are an integral part of these financial statements.
| KINETICS MUTUAL FUNDS, INC. — THE FEEDER FUNDS |
Financial Highlights — (Continued) |
| | | The Medical Fund | |
| | | For the Year Ended December 31, 2012 | | | For the Year Ended December 31, 2011 | | | No Load Class For the Year Ended December 31, 2010 | | | For the Year Ended December 31, 2009 | | | For the Year Ended December 31, 2008 | |
PER SHARE DATA:(1) | | | | | | | | | | | | | | | |
| Net Asset Value Beginning of Year | | $ | 18.75 | | | $ | 19.48 | | | $ | 18.77 | | | $ | 15.23 | | | $ | 19.82 | |
| Income from Investment Operations: | | | | | | | | | | | | | | | | | | | | |
Net investment income(2) | | | 0.33 | | | | 0.18 | | | | 0.10 | | | | 0.20 | | | | 0.19 | |
| Net realized and unrealized gain | | | | | | | | | | | | | | | | | | | | |
| (loss) on investments | | | 1.32 | | | | 0.82 | | | | 0.72 | | | | 3.51 | | | | (4.25 | ) |
| Total from investment | | | | | | | | | | | | | | | | | | | | |
| operations | | | 1.65 | | | | 1.00 | | | | 0.82 | | | | 3.71 | | | | (4.06 | ) |
| Redemption Fees | | | 0.00 | (3) | | | 0.00 | (3) | | | 0.00 | (3) | | | 0.01 | | | | 0.01 | |
| Less Distributions: | | | | | | | | | | | | | | | | | | | | |
| From net investment income | | | (0.36 | ) | | | (0.25 | ) | | | (0.11 | ) | | | (0.16 | ) | | | (0.16 | ) |
| From net realized gains | | | (2.22 | ) | | | (1.48 | ) | | | — | | | | (0.02 | ) | | | (0.38 | ) |
| Total distributions | | | (2.58 | ) | | | (1.73 | ) | | | (0.11 | ) | | | (0.18 | ) | | | (0.54 | ) |
| Net Asset Value, End of Year | | $ | 17.82 | | | $ | 18.75 | | | $ | 19.48 | | | $ | 18.77 | | | $ | 15.23 | |
| Total return | | | 8.86 | % | | | 5.11 | % | | | 4.30 | % | | | 24.47 | % | | | (20.42 | )% |
| | | | | | | | | | | | | | | | | | | | | |
| SUPPLEMENTAL DATA AND RATIOS | | | | | | | | | | | | | | | | | | | | |
| Net assets, end of year (000’s) | | $ | 14,254 | | | $ | 16,376 | | | $ | 25,777 | | | $ | 21,126 | | | $ | 15,727 | |
| Ratio of operating expenses to average | | | | | | | | | | | | | | | | | | | | |
| net assets: | | | | | | | | | | | | | | | | | | | | |
| Before expense reimbursement | | | 2.22 | % | | | 2.02 | % | | | 2.00 | % | | | 2.15 | % | | | 2.26 | % |
After expense reimbursement(4) | | | 1.39 | % | | | 1.39 | % | | | 1.39 | % | | | 1.39 | % | | | 1.41 | % |
| Ratio of net investment income (loss) | | | | | | | | | | | | | | | | | | | | |
| to average net assets: | | | | | | | | | | | | | | | | | | | | |
| Before expense reimbursement | | | 0.83 | % | | | 0.24 | % | | | (0.06 | )% | | | 0.42 | % | | | 0.18 | % |
After expense reimbursement(4) | | | 1.66 | % | | | 0.87 | % | | | 0.55 | % | | | 1.17 | % | | | 1.03 | % |
Portfolio turnover rate(5) | | | 0 | % | | | 5 | % | | | 3 | % | | | 13 | % | | | 28 | % |
| | |
| (1) | Information presented relates to a share of capital stock outstanding for each period. |
| (2) | Net investment income per share represents net investment income divided by the average shares outstanding throughout the period. |
| (3) | Amount calculated is less than $0.005. |
| (4) | See Note #3, Investment Adviser, for the waiver and expense reimbursement discussion. |
| (5) | Portfolio turnover of The Medical Portfolio. |
The accompanying notes are an integral part of these financial statements.
| KINETICS MUTUAL FUNDS, INC. — THE FEEDER FUNDS |
Financial Highlights — (Continued) |
| | | The Medical Fund | |
| | | For the Year Ended December 31, 2012 | | | For the Year Ended December 31, 2011 | | | Advisor Class A For the Year Ended December 31, 2010 | | | For the Year Ended December 31, 2009 | | | For the Year Ended December 31, 2008 | |
PER SHARE DATA:(1) | | | | | | | | | | | | | | | |
| Net Asset Value Beginning of Year | | $ | 18.29 | | | $ | 19.06 | | | $ | 18.36 | | | $ | 14.90 | | | $ | 19.39 | |
| Income from Investment Operations: | | | | | | | | | | | | | | | | | | | | |
Net investment income(2) | | | 0.27 | | | | 0.12 | | | | 0.05 | | | | 0.15 | | | | 0.13 | |
| Net realized and unrealized gain | | | | | | | | | | | | | | | | | | | | |
| (loss) on investments | | | 1.29 | | | | 0.80 | | | | 0.71 | | | | 3.44 | | | | (4.15 | ) |
| Total from investment | | | | | | | | | | | | | | | | | | | | |
| operations | | | 1.56 | | | | 0.92 | | | | 0.76 | | | | 3.59 | | | | (4.02 | ) |
| Redemption Fees | | | 0.00 | (3) | | | 0.00 | (3) | | | 0.00 | (3) | | | 0.01 | | | | 0.04 | |
| Less Distributions: | | | | | | | | | | | | | | | | | | | | |
| From net investment income | | | (0.30 | ) | | | (0.21 | ) | | | (0.06 | ) | | | (0.12 | ) | | | (0.13 | ) |
| From net realized gains | | | (2.22 | ) | | | (1.48 | ) | | | — | | | | (0.02 | ) | | | (0.38 | ) |
| Total distributions | | | (2.52 | ) | | | (1.69 | ) | | | (0.06 | ) | | | (0.14 | ) | | | (0.51 | ) |
| Net Asset Value, End of Year | | $ | 17.33 | | | $ | 18.29 | | | $ | 19.06 | | | $ | 18.36 | | | $ | 14.90 | |
Total return(4) | | | 8.60 | % | | | 4.79 | % | | | 4.13 | % | | | 24.17 | % | | | (20.49 | )% |
| | | | | | | | | | | | | | | | | | | | | |
| SUPPLEMENTAL DATA AND RATIOS | | | | | | | | | | | | | | | | | | | | |
| Net assets, end of year (000’s) | | $ | 2,583 | | | $ | 3,240 | | | $ | 4,207 | | | $ | 4,347 | | | $ | 2,941 | |
| Ratio of operating expenses to | | | | | | | | | | | | | | | | | | | | |
| average net assets: | | | | | | | | | | | | | | | | | | | | |
| Before expense reimbursement | | | 2.47 | % | | | 2.27 | % | | | 2.25 | % | | | 2.40 | % | | | 2.51 | % |
After expense reimbursement(5) | | | 1.64 | % | | | 1.64 | % | | | 1.64 | % | | | 1.64 | % | | | 1.66 | % |
| Ratio of net investment income | | | | | | | | | | | | | | | | | | | | |
| (loss) to average net assets: | | | | | | | | | | | | | | | | | | | | |
| Before expense reimbursement | | | 0.58 | % | | | (0.01 | )% | | | (0.31 | )% | | | 0.17 | % | | | (0.07 | )% |
After expense reimbursement(5) | | | 1.41 | % | | | 0.62 | % | | | 0.30 | % | | | 0.92 | % | | | 0.78 | % |
Portfolio turnover rate(6) | | | 0 | % | | | 5 | % | | | 3 | % | | | 13 | % | | | 28 | % |
| | |
| (1) | Information presented relates to a share of capital stock outstanding for each period. |
| (2) | Net investment income per share represents net investment income divided by the average shares outstanding throughout the period. |
| (3) | Amount calculated is less than $0.005. |
| (4) | The total return calculation does not reflect the 5.75% front end sales charge on Advisor Class A shares. |
| (5) | See Note #3, Investment Adviser, for the waiver and expense reimbursement discussion. |
| (6) | Portfolio turnover of The Medical Portfolio. |
The accompanying notes are an integral part of these financial statements.
| KINETICS MUTUAL FUNDS, INC. — THE FEEDER FUNDS |
Financial Highlights — (Continued) |
| | | The Medical Fund | |
| | | For the Year Ended December 31, 2012 | | | For the Year Ended December 31, 2011 | | | Advisor Class C For the Year Ended December 31, 2010 | | | For the Year Ended December 31, 2009 | | | For the Year Ended December 31, 2008 | |
PER SHARE DATA:(1) | | | | | | | | | | | | | | | |
| Net Asset Value Beginning of Year | | $ | 18.15 | | | $ | 18.90 | | | $ | 18.27 | | | $ | 14.83 | | | $ | 19.34 | |
| Income from Investment Operations: | | | | | | | | | | | | | | | | | | | | |
Net investment income (loss)(2) | | | 0.17 | | | | 0.02 | | | | (0.04 | ) | | | 0.07 | | | | 0.05 | |
| Net realized and unrealized gain | | | | | | | | | | | | | | | | | | | | |
| (loss) on investments | | | 1.29 | | | | 0.80 | | | | 0.69 | | | | 3.41 | | | | (4.13 | ) |
| Total from investment | | | | | | | | | | | | | | | | | | | | |
| operations | | | 1.46 | | | | 0.82 | | | | 0.65 | | | | 3.48 | | | | (4.08 | ) |
| Redemption Fees | | | — | | | | 0.00 | (3) | | | — | | | | 0.00 | (3) | | | 0.02 | |
| Less Distributions: | | | | | | | | | | | | | | | | | | | | |
| From net investment income | | | (0.20 | ) | | | (0.09 | ) | | | (0.02 | ) | | | (0.02 | ) | | | (0.07 | ) |
| From net realized gains | | | (2.22 | ) | | | (1.48 | ) | | | — | | | | (0.02 | ) | | | (0.38 | ) |
| Total distributions | | | (2.42 | ) | | | (1.57 | ) | | | (0.02 | ) | | | (0.04 | ) | | | (0.45 | ) |
| Net Asset Value, End of Year | | $ | 17.19 | | | $ | 18.15 | | | $ | 18.90 | | | $ | 18.27 | | | $ | 14.83 | |
| Total return | | | 8.08 | % | | | 4.32 | % | | | 3.55 | % | | | 23.50 | % | | | (20.97 | )% |
| | | | | | | | | | | | | | | | | | | | | |
| SUPPLEMENTAL DATA AND RATIOS | | | | | | | | | | | | | | | | | | | | |
| Net assets, end of year (000’s) | | $ | 450 | | | $ | 580 | | | $ | 692 | | | $ | 454 | | | $ | 314 | |
| Ratio of operating expenses to | | | | | | | | | | | | | | | | | | | | |
| average net assets: | | | | | | | | | | | | | | | | | | | | |
| Before expense reimbursement | | | 2.97 | % | | | 2.77 | % | | | 2.75 | % | | | 2.90 | % | | | 3.01 | % |
After expense reimbursement(4) | | | 2.14 | % | | | 2.14 | % | | | 2.14 | % | | | 2.14 | % | | | 2.16 | % |
| Ratio of net investment income | | | | | | | | | | | | | | | | | | | | |
| (loss) to average net assets: | | | | | | | | | | | | | | | | | | | | |
| Before expense reimbursement | | | 0.08 | % | | | (0.51 | )% | | | (0.81 | )% | | | (0.33 | )% | | | (0.57 | )% |
After expense reimbursement(4) | | | 0.91 | % | | | 0.12 | % | | | (0.20 | )% | | | 0.42 | % | | | 0.28 | % |
Portfolio turnover rate(5) | | | 0 | % | | | 5 | % | | | 3 | % | | | 13 | % | | | 28 | % |
| | |
| (1) | Information presented relates to a share of capital stock outstanding for each period. |
| (2) | Net investment income per share represents net investment income divided by the average shares outstanding throughout the period. |
| (3) | Amount calculated is less than $0.005. |
| (4) | See Note #3, Investment Adviser, for the waiver and expense reimbursement discussion. |
| (5) | Portfolio turnover of The Medical Portfolio. |
The accompanying notes are an integral part of these financial statements.
| KINETICS MUTUAL FUNDS, INC. — THE FEEDER FUNDS |
Financial Highlights — (Continued) |
| | | The Small Cap Opportunities Fund | |
| | | For the Year Ended December 31, 2012 | | | For the Year Ended December 31, 2011 | | | No Load Class For the Year Ended December 31, 2010 | | | For the Year Ended December 31, 2009 | | | For the Year Ended December 31, 2008 | |
PER SHARE DATA:(1) | | | | | | | | | | | | | | | |
| Net Asset Value Beginning of Year | | $ | 19.85 | | | $ | 23.32 | | | $ | 20.83 | | | $ | 13.17 | | | $ | 31.92 | |
| Income from Investment Operations: | | | | | | | | | | | | | | | | | | | | |
Net investment income (loss)(2) | | | 0.01 | | | | (0.04 | ) | | | (0.04 | ) | | | (0.04 | ) | | | 0.05 | |
| Net realized and unrealized gain | | | | | | | | | | | | | | | | | | | | |
| (loss) on investments | | | 5.31 | | | | (3.15 | ) | | | 2.93 | | | | 7.70 | | | | (18.53 | )(6) |
| Total from investment | | | | | | | | | | | | | | | | | | | | |
| operations | | | 5.32 | | | | (3.19 | ) | | | 2.89 | | | | 7.66 | | | | (18.48 | ) |
Redemption Fees(3) | | | 0.00 | | | | 0.00 | | | | 0.00 | | | | 0.00 | | | | 0.00 | |
| Less Distributions: | | | | | | | | | | | | | | | | | | | | |
| From net investment income | | | — | | | | (0.28 | ) | | | (0.40 | ) | | | — | | | | — | |
| From net realized gains | | | — | | | | — | | | | — | | | | — | | | | (0.27 | ) |
| Total distributions | | | — | | | | (0.28 | ) | | | (0.40 | ) | | | — | | | | (0.27 | ) |
| Net Asset Value, End of Year | | $ | 25.17 | | | $ | 19.85 | | | $ | 23.32 | | | $ | 20.83 | | | $ | 13.17 | |
| Total return | | | 26.74 | % | | | (13.65 | )% | | | 13.86 | % | | | 58.16 | % | | | (57.88 | )%(6) |
| | | | | | | | | | | | | | | | | | | | | |
| SUPPLEMENTAL DATA AND RATIOS | | | | | | | | | | | | | | | | | | | | |
| Net assets, end of year (000’s) | | $ | 63,947 | | | $ | 67,798 | | | $ | 130,279 | | | $ | 161,205 | | | $ | 126,971 | |
| Ratio of operating expenses to | | | | | | | | | | | | | | | | | | | | |
| average net assets: | | | | | | | | | | | | | | | | | | | | |
| Before expense reimbursement | | | 1.96 | % | | | 1.90 | % | | | 1.86 | % | | | 1.86 | % | | | 1.79 | % |
After expense reimbursement(4) | | | 1.64 | % | | | 1.64 | % | | | 1.64 | % | | | 1.64 | % | | | 1.67 | % |
| Ratio of net investment income | | | | | | | | | | | | | | | | | | | | |
| (loss) to average net assets: | | | | | | | | | | | | | | | | | | | | |
| Before expense reimbursement | | | (0.25 | )% | | | (0.44 | )% | | | (0.42 | )% | | | (0.48 | )% | | | 0.09 | % |
After expense reimbursement(4) | | | 0.07 | % | | | (0.18 | )% | | | (0.20 | )% | | | (0.26 | )% | | | 0.21 | % |
Portfolio turnover rate(5) | | | 22 | % | | | 47 | % | | | 4 | % | | | 4 | % | | | 16 | % |
| | |
| (1) | Information presented relates to a share of capital stock outstanding for each period. |
| (2) | Net investment income per share represents net investment income divided by the average shares outstanding throughout the period. |
| (3) | Amount calculated is less than $0.005. |
| (4) | See Note #3, Investment Adviser, for the waiver and expense reimbursement discussion. |
| (5) | Portfolio turnover of The Small Cap Opportunities Portfolio. |
| (6) | Includes adviser reimbursement from the net realized loss on the disposal of investments in violation of restrictions. The reimbursement comprises less than $0.005 of the NAVs for each class at the time of reimbursement and 0.03% of the total return for the Adviser Class C for the fiscal year ended December 31, 2008. There was no impact on the other classes. |
The accompanying notes are an integral part of these financial statements.
| KINETICS MUTUAL FUNDS, INC. — THE FEEDER FUNDS |
Financial Highlights — (Continued) |
| | | The Small Cap Opportunities Fund | |
| | | For the Year Ended December 31, 2012 | | | For the Year Ended December 31, 2011 | | | Advisor Class A For the Year Ended December 31, 2010 | | | For the Year Ended December 31, 2009 | | | For the Year Ended December 31, 2008 | |
PER SHARE DATA:(1) | | | | | | | | | | | | | | | |
| Net Asset Value Beginning of Year | | $ | 19.59 | | | $ | 22.98 | | | $ | 20.53 | | | $ | 13.01 | | | $ | 31.63 | |
| Income from Investment Operations: | | | | | | | | | | | | | | | | | | | | |
Net investment loss(2) | | | (0.04 | ) | | | (0.10 | ) | | | (0.09 | ) | | | (0.08 | ) | | | (0.01 | ) |
| Net realized and unrealized gain | | | | | | | | | | | | | | | | | | | | |
| (loss) on investments | | | 5.22 | | | | (3.08 | ) | | | 2.87 | | | | 7.60 | | | | (18.34 | )(7) |
| Total from investment | | | | | | | | | | | | | | | | | | | | |
| operations | | | 5.18 | | | | (3.18 | ) | | | 2.78 | | | | 7.52 | | | | (18.35 | ) |
Redemption Fees(3) | | | 0.00 | | | | 0.00 | | | | 0.00 | | | | 0.00 | | | | 0.00 | |
| Less Distributions: | | | | | | | | | | | | | | | | | | | | |
| From net investment income | | | — | | | | (0.21 | ) | | | (0.33 | ) | | | — | | | | — | |
| From net realized gains | | | — | | | | — | | | | — | | | | — | | | | (0.27 | ) |
| Total distributions | | | — | | | | (0.21 | ) | | | (0.33 | ) | | | — | | | | (0.27 | ) |
| Net Asset Value, End of Year | | $ | 24.77 | | | $ | 19.59 | | | $ | 22.98 | | | $ | 20.53 | | | $ | 13.01 | |
Total return(4) | | | 26.44 | % | | | (13.85 | )% | | | 13.56 | % | | | 57.80 | % | | | (58.00 | )%(7) |
| | | | | | | | | | | | | | | | | | | | | |
| SUPPLEMENTAL DATA AND RATIOS | | | | | | | | | | | | | | | | | | | | |
| Net assets, end of year (000’s) | | $ | 7,558 | | | $ | 7,250 | | | $ | 11,509 | | | $ | 14,244 | | | $ | 12,090 | |
| Ratio of operating expenses to | | | | | | | | | | | | | | | | | | | | |
| average net assets: | | | | | | | | | | | | | | | | | | | | |
| Before expense reimbursement | | | 2.21 | % | | | 2.15 | % | | | 2.11 | % | | | 2.11 | % | | | 2.04 | % |
After expense reimbursement(5) | | | 1.89 | % | | | 1.89 | % | | | 1.89 | % | | | 1.89 | % | | | 1.92 | % |
| Ratio of net investment loss | | | | | | | | | | | | | | | | | | | | |
| to average net assets: | | | | | | | | | | | | | | | | | | | | |
| Before expense reimbursement | | | (0.50 | )% | | | (0.69 | )% | | | (0.67 | )% | | | (0.73 | )% | | | (0.16 | )% |
After expense reimbursement(5) | | | (0.18 | )% | | | (0.43 | )% | | | (0.45 | )% | | | (0.51 | )% | | | (0.04 | )% |
Portfolio turnover rate(6) | | | 22 | % | | | 47 | % | | | 4 | % | | | 4 | % | | | 16 | % |
| | |
| (1) | Information presented relates to a share of capital stock outstanding for each period. |
| (2) | Net investment income per share represents net investment income divided by the average shares outstanding throughout the period. |
| (3) | Amount calculated is less than $0.005. |
| (4) | The total return calculation does not reflect the 5.75% front end sales charge on Advisor Class A shares. |
| (5) | See Note #3, Investment Adviser, for the waiver and expense reimbursement discussion. |
| (6) | Portfolio turnover of The Small Cap Opportunities Portfolio. |
| (7) | Includes adviser reimbursement from the net realized loss on the disposal of investments in violation of restrictions. The reimbursement comprises less than $0.005 of the NAVs for each class at the time of reimbursement and 0.03% of the total return for the Adviser Class C for the fiscal year ended December 31, 2008. There was no impact on the other classes. |
The accompanying notes are an integral part of these financial statements.
| KINETICS MUTUAL FUNDS, INC. — THE FEEDER FUNDS |
Financial Highlights — (Continued) |
| | | The Small Cap Opportunities Fund | |
| | | For the Year Ended December 31, 2012 | | | For the Year Ended December 31, 2011 | | | Advisor Class C For the Year Ended December 31, 2010 | | | For the Year Ended December 31, 2009 | | | For the Year Ended December 31, 2008 | |
PER SHARE DATA:(1) | | | | | | | | | | | | | | | |
| Net Asset Value Beginning of Year | | $ | 19.36 | | | $ | 22.68 | | | $ | 20.28 | | | $ | 12.92 | | | $ | 31.57 | |
| Income from Investment Operations: | | | | | | | | | | | | | | | | | | | | |
Net investment loss(2) | | | (0.15 | ) | | | (0.20 | ) | | | (0.20 | ) | | | (0.16 | ) | | | (0.12 | ) |
| Net realized and unrealized gain | | | | | | | | | | | | | | | | | | | | |
| (loss) on investments | | | 5.14 | | | | (3.04 | ) | | | 2.84 | | | | 7.52 | | | | (18.26 | )(6) |
| Total from investment | | | | | | | | | | | | | | | | | | | | |
| operations | | | 4.99 | | | | (3.24 | ) | | | 2.64 | | | | 7.36 | | | | 18.38 | |
| Redemption Fees | | | — | | | | — | | | | — | | | | 0.00 | (3) | | | 0.00 | (3) |
| Less Distributions: | | | | | | | | | | | | | | | | | | | | |
| From net investment income | | | — | | | | (0.08 | ) | | | (0.24 | ) | | | — | | | | — | |
| From net realized gains | | | — | | | | — | | | | — | | | | — | | | | (0.27 | ) |
| Total distributions | | | — | | | | (0.08 | ) | | | (0.24 | ) | | | — | | | | (0.27 | ) |
| Net Asset Value, End of Year | | $ | 24.35 | | | $ | 19.36 | | | $ | 22.68 | | | $ | 20.28 | | | $ | 12.92 | |
| Total return | | | 25.77 | % | | | (14.29 | )% | | | 13.00 | % | | | 56.97 | % | | | (58.20 | )%(6) |
| | | | | | | | | | | | | | | | | | | | | |
| SUPPLEMENTAL DATA AND RATIOS | | | | | | | | | | | | | | | | | | | | |
| Net assets, end of year (000’s) | | $ | 2,536 | | | $ | 2,440 | | | $ | 3,450 | | | $ | 4,445 | | | $ | 2,871 | |
| Ratio of operating expenses to | | | | | | | | | | | | | | | | | | | | |
| average net assets: | | | | | | | | | | | | | | | | | | | | |
| Before expense reimbursement | | | 2.71 | % | | | 2.65 | % | | | 2.61 | % | | | 2.61 | % | | | 2.54 | % |
After expense reimbursement(4) | | | 2.39 | % | | | 2.39 | % | | | 2.39 | % | | | 2.39 | % | | | 2.42 | % |
| Ratio of net investment loss | | | | | | | | | | | | | | | | | | | | |
| to average net assets: | | | | | | | | | | | | | | | | | | | | |
| Before expense reimbursement | | | (1.00 | )% | | | (1.19 | )% | | | (1.17 | )% | | | (1.23 | )% | | | (0.66 | )% |
After expense reimbursement(4) | | | (0.68 | )% | | | (0.93 | )% | | | (0.95 | )% | | | (1.01 | )% | | | (0.54 | )% |
Portfolio turnover rate(5) | | | 22 | % | | | 47 | % | | | 4 | % | | | 4 | % | | | 16 | % |
| | |
| (1) | Information presented relates to a share of capital stock outstanding for each period. |
| (2) | Net investment income per share represents net investment income divided by the average shares outstanding throughout the period. |
| (3) | Amount calculated is less than $0.005. |
| (4) | See Note #3, Investment Adviser, for the waiver and expense reimbursement discussion. |
| (5) | Portfolio turnover of The Small Cap Opportunities Portfolio. |
| (6) | Includes adviser reimbursement from the net realized loss on the disposal of investments in violation of restrictions. The reimbursement comprises less than $0.005 of the NAVs for each class at the time of reimbursement and 0.03% of the total return for the Adviser Class C for the fiscal year ended December 31, 2008. There was no impact on the other classes. |
The accompanying notes are an integral part of these financial statements.
| KINETICS MUTUAL FUNDS, INC. — THE FEEDER FUNDS |
Financial Highlights — (Continued) |
| | | The Small Cap Opportunities Fund | |
| | | For the Year Ended December 31, 2012 | | | For the Year Ended December 31, 2011 | | | Institutional Class For the Year Ended December 31, 2010 | | | For the Year Ended December 31, 2009 | | | For the Year Ended December 31, 2008 | |
PER SHARE DATA:(1) | | | | | | | | | | | | | | | |
| Net Asset Value Beginning of Year | | $ | 19.93 | | | $ | 23.45 | | | $ | 20.90 | | | $ | 13.19 | | | $ | 31.92 | |
| Income from Investment Operations: | | | | | | | | | | | | | | | | | | | | |
Net investment income (loss)(2) | | | 0.06 | | | | 0.00 | (3) | | | 0.00 | (3) | | | (0.01 | ) | | | 0.10 | |
| Net realized and unrealized gain | | | | | | | | | | | | | | | | | | | | |
| (loss) on investments | | | 5.33 | | | | (3.17 | ) | | | 2.95 | | | | 7.72 | | | | (18.56 | )(6) |
| Total from investment | | | | | | | | | | | | | | | | | | | | |
| operations | | | 5.39 | | | | (3.17 | ) | | | 2.95 | | | | 7.71 | | | | (18.46 | ) |
Redemption Fees(3) | | | 0.00 | | | | 0.00 | | | | 0.00 | | | | 0.00 | | | | 0.00 | |
| Less Distributions: | | | | | | | | | | | | | | | | | | | | |
| From net investment income | | | — | | | | (0.35 | ) | | | (0.40 | ) | | | — | | | | — | |
| From net realized gains | | | — | | | | — | | | | — | | | | — | | | | (0.27 | ) |
| Total distributions | | | — | | | | (0.35 | ) | | | (0.40 | ) | | | — | | | | (0.27 | ) |
| Net Asset Value, End of Year | | $ | 25.32 | | | $ | 19.93 | | | $ | 23.45 | | | $ | 20.90 | | | $ | 13.19 | |
| Total return | | | 27.04 | % | | | (13.51 | )% | | | 14.10 | % | | | 58.45 | % | | | (57.82 | )%(6) |
| | | | | | | | | | | | | | | | | | | | | |
| SUPPLEMENTAL DATA AND RATIOS | | | | | | | | | | | | | | | | | | | | |
| Net assets, end of year (000’s) | | $ | 7,482 | | | $ | 5,498 | | | $ | 9,808 | | | $ | 19,749 | | | $ | 68,408 | |
| Ratio of operating expenses to | | | | | | | | | | | | | | | | | | | | |
| average net assets: | | | | | | | | | | | | | | | | | | | | |
| Before expense reimbursement | | | 1.91 | % | | | 1.85 | % | | | 1.81 | % | | | 1.81 | % | | | 1.74 | % |
After expense reimbursement(4) | | | 1.44 | % | | | 1.44 | % | | | 1.44 | % | | | 1.44 | % | | | 1.47 | % |
| Ratio of net investment income (loss) | | | | | | | | | | | | | | | | | | | | |
| to average net assets: | | | | | | | | | | | | | | | | | | | | |
| Before expense reimbursement | | | (0.20 | )% | | | (0.39 | )% | | | (0.37 | )% | | | (0.43 | )% | | | 0.14 | % |
After expense reimbursement(4) | | | 0.27 | % | | | 0.02 | % | | | 0.00 | % | | | (0.06 | )% | | | 0.41 | % |
Portfolio turnover rate(5) | | | 22 | % | | | 47 | % | | | 4 | % | | | 4 | % | | | 16 | % |
| | |
| (1) | Information presented relates to a share of capital stock outstanding for each period. |
| (2) | Net investment income per share represents net investment income divided by the average shares outstanding throughout the period. |
| (3) | Amount calculated is less than $0.005. |
| (4) | See Note #3, Investment Adviser, for the waiver and expense reimbursement discussion. |
| (5) | Portfolio turnover of The Small Cap Opportunities Portfolio. |
| (6) | Includes adviser reimbursement from the net realized loss on the disposal of investments in violation of restrictions. The reimbursement comprises less than $0.005 of the NAVs for each class at the time of reimbursement and 0.03% of the total return for the Adviser Class C for the fiscal year ended December 31, 2008. There was no impact on the other classes. |
The accompanying notes are an integral part of these financial statements.
| KINETICS MUTUAL FUNDS, INC. — THE FEEDER FUNDS |
Financial Highlights — (Continued) |
| | | The Market Opportunities Fund | |
| | | For the Year Ended December 31, 2012 | | | For the Year Ended December 31, 2011 | | | No Load Class For the Year Ended December 31, 2010 | | | For the Year Ended December 31, 2009 | | | For the Year Ended December 31, 2008 | |
PER SHARE DATA:(1) | | | | | | | | | | | | | | | |
| Net Asset Value Beginning of Year | | $ | 10.45 | | | $ | 11.46 | | | $ | 10.84 | | | $ | 7.22 | | | $ | 16.12 | |
| Income from Investment Operations: | | | | | | | | | | | | | | | | | | | | |
Net investment income(2) | | | 0.03 | | | | 0.01 | | | | 0.04 | | | | 0.00 | (3) | | | 0.11 | |
| Net realized and unrealized gain | | | | | | | | | | | | | | | | | | | | |
| (loss) on investments | | | 1.80 | | | | (0.91 | ) | | | 1.18 | | | | 3.62 | | | | (9.02 | ) |
| Payment by adviser | | | — | | | | — | | | | — | | | | — | | | | 0.06 | (6) |
| Total from investment | | | | | | | | | | | | | | | | | | | | |
| operations | | | 1.83 | | | | (0.90 | ) | | | 1.22 | | | | 3.62 | | | | (8.85 | ) |
| Redemption Fees | | | 0.00 | (3) | | | 0.00 | (3) | | | 0.00 | (3) | | | 0.01 | | | | 0.01 | |
| Less Distributions: | | | | | | | | | | | | | | | | | | | | |
| From net investment income | | | (0.20 | ) | | | (0.11 | ) | | | (0.60 | ) | | | (0.01 | ) | | | (0.06 | ) |
| Total distributions | | | (0.20 | ) | | | (0.11 | ) | | | (0.60 | ) | | | (0.01 | ) | | | (0.06 | ) |
| Net Asset Value, End of Year | | $ | 12.08 | | | $ | 10.45 | | | $ | 11.46 | | | $ | 10.84 | | | $ | 7.22 | |
| Total return | | | 17.52 | % | | | (7.85 | )% | | | 11.31 | % | | | 50.21 | % | | | (54.82 | )%(6) |
| | | | | | | | | | | | | | | | | | | | | |
| SUPPLEMENTAL DATA AND RATIOS | | | | | | | | | | | | | | | | | | | | |
| Net assets, end of year (000’s) | | $ | 32,929 | | | $ | 30,191 | | | $ | 38,562 | | | $ | 41,254 | | | $ | 34,246 | |
| Ratio of operating expenses to | | | | | | | | | | | | | | | | | | | | |
| average net assets: | | | | | | | | | | | | | | | | | | | | |
| Before expense reimbursement | | | 1.97 | % | | | 1.93 | % | | | 1.92 | % | | | 1.93 | % | | | 1.82 | % |
After expense reimbursement(4) | | | 1.64 | % | | | 1.64 | % | | | 1.64 | % | | | 1.64 | % | | | 1.66 | % |
| Ratio of net investment income (loss) | | | | | | | | | | | | | | | | | | | | |
| to average net assets: | | | | | | | | | | | | | | | | | | | | |
| Before expense reimbursement | | | (0.10 | )% | | | (0.20 | )% | | | 0.06 | % | | | (0.25 | )% | | | 0.78 | % |
After expense reimbursement(4) | | | 0.23 | % | | | 0.09 | % | | | 0.34 | % | | | 0.04 | % | | | 0.94 | % |
Portfolio turnover rate(5) | | | 26 | % | | | 14 | % | | | 12 | % | | | 14 | % | | | 77 | % |
| | |
| (1) | Information presented relates to a share of capital stock outstanding for each period. |
| (2) | Net investment income per share represents net investment income divided by the average shares outstanding throughout the period. |
| (3) | Amount calculated is less than $0.005. |
| (4) | See Note #3, Investment Adviser, for the waiver and expense reimbursement discussion. |
| (5) | Portfolio turnover of The Market Opportunities Portfolio. |
| (6) | Includes adviser reimbursement from the net realized loss on the disposal of investments in violation of restrictions. This reimbursement contributed 0.38%, 0.37%, 0.38% and 0.44% to the returns of the No Load Class, the Advisor Class A, the Advisor Class C and the Institutional Class, respectively, for the year ended December 31, 2008. |
The accompanying notes are an integral part of these financial statements.
| KINETICS MUTUAL FUNDS, INC. — THE FEEDER FUNDS |
Financial Highlights — (Continued) |
| | | The Market Opportunities Fund | |
| | | For the Year Ended December 31, 2012 | | | For the Year Ended December 31, 2011 | | | Advisor Class A For the Year Ended December 31, 2010 | | | For the Year Ended December 31, 2009 | | | For the Year Ended December 31, 2008 | |
PER SHARE DATA:(1) | | | | | | | | | | | | | | | |
| Net Asset Value Beginning of Year | | $ | 10.43 | | | $ | 11.43 | | | $ | 10.80 | | | $ | 7.22 | | | $ | 16.07 | |
| Income from Investment Operations: | | | | | | | | | | | | | | | | | | | | |
Net investment income (loss)(2) | | | 0.00 | (3) | | | (0.02 | ) | | | 0.01 | | | | (0.02 | ) | | | 0.08 | |
| Net realized and unrealized gain | | | | | | | | | | | | | | | | | | | | |
| (loss) on investments | | | 1.80 | | | | (0.90 | ) | | | 1.19 | | | | 3.61 | | | | (8.97 | ) |
| Payment by adviser | | | — | | | | — | | | | — | | | | — | | | | 0.06 | (7) |
| Total from investment | | | | | | | | | | | | | | | | | | | | |
| operations | | | 1.80 | | | | (0.92 | ) | | | 1.20 | | | | 3.59 | | | | (8.83 | ) |
| Redemption Fees | | | 0.00 | (3) | | | 0.00 | (3) | | | 0.00 | (3) | | | 0.00 | (3) | | | 0.00 | (3) |
| Less Distributions: | | | | | | | | | | | | | | | | | | | | |
| From net investment income | | | (0.16 | ) | | | (0.08 | ) | | | (0.57 | ) | | | (0.01 | ) | | | (0.02 | ) |
| Total distributions | | | (0.16 | ) | | | (0.08 | ) | | | (0.57 | ) | | | (0.01 | ) | | | (0.02 | ) |
| Net Asset Value, End of Year | | $ | 12.07 | | | $ | 10.43 | | | $ | 11.43 | | | $ | 10.80 | | | $ | 7.22 | |
Total return(4) | | | 17.26 | % | | | (8.08 | )% | | | 11.11 | % | | | 49.66 | % | | | (54.91 | )%(7) |
| | | | | | | | | | | | | | | | | | | | | |
| SUPPLEMENTAL DATA AND RATIOS | | | | | | | | | | | | | | | | | | | | |
| Net assets, end of year (000’s) | | $ | 6,518 | | | $ | 8,600 | | | $ | 14,167 | | | $ | 18,770 | | | $ | 18,514 | |
| Ratio of operating expenses to | | | | | | | | | | | | | | | | | | | | |
| average net assets: | | | | | | | | | | | | | | | | | | | | |
| Before expense reimbursement | | | 2.22 | % | | | 2.18 | % | | | 2.17 | % | | | 2.18 | % | | | 2.07 | % |
After expense reimbursement(5) | | | 1.89 | % | | | 1.89 | % | | | 1.89 | % | | | 1.89 | % | | | 1.91 | % |
| Ratio of net investment income (loss) | | | | | | | | | | | | | | | | | | | | |
| to average net assets: | | | | | | | | | | | | | | | | | | | | |
| Before expense reimbursement | | | (0.35 | )% | | | (0.45 | )% | | | (0.19 | )% | | | (0.50 | )% | | | 0.53 | % |
After expense reimbursement(5) | | | (0.02 | )% | | | (0.16 | )% | | | 0.09 | % | | | (0.21 | )% | | | 0.69 | % |
Portfolio turnover rate(6) | | | 26 | % | | | 14 | % | | | 12 | % | | | 14 | % | | | 77 | % |
| | |
| (1) | Information presented relates to a share of capital stock outstanding for each period. |
| (2) | Net investment income per share represents net investment income divided by the average shares outstanding throughout the period. |
| (3) | Amount calculated is less than $0.005. |
| (4) | The total return calculation does not reflect the 5.75% front end sales charge on Advisor Class A shares. |
| (5) | See Note #3, Investment Adviser, for the waiver and expense reimbursement discussion. |
| (6) | Portfolio turnover of The Market Opportunities Portfolio. |
| (7) | Includes adviser reimbursement from the net realized loss on the disposal of investments in violation of restrictions. This reimbursement contributed 0.38%, 0.37%, 0.38% and 0.44% to the returns of the No Load Class, the Advisor Class A, the Advisor Class C and the Institutional Class, respectively, for the year ended December 31, 2008. |
The accompanying notes are an integral part of these financial statements.
| KINETICS MUTUAL FUNDS, INC. — THE FEEDER FUNDS |
Financial Highlights — (Continued) |
| | | The Market Opportunities Fund | |
| | | For the Year Ended December 31, 2012 | | | For the Year Ended December 31, 2011 | | | Advisor Class C For the Year Ended December 31, 2010 | | | For the Year Ended December 31, 2009 | | | For the Year Ended December 31, 2008 | |
PER SHARE DATA:(1) | | | | | | | | | | | | | | | |
| Net Asset Value Beginning of Year | | $ | 10.32 | | | $ | 11.30 | | | $ | 10.69 | | | $ | 7.17 | | | $ | 16.01 | |
| Income from Investment Operations: | | | | | | | | | | | | | | | | | | | | |
Net investment income (loss)(2) | | | (0.06 | ) | | | (0.08 | ) | | | (0.04 | ) | | | (0.06 | ) | | | 0.02 | |
| Net realized and unrealized gain | | | | | | | | | | | | | | | | | | | | |
| (loss) on investments | | | 1.78 | | | | (0.88 | ) | | | 1.17 | | | | 3.59 | | | | (8.91 | ) |
| Payment by adviser | | | — | | | | — | | | | — | | | | — | | | | 0.06 | (6) |
| Total from investment | | | | | | | | | | | | | | | | | | | | |
| operations | | | 1.72 | | | | (0.96 | ) | | | 1.13 | | | | 3.53 | | | | (8.83 | ) |
| Redemption Fees | | | 0.00 | (3) | | | — | | | | 0.00 | (3) | | | 0.00 | (3) | | | 0.00 | (3) |
| Less Distributions: | | | | | | | | | | | | | | | | | | | | |
| From net investment income | | | (0.10 | ) | | | (0.02 | ) | | | (0.52 | ) | | | (0.01 | ) | | | (0.01 | ) |
| Total distributions | | | (0.10 | ) | | | (0.02 | ) | | | (0.52 | ) | | | (0.01 | ) | | | (0.01 | ) |
| Net Asset Value, End of Year | | $ | 11.94 | | | $ | 10.32 | | | $ | 11.30 | | | $ | 10.69 | | | $ | 7.17 | |
| Total return | | | 16.70 | % | | | (8.51 | )% | | | 10.54 | % | | | 49.17 | % | | | (55.13 | )%(6) |
| | | | | | | | | | | | | | | | | | | | | |
| SUPPLEMENTAL DATA AND RATIOS | | | | | | | | | | | | | | | | | | | | |
| Net assets, end of year (000’s) | | $ | 3,932 | | | $ | 4,233 | | | $ | 5,569 | | | $ | 6,055 | | | $ | 771 | |
| Ratio of operating expenses to | | | | | | | | | | | | | | | | | | | | |
| average net assets: | | | | | | | | | | | | | | | | | | | | |
| Before expense reimbursement | | | 2.72 | % | | | 2.68 | % | | | 2.67 | % | | | 2.68 | % | | | 2.57 | % |
After expense reimbursement(4) | | | 2.39 | % | | | 2.39 | % | | | 2.39 | % | | | 2.39 | % | | | 2.41 | % |
| Ratio of net investment income (loss) | | | | | | | | | | | | | | | | | | | | |
| to average net assets: | | | | | | | | | | | | | | | | | | | | |
| Before expense reimbursement | | | (0.85 | )% | | | (0.95 | )% | | | (0.69 | )% | | | (1.00 | )% | | | 0.03 | % |
After expense reimbursement(4) | | | (0.52 | )% | | | (0.66 | )% | | | (0.41 | )% | | | (0.71 | )% | | | 0.19 | % |
Portfolio turnover rate(5) | | | 26 | % | | | 14 | % | | | 12 | % | | | 14 | % | | | 77 | % |
| | |
| (1) | Information presented relates to a share of capital stock outstanding for each period. |
| (2) | Net investment income per share represents net investment income divided by the average shares outstanding throughout the period. |
| (3) | Amount calculated is less than $0.005. |
| (4) | See Note #3, Investment Adviser, for the waiver and expense reimbursement discussion. |
| (5) | Portfolio turnover of The Market Opportunities Portfolio. |
| (6) | Includes adviser reimbursement from the net realized loss on the disposal of investments in violation of restrictions. This reimbursement contributed 0.38%, 0.37%, 0.38% and 0.44% to the returns of the No Load Class, the Advisor Class A, the Advisor Class C and the Institutional Class, respectively, for the year ended December 31, 2008. |
The accompanying notes are an integral part of these financial statements.
| KINETICS MUTUAL FUNDS, INC. — THE FEEDER FUNDS |
Financial Highlights — (Continued) |
| | | The Market Opportunities Fund | |
| | | For the Year Ended December 31, 2012 | | | For the Year Ended December 31, 2011 | | | Institutional Class For the Year Ended December 31, 2010 | | | For the Year Ended December 31, 2009 | | | May 19, 2008^ through December 31, 2008 | |
PER SHARE DATA:(1) | | | | | | | | | | | | | | | |
| Net Asset Value Beginning of Period | | $ | 10.46 | | | $ | 11.48 | | | $ | 10.86 | | | $ | 7.21 | | | $ | 13.71 | |
| Income from Investment Operations: | | | | | | | | | | | | | | | | | | | | |
Net investment income(2) | | | 0.05 | | | | 0.03 | | | | 0.06 | | | | 0.02 | | | | 0.08 | |
| Net realized and unrealized gain | | | | | | | | | | | | | | | | | | | | |
| (loss) on investments | | | 1.81 | | | | (0.92 | ) | | | 1.19 | | | | 3.64 | | | | (6.55 | ) |
| Payment by adviser | | | — | | | | — | | | | — | | | | — | | | | 0.06 | (5) |
| Total from investment | | | | | | | | | | | | | | | | | | | | |
| operations | | | 1.86 | | | | (0.89 | ) | | | 1.25 | | | | 3.66 | | | | (6.41 | ) |
| Redemption Fees | | | — | | | | — | | | | — | | | | — | | | | — | |
| Less Distributions: | | | | | | | | | | | | | | | | | | | | |
| From net investment income | | | (0.22 | ) | | | (0.13 | ) | | | (0.63 | ) | | | (0.01 | ) | | | (0.09 | ) |
| Total distributions | | | (0.22 | ) | | | (0.13 | ) | | | (0.63 | ) | | | (0.01 | ) | | | (0.09 | ) |
| Net Asset Value, End of Period | | $ | 12.10 | | | $ | 10.46 | | | $ | 11.48 | | | $ | 10.86 | | | $ | 7.21 | |
| Total return | | | 17.83 | % | | | (7.71 | )% | | | 11.54 | % | | | 50.70 | % | | | (46.77 | )%(5)(6) |
| | | | | | | | | | | | | | | | | | | | | |
| SUPPLEMENTAL DATA AND RATIOS | | | | | | | | | | | | | | | | | | | | |
| Net assets, end of period (000’s) | | $ | 229 | | | $ | 186 | | | $ | 212 | | | $ | 19 | | | $ | 5 | |
| Ratio of operating expenses to | | | | | | | | | | | | | | | | | | | | |
| average net assets: | | | | | | | | | | | | | | | | | | | | |
| Before expense reimbursement | | | 1.92 | % | | | 1.88 | % | | | 1.87 | % | | | 1.88 | % | | | 1.82 | %(7) |
After expense reimbursement(3) | | | 1.44 | % | | | 1.44 | % | | | 1.44 | % | | | 1.44 | % | | | 1.44 | %(7) |
| Ratio of net investment income | | | | | | | | | | | | | | | | | | | | |
| (loss) to average net assets: | | | | | | | | | | | | | | | | | | | | |
| Before expense reimbursement | | | (0.05 | )% | | | (0.15 | )% | | | 0.11 | % | | | (0.20 | )% | | | 0.94 | %(7) |
After expense reimbursement(3) | | | 0.43 | % | | | 0.29 | % | | | 0.54 | % | | | 0.24 | % | | | 1.32 | %(7) |
Portfolio turnover rate(4) | | | 26 | % | | | 14 | % | | | 12 | % | | | 14 | % | | | 77 | % |
| | |
| ^ | Commencement of operations. |
| (1) | Information presented relates to a share of capital stock outstanding for each period. |
| (2) | Net investment income per share represents net investment income divided by the average shares outstanding throughout the period. |
| (3) | See Note #3, Investment Adviser, for the waiver and expense reimbursement discussion. |
| (4) | Portfolio turnover of The Market Opportunities Portfolio. |
| (5) | Includes adviser reimbursement from the net realized loss on the disposal of investments in violation of restrictions. This reimbursement contributed 0.38%, 0.37%, 0.38% and 0.44% to the returns of the No Load Class, the Advisor Class A, the Advisor Class C and the Institutional Class, respectively, for the year ended December 31, 2008. |
| (6) | Not annualized. |
| (7) | Annualized. |
The accompanying notes are an integral part of these financial statements.
| KINETICS MUTUAL FUNDS, INC. — THE FEEDER FUNDS |
Financial Highlights — (Continued) |
| | | The Water Infrastructure Fund | |
| | | For the Year Ended December 31, 2012 | | | For the Year Ended December 31, 2011 | | | No Load Class For the Year Ended December 31, 2010 | | | For the Year Ended December 31, 2009 | | | For the Year Ended December 31, 2008 | |
PER SHARE DATA:(1) | | | | | | | | | | | | | | | |
| Net Asset Value Beginning of Year | | $ | 7.79 | | | $ | 8.38 | | | $ | 8.86 | | | $ | 7.61 | | | $ | 10.17 | |
| Income from Investment Operations: | | | | | | | | | | | | | | | | | | | | |
Net investment income(2) | | | 0.15 | | | | 0.10 | | | | 0.07 | | | | 0.04 | | | | 0.10 | |
| Net realized and unrealized gain | | | | | | | | | | | | | | | | | | | | |
| (loss) on investments | | | 0.61 | | | | (0.51 | ) | | | (0.48 | ) | | | 1.21 | | | | (2.66 | ) |
| Total from investment | | | | | | | | | | | | | | | | | | | | |
| operations | | | 0.76 | | | | (0.41 | ) | | | (0.41 | ) | | | 1.25 | | | | (2.56 | ) |
Redemption Fees(3) | | | 0.00 | | | | 0.00 | | | | 0.00 | | | | 0.00 | | | | 0.00 | |
| Less Distributions: | | | | | | | | | | | | | | | | | | | | |
| From net investment income | | | (0.22 | ) | | | (0.18 | ) | | | (0.07 | ) | | | (0.00 | )(3) | | | — | |
| Total distributions | | | (0.22 | ) | | | (0.18 | ) | | | (0.07 | ) | | | (0.00 | )(3) | | | — | |
| Net Asset Value, End of Year | | $ | 8.33 | | | $ | 7.79 | | | $ | 8.38 | | | $ | 8.86 | | | $ | 7.61 | |
| Total return | | | 9.90 | % | | | (4.88 | )% | | | (4.60 | )% | | | 16.46 | % | | | (25.17 | )% |
| | | | | | | | | | | | | | | | | | | | | |
| SUPPLEMENTAL DATA AND RATIOS | | | | | | | | | | | | | | | | | | | | |
| Net assets, end of year (000’s) | | $ | 4,699 | | | $ | 5,613 | | | $ | 7,001 | | | $ | 7,176 | | | $ | 6,598 | |
| Ratio of operating expenses to | | | | | | | | | | | | | | | | | | | | |
| average net assets: | | | | | | | | | | | | | | | | | | | | |
| Before expense reimbursement | | | 2.55 | % | | | 2.29 | % | | | 2.17 | % | | | 2.36 | % | | | 2.20 | % |
After expense reimbursement(4) | | | 1.64 | % | | | 1.64 | % | | | 1.64 | % | | | 1.64 | % | | | 1.65 | % |
| Ratio of net investment income (loss) | | | | | | | | | | | | | | | | | | | | |
| to average net assets: | | | | | | | | | | | | | | | | | | | | |
| Before expense reimbursement | | | 0.93 | % | | | 0.59 | % | | | 0.33 | % | | | (0.26 | )% | | | 0.55 | % |
After expense reimbursement(4) | | | 1.84 | % | | | 1.24 | % | | | 0.86 | % | | | 0.46 | % | | | 1.10 | % |
Portfolio turnover rate(5) | | | 56 | % | | | 69 | % | | | 111 | % | | | 45 | % | | | 66 | % |
| | |
| (1) | Information presented relates to a share of capital stock outstanding for each period. |
| (2) | Net investment income per share represents net investment income divided by the average shares outstanding throughout the period. |
| (3) | Amount calculated is less than $0.005. |
| (4) | See Note #3, Investment Adviser, for the waiver and expense reimbursement discussion. |
| (5) | Portfolio turnover of The Water Infrastructure Portfolio. |
The accompanying notes are an integral part of these financial statements.
| KINETICS MUTUAL FUNDS, INC. — THE FEEDER FUNDS |
Financial Highlights — (Continued) |
| | | The Water Infrastructure Fund | |
| | | For the Year Ended December 31, 2012 | | | For the Year Ended December 31, 2011 | | | Advisor Class A For the Year Ended December 31, 2010 | | | For the Year Ended December 31, 2009 | | | For the Year Ended December 31, 2008 | |
PER SHARE DATA:(1) | | | | | | | | | | | | | | | |
| Net Asset Value Beginning of Year | | $ | 7.78 | | | $ | 8.35 | | | $ | 8.82 | | | $ | 7.59 | | | $ | 10.17 | |
| Income from Investment Operations: | | | | | | | | | | | | | | | | | | | | |
Net investment income(2) | | | 0.13 | | | | 0.08 | | | | 0.05 | | | | 0.02 | | | | 0.07 | |
| Net realized and unrealized gain | | | | | | | | | | | | | | | | | | | | |
| (loss) on investments | | | 0.61 | | | | (0.50 | ) | | | (0.47 | ) | | | 1.21 | | | | (2.65 | ) |
| Total from investment | | | | | | | | | | | | | | | | | | | | |
| operations | | | 0.74 | | | | (0.42 | ) | | | (0.42 | ) | | | 1.23 | | | | (2.58 | ) |
| Redemption Fees | | | — | | | | 0.00 | (3) | | | 0.00 | (3) | | | 0.00 | (3) | | | 0.00 | (3) |
| Less Distributions: | | | | | | | | | | | | | | | | | | | | |
| From net investment income | | | (0.18 | ) | | | (0.15 | ) | | | (0.05 | ) | | | — | | | | — | |
| Total distributions | | | (0.18 | ) | | | (0.15 | ) | | | (0.05 | ) | | | — | | | | — | |
| Net Asset Value, End of Year | | $ | 8.34 | | | $ | 7.78 | | | $ | 8.35 | | | $ | 8.82 | | | $ | 7.59 | |
Total return(4) | | | 9.61 | % | | | (5.08 | )% | | | (4.80 | )% | | | 16.21 | % | | | (25.37 | )% |
| | | | | | | | | | | | | | | | | | | | | |
| SUPPLEMENTAL DATA AND RATIOS | | | | | | | | | | | | | | | | | | | | |
| Net assets, end of year (000’s) | | $ | 2,597 | | | $ | 4,559 | | | $ | 10,100 | | | $ | 10,339 | | | $ | 7,661 | |
| Ratio of operating expenses to | | | | | | | | | | | | | | | | | | | | |
| average net assets: | | | | | | | | | | | | | | | | | | | | |
| Before expense reimbursement | | | 2.80 | % | | | 2.54 | % | | | 2.42 | % | | | 2.61 | % | | | 2.45 | % |
After expense reimbursement(5) | | | 1.89 | % | | | 1.89 | % | | | 1.89 | % | | | 1.89 | % | | | 1.90 | % |
| Ratio of net investment income (loss) | | | | | | | | | | | | | | | | | | | | |
| to average net assets: | | | | | | | | | | | | | | | | | | | | |
| Before expense reimbursement | | | 0.68 | % | | | 0.34 | % | | | 0.08 | % | | | (0.51 | )% | | | 0.30 | % |
After expense reimbursement(5) | | | 1.59 | % | | | 0.99 | % | | | 0.61 | % | | | 0.21 | % | | | 0.85 | % |
Portfolio turnover rate(6) | | | 56 | % | | | 69 | % | | | 111 | % | | | 45 | % | | | 66 | % |
| | |
| (1) | Information presented relates to a share of capital stock outstanding for each period. |
| (2) | Net investment income per share represents net investment income divided by the average shares outstanding throughout the period. |
| (3) | Amount calculated is less than $0.005. |
| (4) | The total return calculation does not reflect the 5.75% front end sales charge on Advisor Class A shares. |
| (5) | See Note #3, Investment Adviser, for the waiver and expense reimbursement discussion. |
| (6) | Portfolio turnover of The Water Infrastructure Portfolio. |
The accompanying notes are an integral part of these financial statements.
| KINETICS MUTUAL FUNDS, INC. — THE FEEDER FUNDS |
Financial Highlights — (Continued) |
| | | The Water Infrastructure Fund | |
| | | For the Year Ended December 31, 2012 | | | For the Year Ended December 31, 2011 | | | Advisor Class C For the Year Ended December 31, 2010 | | | For the Year Ended December 31, 2009 | | | For the Year Ended December 31, 2008 | |
PER SHARE DATA:(1) | | | | | | | | | | | | | | | |
| Net Asset Value Beginning of Year | | $ | 7.68 | | | $ | 8.25 | | | $ | 8.71 | | | $ | 7.54 | | | $ | 10.16 | |
| Income from Investment Operations: | | | | | | | | | | | | | | | | | | | | |
Net investment income (loss)(2) | | | 0.09 | | | | 0.04 | | | | 0.01 | | | | (0.02 | ) | | | 0.03 | |
| Net realized and unrealized gain (loss) | | | | | | | | | | | | | | | | | | | | |
| on investments | | | 0.60 | | | | (0.49 | ) | | | (0.46 | ) | | | 1.19 | | | | (2.65 | ) |
| Total from investment | | | | | | | | | | | | | | | | | | | | |
| operations | | | 0.69 | | | | (0.45 | ) | | | (0.45 | ) | | | 1.17 | | | | (2.62 | ) |
| Redemption Fees | | | — | | | | 0.00 | (3) | | | — | | | | 0.00 | (3) | | | — | |
| Less Distributions: | | | | | | | | | | | | | | | | | | | | |
| From net investment income | | | (0.14 | ) | | | (0.12 | ) | | | (0.01 | ) | | | — | | | | — | |
| Total distributions | | | (0.14 | ) | | | (0.12 | ) | | | (0.01 | ) | | | — | | | | — | |
| Net Asset Value, End of Year | | $ | 8.23 | | | $ | 7.68 | | | $ | 8.25 | | | $ | 8.71 | | | $ | 7.54 | |
| Total return | | | 8.96 | % | | | (5.51 | )% | | | (5.15 | )% | | | 15.52 | % | | | (25.79 | )% |
| | | | | | | | | | | | | | | | | | | | | |
| SUPPLEMENTAL DATA AND RATIOS | | | | | | | | | | | | | | | | | | | | |
| Net assets, end of year (000’s) | | $ | 1,763 | | | $ | 2,316 | | | $ | 2,840 | | | $ | 2,700 | | | $ | 1,571 | |
| Ratio of operating expenses to average | | | | | | | | | | | | | | | | | | | | |
| net assets: | | | | | | | | | | | | | | | | | | | | |
| Before expense reimbursement | | | 3.30 | % | | | 3.04 | % | | | 2.92 | % | | | 3.11 | % | | | 2.95 | % |
After expense reimbursement(4) | | | 2.39 | % | | | 2.39 | % | | | 2.39 | % | | | 2.39 | % | | | 2.40 | % |
| Ratio of net investment income (loss) to | | | | | | | | | | | | | | | | | | | | |
| average net assets: | | | | | | | | | | | | | | | | | | | | |
| Before expense reimbursement | | | 0.18 | % | | | (0.16 | )% | | | (0.42 | )% | | | (1.01 | )% | | | (0.20 | )% |
After expense reimbursement(4) | | | 1.09 | % | | | 0.49 | % | | | 0.11 | % | | | (0.29 | )% | | | 0.35 | % |
Portfolio turnover rate(5) | | | 56 | % | | | 69 | % | | | 111 | % | | | 45 | % | | | 66 | % |
| | |
| (1) | Information presented relates to a share of capital stock outstanding for each period. |
| (2) | Net investment income per share represents net investment income divided by the average shares outstanding throughout the period. |
| (3) | Amount calculated is less than $0.005. |
| (4) | See Note #3, Investment Adviser, for the waiver and expense reimbursement discussion. |
| (5) | Portfolio turnover of The Water Infrastructure Portfolio. |
The accompanying notes are an integral part of these financial statements.
| KINETICS MUTUAL FUNDS, INC. — THE FEEDER FUNDS |
Financial Highlights — (Continued) |
| | | The Water Infrastructure Fund | |
| | | For the Year Ended December 31, 2012 | | | For the Year Ended December 31, 2011 | | | Institutional Class For the Year Ended December 31, 2010 | | | For the Year Ended December 31, 2009 | | | For the Year Ended December 31, 2008 | |
PER SHARE DATA:(1) | | | | | | | | | | | | | | | |
| Net Asset Value Beginning of Year | | $ | 7.85 | | | $ | 8.42 | | | $ | 8.90 | | | $ | 7.63 | | | $ | 10.18 | |
| Income from Investment Operations: | | | | | | | | | | | | | | | | | | | | |
Net investment income(2) | | | 0.17 | | | | 0.12 | | | | 0.09 | | | | 0.05 | | | | 0.12 | |
| Net realized and unrealized gain | | | | | | | | | | | | | | | | | | | | |
| (loss) on investments | | | 0.62 | | | | (0.51 | ) | | | (0.48 | ) | | | 1.23 | | | | (2.67 | ) |
| Total from investment | | | | | | | | | | | | | | | | | | | | |
| operations | | | 0.79 | | | | (0.39 | ) | | | (0.39 | ) | | | 1.28 | | | | (2.55 | ) |
| Redemption Fees | | | 0.00 | (3) | | | 0.02 | | | | 0.00 | (3) | | | 0.01 | | | | 0.00 | (3) |
| Less Distributions: | | | | | | | | | | | | | | | | | | | | |
| From net investment income | | | (0.24 | ) | | | (0.20 | ) | | | (0.09 | ) | | | (0.02 | ) | | | — | |
| Total distributions | | | (0.24 | ) | | | (0.20 | ) | | | (0.09 | ) | | | (0.02 | ) | | | — | |
| Net Asset Value, End of Year | | $ | 8.40 | | | $ | 7.85 | | | $ | 8.42 | | | $ | 8.90 | | | $ | 7.63 | |
| Total return | | | 10.17 | % | | | (4.43 | )% | | | (4.38 | )% | | | 16.94 | % | | | (25.05 | )% |
| | | | | | | | | | | | | | | | | | | | | |
| SUPPLEMENTAL DATA AND RATIOS | | | | | | | | | | | | | | | | | | | | |
| Net assets, end of year (000’s) | | $ | 1,629 | | | $ | 798 | | | $ | 4,182 | | | $ | 2,905 | | | $ | 251 | |
| Ratio of operating expenses to average | | | | | | | | | | | | | | | | | | | | |
| net assets: | | | | | | | | | | | | | | | | | | | | |
| Before expense reimbursement | | | 2.50 | % | | | 2.24 | % | | | 2.12 | % | | | 2.31 | % | | | 2.15 | % |
After expense reimbursement(4) | | | 1.44 | % | | | 1.44 | % | | | 1.44 | % | | | 1.44 | % | | | 1.45 | % |
| Ratio of net investment income (loss) to | | | | | | | | | | | | | | | | | | | | |
| average net assets: | | | | | | | | | | | | | | | | | | | | |
| Before expense reimbursement | | | 0.98 | % | | | 0.64 | % | | | 0.38 | % | | | (0.21 | )% | | | 0.60 | % |
After expense reimbursement(4) | | | 2.04 | % | | | 1.44 | % | | | 1.06 | % | | | 0.66 | % | | | 1.30 | % |
Portfolio turnover rate(5) | | | 56 | % | | | 69 | % | | | 111 | % | | | 45 | % | | | 66 | % |
| | |
| (1) | Information presented relates to a share of capital stock outstanding for each period. |
| (2) | Net investment income per share represents net investment income divided by the average shares outstanding throughout the period. |
| (3) | Amount calculated is less than $0.005. |
| (4) | See Note #3, Investment Adviser, for the waiver and expense reimbursement discussion. |
| (5) | Portfolio turnover of The Water Infrastructure Portfolio. |
The accompanying notes are an integral part of these financial statements.
| KINETICS MUTUAL FUNDS, INC. — THE FEEDER FUNDS |
Financial Highlights — (Continued) |
| | | The Multi-Disciplinary Fund | |
| | | For the Year Ended December 31, 2012 | | | For the Year Ended December 31, 2011 | | | No Load Class For the Year Ended December 31, 2010 | | | For the Year Ended December 31, 2009 | | | February 11, 2008^ through December 31, 2008 | |
PER SHARE DATA:(1) | | | | | | | | | | | | | | | |
| Net Asset Value Beginning of Period | | $ | 10.09 | | | $ | 10.47 | | | $ | 9.86 | | | $ | 8.22 | | | $ | 10.00 | |
| Income from Investment Operations: | | | | | | | | | | | | | | | | | | | | |
Net investment income (2) | | | 0.34 | | | | 0.83 | | | | 0.35 | | | | 0.09 | | | | 0.01 | |
| Net realized and unrealized gain | | | | | | | | | | | | | | | | | | | | |
| (loss) on investments | | | 1.20 | | | | (0.80 | ) | | | 0.91 | | | | 1.79 | | | | (1.79 | ) |
| Total from investment | | | | | | | | | | | | | | | | | | | | |
| operations | | | 1.54 | | | | 0.03 | | | | 1.26 | | | | 1.88 | | | | (1.78 | ) |
| Redemption Fees | | | 0.00 | (3) | | | 0.00 | (3) | | | 0.00 | (3) | | | — | | | | — | |
| Less Distributions: | | | | | | | | | | | | | | | | | | | | |
| From net investment income | | | (0.43 | ) | | | (0.36 | ) | | | (0.35 | ) | | | (0.08 | ) | | | (0.00 | )(3) |
| From net realized gains | | | (0.12 | ) | | | (0.05 | ) | | | (0.30 | ) | | | (0.16 | ) | | | — | |
| Total distributions | | | (0.55 | ) | | | (0.41 | ) | | | (0.65 | ) | | | (0.24 | ) | | | (0.00 | )(3) |
| Net Asset Value, End of Period | | $ | 11.08 | | | $ | 10.09 | | | $ | 10.47 | | | $ | 9.86 | | | $ | 8.22 | |
| Total return | | | 15.38 | % | | | 0.24 | % | | | 13.04 | % | | | 22.90 | % | | | (17.76 | )%(6) |
| | | | | | | | | | | | | | | | | | | | | |
| SUPPLEMENTAL DATA AND RATIOS | | | | | | | | | | | | | | | | | | | | |
| Net assets, end of period (000’s) | | $ | 19,566 | | | $ | 13,389 | | | $ | 3,489 | | | $ | 938 | | | $ | 99 | |
| Ratio of operating expenses to average | | | | | | | | | | | | | | | | | | | | |
| net assets: | | | | | | | | | | | | | | | | | | | | |
| Before expense reimbursement | | | 2.00 | % | | | 2.38 | % | | | 6.11 | % | | | 13.11 | % | | | 17.58 | %(7) |
After expense reimbursement(4) | | | 1.49 | % | | | 1.49 | % | | | 1.49 | % | | | 1.49 | % | | | 1.49 | %(7) |
| Ratio of net investment income (loss) | | | | | | | | | | | | | | | | | | | | |
| to average net assets: | | | | | | | | | | | | | | | | | | | | |
| Before expense reimbursement | | | 2.65 | % | | | 7.09 | % | | | (1.19 | )% | | | (10.69 | )% | | | (15.99 | )%(7) |
After expense reimbursement(4) | | | 3.16 | % | | | 7.98 | % | | | 3.43 | % | | | 0.93 | % | | | 0.10 | %(7) |
Portfolio turnover rate(5) | | | 41 | % | | | 74 | % | | | 38 | % | | | 77 | % | | | N/A | (8) |
| | |
| ^ | Commencement of operations. |
| (1) | Information presented relates to a share of capital stock outstanding for each period. |
| (2) | Net investment income per share represents net investment income divided by the average shares outstanding throughout the period. |
| (3) | Amount calculated is less than $0.005. |
| (4) | See Note #3, Investment Adviser, for the waiver and expense reimbursement discussion. |
| (5) | Portfolio turnover of The Multi-Disciplinary Portfolio. |
| (6) | Not annualized. |
| (7) | Annualized. |
| (8) | Portfolio turnover is not applicable because The Multi-Disciplinary Portfolio did not hold any long-term securities from inception date through year end. |
The accompanying notes are an integral part of these financial statements.
| KINETICS MUTUAL FUNDS, INC. — THE FEEDER FUNDS |
Financial Highlights — (Continued) |
| | | The Multi-Disciplinary Fund | |
| | | For the Year Ended December 31, 2012 | | | For the Year Ended December 31, 2011 | | | Advisor Class A For the Year Ended December 31, 2010 | | | For the Year Ended December 31, 2009 | | | February 11, 2008^ through December 31, 2008 | |
PER SHARE DATA:(1) | | | | | | | | | | | | | | | |
| Net Asset Value Beginning of Period | | $ | 10.05 | | | $ | 10.44 | | | $ | 9.85 | | | $ | 8.20 | | | $ | 10.00 | |
| Income from Investment Operations: | | | | | | | | | | | | | | | | | | | | |
Net investment income (loss)(2) | | | 0.31 | | | | 0.78 | | | | 0.33 | | | | 0.06 | | | | (0.01 | ) |
| Net realized and unrealized gain | | | | | | | | | | | | | | | | | | | | |
| (loss) on investments | | | 1.20 | | | | (0.78 | ) | | | 0.89 | | | | 1.80 | | | | (1.79 | ) |
| Total from investment | | | | | | | | | | | | | | | | | | | | |
| operations | | | 1.51 | | | | — | | | | 1.22 | | | | 1.86 | | | | (1.80 | ) |
| Redemption Fees | | | 0.00 | (3) | | | — | | | | — | | | | — | | | | — | |
| Less Distributions: | | | | | | | | | | | | | | | | | | | | |
| From net investment income | | | (0.41 | ) | | | (0.34 | ) | | | (0.33 | ) | | | (0.05 | ) | | | (0.00 | )(3) |
| From net realized gains | | | (0.12 | ) | | | (0.05 | ) | | | (0.30 | ) | | | (0.16 | ) | | | — | |
| Total distributions | | | (0.53 | ) | | | (0.39 | ) | | | (0.63 | ) | | | (0.21 | ) | | | (0.00 | )(3) |
| Net Asset Value, End of Period | | $ | 11.03 | | | $ | 10.05 | | | $ | 10.44 | | | $ | 9.85 | | | $ | 8.20 | |
Total return(4) | | | 15.12 | % | | | (0.01 | )% | | | 12.64 | % | | | 22.73 | % | | | (17.97 | )%(7) |
| | | | | | | | | | | | | | | | | | | | | |
| SUPPLEMENTAL DATA AND RATIOS | | | | | | | | | | | | | | | | | | | | |
| Net assets, end of period (000’s) | | $ | 25,764 | | | $ | 4,726 | | | $ | 356 | | | $ | 103 | | | $ | 84 | |
| Ratio of operating expenses to | | | | | | | | | | | | | | | | | | | | |
| average net assets: | | | | | | | | | | | | | | | | | | | | |
| Before expense reimbursement | | | 2.25 | % | | | 2.63 | % | | | 6.36 | % | | | 13.36 | % | | | 17.83 | %(8) |
After expense reimbursement(5) | | | 1.74 | % | | | 1.74 | % | | | 1.74 | % | | | 1.74 | % | | | 1.74 | %(8) |
| Ratio of net investment income (loss) | | | | | | | | | | | | | | | | | | | | |
| to average net assets: | | | | | | | | | | | | | | | | | | | | |
| Before expense reimbursement | | | 2.40 | % | | | 6.84 | % | | | (1.44 | )% | | | (10.94 | )% | | | (16.24 | )%(8) |
After expense reimbursement(5) | | | 2.91 | % | | | 7.73 | % | | | 3.18 | % | | | 0.68 | % | | | (0.15 | )%(8) |
Portfolio turnover rate(6) | | | 41 | % | | | 74 | % | | | 38 | % | | | 77 | % | | | N/A | (9) |
| | |
| ^ | Commencement of operations. |
| (1) | Information presented relates to a share of capital stock outstanding for each period. |
| (2) | Net investment income per share represents net investment income divided by the average shares outstanding throughout the period. |
| (3) | Amount calculated is less than $0.005. |
| (4) | The total return calculation does not reflect the 5.75% front end sales charge on Advisor Class A shares. |
| (5) | See Note #3, Investment Adviser, for the waiver and expense reimbursement discussion. |
| (6) | Portfolio turnover of The Multi-Disciplinary Portfolio. |
| (7) | Not annualized. |
| (8) | Annualized. |
| (9) | Portfolio turnover is not applicable because The Multi-Disciplinary Portfolio did not hold any long-term securities from inception date through year end. |
The accompanying notes are an integral part of these financial statements.
| KINETICS MUTUAL FUNDS, INC. — THE FEEDER FUNDS |
Financial Highlights — (Continued) |
| | | The Multi-Disciplinary Fund | |
| | | For the Year Ended December 31, 2012 | | | For the Year Ended December 31, 2011 | | | Advisor Class C For the Year Ended December 31, 2010 | | | For the Year Ended December 31, 2009 | | | February 11, 2008^ through December 31, 2008 | |
PER SHARE DATA:(1) | | | | | | | | | | | | | | | |
| Net Asset Value Beginning of Period | | $ | 10.00 | | | $ | 10.40 | | | $ | 9.80 | | | $ | 8.17 | | | $ | 10.00 | |
| Income from Investment Operations: | | | | | | | | | | | | | | | | | | | | |
Net investment income (loss)(2) | | | 0.26 | | | | 0.74 | | | | 0.27 | | | | 0.02 | | | | (0.05 | ) |
| Net realized and unrealized gain | | | | | | | | | | | | | | | | | | | | |
| (loss) on investments | | | 1.18 | | | | (0.78 | ) | | | 0.90 | | | | 1.78 | | | | (1.78 | ) |
| Total from investment | | | | | | | | | | | | | | | | | | | | |
| operations | | | 1.44 | | | | (0.04 | ) | | | 1.17 | | | | 1.80 | | | | (1.83 | ) |
| Redemption Fees | | | — | | | | — | | | | — | | | | — | | | | — | |
| Less Distributions: | | | | | | | | | | | | | | | | | | | | |
| From net investment income | | | (0.36 | ) | | | (0.31 | ) | | | (0.27 | ) | | | (0.01 | ) | | | (0.00 | )(3) |
| From net realized gains | | | (0.12 | ) | | | (0.05 | ) | | | (0.30 | ) | | | (0.16 | ) | | | — | |
| Total distributions | | | (0.48 | ) | | | (0.36 | ) | | | (0.57 | ) | | | (0.17 | ) | | | (0.00 | )(3) |
| Net Asset Value, End of Period | | $ | 10.96 | | | $ | 10.00 | | | $ | 10.40 | | | $ | 9.80 | | | $ | 8.17 | |
| Total return | | | 14.48 | % | | | (0.49 | )% | | | 12.13 | % | | | 22.03 | % | | | (18.30 | )%(6) |
| | | | | | | | | | | | | | | | | | | | | |
| SUPPLEMENTAL DATA AND RATIOS | | | | | | | | | | | | | | | | | | | | |
| Net assets, end of period (000’s) | | $ | 7,485 | | | $ | 1,645 | | | $ | 128 | | | $ | 105 | | | $ | 88 | |
| Ratio of operating expenses to | | | | | | | | | | | | | | | | | | | | |
| average net assets: | | | | | | | | | | | | | | | | | | | | |
| Before expense reimbursement | | | 2.75 | % | | | 3.13 | % | | | 6.86 | % | | | 13.86 | % | | | 18.33 | %(7) |
After expense reimbursement(4) | | | 2.24 | % | | | 2.24 | % | | | 2.24 | % | | | 2.24 | % | | | 2.24 | %(7) |
| Ratio of net investment income (loss) | | | | | | | | | | | | | | | | | | | | |
| to average net assets: | | | | | | | | | | | | | | | | | | | | |
| Before expense reimbursement | | | 1.90 | % | | | 6.34 | % | | | (1.94 | )% | | | (11.44 | )% | | | 16.74 | %(7) |
After expense reimbursement(4) | | | 2.41 | % | | | 7.23 | % | | | 2.68 | % | | | 0.18 | % | | | 0.65 | %(7) |
Portfolio turnover rate(5) | | | 41 | % | | | 74 | % | | | 38 | % | | | 77 | % | | | N/A | (8) |
| | |
| ^ | Commencement of operations. |
| (1) | Information presented relates to a share of capital stock outstanding for each period. |
| (2) | Net investment income per share represents net investment income divided by the average shares outstanding throughout the period. |
| (3) | Amount calculated is less than $0.005. |
| (4) | See Note #3, Investment Adviser, for the waiver and expense reimbursement discussion. |
| (5) | Portfolio turnover of The Multi-Disciplinary Portfolio. |
| (6) | Not annualized. |
| (7) | Annualized. |
| (8) | Portfolio turnover is not applicable because The Multi-Disciplinary Portfolio did not hold any long-term securities from inception date through year end. |
The accompanying notes are an integral part of these financial statements.
| KINETICS MUTUAL FUNDS, INC. — THE FEEDER FUNDS |
Financial Highlights — (Continued) |
| | | The Multi-Disciplinary Fund | |
| | | For the Year Ended December 31, 2012 | | | For the Year Ended December 31, 2011 | | | Institutional Class For the Year Ended December 31, 2010 | | | For the Year Ended December 31, 2009 | | | February 11, 2008^ through December 31, 2008 | |
PER SHARE DATA:(1) | | | | | | | | | | | | | | | |
| Net Asset Value Beginning of Period | | $ | 10.12 | | | $ | 10.50 | | | $ | 9.89 | | | $ | 8.23 | | | $ | 10.00 | |
| Income from Investment Operations: | | | | | | | | | | | | | | | | | | | | |
Net investment income(2) | | | 0.36 | | | | 0.85 | | | | 0.37 | | | | 0.10 | | | | 0.02 | |
| Net realized and unrealized gain | | | | | | | | | | | | | | | | | | | | |
| (loss) on investments | | | 1.20 | | | | (0.80 | ) | | | 0.91 | | | | 1.81 | | | | (1.79 | ) |
| Total from investment | | | | | | | | | | | | | | | | | | | | |
| operations | | | 1.56 | | | | 0.05 | | | | 1.28 | | | | 1.91 | | | | (1.77 | ) |
| Redemption Fees | | | — | | | | — | | | | — | | | | — | | | | — | |
| Less Distributions: | | | | | | | | | | | | | | | | | | | | |
| From net investment income | | | (0.45 | ) | | | (0.38 | ) | | | (0.37 | ) | | | (0.09 | ) | | | (0.00 | )(3) |
| From net realized gains | | | (0.12 | ) | | | (0.05 | ) | | | (0.30 | ) | | | (0.16 | ) | | | — | |
| Total distributions | | | (0.57 | ) | | | (0.43 | ) | | | (0.67 | ) | | | (0.25 | ) | | | (0.00 | )(3) |
| Net Asset Value, End of Period | | $ | 11.11 | | | $ | 10.12 | | | $ | 10.50 | | | $ | 9.89 | | | $ | 8.23 | |
| Total return | | | 15.55 | % | | | 0.42 | % | | | 13.19 | % | | | 23.25 | % | | | (17.65 | )%(6) |
| | | | | | | | | | | | | | | | | | | | | |
| SUPPLEMENTAL DATA AND RATIOS | | | | | | | | | | | | | | | | | | | | |
| Net assets, end of period (000’s) | | $ | 6,576 | | | $ | 3,878 | | | $ | 142 | | | $ | 101 | | | $ | 82 | |
| Ratio of operating expenses to | | | | | | | | | | | | | | | | | | | | |
| average net assets: | | | | | | | | | | | | | | | | | | | | |
| Before expense reimbursement | | | 1.95 | % | | | 2.33 | % | | | 6.06 | % | | | 13.06 | % | | | 17.53 | %(7) |
After expense reimbursement(4) | | | 1.29 | % | | | 1.29 | % | | | 1.29 | % | | | 1.29 | % | | | 1.29 | %(7) |
| Ratio of net investment income (loss) | | | | | | | | | | | | | | | | | | | | |
| to average net assets: | | | | | | | | | | | | | | | | | | | | |
| Before expense reimbursement | | | 2.70 | % | | | 7.14 | % | | | (1.14 | )% | | | (10.64 | )% | | | (15.94 | )%(7) |
After expense reimbursement(4) | | | 3.36 | % | | | 8.18 | % | | | 3.63 | % | | | 1.13 | % | | | 0.30 | %(7) |
Portfolio turnover rate(5) | | | 41 | % | | | 74 | % | | | 38 | % | | | 77 | % | | | N/A | (8) |
| | |
| ^ | Commencement of operations. |
| (1) | Information presented relates to a share of capital stock outstanding for each period. |
| (2) | Net investment income per share represents net investment income divided by the average shares outstanding throughout the period. |
| (3) | Amount calculated is less than $0.005. |
| (4) | See Note #3, Investment Adviser, for the waiver and expense reimbursement discussion. |
| (5) | Portfolio turnover of The Multi-Disciplinary Portfolio. |
| (6) | Not annualized. |
| (7) | Annualized. |
| (8) | Portfolio turnover is not applicable because The Multi-Disciplinary Portfolio did not hold any long-term securities from inception date through year end. |
The accompanying notes are an integral part of these financial statements.
| KINETICS MUTUAL FUNDS, INC. |
Report of Independent Registered Public Accounting Firm |
To the Shareholders of and Board of Directors
Kinetics Mutual Funds, Inc.
Elmsford, New York
We have audited the accompanying statements of assets and liabilities of The Internet Fund, The Global Fund, The Paradigm Fund, The Medical Fund, The Small Cap Opportunities Fund, The Market Opportunities Fund, The Water Infrastructure Fund and The Multi-Disciplinary Fund, each a series of shares of Kinetics Mutual Funds, Inc. (the “Funds”), as of December 31, 2012, and the related statements of operations for the year then ended, the statements of changes in net assets for each of the two years in the period then ended and financial highlights for each of the five years in the period then ended, except for The Multi-Disciplinary Fund in which the financial highlights were for each of the four years in the period then ended and the period February 11, 2008 (commencement of operations) through December 31, 2008. These financial statements and financial highlights are the responsibility of the Funds’ management. Our responsibility is to express an opinion on these financial statements and financial highlights based on our audits.
We conducted our audits in accordance with the standards of the Public Company Accounting Oversight Board (United States). Those standards require that we plan and perform the audit to obtain reasonable assurance about whether the financial statements and financial highlights are free of material misstatement. We were not engaged to perform, nor were the Funds required to have, an audit of their internal control over financial reporting. Our audits included consideration of internal control over financial reporting as a basis for designing audit procedures that are appropriate in the circumstances, but not for the purpose of expressing an opinion on the effectiveness of the Funds’ internal control over financial reporting. Accordingly, we express no such opinion. An audit also includes examining, on a test basis, evidence supporting the amounts and disclosures in the financial statements. An audit also includes assessing the accounting principles used and significant estimates made by management, as well as evaluating the overall financial statement presentation. We believe that our audits provide a reasonable basis for our opinion.
In our opinion, the financial statements and financial highlights referred to above present fairly in all material respects, the financial position of each of the eight funds of the Kinetics Mutual Funds, Inc. as of December 31, 2012, the results of their operations for the year then ended, the changes in their net assets for each of the two years in the period then ended and financial highlights for the periods indicated above, in conformity with accounting principles generally accepted in the United States of America.
Philadelphia, Pennsylvania
March 1, 2013
| KINETICS PORTFOLIOS TRUST — MASTER INVESTMENT PORTFOLIOS |
| Allocation of Portfolio Assets |
| December 31, 2012 |
The Internet Portfolio
| | | | | | | | |
| | | | | | Percentage |
| | | Market | | of Total |
| Sector Allocation* | | Value | | Net Assets |
| Information | | $ | 68,716,756 | | | 43.8 | % |
| Retail Trade | | | 21,739,988 | | | 13.9 | % |
| Finance and Insurance | | | 10,656,844 | | | 6.8 | % |
| Management of Companies and Enterprises | | | 9,050,785 | | | 5.8 | % |
| Arts, Entertainment, and Recreation | | | 9,024,892 | | | 5.7 | % |
| Manufacturing | | | 7,068,130 | | | 4.5 | % |
| Professional, Scientific, and Technical Services | | | 2,524,143 | | | 1.6 | % |
| Real Estate and Rental and Leasing | | | 1,828,129 | | | 1.2 | % |
| Administrative and Support and Waste Management and | | | | | | | |
| Remediation Services | | | 1,390,093 | | | 0.9 | % |
| Transportation and Warehousing | | | 1,255,848 | | | 0.8 | % |
| | |
| * Excludes Short-Term Investments |
| KINETICS PORTFOLIOS TRUST — MASTER INVESTMENT PORTFOLIOS |
| Allocation of Portfolio Assets |
December 31, 2012 — (Continued) |
The Global Portfolio
| | | | | | | | |
| | | | | | Percentage |
| | | Market | | of Total |
| Country Allocation* | | Value | | Net Assets |
| United States | | $ | 2,275,745 | | | 34.8 | % |
| Canada | | | 1,433,166 | | | 21.9 | % |
| France | | | 540,261 | | | 8.3 | % |
| Hong Kong | | | 475,667 | | | 7.2 | % |
| Switzerland | | | 399,802 | | | 6.2 | % |
| China | | | 215,531 | | | 3.3 | % |
| Singapore | | | 206,783 | | | 3.2 | % |
| Cayman Islands | | | 147,712 | | | 2.2 | % |
| United Kingdom | | | 135,958 | | | 2.1 | % |
| Spain | | | 81,905 | | | 1.2 | % |
| Guernsey | | | 71,801 | | | 1.1 | % |
| Brazil | | | 64,752 | | | 1.0 | % |
| Australia | | | 36,125 | | | 0.6 | % |
| Greece | | | 22,967 | | | 0.4 | % |
| Argentina | | | 14,685 | | | 0.2 | % |
| Austria | | | 9,578 | | | 0.1 | % |
| | |
| * Excludes Short-Term Investments |
| KINETICS PORTFOLIOS TRUST — MASTER INVESTMENT PORTFOLIOS |
| Allocation of Portfolio Assets |
December 31, 2012 — (Continued) |
The Paradigm Portfolio
| | | | | | Percentage |
| | | Market | | of Total |
| Sector Allocation* | | Value | | Net Assets |
| Information | | $ | 206,872,704 | | | 23.5 | % |
| Real Estate and Rental and Leasing | | | 134,473,414 | | | 15.2 | % |
| Finance and Insurance | | | 100,871,232 | | | 11.4 | % |
| Management of Companies and Enterprises | | | 96,294,014 | | | 10.9 | % |
| Retail Trade | | | 85,580,430 | | | 9.7 | % |
| Mining, Quarrying, and Oil and Gas Extraction | | | 58,962,511 | | | 6.7 | % |
| Arts, Entertainment, and Recreation | | | 56,253,977 | | | 6.4 | % |
| Manufacturing | | | 41,732,888 | | | 4.7 | % |
| Transportation and Warehousing | | | 21,408,714 | | | 2.4 | % |
| Petroleum & Gas | | | 13,416,273 | | | 1.5 | % |
| Utilities | | | 2,324,032 | | | 0.3 | % |
| Construction | | | 1,017,021 | | | 0.1 | % |
| Wholesale Trade | | | 68,481 | | | 0.0 | % |
| Accommodation and Food Services | | | 16,440 | | | 0.0 | % |
| | |
| * Excludes Short-Term Investments |
| KINETICS PORTFOLIOS TRUST — MASTER INVESTMENT PORTFOLIOS |
| Allocation of Portfolio Assets |
December 31, 2012 — (Continued) |
The Medical Portfolio
| | | | | | | | |
| | | | | | | Percentage |
| | | | Market | | | of Total |
| Sector Allocation* | | | Value | | | Net Assets |
| Manufacturing | | $ | 16,592,505 | | | 95.9 | % |
| Professional, Scientific, and Technical Services | | | 658,160 | | | 3.8 | % |
| Finance and Insurance | | | 1,672 | | | 0.0 | % |
| Health Care and Social Assistance | | | 230 | | | 0.0 | % |
| | |
| * Excludes Short-Term Investments |
| KINETICS PORTFOLIOS TRUST — MASTER INVESTMENT PORTFOLIOS |
| Allocation of Portfolio Assets |
December 31, 2012 — (Continued) |
The Small Cap Opportunities Portfolio
| | | | | | Percentage |
| | | Market | | | of Total |
| Sector Allocation* | | Value | | | Net Assets |
| Real Estate and Rental and Leasing | | $ | 20,116,257 | | | | 24.7 | % |
| Finance and Insurance | | | 17,918,036 | | | | 22.0 | % |
| Manufacturing | | | 15,349,497 | | | | 18.8 | % |
| Management of Companies and Enterprises | | | 9,084,858 | | | | 11.1 | % |
| Information | | | 5,729,367 | | | | 7.0 | % |
| Petroleum & Gas | | | 3,841,617 | | | | 4.7 | % |
| Mining, Quarrying, and Oil and Gas Extraction | | | 3,484,081 | | | | 4.3 | % |
| Retail Trade | | | 2,053,816 | | | | 2.5 | % |
| Arts, Entertainment, and Recreation | | | 2,015,615 | | | | 2.5 | % |
| Wholesale Trade | | | 678,528 | | | | 0.8 | % |
| Transportation Equipment | | | 651,990 | | | | 0.8 | % |
| | |
| * Excludes Short-Term Investments |
| KINETICS PORTFOLIOS TRUST — MASTER INVESTMENT PORTFOLIOS |
| Allocation of Portfolio Assets |
December 31, 2012 — (Continued) |
The Market Opportunities Portfolio
| | | | | | Percentage |
| | | Market | | | of Total |
| Sector Allocation* | | Value | | | Net Assets |
| Finance and Insurance | | $ | 25,909,181 | | | | 59.4 | % |
| Real Estate and Rental and Leasing | | | 4,653,663 | | | | 10.6 | % |
| Management of Companies and Enterprises | | | 3,802,935 | | | | 8.7 | % |
| Retail Trade | | | 1,879,104 | | | | 4.3 | % |
| Mining, Quarrying, and Oil and Gas Extraction | | | 1,726,534 | | | | 4.0 | % |
| Petroleum & Gas | | | 1,314,378 | | | | 3.0 | % |
| Arts, Entertainment, and Recreation | | | 770,410 | | | | 1.8 | % |
| Information | | | 744,955 | | | | 1.7 | % |
| Utilities | | | 99,264 | | | | 0.2 | % |
| | |
| * Excludes Short-Term Investments |
| KINETICS PORTFOLIOS TRUST — MASTER INVESTMENT PORTFOLIOS |
| Allocation of Portfolio Assets |
December 31, 2012 — (Continued) |
The Water Infrastructure Portfolio
| Sector Allocation* | | Market Value | | | Percentage of Total Net Assets |
| Finance and Insurance | | $ | 1,563,642 | | | | 14.5 | % |
| Management of Companies and Enterprises | | | 345,321 | | | | 3.2 | % |
| Utilities | | | 162,791 | | | | 1.5 | % |
| Manufacturing | | | 147,446 | | | | 1.4 | % |
| | |
| *Excludes Short-Term Investments & Options |
| KINETICS PORTFOLIOS TRUST — MASTER INVESTMENT PORTFOLIOS |
| Allocation of Portfolio Assets |
December 31, 2012 — (Continued) |
The Multi-Disciplinary Portfolio
| | | | | | Percentage |
| | | Market | | | of Total |
| Sector Allocation* | | Value | | | Net Assets |
| Mining, Quarrying, and Oil and Gas Extraction | | $ | 15,638,137 | | | | 26.3 | % |
| Manufacturing | | | 8,700,981 | | | | 14.6 | % |
| Information | | | 6,618,281 | | | | 11.1 | % |
| Finance and Insurance | | | 4,781,189 | | | | 8.0 | % |
| Administrative and Support and Waste Management | | | | | | | | |
| and Remediation Services | | | 4,211,537 | | | | 7.1 | % |
| Real Estate and Rental and Leasing | | | 4,088,813 | | | | 6.9 | % |
| Management of Companies and Enterprises | | | 3,425,500 | | | | 5.7 | % |
| Health Care and Social Assistance | | | 2,913,250 | | | | 4.9 | % |
| Utilities | | | 2,889,000 | | | | 4.8 | % |
| Arts, Entertainment, and Recreation | | | 2,189,000 | | | | 3.7 | % |
| Retail Trade | | | 1,543,625 | | | | 2.6 | % |
| Transportation and Warehousing | | | 770,000 | | | | 1.3 | % |
| Professional, Scientific, and Technical Services | | | 100,750 | | | | 0.2 | % |
| | |
| * Excludes Short-Term Investments & Options |
| KINETICS PORTFOLIOS TRUST — MASTER INVESTMENT PORTFOLIOS |
| The Internet Portfolio |
| Portfolio of Investments — December 31, 2012 |
| Identifier | | COMMON STOCKS — 84.49% | Shares | | | Value |
| | | Administrative and Support Services — 0.89% | | | | |
| CRMZ | | CreditRiskMonitor.com, Inc. | 600 | | $ | 2,040 |
| CTRP | | Ctrip.com International Ltd. — ADR*^ | 6,000 | | | 136,740 |
| EXPE | | Expedia, Inc. | 20,300 | | | 1,247,435 |
| IILG | | Interval Leisure Group, Inc. | 200 | | | 3,878 |
| | | | | | | 1,390,093 |
| | | Broadcasting (except Internet) — 24.21% | | | | |
| CBS | | CBS Corporation — Class B | 55,200 | | | 2,100,360 |
| DISCA | | Discovery Communications, Inc. — Class A*^ | 101,700 | | | 6,455,916 |
| LMCA | | Liberty Media Corporation — Liberty Capital — Series A* | 117,900 | | | 13,677,579 |
| SNI | | Scripps Networks Interactive — Class A^ | 74,800 | | | 4,332,416 |
| SIRI | | Sirius XM Radio, Inc.^ | 46,000 | | | 132,940 |
| TWX | | Time Warner, Inc. | 80,000 | | | 3,826,400 |
| VIAB | | Viacom Inc. — Class B | 107,600 | | | 5,674,824 |
| DIS | | The Walt Disney Company^ | 34,100 | | | 1,697,839 |
| YOKU | | Youku.com, Inc. — ADR* | 2,160 | | | 39,398 |
| | | | | | | 37,937,672 |
| | | Computer and Electronic Product Manufacturing — 1.34% | | | | |
| AAPL | | Apple, Inc. | 3,000 | | | 1,599,090 |
| QCOM | | QUALCOMM Inc. | 8,000 | | | 496,160 |
| ZNGA | | Zynga, Inc. — Class A* | 2,000 | | | 4,740 |
| | | | | | | 2,099,990 |
| | | Credit Intermediation and Related Activities — 0.12% | | | | |
| TREE | | Tree.com, Inc. | 10,033 | | | 180,895 |
| | | Data Processing, Hosting and Related Services — 0.11% | | | | |
| CSGP | | CoStar Group, Inc.* | 2,000 | | | 178,740 |
| | | Data Processor — 3.57% | | | | |
| MA | | MasterCard, Inc. — Class A^ | 5,000 | | | 2,456,400 |
| VRSK | | Verisk Analytics, Inc. — Class A* | 8,000 | | | 408,000 |
| V | | Visa, Inc. — Class A^ | 18,000 | | | 2,728,440 |
| | | | | | | 5,592,840 |
| | | Defense — 2.88% | | | | |
| CACI | | CACI International, Inc. — Class A*^ | 48,000 | | | 2,641,440 |
| MANT | | ManTech International Corporation — Class A^ | 72,000 | | | 1,867,680 |
| | | | | | | 4,509,120 |
| | | E-Commerce — 2.86% | | | | |
| IACI | | IAC/InterActiveCorp | 94,700 | | | 4,479,310 |
The accompanying notes are an integral part of these financial statements.
| KINETICS PORTFOLIOS TRUST — MASTER INVESTMENT PORTFOLIOS |
| The Internet Portfolio |
Portfolio of Investments — December 31, 2012 — (Continued) |
| Identifier | | | Shares | | | Value |
| | | Gaming — 1.11% | | | | |
| 200 HK | | Melco International Development Limited | 1,500,000 | | $ | 1,743,680 |
| | | Global Exchanges — 1.14% | | | | |
| EXAE GA | | Hellenic Exchanges S.A. Holding Clearing | | | | |
| | | Settlement and Registry | 20,000 | | | 114,836 |
| 8697 JP | | Japan Exchange Group Inc. | 3,300 | | | 163,791 |
| JSE SJ | | JSE Limited | 51,000 | | | 470,746 |
| SGX SP | | Singapore Exchange Limited | 180,000 | | | 1,032,950 |
| | | | | | | 1,782,323 |
| | | Holding Company — 3.42% | | | | |
| GBLS BB | | Groupe Bruxelles Lambert S.A. Strip VVPR*+ | 2,000 | | | 3 |
| IEP | | Icahn Enterprises LP | 27,000 | | | 1,206,900 |
| JSHLY | | Jardine Strategic Holdings Limited — ADR | 6,000 | | | 106,560 |
| LVNTA | | Liberty Ventures — Series A* | 59,600 | | | 4,038,496 |
| | | | | | | 5,351,959 |
| | | Insurance Carriers and Related Activities — 0.00% | | | | |
| AFSI | | AmTrust Financial Services, Inc.^ | 100 | | | 2,869 |
| | | Motion Picture and Sound Recording Industries — 1.89% | | | | |
| DWA | | DreamWorks Animation SKG, Inc. — Class A*^ | 179,100 | | | 2,967,687 |
| | | Motor Vehicle and Parts Dealers — 1.46% | | | | |
| AN | | AutoNation, Inc.*^ | 57,500 | | | 2,282,750 |
| | | Non-Store Retailers — 9.68% | | | | |
| CPRT | | Copart, Inc.* | 40,060 | | | 1,181,770 |
| EBAY | | eBay, Inc.* | 81,290 | | | 4,147,416 |
| HSNI | | HSN, Inc.^ | 13,200 | | | 727,056 |
| LINTA | | Liberty Interactive Corporation — Class A* | 215,300 | | | 4,237,104 |
| OSTK | | Overstock.com, Inc.* | 1,000 | | | 14,310 |
| RBA | | Ritchie Bros. Auctioneers, Incorporated^ | 144,000 | | | 3,008,160 |
| SOHU | | Sohu.com Inc.*^ | 18,000 | | | 852,120 |
| BID | | Sotheby’s^ | 30,000 | | | 1,008,600 |
| | | | | | | 15,176,536 |
| | | Other Exchanges — 0.35% | | | | |
| FTIS LI | | Financial Technologies (India) Ltd. — GDR | 144,000 | | | 316,800 |
| URB/A CN | | Urbana Corporation — Class A* | 240,000 | | | 234,040 |
| | | | | | | 550,840 |
The accompanying notes are an integral part of these financial statements.
| KINETICS PORTFOLIOS TRUST — MASTER INVESTMENT PORTFOLIOS |
| The Internet Portfolio |
Portfolio of Investments — December 31, 2012 — (Continued) |
| Identifier | | | Shares | | | Value |
| | | Other Information Services — 6.42% | | | | |
| GOOG | | Google Inc. — Class A* | 9,000 | | $ | 6,384,330 |
| NTES | | NetEase.com Inc. — ADR* | 11,320 | | | 481,666 |
| SINA | | SINA Corporation* | 40,000 | | | 2,008,800 |
| YHOO | | Yahoo! Inc.* | 60,000 | | | 1,194,000 |
| | | | | | | 10,068,796 |
| | | Performing Arts, Spectator Sports, and Related Industries — 3.56% | | | | |
| LYV | | Live Nation Entertainment, Inc.*^ | 184,800 | | | 1,720,488 |
| MSG | | The Madison Square Garden Company — Class A* | 87,100 | | | 3,862,885 |
| | | | | | | 5,583,373 |
| | | Professional, Scientific, and Technical Services — 1.61% | | | | |
| CTSH | | Cognizant Technology Solutions Corporation — Class A* | 20,000 | | | 1,481,000 |
| ICGE | | ICG Group Inc.* | 15,000 | | | 171,450 |
| INFY | | Infosys Technologies Limited — ADR^ | 20,000 | | | 846,000 |
| MWW | | Monster Worldwide, Inc.*^ | 2,000 | | | 11,240 |
| WYY | | WidePoint Corp.* | 39,062 | | | 14,453 |
| | | | | | | 2,524,143 |
| | | Publishing Industries (except Internet) — 0.52% | | | | |
| SSP | | The E.W. Scripps Company — Class A* | 76,000 | | | 821,560 |
| | | Rental and Leasing Services — 0.62% | | | | |
| CDCO | | Comdisco Holding Company, Inc.* | 194,400 | | | 970,056 |
| | | Satellite Telecommunications — 13.05% | | | | |
| DISH | | DISH Network Corp. — Class A | 142,400 | | | 5,183,360 |
| SATS | | EchoStar Corporation — Class A* | 181,700 | | | 6,217,774 |
| LBTYK | | Liberty Global, Inc. — Series C* | 96,000 | | | 5,640,000 |
| LORL | | Loral Space & Communications Inc. | 27,800 | | | 1,519,548 |
| 2008 HK | | Phoenix Satellite Television Holdings Limited | 4,400,000 | | | 1,424,876 |
| VSAT | | ViaSat, Inc.*^ | 11,800 | | | 459,020 |
| | | | | | | 20,444,578 |
| | | Securities, Commodity Contracts, and Other Financial Investments | | | | |
| | | and Related Activities — 1.23% | | | | |
| CBOE | | CBOE Holdings Inc. | 1,800 | | | 53,028 |
| COWN | | Cowen Group, Inc. — Class A*^ | 95,100 | | | 232,995 |
| ICE | | IntercontinentalExchange Inc.* | 11,500 | | | 1,423,815 |
| MKTX | | MarketAxess Holdings, Inc. | 6,000 | | | 211,800 |
| | | | | | | 1,921,638 |
The accompanying notes are an integral part of these financial statements.
KINETICS PORTFOLIOS TRUST — MASTER INVESTMENT PORTFOLIOS The Internet Portfolio Portfolio of Investments — December 31, 2012 — (Continued) |
| Identifier | | | Shares | | Value |
| | | Special Purpose Entity — 0.00% | | | | | |
| ADPAO | | Adelphia Contingent Value Vehicle CVV Series ACC-4 Int*+ | | 250,827 | | $ | — |
| ADPAL | | Adelphia Recovery Trust Series ACC-6 E/F Int*+ | | 4,878,645 | | | — |
| | | | | | | | — |
| | | Telecommunications — 1.25% | | | | | |
| CHU | | China Unicom (Hong Kong) Limited — ADR^ | | 50,000 | | | 814,500 |
| HTHKY | | Hutchison Telecommunications | | | | | |
| | | Hong Kong Holdings Limited — ADR^ | | 45,000 | | | 310,050 |
| 215 HK | | Hutchinson Telecommunications | | | | | |
| | | Hong Kong Holdings Limited | | 1,800,000 | | | 826,748 |
| ICTG | | ICTC Group Inc.* | | 149 | | | 3,502 |
| | | | | | | | 1,954,800 |
| | | U.S. Equity Exchanges — 0.40% | | | | | |
| NYX | | NYSE Euronext | | 19,830 | | | 625,438 |
| | | Warehousing and Storage — 0.80% | | | | | |
| IRM | | Iron Mountain Incorporated^ | | 40,446 | | | 1,255,848 |
| | | TOTAL COMMON STOCKS | | | | | |
| | | (cost $92,624,754) | | | | | 132,397,534 |
| | | | | | | |
| | | ESCROW NOTES — 0.00% | Principal Amount | | | |
| | | Special Purpose Entity — 0.00% | | | | | |
| 006ESCBG1 | | Adelphia Communications Corp.*+ | $ | 200,000 | | | — |
| 006ESC958 | | Adelphia Communications Corp. Preferred*+ | | 190,000 | | | — |
| | | TOTAL ESCROW NOTES | | | | | |
| | | (cost $0) | | | | | — |
| | | RIGHTS — 0.55% | Shares | | | |
| | | Rental and Leasing Services — 0.55% | | | | | |
| CDCOR | | Comdisco Holding Company, Inc | | | | | |
| | | Expiration Date: 12/31/2050 | | | | | |
| | | Strike Price: $1.00*# | | 12,240,699 | | | 858,073 |
| | | TOTAL RIGHTS | | | | | |
| | | (cost $2,643,576) | | | | | 858,073 |
The accompanying notes are an integral part of these financial statements.
KINETICS PORTFOLIOS TRUST — MASTER INVESTMENT PORTFOLIOS The Internet Portfolio Portfolio of Investments — December 31, 2012 — (Continued) |
| Identifier | | SHORT-TERM INVESTMENTS — 9.05% | Principal Amount | | Value |
| | | Commercial Paper — 4.58% | | | | | |
| 026824820 | | U.S. Bank N.A. 0.02%, 01/02/2013 | $ | 7,180,000 | | $ | 7,180,000 |
| | | | Shares | | | |
| | | Money Market Funds — 4.47% | | | | | |
| FIGXX | | Fidelity Institutional Government Portfolio — Class I, 0.01%b | | 7,010,000 | | | 7,010,000 |
| | | TOTAL SHORT-TERM INVESTMENTS | | | | | |
| | | (cost $14,190,000) | | | | | 14,190,000 |
| | | INVESTMENTS PURCHASED WITH | | | | | |
| | | THE CASH PROCEEDS FROM | | | | | |
| | | SECURITIES LENDING — 20.00% | | | | | |
| | | Money Market Funds — 20.00% | | | | | |
| | | Mount Vernon Securities Lending Trust — Prime | | | | | |
| | | Portfolio, 0.27%b | | 31,348,658 | | | 31,348,658 |
| | | TOTAL INVESTMENTS PURCHASED WITH THE CASH | | | | | |
| | | PROCEEDS FROM SECURITIES LENDING | | | | | |
| | | (cost $31,348,658) | | | | | 31,348,658 |
| | | TOTAL INVESTMENTS — 114.09% | | | | | |
| | | (cost $140,806,988) | | | | $ | 178,794,265 |
Percentages are stated as a percent of net assets.
| * — | Non-income producing security. |
| ^ — | This security or a portion of this security was out on loan at December 31, 2012. Total loaned securities had a market value of $30,785,147 at December 31, 2012. |
| + — | Security is considered illiquid and was fair valued. The aggregate value of such securities is $3 or 0.00% of net assets. |
| # — | Contingent value right (contingent upon profitability of company). |
b — | The rate quoted is the annualized seven-day yield as of December 31, 2012. |
ADR — American Depository Receipt.
GDR — Global Depository Receipt.
The accompanying notes are an integral part of these financial statements.
KINETICS PORTFOLIOS TRUST — MASTER INVESTMENT PORTFOLIOS The Global Portfolio Portfolio of Investments — December 31, 2012 — (Continued) |
| Identifier | | COMMON STOCKS — 93.80% | Shares | | Value |
| | | Apparel Manufacturing — 3.92% | | | | | |
| MC FP | | LVMH Moet Hennessy Louis Vuitton SA | | 1,400 | | $ | 256,494 |
| | | | | | | | |
| | | Arts, Entertainment, and Recreation — 0.19% | | | | | |
| 585 HK | | Imagi International Holdings Limited* | | 1,000,000 | | | 12,644 |
| | | Asset Management — 15.46% | | | | | |
| BX | | The Blackstone Group LP | | 2,150 | | | 33,519 |
| BAM | | Brookfield Asset Management Inc. — Class A^ | | 4,900 | | | 179,585 |
| DDEJF | | Dundee Corporation — Class A* | | 5,300 | | | 163,807 |
| JZCP LN | | JZ Capital Partners Ltd. | | 10,000 | | | 71,801 |
| ONEXF | | Onex Corporation | | 6,675 | | | 282,152 |
| RCP LN | | RIT Capital Partners plc | | 7,400 | | | 135,957 |
| 806 HK | | Value Partners Group Limited | | 218,000 | | | 144,005 |
| | | | | | | | 1,010,826 |
| | | Broadcasting (except Internet) — 4.43% | | | | | |
| LMCA | | Liberty Media Corporation — Liberty Capital — Series A* | | 2,494 | | | 289,329 |
| | | Building Material and Garden Equipment and Supplies Dealers — 0.01% | | | | | |
| OSH | | Orchard Supply Hardware Stores Corporation — Class A* | | 132 | | | 978 |
| | | Construction of Buildings — 2.82% | | | | | |
| BRP | | Brookfield Residential Properties Inc.* | | 9,865 | | | 176,978 |
| LEN | | Lennar Corporation — Class A^ | | 200 | | | 7,734 |
| | | | | | | | 184,712 |
| | | Crop Production — 0.22% | | | | | |
| CRESY | | Cresud S.A.C.I.F.y A. — ADR | | 1,765 | | | 14,685 |
| | | Electronics and Appliance Stores — 0.90% | | | | | |
| SHOS | | Sears Hometown and Outlet Stores Inc.* | | 1,800 | | | 58,608 |
| | | European Exchanges — 1.17% | | | | | |
| BME SM | | Bolsas y Mercados Espanoles | | 3,130 | | | 76,226 |
| | | Gaming — 2.64% | | | | | |
| WYNN | | Wynn Resorts Limited^ | | 1,535 | | | 172,672 |
| | | General Merchandise Stores — 2.60% | | | | | |
| JCP | | J.C. Penney Company, Inc.^ | | 400 | | | 7,884 |
| SCC CN | | Sears Canada Inc.^ | | 1,520 | | | 15,357 |
| SHLD | | Sears Holdings Corporation*^ | | 3,550 | | | 146,828 |
| | | | | | | | 170,069 |
The accompanying notes are an integral part of these financial statements.
KINETICS PORTFOLIOS TRUST — MASTER INVESTMENT PORTFOLIOS The Global Portfolio Portfolio of Investments — December 31, 2012 — (Continued) |
| Identifier | | | Shares | | Value |
| | | Global Exchanges — 2.16% | | | | | |
| BVMF3 BZ | | BM&FBOVESPA SA | | 9,470 | | $ | 64,752 |
| EXAE GA | | Hellenic Exchanges SA Holding Clearing Settlement and Registry | | 4,000 | | | 22,967 |
| SGX SP | | Singapore Exchange Limited | | 9,275 | | | 53,226 |
| | | | | | | | 140,945 |
| | | Holding Company — 16.65% | | | | | |
| BOL FP | | Bollore SA | | 825 | | | 280,518 |
| HPAR SP | | Haw Par Corporation Limited | | 1,600 | | | 8,802 |
| IEP | | Icahn Enterprises LP | | 4,727 | | | 211,297 |
| JS SP | | Jardine Strategic Holdings Limited | | 6,170 | | | 219,158 |
| LUK | | Leucadia National Corporation^ | | 8,100 | | | 192,699 |
| LVNTA | | Liberty Ventures — Series A* | | 2,600 | | | 176,176 |
| | | | | | | | 1,088,650 |
| | | Insurance Carriers and Related Activities — 3.09% | | | | | |
| FFH CN | | Fairfax Financial Holdings Limited^ | | 150 | | | 54,069 |
| GLRE | | Greenlight Capital Re, Ltd. — Class A*^ | | 6,400 | | | 147,712 |
| | | | | | | | 201,781 |
| | | Lessors of Nonresidential Buildings (except Miniwarehouses) — 2.43% | | | | | |
| RSE | | Rouse Properties, Inc.^ | | 9,400 | | | 159,048 |
| | | Merchant Wholesalers, Durable Goods — 4.66% | | | | | |
| CFR VX | | Compagnie Financiere Richemont SA | | 3,900 | | | 304,444 |
| | | Merchant Wholesalers, Nondurable Goods — 1.46% | | | | | |
| GLEN LN | | Glencore International PLC | | 16,710 | | | 95,359 |
| | | Mining (except Oil and Gas) — 3.08% | | | | | |
| ELT AU | | Elementos Limited* | | 9,081 | | | 236 |
| FNV | | Franco-Nevada Corporation^ | | 3,185 | | | 182,086 |
| NCQ | | NovaCopper Inc.* | | 666 | | | 1,206 |
| NG | | NovaGold Resources Inc.* | | 4,000 | | | 18,040 |
| | | | | | | | 201,568 |
| | | Motion Picture and Sound Recording Industries — 1.09% | | | | | |
| DWA | | DreamWorks Animation SKG, Inc. — Class A*^ | | 4,300 | | | 71,251 |
| | | Non-Store Retailers — 2.05% | | | | | |
| LINTA | | Liberty Interactive Corporation — Class A* | | 6,800 | | | 133,824 |
| | | Oil and Gas — 0.82% | | | | | |
| TPL | | Texas Pacific Land Trust | | 1,000 | | | 53,430 |
The accompanying notes are an integral part of these financial statements.
KINETICS PORTFOLIOS TRUST — MASTER INVESTMENT PORTFOLIOS The Global Portfolio Portfolio of Investments — December 31, 2012 — (Continued) |
| Identifier | | | Shares | | Value |
| | | Oil and Gas Extraction — 3.48% | | | | | |
| CNQ | | Canadian Natural Resources Ltd. | | 690 | | $ | 19,920 |
| CLR | | Continental Resources, Inc.* | | 1,050 | | | 77,164 |
| MPNG FP | | Maurel et Prom Nigeria* | | 1,000 | | | 2,957 |
| POU CN | | Paramount Resources Ltd. — Class A* | | 1,410 | | | 45,360 |
| TOU CN | | Tourmaline Oil Corp.* | | 2,615 | | | 82,102 |
| | | | | | | | 227,503 |
| | | Professional, Scientific, and Technical Services — 0.15% | | | | | |
| ICLL AV | | Intercell AG* | | 4,000 | | | 9,578 |
| | | Publishing Industries (except Internet) — 0.09% | | | | | |
| PRS SM | | Promotora de Informaciones S.A. — Class A* | | 18,310 | | | 5,680 |
| | | Real Estate — 12.11% | | | | | |
| ABP AU | | Abacus Property Group | | 16,000 | | | 35,889 |
| BRE CN | | Brookfield Real Estate Services, Inc. | | 5,050 | | | 64,070 |
| CWT-U CN | | Calloway — REIT | | 5,100 | | | 148,432 |
| CIT SP | | City Developments Limited | | 10,715 | | | 112,891 |
| FCE/A | | Forest City Enterprises, Inc. — Class A* | | 18,505 | | | 298,856 |
| 823 HK | | The Link — REIT | | 20,000 | | | 99,860 |
| UOL SP | | UOL Group Ltd. | | 6,520 | | | 31,865 |
| | | | | | | | 791,863 |
| | | Restaurants — 2.15% | | | | | |
| WEN | | The Wendy’s Company^ | | 29,900 | | | 140,530 |
| | | Satellite Telecommunications — 0.67% | | | | | |
| DISH | | DISH Network Corp. — Class A | | 1,200 | | | 43,680 |
| | | Support Activities for Transportation — 3.30% | | | | | |
| 694 HK | | Beijing Capital International Airport Company Limited — Class H | | 301,000 | | | 215,531 |
| | | TOTAL COMMON STOCKS | | | | | |
| | | (cost $5,493,316) | | | | | 6,131,908 |
| | | PREFERRED STOCKS — 0.00% | | | | | |
| | | Building Material and Garden Equipment and Supplies Dealers — 0.00% | | | | | |
| OSHUS | | Orchard Supply Hardware Stores Corporation — Series A*^ | | 132 | | | 238 |
| | | TOTAL PREFERRED STOCKS | | | | | |
| | | (cost $191) | | | | | 238 |
The accompanying notes are an integral part of these financial statements.
KINETICS PORTFOLIOS TRUST — MASTER INVESTMENT PORTFOLIOS The Global Portfolio Portfolio of Investments — December 31, 2012 — (Continued) |
| Identifier | | WARRANTS — 0.00% | Shares | | Value |
| | | Oil and Gas and Consumable Fuels — 0.00% | | | | | |
| MAUBS FP | | Etablissements Maurel et Prom | | | | | |
| | | Expiration Date: 6/30/2014 | | | | | |
| | | Exercise Price: $14.20* | | 1,000 | | $ | 293 |
| | | TOTAL WARRANTS | | | | | |
| | | (cost $0) | | | | | 293 |
| | | SHORT-TERM INVESTMENTS — 6.32% | Principal Amount | | | |
| | | Commercial Paper — 4.67% | | | | | |
| 026824820 | | U.S. Bank N.A 0.02%, 01/02/2013 | $ | 305,000 | | | 305,000 |
| | | | | | | | |
| | | | Shares | | | |
| | | Money Market Funds — 1.65% | | | | | |
| FIGXX | | Fidelity Institutional Government Portfolio — Class I, 0.01%b | | 108,135 | | | 108,135 |
| | | TOTAL SHORT-TERM INVESTMENTS | | | | | |
| | | (cost $413,135) | | | | | 413,135 |
| | | INVESTMENTS PURCHASED WITH | | | | | |
| | | THE CASH PROCEEDS FROM | | | | | |
| | | SECURITIES LENDING — 18.96% | | | | | |
| | | Money Market Funds — 18.96% | | | | | |
| | | Mount Vernon Securities Lending Trust — Prime Portfolio, 0.27%b | | 1,239,466 | | | 1,239,466 |
| | | TOTAL INVESTMENTS PURCHASED WITH THE CASH | | | | | |
| | | PROCEEDS FROM SECURITIES LENDING | | | | | |
| | | (cost $1,239,466) | | | | | 1,239,466 |
| | | TOTAL INVESTMENTS — 119.08% | | | | | |
| | | (cost $7,146,108) | | | | $ | 7,785,040 |
Percentages are stated as a percent of net assets.
| * — | Non-income producing security. |
| ^ — | This security or a portion of this security was out on loan at December 31, 2012. Total loaned securities had a market value of $1,211,561 at December 31, 2012. |
b — | The rate quoted is the annualized seven-day yield as of December 31, 2012 |
ADR — American Depository Receipt.
REIT — Real Estate Investment Trust.
The accompanying notes are an integral part of these financial statements.
KINETICS PORTFOLIOS TRUST — MASTER INVESTMENT PORTFOLIOS The Paradigm Portfolio Portfolio of Investments — December 31, 2012 — (Continued) |
| Identifier | | COMMON STOCKS — 92.22% | Shares | | Value |
| | | Apparel Manufacturing — 0.02% | | | | | |
| LVMUY | | LVMH Moet Hennessy Louis Vuitton SA — ADR^ | | 5,200 | | $ | 195,988 |
| | | Asset Management — 6.76% | | | | | |
| BNBMF | | BAM Investments Ltd.* | | 400 | | | 7,238 |
| BAM | | Brookfield Asset Management Inc. — Class A | | 1,273,390 | | | 46,669,743 |
| DDEJF | | Dundee Corporation — Class A* | | 28,400 | | | 877,759 |
| JZCP LN | | JZ Capital Partners Ltd. | | 15,200 | | | 109,138 |
| OAK | | Oaktree Capital Group LLC | | 1,500 | | | 68,235 |
| ONEXF | | Onex Corporation | | 190,600 | | | 8,056,662 |
| RCP LN | | RIT Capital Partners plc | | 30,800 | | | 565,877 |
| 806 HK | | Value Partners Group Limited | | 3,649,000 | | | 2,410,430 |
| WETF | | WisdomTree Investments, Inc.* | | 150,000 | | | 918,000 |
| | | | | | | | 59,683,082 |
| | | Beverage and Tobacco Product Manufacturing — 0.01% | | | | | |
| BF/A | | Brown-Forman Corporation — Class A | | 450 | | | 27,814 |
| PM | | Philip Morris International, Inc. | | 750 | | | 62,730 |
| | | | | | | | 90,544 |
| | | Broadcasting (except Internet) — 14.48% | | | | | |
| CBS | | CBS Corporation — Class B | | 559,720 | | | 21,297,346 |
| DISCA | | Discovery Communications, Inc. — Class A*^ | | 389,623 | | | 24,733,268 |
| LMCA | | Liberty Media Corporation — Liberty Capital — Series A* | | 583,044 | | | 67,638,935 |
| SNI | | Scripps Networks Interactive — Class A^ | | 69,973 | | | 4,052,836 |
| VIAB | | Viacom Inc. — Class B | | 192,600 | | | 10,157,724 |
| | | | | | | | 127,880,109 |
| | | Building Material and Garden Equipment and Supplies Dealers — 0.02% | | | | | |
| OSH | | Orchard Supply Hardware Stores Corporation — Class A* | | 23,155 | | | 171,579 |
| | | Chemical Manufacturing — 1.23% | | | | | |
| OPK | | OPKO Health, Inc.*^ | | 4,000 | | | 19,240 |
| SIAL | | Sigma-Aldrich Corporation^ | | 145,815 | | | 10,729,068 |
| VHI | | Valhi, Inc. | | 6,000 | | | 75,000 |
| | | | | | | | 10,823,308 |
| | | Clothing and Clothing Accessories Stores — 0.14% | | | | | |
| LTD | | Limited Brands, Inc.^ | | 25,600 | | | 1,204,736 |
The accompanying notes are an integral part of these financial statements.
KINETICS PORTFOLIOS TRUST — MASTER INVESTMENT PORTFOLIOS The Paradigm Portfolio Portfolio of Investments — December 31, 2012 — (Continued) |
| Identifier | | | Shares | | Value |
| | | Construction of Buildings — 0.16% | | | | | |
| BRP | | Brookfield Residential Properties Inc.* | | 22,800 | | $ | 409,032 |
| LEN | | Lennar Corporation — Class A^ | | 26,300 | | | 1,017,021 |
| | | | | | | | 1,426,053 |
| | | Credit Intermediation and Related Activities — 0.00% | | | | | |
| UCBHQ | | UCBH Holdings, Inc.*^+ | | 112,751 | | | — |
| | | E-Commerce — 0.22% | | | | | |
| IACI | | IAC/InterActiveCorp | | 41,900 | | | 1,981,870 |
| | | Electronics and Appliance Stores — 0.35% | | | | | |
| SHOS | | Sears Hometown and Outlet Stores Inc.* | | 96,100 | | | 3,129,016 |
| | | Gaming — 4.30% | | | | | |
| LVS | | Las Vegas Sands Corp.^ | | 365,800 | | | 16,885,328 |
| MGM | | MGM Resorts International* | | 481,600 | | | 5,605,824 |
| WYNN | | Wynn Resorts Limited^ | | 137,495 | | | 15,466,813 |
| | | | | | | | 37,957,965 |
| | | General Merchandise Stores — 3.21% | | | | | |
| FDO | | Family Dollar Stores, Inc. | | 4,600 | | | 291,686 |
| JCP | | J.C. Penney Company, Inc.^ | | 303,900 | | | 5,989,869 |
| SCC CN | | Sears Canada Inc.^ | | 483,878 | | | 4,888,885 |
| SHLD | | Sears Holdings Corporation*^ | | 415,100 | | | 17,168,536 |
| | | | | | | | 28,338,976 |
| | | Global Exchanges — 0.83% | | | | | |
| EXAE GA | | Hellenic Exchanges S.A. Holding Clearing Settlement and Registry | | 36,000 | | | 206,705 |
| 8697 JP | | Japan Exchange Group Inc. | | 59,600 | | | 2,958,158 |
| JSE SJ | | JSE Limited | | 448,000 | | | 4,135,181 |
| | | | | | | | 7,300,044 |
| | | Holding Company — 9.62% | | | | | |
| BOL FP | | Bollore SA | | 5,200 | | | 1,768,110 |
| GBLS BB | | Groupe Bruxelles Lambert S.A. Strip VVPR*+ | | 23,520 | | | 31 |
| IEP | | Icahn Enterprises LP | | 761,642 | | | 34,045,397 |
| JSHLY | | Jardine Strategic Holdings Limited — ADR | | 14,400 | | | 255,744 |
| JS SP | | Jardine Strategic Holdings Limited | | 64,800 | | | 2,301,696 |
| LUK | | Leucadia National Corporation^ | | 1,701,200 | | | 40,471,548 |
| LVNTA | | Liberty Ventures — Series A* | | 90,400 | | | 6,125,504 |
| | | | | | | | 84,968,030 |
The accompanying notes are an integral part of these financial statements.
KINETICS PORTFOLIOS TRUST — MASTER INVESTMENT PORTFOLIOS The Paradigm Portfolio Portfolio of Investments — December 31, 2012 — (Continued) |
| Identifier | | | Shares | | Value |
| | | Insurance Carriers and Related Activities — 1.12% | | | | | |
| MKL | | Markel Corporation* | | 22,732 | | $ | 9,852,503 |
| | | Lessors of Nonresidential Buildings (except Miniwarehouses) — 7.27% | | | | | |
| ALX | | Alexander’s, Inc. — REIT^ | | 5,091 | | | 1,684,103 |
| HHC | | The Howard Hughes Corporation* | | 790,180 | | | 57,698,943 |
| RSE | | Rouse Properties, Inc.^ | | 283,700 | | | 4,800,204 |
| | | | | | | | 64,183,250 |
| | | Lessors of Residential Buildings and Dwellings — 1.87% | | | | | |
| ELS | | Equity Lifestyle Properties, Inc. — REIT | | 245,870 | | | 16,544,592 |
| | | Machinery Manufacturing — 0.08% | | | | | |
| CFX | | Colfax Corporation*^ | | 17,300 | | | 698,055 |
| | | Manufactured Brands — 2.10% | | | | | |
| JAH | | Jarden Corporation* | | 357,943 | | | 18,505,653 |
| | | Merchant Wholesalers, Nondurable Goods — 0.01% | | | | | |
| GLEN LN | | Glencore International PLC | | 12,000 | | | 68,481 |
| NOBGY | | Noble Group Limited — ADR | | 1,200 | | | 22,572 |
| | | | | | | | 91,053 |
| | | Mining (except Oil and Gas) — 2.54% | | | | | |
| FNV | | Franco-Nevada Corporation^ | | 392,100 | | | 22,416,357 |
| | | Motion Picture and Sound Recording Industries — 3.48% | | | | | |
| DWA | | DreamWorks Animation SKG, Inc. — Class A*^ | | 1,856,860 | | | 30,768,170 |
| | | Motor Vehicle and Parts Dealers — 5.05% | | | | | |
| AN | | AutoNation, Inc.*^ | | 1,123,100 | | | 44,587,070 |
| | | Non-Store Retailers — 2.54% | | | | | |
| LINTA | | Liberty Interactive Corporation — Class A* | | 1,137,800 | | | 22,391,904 |
| | | Oil and Gas — 1.52% | | | | | |
| TPL | | Texas Pacific Land Trust | | 251,100 | | | 13,416,273 |
| | | Oil and Gas Extraction — 4.14% | | | | | |
| CNQ | | Canadian Natural Resources Ltd. | | 408,000 | | | 11,778,960 |
| CLR | | Continental Resources, Inc.* | | 112,990 | | | 8,303,635 |
| TOU CN | | Tourmaline Oil Corp.* | | 518,690 | | | 16,284,999 |
| WPX | | WPX Energy Inc.*^ | | 12,000 | | | 178,560 |
| | | | | | | | 36,546,154 |
The accompanying notes are an integral part of these financial statements.
KINETICS PORTFOLIOS TRUST — MASTER INVESTMENT PORTFOLIOS The Paradigm Portfolio Portfolio of Investments — December 31, 2012 — (Continued) |
| Identifier | | | Shares | | Value |
| | | Other Exchanges — 0.04% | | | | | |
| URB/A CN | | Urbana Corporation — Class A* | | 398,178 | | $ | 388,291 |
| | | Other Information Services — 0.00% | | | | | |
| GOOG | | Google Inc. — Class A* | | 30 | | | 21,281 |
| | | Performing Arts, Spectator Sports, and Related Industries — 2.07% | | | | | |
| LYV | | Live Nation Entertainment, Inc.*^ | | 1,965,200 | | | 18,296,012 |
| | | Real Estate — 5.50% | | | | | |
| CWT-U CN | | Calloway — REIT | | 23,200 | | | 675,219 |
| FCE/A | | Forest City Enterprises, Inc. — Class A* | | 1,552,242 | | | 25,068,708 |
| 10 HK | | Hang Lung Group Limited | | 520,000 | | | 2,955,289 |
| 12 HK | | Henderson Land Development Company Limited | | 1,700,000 | | | 11,997,394 |
| VNO | | Vornado Realty Trust — REIT | | 98,869 | | | 7,917,429 |
| | | | | | | | 48,614,039 |
| | | Restaurants — 1.22% | | | | | |
| BKW | | Burger King Worldwide Inc.^ | | 1,000 | | | 16,440 |
| WEN | | The Wendy’s Company | | 2,290,600 | | | 10,765,820 |
| | | | | | | | 10,782,260 |
| | | Satellite Telecommunications — 4.97% | | | | | |
| DISH | | DISH Network Corp. — Class A | | 709,100 | | | 25,811,240 |
| SATS | | EchoStar Corporation — Class A* | | 509,500 | | | 17,435,090 |
| LORL | | Loral Space & Communications Inc. | | 300 | | | 16,398 |
| VSAT | | ViaSat, Inc.*^ | | 16,800 | | | 653,520 |
| | | | | | | | 43,916,248 |
| | | Securities, Commodity Contracts, and Other Financial Investments and Related | | | | | |
| | | Activities — 2.67% | | | | | |
| CBOE | | CBOE Holdings Inc.^ | | 801,926 | | | 23,624,740 |
| | | Support Activities for Transportation — 2.42% | | | | | |
| 694 HK | | Beijing Capital International Airport Company | | | | | |
| | | Limited — Class H | | 27,459,000 | | | 19,662,031 |
| 357 HK | | Hainan Meilan International Airport Company | | | | | |
| | | Limited — Class H | | 2,578,720 | | | 1,746,683 |
| | | | | | | | 21,408,714 |
| | | Utilities — 0.26% | | | | | |
| BIP | | Brookfield Infrastructure Partners LP^ | | 65,930 | | | 2,324,032 |
| | | TOTAL COMMON STOCKS | | | | | |
| | | (cost $769,393,729) | | | | | 814,527,951 |
The accompanying notes are an integral part of these financial statements.
KINETICS PORTFOLIOS TRUST — MASTER INVESTMENT PORTFOLIOS The Paradigm Portfolio Portfolio of Investments — December 31, 2012 — (Continued) |
| Identifier | | PREFERRED STOCKS — 0.01% | Shares | | Value |
| | | Building Material and Garden Equipment and Supplies Dealers — 0.01% | | | | | |
| OSHUS | | Orchard Supply Hardware Stores Corporation — Series A*^ | | 23,155 | | $ | 41,679 |
| | | TOTAL PREFERRED STOCKS | | | | | |
| | | (cost $42,129) | | | | | 41,679 |
| | | CONVERTIBLE BONDS — 0.53% | Principal Amount | | | |
| | | Real Estate — 0.53% | | | | | |
| 345550AK3 | | Forest City Enterprises, Inc. | | | | | |
| | | 3.625%, 10/15/2014 | $ | 4,000,000 | | | 4,722,500 |
| | | TOTAL CONVERTIBLE BONDS | | | | | |
| | | (cost $3,720,278) | | | | | 4,722,500 |
| | | SHORT-TERM INVESTMENTS — 6.39% | | | | | |
| | | Commercial Paper — 4.53% | | | | | |
| 026824820 | | U.S. Bank N.A. 0.02%, 01/02/2013 | | 40,000,000 | | | 40,000,000 |
| | | | | | | | |
| | | | Shares | | | |
| | | Money Market Funds — 1.86% | | | | | |
| FIGXX | | Fidelity Institutional Government Portfolio — Class I, 0.01%b | | 16,447,980 | | | 16,447,980 |
| | | TOTAL SHORT-TERM INVESTMENTS | | | | | |
| | | (cost $56,447,980) | | | | | 56,447,980 |
| | | INVESTMENTS PURCHASED WITH | | | | | |
| | | THE CASH PROCEEDS FROM | | | | | |
| | | SECURITIES LENDING — 17.01% | | | | | |
| | | Money Market Funds — 17.01% | | | | | |
| | | Mount Vernon Securities Lending Trust — | | | | | |
| | | Prime Portfolio, 0.27%b | | 150,222,140 | | | 150,222,140 |
| | | TOTAL INVESTMENTS PURCHASED WITH THE | | | | | |
| | | CASH PROCEEDS FROM SECURITIES LENDING | | | | | |
| | | (cost $150,222,140) | | | | | 150,222,140 |
| | | TOTAL INVESTMENTS — 116.16% | | | | | |
| | | (cost $979,826,256) | | | | $ | 1,025,962,250 |
The accompanying notes are an integral part of these financial statements.
KINETICS PORTFOLIOS TRUST — MASTER INVESTMENT PORTFOLIOS The Paradigm Portfolio Portfolio of Investments — December 31, 2012 — (Continued) |
Percentages are stated as a percent of net assets.
| *— | Non-income producing security. |
| ^ — | This security or a portion of this security was out on loan at December 31, 2012. Total loaned securities had a market value of $147,507,721 at December 31, 2012. |
| + — | Security is considered illiquid and was fair valued. The aggregate value of such securities is $31 or 0.00% of net assets. |
b — | The rate quoted is the annualized seven-day yield as of December 31, 2012. |
ADR — American Depository Receipt.
REIT — Real Estate Investment Trust.
The accompanying notes are an integral part of these financial statements.
KINETICS PORTFOLIOS TRUST — MASTER INVESTMENT PORTFOLIOS The Medical Portfolio Portfolio of Investments — December 31, 2012 — (Continued) |
| Identifier | | COMMON STOCKS — 99.51% | Shares | | Value |
| | | Ambulatory Health Care Services — 0.00% | | | | | |
| AVXT | | AVAX Technologies, Inc.* | | 50,000 | | $ | 230 |
| | | Chemical Manufacturing — 2.68% | | | | | |
| AGEN | | Agenus, Inc.*^ | | 148 | | | 607 |
| ALKS | | Alkermes PLC*^ | | 25,000 | | | 463,000 |
| APHB | | Ampliphi Biosciences Corp.* | | 1,000 | | | 175 |
| MMRF | | MMRGlobal Inc.* | | 43,000 | | | 800 |
| | | | | | | | 464,582 |
| | | Computer and Electronic Product Manufacturing — 0.01% | | | | | |
| TGX | | Theragenics Corporation* | | 655 | | | 1,041 |
| | | Pharmaceutical and Biotechnology — 93.02% | | | | | |
| ABT | | Abbott Laboratories | | 17,000 | | | 1,113,500 |
| AEZS | | AEterna Zentaris Inc.*^ | | 17,083 | | | 40,658 |
| ARNA | | Arena Pharmaceuticals, Inc.*^ | | 45,000 | | | 405,900 |
| ATB CN | | Atrium Innovations Inc.* | | 4,884 | | | 58,675 |
| BIIB | | Biogen Idec, Inc.* | | 7,250 | | | 1,063,358 |
| BPAX | | BioSante Pharmaceuticals, Inc.*^ | | 2,246 | | | 2,785 |
| BMY | | Bristol-Myers Squibb Company | | 35,000 | | | 1,140,650 |
| CLDX | | Celldex Therapeutics Inc.* | | 26,294 | | | 176,433 |
| CBST | | Cubist Pharmaceuticals, Inc.*^ | | 25,000 | | | 1,051,500 |
| DNDN | | Dendreon Corporation*^ | | 29,000 | | | 153,120 |
| LLY | | Eli Lilly & Company | | 25,000 | | | 1,233,000 |
| EPCT | | EpiCept Corporation* | | 680 | | | 39 |
| GSK | | GlaxoSmithKline plc — ADR | | 23,673 | | | 1,029,065 |
| IMGN | | ImmunoGen, Inc.*^ | | 14,000 | | | 178,500 |
| ISIS | | Isis Pharmaceuticals, Inc.*^ | | 29,000 | | | 303,340 |
| ISA CN | | Isotechnika Pharma Inc.* | | 40,000 | | | 2,212 |
| JNJ | | Johnson & Johnson^ | | 16,000 | | | 1,121,600 |
| LIFE | | Life Technologies Corporation* | | 24,000 | | | 1,177,920 |
| MAXY | | Maxygen, Inc. | | 41,000 | | | 100,860 |
| MRK | | Merck & Co., Inc. | | 11,000 | | | 450,340 |
| MYRX | | Myrexis Inc.* | | 74,000 | | | 209,420 |
| COX FP | | NicOx SA* | | 41,535 | | | 127,741 |
| NVS | | Novartis AG — ADR^ | | 19,000 | | | 1,202,700 |
| ONTY | | Oncothyreon, Inc.*^ | | 28,333 | | | 54,399 |
The accompanying notes are an integral part of these financial statements.
KINETICS PORTFOLIOS TRUST — MASTER INVESTMENT PORTFOLIOS The Medical Portfolio Portfolio of Investments — December 31, 2012 — (Continued) |
| Identifier | | | | Shares | | | Value |
| | | Pharmaceutical and Biotechnology — 93.02% (Continued) | | | | | |
| PTIE | | Pain Therapeutics, Inc.^ | | 38,000 | | $ | 102,980 |
| PFE | | Pfizer, Inc. | | 46,000 | | | 1,153,680 |
| PGNX | | Progenics Pharmaceuticals, Inc.* | | 65,200 | | | 194,296 |
| SNY | | Sanofi — ADR | | 27,000 | | | 1,279,260 |
| SCR | | Simcere Pharmaceutical Group — ADR*^ | | 48,000 | | | 385,920 |
| TELK | | Telik, Inc.* | | 3,866 | | | 5,064 |
| VICL | | Vical Incorporated*^ | | 82,500 | | | 240,075 |
| VPHM | | ViroPharma Incorporated*^ | | 15,000 | | | 341,400 |
| | | | | | | | 16,100,390 |
| | | Professional, Scientific, and Technical Services — 3.80% | | | | | |
| AFFX | | Affymetrix, Inc.*^ | | 104,000 | | | 329,680 |
| AMRI | | Albany Molecular Research, Inc.* | | 56,000 | | | 295,680 |
| CDXS | | Codexis, Inc.* | | 5,611 | | | 12,400 |
| PACB | | Pacific Biosciences of California Inc.*^ | | 12,000 | | | 20,400 |
| | | | | | | | 658,160 |
| | | TOTAL COMMON STOCKS | | | | | |
| | | (cost $18,429,670) | | | | | 17,224,403 |
| | | RIGHTS — 0.16% | | | | | |
| | | Funds, Trusts, and Other Financial Vehicles — 0.01% | | | | | |
| LGNYZ | | Ligand Pharmaceuticals Incorporated | | 44,000 | | | 308 |
| LGNXZ | | Ligand Pharmaceuticals Incorporated* | | 44,000 | | | 396 |
| LGNDZ | | Ligand Pharmaceuticals Incorporated* | | 44,000 | | | 704 |
| LGNZZ | | Ligand Pharmaceuticals Incorporated* | | 44,000 | | | 264 |
| | | | | | | | 1,672 |
| | | Pharmaceutical and Biotechnology — 0.15% | | | | | |
| GCVRZ | | Sanofi* | | 15,538 | | | 26,492 |
| | | TOTAL RIGHTS | | | | | |
| | | (cost $0) | | | | | 28,164 |
The accompanying notes are an integral part of these financial statements.
KINETICS PORTFOLIOS TRUST — MASTER INVESTMENT PORTFOLIOS The Medical Portfolio Portfolio of Investments — December 31, 2012 — (Continued) |
| Identifier | | SHORT-TERM INVESTMENTS — 0.37% | Shares | | Value |
| | | Money Market Funds — 0.37% | | | | | |
| FIGXX | | Fidelity Institutional Government Portfolio — Class I, 0.01% b | | 64,048 | | $ | 64,048 |
| | | TOTAL SHORT-TERM INVESTMENTS | | | | | |
| | | (cost $64,048) | | | | | 64,048 |
| | | INVESTMENTS PURCHASED WITH | | | | | |
| | | THE CASH PROCEEDS | | | | | |
| | | FROM SECURITIES LENDING — 34.72% | | | | | |
| | | Money Market Funds — 34.72% | | | | | |
| | | Mount Vernon Securities Lending Trust — | | | | | |
| | | Prime Portfolio, 0.27% b | | 6,008,866 | | $ | 6,008,866 |
| | | TOTAL INVESTMENTS PURCHASED WITH THE CASH | | | | | |
| | | PROCEEDS FROM SECURITIES LENDING | | | | | |
| | | (cost $6,008,866) | | | | | 6,008,866 |
| | | TOTAL INVESTMENTS — 134.76% | | | | | |
| | | (cost $24,502,584) | | | | $ | 23,325,481 |
Percentages are stated as a percent of net assets.
| * — | Non-income producing security. |
| ^ — | This security or a portion of this security was out on loan at December 31, 2012. Total loaned securities had a market value of $5,764,136 at December 31, 2012. |
b — | The rate quoted is the annualized seven-day yield as of December 31, 2012. |
ADR — American Depository Receipt.
The accompanying notes are an integral part of these financial statements.
KINETICS PORTFOLIOS TRUST — MASTER INVESTMENT PORTFOLIOS The Small Cap Opportunities Portfolio Portfolio of Investments — December 31, 2012 — (Continued) |
| Identifier | | COMMON STOCKS — 98.70% | Shares | | Value |
| | | Asset Management — 15.36% | | | | | |
| BNBMF | | BAM Investments Ltd.* | | 98,600 | | $ | 1,784,257 |
| DDEJF | | Dundee Corporation — Class A* | | 120,400 | | | 3,721,203 |
| JZCP LN | | JZ Capital Partners Ltd. | | 88,000 | | | 631,849 |
| OCX CN | | Onex Corporation | | 24,860 | | | 1,046,434 |
| RCP LN | | RIT Capital Partners plc | | 120,900 | | | 2,221,249 |
| SII CN | | Sprott, Inc. | | 1,680 | | | 6,688 |
| 806 HK | | Value Partners Group Limited | | 3,125,000 | | | 2,064,290 |
| WETF | | WisdomTree Investments, Inc.* | | 171,900 | | | 1,052,028 |
| | | | | | | | 12,527,998 |
| | | Automobile and Other Motor Vehicle Merchant Wholesalers — 0.80% | | | | | |
| VTU LN | | Vertu Motors PLC | | 975,000 | | | 651,990 |
| | | Chemical Manufacturing — 2.54% | | | | | |
| IPAR | | Inter Parfums, Inc. | | 106,700 | | | 2,076,382 |
| | | Construction of Buildings — 4.12% | | | | | |
| BRP | | Brookfield Residential Properties Inc.* | | 187,200 | | | 3,358,368 |
| | | Credit Intermediation and Related Activities — 0.61% | | | | | |
| BOKF | | BOK Financial Corporation | | 9,100 | | | 495,586 |
| | | Forestry and Logging — 0.03% | | | | | |
| KEWL | | Keweenaw Land Association Ltd.* | | 380 | | | 28,527 |
| | | Global Exchanges — 1.34% | | | | | |
| EXAE GA | | Hellenic Exchanges S.A. Holding Clearing | | | | | |
| | | Settlement and Registry | | 190,000 | | | 1,090,945 |
| | | Holding Company — 11.65% | | | | | |
| IEP | | Icahn Enterprises LP | | 188,200 | | | 8,412,540 |
| LVNTA | | Liberty Ventures — Series A* | | 16,100 | | | 1,090,936 |
| | | | | | | | 9,503,476 |
| | | Insurance Carriers and Related Activities — 3.47% | | | | | |
| AFSI | | AmTrust Financial Services, Inc.^ | | 60,150 | | | 1,725,703 |
| GLRE | | Greenlight Capital Re, Ltd. — Class A*^ | | 48,000 | | | 1,107,840 |
| | | | | | | | 2,833,543 |
| | | Lessors of Nonresidential Buildings (except Miniwarehouses) — 15.07% | | | | | |
| ALX | | Alexander’s, Inc. — REIT^ | | 800 | | | 264,640 |
| RSE | | Rouse Properties, Inc.^ | | 193,400 | | | 3,272,328 |
| HHC | | The Howard Hughes Corporation* | | 84,700 | | | 6,184,794 |
| FUR | | Winthrop Realty Trust — REIT | | 233,200 | | | 2,576,860 |
| | | | | | | | 12,298,622 |
The accompanying notes are an integral part of these financial statements.
KINETICS PORTFOLIOS TRUST — MASTER INVESTMENT PORTFOLIOS The Small Cap Opportunities Portfolio Portfolio of Investments — December 31, 2012 — (Continued) |
| Identifier | | | Shares | | Value |
| | | Lessors of Residential Buildings and Dwellings — 4.90% | | | | | |
| ELS | | Equity Lifestyle Properties, Inc. — REIT | | 59,400 | | $ | 3,997,026 |
| | | Machinery Manufacturing — 1.34% | | | | | |
| CFX | | Colfax Corporation*^ | | 27,100 | | | 1,093,485 |
| | | Manufactured Brands — 10.40% | | | | | |
| JAH | | Jarden Corporation* | | 132,700 | | | 6,860,590 |
| MOV | | Movado Group, Inc. | | 53,000 | | | 1,626,040 |
| | | | | | | | 8,486,630 |
| | | Merchant Wholesalers, Durable Goods — 0.83% | | | | | |
| DORM | | Dorman Products, Inc.^ | | 19,200 | | | 678,528 |
| | | Mining (except Oil and Gas) — 3.25% | | | | | |
| IMN CN | | Inmet Mining Corporation | | 27,400 | | | 2,038,679 |
| MUX | | McEwen Mining Inc.*^ | | 160,600 | | | 615,098 |
| | | | | | | | 2,653,777 |
| | | Motion Picture and Sound Recording Industries — 6.48% | | | | | |
| ASCMA | | Ascent Capital Group LLC — Class A* | | 29,700 | | | 1,839,618 |
| DWA | | DreamWorks Animation SKG, Inc. — Class A*^ | | 207,900 | | | 3,444,903 |
| | | | | | | | 5,284,521 |
| | | Motor Vehicle and Parts Dealers — 1.18% | | | | | |
| PAG | | Penske Automotive Group, Inc.^ | | 32,000 | | | 962,880 |
| | | Oil and Gas — 4.71% | | | | | |
| TPL | | Texas Pacific Land Trust | | 71,900 | | | 3,841,617 |
| | | Oil and Gas Extraction — 1.02% | | | | | |
| BLMC | | Biloxi Marsh Lands Corporation | | 100 | | | 990 |
| WPX | | WPX Energy Inc.*^ | | 55,800 | | | 830,304 |
| | | | | | | | 831,294 |
| | | Other Exchanges — 0.57% | | | | | |
| URB/A CN | | Urbana Corporation — Class A* | | 477,071 | | | 465,225 |
| | | Performing Arts, Spectator Sports, and Related Industries — 2.47% | | | | | |
| LYV | | Live Nation Entertainment, Inc.*^ | | 216,500 | | | 2,015,615 |
| | | Publishing Industries (except Internet) — 0.47% | | | | | |
| PRIS | | Promotora de Informaciones S.A. — ADR*^ | | 44,030 | | | 51,955 |
| PRIS/B US | | Promotora de Informaciones S.A. — Class B — ADR* | | 251,600 | | | 266,696 |
| VALU | | Value Line, Inc.^ | | 7,615 | | | 68,307 |
| | | | | | | | 386,958 |
The accompanying notes are an integral part of these financial statements.
KINETICS PORTFOLIOS TRUST — MASTER INVESTMENT PORTFOLIOS The Small Cap Opportunities Portfolio Portfolio of Investments — December 31, 2012 — (Continued) |
| Identifier | | | Shares | | Value |
| | | Rental and Leasing Services — 0.05% | | | | | |
| CDCO | | Comdisco Holding Company, Inc.*^ | | 7,560 | | $ | 37,724 |
| | | Restaurants — 4.09% | | | | | |
| WEN | | The Wendy’s Company | | 709,600 | | | 3,335,120 |
| | | Satellite Telecommunications — 1.26% | | | | | |
| LORL | | Loral Space & Communications Inc.^ | | 12,300 | | | 672,318 |
| VSAT | | ViaSat, Inc.*^ | | 9,200 | | | 357,880 |
| | | | | | | | 1,030,198 |
| | | Securities, Commodity Contracts, and Other Financial Investments and Related | | | | | |
| | | Activities — 0.62% | | | | | |
| CBOE | | CBOE Holdings Inc.^ | | 16,990 | | | 500,526 |
| RHJI BB | | RHJ International* | | 800 | | | 4,213 |
| | | | | | | | 504,739 |
| | | Telecommunications — 0.07% | | | | | |
| CIBY | | CIBL, Inc.* | | 18 | | | 16,200 |
| ICTG | | ICTC Group Inc.* | | 208 | | | 4,888 |
| LICT | | Lynch Interactive Corporation* | | 16 | | | 36,800 |
| | | | | | | | 57,888 |
| | | TOTAL COMMON STOCKS | | | | | |
| | | (cost $69,903,146) | | | | | 80,528,662 |
| | | RIGHTS — 0.48% | | | | | |
| | | Rental and Leasing Services — 0.48% | | | | | |
| CDCOR | | Comdisco Holding Company, Inc | | | | | |
| | | Expiration Date: 12/31/2050 | | | | | |
| | | Strike Price: $1.00*# | | 5,634,807 | | | 395,000 |
| | | TOTAL RIGHTS | | | | | |
| | | (cost $1,296,169) | | | | | 395,000 |
| | | SHORT-TERM INVESTMENTS — 0.85% | Principal Amount | | | |
| | | Commercial Paper — 0.76% | | | | | |
| 026824820 | | U.S. Bank N.A 0.02%, 01/02/2013 | | $ 615,000 | | | 615,000 |
The accompanying notes are an integral part of these financial statements.
KINETICS PORTFOLIOS TRUST — MASTER INVESTMENT PORTFOLIOS The Small Cap Opportunities Portfolio Portfolio of Investments — December 31, 2012 — (Continued) |
| Identifier | | | Shares | | Value |
| | | Money Market Funds — 0.09% | | | | | |
| FIGXX | | Fidelity Institutional Government Portfolio — Class I, 0.01%b | | 75,450 | | $ | 75,450 |
| | | TOTAL SHORT-TERM INVESTMENTS | | | | | |
| | | (cost $690,450) | | | | | 690,450 |
| | | INVESTMENTS PURCHASED WITH | | | | | |
| | | THE CASH PROCEEDS FROM | | | | | |
| | | SECURITIES LENDING — 20.77% | | | | | |
| | | Money Market Funds — 20.77% | | | | | |
| | | Mount Vernon Securities Lending Trust — | | | | | |
| | | Prime Portfolio, 0.27%b | | 16,943,635 | | | 16,943,635 |
| | | TOTAL INVESTMENTS PURCHASED WITH THE CASH | | | | | |
| | | PROCEEDS FROM SECURITIES LENDING | | | | | |
| | | (cost $16,943,635) | | | | | 16,943,635 |
| | | TOTAL INVESTMENTS — 120.80% | | | | | |
| | | (cost $88,833,400) | | | | $ | 98,557,747 |
Percentages are stated as a percent of net assets.
| *— | Non-income producing security. |
| ^ — | This security or a portion of this security was out on loan at December 31, 2012. Total loaned securities had a market value of $16,297,935 at December 31, 2012. |
b — | The rate quoted is the annualized seven-day yield as of December 31, 2012. |
| # — | Contingent value right (contingent upon profitability of company). |
ADR — American Depository Receipt.
REIT — Real Estate Investment Trust.
The accompanying notes are an integral part of these financial statements.
KINETICS PORTFOLIOS TRUST — MASTER INVESTMENT PORTFOLIOS The Market Opportunities Portfolio Portfolio of Investments — December 31, 2012 — (Continued) |
| Identifier | | COMMON STOCKS — 93.71% | Shares | | Value |
| | | Asset Management — 29.42% | | | | | |
| APO | | Apollo Global Management LLC — Class A^ | | 13,400 | | $ | 232,624 |
| BNBMF | | BAM Investments Ltd.* | | 41,500 | | | 750,980 |
| BX | | The Blackstone Group LP | | 68,399 | | | 1,066,341 |
| BAM | | Brookfield Asset Management Inc. — Class A | | 63,440 | | | 2,325,076 |
| CNS | | Cohen & Steers, Inc.^ | | 19,800 | | | 603,306 |
| DDEJF | | Dundee Corporation — Class A* | | 21,700 | | | 670,682 |
| EV | | Eaton Vance Corp.^ | | 12,800 | | | 407,680 |
| JZCP LN | | JZ Capital Partners Ltd. | | 60,000 | | | 430,806 |
| KKR | | KKR & Co. L.P | | 600 | | | 9,138 |
| OAK | | Oaktree Capital Group LLC^ | | 2,000 | | | 90,980 |
| OZM | | Och-Ziff Capital Management Group — Class A | | 2,400 | | | 22,800 |
| ONEXF | | Onex Corporation | | 40,400 | | | 1,707,708 |
| RCP LN | | RIT Capital Partners plc | | 26,200 | | | 481,363 |
| SII CN | | Sprott, Inc. | | 41,155 | | | 163,842 |
| TROW | | T. Rowe Price Group, Inc.^ | | 3,490 | | | 227,304 |
| 806 HK | | Value Partners Group Limited | | 1,544,000 | | | 1,019,924 |
| WETF | | WisdomTree Investments, Inc.* | | 429,600 | | | 2,629,152 |
| | | | | | | | 12,839,706 |
| | | Construction of Buildings — 0.63% | | | | | |
| BRP | | Brookfield Residential Properties Inc.* | | 15,400 | | | 276,276 |
| | | Credit Intermediation and Related Activities — 0.32% | | | | | |
| BBCN | | BBCN Bancorp, Inc. | | 6,164 | | | 71,317 |
| EWBC | | East West Bancorp, Inc. | | 3,204 | | | 68,854 |
| UCBHQ | | UCBH Holdings, Inc.*^+ | | 6,803 | | | — |
| | | | | | | | 140,171 |
| | | Data Processor — 4.95% | | | | | |
| FISV | | Fiserv, Inc.* | | 3,606 | | | 284,982 |
| MA | | MasterCard, Inc. — Class A^ | | 1,600 | | | 786,048 |
| V | | Visa, Inc. — Class A^ | | 7,200 | | | 1,091,376 |
| | | | | | | | 2,162,406 |
| | | Electronics and Appliance Stores — 0.05% | | | | | |
| SHOS | | Sears Hometown and Outlet Stores Inc.* | | 610 | | | 19,862 |
| | | European Exchanges — 0.79% | | | | | |
| DB1 GR | | Deutsche Boerse AG | | 5,650 | | | 344,623 |
| | | Gaming — 1.77% | | | | | |
| LVS | | Las Vegas Sands Corp.^ | | 16,690 | | | 770,410 |
The accompanying notes are an integral part of these financial statements.
KINETICS PORTFOLIOS TRUST — MASTER INVESTMENT PORTFOLIOS The Market Opportunities Portfolio Portfolio of Investments — December 31, 2012 — (Continued) |
| Identifier | | | Shares | | Value |
| | | General Merchandise Stores — 0.29% | | | | | |
| SCC CN | | Sears Canada Inc.^ | | 1,199 | | $ | 12,114 |
| SHLD | | Sears Holdings Corporation*^ | | 2,800 | | | 115,808 |
| | | | | | | | 127,922 |
| | | Global Exchanges — 5.23% | | | | | |
| EXAE GA | | Hellenic Exchanges S.A. Holding Clearing Settlement | | | | | |
| | | and Registry | | 21,600 | | | 124,023 |
| 8697 JP | | Japan Exchange Group Inc. | | 2,400 | | | 119,121 |
| JSE SJ | | JSE Limited | | 120,000 | | | 1,107,638 |
| SGX SP | | Singapore Exchange Limited | | 162,000 | | | 929,655 |
| | | | | | | | 2,280,437 |
| | | Holding Company — 9.42% | | | | | |
| IEP | | Icahn Enterprises LP | | 58,200 | | | 2,601,540 |
| LUK | | Leucadia National Corporation^ | | 50,500 | | | 1,201,395 |
| LVNTA | | Liberty Ventures — Series A* | | 4,574 | | | 309,934 |
| | | | | | | | 4,112,869 |
| | | Insurance Carriers and Related Activities — 1.86% | | | | | |
| AFSI | | AmTrust Financial Services, Inc.^ | | 440 | | | 12,624 |
| FRFHF | | Fairfax Financial Holdings Limited^ | | 260 | | | 93,860 |
| GLRE | | Greenlight Capital Re, Ltd. — Class A*^ | | 1,200 | | | 27,696 |
| MKL | | Markel Corporation*^ | | 523 | | | 226,679 |
| PWF CN | | Power Financial Corporation | | 16,400 | | | 449,116 |
| | | | | | | | 809,975 |
| | | Lessors of Nonresidential Buildings (except Miniwarehouses) — 9.23% | | | | | |
| HHC | | The Howard Hughes Corporation* | | 22,400 | | | 1,635,648 |
| RSE | | Rouse Properties, Inc.^ | | 141,400 | | | 2,392,488 |
| | | | | | | | 4,028,136 |
| | | Merchant Wholesalers, Nondurable Goods — 0.01% | | | | | |
| NOBGY | | Noble Group Limited — ADR | | 200 | | | 3,762 |
| | | Mining (except Oil and Gas) — 3.96% | | | | | |
| FNV | | Franco-Nevada Corporation^ | | 30,200 | | | 1,726,534 |
| | | Non-Store Retailers — 4.28% | | | | | |
| LINTA | | Liberty Interactive Corporation — Class A*^ | | 22,800 | | | 448,704 |
| BID | | Sotheby’s^ | | 42,278 | | | 1,421,386 |
| | | | | | | | 1,870,090 |
The accompanying notes are an integral part of these financial statements.
KINETICS PORTFOLIOS TRUST — MASTER INVESTMENT PORTFOLIOS The Market Opportunities Portfolio Portfolio of Investments — December 31, 2012 — (Continued) |
| Identifier | | | Shares | | Value |
| | | Oil and Gas — 3.01% | | | | | |
| TPL | | Texas Pacific Land Trust | | 24,600 | | $ | 1,314,378 |
| | | Other Exchanges — 2.11% | | | | | |
| FTIS LI | | Financial Technologies (India) Ltd. — GDR | | 96,180 | | | 211,596 |
| IMAREX NO | | IMAREX ASA | | 1,850 | | | 1,485 |
| NZX NZ | | NZX Ltd. | | 359,002 | | | 358,981 |
| URB/A CN | | Urbana Corporation — Class A* | | 356,004 | | | 347,164 |
| | | | | | | | 919,226 |
| | | Real Estate — 0.80% | | | | | |
| CWT-U CN | | Calloway — REIT | | 12,000 | | | 349,251 |
| | | Securities, Commodity Contracts, and Other Financial Investments and Related | | | | | |
| | | Activities — 13.44% | | | | | |
| CBOE | | CBOE Holdings Inc.^ | | 103,571 | | | 3,051,202 |
| CME | | CME Group, Inc. | | 9,140 | | | 463,489 |
| ICE | | IntercontinentalExchange Inc.* | | 7,600 | | | 940,956 |
| IVZ | | Invesco Ltd. | | 6,415 | | | 167,367 |
| JEF | | Jefferies Group, Inc.^ | | 54,730 | | | 1,016,336 |
| LSE LN | | London Stock Exchange Group plc | | 12,800 | | | 226,229 |
| | | | | | | | 5,865,579 |
| | | Telecommunications — 0.03% | | | | | |
| IRDM | | Iridium Communications, Inc.*^ | | 1,672 | | | 11,269 |
| | | U.S. Equity Exchanges — 1.88% | | | | | |
| NDAQ | | The NASDAQ OMX Group, Inc. | | 6,400 | | | 160,064 |
| NYX | | NYSE Euronext | | 20,920 | | | 659,817 |
| | | | | | | | 819,881 |
| | | Utilities — 0.23% | | | | | |
| BIP | | Brookfield Infrastructure Partners LP^ | | 2,816 | | | 99,264 |
| | | TOTAL COMMON STOCKS | | | | | |
| | | (cost $37,037,626 ) | | | | | 40,892,027 |
| | | | | | | | |
| | | MUTUAL FUNDS — 0.02% | | | | | |
| | | Funds, Trusts, and Other Financial Vehicles — 0.02% | | | | | |
| PFN | | PIMCO Income Strategy Fund II | | 760 | | | 8,398 |
| | | TOTAL MUTUAL FUNDS | | | | | |
| | | (cost $6,726 ) | | | | | 8,398 |
The accompanying notes are an integral part of these financial statements.
KINETICS PORTFOLIOS TRUST — MASTER INVESTMENT PORTFOLIOS The Market Opportunities Portfolio Portfolio of Investments — December 31, 2012 — (Continued) |
| Identifier | | SHORT-TERM INVESTMENTS — 6.44% | Principal Amount | | Value |
| | | Commercial Paper — 4.68% | | | | | |
| 026824820 | | U.S. Bank N.A. 0.02%, 01/02/2013 | $ | 2,040,000 | | $ | 2,040,000 |
| | | | Shares | | | |
| | | Money Market Funds — 1.76% | | | | | |
| FIGXX | | Fidelity Institutional Government Portfolio — Class I, 0.01%b | | 770,102 | | | 770,102 |
| | | TOTAL SHORT-TERM INVESTMENTS | | | | | |
| | | (cost $2,810,102) | | | | | 2,810,102 |
| | | INVESTMENTS PURCHASED WITH | | | | | |
| | | THE CASH PROCEEDS FROM | | | | | |
| | | SECURITIES LENDING — 24.12% | | | | | |
| | | Money Market Funds — 24.12% | | | | | |
| | | Mount Vernon Securities Lending Trust — | | | | | |
| | | Prime Portfolio, 0.27%b | | 10,527,196 | | | 10,527,196 |
| | | TOTAL INVESTMENTS PURCHASED WITH THE CASH | | | | | |
| | | PROCEEDS FROM SECURITIES LENDING | | | | | |
| | | (cost $10,527,196 ) | | | | | 10,527,196 |
| | | TOTAL INVESTMENTS — 124.29% | | | | | |
| | | (cost $50,381,650) | | | | $ | 54,237,723 |
Percentages are stated as a percent of net assets.
| * — | Non-income producing security. |
| ^ — | This security or a portion of this security was out on loan at December 31, 2012. Total loaned securities had a market value of $10,330,222 at December 31, 2012. |
| + — | Security is considered illiquid and was fair valued. The aggregate value of such securities is $0 or 0.00% of net assets. |
b — | The rate quoted is the annualized seven-day yield as of December 31, 2012. |
ADR — American Depository Receipt.
GDR — Global Depository Receipt.
REIT — Real Estate Investment Trust.
The accompanying notes are an integral part of these financial statements.
KINETICS PORTFOLIOS TRUST — MASTER INVESTMENT PORTFOLIOS The Water Infrastructure Portfolio Portfolio of Investments — December 31, 2012 — (Continued) |
| Identifier | | CONVERTIBLE BONDS — 2.24% | Principal Amount | | Value |
| | | Holding Company — 2.24% | | | | | |
| 451102AB3 | | Icahn Enterprises LP | | | | | |
| | | 4.000%, 08/15/2013# | $ | 240,000 | | $ | 241,800 |
| | | TOTAL CONVERTIBLE BONDS | | | | | |
| | | (cost $236,746 ) | | | | | 241,800 |
| | | CORPORATE BONDS — 4.77% | | | | | |
| | | Computer and Electronic Product Manufacturing — 1.37% | | | | | |
| 883556AS1 | | Thermo Fisher Scientific Inc. | | | | | |
| | | 3.200%, 05/01/2015 | | 140,000 | | | 147,446 |
| | | Credit Intermediation and Related Activities — 0.93% | | | | | |
| 14912L5B3 | | Caterpillar Financial Services Corporation | | | | | |
| | | 1.050%, 03/26/2015 | | 100,000 | | | 100,782 |
| | | Management of Companies and Enterprises — 0.96% | | | | | |
| 38141GDQ4 | | The Goldman Sachs Group, Inc. | | | | | |
| | | 5.250%, 10/15/2013 | | 100,000 | | | 103,521 |
| | | Utilities — 1.51% | | | | | |
| 7594777 | | Veolia Environnement | | | | | |
| | | 4.875%, 05/28/2013# | | 121,000 | | | 162,571 |
| | | TOTAL CORPORATE BONDS | | | | | |
| | | (cost $521,940 ) | | | | | 514,320 |
| | | EXCHANGE TRADED FUNDS — 13.55% | Shares | | | |
| | | Funds, Trusts, and Other Financial Vehicles — 13.55% | | | | | |
| CSJ | | iShares Barclays 1-3 Year Credit Bond ETF* | | 9,500 | | | 1,002,060 |
| SCPB | | SPDR Barclays Short Term Corporate Bond ETF | | 15,000 | | | 460,800 |
| | | TOTAL EXCHANGE TRADED FUNDS | | | | | |
| | | (cost $1,462,827 ) | | | | | 1,462,860 |
| | | WARRANTS — 0.00% | | | | | |
| | | Utilities — 0.00% | | | | | |
| CHC/WS | | China Hydroelectric Corporation | | | | | |
| | | Expiration Date: 1/25/2014 | | | | | |
| | | Exercise Price: $15.00* | | 40,000 | | | 220 |
| | | TOTAL WARRANTS | | | | | |
| | | (cost $48,000 ) | | | | | 220 |
The accompanying notes are an integral part of these fincial statements.
KINETICS PORTFOLIOS TRUST — MASTER INVESTMENT PORTFOLIOS The Water Infrastructure Portfolio Portfolio of Investments — December 31, 2012 — (Continued) |
| Identifier | | SHORT-TERM INVESTMENTS — 4.12% | Principal Amount | | Value |
| | | Commercial Paper — 2.22% | | | | | |
| 026824820 | | U.S. Bank N.A. | | | | | |
| | | 0.02%, 01/02/2013 | | $240,000 | | $ | 240,000 |
| | | | | | | | |
| | | | Shares | | | |
| | | Money Market Funds — 1.90% | | | | | |
| FIGXX | | Fidelity Institutional Government Portfolio — Class I, 0.01%b | | 205,000 | | | 205,000 |
| | | TOTAL SHORT-TERM INVESTMENTS | | | | | |
| | | (cost $445,000 ) | | | | | 445,000 |
| | | TOTAL INVESTMENTS — 24.68% | | | | | |
| | | (cost $2,714,513) | | | | $ | 2,664,200 |
Percentages are stated as a percent of net assets.
| # — | All or a portion of the shares have been committed as collateral for written option contracts. |
| * — | Non-income producing security. |
b — | The rate quoted is the annualized seven-day yield as of December 31, 2012. |
The accompanying notes are an integral part of these financial statements.
KINETICS PORTFOLIOS TRUST — MASTER INVESTMENT PORTFOLIOS The Multi-Disciplinary Portfolio Portfolio of Investments — December 31, 2012 — (Continued) |
| Identifier | | COMMON STOCKS — 2.52% | Shares | | Value |
| | | Insurance Carriers and Related Activities — 2.52% | | | | | |
| AIG | | American International Group, Inc.* | | 42,500 | | $ | 1,500,250 |
| | | TOTAL COMMON STOCKS | | | | | |
| | | (cost $1,495,936 ) | | | | | 1,500,250 |
| | | | | | | | |
| | | CONVERTIBLE BONDS — 64.18% | Principal Amount | | Value |
| | | Administrative and Support Services — 6.68% | | | | | |
| | | WebMD Health Corporation | | | | | |
| 94770VAH5 | | 2.250%, 03/31/2016# | $ | 400,000 | | | 375,000 |
| 94770VAF9 | | 2.500%, 01/31/2018# | | 4,275,000 | | | 3,601,687 |
| | | | | | | | 3,976,687 |
| | | Computer and Electronic Product Manufacturing — 8.61% | | | | | |
| 458660AB3 | | InterDigital, Inc. | | | | | |
| | | 2.500%, 03/15/2016 | | 2,000,000 | | | 2,137,500 |
| 502413AW7 | | L-3 Communications Holdings, Inc. | | | | | |
| | | 3.000%, 08/01/2035# | | 2,450,000 | | | 2,492,875 |
| 747906AH8 | | Quantum Corporation 4.500%, 11/15/2017, | | | | | |
| | | Acquired 10/26/2012 at $500,000■ | | 500,000 | | | 497,500 |
| | | | | | | | 5,127,875 |
| | | Holding Company — 5.75% | | | | | |
| 451102AB3 | | Icahn Enterprises LP | | | | | |
| | | 4.000%, 08/15/2013# | | 3,400,000 | | | 3,425,500 |
| | | Mining (except Oil and Gas) — 3.50% | | | | | |
| 496902AD9 | | Kinross Gold Corporation | | | | | |
| | | 1.750%, 03/15/2028# | | 1,100,000 | | | 1,104,813 |
| 608753AA7 | | Molycorp Inc. | | | | | |
| | | 3.250%, 06/15/2016# | | 1,500,000 | | | 982,500 |
| | | | | | | | 2,087,313 |
| | | Nonmetallic Mineral Product Manufacturing — 4.46% | | | | | |
| 69073TAQ6 | | Owens-Brockway Glass Container | | | | | |
| | | 3.000%, 06/01/2015, Acquired 7/06/2011-5/01/2012 | | | | | |
| | | at $2,631,095#■ | | 2,670,000 | | | 2,654,981 |
| | | Oil and Gas Extraction — 16.06% | | | | | |
| | | Arcan Resources Ltd. | | | | | |
| B4MT4X3 | | 6.250%, 02/28/2016# | | 1,594,000 | | | 1,398,977 |
| B57ZB98 | | 6.500%, 10/31/2018# | | 1,717,000 | | | 1,527,641 |
The accompanying notes are an integral part of these financial statements.
KINETICS PORTFOLIOS TRUST — MASTER INVESTMENT PORTFOLIOS The Multi-Disciplinary Portfolio Portfolio of Investments — December 31, 2012 — (Continued) |
| Identifier | | | Principal Amount | | Value |
| | | Oil and Gas Extraction — 16.06% (Continued) | | | | | |
| | | Chesapeake Energy Corporation | | | | | |
| 165167BW6 | | 2.750%, 11/15/2035# | $ | 650,000 | | $ | 624,813 |
| 165167CB1 | | 2.250%, 12/15/2038^ | | 2,630,000 | | | 2,136,875 |
| B5N86Y1 | | PetroBakken Energy Ltd. 3.125%, 02/08/2016, | | | | | |
| | | Acquired 2/7/2012-5/4/2012 at $3,891,792■ | | 3,900,000 | | | 3,878,550 |
| | | | | | | | 9,566,856 |
| | | Performing Arts, Spectator Sports, and Related Industries — 3.68% | | | | | |
| 538034AB5 | | Live Nation Entertainment, Inc. | | | | | |
| | | 2.875%, 07/15/2027# | | 2,200,000 | | | 2,189,000 |
| | | Professional, Scientific, and Technical Services — 0.17% | | | | | |
| 159864AB3 | | Charles River Laboratories International, Inc. | | | | | |
| | | 2.250%, 06/15/2013# | | 100,000 | | | 100,750 |
| | | Publishing Industries (except Internet) — 5.84% | | | | | |
| 285512AA7 | | Electronic Arts, Inc. | | | | | |
| | | 0.750%, 07/15/2016 | | 3,750,000 | | | 3,475,781 |
| | | Real Estate — 6.87% | | | | | |
| 029169AA7 | | American Real Estate | | | | | |
| | | 4.000%, 08/15/2013 Acquired | | | | | |
| | | 6/24/2011-10/26/2011 at $342,500#■ | | 350,000 | | | 352,625 |
| | | Forest City Enterprises, Inc. | | | | | |
| 345550AK3 | | 3.625%, 10/15/2014# | | 300,000 | | | 354,188 |
| 345550AP2 | | 4.250%, 08/15/2018# | | 3,200,000 | | | 3,382,000 |
| | | | | | | | 4,088,813 |
| | | Transportation Equipment Manufacturing — 1.54% | | | | | |
| 63934EAL2 | | Navistar International Corp. | | | | | |
| | | 3.000%, 10/15/2014 | | 1,000,000 | | | 918,125 |
| | | U.S. Equity Exchanges — 1.02% | | | | | |
| 631103AA6 | | The NASDAQ OMX Group, Inc. | | | | | |
| | | 2.500%, 08/15/2013 | | 605,000 | | | 608,025 |
| | | TOTAL CONVERTIBLE BONDS | | | | | |
| | | (cost $38,276,086 ) | | | | | 38,219,706 |
The accompanying notes are an integral part of these financial statements.
KINETICS PORTFOLIOS TRUST — MASTER INVESTMENT PORTFOLIOS The Multi-Disciplinary Portfolio Portfolio of Investments — December 31, 2012 — (Continued) |
| Identifier | | CORPORATE BONDS — 25.84% | Principal Amount | | Value |
| | | Administrative and Support Services — 0.39% | | | | | |
| 22025YAK6 | | Corrections Corp. of America | | | | | |
| | | 7.750%, 06/01/2017# | | $ 220,000 | | $ | 234,850 |
| | | Ambulatory Health Care Services — 4.89% | | | | | |
| 23918KAL2 | | DaVita, Inc. | | | | | |
| | | 6.375%, 11/01/2018#^ | | 2,710,000 | | | 2,913,250 |
| | | General Merchandise Stores — 2.59% | | | | | |
| | | J.C. Penney Corp., Inc. | | | | | |
| 708130AD1 | | 5.650%, 06/01/2020 ^ | | 1,250,000 | | | 1,090,625 |
| 708130AC3 | | 6.375%, 10/15/2036 | | 600,000 | | | 453,000 |
| | | | | | | | 1,543,625 |
| | | Lessors of Nonresidential Buildings (except miniwarehouses) — 1.02% | | | | | |
| 779273AG6 | | The Rouse Company LP | | | | | |
| | | 5.375%, 11/26/2013# | | 590,000 | | | 607,700 |
| | | Mining (except Oil and Gas) — 4.89% | | | | | |
| 20854PAD1 | | Consol Energy, Inc. | | | | | |
| | | 8.000%, 04/01/2017# | | 1,495,000 | | | 1,625,812 |
| | | Peabody Energy Corporation | | | | | |
| 704549AK0 | | 6.000%, 11/15/2018 | | 950,000 | | | 1,014,125 |
| 704549AH7 | | 6.500%, 09/15/2020# | | 250,000 | | | 269,375 |
| | | | | | | | 2,909,312 |
| | | Oil and Gas Extraction — 1.80% | | | | | |
| | | Harvest Operations Corp. | | | | | |
| B45KCB7 | | 7.250%, 09/30/2013# | | 200,000 | | | 203,519 |
| B45H5R5 | | 7.500%, 05/31/2015# | | 830,000 | | | 871,137 |
| | | | | | | | 1,074,656 |
| | | Satellite Telecommunications — 5.28% | | | | | |
| 25470XAH8 | | DISH DBS Corp. | | | | | |
| | | 4.625%, 07/15/2017 | | 3,000,000 | | | 3,142,500 |
| | | Securities, Commodity Contracts, and Other Financial Investments and | | | | | |
| | | Related Activities — 0.13% | | | | | |
| 52107QAC9 | | Lazard Group LLC | | | | | |
| | | 7.125%, 05/15/2015# | | 67,000 | | | 74,524 |
The accompanying notes are an integral part of these financial statements.
KINETICS PORTFOLIOS TRUST — MASTER INVESTMENT PORTFOLIOS The Multi-Disciplinary Portfolio Portfolio of Investments — December 31, 2012 — (Continued) |
| Identifier | | | Principal Amount | | Value |
| | | Utilities — 4.85% | | | | | |
| 131347BP0 | | Calpine Corp. | | | | | |
| | | 7.250%, 10/15/2017 | | | | | |
| | | Acquired 11/15/2011-4/13/2012 at $2,808,419#■ | $ | 2,700,000 | | $ | 2,889,000 |
| | | TOTAL CORPORATE BONDS | | | | | |
| | | (cost $15,005,509 ) | | | | | 15,389,417 |
| | | MUNICIPAL BONDS — 1.29% | | | | | |
| | | Air Transportation — 1.29% | | | | | |
| | | Branson Missouri Regional Airport Transportation Development District | | | | | |
| 105459AB7 | | 6.000%, 07/01/2025c | | 2,000,000 | | | 440,000 |
| 105459AC5 | | 6.000%, 07/01/2037c | | 1,500,000 | | | 330,000 |
| | | | | | | | 770,000 |
| | | TOTAL MUNICIPAL BONDS | | | | | |
| | | (cost $2,245,112 ) | | | | | 770,000 |
| | | EXCHANGE TRADED FUNDS — 2.09% | | Shares | | | |
| | | Funds, Trusts, and Other Financial Vehicles — 2.09% | | | | | |
| BOND | | PIMCO Total Return ETF | | 11,400 | | | 1,243,170 |
| | | TOTAL EXCHANGE TRADED FUNDS | | | | | |
| | | (cost $1,211,972 ) | | | | | 1,243,170 |
| | | MUTUAL FUNDS — 1.26% | | | | | |
| | | Funds, Trusts, and Other Financial Vehicles — 1.26% | | | | | |
| TLI | | LMP Corporate Loan Fund Inc. | | 12,569 | | | 162,392 |
| NSL | | Nuveen Senior Income Fund^ | | 9,300 | | | 67,983 |
| PCN | | PIMCO Corporate Income Fund^ | | 29,300 | | | 517,145 |
| | | TOTAL MUTUAL FUNDS | | | | | |
| | | (cost $751,804 ) | | | | | 747,520 |
| | | SHORT-TERM INVESTMENTS — 3.17% | | Principal Amount | | | |
| | | Commercial Paper — 2.27% | | | | | |
| 026824820 | | U.S. Bank N.A. 0.02%, 01/02/2013 | $ | 1,350,000 | | | 1,350,000 |
The accompanying notes are an integral part of these financial statements.
KINETICS PORTFOLIOS TRUST — MASTER INVESTMENT PORTFOLIOS The Multi-Disciplinary Portfolio Portfolio of Investments — December 31, 2012 — (Continued) |
| Identifier | | | Shares | | Value |
| | | Money Market Funds — 0.90% | | | | | |
| FIGXX | | Fidelity Institutional Government Portfolio — | | | | | |
| | | Class I, 0.01%b | | 538,438 | | $ | 538,438 |
| | | TOTAL SHORT-TERM INVESTMENTS | | | | | |
| | | (cost $1,888,438) | | | | | 1,888,438 |
| | | INVESTMENTS PURCHASED WITH | | | | | |
| | | THE CASH PROCEEDS | | | | | |
| | | FROM SECURITIES LENDING — 3.18% | | | | | |
| | | Money Market Funds — 3.18% | | | | | |
| | | Mount Vernon Securities Lending Trust — | | | | | |
| | | Prime Portfolio, 0.27%b | | 1,896,215 | | | 1,896,215 |
| | | TOTAL INVESTMENTS PURCHASED WITH THE CASH | | | | | |
| | | PROCEEDS FROM SECURITIES LENDING | | | | | |
| | | (cost $1,896,215) | | | | | 1,896,215 |
| | | TOTAL INVESTMENTS - 103.53% | | | | | |
| | | (cost $62,771,072) | | | | $ | 61,654,716 |
Percentages are stated as a percent of net assets.
| * — | Non-income producing security. |
| # — | All or a portion of the shares have been committed as collateral for written option contracts. |
■ — | Restricted security restricted to institutional investors (144a securities); the percentage of net assets comprised of 144a securities was 17.25%. |
| ^ — | This security or a portion of this security was out on loan at December 31, 2012. Total loaned securities had a market value of $1,849,017 at December 31, 2012. |
c — | The security missed the January 1, 2012 interest payment and has ceased to accrue income. A forbearance agreement is currently in place. |
b — | The rate quoted is the annualized seven-day yield as of December 31, 2012. |
| ETF — Exchange Traded Fund. |
The accompanying notes are an integral part of these financial statements.
KINETICS PORTFOLIOS TRUST — MASTER INVESTMENT PORTFOLIOS The Water Infrastructure Portfolio Portfolio of Options Written — December 31, 2012 |
| | | Identifier | | PUT OPTIONS WRITTEN | Contracts* | | Value |
| | | | | Accommodation | | | | |
| | | | | Starwood Hotels & Resorts Worldwide, Inc. | | | | |
| HOT | | 140118P00038000 | | Expiration: January 2014, Exercise Price: $38.00 | 15 | | $ | 2,925 |
| HOT | | 150117P00035000 | | Expiration: January 2015, Exercise Price: $35.00 | 15 | | | 5,212 |
| | | | | | | | | 8,137 |
| | | | | Administrative and Support Services | | | | |
| | | | | Expedia, Inc. | | | | |
| EXPE | | 140118P00034480 | | Expiration: January 2014, Exercise Price: $34.48 | 15 | | | 2,812 |
| EXPE | | 150117P00034480 | | Expiration: January 2015, Exercise Price: $34.48 | 15 | | | 6,225 |
| | | | | | | | | 9,037 |
| | | | | Broadcasting (except Internet) | | | | |
| | | | | CBS Corporation — Class B | | | | |
| CBS | | 140118P00025000 | | Expiration: January 2014, Exercise Price: $25.00 | 13 | | | 1,268 |
| CBS | | 150117P00025000 | | Expiration: January 2015, Exercise Price: $25.00 | 13 | | | 2,860 |
| | | | | | | | | 4,128 |
| | | | | Building Equipment Contractors | | | | |
| | | | | Honeywell International Inc. | | | | |
| HON | | 150117P00040000 | | Expiration: January 2015, Exercise Price: $40.00 | 12 | | | 3,240 |
| | | | | Building Material and Garden Equipment and Supplies Dealers | | | | |
| | | | | Lowes Companies, Inc. | | | | |
| LOW | | 140118P00023000 | | Expiration: January 2014, Exercise Price: $23.00 | 20 | | | 1,520 |
| LOW | | 150117P00023000 | | Expiration: January 2015, Exercise Price: $23.00 | 20 | | | 3,610 |
| | | | | | | | | 5,130 |
| | | | | Chemical Manufacturing | | | | |
| | | | | The Dow Chemical Company | | | | |
| DOW | | 140118P00020000 | | Expiration: January 2014, Exercise Price: $20.00 | 25 | | | 1,963 |
| DOW | | 150117P00020000 | | Expiration: January 2015, Exercise Price: $20.00 | 25 | | | 4,712 |
| | | | | E.I. du Pont de Nemours and Company | | | | |
| DD | | 150117P00030000 | | Expiration: January 2015, Exercise Price: $30.00 | 20 | | | 4,290 |
| | | | | Gilead Sciences, Inc. | | | | |
| GILD | | 140118P00047000 | | Expiration: January 2014, Exercise Price: $47.00 | 10 | | | 1,300 |
| GILD | | 150117P00045000 | | Expiration: January 2015, Exercise Price: $45.00 | 10 | | | 2,460 |
| | | | | The Mosaic Company | | | | |
| MOS | | 140118P00035000 | | Expiration: January 2014, Exercise Price: $35.00 | 15 | | | 1,830 |
| MOS | | 150117P00035000 | | Expiration: January 2015, Exercise Price: $35.00 | 15 | | | 4,110 |
| | | | | | | | | 20,665 |
The accompanying notes are an integral part of these financial statements.
KINETICS PORTFOLIOS TRUST — MASTER INVESTMENT PORTFOLIOS The Water Infrastructure Portfolio Portfolio of Options Written — December 31, 2012 — (Continued) |
| | | Identifier | | | Contracts* | | Value |
| | | | | Clothing and Clothing Accessories Stores | | | | |
| | | | | Limited Brands, Inc. | | | | |
| LTD | | 140118P00032000 | | Expiration: January 2014, Exercise Price: $32.00 | 11 | | $ | 1,237 |
| LTD | | 150117P00032000 | | Expiration: January 2015, Exercise Price: $32.00 | 11 | | | 3,355 |
| | | | | | | | | 4,592 |
| | | | | Computer and Electronic Product Manufacturing | | | | |
| | | | | Cisco Systems, Inc. | | | | |
| CSCO | | 140118P00013000 | | Expiration: January 2014, Exercise Price: $13.00 | 35 | | | 1,505 |
| CSCO | | 150117P00013000 | | Expiration: January 2015, Exercise Price: $13.00 | 35 | | | 3,377 |
| | | | | Texas Instruments Inc. | | | | |
| TXN | | 140118P00020000 | | Expiration: January 2014, Exercise Price: $20.00 | 25 | | | 1,650 |
| TXN | | 150117P00020000 | | Expiration: January 2015, Exercise Price: $20.00 | 25 | | | 4,000 |
| | | | | | | | | 10,532 |
| | | | | Credit Intermediation and Related Activities | | | | |
| | | | | Bank of America Corporation | | | | |
| BAC | | 140118P00007000 | | Expiration: January 2014, Exercise Price: $7.00 | 70 | | | 2,275 |
| BAC | | 150117P00007000 | | Expiration: January 2015, Exercise Price: $7.00 | 70 | | | 5,005 |
| | | | | Capital One Financial Corporation | | | | |
| COF | | 140118P00038000 | | Expiration: January 2014, Exercise Price: $38.00 | 15 | | | 2,183 |
| COF | | 150117P00035000 | | Expiration: January 2015, Exercise Price: $35.00 | 15 | | | 3,585 |
| | | | | Wells Fargo & Company | | | | |
| WFC | | 150117P00023000 | | Expiration: January 2015, Exercise Price: $23.00 | 20 | | | 3,400 |
| | | | | | | | | 16,448 |
| | | | | Fabricated Metal Product Manufacturing | | | | |
| | | | | Danaher Corporation | | | | |
| DHR | | 130119P00047000 | | Expiration: January 2013, Exercise Price: $47.00 | 5 | | | 25 |
| | | | | Food Services and Drinking Places | | | | |
| | | | | Starbucks Corporation | | | | |
| SBUX | | 140118P00035000 | | Expiration: January 2014, Exercise Price: $35.00 | 15 | | | 1,680 |
| SBUX | | 150117P00035000 | | Expiration: January 2015, Exercise Price: $35.00 | 15 | | | 4,020 |
| | | | | | | | | 5,700 |
| | | | | General Merchandise Stores | | | | |
| | | | | Macy’s, Inc. | | | | |
| M | | 140118P00023000 | | Expiration: January 2014, Exercise Price: $23.00 | 20 | | | 1,480 |
| M | | 150117P00023000 | | Expiration: January 2015, Exercise Price: $23.00 | 20 | | | 3,970 |
The accompanying notes are an integral part of these financial statements.
KINETICS PORTFOLIOS TRUST — MASTER INVESTMENT PORTFOLIOS The Water Infrastructure Portfolio Portfolio of Options Written — December 31, 2012 — (Continued) |
| | | Identifier | | | Contracts* | | | Value |
| | | | | | | | | |
| | | | | General Merchandise Stores — (Continued) | | | | |
| | | | | Nordstrom, Inc. | | | | |
| JWN | | 140118P00035000 | | Expiration: January 2014, Exercise Price: $35.00 | 15 | | $ | 1,800 |
| JWN | | 150117P00035000 | | Expiration: January 2015, Exercise Price: $35.00 | 15 | | | 4,530 |
| | | | | | | | | 11,780 |
| | | | | Insurance Carriers and Related Activities | | | | |
| | | | | American International Group, Inc. | | | | |
| AIG | | 140118P00022000 | | Expiration: January 2014, Exercise Price: $22.00 | 20 | | | 1,610 |
| AIG | | 150117P00023000 | | Expiration: January 2015, Exercise Price: $23.00 | 20 | | | 4,560 |
| | | | | MetLife, Inc. | | | | |
| MET | | 140118P00020000 | | Expiration: January 2014, Exercise Price: $20.00 | 25 | | | 2,050 |
| MET | | 150117P00020000 | | Expiration: January 2015, Exercise Price: $20.00 | 25 | | | 4,463 |
| | | | | Prudential Financial, Inc. | | | | |
| PRU | | 140118P00035000 | | Expiration: January 2014, Exercise Price: $35.00 | 15 | | | 2,243 |
| PRU | | 150117P00035000 | | Expiration: January 2015, Exercise Price: $35.00 | 15 | | | 4,402 |
| | | | | UnitedHealth Group Inc. | | | | |
| UNH | | 140118P00035000 | | Expiration: January 2014, Exercise Price: $35.00 | 15 | | | 1,425 |
| UNH | | 150117P00035000 | | Expiration: January 2015, Exercise Price: $35.00 | 15 | | | 3,420 |
| | | | | | | | | 24,173 |
| | | | | Leather and Applied Product Manufacturing | | | | |
| | | | | Coach, Inc. | | | | |
| COH | | 140118P00040000 | | Expiration: January 2014, Exercise Price: $40.00 | 9 | | | 2,273 |
| COH | | 150117P00040000 | | Expiration: January 2015, Exercise Price: $40.00 | 9 | | | 4,545 |
| | | | | | | | | 6,818 |
| | | | | Machinery Manufacturing | | | | |
| | | | | Caterpillar Inc. | | | | |
| CAT | | 140118P00055000 | | Expiration: January 2014, Exercise Price: $55.00 | 10 | | | 1,670 |
| CAT | | 150117P00055000 | | Expiration: January 2015, Exercise Price: $55.00 | 10 | | | 4,025 |
| | | | | Deere & Company | | | | |
| DE | | 140118P00055000 | | Expiration: January 2014, Exercise Price: $55.00 | 10 | | | 1,560 |
| DE | | 150117P00055000 | | Expiration: January 2015, Exercise Price: $55.00 | 10 | | | 3,850 |
| | | | | Illinois Tool Works Inc. | | | | |
| ITW | | 140118P00040000 | | Expiration: January 2014, Exercise Price: $40.00 | 12 | | | 1,380 |
| ITW | | 150117P00040000 | | Expiration: January 2015, Exercise Price: $40.00 | 12 | | | 3,240 |
| | | | | Ingersoll-Rand PLC | | | | |
| IR | | 140118P00030000 | | Expiration: January 2014, Exercise Price: $30.00 | 15 | | | 1,500 |
| IR | | 150117P00030000 | | Expiration: January 2015, Exercise Price: $30.00 | 15 | | | 3,450 |
| | | | | | | | | 20,675 |
The accompanying notes are an integral part of these financial statements.
KINETICS PORTFOLIOS TRUST — MASTER INVESTMENT PORTFOLIOS The Water Infrastructure Portfolio Portfolio of Options Written — December 31, 2012 — (Continued) |
| | | Identifier | | | Contracts* | | | Value |
| | | | | | | | | |
| | | | | Management of Companies and Enterprises | | | | |
| | | | | JPMorgan Chase & Co. | | | | |
| JPM | | 140118P00030000 | | Expiration: January 2014, Exercise Price: $30.00 | 11 | | $ | 1,589 |
| JPM | | 150117P00030000 | | Expiration: January 2015, Exercise Price: $30.00 | 11 | | | 3,179 |
| | | | | | | | | 4,768 |
| | | | | Mining (except Oil and Gas) | | | | |
| | | | | Barrick Gold Corporation | | | | |
| ABX | | 140118P00023000 | | Expiration: January 2014, Exercise Price: $23.00 | 20 | | | 1,540 |
| ABX | | 150117P00023000 | | Expiration: January 2015, Exercise Price: $23.00 | 20 | | | 3,800 |
| | | | | Freeport-McMoRan Copper & Gold Inc. | | | | |
| FCX | | 140118P00023000 | | Expiration: January 2014, Exercise Price: $23.00 | 15 | | | 1,980 |
| FCX | | 150117P00023000 | | Expiration: January 2015, Exercise Price: $23.00 | 15 | | | 4,065 |
| | | | | Rio Tinto PLC — ADR | | | | |
| RIO | | 140118P00037500 | | Expiration: January 2014, Exercise Price: $37.50 | 15 | | | 2,400 |
| RIO | | 150117P00037500 | | Expiration: January 2015, Exercise Price: $37.50 | 15 | | | 5,550 |
| | | | | | | | | 19,335 |
| | | | | Miscellaneous Manufacturing | | | | |
| | | | | St. Jude Medical, Inc. | | | | |
| STJ | | 150117P00023000 | | Expiration: January 2015, Exercise Price: $23.00 | 20 | | | 3,500 |
| | | | | Non-Store Retailers | | | | |
| | | | | Amazon.com, Inc. | | | | |
| AMZN | | 140118P00160000 | | Expiration: January 2014, Exercise Price: $160.00 | 4 | | | 2,830 |
| AMZN | | 150117P00160000 | | Expiration: January 2015, Exercise Price: $160.00 | 4 | | | 5,930 |
| | | | | eBay, Inc. | | | | |
| EBAY | | 140118P00035000 | | Expiration: January 2014, Exercise Price: $35.00 | 15 | | | 2,543 |
| EBAY | | 150117P00033000 | | Expiration: January 2015, Exercise Price: $33.00 | 15 | | | 4,462 |
| | | | | | | | | 15,765 |
| | | | | Oil and Gas Extraction | | | | |
| | | | | Anadarko Petroleum Corporation | | | | |
| APC | | 140118P00047500 | | Expiration: January 2014, Exercise Price: $47.50 | 10 | | | 2,240 |
| APC | | 150117P00050000 | | Expiration: January 2015, Exercise Price: $50.00 | 10 | | | 5,325 |
| | | | | Canadian Natural Resources Ltd. | | | | |
| CNQ | | 140118P00018000 | | Expiration: January 2014, Exercise Price: $18.00 | 25 | | | 1,750 |
| CNQ | | 150117P00018000 | | Expiration: January 2015, Exercise Price: $18.00 | 25 | | | 4,125 |
| | | | | Encana Corporation | | | | |
| ECA | | 140118P00013000 | | Expiration: January 2014, Exercise Price: $13.00 | 25 | | | 1,438 |
| ECA | | 150117P00013000 | | Expiration: January 2015, Exercise Price: $13.00 | 25 | | | 3,500 |
The accompanying notes are an integral part of these financial statements.
KINETICS PORTFOLIOS TRUST — MASTER INVESTMENT PORTFOLIOS The Water Infrastructure Portfolio Portfolio of Options Written — December 31, 2012 — (Continued) |
| | | Identifier | | | Contracts* | | | Value |
| | | | | | | | | |
| | | | | Oil and Gas Extraction — (Continued) | | | | |
| | | | | Marathon Oil Corporation | | | | |
| MRO | | 140118P00020000 | | Expiration: January 2014, Exercise Price: $20.00 | 25 | | $ | 2,125 |
| MRO | | 150117P00020000 | | Expiration: January 2015, Exercise Price: $20.00 | 25 | | | 4,550 |
| | | | | Occidental Petroleum Corporation | | | | |
| OXY | | 140118P00050000 | | Expiration: January 2014, Exercise Price: $50.00 | 10 | | | 1,920 |
| OXY | | 150117P00050000 | | Expiration: January 2015, Exercise Price: $50.00 | 10 | | | 4,275 |
| | | | | | | | | 31,248 |
| | | | | Petroleum and Coal Products Manufacturing | | | | |
| | | | | Hess Corporation | | | | |
| HES | | 140118P00035000 | | Expiration: January 2014, Exercise Price: $35.00 | 15 | | | 2,392 |
| HES | | 150117P00035000 | | Expiration: January 2015, Exercise Price: $35.00 | 15 | | | 5,100 |
| | | | | | | | | 7,492 |
| | | | | Professional, Scientific and Technical Services | | | | |
| | | | | Computer Sciences Corporation | | | | |
| CSC | | 140118P00025000 | | Expiration: January 2014, Exercise Price: $25.00 | 20 | | | 2,200 |
| CSC | | 150117P00025000 | | Expiration: January 2015, Exercise Price: $25.00 | 20 | | | 4,500 |
| | | | | Fluor Corporation | | | | |
| FLR | | 140118P00040000 | | Expiration: January 2014, Exercise Price: $40.00 | 9 | | | 1,530 |
| FLR | | 150117P00040000 | | Expiration: January 2015, Exercise Price: $40.00 | 9 | | | 3,375 |
| | | | | | | | | 11,605 |
| | | | | Rail Transportation | | | | |
| | | | | CSX Corporation | | | | |
| CSX | | 150117P00012500 | | Expiration: January 2015, Exercise Price: $12.50 | 40 | | | 3,440 |
| | | | | Norfolk Sourthern Corporation | | | | |
| NSC | | 150117P00040000 | | Expiration: January 2015, Exercise Price: $40.00 | 12 | | | 3,180 |
| | | | | | | | | 6,620 |
| | | | | Satellite Telecommunications | | | | |
| | | | | DISH Network Corp. — Class A | | | | |
| DISH | | 140118P00024000 | | Expiration: January 2014, Exercise Price: $24.00 | 14 | | | 1,785 |
| DISH | | 150117P00024000 | | Expiration: January 2015, Exercise Price: $24.00 | 14 | | | 3,570 |
| | | | | | | | | 5,355 |
The accompanying notes are an integral part of these financial statements.
KINETICS PORTFOLIOS TRUST — MASTER INVESTMENT PORTFOLIOS The Water Infrastructure Portfolio Portfolio of Options Written — December 31, 2012 — (Continued) |
| | | Identifier | | | Contracts* | | | Value |
| | | | | | | | | |
| | | | | Securities, Commodity Contracts, and Other Financial | | | | |
| | | | | Investments and Related Activities | | | | |
| | | | | Morgan Stanley | | | | |
| MS | | 140118P00013000 | | Expiration: January 2014, Exercise Price: $13.00 | 40 | | $ | 3,480 |
| MS | | 150117P00013000 | | Expiration: January 2015, Exercise Price: $13.00 | 40 | | | 6,900 |
| | | | | | | | | 10,380 |
| | | | | Software Publishers | | | | |
| | | | | Microsoft Corporation | | | | |
| MSFT | | 150117P00018000 | | Expiration: January 2015, Exercise Price: $18.00 | 25 | | | 3,125 |
| | | | | Oracle Corporation | | | | |
| ORCL | | 150117P00020000 | | Expiration: January 2015, Exercise Price: $20.00 | 25 | | | 2,825 |
| | | | | | | | | 5,950 |
| | | | | Transportation Equipment Manufacturing | | | | |
| | | | | The Boeing Company | | | | |
| BA | | 150117P00050000 | | Expiration: January 2015, Exercise Price: $50.00 | 10 | | | 3,200 |
| | | | | General Dynamics Corporation | | | | |
| GD | | 150117P00045000 | | Expiration: January 2015, Exercise Price: $45.00 | 10 | | | 3,100 |
| | | | | Johnson Controls, Inc. | | | | |
| JCI | | 140118P00020000 | | Expiration: January 2014, Exercise Price: $20.00 | 25 | | | 2,125 |
| JCI | | 150117P00020000 | | Expiration: January 2015, Exercise Price: $20.00 | 25 | | | 4,812 |
| | | | | PACCAR Inc. | | | | |
| PCAR | | 140118P00028500 | | Expiration: January 2014, Exercise Price: $28.50 | 20 | | | 2,300 |
| PCAR | | 150117P00029200 | | Expiration: January 2015, Exercise Price: $29.20 | 15 | | | 4,163 |
| | | | | United Technologies Corporation | | | | |
| UTX | | 150117P00055000 | | Expiration: January 2015, Exercise Price: $55.00 | 10 | | | 3,975 |
| | | | | | | | | 23,675 |
| | | | | Water Transportation | | | | |
| | | | | Carnival Corporation | | | | |
| CCL | | 140118P00024500 | | Expiration: January 2014, Exercise Price: $24.50 | 13 | | | 1,203 |
| CCL | | 150117P00024500 | | Expiration: January 2015, Exercise Price: $24.50 | 13 | | | 2,925 |
| | | | | | | | | 4,128 |
| | | | | TOTAL PUT OPTIONS WRITTEN | | | | |
| | | | | (premiums received $301,071) | | | $ | 300,901 |
* — 100 Shares Per Contract.
ADR — American Depository Receipt.
PLC — Public Limited Company.
The accompanying notes are an integral part of these financial statements.
KINETICS PORTFOLIOS TRUST — MASTER INVESTMENT PORTFOLIOS The Multi-Disciplinary Portfolio Portfolio of Options Written — December 31, 2012 — (Continued) |
| | | Identifier | | PUT OPTIONS WRITTEN | Contracts* | | | Value |
| | | | | | | | | |
| | | | | Accommodation | | | | |
| | | | | Carnival Corporation | | | | |
| CCL | | 130119P00022500 | | Expiration: January 2013, Exercise Price: $22.50 | 60 | | $ | 150 |
| CCL | | 140118P00029500 | | Expiration: January 2014, Exercise Price: $29.50 | 40 | | | 7,600 |
| | | | | Royal Caribbean Cruises Ltd. | | | | |
| RCL | | 130119P00023000 | | Expiration: January 2013, Exercise Price: $23.00 | 30 | | | 120 |
| RCL | | 130119P00025000 | | Expiration: January 2013, Exercise Price: $25.00 | 42 | | | 231 |
| | | | | | | | | 8,101 |
| | | | | Administrative and Support Services | | | | |
| | | | | Expedia, Inc. | | | | |
| EXPE1 | | 130119P00025000 | | Expiration: January 2013, Exercise Price: $25.00 | 45 | | | 562 |
| EXPE | | 140118P00049480 | | Expiration: January 2014, Exercise Price: $49.48 | 2 | | | 1,130 |
| | | | | | | | | 1,692 |
| | | | | Asset Management | | | | |
| | | | | BlackRock, Inc. | | | | |
| BLK | | 130119P00150000 | | Expiration: January 2013, Exercise Price: $150.00 | 5 | | | 50 |
| BLK | | 130119P00160000 | | Expiration: January 2013, Exercise Price: $160.00 | 3 | | | 30 |
| BLK | | 130119P00165000 | | Expiration: January 2013, Exercise Price: $165.00 | 3 | | | 30 |
| BLK | | 140118P00160000 | | Expiration: January 2014, Exercise Price: $160.00 | 15 | | | 10,950 |
| | | | | The Blackstone Group LP | | | | |
| BX | | 130119P00010000 | | Expiration: January 2013, Exercise Price: $10.00 | 144 | | | 144 |
| BX | | 130119P00017500 | | Expiration: January 2013, Exercise Price: $17.50 | 21 | | | 4,001 |
| BX | | 140118P00010000 | | Expiration: January 2014, Exercise Price: $10.00 | 400 | | | 19,000 |
| | | | | Brookfield Asset Management Inc. — Class A | | | | |
| BAM | | 130316P00030000 | | Expiration: March 2013, Exercise Price: $30.00 | 122 | | | 1,830 |
| BAM | | 130622P00035000 | | Expiration: June 2013, Exercise Price: $35.00 | 10 | | | 1,575 |
| | | | | Federated Investors, Inc. — Class B | | | | |
| FII | | 130119P00015990 | | Expiration: January 2013, Exercise Price: $15.99 | 25 | | | 125 |
| FII | | 130420P00015990 | | Expiration: April 2013, Exercise Price: $15.99 | 90 | | | 2,700 |
| FII | | 130420P00017500 | | Expiration: April 2013, Exercise Price: $17.50 | 60 | | | 1,800 |
| FII | | 130420P00018490 | | Expiration: April 2013, Exercise Price: $18.49 | 120 | | | 9,900 |
| | | | | Franklin Resources, Inc. | | | | |
| BEN | | 130119P00090000 | | Expiration: January 2013, Exercise Price: $90.00 | 2 | | | 15 |
| BEN | | 130119P00092000 | | Expiration: January 2013, Exercise Price: $92.00 | 10 | | | 50 |
| BEN | | 130119P00107000 | | Expiration: January 2013, Exercise Price: $107.00 | 10 | | | 225 |
| BEN | | 140118P00102000 | | Expiration: January 2014, Exercise Price: $102.00 | 10 | | | 5,400 |
The accompanying notes are an integral part of these financial statements.
KINETICS PORTFOLIOS TRUST — MASTER INVESTMENT PORTFOLIOS The Multi-Disciplinary Portfolio Portfolio of Options Written — December 31, 2012 — (Continued) |
| | | Identifier | | | Contracts* | | | Value |
| | | | | | | | | |
| | | | | Asset Management — (Continued) | | | | |
| | | | | KKR & Co. L.P. | | | | |
| KKR | | 130119P00011000 | | Expiration: January 2013, Exercise Price: $11.00 | 120 | | $ | 300 |
| KKR | | 130316P00013000 | | Expiration: March 2013, Exercise Price: $13.00 | 80 | | | 2,000 |
| KKR | | 130622P00013000 | | Expiration: June 2013, Exercise Price: $13.00 . | 220 | | | 13,200 |
| | | | | Legg Mason, Inc. | | | | |
| LM | | 130119P00023000 | | Expiration: January 2013, Exercise Price: $23.00 | 99 | | | 495 |
| LM | | 130119P00024000 | | Expiration: January 2013, Exercise Price: $24.00 | 6 | | | 90 |
| LM | | 130119P00025000 | | Expiration: January 2013, Exercise Price: $25.00 | 63 | | | 2,205 |
| LM | | 130216P00020000 | | Expiration: February 2013, Exercise Price: $20.00 | 5 | | | 25 |
| LM | | 140118P00023000 | | Expiration: January 2014, Exercise Price: $23.00 | 55 | | | 12,100 |
| | | | | Oaktree Capital Group LLC | | | | |
| OAK | | 130119P00030000 | | Expiration: January 2013, Exercise Price: $30.00 | 25 | | | 437 |
| OAK | | 130720P00040000 | | Expiration: July 2013, Exercise Price: $40.00 | 35 | | | 5,600 |
| | | | | | | | | 94,277 |
| | | | | Beverage and Tobacco Product Manufacturing | | | | |
| | | | | Coca-Cola Enterprises Inc. | | | | |
| CCE | | 140118P00025000 | | Expiration: January 2014, Exercise Price: $25.00 | 150 | | | 16,500 |
| | | | | PepsiCo, Inc. | | | | |
| PEP | | 130119P00052500 | | Expiration: January 2013, Exercise Price: $52.50 | 10 | | | 20 |
| PEP | | 130119P00057500 | | Expiration: January 2013, Exercise Price: $57.50 | 19 | | | 105 |
| PEP | | 130119P00060000 | | Expiration: January 2013, Exercise Price: $60.00 | 20 | | | 120 |
| PEP | | 140118P00060000 | | Expiration: January 2014, Exercise Price: $60.00 | 25 | | | 5,387 |
| PEP | | 140118P00062500 | | Expiration: January 2014, Exercise Price: $62.50 | 18 | | | 5,112 |
| | | | | Philip Morris International, Inc. | | | | |
| PM | | 130119P00090000 | | Expiration: January 2013, Exercise Price: $90.00 | 2 | | | 1,275 |
| PM | | 130316P00087500 | | Expiration: March 2013, Exercise Price: $87.50 | 22 | | | 11,275 |
| PM | | 140118P00087500 | | Expiration: January 2014, Exercise Price: $87.50 | 20 | | | 21,900 |
| PM | | 140118P00090000 | | Expiration: January 2014, Exercise Price: $90.00 | 1 | | | 1,265 |
| | | | | | | | | 62,959 |
| | | | | Broadcasting (except Internet) | | | | |
| | | | | Cablevision Systems Corporation — Class A | | | | |
| CVC | | 130119P00013000 | | Expiration: January 2013, Exercise Price: $13.00 | 50 | | | 375 |
| | | | | Comcast Corporation — Class A | | | | |
| CMCSA | | 130119P00020000 | | Expiration: January 2013, Exercise Price: $20.00 | 115 | | | 115 |
| CMCSA | | 130119P00022500 | | Expiration: January 2013, Exercise Price: $22.50 | 8 | | | 12 |
| CMCSK | | 130119P00025000 | | Expiration: January 2013, Exercise Price: $25.00 | 24 | | | 60 |
| CMCSA | | 140118P00030000 | | Expiration: January 2014, Exercise Price: $30.00 | 70 | | | 11,900 |
The accompanying notes are an integral part of these financial statements.
KINETICS PORTFOLIOS TRUST — MASTER INVESTMENT PORTFOLIOS The Multi-Disciplinary Portfolio Portfolio of Options Written — December 31, 2012 — (Continued) |
| | | Identifier | | | Contracts* | | | Value |
| | | | | | | | | |
| | | | | Broadcasting (except Internet) — (Continued) | | | | |
| | | | | Discovery Communications, Inc. — Class A | | | | |
| DISCA | | 130420P00050000 | | Expiration: April 2013, Exercise Price: $50.00 | 25 | | $ | 1,187 |
| | | | | Liberty Media Corporation — Liberty Capital — Series A | | | | |
| LMCA | | 130119P00095000 | | Expiration: January 2013, Exercise Price: $95.00 | 1 | | | 28 |
| LMCA | | 130720P00095000 | | Expiration: July 2013, Exercise Price: $95.00 | 12 | | | 2,280 |
| | | | | Time Warner Cable Inc. | | | | |
| TWC | | 130119P00050000 | | Expiration: January 2013, Exercise Price: $50.00 | 17 | | | 43 |
| TWC | | 130119P00055000 | | Expiration: January 2013, Exercise Price: $55.00 | 21 | | | 52 |
| TWC | | 130119P00070000 | | Expiration: January 2013, Exercise Price: $70.00 | 16 | | | 80 |
| | | | | Time Warner Inc. | | | | |
| TWX | | 140118P00035000 | | Expiration: January 2014, Exercise Price: $35.00 | 59 | | | 7,876 |
| TWX | | 140118P00040000 | | Expiration: January 2014, Exercise Price: $40.00 | 47 | | | 10,810 |
| | | | | Viacom Inc. — Class B | | | | |
| VIAB | | 130119P00045000 | | Expiration: January 2013, Exercise Price: $45.00 | 4 | | | 20 |
| VIAB | | 140118P00045000 | | Expiration: January 2014, Exercise Price: $45.00 | 30 | | | 9,000 |
| VIAB | | 140118P00047000 | | Expiration: January 2014, Exercise Price: $47.00 | 43 | | | 15,910 |
| | | | | The Walt Disney Company | | | | |
| DIS | | 130119P00030000 | | Expiration: January 2013, Exercise Price: $30.00 | 15 | | | 15 |
| DIS | | 130119P00035000 | | Expiration: January 2013, Exercise Price: $35.00 | 52 | | | 78 |
| DIS | | 140118P00040000 | | Expiration: January 2014, Exercise Price: $40.00 | 25 | | | 4,525 |
| DIS | | 140118P00045000 | | Expiration: January 2014, Exercise Price: $45.00 | 2 | | | 630 |
| | | | | | | | | 64,996 |
| | | | | Building Material and Garden Equipment and Supplies Dealers | | | | |
| | | | | Lowes Companies, Inc. | | | | |
| LOW | | 130119P00024000 | | Expiration: January 2013, Exercise Price: $24.00 | 6 | | | 21 |
| LOW | | 140118P00023000 | | Expiration: January 2014, Exercise Price: $23.00 | 25 | | | 1,900 |
| LOW | | 140118P00025000 | | Expiration: January 2014, Exercise Price: $25.00 | 4 | | | 416 |
| | | | | | | | | 2,337 |
| | | | | Chemical Manufacturing | | | | |
| | | | | The Clorox Company | | | | |
| CLX | | 130119P00062500 | | Expiration: January 2013, Exercise Price: $62.50 | 60 | | | 150 |
| CLX | | 140118P00060000 | | Expiration: January 2014, Exercise Price: $60.00 | 22 | | | 3,410 |
| CLX | | 140118P00065000 | | Expiration: January 2014, Exercise Price: $65.00 | 5 | | | 1,338 |
| | | | | LyondellBasell Industries NV — Class A | | | | |
| LYB | | 130119P00029250 | | Expiration: January 2013, Exercise Price: $29.25 | 42 | | | 210 |
| LYB | | 130119P00030750 | | Expiration: January 2013, Exercise Price: $30.75 | 20 | | | 100 |
| LYB | | 130119P00032750 | | Expiration: January 2013, Exercise Price: $32.75 | 12 | | | 60 |
The accompanying notes are an integral part of these financial statements.
KINETICS PORTFOLIOS TRUST — MASTER INVESTMENT PORTFOLIOS The Multi-Disciplinary Portfolio Portfolio of Options Written — December 31, 2012 — (Continued) |
| | | Identifier | | | Contracts* | | | Value |
| | | | | | | | | |
| | | | | Chemical Manufacturing — (Continued) | | | | |
| | | | | The Estee Lauder Companies Inc. — Class A | | | | |
| EL | | 130119P00040000 | | Expiration: January 2013, Exercise Price: $40.00 | 54 | | $ | 135 |
| EL | | 130119P00046250 | | Expiration: January 2013, Exercise Price: $46.25 | 4 | | | 10 |
| EL | | 130119P00055000 | | Expiration: January 2013, Exercise Price: $55.00 | 9 | | | 180 |
| EL | | 140118P00047500 | | Expiration: January 2014, Exercise Price: $47.50 | 29 | | | 7,685 |
| | | | | Monsanto Company | | | | |
| MON | | 130119P00085000 | | Expiration: January 2013, Exercise Price: $85.00 | 2 | | | 71 |
| MON | | 140118P00085000 | | Expiration: January 2014, Exercise Price: $85.00 | 1 | | | 670 |
| | | | | The Procter & Gamble Company | | | | |
| PG | | 130119P00057500 | | Expiration: January 2013, Exercise Price: $57.50 | 30 | | | 210 |
| PG | | 130119P00060000 | | Expiration: January 2013, Exercise Price: $60.00 | 35 | | | 367 |
| PG | | 140118P00057500 | | Expiration: January 2014, Exercise Price: $57.50 | 4 | | | 786 |
| | | | | Sigma-Aldrich Corporation | | | | |
| SIAL | | 130119P00065000 | | Expiration: January 2013, Exercise Price: $65.00 | 6 | | | 45 |
| SIAL | | 130420P00065000 | | Expiration: April 2013, Exercise Price: $65.00 | 77 | | | 5,775 |
| SIAL | | 130720P00065000 | | Expiration: July 2013, Exercise Price: $65.00 | 7 | | | 1,190 |
| | | | | | | | | 22,392 |
| | | | | Clothing and Clothing Accessories Stores | | | | |
| | | | | Limited Brands, Inc. | | | | |
| LTD | | 130119P00042000 | | Expiration: January 2013, Exercise Price: $42.00 | 2 | | | 40 |
| LTD | | 140118P00041000 | | Expiration: January 2014, Exercise Price: $41.00 | 15 | | | 5,025 |
| LTD | | 140118P00044000 | | Expiration: January 2014, Exercise Price: $44.00 | 2 | | | 890 |
| | | | | Tiffany & Company | | | | |
| TIF | | 130119P00050000 | | Expiration: January 2013, Exercise Price: $50.00 | 15 | | | 278 |
| TIF | | 130119P00052500 | | Expiration: January 2013, Exercise Price: $52.50 | 26 | | | 1,001 |
| TIF | | 130216P00047500 | | Expiration: February 2013, Exercise Price: $47.50 | 20 | | | 510 |
| TIF | | 140118P00045000 | | Expiration: January 2014, Exercise Price: $45.00 | 22 | | | 6,688 |
| TIF | | 140118P00052500 | | Expiration: January 2014, Exercise Price: $52.50 | 46 | | | 26,565 |
| TIF | | 140118P00057500 | | Expiration: January 2014, Exercise Price: $57.50 | 2 | | | 1,650 |
| | | | | | | | | 42,647 |
| | | | | Computer and Electronic Product Manufacturing | | | | |
| | | | | Apple Inc. | | | | |
| AAPL | | 140118P00450000 | | Expiration: January 2014, Exercise Price: $450.00 | 12 | | | 47,280 |
The accompanying notes are an integral part of these financial statements.
KINETICS PORTFOLIOS TRUST — MASTER INVESTMENT PORTFOLIOS The Multi-Disciplinary Portfolio Portfolio of Options Written — December 31, 2012 — (Continued) |
| | | Identifier | | | Contracts* | | | Value |
| | | | | | | | | |
| | | | | Computer and Electronic Product Manufacturing — (Continued) | | | | |
| | | | | Rockwell Collins, Inc. | | | | |
| COL | | 130119P00045000 | | Expiration: January 2013, Exercise Price: $45.00 | 15 | | $ | 113 |
| COL | | 130420P00045000 | | Expiration: April 2013, Exercise Price: $45.00 | 12 | | | 450 |
| COL | | 130720P00050000 | | Expiration: July 2013, Exercise Price: $50.00 | 56 | | | 8,540 |
| | | | | | | | | 56,383 |
| | | | | Construction of Buildings | | | | |
| | | | | Lennar Corporation — Class A | | | | |
| LEN | | 130119P00029000 | | Expiration: January 2013, Exercise Price: $29.00 | 4 | | | 16 |
| LEN | | 140118P00030000 | | Expiration: January 2014, Exercise Price: $30.00 | 3 | | | 791 |
| | | | | | | | | 807 |
| | | | | Couriers and Messengers | | | | |
| | | | | FedEx Corp. | | | | |
| FDX | | 130119P00075000 | | Expiration: January 2013, Exercise Price: $75.00 | 13 | | | 72 |
| FDX | | 130119P00080000 | | Expiration: January 2013, Exercise Price: $80.00 | 31 | | | 356 |
| FDX | | 140118P00070000 | | Expiration: January 2014, Exercise Price: $70.00 | 6 | | | 1,731 |
| FDX | | 140118P00075000 | | Expiration: January 2014, Exercise Price: $75.00 | 10 | | | 3,925 |
| FDX | | 140118P00077500 | | Expiration: January 2014, Exercise Price: $77.50 | 10 | | | 4,575 |
| | | | | United Parcel Service, Inc. — Class B | | | | |
| UPS | | 130119P00060000 | | Expiration: January 2013, Exercise Price: $60.00 | 12 | | | 24 |
| UPS | | 130119P00065000 | | Expiration: January 2013, Exercise Price: $65.00 | 12 | | | 90 |
| UPS | | 130119P00070000 | | Expiration: January 2013, Exercise Price: $70.00 | 23 | | | 655 |
| UPS | | 130119P00075000 | | Expiration: January 2013, Exercise Price: $75.00 | 10 | | | 1,800 |
| UPS | | 140118P00062500 | | Expiration: January 2014, Exercise Price: $62.50 | 8 | | | 2,192 |
| UPS | | 140118P00070000 | | Expiration: January 2014, Exercise Price: $70.00 | 11 | | | 5,693 |
| UPS | | 140118P00072500 | | Expiration: January 2014, Exercise Price: $72.50 | 4 | | | 2,520 |
| | | | | | | | | 23,633 |
| | | | | Credit Intermediation and Related Activities | | | | |
| | | | | American Express Company | | | | |
| AXP | | 130119P00045000 | | Expiration: January 2013, Exercise Price: $45.00 | 18 | | | 144 |
| AXP | | 140118P00050000 | | Expiration: January 2014, Exercise Price: $50.00 | 60 | | | 21,900 |
| | | | | Bank of America Corporation | | | | |
| BAC | | 130119P00005000 | | Expiration: January 2013, Exercise Price: $5.00 | 60 | | | 30 |
| BAC | | 130119P00007500 | | Expiration: January 2013, Exercise Price: $7.50 | 135 | | | 68 |
The accompanying notes are an integral part of these financial statements.
KINETICS PORTFOLIOS TRUST — MASTER INVESTMENT PORTFOLIOS The Multi-Disciplinary Portfolio Portfolio of Options Written — December 31, 2012 — (Continued) |
| | | Identifier | | | Contracts* | | | Value |
| | | | | | | | | |
| | | | | Credit Intermediation and Related Activities — (Continued) | | | | |
| | | | | The Bank of New York Mellon Corporation | | | | |
| BK | | 130119P00020000 | | Expiration: January 2013, Exercise Price: $20.00 | 100 | | $ | 550 |
| BK | | 130119P00022000 | | Expiration: January 2013, Exercise Price: $22.00 | 84 | | | 798 |
| | | | | M&T Bank Corporation | | | | |
| MTB | | 130119P00070000 | | Expiration: January 2013, Exercise Price: $70.00 | 15 | | | 75 |
| MTB | | 130119P00075000 | | Expiration: January 2013, Exercise Price: $75.00 | 19 | | | 95 |
| MTB | | 130119P00080000 | | Expiration: January 2013, Exercise Price: $80.00 | 17 | | | 128 |
| MTB | | 130119P00085000 | | Expiration: January 2013, Exercise Price: $85.00 | 6 | | | 75 |
| MTB | | 130720P00080000 | | Expiration: July 2013, Exercise Price: $80.00 | 10 | | | 1,600 |
| | | | | Northern Trust Corp. | | | | |
| NTRS | | 130119P00035000 | | Expiration: January 2013, Exercise Price: $35.00 | 6 | | | 15 |
| NTRS | | 130119P00040000 | | Expiration: January 2013, Exercise Price: $40.00 | 41 | | | 205 |
| NTRS | | 140118P00040000 | | Expiration: January 2014, Exercise Price: $40.00 | 71 | | | 12,780 |
| | | | | State Street Corporation | | | | |
| STT | | 130119P00030000 | | Expiration: January 2013, Exercise Price: $30.00 | 10 | | | 45 |
| STT | | 130119P00035000 | | Expiration: January 2013, Exercise Price: $35.00 | 62 | | | 589 |
| STT | | 130119P00037000 | | Expiration: January 2013, Exercise Price: $37.00 | 10 | | | 110 |
| STT | | 130119P00042000 | | Expiration: January 2013, Exercise Price: $42.00 | 11 | | | 242 |
| STT | | 140118P00035000 | | Expiration: January 2014, Exercise Price: $35.00 | 11 | | | 1,930 |
| | | | | U.S. Bancorp | | | | |
| USB | | 130119P00020000 | | Expiration: January 2013, Exercise Price: $20.00 | 40 | | | 40 |
| USB | | 130119P00022000 | | Expiration: January 2013, Exercise Price: $22.00 | 40 | | | 60 |
| | | | | Wells Fargo & Company | | | | |
| WFC | | 130119P00033000 | | Expiration: January 2013, Exercise Price: $33.00 | 4 | | | 162 |
| WFC | | 140118P00028000 | | Expiration: January 2014, Exercise Price: $28.00 | 80 | | | 14,360 |
| WFC | | 140118P00030000 | | Expiration: January 2014, Exercise Price: $30.00 | 30 | | | 7,185 |
| WFC | | 140118P00032000 | | Expiration: January 2014, Exercise Price: $32.00 | 3 | | | 945 |
| | | | | | | | | 64,131 |
| | | | | Defense | | | | |
| | | | | CACI International Inc. — Class A | | | | |
| CACI | | 130316P00040000 | | Expiration: March 2013, Exercise Price: $40.00 | 7 | | | 140 |
| CACI | | 130316P00050000 | | Expiration: March 2013, Exercise Price: $50.00 | 75 | | | 9,000 |
| CACI | | 130622P00050000 | | Expiration: June 2013, Exercise Price: $50.00 | 6 | | | 1,485 |
The accompanying notes are an integral part of these financial statements.
KINETICS PORTFOLIOS TRUST — MASTER INVESTMENT PORTFOLIOS The Multi-Disciplinary Portfolio Portfolio of Options Written — December 31, 2012 — (Continued) |
| | | Identifier | | | Contracts* | | | Value |
| | | | | | | | | |
| | | | | Defense — (Continued) | | | | |
| | | | | Northrop Grumman Corporation | | | | |
| NOC | | 130119P00050000 | | Expiration: January 2013, Exercise Price: $50.00 | 22 | | $ | 110 |
| NOC | | 130119P00052500 | | Expiration: January 2013, Exercise Price: $52.50 | 5 | | | 25 |
| NOC | | 130119P00055000 | | Expiration: January 2013, Exercise Price: $55.00 | 22 | | | 220 |
| NOC | | 130216P00057500 | | Expiration: February 2013, Exercise Price: $57.50 | 4 | | | 140 |
| NOC | | 140118P00060000 | | Expiration: January 2014, Exercise Price: $60.00 | 20 | | | 7,900 |
| | | | | | | | | 19,020 |
| | | | | E-Commerce | | | | |
| | | | | IAC/InterActiveCorp | | | | |
| IACI | | 130119P00040000 | | Expiration: January 2013, Exercise Price: $40.00 | 53 | | | 663 |
| IACI | | 130119P00050000 | | Expiration: January 2013, Exercise Price: $50.00 | 2 | | | 630 |
| IACI | | 130420P00045000 | | Expiration: April 2013, Exercise Price: $45.00 | 50 | | | 12,375 |
| | | | | | | | | 13,668 |
| | | | | Fabricated Metal Product Manufacturing | | | | |
| | | | | Danaher Corporation | | | | |
| DHR | | 130119P00052500 | | Expiration: January 2013, Exercise Price: $52.50 | 2 | | | 45 |
| DHR | | 140118P00045000 | | Expiration: January 2014, Exercise Price: $45.00 | 85 | | | 15,937 |
| DHR | | 140118P00052500 | | Expiration: January 2014, Exercise Price: $52.50 | 2 | | | 770 |
| | | | | McDermott International, Inc. | | | | |
| MDR | | 130119P00007500 | | Expiration: January 2013, Exercise Price: $7.50 | 200 | | | 500 |
| MDR | | 130119P00009000 | | Expiration: January 2013, Exercise Price: $9.00 | 121 | | | 303 |
| MDR | | 130119P00010000 | | Expiration: January 2013, Exercise Price: $10.00 | 155 | | | 1,162 |
| MDR | | 140118P00010000 | | Expiration: January 2014, Exercise Price: $10.00 | 120 | | | 17,100 |
| MDR | | 150117P00010000 | | Expiration: January 2015, Exercise Price: $10.00 | 46 | | | 10,580 |
| | | | | | | | | 46,397 |
| | | | | Food Manufacturing | | | | |
| | | | | Archer-Daniels-Midland Company | | | | |
| ADM | | 130119P00028000 | | Expiration: January 2013, Exercise Price: $28.00 | 5 | | | 460 |
| ADM | | 140118P00023000 | | Expiration: January 2014, Exercise Price: $23.00 | 25 | | | 3,250 |
| ADM | | 140118P00025000 | | Expiration: January 2014, Exercise Price: $25.00 | 51 | | | 9,945 |
| | | | | Bunge Limited | | | | |
| BG | | 130119P00055000 | | Expiration: January 2013, Exercise Price: $55.00 | 31 | | | 77 |
| BG | | 130119P00065000 | | Expiration: January 2013, Exercise Price: $65.00 | 6 | | | 45 |
| BG | | 140118P00055000 | | Expiration: January 2014, Exercise Price: $55.00 | 46 | | | 8,050 |
| BG | | 140118P00057500 | | Expiration: January 2014, Exercise Price: $57.50 | 7 | | | 1,435 |
| BG | | 140118P00062500 | | Expiration: January 2014, Exercise Price: $62.50 | 14 | | | 4,480 |
The accompanying notes are an integral part of these financial statements.
KINETICS PORTFOLIOS TRUST — MASTER INVESTMENT PORTFOLIOS The Multi-Disciplinary Portfolio Portfolio of Options Written — December 31, 2012 — (Continued) |
| | | Identifier | | | Contracts* | | | Value |
| | | | | | | | | |
| | | | | Food Manufacturing — (Continued) | | | | |
| | | | | ConAgra Foods, Inc. | | | | |
| CAG | | 130119P00023000 | | Expiration: January 2013, Exercise Price: $23.00 | 12 | | $ | 30 |
| CAG | | 130119P00025000 | | Expiration: January 2013, Exercise Price: $25.00 | 102 | | | 510 |
| | | | | Dean Foods Company | | | | |
| DF | | 130119P00007500 | | Expiration: January 2013, Exercise Price: $7.50 | 40 | | | 100 |
| | | | | Kellogg Company | | | | |
| K | | 130119P00047500 | | Expiration: January 2013, Exercise Price: $47.50 | 62 | | | 155 |
| K | | 140118P00050000 | | Expiration: January 2014, Exercise Price: $50.00 | 37 | | | 7,308 |
| | | | | Mead Johnson Nutrition Company | | | | |
| MJN | | 130119P00070000 | | Expiration: January 2013, Exercise Price: $70.00 | 15 | | | 6,488 |
| MJN | | 130216P00070000 | | Expiration: February 2013, Exercise Price: $70.00 | 20 | | | 9,950 |
| MJN | | 140118P00060000 | | Expiration: January 2014, Exercise Price: $60.00 | 41 | | | 19,782 |
| MJN | | 140118P00070000 | | Expiration: January 2014, Exercise Price: $70.00 | 12 | | | 12,090 |
| | | | | Mondelez International Inc. — Class A | | | | |
| MDLZ1 | | 130119P00040000 | | Expiration: January 2013, Exercise Price: $40.00 | 4 | | | 156 |
| MDLZ1 | | 140118P00035000 | | Expiration: January 2014, Exercise Price: $35.00 | 30 | | | 3,420 |
| MDLZ1 | | 140118P00040000 | | Expiration: January 2014, Exercise Price: $40.00 | 2 | | | 555 |
| | | | | Unilever NV | | | | |
| UN | | 130216P00030000 | | Expiration: February 2013, Exercise Price: $30.00 | 10 | | | 75 |
| | | | | | | | | 88,361 |
| | | | | Food Services and Drinking Places | | | | |
| | | | | Starbucks Corporation | | | | |
| SBUX | | 140118P00035000 | | Expiration: January 2014, Exercise Price: $35.00 | 118 | | | 13,216 |
| SBUX | | 140118P00045000 | | Expiration: January 2014, Exercise Price: $45.00 | 2 | | | 640 |
| SBUX | | 150117P00030000 | | Expiration: January 2015, Exercise Price: $30.00 | 30 | | | 5,010 |
| | | | | | | | | 18,866 |
| | | | | Funds, Trusts, and Other Financial Vehicles | | | | |
| | | | | iShares MSCI Japan Index Fund | | | | |
| EWJ | | 130119P00009000 | | Expiration: January 2013, Exercise Price: $9.00 | 443 | | | 1,108 |
| EWJ | | 140118P00009000 | | Expiration: January 2014, Exercise Price: $9.00 | 160 | | | 8,160 |
| | | | | iShares Russell 2000 Value Index Fund | | | | |
| IWM | | 130119P00077000 | | Expiration: January 2013, Exercise Price: $77.00 | 2 | | | 38 |
| IWM | | 130216P00069000 | | Expiration: February 2013, Exercise Price: $69.00 | 25 | | | 350 |
| IWM | | 140118P00079000 | | Expiration: January 2014, Exercise Price: $79.00 | 1 | | | 606 |
The accompanying notes are an integral part of these financial statements.
KINETICS PORTFOLIOS TRUST — MASTER INVESTMENT PORTFOLIOS The Multi-Disciplinary Portfolio Portfolio of Options Written — December 31, 2012 — (Continued) |
| | | Identifier | | | Contracts* | | | Value |
| | | | | | | | | |
| | | | | Funds, Trusts, and Other Financial Vehicles — (Continued) | | | | |
| | | | | Market Vectors Gold Miners ETF | | | | |
| GDX | | 130119P00040000 | | Expiration: January 2013, Exercise Price: $40.00 | 47 | | $ | 235 |
| GDX | | 130119P00043000 | | Expiration: January 2013, Exercise Price: $43.00 | 23 | | | 552 |
| GDX | | 130119P00045000 | | Expiration: January 2013, Exercise Price: $45.00 | 11 | | | 715 |
| GDX | | 130119P00050000 | | Expiration: January 2013, Exercise Price: $50.00 | 14 | | | 5,355 |
| GDX | | 140118P00040000 | | Expiration: January 2014, Exercise Price: $40.00 | 5 | | | 1,650 |
| GDX | | 140118P00045000 | | Expiration: January 2014, Exercise Price: $45.00 | 23 | | | 12,593 |
| | | | | Market Vectors Junior Gold Miners ETF | | | | |
| GDXJ | | 130119P00020630 | | Expiration: January 2013, Exercise Price: $20.63 | 10 | | | 1,200 |
| GDXJ | | 130119P00021630 | | Expiration: January 2013, Exercise Price: $21.63 | 30 | | | 6,000 |
| GDXJ | | 130119P00024630 | | Expiration: January 2013, Exercise Price: $24.63 | 15 | | | 7,350 |
| GDXJ | | 130119P00027630 | | Expiration: January 2013, Exercise Price: $27.63 | 15 | | | 11,775 |
| GDXJ | | 140118P00018000 | | Expiration: January 2014, Exercise Price: $18.00 | 166 | | | 45,235 |
| | | | | SPDR S&P 500 EFT Trust | | | | |
| SPY | | 130119P00138000 | | Expiration: January 2013, Exercise Price: $138.00 | 2 | | | 157 |
| SPY | | 130316P00139000 | | Expiration: March 2013, Exercise Price: $139.00 | 10 | | | 3,015 |
| SPY | | 140118P00135000 | | Expiration: January 2014, Exercise Price: $135.00 | 20 | | | 17,560 |
| SPY | | 140118P00138000 | | Expiration: January 2014, Exercise Price: $138.00 | 20 | | | 19,830 |
| SPY | | 141220P00140000 | | Expiration: December 2014, | | | | |
| | | | | Exercise Price: $140.00 | 1 | | | 1,695 |
| | | | | | | | | 145,179 |
| | | | | Gaming | | | | |
| | | | | Las Vegas Sands Corp. | | | | |
| LVS | | 130119P00032250 | | Expiration: January 2013, Exercise Price: $32.25 | 36 | | | 90 |
| LVS | | 130119P00037250 | | Expiration: January 2013, Exercise Price: $37.25 | 22 | | | 154 |
| LVS | | 140118P00027250 | | Expiration: January 2014, Exercise Price: $27.25 | 70 | | | 8,400 |
| LVS | | 140118P00032250 | | Expiration: January 2014, Exercise Price: $32.25 | 32 | | | 6,640 |
| LVS | | 140118P00035250 | | Expiration: January 2014, Exercise Price: $35.25 | 3 | | | 844 |
| | | | | Wynn Resorts Limited | | | | |
| WYNN | | 140118P00062500 | | Expiration: January 2014, Exercise Price: $62.50 | 46 | | | 9,246 |
| WYNN | | 140118P00067500 | | Expiration: January 2014, Exercise Price: $67.50 | 12 | | | 3,066 |
| WYNN | | 140118P00072500 | | Expiration: January 2014, Exercise Price: $72.50 | 8 | | | 2,648 |
| WYNN | | 140118P00087500 | | Expiration: January 2014, Exercise Price: $87.50 | 4 | | | 2,520 |
| WYNN | | 140118P00095000 | | Expiration: January 2014, Exercise Price: $95.00 | 8 | | | 5,040 |
| | | | | | | | | 38,648 |
The accompanying notes are an integral part of these financial statements.
KINETICS PORTFOLIOS TRUST — MASTER INVESTMENT PORTFOLIOS The Multi-Disciplinary Portfolio Portfolio of Options Written — December 31, 2012 — (Continued) |
| | | Identifier | | | Contracts* | | | Value |
| | | | | | | | | |
| | | | | General Merchandise Stores | | | | |
| | | | | Sears Holdings Corporation | | | | |
| SHLD1 | | 130119P00055000 | | Expiration: January 2013, Exercise Price: $55.00 | 12 | | $ | 10,680 |
| SHLD | | 140118P00030420 | | Expiration: January 2014, Exercise Price: $30.42 | 54 | | | 25,245 |
| SHLD | | 140118P00047920 | | Expiration: January 2014, Exercise Price: $47.92 | 27 | | | 36,315 |
| SHLD | | 140621P00047920 | | Expiration: June 2014, Exercise Price: $47.92 | 2 | | | 2,990 |
| | | | | | | | | 75,230 |
| | | | | Holding Company | | | | |
| | | | | Berkshire Hathaway Inc. — Class B | | | | |
| BRKB | | 130119P00070000 | | Expiration: January 2013, Exercise Price: $70.00 | 10 | | | 35 |
| BRKB | | 130119P00072500 | | Expiration: January 2013, Exercise Price: $72.50 | 31 | | | 171 |
| BRKB | | 130119P00075000 | | Expiration: January 2013, Exercise Price: $75.00 | 14 | | | 84 |
| BRKB | | 140118P00080000 | | Expiration: January 2014, Exercise Price: $80.00 | 23 | | | 6,969 |
| | | | | Leucadia National Corporation | | | | |
| LUK | | 130316P00022500 | | Expiration: March 2013, Exercise Price: $22.50 | 100 | | | 6,750 |
| LUK | | 130622P00020000 | | Expiration: June 2013, Exercise Price: $20.00 | 119 | | | 7,437 |
| | | | | | | | | 21,446 |
| | | | | Insurance Carriers and Related Activities | | | | |
| | | | | American International Group, Inc. | | | | |
| AIG | | 130119P00030000 | | Expiration: January 2013, Exercise Price: $30.00 | 30 | | | 195 |
| AIG | | 140118P00030000 | | Expiration: January 2014, Exercise Price: $30.00 | 71 | | | 19,951 |
| | | | | China Life Insurance Co., Ltd. — ADR | | | | |
| LFC | | 130119P00035000 | | Expiration: January 2013, Exercise Price: $35.00 | 32 | | | 80 |
| | | | | Greenlight Capital Re, Ltd. — Class A | | | | |
| GLRE | | 130216P00025000 | | Expiration: February 2013, Exercise Price: $25.00 | 120 | | | 26,100 |
| GLRE | | 130518P00022500 | | Expiration: May 2013, Exercise Price: $22.50 | 85 | | | 7,650 |
| | | | | Loews Corporation | | | | |
| L | | 130316P00035000 | | Expiration: March 2013, Exercise Price: $35.00 | 6 | | | 135 |
| L | | 130316P00040000 | | Expiration: March 2013, Exercise Price: $40.00 | 80 | | | 7,800 |
| | | | | Marsh & McLennan Companies, Inc. | | | | |
| MMC | | 130119P00030000 | | Expiration: January 2013, Exercise Price: $30.00 | 70 | | | 350 |
| MMC | | 140118P00025000 | | Expiration: January 2014, Exercise Price: $25.00 | 16 | | | 920 |
| | | | | The Progressive Corporation | | | | |
| PGR | | 130119P00016500 | | Expiration: January 2013, Exercise Price: $16.50 | 29 | | | 145 |
| PGR | | 130119P00019000 | | Expiration: January 2013, Exercise Price: $19.00 | 40 | | | 200 |
| PGR | | 130216P00018000 | | Expiration: February 2013, Exercise Price: $18.00 | 36 | | | 360 |
| PGR | | 130216P00019000 | | Expiration: February 2013, Exercise Price: $19.00 | 110 | | | 1,925 |
| | | | | | | | | 65,811 |
The accompanying notes are an integral part of these financial statements.
KINETICS PORTFOLIOS TRUST — MASTER INVESTMENT PORTFOLIOS The Multi-Disciplinary Portfolio Portfolio of Options Written — December 31, 2012 — (Continued) |
| | | Identifier | | | Contracts* | | | Value |
| | | | | | | | | |
| | | | | Lessors of Nonfinancial Intangible Assets (except Copyrighted Works) | | | | |
| | | | | Hugoton Royalty Trust | | | | |
| HGT | | 130216P00007500 | | Expiration: February 2013, Exercise Price: $7.50 | 70 | | $ | 3,500 |
| HGT | | 130518P00007500 | | Expiration: May 2013, Exercise Price: $7.50 | 150 | | | 12,750 |
| | | | | San Juan Basin Royalty Trust | | | | |
| SJT | | 130119P00012500 | | Expiration: January 2013, Exercise Price: $12.50 | 15 | | | 187 |
| SJT | | 130420P00012500 | | Expiration: April 2013, Exercise Price: $12.50 | 280 | | | 23,100 |
| | | | | | | | | 39,537 |
| | | | | Lessors of Nonresidential Buildings (except Miniwarehouses) | | | | |
| | | | | The Howard Hughes Corporation | | | | |
| HHC | | 130119P00055000 | | Expiration: January 2013, Exercise Price: $55.00 | 2 | | | 25 |
| | | | | Machinery Manufacturing | | | | |
| | | | | Lindsay Corporation | | | | |
| LNN | | 130316P00060000 | | Expiration: March 2013, Exercise Price: $60.00 | 60 | | | 1,950 |
| | | | | Management of Companies and Enterprises | | | | |
| | | | | JPMorgan Chase & Co. | | | | |
| JPM | | 130119P00028000 | | Expiration: January 2013, Exercise Price: $28.00 | 15 | | | 38 |
| JPM | | 130119P00034000 | | Expiration: January 2013, Exercise Price: $34.00 | 11 | | | 71 |
| JPM | | 130119P00037000 | | Expiration: January 2013, Exercise Price: $37.00 | 21 | | | 262 |
| JPM | | 140118P00030000 | | Expiration: January 2014, Exercise Price: $30.00 | 100 | | | 14,450 |
| JPM | | 140118P00032000 | | Expiration: January 2014, Exercise Price: $32.00 | 25 | | | 4,575 |
| JPM | | 140118P00035000 | | Expiration: January 2014, Exercise Price: $35.00 | 12 | | | 2,934 |
| | | | | The Goldman Sachs Group, Inc. | | | | |
| GS | | 130119P00090000 | | Expiration: January 2013, Exercise Price: $90.00 | 5 | | | 53 |
| GS | | 130119P00095000 | | Expiration: January 2013, Exercise Price: $95.00 | 11 | | | 148 |
| | | | | | | | | 22,531 |
| | | | | Manufactured Brands | | | | |
| | | | | Jarden Corporation | | | | |
| JAH | | 130119P00035000 | | Expiration: January 2013, Exercise Price: $35.00 | 10 | | | 50 |
| | | | | Merchant Wholesalers, Nondurable Goods | | | | |
| | | | | Express Scripts Holding Company | | | | |
| ESRX | | 140118P00045000 | | Expiration: January 2014, Exercise Price: $45.00 | 20 | | | 5,370 |
| | | | | Molson Coors Brewing Company — Class B | | | | |
| TAP | | 130119P00040000 | | Expiration: January 2013, Exercise Price: $40.00 | 6 | | | 60 |
| TAP | | 140118P00040000 | | Expiration: January 2014, Exercise Price: $40.00 | 90 | | | 28,350 |
| TAP | | 150117P00040000 | | Expiration: January 2015, Exercise Price: $40.00 | 50 | | | 26,250 |
| | | | | | | | | 60,030 |
The accompanying notes are an integral part of these financial statements.
KINETICS PORTFOLIOS TRUST — MASTER INVESTMENT PORTFOLIOS The Multi-Disciplinary Portfolio Portfolio of Options Written — December 31, 2012 — (Continued) |
| | | Identifier | | | Contracts* | | | Value |
| | | | | | | | | |
| | | | | Mining (except Oil and Gas) | | | | |
| | | | | Barrick Gold Corporation | | | | |
| ABX | | 130119P00038000 | | Expiration: January 2013, Exercise Price: $38.00 | 30 | | $ | 9,300 |
| ABX | | 130119P00040000 | | Expiration: January 2013, Exercise Price: $40.00 | 53 | | | 26,633 |
| ABX | | 130119P00043000 | | Expiration: January 2013, Exercise Price: $43.00 | 8 | | | 6,400 |
| ABX | | 140118P00030000 | | Expiration: January 2014, Exercise Price: $30.00 | 10 | | | 2,490 |
| ABX | | 140118P00035000 | | Expiration: January 2014, Exercise Price: $35.00 | 11 | | | 5,335 |
| ABX | | 140118P00040000 | | Expiration: January 2014, Exercise Price: $40.00 | 25 | | | 20,187 |
| ABX | | 140118P00045000 | | Expiration: January 2014, Exercise Price: $45.00 | 9 | | | 10,800 |
| | | | | Cameco Corporation | | | | |
| CCJ | | 130119P00015000 | | Expiration: January 2013, Exercise Price: $15.00 | 14 | | | 35 |
| CCJ | | 130119P00018000 | | Expiration: January 2013, Exercise Price: $18.00 | 99 | | | 743 |
| CCJ | | 130119P00020000 | | Expiration: January 2013, Exercise Price: $20.00 | 51 | | | 3,570 |
| CCJ | | 130119P00021000 | | Expiration: January 2013, Exercise Price: $21.00 | 4 | | | 560 |
| CCJ | | 130119P00022000 | | Expiration: January 2013, Exercise Price: $22.00 | 40 | | | 9,200 |
| CCJ | | 140118P00015000 | | Expiration: January 2014, Exercise Price: $15.00 | 65 | | | 6,175 |
| | | | | Freeport-McMoRan Copper & Gold Inc. | | | | |
| FCX | | 130119P00029500 | | Expiration: January 2013, Exercise Price: $29.50 | 30 | | | 255 |
| FCX | | 130119P00033000 | | Expiration: January 2013, Exercise Price: $33.00 | 65 | | | 3,965 |
| FCX | | 130119P00035000 | | Expiration: January 2013, Exercise Price: $35.00 | 11 | | | 1,788 |
| FCX | | 140118P00030000 | | Expiration: January 2014, Exercise Price: $30.00 | 63 | | | 21,420 |
| FCX | | 140118P00035000 | | Expiration: January 2014, Exercise Price: $35.00 | 2 | | | 1,170 |
| | | | | Harry Winston Diamond Corporation | | | | |
| HWD | | 130216P00010000 | | Expiration: February 2013, Exercise Price: $10.00 | 155 | | | 1,550 |
| HWD | | 130216P00012500 | | Expiration: February 2013, Exercise Price: $12.50 | 100 | | | 2,750 |
| HWD | | 130518P00010000 | | Expiration: May 2013, Exercise Price: $10.00 | 30 | | | 600 |
| HWD | | 130518P00012500 | | Expiration: May 2013, Exercise Price: $12.50 | 25 | | | 1,812 |
| HWD | | 130817P00012500 | | Expiration: August 2013, Exercise Price: $12.50 | 180 | | | 18,900 |
| | | | | Newmont Mining Corporation | | | | |
| NEM | | 130119P00046000 | | Expiration: January 2013, Exercise Price: $46.00 | 29 | | | 2,944 |
| NEM | | 130119P00050000 | | Expiration: January 2013, Exercise Price: $50.00 | 5 | | | 1,875 |
| NEM | | 130119P00052500 | | Expiration: January 2013, Exercise Price: $52.50 | 39 | | | 23,887 |
| NEM | | 130119P00060000 | | Expiration: January 2013, Exercise Price: $60.00 | 10 | | | 13,550 |
| NEM | | 140118P00045000 | | Expiration: January 2014, Exercise Price: $45.00 | 6 | | | 3,465 |
| NEM | | 140118P00050000 | | Expiration: January 2014, Exercise Price: $50.00 | 18 | | | 15,840 |
| | | | | NovaGold Resources Inc. | | | | |
| NG | | 140118P00005000 | | Expiration: January 2014, Exercise Price: $5.00 | 570 | | | 74,100 |
| NG1 | | 140118P00005000 | | Expiration: January 2014, Exercise Price: $5.00 | 150 | | | 18,750 |
| NG1 | | 140118P00007000 | | Expiration: January 2014, Exercise Price: $7.00 | 285 | | | 79,087 |
The accompanying notes are an integral part of these financial statements.
KINETICS PORTFOLIOS TRUST — MASTER INVESTMENT PORTFOLIOS The Multi-Disciplinary Portfolio Portfolio of Options Written — December 31, 2012 — (Continued) |
| | | Identifier | | | Contracts* | | | Value |
| | | | | | | | | |
| | | | | Mining (except Oil and Gas) — (Continued) | | | | |
| | | | | Rio Tinto PLC — ADR | | | | |
| RIO | | 130119P00050000 | | Expiration: January 2013, Exercise Price: $50.00 | 22 | | $ | 275 |
| RIO | | 130119P00052500 | | Expiration: January 2013, Exercise Price: $52.50 | 20 | | | 500 |
| RIO | | 130119P00060000 | | Expiration: January 2013, Exercise Price: $60.00 | 12 | | | 3,240 |
| RIO | | 140118P00032500 | | Expiration: January 2014, Exercise Price: $32.50 | 35 | | | 3,150 |
| RIO | | 140118P00037500 | | Expiration: January 2014, Exercise Price: $37.50 | 36 | | | 5,760 |
| | | | | Royal Gold, Inc. | | | | |
| RGLD | | 130119P00060000 | | Expiration: January 2013, Exercise Price: $60.00 | 4 | | | 10 |
| RGLD | | 130119P00062500 | | Expiration: January 2013, Exercise Price: $62.50 | 4 | | | 10 |
| RGLD | | 140118P00060000 | | Expiration: January 2014, Exercise Price: $60.00 | 52 | | | 16,900 |
| RGLD | | 140118P00075000 | | Expiration: January 2014, Exercise Price: $75.00 | 25 | | | 21,125 |
| | | | | Vale SA | | | | |
| VALE | | 130119P00025000 | | Expiration: January 2013, Exercise Price: $25.00 | 55 | | | 22,275 |
| VALE | | 140118P00018000 | | Expiration: January 2014, Exercise Price: $18.00 | 60 | | | 9,480 |
| | | | | | | | | 471,861 |
| | | | | Miscellaneous Manufacturing | | | | |
| | | | | 3M Co. | | | | |
| MMM | | 130119P00065000 | | Expiration: January 2013, Exercise Price: $65.00 | 10 | | | 15 |
| MMM | | 130119P00067500 | | Expiration: January 2013, Exercise Price: $67.50 | 23 | | | 34 |
| MMM | | 140118P00080000 | | Expiration: January 2014, Exercise Price: $80.00 | 10 | | | 4,025 |
| | | | | International Game Technology | | | | |
| IGT | | 130119P00011000 | | Expiration: January 2013, Exercise Price: $11.00 | 95 | | | 238 |
| IGT | | 130119P00012500 | | Expiration: January 2013, Exercise Price: $12.50 | 118 | | | 885 |
| IGT | | 130119P00015000 | | Expiration: January 2013, Exercise Price: $15.00 | 81 | | | 8,100 |
| IGT | | 140118P00010000 | | Expiration: January 2014, Exercise Price: $10.00 | 104 | | | 6,240 |
| IGT | | 140118P00013000 | | Expiration: January 2014, Exercise Price: $13.00 | 63 | | | 10,080 |
| IGT | | 150117P00010000 | | Expiration: January 2015, Exercise Price: $10.00 | 20 | | | 2,400 |
| | | | | | | | | 32,017 |
| | | | | Motion Picture and Sound Recording Industries | | | | |
| | | | | DreamWorks Animation SKG, Inc. — Class A | | | | |
| DWA | | 130316P00017500 | | Expiration: March 2013, Exercise Price: $17.50 | 215 | | | 35,475 |
| DWA | | 130622P00015000 | | Expiration: June 2013, Exercise Price: $15.00 | 125 | | | 12,187 |
| DWA | | 130622P00017500 | | Expiration: June 2013, Exercise Price: $17.50 | 9 | | | 1,980 |
| | | | | | | | | 49,642 |
The accompanying notes are an integral part of these financial statements.
KINETICS PORTFOLIOS TRUST — MASTER INVESTMENT PORTFOLIOS The Multi-Disciplinary Portfolio Portfolio of Options Written — December 31, 2012 — (Continued) |
| | | Identifier | | | Contracts* | | | Value |
| | | | | | | | | |
| | | | | Motor Vehicle and Parts Dealers | | | | |
| | | | | AutoNation, Inc. | | | | |
| AN | | 130420P00039000 | | Expiration: April 2013, Exercise Price: $39.00 | 120 | | $ | 26,100 |
| AN | | 130720P00038000 | | Expiration: July 2013, Exercise Price: $38.00 | 30 | | | 8,400 |
| | | | | | | | | 34,500 |
| | | | | Non-Store Retailers | | | | |
| | | | | eBay, Inc. | | | | |
| EBAY | | 130119P00025000 | | Expiration: January 2013, Exercise Price: $25.00 | 60 | | | 90 |
| EBAY | | 130119P00043000 | | Expiration: January 2013, Exercise Price: $43.00 | 2 | | | 32 |
| EBAY | | 140118P00045000 | | Expiration: January 2014, Exercise Price: $45.00 | 2 | | | 870 |
| | | | | Sotheby’s | | | | |
| BID | | 130119P00025000 | | Expiration: January 2013, Exercise Price: $25.00 | 55 | | | 275 |
| BID | | 130119P00030000 | | Expiration: January 2013, Exercise Price: $30.00 | 45 | | | 1,125 |
| BID | | 140118P00023000 | | Expiration: January 2014, Exercise Price: $23.00 | 133 | | | 19,285 |
| | | | | | | | | 21,677 |
| | | | | Oil and Gas and Consumable Fuels | | | | |
| | | | | PetroChina Company Ltd. — ADR | | | | |
| PTR | | 130119P00115000 | | Expiration: January 2013, Exercise Price: $115.00 | 14 | | | 140 |
| PTR | | 130119P00125000 | | Expiration: January 2013, Exercise Price: $125.00 | 16 | | | 200 |
| | | | | | | | | 340 |
| | | | | Oil and Gas Extraction | | | | |
| | | | | Canadian Natural Resources Ltd. | | | | |
| CNQ | | 130119P00030000 | | Expiration: January 2013, Exercise Price: $30.00 | 78 | | | 11,310 |
| CNQ | | 130119P00031000 | | Expiration: January 2013, Exercise Price: $31.00 | 13 | | | 2,925 |
| CNQ | | 130119P00033000 | | Expiration: January 2013, Exercise Price: $33.00 | 26 | | | 10,790 |
| CNQ | | 140118P00025000 | | Expiration: January 2014, Exercise Price: $25.00 | 36 | | | 8,550 |
| CNQ | | 140118P00028000 | | Expiration: January 2014, Exercise Price: $28.00 | 25 | | | 9,000 |
| CNQ | | 140118P00030000 | | Expiration: January 2014, Exercise Price: $30.00 | 3 | | | 1,410 |
| | | | | Cenovus Energy Inc. | | | | |
| CVE | | 130316P00030000 | | Expiration: March 2013, Exercise Price: $30.00 | 100 | | | 5,750 |
| | | | | CNOOC Ltd. — ADR | | | | |
| CEO | | 130316P00180000 | | Expiration: March 2013, Exercise Price: $180.00 | 22 | | | 1,925 |
| | | | | Encana Corporation | | | | |
| ECA | | 130119P00017500 | | Expiration: January 2013, Exercise Price: $17.50 | 205 | | | 1,025 |
| ECA | | 130119P00025000 | | Expiration: January 2013, Exercise Price: $25.00 | 13 | | | 6,825 |
| ECA | | 140118P00018000 | | Expiration: January 2014, Exercise Price: $18.00 | 50 | | | 10,750 |
| ECA | | 140118P00020000 | | Expiration: January 2014, Exercise Price: $20.00 | 31 | | | 9,920 |
| ECA | | 140118P00022000 | | Expiration: January 2014, Exercise Price: $22.00 | 5 | | | 2,225 |
The accompanying notes are an integral part of these financial statements.
KINETICS PORTFOLIOS TRUST — MASTER INVESTMENT PORTFOLIOS The Multi-Disciplinary Portfolio Portfolio of Options Written — December 31, 2012 — (Continued) |
| | | Identifier | | | Contracts* | | | Value |
| | | | | | | | | |
| | | | | Oil and Gas Extraction — (Continued) | | | | |
| | | | | EXCO Resources, Inc. | | | | |
| XCO | | 130316P00006000 | | Expiration: March 2013, Exercise Price: $6.00 | 250 | | $ | 7,500 |
| | | | | Imperial Oil Ltd. | | | | |
| IMO | | 130518P00040000 | | Expiration: May 2013, Exercise Price: $40.00 | 90 | | | 13,500 |
| | | | | Occidental Petroleum Corporation | | | | |
| OXY | | 140118P00055000 | | Expiration: January 2014, Exercise Price: $55.00 | 91 | | | 24,525 |
| OXY | | 140118P00075000 | | Expiration: January 2014, Exercise Price: $75.00 | 7 | | | 6,352 |
| | | | | Penn West Petroleum Ltd. | | | | |
| PWE | | 130316P00013000 | | Expiration: March 2013, Exercise Price: $13.00 | 60 | | | 13,500 |
| PWE | | 130622P00012000 | | Expiration: June 2013, Exercise Price: $12.00 | 65 | | | 12,350 |
| | | | | Petroleo Brasileiro S.A. — ADR | | | | |
| PBR | | 130119P00023000 | | Expiration: January 2013, Exercise Price: $23.00 | 41 | | | 15,067 |
| PBR | | 130119P00025000 | | Expiration: January 2013, Exercise Price: $25.00 | 101 | | | 57,065 |
| PBR | | 130119P00035000 | | Expiration: January 2013, Exercise Price: $35.00 | 8 | | | 12,500 |
| | | | | SandRidge Energy Inc. | | | | |
| SD | | 140118P00005000 | | Expiration: January 2014, Exercise Price: $5.00 | 900 | | | 72,900 |
| | | | | Sasol Ltd. — ADR | | | | |
| SSL | | 130316P00040000 | | Expiration: March 2013, Exercise Price: $40.00 | 75 | | | 6,375 |
| SSL | | 130622P00040000 | | Expiration: June 2013, Exercise Price: $40.00 | 54 | | | 11,880 |
| | | | | StatoilHydro ASA — ADR | | | | |
| STO | | 130119P00022500 | | Expiration: January 2013, Exercise Price: $22.50 | 24 | | | 120 |
| STO | | 130420P00022500 | | Expiration: April 2013, Exercise Price: $22.50 | 50 | | | 1,625 |
| STO | | 130720P00022500 | | Expiration: July 2013, Exercise Price: $22.50 | 88 | | | 8,140 |
| | | | | Suncor Energy, Inc. | | | | |
| SU | | 130119P00028000 | | Expiration: January 2013, Exercise Price: $28.00 | 9 | | | 59 |
| SU | | 130119P00030000 | | Expiration: January 2013, Exercise Price: $30.00 | 6 | | | 90 |
| SU | | 130119P00032000 | | Expiration: January 2013, Exercise Price: $32.00 | 85 | | | 3,867 |
| SU | | 140118P00025000 | | Expiration: January 2014, Exercise Price: $25.00 | 12 | | | 1,638 |
| SU | | 140118P00030000 | | Expiration: January 2014, Exercise Price: $30.00 | 70 | | | 20,265 |
| | | | | Total SA — ADR | | | | |
| TOT | | 130119P00045000 | | Expiration: January 2013, Exercise Price: $45.00 | 84 | | | 630 |
| TOT | | 140118P00040000 | | Expiration: January 2014, Exercise Price: $40.00 | 14 | | | 2,100 |
| TOT | | 140118P00042500 | | Expiration: January 2014, Exercise Price: $42.50 | 16 | | | 3,160 |
| TOT | | 140118P00045000 | | Expiration: January 2014, Exercise Price: $45.00 | 7 | | | 1,872 |
| | | | | WPX Energy Inc. | | | | |
| WPX | | 130119P00015000 | | Expiration: January 2013, Exercise Price: $15.00 | 141 | | | 8,108 |
| WPX | | 140118P00012500 | | Expiration: January 2014, Exercise Price: $12.50 | 100 | | | 13,750 |
| WPX | | 140118P00015000 | | Expiration: January 2014, Exercise Price: $15.00 | 114 | | | 28,785 |
| | | | | | | | | 430,128 |
The accompanying notes are an integral part of these financial statements.
KINETICS PORTFOLIOS TRUST — MASTER INVESTMENT PORTFOLIOS The Multi-Disciplinary Portfolio Portfolio of Options Written — December 31, 2012 — (Continued) |
| | | Identifier | | | Contracts* | | | Value |
| | | | | | | | | |
| | | | | Performing Arts, Spectator Sports, and Related Industries | | | | |
| | | | | The Madison Square Garden Company | | | | |
| MSG | | 130216P00037000 | | Expiration: February 2013, Exercise Price: $37.00 | 2 | | $ | 15 |
| | | | | Petroleum and Coal Products Manufacturing | | | | |
| | | | | Exxon Mobile Corporation | | | | |
| XOM | | 130119P00085000 | | Expiration: January 2013, Exercise Price: $85.00 | 2 | | | 177 |
| XOM | | 140118P00082500 | | Expiration: January 2014, Exercise Price: $82.50 | 20 | | | 11,900 |
| XOM | | 140118P00087500 | | Expiration: January 2014, Exercise Price: $87.50 | 1 | | | 823 |
| | | | | | | | | 12,900 |
| | | | | Pharmaceutical and Biotechnology | | | | |
| | | | | Novartis AG — ADR | | | | |
| NVS | | 130119P00047500 | | Expiration: January 2013, Exercise Price: $47.50 | 22 | | | 55 |
| NVS | | 130119P00050000 | | Expiration: January 2013, Exercise Price: $50.00 | 20 | | | 50 |
| NVS | | 130119P00052500 | | Expiration: January 2013, Exercise Price: $52.50 | 30 | | | 75 |
| NVS | | 140118P00050000 | | Expiration: January 2014, Exercise Price: $50.00 | 15 | | | 1,613 |
| | | | | Sanofi — ADR | | | | |
| SNY | | 130316P00040000 | | Expiration: March 2013, Exercise Price: $40.00 | 35 | | | 787 |
| SNY | | 130622P00040000 | | Expiration: June 2013, Exercise Price: $40.00 | 25 | | | 2,375 |
| SNY | | 130622P00041000 | | Expiration: June 2013, Exercise Price: $41.00 | 5 | | | 550 |
| | | | | | | | | 5,505 |
| | | | | Pipeline Transportation | | | | |
| | | | | The Williams Companies, Inc. | | | | |
| WMB1 | | 130119P00020000 | | Expiration: January 2013, Exercise Price: $20.00 | 80 | | | 120 |
| WMB1 | | 130119P00025000 | | Expiration: January 2013, Exercise Price: $25.00 | 15 | | | 38 |
| WMB | | 130216P00025000 | | Expiration: February 2013, Exercise Price: $25.00 | 65 | | | 325 |
| | | | | | | | | 483 |
| | | | | Primary Metal Manufacturing | | | | |
| | | | | Commercial Metals Company | | | | |
| CMC | | 130316P00012000 | | Expiration: March 2013, Exercise Price: $12.00 | 230 | | | 3,450 |
| | | | | Mueller Industries, Inc. | | | | |
| MLI | | 130316P00045000 | | Expiration: March 2013, Exercise Price: $45.00 | 15 | | | 1,500 |
| | | | | | | | | 4,950 |
| | | | | Professional, Scientific, and Technical Services | | | | |
| | | | | Automatic Data Processing, Inc. | | | | |
| ADP | | 130119P00050000 | | Expiration: January 2013, Exercise Price: $50.00 | 32 | | | 160 |
| ADP | | 140118P00050000 | | Expiration: January 2014, Exercise Price: $50.00 | 52 | | | 12,740 |
| ADP | | 140118P00052500 | | Expiration: January 2014, Exercise Price: $52.50 | 3 | | | 975 |
The accompanying notes are an integral part of these financial statements.
KINETICS PORTFOLIOS TRUST — MASTER INVESTMENT PORTFOLIOS The Multi-Disciplinary Portfolio Portfolio of Options Written — December 31, 2012 — (Continued) |
| | | Identifier | | | Contracts* | | | Value |
| | | | | | | | | |
| | | | | Professional, Scientific, and Technical Services — (Continued) | | | | |
| | | | | Charles River Laboratories International, Inc. | | | | |
| CRL | | 130518P00030000 | | Expiration: May 2013, Exercise Price: $30.00 | 90 | | $ | 5,400 |
| CRL | | 130817P00030000 | | Expiration: August 2013, Exercise Price: $30.00 | 50 | | | 5,000 |
| | | | | | | | | 24,275 |
| | | | | Publishing Industries (except Internet) | | | | |
| | | | | News Corporation — Class A | | | | |
| NWSA | | 130119P00017500 | | Expiration: January 2013, Exercise Price: $17.50 | 225 | | | 562 |
| NWSA | | 140118P00022000 | | Expiration: January 2014, Exercise Price: $22.00 | 84 | | | 11,550 |
| | | | | | | | | 12,112 |
| | | | | Rail Transportation | | | | |
| | | | | Canadian National Railway Company | | | | |
| CNI | | 130119P00075000 | | Expiration: January 2013, Exercise Price: $75.00 | 6 | | | 30 |
| CNI | | 130420P00080000 | | Expiration: April 2013, Exercise Price: $80.00 | 62 | | | 5,270 |
| CNI | | 130720P00085000 | | Expiration: July 2013, Exercise Price: $85.00 | 2 | | | 625 |
| | | | | Canadian Pacific Railway Limited | | | | |
| CP | | 130316P00075000 | | Expiration: March 2013, Exercise Price: $75.00 | 15 | | | 300 |
| CP | | 130622P00075000 | | Expiration: June 2013, Exercise Price: $75.00 | 19 | | | 1,567 |
| CP | | 130622P00090000 | | Expiration: June 2013, Exercise Price: $90.00 | 20 | | | 5,900 |
| | | | | CSX Corporation | | | | |
| CSX | | 130119P00020000 | | Expiration: January 2013, Exercise Price: $20.00 | 178 | | | 9,701 |
| CSX | | 140118P00017500 | | Expiration: January 2014, Exercise Price: $17.50 | 69 | | | 9,867 |
| CSX | | 140118P00020000 | | Expiration: January 2014, Exercise Price: $20.00 | 45 | | | 11,498 |
| | | | | Norfolk Southern Corporation | | | | |
| NSC | | 130119P00062500 | | Expiration: January 2013, Exercise Price: $62.50 | 15 | | | 2,325 |
| NSC | | 130119P00065000 | | Expiration: January 2013, Exercise Price: $65.00 | 32 | | | 10,880 |
| NSC | | 130119P00070000 | | Expiration: January 2013, Exercise Price: $70.00 | 6 | | | 4,920 |
| NSC | | 140118P00057500 | | Expiration: January 2014, Exercise Price: $57.50 | 22 | | | 11,330 |
| NSC | | 140118P00065000 | | Expiration: January 2014, Exercise Price: $65.00 | 15 | | | 13,575 |
| | | | | Union Pacific Corporation | | | | |
| UNP | | 130119P00090000 | | Expiration: January 2013, Exercise Price: $90.00 | 4 | | | 6 |
| UNP | | 130119P00097500 | | Expiration: January 2013, Exercise Price: $97.50 | 7 | | | 31 |
| UNP | | 130119P00100000 | | Expiration: January 2013, Exercise Price: $100.00 | 26 | | | 156 |
| UNP | | 140118P00095000 | | Expiration: January 2014, Exercise Price: $95.00 | 11 | | | 4,730 |
| UNP | | 140118P00100000 | | Expiration: January 2014, Exercise Price: $100.00 | 5 | | | 2,688 |
| | | | | | | | | 95,399 |
The accompanying notes are an integral part of these financial statements.
KINETICS PORTFOLIOS TRUST — MASTER INVESTMENT PORTFOLIOS The Multi-Disciplinary Portfolio Portfolio of Options Written — December 31, 2012 — (Continued) |
| | | Identifier | | | Contracts* | | | Value |
| | | | | | | | | |
| | | | | Real Estate | | | | |
| | | | | Boston Properties, Inc. | | | | |
| BXP | | 130119P00077500 | | Expiration: January 2013, Exercise Price: $77.50 | 2 | | $ | 15 |
| | | | | CBRE Group, Inc. — Class A | | | | |
| CBG | | 130316P00014000 | | Expiration: March 2013, Exercise Price: $14.00 | 60 | | | 450 |
| | | | | General Growth Properties, Inc. | | | | |
| GGP | | 130119P00015000 | | Expiration: January 2013, Exercise Price: $15.00 | 90 | | | 135 |
| | | | | Vornado Realty Trust — REIT | | | | |
| VNO | | 130119P00069000 | | Expiration: January 2013, Exercise Price: $69.00 | 11 | | | 83 |
| VNO | | 140118P00079000 | | Expiration: January 2014, Exercise Price: $79.00 | 1 | | | 765 |
| | | | | Washington — REIT | | | | |
| WRE | | 130119P00025000 | | Expiration: January 2013, Exercise Price: $25.00 | 30 | | | 375 |
| | | | | | | | | 1,823 |
| | | | | Restaurants | | | | |
| | | | | The Wendy’s Company | | | | |
| WEN | | 130119P00005000 | | Expiration: January 2013, Exercise Price: $5.00 | 750 | | | 22,500 |
| WEN | | 130216P00005000 | | Expiration: February 2013, Exercise Price: $5.00 | 170 | | | 5,950 |
| WEN | | 130518P00004000 | | Expiration: May 2013, Exercise Price: $4.00 | 200 | | | 1,500 |
| | | | | | | | | 29,950 |
| | | | | Satellite Telecommunications | | | | |
| | | | | DISH Network Corp. — Class A | | | | |
| DISH | | 130119P00025000 | | Expiration: January 2013, Exercise Price: $25.00 | 25 | | | 63 |
| DISH | | 140118P00029000 | | Expiration: January 2014, Exercise Price: $29.00 | 3 | | | 787 |
| | | | | | | | | 850 |
| | | | | Securities, Commodity Contracts, and Other Financial Investments | | | | |
| | | | | and Related Activities | | | | |
| | | | | CBOE Holdings Inc. | | | | |
| CBOE | | 130119P00024250 | | Expiration: January 2013, Exercise Price: $24.25 | 122 | | | 610 |
| CBOE | | 140118P00024250 | | Expiration: January 2014, Exercise Price: $24.25 | 33 | | | 2,970 |
| CBOE | | 140118P00026250 | | Expiration: January 2014, Exercise Price: $26.25 | 82 | | | 12,505 |
| | | | | The Charles Schwab Corporation | | | | |
| SCHW | | 130119P00010000 | | Expiration: January 2013, Exercise Price: $10.00 | 50 | | | 125 |
| SCHW | | 130119P00012500 | | Expiration: January 2013, Exercise Price: $12.50 | 201 | | | 503 |
| SCHW | | 130119P00015000 | | Expiration: January 2013, Exercise Price: $15.00 | 50 | | | 4,000 |
| SCHW | | 140118P00012000 | | Expiration: January 2014, Exercise Price: $12.00 | 110 | | | 9,625 |
The accompanying notes are an integral part of these financial statements.
KINETICS PORTFOLIOS TRUST — MASTER INVESTMENT PORTFOLIOS The Multi-Disciplinary Portfolio Portfolio of Options Written — December 31, 2012 — (Continued) |
| | | Identifier | | | Contracts* | | | Value |
| | | | | | | | | |
| | | | | Securities, Commodity Contracts, and Other Financial Investments | | | | |
| | | | | and Related Activities — (Continued) | | | | |
| | | | | CME Group Inc. | | | | |
| CME | | 130119P00044000 | | Expiration: January 2013, Exercise Price: $44.00 | 10 | | $ | 100 |
| CME | | 130119P00048000 | | Expiration: January 2013, Exercise Price: $48.00 | 40 | | | 1,300 |
| CME | | 130119P00052000 | | Expiration: January 2013, Exercise Price: $52.00 | 30 | | | 5,550 |
| CME | | 140118P00042000 | | Expiration: January 2014, Exercise Price: $42.00 | 28 | | | 7,770 |
| CME | | 140118P00048000 | | Expiration: January 2014, Exercise Price: $48.00 | 10 | | | 4,900 |
| CME | | 140118P00052000 | | Expiration: January 2014, Exercise Price: $52.00 | 2 | | | 1,360 |
| | | | | Interactive Brokers Group, Inc. — Class A | | | | |
| IBKR | | 130119P00012210 | | Expiration: January 2013, Exercise Price: $12.21 | 50 | | | 125 |
| IBKR | | 140118P00012000 | | Expiration: January 2014, Exercise Price: $12.00 | 250 | | | 15,000 |
| | | | | Invesco Ltd. | | | | |
| IVZ | | 130119P00019000 | | Expiration: January 2013, Exercise Price: $19.00 | 55 | | | 413 |
| IVZ | | 130420P00023000 | | Expiration: April 2013, Exercise Price: $23.00 | 47 | | | 2,467 |
| IVZ | | 130720P00022000 | | Expiration: July 2013, Exercise Price: $22.00 | 110 | | | 9,075 |
| | | | | | | | | 78,398 |
| | | | | Support Activities for Mining | | | | |
| | | | | Halliburton Company | | | | |
| HAL | | 130119P00032000 | | Expiration: January 2013, Exercise Price: $32.00 | 11 | | | 275 |
| HAL | | 130119P00035000 | | Expiration: January 2013, Exercise Price: $35.00 | 70 | | | 7,420 |
| HAL | | 140118P00030000 | | Expiration: January 2014, Exercise Price: $30.00 | 80 | | | 22,200 |
| | | | | | | | | 29,895 |
| | | | | Support Activities for Transportation | | | | |
| | | | | The Brink’s Company | | | | |
| BCO | | 130316P00025000 | | Expiration: March 2013, Exercise Price: $25.00 | 150 | | | 7,125 |
| | | | | Expeditors International of Washington, Inc. | | | | |
| EXPD | | 130119P00037500 | | Expiration: January 2013, Exercise Price: $37.50 | 78 | | | 1,755 |
| EXPD | | 130119P00040000 | | Expiration: January 2013, Exercise Price: $40.00 | 53 | | | 5,565 |
| | | | | | | | | 14,445 |
| | | | | Telecommunications | | | | |
| | | | | DIRECTV | | | | |
| DTV | | 140118P00050000 | | Expiration: January 2014, Exercise Price: $50.00 | 2 | | | 1,050 |
The accompanying notes are an integral part of these financial statements.
KINETICS PORTFOLIOS TRUST — MASTER INVESTMENT PORTFOLIOS The Multi-Disciplinary Portfolio Portfolio of Options Written — December 31, 2012 — (Continued) |
| | | Identifier | | | Contracts* | | | Value |
| | | | | | | | | |
| | | | | Telecommunications— (Continued) | | | | |
| | | | | Vodafone Group PLC — ADR | | | | |
| VOD1 | | 130119P00022500 | | Expiration: January 2013, Exercise Price: $22.50 | 45 | | $ | 112 |
| VOD | | 130119P00023000 | | Expiration: January 2013, Exercise Price: $23.00 | 49 | | | 123 |
| VOD | | 130119P00025000 | | Expiration: January 2013, Exercise Price: $25.00 | 43 | | | 1,290 |
| VOD1 | | 130119P00025000 | | Expiration: January 2013, Exercise Price: $25.00 | 25 | | | 375 |
| VOD | | 130119P00026000 | | Expiration: January 2013, Exercise Price: $26.00 | 3 | | | 277 |
| VOD | | 140118P00023000 | | Expiration: January 2014, Exercise Price: $23.00 | 51 | | | 8,160 |
| | | | | | | | | 11,387 |
| | | | | Transportation Equipment Manufacturing | | | | |
| | | | | The Boeing Company | | | | |
| BA | | 130119P00065000 | | Expiration: January 2013, Exercise Price: $65.00 | 5 | | | 50 |
| BA | | 130119P00067500 | | Expiration: January 2013, Exercise Price: $67.50 | 19 | | | 285 |
| BA | | 130119P00070000 | | Expiration: January 2013, Exercise Price: $70.00 | 7 | | | 196 |
| BA | | 130216P00067500 | | Expiration: February 2013, Exercise Price: $67.50 | 2 | | | 111 |
| BA | | 140118P00062500 | | Expiration: January 2014, Exercise Price: $62.50 | 31 | | | 10,462 |
| BA | | 140118P00065000 | | Expiration: January 2014, Exercise Price: $65.00 | 4 | | | 1,610 |
| BA | | 140118P00070000 | | Expiration: January 2014, Exercise Price: $70.00 | 12 | | | 6,810 |
| BA | | 140118P00072500 | | Expiration: January 2014, Exercise Price: $72.50 | 1 | | | 673 |
| | | | | Federal-Mogul Corporation | | | | |
| FDML | | 130119P00007500 | | Expiration: January 2013, Exercise Price: $7.50 | 165 | | | 3,300 |
| FDML | | 130420P00010000 | | Expiration: April 2013, Exercise Price: $10.00 | 180 | | | 44,100 |
| | | | | General Dynamics Corporation | | | | |
| GD | | 130119P00062500 | | Expiration: January 2013, Exercise Price: $62.50 | 22 | | | 770 |
| GD | | 130119P00065000 | | Expiration: January 2013, Exercise Price: $65.00 | 30 | | | 1,800 |
| GD | | 140118P00057500 | | Expiration: January 2014, Exercise Price: $57.50 | 20 | | | 6,200 |
| GD | | 140118P00060000 | | Expiration: January 2014, Exercise Price: $60.00 | 10 | | | 3,700 |
| | | | | Honda Motor Co., LTD. — ADR | | | | |
| HMC | | 130720P00030000 | | Expiration: July 2013, Exercise Price: $30.00 | 80 | | | 6,400 |
| | | | | Lear Corporation | | | | |
| LEA | | 130316P00035000 | | Expiration: March 2013, Exercise Price: $35.00 | 30 | | | 225 |
| | | | | Oshkosh Corporation | | | | |
| OSK | | 130119P00019000 | | Expiration: January 2013, Exercise Price: $19.00 | 20 | | | 200 |
| OSK | | 130119P00020000 | | Expiration: January 2013, Exercise Price: $20.00 | 75 | | | 375 |
| OSK | | 130119P00025000 | | Expiration: January 2013, Exercise Price: $25.00 | 85 | | | 425 |
The accompanying notes are an integral part of these financial statements.
KINETICS PORTFOLIOS TRUST — MASTER INVESTMENT PORTFOLIOS The Multi-Disciplinary Portfolio Portfolio of Options Written — December 31, 2012 — (Continued) |
| | | Identifier | | | Contracts* | | | Value |
| | | | | | | | | |
| | | | | Transportation Equipment | | | | |
| | | | | Manufacturing — (Continued) | | | | |
| | | | | Toyota Motor Corporation — ADR | | | | |
| TM | | 130119P00067500 | | Expiration: January 2013, Exercise Price: $67.50 | 21 | | $ | 32 |
| TM | | 130119P00070000 | | Expiration: January 2013, Exercise Price: $70.00 | 11 | | | 33 |
| TM | | 130119P00072500 | | Expiration: January 2013, Exercise Price: $72.50 | 10 | | | 25 |
| TM | | 140118P00070000 | | Expiration: January 2014, Exercise Price: $70.00 | 16 | | | 3,328 |
| TM | | 140118P00075000 | | Expiration: January 2014, Exercise Price: $75.00 | 14 | | | 4,242 |
| | | | | | | | | 95,352 |
| | | | | U.S. Equity Exchanges | | | | |
| | | | | The NASDAQ OMX Group, Inc. | | | | |
| NDAQ | | 130119P00022000 | | Expiration: January 2013, Exercise Price: $22.00 | 55 | | | 275 |
| NDAQ | | 130119P00024000 | | Expiration: January 2013, Exercise Price: $24.00 | 32 | | | 640 |
| NDAQ | | 130119P00025000 | | Expiration: January 2013, Exercise Price: $25.00 | 66 | | | 3,465 |
| NDAQ | | 140118P00020000 | | Expiration: January 2014, Exercise Price: $20.00 | 30 | | | 3,525 |
| | | | | NYSE Euronext | | | | |
| NYX | | 140118P00023000 | | Expiration: January 2014, Exercise Price: $23.00 | 74 | | | 3,293 |
| NYX | | 140118P00025000 | | Expiration: January 2014, Exercise Price: $25.00 | 4 | | | 308 |
| | | | | | | | | 11,506 |
| | | | | Utilities | | | | |
| | | | | Cadiz Inc. | | | | |
| CDZI | | 130518P00007500 | | Expiration: May 2013, Exercise Price: $7.50 | 285 | | | 27,788 |
| | | | | FirstEnergy Corp. | | | | |
| FE | | 130119P00035000 | | Expiration: January 2013, Exercise Price: $35.00 | 10 | | | 25 |
| FE | | 130119P00038000 | | Expiration: January 2013, Exercise Price: $38.00 | 28 | | | 70 |
| FE | | 130119P00040000 | | Expiration: January 2013, Exercise Price: $40.00 | 45 | | | 562 |
| FE | | 130119P00043000 | | Expiration: January 2013, Exercise Price: $43.00 | 31 | | | 4,340 |
| FE | | 140118P00040000 | | Expiration: January 2014, Exercise Price: $40.00 | 13 | | | 4,355 |
| | | | | Huaneng Power International, Inc. — ADR | | | | |
| HNP | | 130216P00025000 | | Expiration: February 2013, Exercise Price: $25.00 | 10 | | | 50 |
| | | | | National Grid PLC — ADR | | | | |
| NGG | | 130316P00050000 | | Expiration: March 2013, Exercise Price: $50.00 | 20 | | | 450 |
| NGG | | 130622P00050000 | | Expiration: June 2013, Exercise Price: $50.00 | 32 | | | 2,240 |
The accompanying notes are an integral part of these financial statements.
KINETICS PORTFOLIOS TRUST — MASTER INVESTMENT PORTFOLIOS The Multi-Disciplinary Portfolio Portfolio of Options Written — December 31, 2012 — (Continued) |
| | | Identifier | | | Contracts* | | | Value |
| | | | | | | | | |
| | | | | Utilities— (Continued) | | | | |
| | | | | Utilities Select Sector SPDR Fund | | | | |
| XLU | | 130119P00030000 | | Expiration: January 2013, Exercise Price: $30.00 | 30 | | $ | 45 |
| XLU | | 130119P00031000 | | Expiration: January 2013, Exercise Price: $31.00 | 12 | | | 24 |
| XLU | | 130119P00032000 | | Expiration: January 2013, Exercise Price: $32.00 | 50 | | | 150 |
| | | | | Veolia Environnement — ADR | | | | |
| VE | | 130119P00010000 | | Expiration: January 2013, Exercise Price: $10.00 | 25 | | | 312 |
| VE | | 130420P00010000 | | Expiration: April 2013, Exercise Price: $10.00 | 380 | | | 11,400 |
| | | | | | | | | 51,811 |
| | | | | Waste Management and Remediation Services | | | | |
| | | | | Republic Services, Inc. | | | | |
| RSG | | 130119P00025000 | | Expiration: January 2013, Exercise Price: $25.00 | 42 | | | 210 |
| RSG | | 130420P00025000 | | Expiration: April 2013, Exercise Price: $25.00 | 50 | | | 750 |
| | | | | Waste Management, Inc. | | | | |
| WM | | 130119P00030000 | | Expiration: January 2013, Exercise Price: $30.00 | 83 | | | 208 |
| WM | | 140118P00025000 | | Expiration: January 2014, Exercise Price: $25.00 | 35 | | | 2,188 |
| WM | | 140118P00030000 | | Expiration: January 2014, Exercise Price: $30.00 | 57 | | | 9,547 |
| | | | | | | | | 12,903 |
| | | | | TOTAL PUT OPTIONS WRITTEN | | | | |
| | | | | (premiums received $5,091,981) | | | | $2,635,228 |
* — 100 Shares Per Contract.
ADR — American Depository Receipt.
ETF — Exchange Traded Fund.
REIT — Real Estate Investment Trust
The accompanying notes are an integral part of these financial statements.
KINETICS PORTFOLIOS TRUST — MASTER INVESTMENT PORTFOLIOS The Multi-Disciplinary Portfolio Portfolio of Securities Sold Short — December 31, 2012 |
| Identifier | | WARRANTS | Shares | | Value |
| | | | | | | | |
| | | Insurance Carriers and Related Activities | | | | | |
| AIG | | American International Group, Inc. | | 42,500 | | | $586,500 |
| | | TOTAL SECURITIES SOLD SHORT | | | | | |
| | | (proceeds ($596,717)) | | | | | $586,500 |
The accompanying notes are an integral part of these financial statements.
KINETICS PORTFOLIOS TRUST — MASTER INVESTMENT PORTFOLIOS Statements of Assets & Liabilities December 31, 2012 |
| | | The Internet | | The Global | |
| | | Portfolio | | Portfolio | |
| ASSETS: | | | | | | | |
Investments, at value (1)(2) | | $ | 178,794,265 | | $ | 7,785,040 | |
Foreign currencies, at value (3) | | | — | | | 49 | |
| Cash | | | 10,101,989 | | | 1,647 | |
| Receivable for contributed capital | | | 510,784 | | | 1,038 | |
| Receivable for investments sold | | | 28,382 | | | — | |
| Dividends and interest receivable | | | 17,221 | | | 6,794 | |
| Other accounts receivable | | | 99,877 | | | — | |
| Other assets | | | 8,472 | | | 588 | |
| Total Assets | | | 189,560,990 | | | 7,795,156 | |
| LIABILITIES: | | | | | | | |
| Payable to Adviser | | | 164,601 | | | 6,785 | |
| Payable to Trustees and Officers | | | 2,836 | | | 117 | |
| Payable for securities purchased | | | 842,235 | | | — | |
| Payable for collateral received for securities loaned | | | 31,348,658 | | | 1,239,466 | |
| Payable for withdrawn capital | | | 459,388 | | | 268 | |
| Accrued expenses and other liabilities | | | 31,824 | | | 11,111 | |
| Total Liabilities | | | 32,849,542 | | | 1,257,747 | |
| Net Assets | | $ | 156,711,448 | | $ | 6,537,409 | |
(1) Cost of investments | | $ | 140,806,988 | | $ | 7,146,108 | |
(2) Includes loaned securities with a market value of | | $ | 30,785,147 | | $ | 1,211,561 | |
(3) Cost of foreign currencies | | $ | — | | $ | 46 | |
The accompanying notes are an integral part of these financial statements.
KINETICS PORTFOLIOS TRUST — MASTER INVESTMENT PORTFOLIOS Statements of Assets & Liabilities — (Continued) December 31, 2012 |
| | | The Paradigm | | The Medical | |
| | | Portfolio | | Portfolio | |
| ASSETS: | | | | | | | |
Investments, at value (1)(2) | | $ | 1,025,962,250 | | $ | 23,325,481 | |
| Cash | | | 437,630 | | | — | |
| Receivable for contributed capital | | | 10,102,454 | | | 36,521 | |
| Dividends and interest receivable | | | 137,424 | | | 18,436 | |
| Other assets | | | 80,926 | | | 4,769 | |
| Total Assets | | | 1,036,720,684 | | | 23,385,207 | |
| LIABILITIES: | | | | | | | |
| Payable to Adviser | | | 919,527 | | | 18,619 | |
| Payable to Trustees and Officers | | | 19,958 | | | 423 | |
| Payable for securities purchased | | | 35,837 | | | — | |
| Payable for collateral received for securities loaned | | | 150,222,140 | | | 6,008,866 | |
| Payable for withdrawn capital | | | 2,119,926 | | | 37,022 | |
| Accrued expenses and other liabilities | | | 152,347 | | | 11,361 | |
| Total Liabilities | | | 153,469,735 | | | 6,076,291 | |
| Net Assets | | $ | 883,250,949 | | $ | 17,308,916 | |
(1) Cost of investments | | $ | 979,826,256 | | $ | 24,502,584 | |
(2) Includes loaned securities with a market value of | | $ | 147,507,721 | | $ | 5,764,136 | |
The accompanying notes are an integral part of these financial statements.
KINETICS PORTFOLIOS TRUST — MASTER INVESTMENT PORTFOLIOS Statements of Assets & Liabilities — (Continued) December 31, 2012 |
| | | The Small Cap | | The Market | |
| | | Opportunities | | Opportunities | |
| | | Portfolio | | Portfolio | |
| ASSETS: | | | | | | | |
Investments, at value (1)(2) | | $ | 98,557,747 | | $ | 54,237,723 | |
| Cash | | | — | | | 2,081 | |
| Receivable for contributed capital | | | 35,400 | | | 307 | |
| Receivable for investments sold | | | 108,621 | | | 32,271 | |
| Dividends and interest receivable | | | 46,707 | | | 12,747 | |
| Other accounts receivable | | | 20,977 | | | — | |
| Other assets | | | 4,983 | | | 3,374 | |
| Total Assets | | | 98,774,435 | | | 54,288,503 | |
| LIABILITIES: | | | | | | | |
| Payable to Adviser | | | 85,323 | | | 45,471 | |
| Payable to Trustees and Officers | | | 1,898 | | | 1,004 | |
| Payable for securities purchased | | | — | | | 11,920 | |
| Payable for collateral received for securities loaned | | | 16,943,635 | | | 10,527,196 | |
| Payable for withdrawn capital | | | 133,174 | | | 47,195 | |
| Accrued expenses and other liabilities | | | 22,422 | | | 17,180 | |
| Total Liabilities | | | 17,186,452 | | | 10,649,966 | |
| Net Assets | | $ | 81,587,983 | | $ | 43,638,537 | |
(1) Cost of investments | | $ | 88,833,400 | | $ | 50,381,650 | |
(2) Includes loaned securities with a market value of | | $ | 16,297,935 | | $ | 10,330,222 | |
The accompanying notes are an integral part of these financial statements.
| KINETICS PORTFOLIOS TRUST — MASTER INVESTMENT PORTFOLIOS |
Statements of Assets & Liabilities — (Continued) |
| December 31, 2012 |
| | | The Water | | The Multi- | |
| | | Infrastructure | | Disciplinary | |
| | | Portfolio | | Portfolio | |
| ASSETS: | | | | | | | |
Investments, at value (1)(2) | | $ | 2,664,200 | | $ | 61,654,716 | |
| Deposits from securities sold short | | | — | | | 588,625 | |
| Cash | | | 8,426,681 | | | 6,020 | |
| Receivable for contributed capital | | | 17,756 | | | 827,786 | |
| Receivable for investments sold | | | 1,412,887 | | | 1,170,430 | |
| Dividends and interest receivable | | | 45,260 | | | 613,884 | |
| Other assets | | | 314 | | | 952 | |
| Total Assets | | | 12,567,098 | | | 64,862,413 | |
| LIABILITIES: | | | | | | | |
Written options, at value (3) | | | 300,901 | | | 2,635,228 | |
Securities sold short, at value (4) | | | — | | | 586,500 | |
| Payable to Adviser | | | 11,728 | | | 60,071 | |
| Payable to Trustees and Officers | | | 278 | | | 1,090 | |
| Payable for securities purchased | | | 1,436,621 | | | 20,634 | |
| Payable for collateral received for securities loaned | | | — | | | 1,896,215 | |
| Payable for withdrawn capital | | | 12,124 | | | 88,726 | |
| Accrued expenses and other liabilities | | | 10,108 | | | 23,066 | |
| Total Liabilities | | | 1,771,760 | | | 5,311,530 | |
| Net Assets | | $ | 10,795,338 | | $ | 59,550,883 | |
(1) Cost of investments | | $ | 2,714,513 | | $ | 62,771,072 | |
(2) Includes loaned securities with a market value of | | $ | — | | $ | 1,849,017 | |
(3) Premiums received | | $ | 301,071 | | $ | 5,091,981 | |
(4) Short sale proceeds | | $ | — | | $ | 596,717 | |
The accompanying notes are an integral part of these financial statements.
| KINETICS PORTFOLIOS TRUST — MASTER INVESTMENT PORTFOLIOS |
| Statements of Operations |
| For the Year Ended December 31, 2012 |
| | | The Internet | | The Global | |
| | | Portfolio | | Portfolio | |
| INVESTMENT INCOME: | | | | | | | |
| Dividends† | | $ | 1,741,287 | | $ | 98,582 | |
| Interest | | | 563 | | | 70 | |
| Income from securities lending | | | 74,807 | | | 23,146 | |
| Total investment income | | | 1,816,657 | | | 121,798 | |
| EXPENSES: | | | | | | | |
| Investment advisory fees | | | 1,485,178 | | | 70,124 | |
| Administration fees | | | 57,178 | | | 2,701 | |
| Professional fees | | | 18,687 | | | 8,268 | |
| Fund accounting fees | | | 31,057 | | | 8,913 | |
| Trustees’ and Officers’ fees and expenses | | | 13,239 | | | 609 | |
| Custodian fees and expenses | | | 17,516 | | | 8,660 | |
| Other expenses | | | 4,544 | | | 196 | |
| Total expenses | | | 1,627,399 | | | 99,471 | |
| Net investment income | | | 189,258 | | | 22,327 | |
| REALIZED AND UNREALIZED GAIN ON INVESTMENTS: | | | | | | | |
| Net realized gain on: | | | | | | | |
| Investments and foreign currency | | | 4,840,072 | | | 105,224 | |
| Net change in unrealized appreciation of: | | | | | | | |
| Investments and foreign currency | | | 19,951,987 | | | 1,012,392 | |
| Net gain on investments | | | 24,792,059 | | | 1,117,616 | |
| Net increase in net assets resulting from operations | | $ | 24,981,317 | | $ | 1,139,943 | |
| † Net of foreign taxes withheld of: | | $ | 14,404 | | $ | 6,300 | |
The accompanying notes are an integral part of these financial statements.
| KINETICS PORTFOLIOS TRUST — MASTER INVESTMENT PORTFOLIOS |
Statements of Operations — (Continued) |
| For the Year Ended December 31, 2012 |
| | | The Paradigm | | The Medical | |
| | | Portfolio | | Portfolio | |
| INVESTMENT INCOME: | | | | | | | |
| Dividends† | | $ | 12,035,853 | | $ | 541,218 | |
| Interest | | | 529,669 | | | 88 | |
| Income from securities lending | | | 3,632,144 | | | 42,031 | |
| Total investment income | | | 16,197,666 | | | 583,337 | |
| EXPENSES: | | | | | | | |
| Investment advisory fees | | | 10,880,449 | | | 239,026 | |
| Administration fees | | | 418,959 | | | 9,394 | |
| Professional fees | | | 90,847 | | | 9,626 | |
| Fund accounting fees | | | 198,518 | | | 7,199 | |
| Trustees’ and Officers’ fees and expenses | | | 98,914 | | | 2,205 | |
| Custodian fees and expenses | | | 79,156 | | | 5,887 | |
| Other expenses | | | 43,518 | | | 1,164 | |
| Total expenses | | | 11,810,361 | | | 274,501 | |
| Net investment income | | | 4,387,305 | | | 308,836 | |
| REALIZED AND UNREALIZED GAIN ON INVESTMENTS: | | | | | | | |
| Net realized gain on: | | | | | | | |
| Investments and foreign currency | | | 37,914,543 | | | 524,454 | |
| Realized gain distributions received from other | | | | | | | |
| investment companies | | | 719,971 | | | — | |
| Net change in unrealized appreciation of: | | | | | | | |
| Investments and foreign currency | | | 132,659,116 | | | 852,320 | |
| Net gain on investments | | | 171,293,630 | | | 1,376,774 | |
| Net increase in net assets resulting from operations | | $ | 175,680,935 | | $ | 1,685,610 | |
| † Net of foreign taxes withheld of: | | $ | 335,319 | | $ | 21,374 | |
The accompanying notes are an integral part of these financial statements.
| KINETICS PORTFOLIOS TRUST — MASTER INVESTMENT PORTFOLIOS |
Statements of Operations — (Continued) |
| For the Year Ended December 31, 2012 |
| | | The Small Cap | | The Market | |
| | | Opportunities | | Opportunities | |
| | | Portfolio | | Portfolio | |
| INVESTMENT INCOME: | | | | | | | |
| Dividends† | | $ | 1,353,030 | | $ | 772,804 | |
| Interest | | | 114 | | | 558 | |
| Income from securities lending | | | 73,556 | | | 54,582 | |
| Total investment income | | | 1,426,700 | | | 827,944 | |
| EXPENSES: | | | | | | | |
| Investment advisory fees | | | 1,046,412 | | | 553,511 | |
| Administration fees | | | 40,505 | | | 21,490 | |
| Professional fees | | | 15,737 | | | 12,075 | |
| Fund accounting fees | | | 22,433 | | | 15,010 | |
| Trustees’ and Officers’ fees and expenses | | | 9,490 | | | 5,153 | |
| Custodian fees and expenses | | | 62,871 | | | 22,727 | |
| Other expenses | | | 4,214 | | | 1,906 | |
| Total expenses | | | 1,201,662 | | | 631,872 | |
| Net investment income | | | 225,038 | | | 196,072 | |
| REALIZED AND UNREALIZED GAIN ON INVESTMENTS: | | | | | | | |
| Net realized gain on: | | | | | | | |
| Investments and foreign currency | | | 7,738,904 | | | 4,863,610 | |
| Realized gain distributions received from other | | | | | | | |
| investment companies | | | 97,600 | | | — | |
| Net change in unrealized appreciation of: | | | | | | | |
| Investments and foreign currency | | | 12,110,059 | | | 2,198,782 | |
| Net gain on investments | | | 19,946,563 | | | 7,062,392 | |
| Net increase in net assets resulting from operations | | $ | 20,171,601 | | $ | 7,258,464 | |
| † Net of foreign taxes withheld of: | | $ | 15,392 | | $ | 33,081 | |
The accompanying notes are an integral part of these financial statements.
| KINETICS PORTFOLIOS TRUST — MASTER INVESTMENT PORTFOLIOS |
Statements of Operations — (Continued) |
| For the Year Ended December 31, 2012 |
| | | The Water | | The Multi- | |
| | | Infrastructure | | Disciplinary | |
| | | Portfolio | | Portfolio | |
| INVESTMENT INCOME: | | | | | | | |
| Dividends† | | $ | 5,437 | | $ | 62,881 | |
| Interest | | | 395,091 | | | 1,912,314 | |
| Income from securities lending | | | 1,533 | | | 5,254 | |
| Total investment income | | | 402,061 | | | 1,980,449 | |
| EXPENSES: | | | | | | | |
| Investment advisory fees | | | 144,627 | | | 529,233 | |
| Administration fees | | | 5,619 | | | 21,742 | |
| Professional fees | | | 9,804 | | | 12,436 | |
| Fund accounting fees | | | 4,450 | | | 32,986 | |
| Trustees’ and Officers’ fees and expenses | | | 1,303 | | | 4,789 | |
| Custodian fees and expenses | | | 5,687 | | | 10,200 | |
| Other expenses | | | 652 | | | 1,193 | |
| Total expenses | | | 172,142 | | | 612,579 | |
| Net investment income | | | 229,919 | | | 1,367,870 | |
| REALIZED AND UNREALIZED GAIN (LOSS) ON INVESTMENTS: | | | | | | | |
| Net realized gain (loss) on: | | | | | | | |
| Investments and foreign currency | | | (587,722 | ) | | (534,647 | ) |
| Written option contracts expired or closed | | | 902,706 | | | 1,725,872 | |
| Realized gain distributions received from other | | | | | | | |
| investment companies | | | 36 | | | — | |
| Net change in unrealized appreciation (depreciation) of: | | | | | | | |
| Investments and foreign currency | | | 679,719 | | | 218,529 | |
| Written option contracts | | | (71,418 | ) | | 2,521,424 | |
| Securities sold short | | | — | | | 10,217 | |
| Net gain on investments | | | 923,321 | | | 3,941,395 | |
| Net increase in net assets resulting from operations | | $ | 1,153,240 | | $ | 5,309,265 | |
| † Net of foreign taxes withheld of: | | $ | 331 | | $ | — | |
The accompanying notes are an integral part of these financial statements.
| KINETICS PORTFOLIOS TRUST — MASTER INVESTMENT PORTFOLIOS |
| Statements of Changes in Net Assets |
| | | The Internet Portfolio | | The Global Portfolio | |
| | | For the | | For the | | For the | | For the | |
| | | Year Ended | | Year Ended | | Year Ended | | Year Ended | |
| | | December 31, | | December 31, | | December 31, | | December 31, | |
| | | 2012 | | 2011 | | 2012 | | 2011 | |
| OPERATIONS: | | | | | | | | | | | | | |
| Net investment income (loss) | | $ | 189,258 | | $ | (503,694 | ) | $ | 22,327 | | $ | 31,333 | |
| Net realized gain (loss) on sale of investments and foreign currency | | | 4,840,072 | | | 27,594,634 | | | 105,224 | | | (78,538 | ) |
| Net change in unrealized appreciation (depreciation) of investments and foreign currency | | | 19,951,987 | | | (28,538,710 | ) | | 1,012,392 | | | (941,649 | ) |
| Net increase (decrease) in net assets resulting from operations | | | 24,981,317 | | | (1,447,770 | ) | | 1,139,943 | | | (988,854 | ) |
| NET INCREASE (DECREASE) IN NET ASSETS RESULTING FROM BENEFICIAL INTEREST TRANSACTIONS: | | | | | | | | | | | | | |
| Contributions | | | 40,015,908 | | | 4,063,222 | | | 2,922,314 | | | 2,103,045 | |
| Withdrawals | | | (13,342,552 | ) | | (12,825,630 | ) | | (1,645,472 | ) | | (2,296,401 | ) |
| Net increase (decrease) in net assets resulting from beneficial interest transactions | | | 26,673,356 | | | (8,762,408 | ) | | 1,276,842 | | | (193,356 | ) |
| Total increase (decrease) in net assets | | | 51,654,673 | | | (10,210,178 | ) | | 2,416,785 | | | (1,182,210 | ) |
| NET ASSETS: | | | | | | | | | | | | | |
| Beginning of year | | | 105,056,775 | | | 115,266,953 | | | 4,120,624 | | | 5,302,834 | |
| End of year | | $ | 156,711,448 | | $ | 105,056,775 | | $ | 6,537,409 | | $ | 4,120,624 | |
The accompanying notes are an integral part of these financial statements.
| KINETICS PORTFOLIOS TRUST — MASTER INVESTMENT PORTFOLIOS |
Statements of Changes in Net Assets — (Continued) |
| | | The Paradigm Portfolio | | The Medical Portfolio | |
| | | For the | | For the | | For the | | For the | |
| | | Year Ended | | Year Ended | | Year Ended | | Year Ended | |
| | | December 31, | | December 31, | | December 31, | | December 31, | |
| | | 2012 | | 2011 | | 2012 | | 2011 | |
| OPERATIONS: | | | | | | | | | | | | | |
| Net investment income | | $ | 4,387,305 | | $ | 4,195,125 | | $ | 308,836 | | $ | 252,935 | |
| Net realized gain on sale of investments, foreign currency and distributions received from other investment companies | | | 38,634,514 | | | 218,218,507 | | | 524,454 | | | 3,620,097 | |
| Net change in unrealized appreciation (depreciation) of investments and foreign currency | | | 132,659,116 | | | (376,870,337 | ) | | 852,320 | | | (2,712,697 | ) |
| Net increase (decrease) in net assets resulting from operations | | | 175,680,935 | | | (154,456,705 | ) | | 1,685,610 | | | 1,160,335 | |
| NET INCREASE (DECREASE) IN NET ASSETS RESULTING FROM BENEFICIAL INTEREST TRANSACTIONS: | | | | | | | | | | | | | |
| Contributions | | | 52,951,684 | | | 9,416,012 | | | 486,550 | | | 4,518,994 | |
| Withdrawals | | | (190,008,480 | ) | | (257,783,279 | ) | | (5,069,761 | ) | | (16,164,992 | ) |
| Net decrease in net assets resulting from beneficial interest transactions | | | (137,056,796 | ) | | (248,367,267 | ) | | (4,583,211 | ) | | (11,645,998 | ) |
| Total increase (decrease) in net assets | | | 38,624,139 | | | (402,823,972 | ) | | (2,897,601 | ) | | (10,485,663 | ) |
| NET ASSETS: | | | | | | | | | | | | | |
| Beginning of year | | | 844,626,810 | | | 1,247,450,782 | | | 20,206,517 | | | 30,692,180 | |
| End of year | | $ | 883,250,949 | | $ | 844,626,810 | | $ | 17,308,916 | | $ | 20,206,517 | |
The accompanying notes are an integral part of these financial statements.
| KINETICS PORTFOLIOS TRUST — MASTER INVESTMENT PORTFOLIOS |
Statements of Changes in Net Assets — (Continued) |
| | | The Small Cap | | The Market | |
| | | Opportunities Portfolio | | Opportunities Portfolio | |
| | | For the | | For the | | For the | | For the | |
| | | Year Ended | | Year Ended | | Year Ended | | Year Ended | |
| | | December 31, | | December 31, | | December 31, | | December 31, | |
| | | 2012 | | 2011 | | 2012 | | 2011 | |
| OPERATIONS: | | | | | | | | | | | | | |
| Net investment income | | $ | 225,038 | | $ | 34,452 | | $ | 196,072 | | $ | 149,424 | |
| Net realized gain on sale of investments, foreign currency and distributions received from other investment companies | | | 7,836,504 | | | 18,650,400 | | | 4,863,610 | | | 2,024,778 | |
| Net change in unrealized appreciation (depreciation) of investments and foreign currency | | | 12,110,059 | | | (32,965,432 | ) | | 2,198,782 | | | (5,577,434 | ) |
| Net increase (decrease) in net assets resulting from operations | | | 20,171,601 | | | (14,280,580 | ) | | 7,258,464 | | | (3,403,232 | ) |
| NET DECREASE IN NET ASSETS RESULTING FROM BENEFICIAL INTEREST TRANSACTIONS: | | | | | | | | | | | | | |
| Contributions | | | 355,647 | | | — | | | 104,996 | | | 1,948,555 | |
| Withdrawals | | | (21,968,834 | ) | | (57,834,003 | ) | | (6,941,845 | ) | | (13,857,653 | ) |
| Net decrease in net assets resulting from beneficial interest transactions | | | (21,613,187 | ) | | (57,834,003 | ) | | (6,836,849 | ) | | (11,909,098 | ) |
| Total increase (decrease) in net assets | | | (1,441,586 | ) | | (72,114,583 | ) | | 421,615 | | | (15,312,330 | ) |
| NET ASSETS: | | | | | | | | | | | | | |
| Beginning of year | | | 83,029,569 | | | 155,144,152 | | | 43,216,922 | | | 58,529,252 | |
| End of year | | $ | 81,587,983 | | $ | 83,029,569 | | $ | 43,638,537 | | $ | 43,216,922 | |
The accompanying notes are an integral part of these financial statements.
| KINETICS PORTFOLIOS TRUST — MASTER INVESTMENT PORTFOLIOS |
Statements of Changes in Net Assets — (Continued) |
| | | The Water | | The Multi- | |
| | | Infrastructure Portfolio | | Disciplinary Portfolio | |
| | | For the | | For the | | For the | | For the | |
| | | Year Ended | | Year Ended | | Year Ended | | Year Ended | |
| | | December 31, | | December 31, | | December 31, | | December 31, | |
| ` | | 2012 | | 2011 | | 2012 | | 2011 | |
| OPERATIONS: | | | | | | | | | | | | | |
| Net investment income | | $ | 229,919 | | $ | 256,592 | | $ | 1,367,870 | | $ | 1,228,473 | |
| Net realized gain (loss) on sale of investments, foreign currency, written options and distributions received from other investment companies | | | 315,020 | | | 800,699 | | | 1,191,225 | | | (56,968 | ) |
| Net change in unrealized appreciation (depreciation) of investments,foreign currency, written options and securities sold short | | | 608,301 | | | (1,848,377 | ) | | 2,750,170 | | | (1,646,091 | ) |
| Net increase (decrease) in net assets resulting from operations | | | 1,153,240 | | | (791,086 | ) | | 5,309,265 | | | (474,586 | ) |
| NET INCREASE (DECREASE) IN NET ASSETS RESULTING FROM BENEFICIAL INTEREST TRANSACTIONS: | | | | | | | | | | | | | |
| Contributions | | | 2,343,426 | | | 1,421,834 | | | 34,091,278 | | | 21,350,865 | |
| Withdrawals | | | (6,080,519 | ) | | (11,474,644 | ) | | (3,583,117 | ) | | (1,350,871 | ) |
| Net increase (decrease) in net assets resulting from beneficial interest transactions | | | (3,737,093 | ) | | (10,052,810 | ) | | 30,508,161 | | | 19,999,994 | |
| Total increase (decrease) in net assets | | | (2,583,853 | ) | | (10,843,896 | ) | | 35,817,426 | | | 19,525,408 | |
| NET ASSETS: | | | | | | | | | | | | | |
| Beginning of year | | | 13,379,191 | | | 24,223,087 | | | 23,733,457 | | | 4,208,049 | |
| End of year | | $ | 10,795,338 | | $ | 13,379,191 | | $ | 59,550,883 | | $ | 23,733,457 | |
The accompanying notes are an integral part of these financial statements.
| KINETICS PORTFOLIOS TRUST — MASTER INVESTMENT PORTFOLIOS |
| Notes to Financial Statements |
| December 31, 2012 |
1. Organization
The Kinetics Portfolios Trust (the “Trust”) was organized as a Delaware Statutory Trust on March 14, 2000 and is registered under the Investment Company Act of 1940, as amended (the “1940 Act”), as an open-end management investment company issuing its beneficial interests in series, each series representing a distinct portfolio with its own investment objective and policies. The series currently authorized are: The Internet Portfolio, The Global Portfolio, The Paradigm Portfolio, The Medical Portfolio, The Small Cap Opportunities Portfolio, The Market Opportunities Portfolio, The Water Infrastructure Portfolio and The Multi-Disciplinary Portfolio (collectively, the “Master Portfolios”). Pursuant to the 1940 Act, the Master Portfolios, are “non-diversified” series of the Trust. The Market Opportunities Portfolio commenced operations on January 31, 2006, The Water Infrastructure Portfolio commenced operations on June 29, 2007 and The Multi-Disciplinary Portfolio commenced operations on February 11, 2008. Each of the remaining Master Portfolios commenced operations on April 28, 2000.
Each Master Portfolio is a Master Investment Portfolio in a master-feeder fund structure. Each Master Portfolio has multiple feeder funds invested in the Master Portfolio. By contributing assets to the Master Portfolio, the feeder funds receive a beneficial interest in the Master Portfolio. The Master Portfolio then invests the contributed assets in portfolio securities and allocates income, gains (losses) and expenses to the feeder funds based on the feeder funds’ proportionate interests in the Master Portfolio.
Each of the Master Portfolios, except for The Multi-Disciplinary Portfolio, seeks to provide investors with long-term capital growth. The Multi-Disciplinary Portfolio seeks to provide investors with total return. The Internet Portfolio invests primarily in the equity securities of U.S. and foreign companies engaged in the Internet and Internet-related activities. The Global Portfolio generally invests in the equity securities of foreign companies that have the ability to facilitate an increase in the growth of their traditional business lines and in U.S. companies benefiting from international economic growth. The Paradigm Portfolio invests primarily in the equity securities of U.S. and foreign companies that the investment adviser believes are undervalued and that have high returns on equity and are well positioned to reduce their costs, extend the reach of their distribution channels and experience significant growth in their assets or revenues. The Medical Portfolio invests primarily in the equity securities of U.S.
| KINETICS PORTFOLIOS TRUST — MASTER INVESTMENT PORTFOLIOS |
Notes to Financial Statements — (Continued) |
| December 31, 2012 |
and foreign companies engaged in medical research, pharmaceutical treatments and related medical technology industries and related technology industries, generally, with a focus on companies engaged in cancer research and drug development. The Small Cap Opportunities Portfolio invests primarily in the equity securities of U.S. and foreign small capitalized companies that provide attractive valuation opportunities due to special situations such as lack of institutional ownership, lack of significant analyst coverage or companies with sound fundamentals that have experienced a short-term earnings shortfall. The Market Opportunities Portfolio invests primarily in the equity securities of U.S. and foreign companies engaged in capital markets or related to capital markets, as well as companies involved in the gaming industry. The Water Infrastructure Portfolio invests primarily in securities and derivatives issued by U.S. and foreign companies engaged in water infrastructure and natural resources with a specific water theme and related activities. The Multi-Disciplinary Portfolio utilizes a two-part investment strategy, which includes fixed income and derivatives components.
2. Significant Accounting Policies
Security Valuation
Master Portfolio securities that are listed on a U.S. securities exchange for which market quotations are readily available are valued at the last quoted sale price on the day the valuation is made. Price information on listed securities is taken from the exchange where the security is primarily traded. All equity securities that are traded using the National Association of Securities Dealers’ Automated Quotation System (“NASDAQ”) are valued using the NASDAQ Official Closing Price (“NOCP”). Foreign securities are valued by an independent pricing service. In the event market quotations are not readily available or if events occur that may materially affect the value of a particular security between the time trading ends on a particular security and the close of regular trading on the New York Stock Exchange (“NYSE”), “fair value” will be determined. Unlisted U.S. securities and listed U.S. securities not traded on the valuation date for which market quotations are readily available are valued at the last bid price. Exchange traded options are valued at the composite price, using the National Best Bid and Offer quotes (“NBBO”). NBBO consists of the highest bid price and lowest ask price across any of the exchanges on which an option is quoted thus providing a view across the entire U.S. options marketplace. Composite option pricing calculates the mean of the highest bid price and lowest ask price across the exchanges where the option is traded.
| KINETICS PORTFOLIOS TRUST — MASTER INVESTMENT PORTFOLIOS |
Notes to Financial Statements — (Continued) |
| December 31, 2012 |
If the composite option price is not available, the mean between the highest bid and the lowest asked quotations at the close of the exchanges will be used. If none of the above are available, exchange traded options are valued at the last quoted sales price. Non-exchange traded options for which over-the-counter quotations are not readily available are valued at the mean of the current bid and asked prices. Fixed-income securities (other than obligations having a maturity of 60 days or less) are normally valued on the basis of quotes obtained from pricing services, which take into account appropriate factors such as institutional-sized trading in similar groups of securities, yield, quality, coupon rate, maturity, type of issue, trading characteristics and other market data. Instruments with remaining maturities of 60 days or less are valued at amortized cost, which approximates fair value. Other assets and securities for which no quotations are readily available (including restricted securities) will be valued in good faith at fair value using methods determined by the Board of Trustees of the Master Portfolios. In determining the fair value of a security, the Board of Trustees shall take into account the relevant factors and surrounding circumstances, which may include: (i) the nature and pricing history (if any) of the security; (ii) whether any dealer quotations for the security are available; (iii) possible valuation methodologies that could be used to determine the fair value of the security; (iv) the recommendation of the portfolio manager of the Portfolios with respect to the valuation of the security; (v) whether the same or similar securities are held by other funds managed by the Advisor or other funds and the method used to price the security in those funds; (vi) the extent to which the fair value to be determined for the security will result from the use of data or formula produced by third parties independent of the Advisor; (vii) the liquidity or illiquidity of the market for the security; and (viii) the value of a foreign security traded on other foreign markets. At December 31, 2012, 0.00%, 0.00% and 0.00% of the net assets of The Internet Portfolio, The Paradigm Portfolio and The Market Opportunities Portfolio, respectively, were fair valued securities. The other Master Portfolios did not hold any fair valued securities at December 31, 2012.
Repurchase Agreements
Each Master Portfolio may enter into repurchase agreements with banks that are members of the Federal Reserve System or securities dealers who are members of a national securities exchange or are primary dealers in U.S. Government Securities. In connection with transactions in repurchase agreements, it is the Trust’s policy that the Master Portfolio receive, as collateral, securities whose
| KINETICS PORTFOLIOS TRUST — MASTER INVESTMENT PORTFOLIOS |
Notes to Financial Statements — (Continued) |
| December 31, 2012 |
market value, including accrued interest, at all times will be at least equal to 102% of the amount invested by the Master Portfolio in each repurchase agreement. If the seller defaults, and the value of the collateral declines, realization of the collateral by the Master Portfolio may be delayed or limited.
Written Options
The Master Portfolios may write (sell) call or put options for trading or hedging purposes. When a Master Portfolio writes an option, an amount equal to the premium received by the Master Portfolio is included in the Statement of Assets and Liabilities as an asset and an equivalent liability. The amount of the liability is subsequently marked-to-market to reflect the current value of the option written. By writing the option, the Master Portfolio may become obligated during the term of the option to deliver or purchase the securities underlying the option at the exercise price if the option is exercised. When an option expires on its stipulated expiration date or the Master Portfolio enters into a closing purchase transaction, the Master Portfolio realizes a gain or loss if the cost of the closing transaction differs from the premium received when the option was sold, without regard to any unrealized gain or loss on the underlying security, and the liability related to such option is eliminated. When an option is exercised, the premium originally received decreases the cost basis of the underlying security (or increases the proceeds on the security sold short) and the Master Portfolio realizes a gain or loss from the sale of the security (or closing of the short sale). As collateral for uncovered written options, the Master Portfolio is required under the 1940 Act to maintain assets consisting of cash, cash equivalents or liquid securities. This collateral is required to be adjusted daily to reflect the exercise price of the purchase obligation for put options or the market value of the instrument underlying the contract for call options.
Foreign Currency Translations
The books and records of the Master Portfolios are maintained in U.S. dollars. For the Master Portfolios, foreign currency transactions are translated into U.S. dollars on the following basis: (i) market value of investment securities and other assets and liabilities are translated at the exchange rate of such currencies against the U.S. dollar, as provided by an approved pricing service, and (ii) purchases and sales of investment securities, dividend and interest income and certain expenses at the rates of exchange prevailing on the respective dates of such transactions. The Master Portfolios do not isolate and treat as ordinary income that portion of the results of operations arising as a result of changes in
| KINETICS PORTFOLIOS TRUST — MASTER INVESTMENT PORTFOLIOS |
Notes to Financial Statements — (Continued) |
| December 31, 2012 |
the exchange rate from the fluctuations arising from changes in the market prices of securities held during the period. However, for federal income tax purposes, the Master Portfolios do isolate and treat as ordinary income the effect of changes in foreign exchange rates arising from actual foreign currency transactions and the effect of changes in foreign exchange rates arising between trade date and settlement date.
Restricted and Illiquid Securities
The Master Portfolios may invest in restricted securities. These securities are valued by the Master Portfolios after giving due consideration to pertinent factors including recent private sales, market conditions and the issuer’s financial performance. The Master Portfolios have no right to require registration of unregistered securities. At December 31, 2012 the following Master Portfolios held securities restricted to institutional investors (144A securities):
| | | | | | Percentage of | |
| | | Market Value | | Net Assets | |
| The Multi-Disciplinary Portfolio | | $ | 10,272,656 | | | 17.25% | |
An illiquid asset is any asset which may not be sold or disposed of in the ordinary course of business within seven days at approximately the value at which the Master Portfolio has valued the investment. At December 31, 2012, the following Master Portfolios held illiquid securities:
| | | | | | Percentage of | |
| | | Market Value | | Net Assets | |
| The Internet Portfolio | | $ | 3 | | | 0.00 | % |
| The Paradigm Portfolio | | | 31 | | | 0.00 | % |
| The Market Opportunities Portfolio | | | — | * | | 0.00 | % |
| | |
| * | Amount is less than $0.50. |
When-Issued Securities
The Master Portfolios may purchase securities on a when-issued or delayed delivery basis. Although the purchase amounts of these securities are established at the time the purchaser enters into the agreement, these securities may be delivered and paid for at a future date. The Master Portfolios record purchases of when-issued securities and reflect the values of such securities in determining net asset value in the same manner as other portfolio securities. The Master Portfolios maintain at all times cash or other liquid
| KINETICS PORTFOLIOS TRUST — MASTER INVESTMENT PORTFOLIOS |
Notes to Financial Statements — (Continued) |
| December 31, 2012 |
assets in an amount at least equal to the amount of outstanding commitments for when-issued securities.
Securities Lending
Each Master Portfolio may lend its portfolio securities to broker-dealers by entering directly into lending arrangements with such broker dealers or indirectly through repurchase agreements with respect to no more than 33 1/3% of the total assets of each Master Portfolio (including any collateral posted) or 50% of the total assets of each Master Portfolio (excluding any collateral posted). Securities lending and repurchase transactions will be fully collateralized at all times with cash and/or short-term debt obligations. The Master Portfolios receive interest on the collateral received as well as a fee for the securities loaned.
Short-Term Investments
The Portfolios may invest in money market funds and short-term high quality debt securities such as commercial paper, repurchase agreements and certificates of deposit. Money market funds typically invest in short-term instruments and attempt to maintain a stable net asset value. While the risk is low, these funds may lose value. At December 31, 2012, The Internet Portfolio, The Global Portfolio, The Paradigm Portfolio, The Medical Portfolio, The Small Cap Opportunities Portfolio, The Market Opportunities Portfolio, and the Multi-Disciplinary Portfolio invested approximately 20%, 19%, 17%, 35%, 21%, 24%, and 3%, respectively, of net assets in the Mount Vernon Securities Lending Trust-Prime Portfolio which normally invests in short-term instruments with an objective of maximizing current income to the extent consistent with the preservation of capital and liquidity. Mount Vernon Securities Lending Trust-Prime Portfolio’s financial statements are available on the SEC website www.sec.gov.
Expense Allocation
Common expenses incurred by the Master Portfolios are allocated among the Master Portfolios (i) based upon relative average net assets, (ii) as incurred on a specific identification basis, or (iii) equally among the Master Portfolios, depending on the nature of the expenditure. All expenses incurred by the Master Portfolios are allocated to the feeder funds daily based on their proportionate interests in the respective Master Portfolios.
| KINETICS PORTFOLIOS TRUST — MASTER INVESTMENT PORTFOLIOS |
Notes to Financial Statements — (Continued) |
| December 31, 2012 |
Federal Income Taxes
Each Master Portfolio will be treated as a partnership for federal income tax purposes. As such, each investor in a Master Portfolio will be subject to taxation on its share of the Master Portfolio’s ordinary income and capital gains. It is intended that each Master Portfolio’s assets will be managed so an investor in the Master Portfolio can satisfy the requirements of subchapter M of the Internal Revenue Code.
There is no tax liability resulting from unrecognized tax benefits relating to uncertain income tax positions taken or expected to be taken in future tax returns. As of December 31, 2012, open tax years include the tax years ended December 31, 2009 through 2012. The Master Portfolios are also not aware of any tax positions for which it is reasonably possible that the total amounts of unrecognized tax benefits will significantly change in the next twelve months.
Use of Estimates
The preparation of financial statements in conformity with U.S. generally accepted accounting principles (“GAAP”) requires management to make estimates and assumptions that affect the reported amounts in the financial statements. Actual results could differ from those estimates.
Other
Realized gains and losses on the sale of investments are calculated on the identified cost basis. Dividend income is recorded on the ex-dividend date. Interest income is accounted for on the accrual basis and includes amortization of premiums and discounts on the interest method. Other noncash dividends are recognized as investment income at the fair value of the property received. Withholding taxes on foreign dividends have been provided for in accordance with the Trust’s understanding of the applicable country’s tax rules and rates.
3. Investment Adviser
The Trust has entered into Investment Advisory Agreements (the “Agreements”) with Kinetics Asset Management LLC (the “Adviser”), with whom certain officers and trustees of the Trust are affiliated, to furnish investment advisory services to the Master Portfolios. The Adviser is a wholly-owned subsidiary of Horizon Kinetics LLC. Under the terms of the Agreements, the Master Portfolios compensate the Adviser for its management services at the annual rate of 1.25% of each Master Portfolio’s average daily net assets.
| KINETICS PORTFOLIOS TRUST — MASTER INVESTMENT PORTFOLIOS |
Notes to Financial Statements — (Continued) |
| December 31, 2012 |
For the year ended December 31, 2012, The Internet Portfolio, The Global Portfolio, The Paradigm Portfolio, The Medical Portfolio, The Small Cap Opportunities Portfolio, The Market Opportunities Portfolio, The Water Infrastructure Portfolio and The Multi-Disciplinary Portfolio incurred expenses of $1,485,178, $70,124, $10,880,449, $239,026, $1,046,412, $553,511, $144,627 and $529,233, respectively, pursuant to the Agreements.
For the year ended December 31, 2012, the Trust was allocated $24,000 for the services of the Chief Compliance Officer employed by the Adviser.
4. Securities Transactions
Purchases and sales of investment securities, other than short-term investments, for the year ended December 31, 2012 were as follows:
| | | Purchases | | Sales | |
| | | U.S. | | | | U.S. | | | |
| | | Government | | Other | | Government | | Other | |
| The Internet Portfolio | | $ | — | | $ | 17,633,499 | | $ | — | | $ | 10,581,016 | |
| The Global Portfolio | | | — | | | 2,370,249 | | | — | | | 1,144,958 | |
| The Paradigm Portfolio | | | — | | | 48,797,781 | | | — | | | 212,449,764 | |
| The Medical Portfolio | | | — | | | — | | | — | | | 4,145,281 | |
| The Small Cap Opportunities | | | | | | | | | | | | | |
| Portfolio | | | — | | | 17,922,086 | | | — | | | 39,003,593 | |
| The Market Opportunities | | | | | | | | | | | | | |
| Portfolio | | | — | | | 10,452,432 | | | — | | | 16,228,707 | |
| The Water Infrastructure | | | | | | | | | | | | | |
| Portfolio | | | — | | | 4,265,589 | | | — | | | 11,909,313 | |
| The Multi-Disciplinary Portfolio | | | — | | | 50,555,995 | | | — | | | 17,144,250 | |
As of December 31, 2012, the cost of investments and unrealized appreciation (depreciation) on investment securities for federal income tax purposes was as follows:
| | | Net. | | | | | | | | | | |
| | | Unrealized | | | | | | | | | | |
| | | Appreciation | | Unrealized | | Unrealized | | Tax Cost of | |
| | | (Depreciation) | | Appreciation | | Depreciation | | Investments | |
| The Internet Portfolio | | $ | 37,389,100 | | $ | 47,503,009 | | $ | (10,113,909 | ) | $ | 141,405,165 | |
| The Global Portfolio | | | 530,504 | | | 971,345 | | | (440,841 | ) | | 7,254,536 | |
| The Paradigm Portfolio | | | 14,767,687 | | | 141,174,440 | | | (126,406,753 | ) | | 1,011,194,563 | |
| The Medical Portfolio | | | (1,247,742 | ) | | 3,320,860 | | | (4,568,602 | ) | | 24,573,223 | |
| The Small Cap Opportunities | | | | | | | | | | | | | |
| Portfolio | | | 7,281,567 | | | 15,654,118 | | | (8,372,551 | ) | | 91,276,180 | |
| The Market Opportunities | | | | | | | | | | | | | |
| Portfolio | | | 2,202,755 | | | 7,989,874 | | | (5,787,119 | ) | | 52,034,968 | |
| The Water Infrastructure Portfolio | | | (50,313 | ) | | 73,341 | | | (123,654 | ) | | 2,714,513 | |
| The Multi-Disciplinary Portfolio | | | (869,404 | ) | | 4,870,213 | | | (5,739,617 | ) | | 62,524,120 | |
| KINETICS PORTFOLIOS TRUST — MASTER INVESTMENT PORTFOLIOS |
Notes to Financial Statements — (Continued) |
| December 31, 2012 |
For the year ended December 31, 2012, the Master Portfolios wrote the following options:
| | | Number | | Premium | |
| | | of Contracts | | Amount | |
| The Water Infrastructure Portfolio | | | | | | | |
| Outstanding at the Beginning of the Year | | | 4,907 | | $ | 867,666 | |
| Options Written | | | 3,311 | | | 511,036 | |
| Options Expired | | | (5,113 | ) | | (843,116 | ) |
| Options Exercised | | | (1,026 | ) | | (143,369 | ) |
| Options Closed | | | (313 | ) | | (91,146 | ) |
| Outstanding at December 31, 2012 | | | 1,766 | | $ | 301,071 | |
| | | | | | | | |
| The Multi-Disciplinary Portfolio | | | | | | | |
| Outstanding at the Beginning of the Year | | | 8,551 | | $ | 2,156,278 | |
| Options Written | | | 31,277 | | | 5,767,474 | |
| Options Expired | | | (8,815 | ) | | (1,521,975 | ) |
| Options Exercised | | | (3,479 | ) | | (590,859 | ) |
| Options Closed | | | (3,398 | ) | | (718,937 | ) |
| Outstanding at December 31, 2012 | | | 24,136 | | $ | 5,091,981 | |
5. Portfolio Securities Loaned
As of December 31, 2012, the Master Portfolios had loaned securities that were collateralized by cash. The cash collateral is invested by the custodian in a money market pooled account approved by the Adviser. Although risk is mitigated by the collateral, a Master Portfolio could experience a delay in recovering its securities and possible loss of income or value if the borrower fails to return them. The Master Portfolio receives interest on the collateral received as well as a fee for the securities loaned. The Master Portfolios will continue to receive dividends and interest on all securities loaned. Gain or loss in the fair value of the securities loaned that may occur during the term of the loan will be accounted for by the Master Portfolios. The value of the securities on loan and the value of the related collateral at December 31, 2012, were as follows:
| | | Securities | | Collateral | |
| The Internet Portfolio | | $ | 30,785,147 | | $ | 31,348,658 | |
| The Global Portfolio | | | 1,211,561 | | | 1,239,466 | |
| The Paradigm Portfolio | | | 147,507,721 | | | 150,222,140 | |
| The Medical Portfolio | | | 5,764,136 | | | 6,008,866 | |
| The Small Cap Opportunities Portfolio | | | 16,297,935 | | | 16,943,635 | |
| The Market Opportunities Portfolio | | | 10,330,222 | | | 10,527,196 | |
| The Water Infrastructure Portfolio | | | — | | | — | |
| The Multi-Disciplinary Portfolio | | | 1,849,017 | | | 1,896,215 | |
| KINETICS PORTFOLIOS TRUST — MASTER INVESTMENT PORTFOLIOS |
Notes to Financial Statements — (Continued) |
| December 31, 2012 |
6. Selected Financial Highlights
Financial highlights for the Master Portfolios were as follows:
| | | The Internet Portfolio | |
| | | For the Year Ended December 31, 2012 | For the Year Ended December 31, 2011 | For the Year Ended December 31, 2010 | For the Year Ended December 31, 2009 | For the Year Ended December 31, 2008 |
| Ratio of expenses to | | | | | | | | | | | | | | | | |
| average net assets: | | | | | | | | | | | | | | | | |
| Before expense | | | | | | | | | | | | | | | | |
| reduction | | | 1.37 | % | | 1.38 | % | | 1.37 | % | | 1.37 | % | | 1.34 | % |
| After expense | | | | | | | | | | | | | | | | |
| reduction | | | 1.37 | % | | 1.38 | % | | 1.37 | % | | 1.37 | % | | 1.34 | % |
| Ratio of net investment | | | | | | | | | | | | | | | | |
| income (loss) to | | | | | | | | | | | | | | | | |
| average net assets: | | | | | | | | | | | | | | | | |
| Before expense | | | | | | | | | | | | | | | | |
| reduction | | | 0.16 | % | | (0.43 | )% | | (0.33 | )% | | (0.04 | )% | | 1.59 | % |
| After expense | | | | | | | | | | | | | | | | |
| reduction | | | 0.16 | % | | (0.43 | )% | | (0.33 | )% | | (0.04 | )% | | 1.59 | % |
| Portfolio turnover | | | | | | | | | | | | | | | | |
| rate | | | 9 | % | | 32 | % | | 12 | % | | 14 | % | | 19 | % |
| | | The Global Portfolio | |
| | | For the Year Ended December 31, 2012 | For the Year Ended December 31, 2011 | For the Year Ended December 31, 2010 | For the Year Ended December 31, 2009 | For the Year Ended December 31, 2008 |
| Ratio of expenses to | | | | | | | | | | | | | | | | |
| average net assets: | | | | | | | | | | | | | | | | |
| Before expense | | | | | | | | | | | | | | | | |
| reduction | | | 1.77 | % | | 2.23 | % | | 2.43 | % | | 2.81 | % | | 2.46 | % |
| After expense | | | | | | | | | | | | | | | | |
| reduction | | | 1.77 | % | | 2.23 | % | | 2.43 | % | | 2.81 | % | | 2.46 | % |
| Ratio of net investment | | | | | | | | | | | | | | | | |
| income (loss) to | | | | | | | | | | | | | | | | |
| average net assets: | | | | | | | | | | | | | | | | |
| Before expense | | | | | | | | | | | | | | | | |
| reduction | | | 0.40 | % | | 0.61 | % | | (0.51 | )% | | (0.74 | )% | | 0.83 | % |
| After expense | | | | | | | | | | | | | | | | |
| reduction | | | 0.40 | % | | 0.61 | % | | (0.51 | )% | | (0.74 | )% | | 0.83 | % |
| Portfolio turnover | | | | | | | | | | | | | | | | |
| rate | | | 23 | % | | 135 | % | | 122 | % | | 53 | % | | 98 | % |
| KINETICS PORTFOLIOS TRUST — MASTER INVESTMENT PORTFOLIOS |
Notes to Financial Statements — (Continued) |
| December 31, 2012 |
| | | The Paradigm Portfolio | |
| | | For the Year Ended December 31, 2012 | For the Year Ended December 31, 2011 | For the Year Ended December 31, 2010 | For the Year Ended December 31, 2009 | For the Year Ended December 31, 2008 |
| Ratio of expenses to | | | | | | | | | | | | | | | | |
| average net assets: | | | | | | | | | | | | | | | | |
| Before expense | | | | | | | | | | | | | | | | |
| reduction | | | 1.36 | % | | 1.37 | % | | 1.36 | % | | 1.36 | % | | 1.33 | % |
| After expense | | | | | | | | | | | | | | | | |
| reduction | | | 1.36 | % | | 1.37 | % | | 1.36 | % | | 1.36 | % | | 1.33 | % |
| Ratio of net investment | | | | | | | | | | | | | | | | |
| income to | | | | | | | | | | | | | | | | |
| average net assets: | | | | | | | | | | | | | | | | |
| Before expense | | | | | | | | | | | | | | | | |
| reduction | | | 0.50 | % | | 0.37 | % | | 0.83 | % | | 1.15 | % | | 0.86 | % |
| After expense | | | | | | | | | | | | | | | | |
| reduction | | | 0.50 | % | | 0.37 | % | | 0.83 | % | | 1.15 | % | | 0.86 | % |
| Portfolio turnover | | | | | | | | | | | | | | | | |
| rate | | | 6 | % | | 58 | % | | 7 | % | | 15 | % | | 34 | % |
| | | The Medical Portfolio | |
| | | For the Year Ended December 31, 2012 | For the Year Ended December 31, 2011 | For the Year Ended December 31, 2010 | For the Year Ended December 31, 2009 | For the Year Ended December 31, 2008 |
| Ratio of expenses to | | | | | | | | | | | | | | | | |
| average net assets: | | | | | | | | | | | | | | | | |
| Before expense | | | | | | | | | | | | | | | | |
| reduction | | | 1.44 | % | | 1.40 | % | | 1.39 | % | | 1.43 | % | | 1.42 | % |
| After expense | | | | | | | | | | | | | | | | |
| reduction | | | 1.44 | % | | 1.40 | % | | 1.39 | % | | 1.43 | % | | 1.42 | % |
| Ratio of net investment | | | | | | | | | | | | | | | | |
| income to | | | | | | | | | | | | | | | | |
| average net assets: | | | | | | | | | | | | | | | | |
| Before expense | | | | | | | | | | | | | | | | |
| reduction | | | 1.62 | % | | 0.86 | % | | 0.55 | % | | 1.14 | % | | 1.02 | % |
| After expense | | | | | | | | | | | | | | | | |
| reduction | | | 1.62 | % | | 0.86 | % | | 0.55 | % | | 1.14 | % | | 1.02 | % |
| Portfolio turnover | | | | | | | | | | | | | | | | |
| rate | | | 0 | % | | 5 | % | | 3 | % | | 13 | % | | 28 | % |
| KINETICS PORTFOLIOS TRUST — MASTER INVESTMENT PORTFOLIOS |
Notes to Financial Statements — (Continued) |
| December 31, 2012 |
| | | | The Small Cap Opportunities Portfolio | |
| | | | For the Year Ended December 31, 2012 | | For the Year Ended December 31, 2011 | | For the Year Ended December 31, 2010 | | For the Year Ended December 31, 2009 | | For the Year Ended December 31, 2008 |
| Ratio of expenses to | | | | | | | | | | | | | | | | |
| average net assets: | | | | | | | | | | | | | | | | |
| Before expense | | | | | | | | | | | | | | | | |
| reduction | | | 1.44 | % | | 1.43 | % | | 1.42 | % | | 1.42 | % | | 1.36 | % |
| After expense | | | | | | | | | | | | | | | | |
| reduction | | | 1.44 | % | | 1.43 | % | | 1.42 | % | | 1.42 | % | | 1.36 | % |
| Ratio of net investment | | | | | | | | | | | | | | | | |
| income (loss) to | | | | | | | | | | | | | | | | |
| average net assets: | | | | | | | | | | | | | | | | |
| Before expense | | | | | | | | | | | | | | | | |
| reduction | | | 0.27 | % | | 0.03 | % | | 0.02 | % | | (0.05 | )% | | 0.51 | % |
| After expense | | | | | | | | | | | | | | | | |
| reduction | | | 0.27 | % | | 0.03 | % | | 0.02 | % | | (0.05 | )% | | 0.51 | % |
| Portfolio turnover | | | | | | | | | | | | | | | | |
| rate | | | 22 | % | | 47 | % | | 4 | % | | 4 | % | | 16 | % |
| | | | The Market Opportunities Portfolio | |
| | | | For the Year Ended December 31, 2012 | | For the Year Ended December 31, 2011 | | For the Year Ended December 31, 2010 | | For the Year Ended December 31, 2009 | | For the Year Ended December 31, 2008 |
| Ratio of expenses to | | | | | | | | | | | | | | | | |
| average net assets: | | | | | | | | | | | | | | | | |
| Before expense | | | | | | | | | | | | | | | | |
| reduction | | | 1.43 | % | | 1.42 | % | | 1.42 | % | | 1.42 | % | | 1.36 | % |
| After expense | | | | | | | | | | | | | | | | |
| reduction | | | 1.43 | % | | 1.42 | % | | 1.42 | % | | 1.42 | % | | 1.36 | % |
| Ratio of net investment | | | | | | | | | | | | | | | | |
| income to | | | | | | | | | | | | | | | | |
| average net assets: | | | | | | | | | | | | | | | | |
| Before expense | | | | | | | | | | | | | | | | |
| reduction | | | 0.44 | % | | 0.30 | % | | 0.56 | % | | 0.26 | % | | 1.25 | % |
| After expense | | | | | | | | | | | | | | | | |
| reduction | | | 0.44 | % | | 0.30 | % | | 0.56 | % | | 0.26 | % | | 1.25 | % |
| Portfolio turnover | | | | | | | | | | | | | | | | |
| rate | | | 26 | % | | 14 | % | | 12 | % | | 14 | % | | 77 | % |
| KINETICS PORTFOLIOS TRUST — MASTER INVESTMENT PORTFOLIOS |
Notes to Financial Statements — (Continued) |
| December 31, 2012 |
| | | | The Water Infrastructure Portfolio | |
| | | | For the Year Ended December 31, 2012 | | For the Year Ended December 31, 2011 | | For the Year Ended December 31, 2010 | | For the Year Ended December 31, 2009 | | For the Year Ended December 31, 2008 |
| Ratio of expenses to | | | | | | | | | | | | | | | | |
| average net assets: | | | | | | | | | | | | | | | | |
| Before expense | | | | | | | | | | | | | | | | |
| reduction | | | 1.49 | % | | 1.42 | % | | 1.47 | % | | 1.49 | % | | 1.49 | % |
| After expense | | | | | | | | | | | | | | | | |
| reduction | | | 1.49 | % | | 1.42 | % | | 1.47 | % | | 1.49 | % | | 1.49 | % |
| Ratio of net investment | | | | | | | | | | | | | | | | |
| income to | | | | | | | | | | | | | | | | |
| average net assets: | | | | | | | | | | | | | | | | |
| Before expense | | | | | | | | | | | | | | | | |
| reduction | | | 1.99 | % | | 1.47 | % | | 1.04 | % | | 0.63 | % | | 1.27 | % |
| After expense | | | | | | | | | | | | | | | | |
| reduction | | | 1.99 | % | | 1.47 | % | | 1.04 | % | | 0.63 | % | | 1.27 | % |
| Portfolio turnover | | | | | | | | | | | | | | | | |
| rate | | | 56 | % | | 69 | % | | 111 | % | | 45 | % | | 66 | % |
| | | | The Multi-Disciplinary Portfolio | |
| | | | For the Year Ended December 31, 2012 | | For the Year Ended December 31, 2011 | | For the Year Ended December 31, 2010 | | For the Year Ended December 31, 2009 | | February 11, 2008^ through December 31, 2008 |
| Ratio of expenses to | | | | | | | | | | | | | | | | |
| average net assets: | | | | | | | | | | | | | | | | |
| Before expense | | | | | | | | | | | | | | | | |
| reduction | | | 1.45 | % | | 1.54 | % | | 2.41 | % | | 3.66 | % | | 5.09 | %(1) |
| After expense | | | | | | | | | | | | | | | | |
| reduction | | | 1.45 | % | | 1.54 | % | | 2.41 | % | | 3.66 | % | | 5.09 | %(1) |
| Ratio of net investment | | | | | | | | | | | | | | | | |
| income (loss) to | | | | | | | | | | | | | | | | |
| average net assets: | | | | | | | | | | | | | | | | |
| Before expense | | | | | | | | | | | | | | | | |
| reduction | | | 3.23 | % | | 8.00 | % | | 2.58 | % | | (1.20 | )% | | (3.49 | )%(1) |
| After expense | | | | | | | | | | | | | | | | |
| reduction | | | 3.23 | % | | 8.00 | % | | 2.58 | % | | (1.20 | )% | | (3.49 | )%(1) |
| Portfolio turnover | | | | | | | | | | | | | | | | |
| rate | | | 41 | % | | 74 | % | | 38 | % | | 77 | % | | N/A | (2) |
| ^ | Commencement of operations. |
| (1) | Annualized. |
| (2) | The Portfolio did not hold any long-term securities during the period, therefore the portfolio |
| | turnover is not applicable. |
| KINETICS PORTFOLIOS TRUST — MASTER INVESTMENT PORTFOLIOS |
Notes to Financial Statements — (Continued) |
| December 31, 2012 |
7. Summary of Fair Value Exposure
Security Valuation
Various inputs are used in determining the value of a Master Portfolio’s investments. These inputs are summarized in the three broad levels listed below:
| | |
| | Level 1 - Unadjusted quoted prices in active markets for identical assets or liabilities that a Master Portfolio has the ability to access. |
| | |
| | Level 2 - Observable inputs other than quoted prices included in Level 1 that are observable for the asset or liability, either directly or indirectly. These inputs may include quoted prices for the identical instrument on an inactive market, prices for similar instruments, interest rates, prepayment speeds, credit risk, yield curves, default rates and similar data. |
| | |
| | Level 3 - Unobservable inputs for the asset or liability, to the extent relevant observable inputs are not available, representing a Master Portfolio’s own assumptions about the assumptions a market participant would use in valuing the asset or liability, and would be based on the best information available. |
The availability of observable inputs can vary from security to security and is affected by a wide variety of factors, including, for example, the type of security, whether the security is new and not yet established in the marketplace, the liquidity of markets, and other characteristics particular to the security. To the extent that valuation is based on models or inputs that are less observable or unobservable in the market, the determination of fair value requires more judgment. Accordingly, the degree of judgment exercised in determining fair value is greatest for instruments categorized in Level 3.
The inputs used to measure fair value may fall into different levels of the fair value hierarchy. In such cases, for disclosure purposes, the level in the fair value hierarchy within which the fair value measurement falls in its entirety, is determined based on the lowest level input that is significant to the fair value measurement in its entirety.
| KINETICS PORTFOLIOS TRUST — MASTER INVESTMENT PORTFOLIOS |
Notes to Financial Statements — (Continued) |
| December 31, 2012 |
The Internet Portfolio
The following is a summary of the inputs used to value The Internet Portfolio’s net assets as of December 31, 2012:
| Assets^ | | | Level 1 | | | Level 2 | | | Level 3 | | | Total | |
| Common Stocks | | $ | 132,394,029 | | $ | 3,502 | (1) | $ | 3 | (2) | $ | 132,397,534 | |
| Escrow Notes | | | — | | | — | | | — | * | | — | * |
| Rights | | | 858,073 | | | — | | | — | | | 858,073 | |
| Short-Term Investments | | | 7,010,000 | | | 7,180,000 | + | | — | | | 14,190,000 | |
| Investments Purchased with the Cash | | | | | | | | | | | | | |
| Proceeds from Securities Lending | | | 31,348,658 | | | — | | | — | | | 31,348,658 | |
| Total Investments in Securities | | $ | 171,610,760 | | $ | 7,183,502 | | $ | 3 | | $ | 178,794,265 | |
| | | | | | | |
| (1) | The Common Stocks Level 2 balance consists of the market value of the associated Level 2 investments in the following industry: | | | | |
| | Telecommunications | | $ | 3,502 | |
| (2) | The Common Stocks Level 3 balance consists of the market value of the associated Level 3 investments in the following industries: | | | | |
| | Holding Company | | $ | 3 | |
| | Special Purpose Entity | | | — | |
| | Transfer out of Level 1 into Level 3 | | $ | 3 | |
Transfers were made out of Level 1 into Level 3 due to a decrease in market activity.
Transfers between levels are recognized at the end of the reporting period.
Following is a reconciliation of Level 3 assets for which significant unobservable inputs were used to determine fair value:
| Description | Investments in Securities | |
| Balance as of December 31, 2011 | | $ | 25 | |
| Accrued discounts/premiums | | | — | |
| Realized gain (loss) | | | — | |
| Change in unrealized appreciation (depreciation) | | | (25 | ) |
| Net purchases | | | — | |
| Net sales | | | — | |
| Transfer in and/or out of Level 3 | | | 3 | |
| Balance as of December 31, 2012 | | $ | 3 | |
| KINETICS PORTFOLIOS TRUST — MASTER INVESTMENT PORTFOLIOS |
Notes to Financial Statements — (Continued) |
| December 31, 2012 |
| | | Fair Value at | | Valuation | Unobservable | | |
| Description | | 12/31/2012 | | Techniques | Input | Range |
| Common Stocks | | $ 3 | | Conservative Value Assigned Pending Bankruptcy Litigation Proceedings/Market Comparables/Delisted | | No active market | $ | 0.00-$0.00(a) |
| Escrow Notes | | —* | | Conservative Value Assigned Pending Bankruptcy Litigation Proceedings/Market Comparables | | No active market | $ | 0.00-$0.00 |
There is no active market for the Level 3 securities, so a conservative value is being assigned until such time as a market exists.
| | | |
| * | Amount is less than $0.50. |
| ^ | See Portfolio of Investments for breakout of investments by industry classification. |
| + | Priced at amortized cost. |
| (a) | Amount is less than $0.005. |
The Global Portfolio
The following is a summary of the inputs used to value the The Global Portfolio’s net assets as of December 31, 2012:
| Assets^ | | | Level 1 | | | Level 2 | | | Level 3 | | | Total | |
| Common Stocks | | $ | 6,062,482 | | $ | 69,426 | | $ | — | | $ | 6,131,908 | |
| Preferred Stocks | | | 238 | | | — | | | — | | | 238 | |
| Warrants | | | 293 | | | — | | | — | | | 293 | |
| Short-Term Investments | | | 108,135 | | | 305,000 | + | | — | | | 413,135 | |
| Investments Purchased with the Cash | | | | | | | | | | | | | |
| Proceeds from Securities Lending | | | 1,239,466 | | | — | | | — | | | 1,239,466 | |
| Total Investments in Securities | | $ | 7,410,614 | | $ | 374,426 | | $ | | | $ | 7,785,040 | |
| | | |
| (1) | The Common Stocks Level 2 balance consists of the market value of the associated Level 2 investments in the following industries: |
| Insurance Carriers and Related Activities | | $ | 54,069 | |
| General Merchandise Stores | | | 15,357 | |
| | | $ | 69,426 | |
| Transfers out of Level 1 into Level 2 | | $ | 69,426 | |
| Transfers out of Level 3 into Level 1 | | $ | 978 | |
Transfers were made out of Level 3 into Level 1 due to an increase in market activity.
Transfers were made out of Level 1 and into Level 2 due to a decrease in market activity.
Transfers between levels are recognized at the end of the reporting period.
Following is a reconciliation of Level 3 assets for which significant unobservable inputs were used to determine fair value:
| KINETICS PORTFOLIOS TRUST — MASTER INVESTMENT PORTFOLIOS |
Notes to Financial Statements — (Continued) |
| December 31, 2012 |
| Description | Investments in Securities | |
| Balance as of December 31, 2011 | | $ | 2,226 | |
| Accrued discounts/premiums | | | — | |
| Realized gain (loss) | | | — | |
| Change in unrealized appreciation (depreciation) | | | (1,248 | ) |
| Net purchases | | | — | |
| Net sales | | | — | |
| Transfer in and/or out of Level 3 | | | (978 | ) |
| Balance as of December 31, 2012 | | $ | — | |
| | | |
| * | Amount is less than $0.50. |
| ^ | See Portfolio of Investments for breakout of investments by industry classification. |
| + | Priced at amortized cost. |
| (a) | Amount is less than $0.005. |
The Paradigm Portfolio
The following is a summary of the inputs used to value the The Paradigm Portfolio’s net assets as of December 31, 2012:
| Assets^ | | | Level 1 | | | Level 2 | | | Level 3 | | | Total | |
| Common Stocks | | $ | 809,631,797 | | $ | 4,896,123 | (1) | $ | 31 | (2) | $ | 814,527,951 | |
| Preferred Stocks | | | 41,679 | | | — | | | — | | | 41,679 | |
| Convertible Bonds | | | — | | | 4,722,500 | | | — | | | 4,722,500 | |
| Short-Term Investments | | | 16,447,980 | | | 40,000,000 | + | | — | | | 56,447,980 | |
| Investments Purchased with the Cash | | | | | | | | | | | | | |
| Proceeds from Securities Lending | | | 150,222,140 | | | — | | | — | | | 150,222,140 | |
| Total Investments in Securities | | $ | 976,343,596 | | $ | 49,618,623 | | $ | 31 | | $ | 1,025,962,250 | |
| | | |
| (1) | The Common Stocks Level 2 balance consists of the market value of the associated Level 2 investments in the following industries: |
| Asset Management | | $ | 7,238 | |
| General Merchandise Stores | | | 4,888,885 | |
| | | $ | 4,896,123 | |
| (2) | The Common Stocks Level 3 balance consists of the market value of the associated Level 3 investments in the following industries: |
| Credit Intermediation and Related Activities | | $ | — | * |
| Holding Company | | | 31 | |
| | | $ | 31 | |
| | | | | |
| | | | | |
| Transfers out of Level 1 into Level 2 | | $ | 4,888,885 | |
| Transfers out of Level 2 into Level 3 | | | — | * |
| Transfers out of Level 1 into Level 3 | | | 31 | |
| Transfers out of Level 3 into Level 1 | | | 213,258 | |
| KINETICS PORTFOLIOS TRUST — MASTER INVESTMENT PORTFOLIOS |
Notes to Financial Statements — (Continued) |
| December 31, 2012 |
Transfers were made out of Level 1 into Level 2 due to a decrease in market activity.
Transfers were made out of Level 2 into Level 3 due to a decrease in market activity.
Transfers were made out of Level 1 into Level 3 due to a decrease in market activity.
Transfers were made out of Level 3 into Level 1 due to an increase in market activity.
Transfers between levels are recognized at the end of the reporting period.
Following is a reconciliation of Level 3 assets for which significant unobservable inputs were used to determine fair value:
| Description | Investments in Securities | |
| Balance as of December 31, 2011 | | $ | 390,177 | |
| Accrued discounts/premiums | | | — | |
| Realized gain (loss) | | | (7,341,483 | ) |
| Change in unrealized appreciation (depreciation) | | | 7,164,865 | |
| Net purchases | | | — | |
| Net sales | | | (301 | ) |
| Transfer in and/or out of Level 3 | | | (213,227 | ) |
| Balance as of December 31, 2012 | | $ | 31 | |
| | | Fair Value at | | Valuation | | Unobservable | | | |
| Description | | 12/31/2012 | | Techniques | | Input | Range | |
| Common Stocks | | $ 31 | | Delisted-Acquired by the U.S. Government/Market Comparables | | No active market | $ | 0.00-$0.00 | (a) |
There is no active market for the Level 3 securities, so a conservative value is being assigned until such time as a market exists.
| * | Amount is less than $0.50. |
| ^ | See Portfolio of Investments for breakout of investments by industry classification. |
| + | Priced at amortized cost. |
| (a) | Amount is less than $0.005. |
The Medical Portfolio
The following is a summary of the inputs used to value the The Medical Portfolio’s net assets as of December 31, 2012:
| Assets^ | | | Level 1 | | | Level 2 | | | Level 3 | | | Total | |
| Common Stocks | | $ | 17,165,728 | | $ | 58,675 | | $ | — | | $ | 17,224,403 | |
| Rights | | | 28,164 | | | — | | | — | | | 28,164 | |
| Short-Term Investments | | | 64,048 | | | — | | | — | | | 64,048 | |
| Investments Purchased with the Cash | | | | | | | | | | | | | |
| Proceeds from Securities Lending | | | 6,008,866 | | | — | | | — | | | 6,008,866 | |
| Total Investments in Securities | | $ | 23,266,806 | | $ | 58,675 | | $ | — | | $ | 23,325,481 | |
| KINETICS PORTFOLIOS TRUST — MASTER INVESTMENT PORTFOLIOS |
Notes to Financial Statements — (Continued) |
| December 31, 2012 |
| | | |
| (1) | The Common Stocks Level 2 balance consists of the market value of the associated Level 2 investments in the following industry: |
| Pharmaceutical and Biotechnology | | $ | 58,675 | |
| Transfers out of Level 1 into Level 2 | | $ | 58,675 | |
Transfers were made out of Level 1 and into Level 2 due to a decrease in market activity.
Transfers between levels are recognized at the end of the reporting period.
Following is a reconciliation of Level 3 assets for which significant unobservable inputs were used to determine fair value:
| Description | Investments in Securities | |
| Balance as of December 31, 2011 | | $ | — | * |
| Accrued discounts/premiums | | | — | |
| Realized gain (loss) | | | — | |
| Change in unrealized appreciation (depreciation) | | | — | |
| Net purchases | | | — | |
| Net sales | | | — | * |
| Transfer in and/or out of Level 3 | | | — | |
| Balance as of December 31, 2012 | | $ | — | |
| | | |
| * | Amount is less than $0.50. |
| ^ | See Portfolio of Investments for breakout of investments by industry classification. |
The Small Cap Opportunities Portfolio
The following is a summary of the inputs used to value the The Small Cap Opportunities Portfolio’s net assets as of December 31, 2012:
| Assets^ | | | Level 1 | | | Level 2 | | | Level 3 | | | Total | |
| Common Stocks | | $ | 77,676,883 | | $ | 2,851,779 | (1) | $ | — | | $ | 80,528,662 | |
| Rights | | | 395,000 | | | — | | | — | | | 395,000 | |
| Short-Term Investments | | | 75,450 | | | 615,000 | + | | — | | | 690,450 | |
| Investments Purchased with the Cash | | | | | | | | | | | | | |
| Proceeds from Securities Lending | | | 16,943,635 | | | — | | | — | | | 16,943,635 | |
| Total Investments in Securities | | $ | 95,090,968 | | $ | 3,466,779 | | $ | — | | $ | 98,557,747 | |
| | | |
| (1) | The Common Stocks Level 2 balance consists of the market value of the associated Level 2 investments in the following industries: |
| Asset Management | | $ | 2,830,691 | |
| Telecommunications | | | 21,088 | |
| | | $ | 2,851,779 | |
| Transfers out of Level 2 into Level 1 | | | 65,517 | |
| Transfers out of Level 1 into Level 2 | | $ | 1,046,434 | |
Transfers were made out of Level 2 and into Level 1 due to an increase in market activity.
Transfers were made out of Level 1 and into Level 2 due to a decrease in market activity.
Transfers between levels are recognized at the end of the reporting period.
| KINETICS PORTFOLIOS TRUST — MASTER INVESTMENT PORTFOLIOS |
Notes to Financial Statements — (Continued) |
| December 31, 2012 |
Following is a reconciliation of Level 3 assets for which significant unobservable inputs were used to determine fair value:
| Description | Investments in Securities | |
| Balance as of December 31, 2011 | | $ | 3 | |
| Accrued discounts/premiums | | | — | |
| Realized gain (loss) | | | (1,232,723 | ) |
| Change in unrealized appreciation (depreciation) | | | 1,232,808 | |
| Net purchases | | | — | |
| Net sales | | | (88 | ) |
| Transfer in and/or out of Level 3 | | | — | |
| Balance as of December 31, 2012 | | $ | — | |
| | | |
| * | Amount is less than $0.50. |
| ^ | See Portfolio of Investments for breakout of investments by industry classification. |
| + | Priced at amortized cost. |
The Market Opportunities Portfolio
The following is a summary of the inputs used to value the The Market Opportunities Portfolio’s net assets as of December 31, 2012:
| Assets^ | | | Level 1 | | | Level 2 | | | Level 3 | | | Total | |
| Common Stocks | | $ | 40,128,933 | | $ | 763,094 | (1) | $ | — | (2) | $ | 40,892,027 | |
| Mutual Funds | | | 8,398 | | | — | | | — | | | 8,398 | |
| Short-Term Investments | | | 770,102 | | | 2,040,000+ | | | — | | | 2,810,102 | |
| Investments Purchased with the Cash | | | | | | | | | | | | | |
| Proceeds from Securities Lending | | | 10,527,196 | | | — | | | — | | | 10,527,196 | |
| Total Investments in Securities | | $ | 51,434,629 | | $ | 2,803,094 | | $ | — | | $ | 54,237,723 | |
| | | |
| (1) | The Common Stocks Level 2 balance consists of the market value of the associated Level 2 investments in the following industries: |
| Asset Management | | $ | 750,980 | |
| General Merchandise Stores | | | 12,114 | |
| | | $ | 763,094 | |
| (2) | The Common Stocks Level 3 balance consists of the market value of the associated Level 3 investments in the following industry: |
| Credit Intermediation and Related Activities | | $ | — | * |
| Transfers out of Level 2 into Level 1 | | $ | 358,981 | |
| Transfers out of Level 2 into Level 3 | | | — | * |
| Transfers out of Level 1 into Level 2 | | | 12,114 | |
Transfers were made out of Level 1 and into Level 2 due to a decrease in market activity.
Transfers were made out of Level 2 and into Level 1 due to an increase in market activity.
Transfers were made out of Level 2 and into Level 3 due to a decrease in market activity.
Transfers between levels are recognized at the end of the reporting period.
| KINETICS PORTFOLIOS TRUST — MASTER INVESTMENT PORTFOLIOS |
Notes to Financial Statements — (Continued) |
| December 31, 2012 |
Following is a reconciliation of Level 3 assets for which significant unobservable inputs were used to determine fair value:
| Description | Investments in Securities | |
| Balance as of December 31, 2011 | | $ | — | |
| Accrued discounts/premiums | | | — | |
| Realized gain (loss) | | | — | |
| Change in unrealized appreciation (depreciation) | | | — | |
| Net purchases | | | — | |
| Net sales | | | — | |
| Transfer in and/or out of Level 3 | | | — | * |
| Balance as of December 31, 2012 | | $ | — | * |
| | | Fair Value at | | Valuation | | Unobservable | | | |
| Description | | 12/31/2012 | | Techniques | | Input | | | Range |
| Common Stocks | | $ —* | | Delisted-Acquired by the U.S. Government/Market Comparables | | No active market/Market Comparables | | $ | 0.00-$0.00 |
There is no active market for the Level 3 securities, so a conservative value is being assigned until such time as a market exists.
| | | |
| * | Amount is less than $0.50. |
| ^ | See Portfolio of Investments for breakout of investments by industry classification. |
| + | Priced at amortized cost. |
The Water Infrastructure Portfolio
The following is a summary of the inputs used to value the The Water Infrastructure Portfolio’s net assets as of December 31, 2012:
| Assets^ | | | Level 1 | | | Level 2 | | | Level 3 | | | Total | |
| Convertible Bonds | | $ | — | | $ | 241,800 | | $ | — | | $ | 241,800 | |
| Corporate Bonds | | | — | | | 514,320 | | | — | | | 514,320 | |
| Exchange Traded Funds | | | 1,462,860 | | | — | | | — | | | 1,462,860 | |
| Warrants | | | 220 | | | — | | | — | | | 220 | |
| Short-Term Investments | | | 205,000 | | | 240,000+ | | | — | | | 445,000 | |
| Total Investments in Securities | | $ | 1,668,080 | | $ | 996,120 | | $ | — | | $ | 2,664,200 | |
| | | | | | | | | | | | | | |
| Liabilities | | | | | | | | | | | | | |
| Written Options | | $ | — | | $ | 300,901 | | $ | — | | $ | 300,901 | |
| Transfers out of Level 2 into Level 1 | | | | | | | | | | | $ | 220 | |
Transfers between levels are recognized at the end of the reporting period.
| | | |
| ^ | See Portfolio of Investments for breakout of investments by industry classification. |
| + | Priced at amortized cost. |
| KINETICS PORTFOLIOS TRUST — MASTER INVESTMENT PORTFOLIOS |
Notes to Financial Statements — (Continued) |
| December 31, 2012 |
The Multi-Disciplinary Portfolio
The following is a summary of the inputs used to value the The Multi-Disciplinary Portfolio’s net assets as of December 31, 2012:
| Assets^ | | Level 1 | | | Level 2 | | | Level 3 | | | Total | |
| Common Stocks | | $ | 1,500,250 | | | $ | — | | | $ | — | | | $ | 1,500,250 | |
| Convertible Bonds | | | — | | | | 38,219,706 | | | | — | | | | 38,219,706 | |
| Corporate Bonds | | | — | | | | 15,389,417 | | | | — | | | | 15,389,417 | |
| Municipal Bonds | | | — | | | | 770,000 | | | | — | | | | 770,000 | |
| Exchange Traded Funds | | | 1,243,170 | | | | — | | | | — | | | | 1,243,170 | |
| Mutual Funds | | | 747,520 | | | | — | | | | — | | | | 747,520 | |
| Short-Term Investments | | | 538,438 | | | | 1,350,000 | + | | | — | | | | 1,888,438 | |
| Investments Purchased with the Cash | | | | | | | | | | | | | | | | |
| Proceeds from Securities Lending | | | 1,896,215 | | | | — | | | | — | | | | 1,896,215 | |
| Total Investments in Securities | | $ | 5,925,593 | | | $ | 55,729,123 | | | $ | — | | | $ | 61,654,716 | |
| | | | | | | | | | | | | | | | | |
| Liabilities | | | | | | | | | | | | | | | | |
| Written Options | | $ | — | | | $ | 2,635,228 | | | $ | — | | | $ | 2,635,228 | |
| Security held Short | | | — | | | | 586,500 | | | | — | | | | 586,500 | |
| Totals | | $ | — | | | $ | 3,221,728 | | | $ | — | | | $ | 3,221,728 | |
For the year ended December 31, 2012, there were no transfers into or out of Level 1 or Level 2.
Transfers between levels are recognized at the end of the reporting period.
Following is a reconciliation of Level 3 assets for which significant unobservable inputs were used to determine fair value:
| Description | | Investments in Securities | |
| Balance as of December 31, 2012 | | $ | (25 | ) |
| Accrued discounts/premiums | | | — | |
| Realized gain (loss) | | | 2,491 | |
| Change in unrealized appreciation (depreciation) | | | (2,466 | ) |
| Net purchases | | | — | |
| Net sales | | | — | |
| Transfer in and/or out of Level 3 | | | — | |
| Balance as of December 31, 2012 | | $ | — | |
| ^ | See Portfolio of Investments for breakout of investments by industry classification. |
| + | Priced at amortized cost. |
8. Disclosures about Derivative Instruments and Hedging Activities
The Master Portfolios have adopted enhanced disclosure regarding derivatives and hedging activity intended to improve financial reporting of derivative instruments by enabling investors to understand how and why a Master Portfolio uses derivatives, how derivatives are accounted for by the Master Portfolios, and how derivative instruments affect a Master Portfolio’s results of operations and financial position. The Master Portfolios utilized options to implement or to gain further exposure to their respective investment strategies.
| KINETICS PORTFOLIOS TRUST — MASTER INVESTMENT PORTFOLIOS |
Notes to Financial Statements — (Continued) |
| December 31, 2012 |
The Water Infrastructure Portfolio
Statement of Assets and Liabilities
Fair values of derivative instruments as of December 31, 2012:
| | | | Assets | | | Liabilities | |
| Equity Contracts | | | Description | | | Fair Value | | | Description | | | Fair Value | |
| | | | | | | | | | Written option | | | | |
| Written Options | | | | | $ | — | | | contracts, at value | | $ | 300,901 | |
| Total | | | | | $ | — | | | | | $ | 300,901 | |
Statement of Operations
The effect of derivative instruments on the Statement of Operations for the year ended December 31, 2012:
| Amount of Realized Gain (Loss) on Equity Contracts |
| | | | | |
| Equity Contracts | | | | |
| Written Options | | $ | 902,706 | |
| Total | | $ | 902,706 | |
| Change in Unrealized Appreciation (Depreciation) on Equity Contracts |
| Equity Contracts | | | | |
| Written Options | | $ | (71,418 | ) |
| Total | | $ | (71,418 | ) |
The Water Infrastructure Portfolio has adopted authoritative standards regarding disclosure about derivatives and hedging activities and how they affect the Portfolio’s Statement of Assets and Liabilities and Statement of Operations. For the year ended December 31, 2012: written option contracts (3,311 contracts) were opened and $511,036 premiums were received during the period.
The Multi-Disciplinary Portfolio
Statement of Assets and Liabilities
Fair values of derivative instruments as of December 31, 2012:
| | | | Assets | | | Liabilities | |
| Equity Contracts | | | Description | | | Fair Value | | | Description | | | Fair Value | |
| | | | | | | | | | Written option | | | | |
| Written Options | | | | | $ | — | | | contracts, at value | | $ | 2,635,228 | |
| Total | | | | | $ | — | | | | | $ | 2,635,228 | |
| KINETICS PORTFOLIOS TRUST — MASTER INVESTMENT PORTFOLIOS |
Notes to Financial Statements — (Continued) |
| December 31, 2012 |
Statement of Operations
The effect of derivative instruments on the Statement of Operations for the year ended December 31, 2012:
| Amount of Realized Gain (Loss) on Equity Contracts |
| Equity Contracts | | | | |
| Written Options | | $ | 1,725,872 | |
| Total | | $ | 1,725,872 | |
| | | | | |
| Change in Unrealized Appreciation (Depreciation) on Equity Contracts |
| Equity Contracts | | | | |
| Written Options | | $ | 2,521,424 | |
| Total | | $ | 2,521,424 | |
The Multi-Disciplinary Portfolio has adopted authoritative standards regarding disclosure about derivatives and hedging activities and how they affect the Portfolio’s Statement of Assets and Liabilities and Statement of Operations. For the year ended December 31, 2012: written option contracts (31,277 contracts) were opened and $5,767,474 premiums were received during the period.
9. Recent Accounting Pronouncement
In December 2011, the Financial Accounting Standards Board issued Accounting Standards Update No. 2011-11 “Disclosures about Offsetting Assets and Liabilities” (“ASU 2011-11”). ASU 2011-11 requires disclosures to make financial statements that are prepared under GAAP more comparable to those prepared under the International Financial Reporting Standards. The new disclosure requirements mandate that entities disclose both gross and net information about instruments and transactions eligible for offset in the Statements of Assets & Liabilities as well as instruments and transactions subject to an agreement similar to a master netting arrangement. In addition, ASU 2011-11 requires disclosure of collateral received and posted in connection with master netting agreements or similar arrangements. New disclosures are required for annual reporting periods beginning on or after January 1, 2013, and interim periods within those annual periods.
Management is currently evaluating the impact ASU 2011-11 will have on the Master Portfolios’ financial statements and disclosures.
| KINETICS PORTFOLIOS TRUST — MASTER INVESTMENT PORTFOLIOS |
Notes to Financial Statements — (Continued) |
| December 31, 2012 |
10. Information about Proxy Voting (Unaudited)
Information regarding how Kinetics Portfolios votes proxies relating to portfolio securities is available without charge upon request by calling toll-free at 1-800-930-3828 or by accessing the Funds’ website at www.kineticsfunds.com and by accessing the SEC’s website at www.sec.gov. Information regarding how the Master Portfolios voted proxies relating to portfolio securities during the most recent twelve month period ended June 30, is available without charge, upon request, by calling toll-free at 1-800-930-3828 or by accessing the SEC’s website at www.sec.gov.
11. Information about the Portfolio Holdings (Unaudited)
The Kinetics Portfolios Trust files its complete schedules of portfolio holdings for its first and third fiscal quarters with the SEC on Form N-Q. The Master Portfolios’ Form N-Q is available without charge, upon request, by calling toll-free at 1-800-930-3828. Furthermore, you can obtain the Form N-Q on the SEC’s website at www.sec.gov. Finally, the Form N-Q may be reviewed and copied at the SEC’s Public Reference Room in Washington, D.C. Information on the operation of the Public Reference Room may be obtained by calling 1-800-SEC-0330.
12. Subsequent Events
In preparing these financial statements, management has evaluated Portfolio related events and transactions for potential recognition or disclosure through the date the financial statements were issued. On January 1, 2013, The Water Infrastructure Portfolio changed its name and investment mandate and began operations as The Alternative Income Portfolio. The Water Infrastructure Fund made corresponding changes to its name and investment mandate on January 1, 2013. Under the terms of the Agreements, The Alternative Income Portfolio compensates the Adviser for its management services at the annual rate of 0.90% of the average daily net assets, beginning January 1, 2013.
| KINETICS PORTFOLIOS TRUST |
| Report of Independent Registered |
| Public Accounting Firm |
To the Shareholders of and Board of Trustees
Kinetics Portfolios Trust
Elmsford, New York
We have audited the accompanying statements of assets and liabilities, including the portfolios of investments, of The Internet Portfolio, The Global Portfolio, The Paradigm Portfolio, The Medical Portfolio, The Small Cap Opportunities Portfolio, The Market Opportunities Portfolio, The Water Infrastructure Portfolio, and The Multi-Disciplinary Portfolio, each a series of shares of Kinetics Portfolios Trust (the “Trust”), as of December 31, 2012, and the related statements of operations for the year then ended, the statements of changes in net assets for each of the two years in the period then ended and financial highlights for each of the five years in the period then ended, except for The Multi-Disciplinary Portfolio in which the financial highlights were for each of the four years in the period then ended and the period February 11, 2008 (commencement of operations) through December 31, 2008. These financial statements and financial highlights are the responsibility of the Trusts’ management. Our responsibility is to express an opinion on these financial statements and financial highlights based on our audits.
We conducted our audits in accordance with the standards of the Public Company Accounting Oversight Board (United States). Those standards require that we plan and perform the audit to obtain reasonable assurance about whether the financial statements and financial highlights are free of material misstatement. We were not engaged to perform, nor was the Trust required to have, an audit of its internal control over financial reporting. Our audits included consideration of internal control over financial reporting as a basis for designing audit procedures that are appropriate in the circumstances, but not for the purpose of expressing an opinion on the effectiveness of the Trust’s internal control over financial reporting. Accordingly, we express no such opinion. An audit also includes examining, on a test basis, evidence supporting the amounts and disclosures in the financial statements. Our procedures included confirmation of securities owned as of December 31, 2012, by correspondence with the custodian and brokers or by other appropriate auditing procedures where replies from brokers were not received. An audit also includes assessing the accounting principles used and significant estimates made by management, as well as evaluating the overall financial statement presentation. We believe that our audits provide a reasonable basis for our opinion.
In our opinion, the financial statements and financial highlights referred to above present fairly in all material respects, the financial position of each of the eight portfolios of the Kinetics Portfolios Trust as of December 31, 2012, the results of their operations for the year then ended, the changes in their net assets for each of the two years in the period then ended and financial highlights for the periods indicated above, in conformity with accounting principles generally accepted in the United States of America.
Philadelphia, Pennsylvania
March 1, 2013.
| KINETICS MUTUAL FUNDS, INC. |
| Results of Shareholder Meeting (Unaudited) |
At a meeting held on September 21, 2012, the Board of Directors of the Company and the Board of Trustees of the Trust, approved: (1) changing the investment objective of The Water Infrastructure Fund/Water Infrastructure Portfolio (the “Fund/Portfolio”) investment strategy to provide current income and gains, and adding secondary objective to seek to obtain long-term growth of capital; (2) changing the investment strategy of the Portfolio; (3) changing the Fund’s/Portfolio’s fundamental investment restriction relating to industry concentration by eliminating the requirement to concentrate its investments in water and water infrastructure-related industries; and (4) changing the name of the Fund to The Alternative Income Fund and changing the name of the Portfolio to The Alternative Income Portfolio. On December 21, 2012, a special meeting of shareholders of the Fund was held and the changes in the Fund’s/Portfolio’s investment objective and fundamental restriction relating to industry concentration were approved. The Fund/Portfolio’s new investment strategy is described in the prospectus dated January 1, 2013. The voting results of the special meeting of shareholders are shown below:
1.
| Votes for the | | Votes against the | | | | |
| Resolution: | | Resolution | | Abstain: | | Uninstructed: |
| 1,173,885 | | 145,328 | | 55,315 | | 23,348 |
| | | | | | | |
| 2. | | | | | | |
| Votes for the | | Votes against the | | | | |
| Resolution: | | Resolution | | Abstain: | | Uninstructed: |
| 1,158,432 | | 159,682 | | 56,414 | | 23,348 |
| KINETICS PORTFOLIOS TRUST |
| Management of the Funds and the Portfolios |
The management and affairs of the Funds and the Portfolios are supervised by the Board of Directors of the Company and the Board of Trustees of the Trust, respectively. Each Board consists of the same eight individuals, five of whom are not “interested persons” of the Company or the Trust as that term is defined in the Investment Company Act of 1940, as amended (the “1940 Act”). The Directors are fiduciaries for the Funds’ shareholders and are governed by the laws of the State of Maryland in this regard. The Trustees are fiduciaries for the Portfolios’ shareholders and are governed by the laws of the State of Delaware in this regard.
Each Board establishes policies for the operation of the Funds and the Portfolios and appoints the officers who conduct the daily business of the Funds and the Portfolios. Directors/Trustees of the Company and the Trust are listed below with their addresses, present positions with the Company and Trust, length of time served, principal occupations over at least the last five years, number of Funds and Portfolios overseen and any other Directorships held. The SAI includes additional information about the Funds’ officers and directors and is available, without charge, upon request by calling 1-800-930-3828.
| KINETICS PORTFOLIOS TRUST |
Management of the Funds and the Portfolios—(Continued) |
Board of Directors/Board of Trustees
Independent Directors/Trustees
| | | | | | | Number of |
| | | | | | | Portfolios/Funds in |
| | | | Term of Office/ | | Fund Complex** |
| | Position(s) with the | Length of | | Overseen by |
| Name, Address and Year of Birth | Company and Trust | Time Served | | Trustee/Director |
| Steven T. Russell | | Independent | | Indefinite/ | | 16 |
| Year Born: 1963 | | Director/Trustee | | Since 2000 | | |
| c/o Kinetics Asset Management LLC | | | | | | |
| 555 Taxter Road | | | | | | |
| Suite 175 | | | | | | |
| Elmsford, New York, 10523 | | | | | | |
| | | | | | | |
| Douglas Cohen, C.P.A | | Independent | | Indefinite/ | | 16 |
| Year Born: 1961 | | Director/Trustee | | Since 2000 | | |
| c/o Kinetics Asset Management LLC | | | | | | |
| 555 Taxter Road | | | | | | |
| Suite 175 | | | | | | |
| Elmsford, New York, 10523 | | | | | | |
| | | | | | | |
| William J. Graham | | Independent | | Indefinite/ | | 16 |
| Year Born: 1962 | | Director/Trustee | | Since 2000 | | |
| c/o Kinetics Asset Management LLC | | | | | | |
| 555 Taxter Road | | | | | | |
| Suite 175 | | | | | | |
| Elmsford, New York, 10523 | | | | | | |
| | | | | | | |
| Joseph E. Breslin | | Independent | | Indefinite/ | | 16 |
| Year Born: 1953 | | Director/Trustee | | Since 2000 | | |
| c/o Kinetics Asset Management LLC | | | | | | |
| 555 Taxter Road | | | | | | |
| Suite 175 | | | | | | |
| Elmsford, New York, 10523 | | | | | | |
| | | | | | | |
| James M. Breen | | Independent | | Indefinite/ | | 16 |
| Year Born: 1959 | | Director/Trustee | | Since 2008 | | |
| c/o Kinetics Asset Management LLC | | | | | | |
| 555 Taxter Road | | | | | | |
| Suite 175 | | | | | | |
| Elmsford, New York, 10523 | | | | | | |
| Principal Occupation During the Past Five Years | | Other Directorships Held by Trustee/Director |
| Attorney and Counselor at Law, Partner, Law Firm of Russell and Fig (2002-2010); Steven Russell Law Firm (1994 to 2002); Professor of Business Law, Suffolk County Community College (1997 to Present). | | N/A |
| | | |
| Sunrise Credit Services, Inc. (2005 to Present); Wagner & Zwerman, LLP Certified Public Accountant (1997 to 2005). | | Director, Kinetics Fund, Inc. (a private fund). |
| | | |
| Attorney, William J. Graham, PC (2001 to Present); Bracken & Margolin, LLP (1997 to 2001). | | N/A |
| | | |
| Chief Operating Officer, Central Park Credit Holdings, (2007-2009) Chief Operating Officer, Aladdin Capital Management (2005-2007); | | Trustee, Hatteras Alternative Mutual Funds Trust (4 portfolios); Hatteras Variable Trust (1 portfolio); Trustee, Underlying Funds Trust (5 portfolios). |
| | | |
| Homeland Security Investigations, Senior Special Agent, Miami, FL (2011 to Present); Assistant Attaché Immigration & Customs Enforcement, Pretoria, South Africa (2008 to 2011); Immigration & Customs Enforcement Representative, Athens, Greece (2006 to 2008); Immigrations & Customs Enforcement, Senior Special Agent, Miami, FL (2000 to 2008). | | N/A |
| KINETICS PORTFOLIOS TRUST |
Management of the Funds and the Portfolios—(Continued) |
| Board of Directors/Board of Trustees (Continued) |
| |
| Interested Directors/Trustees and Officers |
| | | | | | Number of |
| | | | | | Portfolios/Funds in |
| | | | Term of Office/ | Fund Complex** |
| | Position(s) with the | Length of | Overseen by |
| Name, Address and Year of Birth | Company and Trust | Time Served | Trustee/Director |
| Murray Stahl* | | Director/Trustee | | Indefinite/ | 16 |
| Year Born: 1953 | | and Secretary | | Since 2000 | |
| c/o Kinetics Asset Management LLC | | | | | |
| 555 Taxter Road | | | | | |
| Suite 175 | | | | | |
| Elmsford, New York, 10523 | | | | | |
| | | | | | |
| Peter B. Doyle* | | Director/Trustee, | | Indefinite/ | 16 |
| Year Born: 1962 | | President and | | Since 2002 | |
| c/o Kinetics Asset Management LLC | | Chairman of | | | |
| 555 Taxter Road | | the Board | | | |
| Suite 175 | | | | | |
| Elmsford, New York, 10523 | | | | | |
| | | | | | |
| | | | | | |
| Leonid Polyakov* | | Director/Trustee | | Indefinite/ | 16 |
| Year Born: 1959 | | and Treasurer | | Since 2002 | |
| c/o Kinetics Asset Management LLC | | | | | |
| 555 Taxter Road | | | | | |
| Suite 175 | | | | | |
| Elmsford, New York, 10523 | | | | | |
| * | Directors/Trustees who are considered “interested persons” as defined in Section 2(a)(19) of the 1940 Act because of their association with the Adviser. |
| Principal Occupation During the Past Five Years | | Other Directorships Held by Trustee/Director |
| Chairman, Co-Founder & Chief Investment Officer, Horizon Kinetics LLC, parent holding company to, among others, Horizon Asset Management LLC, Kinetics Asset Management LLC and Kinetics Advisers, LLC, registered investment advisers (1994 to Present); Director of Research, Kinetics Mutual Funds, Inc. (2002 to Present). | | Chairman, FRMO Corp. (2001 to Present) (an intellectual capital firm engaged in the analysis of public companies within a framework of identifying investment strategies and techniques that reduce risk); Director Horizon Kinetics LLC (2011 to Present). |
| | | |
| Co-Founder and Senior Member, Horizon Kinetics LLC, parent holding company to, among others, Horizon Asset Management LLC, Kinetics Asset Management LLC and Kinetics Advisers, LLC, registered investment advisers (1994 to Present); President & Chief Investment Strategist, Kinetics Mutual Funds, Inc. (1998 to Present). | | Director, Kinetics Fund, Inc. (a private fund); Director and Officer, FRMO Corp. (2001 to Present); Director Horizon Kinetics LLC (2011 to Present). |
| | | |
| Chief Financial Officer, Kinetics Asset Management LLC and Kinetics Advisers, LLC, registered investment advisers (2000 to 2011); President, Kinetics Funds Distributor, Inc. (2002 to Present); formerly CFO, KBD Securities, LLC (2000 to 2010). | | Director, Kinetics Fund, Inc. (a private fund); Director Horizon Kinetics LLC (2011 to Present). |
| ** | The term “fund complex” refers to the Company and the Trust, which hold themselves out as related for investment purposes. |
| KINETICS MUTUAL FUNDS, INC. & KINETICS PORTFOLIOS TRUST |
| Privacy Policy |
We collect the following nonpublic personal information about you:
| | | |
| | • | Information we receive from you on or in applications or other forms, correspondence, or conversations, including, but not limited to, your name, address, phone number, social security number, assets, income and date of birth; and |
| | | |
| | • | Information about your transactions with us, our affiliates, or others, including, but not limited to, your account number and balance, payments history, parties to transactions, cost basis information, and other financial information. |
We do not disclose any nonpublic personal information about our current or former shareholders to nonaffiliated third parties, except as permitted by law. For example, we are permitted by law to disclose all of the information we collect, as described above, to our transfer agent to process your transactions. Furthermore, we restrict access to your nonpublic personal information to those persons who require such information to provide products or services to you. We maintain physical, electronic, and procedural safeguards that comply with federal standards to guard your nonpublic personal information.
In the event that you hold shares of the fund(s) through a financial intermediary, including, but not limited to, a broker-dealer, bank, or trust company, the privacy policy of your financial intermediary would govern how your nonpublic personal information would be shared with nonaffiliated third parties.
| |
| |
| Kinetics Mutual |
| Funds, Inc. |
| 615 East Michigan Street |
| Milwaukee, WI 53202 |
| INVESTMENT ADVISER AND |
| SHAREHOLDER SERVICING AGENT |
| Kinetics Asset Management LLC |
| 555 Taxter Road |
| Suite 175 |
| Elmsford, NY 10523 |
| INDEPENDENT REGISTERED |
| PUBLIC ACCOUNTING FIRM |
| Tait, Weller & Baker LLP |
| 1818 Market Street |
| Suite 2400 |
| Philadelphia, PA 19103 |
| DISTRIBUTOR |
| Kinetics Funds Distributor LLC |
| 470 Park Avenue South |
| New York, NY 10016 |
| ADMINISTRATOR |
| FUND ACCOUNTANT AND |
| TRANSFER AGENT |
| U.S. Bancorp Fund Services, LLC |
| 615 East Michigan Street |
| Milwaukee, WI 53202 |
| CUSTODIAN |
| U.S. Bank, N.A. |
| Custody Operations |
| 1555 River Center Drive, Suite 302 |
| Milwaukee, WI 53212 |
| THIS MATERIAL MUST BE PRECEDED OR |
| ACCOMPANIED BY A PROSPECTUS |
| |
Item 2. Code of Ethics.
The registrant has adopted a code of ethics that applies to the registrant’s principal executive officer and principal financial officer. The registrant has not made any amendments to its code of ethics during the period covered by this report. The registrant has not granted any waivers from any provisions of the code of ethics during the period covered by this report. A copy of the registrant’s Code of Ethics is filed herewith.
Item 3. Audit Committee Financial Expert.
The registrant’s board of trustees/directors has determined that there is at least one audit committee financial expert serving on its audit committee. Mr. Douglas Cohen and Mr. Joseph Breslin are the “audit committee financial experts” and are considered to be “independent” as each term is defined in Item 3 of Form N-CSR.
Item 4. Principal Accountant Fees and Services.
The registrant has engaged its principal accountant to perform audit services, audit-related services, tax services and other services during the past two fiscal years. “Audit services” refer to performing an audit of the registrant's annual financial statements or services that are normally provided by the accountant in connection with statutory and regulatory filings or engagements for those fiscal years. “Audit-related services” refer to the assurance and related services by the principal accountant that are reasonably related to the performance of the audit. “Tax services” refer to professional services rendered by the principal accountant for tax compliance, tax advice, and tax planning. There were no “Other services” provided by the principal accountant. The following table details the aggregate fees billed or expected to be billed for each of the last two fiscal years for audit fees, audit-related fees, tax fees and other fees by the principal accountant.
| | | | | |
| | FYE 12/31/2012 Kinetics Portfolios Trust | FYE 12/31/2012 Kinetics Mutual Funds | FYE 12/31/2011 Kinetics Portfolios Trust | FYE 12/31/2011 Kinetics Mutual Funds |
| Audit Fees | 79,250 | 79,250 | 77,000 | 77,000 |
| Audit-Related Fees | 0 | 0 | 0 | 0 |
| Tax Fees | 22,000 | 22,000 | 22,000 | 22,000 |
| All Other Fees | 0 | 0 | 0 | 0 |
The audit committee has adopted pre-approval policies and procedures that require the audit committee to pre-approve all audit and non-audit services of the registrant, including services provided to any entity affiliated with the registrant.
The percentage of fees billed by Tait, Weller & Baker LLP applicable to non-audit services pursuant to waiver of pre-approval requirement were as follows:
| | | |
| | FYE 12/31/2012 | FYE 12/31/2011 |
| Audit-Related Fees | 0% | 0% |
| Tax Fees | 0% | 0% |
| All Other Fees | 0% | 0% |
All of the principal accountant’s hours spent on auditing the registrant’s financial statements were attributed to work performed by full-time permanent employees of the principal accountant.
The following table indicates the non-audit fees billed or expected to be billed by the registrant’s accountant for services to the registrant and to the registrant’s investment adviser (and any other controlling entity, etc.—not sub-adviser) for the last two years. The audit committee of the board of trustees/directors has considered whether the provision of non-audit services that were rendered to the registrant's investment adviser is compatible with maintaining the principal accountant's independence and has concluded that the provision of such non-audit services by the accountant has not compromised the accountant’s independence.
| | | |
| Non-Audit Related Fees | FYE 12/31/2012 | FYE 12/31/2011 |
| Registrant | 0 | 0 |
| Registrant’s Investment Adviser | 0 | 0 |
Item 5. Audit Committee of Listed Registrants.
Not applicable to registrants who are not listed issuers (as defined in Rule 10A-3 under the Securities Exchange Act of 1934).
Item 6. Schedule of Investments.
The Schedule of Investments is included as part of the report to shareholders filed under Item 1 of this Form.
Item 7. Disclosure of Proxy Voting Policies and Procedures for Closed-End Management Investment Companies.
Not applicable to open-end investment companies.
Item 8. Portfolio Managers of Closed-End Management Investment Companies.
Not applicable to open-end investment companies.
Item 9. Purchases of Equity Securities by Closed-End Management Investment Company and Affiliated Purchasers.
Not applicable to open-end investment companies.
Item 10. Submission of Matters to a Vote of Security Holders.
There have been no material changes to the procedures by which shareholders may recommend nominees to the registrant’s board of trustees.
Item 11. Controls and Procedures.
| (a) | The Registrant’s President/Chief Executive Officer and Treasurer/Chief Financial Officer have concluded that the Registrant's disclosure controls and procedures (as defined in Rule 30a-3(c) under the Investment Company Act of 1940, as amended (the “1940 Act”)) are effective as of a date within 90 days of the filing date of this report, that includes the disclosure required by this paragraph, based on the evaluation of these controls and procedures required by Rule 30a-3(b) under the 1940 Act and Rule 15d-15(b) under the Securities Exchange Act of 1934, as amended. |
| (b) | There were no changes in the Registrant's internal control over financial reporting (as defined in Rule 30a-3(d) under the Act) that occurred during the second fiscal quarter of the period covered by this report that has materially affected, or is reasonably likely to materially affect, the Registrant's internal control over financial reporting. |
Item 12. Exhibits.
(2) Certifications pursuant to Section 302 of the Sarbanes-Oxley Act of 2002. Filed herewith.
(3) Not applicable to open-end investment companies.
| (b) | Certification pursuant to Section 906 of the Sarbanes-Oxley Act of 2002. Furnished herewith. |
SIGNATURES
Pursuant to the requirements of the Securities Exchange Act of 1934 and the Investment Company Act of 1940, the registrant has duly caused this report to be signed on its behalf by the undersigned, thereunto duly authorized.
(Registrant) Kinetics Mutual Funds, Inc. & Kinetics Portfolios Trust
By (Signature and Title)* /s/ Peter B. Doyle
Peter B. Doyle, President
Date 3/7/2013
Pursuant to the requirements of the Securities Exchange Act of 1934 and the Investment Company Act of 1940, this report has been signed below by the following persons on behalf of the registrant and in the capacities and on the dates indicated.
By (Signature and Title)* /s/ Peter B. Doyle
Peter B. Doyle, President
Date 3/7/2013
By (Signature and Title)* /s/ Leonid Polyakov
Leonid Polyakov, Treasurer
Date 3/5/2013
* Print the name and title of each signing officer under his or her signature.