As filed with the Securities and Exchange Commission on March 7, 2014
UNITED STATES
SECURITIES AND EXCHANGE COMMISSION
Washington, D.C. 20549
FORM N-CSR
CERTIFIED SHAREHOLDER REPORT OF REGISTERED
MANAGEMENT INVESTMENT COMPANIES
Investment Company Act file number 811-09303 & 811-09923
Kinetics Mutual Funds, Inc. & Kinetics Portfolios Trust
(Exact name of registrant as specified in charter)
470 Park Avenue South
New York, NY 10016
(Address of principal executive offices) (Zip code)
U.S. Bancorp Fund Services, LLC
615 E. Michigan Street
Milwaukee, WI 53202
(Name and address of agent for service)
(800) 930-3828
Registrant's telephone number, including area code
Date of fiscal year end: December 31, 2013
Date of reporting period: December 31, 2013
Item 1. Report to Stockholders.
| KINETICS MUTUAL FUNDS, INC. |
| Table of Contents |
| December 31, 2013 |
| | Page |
| Shareholders’ Letter | 2 |
| Year 2013 Annual Investment Commentary | 5 |
| KINETICS MUTUAL FUNDS, INC. — FEEDER FUNDS | |
| Growth of 10,000 Investment | 9 |
| Expense Example | 19 |
| Statements of Assets & Liabilities | 28 |
| Statements of Operations | 32 |
| Statements of Changes in Net Assets | 36 |
| Notes to Financial Statements | 47 |
| Financial Highlights | 62 |
| Report of Independent Registered Public Accounting Firm | 91 |
| KINETICS PORTFOLIOS TRUST — MASTER INVESTMENT PORTFOLIOS | |
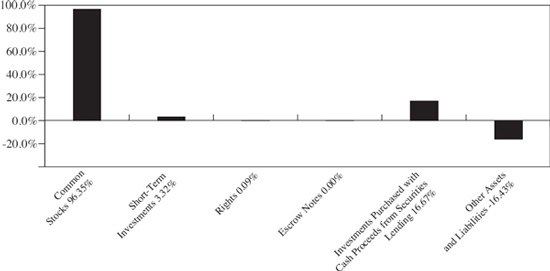
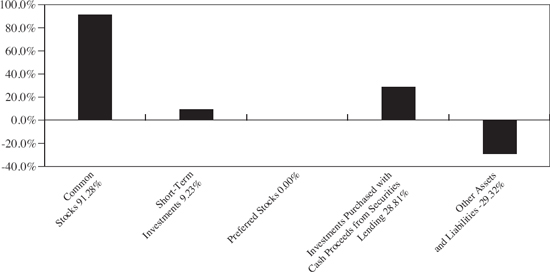
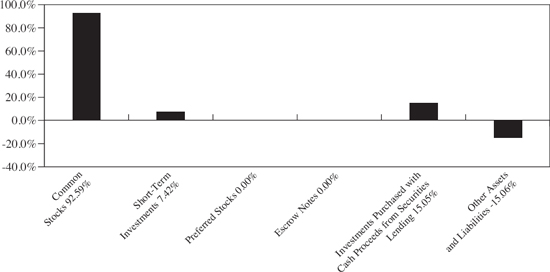
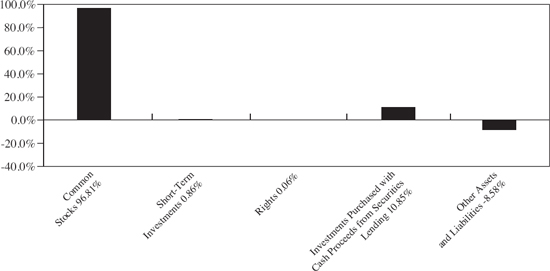
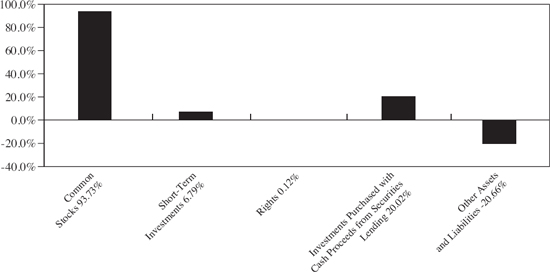
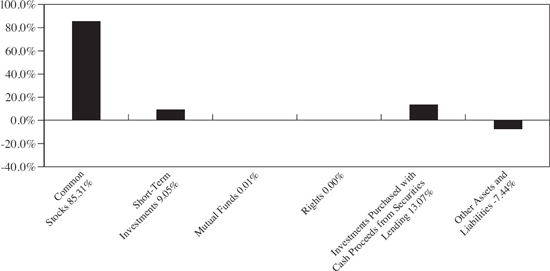
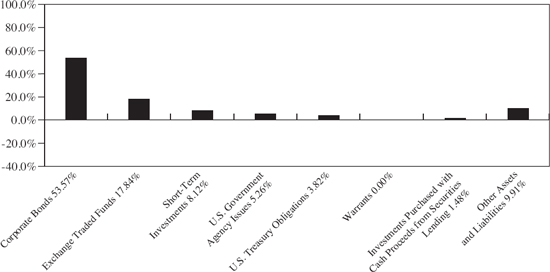
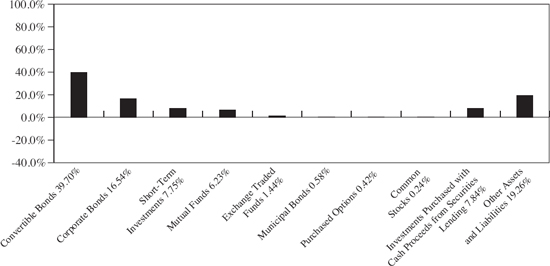
| Allocation of Portfolio Assets | 92 |
| Portfolio of Investments — The Internet Portfolio | 100 |
| Portfolio of Investments — The Global Portfolio | 104 |
| Portfolio of Investments — The Paradigm Portfolio | 108 |
| Portfolio of Investments — The Medical Portfolio | 114 |
| Portfolio of Investments — The Small Cap Opportunities Portfolio | 117 |
| Portfolio of Investments — The Market Opportunities Portfolio | 122 |
| Portfolio of Investments — The Alternative Income Portfolio | 126 |
| Portfolio of Investments — The Multi-Disciplinary Portfolio | 135 |
| Portfolio of Options Written — The Alternative Income Portfolio | 141 |
| Portfolio of Options Written — The Multi-Disciplinary Portfolio | 167 |
| Statements of Assets & Liabilities | 185 |
| Statements of Operations | 189 |
| Statements of Changes in Net Assets | 193 |
| Notes to Financial Statements | 197 |
| Report of Independent Registered Public Accounting Firm | 224 |
| Management of the Funds and the Portfolios | 225 |
| Privacy Policy | 230 |
| KINETICS MUTUAL FUNDS, INC. |
| Shareholders’ Letter |
Dear Fellow Shareholders:
We are pleased to present the Kinetics Mutual Funds (“Funds”) Annual Report for the year ended December 31, 2013. Our Funds, other than the Alternative Income Fund, which recently changed its mandate, reached all-time highs, eclipsing previous peaks obtained prior to the global financial crisis. Perhaps most noteworthy is that the Kinetics Internet Fund has not only surpassed its 2007 peak net asset value (NAV), but also the peak reached in March of 2000. This is particularly impressive considering that the NASDAQ Composite Index remains more than 30% below its high value in year 2000. We believe that this is a testament to the virtues of value investing, and that such a strategy can achieve superior results when applied to any type of business. The No-Load Classes of each of our Funds appreciated as follows during the year: The Kinetics Paradigm Fund +44.07%, The Kinetics Multi-Disciplinary Fund +4.28%, The Kinetics Small Cap Opportunities Fund +59.40%, The Kinetics Market Opportunities Fund +46.74%, The Kinetics Internet Fund +44.28%, The Kinetics Medical Fund +49.25%, The Kinetics Alternative Income Fund +5.22%, and The Kinetics Global Fund +28.59%. This compares to returns of 32.39% for the S&P 500 Index and 22.80% for the MSCI All Country World Index.
Our investment philosophy is definitely value oriented; however, it can be distinguished from more conventional strategies in that it is dynamic. Thus, we seek to find areas of pricing inefficiencies through most, if not all, market cycles. This has been achieved largely through our efforts to identify and capitalize upon predictive attributes such as spin-offs, dormant assets, and terms of trade. The most recent market cycle has been pervasively upward-trending, which can be likened to a rising tide lifting all ships. The unique aspect of this rising market is that the preponderance of capital that is being allocated to equity securities has been through passive investment strategies, namely, exchange-traded funds (ETFs). The popularity of passive investing has created a pricing dislocation in companies with perhaps what is the most compelling predictive attribute that we have ever identified: owner-operator management.
Owner-operator companies, as the name implies, are companies where the management has a substantial portion of their collective wealth invested in the equity of the company. These individuals are often billionaire industry veterans, which in itself is a competitive advantage. Throughout the last market cycle, these individuals have been selectively opportunistic and have created considerable value for shareholders. Even as the market rally matures, these individuals continue to execute transactions and make capital structure decisions that promise to compound value for years to come. They can be
compared to those of the typical “agent” managed company that has simply benefitted from the economic and market recovery’s boosting of share prices. We see little opportunity for many such securities to appreciate markedly absent a robust economy and/or market valuation multiple-expansion. Most of the equity mutual funds managed by Kinetics Asset Management LLC (“Kinetics”) continue to emphasize owner-operated companies, many of which also exhibit other predictive attributes.
In addition to its core equity strategies, Kinetics has launched a series of income-oriented funds that seek to capitalize upon modern market dynamics. The majority of investors strive to quantify the risks of an investment; therefore, they desire a standardized means to do so. Largely as a result of modern portfolio theory, standard deviation of returns—that is, volatility—has emerged as the preferred means to measure risk. At Kinetics, we evaluate risk as the potential for the permanent impairment of capital, which is distinctly different from price volatility. Thus, we utilize various methodologies to generate income, where other investors are willing to pay us a premium for volatility insurance. The strategy has proven to be quite effective; despite having been launched on the precipice of the global financial crisis in early 2008, the Multi-Disciplinary Fund achieved full net asset value (NAV) recovery (not including dividends) by early 2010. A more conservative version of this strategy is employed in the Alternative Income Fund, which we would expect to have less volatility and faster NAV recovery (in the event a drawdown occurs), albeit, with lower expected returns.
Shareholders can continue to access additional information about the Funds from our website, www.kineticsfunds.com. This website provides a broad array of materials, including recent portfolio holdings, quarterly investment commentaries, conference call transcripts, newsflashes, recent performance data, and online access to account information.
Kinetics offers the following funds to investors:
The Paradigm Fund focuses on companies that are valued attractively and currently have, or are expected to soon have, sustainable high business returns. The Fund has produced attractive returns since its inception in an environment that should be described as difficult for equity investors. The Paradigm Fund is Kinetics’ flagship fund.
The Multi-Disciplinary Fund seeks to utilize stock options and fixed-income investments in order to provide investors with equity-like returns, but with more muted volatility. At times, the options strategies of the Fund may cause the manager to purchase equity securities.
The Small Cap Opportunities Fund focuses on undervalued and special situation small capitalization equities that have the potential for rewarding long-term investment results. The same investment fundamentals employed by The Paradigm Fund are used to identify such opportunities.
The Medical Fund is a sector fund, offering an investment in scientific discovery within the promising field of medical research, particularly in the development of cancer treatments and therapies. As a sector fund, The Medical Fund is likely to have heightened volatility.
The Internet Fund is a sector fund that focuses on companies engaged in the evolution of Internet-related developments. As such, this Fund has been, and is likely to continue to be, quite volatile. More recently, this Fund has been focusing on content companies, which we believe will be the winners in the next generation of Internet development.
The Global Fund is focused on selecting long life cycle international companies that can generate long-term wealth through their business operations. This Fund is presently finding exciting opportunities in the more developed markets.
The Market Opportunities Fund focuses on those companies that benefit from increasing transactional volume or throughput, such as publicly-traded exchanges and credit card processors, or companies that act as facilitators, such as gaming companies, airports, and publicly-traded toll roads.
The end of 2013 marks the first year of performance under The Alternative Income Fund’s new investment strategy since its having undergone a proxy vote on December 21, 2012. The primary investment objective of The Alternative Income Fund is to provide current income and gains, with a secondary objective of obtaining long-term growth of capital. Consistent with this change, prospectively, the Fund will seek to generate a total return that exceeds that of most short-term U.S. fixed income indexes, with limited market value variability.
The Kinetics Investment Team
| KINETICS MUTUAL FUNDS, INC. |
| Investment Commentary |
Dear Fellow Shareholders,
There are many methods of “investing” in public equity markets, although certain strategies are more speculative in nature than others. For example, there is no shortage of investors who invest in high growth companies that are valued based upon operating metrics rather than profitability or cash flow. Consider an upstart technology company that is growing revenue rapidly, but for which very little of the revenue is available as free cash flow to the firm. Now, if one has sufficient confidence in the business model and product and forecasts eventual cash flow 5 to 10 years out, this is perhaps a prudent strategy. However, most of the practitioners of such strategies have average holding periods of less than a year (often significantly less). Thus, by investing in a company with a protracted time horizon, one is simply “investing” with the hope that others will bid up the security in anticipation of eventual cash flow conversion.
In contrast to the aforementioned strategy, the investment team at Kinetics Asset Management LLC views each of our investments as a fractional ownership of the underlying businesses. This is not a dissimilar strategy to how a private market capitalist would evaluate potential investments in operating businesses. Thus, we evaluate our projected rate of return on the basis of visible cash flows and compare this rate to those of alternative investments. This analysis is particularly important in the current investment environment for two primary reasons: i) there are numerous examples of companies trading at increasingly intrepid valuations despite little to no cash flow, and ii) there is a dearth of opportunities, other than in equities, offering reasonable real rates of return. As a result, equity investors may be pressured to compromise their valuation standards. We would much rather forego potential short-term gains in the interest of preserving the long-term capital of our shareholders.
The enduring consequences of the global financial crisis are too numerous to delineate in this letter, but there is a specific, widely unappreciated consequence that warrants attention. Investment managers and corporate managers alike have been highly motivated to act in an extremely—we believe overly—risk averse manner post-crisis. This was perhaps warranted in the early stages of the economic recovery, but the aversion continues to this day, and it now verges upon complacency. This complacency may be as simple as hoarding excessive cash balances that are effectively earning no return in real terms, thereby eroding shareholder value. Examine the balance sheets of many
of the once enterprising technology companies that have become large and cumbersome—we could use Oracle, Cisco, Microsoft, Apple, and Intel for illustrative purposes—these companies all hold multi-billion dollar cash balances that are well in excess of debt burdens. We contend that if this capital cannot be effectively deployed, it should be distributed to shareholders as efficiently as possible. The world’s preeminent activist investors appear to agree, as the strategy is now more popular and profitable than ever.
One need not invest in a cavalier hedge fund to reap the benefits of activist investing; in fact, we believe that you will enjoy an even better result investing in companies with dynamic owner operators. These stewards of capital are aligned directly with shareholders and have been making business decisions with shareholder value in mind throughout and since the crisis. It is our contention that these companies are positioned to thrive in an otherwise uninspiring investment environment.
We have always believed that we can generate excess risk-adjusted returns for our investors by acting in opposition to the crowd and conducting rigorous business analysis (qualitative and quantitative). The merits of this strategy are evident in our long-term performance, and we are as committed and optimistic as we have ever been.
The Kinetics Investment Team
Disclosure
This material is intended to be reviewed in conjunction with a current prospectus, which includes all fees and expenses that apply to a continued investment, as well as information regarding the risk factors, policies and objectives of the Funds. Read it carefully before investing.
Mutual Fund investing involves risk. Principal loss is possible. Because The Internet Fund, The Medical Fund and The Market Opportunities Fund invest in a single industry or geographic region, their shares are subject to a higher degree of risk than funds with a higher level of diversification. Internet, biotechnology and certain capital markets or gaming stocks are subject to a rate of change in technology, obsolescence and competition that is generally higher than that of other industries, hence they may experience extreme price and volume fluctuations.
International investing [for all Funds] presents special risks including currency exchange fluctuation, government regulations, and the potential for political and economic instability. Accordingly, the share prices for these Funds are expected to be more volatile than that of U.S.-only funds. Past performance is no guarantee of future performance.
Because smaller companies [for The Small Cap Opportunities Fund] often have narrower markets and limited financial resources, they present more risk than larger, more well established, companies.
Non-investment grade debt securities [for all Funds], i.e., junk bonds, are subject to greater credit risk, price volatility and risk of loss than investment grade securities.
Further, options contain special risks including the imperfect correlation between the value of the option and the value of the underlying asset. Investments [for The Multi- Disciplinary Fund and The Alternative Income Fund] in futures, swaps and other derivative instruments may result in loss as derivative instruments may be illiquid, difficult to price and leveraged so that small changes may produce disproportionate losses to the Funds. To the extent the Funds segregate assets to cover derivative positions, they may impair their ability to meet current obligations, to honor requests for redemption and to manage the investments in a manner consistent with their respective investment objectives. Purchasing and writing put and call
options and, in particular, writing “uncovered” options are highly specialized activities that entail greater than ordinary investment risk.
As non-diversified Funds, the value of Fund shares may fluctuate more than shares invested in a broader range of industries and companies. Unlike other investment companies that directly acquire and manage their own portfolios of securities, The Kinetics Mutual Funds pursue their investment objectives by investing all of their investable assets in a corresponding portfolio series of the Kinetics Portfolios Trust.
The information concerning the Funds included in the shareholder report contains certain forward-looking statements about the factors that may affect the performance of the Funds in the future. These statements are based on Fund management’s predictions and expectations concerning certain future events and their expected impact on the Funds, such as performance of the economy as a whole and of specific industry sectors, changes in the levels of interest rates, the impact of developing world events, and other factors that may influence the future performance of the Funds. Management believes these forward-looking statements to be reasonable, although they are inherently uncertain and difficult to predict. Actual events may cause adjustments in portfolio management strategies from those currently expected to be employed.
The Nasdaq Composite (NASDAQ) and the Standard & Poor’s 500 Index (S&P 500) each represent an unmanaged, broad-basket of stocks. They are typically used as a proxy for overall market performance.
Distributor: Kinetics Funds Distributor LLC is not an affiliate of Kinetics Mutual Funds, Inc. Kinetics Funds Distributor LLC is an affiliate of Kinetics Asset Management LLC, Investment Adviser to Kinetics Mutual Funds, Inc.
For more information, log onto www.kineticsfunds.com. January 1, 2014 — Kinetics Asset Management LLC ®
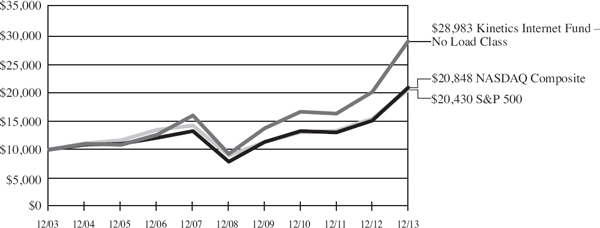
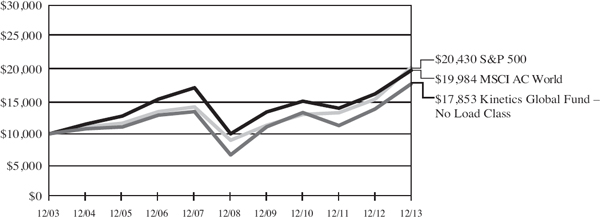
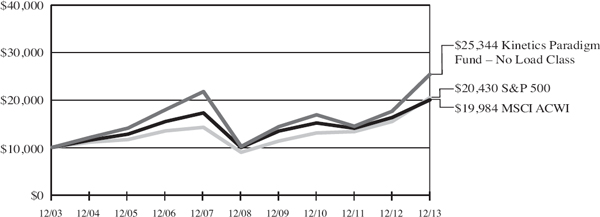
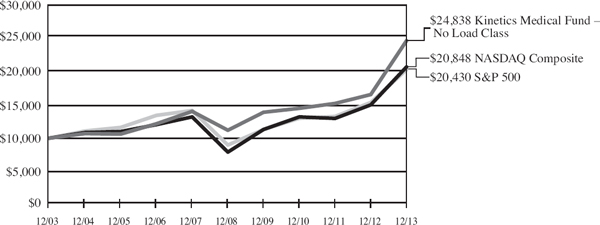
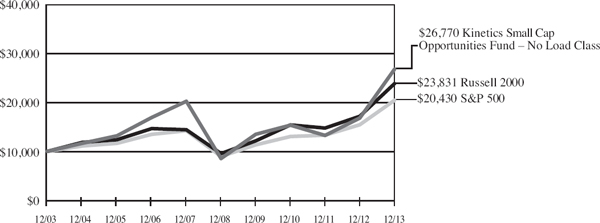
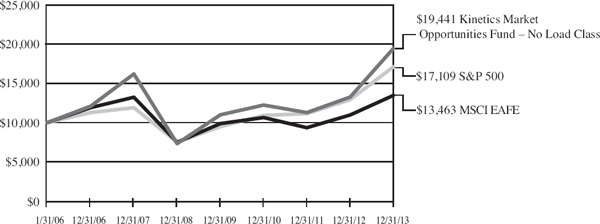
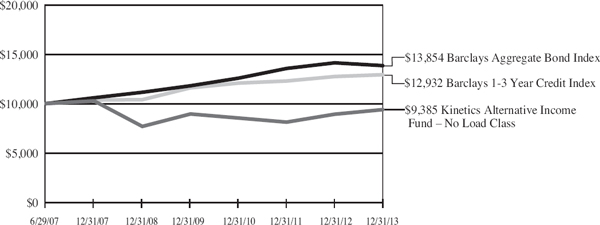
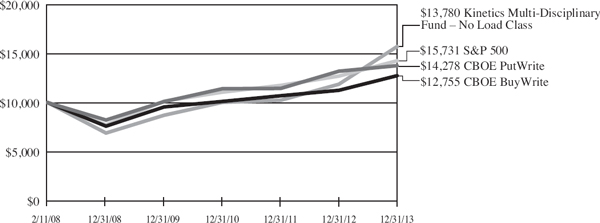
How a $10,000 Investment Has Grown:
The charts show the growth of a $10,000 investment in the Feeder Funds as compared to the performance of two or more representative market indices. The tables below the charts show the average annual total returns on an investment over various periods. Returns for periods greater than one year are average annual total returns. The annual returns assume the reinvestment of all dividends and distributions, however, the graph and table do not reflect the deduction of taxes that a shareholder would pay on fund distributions or the redemption of fund shares. Past performance is not predictive of future performance. Current performance may be lower or higher than the returns quoted below. The performance data reflects voluntary fee waivers and expense reimbursements made by the Adviser and the returns would have been lower if these waivers and expense reimbursements were not in effect. Investment return and principal value will fluctuate, so that your shares, when redeemed, may be worth more or less than their original costs.
The S&P 500 Index — is a capital-weighted index, representing the aggregate market value of the common equity of 500 stocks primarily traded on the New York Stock Exchange. The S&P 500 is unmanaged and includes the reinvestment of dividends and does not reflect the payments of transaction costs and advisory fees associated with an investment in the Funds. The securities that comprise the S&P 500 may differ substantially from the securities in the Funds’ portfolios. It is not possible to directly invest in an index.
The NASDAQ Composite Index — is a broad-based capitalization-weighted index of all NASDAQ stocks. The NASDAQ is unmanaged and does not include the reinvestment of dividends and does not reflect the payment of transaction costs or advisory fees associated with an investment in the Funds. The securities that comprise the NASDAQ Composite may differ substantially from the securities in the Funds’ portfolios. It is not possible to directly invest in an index.
The MSCI ACWI (All Country World Index) Index — is a free float-adjusted market capitalization weighted index that is designed to measure the equity market performance of developed and emerging markets. As of November 27, 2013, the MSCI ACWI consists of 44 country indices comprising 23 developed and 21 emerging market country indices. The developed market country indices included are: Australia, Austria, Belgium, Canada, Denmark, Finland, France, Germany, Hong Kong, Ireland, Israel, Italy, Japan, Netherlands, New Zealand, Norway, Portugal, Singapore, Spain, Sweden, Switzerland, the United Kingdom and the
United States. The emerging market country indices included are: Brazil, Chile, China, Colombia, Czech Republic, Egypt, Greece, Hungary, India, Indonesia, Korea, Malaysia, Mexico, Peru, Philippines, Poland, Russia, South Africa, Taiwan, Thailand, and Turkey.
The Russell 2000® Index — is a subset of the Russell 3000 Index® representing approximately 10% of the total market capitalization of that index. It includes approximately 2000 of the smallest securities based on a combination of their market cap and current index membership. The Russell 2000® Index is constructed to provide a comprehensive and unbiased small-cap barometer and is completely reconstituted annually to ensure larger stocks do not distort the performance and characteristics of the true small-cap opportunity set.
The MSCI EAFE® Index (Europe, Australasia, Far East) — is a free float- adjusted market capitalization index that is designed to measure the equity market performance of developed markets, excluding the US & Canada. As of November 27, 2013, the MSCI EAFE® Index consisted of the following 21 developed market country indices: Australia, Austria, Belgium, Denmark, Finland, France, Germany, Hong Kong, Ireland, Israel, Italy, Japan, the Netherlands, New Zealand, Norway, Portugal, Singapore, Spain, Sweden, Switzerland, and the United Kingdom.
The Barclays U.S. 1-3 Year Credit Index — measures the performance of investment grade corporate debt and sovereign, supranational, local authority and non-U.S. agency bonds that are U.S. dollar denominated and have a remaining maturity of greater than or equal to one year and less than three years.
The Barclays U.S. Aggregate Bond Index — covers the USD-denominated, investment-grade, fixed-rate, taxable bond market of SEC-registered securities. The Index includes multiple types of government and corporate-issued bonds, some of which are asset-backed.
CBOE S&P 500 BuyWrite Index (BXM) — The CBOE S&P 500 BuyWrite Index (BXM) is a benchmark index designed to track the performance of a hypothetical buy-write strategy on the S&P 500. The securities that comprise the CBOE S&P 500 BuyWrite Index may differ substantially from the securities in The Multi-Disciplinary Fund’s portfolio. It is not possible to directly invest in an index.
CBOE S&P 500 PutWrite Index (PUT) — The CBOE S&P 500 PutWrite Index (PUT) is a benchmark index designed to track the performance of a passive program that sells near-term, at-the-money S&P 500 Index puts. The securities that comprise the CBOE S&P 500 PutWrite Index may differ substantially from the securities in The Multi-Disciplinary Fund’s portfolio. It is not possible to directly invest in an index.
The Internet Fund
December 31, 2003 — December 31, 2013
| | | Ended 12/31/2013 |
| | | No Load Class | | Advisor Class A (No Load) | | Advisor Class A (Load Adjusted)(1) | | Advisor Class C | | S&P 500 | | NASDAQ Composite |
| One Year | | 44.28 | % | | 43.94 | % | | 35.66 | % | | 43.20 | % | | 32.39 | % | | 38.32 | % |
| Five Years | | 25.71 | % | | 25.40 | % | | 23.92 | % | | 24.77 | % | | 17.94 | % | | 21.51 | % |
| Ten Years | | 11.23 | % | | 11.09 | % | | 10.43 | % | | N/A | | | 7.41 | % | | 7.62 | % |
| Since Inception | | | | | | | | | | | | | | | | | | |
| No Load Class | | | | | | | | | | | | | | | | | | |
| (10/21/96) | | 16.38 | % | | N/A | | | N/A | | | N/A | | | 7.68 | % | | 7.34 | % |
| Since Inception | | | | | | | | | | | | | | | | | | |
| Advisor Class A | | | | | | | | | | | | | | | | | | |
| (4/26/01) | | N/A | | | 8.41 | % | | 7.91 | % | | N/A | | | 5.29 | % | | 5.83 | % |
| Since Inception | | | | | | | | | | | | | | | | | | |
| Advisor Class C | | | | | | | | | | | | | | | | | | |
| (2/16/07) | | N/A | | | N/A | | | N/A | | | 11.81 | % | | 5.81 | % | | 7.78 | % |
(1) Reflects front-end sales charge of 5.75%.
Returns for periods greater than one year are average annual total returns.
The Global Fund
December 31, 2003 — December 31, 2013
| | | Ended 12/31/2013 |
| | | No Load Class | | Advisor Class A (No Load) | | Advisor Class A (Load Adjusted)(1) | | Advisor Class C | | S&P 500 | | MSCI AC World Index |
| One Year | | 28.59 | % | | 28.16 | % | | 20.73 | % | | 27.84 | % | | 32.39 | % | | 22.80 | % |
| Five Years | | 21.88 | % | | 21.68 | % | | 20.29 | % | | 20.89 | % | | 17.94 | % | | 14.92 | % |
| Ten Years | | 5.97 | % | | N/A | | | N/A | | | N/A | | | 7.41 | % | | 7.17 | % |
| Since Inception | | | | | | | | | | | | | | | | | | |
| No Load Class | | | | | | | | | | | | | | | | | | |
| (12/31/99) | | -1.83 | % | | N/A | | | N/A | | | N/A | | | 3.60 | % | | 3.19 | % |
| Since Inception | | | | | | | | | | | | | | | | | | |
| Advisor Class A | | | | | | | | | | | | | | | | | | |
| (5/19/08) | | N/A | | | 6.32 | % | | 5.19 | % | | N/A | | | 7.07 | % | | 2.75 | % |
| Since Inception | | | | | | | | | | | | | | | | | | |
| Advisor Class C | | | | | | | | | | | | | | | | | | |
| (5/19/08) | | N/A | | | N/A | | | N/A | | | 5.69 | % | | 7.07 | % | | 2.75 | % |
(1) Reflects front-end sales charge of 5.75%.
Returns for periods greater than one year are average annual total returns.
The Paradigm Fund
December 31, 2003 — December 31, 2013
| | | Ended 12/31/2013 |
| | | No Load Class | | Advisor Class A (No Load) | | Advisor Class A (Load Adjusted)(1) | | Advisor Class C | | Institutional Class | | S&P 500 | | MSCI ACWI |
| One Year | | 44.07 | % | | 43.70 | % | | 35.43 | % | | 43.01 | % | | 44.40 | % | | 32.39 | % | | 22.80 | % |
| Five Years | | 20.01 | % | | 19.71 | % | | 18.31 | % | | 19.11 | % | | 20.25 | % | | 17.94 | % | | 14.92 | % |
| Ten Years | | 9.75 | % | | 9.44 | % | | 8.80 | % | | 8.90 | % | | N/A | | | 7.41 | % | | 7.17 | % |
| Since Inception | | | | | | | | | | | | | | | | | | | | | |
| No Load Class | | | | | | | | | | | | | | | | | | | | | |
| (12/31/99) | | 9.98 | % | | N/A | | | N/A | | | N/A | | | N/A | | | 3.60 | % | | 3.19 | % |
| Since Inception | | | | | | | | | | | | | | | | | | | | | |
| Advisor Class A | | | | | | | | | | | | | | | | | | | | | |
| (4/26/01) | | N/A | | | 10.41 | % | | 9.90 | % | | N/A | | | N/A | | | 5.29 | % | | 5.39 | % |
| Since Inception | | | | | | | | | | | | | | | | | | | | | |
| Advisor Class C | | | | | | | | | | | | | | | | | | | | | |
| (6/28/02) | | N/A | | | N/A | | | N/A | | | 10.78 | % | | N/A | | | 7.74 | % | | 7.73 | % |
| Since Inception | | | | | | | | | | | | | | | | | | | | | |
| Institutional Class | | | | | | | | | | | | | | | | | | | | | |
| (5/27/05) | | N/A | | | N/A | | | N/A | | | N/A | | | 8.75 | % | | 7.41 | % | | 6.71 | % |
(1) Reflects front-end sales charge of 5.75%.
Returns for periods greater than one year are average annual total returns.
The Medical Fund
December 31, 2003 — December 31, 2013
| | | Ended 12/31/2013 |
| | | No Load Class | | Advisor Class A (No Load) | | Advisor Class A (Load Adjusted)(1) | | Advisor Class C | | S&P 500 | | NASDAQ Composite |
| One Year | | 49.25 | % | | 48.90 | % | | 40.32 | % | | 48.08 | % | | 32.39 | % | | 38.32 | % |
| Five Years | | 17.26 | % | | 16.98 | % | | 15.60 | % | | 16.38 | % | | 17.94 | % | | 21.51 | % |
| Ten Years | | 9.52 | % | | 9.27 | % | | 8.62 | % | | N/A | | | 7.41 | % | | 7.62 | % |
| Since Inception | | | | | | | | | | | | | | | | | | |
| No Load Class | | | | | | | | | | | | | | | | | | |
| (9/30/99) | | 10.06 | % | | N/A | | | N/A | | | N/A | | | 4.55 | % | | 2.99 | % |
| Since Inception | | | | | | | | | | | | | | | | | | |
| Advisor Class A | | | | | | | | | | | | | | | | | | |
| (4/26/01) | | N/A | | | 5.92 | % | | 5.43 | % | | N/A | | | 5.29 | % | | 5.83 | % |
| Since Inception | | | | | | | | | | | | | | | | | | |
| Advisor Class C | | | | | | | | | | | | | | | | | | |
| (2/16/07) | | N/A | | | N/A | | | N/A | | | 9.35 | % | | 5.81 | % | | 7.78 | % |
(1) Reflects front-end sales charge of 5.75%.
Returns for periods greater than one year are average annual total returns.
The Small Cap Opportunities Fund
December 31, 2003 — December 31, 2013
| | | Ended 12/31/2013 |
| | | No Load Class | | Advisor Class A (No Load) | | Advisor Class A (Load Adjusted)(1) | | Advisor Class C | | Institutional Class | | Russell 2000 | | S&P 500 |
| One Year | | 59.40 | % | | 59.02 | % | | 49.89 | % | | 58.23 | % | | 59.72 | % | | 38.82 | % | | 32.39 | % |
| Five Years | | 25.73 | % | | 25.43 | % | | 23.96 | % | | 24.78 | % | | 25.98 | % | | 20.08 | % | | 17.94 | % |
| Ten Years | | 10.35 | % | | 10.07 | % | | 9.42 | % | | N/A | | | N/A | | | 9.07 | % | | 7.41 | % |
| Since Inception | | | | | | | | | | | | | | | | | | | | | |
| No Load Class | | | | | | | | | | | | | | | | | | | | | |
| (3/20/00) | | 11.54 | % | | N/A | | | N/A | | | N/A | | | N/A | | | 7.01 | % | | 3.70 | % |
| Since Inception | | | | | | | | | | | | | | | | | | | | | |
| Advisor Class A | | | | | | | | | | | | | | | | | | | | | |
| (12/31/01) | | N/A | | | 9.65 | % | | 9.11 | % | | N/A | | | N/A | | | 8.93 | % | | 6.16 | % |
| Since Inception | | | | | | | | | | | | | | | | | | | | | |
| Advisor Class C | | | | | | | | | | | | | | | | | | | | | |
| (2/16/07) | | N/A | | | N/A | | | N/A | | | 5.05 | % | | N/A | | | 6.73 | % | | 5.81 | % |
| Since Inception | | | | | | | | | | | | | | | | | | | | | |
| Institutional Class | | | | | | | | | | | | | | | | | | | | | |
| (8/12/05) | | N/A | | | N/A | | | N/A | | | N/A | | | 9.43 | % | | 8.45 | % | | 7.22 | % |
(1) Reflects front-end sales charge of 5.75%.
Returns for periods greater than one year are average annual total returns.
The Market Opportunities Fund
January 31, 2006 — December 31, 2013
| | | Ended 12/31/2013 |
| | | No Load Class | | Advisor Class A (No Load) | | Advisor Class A (Load Adjusted)(1) | | Advisor Class C | | Institutional Class | | S&P 500 | | MSCI EAFE |
| One Year | | 46.74 | % | | 46.36 | % | | 37.90 | % | | 45.61 | % | | 47.15 | % | | 32.39 | % | | 22.78 | % |
| Five Years | | 21.58 | % | | 21.27 | % | | 19.85 | % | | 20.71 | % | | 21.88 | % | | 17.94 | % | | 12.44 | % |
| Since Inception | | | | | | | | | | | | | | | | | | | | | |
| No Load Class | | | | | | | | | | | | | | | | | | | | | |
| (1/31/06) | | 8.76 | % | | N/A | | | N/A | | | N/A | | | N/A | | | 7.02 | % | | 3.83 | % |
| Since Inception | | | | | | | | | | | | | | | | | | | | | |
| Advisor Class A | | | | | | | | | | | | | | | | | | | | | |
| (1/31/06) | | N/A | | | 8.49 | % | | 7.68 | % | | N/A | | | N/A | | | 7.02 | % | | 3.83 | % |
| Since Inception | | | | | | | | | | | | | | | | | | | | | |
| Advisor Class C | | | | | | | | | | | | | | | | | | | | | |
| (2/16/07) | | N/A | | | N/A | | | N/A | | | 5.21 | % | | N/A | | | 5.81 | % | | 1.19 | % |
| Since Inception | | | | | | | | | | | | | | | | | | | | | |
| Institutional Class | | | | | | | | | | | | | | | | | | | | | |
| (5/19/08) | | N/A | | | N/A | | | N/A | | | N/A | | | 6.59 | % | | 7.07 | % | | 0.40 | % |
(1) Reflects front-end sales charge of 5.75%.
Returns for periods greater than one year are average total returns.
The Alternative Income Fund
June 29, 2007 — December 31, 2013
| | | Ended 12/31/2013 |
| | | No Load Class | | Advisor Class A (No Load) | | Advisor Class A (Load Adjusted)(1) | | Advisor Class C | | Institutional Class | | Barclays U.S. 1-3 Year Credit Index | | Barclays U.S. Aggregate Bond Index |
| One Year | | 5.22 | % | | 4.91 | % | | -1.13 | % | | 4.46 | % | | 5.39 | % | | 1.45 | % | | -2.02 | % |
| Five Years | | 4.09 | % | | 3.84 | % | | 2.63 | % | | 3.34 | % | | 4.41 | % | | 4.46 | % | | 4.44 | % |
| Since Inception | | | | | | | | | | | | | | | | | | | | | |
| No Load Class | | | | | | | | | | | | | | | | | | | | | |
| (6/29/07) | | -0.97 | % | | N/A | | | N/A | | | N/A | | | N/A | | | 4.03 | % | | 5.14 | % |
| Since Inception | | | | | | | | | | | | | | | | | | | | | |
| Advisor Class A | | | | | | | | | | | | | | | | | | | | | |
| (6/29/07) | | N/A | | | -1.21 | % | | -2.10 | % | | N/A | | | N/A | | | 4.03 | % | | 5.14 | % |
| Since Inception | | | | | | | | | | | | | | | | | | | | | |
| Advisor Class C | | | | | | | | | | | | | | | | | | | | | |
| (6/29/07) | | N/A | | | N/A | | | N/A | | | -1.69 | % | | N/A | | | 4.03 | % | | 5.14 | % |
| Since Inception | | | | | | | | | | | | | | | | | | | | | |
| Institutional Class | | | | | | | | | | | | | | | | | | | | | |
| (6/29/07) | | N/A | | | N/A | | | N/A | | | N/A | | | -0.70 | % | | 4.03 | % | | 5.14 | % |
(1) Reflects front-end sales charge of 5.75%.
Returns for periods greater than one year are average total returns.
The Multi-Disciplinary Fund
February 11, 2008 — December 31, 2013
| | | Ended 12/31/2013 |
| | | No Load Class | | Advisor Class A (No Load) | | Advisor Class A (Load Adjusted)(1) | | Advisor Class C | | Institutional Class | | S&P 500 | | CBOE Buy | | CBOE Put |
| One Year | | 4.28 | % | | 4.15 | % | | -1.82 | % | | 3.59 | % | | 4.58 | % | | 32.39 | % | | 13.26 | % | | 12.28 | % |
| Five Years | | 10.88 | % | | 10.63 | % | | 9.33 | % | | 10.06 | % | | 11.10 | % | | 17.94 | % | | 10.92 | % | | 13.07 | % |
| Since Inception | | | | | | | | | | | | | | | | | | | | | | | | |
| No Load Class | | | | | | | | | | | | | | | | | | | | | | | | |
| (2/11/08) | | 5.60 | % | | N/A | | | N/A | | | N/A | | | N/A | | | 8.00 | % | | 4.22 | % | | 6.24 | % |
| Since Inception | | | | | | | | | | | | | | | | | | | | | | | | |
| Advisor Class A | | | | | | | | | | | | | | | | | | | | | | | | |
| (2/11/08) | | N/A | | | 5.35 | % | | 4.30 | % | | N/A | | | N/A | | | 8.00 | % | | 4.22 | % | | 6.24 | % |
| Since Inception | | | | | | | | | | | | | | | | | | | | | | | | |
| Advisor Class C | | | | | | | | | | | | | | | | | | | | | | | | |
| (2/11/08) | | N/A | | | N/A | | | N/A | | | 4.82 | % | | N/A | | | 8.00 | % | | 4.22 | % | | 6.24 | % |
| Since Inception | | | | | | | | | | | | | | | | | | | | | | | | |
| Institutional Class | | | | | | | | | | | | | | | | | | | | | | | | |
| (2/11/08) | | N/A | | | N/A | | | N/A | | | N/A | | | 5.80 | % | | 8.00 | % | | 4.22 | % | | 6.24 | % |
(1) Reflects front-end sales charge of 5.75%.
Returns for periods greater than one year are average total returns.
| KINETICS MUTUAL FUNDS, INC. — THE FEEDER FUNDS |
| Expense Example |
| December 31, 2013 |
Shareholders incur two types of costs: (1) transaction costs, including sales charges (loads) on purchase payments, reinvestments of dividends or other distributions made by a Fund, redemption fees, and exchange fees, and (2), ongoing costs, including management fees, distribution and/or service (12b-1) fees, and other Fund expenses. This example is intended to help investors understand the ongoing costs (in dollars) of investing in a series of Kinetics Mutual Funds, Inc. (each a “Feeder Fund” and collectively the “Feeder Funds”), and to compare these costs with the ongoing costs of investing in other mutual funds. The example is based on an investment of $1,000 invested on July 1, 2013 and held for the entire period from July 1, 2013 to December 31, 2013.
Actual Expenses
The first line and second line items of the table below provide information about actual account values and actual expenses before and after expense reimbursement. Unlike other mutual funds that directly acquire and manage their own portfolio securities, each Feeder Fund invests all or generally all of its investable assets in a corresponding series of The Kinetics Portfolios Trust (each, a “Master Portfolio”, and together the “Master Portfolios”), a separately registered investment company. The Master Portfolio, in turn, invests in securities. With this type of organization, expenses can accrue specifically to the Master Portfolio or the Feeder Fund or both. Each Feeder Fund records its proportionate share of the Master Portfolio’s expenses, including directed brokerage credits, on a daily basis. Any expense reductions include Fund-specific expenses as well as the expenses allocated from the Master Portfolio.
The Feeder Funds will charge shareholder fees for outgoing wire transfers, returned checks, and exchanges executed by telephone between a Feeder Fund and any other Feeder Fund. The Feeder Funds’ transfer agent charges a $5.00 transaction fee to shareholder accounts for telephone exchanges between any two Feeder Funds. The Feeder Funds’ transfer agent does not charge a transaction fee for written exchange requests. IRA accounts are assessed a $15.00 annual fee. Finally, as a disincentive to market-timing transactions, the Feeder Funds will assess a 2.00% fee on the redemption or exchange of Fund shares held for less than 30 days. These fees will be paid to the Feeder Funds to help offset transaction costs. The Feeder Funds reserve the right to waive the redemption fee, subject to their sole discretion, in instances deemed not to be disadvantageous to the Feeder Funds or shareholders as described in the Feeder Funds’ prospectus.
| KINETICS MUTUAL FUNDS, INC. — THE FEEDER FUNDS |
Expense Example — (Continued) |
| December 31, 2013 |
You may use the information provided in the first line, together with the amounts you invested, to estimate the expenses that you paid over the period. Simply divide your account value by $1,000 (for example, an $8,600 account value divided by $1,000 = 8.6), then multiply the result by the number in the first line under the heading entitled “Expenses Paid During Period” to estimate the expenses you paid on your account during this period.
Hypothetical Example for Comparison Purposes
The third and fourth line items of the table below provide information about hypothetical account values and hypothetical expenses before and after expense reimbursements based on the Feeder Funds’ actual expense ratios and an assumed rate of return of 5% per year before expenses, which are not the Feeder Funds’ actual returns. The hypothetical account values and expenses may not be used to estimate the actual ending account balance or expenses one paid for the period. You may use this information to compare the ongoing costs of investing in the Feeder Funds and other funds. To do so, compare this 5% hypothetical example with the 5% hypothetical examples that appear in the shareholder reports of the other funds. Please note that the expenses shown in the table are meant to highlight one’s ongoing costs only and do not reflect any transactional costs, such as sales charges (loads), redemption fees, or exchange fees. Therefore, the second line of the table is useful in comparing ongoing costs only, and will not help one determine the relative total costs of owning different funds. If these transactional costs had been included, one’s costs would have been higher.
| KINETICS MUTUAL FUNDS, INC. — THE FEEDER FUNDS |
Expense Example — (Continued) |
| December 31, 2013 |
| | | | | | | | | | | | | Expenses Paid | |
| | | | Beginning | | | Ending | | | | | | During | |
| | | | Account | | | Account | | | Annualized | | | Period* | |
| | | | Value | | | Value | | | Expense | | | (7/1/13 to | |
| | | | (7/1/13) | | | (12/31/13) | | | Ratio | | | 12/31/13) | |
| The Internet Fund | | | | | | | | | | | | | |
| No Load Class Actual — before | | | | | | | | | | | | | |
| expense reimbursement | | $ | 1,000.00 | | $ | 1,247.80 | | | 1.83 | % | $ | 10.37 | |
| No Load Class Actual — after | | | | | | | | | | | | | |
| expense reimbursement | | $ | 1,000.00 | | $ | 1,247.80 | | | 1.83 | % | $ | 10.37 | |
| No Load Class Hypothetical | | | | | | | | | | | | | |
| (5% return before expenses) — | | | | | | | | | | | | | |
| before expense reimbursement | | $ | 1,000.00 | | $ | 1,015.97 | | | 1.83 | % | $ | 9.30 | |
| No Load Class Hypothetical | | | | | | | | | | | | | |
| (5% return before expenses) — | | | | | | | | | | | | | |
| after expense reimbursement | | $ | 1,000.00 | | $ | 1,015.97 | | | 1.83 | % | $ | 9.30 | |
| Advisor Class A Actual — before | | | | | | | | | | | | | |
| expense reimbursement | | $ | 1,000.00 | | $ | 1,246.30 | | | 2.08 | % | $ | 11.78 | |
| Advisor Class A Actual — after | | | | | | | | | | | | | |
| expense reimbursement | | $ | 1,000.00 | | $ | 1,246.30 | | | 2.08 | % | $ | 11.78 | |
| Advisor Class A Hypothetical | | | | | | | | | | | | | |
| (5% return before expenses) — | | | | | | | | | | | | | |
| before expense reimbursement | | $ | 1,000.00 | | $ | 1,014.71 | | | 2.08 | % | $ | 10.56 | |
| Advisor Class A Hypothetical | | | | | | | | | | | | | |
| (5% return before expenses) — | | | | | | | | | | | | | |
| after expense reimbursement | | $ | 1,000.00 | | $ | 1,014.71 | | | 2.08 | % | $ | 10.56 | |
| Advisor Class C Actual — before | | | | | | | | | | | | | |
| expense reimbursement | | $ | 1,000.00 | | $ | 1,243.10 | | | 2.58 | % | $ | 14.59 | |
| Advisor Class C Actual — after | | | | | | | | | | | | | |
| expense reimbursement | | $ | 1,000.00 | | $ | 1,243.10 | | | 2.58 | % | $ | 14.59 | |
| Advisor Class C Hypothetical | | | | | | | | | | | | | |
| (5% return before expenses) — | | | | | | | | | | | | | |
| before expense reimbursement | | $ | 1,000.00 | | $ | 1,012.19 | | | 2.58 | % | $ | 13.09 | |
| Advisor Class C Hypothetical | | | | | | | | | | | | | |
| (5% return before expenses) — | | | | | | | | | | | | | |
| after expense reimbursement | | $ | 1,000.00 | | $ | 1,012.19 | | | 2.58 | % | $ | 13.09 | |
| | | | | | | | | | | | | | |
| The Global Fund | | | | | | | | | | | | | |
| No Load Class Actual — before | | | | | | | | | | | | | |
| expense reimbursement | | $ | 1,000.00 | | $ | 1,176.00 | | | 2.76 | % | $ | 15.14 | |
| No Load Class Actual — after | | | | | | | | | | | | | |
| expense reimbursement | | $ | 1,000.00 | | $ | 1,176.00 | | | 1.39 | % | $ | 7.62 | |
| No Load Class Hypothetical | | | | | | | | | | | | | |
| (5% return before expenses) — | | | | | | | | | | | | | |
| before expense reimbursement | | $ | 1,000.00 | | $ | 1,011.29 | | | 2.76 | % | $ | 13.99 | |
| No Load Class Hypothetical | | | | | | | | | | | | | |
| (5% return before expenses) — | | | | | | | | | | | | | |
| after expense reimbursement | | $ | 1,000.00 | | $ | 1,018.19 | | | 1.39 | % | $ | 7.07 | |
| Advisor Class A Actual — before | | | | | | | | | | | | | |
| expense reimbursement | | $ | 1,000.00 | | $ | 1,174.40 | | | 3.01 | % | $ | 16.50 | |
| KINETICS MUTUAL FUNDS, INC. — THE FEEDER FUNDS |
Expense Example — (Continued) |
| December 31, 2013 |
| | | | | | | | | | | | | Expenses Paid | |
| | | | Beginning | | | Ending | | | | | | During | |
| | | | Account | | | Account | | | Annualized | | | Period* | |
| | | | Value | | | Value | | | Expense | | | (7/1/13 to | |
| | | | (7/1/13) | | | (12/31/13) | | | Ratio | | | 12/31/13) | |
| Advisor Class A Actual — after | | | | | | | | | | | | | |
| expense reimbursement | | $ | 1,000.00 | | $ | 1,174.40 | | | 1.64 | % | $ | 8.99 | |
| Advisor Class A Hypothetical | | | | | | | | | | | | | |
| (5% return before expenses) — | | | | | | | | | | | | | |
| before expense reimbursement | | $ | 1,000.00 | | $ | 1,010.03 | | | 3.01 | % | $ | 15.25 | |
| Advisor Class A Hypothetical | | | | | | | | | | | | | |
| (5% return before expenses) — | | | | | | | | | | | | | |
| after expense reimbursement | | $ | 1,000.00 | | $ | 1,016.93 | | | 1.64 | % | $ | 8.34 | |
| Advisor Class C Actual — before | | | | | | | | | | | | | |
| expense reimbursement | | $ | 1,000.00 | | $ | 1,171.90 | | | 3.51 | % | $ | 19.22 | |
| Advisor Class C Actual — after | | | | | | | | | | | | | |
| expense reimbursement | | $ | 1,000.00 | | $ | 1,171.90 | | | 2.14 | % | $ | 11.72 | |
| Advisor Class C Hypothetical | | | | | | | | | | | | | |
| (5% return before expenses) — | | | | | | | | | | | | | |
| before expense reimbursement | | $ | 1,000.00 | | $ | 1,007.51 | | | 3.51 | % | $ | 17.76 | |
| Advisor Class C Hypothetical | | | | | | | | | | | | | |
| (5% return before expenses) — | | | | | | | | | | | | | |
| after expense reimbursement | | $ | 1,000.00 | | $ | 1,014.41 | | | 2.14 | % | $ | 10.87 | |
| | | | | | | | | | | | | | |
| The Paradigm Fund | | | | | | | | | | | | | |
| No Load Class Actual — before | | | | | | | | | | | | | |
| expense reimbursement | | $ | 1,000.00 | | $ | 1,195.10 | | | 1.70 | % | $ | 9.41 | |
| No Load Class Actual — after | | | | | | | | | | | | | |
| expense reimbursement | | $ | 1,000.00 | | $ | 1,195.10 | | | 1.64 | % | $ | 9.07 | |
| No Load Class Hypothetical | | | | | | | | | | | | | |
| (5% return before expenses) — | | | | | | | | | | | | | |
| before expense reimbursement | | $ | 1,000.00 | | $ | 1,016.63 | | | 1.70 | % | $ | 8.64 | |
| No Load Class Hypothetical | | | | | | | | | | | | | |
| (5% return before expenses) — | | | | | | | | | | | | | |
| after expense reimbursement | | $ | 1,000.00 | | $ | 1,016.93 | | | 1.64 | % | $ | 8.34 | |
| Advisor Class A Actual — before | | | | | | | | | | | | | |
| expense reimbursement | | $ | 1,000.00 | | $ | 1,193.20 | | | 1.95 | % | $ | 10.78 | |
| Advisor Class A Actual — after | | | | | | | | | | | | | |
| expense reimbursement | | $ | 1,000.00 | | $ | 1,193.20 | | | 1.89 | % | $ | 10.45 | |
| Advisor Class A Hypothetical | | | | | | | | | | | | | |
| (5% return before expenses) — | | | | | | | | | | | | | |
| before expense reimbursement | | $ | 1,000.00 | | $ | 1,015.37 | | | 1.95 | % | $ | 9.91 | |
| Advisor Class A Hypothetical | | | | | | | | | | | | | |
| (5% return before expenses) — | | | | | | | | | | | | | |
| after expense reimbursement | | $ | 1,000.00 | | $ | 1,015.67 | | | 1.89 | % | $ | 9.60 | |
| Advisor Class C Actual — before | | | | | | | | | | | | | |
| expense reimbursement | | $ | 1,000.00 | | $ | 1,190.10 | | | 2.45 | % | $ | 13.52 | |
| Advisor Class C Actual — after | | | | | | | | | | | | | |
| expense reimbursement | | $ | 1,000.00 | | $ | 1,190.10 | | | 2.39 | % | $ | 13.19 | |
| KINETICS MUTUAL FUNDS, INC. — THE FEEDER FUNDS |
Expense Example — (Continued) |
| December 31, 2013 |
| | | | | | | | | | | | | Expenses Paid | |
| | | | Beginning | | | Ending | | | | | | During | |
| | | | Account | | | Account | | | Annualized | | | Period* | |
| | | | Value | | | Value | | | Expense | | | (7/1/13 to | |
| | | | (7/1/13) | | | (12/31/13) | | | Ratio | | | 12/31/13) | |
| Advisor Class C Hypothetical | | | | | | | | | | | | | |
| (5% return before expenses) — | | | | | | | | | | | | | |
| before expense reimbursement | | $ | 1,000.00 | | $ | 1,012.85 | | | 2.45 | % | $ | 12.43 | |
| Advisor Class C Hypothetical | | | | | | | | | | | | | |
| (5% return before expenses) — | | | | | | | | | | | | | |
| after expense reimbursement | | $ | 1,000.00 | | $ | 1,013.15 | | | 2.39 | % | $ | 12.13 | |
| Institutional Class Actual — before | | | | | | | | | | | | | |
| expense reimbursement | | $ | 1,000.00 | | $ | 1,196.10 | | | 1.65 | % | $ | 9.13 | |
| Institutional Class Actual — after | | | | | | | | | | | | | |
| expense reimbursement | | $ | 1,000.00 | | $ | 1,196.10 | | | 1.44 | % | $ | 7.97 | |
| Institutional Class Hypothetical | | | | | | | | | | | | | |
| (5% return before expenses) — | | | | | | | | | | | | | |
| before expense reimbursement | | $ | 1,000.00 | | $ | 1,016.88 | | | 1.65 | % | $ | 8.39 | |
| Institutional Class Hypothetical | | | | | | | | | | | | | |
| (5% return before expenses) — | | | | | | | | | | | | | |
| after expense reimbursement | | $ | 1,000.00 | | $ | 1,017.94 | | | 1.44 | % | $ | 7.32 | |
| | | | | | | | | | | | | | |
| The Medical Fund | | | | | | | | | | | | | |
| No Load Class Actual — before | | | | | | | | | | | | | |
| expense reimbursement | | $ | 1,000.00 | | $ | 1,195.30 | | | 2.07 | % | $ | 11.45 | |
| No Load Class Actual — after | | | | | | | | | | | | | |
| expense reimbursement | | $ | 1,000.00 | | $ | 1,195.30 | | | 1.39 | % | $ | 7.69 | |
| No Load Class Hypothetical | | | | | | | | | | | | | |
| (5% return before expenses) — | | | | | | | | | | | | | |
| before expense reimbursement | | $ | 1,000.00 | | $ | 1,014.76 | | | 2.07 | % | $ | 10.51 | |
| No Load Class Hypothetical | | | | | | | | | | | | | |
| (5% return before expenses) — | | | | | | | | | | | | | |
| after expense reimbursement | | $ | 1,000.00 | | $ | 1,018.19 | | | 1.39 | % | $ | 7.07 | |
| Advisor Class A Actual — before | | | | | | | | | | | | | |
| expense reimbursement | | $ | 1,000.00 | | $ | 1,194.10 | | | 2.32 | % | $ | 12.83 | |
| Advisor Class A Actual — after | | | | | | | | | | | | | |
| expense reimbursement | | $ | 1,000.00 | | $ | 1,194.10 | | | 1.64 | % | $ | 9.07 | |
| Advisor Class A Hypothetical | | | | | | | | | | | | | |
| (5% return before expenses) — | | | | | | | | | | | | | |
| before expense reimbursement | | $ | 1,000.00 | | $ | 1,013.50 | | | 2.32 | % | $ | 11.77 | |
| Advisor Class A Hypothetical | | | | | | | | | | | | | |
| (5% return before expenses) — | | | | | | | | | | | | | |
| after expense reimbursement | | $ | 1,000.00 | | $ | 1,016.93 | | | 1.64 | % | $ | 8.34 | |
| Advisor Class C Actual — before | | | | | | | | | | | | | |
| expense reimbursement | | $ | 1,000.00 | | $ | 1,190.60 | | | 2.82 | % | $ | 15.57 | |
| Advisor Class C Actual — after | | | | | | | | | | | | | |
| expense reimbursement | | $ | 1,000.00 | | $ | 1,190.60 | | | 2.14 | % | $ | 11.82 | |
| Advisor Class C Hypothetical | | | | | | | | | | | | | |
| (5% return before expenses) — | | | | | | | | | | | | | |
| before expense reimbursement | | $ | 1,000.00 | | $ | 1,010.98 | | | 2.82 | % | $ | 14.29 | |
| KINETICS MUTUAL FUNDS, INC. — THE FEEDER FUNDS |
Expense Example — (Continued) |
| December 31, 2013 |
| | | | | | | | | | | | | Expenses Paid | |
| | | | Beginning | | | Ending | | | | | | During | |
| | | | Account | | | Account | | | Annualized | | | Period* | |
| | | | Value | | | Value | | | Expense | | | (7/1/13 to | |
| | | | (7/1/13) | | | (12/31/13) | | | Ratio | | | 12/31/13) | |
| Advisor Class C Hypothetical | | | | | | | | | | | | | |
| (5% return before expenses) — | | | | | | | | | | | | | |
| after expense reimbursement | | $ | 1,000.00 | | $ | 1,014.41 | | | 2.14 | % | $ | 10.87 | |
| | | | | | | | | | | | | | |
| The Small Cap Opportunities Fund | | | | | | | | | | | | | |
| No Load Class Actual — before | | | | | | | | | | | | | |
| expense reimbursement | | $ | 1,000.00 | | $ | 1,242.10 | | | 1.71 | % | $ | 9.66 | |
| No Load Class Actual — after | | | | | | | | | | | | | |
| expense reimbursement | | $ | 1,000.00 | | $ | 1,242.10 | | | 1.64 | % | $ | 9.27 | |
| No Load Class Hypothetical | | | | | | | | | | | | | |
| (5% return before expenses) — | | | | | | | | | | | | | |
| before expense reimbursement | | $ | 1,000.00 | | $ | 1,016.58 | | | 1.71 | % | $ | 8.69 | |
| No Load Class Hypothetical | | | | | | | | | | | | | |
| (5% return before expenses) — | | | | | | | | | | | | | |
| after expense reimbursement | | $ | 1,000.00 | | $ | 1,016.93 | | | 1.64 | % | $ | 8.34 | |
| Advisor Class A Actual — before | | | | | | | | | | | | | |
| expense reimbursement | | $ | 1,000.00 | | $ | 1,240.60 | | | 1.96 | % | $ | 11.07 | |
| Advisor Class A Actual — after | | | | | | | | | | | | | |
| expense reimbursement | | $ | 1,000.00 | | $ | 1,240.60 | | | 1.89 | % | $ | 10.67 | |
| Advisor Class A Hypothetical | | | | | | | | | | | | | |
| (5% return before expenses) — | | | | | | | | | | | | | |
| before expense reimbursement | | $ | 1,000.00 | | $ | 1,015.32 | | | 1.96 | % | $ | 9.96 | |
| Advisor Class A Hypothetical | | | | | | | | | | | | | |
| (5% return before expenses) — | | | | | | | | | | | | | |
| after expense reimbursement | | $ | 1,000.00 | | $ | 1,015.67 | | | 1.89 | % | $ | 9.60 | |
| Advisor Class C Actual — before | | | | | | | | | | | | | |
| expense reimbursement | | $ | 1,000.00 | | $ | 1,237.30 | | | 2.46 | % | $ | 13.87 | |
| Advisor Class C Actual — after | | | | | | | | | | | | | |
| expense reimbursement | | $ | 1,000.00 | | $ | 1,237.30 | | | 2.39 | % | $ | 13.48 | |
| Advisor Class C Hypothetical | | | | | | | | | | | | | |
| (5% return before expenses) — | | | | | | | | | | | | | |
| before expense reimbursement | | $ | 1,000.00 | | $ | 1,012.80 | | | 2.46 | % | $ | 12.48 | |
| Advisor Class C Hypothetical | | | | | | | | | | | | | |
| (5% return before expenses) — | | | | | | | | | | | | | |
| after expense reimbursement | | $ | 1,000.00 | | $ | 1,013.15 | | | 2.39 | % | $ | 12.13 | |
| Institutional Class Actual — before | | | | | | | | | | | | | |
| expense reimbursement | | $ | 1,000.00 | | $ | 1,243.20 | | | 1.66 | % | $ | 9.39 | |
| Institutional Class Actual — after | | | | | | | | | | | | | |
| expense reimbursement | | $ | 1,000.00 | | $ | 1,243.20 | | | 1.44 | % | $ | 8.14 | |
| Institutional Class Hypothetical | | | | | | | | | | | | | |
| (5% return before expenses) — | | | | | | | | | | | | | |
| before expense reimbursement | | $ | 1,000.00 | | $ | 1,016.83 | | | 1.66 | % | $ | 8.44 | |
| Institutional Class Hypothetical | | | | | | | | | | | | | |
| (5% return before expenses) — | | | | | | | | | | | | | |
| after expense reimbursement | | $ | 1,000.00 | | $ | 1,017.94 | | | 1.44 | % | $ | 7.32 | |
| KINETICS MUTUAL FUNDS, INC. — THE FEEDER FUNDS |
Expense Example — (Continued) |
| December 31, 2013 |
| | | | | | | | | | | | | Expenses Paid | |
| | | | Beginning | | | Ending | | | | | | During | |
| | | | Account | | | Account | | | Annualized | | | Period* | |
| | | | Value | | | Value | | | Expense | | | (7/1/13 to | |
| | | | (7/1/13) | | | (12/31/13) | | | Ratio | | | 12/31/13) | |
| The Market Opportunities Fund | | | | | | | | | | | | | |
| No Load Class Actual — before | | | | | | | | | | | | | |
| expense reimbursement | | $ | 1,000.00 | | $ | 1,200.10 | | | 1.89 | % | $ | 10.48 | |
| No Load Class Actual — after | | | | | | | | | | | | | |
| expense reimbursement | | $ | 1,000.00 | | $ | 1,200.10 | | | 1.64 | % | $ | 9.09 | |
| No Load Class Hypothetical | | | | | | | | | | | | | |
| (5% return before expenses) — | | | | | | | | | | | | | |
| before expense reimbursement | | $ | 1,000.00 | | $ | 1,015.67 | | | 1.89 | % | $ | 9.60 | |
| No Load Class Hypothetical | | | | | | | | | | | | | |
| (5% return before expenses) — | | | | | | | | | | | | | |
| after expense reimbursement | | $ | 1,000.00 | | $ | 1,016.93 | | | 1.64 | % | $ | 8.34 | |
| Advisor Class A Actual — before | | | | | | | | | | | | | |
| expense reimbursement | | $ | 1,000.00 | | $ | 1,198.50 | | | 2.14 | % | $ | 11.86 | |
| Advisor Class A Actual — after | | | | | | | | | | | | | |
| expense reimbursement | | $ | 1,000.00 | | $ | 1,198.50 | | | 1.89 | % | $ | 10.47 | |
| Advisor Class A Hypothetical | | | | | | | | | | | | | |
| (5% return before expenses) — | | | | | | | | | | | | | |
| before expense reimbursement | | $ | 1,000.00 | | $ | 1,014.41 | | | 2.14 | % | $ | 10.87 | |
| Advisor Class A Hypothetical | | | | | | | | | | | | | |
| (5% return before expenses) — | | | | | | | | | | | | | |
| after expense reimbursement | | $ | 1,000.00 | | $ | 1,015.67 | | | 1.89 | % | $ | 9.60 | |
| Advisor Class C Actual — before | | | | | | | | | | | | | |
| expense reimbursement | | $ | 1,000.00 | | $ | 1,195.70 | | | 2.64 | % | $ | 14.61 | |
| Advisor Class C Actual — after | | | | | | | | | | | | | |
| expense reimbursement | | $ | 1,000.00 | | $ | 1,195.70 | | | 2.39 | % | $ | 13.23 | |
| Advisor Class C Hypothetical | | | | | | | | | | | | | |
| (5% return before expenses) — | | | | | | | | | | | | | |
| before expense reimbursement | | $ | 1,000.00 | | $ | 1,011.89 | | | 2.64 | % | $ | 13.39 | |
| Advisor Class C Hypothetical | | | | | | | | | | | | | |
| (5% return before expenses) — | | | | | | | | | | | | | |
| after expense reimbursement | | $ | 1,000.00 | | $ | 1,013.15 | | | 2.39 | % | $ | 12.13 | |
| Institutional Class Actual — before | | | | | | | | | | | | | |
| expense reimbursement | | $ | 1,000.00 | | $ | 1,201.50 | | | 1.84 | % | $ | 10.21 | |
| Institutional Class Actual — after | | | | | | | | | | | | | |
| expense reimbursement | | $ | 1,000.00 | | $ | 1,201.50 | | | 1.44 | % | $ | 7.99 | |
| Institutional Class Hypothetical | | | | | | | | | | | | | |
| (5% return before expenses) — | | | | | | | | | | | | | |
| before expense reimbursement | | $ | 1,000.00 | | $ | 1,015.92 | | | 1.84 | % | $ | 9.35 | |
| Institutional Class Hypothetical | | | | | | | | | | | | | |
| (5% return before expenses) — | | | | | | | | | | | | | |
| after expense reimbursement | | $ | 1,000.00 | | $ | 1,017.94 | | | 1.44 | % | $ | 7.32 | |
| KINETICS MUTUAL FUNDS, INC. — THE FEEDER FUNDS |
Expense Example — (Continued) |
| December 31, 2013 |
| | | | | | | | | | | | | Expenses Paid | |
| | | | Beginning | | | Ending | | | | | | During | |
| | | | Account | | | Account | | | Annualized | | | Period* | |
| | | | Value | | | Value | | | Expense | | | (7/1/13 to | |
| | | | (7/1/13) | | | (12/31/13) | | | Ratio | | | 12/31/13) | |
| The Alternative Income Fund | | | | | | | | | | | | | |
| No Load Class Actual — before | | | | | | | | | | | | | |
| expense reimbursement | | $ | 1,000.00 | | $ | 1,035.00 | | | 2.28 | % | $ | 11.69 | |
| No Load Class Actual — after | | | | | | | | | | | | | |
| expense reimbursement | | $ | 1,000.00 | | $ | 1,035.00 | | | 0.95 | % | $ | 4.87 | |
| No Load Class Hypothetical | | | | | | | | | | | | | |
| (5% return before expenses) — | | | | | | | | | | | | | |
| before expense reimbursement | | $ | 1,000.00 | | $ | 1,013.71 | | | 2.28 | % | $ | 11.57 | |
| No Load Class Hypothetical | | | | | | | | | | | | | |
| (5% return before expenses) — | | | | | | | | | | | | | |
| after expense reimbursement | | $ | 1,000.00 | | $ | 1,020.41 | | | 0.95 | % | $ | 4.84 | |
| Advisor Class A Actual — before | | | | | | | | | | | | | |
| expense reimbursement | | $ | 1,000.00 | | $ | 1,033.80 | | | 2.53 | % | $ | 12.97 | |
| Advisor Class A Actual — after | | | | | | | | | | | | | |
| expense reimbursement | | $ | 1,000.00 | | $ | 1,033.80 | | | 1.20 | % | $ | 6.15 | |
| Advisor Class A Hypothetical | | | | | | | | | | | | | |
| (5% return before expenses) — | | | | | | | | | | | | | |
| before expense reimbursement | | $ | 1,000.00 | | $ | 1,012.45 | | | 2.53 | % | $ | 12.83 | |
| Advisor Class A Hypothetical | | | | | | | | | | | | | |
| (5% return before expenses) — | | | | | | | | | | | | | |
| after expense reimbursement | | $ | 1,000.00 | | $ | 1,019.15 | | | 1.20 | % | $ | 6.11 | |
| Advisor Class C Actual — before | | | | | | | | | | | | | |
| expense reimbursement | | $ | 1,000.00 | | $ | 1,031.20 | | | 3.03 | % | $ | 15.51 | |
| Advisor Class C Actual — after | | | | | | | | | | | | | |
| expense reimbursement | | $ | 1,000.00 | | $ | 1,031.20 | | | 1.70 | % | $ | 8.70 | |
| Advisor Class C Hypothetical | | | | | | | | | | | | | |
| (5% return before expenses) — | | | | | | | | | | | | | |
| before expense reimbursement | | $ | 1,000.00 | | $ | 1,009.93 | | | 3.03 | % | $ | 15.35 | |
| Advisor Class C Hypothetical | | | | | | | | | | | | | |
| (5% return before expenses) — | | | | | | | | | | | | | |
| after expense reimbursement | | $ | 1,000.00 | | $ | 1,016.63 | | | 1.70 | % | $ | 8.64 | |
| Institutional Class Actual — before | | | | | | | | | | | | | |
| expense reimbursement | | $ | 1,000.00 | | $ | 1,036.00 | | | 2.23 | % | $ | 11.44 | |
| Institutional Class Actual — after | | | | | | | | | | | | | |
| expense reimbursement | | $ | 1,000.00 | | $ | 1,036.00 | | | 0.75 | % | $ | 3.85 | |
| Institutional Class Hypothetical | | | | | | | | | | | | | |
| (5% return before expenses) — | | | | | | | | | | | | | |
| before expense reimbursement | | $ | 1,000.00 | | $ | 1,013.96 | | | 2.23 | % | $ | 11.32 | |
| Institutional Class Hypothetical | | | | | | | | | | | | | |
| (5% return before expenses) — | | | | | | | | | | | | | |
| after expense reimbursement | | $ | 1,000.00 | | $ | 1,021.42 | | | 0.75 | % | $ | 3.82 | |
| KINETICS MUTUAL FUNDS, INC. — THE FEEDER FUNDS |
Expense Example — (Continued) |
| December 31, 2013 |
| | | | | | | | | | | | | Expenses Paid | |
| | | | Beginning | | | Ending | | | | | | During | |
| | | | Account | | | Account | | | Annualized | | | Period* | |
| | | | Value | | | Value | | | Expense | | | (7/1/13 to | |
| | | | (7/1/13) | | | (12/31/13) | | | Ratio | | | 12/31/13) | |
| The Multi-Disciplinary Fund | | | | | | | | | | | | | |
| No Load Class Actual — before | | | | | | | | | | | | | |
| expense reimbursement | | $ | 1,000.00 | | $ | 1,036.30 | | | 1.81 | % | $ | 9.29 | |
| No Load Class Actual — after | | | | | | | | | | | | | |
| expense reimbursement | | $ | 1,000.00 | | $ | 1,036.30 | | | 1.49 | % | $ | 7.65 | |
| No Load Class Hypothetical | | | | | | | | | | | | | |
| (5% return before expenses) — | | | | | | | | | | | | | |
| before expense reimbursement | | $ | 1,000.00 | | $ | 1,016.08 | | | 1.81 | % | $ | 9.20 | |
| No Load Class Hypothetical | | | | | | | | | | | | | |
| (5% return before expenses) — | | | | | | | | | | | | | |
| after expense reimbursement | | $ | 1,000.00 | | $ | 1,017.69 | | | 1.49 | % | $ | 7.58 | |
| Advisor Class A Actual — before | | | | | | | | | | | | | |
| expense reimbursement | | $ | 1,000.00 | | $ | 1,035.80 | | | 2.06 | % | $ | 10.57 | |
| Advisor Class A Actual — after | | | | | | | | | | | | | |
| expense reimbursement | | $ | 1,000.00 | | $ | 1,035.80 | | | 1.74 | % | $ | 8.93 | |
| Advisor Class A Hypothetical | | | | | | | | | | | | | |
| (5% return before expenses) — | | | | | | | | | | | | | |
| before expense reimbursement | | $ | 1,000.00 | | $ | 1,014.82 | | | 2.06 | % | $ | 10.46 | |
| Advisor Class A Hypothetical | | | | | | | | | | | | | |
| (5% return before expenses) — | | | | | | | | | | | | | |
| after expense reimbursement | | $ | 1,000.00 | | $ | 1,016.43 | | | 1.74 | % | $ | 8.84 | |
| Advisor Class C Actual — before | | | | | | | | | | | | | |
| expense reimbursement | | $ | 1,000.00 | | $ | 1,033.70 | | | 2.56 | % | $ | 13.12 | |
| Advisor Class C Actual — after | | | | | | | | | | | | | |
| expense reimbursement | | $ | 1,000.00 | | $ | 1,033.70 | | | 2.24 | % | $ | 11.48 | |
| Advisor Class C Hypothetical | | | | | | | | | | | | | |
| (5% return before expenses) — | | | | | | | | | | | | | |
| before expense reimbursement | | $ | 1,000.00 | | $ | 1,012.29 | | | 2.56 | % | $ | 12.98 | |
| Advisor Class C Hypothetical | | | | | | | | | | | | | |
| (5% return before expenses) — | | | | | | | | | | | | | |
| after expense reimbursement | | $ | 1,000.00 | | $ | 1,013.91 | | | 2.24 | % | $ | 11.37 | |
| Institutional Class Actual — before | | | | | | | | | | | | | |
| expense reimbursement | | $ | 1,000.00 | | $ | 1,038.20 | | | 1.76 | % | $ | 9.04 | |
| Institutional Class Actual — after | | | | | | | | | | | | | |
| expense reimbursement | | $ | 1,000.00 | | $ | 1,038.20 | | | 1.29 | % | $ | 6.63 | |
| Institutional Class Hypothetical | | | | | | | | | | | | | |
| (5% return before expenses) — | | | | | | | | | | | | | |
| before expense reimbursement | | $ | 1,000.00 | | $ | 1,016.33 | | | 1.76 | % | $ | 8.94 | |
| Institutional Class Hypothetical | | | | | | | | | | | | | |
| (5% return before expenses) — | | | | | | | | | | | | | |
| after expense reimbursement | | $ | 1,000.00 | | $ | 1,018.70 | | | 1.29 | % | $ | 6.56 | |
| | | |
| Note: | Each Feeder Fund records its proportionate share of the respective Master Portfolio’s expenses on a daily basis. Any expense reductions include Feeder Fund-specific expenses as well as the expenses allocated for the Master Portfolio. |
| * | Expenses are equal to the Feeder Fund’s annualized expense ratio before expense reimbursement and after expense reimbursement multiplied by the average account value over the period, multiplied by 184/365. |
| KINETICS MUTUAL FUNDS, INC. — THE FEEDER FUNDS |
| Statements of Assets & Liabilities |
| December 31, 2013 |
| | | The Internet | | | The Global | |
| | | Fund | | | Fund | |
| ASSETS: | | | | | | |
| Investments in the Master Portfolio, at value* | | $ | 178,839,508 | | | $ | 12,208,812 | |
| Receivable from Adviser | | | 280 | | | | 12,809 | |
| Receivable for Master Portfolio interest sold | | | — | | | | 1,932 | |
| Receivable for Fund shares sold | | | 913,417 | | | | 1,816 | |
| Prepaid expenses and other assets | | | 21,595 | | | | 16,173 | |
| Total Assets | | | 179,774,800 | | | | 12,241,542 | |
| LIABILITIES: | | | | | | | | |
| Payable for Master Portfolio interest purchased | | | 464,665 | | | | — | |
| Payable to Directors and Officers | | | 6,415 | | | | 334 | |
| Payable for Fund shares repurchased | | | 448,752 | | | | 3,748 | |
| Payable for shareholder servicing fees | | | 36,758 | | | | 2,566 | |
| Payable for distribution fees | | | 1,800 | | | | 1,269 | |
| Accrued expenses and other liabilities | | | 65,940 | | | | 13,681 | |
| Total Liabilities | | | 1,024,330 | | | | 21,598 | |
| Net Assets | | $ | 178,750,470 | | | $ | 12,219,944 | |
| NET ASSETS CONSIST OF: | | | | | | | | |
| Paid in capital | | $ | 82,764,194 | | | $ | 9,837,069 | |
| Accumulated net investment Income (loss) | | | 108,097 | | | | (28,646 | ) |
Accumulated net realized gain (loss) on investments and foreign currency | | | 5,010,832 | | | | (396,625 | ) |
| Net unrealized appreciation on: | | | | | | | | |
| Investments and foreign currency | | | 90,867,347 | | | | 2,808,146 | |
| Net Assets | | $ | 178,750,470 | | | $ | 12,219,944 | |
| CALCULATION OF NET ASSET VALUE PER SHARE — NO LOAD CLASS: | | | | | | | | |
| Net Assets | | $ | 172,331,691 | | | $ | 8,705,081 | |
| Shares outstanding | | | 2,907,724 | | | | 1,438,355 | |
| Net asset value per share (offering price and redemption price) | | $ | 59.27 | | | $ | 6.05 | |
| CALCULATION OF NET ASSET VALUE PER SHARE — ADVISOR CLASS A: | | | | | | | | |
| Net Assets | | $ | 5,505,677 | | | $ | 1,991,579 | |
| Shares outstanding | | | 95,181 | | | | 330,056 | |
| Net asset value per share (redemption price) | | $ | 57.84 | | | $ | 6.03 | |
Offering price per share ($57.84 divided by .9425 and $6.03 divided by .9425) | | $ | 61.37 | | | $ | 6.40 | |
| CALCULATION OF NET ASSET VALUE PER SHARE — ADVISOR CLASS C: | | | | | | | | |
| Net Assets | | $ | 913,102 | | | $ | 1,523,284 | |
| Shares outstanding | | | 16,488 | | | | 258,400 | |
| Net asset value per share (offering price and redemption price) | | $ | 55.38 | | | $ | 5.90 | |
| | | |
| * | Each Feeder Fund invests all or generally all its assets directly in the corresponding Master Portfolio. The financial statements for the Master Portfolios, along with the portfolio of investments in securities, are contained elsewhere in this report and should be read in conjunction with the Feeder Funds’ financial statements. |
The accompanying notes are an integral part of these financial statements.
| KINETICS MUTUAL FUNDS, INC. — THE FEEDER FUNDS |
Statements of Assets & Liabilities — (Continued) |
| December 31, 2013 |
| | | The Paradigm | | | The Medical | |
| | | Fund | | | Fund | |
| ASSETS: | | | | | | |
| Investments in the Master Portfolio, at value* | | $ | 1,274,991,821 | | | $ | 24,761,381 | |
| Receivable from Adviser | | | 28,003 | | | | 13,372 | |
| Receivable for Fund shares sold | | | 2,031,997 | | | | 95,580 | |
| Prepaid expenses and other assets | | | 46,046 | | | | 16,017 | |
| Total Assets | | | 1,277,097,867 | | | | 24,886,350 | |
| LIABILITIES: | | | | | | | | |
| Payable for Master Portfolio interest purchased | | | 723,870 | | | | 92,802 | |
| Payable to Directors and Officers | | | 40,026 | | | | 848 | |
| Payable for Fund shares repurchased | | | 1,308,127 | | | | 2,778 | |
| Payable for shareholder servicing fees | | | 210,819 | | | | 5,185 | |
| Payable for distribution fees | | | 235,776 | | | | 2,432 | |
| Accrued expenses and other liabilities | | | 248,023 | | | | 16,906 | |
| Total Liabilities | | | 2,766,641 | | | | 120,951 | |
| Net Assets | | $ | 1,274,331,226 | | | $ | 24,765,399 | |
| NET ASSETS CONSIST OF: | | | | | | | | |
| Paid in capital | | $ | 1,639,218,470 | | | $ | 17,706,625 | |
| Accumulated net investment income (loss) | | | (9,374,074 | ) | | | (39,072 | ) |
Accumulated net realized loss on investments and foreign currency | | | (784,065,009 | ) | | | (409,312 | ) |
| Net unrealized appreciation on: | | | | | | | | |
| Investments and foreign currency | | | 428,551,839 | | | | 7,507,158 | |
| Net Assets | | $ | 1,274,331,226 | | | $ | 24,765,399 | |
| CALCULATION OF NET ASSET VALUE PER SHARE — NO LOAD CLASS: | | | | | | | | |
| Net Assets | | $ | 597,745,813 | | | $ | 20,489,092 | |
| Shares outstanding | | | 17,403,442 | | | | 776,700 | |
| Net asset value per share (offering price and redemption price) | | $ | 34.35 | | | $ | 26.38 | |
| CALCULATION OF NET ASSET VALUE PER SHARE — ADVISOR CLASS A: | | | | | | | | |
| Net Assets | | $ | 204,547,909 | | | $ | 3,745,667 | |
| Shares outstanding | | | 6,063,145 | | | | 146,208 | |
| Net asset value per share (redemption price) | | $ | 33.74 | | | $ | 25.62 | |
Offering price per share ($33.74 divided by .9425 and $25.62 divided by .9425) | | $ | 35.80 | | | $ | 27.18 | |
| CALCULATION OF NET ASSET VALUE PER SHARE — ADVISOR CLASS C: | | | | | | | | |
| Net Assets | | $ | 138,355,248 | | | $ | 530,640 | |
| Shares outstanding | | | 4,273,062 | | | | 21,002 | |
| Net asset value per share (offering price and redemption price) | | $ | 32.38 | | | $ | 25.27 | |
| CALCULATION OF NET ASSET VALUE PER SHARE — INSTITUTIONAL CLASS: | | | | | | | | |
| Net Assets | | $ | 333,682,256 | | | | N/A | |
| Shares outstanding | | | 9,732,604 | | | | N/A | |
| Net asset value per share (offering price and redemption price) | | $ | 34.28 | | | | N/A | |
| | | |
| * | Each Feeder Fund invests all or generally all its assets directly in the corresponding Master Portfolio. The financial statements for the Master Portfolios, along with the portfolio of investments in securities, are contained elsewhere in this report and should be read in conjunction with the Feeder Funds’ financial statements. |
The accompanying notes are an integral part of these financial statements.
| KINETICS MUTUAL FUNDS, INC. — THE FEEDER FUNDS |
Statements of Assets & Liabilities — (Continued) |
| December 31, 2013 |
| | | The Small Cap | | | The Market | |
| | | Opportunities | | | Opportunities | |
| | | Fund | | | Fund | |
| ASSETS: | | | | | | |
| Investments in the Master Portfolio, at value* | | $ | 347,956,457 | | | $ | 66,544,589 | |
| Receivable from Adviser | | | 17,617 | | | | 12,279 | |
| Receivable for Fund shares sold | | | 4,544,890 | | | | 439,162 | |
| Prepaid expenses and other assets | | | 49,713 | | | | 30,946 | |
| Total Assets | | | 352,568,677 | | | | 67,026,976 | |
| LIABILITIES: | | | | | | | | |
| Payable for Master Portfolio interest purchased | | | 4,374,411 | | | | 429,653 | |
| Payable to Directors and Officers | | | 6,476 | | | | 2,123 | |
| Payable for Fund shares repurchased | | | 170,479 | | | | 9,509 | |
| Payable for shareholder servicing fees | | | 62,083 | | | | 13,154 | |
| Payable for distribution fees | | | 12,592 | | | | 9,487 | |
| Accrued expenses and other liabilities | | | 45,458 | | | | 21,990 | |
| Total Liabilities | | | 4,671,499 | | | | 485,916 | |
| Net Assets | | $ | 347,897,178 | | | $ | 66,541,060 | |
| NET ASSETS CONSIST OF: | | | | | | | | |
| Paid in capital | | $ | 425,896,369 | | | $ | 73,092,876 | |
| Accumulated net investment loss | | | (1,545,658 | ) | | | (634,488 | ) |
| Accumulated net realized loss on investments and | | | | | | | | |
| foreign currency | | | (160,403,930 | ) | | | (25,872,614 | ) |
| Net unrealized appreciation on: | | | | | | | | |
| Investments and foreign currency | | | 83,950,397 | | | | 19,955,286 | |
| Net Assets | | $ | 347,897,178 | | | $ | 66,541,060 | |
| CALCULATION OF NET ASSET VALUE PER SHARE — NO LOAD CLASS: | | | | | | | | |
| Net Assets | | $ | 277,816,235 | | | $ | 47,465,632 | |
| Shares outstanding | | | 6,924,835 | | | | 2,688,265 | |
| Net asset value per share (offering price and redemption price) | | $ | 40.12 | | | $ | 17.66 | |
| CALCULATION OF NET ASSET VALUE PER SHARE — ADVISOR CLASS A: | | | | | | | | |
| Net Assets | | $ | 21,871,101 | | | $ | 11,741,572 | |
| Shares outstanding | | | 555,297 | | | | 666,967 | |
| Net asset value per share (redemption price) | | $ | 39.39 | | | $ | 17.60 | |
| Offering price per share ($39.39 divided by .9425 and $17.60 | | | | | | | | |
| divided by .9425) | | $ | 41.79 | | | $ | 18.67 | |
| CALCULATION OF NET ASSET VALUE PER SHARE — ADVISOR CLASS C: | | | | | | | | |
| Net Assets | | $ | 7,177,920 | | | $ | 5,525,024 | |
| Shares outstanding | | | 186,297 | | | | 319,082 | |
| Net asset value per share (offering price and redemption price) | | $ | 38.53 | | | $ | 17.32 | |
| CALCULATION OF NET ASSET VALUE PER SHARE — INSTITUTIONAL CLASS: | | | | | | | | |
| Net Assets | | $ | 41,031,922 | | | $ | 1,808,832 | |
| Shares outstanding | | | 1,014,721 | | | | 101,951 | |
| Net asset value per share (offering price and redemption price) | | $ | 40.44 | | | $ | 17.74 | |
| | | |
| * | Each Feeder Fund invests all or generally all its assets directly in the corresponding Master Portfolio. The financial statements for the Master Portfolios, along with the portfolio of investments in securities, are contained elsewhere in this report and should be read in conjunction with the Feeder Funds’ financial statements. |
The accompanying notes are an integral part of these financial statements.
| KINETICS MUTUAL FUNDS, INC. — THE FEEDER FUNDS |
Statements of Assets & Liabilities — (Continued) |
| December 31, 2013 |
| | | The Alternative | | | The Multi- | |
| | | Income | | | Disciplinary | |
| | | Fund | | | Fund | |
| ASSETS: | | | | | | |
| Investments in the Master Portfolio, at value* | | $ | 23,404,038 | | | $ | 90,159,419 | |
| Receivable from Adviser | | | 30,442 | | | | 25,381 | |
| Receivable for Fund shares sold | | | 614,972 | | | | 706,548 | |
| Prepaid expenses and other assets | | | 51,734 | | | | 35,126 | |
| Total Assets | | | 24,101,186 | | | | 90,926,474 | |
| LIABILITIES: | | | | | | | | |
| Payable for Master Portfolio interest purchased | | | 598,640 | | | | 536,532 | |
| Payable to Directors and Officers | | | 661 | | | | 3,261 | |
| Payable for Fund shares repurchased | | | 16,332 | | | | 170,016 | |
| Payable for shareholder servicing fees | | | 3,638 | | | | 15,132 | |
| Payable for distribution fees | | | 4,203 | | | | 15,149 | |
| Accrued expenses and other liabilities | | | 15,496 | | | | 26,868 | |
| Total Liabilities | | | 638,970 | | | | 766,958 | |
| Net Assets | | $ | 23,462,216 | | | $ | 90,159,516 | |
| NET ASSETS CONSIST OF: | | | | | | | | |
| Paid in capital | | $ | 30,976,214 | | | $ | 89,334,979 | |
| Accumulated net investment loss | | | — | | | | (935,161 | ) |
| Accumulated net realized gain (loss) on investments, foreign currency, | | | | | | | | |
| written option contracts and securities sold short | | | (8,059,365 | ) | | | 1,154,295 | |
| Net unrealized appreciation (depreciation) on: | | | | | | | | |
| Investments and foreign currency | | | (58,254 | ) | | | (2,720,522 | ) |
| Written option contracts | | | 603,621 | | | | 3,325,925 | |
| Net Assets | | $ | 23,462,216 | | | $ | 90,159,516 | |
| CALCULATION OF NET ASSET VALUE PER SHARE — NO LOAD CLASS: | | | | | | | | |
| Net Assets | | $ | 11,848,293 | | | $ | 19,553,402 | |
| Shares outstanding | | | 134,820 | | | | 1,773,760 | |
| Net asset value per share (offering price and redemption price) | | $ | 87.88 | | | $ | 11.02 | |
| CALCULATION OF NET ASSET VALUE PER SHARE — ADVISOR CLASS A: | | | | | | | | |
| Net Assets | | $ | 2,898,277 | | | $ | 36,169,574 | |
| Shares outstanding | | | 33,035 | | | | 3,295,128 | |
| Net asset value per share (redemption price) | | $ | 87.73 | | | $ | 10.98 | |
| Offering price per share ($87.73 divided by .9425 and $10.98 | | | | | | | | |
| divided by .9425) | | $ | 93.08 | | | $ | 11.65 | |
| CALCULATION OF NET ASSET VALUE PER SHARE — ADVISOR CLASS C: | | | | | | | | |
| Net Assets | | $ | 1,862,034 | | | $ | 11,209,211 | |
| Shares outstanding | | | 21,626 | | | | 1,028,711 | |
| Net asset value per share (offering price and redemption price) | | $ | 86.10 | | | $ | 10.90 | |
| CALCULATION OF NET ASSET VALUE PER SHARE — INSTITUTIONAL CLASS: | | | | | | | | |
| Net Assets | | $ | 6,853,612 | | | $ | 23,227,329 | |
| Shares outstanding | | | 77,211 | | | | 2,100,232 | |
| Net asset value per share (offering price and redemption price) | | $ | 88.76 | | | $ | 11.06 | |
| | | |
| * | Each Feeder Fund invests all or generally all its assets directly in the corresponding Master Portfolio. The financial statements for the Master Portfolios, along with the portfolio of investments in securities, are contained elsewhere in this report and should be read in conjunction with the Feeder Funds’ financial statements. |
The accompanying notes are an integral part of these financial statements.
| KINETICS MUTUAL FUNDS, INC. — THE FEEDER FUNDS |
| Statements of Operations |
| For the Year Ended December 31, 2013 |
| | | The Internet | | | The Global | |
| | | Fund | | | Fund | |
| INVESTMENT INCOME (LOSS) ALLOCATED FROM MASTER PORTFOLIOS: | | | | | | |
| Dividends† | | $ | 847,497 | | | $ | 122,120 | |
| Interest | | | 1,962 | | | | 127 | |
| Income from securities lending | | | 73,283 | | | | 25,409 | |
| Expenses allocated from Master Portfolio | | | (2,377,165 | ) | | | (158,958 | ) |
| Net investment loss from Master Portfolio | | | (1,454,423 | ) | | | (11,302 | ) |
| EXPENSES: | | | | | | | | |
| Distribution fees — Advisor Class A | | | 7,545 | | | | 2,919 | |
| Distribution fees — Advisor Class C | | | 3,437 | | | | 7,349 | |
| Shareholder servicing fees — Advisor Class A | | | 7,545 | | | | 2,919 | |
| Shareholder servicing fees — Advisor Class C | | | 1,146 | | | | 2,450 | |
| Shareholder servicing fees — No Load Class | | | 423,791 | | | | 17,757 | |
| Transfer agent fees and expenses | | | 160,964 | | | | 20,096 | |
| Reports to shareholders | | | 30,118 | | | | 3,631 | |
| Administration fees | | | 62,729 | | | | 5,201 | |
| Professional fees | | | 22,218 | | | | 8,505 | |
| Directors’ and Officers’ fees and expenses | | | 17,420 | | | | 881 | |
| Registration fees | | | 54,850 | | | | 40,372 | |
| Fund accounting fees | | | 8,804 | | | | 436 | |
| Other expenses | | | 8,848 | | | | 386 | |
| Total expenses | | | 809,415 | | | | 112,902 | |
| Less, expense reimbursement | | | — | | | | (133,013 | ) |
| Net expenses | | | 809,415 | | | | (20,111 | ) |
| Net investment income (loss) | | | (2,263,838 | ) | | | 8,809 | |
| REALIZED AND UNREALIZED GAIN ON INVESTMENTS | | | | | | | | |
| ALLOCATED FROM MASTER PORTFOLIOS: | | | | | | | | |
| Net realized gain on: | | | | | | | | |
| Investments and foreign currency | | | 11,540,964 | | | | 66,668 | |
| Realized gain distributions received from other | | | | | | | | |
| investment companies | | | — | | | | 236 | |
| Net change in unrealized appreciation of: | | | | | | | | |
| Investments and foreign currency | | | 52,880,805 | | | | 2,169,965 | |
| Net gain on investments | | | 64,421,769 | | | | 2,236,869 | |
| Net increase in net assets resulting from operations | | $ | 62,157,931 | | | $ | 2,245,678 | |
| † Net of foreign taxes withheld of: | | $ | 9,877 | | | $ | 9,774 | |
The accompanying notes are an integral part of these financial statements.
| KINETICS MUTUAL FUNDS, INC. — THE FEEDER FUNDS |
Statements of Operations — (Continued) |
| For the Year Ended December 31, 2013 |
| | | The Paradigm | | | The Medical | |
| | | Fund | | | Fund | |
| INVESTMENT INCOME (LOSS) ALLOCATED FROM MASTER PORTFOLIOS: | | | | | | |
| Dividends† | | $ | 10,393,255 | | | $ | 244,110 | |
| Interest | | | 231,247 | | | | 78 | |
| Income from securities lending | | | 1,313,610 | | | | 61,508 | |
| Expenses allocated from Master Portfolio | | | (14,355,207 | ) | | | (309,972 | ) |
| Net investment income (loss) from Master Portfolio | | | (2,417,095 | ) | | | (4,276 | ) |
| EXPENSES: | | | | | | | | |
| Distribution fees — Advisor Class A | | | 419,676 | | | | 8,345 | |
| Distribution fees — Advisor Class C | | | 897,888 | | | | 3,786 | |
| Shareholder servicing fees — Advisor Class A | | | 419,676 | | | | 8,345 | |
| Shareholder servicing fees — Advisor Class C | | | 299,296 | | | | 1,262 | |
| Shareholder servicing fees — No Load Class | | | 1,272,685 | | | | 45,538 | |
| Shareholder servicing fees — Institutional Class | | | 539,736 | | | | — | |
| Transfer agent fees and expenses | | | 351,318 | | | | 27,404 | |
| Reports to shareholders | | | 163,837 | | | | 5,175 | |
| Administration fees | | | 386,775 | | | | 8,032 | |
| Professional fees | | | 88,306 | | | | 9,471 | |
| Directors’ and Officers’ fees and expenses | | | 101,696 | | | | 2,130 | |
| Registration fees | | | 90,099 | | | | 42,354 | |
| Fund accounting fees | | | 51,942 | | | | 1,077 | |
| Other expenses | | | 55,421 | | | | 1,146 | |
| Total expenses | | | 5,138,351 | | | | 164,065 | |
| Less, expense waiver for Institutional Class shareholder | | | | | | | | |
| servicing fees | | | (404,802 | ) | | | — | |
| Less, expense reimbursement | | | (819,825 | ) | | | (155,301 | ) |
| Net expenses | | | 3,913,724 | | | | 8,764 | |
| Net investment income (loss) | | | (6,330,819 | ) | | | (13,040 | ) |
| REALIZED AND UNREALIZED GAIN (LOSS) ON INVESTMENTS | | | | | | | | |
| ALLOCATED FROM MASTER PORTFOLIOS: | | | | | | | | |
| Net realized gain (loss) on: | | | | | | | | |
| Investments and foreign currency | | | 950,246 | | | | (340,728 | ) |
| Net change in unrealized appreciation of: | | | | | | | | |
| Investments and foreign currency | | | 384,565,800 | | | | 8,683,292 | |
| Net gain on investments | | | 385,516,046 | | | | 8,342,564 | |
| Net increase in net assets resulting from operations | | $ | 379,185,227 | | | $ | 8,329,524 | |
| † Net of foreign taxes withheld of: | | $ | 838,551 | | | $ | 14,620 | |
The accompanying notes are an integral part of these financial statements.
| KINETICS MUTUAL FUNDS, INC. — THE FEEDER FUNDS |
Statements of Operations — (Continued) |
| For the Year Ended December 31, 2013 |
| | | The Small Cap | | | The Market | |
| | | Opportunities | | | Opportunities | |
| | | Fund | | | Fund | |
| INVESTMENT LOSS ALLOCATED FROM MASTER PORTFOLIOS: | | | | | | |
| Dividends† | | $ | 2,195,713 | | | $ | 882,618 | |
| Interest | | | 1,606 | | | | 704 | |
| Income from securities lending | | | 165,846 | | | | 70,749 | |
| Expenses allocated from Master Portfolio | | | (2,339,784 | ) | | | (798,101 | ) |
| Net investment income from Master Portfolio | | | 23,381 | | | | 155,970 | |
| EXPENSES: | | | | | | | | |
| Distribution fees — Advisor Class A | | | 32,830 | | | | 21,567 | |
| Distribution fees — Advisor Class C | | | 33,208 | | | | 35,823 | |
| Shareholder servicing fees — Advisor Class A | | | 32,830 | | | | 21,567 | |
| Shareholder servicing fees — Advisor Class C | | | 11,069 | | | | 11,941 | |
| Shareholder servicing fees — No Load Class | | | 350,922 | | | | 101,649 | |
| Shareholder servicing fees — Institutional Class | | | 33,730 | | | | 6,038 | |
| Transfer agent fees and expenses | | | 60,223 | | | | 28,874 | |
| Reports to shareholders | | | 21,965 | | | | 9,524 | |
| Administration fees | | | 62,116 | | | | 22,734 | |
| Professional fees | | | 19,129 | | | | 12,202 | |
| Directors’ and Officers’ fees and expenses | | | 15,053 | | | | 5,448 | |
| Registration fees | | | 57,342 | | | | 48,823 | |
| Fund accounting fees | | | 7,733 | | | | 2,862 | |
| Other expenses | | | 5,524 | | | | 2,798 | |
| Total expenses | | | 743,674 | | | | 331,850 | |
| Less, expense waiver for Institutional Class shareholder | | | | | | | | |
| servicing fees | | | (25,298 | ) | | | (4,528 | ) |
| Less, expense reimbursement | | | (159,244 | ) | | | (137,931 | ) |
| Net expenses | | | 559,132 | | | | 189,391 | |
| Net investment loss | | | (535,751 | ) | | | (33,421 | ) |
| REALIZED AND UNREALIZED GAIN ON INVESTMENTS | | | | | | | | |
| ALLOCATED FROM MASTER PORTFOLIOS: | | | | | | | | |
| Net realized gain on: | | | | | | | | |
| Investments and foreign currency | | | 912,039 | | | | 4,578,478 | |
| Realized gain distributions received from other | | | | | | | | |
| investment companies | | | — | | | | 7,522 | |
| Net change in unrealized appreciation of: | | | | | | | | |
| Investments and foreign currency | | | 74,228,630 | | | | 16,099,778 | |
| Net gain on investments | | | 75,140,669 | | | | 20,685,778 | |
| Net increase in net assets resulting from operations | | $ | 74,604,918 | | | $ | 20,652,357 | |
| † Net of foreign taxes withheld of: | | $ | 131,491 | | | $ | 41,132 | |
The accompanying notes are an integral part of these financial statements.
| KINETICS MUTUAL FUNDS, INC. — THE FEEDER FUNDS |
Statements of Operations — (Continued) |
| For the Year Ended December 31, 2013 |
| | | The Alternative | | | The Multi- | |
| | | Income | | | Disciplinary | |
| | | Fund | | | Fund | |
| INVESTMENT INCOME (LOSS) ALLOCATED FROM MASTER PORTFOLIOS: | | | | | | |
| Dividends | | $ | 39,227 | | | $ | 243,437 | |
| Interest | | | 81,201 | | | | 2,563,416 | |
| Income from securities lending | | | 1,795 | | | | 11,975 | |
| Expenses allocated from Master Portfolio | | | (216,571 | ) | | | (1,200,651 | ) |
| Net investment income (loss) from Master Portfolio | | | (94,348 | ) | | | 1,618,177 | |
| EXPENSES: | | | | | | | | |
| Distribution fees — Advisor Class A | | | 5,456 | | | | 104,788 | |
| Distribution fees — Advisor Class C | | | 12,641 | | | | 77,096 | |
| Shareholder servicing fees — Advisor Class A | | | 5,456 | | | | 104,788 | |
| Shareholder servicing fees — Advisor Class C | | | 4,214 | | | | 25,699 | |
| Shareholder servicing fees — No Load Class | | | 25,109 | | | | 50,372 | |
| Shareholder servicing fees — Institutional Class | | | 6,939 | | | | 29,193 | |
| Transfer agent fees and expenses | | | 27,671 | | | | 36,526 | |
| Reports to shareholders | | | 20,329 | | | | 15,803 | |
| Administration fees | | | 6,297 | | | | 34,609 | |
| Professional fees | | | 14,527 | | | | 14,935 | |
| Directors’ and Officers’ fees and expenses | | | 1,630 | | | | 8,633 | |
| Registration fees | | | 54,702 | | | | 56,223 | |
| Fund accounting fees | | | 842 | | | | 4,361 | |
| Other expenses | | | 780 | | | | 3,265 | |
| Total expenses | | | 186,593 | | | | 566,291 | |
| Less, expense waiver for Institutional Class shareholder | | | | | | | | |
| servicing fees | | | (5,204 | ) | | | (21,895 | ) |
| Less, expense reimbursement | | | (221,680 | ) | | | (289,857 | ) |
| Net expenses | | | (40,291 | ) | | | 254,539 | |
| Net investment income (loss) | | | (54,057 | ) | | | 1,363,638 | |
| REALIZED AND UNREALIZED GAIN (LOSS) ON INVESTMENTS | | | | | | | | |
| ALLOCATED FROM MASTER PORTFOLIOS: | | | | | | | | |
| Net realized gain (loss) on: | | | | | | | | |
| Investments and foreign currency | | | 19,300 | | | | 1,105,640 | |
| Written option contracts expired or closed | | | 310,987 | | | | 1,372,837 | |
| Securities sold short | | | — | | | | (141,272 | ) |
| Realized gain distributions received from other | | | | | | | | |
| investment companies | | | 1,067 | | | | 34,280 | |
| Net change in unrealized appreciation (depreciation) of: | | | | | | | | |
| Investments and foreign currency | | | (8,653 | ) | | | (1,604,855 | ) |
| Written option contracts | | | 603,453 | | | | 875,143 | |
| Securities sold short | | | — | | | | (10,192 | ) |
| Net gain on investments | | | 926,154 | | | | 1,631,581 | |
| Net increase in net assets resulting from operations | | $ | 872,097 | | | $ | 2,995,219 | |
The accompanying notes are an integral part of these financial statements.
| KINETICS MUTUAL FUNDS, INC. — THE FEEDER FUNDS |
| Statements of Changes in Net Assets |
| | | The Internet Fund | | | The Global Fund | |
| | | For the | | | For the | | | For the | | | For the | |
| | | Year Ended | | | Year Ended | | | Year Ended | | | Year Ended | |
| | | December 31, | | | December 31, | | | December 31, | | | December 31, | |
| | | 2013 | | | 2012 | | | 2013 | | | 2012 | |
| OPERATIONS: | | | | | | | | | | | | |
| Net investment income (loss) | | $ | (2,263,838 | ) | | $ | (433,729 | ) | | $ | 8,809 | | | $ | 39,580 | |
| Net realized gain on sale of | | | | | | | | | | | | | | | | |
| investments, foreign currency and | | | | | | | | | | | | | | | | |
| distributions received from other | | | | | | | | | | | | | | | | |
| investment companies | | | 11,540,964 | | | | 4,839,728 | | | | 66,904 | | | | 104,946 | |
| Net change in unrealized appreciation | | | | | | | | | | | | | | | | |
| of investments and foreign | | | | | | | | | | | | | | | | |
| currency | | | 52,880,805 | | | | 19,949,877 | | | | 2,169,965 | | | | 1,011,339 | |
| Net increase in net assets resulting | | | | | | | | | | | | | | | | |
| from operations | | | 62,157,931 | | | | 24,355,876 | | | | 2,245,678 | | | | 1,155,865 | |
| DISTRIBUTIONS TO SHAREHOLDERS — | | | | | | | | | | | | | | | | |
| NO LOAD CLASS: | | | | | | | | | | | | | | | | |
| Net investment income | | | — | | | | — | | | | (9,185 | ) | | | (123,429 | ) |
| Net realized gains | | | (8,399,207 | ) | | | (5,207,093 | ) | | | — | | | | — | |
| Total distributions | | | (8,399,207 | ) | | | (5,207,093 | ) | | | (9,185 | ) | | | (123,429 | ) |
| DISTRIBUTIONS TO SHAREHOLDERS — | | | | | | | | | | | | | | | | |
| ADVISOR CLASS A: | | | | | | | | | | | | | | | | |
| Net investment income | | | — | | | | — | | | | (2,107 | ) | | | (24,753 | ) |
| Net realized gains | | | (264,840 | ) | | | (46,661 | ) | | | — | | | | — | |
| Total distributions | | | (264,840 | ) | | | (46,661 | ) | | | (2,107 | ) | | | (24,753 | ) |
| DISTRIBUTIONS TO SHAREHOLDERS — | | | | | | | | | | | | | | | | |
| ADVISOR CLASS C: | | | | | | | | | | | | | | | | |
| Net investment income | | | — | | | | — | | | | (1,648 | ) | | | (8,334 | ) |
| Net realized gains | | | (47,335 | ) | | | (6,516 | ) | | | — | | | | — | |
| Total distributions | | | (47,335 | ) | | | (6,516 | ) | | | (1,648 | ) | | | (8,334 | ) |
| CAPITAL SHARE TRANSACTIONS — | | | | | | | | | | | | | | | | |
| NO LOAD CLASS: | | | | | | | | | | | | | | | | |
| Proceeds from shares sold | | | 26,409,652 | | | | 46,371,634 | | | | 3,089,656 | | | | 1,878,282 | |
| Redemption fees | | | 4,961 | | | | 4,548 | | | | 68 | | | | 6 | |
| Proceeds from shares issued to holders | | | | | | | | | | | | | | | | |
| in reinvestment of dividends | | | 8,096,254 | | | | 5,050,816 | | | | 8,850 | | | | 115,580 | |
| Cost of shares redeemed | | | (69,661,189 | ) | | | (19,118,564 | ) | | | (1,183,302 | ) | | | (1,366,910 | ) |
| Net increase (decrease) in net assets | | | | | | | | | | | | | | | | |
| resulting from capital share | | | | | | | | | | | | | | | | |
| transactions | | | (35,150,322 | ) | | | 32,308,434 | | | | 1,915,272 | | | | 626,958 | |
| CAPITAL SHARE TRANSACTIONS — | | | | | | | | | | | | | | | | |
| ADVISOR CLASS A: | | | | | | | | | | | | | | | | |
| Proceeds from shares sold | | | 4,387,670 | | | | 509,770 | | | | 1,186,661 | | | | 1,116,949 | |
| Redemption fees | | | 550 | | | | — | | | | 40 | | | | 385 | |
| Proceeds from shares issued to holders | | | | | | | | | | | | | | | | |
| in reinvestment of dividends | | | 221,753 | | | | 38,332 | | | | 1,866 | | | | 22,174 | |
| Cost of shares redeemed | | | (1,362,298 | ) | | | (394,222 | ) | | | (576,135 | ) | | | (591,598 | ) |
| Net increase in net assets resulting | | | | | | | | | | | | | | | | |
| from capital share transactions | | | 3,247,675 | | | | 153,880 | | | | 612,432 | | | | 547,910 | |
The accompanying notes are an integral part of these financial statements.
| KINETICS MUTUAL FUNDS, INC. — THE FEEDER FUNDS |
Statements of Changes in Net Assets — (Continued) |
| | | The Internet Fund | �� | | The Global Fund | |
| | | For the | | | For the | | | For the | | | For the | |
| | | Year Ended | | | Year Ended | | | Year Ended | | | Year Ended | |
| | | December 31, | | | December 31, | | | December 31, | | | December 31, | |
| | | 2013 | | | 2012 | | | 2013 | | | 2012 | |
| CAPITAL SHARE TRANSACTIONS — | | | | | | | | | | | | |
| ADVISOR CLASS C: | | | | | | | | | | | | |
| Proceeds from shares sold | | $ | 604,756 | | | $ | 82,925 | | | $ | 914,460 | | | $ | 238,490 | |
| Redemption fees | | | — | | | | — | | | | — | | | | — | |
| Proceeds from shares issued to holders | | | | | | | | | | | | | | | | |
| in reinvestment of dividends | | | 35,987 | | | | 4,595 | | | | 1,580 | | | | 7,789 | |
| Cost of shares redeemed | | | (34,603 | ) | | | (25,134 | ) | | | (2,000 | ) | | | (8,967 | ) |
| Net increase in net assets | | | | | | | | | | | | | | | | |
| resulting from capital | | | | | | | | | | | | | | | | |
| share transactions | | | 606,140 | | | | 62,386 | | | | 914,040 | | | | 237,312 | |
| TOTAL INCREASE IN NET ASSETS: | | | 22,150,042 | | | | 51,620,306 | | | | 5,674,482 | | | | 2,411,529 | |
| NET ASSETS: | | | | | | | | | | | | | | | | |
| Beginning of year | | | 156,600,428 | | | | 104,980,122 | | | | 6,545,462 | | | | 4,133,933 | |
| End of year* | | $ | 178,750,470 | | | $ | 156,600,428 | | | $ | 12,219,944 | | | $ | 6,545,462 | |
| * Including undistributed net investment | | | | | | | | | | | | | | | | |
| income (loss) of: | | $ | 108,097 | | | $ | 43,841 | | | $ | (28,646 | ) | | $ | (78,186 | ) |
| CHANGES IN SHARES OUTSTANDING — | | | | | | | | | | | | | | | | |
| NO LOAD CLASS: | | | | | | | | | | | | | | | | |
| Shares sold | | | 525,397 | | | | 1,069,839 | | | | 584,835 | | | | 427,158 | |
| Shares issued in reinvestments of | | | | | | | | | | | | | | | | |
| dividends and distributions | | | 137,016 | | | | 118,341 | | | | 1,468 | | | | 24,697 | |
| Shares redeemed | | | (1,345,154 | ) | | | (461,243 | ) | | | (224,143 | ) | | | (301,524 | ) |
| Net increase (decrease) in | | | | | | | | | | | | | | | | |
| shares outstanding | | | (682,741 | ) | | | 726,937 | | | | 362,160 | | | | 150,331 | |
| CHANGES IN SHARES OUTSTANDING — | | | | | | | | | | | | | | | | |
| ADVISOR CLASS A: | | | | | | | | | | | | | | | | |
| Shares sold | | | 83,265 | | | | 12,322 | | | | 208,374 | | | | 258,844 | |
| Shares issued in reinvestments of | | | | | | | | | | | | | | | | |
| dividends and distributions | | | 3,845 | | | | 917 | | | | 310 | | | | 4,738 | |
| Shares redeemed | | | (24,534 | ) | | | (10,094 | ) | | | (110,866 | ) | | | (131,342 | ) |
| Net increase in shares | | | | | | | | | | | | | | | | |
| outstanding | | | 62,576 | | | | 3,145 | | | | 97,818 | | | | 132,240 | |
| CHANGES IN SHARES OUTSTANDING — | | | | | | | | | | | | | | | | |
| ADVISOR CLASS C: | | | | | | | | | | | | | | | | |
| Shares sold | | | 12,031 | | | | 2,130 | | | | 175,531 | | | | 54,697 | |
| Shares issued in reinvestments of | | | | | | | | | | | | | | | | |
| dividends and distributions | | | 652 | | | | 114 | | | | 269 | | | | 1,693 | |
| Shares redeemed | | | (731 | ) | | | (674 | ) | | | (347 | ) | | | (2,056 | ) |
| Net increase in shares | | | | | | | | | | | | | | | | |
| outstanding | | | 11,952 | | | | 1,570 | | | | 175,453 | | | | 54,334 | |
The accompanying notes are an integral part of these financial statements.
| KINETICS MUTUAL FUNDS, INC. — THE FEEDER FUNDS |
Statements of Changes in Net Assets — (Continued) |
| | | The Paradigm Fund | | | The Medical Fund | |
| | | For the | | | For the | | | For the | | | For the | |
| | | Year Ended | | | Year Ended | | | Year Ended | | | Year Ended | |
| | | December 31, | | | December 31, | | | December 31, | | | December 31, | |
| | | 2013 | | | 2012 | | | 2013 | | | 2012 | |
| OPERATIONS: | | | | | | | | | | | | |
| Net investment income (loss) | | $ | (6,330,819 | ) | | $ | 1,073,108 | | | $ | (13,040 | ) | | $ | 305,849 | |
| Net realized gain (loss) on sale of | | | | | | | | | | | | | | | | |
| investments and foreign currency | | | 950,246 | | | | 37,284,162 | | | | (340,728 | ) | | | 522,636 | |
| Net change in unrealized appreciation of | | | | | | | | | | | | | | | | |
| investments and foreign currency | | | 384,565,800 | | | | 127,689,744 | | | | 8,683,292 | | | | 852,539 | |
| Net increase in net assets resulting | | | | | | | | | | | | | | | | |
| from operations | | | 379,185,227 | | | | 166,047,014 | | | | 8,329,524 | | | | 1,681,024 | |
| DISTRIBUTIONS TO SHAREHOLDERS — | | | | | | | | | | | | | | | | |
| NO LOAD CLASS: | | | | | | | | | | | | | | | | |
| Net investment income | | | (3,649,194 | ) | | | (2,091,661 | ) | | | (47,302 | ) | | | (256,326 | ) |
| Net realized gains | | | — | | | | — | | | | (118,630 | ) | | | (1,561,461 | ) |
| Total distributions | | | (3,649,194 | ) | | | (2,091,661 | ) | | | (165,932 | ) | | | (1,817,787 | ) |
| DISTRIBUTIONS TO SHAREHOLDERS — | | | | | | | | | | | | | | | | |
| ADVISOR CLASS A: | | | | | | | | | | | | | | | | |
| Net investment income | | | (958,523 | ) | | | (146,854 | ) | | | (4,406 | ) | | | (40,937 | ) |
| Net realized gains | | | — | | | | — | | | | (22,398 | ) | | | (297,758 | ) |
| Total distributions | | | (958,523 | ) | | | (146,854 | ) | | | (26,804 | ) | | | (338,695 | ) |
| DISTRIBUTIONS TO SHAREHOLDERS — | | | | | | | | | | | | | | | | |
| ADVISOR CLASS C: | | | | | | | | | | | | | | | | |
| Net investment income | | | (111,115 | ) | | | — | | | | (632 | ) | | | (4,623 | ) |
| Net realized gains | | | — | | | | — | | | | (3,216 | ) | | | (51,491 | ) |
| Total distributions | | | (111,115 | ) | | | — | | | | (3,848 | ) | | | (56,114 | ) |
| DISTRIBUTIONS TO SHAREHOLDERS — | | | | | | | | | | | | | | | | |
| INSTITUTIONAL CLASS: | | | | | | | | | | | | | | | | |
| Net investment income | | | (2,547,950 | ) | | | (1,577,657 | ) | | | N/A | | | | N/A | |
| Net realized gains | | | — | | | | — | | | | N/A | | | | N/A | |
| Total distributions | | | (2,547,950 | ) | | | (1,577,657 | ) | | | N/A | | | | N/A | |
| CAPITAL SHARE TRANSACTIONS — | | | | | | | | | | | | | | | | |
| NO LOAD CLASS: | | | | | | | | | | | | | | | | |
| Proceeds from shares sold | | | 128,552,091 | | | | 64,026,639 | | | | 5,499,559 | | | | 726,629 | |
| Redemption fees | | | 28,908 | | | | 3,832 | | | | 2,309 | | | | 179 | |
| Proceeds from shares issued to holders | | | | | | | | | | | | | | | | |
| in reinvestment of dividends | | | 3,421,586 | | | | 1,971,657 | | | | 163,327 | | | | 1,796,827 | |
| Cost of shares redeemed | | | (129,139,004 | ) | | | (161,429,928 | ) | | | (6,191,262 | ) | | | (4,192,023 | ) |
| Net increase (decrease) in net assets | | | | | | | | | | | | | | | | |
| resulting from capital share | | | | | | | | | | | | | | | | |
| transactions | | | 2,863,581 | | | | (95,427,800 | ) | | | (526,067 | ) | | | (1,668,388 | ) |
| CAPITAL SHARE TRANSACTIONS — | | | | | | | | | | | | | | | | |
| ADVISOR CLASS A: | | | | | | | | | | | | | | | | |
| Proceeds from shares sold | | | 41,783,343 | | | | 18,086,486 | | | | 2,015,743 | | | | 313,634 | |
| Redemption fees | | | 4,446 | | | | 796 | | | | 962 | | | | 2 | |
| Proceeds from shares issued to holders | | | | | | | | | | | | | | | | |
| in reinvestment of dividends | | | 869,957 | | | | 132,398 | | | | 16,802 | | | | 201,396 | |
| Cost of shares redeemed | | | (32,587,410 | ) | | | (57,418,386 | ) | | | (2,055,321 | ) | | | (1,109,278 | ) |
| Net increase (decrease) in net | | | | | | | | | | | | | | | | |
| assets resulting from capital | | | | | | | | | | | | | | | | |
| share transactions | | | 10,070,336 | | | | (39,198,706 | ) | | | (21,814 | ) | | | (594,246 | ) |
The accompanying notes are an integral part of these financial statements.
| KINETICS MUTUAL FUNDS, INC. — THE FEEDER FUNDS |
Statements of Changes in Net Assets — (Continued) |
| | | The Paradigm Fund | | | The Medical Fund | |
| | | For the | | | For the | | | For the | | | For the | |
| | | Year Ended | | | Year Ended | | | Year Ended | | | Year Ended | |
| | | December 31, | | | December 31, | | | December 31, | | | December 31, | |
| | | 2013 | | | 2012 | | | 2013 | | | 2012 | |
| CAPITAL SHARE TRANSACTIONS — | | | | | | | | | | | | |
| ADVISOR CLASS C: | | | | | | | | | | | | |
| Proceeds from shares sold | | $ | 10,763,761 | | | $ | 3,849,753 | | | $ | 110,624 | | | $ | 36,059 | |
| Redemption fees | | | 4 | | | | 52 | | | | — | | | | — | |
| Proceeds from shares issued to holders | | | | | | | | | | | | | | | | |
| in reinvestment of dividends | | | 100,621 | | | | — | | | | 1,975 | | | | 29,798 | |
| Cost of shares redeemed | | | (15,948,545 | ) | | | (25,024,304 | ) | | | (219,103 | ) | | | (181,789 | ) |
| Net decrease in net assets resulting | | | | | | | | | | | | | | | | |
| from capital share transactions | | | (5,084,159 | ) | | | (21,174,499 | ) | | | (106,504 | ) | | | (115,932 | ) |
| CAPITAL SHARE TRANSACTIONS — | | | | | | | | | | | | | | | | |
| INSTITUTIONAL CLASS: | | | | | | | | | | | | | | | | |
| Proceeds from shares sold | | | 110,215,275 | | | | 81,609,346 | | | | N/A | | | | N/A | |
| Redemption fees | | | 5,525 | | | | 6,189 | | | | N/A | | | | N/A | |
| Proceeds from shares issued to holders | | | | | | | | | | | | | | | | |
| in reinvestment of dividends | | | 1,781,955 | | | | 1,311,574 | | | | N/A | | | | N/A | |
| Cost of shares redeemed | | | (63,765,372 | ) | | | (57,342,208 | ) | | | N/A | | | | N/A | |
| Net increase in net assets resulting | | | | | | | | | | | | | | | | |
| from capital share transactions | | | 48,237,383 | | | | 25,584,901 | | | | N/A | | | | N/A | |
| TOTAL INCREASE (DECREASE) IN | | | | | | | | | | | | | | | | |
| NET ASSETS: | | | 428,005,586 | | | | 32,014,738 | | | | 7,478,555 | | | | (2,910,138 | ) |
| NET ASSETS: | | | | | | | | | | | | | | | | |
| Beginning of year | | | 846,325,640 | | | | 814,310,902 | | | | 17,286,844 | | | | 20,196,982 | |
| End of year* | | $ | 1,274,331,226 | | | $ | 846,325,640 | | | $ | 24,765,399 | | | $ | 17,286,844 | |
| * Including undistributed net investment | | | | | | | | | | | | | | | | |
| income (loss) of: | | $ | (9,374,074 | ) | | $ | (9,449,805 | ) | | $ | (39,072 | ) | | $ | 28,372 | |
| CHANGES IN SHARES OUTSTANDING — | | | | | | | | | | | | | | | | |
| NO LOAD CLASS: | | | | | | | | | | | | | | | | |
| Shares sold | | | 4,367,391 | | | | 2,761,190 | | | | 245,850 | | | | 36,993 | |
| Shares issued in reinvestments of | | | | | | | | | | | | | | | | |
| dividends and distributions | | | 100,105 | | | | 83,157 | | | | 6,196 | | | | 101,230 | |
| Shares redeemed | | | (4,435,343 | ) | | | (7,210,869 | ) | | | (275,053 | ) | | | (211,946 | ) |
| Net increase (decrease) in | | | | | | | | | | | | | | | | |
| shares outstanding | | | 32,153 | | | | (4,366,522 | ) | | | (23,007 | ) | | | (73,723 | ) |
| CHANGES IN SHARES OUTSTANDING — | | | | | | | | | | | | | | | | |
| ADVISOR CLASS A: | | | | | | | | | | | | | | | | |
| Shares sold | | | 1,418,522 | | | | 793,709 | | | | 90,529 | | | | 16,529 | |
| Shares issued in reinvestments of | | | | | | | | | | | | | | | | |
| dividends and distributions | | | 25,915 | | | | 5,675 | | | | 656 | | | | 11,668 | |
| Shares redeemed | | | (1,136,718 | ) | | | (2,600,387 | ) | | | (94,006 | ) | | | (56,326 | ) |
| Net increase (decrease) in shares | | | | | | | | | | | | | | | | |
| outstanding | | | 307,719 | | | | (1,801,003 | ) | | | (2,821 | ) | | | (28,129 | ) |
The accompanying notes are an integral part of these financial statements.
| KINETICS MUTUAL FUNDS, INC. — THE FEEDER FUNDS |
Statements of Changes in Net Assets — (Continued) |
| | | The Paradigm Fund | | | The Medical Fund | |
| | | For the | | | For the | | | For the | | | For the | |
| | | Year Ended | | | Year Ended | | | Year Ended | | | Year Ended | |
| | | December 31, | | | December 31, | | | December 31, | | | December 31, | |
| | | 2013 | | | 2012 | | | 2013 | | | 2012 | |
| CHANGES IN SHARES OUTSTANDING — | | | | | | | | | | | | |
| ADVISOR CLASS C: | | | | | | | | | | | | |
| Shares sold | | $ | 385,726 | | | $ | 180,440 | | | $ | 4,926 | | | $ | 1,995 | |
| Shares issued in reinvestments of | | | | | | | | | | | | | | | | |
| dividends and distributions | | | 3,123 | | | | — | | | | 78 | | | | 1,741 | |
| Shares redeemed | | | (590,232 | ) | | | (1,172,251 | ) | | | (10,184 | ) | | | (9,532 | ) |
| Net decrease in shares | | | | | | | | | | | | | | | | |
| outstanding | | | (201,383 | ) | | | (991,811 | ) | | | (5,180 | ) | | | (5,796 | ) |
| CHANGES IN SHARES OUTSTANDING — | | | | | | | | | | | | | | | | |
| INSTITUTIONAL CLASS: | | | | | | | | | | | | | | | | |
| Shares sold | | | 3,816,087 | | | | 3,733,029 | | | | N/A | | | | N/A | |
| Shares issued in reinvestments of | | | | | | | | | | | | | | | | |
| dividends and distributions | | | 52,226 | | | | 55,434 | | | | N/A | | | | N/A | |
| Shares redeemed | | | (2,177,559 | ) | | | (2,534,864 | ) | | | N/A | | | | N/A | |
| Net increase in shares | | | | | | | | | | | | | | | | |
| outstanding | | | 1,690,754 | | | | 1,253,599 | | | | N/A | | | | N/A | |
The accompanying notes are an integral part of these financial statements.
| KINETICS MUTUAL FUNDS, INC. — THE FEEDER FUNDS |
Statements of Changes in Net Assets — (Continued) |
| | | The Small Cap | | | The Market | |
| | | Opportunities Fund | | | Opportunities Fund | |
| | | For the | | | For the | | | For the | | | For the | |
| | | Year Ended | | | Year Ended | | | Year Ended | | | Year Ended | |
| | | December 31, | | | December 31, | | | December 31, | | | December 31, | |
| | | 2013 | | | 2012 | | | 2013 | | | 2012 | |
| OPERATIONS: | | | | | | | | | | | | |
| Net investment income (loss) | | $ | (535,751 | ) | | $ | 30,632 | | | $ | (33,421 | ) | | $ | 52,756 | |
| Net realized gain on sale of investments, | | | | | | | | | | | | | | | | |
| foreign currency and distributions | | | | | | | | | | | | | | | | |
| received from other investment | | | | | | | | | | | | | | | | |
| companies | | | 912,039 | | | | 7,834,606 | | | | 4,586,000 | | | | 4,862,677 | |
| Net change in unrealized appreciation | | | | | | | | | | | | | | | | |
| of investments and foreign | | | | | | | | | | | | | | | | |
| currency | | | 74,228,630 | | | | 12,106,767 | | | | 16,099,778 | | | | 2,198,282 | |
| Net increase in net assets resulting | | | | | | | | | | | | | | | | |
| from operations | | | 74,604,918 | | | | 19,972,005 | | | | 20,652,357 | | | | 7,113,715 | |
| DISTRIBUTIONS TO SHAREHOLDERS — | | | | | | | | | | | | | | | | |
| NO LOAD CLASS: | | | | | | | | | | | | | | | | |
| Net investment income | | | — | | | | — | | | | (173,362 | ) | | | (532,781 | ) |
| Total distributions | | | — | | | | — | | | | (173,362 | ) | | | (532,781 | ) |
| DISTRIBUTIONS TO SHAREHOLDERS — | | | | | | | | | | | | | | | | |
| ADVISOR CLASS A: | | | | | | | | | | | | | | | | |
| Net investment income | | | — | | | | — | | | | (43,317 | ) | | | (84,630 | ) |
| Total distributions | | | — | | | | — | | | | (43,317 | ) | | | (84,630 | ) |
| DISTRIBUTIONS TO SHAREHOLDERS — | | | | | | | | | | | | | | | | |
| ADVISOR CLASS C: | | | | | | | | | | | | | | | | |
| Net investment income | | | — | | | | — | | | | (20,715 | ) | | | (33,350 | ) |
| Total distributions | | | — | | | | — | | | | (20,715 | ) | | | (33,350 | ) |
| DISTRIBUTIONS TO SHAREHOLDERS — | | | | | | | | | | | | | | | | |
| INSTITUTIONAL CLASS: | | | | | | | | | | | | | | | | |
| Net investment income | | | — | | | | — | | | | (6,619 | ) | | | (4,195 | ) |
| Total distributions | | | — | | | | — | | | | (6,619 | ) | | | (4,195 | ) |
| CAPITAL SHARE TRANSACTIONS — | | | | | | | | | | | | | | | | |
| NO LOAD CLASS: | | | | | | | | | | | | | | | | |
| Proceeds from shares sold | | | 191,484,979 | | | | 1,841,937 | | | | 12,840,687 | | | | 630,318 | |
| Redemption fees | | | 16,105 | | | | 434 | | | | 2,752 | | | | 455 | |
| Proceeds from shares issued to holders | | | | | | | | | | | | | | | | |
| in reinvestment of dividends | | | — | | | | — | | | | 172,044 | | | | 531,266 | |
| Cost of shares redeemed | | | (37,876,316 | ) | | | (21,727,814 | ) | | | (13,323,220 | ) | | | (3,055,029 | ) |
| Net increase (decrease) in net assets | | | | | | | | | | | | | | | | |
| resulting from capital | | | | | | | | | | | | | | | | |
| share transactions | | | 153,624,768 | | | | (19,885,443 | ) | | | (307,737 | ) | | | (1,892,990 | ) |
| CAPITAL SHARE TRANSACTIONS — | | | | | | | | | | | | | | | | |
| ADVISOR CLASS A: | | | | | | | | | | | | | | | | |
| Proceeds from shares sold | | | 11,072,084 | | | | 712,257 | | | | 5,568,364 | | | | 400,180 | |
| Redemption fees | | | 2,704 | | | | 23 | | | | 1,711 | | | | 280 | |
| Proceeds from shares issued to holders | | | | | | | | | | | | | | | | |
| in reinvestment of dividends | | | — | | | | — | | | | 34,665 | | | | 69,282 | |
| Cost of shares redeemed | | | (2,330,561 | ) | | | (2,129,011 | ) | | | (3,495,307 | ) | | | (3,721,538 | ) |
| Net increase (decrease) in net assets | | | | | | | | | | | | | | | | |
| resulting from capital share | | | | | | | | | | | | | | | | |
| transactions | | | 8,744,227 | | | | (1,416,731 | ) | | | 2,109,433 | | | | (3,251,796 | ) |
The accompanying notes are an integral part of these financial statements.
| KINETICS MUTUAL FUNDS, INC. — THE FEEDER FUNDS |
Statements of Changes in Net Assets — (Continued) |
| | | The Small Cap | | | The Market | |
| | | Opportunities Fund | | | Opportunities Fund | |
| | | For the | | | For the | | | For the | | | For the | |
| | | Year Ended | | | Year Ended | | | Year Ended | | | Year Ended | |
| | | December 31, | | | December 31, | | | December 31, | | | December 31, | |
| | | 2013 | | | 2012 | | | 2013 | | | 2012 | |
| CAPITAL SHARE TRANSACTIONS — | | | | | | | | | | | | |
| ADVISOR CLASS C: | | | | | | | | | | | | |
| Proceeds from shares sold | | $ | 3,682,497 | | | $ | 162,437 | | | $ | 378,584 | | | $ | 162,143 | |
| Redemption fees | | | 716 | | | | — | | | | 199 | | | | 101 | |
| Proceeds from shares issued to holders | | | | | | | | | | | | | | | | |
| in reinvestment of dividends | | | — | | | | — | | | | 18,554 | | | | 29,824 | |
| Cost of shares redeemed | | | (937,616 | ) | | | (634,738 | ) | | | (546,143 | ) | | | (1,117,534 | ) |
| Net increase (decrease) in net assets | | | | | | | | | | | | | | | | |
| resulting from capital | | | | | | | | | | | | | | | | |
| share transactions | | | 2,745,597 | | | | (472,301 | ) | | | (148,806 | ) | | | (925,466 | ) |
| CAPITAL SHARE TRANSACTIONS — | | | | | | | | | | | | | | | | |
| INSTITUTIONAL CLASS: | | | | | | | | | | | | | | | | |
| Proceeds from shares sold | | | 36,054,133 | | | | 2,959,815 | | | | 13,645,790 | | | | 57,706 | |
| Redemption fees | | | — | | | | 532 | | | | 1,462 | | | | — | |
| Proceeds from shares issued to holders | | | | | | | | | | | | | | | | |
| in reinvestment of dividends | | | — | | | | — | | | | 6,468 | | | | 1,417 | |
| Cost of shares redeemed | | | (9,399,860 | ) | | | (2,620,000 | ) | | | (12,782,149 | ) | | | (48,403 | ) |
| Net increase in net assets resulting | | | | | | | | | | | | | | | | |
| from capital share transactions | | | 26,654,273 | | | | 340,347 | | | | 871,571 | | | | 10,720 | |
| TOTAL INCREASE (DECREASE) IN | | | | | | | | | | | | | | | | |
| NET ASSETS: | | | 266,373,783 | | | | (1,462,123 | ) | | | 22,932,805 | | | | 399,227 | |
| NET ASSETS: | | | | | | | | | | | | | | | | |
| Beginning of year | | | 81,523,395 | | | | 82,985,518 | | | | 43,608,255 | | | | 43,209,028 | |
| End of year* | | $ | 347,897,178 | | | $ | 81,523,395 | | | $ | 66,541,060 | | | $ | 43,608,255 | |
| * Including undistributed net investment | | | | | | | | | | | | | | | | |
| loss of: | | $ | (1,545,658 | ) | | $ | (747,038 | ) | | $ | (634,488 | ) | | $ | (1,156,606 | ) |
| CHANGES IN SHARES OUTSTANDING — | | | | | | | | | | | | | | | | |
| NO LOAD CLASS: | | | | | | | | | | | | | | | | |
| Shares sold | | | 5,488,513 | | | | 80,246 | | | | 787,628 | | | | 54,575 | |
| Shares issued in reinvestments of | | | | | | | | | | | | | | | | |
| dividends and distributions | | | — | | | | — | | | | 9,814 | | | | 44,495 | |
| Shares redeemed | | | (1,104,650 | ) | | | (953,945 | ) | | | (835,192 | ) | | | (263,041 | ) |
| Net increase (decrease) in | | | | | | | | | | | | | | | | |
| shares outstanding | | | 4,383,863 | | | | (873,699 | ) | | | (37,750 | ) | | | (163,971 | ) |
| CHANGES IN SHARES OUTSTANDING — | | | | | | | | | | | | | | | | |
| ADVISOR CLASS A: | | | | | | | | | | | | | | | | |
| Shares sold | | | 321,977 | | | | 30,501 | | | | 358,219 | | | | 34,816 | |
| Shares issued in reinvestments of | | | | | | | | | | | | | | | | |
| dividends and distributions | | | — | | | | — | | | | 1,983 | | | | 5,807 | |
| Shares redeemed | | | (71,873 | ) | | | (95,419 | ) | | | (233,140 | ) | | | (325,109 | ) |
| Net increase (decrease) in | | | | | | | | | | | | | | | | |
| shares outstanding | | | 250,104 | | | | (64,918 | ) | | | 127,062 | | | | (284,486 | ) |
The accompanying notes are an integral part of these financial statements.
| KINETICS MUTUAL FUNDS, INC. — THE FEEDER FUNDS |
Statements of Changes in Net Assets — (Continued) |
| | | The Small Cap | | | The Market | |
| | | Opportunities Fund | | | Opportunities Fund | |
| | | For the | | | For the | | | For the | | | For the | |
| | | Year Ended | | | Year Ended | | | Year Ended | | | Year Ended | |
| | | December 31, | | | December 31, | | | December 31, | | | December 31, | |
| | | 2013 | | | 2012 | | | 2013 | | | 2012 | |
| CHANGES IN SHARES OUTSTANDING — | | | | | | | | | | | | |
| ADVISOR CLASS C: | | | | | | | | | | | | |
| Shares sold | | | 110,477 | | | | 7,094 | | | | 25,837 | | | | 14,383 | |
| Shares issued in reinvestments of | | | | | | | | | | | | | | | | |
| dividends and distributions | | | — | | | | — | | | | 1,080 | | | | 2,527 | |
| Shares redeemed | | | (28,337 | ) | | | (29,018 | ) | | | (37,227 | ) | | | (97,683 | ) |
| Net increase (decrease) in | | | | | | | | | | | | | | | | |
| shares outstanding | | | 82,140 | | | | (21,924 | ) | | | (10,310 | ) | | | (80,773 | ) |
| CHANGES IN SHARES OUTSTANDING — | | | | | | | | | | | | | | | | |
| INSTITUTIONAL CLASS: | | | | | | | | | | | | | | | | |
| Shares sold | | | 990,478 | | | | 133,450 | | | | 937,141 | | | | 5,247 | |
| Shares issued in reinvestments of | | | | | | | | | | | | | | | | |
| dividends and distributions | | | — | | | | 3 | | | | 367 | | | | 118 | |
| Shares redeemed | | | (271,270 | ) | | | (113,744 | ) | | | (854,503 | ) | | | (4,211 | ) |
| Net increase in shares | | | | | | | | | | | | | | | | |
| outstanding | | | 719,208 | | | | 19,709 | | | | 83,005 | | | | 1,154 | |
The accompanying notes are an integral part of these financial statements.
| KINETICS MUTUAL FUNDS, INC. — THE FEEDER FUNDS |
Statements of Changes in Net Assets — (Continued) |
| | | The Alternative | | | The Multi- | |
| | | Income Fund | | | Disciplinary Fund | |
| | | For the | | | For the | | | For the | | | For the | |
| | | Year Ended | | | Year Ended | | | Year Ended | | | Year Ended | |
| | | December 31, | | | December 31, | | | December 31, | | | December 31, | |
| | | 2013 | | | 2012 | | | 2013 | | | 2012 | |
| OPERATIONS: | | | | | | | | | | | | |
| Net investment income (loss) | | $ | (54,057 | ) | | $ | 186,370 | | | $ | 1,363,638 | | | $ | 1,275,828 | |
| Net realized gain on sale of | | | | | | | | | | | | | | | | |
| investments, foreign currency, | | | | | | | | | | | | | | | | |
| written option contracts expired or | | | | | | | | | | | | | | | | |
| closed, securities sold short and | | | | | | | | | | | | | | | | |
| distributions received from other | | | | | | | | | | | | | | | | |
| investment companies | | | 331,354 | | | | 309,517 | | | | 2,371,485 | | | | 1,177,010 | |
| Net change in unrealized appreciation | | | | | | | | | | | | | | | | |
| (depreciation) of investments, | | | | | | | | | | | | | | | | |
| foreign currency, written options | | | | | | | | | | | | | | | | |
| and securities sold short | | | 594,800 | | | | 604,822 | | | | (739,904 | ) | | | 2,744,146 | |
| Net increase in net assets resulting | | | | | | | | | | | | | | | | |
| from operations | | | 872,097 | | | | 1,100,709 | | | | 2,995,219 | | | | 5,196,984 | |
| DISTRIBUTIONS TO SHAREHOLDERS — | | | | | | | | | | | | | | | | |
| NO LOAD CLASS: | | | | | | | | | | | | | | | | |
| Net investment income | | | — | | | | (121,802 | ) | | | (487,296 | ) | | | (679,067 | ) |
| Net realized gains | | | — | | | | — | | | | (441,978 | ) | | | (200,492 | ) |
| Total distributions | | | — | | | | (121,802 | ) | | | (929,274 | ) | | | (879,559 | ) |
| DISTRIBUTIONS TO SHAREHOLDERS — | | | | | | | | | | | | | | | | |
| ADVISOR CLASS A: | | | | | | | | | | | | | | | | |
| Net investment income | | | — | | | | (54,584 | ) | | | (924,799 | ) | | | (647,761 | ) |
| Net realized gains | | | — | | | | — | | | | (819,239 | ) | | | (258,629 | ) |
| Total distributions | | | — | | | | (54,584 | ) | | | (1,744,038 | ) | | | (906,390 | ) |
| DISTRIBUTIONS TO SHAREHOLDERS — | | | | | | | | | | | | | | | | |
| ADVISOR CLASS C: | | | | | | | | | | | | | | | | |
| Net investment income | | | — | | | | (29,650 | ) | | | (183,756 | ) | | | (173,702 | ) |
| Net realized gains | | | — | | | | — | | | | (258,354 | ) | | | (77,474 | ) |
| Total distributions | | | — | | | | (29,650 | ) | | | (442,110 | ) | | | (251,176 | ) |
| DISTRIBUTIONS TO SHAREHOLDERS — | | | | | | | | | | | | | | | | |
| INSTITUTIONAL CLASS: | | | | | | | | | | | | | | | | |
| Net investment income | | | — | | | | (45,289 | ) | | | (457,067 | ) | | | (218,586 | ) |
| Net realized gains | | | — | | | | — | | | | (509,401 | ) | | | (67,014 | ) |
| Total distributions | | | — | | | | (45,289 | ) | | | (966,468 | ) | | | (285,600 | ) |
| CAPITAL SHARE TRANSACTIONS — | | | | | | | | | | | | | | | | |
| NO LOAD CLASS: | | | | | | | | | | | | | | | | |
| Proceeds from shares sold | | | 9,908,542 | | | | 1,553,283 | | | | 8,952,699 | | | | 9,228,811 | |
| Redemption fees | | | 9 | | | | 78 | | | | 334 | | | | 725 | |
| Proceeds from shares issued to holders | | | | | | | | | | | | | | | | |
| in reinvestment of dividends | | | — | | | | 108,785 | | | | 736,771 | | | | 651,115 | |
| Cost of shares redeemed | | | (3,240,996 | ) | | | (2,871,859 | ) | | | (9,582,407 | ) | | | (5,059,428 | ) |
| Net increase (decrease) in net assets | | | | | | | | | | | | | | | | |
| resulting from capital share | | | | | | | | | | | | | | | | |
| transactions | | | 6,667,555 | | | | (1,209,713 | ) | | | 107,397 | | | | 4,821,223 | |
The accompanying notes are an integral part of these financial statements.
| KINETICS MUTUAL FUNDS, INC. — THE FEEDER FUNDS |
Statements of Changes in Net Assets — (Continued) |
| | | The Alternative | | | The Multi- | |
| | | Income Fund | | | Disciplinary Fund | |
| | | For the | | | For the | | | For the | | | For the | |
| | | Year Ended | | | Year Ended | | | Year Ended | | | Year Ended | |
| | | December 31, | | | December 31, | | | December 31, | | | December 31, | |
| | | 2013 | | | 2012 | | | 2013 | | | 2012 | |
| CAPITAL SHARE TRANSACTIONS — | | | | | | | | | | | | |
| ADVISOR CLASS A: | | | | | | | | | | | | |
| Proceeds from shares sold | | $ | 1,848,803 | | | $ | 255,900 | | | $ | 33,189,160 | | | $ | 22,935,328 | |
| Redemption fees | | | 313 | | | | — | | | | 4,331 | | | | 5,989 | |
| Proceeds from shares issued to holders | | | | | | | | | | | | | | | | |
| in reinvestment of dividends | | | — | | | | 46,863 | | | | 1,696,922 | | | | 851,763 | |
| Cost of shares redeemed | | | (1,667,426 | ) | | | (2,604,163 | ) | | | (24,094,744 | ) | | | (3,459,167 | ) |
| Net increase (decrease) in net | | | | | | | | | | | | | | | | |
| assets resulting from capital | | | | | | | | | | | | | | | | |
| share transactions | | | 181,690 | | | | (2,301,400 | ) | | | 10,795,669 | | | | 20,333,913 | |
| CAPITAL SHARE TRANSACTIONS — | | | | | | | | | | | | | | | | |
| ADVISOR CLASS C: | | | | | | | | | | | | | | | | |
| Proceeds from shares sold | | | 1,152,698 | | | | 250,862 | | | | 4,855,689 | | | | 6,096,378 | |
| Redemption fees | | | — | | | | — | | | | — | | | | — | |
| Proceeds from shares issued to holders | | | | | | | | | | | | | | | | |
| in reinvestment of dividends | | | — | | | | 19,420 | | | | 423,776 | | | | 240,039 | |
| Cost of shares redeemed | | | (1,134,524 | ) | | | (992,794 | ) | | | (1,435,484 | ) | | | (801,065 | ) |
| Net increase (decrease) in net | | | | | | | | | | | | | | | | |
| assets resulting from capital | | | | | | | | | | | | | | | | |
| share transactions | | | 18,174 | | | | (722,512 | ) | | | 3,843,981 | | | | 5,535,352 | |
| CAPITAL SHARE TRANSACTIONS — | | | | | | | | | | | | | | | | |
| INSTITUTIONAL CLASS: | | | | | | | | | | | | | | | | |
| Proceeds from shares sold | | | 5,417,780 | | | | 1,083,914 | | | | 17,790,455 | | | | 2,153,101 | |
| Redemption fees | | | — | | | | 159 | | | | — | | | | — | |
| Proceeds from shares issued to holders | | | | | | | | | | | | | | | | |
| in reinvestment of dividends | | | — | | | | 31,108 | | | | 955,985 | | | | 276,678 | |
| Cost of shares redeemed | | | (384,298 | ) | | | (327,778 | ) | | | (1,638,909 | ) | | | (240,894 | ) |
| Net increase in net assets resulting | | | | | | | | | | | | | | | | |
| from capital share transactions | | | 5,033,482 | | | | 787,403 | | | | 17,107,531 | | | | 2,188,885 | |
| TOTAL INCREASE (DECREASE) IN | | | | | | | | | | | | | | | | |
| NET ASSETS: | | | 12,772,998 | | | | (2,596,838 | ) | | | 30,767,907 | | | | 35,753,632 | |
| NET ASSETS: | | | | | | | | | | | | | | | | |
| Beginning of year | | | 10,689,218 | | | | 13,286,056 | | | | 59,391,609 | | | | 23,637,977 | |
| End of year* | | $ | 23,462,216 | | | $ | 10,689,218 | | | $ | 90,159,516 | | | $ | 59,391,609 | |
| * Including undistributed net investment | | | | | | | | | | | | | | | | |
| loss of: | | $ | — | | | $ | (72,455 | ) | | $ | (935,161 | ) | | $ | (433,001 | ) |
| CHANGES IN SHARES OUTSTANDING — | | | | | | | | | | | | | | | | |
| NO LOAD CLASS: | | | | | | | | | | | | | | | | |
| Shares sold | | | 939,415 | | | | 183,153 | | | | 790,030 | | | | 848,038 | |
| Shares issued in reinvestments of | | | | | | | | | | | | | | | | |
| dividends and distributions | | | — | | | | 13,044 | | | | 66,399 | | | | 59,656 | |
| Shares redeemed | | | (1,368,656 | )(1) | | | (352,741 | ) | | | (849,113 | ) | | | (467,948 | ) |
| Net increase (decrease) in shares | | | | | | | | | | | | | | | | |
| outstanding | | | (429,241 | ) | | | (156,544 | ) | | | 7,316 | | | | 439,746 | |
The accompanying notes are an integral part of these financial statements.
| KINETICS MUTUAL FUNDS, INC. — THE FEEDER FUNDS |
Statements of Changes in Net Assets — (Continued) |
| | | The Alternative | | | The Multi- | |
| | | Income Fund | | | Disciplinary Fund | |
| | | For the | | | For the | | | For the | | | For the | |
| | | Year Ended | | | Year Ended | | | Year Ended | | | Year Ended | |
| | | December 31, | | | December 31, | | | December 31, | | | December 31, | |
| | | 2013 | | | 2012 | | | 2013 | | | 2012 | |
| CHANGES IN SHARES OUTSTANDING — | | | | | | | | | | | | |
| ADVISOR CLASS A: | | | | | | | | | | | | |
| Shares sold | | | 43,207 | | | | 30,908 | | | | 2,944,381 | | | | 2,108,470 | |
| Shares issued in reinvestments of | | | | | | | | | | | | | | | | |
| dividends and distributions | | | — | | | | 5,612 | | | | 153,652 | | | | 78,399 | |
| Shares redeemed | | | (321,663 | )(1) | | | (311,285 | ) | | | (2,138,431 | ) | | | (321,378 | ) |
| Net increase (decrease) in shares | | | | | | | | | | | | | | | | |
| outstanding | | | (278,456 | ) | | | (274,765 | ) | | | 959,602 | | | | 1,865,491 | |
| CHANGES IN SHARES OUTSTANDING — | | | | | | | | | | | | | | | | |
| ADVISOR CLASS C: | | | | | | | | | | | | | | | | |
| Shares sold | | | 33,993 | | | | 30,770 | | | | 435,881 | | | | 570,311 | |
| Shares issued in reinvestments of | | | | | | | | | | | | | | | | |
| dividends and distributions | | | — | | | | 2,357 | | | | 38,723 | | | | 22,235 | |
| Shares redeemed | | | (226,741 | )(1) | | | (120,473 | ) | | | (128,853 | ) | | | (74,099 | ) |
| Net increase (decrease) in shares | | | | | | | | | | | | | | | | |
| outstanding | | | (192,748 | ) | | | (87,346 | ) | | | 345,751 | | | | 518,447 | |
| CHANGES IN SHARES OUTSTANDING — | | | | | | | | | | | | | | | | |
| INSTITUTIONAL CLASS: | | | | | | | | | | | | | | | | |
| Shares sold | | | 246,519 | | | | 127,757 | | | | 1,566,653 | | | | 205,219 | |
| Shares issued in reinvestments of | | | | | | | | | | | | | | | | |
| dividends and distributions | | | — | | | | 3,699 | | | | 86,068 | | | | 25,267 | |
| Shares redeemed | | | (363,249 | )(1) | | | (39,174 | ) | | | (144,343 | ) | | | (21,810 | ) |
| Net increase (decrease) in | | | | | | | | | | | | | | | | |
| shares outstanding | | | (116,730 | ) | | | 92,282 | | | | 1,508,378 | | | | 208,676 | |
| | | |
| (1) | Shares redeemed include: 1,198,771 No Load Class shares, 210,478 Class A shares, 159,007 Class C shares and 332,551 Institutional Class shares respectively due to the reverse split. Please see Note 10 for more information. |
The accompanying notes are an integral part of these financial statements.
| KINETICS MUTUAL FUNDS, INC. — THE FEEDER FUNDS |
| Notes to Financial Statements |
| December 31, 2013 |
1. Organization
Kinetics Mutual Funds, Inc. (the “Company”) is registered under the Investment Company Act of 1940, as amended (the “1940 Act”), and is incorporated in the State of Maryland. The Company is an open-end management investment company issuing its shares in series. One billion shares are authorized for the Company with a par value of $0.001 per share. The series of the Company presently authorized are The Internet Fund (“Internet”), The Global Fund (“Global”), The Paradigm Fund (“Paradigm”), The Medical Fund (“Medical”), The Small Cap Opportunities Fund (“Small Cap”), The Market Opportunities Fund (“Market Opportunities”), The Alternative Income Fund (formerly the Water Infrastructure Fund) (“Alternative Income”), and The Multi-Disciplinary Fund (“Multi-Disciplinary”). Investment operations of the Company began on October 21, 1996 (Internet), September 30, 1999 (Medical), December 31, 1999 (Global and Paradigm), March 20, 2000 (Small Cap), January 31, 2006 (Market Opportunities), June 29, 2007 (Alternative Income), and February 11, 2008 (Multi-Disciplinary). Each series, unlike many other investment companies which directly acquire and manage their own portfolios of securities, seeks to achieve its investment objective by investing all of its investable assets in a corresponding portfolio series (each a “Master Portfolio” and collectively the “Master Portfolios”) of Kinetics Portfolios Trust (the “Trust”).
On April 28, 2000 (January 31, 2006 with respect to Market Opportunities, June 29, 2007 with respect to Alternative Income, and February 11, 2008 with respect to Multi-Disciplinary), each series in the Company entered into a master-feeder fund structure. By entering into this structure, each series (each a “Feeder Fund” and collectively, the “Feeder Funds”) invested all of its assets in a corresponding Master Portfolio which had the same investment objective as the Feeder Fund. Each Master Portfolio has multiple feeder funds. Each Feeder Fund receives a proportionate amount of interest in the Master Portfolio equal to its relative contribution of capital. Thus, each Feeder Fund is allocated its portion of income, gains (losses) and expenses from the Master Portfolio.
| KINETICS MUTUAL FUNDS, INC. — THE FEEDER FUNDS |
Notes to Financial Statements — (Continued) |
| December 31, 2013 |
Each Feeder Fund’s respective interest in the corresponding Master Portfolio as of December 31, 2013 is as follows:
| | | | | |
| | | | Interest in |
| | | | Master Portfolio |
| Internet Fund | | | 99.989 | % |
| Global Fund | | | 99.932 | % |
| Paradigm Fund | | | 96.027 | % |
| Medical Fund | | | 99.887 | % |
| Small Cap Fund | | | 99.988 | % |
| Market Opportunities Fund | | | 99.975 | % |
| Alternative Income Fund | | | 99.367 | % |
| Multi-Disciplinary Fund | | | 99.832 | % |
Prior to the conversion to a master-feeder fund structure on April 28, 2000, each then existing series conducted its own investment operations.
As of December 31, 2013 each of the Feeder Funds offers Advisor Class A shares. Advisor Class A shares are subject to an annual Rule 12b-1 fee of 0.25% of average daily net assets and a shareholder servicing fee of 0.25% of average daily net assets. The Advisor Class A shares are also subject to a front-end sales charge of 5.75%.
As of December 31, 2013, each of the Feeder Funds offers Advisor Class C shares. Advisor Class C shares are subject to an annual Rule 12b-1 fee of 0.75% of average daily net assets and a shareholder servicing fee of 0.25% of average daily net assets. Advisor Class C shares do not have a sales charge.
As of December 31, 2013, each of the Feeder Funds offers No Load Class shares. No Load Class shares are subject to a shareholder servicing fee of 0.25% of average daily net assets but do not have 12b-1 fees or a sales charge.
As of December 31, 2013 the Paradigm, Small Cap, Market Opportunities, Alternative Income, and Multi-Disciplinary Funds offer Institutional Class shares. Institutional Class shares are subject to a shareholder servicing fee of 0.20% of average daily net assets but do not have 12b-1 fees or a sales charge. For the year ended December 31, 2013, the adviser has agreed to waive portion of the institutional class shareholder servicing fee in excess of 0.05%.
Each class of shares for each Fund has identical rights and privileges except with respect to the Rule 12b-1 fees paid by the Advisor Class A and Advisor Class C
| KINETICS MUTUAL FUNDS, INC. — THE FEEDER FUNDS |
Notes to Financial Statements — (Continued) |
| December 31, 2013 |
shares, the sales charge on the Advisor Class A shares, the shareholder servicing fees paid by the Advisor Class A, Advisor Class C, No Load Class and Institutional Class shares, voting rights on matters pertaining to a single class of shares and the exchange privileges of each class of shares. Shares of each Feeder Fund will assess a 2.00% redemption fee (with exceptions) on shares redeemed or exchanged within 30 days of purchase. Income, expenses (other than expenses attributable to a specific class), and realized and unrealized gains or losses on investments are allocated to each class based on its relative net assets.
Refer to the Master Portfolio’s financial statements to obtain information about the investment objective of the corresponding Feeder Fund. The financial statements of the Master Portfolios, including the portfolios of investments, are contained elsewhere in this report and should be read in conjunction with the Feeder Funds’ financial statements.
2. Significant Accounting Policies
Security Valuation
Master Portfolio securities that are listed on a U.S. securities exchange for which market quotations are readily available are valued at the last quoted sale price on the day the valuation is made. Price information on listed securities is taken from the exchange where the security is primarily traded. All equity securities that are traded using the National Association of Securities Dealers’ Automated Quotation System (“NASDAQ”) are valued using the NASDAQ Official Closing Price (“NOCP”). Foreign securities are valued by an independent pricing service. In the event market quotations are not readily available or if events occur that may materially affect the value of a particular security between the time trading ends on a particular security and the close of regular trading on the New York Stock Exchange (“NYSE”), “fair value” will be determined. Unlisted U.S. securities and listed U.S. securities not traded on the valuation date for which market quotations are readily available are valued at the last bid price. Exchange traded options are valued at the composite price, using the National Best Bid and Offer quotes (“NBBO”). NBBO consists of the highest bid price and lowest ask price across any of the exchanges on which an option is quoted, thus providing a view across the entire U.S. options marketplace. Composite option pricing calculates the mean of the highest bid price and lowest ask price across the exchanges where the option is traded. If the composite option price is not available, the mean between the highest bid and the lowest asked quotations at the close of the exchanges will be used. If
| KINETICS MUTUAL FUNDS, INC. — THE FEEDER FUNDS |
Notes to Financial Statements — (Continued) |
| December 31, 2013 |
none of the above are available, exchange traded options are valued at the last quoted sales price. Non-exchange traded options for which over-the-counter quotations are not readily available are valued at the mean of the current bid and asked prices. Fixed-income securities (other than obligations having a maturity of 60 days or less) are normally valued on the basis of quotes obtained from pricing services, which take into account appropriate factors such as institutional-sized trading in similar groups of securities, yield, quality, coupon rate, maturity, type of issue, trading characteristics and other market data.
Instruments with remaining maturities of 60 days or less are valued at amortized cost, which approximates fair value. Other assets and securities for which no quotations are readily available (including restricted securities) will be valued in good faith at fair value using methods determined by the Board of Trustees of the Master Portfolios. In determining the fair value of a security, the Board of Trustees shall take into account the relevant factors and surrounding circumstances, which may include: (i) the nature and pricing history (if any) of the security; (ii) whether any dealer quotations for the security are available; (iii) possible valuation methodologies that could be used to determine the fair value of the security; (iv) the recommendation of the portfolio manager of the Portfolios with respect to the valuation of the security; (v) whether the same or similar securities are held by other funds managed by the Advisor or other funds and the method used to price the security in those funds; (vi) the extent to which the fair value to be determined for the security will result from the use of data or formula produced by third parties independent of the Advisor; and (vii) the liquidity or illiquidity of the market for the security; and (viii) the value of a foreign security traded on other foreign markets. At December 31, 2013, 0.00%, 0.00%, 0.00%, 0.06% and 0.58% of the net assets of The Internet Portfolio, The Paradigm Portfolio, The Medical Portfolio, The Market Opportunities Portfolio and The Multi-Disciplinary Portfolio, respectively, were fair valued securities. The other Master Portfolios did not hold any fair valued securities at December 31, 2013.
Repurchase Agreements
Each Master Portfolio may enter into repurchase agreements with banks that are members of the Federal Reserve System or securities dealers who are members of a national securities exchange or are primary dealers in U.S. Government Securities. In connection with transactions in repurchase agreements, it is the Trust’s policy that the Master Portfolio receive, as collateral, securities whose market value, including accrued interest, at all times will be at least equal to
| KINETICS MUTUAL FUNDS, INC. — THE FEEDER FUNDS |
Notes to Financial Statements — (Continued) |
| December 31, 2013 |
102% of the amount invested by the Master Portfolio in each repurchase agreement. If the seller defaults and the value of the collateral declines, realization of the collateral by the Master Portfolio may be delayed or limited.
Written Option Accounting
The Master Portfolios may write (sell) call or put options for trading or hedging purposes. When the Master Portfolio writes an option, an amount equal to the premium received by the Master Portfolio is included in the Statement of Assets and Liabilities as an asset and an equivalent liability. The amount of the liability is subsequently marked-to-market to reflect the current value of the option written. By writing the option, the Master Portfolio may become obligated during the term of the option to deliver or purchase the securities underlying the option at the exercise price if the option is exercised. When an option expires on its stipulated expiration date or the Master Portfolio enters into a closing purchase transaction, the Master Portfolio realizes a gain or loss if the cost of the closing transaction differs from the premium received when the option was sold, without regard to any unrealized gain or loss on the underlying security, and the liability related to such option is eliminated. When an option is exercised, the premium originally received decreases the cost basis of the underlying security (or increases the proceeds on the security sold short) and the Master Portfolio realizes a gain or loss from the sale of the security (or closing of the short sale). As collateral for uncovered written options, the Master Portfolio is required under the 1940 Act to maintain assets consisting of cash, cash equivalents or liquid securities. This collateral is required to be adjusted daily to reflect the exercise price of the purchase obligation for put options or the market value of the instrument underlying the contract for call options.
Foreign Currency Translations
The books and records of the Master Portfolios are maintained in U.S. dollars. For the Master Portfolios, foreign currency transactions are translated into U.S. dollars on the following basis: (i) market values of investment securities and other assets and liabilities are translated at the exchange rate of such currencies against the U.S. dollar, as provided by an approved pricing service, and (ii) purchases and sales of investment securities, dividend and interest income and certain expenses at the rates of exchange prevailing on the respective dates of such transactions. The Master Portfolios do not isolate and treat as ordinary income that portion of the results of operations arising as a result of changes in the exchange rate from the fluctuations arising from changes in the market prices of securities held during the period. Such fluctuations are included with
| KINETICS MUTUAL FUNDS, INC. — THE FEEDER FUNDS |
Notes to Financial Statements — (Continued) |
| December 31, 2013 |
the net realized and unrealized gain or loss from investments. However, for federal income tax purposes, the Master Portfolios do isolate and treat as ordinary income the effect of changes in foreign exchange rates arising from actual foreign currency transactions and the effect of changes in foreign exchange rates arising between trade date and settlement date.
Restricted and Illiquid Securities
The Master Portfolios may invest in restricted securities. These securities are valued by the Master Portfolios after giving due consideration to pertinent factors including recent private sales, market conditions and the issuer’s financial performance. The Master Portfolios have no right to require registration of unregistered securities. At December 31, 2013 the following Master Portfolio held securities restricted to institutional investors (144A securities):
| | | | | | | | |
| | | | | | | Percentage of |
| | | | Market Value | | Net Assets |
| The Multi-Disciplinary Portfolio | | $ | 5,533,094 | | | 6.13 | % |
| The Alternative Income Portfolio | | | 200,440 | | | 0.85 | % |
An illiquid asset is any asset which may not be sold or disposed of in the ordinary course of business within seven days at approximately the value at which the Master Portfolio has valued the investment. At December 31, 2013, the following Master Portfolios held illiquid securities:
| | | | | | | | |
| | | | | | | Percentage of |
| | | | Market Value | | Net Assets |
| The Internet Portfolio | | $ | — | * | | 0.00 | % |
| The Medical Portfolio | | | — | * | | 0.00 | % |
| The Paradigm Portfolio | | | — | * | | 0.00 | % |
| The Market Opportunities Portfolio | | | 41,105 | | | 0.06 | % |
| The Multi-Disciplinary Portfolio | | | 525,000 | | | 0.58 | % |
| | |
| * Amount is less than $0.50. |
When-Issued Securities
The Master Portfolios may purchase securities on a when-issued or delayed delivery basis. Although the purchase amounts of these securities are established at the time the purchaser enters into the agreement, these securities may be delivered and paid for at a future date. The Master Portfolios record purchases of when-issued securities and reflect the values of such securities in determining net asset value in the same manner as other portfolio securities. The Master Portfolios maintain at all times cash or other liquid assets in an amount at least equal to the amount of outstanding commitments for when- issued securities.
| KINETICS MUTUAL FUNDS, INC. — THE FEEDER FUNDS |
Notes to Financial Statements — (Continued) |
| December 31, 2013 |
Securities Lending
Each Master Portfolio may lend its portfolio securities to broker-dealers by entering directly into lending arrangements with such broker-dealers or indirectly through repurchase agreements with respect to no more than 33 1/3% of the total assets of each Master Portfolio (including any collateral posted) or 50% of the total assets of each Master Portfolio (excluding any collateral posted). Securities lending and repurchase transactions will be fully collateralized at all times with cash and/or short-term debt obligations. The Master Portfolios receive interest on the collateral received as well as a fee for the securities loaned.
Expense Allocation
Common expenses incurred by Feeder Funds are allocated among the Feeder Funds (i) based upon relative average net assets, (ii) as incurred on a specific identification basis, or (iii) equally among the Feeder Funds, depending on the nature of the expenditure.
Each Feeder Fund records its proportionate share of the corresponding Master Portfolio’s expenses on a daily basis. In addition, each Feeder Fund accrues its own separate expenses. Any cap on expenses includes Feeder Fund-specific expenses as well as the expenses allocated from the Master Portfolio.
Federal Income Taxes
Each Master Portfolio will be treated as a partnership for federal income tax purposes. As such, each investor in the Master Portfolio via its investment in a Feeder Fund will be subject to taxation on its share of the Master Portfolio’s ordinary income and capital gains. It is intended that the Master Portfolio’s assets will be managed so an investor in the Master Portfolio via its investment in a Feeder Fund can satisfy the requirements of subchapter M of the Internal Revenue Code.
It is the Feeder Funds’ policy to meet the requirements of the Internal Revenue Code applicable to regulated investment companies and the Feeder Funds intend to distribute investment company net taxable income and net capital gains to shareholders. Therefore, no federal income tax provision is recorded.
Dividends from net investment income and distributions of net realized capital gains, if any, will be declared and paid at least annually. The character of
| KINETICS MUTUAL FUNDS, INC. — THE FEEDER FUNDS |
Notes to Financial Statements — (Continued) |
| December 31, 2013 |
distributions made during the year from net investment income or net realized gains may differ from the characterization for federal income tax purposes due to differences in the recognition of income, expenses and gain items for financial statement and tax purposes. Additionally, the Feeder Funds may utilize earnings and profits distributed to shareholders on redemption of shares as part of the dividends paid deduction for income tax purposes. Where appropriate, reclassifications between capital accounts are made for such differences that are permanent in nature.
There is no tax liability resulting from unrecognized tax benefits relating to uncertain income tax positions taken or expected to be taken in future tax returns. As of December 31, 2013, open tax years include the tax years ended December 31, 2010 through 2013. The Funds are also not aware of any tax positions for which it is reasonably possible that the total amounts of unrecognized tax benefits will significantly change in the next twelve months.
Use of Estimates
The preparation of financial statements in conformity with U.S. generally accepted accounting principles (“GAAP”) requires management to make estimates and assumptions that affect the reported amounts in the financial statements. Actual results could differ from those estimates.
Other
Realized gains and losses on the sale of investments are calculated on the identified cost basis. Dividend income is recorded on the ex-dividend date. Interest income is accounted for on the accrual basis and includes amortization of premiums and discounts on the interest method. Other noncash dividends are recognized as investment income at the fair value of the property received. Withholding taxes on foreign dividends have been provided for in accordance with the Company’s understanding of the applicable country’s tax rules and rates.
3. Investment Adviser
The Trust has entered into Investment Advisory Agreements (the “Agreements”) with Kinetics Asset Management LLC (the “Adviser”), with whom certain officers and trustees of the Trust are affiliated, to furnish investment advisory services to the Master Portfolios. The Adviser is a wholly-owned subsidiary of Horizon Kinetics LLC. Under the terms of the Agreements, the Master
| KINETICS MUTUAL FUNDS, INC. — THE FEEDER FUNDS |
Notes to Financial Statements — (Continued) |
| December 31, 2013 |
Portfolios, except the Alternative Income Portfolio, compensate the Adviser for its management services at the annual rate of 1.25% of each Master Portfolio’s average daily net assets. The Alternative Income Portfolio began compensating the Adviser for its management services at the annual rate of 0.90% of the Master Portfolio’s average daily net assets beginning January 1, 2013.
The Adviser has voluntarily agreed to waive a portion of its advisory fee and/or reimburse certain operating expenses as deemed appropriate. The Adviser may discontinue the voluntary waiver/reimbursement at any time; these waivers/reimbursements are not subject to recapture.
For the year ended December 31, 2013, the rate earned by the Adviser from the Master Portfolios and the waived fees/reimbursed expenses for the Feeder Funds are as follows:
| | | | | | | |
| | | The Internet | | The Global |
| | | Fund | | Fund |
| Annual advisory rate | | | 1.25 | % | | | 1.25 | % |
| Expenses reimbursed by Adviser through | | | | | | | | |
| voluntary waiver | | $ | — | | | $ | 133,013 | |
| Expenses reimbursed by Adviser through | | | | | | | | |
| institutional class shareholder | | | | | | | | |
| servicing fee waiver | | $ | — | | | $ | — | |
| | | | | | | | | |
| | | The Paradigm | | The Medical |
| | | Fund | | Fund |
| Annual advisory rate | | | 1.25 | % | | | 1.25 | % |
| Expenses reimbursed by Adviser through | | | | | | | | |
| voluntary waiver | | $ | 819,825 | | | $ | 155,301 | |
| Expenses reimbursed by Adviser through | | | | | | | | |
| institutional class shareholder | | | | | | | | |
| servicing fee waiver | | $ | 404,802 | | | $ | — | |
| | | | | | | | | |
| | | The Small Cap | | The Market |
| | | Opportunities | | Opportunities |
| | | Fund | | Fund |
| Annual advisory rate | | | 1.25 | % | | | 1.25 | % |
| Expenses reimbursed by Adviser through | | | | | | | | |
| voluntary waiver | | $ | 159,244 | | | $ | 137,931 | |
| Expenses reimbursed by Adviser through | | | | | | | | |
| institutional class shareholder | | | | | | | | |
| servicing fee waiver | | $ | 25,298 | | | $ | 4,528 | |
| KINETICS MUTUAL FUNDS, INC. — THE FEEDER FUNDS |
Notes to Financial Statements — (Continued) |
| December 31, 2013 |
| | | The Alternative | | | The Multi- | |
| | | Income | | | Disciplinary | |
| | | Fund | | | Fund | |
| Annual advisory rate | | | 0.90 | % | | | 1.25 | % |
| Expenses reimbursed by Adviser through | | | | | | | | |
| voluntary waiver | | $ | 221,680 | | | $ | 289,857 | |
| Expenses reimbursed by Adviser through | | | | | | | | |
| institutional class shareholder | | | | | | | | |
| servicing fee waiver | | $ | 5,204 | | | $ | 21,895 | |
The Adviser receives a shareholder servicing fee from the No Load Class, Advisor Class A and Advisor Class C shares of a Feeder Fund pursuant to a Shareholder Servicing Agreement in the amount equal to 0.25% of the Feeder Fund’s average daily net assets attributable to No Load Class, Advisor Class A and Advisor Class C shares, respectively. For the Institutional Class, the Adviser receives a shareholder servicing fee pursuant to a shareholder servicing agreement in the amount equal to 0.20% of a Feeder Fund’s average daily net assets attributable to Institutional Class shares. At this time, the Adviser has contractually agreed to waive and/or reimburse the portion of the Institutional Class shareholder servicing fee in excess of 0.05% of a Feeder Fund’s average daily net assets attributable to Institutional Class shares until at least May 1, 2014. For the year ended December 31, 2013, the Adviser waived amounts depicted in the above table in shareholder servicing fees for the Institutional Class of the Paradigm, Small Cap, Market Opportunities, Alternative Income, and Multi-Disciplinary Funds. During the year ended December 31, 2013, Internet, Global, Paradigm, Medical, Small Cap, Market Opportunities, Alternative Income and Multi-Disciplinary Funds incurred shareholder servicing expenses of $432,482, $23,126, $2,531,393, $55,145, $428,551, $141,195, $41,718, and $210, 052 respectively, pursuant to the Shareholder Servicing Plan. The Adviser is responsible for paying a portion of these shareholder servicing fees to various agents that have a written shareholder servicing agreement with the Adviser and that perform shareholder servicing functions and maintenance of shareholder accounts on behalf of their clients who own shares of the Feeder Funds.
For the year ended December 31, 2013, the Feeder Funds were allocated $26,000 for the services of the Chief Compliance Officer employed by the Adviser.
The Company, on behalf of the Feeder Funds, has adopted two Retail Distribution Plans pursuant to Rule 12b-1 under the 1940 Act (the “12b-1 Plans”). One Plan is for Advisor Class A shares, while the other Plan is for Advisor Class C shares. Under the first Plan, Advisor Class A shares may pay up to an annual rate of 0.50% of the average daily net asset value of Advisor Class A shares to the
| KINETICS MUTUAL FUNDS, INC. — THE FEEDER FUNDS |
Notes to Financial Statements — (Continued) |
| December 31, 2013 |
Distributor or other qualified recipients under the Plan. During the year ended December 31, 2013, payments under the 12b-1 Plan for the Advisor Class A shares of the Internet, Global, Paradigm, Medical, Small Cap, Market Opportunities, Alternative Income, and Multi-Disciplinary Funds were limited to 0.25% of the average daily net asset value of such shares of such Funds. During the year ended December 31, 2013, the Advisor Class A shares of the Internet, Global, Paradigm, Medical, Small Cap, Market Opportunities, Alternative Income, and Multi-Disciplinary Funds incurred expenses of $7,545, $2,919, $419,676, $8,345, $32,830, $21,567, $5,456, and $104,788 respectively, pursuant to the 12b-1 Plan. Under the second Plan, Advisor Class C shares pay an annual rate of 0.75% of the average daily net asset value of such shares. During the year ended December 31, 2013, Internet, Global, Paradigm, Medical, Small Cap, Market Opportunities, Alternative Income, and Multi-Disciplinary Funds Advisor Class C Shares incurred expenses of $3,437, $7,349, $897,888, $3,786, $33,208, $35,823, $12,641 and $77,096 respectively, pursuant to the 12b-1 Plan.
Kinetics Funds Distributor, LLC (the “Distributor”) acts as the Feeder Funds’ principal underwriter in a continuous public offering of the Feeder Funds’ shares. The Distributor is an affiliate of the Adviser. For the year ended December 31, 2013, the Distributor received $4,927, $394, $58,548, $4,265, $6,160, $3,664, $1,358 and $13,385 from sales loads from the Internet, Global, Paradigm, Medical, Small Cap, Market Opportunities, Alternative Income, and Multi-Disciplinary Funds.
4. Reclassification of Capital Accounts
GAAP requires that certain components of net assets relating to permanent differences be reclassified between financial and tax reporting. These reclassifications have no effect on net assets or net asset value per share. For the year ended December 31, 2013, each Feeder Fund recorded the following reclassifications to the accounts listed below:
| | | | | | | | | | |
| | | INCREASE (DECREASE) | |
| | | Paid In Capital | | | Accumulated Net Investment Income or (Loss) | | | Accumulated Net Realized Gain or (Loss) | |
| Internet | | $ | (2,073,487 | ) | | $ | 2,328,094 | | | $ | (254,607 | ) |
| Global | | | — | | | | 53,671 | | | | (53,671 | ) |
| Paradigm | | | (11,104,043 | ) | | | 13,673,332 | | | | (2,569,289 | ) |
| Medical | | | — | | | | (2,064 | ) | | | 2,064 | |
| Small Cap | | | 948,572 | | | | (262,869 | ) | | | (685,703 | ) |
| Market | | | (91,727 | ) | | | 799,552 | | | | (707,825 | ) |
| Alternative Income | | | (145,322 | ) | | | 126,512 | | | | 18,810 | |
| Multi-Disciplinary | | | — | | | | 187,120 | | | | (187,120 | ) |
| KINETICS MUTUAL FUNDS, INC. — THE FEEDER FUNDS |
Notes to Financial Statements — (Continued) |
| December 31, 2013 |
5. Income Taxes
At December 31, 2013, the Internet, Global, Paradigm, Medical, Small Cap, Market Opportunities, Alternative Income, and Multi-Disciplinary Funds had $0, $966, $0, $0, $260,462, $0, $0 and $453,666, respectively, of undistributed net investment income on a tax basis.
At December 31, 2013, the Internet and Multi-Disciplinary Funds had $5,361,037 and $17,495, respectively, of accumulated net realized gains on a tax basis.
At December 31, 2013, the Feeder Funds had accumulated net realized capital loss carryforwards expiring in the following years:
| | | | | | | | | | | | | | | | |
| | | | | | | | | | | | No | | | No | |
| | | | | | | | | | | | Expiration | | | Expiration | |
| Feeder Fund | | 2016 | | | 2017 | | | 2018 | | | Short-term | | | Long-term | |
| Internet | | $ | — | | | $ | — | | | $ | — | | | $ | — | | | $ | — | |
| Global | | | — | | | | (367,030 | ) | | | — | | | | — | | | | — | |
| Paradigm | | | (205,745,172 | ) | | | (445,505,345 | ) | | | (115,786,082 | ) | | | (1,814,849 | ) | | | — | |
| Medical | | | — | | | | — | | | | — | | | | — | | | | (342,501 | ) |
| Small Cap | | | (53,244,496 | ) | | | (96,486,615 | ) | | | (8,224,702 | ) | | | — | | | | — | |
| Market | | | (16,707,598 | ) | | | (6,623,055 | ) | | | (2,108,533 | ) | | | — | | | | — | |
| Alternative | | | (987,119 | ) | | | (4,868,599 | ) | | | (2,203,647 | ) | | | — | | | | — | |
| Multi-Disciplinary | | | — | | | | — | | | | — | | | | — | | | | — | |
As a result of the Regulated Investment Company Modernization Act of 2010 (the “Modernization Act”), losses incurred in this fiscal year and beyond retain their character, short-term or long-term, have no expiration date and are utilized prior to capital loss carryforwards accumulated before the enactment of the Modernization Act.
For the year ended December 31, 2013, the following Feeder Funds utilized capital loss carryforwards:
| | | | | |
| | | | Capital Loss | |
| Fund | | | Carryforward | |
| Global | | $ | 36,284 | |
| Small Cap | | | 1,332,607 | |
| Market Opportunities | | | 3,947,393 | |
| Alternative | | | 1,652 | |
| KINETICS MUTUAL FUNDS, INC. — THE FEEDER FUNDS |
Notes to Financial Statements — (Continued) |
| December 31, 2013 |
At December 31, 2013, the following Feeder Funds deferred, on a tax basis, post-October losses:
| | | | | | | |
| | Post-October | | Post-October | |
| Feeder Fund | Losses | | Currency Losses | |
| Internet | | $ | (36,653 | ) | | | |
| Paradigm | | | | | | $ | (825,325 | ) |
| Medical | | | | | | | (39,071 | ) |
| Market Opportunities | | | | | | | (107,573 | ) |
The tax components of dividends paid during the years ended December 31, 2013 and December 31, 2012, are:
| | | | | | | | | | | | | |
| | | Internet | | | Global | |
| | | Ordinary | | | Long-Term | | | Ordinary | | | Long-Term | |
| | | Income | | | Capital Gains | | | Income | | | Capital Gains | |
| | | Distribution | | | Distribution | | | Distribution | | | Distribution | |
| 2013 | | $ | — | | | $ | 8,711,382 | | | $ | 12,940 | | | $ | — | |
| 2012 | | $ | — | | | $ | 5,260,270 | | | $ | 156,516 | | | $ | — | |
| | | | | | | | | | | | | | | | | |
| | | Paradigm | | | Medical | |
| | | Ordinary | | | Long-Term | | | Ordinary | | | Long-Term | |
| | | Income | | | Capital Gains | | | Income | | | Capital Gains | |
| | | Distribution | | | Distribution | | | Distribution | | | Distribution | |
| 2013 | | $ | 7,266,782 | | | $ | — | | | $ | 52,349 | | | $ | 144,235 | |
| 2012 | | $ | 3,816,172 | | | $ | — | | | $ | 301,886 | | | $ | 1,910,710 | |
| | | | | | | | | | | | | | | | | |
| | | Small Cap | | | Market Opportunities | |
| | | Ordinary | | | Long-Term | | | Ordinary | | | Long-Term | |
| | | Income | | | Capital Gains | | | Income | | | Capital Gains | |
| | | Distribution | | | Distribution | | | Distribution | | | Distribution | |
| 2013 | | $ | — | | | $ | — | | | $ | 244,013 | | | $ | — | |
| 2012 | | $ | — | | | $ | — | | | $ | 654,956 | | | $ | — | |
| | | | | | | | | | | | | | | | | |
| | | Alternative Income | | | Multi-Disciplinary | |
| | | Ordinary | | | Long-Term | | | Ordinary | | | Long-Term | |
| | | Income | | | Capital Gains | | | Income | | | Capital Gains | |
| | | Distribution | | | Distribution | | | Distribution | | | Distribution | |
| 2013 | | $ | — | | | $ | — | | | $ | 3,590,035 | | | $ | 491,855 | |
| 2012 | | $ | 251,325 | | | $ | — | | | $ | 2,322,725 | | | $ | — | |
| KINETICS MUTUAL FUNDS, INC. — THE FEEDER FUNDS |
Notes to Financial Statements — (Continued) |
| December 31, 2013 |
6. Tax Information (Unaudited)
The Global, Paradigm, Medical, and Market Opportunities Funds designate 49%, 100%, 100% and 84%, respectively, of dividends declared after December 31, 2013 from net investment income as qualified dividend income under the Jobs and Growth Tax Relief Reconciliation Act of 2003.
The Internet, Global, Paradigm, Medical, Small Cap, Market Opportunities, Alternative Income, and Multi-Disciplinary Funds hereby designate 0%, 100%, 100%, 27%, 0%, 100%, 0% and 88%, respectively, as ordinary income distributions and 100%, 73% and 12% for the Internet, Medical and Multi-Disciplinary Funds as long-term capital gain distributions for the purposes of the dividends paid deduction, which include earnings and profits distributed to shareholders on redemptions of Fund shares.
For corporate shareholders in the Feeder Funds, the percentage of ordinary dividend income distributed for the year ended December 31, 2013, which is designated as qualifying for the dividends-received deduction, is as follows: Global 22%, Paradigm 100%, Medical 100%, and Market Opportunities 63%. The Multi-Disciplinary Fund designates 100% of its ordinary income distributions for the fiscal year ended December 31, 2013 as interest-related dividends under Internal Revenue Code Section 871(k)(l)(C).
The Multi-Disciplinary Fund designates 38% of its ordinary income distribution as a short-term capital gain distribution under Internal Revenue Code Section 871(k)(2)(C).
7. Information about Proxy Voting (Unaudited)
Information regarding how the Company and the Master Portfolios vote proxies relating to portfolio securities is available without charge, upon request by calling toll-free at 1-800-930-3828 or by accessing the Company’s website at www.kineticsfunds.com and by accessing the SEC’s website at www.sec.gov. Information regarding how the Feeder Funds and the Master Portfolios voted proxies relating to portfolio securities during the most recent twelve month period ended June 30, is available without charge, upon request, by calling toll-free at 1-800-930-3828 or by accessing the SEC’s website at www.sec.gov.
| KINETICS MUTUAL FUNDS, INC. — THE FEEDER FUNDS |
Notes to Financial Statements — (Continued) |
| December 31, 2013 |
8. Information about the Portfolio Holdings (Unaudited)
The Feeder Funds file their complete schedule of portfolio holdings for their first and third fiscal quarters with the SEC on Form N-Q. The Feeder Funds’ Form N-Q is available without charge, upon request, by calling toll-free at 1-800-930-3828. Furthermore, you can obtain the Form N-Q on the SEC’s website at www.sec.gov. Finally, the Form N-Q may be reviewed and copied at the SEC’s Public Reference Room in Washington, D.C. Information on the operation of the Public Reference Room may be obtained by calling 1-800-SEC-0330.
9. Subsequent Events
In preparing these financial statements, management has evaluated Fund related events and transactions for potential recognition or disclosure through the date the financial statements were issued. There were no events or translations that occurred during the year that materially impacted the amounts or disclosures in the Feeder Funds’ financial statements.
10. Reverse Stock Split
During the year ended December 31, 2013, shares of The Alternative Income Fund were adjusted to reflect a reverse stock split. The effect of the reverse stock split was to reduce the number of shares outstanding while maintaining the Fund’s and each shareholder’s aggregate net asset value. A summary of the reverse stock split is as follows:
| | | | | | | | | | | | | | |
| | | | | | | | Net Asset | | Net Asset | | Shares | | Shares |
| | | | | | | | Value | | Value | | Outstanding | | Outstanding |
| | | | | | | | Before | | After | | Before | | After |
| | | | | | | | Reverse | | Reverse | | Reverse | | Reverse |
| | | | Date | | Rate | | Split | | Split | | Split | | Split |
| Alternative Income Fund, | | | | | | | | | | | | | |
| No Load Class | | | 5/31/13 | | 1:10 | | 8.52 | | 85.24 | | 1,331,968 | | 133,197 |
| Alternative Income Fund, | | | | | | | | | | | | | |
| Class A | | | 5/31/13 | | 1:10 | | 8.52 | | 85.23 | | 233,864 | | 23,386 |
| Alternative Income Fund, | | | | | | | | | | | | | |
| Class C | | | 5/31/13 | | 1:10 | | 8.39 | | 83.88 | | 176,674 | | 17,667 |
| Alternative Income Fund, | | | | | | | | | | | | | |
| Institutional Class | | | 5/31/13 | | 1:10 | | 8.60 | | 86.01 | | 369,501 | | 36,950 |
| KINETICS MUTUAL FUNDS, INC. — THE FEEDER FUNDS |
| Financial Highlights |
| | | The Internet Fund | |
| | | | | | | | | No Load Class | | | | | | | |
| | | For the | | | For the | | | For the | | | For the | | | For the | |
| | | Year Ended | | | Year Ended | | | Year Ended | | | Year Ended | | | Year Ended | |
| | | December 31, | | | December 31, | | | December 31, | | | December 31, | | | December 31, | |
| | | 2013 | | | 2012 | | | 2011 | | | 2010 | | | 2009 | |
PER SHARE DATA:(1) | | | | | | | | | | | | | | | |
| Net Asset Value, Beginning of Year | | $ | 43.18 | | | $ | 36.26 | | | $ | 37.25 | | | $ | 30.74 | | | $ | 20.71 | |
| Income from Investment Operations: | | | | | | | | | | | | | | | | | | | | |
Net investment loss(2) | | | (0.67 | ) | | | (0.15 | ) | | | (0.37 | ) | | | (0.28 | ) | | | (0.14 | ) |
| Net realized and unrealized gain | | | | | | | | | | | | | | | | | | | | |
| (loss) on investments | | | 19.78 | | | | 8.56 | | | | (0.37 | ) | | | 6.79 | | | | 10.21 | |
| Total from investment | | | | | | | | | | | | | | | | | | | | |
| operations | | | 19.11 | | | | 8.41 | | | | (0.74 | ) | | | 6.51 | | | | 10.07 | |
Redemption Fees(3) | | | 0.00 | | | | 0.00 | | | | 0.00 | | | | 0.00 | | | | 0.00 | |
| Less Distributions: | | | | | | | | | | | | | | | | | | | | |
| From net investment income | | | — | | | | — | | | | — | | | | — | | | | (0.04 | ) |
| From net realized gains | | | (3.02 | ) | | | (1.49 | ) | | | (0.25 | ) | | | — | | | | — | |
| Total distributions | | | (3.02 | ) | | | (1.49 | ) | | | (0.25 | ) | | | — | | | | (0.04 | ) |
| Net Asset Value, End of Year | | $ | 59.27 | | | $ | 43.18 | | | $ | 36.26 | | | $ | 37.25 | | | $ | 30.74 | |
| Total return | | | 44.28 | % | | | 23.24 | % | | | (1.98 | )% | | | 21.18 | % | | | 48.61 | % |
| SUPPLEMENTAL DATA AND RATIOS | | | | | | | | | | | | | | | | | | | | |
| Net assets, end of year (000’s) | | $ | 172,332 | | | $ | 155,036 | | | $ | 103,828 | | | $ | 113,085 | | | $ | 104,666 | |
| Ratio of operating expenses to average | | | | | | | | | | | | | | | | | | | | |
| net assets: | | | | | | | | | | | | | | | | | | | | |
| Before expense reimbursement | | | 1.84 | % | | | 1.94 | % | | | 1.94 | % | | | 1.95 | % | | | 1.98 | % |
After expense reimbursement(4) | | | 1.84 | % | | | 1.89 | % | | | 1.89 | % | | | 1.89 | % | | | 1.89 | % |
| Ratio of net investment loss to | | | | | | | | | | | | | | | | | | | | |
| average net assets: | | | | | | | | | | | | | | | | | | | | |
| Before expense reimbursement | | | (1.30 | )% | | | (0.41 | )% | | | (0.99 | )% | | | (0.91 | )% | | | (0.64 | )% |
After expense reimbursement(4) | | | (1.30 | )% | | | (0.36 | )% | | | (0.94 | )% | | | (0.85 | )% | | | (0.55 | )% |
Portfolio turnover rate(5) | | | 8 | % | | | 9 | % | | | 32 | % | | | 12 | % | | | 14 | % |
| | | |
| (1) | Information presented relates to a share of capital stock outstanding for each period. |
| (2) | Net investment income per share represents net investment income divided by the average shares outstanding throughout the period. |
| (3) | Amount calculated is less than $0.005. |
| (4) | See Note #3, Investment Adviser, for the waiver and expense reimbursement discussion. |
| (5) | Portfolio turnover of The Internet Portfolio. |
The accompanying notes are an integral part of these financial statements.
KINETICS MUTUAL FUNDS, INC. — THE FEEDER FUNDS Financial Highlights — (Continued) |
| | | The Internet Fund | |
| | | | | | | | | Advisor Class A | | | | | | | |
| | | For the | | | For the | | | For the | | | For the | | | For the | |
| | | Year Ended | | | Year Ended | | | Year Ended | | | Year Ended | | | Year Ended | |
| | | December 31, | | | December 31, | | | December 31, | | | December 31, | | | December 31, | |
| | | 2013 | | | 2012 | | | 2011 | | | 2010 | | | 2009 | |
PER SHARE DATA:(1) | | | | | | | | | | | | | | | |
| Net Asset Value, Beginning of Year | | $ | 42.30 | | | $ | 35.63 | | | $ | 36.69 | | | $ | 30.35 | | | $ | 20.50 | |
| Income from Investment Operations: | | | | | | | | | | | | | | | | | | | | |
Net investment loss(2) | | | (0.81 | ) | | | (0.24 | ) | | | (0.46 | ) | | | (0.36 | ) | | | (0.21 | ) |
| Net realized and unrealized gain | | | | | | | | | | | | | | | | | | | | |
| (loss) on investments | | | 19.36 | | | | 8.40 | | | | (0.36 | ) | | | 6.70 | | | | 10.09 | |
| Total from investment | | | | | | | | | | | | | | | | | | | | |
| operations | | | 18.55 | | | | 8.16 | | | | (0.82 | ) | | | 6.34 | | | | 9.88 | |
| Redemption Fees | | | 0.01 | | | | — | | | | 0.01 | | | | 0.00 | (3) | | | 0.01 | |
| Less Distributions: | | | | | | | | | | | | | | | | | | | | |
| From net investment income | | | — | | | | — | | | | — | | | | — | | | | (0.04 | ) |
| From net realized gains | | | (3.02 | ) | | | (1.49 | ) | | | (0.25 | ) | | | — | | | | — | |
| Total distributions | | | (3.02 | ) | | | (1.49 | ) | | | (0.25 | ) | | | — | | | | (0.04 | ) |
| Net Asset Value, End of Year | | $ | 57.84 | | | $ | 42.30 | | | $ | 35.63 | | | $ | 36.69 | | | $ | 30.35 | |
Total return(4) | | | 43.94 | % | | | 22.92 | % | | | (2.20 | )% | | | 20.89 | % | | | 48.23 | % |
| SUPPLEMENTAL DATA AND RATIOS | | | | | | | | | | | | | | | | | | | | |
| Net assets, end of year (000’s) | | $ | 5,506 | | | $ | 1,379 | | | $ | 1,050 | | | $ | 1,892 | | | $ | 738 | |
| Ratio of operating expenses to average | | | | | | | | | | | | | | | | | | | | |
| net assets: | | | | | | | | | | | | | | | | | | | | |
| Before expense reimbursement | | | 2.09 | % | | | 2.19 | % | | | 2.19 | % | | | 2.20 | % | | | 2.23 | % |
After expense reimbursement(5) | | | 2.09 | % | | | 2.14 | % | | | 2.14 | % | | | 2.14 | % | | | 2.14 | % |
| Ratio of net investment loss to | | | | | | | | | | | | | | | | | | | | |
| average net assets: | | | | | | | | | | | | | | | | | | | | |
| Before expense reimbursement | | | (1.55 | )% | | | (0.66 | )% | | | (1.24 | )% | | | (1.16 | )% | | | (0.89 | )% |
After expense reimbursement(5) | | | (1.55 | )% | | | (0.61 | )% | | | (1.19 | )% | | | (1.10 | )% | | | (0.80 | )% |
Portfolio turnover rate(6) | | | 8 | % | | | 9 | % | | | 32 | % | | | 12 | % | | | 14 | % |
| (1) | Information presented relates to a share of capital stock outstanding for each period. |
| (2) | Net investment income per share represents net investment income divided by the average shares outstanding throughout the period. |
| (3) | Amount calculated is less than $0.005. |
| (4) | The total return calculation does not reflect the 5.75% front end sales charge on Advisor Class A shares. |
| (5) | See Note #3, Investment Adviser, for the waiver and expense reimbursement discussion. |
| (6) | Portfolio turnover of The Internet Portfolio. |
The accompanying notes are an integral part of these financial statements.
| KINETICS MUTUAL FUNDS, INC. — THE FEEDER FUNDS |
Financial Highlights — (Continued) |
| | | The Internet Fund | |
| | | | | | | | Advisor Class C | | | | | | |
| | | For the | | | For the | | | For the | | | For the | | | For the | |
| | | Year Ended | | | Year Ended | | | Year Ended | | | Year Ended | | | Year Ended | |
| | | December 31, | | | December 31, | | | December 31, | | | December 31, | | | December 31, | |
| | | 2013 | | | 2012 | | | 2011 | | | 2010 | | | 2009 | |
PER SHARE DATA:(1) | | | | | | | | | | | | | | | |
| Net Asset Value, Beginning of Year | | $ | 40.79 | | | $ | 34.58 | | | $ | 35.79 | | | $ | 29.76 | | | $ | 20.20 | |
| Income from Investment Operations: | | | | | | | | | | | | | | | | | | | | |
Net investment loss(2) | | | (1.03 | ) | | | (0.43 | ) | | | (0.63 | ) | | | (0.51 | ) | | | (0.31 | ) |
| Net realized and unrealized gain | | | | | | | | | | | | | | | | | | | | |
| (loss) on investments | | | 18.64 | | | | 8.13 | | | | (0.34 | ) | | | 6.54 | | | | 9.91 | |
| Total from investment | | | | | | | | | | | | | | | | | | | | |
| operations | | | 17.61 | | | | 7.70 | | | | (0.97 | ) | | | 6.03 | | | | 9.60 | |
| Redemption Fees | | | — | | | | — | | | | 0.01 | | | | — | | | | — | |
| Less Distributions: | | | | | | | | | | | | | | | | | | | | |
| From net investment income | | | — | | | | — | | | | — | | | | — | | | | (0.04 | ) |
| From net realized gains | | | (3.02 | ) | | | (1.49 | ) | | | (0.25 | ) | | | — | | | | — | |
| Total distributions | | | (3.02 | ) | | | (1.49 | ) | | | (0.25 | ) | | | — | | | | (0.04 | ) |
| Net Asset Value, End of Year | | $ | 55.38 | | | $ | 40.79 | | | $ | 34.58 | | | $ | 35.79 | | | $ | 29.76 | |
| Total return | | | 43.20 | % | | | 22.32 | % | | | (2.67 | )% | | | 20.26 | % | | | 47.51 | % |
| SUPPLEMENTAL DATA AND RATIOS | | | | | | | | | | | | | | | | | | | | |
| Net assets, end of year (000’s) | | $ | 913 | | | $ | 185 | | | $ | 103 | | | $ | 196 | | | $ | 120 | |
| Ratio of operating expenses to | | | | | | | | | | | | | | | | | | | | |
| average net assets: | | | | | | | | | | | | | | | | | | | | |
| Before expense reimbursement | | | 2.59 | % | | | 2.69 | % | | | 2.69 | % | | | 2.70 | % | | | 2.73 | % |
After expense reimbursement(3) | | | 2.59 | % | | | 2.64 | % | | | 2.64 | % | | | 2.64 | % | | | 2.64 | % |
| Ratio of net investment loss to | | | | | | | | | | | | | | | | | | | | |
| average net assets: | | | | | | | | | | | | | | | | | | | | |
| Before expense reimbursement | | | (2.05 | )% | | | (1.16 | )% | | | (1.74 | )% | | | (1.66 | )% | | | (1.39 | )% |
After expense reimbursement(3) | | | (2.05 | )% | | | (1.11 | )% | | | (1.69 | )% | | | (1.60 | )% | | | (1.30 | )% |
Portfolio turnover rate(4) | | | 8 | % | | | 9 | % | | | 32 | % | | | 12 | % | | | 14 | % |
| (1) | Information presented relates to a share of capital stock outstanding for each period. |
| (2) | Net investment income per share represents net investment income divided by the average shares outstanding throughout the period. |
| (3) | See Note #3, Investment Adviser, for the waiver and expense reimbursement discussion. |
| (4) | Portfolio turnover of The Internet Portfolio. |
The accompanying notes are an integral part of these financial statements.
| KINETICS MUTUAL FUNDS, INC. — THE FEEDER FUNDS |
Financial Highlights — (Continued) |
| | | The Global Fund | |
| | | | | | | | | No Load Class | | | | | | | |
| | | For the | | | For the | | | For the | | | For the | | | For the | |
| | | Year Ended | | | Year Ended | | | Year Ended | | | Year Ended | | | Year Ended | |
| | | December 31, | | | December 31, | | | December 31, | | | December 31, | | | December 31, | |
| | | 2013 | | | 2012 | | | 2011 | | | 2010 | | | 2009 | |
PER SHARE DATA:(1) | | | | | | | | | | | | | | | |
| Net Asset Value, Beginning of Year | | $ | 4.71 | | | $ | 3.92 | | | $ | 4.67 | | | $ | 3.92 | | | $ | 2.36 | |
| Income from Investment Operations: | | | | | | | | | | | | | | | | | | | | |
Net investment income(2) | | | 0.01 | | | | 0.03 | | | | 0.06 | | | | 0.02 | | | | 0.02 | |
| Net realized and unrealized gain | | | | | | | | | | | | | | | | | | | | |
| (loss) on investments | | | 1.34 | | | | 0.88 | | | | (0.78 | ) | | | 0.78 | | | | 1.55 | |
| Total from investment | | | | | | | | | | | | | | | | | | | | |
| operations | | | 1.35 | | | | 0.91 | | | | (0.72 | ) | | | 0.80 | | | | 1.57 | |
| Redemption Fees | | | 0.00 | (3) | | | 0.00 | (3) | | | 0.00 | (3) | | | 0.00 | (3) | | | 0.01 | |
| Less Distributions: | | | | | | | | | | | | | | | | | | | | |
| From net investment income | | | (0.01 | ) | | | (0.12 | ) | | | (0.03 | ) | | | (0.05 | ) | | | (0.02 | ) |
| Total distributions | | | (0.01 | ) | | | (0.12 | ) | | | (0.03 | ) | | | (0.05 | ) | | | (0.02 | ) |
| Net Asset Value, End of Year | | $ | 6.05 | | | $ | 4.71 | | | $ | 3.92 | | | $ | 4.67 | | | $ | 3.92 | |
| Total return | | | 28.59 | % | | | 23.16 | % | | | (15.41 | )% | | | 20.30 | % | | | 66.86 | % |
| SUPPLEMENTAL DATA AND RATIOS | | | | | | | | | | | | | | | | | | | | |
| Net assets, end of year (000’s) | | $ | 8,705 | | | $ | 5,069 | | | $ | 3,631 | | | $ | 4,541 | | | $ | 4,370 | |
| Ratio of operating expenses to | | | | | | | | | | | | | | | | | | | | |
| average net assets: | | | | | | | | | | | | | | | | | | | | |
| Before expense reimbursement | | | 2.83 | % | | | 3.38 | % | | | 3.94 | % | | | 4.17 | % | | | 5.32 | % |
After expense reimbursement(4) | | | 1.39 | % | | | 1.39 | % | | | 1.39 | % | | | 1.39 | % | | | 1.39 | % |
| Ratio of net investment income (loss) | | | | | | | | | | | | | | | | | | | | |
| to average net assets: | | | | | | | | | | | | | | | | | | | | |
| Before expense reimbursement | | | (1.22 | )% | | | (1.22 | )% | | | (1.11 | )% | | | (2.26 | )% | | | (3.27 | )% |
After expense reimbursement(4) | | | 0.22 | % | | | 0.77 | % | | | 1.44 | % | | | 0.52 | % | | | 0.66 | % |
Portfolio turnover rate(5) | | | 15 | % | | | 23 | % | | | 135 | % | | | 122 | % | | | 53 | % |
| (1) | Information presented relates to a share of capital stock outstanding for each period. |
| (2) | Net investment income per share represents net investment income divided by the average shares outstanding throughout the period. |
| (3) | Amount calculated is less than $0.005. |
| (4) | See Note #3, Investment Adviser, for the waiver and expense reimbursement discussion. |
| (5) | Portfolio turnover of The Global Portfolio. |
The accompanying notes are an integral part of these financial statements.
| KINETICS MUTUAL FUNDS, INC. — THE FEEDER FUNDS |
Financial Highlights — (Continued) |
| | | The Global Fund | |
| | | | | | | | Advisor Class A | | | | | | |
| | | For the | | | For the | | | For the | | | For the | | | For the | |
| | | Year Ended | | | Year Ended | | | Year Ended | | | Year Ended | | | Year Ended | |
| | | December 31, | | | December 31, | | | December 31, | | | December 31, | | | December 31, | |
| | | 2013 | | | 2012 | | | 2011 | | | 2010 | | | 2009 | |
PER SHARE DATA:(1) | | | | | | | | | | | | | | | |
| Net Asset Value, Beginning of Year | | $ | 4.71 | | | $ | 3.92 | | | $ | 4.68 | | | $ | 3.93 | | | $ | 2.36 | |
| Income from Investment Operations: | | | | | | | | | | | | | | | | | | | | |
Net investment income (loss)(2) | | | (0.00 | )(3) | | | 0.02 | | | | 0.05 | | | | 0.01 | | | | 0.01 | |
| Net realized and unrealized gain | | | | | | | | | | | | | | | | | | | | |
| (loss) on investments | | | 1.33 | | | | 0.88 | | | | (0.78 | ) | | | 0.78 | | | | 1.57 | |
| Total from investment | | | | | | | | | | | | | | | | | | | | |
| operations | | | 1.33 | | | | 0.90 | | | | (0.73 | ) | | | 0.79 | | | | 1.58 | |
| Redemption Fees | | | 0.00 | (3) | | | 0.00 | (3) | | | 0.00 | (3) | | | 0.00 | (3) | | | — | |
| Less Distributions: | | | | | | | | | | | | | | | | | | | | |
| From net investment income | | | (0.01 | ) | | | (0.11 | ) | | | (0.03 | ) | | | (0.04 | ) | | | (0.01 | ) |
| Total distributions | | | (0.01 | ) | | | (0.11 | ) | | | (0.03 | ) | | | (0.04 | ) | | | (0.01 | ) |
| Net Asset Value, End of Year | | $ | 6.03 | | | $ | 4.71 | | | $ | 3.92 | | | $ | 4.68 | | | $ | 3.93 | |
Total return(4) | | | 28.16 | % | | | 22.94 | % | | | (15.59 | )% | | | 20.04 | % | | | 67.11 | % |
| SUPPLEMENTAL DATA AND RATIOS | | | | | | | | | | | | | | | | | | | | |
| Net assets, end of year (000’s) | | $ | 1,992 | | | $ | 1,093 | | | $ | 392 | | | $ | 707 | | | $ | 368 | |
| Ratio of operating expenses to average | | | | | | | | | | | | | | | | | | | | |
| net assets: | | | | | | | | | | | | | | | | | | | | |
| Before expense reimbursement | | | 3.08 | % | | | 3.63 | % | | | 4.19 | % | | | 4.42 | % | | | 5.57 | % |
After expense reimbursement(5) | | | 1.64 | % | | | 1.64 | % | | | 1.64 | % | | | 1.64 | % | | | 1.64 | % |
| Ratio of net investment income (loss) to | | | | | | | | | | | | | | | | | | | | |
| average net assets: | | | | | | | | | | | | | | | | | | | | |
| Before expense reimbursement | | | (1.47 | )% | | | (1.47 | )% | | | (1.36 | )% | | | (2.51 | )% | | | (3.52 | )% |
After expense reimbursement(5) | | | (0.03 | )% | | | 0.52 | % | | | 1.19 | % | | | 0.27 | % | | | 0.41 | % |
Portfolio turnover rate(6) | | | 15 | % | | | 23 | % | | | 135 | % | | | 122 | % | | | 53 | % |
| (1) | Information presented relates to a share of capital stock outstanding for each period. |
| (2) | Net investment income per share represents net investment income divided by the average shares outstanding throughout the period. |
| (3) | Amount calculated is less than $0.005. |
| (4) | The total return calculation does not reflect the 5.75% front end sales charge on Advisor Class A shares. |
| (5) | See Note #3, Investment Adviser, for the waiver and expense reimbursement discussion. |
| (6) | Portfolio turnover of The Global Portfolio. |
The accompanying notes are an integral part of these financial statements.
| KINETICS MUTUAL FUNDS, INC. — THE FEEDER FUNDS |
Financial Highlights — (Continued) |
| | | The Global Fund | |
| | | | | | | | Advisor Class C | | | | | | |
| | | For the | | | For the | | | For the | | | For the | | | For the | |
| | | Year Ended | | | Year Ended | | | Year Ended | | | Year Ended | | | Year Ended | |
| | | December 31, | | | December 31, | | | December 31, | | | December 31, | | | December 31, | |
| | | 2013 | | | 2012 | | | 2011 | | | 2010 | | | 2009 | |
PER SHARE DATA:(1) | | | | | | | | | | | | | | | |
| Net Asset Value, Beginning of Year | | $ | 4.62 | | | $ | 3.87 | | | $ | 4.64 | | | $ | 3.90 | | | $ | 2.37 | |
| Income from Investment Operations: | | | | | | | | | | | | | | | | | | | | |
Net investment income (loss)(2) | | | (0.03 | ) | | | 0.00 | (3) | | | 0.03 | | | | (0.01 | ) | | | 0.00 | (3) |
| Net realized and unrealized gain | | | | | | | | | | | | | | | | | | | | |
| (loss) on investments | | | 1.32 | | | | 0.85 | | | | (0.77 | ) | | | 0.77 | | | | 1.53 | |
| Total from investment | | | | | | | | | | | | | | | | | | | | |
| operations | | | 1.29 | | | | 0.85 | | | | (0.74 | ) | | | 0.76 | | | | 1.53 | |
| Redemption Fees | | | — | | | | — | | | | — | | | | — | | | | — | |
| Less Distributions: | | | | | | | | | | | | | | | | | | | | |
| From net investment income | | | (0.01 | ) | | | (0.10 | ) | | | (0.03 | ) | | | (0.02 | ) | | | (0.00 | )(3) |
| Total distributions | | | (0.01 | ) | | | (0.10 | ) | | | (0.03 | ) | | | (0.02 | ) | | | (0.00 | )(3) |
| Net Asset Value, End of Year | | $ | 5.90 | | | $ | 4.62 | | | $ | 3.87 | | | $ | 4.64 | | | $ | 3.90 | |
| Total return | | | 27.84 | % | | | 22.04 | % | | | (15.94 | )% | | | 19.24 | % | | | 65.08 | % |
| SUPPLEMENTAL DATA AND RATIOS | | | | | | | | | | | | | | | | | | | | |
| Net assets, end of year (000’s) | | $ | 1,523 | | | $ | 383 | | | $ | 111 | | | $ | 64 | | | $ | 36 | |
| Ratio of operating expenses to | | | | | | | | | | | | | | | | | | | | |
| average net assets: | | | | | | | | | | | | | | | | | | | | |
| Before expense reimbursement | | | 3.58 | % | | | 4.13 | % | | | 4.69 | % | | | 4.92 | % | | | 6.07 | % |
After expense reimbursement(4) | | | 2.14 | % | | | 2.14 | % | | | 2.14 | % | | | 2.14 | % | | | 2.14 | % |
| Ratio of net investment income (loss) | | | | | | | | | | | | | | | | | | | | |
| to average net assets: | | | | | | | | | | | | | | | | | | | | |
| Before expense reimbursement | | | (1.97 | )% | | | (1.97 | )% | | | (1.86 | )% | | | (3.01 | )% | | | (4.02 | )% |
After expense reimbursement(4) | | | (0.53 | )% | | | 0.02 | % | | | 0.69 | % | | | (0.23 | )% | | | (0.09 | )% |
Portfolio turnover rate(5) | | | 15 | % | | | 23 | % | | | 135 | % | | | 122 | % | | | 53 | % |
| (1) | Information presented relates to a share of capital stock outstanding for each period. |
| (2) | Net investment income per share represents net investment income divided by the average shares outstanding throughout the period. |
| (3) | Amount calculated is less than $0.005. |
| (4) | See Note #3, Investment Adviser, for the waiver and expense reimbursement discussion. |
| (5) | Portfolio turnover of The Global Portfolio. |
The accompanying notes are an integral part of these financial statements.
| KINETICS MUTUAL FUNDS, INC. — THE FEEDER FUNDS |
Financial Highlights — (Continued) |
| | | The Paradigm Fund | |
| | | | | | | | | No Load Class | | | | | | | |
| | | For the | | | For the | | | For the | | | For the | | | For the | |
| | | Year Ended | | | Year Ended | | | Year Ended | | | Year Ended | | | Year Ended | |
| | | December 31, | | | December 31, | | | December 31, | | | December 31, | | | December 31, | |
| | | 2013 | | | 2012 | | | 2011 | | | 2010 | | | 2009 | |
PER SHARE DATA:(1) | | | | | | | | | | | | | | | |
| Net Asset Value, Beginning of Year | | $ | 23.99 | | | $ | 19.81 | | | $ | 23.31 | | | $ | 20.18 | | | $ | 14.42 | |
| Income from Investment Operations: | | | | | | | | | | | | | | | | | | | | |
Net investment income (loss)(2) | | | (0.15 | ) | | | 0.05 | | | | 0.02 | | | | 0.11 | | | | 0.15 | |
| Net realized and unrealized gain | | | | | | | | | | | | | | | | | | | | |
| (loss) on investments | | | 10.72 | | | | 4.25 | | | | (3.34 | ) | | | 3.39 | | | | 5.78 | |
| Total from investment | | | | | | | | | | | | | | | | | | | | |
| operations | | | 10.57 | | | | 4.30 | | | | (3.32 | ) | | | 3.50 | | | | 5.93 | |
Redemption Fees(3) | | | 0.00 | | | | 0.00 | | | | 0.00 | | | | 0.00 | | | | 0.00 | |
| Less Distributions: | | | | | | | | | | | | | | | | | | | | |
| From net investment income | | | (0.21 | ) | | | (0.12 | ) | | | (0.18 | ) | | | (0.37 | ) | | | (0.17 | ) |
| Total distributions | | | (0.21 | ) | | | (0.12 | ) | | | (0.18 | ) | | | (0.37 | ) | | | (0.17 | ) |
| Net Asset Value, End of Year | | $ | 34.35 | | | $ | 23.99 | | | $ | 19.81 | | | $ | 23.31 | | | $ | 20.18 | |
| Total return | | | 44.07 | % | | | 21.78 | % | | | (14.27 | )% | | | 17.37 | % | | | 41.02 | % |
| SUPPLEMENTAL DATA AND RATIOS | | | | | | | | | | | | | | | | | | | | |
| Net assets, end of year (000’s) | | $ | 597,746 | | | $ | 416,696 | | | $ | 430,528 | | | $ | 687,056 | | | $ | 825,278 | |
| Ratio of operating expenses to | | | | | | | | | | | | | | | | | | | | |
| average net assets: | | | | | | | | | | | | | | | | | | | | |
| Before expense reimbursement | | | 1.72 | % | | | 1.78 | % | | | 1.78 | % | | | 1.76 | % | | | 1.73 | % |
After expense reimbursement(4) | | | 1.64 | % | | | 1.64 | % | | | 1.64 | % | | | 1.64 | % | | | 1.64 | % |
| Ratio of net investment income (loss) | | | | | | | | | | | | | | | | | | | | |
| to average net assets: | | | | | | | | | | | | | | | | | | | | |
| Before expense reimbursement | | | (0.60 | )% | | | 0.08 | % | | | (0.03 | )% | | | 0.43 | % | | | 0.78 | % |
After expense reimbursement(4) | | | (0.52 | )% | | | 0.22 | % | | | 0.11 | % | | | 0.55 | % | | | 0.87 | % |
Portfolio turnover rate(5) | | | 4 | % | | | 6 | % | | | 58 | % | | | 7 | % | | | 15 | % |
| (1) | Information presented relates to a share of capital stock outstanding for each period. |
| (2) | Net investment income per share represents net investment income divided by the average shares outstanding throughout the period. |
| (3) | Amount calculated is less than $0.005. |
| (4) | See Note #3, Investment Adviser, for the waiver and expense reimbursement discussion. |
| (5) | Portfolio turnover of The Paradigm Portfolio. |
The accompanying notes are an integral part of these financial statements.
| KINETICS MUTUAL FUNDS, INC. — THE FEEDER FUNDS |
Financial Highlights — (Continued) |
| | | The Paradigm Fund |
| | | | | | | | | Advisor Class A | | | | | | | | |
| | | For the | | | For the | | | For the | | | For the | | | For the | |
| | | Year Ended | | | Year Ended | | | Year Ended | | | Year Ended | | | Year Ended | |
| | | December 31, | | | December 31, | | | December 31, | | | December 31, | | | December 31, | |
| | | 2013 | | | 2012 | | | 2011 | | | 2010 | | | 2009 | |
PER SHARE DATA:(1) | | | | | | | | | | | | | | | | | | | | |
| Net Asset Value, Beginning of Year | | $ | 23.59 | | | $ | 19.45 | | | $ | 22.95 | | | $ | 19.88 | | | $ | 14.16 | |
| Income from Investment Operations: | | | | | | | | | | | | | | | | | | | | |
Net investment income (loss)(2) | | | (0.22 | ) | | | (0.01 | ) | | | (0.03 | ) | | | 0.06 | | | | 0.10 | |
| Net realized and unrealized gain | | | | | | | | | | | | | | | | | | | | |
| (loss) on investments | | | 10.53 | | | | 4.18 | | | | (3.29 | ) | | | 3.33 | | | | 5.68 | |
| Total from investment | | | | | | | | | | | | | | | | | | | | |
| operations | | | 10.31 | | | | 4.17 | | | | (3.32 | ) | | | 3.39 | | | | 5.78 | |
| Redemption Fees | | | 0.00 | (3) | | | 0.00 | | | | 0.00 | | | | 0.00 | | | | — | |
| Less Distributions: | | | | | | | | | | | | | | | | | | | | |
| From net investment income | | | (0.16 | ) | | | (0.03 | ) | | | (0.18 | ) | | | (0.32 | ) | | | (0.06 | ) |
| Total distributions | | | (0.16 | ) | | | (0.03 | ) | | | (0.18 | ) | | | (0.32 | ) | | | (0.06 | ) |
| Net Asset Value, End of Year | | $ | 33.74 | | | $ | 23.59 | | | $ | 19.45 | | | $ | 22.95 | | | $ | 19.88 | |
Total return(4) | | | 43.70 | % | | | 21.49 | % | | | (14.49 | )% | | | 17.11 | % | | | 40.64 | % |
| SUPPLEMENTAL DATA AND RATIOS | | | | | | | | | | | | | | | | | | | | |
| Net assets, end of year (000’s) | | $ | 204,548 | | | $ | 135,747 | | | $ | 146,939 | | | $ | 226,264 | | | $ | 252,106 | |
| Ratio of operating expenses to | | | | | | | | | | | | | | | | | | | | |
| average net assets: | | | | | | | | | | | | | | | | | | | | |
| Before expense reimbursement | | | 1.97 | % | | | 2.03 | % | | | 2.03 | % | | | 2.01 | % | | | 1.98 | % |
After expense reimbursement(5) | | | 1.89 | % | | | 1.89 | % | | | 1.89 | % | | | 1.89 | % | | | 1.89 | % |
| Ratio of net investment income (loss) | | | | | | | | | | | | | | | | | | | | |
| to average net assets: | | | | | | | | | | | | | | | | | | | | |
| Before expense reimbursement | | | (0.85 | )% | | | (0.17 | )% | | | (0.28 | )% | | | 0.18 | % | | | 0.53 | % |
After expense reimbursement(5) | | | (0.77 | )% | | | (0.03 | )% | | | (0.14 | )% | | | 0.30 | % | | | 0.62 | % |
Portfolio turnover rate(6) | | | 4 | % | | | 6 | % | | | 58 | % | | | 7 | % | | | 15 | % |
| (1) | Information presented relates to a share of capital stock outstanding for each period. |
| (2) | Net investment income per share represents net investment income divided by the average shares outstanding throughout the period. |
| (3) | Amount calculated is less than $0.005. |
| (4) | The total return calculation does not reflect the 5.75% front end sales charge on Advisor Class A shares. |
| (5) | See Note #3, Investment Adviser, for the waiver and expense reimbursement discussion. |
| (6) | Portfolio turnover of The Paradigm Portfolio. |
The accompanying notes are an integral part of these financial statements.
| KINETICS MUTUAL FUNDS, INC. — THE FEEDER FUNDS |
Financial Highlights — (Continued) |
| | | The Paradigm Fund | |
| | | | | | | | | Advisor Class C | | | | | | | |
| | | For the | | | For the | | | For the | | | For the | | | For the | |
| | | Year Ended | | | Year Ended | | | Year Ended | | | Year Ended | | | Year Ended | |
| | | December 31, | | | December 31, | | | December 31, | | | December 31, | | | December 31, | |
| | | 2013 | | | 2012 | | | 2011 | | | 2010 | | | 2009 | |
PER SHARE DATA:(1) | | | | | | | | | | | | | | | |
| Net Asset Value, Beginning of Year | | $ | 22.66 | | | $ | 18.76 | | | $ | 22.25 | | | $ | 19.33 | | | $ | 13.80 | |
| Income from Investment Operations: | | | | | | | | | | | | | | | | | | | | |
Net investment income (loss)(2) | | | (0.35 | ) | | | (0.11 | ) | | | (0.14 | ) | | | (0.04 | ) | | | 0.02 | |
| Net realized and unrealized gain | | | | | | | | | | | | | | | | | | | | |
| (loss) on investments | | | 10.10 | | | | 4.01 | | | | (3.17 | ) | | | 3.22 | | | | 5.51 | |
| Total from investment | | | | | | | | | | | | | | | | | | | | |
| operations | | | 9.75 | | | | 3.90 | | | | (3.31 | ) | | | 3.18 | | | | 5.53 | |
Redemption Fees(3) | | | 0.00 | | | | 0.00 | | | | 0.00 | | | | 0.00 | | | | 0.00 | |
| Less Distributions: | | | | | | | | | | | | | | | | | | | | |
| From net investment income | | | (0.03 | ) | | | — | | | | (0.18 | ) | | | (0.26 | ) | | | — | |
| Total distributions | | | (0.03 | ) | | | — | | | | (0.18 | ) | | | (0.26 | ) | | | — | |
| Net Asset Value, End of Year | | $ | 32.38 | | | $ | 22.66 | | | $ | 18.76 | | | $ | 22.25 | | | $ | 19.33 | |
| Total return | | | 43.01 | % | | | 20.85 | % | | | (14.90 | )% | | | 16.45 | % | | | 39.97 | % |
| SUPPLEMENTAL DATA AND RATIOS | | | | | | | | | | | | | | | | | | | | |
| Net assets, end of year (000’s) | | $ | 138,355 | | | $ | 101,405 | | | $ | 102,534 | | | $ | 152,571 | | | $ | 169,578 | |
| Ratio of operating expenses to | | | | | | | | | | | | | | | | | | | | |
| average net assets: | | | | | | | | | | | | | | | | | | | | |
| Before expense reimbursement | | | 2.47 | % | | | 2.53 | % | | | 2.53 | % | | | 2.51 | % | | | 2.48 | % |
After expense reimbursement(4) | | | 2.39 | % | | | 2.39 | % | | | 2.39 | % | | | 2.39 | % | | | 2.39 | % |
| Ratio of net investment income (loss) | | | | | | | | | | | | | | | | | | | | |
| to average net assets: | | | | | | | | | | | | | | | | | | | | |
| Before expense reimbursement | | | (1.35 | )% | | | (0.67 | )% | | | (0.78 | )% | | | (0.32 | )% | | | 0.03 | % |
After expense reimbursement(4) | | | (1.27 | )% | | | (0.53 | )% | | | (0.64 | )% | | | (0.20 | )% | | | 0.12 | % |
Portfolio turnover rate(5) | | | 4 | % | | | 6 | % | | | 58 | % | | | 7 | % | | | 15 | % |
| (1) | Information presented relates to a share of capital stock outstanding for each period. |
| (2) | Net investment income per share represents net investment income divided by the average shares outstanding throughout the period. |
| (3) | Amount calculated is less than $0.005. |
| (4) | See Note #3, Investment Adviser, for the waiver and expense reimbursement discussion. |
| (5) | Portfolio turnover of The Paradigm Portfolio. |
The accompanying notes are an integral part of these financial statements.
| KINETICS MUTUAL FUNDS, INC. — THE FEEDER FUNDS |
Financial Highlights — (Continued) |
| | | The Paradigm Fund | |
| | | | | | | | | Institutional Class | | | | | | | |
| | | For the | | | For the | | | For the | | | For the | | | For the | |
| | | Year Ended | | | Year Ended | | | Year Ended | | | Year Ended | | | Year Ended | |
| | | December 31, | | | December 31, | | | December 31, | | | December 31, | | | December 31, | |
| | | 2013 | | | 2012 | | | 2011 | | | 2010 | | | 2009 | |
PER SHARE DATA:(1) | | | | | | | | | | | | | | | |
| Net Asset Value, Beginning of Year | | $ | 23.93 | | | $ | 19.79 | | | $ | 23.25 | | | $ | 20.13 | | | $ | 14.44 | |
| Income from Investment Operations: | | | | | | | | | | | | | | | | | | | | |
Net investment income (loss)(2) | | | (0.09 | ) | | | 0.10 | | | | 0.07 | | | | 0.16 | | | | 0.18 | |
| Net realized and unrealized gain | | | | | | | | | | | | | | | | | | | | |
| (loss) on investments | | | 10.70 | | | | 4.24 | | | | (3.35 | ) | | | 3.38 | | | | 5.78 | |
| Total from investment | | | | | | | | | | | | | | | | | | | | |
| operations | | | 10.61 | | | | 4.34 | | | | (3.28 | ) | | | 3.54 | | | | 5.96 | |
Redemption Fees(3) | | | 0.00 | | | | 0.00 | | | | 0.00 | | | | 0.00 | | | | 0.00 | |
| Less Distributions: | | | | | | | | | | | | | | | | | | | | |
| From net investment income | | | (0.26 | ) | | | (0.20 | ) | | | (0.18 | ) | | | (0.42 | ) | | | (0.27 | ) |
| Total distributions | | | (0.26 | ) | | | (0.20 | ) | | | (0.18 | ) | | | (0.42 | ) | | | (0.27 | ) |
| Net Asset Value, End of Year | | $ | 34.28 | | | $ | 23.93 | | | $ | 19.79 | | | $ | 23.25 | | | $ | 20.13 | |
| Total return | | | 44.40 | % | | | 21.99 | % | | | (14.13 | )% | | | 17.62 | % | | | 41.31 | % |
| SUPPLEMENTAL DATA AND RATIOS | | | | | | | | | | | | | | | | | | | | |
| Net assets, end of year (000’s) | | $ | 333,682 | | | $ | 192,478 | | | $ | 134,309 | | | $ | 142,261 | | | $ | 125,372 | |
| Ratio of operating expenses to | | | | | | | | | | | | | | | | | | | | |
| average net assets: | | | | | | | | | | | | | | | | | | | | |
| Before expense reimbursement | | | 1.67 | % | | | 1.73 | % | | | 1.73 | % | | | 1.71 | % | | | 1.68 | % |
After expense reimbursement(4) | | | 1.44 | % | | | 1.44 | % | | | 1.44 | % | | | 1.44 | % | | | 1.44 | % |
| Ratio of net investment income | | | | | | | | | | | | | | | | | | | | |
| (loss) to average net assets: | | | | | | | | | | | | | | | | | | | | |
| Before expense reimbursement | | | (0.55 | )% | | | 0.13 | % | | | 0.02 | % | | | 0.48 | % | | | 0.83 | % |
After expense reimbursement(4) | | | (0.32 | )% | | | 0.42 | % | | | 0.31 | % | | | 0.75 | % | | | 1.07 | % |
Portfolio turnover rate(5) | | | 4 | % | | | 6 | % | | | 58 | % | | | 7 | % | | | 15 | % |
| (1) | Information presented relates to a share of capital stock outstanding for each period. |
| (2) | Net investment income per share represents net investment income divided by the average shares outstanding throughout the period. |
| (3) | Amount calculated is less than $0.005. |
| (4) | See Note #3, Investment Adviser, for the waiver and expense reimbursement discussion. |
| (5) | Portfolio turnover of The Paradigm Portfolio. |
The accompanying notes are an integral part of these financial statements.
| KINETICS MUTUAL FUNDS, INC. — THE FEEDER FUNDS |
Financial Highlights — (Continued) |
| | | | The Medical Fund |
| | | | | | | | | No Load Class | | | | | | | |
| | | For the | | For the | | For the | | For the | | For the | |
| | | Year Ended | | Year Ended | | Year Ended | | Year Ended | | Year Ended | |
| | | December 31, | | December 31, | | December 31, | | December 31, | | December 31, | |
| | | 2013 | | 2012 | | 2011 | | 2010 | | 2009 | |
PER SHARE DATA:(1) | | | | | | | | | | | | | | | | |
| Net Asset Value, Beginning of Year | | $ | 17.82 | | $ | 18.75 | | $ | 19.48 | | $ | 18.77 | | $ | 15.23 | |
| Income from Investment Operations: | | | | | | | | | | | | | | | | |
Net investment income(2) | | | (0.00 | )(3) | | 0.33 | | | 0.18 | | | 0.10 | | | 0.20 | |
| Net realized and unrealized gain | | | | | | | | | | | | | | | | |
| on investments | | | 8.77 | | | 1.32 | | | 0.82 | | | 0.72 | | | 3.51 | |
| Total from investment | | | | | | | | | | | | | | | | |
| operations | | | 8.77 | | | 1.65 | | | 1.00 | | | 0.82 | | | 3.71 | |
| Redemption Fees | | | 0.00 | (3) | | 0.00 | | | 0.00 | | | 0.00 | | | 0.01 | |
| Less Distributions: | | | | | | | | | | | | | | | | |
| From net investment income | | | (0.06 | ) | | (0.36 | ) | | (0.25 | ) | | (0.11 | ) | | (0.16 | ) |
| From net realized gains | | | (0.15 | ) | | (2.22 | ) | | (1.48 | ) | | — | | | (0.02 | ) |
| Total distributions | | | (0.21 | ) | | (2.58 | ) | | (1.73 | ) | | (0.11 | ) | | (0.18 | ) |
| Net Asset Value, End of Year | | $ | 26.38 | | $ | 17.82 | | $ | 18.75 | | $ | 19.48 | | $ | 18.77 | |
| Total return | | | 49.25 | % | | 8.86 | % | | 5.11 | % | | 4.30 | % | | 24.47 | % |
| SUPPLEMENTAL DATA AND RATIOS | | | | | | | | | | | | | | | | |
| Net assets, end of year (000’s) | | $ | 20,489 | | $ | 14,254 | | $ | 16,376 | | $ | 25,777 | | $ | 21,126 | |
| Ratio of operating expenses to average | | | | | | | | | | | | | | | | |
| net assets: | | | | | | | | | | | | | | | | |
| Before expense reimbursement | | | 2.09 | % | | 2.22 | % | | 2.02 | % | | 2.00 | % | | 2.15 | % |
After expense reimbursement(4) | | | 1.39 | % | | 1.39 | % | | 1.39 | % | | 1.39 | % | | 1.39 | % |
| Ratio of net investment income (loss) | | | | | | | | | | | | | | | | |
| to average net assets: | | | | | | | | | | | | | | | | |
| Before expense reimbursement | | | (0.70 | )% | | 0.83 | % | | 0.24 | % | | (0.06 | )% | | 0.42 | % |
After expense reimbursement(4) | | | 0.00 | % | | 1.66 | % | | 0.87 | % | | 0.55 | % | | 1.17 | % |
Portfolio turnover rate(5) | | | 12 | % | | 0 | % | | 5 | % | | 3 | % | | 13 | % |
| (1) | Information presented relates to a share of capital stock outstanding for each period. |
| (2) | Net investment income per share represents net investment income divided by the average shares outstanding throughout the period. |
| (3) | Amount calculated is less than $0.005. |
| (4) | See Note #3, Investment Adviser, for the waiver and expense reimbursement discussion. |
| (5) | Portfolio turnover of The Medical Portfolio. |
The accompanying notes are an integral part of these financial statements.
| KINETICS MUTUAL FUNDS, INC. — THE FEEDER FUNDS |
Financial Highlights — (Continued) |
| | | The Medical Fund | |
| | | | | | | | | Advisor Class A | | | | | | | |
| | | For the | | | For the | | | For the | | | For the | | | For the | |
| | | Year Ended | | | Year Ended | | | Year Ended | | | Year Ended | | | Year Ended | |
| | | December 31, | | | December 31, | | | December 31, | | | December 31, | | | December 31, | |
| | | 2013 | | | 2012 | | | 2011 | | | 2010 | | | 2009 | |
PER SHARE DATA:(1) | | | | | | | | | | | | | | | |
| Net Asset Value, Beginning of Year | | $ | 17.33 | | | $ | 18.29 | | | $ | 19.06 | | | $ | 18.36 | | | $ | 14.90 | |
| Income from Investment Operations: | | | | | | | | | | | | | | | | | | | | |
Net investment income(2) | | | (0.06 | ) | | | 0.27 | | | | 0.12 | | | | 0.05 | | | | 0.15 | |
| Net realized and unrealized gain | | | | | | | | | | | | | | | | | | | | |
| on investments | | | 8.52 | | | | 1.29 | | | | 0.80 | | | | 0.71 | | | | 3.44 | |
| Total from investment | | | | | | | | | | | | | | | | | | | | |
| operations | | | 8.46 | | | | 1.56 | | | | 0.92 | | | | 0.76 | | | | 3.59 | |
| Redemption Fees | | | 0.01 | | | | 0.00 | (3) | | | 0.00 | (3) | | | 0.00 | (3) | | | 0.01 | |
| Less Distributions: | | | | | | | | | | | | | | | | | | | | |
| From net investment income | | | (0.03 | ) | | | (0.30 | ) | | | (0.21 | ) | | | (0.06 | ) | | | (0.12 | ) |
| From net realized gains | | | (0.15 | ) | | | (2.22 | ) | | | (1.48 | ) | | | — | | | | (0.02 | ) |
| Total distributions | | | (0.18 | ) | | | (2.52 | ) | | | (1.69 | ) | | | (0.06 | ) | | | (0.14 | ) |
| Net Asset Value, End of Year | | $ | 25.62 | | | $ | 17.33 | | | $ | 18.29 | | | $ | 19.06 | | | $ | 18.36 | |
Total return(4) | | | 48.90 | % | | | 8.60 | % | | | 4.79 | % | | | 4.13 | % | | | 24.17 | % |
| SUPPLEMENTAL DATA AND RATIOS | | | | | | | | | | | | | | | | | | | | |
| Net assets, end of year (000’s) | | $ | 3,746 | | | $ | 2,583 | | | $ | 3,240 | | | $ | 4,207 | | | $ | 4,347 | |
| Ratio of operating expenses to | | | | | | | | | | | | | | | | | | | | |
| average net assets: | | | | | | | | | | | | | | | | | | | | |
| Before expense reimbursement | | | 2.34 | % | | | 2.47 | % | | | 2.27 | % | | | 2.25 | % | | | 2.40 | % |
After expense reimbursement(5) | | | 1.64 | % | | | 1.64 | % | | | 1.64 | % | | | 1.64 | % | | | 1.64 | % |
| Ratio of net investment income | | | | | | | | | | | | | | | | | | | | |
| (loss) to average net assets: | | | | | | | | | | | | | | | | | | | | |
| Before expense reimbursement | | | (0.95 | )% | | | 0.58 | % | | | (0.01 | )% | | | (0.31 | )% | | | 0.17 | % |
After expense reimbursement(5) | | | (0.25 | )% | | | 1.41 | % | | | 0.62 | % | | | 0.30 | % | | | 0.92 | % |
Portfolio turnover rate(6) | | | 12 | % | | | 0 | % | | | 5 | % | | | 3 | % | | | 13 | % |
| (1) | Information presented relates to a share of capital stock outstanding for each period. |
| (2) | Net investment income per share represents net investment income divided by the average shares outstanding throughout the period. |
| (3) | Amount calculated is less than $0.005. |
| (4) | The total return calculation does not reflect the 5.75% front end sales charge on Advisor Class A shares. |
| (5) | See Note #3, Investment Adviser, for the waiver and expense reimbursement discussion. |
| (6) | Portfolio turnover of The Medical Portfolio. |
The accompanying notes are an integral part of these financial statements.
| KINETICS MUTUAL FUNDS, INC. — THE FEEDER FUNDS |
Financial Highlights — (Continued) |
| | | The Medical Fund | |
| | | | | | | | | Advisor Class C | | | | | | | |
| | | For the | | | For the | | | For the | | | For the | | | For the | |
| | | Year Ended | | | Year Ended | | | Year Ended | | | Year Ended | | | Year Ended | |
| | | December 31, | | | December 31, | | | December 31, | | | December 31, | | | December 31, | |
| | | 2013 | | | 2012 | | | 2011 | | | 2010 | | | 2009 | |
PER SHARE DATA:(1) | | | | | | | | | | | | | | | |
| Net Asset Value, Beginning of Year | | $ | 17.19 | | | $ | 18.15 | | | $ | 18.90 | | | $ | 18.27 | | | $ | 14.83 | |
| Income from Investment Operations: | | | | | | | | | | | | | | | | | | | | |
Net investment income (loss)(2) | | | (0.16 | ) | | | 0.17 | | | | 0.02 | | | | (0.04 | ) | | | 0.07 | |
| Net realized and unrealized gain | | | | | | | | | | | | | | | | | | | | |
| on investments | | | 8.42 | | | | 1.29 | | | | 0.80 | | | | 0.69 | | | | 3.41 | |
| Total from investment | | | | | | | | | | | | | | | | | | | | |
| operations | | | 8.26 | | | | 1.46 | | | | 0.82 | | | | 0.65 | | | | 3.48 | |
| Redemption Fees | | | — | | | | — | | | | 0.00 | (3) | | | — | | | | 0.00 | (3) |
| Less Distributions: | | | | | | | | | | | | | | | | | | | | |
| From net investment income | | | (0.03 | ) | | | (0.20 | ) | | | (0.09 | ) | | | (0.02 | ) | | | (0.02 | ) |
| From net realized gains | | | (0.15 | ) | | | (2.22 | ) | | | (1.48 | ) | | | — | | | | (0.02 | ) |
| Total distributions | | | (0.18 | ) | | | (2.42 | ) | | | (1.57 | ) | | | (0.02 | ) | | | (0.04 | ) |
| Net Asset Value, End of Year | | $ | 25.27 | | | $ | 17.19 | | | $ | 18.15 | | | $ | 18.90 | | | $ | 18.27 | |
| Total return | | | 48.08 | % | | | 8.08 | % | | | 4.32 | % | | | 3.55 | % | | | 23.50 | % |
| SUPPLEMENTAL DATA AND RATIOS | | | | | | | | | | | | | | | | | | | | �� |
| Net assets, end of year (000’s) | | $ | 531 | | | $ | 450 | | | $ | 580 | | | $ | 692 | | | $ | 454 | |
| Ratio of operating expenses to | | | | | | | | | | | | | | | | | | | | |
| average net assets: | | | | | | | | | | | | | | | | | | | | |
| Before expense reimbursement | | | 2.84 | % | | | 2.97 | % | | | 2.77 | % | | | 2.75 | % | | | 2.90 | % |
After expense reimbursement(4) | | | 2.14 | % | | | 2.14 | % | | | 2.14 | % | | | 2.14 | % | | | 2.14 | % |
| Ratio of net investment income | | | | | | | | | | | | | | | | | | | | |
| (loss) to average net assets: | | | | | | | | | | | | | | | | | | | | |
| Before expense reimbursement | | | (1.45 | )% | | | 0.08 | % | | | (0.51 | )% | | | (0.81 | )% | | | (0.33 | )% |
After expense reimbursement(4) | | | (0.75 | )% | | | 0.91 | % | | | 0.12 | % | | | (0.20 | )% | | | 0.42 | % |
Portfolio turnover rate(5) | | | 12 | % | | | 0 | % | | | 5 | % | | | 3 | % | | | 13 | % |
| (1) | Information presented relates to a share of capital stock outstanding for each period. |
| (2) | Net investment income per share represents net investment income divided by the average shares outstanding throughout the period. |
| (3) | Amount calculated is less than $0.005. |
| (4) | See Note #3, Investment Adviser, for the waiver and expense reimbursement discussion. |
| (5) | Portfolio turnover of The Medical Portfolio. |
The accompanying notes are an integral part of these financial statements.
| KINETICS MUTUAL FUNDS, INC. — THE FEEDER FUNDS |
Financial Highlights — (Continued) |
| | | The Small Cap Opportunities Fund | |
| | | | | | | | | No Load Class | | | | | | | |
| | | For the | | | For the | | | For the | | | For the | | | For the | |
| | | Year Ended | | | Year Ended | | | Year Ended | | | Year Ended | | | Year Ended | |
| | | December 31, | | | December 31, | | | December 31, | | | December 31, | | | December 31, | |
| | | 2013 | | | 2012 | | | 2011 | | | 2010 | | | 2009 | |
PER SHARE DATA:(1) | | | | | | | | | | | | | | | |
| Net Asset Value, Beginning of Year | | $ | 25.17 | | | $ | 19.85 | | | $ | 23.32 | | | $ | 20.83 | | | $ | 13.17 | |
| Income from Investment Operations: | | | | | | | | | | | | | | | | | | | | |
Net investment income (loss)(2) | | | (0.10 | ) | | | 0.01 | | | | (0.04 | ) | | | (0.04 | ) | | | (0.04 | ) |
| Net realized and unrealized gain | | | | | | | | | | | | | | | | | | | | |
| (loss) on investments | | | 15.05 | | | | 5.31 | | | | (3.15 | ) | | | 2.93 | | | | 7.70 | |
| Total from investment | | | | | | | | | | | | | | | | | | | | |
| operations | | | 14.95 | | | | 5.32 | | | | (3.19 | ) | | | 2.89 | | | | 7.66 | |
Redemption Fees(3) | | | 0.00 | | | | 0.00 | | | | 0.00 | | | | 0.00 | | | | 0.00 | |
| Less Distributions: | | | | | | | | | | | | | | | | | | | | |
| From net investment income | | | — | | | | — | | | | (0.28 | ) | | | (0.40 | ) | | | — | |
| Total distributions | | | — | | | | — | | | | (0.28 | ) | | | (0.40 | ) | | | — | |
| Net Asset Value, End of Year | | $ | 40.12 | | | $ | 25.17 | | | $ | 19.85 | | | $ | 23.32 | | | $ | 20.83 | |
| Total return | | | 59.40 | % | | | 26.74 | % | | | (13.65 | )% | | | 13.86 | % | | | 58.16 | % |
| SUPPLEMENTAL DATA AND RATIOS | | | | | | | | | | | | | | | | | | | | |
| Net assets, end of year (000’s) | | $ | 277,816 | | | $ | 63,947 | | | $ | 67,798 | | | $ | 130,279 | | | $ | 161,205 | |
| Ratio of operating expenses to | | | | | | | | | | | | | | | | | | | | |
| average net assets: | | | | | | | | | | | | | | | | | | | | |
| Before expense reimbursement | | | 1.73 | % | | | 1.96 | % | | | 1.90 | % | | | 1.86 | % | | | 1.86 | % |
After expense reimbursement(4) | | | 1.64 | % | | | 1.64 | % | | | 1.64 | % | | | 1.64 | % | | | 1.64 | % |
| Ratio of net investment income | | | | | | | | | | | | | | | | | | | | |
| (loss) to average net assets: | | | | | | | | | | | | | | | | | | | | |
| Before expense reimbursement | | | (0.38 | )% | | | (0.25 | )% | | | (0.44 | )% | | | (0.42 | )% | | | (0.48 | )% |
After expense reimbursement(4) | | | (0.29 | )% | | | 0.07 | % | | | (0.18 | )% | | | (0.20 | )% | | | (0.26 | )% |
Portfolio turnover rate(5) | | | 6 | % | | | 22 | % | | | 47 | % | | | 4 | % | | | 4 | % |
| (1) | Information presented relates to a share of capital stock outstanding for each period. |
| (2) | Net investment income per share represents net investment income divided by the average shares outstanding throughout the period. |
| (3) | Amount calculated is less than $0.005. |
| (4) | See Note #3, Investment Adviser, for the waiver and expense reimbursement discussion. |
| (5) | Portfolio turnover of The Small Cap Opportunities Portfolio. |
The accompanying notes are an integral part of these financial statements.
| KINETICS MUTUAL FUNDS, INC. — THE FEEDER FUNDS |
Financial Highlights — (Continued) |
| | | The Small Cap Opportunities Fund | |
| | | | | | | | | Advisor Class A | | | | | | | |
| | | For the | | | For the | | | For the | | | For the | | | For the | |
| | | Year Ended | | | Year Ended | | | Year Ended | | | Year Ended | | | Year Ended | |
| | | December 31, | | | December 31, | | | December 31, | | | December 31, | | | December 31, | |
| | | 2013 | | | 2012 | | | 2011 | | | 2010 | | | 2009 | |
PER SHARE DATA:(1) | | | | | | | | | | | | | | | |
| Net Asset Value, Beginning of Year | | $ | 24.77 | | | $ | 19.59 | | | $ | 22.98 | | | $ | 20.53 | | | $ | 13.01 | |
| Income from Investment Operations: | | | | | | | | | | | | | | | | | | | | |
Net investment loss(2) | | | (0.18 | ) | | | (0.04 | ) | | | (0.10 | ) | | | (0.09 | ) | | | (0.08 | ) |
| Net realized and unrealized gain | | | | | | | | | | | | | | | | | | | | |
| (loss) on investments | | | 14.79 | | | | 5.22 | | | | (3.08 | ) | | | 2.87 | | | | 7.60 | |
| Total from investment | | | | | | | | | | | | | | | | | | | | |
| operations | | | 14.61 | | | | 5.18 | | | | (3.18 | ) | | | 2.78 | | | | 7.52 | |
| Redemption Fees | | | 0.01 | | | | 0.00 | (3) | | | 0.00 | (3) | | | 0.00 | (3) | | | 0.00 | (3) |
| Less Distributions: | | | | | | | | | | | | | | | | | | | | |
| From net investment income | | | — | | | | — | | | | (0.21 | ) | | | (0.33 | ) | | | — | |
| Total distributions | | | — | | | | — | | | | (0.21 | ) | | | (0.33 | ) | | | — | |
| Net Asset Value, End of Year | | $ | 39.39 | | | $ | 24.77 | | | $ | 19.59 | | | $ | 22.98 | | | $ | 20.53 | |
Total return(4) | | | 59.02 | % | | | 26.44 | % | | | (13.85 | )% | | | 13.56 | % | | | 57.80 | % |
| SUPPLEMENTAL DATA AND RATIOS | | | | | | | | | | | | | | | | | | | | |
| Net assets, end of year (000’s) | | $ | 21,871 | | | $ | 7,558 | | | $ | 7,250 | | | $ | 11,509 | | | $ | 14,244 | |
| Ratio of operating expenses to | | | | | | | | | | | | | | | | | | | | |
| average net assets: | | | | | | | | | | | | | | | | | | | | |
| Before expense reimbursement | | | 1.98 | % | | | 2.21 | % | | | 2.15 | % | | | 2.11 | % | | | 2.11 | % |
After expense reimbursement(5) | | | 1.89 | % | | | 1.89 | % | | | 1.89 | % | | | 1.89 | % | | | 1.89 | % |
| Ratio of net investment loss to | | | | | | | | | | | | | | | | | | | | |
| average net assets: | | | | | | | | | | | | | | | | | | | | |
| Before expense reimbursement | | | (0.63 | )% | | | (0.50 | )% | | | (0.69 | )% | | | (0.67 | )% | | | (0.73 | )% |
After expense reimbursement(5) | | | (0.54 | )% | | | (0.18 | )% | | | (0.43 | )% | | | (0.45 | )% | | | (0.51 | )% |
Portfolio turnover rate(6) | | | 6 | % | | | 22 | % | | | 47 | % | | | 4 | % | | | 4 | % |
| (1) | Information presented relates to a share of capital stock outstanding for each period. |
| (2) | Net investment income per share represents net investment income divided by the average shares outstanding throughout the period. |
| (3) | Amount calculated is less than $0.005. |
| (4) | The total return calculation does not reflect the 5.75% front end sales charge on Advisor Class A shares. |
| (5) | See Note #3, Investment Adviser, for the waiver and expense reimbursement discussion. |
| (6) | Portfolio turnover of The Small Cap Opportunities Portfolio. |
The accompanying notes are an integral part of these financial statements.
| KINETICS MUTUAL FUNDS, INC. — THE FEEDER FUNDS |
Financial Highlights — (Continued) |
| | | The Small Cap Opportunities Fund | |
| | | | | | | | | Advisor Class C | | | | | | | |
| | | For the | | | For the | | | For the | | | For the | | | For the | |
| | | Year Ended | | | Year Ended | | | Year Ended | | | Year Ended | | | Year Ended | |
| | | December 31, | | | December 31, | | | December 31, | | | December 31, | | | December 31, | |
| | | 2013 | | | 2012 | | | 2011 | | | 2010 | | | 2009 | |
PER SHARE DATA:(1) | | | | | | | | | | | | | | | |
| Net Asset Value, Beginning of Year | | $ | 24.35 | | | $ | 19.36 | | | $ | 22.68 | | | $ | 20.28 | | | $ | 12.92 | |
| Income from Investment Operations: | | | | | | | | | | | | | | | | | | | | |
Net investment loss(2) | | | (0.34 | ) | | | (0.15 | ) | | | (0.20 | ) | | | (0.20 | ) | | | (0.16 | ) |
| Net realized and unrealized gain | | | | | | | | | | | | | | | | | | | | |
| (loss) on investments | | | 14.51 | | | | 5.14 | | | | (3.04 | ) | | | 2.84 | | | | 7.52 | |
| Total from investment | | | | | | | | | | | | | | | | | | | | |
| operations | | | 14.17 | | | | 4.99 | | | | (3.24 | ) | | | 2.64 | | | | 7.36 | |
| Redemption Fees | | | 0.01 | | | | — | | | | — | | | | — | | | | 0.00 | (3) |
| Less Distributions: | | | | | | | | | | | | | | | | | | | | |
| From net investment income | | | — | | | | — | | | | (0.08 | ) | | | (0.24 | ) | | | — | |
| Total distributions | | | — | | | | — | | | | (0.08 | ) | | | (0.24 | ) | | | — | |
| Net Asset Value, End of Year | | $ | 38.53 | | | $ | 24.35 | | | $ | 19.36 | | | $ | 22.68 | | | $ | 20.28 | |
| Total return | | | 58.23 | % | | | 25.77 | % | | | (14.29 | )% | | | 13.00 | % | | | 56.97 | % |
| SUPPLEMENTAL DATA AND RATIOS | | | | | | | | | | | | | | | | | | | | |
| Net assets, end of year (000’s) | | $ | 7,178 | | | $ | 2,536 | | | $ | 2,440 | | | $ | 3,450 | | | $ | 4,445 | |
| Ratio of operating expenses to | | | | | | | | | | | | | | | | | | | | |
| average net assets: | | | | | | | | | | | | | | | | | | | | |
| Before expense reimbursement | | | 2.48 | % | | | 2.71 | % | | | 2.65 | % | | | 2.61 | % | | | 2.61 | % |
After expense reimbursement(4) | | | 2.39 | % | | | 2.39 | % | | | 2.39 | % | | | 2.39 | % | | | 2.39 | % |
| Ratio of net investment loss to | | | | | | | | | | | | | | | | | | | | |
| average net assets: | | | | | | | | | | | | | | | | | | | | |
| Before expense reimbursement | | | (1.13 | )% | | | (1.00 | )% | | | (1.19 | )% | | | (1.17 | )% | | | (1.23 | )% |
After expense reimbursement(4) | | | (1.04 | )% | | | (0.68 | )% | | | (0.93 | )% | | | (0.95 | )% | | | (1.01 | )% |
Portfolio turnover rate(5) | | | 6 | % | | | 22 | % | | | 47 | % | | | 4 | % | | | 4 | % |
| (1) | Information presented relates to a share of capital stock outstanding for each period. |
| (2) | Net investment income per share represents net investment income divided by the average shares outstanding throughout the period. |
| (3) | Amount calculated is less than $0.005. |
| (4) | See Note #3, Investment Adviser, for the waiver and expense reimbursement discussion. |
| (5) | Portfolio turnover of The Small Cap Opportunities Portfolio. |
The accompanying notes are an integral part of these financial statements.
| KINETICS MUTUAL FUNDS, INC. — THE FEEDER FUNDS |
Financial Highlights — (Continued) |
| | | The Small Cap Opportunities Fund | |
| | | | | | | | | Institutional Class | | | | | | | |
| | | For the | | | For the | | | For the | | | For the | | | For the | |
| | | Year Ended | | | Year Ended | | | Year Ended | | | Year Ended | | | Year Ended | |
| | | December 31, | | | December 31, | | | December 31, | | | December 31, | | | December 31, | |
| | | 2013 | | | 2012 | | | 2011 | | | 2010 | | | 2009 | |
PER SHARE DATA:(1) | | | | | | | | | | | | | | | |
| Net Asset Value, Beginning of Year | | $ | 25.32 | | | $ | 19.93 | | | $ | 23.45 | | | $ | 20.90 | | | $ | 13.19 | |
| Income from Investment Operations: | | | | | | | | | | | | | | | | | | | | |
Net investment income (loss)(2) | | | (0.03 | ) | | | 0.06 | | | | 0.00 | (3) | | | 0.00 | (3) | | | (0.01 | ) |
| Net realized and unrealized gain | | | | | | | | | | | | | | | | | | | | |
| (loss) on investments | | | 15.15 | | | | 5.33 | | | | (3.17 | ) | | | 2.95 | | | | 7.72 | |
| Total from investment | | | | | | | | | | | | | | | | | | | | |
| operations | | | 15.12 | | | | 5.39 | | | | (3.17 | ) | | | 2.95 | | | | 7.71 | |
| Redemption Fees | | | — | | | | 0.00 | (3) | | | 0.00 | (3) | | | 0.00 | (3) | | | 0.00 | (3) |
| Less Distributions: | | | | | | | | | | | | | | | | | | | | |
| From net investment income | | | — | | | | — | | | | (0.35 | ) | | | (0.40 | ) | | | — | |
| Total distributions | | | — | | | | — | | | | (0.35 | ) | | | (0.40 | ) | | | — | |
| Net Asset Value, End of Year | | $ | 40.44 | | | $ | 25.32 | | | $ | 19.93 | | | $ | 23.45 | | | $ | 20.90 | |
| Total return | | | 59.72 | % | | | 27.04 | % | | | (13.51 | )% | | | 14.10 | % | | | 58.45 | % |
| SUPPLEMENTAL DATA AND RATIOS | | | | | | | | | | | | | | | | | | | | |
| Net assets, end of year (000’s) | | $ | 41,032 | | | $ | 7,482 | | | $ | 5,498 | | | $ | 9,808 | | | $ | 19,749 | |
| Ratio of operating expenses to | | | | | | | | | | | | | | | | | | | | |
| average net assets: | | | | | | | | | | | | | | | | | | | | |
| Before expense reimbursement | | | 1.68 | % | | | 1.91 | % | | | 1.85 | % | | | 1.81 | % | | | 1.81 | % |
After expense reimbursement(4) | | | 1.44 | % | | | 1.44 | % | | | 1.44 | % | | | 1.44 | % | | | 1.44 | % |
| Ratio of net investment income | | | | | | | | | | | | | | | | | | | | |
| (loss) to average net assets: | | | | | | | | | | | | | | | | | | | | |
| Before expense reimbursement | | | (0.33 | )% | | | (0.20 | )% | | | (0.39 | )% | | | (0.37 | )% | | | (0.43 | )% |
After expense reimbursement(4) | | | (0.09 | )% | | | 0.27 | % | | | 0.02 | % | | | 0.00 | % | | | (0.06 | )% |
Portfolio turnover rate(5) | | | 6 | % | | | 22 | % | | | 47 | % | | | 4 | % | | | 4 | % |
| (1) | Information presented relates to a share of capital stock outstanding for each period. |
| (2) | Net investment income per share represents net investment income divided by the average shares outstanding throughout the period. |
| (3) | Amount calculated is less than $0.005. |
| (4) | See Note #3, Investment Adviser, for the waiver and expense reimbursement discussion. |
| (5) | Portfolio turnover of The Small Cap Opportunities Portfolio. |
The accompanying notes are an integral part of these financial statements.
| KINETICS MUTUAL FUNDS, INC. — THE FEEDER FUNDS |
Financial Highlights — (Continued) |
| | | The Market Opportunities Fund | |
| | | | | | | | | No Load Class | | | | | | | |
| | | For the | | | For the | | | For the | | | For the | | | For the | |
| | | Year Ended | | | Year Ended | | | Year Ended | | | Year Ended | | | Year Ended | |
| | | December 31, | | | December 31, | | | December 31, | | | December 31, | | | December 31, | |
| | | 2013 | | | 2012 | | | 2011 | | | 2010 | | | 2009 | |
PER SHARE DATA:(1) | | | | | | | | | | | | | | | |
| Net Asset Value, Beginning of Year | | $ | 12.08 | | | $ | 10.45 | | | $ | 11.46 | | | $ | 10.84 | | | $ | 7.22 | |
| Income from Investment Operations: | | | | | | | | | | | | | | | | | | | | |
Net investment income(2) | | | 0.00 | (3) | | | 0.03 | | | | 0.01 | | | | 0.04 | | | | 0.00 | (3) |
| Net realized and unrealized gain | | | | | | | | | | | | | | | | | | | | |
| (loss) on investments | | | 5.65 | | | | 1.80 | | | | (0.91 | ) | | | 1.18 | | | | 3.62 | |
| Total from investment | | | | | | | | | | | | | | | | | | | | |
| operations | | | 5.65 | | | | 1.83 | | | | (0.90 | ) | | | 1.22 | | | | 3.62 | |
| Redemption Fees | | | 0.00 | (3) | | | 0.00 | (3) | | | 0.00 | (3) | | | 0.00 | (3) | | | 0.01 | |
| Less Distributions: | | | | | | | | | | | | | | | | | | | | |
| From net investment income | | | (0.07 | ) | | | (0.20 | ) | | | (0.11 | ) | | | (0.60 | ) | | | (0.01 | ) |
| Total distributions | | | (0.07 | ) | | | (0.20 | ) | | | (0.11 | ) | | | (0.60 | ) | | | (0.01 | ) |
| Net Asset Value, End of Year | | $ | 17.66 | | | $ | 12.08 | | | $ | 10.45 | | | $ | 11.46 | | | $ | 10.84 | |
| Total return | | | 46.74 | % | | | 17.52 | % | | | (7.85 | )% | | | 11.31 | % | | | 50.21 | % |
| SUPPLEMENTAL DATA AND RATIOS | | | | | | | | | | | | | | | | | | | | |
| Net assets, end of year (000’s) | | $ | 47,466 | | | $ | 32,929 | | | $ | 30,191 | | | $ | 38,562 | | | $ | 41,254 | |
| Ratio of operating expenses to | | | | | | | | | | | | | | | | | | | | |
| average net assets: | | | | | | | | | | | | | | | | | | | | |
| Before expense reimbursement | | | 1.88 | % | | | 1.97 | % | | | 1.93 | % | | | 1.92 | % | | | 1.93 | % |
After expense reimbursement(4) | | | 1.64 | % | | | 1.64 | % | | | 1.64 | % | | | 1.64 | % | | | 1.64 | % |
| Ratio of net investment income (loss) | | | | | | | | | | | | | | | | | | | | |
| to average net assets: | | | | | | | | | | | | | | | | | | | | |
| Before expense reimbursement | | | (0.21 | )% | | | (0.10 | )% | | | (0.20 | )% | | | 0.06 | % | | | (0.25 | )% |
After expense reimbursement(4) | | | 0.03 | % | | | 0.23 | % | | | 0.09 | % | | | 0.34 | % | | | 0.04 | % |
Portfolio turnover rate(5) | | | 21 | % | | | 26 | % | | | 14 | % | | | 12 | % | | | 14 | % |
| (1) | Information presented relates to a share of capital stock outstanding for each period. |
| (2) | Net investment income per share represents net investment income divided by the average shares outstanding throughout the period. |
| (3) | Amount calculated is less than $0.005. |
| (4) | See Note #3, Investment Adviser, for the waiver and expense reimbursement discussion. |
| (5) | Portfolio turnover of The Market Opportunities Portfolio. |
The accompanying notes are an integral part of these financial statements.
| KINETICS MUTUAL FUNDS, INC. — THE FEEDER FUNDS |
Financial Highlights — (Continued) |
| | | The Market Opportunities Fund | |
| | | | | | | | | Advisor Class A | | | | | | | |
| | | For the | | | For the | | | For the | | | For the | | | For the | |
| | | Year Ended | | | Year Ended | | | Year Ended | | | Year Ended | | | Year Ended | |
| | | December 31, | | | December 31, | | | December 31, | | | December 31, | | | December 31, | |
| | | 2013 | | | 2012 | | | 2011 | | | 2010 | | | 2009 | |
PER SHARE DATA:(1) | | | | | | | | | | | | | | | |
| Net Asset Value, Beginning of Year | | $ | 12.07 | | | $ | 10.43 | | | $ | 11.43 | | | $ | 10.80 | | | $ | 7.22 | |
| Income from Investment Operations: | | | | | | | | | | | | | | | | | | | | |
Net investment income (loss)(2) | | | (0.03 | ) | | | 0.00 | (3) | | | (0.02 | ) | | | 0.01 | | | | (0.02 | ) |
| Net realized and unrealized gain | | | | | | | | | | | | | | | | | | | | |
| (loss) on investments | | | 5.63 | | | | 1.80 | | | | (0.90 | ) | | | 1.19 | | | | 3.61 | |
| Total from investment | | | | | | | | | | | | | | | | | | | | |
| operations | | | 5.60 | | | | 1.80 | | | | (0.92 | ) | | | 1.20 | | | | 3.59 | |
Redemption Fees(3) | | | 0.00 | | | | 0.00 | | | | 0.00 | | | | 0.00 | | | | 0.00 | |
| Less Distributions: | | | | | | | | | | | | | | | | | | | | |
| From net investment income | | | (0.07 | ) | | | (0.16 | ) | | | (0.08 | ) | | | (0.57 | ) | | | (0.01 | ) |
| Total distributions | | | (0.07 | ) | | | (0.16 | ) | | | (0.08 | ) | | | (0.57 | ) | | | (0.01 | ) |
| Net Asset Value, End of Year | | $ | 17.60 | | | $ | 12.07 | | | $ | 10.43 | | | $ | 11.43 | | | $ | 10.80 | |
Total return(4) | | | 46.36 | % | | | 17.26 | % | | | (8.08 | )% | | | 11.11 | % | | | 49.66 | % |
| SUPPLEMENTAL DATA AND RATIOS | | | | | | | | | | | | | | | | | | | | |
| Net assets, end of year (000’s) | | $ | 11,742 | | | $ | 6,518 | | | $ | 8,600 | | | $ | 14,167 | | | $ | 18,770 | |
| Ratio of operating expenses to | | | | | | | | | | | | | | | | | | | | |
| average net assets: | | | | | | | | | | | | | | | | | | | | |
| Before expense reimbursement | | | 2.13 | % | | | 2.22 | % | | | 2.18 | % | | | 2.17 | % | | | 2.18 | % |
After expense reimbursement(5) | | | 1.89 | % | | | 1.89 | % | | | 1.89 | % | | | 1.89 | % | | | 1.89 | % |
| Ratio of net investment income (loss) | | | | | | | | | | | | | | | | | | | | |
| to average net assets: | | | | | | | | | | | | | | | | | | | | |
| Before expense reimbursement | | | (0.46 | )% | | | (0.35 | )% | | | (0.45 | )% | | | (0.19 | )% | | | (0.50 | )% |
After expense reimbursement(5) | | | (0.22 | )% | | | (0.02 | )% | | | (0.16 | )% | | | 0.09 | % | | | (0.21 | )% |
Portfolio turnover rate(6) | | | 21 | % | | | 26 | % | | | 14 | % | | | 12 | % | | | 14 | % |
| (1) | Information presented relates to a share of capital stock outstanding for each period. |
| (2) | Net investment income per share represents net investment income divided by the average shares outstanding throughout the period. |
| (3) | Amount calculated is less than $0.005. |
| (4) | The total return calculation does not reflect the 5.75% front end sales charge on Advisor Class A shares. |
| (5) | See Note #3, Investment Adviser, for the waiver and expense reimbursement discussion. |
| (6) | Portfolio turnover of The Market Opportunities Portfolio. |
The accompanying notes are an integral part of these financial statements.
| KINETICS MUTUAL FUNDS, INC. — THE FEEDER FUNDS |
Financial Highlights — (Continued) |
| | | The Market Opportunities Fund | |
| | | | | | | | | Advisor Class C | | | | | | | |
| | | For the | | | For the | | | For the | | | For the | | | For the | |
| | | Year Ended | | | Year Ended | | | Year Ended | | | Year Ended | | | Year Ended | |
| | | December 31, | | | December 31, | | | December 31, | | | December 31, | | | December 31, | |
| | | 2013 | | | 2012 | | | 2011 | | | 2010 | | | 2009 | |
PER SHARE DATA:(1) | | | | | | | | | | | | | | | |
| Net Asset Value, Beginning of Year | | $ | 11.94 | | | $ | 10.32 | | | $ | 11.30 | | | $ | 10.69 | | | $ | 7.17 | |
| Income from Investment Operations: | | | | | | | | | | | | | | | | | | | | |
Net investment loss(2) | | | (0.11 | ) | | | (0.06 | ) | | | (0.08 | ) | | | (0.04 | ) | | | (0.06 | ) |
| Net realized and unrealized gain | | | | | | | | | | | | | | | | | | | | |
| (loss) on investments | | | 5.56 | | | | 1.78 | | | | (0.88 | ) | | | 1.17 | | | | 3.59 | |
| Total from investment | | | | | | | | | | | | | | | | | | | | |
| operations | | | 5.45 | | | | 1.72 | | | | (0.96 | ) | | | 1.13 | | | | 3.53 | |
| Redemption Fees | | | 0.00 | (3) | | | 0.00 | (3) | | | — | | | | 0.00 | (3) | | | 0.00 | (3) |
| Less Distributions: | | | | | | | | | | | | | | | | | | | | |
| From net investment income | | | (0.07 | ) | | | (0.10 | ) | | | (0.02 | ) | | | (0.52 | ) | | | (0.01 | ) |
| Total distributions | | | (0.07 | ) | | | (0.10 | ) | | | (0.02 | ) | | | (0.52 | ) | | | (0.01 | ) |
| Net Asset Value, End of Year | | $ | 17.32 | | | $ | 11.94 | | | $ | 10.32 | | | $ | 11.30 | | | $ | 10.69 | |
| Total return | | | 45.61 | % | | | 16.70 | % | | | (8.51 | )% | | | 10.54 | % | | | 49.17 | % |
| SUPPLEMENTAL DATA AND RATIOS | | | | | | | | | | | | | | | | | | | | |
| Net assets, end of year (000’s) | | $ | 5,525 | | | $ | 3,932 | | | $ | 4,233 | | | $ | 5,569 | | | $ | 6,055 | |
| Ratio of operating expenses to | | | | | | | | | | | | | | | | | | | | |
| average net assets: | | | | | | | | | | | | | | | | | | | | |
| Before expense reimbursement | | | 2.63 | % | | | 2.72 | % | | | 2.68 | % | | | 2.67 | % | | | 2.68 | % |
After expense reimbursement(4) | | | 2.39 | % | | | 2.39 | % | | | 2.39 | % | | | 2.39 | % | | | 2.39 | % |
| Ratio of net investment loss to | | | | | | | | | | | | | | | | | | | | |
| average net assets: | | | | | | | | | | | | | | | | | | | | |
| Before expense reimbursement | | | (0.96 | )% | | | (0.85 | )% | | | (0.95 | )% | | | (0.69 | )% | | | (1.00 | )% |
After expense reimbursement(4) | | | (0.72 | )% | | | (0.52 | )% | | | (0.66 | )% | | | (0.41 | )% | | | (0.71 | )% |
Portfolio turnover rate(5) | | | 21 | % | | | 26 | % | | | 14 | % | | | 12 | % | | | 14 | % |
| (1) | Information presented relates to a share of capital stock outstanding for each period. |
| (2) | Net investment income per share represents net investment income divided by the average shares outstanding throughout the period. |
| (3) | Amount calculated is less than $0.005. |
| (4) | See Note #3, Investment Adviser, for the waiver and expense reimbursement discussion. |
| (5) | Portfolio turnover of The Market Opportunities Portfolio. |
The accompanying notes are an integral part of these financial statements.
| KINETICS MUTUAL FUNDS, INC. — THE FEEDER FUNDS |
Financial Highlights — (Continued) |
| | | The Market Opportunities Fund | |
| | | | | | | | | Institutional Class | | | | | | | |
| | | For the | | | For the | | | For the | | | For the | | | For the | |
| | | Year Ended | | | Year Ended | | | Year Ended | | | Year Ended | | | Year Ended | |
| | | December 31, | | | December 31, | | | December 31, | | | December 31, | | | December 31, | |
| | | 2013 | | | 2012 | | | 2011 | | | 2010 | | | 2009 | |
PER SHARE DATA:(1) | | | | | | | | | | | | | | | |
| Net Asset Value, Beginning of Year | | $ | 12.10 | | | $ | 10.46 | | | $ | 11.48 | | | $ | 10.86 | | | $ | 7.21 | |
| Income from Investment Operations: | | | | | | | | | | | | | | | | | | | | |
Net investment income(2) | | | 0.03 | | | | 0.05 | | | | 0.03 | | | | 0.06 | | | | 0.02 | |
| Net realized and unrealized gain | | | | | | | | | | | | | | | | | | | | |
| (loss) on investments | | | 5.67 | | | | 1.81 | | | | (0.92 | ) | | | 1.19 | | | | 3.64 | |
| Total from investment | | | | | | | | | | | | | | | | | | | | |
| operations | | | 5.70 | | | | 1.86 | | | | (0.89 | ) | | | 1.25 | | | | 3.66 | |
| Redemption Fees | | | 0.01 | | | | — | | | | — | | | | — | | | | — | |
| Less Distributions: | | | | | | | | | | | | | | | | | | | | |
| From net investment income | | | (0.07 | ) | | | (0.22 | ) | | | (0.13 | ) | | | (0.63 | ) | | | (0.01 | ) |
| Total distributions | | | (0.07 | ) | | | (0.22 | ) | | | (0.13 | ) | | | (0.63 | ) | | | (0.01 | ) |
| Net Asset Value, End of Year | | $ | 17.74 | | | $ | 12.10 | | | $ | 10.46 | | | $ | 11.48 | | | $ | 10.86 | |
| Total return | | | 47.15 | % | | | 17.83 | % | | | (7.71 | )% | | | 11.54 | % | | | 50.70 | % |
| SUPPLEMENTAL DATA AND RATIOS | | | | | | | | | | | | | | | | | | | | |
| Net assets, end of year (000’s) | | $ | 1,809 | | | $ | 229 | | | $ | 186 | | | $ | 212 | | | $ | 19 | |
| Ratio of operating expenses to | | | | | | | | | | | | | | | | | | | | |
| average net assets: | | | | | | | | | | | | | | | | | | | | |
| Before expense reimbursement | | | 1.83 | % | | | 1.92 | % | | | 1.88 | % | | | 1.87 | % | | | 1.88 | % |
After expense reimbursement(3) | | | 1.44 | % | | | 1.44 | % | | | 1.44 | % | | | 1.44 | % | | | 1.44 | % |
| Ratio of net investment income (loss) | | | | | | | | | | | | | | | | | | | | |
| to average net assets: | | | | | | | | | | | | | | | | | | | | |
| Before expense reimbursement | | | (0.16 | )% | | | (0.05 | )% | | | (0.15 | )% | | | 0.11 | % | | | (0.20 | )% |
After expense reimbursement(3) | | | 0.23 | % | | | 0.43 | % | | | 0.29 | % | | | 0.54 | % | | | 0.24 | % |
Portfolio turnover rate(4) | | | 21 | % | | | 26 | % | | | 14 | % | | | 12 | % | | | 14 | % |
| (1) | Information presented relates to a share of capital stock outstanding for each period. |
| (2) | Net investment income per share represents net investment income divided by the average shares outstanding throughout the period. |
| (3) | See Note #3, Investment Adviser, for the waiver and expense reimbursement discussion. |
| (4) | Portfolio turnover of The Market Opportunities Portfolio. |
The accompanying notes are an integral part of these financial statements.
| KINETICS MUTUAL FUNDS, INC. — THE FEEDER FUNDS |
Financial Highlights — (Continued) |
| | | The Alternative Income Fund | |
| | | | | | | | | No Load Class | | | | | | | |
| | | For the | | | For the | | | For the | | | For the | | | For the | |
| | | Year Ended | | | Year Ended | | | Year Ended | | | Year Ended | | | Year Ended | |
| | | December 31, | | | December 31, | | | December 31, | | | December 31, | | | December 31, | |
| | | 2013 | | | 2012(1) | | | 2011(1) | | | 2010(1) | | | 2009(1) | |
PER SHARE DATA:(2) | | | | | | | | | | | | | | | |
| Net Asset Value, Beginning of Year | | $ | 83.31 | | | $ | 77.90 | | | $ | 83.82 | | | $ | 88.57 | | | $ | 76.13 | |
| Income from Investment Operations: | | | | | | | | | | | | | | | | | | | | |
Net investment income (loss)(3) | | | (0.21 | ) | | | 1.53 | | | | 1.03 | | | | 0.72 | | | | 0.37 | |
| Net realized and unrealized gain | | | | | | | | | | | | | | | | | | | | |
| (loss) on investments | | | 4.78 | | | | 6.09 | | | | (5.13 | ) | | | (4.75 | ) | | | 12.08 | |
| Total from investment | | | | | | | | | | | | | | | | | | | | |
| operations | | | 4.57 | | | | 7.62 | | | | (4.10 | ) | | | (4.03 | ) | | | 12.45 | |
| Redemption Fees | | | 0.00 | (4) | | | 0.00 | (4) | | | 0.00 | (4) | | | 0.00 | (4) | | | 0.01 | |
| Less Distributions: | | | | | | | | | | | | | | | | | | | | |
| From net investment income | | | — | | | | (2.21 | ) | | | (1.82 | ) | | | (0.72 | ) | | | (0.02 | ) |
| Total distributions | | | — | | | | (2.21 | ) | | | (1.82 | ) | | | (0.72 | ) | | | (0.02 | ) |
| Net Asset Value, End of Year | | $ | 87.88 | | | $ | 83.31 | | | $ | 77.90 | | | $ | 83.82 | | | $ | 88.57 | |
| Total return | | | 5.22 | % | | | 9.90 | % | | | (4.88 | )% | | | (4.60 | )% | | | 16.46 | % |
| SUPPLEMENTAL DATA AND RATIOS | | | | | | | | | | | | | | | | | | | | |
| Net assets, end of year (000’s) | | $ | 11,848 | | | $ | 4,699 | | | $ | 5,613 | | | $ | 7,001 | | | $ | 7,176 | |
| Ratio of operating expenses to | | | | | | | | | | | | | | | | | | | | |
| average net assets: | | | | | | | | | | | | | | | | | | | | |
| Before expense reimbursement | | | 2.23 | % | | | 2.55 | % | | | 2.29 | % | | | 2.17 | % | | | 2.36 | % |
After expense reimbursement(5) | | | 0.95 | % | | | 1.64 | % | | | 1.64 | % | | | 1.64 | % | | | 1.64 | % |
| Ratio of net investment income (loss) | | | | | | | | | | | | | | | | | | | | |
| to average net assets: | | | | | | | | | | | | | | | | | | | | |
| Before expense reimbursement | | | (1.52 | )% | | | 0.93 | % | | | 0.59 | % | | | 0.33 | % | | | (0.26 | )% |
After expense reimbursement(5) | | | (0.24 | )% | | | 1.84 | % | | | 1.24 | % | | | 0.86 | % | | | 0.46 | % |
Portfolio turnover rate(6) | | | 19 | % | | | 56 | % | | | 69 | % | | | 111 | % | | | 45 | % |
| (1) | Per share data adjusted for 1:10 reverse stock split completed as of May 31, 2013. |
| (2) | Information presented relates to a share of capital stock outstanding for each period. |
| (3) | Net investment income per share represents net investment income divided by the average shares outstanding throughout the period. |
| (4) | Amount calculated is less than $0.005. |
| (5) | See Note #3, Investment Adviser, for the waiver and expense reimbursement discussion. |
| (6) | Portfolio turnover of The Alternative Income Portfolio. |
The accompanying notes are an integral part of these financial statements.
| KINETICS MUTUAL FUNDS, INC. — THE FEEDER FUNDS |
Financial Highlights — (Continued) |
| | | The Alternative Income Fund | |
| | | | | | | | | Advisor Class A | | | | | | | |
| | | For the | | | For the | | | For the | | | For the | | | For the | |
| | | Year Ended | | | Year Ended | | | Year Ended | | | Year Ended | | | Year Ended | |
| | | December 31, | | | December 31, | | | December 31, | | | December 31, | | | December 31, | |
| | | 2013 | | | 2012(1) | | | 2011(1) | | | 2010(1) | | | 2009(1) | |
PER SHARE DATA:(2) | | | | | | | | | | | | | | | |
| Net Asset Value, Beginning of Year | | $ | 83.38 | | | $ | 77.76 | | | $ | 83.52 | | | $ | 88.18 | | | $ | 75.94 | |
| Income from Investment Operations: | | | | | | | | | | | | | | | | | | | | |
Net investment income (loss)(3) | | | (0.43 | ) | | | 1.31 | | | | 0.82 | | | | 0.50 | | | | 0.17 | |
| Net realized and unrealized gain | | | | | | | | | | | | | | | | | | | | |
| (loss) on investments | | | 4.77 | | | | 6.09 | | | | (5.13 | ) | | | (4.70 | ) | | | 12.06 | |
| Total from investment | | | | | | | | | | | | | | | | | | | | |
| operations | | | 4.34 | | | | 7.40 | | | | (4.31 | ) | | | (4.20 | ) | | | 12.23 | |
| Redemption Fees | | | 0.01 | | | | 0.00 | (4) | | | 0.01 | | | | 0.01 | | | | 0.01 | |
| Less Distributions: | | | | | | | | | | | | | | | | | | | | |
| From net investment income | | | — | | | | (1.78 | ) | | | (1.46 | ) | | | (0.47 | ) | | | — | |
| Total distributions | | | — | | | | (1.78 | ) | | | (1.46 | ) | | | (0.47 | ) | | | — | |
| Net Asset Value, End of Year | | $ | 87.73 | | | $ | 83.38 | | | $ | 77.76 | | | $ | 83.52 | | | $ | 88.18 | |
Total return(5) | | | 4.91 | % | | | 9.61 | % | | | (5.08 | )% | | | (4.80 | )% | | | 16.21 | % |
| SUPPLEMENTAL DATA AND RATIOS | | | | | | | | | | | | | | | | | | | | |
| Net assets, end of year (000’s) | | $ | 2,898 | | | $ | 2,597 | | | $ | 4,559 | | | $ | 10,100 | | | $ | 10,339 | |
| Ratio of operating expenses to | | | | | | | | | | | | | | | | | | | | |
| average net assets: | | | | | | | | | | | | | | | | | | | | |
| Before expense reimbursement | | | 2.48 | % | | | 2.80 | % | | | 2.54 | % | | | 2.42 | % | | | 2.61 | % |
After expense reimbursement(6) | | | 1.20 | % | | | 1.89 | % | | | 1.89 | % | | | 1.89 | % | | | 1.89 | % |
| Ratio of net investment income (loss) | | | | | | | | | | | | | | | | | | | | |
| to average net assets: | | | | | | | | | | | | | | | | | | | | |
| Before expense reimbursement | | | (1.77 | )% | | | 0.68 | % | | | 0.34 | % | | | 0.08 | % | | | (0.51 | )% |
After expense reimbursement(6) | | | (0.49 | )% | | | 1.59 | % | | | 0.99 | % | | | 0.61 | % | | | 0.21 | % |
Portfolio turnover rate(7) | | | 19 | % | | | 56 | % | | | 69 | % | | | 111 | % | | | 45 | % |
| (1) | Per share data adjusted for 1:10 reverse stock split completed as of May 31, 2013. |
| (2) | Information presented relates to a share of capital stock outstanding for each period. |
| (3) | Net investment income per share represents net investment income divided by the average shares outstanding throughout the period. |
| (4) | Amount calculated is less than $0.005. |
| (5) | The total return calculation does not reflect the 5.75% front end sales charge on Advisor Class A shares. |
| (6) | See Note #3, Investment Adviser, for the waiver and expense reimbursement discussion. |
| (7) | Portfolio turnover of The Alternative Income Portfolio. |
The accompanying notes are an integral part of these financial statements.
| KINETICS MUTUAL FUNDS, INC. — THE FEEDER FUNDS |
Financial Highlights — (Continued) |
| | | The Alternative Income Fund | |
| | | | | | | | | Advisor Class C | | | | | | | |
| | | For the | | | For the | | | For the | | | For the | | | For the | |
| | | Year Ended | | | Year Ended | | | Year Ended | | | Year Ended | | | Year Ended | |
| | | December 31, | | | December 31, | | | December 31, | | | December 31, | | | December 31, | |
| | | 2013 | | | 2012(1) | | | 2011(1) | | | 2010(1) | | | 2009(1) | |
PER SHARE DATA:(2) | | | | | | | | | | | | | | | |
| Net Asset Value, Beginning of Year | | $ | 82.26 | | | $ | 76.75 | | | $ | 82.53 | | | $ | 87.12 | | | $ | 75.42 | |
| Income from Investment Operations: | | | | | | | | | | | | | | | | | | | | |
Net investment income (loss)(3) | | | (0.84 | ) | | | 0.89 | | | | 0.40 | | | | 0.09 | | | | (0.23 | ) |
| Net realized and unrealized gain | | | | | | | | | | | | | | | | | | | | |
| (loss) on investments | | | 4.68 | | | | 6.00 | | | | (5.03 | ) | | | (4.57 | ) | | | 11.93 | |
| Total from investment | | | | | | | | | | | | | | | | | | | | |
| operations | | | 3.84 | | | | 6.89 | | | | (4.63 | ) | | | (4.48 | ) | | | 11.70 | |
| Redemption Fees | | | — | | | | 0.00 | (4) | | | 0.01 | | | | 0.00 | (4) | | | 0.00 | (4) |
| Less Distributions: | | | | | | | | | | | | | | | | | | | | |
| From net investment income | | | — | | | | (1.38 | ) | | | (1.16 | ) | | | (0.11 | ) | | | — | |
| Total distributions | | | — | | | | (1.38 | ) | | | (1.16 | ) | | | (0.11 | ) | | | — | |
| Net Asset Value, End of Year | | $ | 86.10 | | | $ | 82.26 | | | $ | 76.75 | | | $ | 82.53 | | | $ | 87.12 | |
| Total return | | | 4.46 | % | | | 8.96 | % | | | (5.51 | )% | | | (5.15 | )% | | | 15.52 | % |
| SUPPLEMENTAL DATA AND RATIOS | | | | | | | | | | | | | | | | | | | | |
| Net assets, end of year (000’s) | | $ | 1,862 | | | $ | 1,763 | | | $ | 2,316 | | | $ | 2,840 | | | $ | 2,700 | |
| Ratio of operating expenses to | | | | | | | | | | | | | | | | | | | | |
| average net assets: | | | | | | | | | | | | | | | | | | | | |
| Before expense reimbursement | | | 2.98 | % | | | 3.30 | % | | | 3.04 | % | | | 2.92 | % | | | 3.11 | % |
After expense reimbursement(5) | | | 1.70 | % | | | 2.39 | % | | | 2.39 | % | | | 2.39 | % | | | 2.39 | % |
| Ratio of net investment income (loss) | | | | | | | | | | | | | | | | | | | | |
| to average net assets: | | | | | | | | | | | | | | | | | | | | |
| Before expense reimbursement | | | (2.27 | )% | | | 0.18 | % | | | (0.16 | )% | | | (0.42 | )% | | | (1.01 | )% |
After expense reimbursement(5) | | | (0.99 | )% | | | 1.09 | % | | | 0.49 | % | | | 0.11 | % | | | (0.29 | )% |
Portfolio turnover rate(6) | | | 19 | % | | | 56 | % | | | 69 | % | | | 111 | % | | | 45 | % |
| (1) | Per share data adjusted for 1:10 reverse stock split completed as of May 31, 2013. |
| (2) | Information presented relates to a share of capital stock outstanding for each period. |
| (3) | Net investment income per share represents net investment income divided by the average shares outstanding throughout the period. |
| (4) | Amount calculated is less than $0.005. |
| (5) | See Note #3, Investment Adviser, for the waiver and expense reimbursement discussion. |
| (6) | Portfolio turnover of The Alternative Income Portfolio. |
The accompanying notes are an integral part of these financial statements.
| KINETICS MUTUAL FUNDS, INC. — THE FEEDER FUNDS |
Financial Highlights — (Continued) |
| | | The Alternative Income Fund | |
| | | | | | | | | Institutional Class | | | | | | | |
| | | For the | | | For the | | | For the | | | For the | | | For the | |
| | | Year Ended | | | Year Ended | | | Year Ended | | | Year Ended | | | Year Ended | |
| | | December 31, | | | December 31, | | | December 31, | | | December 31, | | | December 31, | |
| | | 2013 | | | 2012(1) | | | 2011(1) | | | 2010(1) | | | 2009(1) | |
PER SHARE DATA:(2) | | | | | | | | | | | | | | | |
| Net Asset Value, Beginning of Year | | $ | 84.00 | | | $ | 78.49 | | | $ | 84.22 | | | $ | 88.97 | | | $ | 76.32 | |
| Income from Investment Operations: | | | | | | | | | | | | | | | | | | | | |
Net investment income(3) | | | (0.04 | ) | | | 1.72 | | | | 1.21 | | | | 0.88 | | | | 0.55 | |
| Net realized and unrealized gain | | | | | | | | | | | | | | | | | | | | |
| (loss) on investments | | | 4.80 | | | | 6.16 | | | | (5.13 | ) | | | (4.74 | ) | | | 12.26 | |
| Total from investment | | | | | | | | | | | | | | | | | | | | |
| operations | | | 4.76 | | | | 7.88 | | | | (3.92 | ) | | | (3.86 | ) | | | 12.81 | |
| Redemption Fees | | | — | | | | 0.01 | | | | 0.17 | | | | 0.01 | | | | 0.06 | |
| Less Distributions: | | | | | | | | | | | | | | | | | | | | |
| From net investment income | | | — | | | | (2.38 | ) | | | (1.98 | ) | | | (0.90 | ) | | | (0.22 | ) |
| Total distributions | | | — | | | | (2.38 | ) | | | (1.98 | ) | | | (0.90 | ) | | | (0.22 | ) |
| Net Asset Value, End of Year | | $ | 88.76 | | | $ | 84.00 | | | $ | 78.49 | | | $ | 84.22 | | | $ | 88.97 | |
| Total return | | | 5.39 | % | | | 10.17 | % | | | (4.43 | )% | | | (4.38 | )% | | | 16.94 | % |
| SUPPLEMENTAL DATA AND RATIOS | | | | | | | | | | | | | | | | | | | | |
| Net assets, end of year (000’s) | | $ | 6,854 | | | $ | 1,629 | | | $ | 798 | | | $ | 4,182 | | | $ | 2,905 | |
| Ratio of operating expenses to | | | | | | | | | | | | | | | | | | | | |
| average net assets: | | | | | | | | | | | | | | | | | | | | |
| Before expense reimbursement | | | 2.18 | % | | | 2.50 | % | | | 2.24 | % | | | 2.12 | % | | | 2.31 | % |
After expense reimbursement(5) | | | 0.75 | % | | | 1.44 | % | | | 1.44 | % | | | 1.44 | % | | | 1.44 | % |
| Ratio of net investment income (loss) | | | | | | | | | | | | | | | | | | | | |
| to average net assets: | | | | | | | | | | | | | | | | | | | | |
| Before expense reimbursement | | | (1.47 | )% | | | 0.98 | % | | | 0.64 | % | | | 0.38 | % | | | (0.21 | )% |
After expense reimbursement(5) | | | (0.04 | )% | | | 2.04 | % | | | 1.44 | % | | | 1.06 | % | | | 0.66 | % |
Portfolio turnover rate(6) | | | 19 | % | | | 56 | % | | | 69 | % | | | 111 | % | | | 45 | % |
| (1) | Per share data adjusted for 1:10 reverse stock split completed as of May 31, 2013. |
| (2) | Information presented relates to a share of capital stock outstanding for each period. |
| (3) | Net investment income per share represents net investment income divided by the average shares outstanding throughout the period. |
| (4) | Amount calculated is less than $0.005. |
| (5) | See Note #3, Investment Adviser, for the waiver and expense reimbursement discussion. |
| (6) | Portfolio turnover of The Alternative Income Portfolio. |
The accompanying notes are an integral part of these financial statements.
| KINETICS MUTUAL FUNDS, INC. — THE FEEDER FUNDS |
Financial Highlights — (Continued) |
| | | The Multi-Disciplinary Fund | |
| | | | | | | | | No Load Class | | | | | | | |
| | | For the | | | For the | | | For the | | | For the | | | For the | |
| | | Year Ended | | | Year Ended | | | Year Ended | | | Year Ended | | | Year Ended | |
| | | December 31, | | | December 31, | | | December 31, | | | December 31, | | | December 31, | |
| | | 2013 | | | 2012 | | | 2011 | | | 2010 | | | 2009 | |
PER SHARE DATA:(1) | | | | | | | | | | | | | | | |
| Net Asset Value, Beginning of Year | | $ | 11.08 | | | $ | 10.09 | | | $ | 10.47 | | | $ | 9.86 | | | $ | 8.22 | |
| Income from Investment Operations: | | | | | | | | | | | | | | | | | | | | |
Net investment income(2) | | | 0.20 | | | | 0.34 | | | | 0.83 | | | | 0.35 | | | | 0.09 | |
| Net realized and unrealized gain | | | | | | | | | | | | | | | | | | | | |
| (loss) on investments | | | 0.28 | | | | 1.20 | | | | (0.80 | ) | | | 0.91 | | | | 1.79 | |
| Total from investment | | | | | | | | | | | | | | | | | | | | |
| operations | | | 0.48 | | | | 1.54 | | | | 0.03 | | | | 1.26 | | | | 1.88 | |
| Redemption Fees | | | 0.00 | (3) | | | 0.00 | (3) | | | 0.00 | (3) | | | 0.00 | (3) | | | — | |
| Less Distributions: | | | | | | | | | | | | | | | | | | | | |
| From net investment income | | | (0.28 | ) | | | (0.43 | ) | | | (0.36 | ) | | | (0.35 | ) | | | (0.08 | ) |
| From net realized gains | | | (0.26 | ) | | | (0.12 | ) | | | (0.05 | ) | | | (0.30 | ) | | | (0.16 | ) |
| Total distributions | | | (0.54 | ) | | | (0.55 | ) | | | (0.41 | ) | | | (0.65 | ) | | | (0.24 | ) |
| Net Asset Value, End of Year | | $ | 11.02 | | | $ | 11.08 | | | $ | 10.09 | | | $ | 10.47 | | | $ | 9.86 | |
| Total return | | | 4.28 | % | | | 15.38 | % | | | 0.24 | % | | | 13.04 | % | | | 22.90 | % |
| SUPPLEMENTAL DATA AND RATIOS | | | | | | | | | | | | | | | | | | | | |
| Net assets, end of year (000’s) | | $ | 19,553 | | | $ | 19,566 | | | $ | 13,389 | | | $ | 3,489 | | | $ | 938 | |
| Ratio of operating expenses to average | | | | | | | | | | | | | | | | | | | | |
| net assets: | | | | | | | | | | | | | | | | | | | | |
| Before expense reimbursement | | | 1.83 | %(4) | | | 2.00 | % | | | 2.38 | % | | | 6.11 | % | | | 13.11 | % |
After expense reimbursement(5) | | | 1.50 | %(4) | | | 1.49 | % | | | 1.49 | % | | | 1.49 | % | | | 1.49 | % |
| Ratio of net investment income (loss) | | | | | | | | | | | | | | | | | | | | |
| to average net assets: | | | | | | | | | | | | | | | | | | | | |
| Before expense reimbursement | | | 1.41 | %(6) | | | 2.65 | % | | | 7.09 | % | | | (1.19 | )% | | | (10.69 | )% |
After expense reimbursement(5) | | | 1.74 | %(6) | | | 3.16 | % | | | 7.98 | % | | | 3.43 | % | | | 0.93 | % |
Portfolio turnover rate(7) | | | 54 | % | | | 41 | % | | | 74 | % | | | 38 | % | | | 77 | % |
| (1) | Information presented relates to a share of capital stock outstanding for each period. |
| (2) | Net investment income per share represents net investment income divided by the average shares outstanding throughout the period. |
| (3) | Amount calculated is less than $0.005. |
| (4) | The ratio of expenses includes borrowing expense on securities sold short. The expense ratio excluding borrowing expenses on securities sold short was 1.82% before expense reimbursement and 1.49% after expense reimbursement. |
| (5) | See Note #3, Investment Adviser, for the waiver and expense reimbursement discussion. |
| (6) | The ratio of net investment income includes borrowing expense on securities sold short. |
| (7) | Portfolio turnover of The Multi-Disciplinary Portfolio. |
The accompanying notes are an integral part of these financial statements.
| KINETICS MUTUAL FUNDS, INC. — THE FEEDER FUNDS |
Financial Highlights — (Continued) |
| | | The Multi-Disciplinary Fund | |
| | | | | | | | | Advisor Class A | | | | | | | |
| | | For the | | | For the | | | For the | | | For the | | | For the | |
| | | Year Ended | | | Year Ended | | | Year Ended | | | Year Ended | | | Year Ended | |
| | | December 31, | | | December 31, | | | December 31, | | | December 31, | | | December 31, | |
| | | 2013 | | | 2012 | | | 2011 | | | 2010 | | | 2009 | |
PER SHARE DATA:(1) | | | | | | | | | | | | | | | |
| Net Asset Value, Beginning of Year | | $ | 11.03 | | | $ | 10.05 | | | $ | 10.44 | | | $ | 9.85 | | | $ | 8.20 | |
| Income from Investment Operations: | | | | | | | | | | | | | | | | | | | | |
Net investment income(2) | | | 0.17 | | | | 0.31 | | | | 0.78 | | | | 0.33 | | | | 0.06 | |
| Net realized and unrealized gain | | | | | | | | | | | | | | | | | | | | |
| (loss) on investments | | | 0.29 | | | | 1.20 | | | | (0.78 | ) | | | 0.89 | | | | 1.80 | |
| Total from investment | | | | | | | | | | | | | | | | | | | | |
| operations | | | 0.46 | | | | 1.51 | | | | — | | | | 1.22 | | | | 1.86 | |
| Redemption Fees | | | 0.00 | (3) | | | 0.00 | (3) | | | — | | | | — | | | | — | |
| Less Distributions: | | | | | | | | | | | | | | | | | | | | |
| From net investment income | | | (0.25 | ) | | | (0.41 | ) | | | (0.34 | ) | | | (0.33 | ) | | | (0.05 | ) |
| From net realized gains | | | (0.26 | ) | | | (0.12 | ) | | | (0.05 | ) | | | (0.30 | ) | | | (0.16 | ) |
| Total distributions | | | (0.51 | ) | | | (0.53 | ) | | | (0.39 | ) | | | (0.63 | ) | | | (0.21 | ) |
| Net Asset Value, End of Year | | $ | 10.98 | | | $ | 11.03 | | | $ | 10.05 | | | $ | 10.44 | | | $ | 9.85 | |
Total return(4) | | | 4.15 | % | | | 15.12 | % | | | (0.01 | )% | | | 12.64 | % | | | 22.73 | % |
| SUPPLEMENTAL DATA AND RATIOS | | | | | | | | | | | | | | | | | | | | |
| Net assets, end of year (000’s) | | $ | 36,170 | | | $ | 25,764 | | | $ | 4,726 | | | $ | 356 | | | $ | 103 | |
| Ratio of operating expenses to | | | | | | | | | | | | | | | | | | | | |
| average net assets: | | | | | | | | | | | | | | | | | | | | |
| Before expense reimbursement | | | 2.08 | %(5) | | | 2.25 | % | | | 2.63 | % | | | 6.36 | % | | | 13.36 | % |
After expense reimbursement(6) | | | 1.75 | %(5) | | | 1.74 | % | | | 1.74 | % | | | 1.74 | % | | | 1.74 | % |
| Ratio of net investment income (loss) | | | | | | | | | | | | | | | | | | | | |
| to average net assets: | | | | | | | | | | | | | | | | | | | | |
| Before expense reimbursement | | | 1.16 | %(7) | | | 2.40 | % | | | 6.84 | % | | | (1.44 | )% | | | (10.94 | )% |
After expense reimbursement(6) | | | 1.49 | %(7) | | | 2.91 | % | | | 7.73 | % | | | 3.18 | % | | | 0.68 | % |
Portfolio turnover rate(8) | | | 54 | % | | | 41 | % | | | 74 | % | | | 38 | % | | | 77 | % |
| (1) | Information presented relates to a share of capital stock outstanding for each period. |
| (2) | Net investment income per share represents net investment income divided by the average shares outstanding throughout the period. |
| (3) | Amount calculated is less than $0.005. |
| (4) | The total return calculation does not reflect the 5.75% front end sales charge on Advisor Class A shares. |
| (5) | The ratio of expenses includes borrowing expense on securities sold short. The expense ratio excluding borrowing expenses on securities sold short was 2.07% before expense reimbursement and 1.74% after expense reimbursement. |
| (6) | See Note #3, Investment Adviser, for the waiver and expense reimbursement discussion. |
| (7) | The ratio of net investment income includes borrowing expense on securities sold short. |
| (8) | Portfolio turnover of The Multi-Disciplinary Portfolio. |
The accompanying notes are an integral part of these financial statements.
| KINETICS MUTUAL FUNDS, INC. — THE FEEDER FUNDS |
Financial Highlights — (Continued) |
| | | The Multi-Disciplinary Fund | |
| | | | | | | | | Advisor Class C | | | | | | | |
| | | For the | | | For the | | | For the | | | For the | | | For the | |
| | | Year Ended | | | Year Ended | | | Year Ended | | | Year Ended | | | Year Ended | |
| | | December 31, | | | December 31, | | | December 31, | | | December 31, | | | December 31, | |
| | | 2013 | | | 2012 | | | 2011 | | | 2010 | | | 2009 | |
PER SHARE DATA:(1) | | | | | | | | | | | | | | | |
| Net Asset Value, Beginning of Year | | $ | 10.96 | | | $ | 10.00 | | | $ | 10.40 | | | $ | 9.80 | | | $ | 8.17 | |
| Income from Investment Operations: | | | | | | | | | | | | | | | | | | | | |
Net investment income(2) | | | 0.11 | | | | 0.26 | | | | 0.74 | | | | 0.27 | | | | 0.02 | |
| Net realized and unrealized gain | | | | | | | | | | | | | | | | | | | | |
| (loss) on investments | | | 0.29 | | | | 1.18 | | | | (0.78 | ) | | | 0.90 | | | | 1.78 | |
| Total from investment | | | | | | | | | | | | | | | | | | | | |
| operations | | | 0.40 | | | | 1.44 | | | | (0.04 | ) | | | 1.17 | | | | 1.80 | |
| Redemption Fees | | | — | | | | — | | | | — | | | | — | | | | — | |
| Less Distributions: | | | | | | | | | | | | | | | | | | | | |
| From net investment income | | | (0.20 | ) | | | (0.36 | ) | | | (0.31 | ) | | | (0.27 | ) | | | (0.01 | ) |
| From net realized gains | | | (0.26 | ) | | | (0.12 | ) | | | (0.05 | ) | | | (0.30 | ) | | | (0.16 | ) |
| Total distributions | | | (0.46 | ) | | | (0.48 | ) | | | (0.36 | ) | | | (0.57 | ) | | | (0.17 | ) |
| Net Asset Value, End of Year | | $ | 10.90 | | | $ | 10.96 | | | $ | 10.00 | | | $ | 10.40 | | | $ | 9.80 | |
| Total return | | | 3.59 | % | | | 14.48 | % | | | (0.49 | )% | | | 12.13 | % | | | 22.03 | % |
| SUPPLEMENTAL DATA AND RATIOS | | | | | | | | | | | | | | | | | | | | |
| Net assets, end of year (000’s) | | $ | 11,209 | | | $ | 7,485 | | | $ | 1,645 | | | $ | 128 | | | $ | 105 | |
| Ratio of operating expenses to | | | | | | | | | | | | | | | | | | | | |
| average net assets: | | | | | | | | | | | | | | | | | | | | |
| Before expense reimbursement | | | 2.58 | %(3) | | | 2.75 | % | | | 3.13 | % | | | 6.86 | % | | | 13.86 | % |
After expense reimbursement(4) | | | 2.25 | %(3) | | | 2.24 | % | | | 2.24 | % | | | 2.24 | % | | | 2.24 | % |
| Ratio of net investment income (loss) | | | | | | | | | | | | | | | | | | | | |
| to average net assets: | | | | | | | | | | | | | | | | | | | | |
| Before expense reimbursement | | | 0.66 | %(5) | | | 1.90 | % | | | 6.34 | % | | | (1.94 | )% | | | (11.44 | )% |
After expense reimbursement(4) | | | 0.99 | %(5) | | | 2.41 | % | | | 7.23 | % | | | 2.68 | % | | | 0.18 | % |
Portfolio turnover rate(6) | | | 54 | % | | | 41 | % | | | 74 | % | | | 38 | % | | | 77 | % |
| (1) | Information presented relates to a share of capital stock outstanding for each period. |
| (2) | Net investment income per share represents net investment income divided by the average shares outstanding throughout the period. |
| (3) | The ratio of expenses includes borrowing expense on securities sold short. The expense ratio excluding borrowing expenses on securities sold short was 2.57% before expense reimbursement and 2.24% after expense reimbursement. |
| (4) | See Note #3, Investment Adviser, for the waiver and expense reimbursement discussion. |
| (5) | The ratio of net investment income includes borrowing expense on securities sold short. |
| (6) | Portfolio turnover of The Multi-Disciplinary Portfolio. |
The accompanying notes are an integral part of these financial statements.
| KINETICS MUTUAL FUNDS, INC. — THE FEEDER FUNDS |
Financial Highlights — (Continued) |
| | | The Multi-Disciplinary Fund | |
| | | | | | | | | Institutional Class | | | | | | | |
| | | For the | | | For the | | | For the | | | For the | | | For the | |
| | | Year Ended | | | Year Ended | | | Year Ended | | | Year Ended | | | Year Ended | |
| | | December 31, | | | December 31, | | | December 31, | | | December 31, | | | December 31, | |
| | | 2013 | | | 2012 | | | 2011 | | | 2010 | | | 2009 | |
PER SHARE DATA:(1) | | | | | | | | | | | | | | | |
| Net Asset Value, Beginning of Year | | $ | 11.11 | | | $ | 10.12 | | | $ | 10.50 | | | $ | 9.89 | | | $ | 8.23 | |
| Income from Investment Operations: | | | | | | | | | | | | | | | | | | | | |
Net investment income(2) | | | 0.22 | | | | 0.36 | | | | 0.85 | | | | 0.37 | | | | 0.10 | |
| Net realized and unrealized gain | | | | | | | | | | | | | | | | | | | | |
| (loss) on investments | | | 0.29 | | | | 1.20 | | | | (0.80 | ) | | | 0.91 | | | | 1.81 | |
| Total from investment | | | | | | | | | | | | | | | | | | | | |
| operations | | | 0.51 | | | | 1.56 | | | | 0.05 | | | | 1.28 | | | | 1.91 | |
| Redemption Fees | | | — | | | | — | | | | — | | | | — | | | | — | |
| Less Distributions: | | | | | | | | | | | | | | | | | | | | |
| From net investment income | | | (0.30 | ) | | | (0.45 | ) | | | (0.38 | ) | | | (0.37 | ) | | | (0.09 | ) |
| From net realized gains | | | (0.26 | ) | | | (0.12 | ) | | | (0.05 | ) | | | (0.30 | ) | | | (0.16 | ) |
| Total distributions | | | (0.56 | ) | | | (0.57 | ) | | | (0.43 | ) | | | (0.67 | ) | | | (0.25 | ) |
| Net Asset Value, End of Year | | $ | 11.06 | | | $ | 11.11 | | | $ | 10.12 | | | $ | 10.50 | | | $ | 9.89 | |
| Total return | | | 4.58 | % | | | 15.55 | % | | | 0.42 | % | | | 13.19 | % | | | 23.25 | % |
| SUPPLEMENTAL DATA AND RATIOS | | | | | | | | | | | | | | | | | | | | |
| Net assets, end of year (000’s) | | $ | 23,227 | | | $ | 6,576 | | | $ | 3,878 | | | $ | 142 | | | $ | 101 | |
| Ratio of operating expenses to | | | | | | | | | | | | | | | | | | | | |
| average net assets: | | | | | | | | | | | | | | | | | | | | |
| Before expense reimbursement | | | 1.78 | %(3) | | | 1.95 | % | | | 2.33 | % | | | 6.06 | % | | | 13.06 | % |
After expense reimbursement(4) | | | 1.30 | %(3) | | | 1.29 | % | | | 1.29 | % | | | 1.29 | % | | | 1.29 | % |
| Ratio of net investment income (loss) | | | | | | | | | | | | | | | | | | | | |
| to average net assets: | | | | | | | | | | | | | | | | | | | | |
| Before expense reimbursement | | | 1.46 | %(5) | | | 2.70 | % | | | 7.14 | % | | | (1.14 | )% | | | (10.64 | )% |
After expense reimbursement(4) | | | 1.94 | %(5) | | | 3.36 | % | | | 8.18 | % | | | 3.63 | % | | | 1.13 | % |
Portfolio turnover rate(6) | | | 54 | % | | | 41 | % | | | 74 | % | | | 38 | % | | | 77 | % |
| (1) | Information presented relates to a share of capital stock outstanding for each period. |
| (2) | Net investment income per share represents net investment income divided by the average shares outstanding throughout the period. |
| (3) | The ratio of expenses includes borrowing expense on securities sold short. The expense ratio excluding borrowing expenses on securities sold short was 1.77% before expense reimbursement and 1.29% after expense reimbursement. |
| (4) | See Note #3, Investment Adviser, for the waiver and expense reimbursement discussion. |
| (5) | The ratio of net investment income includes borrowing expense on securities sold short. |
| (6) | Portfolio turnover of The Multi-Disciplinary Portfolio. |
The accompanying notes are an integral part of these financial statements.
| KINETICS MUTUAL FUNDS, INC. |
| Report of Independent Registered |
| Public Accounting Firm |
Board of Directors and Shareholders of
Kinetics Mutual Funds, Inc.
Elmsford, NY
We have audited the accompanying statements of assets and liabilities of The Internet Fund, The Global Fund, The Paradigm Fund, The Medical Fund, The Small Cap Opportunities Fund, The Market Opportunities Fund, The Alternative Income Fund (previously the Water Infrastructure Fund) and The Multi-Disciplinary Fund, each a series of shares of Kinetics Mutual Funds, Inc. (the “Funds”), as of December 31, 2013, and the related statements of operations for the year then ended, the statements of changes in net assets for each of the two years in the period then ended and financial highlights for each of the five years in the period then ended. These financial statements and financial highlights are the responsibility of the Funds’ management. Our responsibility is to express an opinion on these financial statements and financial highlights based on our audits.
We conducted our audits in accordance with the standards of the Public Company Accounting Oversight Board (United States). Those standards require that we plan and perform the audit to obtain reasonable assurance about whether the financial statements and financial highlights are free of material misstatement. We were not engaged to perform, nor were the Funds required to have, an audit of their internal control over financial reporting. Our audits included consideration of internal control over financial reporting as a basis for designing audit procedures that are appropriate in the circumstances, but not for the purpose of expressing an opinion on the effectiveness of the Funds’ internal control over financial reporting. Accordingly, we express no such opinion. An audit also includes examining, on a test basis, evidence supporting the amounts and disclosures in the financial statements. An audit also includes assessing the accounting principles used and significant estimates made by management, as well as evaluating the overall financial statement presentation. We believe that our audits provide a reasonable basis for our opinion.
In our opinion, the financial statements and financial highlights referred to above present fairly in all material respects, the financial position of each of the eight funds of the Kinetics Mutual Funds, Inc. as of December 31, 2013, the results of their operations for the year then ended, the changes in their net assets for each of the two years in the period then ended and financial highlights for each of the five years in the period then ended, in conformity with accounting principles generally accepted in the United States of America.
Philadelphia, Pennsylvania
February 26, 2014
| KINETICS PORTFOLIOS TRUST — MASTER INVESTMENT PORTFOLIOS |
| Allocation of Portfolio Assets |
| December 31, 2013 |
The Internet Portfolio
| | | | | | | | |
| | | | | | | Percentage | |
| | | | Market | | | of Total | |
| Sector Allocation* | | | Value | | | Net Assets | |
| Information | | $ | 102,642,713 | | | 57.4 | % |
| Retail Trade | | | 21,876,615 | | | 12.2 | % |
| Management of Companies and Enterprises | | | 15,470,769 | | | 8.6 | % |
| Arts, Entertainment, and Recreation | | | 14,500,230 | | | 8.1 | % |
| Finance and Insurance | | | 11,979,860 | | | 6.7 | % |
| Manufacturing | | | 5,240,240 | | | 2.9 | % |
| Real Estate and Rental and Leasing | | | 472,562 | | | 0.3 | % |
| Administrative and Support and Waste Management and | | | | | | | |
| Remediation Services | | | 295,776 | | | 0.2 | % |
| Professional, Scientific, and Technical Services | | | 14,260 | | | 0.0 | % |
| * | | Excludes Short-Term Investments |
| KINETICS PORTFOLIOS TRUST — MASTER INVESTMENT PORTFOLIOS |
| Allocation of Portfolio Assets |
December 31, 2013 — (Continued) |
The Global Portfolio
| | | | | | | Percentage | |
| | | | Market | | | of Total | |
| Country Allocation* | | | Value | | | Net Assets | |
| United States | | $ | 5,543,322 | | | 45.2 | % |
| Canada | | | 2,922,478 | | | 23.9 | % |
| France | | | 798,310 | | | 6.5 | % |
| Cayman Islands | | | 681,078 | | | 5.6 | % |
| Switzerland | | | 388,229 | | | 3.2 | % |
| Bermuda | | | 191,040 | | | 1.6 | % |
| Singapore | | | 142,871 | | | 1.2 | % |
| Spain | | | 129,178 | | | 1.1 | % |
| Japan | | | 88,232 | | | 0.7 | % |
| Jersey | | | 86,527 | | | 0.7 | % |
| Guernsey | | | 74,146 | | | 0.6 | % |
| Brazil | | | 44,395 | | | 0.4 | % |
| Greece | | | 44,023 | | | 0.4 | % |
| Argentina | | | 17,827 | | | 0.2 | % |
| * | | Excludes Short-Term Investments |
| KINETICS PORTFOLIOS TRUST — MASTER INVESTMENT PORTFOLIOS |
| Allocation of Portfolio Assets |
December 31, 2013 — (Continued) |
The Paradigm Portfolio
| | | | | | | Percentage | |
| | | | Market | | | of Total | |
| Sector Allocation* | | | Value | | | Net Assets | |
| Information | | $ | 343,783,208 | | | 25.8 | % |
| Real Estate and Rental and Leasing | | | 171,181,570 | | | 12.9 | % |
| Management of Companies and Enterprises | | | 168,898,939 | | | 12.7 | % |
| Finance and Insurance | | | 147,483,542 | | | 11.1 | % |
| Arts, Entertainment, and Recreation | | | 103,487,620 | | | 7.8 | % |
| Retail Trade | | | 103,317,391 | | | 7.8 | % |
| Manufacturing | | | 74,103,413 | | | 5.6 | % |
| Mining, Quarrying, and Oil and Gas Extraction | | | 62,183,628 | | | 4.7 | % |
| Petroleum and Gas | | | 30,344,202 | | | 2.3 | % |
| Transportation and Warehousing | | | 20,657,185 | | | 1.6 | % |
| Utilities | | | 2,585,775 | | | 0.2 | % |
| Construction | | | 1,040,428 | | | 0.1 | % |
| Accommodation and Food Services | | | 283,464 | | | 0.0 | % |
| Wholesale Trade | | | 62,138 | | | 0.0 | % |
| * | | Excludes Short-Term Investments |
| KINETICS PORTFOLIOS TRUST — MASTER INVESTMENT PORTFOLIOS |
| Allocation of Portfolio Assets |
December 31, 2013 — (Continued) |
The Medical Portfolio
| | | | | | | Percentage | |
| | | | Market | | | of Total | |
| Sector Allocation* | | | Value | | | Net Assets | |
| Manufacturing | | $ | 22,477,549 | | | 90.7 | % |
| Professional, Scientific, and Technical Services | | | 1,526,375 | | | 6.2 | % |
| Finance and Insurance | | | 8,514 | | | 0.0 | % |
| Health Care and Social Assistance | | | 125 | | | 0.0 | % |
| * | | Excludes Short-Term Investments |
| KINETICS PORTFOLIOS TRUST — MASTER INVESTMENT PORTFOLIOS |
| Allocation of Portfolio Assets |
December 31, 2013 — (Continued) |
The Small Cap Opportunities Portfolio
| | | | | | | Percentage | |
| | | | Market | | | of Total | |
| Sector Allocation* | | | Value | | | Net Assets | |
| Real Estate and Rental and Leasing | | $ | 78,404,561 | | | 22.6 | % |
| Manufacturing | | | 67,056,522 | | | 19.3 | % |
| Finance and Insurance | | | 48,859,758 | | | 14.0 | % |
| Information | | | 43,186,992 | | | 12.4 | % |
| Management of Companies and Enterprises | | | 33,725,427 | | | 9.7 | % |
| Retail Trade | | | 18,406,907 | | | 5.3 | % |
| Petroleum and Gas | | | 17,793,915 | | | 5.1 | % |
| Arts, Entertainment, and Recreation | | | 12,784,720 | | | 3.7 | % |
| Accommodation and Food Services | | | 2,164,750 | | | 0.6 | % |
| Mining, Quarrying, and Oil and Gas Extraction | | | 2,161,291 | | | 0.6 | % |
| Wholesale Trade | | | 1,076,544 | | | 0.3 | % |
| Transportation Equipment | | | 960,663 | | | 0.3 | % |
| * | | Excludes Short-Term Investments |
| KINETICS PORTFOLIOS TRUST — MASTER INVESTMENT PORTFOLIOS |
| Allocation of Portfolio Assets |
December 31, 2013 — (Continued) |
The Market Opportunities Portfolio
| | | | | | | Percentage | |
| | | | Market | | | of Total | |
| Sector Allocation* | | | Value | | | Net Assets | |
| Finance and Insurance | | $ | 32,105,576 | | | 48.2 | % |
| Management of Companies and Enterprises | | | 9,276,794 | | | 13.9 | % |
| Real Estate and Rental and Leasing | | | 7,257,605 | | | 10.9 | % |
| Retail Trade | | | 3,041,471 | | | 4.6 | % |
| Petroleum and Gas | | | 2,988,894 | | | 4.5 | % |
| Arts, Entertainment, and Recreation | | | 914,892 | | | 1.4 | % |
| Information | | | 672,115 | | | 1.0 | % |
| Accommodation and Food Services | | | 203,000 | | | 0.3 | % |
| Mining, Quarrying, and Oil and Gas Extraction | | | 162,960 | | | 0.2 | % |
| Utilities | | | 110,444 | | | 0.2 | % |
| Manufacturing | | | 49,482 | | | 0.1 | % |
| Support Activities for Water Transportation | | | 7,522 | | | 0.0 | % |
| * | | Excludes Short-Term Investments |
| KINETICS PORTFOLIOS TRUST — MASTER INVESTMENT PORTFOLIOS |
| Allocation of Portfolio Assets |
December 31, 2013 — (Continued) |
The Alternative Income Portfolio
| | | | | | | Percentage | |
| | | | Market | | | of Total | |
| Sector Allocation* | | | Value | | | Net Assets | |
| Finance and Insurance | | $ | 8,688,066 | | | 37.0 | % |
| Manufacturing | | | 4,492,889 | | | 19.1 | % |
| Information | | | 2,001,791 | | | 8.5 | % |
| Retail Trade | | | 1,072,179 | | | 4.6 | % |
| Public Administration | | | 899,686 | | | 3.8 | % |
| Mining, Quarrying, and Oil and Gas Extraction | | | 733,487 | | | 3.1 | % |
| Utilities | | | 358,664 | | | 1.5 | % |
| Wholesale Trade | | | 199,966 | | | 0.8 | % |
| Accommodations and Food Services | | | 198,884 | | | 0.8 | % |
Administrative and Support and Waste Management and Remediation Services | | | 106,534 | | | 0.5 | % |
| Transportation and Warehousing | | | 103,341 | | | 0.4 | % |
| Management of Companies and Enterprises | | | 102,585 | | | 0.4 | % |
| * | | Excludes Short-Term Investments & Written Options |
| KINETICS PORTFOLIOS TRUST — MASTER INVESTMENT PORTFOLIOS |
| Allocation of Portfolio Assets |
December 31, 2013 — (Continued) |
The Multi-Disciplinary Portfolio
| | | | | | | Percentage | |
| | | | Market | | | of Total | |
| Sector Allocation* | | | Value | | | Net Assets | |
| Mining, Quarrying, and Oil and Gas Extraction | | $ | 14,824,984 | | | 16.3 | % |
| Manufacturing | | | 10,636,875 | | | 11.8 | % |
| Finance and Insurance | | | 10,479,592 | | | 11.6 | % |
| Information | | | 8,490,813 | | | 9.4 | % |
Administrative and Support and Waste Management and Remediation Services | | | 5,216,063 | | | 5.8 | % |
| Health Care and Social Assistance | | | 2,850,581 | | | 3.2 | % |
| Arts, Entertainment, and Recreation | | | 2,814,806 | | | 3.1 | % |
| Other Services (except Public Administration) | | | 1,404,797 | | | 1.6 | % |
| Retail Trade | | | 990,625 | | | 1.1 | % |
| Transportation and Warehousing | | | 525,000 | | | 0.6 | % |
| Real Estate and Rental and Leasing | | | 497,848 | | | 0.6 | % |
| Management of Companies and Enterprises | | | 104,250 | | | 0.1 | % |
| * | | Excludes Short-Term Investments & Written Options |
| KINETICS PORTFOLIOS TRUST — MASTER INVESTMENT PORTFOLIOS |
| The Internet Portfolio |
| Portfolio of Investments — December 31, 2013 |
| Identifier | | COMMON STOCKS — 96.35% | | | Shares | | | Value | |
| | | Administrative and Support Services — 0.16% | | | | | | | |
| CRMZ | | CreditRiskMonitor.com, Inc. | | | 600 | | $ | 1,800 | |
| CTRP | | Ctrip.com International Ltd. — ADR*^ | | | 5,800 | | | 287,796 | |
| IILG | | Interval Leisure Group, Inc. | | | 200 | | | 6,180 | |
| | | | | | | | | 295,776 | |
| | | Broadcasting (except Internet) — 3.31% | | | | | | | |
| CBS | | CBS Corporation — Class B | | | 53,000 | | | 3,378,220 | |
| DIS | | The Walt Disney Company^ | | | 33,300 | | | 2,544,120 | |
| | | | | | | | | 5,922,340 | |
| | | Computer and Electronic Product Manufacturing — 0.29% | | | | | | | |
| QCOM | | QUALCOMM Inc. | | | 7,000 | | | 519,750 | |
| | | Credit Intermediation and Related Activities — 0.18% | | | | | | | |
| TREE | | Tree.com, Inc.*^ | | | 9,833 | | | 322,916 | |
| | | Data Processing, Hosting and Related Services — 0.21% | | | | | | | |
| CSGP | | CoStar Group, Inc.*^ | | | 2,000 | | | 369,160 | |
| | | Data Processor — 4.27% | | | | | | | |
| MA | | MasterCard, Inc. — Class A | | | 4,000 | | | 3,341,840 | |
| VRSK | | Verisk Analytics, Inc. — Class A* | | | 7,700 | | | 506,044 | |
| V | | Visa, Inc. — Class A^ | | | 17,000 | | | 3,785,560 | |
| | | | | | | | | 7,633,444 | |
| | | Defense — 2.24% | | | | | | | |
| CACI | | CACI International, Inc. — Class A*^ | | | 40,000 | | | 2,928,800 | |
| MANT | | ManTech International Corporation — Class A^ | | | 36,000 | | | 1,077,480 | |
| | | | | | | | | 4,006,280 | |
| | | E- Commerce — 12.39% | | | | | | | |
| EBAY | | eBay, Inc.* | | | 72,000 | | | 3,952,080 | |
| IACI | | IAC/InterActiveCorp | | | 108,000 | | | 7,418,520 | |
| LINTA | | Liberty Interactive Corporation — Class A* | | | 367,400 | | | 10,783,190 | |
| | | | | | | | | 22,153,790 | |
| | | Gaming — 1.89% | | | | | | | |
| 200 HK | | Melco International Development Limited | | | 920,000 | | | 3,381,350 | |
| | | General Merchandise Stores — 0.01% | | | | | | | |
| SHLD | | Sears Holdings Corporation*^ | | | 400 | | | 19,616 | |
The accompanying notes are an integral part of these financial statements.
| KINETICS PORTFOLIOS TRUST — MASTER INVESTMENT PORTFOLIOS |
| The Internet Portfolio |
Portfolio of Investments — December 31, 2013 — (Continued) |
| Identifier | | | | | Shares | | | Value | |
| | | Global Exchanges — 0.22% | | | | | | | |
| EXAE GA | | Hellenic Exchanges S.A. Holding Clearing Settlement | | | | | | | |
| | | and Registry | | | 11,000 | | $ | 121,062 | |
| JSE SJ | | JSE Limited | | | 32,000 | | | 273,723 | |
| | | | | | | | | 394,785 | |
| | | Holding Company — 15.82% | | | | | | | |
| GBLS BB | | Groupe Bruxelles Lambert S.A. Strip VVPR*+ | | | 2,000 | | | — | |
| IEP | | Icahn Enterprises LP^ | | | 36,060 | | | 3,945,325 | |
| LMCA | | Liberty Media Corporation — Class A* | | | 118,600 | | | 17,368,970 | |
| LVNTA | | Liberty Ventures — Series A* | | | 57,000 | | | 6,987,630 | |
| | | | | | | | | 28,301,925 | |
| | | Insurance Carriers and Related Activities — 0.00% | | | | | | | |
| AFSI | | AmTrust Financial Services, Inc.^ | | | 110 | | | 3,596 | |
| | | Media — 19.28% | | | | | | | |
| DISCA | | Discovery Communications, Inc. — Class A*^ | | | 101,700 | | | 9,195,714 | |
| SNI | | Scripps Networks Interactive — Class A | | | 77,000 | | | 6,653,570 | |
| STRZA | | Starz — Class A*^ | | | 129,200 | | | 3,777,808 | |
| TWX | | Time Warner, Inc. | | | 77,000 | | | 5,368,440 | |
| VIAB | | Viacom Inc. — Class B | | | 108,600 | | | 9,485,124 | |
| | | | | | | | | 34,480,656 | |
| | | Motion Picture and Sound Recording Industries — 3.20% | | | | | | | |
| DWA | | DreamWorks Animation SKG, Inc. — Class A*^ | | | 161,000 | | | 5,715,500 | |
| | | Motor Vehicle and Parts Dealers — 0.67% | | | | | | | |
| AN | | AutoNation, Inc.* | | | 24,000 | | | 1,192,560 | |
| | | Non-Store Retailers — 1.29% | | | | | | | |
| CPRT | | Copart, Inc.* | | | 38,860 | | | 1,424,219 | |
| OSTK | | Overstock.com, Inc.* | | | 1,000 | | | 30,790 | |
| BID | | Sotheby’s | | | 16,000 | | | 851,200 | |
| | | | | | | | | 2,306,209 | |
| | | Other Exchanges — 0.05% | | | | | | | |
| CBOE | | CBOE Holdings Inc.^ | | | 1,700 | | | 88,332 | |
| | | Other Information Services — 6.65% | | | | | | | |
| GOOG | | Google Inc. — Class A* | | | 8,600 | | | 9,638,106 | |
| YHOO | | Yahoo! Inc.* | | | 56,000 | | | 2,264,640 | |
| | | | | | | | | 11,902,746 | |
The accompanying notes are an integral part of these financial statements.
| KINETICS PORTFOLIOS TRUST — MASTER INVESTMENT PORTFOLIOS |
| The Internet Portfolio |
Portfolio of Investments — December 31, 2013 — (Continued) |
| Identifier | | | | | Shares | | | Value | |
| | | Performing Arts, Spectator Sports, and Related Industries — 4.79% | | | | | | | |
| LYV | | Live Nation Entertainment, Inc.* | | | 195,000 | | $ | 3,853,200 | |
| MSG | | The Madison Square Garden Company — Class A* | | | 82,000 | | | 4,721,560 | |
| | | | | | | | | 8,574,760 | |
| | | Professional, Scientific, and Technical Services — 0.01% | | | | | | | |
| MWW | | Monster Worldwide, Inc.*^ | | | 2,000 | | | 14,260 | |
| | | Publishing Industries (except Internet) — 0.94% | | | | | | | |
| SSP | | The E.W. Scripps Company — Class A*^ | | | 77,500 | | | 1,683,300 | |
| | | Rental and Leasing Services — 0.17% | | | | | | | |
| CDCO | | Comdisco Holding Company, Inc.*^ | | | 58,000 | | | 313,200 | |
| | | Satellite Telecommunications — 14.97% | | | | | | | |
| DISH | | DISH Network Corp. — Class A* | | | 146,000 | | | 8,456,320 | |
| SATS | | EchoStar Corporation — Class A* | | | 217,800 | | | 10,829,016 | |
| LBTYK | | Liberty Global plc — Series C* | | | 72,000 | | | 6,071,040 | |
| LORL | | Loral Space & Communications Inc.* | | | 8,600 | | | 696,428 | |
| VSAT | | ViaSat, Inc.*^ | | | 11,400 | | | 714,210 | |
| | | | | | | | | 26,767,014 | |
| | | Securities, Commodity Contracts, and Other Financial Investments | | | | | | | |
| | | and Related Activities — 1.98% | | | | | | | |
| ICE | | IntercontinentalExchange Group, Inc. | | | 14,030 | | | 3,155,627 | |
| MKTX | | MarketAxess Holdings, Inc. | | | 5,700 | | | 381,159 | |
| | | | | | | | | 3,536,786 | |
| | | Security System Services — 1.34% | | | | | | | |
| ASCMA | | Ascent Capital Group LLC — Class A* | | | 28,000 | | | 2,395,680 | |
| | | Telecommunications — 0.02% | | | | | | | |
| ICTG | | ICTC Group Inc.* | | | 149 | | | 2,987 | |
| 9984 JP | | SoftBank Corp. | | | 400 | | | 34,945 | |
| | | | | | | | | 37,932 | |
| | | TOTAL COMMON STOCKS | | | | | | | |
| | | (cost $81,513,500) | | | | | | 172,333,663 | |
| | | | | | | | | | |
| | | | | | Principal | | | | |
| | | ESCROW NOTES — 0.00% | | | Amount | | | | |
| | | Special Purpose Entity — 0.00% | | | | | | | |
| 006ESC958 | | Adelphia Communications Corp. Preferred*+ | | | $190,000 | | | — | |
| | | TOTAL ESCROW NOTES | | | | | | | |
| | | (cost $0) | | | | | | — | |
The accompanying notes are an integral part of these financial statements.
| KINETICS PORTFOLIOS TRUST — MASTER INVESTMENT PORTFOLIOS |
| The Internet Portfolio |
Portfolio of Investments — December 31, 2013 — (Continued) |
| Identifier | | RIGHTS — 0.09% | | | Shares | | | Value | |
| | | Rental and Leasing Services — 0.09% | | | | | | | |
| CDCOR | | Comdisco Holding Company, Inc.*# | | | 2,244,537 | | $ | 159,362 | |
| | | TOTAL RIGHTS | | | | | | | |
| | | (cost $106,303) | | | | | | 159,362 | |
| | | | | | | | | | |
| | | | | | Principal | | | | |
| | | SHORT-TERM INVESTMENTS — 3.32% | | | Amount | | | | |
| | | Commercial Paper — 3.29% | | | | | | | |
| 049218836 | | U.S. Bank N.A., 0.02%, 01/02/2014 | | | $5,875,000 | | | 5,875,000 | |
| | | | | | | | | | |
| | | | | | Shares | | | | |
| | | Money Market Funds — 0.03% | | | | | | | |
| FIGXX | | Fidelity Institutional Government Portfolio — Class I, 0.01%b | | | 61,676 | | | 61,676 | |
| | | TOTAL SHORT-TERM INVESTMENTS | | | | | | | |
| | | (cost $5,936,676) | | | | | | 5,936,676 | |
| | | | | | | | | | |
| | | INVESTMENTS PURCHASED WITH | | | | | | | |
| | | THE CASH PROCEEDS FROM | | | | | | | |
| | | SECURITIES LENDING — 16.67% | | | | | | | |
| | | Money Market Funds — 16.67% | | | | | | | |
| | | Mount Vernon Securities Lending Trust — Prime | | | | | | | |
| | | Portfolio, 0.17%b | | | 29,816,268 | | | 29,816,268 | |
| | | TOTAL INVESTMENTS PURCHASED WITH THE CASH | | | | | | | |
| | | PROCEEDS FROM SECURITIES LENDING | | | | | | | |
| | | (cost $29,816,268) | | | | | | 29,816,268 | |
| | | TOTAL INVESTMENTS — 116.43% | | | | | | | |
| | | (cost $117,372,747) | | | | | $ | 208,245,969 | |
Percentages are stated as a percent of net assets.
| * — | Non-income producing security. |
| ^ — | This security or a portion of this security was out on loan at December 31, 2013. Total loaned securities had a market value of $28,959,111 at December 31, 2013. |
| + — | Security is considered illiquid and was fair valued. The aggregate value of such securities is $0 or 0.00% of net assets. |
| # — | Contingent value right (contingent upon profitability of company). |
| b — | The rate quoted is the annualized seven-day yield as of December 31, 2013. |
ADR — American Depository Receipt.
The accompanying notes are an integral part of these financial statements.
| KINETICS PORTFOLIOS TRUST — MASTER INVESTMENT PORTFOLIOS |
| The Global Portfolio |
Portfolio of Investments — December 31, 2013 — (Continued) |
| Identifier | | COMMON STOCKS — 91.28% | | | Shares | | | Value | |
| | | Apparel Manufacturing — 2.09% | | | | | | | |
| MC FP | | LVMH Moet Hennessy Louis Vuitton SA | | | 1,400 | | $ | 255,386 | |
| | | Asset Management — 13.96% | | | | | | | |
| APO | | Apollo Global Management LLC — Class A | | | 300 | | | 9,483 | |
| BX | | The Blackstone Group LP | | | 1,850 | | | 58,275 | |
| BAM | | Brookfield Asset Management Inc. — Class A | | | 4,900 | | | 190,267 | |
| DDEJF | | Dundee Corporation — Class A* | | | 34,600 | | | 609,877 | |
| JZCP LN | | JZ Capital Partners Ltd. | | | 10,000 | | | 74,146 | |
| OAK | | Oaktree Capital Group LLC^ | | | 2,700 | | | 158,868 | |
| ONEXF | | Onex Corporation | | | 11,200 | | | 604,250 | |
| | | | | | | | | 1,705,166 | |
| | | Beverage and Tobacco Product Manufacturing — 0.16% | | | | | | | |
| CWGL | | Crimson Wine Group Ltd.* | | | 1,350 | | | 11,934 | |
| FNEVY | | Fraser and Neave Limited — ADR | | | 400 | | | 8,000 | |
| | | | | | | | | 19,934 | |
| | | Construction of Buildings — 2.06% | | | | | | | |
| BRP | | Brookfield Residential Properties Inc.*^ | | | 10,100 | | | 244,319 | |
| LEN | | Lennar Corporation — Class A^ | | | 200 | | | 7,912 | |
| | | | | | | | | 252,231 | |
| | | Crop Production — 0.15% | | | | | | | |
| CRESY | | Cresud S.A.C.I.F.y A. — ADR | | | 1,765 | | | 17,826 | |
| | | E-Commerce — 3.68% | | | | | | | |
| LINTA | | Liberty Interactive Corporation — Class A* | | | 15,300 | | | 449,055 | |
| | | Electronics and Appliance Stores — 0.42% | | | | | | | |
| SHOS | | Sears Hometown and Outlet Stores Inc.* | | | 2,000 | | | 51,000 | |
| | | European Exchanges — 0.97% | | | | | | | |
| BME SM | | Bolsas y Mercados Espanoles | | | 3,130 | | | 119,103 | |
| | | Gaming — 2.44% | | | | | | | |
| WYNN | | Wynn Resorts Limited^ | | | 1,535 | | | 298,112 | |
| | | General Merchandise Stores — 4.21% | | | | | | | |
| SEARF | | Sears Canada Inc.^ | | | 2,720 | | | 33,701 | |
| SHLD | | Sears Holdings Corporation*^ | | | 9,800 | | | 480,592 | |
| | | | | | | | | 514,293 | |
The accompanying notes are an integral part of these financial statements.
| KINETICS PORTFOLIOS TRUST — MASTER INVESTMENT PORTFOLIOS |
| The Global Portfolio |
Portfolio of Investments — December 31, 2013 — (Continued) |
| Identifier | | | | | Shares | | | Value | |
| | | Global Exchanges — 1.16% | | | | | | | |
| BVMF3 BZ | | BM&FBOVESPA SA | | | 9,470 | | $ | 44,395 | |
| EXAE GA | | Hellenic Exchanges S.A. Holding Clearing Settlement | | | | | | | |
| | | and Registry | | | 4,000 | | | 44,022 | |
| SGX SP | | Singapore Exchange Limited | | | 9,275 | | | 53,359 | |
| | | | | | | | | 141,776 | |
| | | Holding Company — 21.28% | | | | | | | |
| BOL FP | | Bollore SA | | | 925 | | | 542,924 | |
| IEP | | Icahn Enterprises LP^ | | | 6,194 | | | 677,685 | |
| JS SP | | Jardine Strategic Holdings Limited | | | 5,970 | | | 191,040 | |
| LUK | | Leucadia National Corporation | | | 12,000 | | | 340,080 | |
| LMCA | | Liberty Media Corporation — Class A* | | | 3,400 | | | 497,930 | |
| LVNTA | | Liberty Ventures — Series A*^ | | | 2,600 | | | 318,734 | |
| PVF CN | | Partners Value Fund Inc.* | | | 1,200 | | | 31,716 | |
| | | | | | | | | 2,600,109 | |
| | | Insurance Carriers and Related Activities — 0.63% | | | | | | | |
| AFSI | | AmTrust Financial Services, Inc.^ | | | 500 | | | 16,345 | |
| GLRE | | Greenlight Capital Re, Ltd. — Class A* | | | 1,800 | | | 60,678 | |
| | | | | | | | | 77,023 | |
| | | Jewelry, Watch, Precious Stone, and Precious Metal | | | | | | | |
| | | Merchant Wholesalers — 3.18% | | | | | | | |
| CFR SW | | Compagnie Financiere Richemont SA | | | 3,900 | | | 388,229 | |
| | | Lessors of Nonresidential Buildings (except Miniwarehouses) — 1.92% | | | | | | | |
| HHC | | The Howard Hughes Corporation* | | | 200 | | | 24,020 | |
| RSE | | Rouse Properties, Inc.^ | | | 9,500 | | | 210,805 | |
| | | | | | | | | 234,825 | |
| | | Media — 0.93% | | | | | | | |
| STRZA | | Starz — Class A*^ | | | 3,894 | | | 113,861 | |
| | | Merchant Wholesalers, Nondurable Goods — 0.71% | | | | | | | |
| GLEN LN | | Glencore Xstrata plc* | | | 16,710 | | | 86,527 | |
| | | Mining (except Oil and Gas) — 0.43% | | | | | | | |
| FNV | | Franco-Nevada Corporation^ | | | 1,000 | | | 40,740 | |
| NCQ | | NovaCopper Inc.* | | | 666 | | | 1,012 | |
| NG | | NovaGold Resources Inc.*^ | | | 4,000 | | | 10,160 | |
| | | | | | | | | 51,912 | |
| | | Motion Picture and Sound Recording Industries — 2.73% | | | | | | | |
| DWA | | DreamWorks Animation SKG, Inc. — Class A*^ | | | 9,400 | | | 333,700 | |
The accompanying notes are an integral part of these financial statements.
| KINETICS PORTFOLIOS TRUST — MASTER INVESTMENT PORTFOLIOS |
| The Global Portfolio |
Portfolio of Investments — December 31, 2013 — (Continued) |
| Identifier | | | | | Shares | | | Value | |
| | | Oil and Gas — 2.19% | | | | | | | |
| TPL | | Texas Pacific Land Trust* | | | 2,700 | | $ | 267,219 | |
| | | Oil and Gas Extraction — 7.37% | | | | | | | |
| CLR | | Continental Resources, Inc.* | | | 1,050 | | | 118,146 | |
| POU CN | | Paramount Resources Ltd. — Class A* | | | 1,410 | | | 51,608 | |
| SEMUF | | Siem Industries Inc. | | | 6,600 | | | 620,400 | |
| TOU CN | | Tourmaline Oil Corp.* | | | 2,615 | | | 110,041 | |
| | | | | | | | | 900,195 | |
| | | Other Information Services — 0.01% | | | | | | | |
| IIJI | | Internet Initiative Japan Inc. — ADR | | | 100 | | | 1,337 | |
| | | Publishing Industries (except Internet) — 0.08% | | | | | | | |
| PRS SM | | Promotora de Informaciones S.A. — Class A* | | | 18,310 | | | 10,076 | |
| | | Real Estate — 10.30% | | | | | | | |
| BPY | | Brookfield Property Partners LP^ | | | 281 | | | 5,603 | |
| BRE CN | | Brookfield Real Estate Services, Inc. | | | 5,050 | | | 63,467 | |
| CWT-U CN | | Calloway — REIT | | | 5,100 | | | 120,796 | |
| CIT SP | | City Developments Limited | | | 10,715 | | | 81,512 | |
| DRM CN | | Dream Unlimited Corp. — Class A* | | | 50,000 | | | 795,481 | |
| FCE/A | | Forest City Enterprises, Inc. — Class A* | | | 10,000 | | | 191,000 | |
| | | | | | | | | 1,257,859 | |
| | | Restaurants — 4.94% | | | | | | | |
| BKW | | Burger King Worldwide Inc. | | | 2,000 | | | 45,720 | |
| WEN | | The Wendy’s Company^ | | | 64,000 | | | 558,080 | |
| | | | | | | | | 603,800 | |
| | | Satellite Telecommunications — 2.25% | | | | | | | |
| DISH | | DISH Network Corp. — Class A* | | | 2,000 | | | 115,840 | |
| SATS | | EchoStar Corporation — Class A* | | | 3,200 | | | 159,104 | |
| | | | | | | | | 274,944 | |
| | | Support Activities for Water Transportation — 0.12% | | | | | | | |
| CKI CN | | Clarke Inc. | | | 2,000 | | | 15,044 | |
| | | Telecommunications — 0.36% | | | | | | | |
| 9984 JP | | SoftBank Corp. | | | 500 | | | 43,681 | |
| | | Transportation Equipment Manufacturing — 0.55% | | | | | | | |
| HEI/A | | HEICO Corporation — Class A | | | 575 | | | 24,219 | |
| 6460 JP | | Sega Sammy Holdings, Inc. | | | 1,700 | | | 43,214 | |
| | | | | | | | | 67,433 | |
| | | TOTAL COMMON STOCKS | | | | | | | |
| | | (cost $8,340,976) | | | | | | 11,151,656 | |
The accompanying notes are an integral part of these financial statements.
| KINETICS PORTFOLIOS TRUST — MASTER INVESTMENT PORTFOLIOS |
| The Global Portfolio |
Portfolio of Investments — December 31, 2013 — (Continued) |
| Identifier | | PREFERRED STOCKS — 0.00% | | | Shares | | | Value | |
| | | Building Material and Garden Equipment and | | | | | | | |
| | | Supplies Dealers — 0.00% | | | | | | | |
| OSHUS | | Orchard Supply Hardware Stores Corporation — Series A* | | | 132 | | $ | 1 | |
| | | TOTAL PREFERRED STOCKS | | | | | | | |
| | | (cost $192) | | | | | | 1 | |
| | | | | | | | | | |
| | | | | | Principal | | | | |
| | | SHORT-TERM INVESTMENTS — 9.23% | | | Amount | | | | |
| | | Commercial Paper — 4.71% | | | | | | | |
| 049218048 | �� | U.S. Bank N.A., 0.02%, 01/02/2014 | | $ | 575,000 | | | 575,000 | |
| | | | | | | | | | |
| | | | | | Shares | | | | |
| | | Money Market Funds — 4.52% | | | | | | | |
| FIGXX | | Fidelity Institutional Government Portfolio — Class I, 0.01%b | | | 553,000 | | | 553,000 | |
| | | TOTAL SHORT-TERM INVESTMENTS | | | | | | | |
| | | (cost $1,128,000) | | | | | | 1,128,000 | |
| | | | | | | | | | |
| | | INVESTMENTS PURCHASED WITH | | | | | | | |
| | | THE CASH PROCEEDS FROM | | | | | | | |
| | | SECURITIES LENDING — 28.81% | | | | | | | |
| | | Money Market Funds — 28.81% | | | | | | | |
| | | Mount Vernon Securities Lending Trust — Prime Portfolio, 0.17%b | | | 3,519,916 | | | 3,519,916 | |
| | | TOTAL INVESTMENTS PURCHASED WITH THE CASH | | | | | | | |
| | | PROCEEDS FROM SECURITIES LENDING | | | | | | | |
| | | (cost $3,519,916) | | | | | | 3,519,916 | |
| | | TOTAL INVESTMENTS — 129.32% | | | | | | | |
| | | (cost $12,989,084) | | | | | $ | 15,799,573 | |
Percentages are stated as a percent of net assets.
| * — | Non-income producing security. |
| ^ — | This security or a portion of this security was out on loan at December 31, 2013. Total loaned securities had a market value of $3,458,039 at December 31, 2013. |
| b — | The rate quoted is the annualized seven-day yield as of December 31, 2013. |
ADR — American Depository Receipt.
REIT — Real Estate Investment Trust.
The accompanying notes are an integral part of these financial statements.
| KINETICS PORTFOLIOS TRUST — MASTER INVESTMENT PORTFOLIOS |
| The Paradigm Portfolio |
Portfolio of Investments — December 31, 2013 — (Continued) |
| Identifier | | COMMON STOCKS — 92.59% | | | Shares | | | Value | |
| | | Apparel Manufacturing — 0.13% | | | | | | | |
| LB | | L Brands, Inc.^ | | | 25,600 | | $ | 1,583,360 | |
| LVMUY | | LVMH Moet Hennessy Louis Vuitton SA — ADR | | | 5,200 | | | 190,320 | |
| | | | | | | | | 1,773,680 | |
| | | Asset Management — 5.94% | | | | | | | |
| APO | | Apollo Global Management LLC — Class A | | | 1,000 | | | 31,610 | |
| BAM | | Brookfield Asset Management Inc. — Class A^ | | | 1,248,900 | | | 48,494,787 | |
| CG | | The Carlyle Group LP | | | 100 | | | 3,562 | |
| DDEJF | | Dundee Corporation — Class A* | | | 149,500 | | | 2,635,162 | |
| JZCP LN | | JZ Capital Partners Ltd. | | | 15,200 | | | 112,701 | |
| KKR | | KKR & Co. LP^ | | | 900 | | | 21,906 | |
| OAK | | Oaktree Capital Group LLC^ | | | 13,900 | | | 817,876 | |
| ONEXF | | Onex Corporation | | | 397,100 | | | 21,423,902 | |
| RCP LN | | RIT Capital Partners plc | | | 26,600 | | | 555,011 | |
| 806 HK | | Value Partners Group Limited | | | 2,771,000 | | | 2,144,101 | |
| WETF | | WisdomTree Investments, Inc.* | | | 147,000 | | | 2,603,370 | |
| | | | | | | | | 78,843,988 | |
| | | Beverage and Tobacco Product Manufacturing — 0.12% | | | | | | | |
| BF/A | | Brown-Forman Corporation — Class A | | | 450 | | | 33,197 | |
| CWGL | | Crimson Wine Group Ltd.* | | | 171,860 | | | 1,519,242 | |
| PM | | Philip Morris International, Inc. | | | 750 | | | 65,348 | |
| | | | | | | | | 1,617,787 | |
| | | Broadcasting (except Internet) — 2.69% | | | | | | | |
| CBS | | CBS Corporation — Class B | | | 559,720 | | | 35,676,553 | |
| | | Building Material and Garden Equipment and | | | | | | | |
| | | Supplies Dealers — 0.00% | | | | | | | |
| OSHWQ | | Orchard Supply Hardware Stores Corporation — Class A* | | | 23,155 | | | 4,446 | |
| | | Chemical Manufacturing — 1.04% | | | | | | | |
| OPK | | OPKO Health, Inc.*^ | | | 4,000 | | | 33,760 | |
| SIAL | | Sigma-Aldrich Corporation^ | | | 145,815 | | | 13,708,068 | |
| VHI | | Valhi, Inc. | | | 6,000 | | | 105,480 | |
| | | | | | | | | 13,847,308 | |
| | | Construction of Buildings — 0.13% | | | | | | | |
| BRP | | Brookfield Residential Properties Inc.* | | | 28,600 | | | 691,834 | |
| LEN | | Lennar Corporation — Class A^ | | | 26,300 | | | 1,040,428 | |
| | | | | | | | | 1,732,262 | |
| | | Credit Intermediation and Related Activities — 0.00% | | | | | | | |
| OCN | | Ocwen Financial Corporation* | | | 200 | | | 11,090 | |
The accompanying notes are an integral part of these financial statements.
| KINETICS PORTFOLIOS TRUST — MASTER INVESTMENT PORTFOLIOS |
| The Paradigm Portfolio |
Portfolio of Investments — December 31, 2013 — (Continued) |
| Identifier | | | | | Shares | | | Value | |
| | | E-Commerce — 2.98% | | | | | | | |
| IACI | | IAC/InterActiveCorp | | | 44,700 | | $ | 3,070,443 | |
| LINTA | | Liberty Interactive Corporation — Class A* | | | 1,243,600 | | | 36,499,660 | |
| | | | | | | | | 39,570,103 | |
| | | Electronics and Appliance Stores — 0.20% | | | | | | | |
| SHOS | | Sears Hometown and Outlet Stores Inc.* | | | 102,900 | | | 2,623,950 | |
| | | Gaming — 4.87% | | | | | | | |
| LVS | | Las Vegas Sands Corp. | | | 358,200 | | | 28,251,234 | |
| MGM | | MGM Resorts International* | | | 481,600 | | | 11,327,232 | |
| WYNN | | Wynn Resorts Limited^ | | | 129,000 | | | 25,053,090 | |
| | | | | | | | | 64,631,556 | |
| | | Gasoline Stations — 0.03% | | | | | | | |
| SUSS | | Susser Holdings Corporation*^ | | | 5,200 | | | 340,548 | |
| | | General Merchandise Stores — 2.17% | | | | | | | |
| FDO | | Family Dollar Stores, Inc. | | | 4,800 | | | 311,856 | |
| JCP | | J.C. Penney Company, Inc.*^ | | | 128,800 | | | 1,178,520 | |
| SEARF | | Sears Canada Inc.^ | | | 481,400 | | | 5,964,546 | |
| SHLD | | Sears Holdings Corporation*^ | | | 436,180 | | | 21,390,267 | |
| | | | | | | | | 28,845,189 | |
| | | Global Exchanges — 0.91% | | | | | | | |
| EXAE GA | | Hellenic Exchanges S.A. Holding Clearing Settlement | | | | | | | |
| | | and Registry | | | 33,600 | | | 369,789 | |
| 8697 JP | | Japan Exchange Group Inc. | | | 284,000 | | | 8,060,735 | |
| JSE SJ | | JSE Limited | | | 432,000 | | | 3,695,268 | |
| | | | | | | | | 12,125,792 | |
| | | Holding Company — 18.12% | | | | | | | |
| BOL FP | | Bollore SA | | | 5,200 | | | 3,052,112 | |
| GBLS BB | | Groupe Bruxelles Lambert S.A. Strip VVPR*+ | | | 23,520 | | | — | |
| IEP | | Icahn Enterprises LP | | | 818,055 | | | 89,503,397 | |
| JS SP | | Jardine Strategic Holdings Limited | | | 64,800 | | | 2,073,600 | |
| JSHLY | | Jardine Strategic Holdings Limited — ADR^ | | | 14,400 | | | 230,544 | |
| LUK | | Leucadia National Corporation | | | 1,715,000 | | | 48,603,100 | |
| LMCA | | Liberty Media Corporation — Class A* | | | 587,800 | | | 86,083,310 | |
| LVNTA | | Liberty Ventures — Series A* | | | 90,400 | | | 11,082,136 | |
| PVF CN | | Partners Value Fund Inc.* | | | 800 | | | 21,144 | |
| | | | | | | | | 240,649,343 | |
The accompanying notes are an integral part of these financial statements.
| KINETICS PORTFOLIOS TRUST — MASTER INVESTMENT PORTFOLIOS |
| The Paradigm Portfolio |
Portfolio of Investments — December 31, 2013 — (Continued) |
| Identifier | | | | | Shares | | | Value | |
| | | Insurance Carriers and Related Activities — 1.06% | | | | | | | |
| AFSI | | AmTrust Financial Services, Inc. | | | 2,200 | | $ | 71,918 | |
| MKL | | Markel Corporation* | | | 22,732 | | | 13,192,516 | |
| WTM | | White Mountains Insurance Group Ltd. | | | 1,400 | | | 844,312 | |
| | | | | | | | | 14,108,746 | |
| | | Lessors of Nonresidential Buildings (except | | | | | | | |
| | | Miniwarehouses) — 7.88% | | | | | | | |
| HHC | | The Howard Hughes Corporation* | | | 814,400 | | | 97,809,440 | |
| RSE | | Rouse Properties, Inc.^ | | | 309,900 | | | 6,876,681 | |
| | | | | | | | | 104,686,121 | |
| | | Lessors of Residential Buildings and Dwellings — 1.32% | | | | | | | |
| ELS | | Equity Lifestyle Properties, Inc. — REIT | | | 483,940 | | | 17,533,146 | |
| | | Machinery Manufacturing — 0.08% | | | | | | | |
| CFX | | Colfax Corporation* | | | 17,300 | | | 1,101,837 | |
| | | Manufactured Brands — 2.48% | | | | | | | |
| JAH | | Jarden Corporation* | | | 536,000 | | | 32,883,600 | |
| | | Media — 5.74% | | | | | | | |
| DISCA | | Discovery Communications, Inc. — Class A*^ | | | 389,623 | | | 35,229,711 | |
| SNI | | Scripps Networks Interactive — Class A | | | 69,973 | | | 6,046,367 | |
| STRZA | | Starz — Class A* | | | 610,300 | | | 17,845,172 | |
| VIAB | | Viacom Inc. — Class B | | | 196,400 | | | 17,153,576 | |
| | | | | | | | | 76,274,826 | |
| | | Merchant Wholesalers, Nondurable Goods — 0.00% | | | | | | | |
| GLEN LN | | Glencore Xstrata plc* | | | 12,000 | | | 62,138 | |
| | | Mining (except Oil and Gas) — 0.88% | | | | | | | |
| FNV | | Franco-Nevada Corporation^ | | | 286,800 | | | 11,684,232 | |
| | | Motion Picture and Sound Recording Industries — 5.00% | | | | | | | |
| DWA | | DreamWorks Animation SKG, Inc. — Class A*^ | | | 1,868,700 | | | 66,338,850 | |
| | | Motor Vehicle and Parts Dealers — 4.20% | | | | | | | |
| AN | | AutoNation, Inc.* | | | 1,122,300 | | | 55,767,087 | |
| | | Oil and Gas — 2.29% | | | | | | | |
| TPL | | Texas Pacific Land Trust* | | | 306,600 | | | 30,344,202 | |
The accompanying notes are an integral part of these financial statements.
| KINETICS PORTFOLIOS TRUST — MASTER INVESTMENT PORTFOLIOS |
| The Paradigm Portfolio |
Portfolio of Investments — December 31, 2013 — (Continued) |
| Identifier | | | | | Shares | | | Value | |
| | | Oil and Gas Extraction — 3.80% | | | | | | | |
| CNQ | | Canadian Natural Resources Ltd. | | | 389,600 | | $ | 13,184,064 | |
| CLR | | Continental Resources, Inc.*^ | | | 112,990 | | | 12,713,635 | |
| SEMUF | | Siem Industries Inc. | | | 29,700 | | | 2,791,800 | |
| TOU CN | | Tourmaline Oil Corp.* | | | 518,290 | | | 21,809,897 | |
| | | | | | | | | 50,499,396 | |
| | | Other Exchanges — 3.19% | | | | | | | |
| CBOE | | CBOE Holdings Inc.^ | | | 801,926 | | | 41,668,075 | |
| URB/A CN | | Urbana Corporation — Class A* | | | 398,178 | | | 704,707 | |
| | | | | | | | | 42,372,782 | |
| | | Other Information Services — 0.00% | | | | | | | |
| GOOG | | Google Inc. — Class A* | | | 30 | | | 33,621 | |
| | | Performing Arts, Spectator Sports, and Related Industries — 2.93% | | | | | | | |
| LYV | | Live Nation Entertainment, Inc.* | | | 1,966,400 | | | 38,856,064 | |
| | | Real Estate — 3.64% | | | | | | | |
| BPY | | Brookfield Property Partners LP^ | | | 73,064 | | | 1,456,896 | |
| CWT-U CN | | Calloway — REIT | | | 19,200 | | | 454,763 | |
| DRM CN | | Dream Unlimited Corp. — Class A* | | | 226,200 | | | 3,598,757 | |
| FCE/A | | Forest City Enterprises, Inc. — Class A* | | | 1,778,300 | | | 33,965,530 | |
| TPH | | TRI Pointe Homes, Inc.* | | | 800 | | | 15,944 | |
| VNO | | Vornado Realty Trust — REIT^ | | | 98,869 | | | 8,778,579 | |
| | | | | | | | | 48,270,469 | |
| | | Restaurants — 1.78% | | | | | | | |
| BKW | | Burger King Worldwide Inc. | | | 12,400 | | | 283,464 | |
| WEN | | The Wendy’s Company^ | | | 2,678,600 | | | 23,357,392 | |
| | | | | | | | | 23,640,856 | |
| | | Satellite Telecommunications — 5.09% | | | | | | | |
| DISH | | DISH Network Corp. — Class A* | | | 709,100 | | | 41,071,072 | |
| SATS | | EchoStar Corporation — Class A* | | | 511,100 | | | 25,411,892 | |
| LORL | | Loral Space & Communications Inc.* | | | 300 | | | 24,294 | |
| VSAT | | ViaSat, Inc.* | | | 16,800 | | | 1,052,520 | |
| | | | | | | | | 67,559,778 | |
| | | Security System Services — 0.14% | | | | | | | |
| ASCMA | | Ascent Capital Group LLC — Class A* | | | 21,100 | | | 1,805,316 | |
The accompanying notes are an integral part of these financial statements.
| KINETICS PORTFOLIOS TRUST — MASTER INVESTMENT PORTFOLIOS |
| The Paradigm Portfolio |
Portfolio of Investments — December 31, 2013 — (Continued) |
| Identifier | | | | | Shares | | | Value | |
| | | Support Activities for Transportation — 1.56% | | | | | | | |
| 694 HK | | Beijing Capital International Airport Company Limited — | | | | | | | |
| | | Class H | | | 23,431,000 | | $ | 18,341,587 | |
| 357 HK | | Hainan Meilan International Airport Company Limited — | | | | | | | |
| | | Class H | | | 2,338,000 | | | 2,315,598 | |
| | | | | | | | | 20,657,185 | |
| | | Transportation Equipment Manufacturing — 0.00% | | | | | | | |
| HEI/A | | HEICO Corporation — Class A | | | 1,250 | | | 52,650 | |
| | | Utilities — 0.20% | | | | | | | |
| BIP | | Brookfield Infrastructure Partners LP^ | | | 65,930 | | | 2,585,775 | |
| | | TOTAL COMMON STOCKS | | | | | | | |
| | | (cost $782,365,772) | | | | | | 1,229,412,272 | |
| | | | | | | | | | |
| | | PREFERRED STOCKS — 0.00% | | | | | | | |
| | | Building Material and Garden Equipment and | | | | | | | |
| | | Supplies Dealers — 0.00% | | | | | | | |
| OSHUS | | Orchard Supply Hardware Stores Corporation — Series A*^ | | | 23,155 | | | 231 | |
| | | TOTAL PREFERRED STOCKS | | | | | | | |
| | | (cost $42,130) | | | | | | 231 | |
| | | | | | | | | | |
| | | | | | Principal | | | | |
| | | ESCROW NOTES — 0.00% | | | Amount | | | | |
| | | Special Purpose Entity — 0.00% | | | | | | | |
| 006ESCBG1 | | Adelphia Communications Corp.*+ | | $ | 200,000 | | | — | |
| | | TOTAL ESCROW NOTES | | | | | | | |
| | | (cost $0) | | | | | | — | |
| | | | | | | | | | |
| | | SHORT-TERM INVESTMENTS — 7.42% | | | | | | | |
| | | Commercial Paper — 4.90% | | | | | | | |
| 049218837 | | U.S. Bank N.A., 0.02%, 01/02/2014 | | | 65,000,000 | | | 65,000,000 | |
| | | | | | | | | | |
| | | | | | Shares | | | | |
| | | Money Market Funds — 2.52% | | | | | | | |
| FIGXX | | Fidelity Institutional Government Portfolio — Class I, 0.01%b | | | 33,519,305 | | | 33,519,305 | |
| | | TOTAL SHORT-TERM INVESTMENTS | | | | | | | |
| | | (cost $98,519,305) | | | | | | 98,519,305 | |
The accompanying notes are an integral part of these financial statements.
| KINETICS PORTFOLIOS TRUST — MASTER INVESTMENT PORTFOLIOS |
| The Paradigm Portfolio |
Portfolio of Investments — December 31, 2013 — (Continued) |
| | | INVESTMENTS PURCHASED WITH | | | | | | | |
| | | THE CASH PROCEEDS FROM | | | | | | | |
| Identifier | | SECURITIES LENDING — 15.05% | | | Shares | | | Value | |
| | | Money Market Funds — 15.05% | | | | | | | |
| | | Mount Vernon Securities Lending Trust — Prime | | | | | | | |
| | | Portfolio, 0.17%b | | | 199,757,066 | | $ | 199,757,066 | |
| | | TOTAL INVESTMENTS PURCHASED WITH THE CASH | | | | | | | |
| | | PROCEEDS FROM SECURITIES LENDING | | | | | | | |
| | | (cost $199,757,066) | | | | | | 199,757,066 | |
| | | TOTAL INVESTMENTS — 115.06% | | | | | | | |
| | | (cost $1,080,684,273) | | | | | $ | 1,527,688,874 | |
Percentages are stated as a percent of net assets.
| * — | Non-income producing security. |
| ^ — | This security or a portion of this security was out on loan at December 31, 2013. Total loaned securities had a market value of $194,641,999 at December 31, 2013. |
| + — | Security is considered illiquid and was fair valued. The aggregate value of such securities is $0 or 0.00% of net assets. |
| b — | The rate quoted is the annualized seven-day yield as of December 31, 2013. |
ADR — American Depository Receipt.
REIT — Real Estate Investment Trust.
The accompanying notes are an integral part of these financial statements.
| KINETICS PORTFOLIOS TRUST — MASTER INVESTMENT PORTFOLIOS |
| The Medical Portfolio |
Portfolio of Investments — December 31, 2013 — (Continued) |
| Identifier | | COMMON STOCKS — 96.81% | | | Shares | | | Value | |
| | | Ambulatory Health Care Services — 0.00% | | | | | | | |
| AVXT | | AVAX Technologies, Inc.* | | | 50,000 | | $ | 125 | |
| | | Chemical Manufacturing — 6.68% | | | | | | | |
| AGEN | | Agenus, Inc.*^ | | | 148 | | | 391 | |
| ALKS | | Alkermes plc* | | | 25,000 | | | 1,016,500 | |
| APHB | | Ampliphi Biosciences Corp.* | | | 1,000 | | | 500 | |
| IMNP | | Immune Pharmaceuticals Inc.* | | | 17 | | | 39 | |
| LONN VX | | Lonza Group AG* | | | 4,000 | | | 379,351 | |
| MMRF | | MMRGlobal Inc.* | | | 43,000 | | | 1,419 | |
| OSIR | | Osiris Therapeutics, Inc.*^ | | | 16,000 | | | 257,280 | |
| | | | | | | | | 1,655,480 | |
| | | Pharmaceutical and Biotechnology — 83.97% | | | | | | | |
| ABT | | Abbott Laboratories | | | 13,000 | | | 498,290 | |
| ABBV | | AbbVie Inc. | | | 14,000 | | | 739,340 | |
| ARNA | | Arena Pharmaceuticals, Inc.*^ | | | 45,000 | | | 263,250 | |
| AZN | | AstraZeneca plc — ADR | | | 12,000 | | | 712,440 | |
| ATB CN | | Atrium Innovations Inc.* | | | 4,884 | | | 111,726 | |
| BIIB | | Biogen Idec, Inc.* | | | 7,250 | | | 2,028,188 | |
| BMY | | Bristol-Myers Squibb Company | | | 34,000 | | | 1,807,100 | |
| CLDX | | Celldex Therapeutics Inc.* | | | 26,294 | | | 636,578 | |
| CBST | | Cubist Pharmaceuticals, Inc.* | | | 24,000 | | | 1,652,880 | |
| DNDN | | Dendreon Corporation*^ | | | 34,000 | | | 101,660 | |
| LLY | | Eli Lilly & Company | | | 23,000 | | | 1,173,000 | |
| GSK | | GlaxoSmithKline plc — ADR^ | | | 22,673 | | | 1,210,512 | |
| ISIS | | Isis Pharmaceuticals, Inc.*^ | | | 17,000 | | | 677,280 | |
| JNJ | | Johnson & Johnson | | | 14,000 | | | 1,282,260 | |
| MAXY | | Maxygen, Inc.+ | | | 41,000 | | | — | |
| MRK | | Merck & Co., Inc. | | | 16,000 | | | 800,800 | |
| NVS | | Novartis AG — ADR | | | 18,000 | | | 1,446,840 | |
| ONTY | | Oncothyreon, Inc.*^ | | | 32,333 | | | 56,906 | |
| PFE | | Pfizer, Inc. | | | 46,000 | | | 1,408,980 | |
| PGNX | | Progenics Pharmaceuticals, Inc.* | | | 67,200 | | | 358,176 | |
| RHHBY | | Roche Holding AG Ltd. — ADR | | | 8,000 | | | 561,600 | |
| SHPG | | Shire plc — ADR | | | 6,000 | | | 847,740 | |
| SNY | | Sano3 — ADR | | | 26,000 | | | 1,394,380 | |
| VICL | | Vical Inc.*^ | | | 84,500 | | | 99,710 | |
| VPHM | | ViroPharma Inc.* | | | 19,000 | | | 947,150 | |
| | | | | | | | | 20,816,786 | |
The accompanying notes are an integral part of these financial statements.
| KINETICS PORTFOLIOS TRUST — MASTER INVESTMENT PORTFOLIOS |
| The Medical Portfolio |
Portfolio of Investments — December 31, 2013 — (Continued) |
| Identifier | | | | | Shares | | | Value | |
| | | Professional, Scientific, and Technical Services — 6.16% | | | | | | | |
| AFFX | | Affymetrix, Inc.*^ | | | 104,000 | | $ | 891,280 | |
| AMRI | | Albany Molecular Research, Inc.*^ | | | 56,000 | | | 564,480 | |
| CDXS | | Codexis, Inc.* | | | 5,611 | | | 7,855 | |
| PACB | | Pacific Biosciences of California Inc.* | | | 12,000 | | | 62,760 | |
| | | | | | | | | 1,526,375 | |
| | | TOTAL COMMON STOCKS | | | | | | | |
| | | (cost $16,496,758) | | | | | | 23,998,766 | |
| | | | | | | | | | |
| | | RIGHTS — 0.06% | | | | | | | |
| | | Funds, Trusts, and Other Financial Vehicles — 0.04% | | | | | | | |
| LGNDZ | | Ligand Pharmaceuticals Inc.* | | | 44,000 | | | 264 | |
| LGNXZ | | Ligand Pharmaceuticals Inc.* | | | 44,000 | | | 5,280 | |
| LGNYZ | | Ligand Pharmaceuticals Inc. | | | 44,000 | | | 2,640 | |
| LGNZZ | | Ligand Pharmaceuticals Inc.* | | | 44,000 | | | 330 | |
| | | | | | | | | 8,514 | |
| | | Pharmaceutical and Biotechnology — 0.02% | | | | | | | |
| 09065VCVR | | BioSante Pharmaceuticals, Inc.*+ | | | 2,246 | | | — | |
| GCVRZ | | Sanofi* | | | 15,538 | | | 5,283 | |
| | | | | | | | | 5,283 | |
| | | TOTAL RIGHTS | | | | | | | |
| | | (cost $0) | | | | | | 13,797 | |
The accompanying notes are an integral part of these financial statements.
| KINETICS PORTFOLIOS TRUST — MASTER INVESTMENT PORTFOLIOS |
| The Medical Portfolio |
Portfolio of Investments — December 31, 2013 — (Continued) |
| | | | | | Principal | | | | |
| Identifier | | SHORT-TERM INVESTMENTS — 0.86% | | | Amount | | | Value | |
| | | Commercial Paper — 0.60% | | | | | | | |
| 049218836 | | U.S. Bank N.A., 0.02%, 01/02/2014 | | $ | 150,000 | | $ | 150,000 | |
| | | | | | | | | | |
| | | | | | | | | | |
| | | | | | Shares | | | | |
| | | Money Market Funds — 0.26% | | | | | | | |
| FIGXX | | Fidelity Institutional Government Portfolio — Class I, 0.01%b | | | 64,073 | | | 64,073 | |
| | | TOTAL SHORT-TERM INVESTMENTS | | | | | | | |
| | | (cost $214,073) | | | | | | 214,073 | |
| | | | | | | | | | |
| | | INVESTMENTS PURCHASED WITH | | | | | | | |
| | | THE CASH PROCEEDS | | | | | | | |
| | | FROM SECURITIES LENDING — 10.85% | | | | | | | |
| | | Money Market Funds — 10.85% | | | | | | | |
| | | Mount Vernon Securities Lending Trust — Prime | | | | | | | |
| | | Portfolio, 0.17%b | | | 2,689,850 | | | 2,689,850 | |
| | | TOTAL INVESTMENTS PURCHASED WITH THE CASH | | | | | | | |
| | | PROCEEDS FROM SECURITIES LENDING | | | | | | | |
| | | (cost $2,689,850) | | | | | | 2,689,850 | |
| | | TOTAL INVESTMENTS — 108.58% | | | | | | | |
| | | (cost $19,400,681) | | | | | $ | 26,916,486 | |
Percentages are stated as a percent of net assets.
| * — | Non-income producing security. |
| ^ — | This security or a portion of this security was out on loan at December 31, 2013. Total loaned securities had a market value of $2,537,862 at December 31, 2013. |
| + — | Security is considered illiquid and was fair valued. The aggregate value of such securities is $0 or 0.00% of net assets. |
| b — | The rate quoted is the annualized seven-day yield as of December 31, 2013. |
ADR — American Depository Receipt.
The accompanying notes are an integral part of these financial statements.
| KINETICS PORTFOLIOS TRUST — MASTER INVESTMENT PORTFOLIOS |
| The Small Cap Opportunities Portfolio |
Portfolio of Investments — December 31, 2013 — (Continued) |
| Identifier | | COMMON STOCKS — 93.73% | | | Shares | | | Value | |
| | | Asset Management — 8.42% | | | | | | | |
| DDEJF | | Dundee Corporation — Class A* | | | 578,800 | | $ | 10,202,218 | |
| JZCP LN | | JZ Capital Partners Ltd. | | | 134,800 | | | 999,482 | |
| OCX CN | | Onex Corporation | | | 226,460 | | | 12,226,388 | |
| RCP LN | | RIT Capital Partners plc | | | 135,200 | | | 2,820,958 | |
| SII CN | | Sprott, Inc. | | | 1,680 | | | 4,144 | |
| WETF | | WisdomTree Investments, Inc.* | | | 171,900 | | | 3,044,349 | |
| | | | | | | | | 29,297,539 | |
| | | Automobile and Other Motor Vehicle Merchant Wholesalers — 0.28% | | | | | | | |
| VTU LN | | Vertu Motors plc | | | 975,000 | | | 960,663 | |
| | | Chemical Manufacturing — 1.60% | | | | | | | |
| IPAR | | Inter Parfums, Inc. | | | 155,100 | | | 5,554,131 | |
| | | Construction of Buildings — 3.58% | | | | | | | |
| BRP | | Brookfield Residential Properties Inc.* | | | 515,100 | | | 12,460,269 | |
| | | Credit Intermediation and Related Activities — 0.22% | | | | | | | |
| BOKF | | BOK Financial Corporation | | | 11,400 | | | 756,048 | |
| | | Electronics and Appliance Stores — 1.57% | | | | | | | |
| SHOS | | Sears Hometown and Outlet Stores Inc.* | | | 214,300 | | | 5,464,650 | |
| | | Forestry and Logging — 0.01% | | | | | | | |
| KEWL | | Keweenaw Land Association Ltd.* | | | 380 | | | 33,060 | |
| | | Gaming — 0.62% | | | | | | | |
| TPCA | | Tropicana Entertainment Inc.* | | | 123,700 | | | 2,164,750 | |
| | | Gasoline Stations — 1.59% | | | | | | | |
| SUSS | | Susser Holdings Corporation*^ | | | 84,600 | | | 5,540,454 | |
| | | General Merchandise Stores — 1.04% | | | | | | | |
| SEARF | | Sears Canada Inc.^ | | | 290,800 | | | 3,603,012 | |
| | | Global Exchanges — 0.60% | | | | | | | |
| EXAE GA | | Hellenic Exchanges S.A. Holding Clearing Settlement | | | | | | | |
| | | and Registry | | | 190,000 | | | 2,091,072 | |
| | | Holding Company — 10.93% | | | | | | | |
| IEP | | Icahn Enterprises LP | | | 297,886 | | | 32,591,707 | |
| LVNTA | | Liberty Ventures — Series A* | | | 16,100 | | | 1,973,699 | |
| PVF CN | | Partners Value Fund Inc.* | | | 131,000 | | | 3,462,297 | |
| | | | | | | | | 38,027,703 | |
The accompanying notes are an integral part of these financial statements.
| KINETICS PORTFOLIOS TRUST — MASTER INVESTMENT PORTFOLIOS |
| The Small Cap Opportunities Portfolio |
Portfolio of Investments — December 31, 2013 — (Continued) |
| Identifier | | | | | Shares | | | Value | |
| | | Insurance Carriers and Related Activities — 3.20% | | | | | | | |
| AFSI | | AmTrust Financial Services, Inc.^ | | | 163,900 | | $ | 5,357,891 | |
| GLRE | | Greenlight Capital Re, Ltd. — Class A*^ | | | 171,400 | | | 5,777,894 | |
| | | | | | | | | 11,135,785 | |
| | | Lessors of Nonresidential Buildings (except Miniwarehouses) — 10.87% | | | | | | | |
| ALX | | Alexander’s, Inc. — REIT^ | | | 1,400 | | | 462,000 | |
| HHC | | The Howard Hughes Corporation* | | | 227,000 | | | 27,262,700 | |
| RSE | | Rouse Properties, Inc.^ | | | 455,600 | | | 10,109,764 | |
| | | | | | | | | 37,834,464 | |
| | | Lessors of Residential Buildings and Dwellings — 1.46% | | | | | | | |
| ELS | | Equity Lifestyle Properties, Inc. — REIT^ | | | 139,800 | | | 5,064,954 | |
| | | Machinery Manufacturing — 0.63% | | | | | | | |
| CFX | | Colfax Corporation* | | | 34,500 | | | 2,197,305 | |
| | | Manufactured Brands — 6.53% | | | | | | | |
| JAH | | Jarden Corporation* | | | 329,250 | | | 20,199,487 | |
| MOV | | Movado Group, Inc. | | | 57,200 | | | 2,517,372 | |
| | | | | | | | | 22,716,859 | |
| | | Media — 3.13% | | | | | | | |
| STRZA | | Starz — Class A*^ | | | 372,200 | | | 10,883,128 | |
| | | Merchant Wholesalers, Durable Goods — 0.31% | | | | | | | |
| DORM | | Dorman Products, Inc.*^ | | | 19,200 | | | 1,076,544 | |
| | | Mining (except Oil and Gas) — 0.29% | | | | | | | |
| FM CN | | First Quantum Minerals Ltd. | | | 39,366 | | | 709,311 | |
| MUX | | McEwen Mining Inc.*^ | | | 160,600 | | | 314,776 | |
| | | | | | | | | 1,024,087 | |
| | | Motion Picture and Sound Recording Industries — 6.22% | | | | | | | |
| DWA | | DreamWorks Animation SKG, Inc. — Class A*^ | | | 610,200 | | | 21,662,100 | |
| | | Motor Vehicle and Parts Dealers — 0.52% | | | | | | | |
| PAG | | Penske Automotive Group, Inc. | | | 38,700 | | | 1,825,092 | |
| | | Oil and Gas — 5.11% | | | | | | | |
| TPL | | Texas Pacific Land Trust* | | | 179,791 | | | 17,793,915 | |
The accompanying notes are an integral part of these financial statements.
| KINETICS PORTFOLIOS TRUST — MASTER INVESTMENT PORTFOLIOS |
| The Small Cap Opportunities Portfolio |
Portfolio of Investments — December 31, 2013 — (Continued) |
| Identifier | | | | | Shares | | | Value | |
| | | Oil and Gas Extraction — 0.33% | | | | | | | |
| BLMC | | Biloxi Marsh Lands Corporation | | | 100 | | $ | 1,525 | |
| WPX | | WPX Energy Inc.*^ | | | 55,800 | | | 1,137,204 | |
| | | | | | | | | 1,138,729 | |
| | | Other Exchanges — 0.61% | | | | | | | |
| CBOE | | CBOE Holdings Inc.^ | | | 16,990 | | | 882,801 | |
| URB/A CN | | Urbana Corporation — Class A* | | | 695,071 | | | 1,230,156 | |
| | | | | | | | | 2,112,957 | |
| | | Performing Arts, Spectator Sports, and Related Industries — 3.67% | | | | | | | |
| LYV | | Live Nation Entertainment, Inc.* | | | 647,000 | | | 12,784,720 | |
| | | Petroleum and Coal Products Manufacturing — 1.00% | | | | | | | |
| CVI | | CVR Energy, Inc. | | | 80,000 | | | 3,474,400 | |
| | | Publishing Industries (except Internet) — 0.29% | | | | | | | |
| PRIS | | Promotora de Informaciones S.A. — ADR*^ | | | 88,060 | | | 192,851 | |
| PRIS/B US | | Promotora de Informaciones S.A. — Class B — ADR*^ | | | 251,600 | | | 727,124 | |
| VALU | | Value Line, Inc. | | | 7,615 | | | 88,410 | |
| | | | | | | | | 1,008,385 | |
| | | Real Estate — 6.48% | | | | | | | |
| DRM CN | | Dream Unlimited Corp. — Class A* | | | 1,418,600 | | | 22,569,395 | |
| | | Rental and Leasing Services — 0.01% | | | | | | | |
| CDCO | | Comdisco Holding Company, Inc.*^ | | | 7,560 | | | 40,824 | |
| | | Restaurants — 6.03% | | | | | | | |
| WEN | | The Wendy’s Company^ | | | 2,404,700 | | | 20,968,984 | |
| | | Satellite Telecommunications — 0.62% | | | | | | | |
| LORL | | Loral Space & Communications Inc.* | | | 14,000 | | | 1,133,720 | |
| VSAT | | ViaSat, Inc.* | | | 16,400 | | | 1,027,460 | |
| | | | | | | | | 2,161,180 | |
| | | Securities, Commodity Contracts, and Other Financial Investments | | | | | | | |
| | | and Related Activities — 0.00% | | | | | | | |
| RHJI BB | | RHJ International* | | | 800 | | | 4,061 | |
| | | Security System Services — 2.75% | | | | | | | |
| ASCMA | | Ascent Capital Group LLC — Class A* | | | 111,800 | | | 9,565,608 | |
The accompanying notes are an integral part of these financial statements.
| KINETICS PORTFOLIOS TRUST — MASTER INVESTMENT PORTFOLIOS |
| The Small Cap Opportunities Portfolio |
Portfolio of Investments — December 31, 2013 — (Continued) |
| Identifier | | | | | Shares | | | Value | |
| | | Telecommunications — 0.02% | | | | | | | |
| CIBY | | CIBL, Inc.* | | | 18 | | $ | 25,200 | |
| ICTG | | ICTC Group Inc.* | | | 208 | | | 4,170 | |
| LICT | | Lynch Interactive Corporation* | | | 16 | | | 38,400 | |
| | | | | | | | | 67,770 | |
| | | Transportation Equipment Manufacturing — 3.19% | | | | | | | |
| ARII | | American Railcar Industries, Inc.^ | | | 122,600 | | | 5,608,950 | |
| FDML | | Federal-Mogul Corporation* | | | 279,900 | | | 5,508,432 | |
| | | | | | | | | 11,117,382 | |
| | | TOTAL COMMON STOCKS | | | | | | | |
| | | (cost $ 241,313,107) | | | | | | 326,181,979 | |
| | | | | | | | | | |
| | | RIGHTS — 0.12% | | | | | | | |
| | | Rental and Leasing Services — 0.12% | | | | | | | |
| CDCOR | | Comdisco Holding Company, Inc.*# | | | 5,634,807 | | | 400,071 | |
| | | TOTAL RIGHTS | | | | | | | |
| | | (cost $1,296,168) | | | | | | 400,071 | |
| | | | | | | | | | |
| | | | | | Principal | | | | |
| | | SHORT-TERM INVESTMENTS — 6.79% | | | Amount | | | | |
| | | Commercial Paper — 4.81% | | | | | | | |
| 049218837 | | U.S. Bank N.A., 0.02%, 01/02/2014 | | $ | 16,750,000 | | | 16,750,000 | |
| | | | | | | | | | |
| | | | | | Shares | | | | |
| | | Money Market Funds — 1.98% | | | | | | | |
| FIGXX | | Fidelity Institutional Government Portfolio — Class I, 0.01%b | | | 6,872,715 | | | 6,872,715 | |
| | | TOTAL SHORT-TERM INVESTMENTS | | | | | | | |
| | | (cost $23,622,715) | | | | | | 23,622,715 | |
The accompanying notes are an integral part of these financial statements.
| KINETICS PORTFOLIOS TRUST — MASTER INVESTMENT PORTFOLIOS |
| The Small Cap Opportunities Portfolio |
Portfolio of Investments — December 31, 2013 — (Continued) |
| | | INVESTMENTS PURCHASED WITH | | | | | | | |
| | | THE CASH PROCEEDS FROM | | | | | | | |
| Identifier | | SECURITIES LENDING — 20.02% | | | Shares | | | Value | |
| | | Money Market Funds — 20.02% | | | | | | | |
| | | Mount Vernon Securities Lending Trust — Prime | | | | | | | |
| | | Portfolio, 0.17%b | | | 69,687,876 | | $ | 69,687,876 | |
| | | TOTAL INVESTMENTS PURCHASED WITH THE CASH | | | | | | | |
| | | PROCEEDS FROM SECURITIES LENDING | | | | | | | |
| | | (cost $69,687,876) | | | | | | 69,687,876 | |
| | | TOTAL INVESTMENTS — 120.66% | | | | | | | |
| | | (cost $ 335,919,866) | | | | | $ | 419,892,641 | |
Percentages are stated as a percent of net assets.
| * — | Non-income producing security. |
| ^ — | This security or a portion of this security was out on loan at December 31, 2013. Total loaned securities had a market value of $67,341,896 at December 31, 2013. |
| # — | Contingent value right (contingent upon profitability of company). |
| b — | The rate quoted is the annualized seven-day yield as of December 31, 2013. |
ADR — American Depository Receipt.
REIT — Real Estate Investment Trust.
The accompanying notes are an integral part of these financial statements.
| KINETICS PORTFOLIOS TRUST — MASTER INVESTMENT PORTFOLIOS |
| The Market Opportunities Portfolio |
Portfolio of Investments — December 31, 2013 — (Continued) |
| Identifier | | COMMON STOCKS — 85.31% | | | Shares | | | Value | |
| | | Asset Management — 23.93% | | | | | | | |
| APO | | Apollo Global Management LLC — Class A | | | 13,600 | | $ | 429,896 | |
| BX | | The Blackstone Group LP^ | | | 64,799 | | | 2,041,168 | |
| BAM | | Brookfield Asset Management Inc. — Class A^ | | | 55,000 | | | 2,135,650 | |
| CG | | The Carlyle Group LP | | | 100 | | | 3,562 | |
| DDEJF | | Dundee Corporation — Class A* | | | 103,500 | | | 1,824,343 | |
| JZCP LN | | JZ Capital Partners Ltd. | | | 60,600 | | | 449,322 | |
| OAK | | Oaktree Capital Group LLC^ | | | 30,000 | | | 1,765,200 | |
| OZM | | Och-Ziff Capital Management Group — Class A | | | 2,400 | | | 35,520 | |
| ONEXF | | Onex Corporation | | | 58,600 | | | 3,161,523 | |
| SII CN | | Sprott, Inc. | | | 41,155 | | | 101,507 | |
| TROW | | T. Rowe Price Group, Inc. | | | 2,400 | | | 201,048 | |
| 806 HK | | Value Partners Group Limited | | | 306,000 | | | 236,772 | |
| WETF | | WisdomTree Investments, Inc.* | | | 200,000 | | | 3,542,000 | |
| | | | | | | | | 15,927,511 | |
| | | Beverage and Tobacco Product Manufacturing — 0.07% | | | | | | | |
| CWGL | | Crimson Wine Group Ltd.* | | | 5,080 | | | 44,907 | |
| | | Construction of Buildings — 0.60% | | | | | | | |
| BRP | | Brookfield Residential Properties Inc.*^ | | | 16,400 | | | 396,716 | |
| | | Credit Intermediation and Related Activities — 0.17% | | | | | | | |
| BBCN | | BBCN Bancorp, Inc. | | | 10 | | | 166 | |
| EWBC | | East West Bancorp, Inc.^ | | | 3,204 | | | 112,044 | |
| | | | | | | | | 112,210 | |
| | | Data Processor — 4.35% | | | | | | | |
| MA | | MasterCard, Inc. — Class A | | | 1,600 | | | 1,336,736 | |
| V | | Visa, Inc. — Class A^ | | | 7,000 | | | 1,558,760 | |
| | | | | | | | | 2,895,496 | |
| | | E-Commerce — 1.01% | | | | | | | |
| LINTA | | Liberty Interactive Corporation — Class A* | | | 22,900 | | | 672,115 | |
| | | Electronics and Appliance Stores — 0.02% | | | | | | | |
| SHOS | | Sears Hometown and Outlet Stores Inc.* | | | 610 | | | 15,555 | |
| | | European Exchanges — 0.70% | | | | | | | |
| DB1 GR | | Deutsche Boerse AG | | | 5,650 | | | 467,918 | |
| | | Gaming — 1.68% | | | | | | | |
| LVS | | Las Vegas Sands Corp. | | | 11,600 | | | 914,892 | |
| TPCA | | Tropicana Entertainment Inc.* | | | 11,600 | | | 203,000 | |
| | | | | | | | | 1,117,892 | |
The accompanying notes are an integral part of these financial statements.
| KINETICS PORTFOLIOS TRUST — MASTER INVESTMENT PORTFOLIOS |
| The Market Opportunities Portfolio |
Portfolio of Investments — December 31, 2013 — (Continued) |
| Identifier | | | | | Shares | | | Value | |
| | | General Merchandise Stores — 0.51% | | | | | | | |
| SEARF | | Sears Canada Inc.^ | | | 300 | | $ | 3,717 | |
| SHLD | | Sears Holdings Corporation*^ | | | 6,800 | | | 333,472 | |
| | | | | | | | | 337,189 | |
| | | Global Exchanges — 3.23% | | | | | | | |
| EXAE GA | | Hellenic Exchanges S.A. Holding Clearing Settlement | | | | | | | |
| | | and Registry | | | 21,600 | | | 237,722 | |
| JSE SJ | | JSE Limited | | | 83,600 | | | 715,103 | |
| LSE LN | | London Stock Exchange Group plc | | | 12,800 | | | 367,331 | |
| SGX SP | | Singapore Exchange Limited | | | 144,000 | | | 828,432 | |
| | | | | | | | | 2,148,588 | |
| | | Holding Company — 16.48% | | | | | | | |
| IEP | | Icahn Enterprises LP^ | | | 59,871 | | | 6,550,486 | |
| LUK | | Leucadia National Corporation | | | 96,200 | | | 2,726,308 | |
| LVNTA | | Liberty Ventures — Series A*^ | | | 4,574 | | | 560,727 | |
| PVF CN | | Partners Value Fund Inc.* | | | 42,900 | | | 1,133,836 | |
| | | | | | | | | 10,971,357 | |
| | | Insurance Carriers and Related Activities — 0.85% | | | | | | | |
| AFSI | | AmTrust Financial Services, Inc.^ | | | 3,210 | | | 104,935 | |
| GLRE | | Greenlight Capital Re, Ltd. — Class A*^ | | | 1,200 | | | 40,452 | |
| MKL | | Markel Corporation* | | | 523 | | | 303,523 | |
| WTM | | White Mountains Insurance Group Ltd. | | | 200 | | | 120,616 | |
| | | | | | | | | 569,526 | |
| | | Lessors of Nonresidential Buildings (except | | | | | | | |
| | | Miniwarehouses) — 6.15% | | | | | | | |
| HHC | | The Howard Hughes Corporation* | | | 26,700 | | | 3,206,670 | |
| RSE | | Rouse Properties, Inc.^ | | | 40,000 | | | 887,600 | |
| | | | | | | | | 4,094,270 | |
| | | Mining (except Oil and Gas) — 0.24% | | | | | | | |
| FNV | | Franco-Nevada Corporation^ | | | 4,000 | | | 162,960 | |
| | | Non-Store Retailers — 3.20% | | | | | | | |
| BID | | Sotheby’s | | | 40,000 | | | 2,128,000 | |
| | | Oil and Gas — 4.49% | | | | | | | |
| TPL | | Texas Pacific Land Trust* | | | 30,200 | | | 2,988,894 | |
The accompanying notes are an integral part of these financial statements.
| KINETICS PORTFOLIOS TRUST — MASTER INVESTMENT PORTFOLIOS |
| The Market Opportunities Portfolio |
Portfolio of Investments — December 31, 2013 — (Continued) |
| Identifier | | | | | Shares | | | Value | |
| | | Other Exchanges — 8.11% | | | | | | | |
| CBOE | | CBOE Holdings Inc. | | | 84,000 | | $ | 4,364,640 | |
| FTIS LI | | Financial Technologies (India) Ltd. — GDR+ | | | 96,180 | | | 41,105 | |
| IMAREX NO | | IMAREX ASA+ | | | 1,850 | | | — | |
| NZX NZ | | NZX Ltd. | | | 359,002 | | | 366,103 | |
| URB/A CN | | Urbana Corporation — Class A* | | | 356,004 | | | 630,066 | |
| | | | | | | | | 5,401,914 | |
| | | Real Estate — 4.16% | | | | | | | |
| BPY | | Brookfield Property Partners LP^ | | | 3,641 | | | 72,602 | |
| CWT-U CN | | Calloway — REIT | | | 6,000 | | | 142,113 | |
| DRM CN | | Dream Unlimited Corp. — Class A* | | | 160,400 | | | 2,551,904 | |
| | | | | | | | | 2,766,619 | |
| | | Securities, Commodity Contracts, and Other Financial Investments | | | | | | | |
| | | and Related Activities — 4.79% | | | | | | | |
| CME | | CME Group, Inc. | | | 9,140 | | | 717,124 | |
| ICE | | IntercontinentalExchange Group, Inc. | | | 10,978 | | | 2,469,172 | |
| | | | | | | | | 3,186,296 | |
| | | Support Activities for Water Transportation — 0.01% | | | | | | | |
| CKI CN | | Clarke Inc. | | | 1,000 | | | 7,522 | |
| | | Transportation Equipment Manufacturing — 0.01% | | | | | | | |
| ARII | | American Railcar Industries, Inc.^ | | | 100 | | | 4,575 | |
| | | U.S. Equity Exchanges — 0.38% | | | | | | | |
| NDAQ | | The NASDAQ OMX Group, Inc. | | | 6,400 | | | 254,720 | |
| | | Utilities — 0.17% | | | | | | | |
| BIP | | Brookfield Infrastructure Partners LP^ | | | 2,816 | | | 110,443 | |
| | | TOTAL COMMON STOCKS | | | | | | | |
| | | (cost $36,824,176) | | | | | | 56,783,193 | |
| | | | | | | | | | |
| | | RIGHTS — 0.00% | | | | | | | |
| | | Asset Management — 0.00% | | | | | | | |
| WPSL | | W.P. Stewart & Co., Ltd.*+ | | | 205 | | | — | |
| | | TOTAL RIGHTS | | | | | | | |
| | | (cost $0) | | | | | | — | |
The accompanying notes are an integral part of these financial statements.
| KINETICS PORTFOLIOS TRUST — MASTER INVESTMENT PORTFOLIOS |
| The Market Opportunities Portfolio |
Portfolio of Investments — December 31, 2013 — (Continued) |
| Identifier | | MUTUAL FUNDS — 0.01% | | | Shares | | | Value | |
| | | Funds, Trusts, and Other Financial Vehicles — 0.01% | | | | | | | |
| PFN | | PIMCO Income Strategy Fund II | | | 760 | | $ | 7,562 | |
| | | TOTAL MUTUAL FUNDS | | | | | | | |
| | | (cost $6,726) | | | | | | 7,562 | |
| | | | | | | | | | |
| | | | | | Principal | | | | |
| | | SHORT-TERM INVESTMENTS — 9.05% | | | Amount | | | | |
| | | Commercial Paper — 4.62% | | | | | | | |
| 049218837 | | U.S. Bank N.A., 0.02%, 01/02/2014 | | $ | 3,075,000 | | | 3,075,000 | |
| | | | | | | | | | |
| | | | | | Shares | | | | |
| | | Money Market Funds — 4.43% | | | | | | | |
| FIGXX | | Fidelity Institutional Government Portfolio — Class I, 0.01%b | | . | 2,951,375 | | | 2,951,375 | |
| | | TOTAL SHORT-TERM INVESTMENTS | | | | | | | |
| | | (cost $6,026,375) | | | | | | 6,026,375 | |
| | | | | | | | | | |
| | | INVESTMENTS PURCHASED WITH | | | | | | | |
| | | THE CASH PROCEEDS FROM | | | | | | | |
| | | SECURITIES LENDING — 13.07% | | | | | | | |
| | | Money Market Funds — 13.07% | | | | | | | |
| | | Mount Vernon Securities Lending Trust — Prime | | | | | | | |
| | | Portfolio, 0.17%b | | | 8,695,710 | | | 8,695,710 | |
| | | TOTAL INVESTMENTS PURCHASED WITH THE CASH | | | | | | | |
| | | PROCEEDS FROM SECURITIES LENDING | | | | | | | |
| | | (cost $8,695,710) | | | | | | 8,695,710 | |
| | | TOTAL INVESTMENTS — 107.44% | | | | | | | |
| | | (cost $51,552,987) | | | | | $ | 71,512,840 | |
Percentages are stated as a percent of net assets.
| * — | Non-income producing security. |
| ^ — | This security or a portion of this security was out on loan at December 31, 2013. Total loaned securities had a market value of $8,555,011 at December 31, 2013. |
| + — | Security is considered illiquid and was fair valued. The aggregate value of such securities is $41,105 or 0.06% of net assets. |
| b — | The rate quoted is the annualized seven-day yield as of December 31, 2013. |
GDR — Global Depository Receipt.
REIT — Real Estate Investment Trust.
The accompanying notes are an integral part of these financial statements.
| KINETICS PORTFOLIOS TRUST — MASTER INVESTMENT PORTFOLIOS |
| The Alternative Income Portfolio |
Portfolio of Investments — December 31, 2013 — (Continued) |
| | | | | | Principal | | | | |
| Identifier | | CORPORATE BONDS — 53.57% | | | Amount | | | Value | |
| | | Beverage and Tobacco Product Manufacturing — 3.48% | | | | | | | |
| 02209SAK9 | | Altria Group, Inc. | | | | | | | |
| | | 4.125%, 09/11/2015 | | $ | 100,000 | | $ | 105,568 | |
| 03523TBL1 | | Anheuser-Busch InBev Worldwide Inc. | | | | | | | |
| | | 1.500%, 07/14/2014 | | | 126,000 | | | 126,734 | |
| 10138MAH8 | | Bottling Group LLC | | | | | | | |
| | | 6.950%, 03/15/2014 | | | 100,000 | | | 101,305 | |
| 191216AP5 | | The Coca-Cola Company | | | | | | | |
| | | 1.500%, 11/15/2015 | | | 100,000 | | | 101,933 | |
| 26138EAM1 | | Dr. Pepper Snapple Group, Inc. | | | | | | | |
| | | 2.900%, 01/15/2016 | | | 200,000 | | | 207,673 | |
| 761713AV8 | | Reynolds American, Inc. | | | | | | | |
| | | 1.050%, 10/30/2015 | | | 175,000 | | | 175,636 | |
| | | | | | | | | 818,849 | |
| | | Broadcasting (except Internet) — 0.87% | | | | | | | |
| 63946BAB6 | | NBCUniversal Media, LLC | | | | | | | |
| | | 3.650%, 04/30/2015 | | | 100,000 | | | 104,034 | |
| 25468PCU8 | | The Walt Disney Company | | | | | | | |
| | | 0.450%, 12/01/2015 | | | 100,000 | | | 99,945 | |
| | | | | | | | | 203,979 | |
| | | Chemical Manufacturing — 1.85% | | | | | | | |
| 19416QDQ0 | | Colgate-Palmolive Company | | | | | | | |
| | | 1.375%, 11/01/2015 | | | 150,000 | | | 152,223 | |
| | | Ecolab Inc. | | | | | | | |
| 278865AJ9 | | 2.375%, 12/08/2014 | | | 125,000 | | | 126,987 | |
| 278865AN0 | | 1.000%, 08/09/2015 | | | 55,000 | | | 55,193 | |
| 88166CAA6 | | Teva Pharmaceuticals Finance | | | | | | | |
| | | 3.000%, 06/15/2015 | | | 100,000 | | | 103,240 | |
| | | | | | | | | 437,643 | |
| | | Computer and Electronic Product Manufacturing — 4.29% | | | | | | | |
| 111320AD9 | | Broadcom Corporation | | | | | | | |
| | | 2.375%, 11/01/2015 | | | 200,000 | | | 205,229 | |
| 22303QAK6 | | Covidien International Finance SA | | | | | | | |
| | | 2.800%, 06/15/2015 | | | 100,000 | | | 102,864 | |
| | | Hewlett-Packard Co. | | | | | | | |
| 428236AT0 | | 6.125%, 03/01/2014 | | | 50,000 | | | 50,426 | |
| 428236BC6 | | 2.125%, 09/13/2015 | | | 100,000 | | | 101,870 | |
The accompanying notes are an integral part of these financial statements.
| KINETICS PORTFOLIOS TRUST — MASTER INVESTMENT PORTFOLIOS |
| The Alternative Income Portfolio |
Portfolio of Investments — December 31, 2013 — (Continued) |
| | | | | | Principal | | | | |
| Identifier | | | | | Amount | | | Value | |
| | | Computer and Electronic Product Manufacturing — 4.29% (Continued) | | | | | | | |
| 459200HD6 | | IBM Corp. | | | | | | | |
| | | 0.750%, 05/11/2015 | | $ | 100,000 | | $ | 100,474 | |
| 585055AR7 | | Medtronic, Inc. | | | | | | | |
| | | 3.000%, 03/15/2015 | | | 100,000 | | | 103,208 | |
| 883556AS1 | | Thermo Fisher Scientific, Inc. | | | | | | | |
| | | 3.200%, 05/01/2015 | | | 140,000 | | | 144,600 | |
| 902133AL1 | | Tyco Electronics Group SA | | | | | | | |
| | | 1.600%, 02/03/2015 | | | 200,000 | | | 202,022 | |
| | | | | | | | | 1,010,693 | |
| | | Consumer Staples — 0.85% | | | | | | | |
| 742718ED7 | | The Procter & Gamble Company | | | | | | | |
| | | 0.750%, 11/04/2016 | | | 200,000 | | | 199,276 | |
| | | Credit Intermediation and Related Activities — 8.44% | | | | | | | |
| 025815AA9 | | American Express Centurion | | | | | | | |
| | | 0.875%, 11/13/2015 | | | 250,000 | | | 250,674 | |
| 0258M0CZ0 | | American Express Credit Corporation | | | | | | | |
| | | 5.125%, 08/25/2014 | | | 100,000 | | | 103,061 | |
| 06406HCD9 | | The Bank of New York Mellon Corporation | | | | | | | |
| | | 0.700%, 10/23/2015 | | | 200,000 | | | 200,449 | |
| 064159BV7 | | Bank of Nova Scotia | | | | | | | |
| | | 0.950%, 03/15/2016 | | | 200,000 | | | 200,393 | |
| 120568AM2 | | Bunge Limited Finance Corporation | | | | | | | |
| | | 5.350%, 04/15/2014 | | | 115,000 | | | 116,470 | |
| 14040HAS4 | | Capital One Financial Corporation | | | | | | | |
| | | 7.375%, 05/23/2014 | | | 100,000 | | | 102,585 | |
| 14912L5B3 | | Caterpillar Financial Services Corporation | | | | | | | |
| | | 1.050%, 03/26/2015 | | | 100,000 | | | 100,663 | |
| 31677QAX7 | | Fifth Third Bank | | | | | | | |
| | | 0.900%, 02/26/2016 | | | 150,000 | | | 149,290 | |
| | | General Electric Capital Corp. | | | | | | | |
| 36966RS98 | | 5.450%, 06/15/2014 | | | 10,000 | | | 10,196 | |
| 36962G6M1 | | 1.000%, 12/11/2015 | | | 200,000 | | | 201,699 | |
| 24422ERQ4 | | John Deere Capital Corporation | | | | | | | |
| | | 0.875%, 04/17/2015 | | | 100,000 | | | 100,599 | |
| 69371RK62 | | PACCAR Financial Corporation | | | | | | | |
| | | 1.050%, 06/05/2015 | | | 100,000 | | | 100,851 | |
| 69349LAN8 | | PNC Bank NA | | | | | | | |
| | | 1.300%, 10/03/2016 | | | 250,000 | | | 251,510 | |
The accompanying notes are an integral part of these financial statements.
| KINETICS PORTFOLIOS TRUST — MASTER INVESTMENT PORTFOLIOS |
| The Alternative Income Portfolio |
Portfolio of Investments — December 31, 2013 — (Continued) |
| | | | | | Principal | | | | |
| Identifier | | | | | Amount | | | Value | |
| | | Credit Intermediation and Related Activities — 8.44% (Continued) | | | | | | | |
| 92976GAB7 | | Wachovia Bank NA | | | | | | | |
| | | 4.800%, 11/01/2014 | | $ | 96,000 | | $ | 99,585 | |
| | | | | | | | | 1,988,025 | |
| | | Digital Security — 0.65% | | | | | | | |
| 871503AG3 | | Symantec Corp. | | | | | | | |
| | | 2.750%, 09/15/2015 | | | 150,000 | | | 154,159 | |
| | | Diversified Financial Services — 0.85% | | | | | | | |
| 46623EJR1 | | JPMorgan Chase & Co. | | | | | | | |
| | | 1.100%, 10/15/2015 | | | 200,000 | | | 200,851 | |
| | | E-Commerce — 1.45% | | | | | | | |
| 023135AK2 | | Amazon.com, Inc. | | | | | | | |
| | | 0.650%, 11/27/2015 | | | 200,000 | | | 200,004 | |
| 278642AD5 | | eBay, Inc. | | | | | | | |
| | | 0.700%, 07/15/2015 | | | 140,000 | | | 140,430 | |
| | | | | | | | | 340,434 | |
| | | Food Manufacturing — 4.48% | | | | | | | |
| 205887BH4 | | ConAgra Foods, Inc. | | | | | | | |
| | | 1.350%, 09/10/2015 | | | 100,000 | | | 100,736 | |
| 370334BN3 | | General Mills, Inc. | | | | | | | |
| | | 0.875%, 01/29/2016 | | | 200,000 | | | 199,531 | |
| 423074AL7 | | HJ Heinz Co. | | | | | | | |
| | | 2.000%, 09/12/2016 | | | 150,000 | | | 151,283 | |
| 487836BG2 | | Kellogg Company | | | | | | | |
| | | 1.125%, 05/15/2015 | | | 200,000 | | | 201,430 | |
| 50076QAK2 | | Kraft Foods Group Inc. | | | | | | | |
| | | 1.625%, 06/04/2015 | | | 200,000 | | | 202,611 | |
| 982526AR6 | | William Wrigley Jr. Company | | | | | | | |
| | | 1.400%, 10/21/2016, Acquired 10/28/2013 at $201,359■ | | | 200,000 | | | 200,440 | |
| | | | | | | | | 1,056,031 | |
| | | Food Services and Drinking Places — 0.84% | | | | | | | |
| 855244AE9 | | Starbucks Corporation | | | | | | | |
| | | 0.875%, 12/05/2016 | | | 200,000 | | | 198,884 | |
| | | Funds, Trusts, and Other Financial Vehicles — 0.64% | | | | | | | |
| 65339KAC4 | | NextEra Energy Capital Holding Inc. | | | | | | | |
| | | 1.611%, 06/01/2014 | | | 150,000 | | | 150,684 | |
The accompanying notes are an integral part of these financial statements.
| KINETICS PORTFOLIOS TRUST — MASTER INVESTMENT PORTFOLIOS |
| The Alternative Income Portfolio |
Portfolio of Investments — December 31, 2013 — (Continued) |
| | | | | | Principal | | | | |
| Identifier | | | | | Amount | | | Value | |
| | | General Merchandise Stores — 0.96% | | | | | | | |
| 22160KAD7 | | Costco Wholesale Corporation | | | | | | | |
| | | 0.650%, 12/07/2015 | | $ | 150,000 | | $ | 150,348 | |
| 931142CX9 | | Wal-Mart Stores, Inc. | | | | | | | |
| | | 1.500%, 10/25/2015 | | | 74,000 | | | 75,442 | |
| | | | | | | | | 225,790 | |
| | | Health and Personal Care Stores — 1.29% | | | | | | | |
| 126650BT6 | | CVS Caremark Corporation | | | | | | | |
| | | 3.250%, 05/18/2015 | | | 100,000 | | | 103,401 | |
| 931422AG4 | | Walgreen Company | | | | | | | |
| | | 1.000%, 03/13/2015 | | | 200,000 | | | 200,881 | |
| | | | | | | | | 304,282 | |
| | | Holding Company — 1.07% | | | | | | | |
| 084664BX8 | | Berkshire Hathaway Finance Corp. | | | | | | | |
| | | 0.950%, 08/15/2016 | | | 250,000 | | | 251,296 | |
| | | Insurance Carriers and Related Activities — 2.15% | | | | | | | |
| 74432QAE5 | | Prudential Financial, Inc. | | | | | | | |
| | | 5.100%, 09/20/2014 | | | 100,000 | | | 103,212 | |
| 91324PBX9 | | UnitedHealth Group Inc. | | | | | | | |
| | | 0.850%, 10/15/2015 | | | 100,000 | | | 100,445 | |
| 94973VAZ0 | | WellPoint, Inc. | | | | | | | |
| | | 1.250%, 09/10/2015 | | | 300,000 | | | 302,211 | |
| | | | | | | | | 505,868 | |
| | | Media — 1.08% | | | | | | | |
| 25470DAB5 | | Discovery Communications | | | | | | | |
| | | 3.700%, 06/01/2015 | | | 100,000 | | | 104,091 | |
| 92553PAK8 | | Viacom Inc. | | | | | | | |
| | | 1.250%, 02/27/2015 | | | 150,000 | | | 150,790 | |
| | | | | | | | | 254,881 | |
| | | Merchant Wholesalers, Nondurable Goods — 1.28% | | | | | | | |
| 30219GAB4 | | Express Scripts Holding Company | | | | | | | |
| | | 2.100%, 02/12/2015 | | | 100,000 | | | 101,477 | |
| 581557AY1 | | McKesson Corp. | | | | | | | |
| | | 0.950%, 12/04/2015 | | | 200,000 | | | 199,966 | |
| | | | | | | | | 301,443 | |
The accompanying notes are an integral part of these financial statements.
| KINETICS PORTFOLIOS TRUST — MASTER INVESTMENT PORTFOLIOS |
| The Alternative Income Portfolio |
Portfolio of Investments — December 31, 2013 — (Continued) |
| | | | | | Principal | | | | |
| Identifier | | | | | Amount | | | Value | |
| | | Mining (except Oil and Gas) — 1.71% | | | | | | | |
| 35671DAV7 | | Freeport-McMoRan Copper & Gold Inc. | | | | | | | |
| | | 1.400%, 02/13/2015 | | | $300,000 | | $ | 301,757 | |
| 76720AAA4 | | Rio Tinto Financial USA plc | | | | | | | |
| | | 1.125%, 03/20/2015 | | | 100,000 | | | 100,587 | |
| | | | | | | | | 402,344 | |
| | | Miscellaneous Manufacturing — 1.56% | | | | | | | |
| 071813BH1 | | Baxter International Inc. | | | | | | | |
| | | 0.950%, 06/01/2016 | | | 200,000 | | | 200,097 | |
| 067383AB5 | | CR Bard, Inc. | | | | | | | |
| | | 2.875%, 01/15/2016 | | | 150,000 | | | 155,064 | |
| 418056AR8 | | Hasbro, Inc. | | | | | | | |
| | | 6.125%, 05/15/2014 | | | 12,000 | | | 12,242 | |
| | | | | | | | | 367,403 | |
| | | Motor Vehicle and Parts Dealers — 0.43% | | | | | | | |
| 053332AH5 | | AutoZone, Inc. | | | | | | | |
| | | 6.500%, 01/15/2014 | | | 100,000 | | | 100,196 | |
| | | Oil and Gas Extraction — 1.83% | | | | | | | |
| 136385AQ4 | | Canadian Natural Resources Ltd. | | | | | | | |
| | | 1.450%, 11/14/2014 | | | 130,000 | | | 131,082 | |
| 25179MAS2 | | Devon Energy Corporation | | | | | | | |
| | | 1.200%, 12/15/2016 | | | 200,000 | | | 200,061 | |
| 565849AJ5 | | Marathon Oil Corporation | | | | | | | |
| | | 0.900%, 11/01/2015 | | | 100,000 | | | 100,128 | |
| | | | | | | | | 431,271 | |
| | | Other Information Services — 0.97% | | | | | | | |
| 38259PAC6 | | Google Inc. | | | | | | | |
| | | 2.125%, 05/19/2016 | | | 222,000 | | | 229,502 | |
| | | Pharmaceutical and Biotechnology — 2.13% | | | | | | | |
| 031162AJ9 | | Amgen Inc. | | | | | | | |
| | | 4.850%, 11/18/2014 | | | 140,000 | | | 145,235 | |
| 377372AG2 | | GlaxoSmithKline Capital Inc. | | | | | | | |
| | | 0.700%, 03/18/2016 | | | 200,000 | | | 199,260 | |
| 53217VAD1 | | Life Technologies Corporation | | | | | | | |
| | | 3.500%, 01/15/2016 | | | 150,000 | | | 156,325 | |
| | | | | | | | | 500,820 | |
The accompanying notes are an integral part of these financial statements.
| KINETICS PORTFOLIOS TRUST — MASTER INVESTMENT PORTFOLIOS |
| The Alternative Income Portfolio |
Portfolio of Investments — December 31, 2013 — (Continued) |
| | | | | | Principal | | | | |
| Identifier | | | | | Amount | | | Value | |
| | | Pipeline Transportation — 0.44% | | | | | | | |
| 96950FAB0 | | Williams Partners LP | | | | | | | |
| | | 3.800%, 02/15/2015 | | $ | 100,000 | | $ | 103,340 | |
| | | Publishing Industries (except Internet) — 0.42% | | | | | | | |
| 884903BL8 | | Thomson Reuters Corporation | | | | | | | |
| | | 0.875%, 05/23/2016 | | | 100,000 | | | 99,355 | |
| | | Satellite Telecommunications — 1.10% | | | | | | | |
| 25459HAY1 | | DIRECTV Holdings, LLC | | | | | | | |
| | | 3.500%, 03/01/2016 | | | 150,000 | | | 157,536 | |
| 88732JAQ1 | | Time Warner Cable Inc. | | | | | | | |
| | | 8.250%, 02/14/2014 | | | 100,000 | | | 100,862 | |
| | | | | | | | | 258,398 | |
| | | Securities, Commodity Contracts, and Other Financial | | | | | | | |
| | | Investments and Related Activities — 1.08% | | | | | | | |
| 472319AD4 | | Jefferies Group LLC | | | | | | | |
| | | 5.875%, 06/08/2014 | | | 150,000 | | | 153,392 | |
| 61747WAD1 | | Morgan Stanley | | | | | | | |
| | | 2.875%, 01/24/2014 | | | 100,000 | | | 100,131 | |
| | | | | | | | | 253,523 | |
| | | Software — 0.44% | | | | | | | |
| 00724FAA9 | | Adobe Systems, Inc. | | | | | | | |
| | | 3.250%, 02/01/2015 | | | 100,000 | | | 102,734 | |
| | | Telecommunications — 2.12% | | | | | | | |
| 00206RBL5 | | AT&T, Inc. | | | | | | | |
| | | 0.800%, 12/01/2015 | | | 200,000 | | | 199,588 | |
| 92343VBH6 | | Verizon Communications Inc. | | | | | | | |
| | | 0.700%, 11/02/2015 | | | 200,000 | | | 199,533 | |
| 92857WBA7 | | Vodafone Group plc | | | | | | | |
| | | 0.900%, 02/19/2016 | | | 100,000 | | | 100,403 | |
| | | | | | | | | 499,524 | |
| | | Transportation Equipment Manufacturing — 0.85% | | | | | | | |
| 89233P6J0 | | Toyota Motor Credit Corp. | | | | | | | |
| | | 0.875%, 07/17/2015 | | | 200,000 | | | 201,306 | |
The accompanying notes are an integral part of these financial statements.
| KINETICS PORTFOLIOS TRUST — MASTER INVESTMENT PORTFOLIOS |
| The Alternative Income Portfolio |
Portfolio of Investments — December 31, 2013 — (Continued) |
| | | | | | Principal | | | | |
| Identifier | | | | | Amount | | | Value | |
| | | Utilities — 1.52% | | | | | | | |
| 693304AN7 | | PECO Energy Company | | | | | | | |
| | | 5.000%, 10/01/2014 | | $ | 52,000 | | $ | 53,703 | |
| 843646AF7 | | Southern Power Company | | | | | | | |
| | | 4.875%, 07/15/2015 | | | 100,000 | | | 106,136 | |
| 98389BAP5 | | Xcel Energy, Inc. | | | | | | | |
| | | 0.750%, 05/09/2016 | | | $200,000 | | | 198,429 | |
| | | | | | | | | 358,268 | |
| | | Waste Management and Remediation Services — 0.45% | | | | | | | |
| 94106LAT6 | | Waste Management, Inc. | | | | | | | |
| | | 6.375%, 03/11/2015 | | | 100,000 | | | 106,534 | |
| | | TOTAL CORPORATE BONDS | | | | | | | |
| | | (cost $12,624,245) | | | | | | 12,617,586 | |
| | | | | | | | | | |
| | | U.S. GOVERNMENT AGENCY ISSUES — 5.26%1 | | | | | | | |
| | | U.S. Government Agency Issues — 5.26% | | | | | | | |
| 3133ED4A7 | | Federal Farm Credit Bank | | | | | | | |
| | | 0.375%, 10/07/2015 | | | 300,000 | | | 300,095 | |
| | | Federal Home Loan Banks | | | | | | | |
| 313371ZY5 | | 1.875%, 12/11/2015 | | | 175,000 | | | 180,223 | |
| 313375RN9 | | 1.000%, 03/11/2016 | | | 200,000 | | | 202,333 | |
| 3137EADQ9 | | Federal Home Loan Mortgage Corporation | | | | | | | |
| | | 0.500%, 05/13/2016 | | | 300,000 | | | 299,813 | |
| 31398A4K5 | | Federal National Mortgage Association | | | | | | | |
| | | 1.875%, 10/15/2015 | | | 250,000 | | | 256,176 | |
| | | TOTAL U.S. GOVERNMENT AGENCY ISSUES | | | | | | | |
| | | (cost $1,239,237) | | | | | | 1,238,640 | |
| | | | | | | | | | |
| | | U.S. TREASURY OBLIGATIONS — 3.82% | | | | | | | |
| | | U.S. Treasury Notes — 3.82% | | | | | | | |
| | | U.S. Treasury Notes | | | | | | | |
| 912828TK6 | | 0.250%, 08/15/2015 | | | 350,000 | | | 349,891 | |
| 912828VL1 | | 0.625%, 07/15/2016 | | | 250,000 | | | 250,322 | |
| 912828WA4 | | 0.625%, 10/15/2016^ | | | 300,000 | | | 299,473 | |
| | | TOTAL U.S. TREASURY OBLIGATIONS | | | | | | | |
| | | (cost $897,998) | | | | | | 899,686 | |
The accompanying notes are an integral part of these financial statements.
| KINETICS PORTFOLIOS TRUST — MASTER INVESTMENT PORTFOLIOS |
| The Alternative Income Portfolio |
Portfolio of Investments — December 31, 2013 — (Continued) |
| Identifier | | EXCHANGE TRADED FUNDS — 17.84% | | | Shares | | | Value | |
| | | Funds, Trusts, and Other Financial Vehicles — 17.84% | | | | | | | |
| CSJ | | iShares Barclays 1-3 Year Credit Bond ETF^ | | | 29,400 | | $ | 3,100,524 | |
| MINT | | PIMCO Enhanced Short Maturity ETF | | | 3,600 | | | 364,680 | |
| SCPB | | SPDR Barclays Short Term Corporate Bond ETF# | | | 24,000 | | | 736,560 | |
| | | TOTAL EXCHANGE TRADED FUNDS | | | | | | | |
| | | (cost $4,205,762) | | | | | | 4,201,764 | |
| | | | | | | | | | |
| | | WARRANTS — 0.00% | | | | | | | |
| | | Utilities — 0.00% | | | | | | | |
| CHC/WS | | China Hydroelectric Corporation | | | | | | | |
| | | Expiration Date: 1/25/2014 | | | | | | | |
| | | Exercise Price: $15.00* | | | 40,000 | | | 396 | |
| | | TOTAL WARRANTS | | | | | | | |
| | | (cost $48,000) | | | | | | 396 | |
| | | | | | | | | | |
| | | | | | Principal | | | | |
| | | SHORT-TERM INVESTMENTS — 8.12% | | | Amount | | | | |
| | | Commercial Paper — 4.04% | | | | | | | |
| 049218836 | | U.S. Bank N.A., 0.02%, 01/02/2014 | | $ | 950,000 | | | 950,000 | |
| | | | | | | | | | |
| | | Money Market Funds — 4.08% | | | Shares | | | | |
| FIGXX | | Fidelity Institutional Government Portfolio — Class I, 0.01%b | | | 961,603 | | | 961,603 | |
| | | TOTAL SHORT-TERM INVESTMENTS | | | | | | | |
| | | (cost $1,911,603) | | | | | | 1,911,603 | |
| | | | | | | | | | |
| | | INVESTMENTS PURCHASED WITH | | | | | | | |
| | | THE CASH PROCEEDS FROM | | | | | | | |
| | | SECURITIES LENDING — 1.48% | | | | | | | |
| | | Money Market Funds — 1.48% | | | | | | | |
| | | Mount Vernon Securities Lending Trust — Prime | | | | | | | |
| | | Portfolio, 0.17%b | | | 349,200 | | | 349,200 | |
| | | TOTAL INVESTMENTS PURCHASED WITH THE CASH | | | | | | | |
| | | PROCEEDS FROM SECURITIES LENDING | | | | | | | |
| | | (cost $349,200) | | | | | | 349,200 | |
| | | TOTAL INVESTMENTS — 90.09% | | | | | | | |
| | | (cost $21,276,045) | | | | | $ | 21,218,875 | |
The accompanying notes are an integral part of these financial statements.
| KINETICS PORTFOLIOS TRUST — MASTER INVESTMENT PORTFOLIOS |
| The Alternative Income Portfolio |
Portfolio of Investments — December 31, 2013 — (Continued) |
Percentages are stated as a percent of net assets.
| # — | All or a portion of the shares have been committed as collateral for written option contracts. |
| ^ — | This security or a portion of this security was out on loan at December 31, 2013. Total loaned securities had a market value of $342,030 at December 31, 2013. |
| * — | Non-income producing security. |
| 1 — | The obligations of certain U.S. Government-Sponsored entities are neither issued nor guaranteed by the United States Treasury. |
| b — | The rate quoted is the annualized seven-day yield as of December 31, 2013. |
| ETF — Exchange Traded Fund. |
| ■ — | Restricted security restricted to institutional investors (144a securities); the percentage of net assets comprised of 144a securities was 0.85%. |
The accompanying notes are an integral part of these financial statements.
| KINETICS PORTFOLIOS TRUST — MASTER INVESTMENT PORTFOLIOS |
| The Multi-Disciplinary Portfolio |
Portfolio of Investments — December 31, 2013 — (Continued) |
| Identifier | | COMMON STOCKS — 0.24% | | | Shares | | | Value | |
| | | Oil and Gas Extraction — 0.24% | | | | | | | |
| STO | | Statoil ASA — ADR | | | 8,800 | | $ | 212,344 | |
| | | TOTAL COMMON STOCKS | | | | | | | |
| | | (cost $189,267) | | | | | | 212,344 | |
| | | | | | | | | | |
| | | | | | Principal | | | | |
| | | CONVERTIBLE BONDS — 39.70% | | | Amount | | | | |
| | | Administrative and Support Services — 5.78% | | | | | | | |
| | | WebMD Health Corporation | | | | | | | |
| 94770VAH5 | | 2.250%, 03/31/2016# | | $ | 400,000 | | | 402,000 | |
| 94770VAF9 | | 2.500%, 01/31/2018# | | | 4,875,000 | | | 4,814,062 | |
| | | | | | | | | 5,216,062 | |
| | | Computer and Electronic Product Manufacturing — 1.84% | | | | | | | |
| 502413AW7 | | L-3 Communications Holdings, Inc. | | | | | | | |
| | | 3.000%, 08/01/2035# | | | 950,000 | | | 1,148,906 | |
| 747906AJ4 | | Quantum Corporation | | | | | | | |
| | | 4.500%, 11/15/2017 | | | 500,000 | | | 512,188 | |
| | | | | | | | | 1,661,094 | |
| | | Mining (except Oil and Gas) — 5.50% | | | | | | | |
| 250669AA6 | | Detour Gold Corporation | | | | | | | |
| | | 5.500%, 11/30/2017 | | | 1,000,000 | | | 786,250 | |
| B7W1RP3 | | Kirkland Lake Gold Inc. | | | | | | | |
| | | 6.000%, 06/30/2017 | CAD | | 350,000 | | | 214,168 | |
| 608753AA7 | | Molycorp Inc. | | | | | | | |
| | | 3.250%, 06/15/2016# | | | 1,500,000 | | | 1,057,500 | |
| 780287AA6 | | Royal Gold, Inc. | | | | | | | |
| | | 2.875%, 06/15/2019 | | | 3,014,000 | | | 2,912,278 | |
| | | | | | | | | 4,970,196 | |
| | | Nonmetallic Mineral Product Manufacturing — 5.99% | | | | | | | |
| 69073TAQ6 | | Owens-Brockway Glass Container | | | | | | | |
| | | 3.000%, 06/01/2015, Acquired 7/6/2011-3/15/2013 | | | | | | | |
| | | at $5,156,088#■ | | | 5,170,000 | | | 5,412,344 | |
The accompanying notes are an integral part of these financial statements.
| KINETICS PORTFOLIOS TRUST — MASTER INVESTMENT PORTFOLIOS |
| The Multi-Disciplinary Portfolio |
Portfolio of Investments — December 31, 2013 — (Continued) |
| | | | | | Principal | | | | |
| Identifier | | | | | Amount | | | Value | |
| | | Oil and Gas Extraction — 6.98% | | | | | | | |
| | | Arcan Resources Ltd. | | | | | | | |
| B4MT4X3 | | 6.250%, 02/28/2016# | CAD | $ | 1,719,000 | | $ | 841,497 | |
| B57ZB98 | | 6.500%, 10/31/2018# | CAD | | 2,592,000 | | | 1,189,551 | |
| | | Chesapeake Energy Corporation | | | | | | | |
| 165167BW6 | | 2.750%, 11/15/2035# | | $ | 650,000 | | | 682,906 | |
| 165167CB1 | | 2.250%, 12/15/2038^ | | | 3,830,000 | | | 3,590,625 | |
| | | | | | | | | 6,304,579 | |
| | | Performing Arts, Spectator Sports, and Related Industries — 3.12% | | | | | | | |
| 538034AB5 | | Live Nation Entertainment, Inc. | | | | | | | |
| | | 2.875%, 07/15/2027# | | | 2,763,000 | | | 2,814,806 | |
| | | Personal and Laundry Services — 1.55% | | | | | | | |
| 758932AA5 | | Regis Corporation | | | | | | | |
| | | 5.000%, 07/15/2014 | | | 1,303,000 | | | 1,404,797 | |
| | | Primary Metal Manufacturing — 2.81% | | | | | | | |
| 03938LAK0 | | ArcelorMittal | | | | | | | |
| | | 5.000%, 05/15/2014 | | | 2,500,000 | | | 2,535,938 | |
| | | Real Estate — 0.55% | | | | | | | |
| 345550AP2 | | Forest City Enterprises, Inc. | | | | | | | |
| | | 4.250%, 08/15/2018# | | | 446,000 | | | 497,847 | |
| | | Software Publishers — 4.44% | | | | | | | |
| 285512AA7 | | Electronic Arts, Inc. | | | | | | | |
| | | 0.750%, 07/15/2016^ | | | 3,750,000 | | | 4,007,812 | |
| | | Transportation Equipment Manufacturing — 1.14% | | | | | | | |
| 63934EAL2 | | Navistar International Corp. | | | | | | | |
| | | 3.000%, 10/15/2014^ | | | 1,000,000 | | | 1,027,500 | |
| | | TOTAL CONVERTIBLE BONDS | | | | | | | |
| | | (cost $36,861,082) | | | | | | 35,852,975 | |
| | | | | | | | | | |
| | | CORPORATE BONDS — 16.54% | | | | | | | |
| | | Ambulatory Health Care Services — 3.16% | | | | | | | |
| 23918KAL2 | | DaVita HealthCare Partners, Inc. | | | | | | | |
| | | 6.375%, 11/01/2018#^ | | | 2,710,000 | | | 2,850,581 | |
| | | Credit Intermediation and Related Activities — 0.13% | | | | | | | |
| 02005NAE0 | | Ally Financial, Inc. | | | | | | | |
| | | 8.000%, 03/15/2020 | | | 100,000 | | | 120,375 | |
The accompanying notes are an integral part of these financial statements.
| KINETICS PORTFOLIOS TRUST — MASTER INVESTMENT PORTFOLIOS |
| The Multi-Disciplinary Portfolio |
Portfolio of Investments — December 31, 2013 — (Continued) |
| | | | | | Principal | | | | |
| Identifier | | | | | Amount | | | Value | |
| | | General Merchandise Stores — 1.10% | | | | | | | |
| 708130AD1 | | J.C. Penney Company, Inc. | | | | | | | |
| | | 5.650%, 06/01/2020 | | $ | 1,250,000 | | $ | 990,625 | |
| | | Holding Company — 0.11% | | | | | | | |
| 451102AH0 | | Icahn Enterprises LP | | | | | | | |
| | | 8.000%, 01/15/2018 | | | 100,000 | | | 104,250 | |
| | | Mining (except Oil and Gas) — 3.70% | | | | | | | |
| 20854PAD1 | | Consol Energy, Inc. | | | | | | | |
| | | 8.000%, 04/01/2017# | | | 1,495,000 | | | 1,580,963 | |
| 35671DAU9 | | Freeport-McMoRan Copper & Gold Inc. | | | | | | | |
| | | 3.550%, 03/01/2022^ | | | 500,000 | | | 476,029 | |
| | | Peabody Energy Corporation | | | | | | | |
| 704549AK0 | | 6.000%, 11/15/2018^ | | | 950,000 | | | 1,016,500 | |
| 704549AH7 | | 6.500%, 09/15/2020# | | | 250,000 | | | 264,375 | |
| | | | | | | | | 3,337,867 | |
| | | Satellite Telecommunications — 3.61% | | | | | | | |
| | | DISH DBS Corp. | | | | | | | |
| 25470XAH8 | | 4.625%, 07/15/2017^ | | | 3,000,000 | | | 3,150,000 | |
| 25470XAB1 | | 7.875%, 09/01/2019 | | | 100,000 | | | 114,750 | |
| | | | | | | | | 3,264,750 | |
| | | Securities, Commodity Contracts, and Other Financial | | | | | | | |
| | | Investments and Related Activities — 3.38% | | | | | | | |
| 683797AB0 | | Oppenheimer Holdings, Inc. | | | | | | | |
| | | 8.750%, 04/15/2018 | | | 2,839,000 | | | 3,051,925 | |
| | | Telecommunications — 1.35% | | | | | | | |
| 852060AG7 | | Sprint Capital Corp. | | | | | | | |
| | | 6.900%, 05/01/2019^ | | | 1,000,000 | | | 1,097,500 | |
| 852061AK6 | | Sprint Nextel Corp. | | | | | | | |
| | | 9.000%, 11/15/2018, Acquired 12/30/2013 | | | | | | | |
| | | at $121,000■ | | | 100,000 | | | 120,750 | |
| | | | | | | | | 1,218,250 | |
| | | TOTAL CORPORATE BONDS | | | | | | | |
| | | (cost $14,778,127) | | | | | | 14,938,623 | |
The accompanying notes are an integral part of these financial statements.
| KINETICS PORTFOLIOS TRUST — MASTER INVESTMENT PORTFOLIOS |
| The Multi-Disciplinary Portfolio |
Portfolio of Investments — December 31, 2013 — (Continued) |
| | | | | | Principal | | | | |
| Identifier | | MUNICIPAL BONDS — 0.58% | | | Amount | | | Value | |
| | | Air Transportation — 0.58% | | | | | | | |
| | | Branson Missouri Regional Airport Transportation | | | | | | | |
| | | Development District | | | | | | | |
| 105459AB7 | | 6.000%, 07/01/2025c+ | | $ | 2,000,000 | | $ | 300,000 | |
| 105459AC5 | | 6.000%, 07/01/2037c+ | | | 1,500,000 | | | 225,000 | |
| | | | | | | | | 525,000 | |
| | | TOTAL MUNICIPAL BONDS | | | | | | | |
| | | (cost $2,245,112) | | | | | | 525,000 | |
| | | | | | | | | | |
| | | EXCHANGE TRADED FUNDS — 1.44% | | | Shares | | | | |
| | | Funds, Trusts, and Other Financial Vehicles — 1.44% | | | | | | | |
| BOND | | PIMCO Total Return ETF^ | | | 12,400 | | | 1,298,776 | |
| | | TOTAL EXCHANGE TRADED FUNDS | | | | | | | |
| | | (cost $1,321,264) | | | | | | 1,298,776 | |
| | | | | | | | | | |
| | | MUTUAL FUNDS — 6.23% | | | | | | | |
| | | Funds, Trusts, and Other Financial Vehicles — 6.23% | | | | | | | |
| ACG | | ACM Income Fund, Inc. | | | 131,200 | | | 935,456 | |
| ACP | | Avenue Income Credit Strategies Fund | | | 3,000 | | | 52,740 | |
| DSL | | DoubleLine Income Solutions Fund | | | 17,400 | | | 366,966 | |
| DBL | | DoubleLine Opportunistic Credit Fund | | | 8,700 | | | 194,184 | |
| HAV | | Helios Advantage Income Fund, Inc. | | | 700 | | | 6,349 | |
| HSA | | Helios Strategic Income Fund, Inc. | | | 200 | | | 1,332 | |
| TLI | | LMP Corporate Loan Fund Inc.^ | | | 5,600 | | | 68,488 | |
| MTS | | Montgomery Street Income Securities, Inc. | | | 34,400 | | | 534,576 | |
| JFR | | Nuveen Floating Rate Income Fund | | | 200 | | | 2,384 | |
| PCM | | PCM Fund Inc. | | | 2,900 | | | 33,785 | |
| PCN | | PIMCO Corporate Income Fund | | | 1,700 | | | 26,860 | |
| PCI | | PIMCO Dynamic Credit Income Fund | | | 50,500 | | | 1,135,240 | |
| PDI | | PIMCO Dynamic Income Fund^ | | | 38,200 | | | 1,112,766 | |
| PKO | | PIMCO Income Opportunity Fund^ | | | 16,050 | | | 453,413 | |
| PFL | | PIMCO Income Strategy Fund | | | 10,600 | | | 119,886 | |
| PFN | | PIMCO Income Strategy Fund II | | | 10,100 | | | 100,495 | |
| IMF | | Western Asset Inflation Management Fund Inc. | | | 1,700 | | | 28,781 | |
| DMO | | Western Asset Mortgage Defined | | | | | | | |
| | | Opportunity Fund Inc. | | | 19,500 | | | 452,010 | |
| WIW | | Western Asset/Claymore Inflation-Linked | | | | | | | |
| | | Opportunities & Income Fund | | | 200 | | | 2,254 | |
The accompanying notes are an integral part of these financial statements.
| KINETICS PORTFOLIOS TRUST — MASTER INVESTMENT PORTFOLIOS |
| The Multi-Disciplinary Portfolio |
Portfolio of Investments — December 31, 2013 — (Continued) |
| Identifier | | | | | Shares | | | Value | |
| | | Funds, Trusts, and Other Financial Vehicles — 6.23% (Continued) | | | | | | | |
| WIA | | Western Asset/Claymore Inflation-Linked | | | | | | | |
| | | Securities & Income Fund | | | 200 | | $ | 2,284 | |
| | | TOTAL MUTUAL FUNDS | | | | | | | |
| | | (cost $5,795,003) | | | | | | 5,630,249 | |
| | | | | | | | | | |
| | | PURCHASED PUT OPTIONS — 0.42% | | | Contractsd | | | | |
| | | Credit Intermediation and Related Activities — 0.21% | | | | | | | |
| | | iPath S&P 500 VIX Short-Term Futures ETN* | | | | | | | |
| VXX 150117P00025000 | | Expiration: January 2015, Exercise Price: $25.00 | | | 2 | | | 555 | |
| VXX 160115P00015000 | | Expiration: January 2016, Exercise Price: $15.00 | | | 4 | | | 912 | |
| VXX 160115P00020000 | | Expiration: January 2016, Exercise Price: $20.00 | | | 444 | | | 184,260 | |
| | | | | | | | | 185,727 | |
| | | Funds, Trusts, and Other Financial Vehicles — 0.21% | | | | | | | |
| | | ProShares Ultra VIX Short-Term Futures ETF* | | | | | | | |
| UVXY 150117P00010000 | | Expiration: January 2015, Exercise Price: $10.00 | | | 18 | | | 6,480 | |
| UVXY 150117P00011000 | | Expiration: January 2015, Exercise Price: $11.00 | | | 12 | | | 5,160 | |
| UVXY1 150117P00012000 | | Expiration: January 2015, Exercise Price: $12.00 | | | 6 | | | 6,270 | |
| UVXY 150117P00012000 | | Expiration: January 2015, Exercise Price: $12.00 | | | 78 | | | 39,000 | |
| UVXY 150117P00014000 | | Expiration: January 2015, Exercise Price: $14.00 | | | 4 | | | 2,500 | |
| UVXY 150117P00015000 | | Expiration: January 2015, Exercise Price: $15.00 | | | 4 | | | 2,780 | |
| UVXY 150117P00016000 | | Expiration: January 2015, Exercise Price: $16.00 | | | 18 | | | 13,770 | |
| UVXY 160115P00008000 | | Expiration: January 2016, Exercise Price: $8.00 | | | 8 | | | 3,520 | |
| UVXY 160115P00009000 | | Expiration: January 2016, Exercise Price: $9.00 | | | 190 | | | 97,850 | |
| UVXY 160115P00010000 | | Expiration: January 2016, Exercise Price: $10.00 | | | 26 | | | 15,210 | |
| | | | | | | | | 192,540 | |
| | | TOTAL PURCHASED PUT OPTIONS | | | | | | | |
| | | (cost $370,386) | | | | | | 378,267 | |
| | | | | | | | | | |
| | | | | | Principal | | | | |
| | | SHORT-TERM INVESTMENTS — 7.75% | | | Amount | | | | |
| | | Commercial Paper — 2.57% | | | | | | | |
| 049218837 | | U.S. Bank N.A., 0.02%, 01/02/2014 | | $ | 2,325,000 | | | 2,325,000 | |
| | | | | | | | | | |
| | | | | | Shares | | | | |
| | | Money Market Funds — 2.41% | | | | | | | |
| FIGXX | | Fidelity Institutional Government Portfolio — | | | | | | | |
| | | Class I, 0.01%b | | | 2,176,000 | | | 2,176,000 | |
The accompanying notes are an integral part of these financial statements.
| KINETICS PORTFOLIOS TRUST — MASTER INVESTMENT PORTFOLIOS |
| The Multi-Disciplinary Portfolio |
Portfolio of Investments — December 31, 2013 — (Continued) |
| | | | | | Principal | | | | |
| Identifier | | | | | Amount | | | Value | |
| | | U.S. Treasury Obligations — 2.77% | | | | | | | |
| | | United States Treasury Bill | | | | | | | |
| 912796BS7 | | Maturity Date: 01/02/2014, Yield to Maturity 0.02% | | $ | 1,500,000 | | $ | 1,499,999 | |
| 912796BV0 | | Maturity Date: 01/23/2014, Yield to Maturity 0.00% | | | 1,000,000 | | | 1,000,000 | |
| | | | | | | | | 2,499,999 | |
| | | TOTAL SHORT-TERM INVESTMENTS | | | | | | | |
| | | (cost $7,000,999) | | | | | | 7,000,999 | |
| | | | | | | | | | |
| | | INVESTMENTS PURCHASED WITH | | | | | | | |
| | | THE CASH PROCEEDS FROM | | | | | | | |
| | | SECURITIES LENDING — 7.84% | | | Shares | | | | |
| | | Money Market Funds — 7.84% | | | | | | | |
| | | Mount Vernon Securities Lending Trust — Prime | | | | | | | |
| | | Portfolio, 0.17%b | | | 7,084,608 | | | 7,084,608 | |
| | | TOTAL INVESTMENTS PURCHASED WITH THE CASH | | | | | | | |
| | | PROCEEDS FROM SECURITIES LENDING | | | | | | | |
| | | (cost $7,084,608) | | | | | | 7,084,608 | |
| | | TOTAL INVESTMENTS — 80.74% | | | | | | | |
| | | (cost $75,645,848) | | | | | $ | 72,921,841 | |
Percentages are stated as a percent of net assets.
| * — | Non-income producing security. |
| ^ — | This security or a portion of this security was out on loan at December 31, 2013. Total loaned securities had a market value of $6,926,554 at December 31, 2013. |
| # — | All or a portion of the shares have been committed as collateral for written option contracts. |
| ■ — | Restricted security restricted to institutional investors (144a securities); the percentage of net assets comprised of 144a securities was 6.13%. |
| c — | The security missed January 1, 2012 interest payment and has ceased to accrue income. A forbearance agreement is currently in place. |
| + — | Security is considered illiquid. The aggregate value of such securities is $525,000 or 0.58% of net assets. |
| b — | The rate quoted is the annualized seven-day yield as of December 31, 2013. |
| d — | 100 shares per contract. |
ADR — American Depository Receipt.
CAD — Canadian Dollars.
ETF — Exchange Traded Fund.
ETN — Exchange Traded Note.
The accompanying notes are an integral part of these financial statements.
| KINETICS PORTFOLIOS TRUST — MASTER INVESTMENT PORTFOLIOS |
| The Alternative Income Portfolio |
| Portfolio of Options Written — December 31, 2013 |
| Identifier | | PUT OPTIONS WRITTEN | | | Contracts* | | | Value | |
| | | Accommodation | | | | | | | |
| | | Carnival Corporation | | | | | | | |
| CCL 140118P00029500 | | Expiration: January 2014, Exercise Price: $29.50 | | | 10 | | $ | 25 | |
| CCL 140419P00030000 | | Expiration: April 2014, Exercise Price: $30.00 | | | 12 | | | 150 | |
| CCL 150117P00024500 | | Expiration: January 2015, Exercise Price: $24.50 | | | 33 | | | 1,320 | |
| | | Marriott International Inc. — Class A | | | | | | | |
| MAR 140419P00035000 | | Expiration: April 2014, Exercise Price: $35.00 | | | 2 | | | 15 | |
| MAR 160115P00030000 | | Expiration: January 2016, Exercise Price: $30.00 | | | 2 | | | 230 | |
| MAR 160115P00033000 | | Expiration: January 2016, Exercise Price: $33.00 | | | 35 | | | 5,862 | |
| MAR 160115P00035000 | | Expiration: January 2016, Exercise Price: $35.00 | | | 1 | | | 194 | |
| | | | | | | | | 7,796 | |
| | | Administrative and Support Services | | | | | | | |
| | | Accenture plc — Class A | | | | | | | |
| ACN 140517P00055000 | | Expiration: May 2014, Exercise Price: $55.00 | | | 4 | | | 60 | |
| ACN 150117P00045000 | | Expiration: January 2015, Exercise Price: $45.00 | | | 10 | | | 450 | |
| ACN 160115P00060000 | | Expiration: January 2016, Exercise Price: $60.00 | | | 1 | | | 370 | |
| | | Expedia, Inc. | | | | | | | |
| EXPE 140118P00044480 | | Expiration: January 2014, Exercise Price: $44.48 | | | 10 | | | 25 | |
| EXPE 150117P00034480 | | Expiration: January 2015, Exercise Price: $34.48 | | | 25 | | | 1,813 | |
| EXPE 160115P00040000 | | Expiration: January 2016, Exercise Price: $40.00 | | | 3 | | | 975 | |
| EXPE 160115P00050000 | | Expiration: January 2016, Exercise Price: $50.00 | | | 1 | | | 625 | |
| | | | | | | | | 4,318 | |
| | | Ambulatory Health Care Services | | | | | | | |
| | | DaVita HealthCare Partners Inc. | | | | | | | |
| DVA 160115P00050000 | | Expiration: January 2016, Exercise Price: $50.00 | | | 1 | | | 355 | |
| | | Apparel Manufacturing | | | | | | | |
| | | L Brands, Inc. | | | | | | | |
| LB 140222P00040000 | | Expiration: February 2014, Exercise Price: $40.00 | | | 10 | | | 75 | |
| LB 150117P00032000 | | Expiration: January 2015, Exercise Price: $32.00 | | | 11 | | | 358 | |
| LB 150117P00044000 | | Expiration: January 2015, Exercise Price: $44.00 | | | 9 | | | 1,215 | |
| LB 150117P00047000 | | Expiration: January 2015, Exercise Price: $47.00 | | | 5 | | | 925 | |
| | | | | | | | | 2,573 | |
| | | Asset Management | | | | | | | |
| | | BlackRock, Inc. | | | | | | | |
| BLK 160115P00210000 | | Expiration: January 2016, Exercise Price: $210.00 | | | 8 | | | 11,520 | |
The accompanying notes are an integral part of these financial statements.
| KINETICS PORTFOLIOS TRUST — MASTER INVESTMENT PORTFOLIOS |
| The Alternative Income Portfolio |
Portfolio of Options Written — December 31, 2013 — (Continued) |
| Identifier | | | | | Contracts* | | | Value | |
| | | Asset Management — (Continued) | | | | | | | |
| | | The Blackstone Group LP | | | | | | | |
| BX 140621P00020000 | | Expiration: June 2014, Exercise Price: $20.00 | | | 10 | | $ | 210 | |
| BX 150117P00012000 | | Expiration: January 2015, Exercise Price: $12.00 | | | 30 | | | 345 | |
| BX 150117P00017000 | | Expiration: January 2015, Exercise Price: $17.00 | | | 40 | | | 1,520 | |
| | | Franklin Resources, Inc. | | | | | | | |
| BEN 140419P00035000 | | Expiration: April 2014, Exercise Price: $35.00 | | | 22 | | | 165 | |
| BEN 150117P00040000 | | Expiration: January 2015, Exercise Price: $40.00 | | | 1 | | | 98 | |
| BEN 160115P00040000 | | Expiration: January 2016, Exercise Price: $40.00 | | | 18 | | | 4,275 | |
| | | KKR & Co. LP | | | | | | | |
| KKR 150117P00013000 | | Expiration: January 2015, Exercise Price: $13.00 | | | 50 | | | 1,625 | |
| | | | | | | | | 19,758 | |
| | | Beverage and Tobacco Product Manufacturing | | | | | | | |
| | | Anheuser-Busch InBev NV — ADR | | | | | | | |
| BUD 140322P00080000 | | Expiration: March 2014, Exercise Price: $80.00 | | | 11 | | | 138 | |
| BUD 140322P00085000 | | Expiration: March 2014, Exercise Price: $85.00 | | | 8 | | | 160 | |
| | | The Coca-Cola Company | | | | | | | |
| KO 140222P00034000 | | Expiration: February 2014, Exercise Price: $34.00 | | | 5 | | | 20 | |
| KO 140517P00032000 | | Expiration: May 2014, Exercise Price: $32.00 | | | 6 | | | 51 | |
| KO 150117P00030000 | | Expiration: January 2015, Exercise Price: $30.00 | | | 18 | | | 702 | |
| KO 150117P00032500 | | Expiration: January 2015, Exercise Price: $32.50 | | | 5 | | | 310 | |
| KO 150117P00035000 | | Expiration: January 2015, Exercise Price: $35.00 | | | 8 | | | 824 | |
| KO 160115P00033000 | | Expiration: January 2016, Exercise Price: $33.00 | | | 7 | | | 1,239 | |
| | | Constellation Brands, Inc. — Class A | | | | | | | |
| STZ 140118P00040000 | | Expiration: January 2014, Exercise Price: $40.00 | | | 10 | | | 75 | |
| STZ 140419P00042500 | | Expiration: April 2014, Exercise Price: $42.50 | | | 5 | | | 50 | |
| STZ 140419P00045000 | | Expiration: April 2014, Exercise Price: $45.00 | | | 5 | | | 50 | |
| STZ 150117P00042500 | | Expiration: January 2015, Exercise Price: $42.50 | | | 8 | | | 420 | |
| STZ 160115P00045000 | | Expiration: January 2016, Exercise Price: $45.00 | | | 9 | | | 1,642 | |
| STZ 160115P00052500 | | Expiration: January 2016, Exercise Price: $52.50 | | | 3 | | | 1,020 | |
| | | Lorillard, Inc. | | | | | | | |
| LO 140621P00040000 | | Expiration: June 2014, Exercise Price: $40.00 | | | 2 | | | 117 | |
| LO 150117P00036670 | | Expiration: January 2015, Exercise Price: $36.67 | | | 28 | | | 2,982 | |
| | | Molson Coors Brewing Company — Class B | | | | | | | |
| TAP 140419P00040000 | | Expiration: April 2014, Exercise Price: $40.00 | | | 13 | | | 98 | |
| TAP 150117P00035000 | | Expiration: January 2015, Exercise Price: $35.00 | | | 23 | | | 977 | |
| TAP 160115P00040000 | | Expiration: January 2016, Exercise Price: $40.00 | | | 6 | | | 1,365 | |
The accompanying notes are an integral part of these financial statements.
| KINETICS PORTFOLIOS TRUST — MASTER INVESTMENT PORTFOLIOS |
| The Alternative Income Portfolio |
Portfolio of Options Written — December 31, 2013 — (Continued) |
| Identifier | | | | | Contracts* | | | Value | |
| | | Beverage and Tobacco Product Manufacturing — (Continued) | | | | | | | |
| | | Philip Morris International, Inc. | | | | | | | |
| PM 140118P00070000 | | Expiration: January 2014, Exercise Price: $70.00 | | | 5 | | $ | 13 | |
| PM 150117P00075000 | | Expiration: January 2015, Exercise Price: $75.00 | | | 5 | | | 1,187 | |
| | | | | | | | | 13,440 | |
| | | Broadcasting (except Internet) | | | | | | | |
| | | CBS Corporation — Class B | | | | | | | |
| CBS 140621P00045000 | | Expiration: June 2014, Exercise Price: $45.00 | | | 20 | | | 900 | |
| CBS 150117P00037000 | | Expiration: January 2015, Exercise Price: $37.00 | | | 12 | | | 930 | |
| CBS 150117P00040000 | | Expiration: January 2015, Exercise Price: $40.00 | | | 4 | | | 380 | |
| | | Comcast Corporation — Class A | | | | | | | |
| CMCSA 140419P00031000 | | Expiration: April 2014, Exercise Price: $31.00 | | | 5 | | | 30 | |
| CMCSA 150117P00028000 | | Expiration: January 2015, Exercise Price: $28.00 | | | 29 | | | 653 | |
| CMCSA 160115P00035000 | | Expiration: January 2016, Exercise Price: $35.00 | | | 6 | | | 996 | |
| | | Twenty-First Century Fox, Inc. — Class A | | | | | | | |
| FOXA 140419P00024000 | | Expiration: April 2014, Exercise Price: $24.00 | | | 8 | | | 40 | |
| FOXA1 150117P00022000 | | Expiration: January 2015, Exercise Price: $22.00 | | | 30 | | | 675 | |
| FOXA 150117P00025000 | | Expiration: January 2015, Exercise Price: $25.00 | | | 28 | | | 1,820 | |
| FOXA 160115P00025000 | | Expiration: January 2016, Exercise Price: $25.00 | | | 3 | | | 465 | |
| | | The Walt Disney Company | | | | | | | |
| DIS 140419P00052500 | | Expiration: April 2014, Exercise Price: $52.50 | | | 7 | | | 74 | |
| DIS 160115P00050000 | | Expiration: January 2016, Exercise Price: $50.00 | | | 8 | | | 1,692 | |
| DIS 160115P00055000 | | Expiration: January 2016, Exercise Price: $55.00 | | | 2 | | | 625 | |
| | | | | | | | | 9,280 | |
| | | Building Equipment Contractors | | | | | | | |
| | | Honeywell International Inc. | | | | | | | |
| HON 150117P00065000 | | Expiration: January 2015, Exercise Price: $65.00 | | | 1 | | | 135 | |
| HON 160115P00065000 | | Expiration: January 2016, Exercise Price: $65.00 | | | 5 | | | 1,750 | |
| | | | | | | | | 1,885 | |
| | | Building Material and Garden Equipment and Supplies Dealers | | | | | | | |
| | | Fastenal Company | | | | | | | |
| FAST 140118P00033000 | | Expiration: January 2014, Exercise Price: $33.00 | | | 5 | | | 12 | |
| FAST 140118P00039500 | | Expiration: January 2014, Exercise Price: $39.50 | | | 8 | | | 60 | |
| FAST 150117P00032500 | | Expiration: January 2015, Exercise Price: $32.50 | | | 17 | | | 1,785 | |
| FAST 150117P00034500 | | Expiration: January 2015, Exercise Price: $34.50 | | | 13 | | | 1,755 | |
| FAST 150117P00037500 | | Expiration: January 2015, Exercise Price: $37.50 | | | 7 | | | 1,365 | |
The accompanying notes are an integral part of these financial statements.
| KINETICS PORTFOLIOS TRUST — MASTER INVESTMENT PORTFOLIOS |
| The Alternative Income Portfolio |
Portfolio of Options Written — December 31, 2013 — (Continued) |
| Identifier | | | | | Contracts* | | | Value | |
| | | Building Material and Garden Equipment and Supplies Dealers — (Continued) | | | | | | | |
| | | The Home Depot, Inc. | | | | | | | |
| HD 140517P00055000 | | Expiration: May 2014, Exercise Price: $55.00 | | | 1 | | $ | 13 | |
| HD 150117P00050000 | | Expiration: January 2015, Exercise Price: $50.00 | | | 20 | | | 1,150 | |
| HD 150117P00060000 | | Expiration: January 2015, Exercise Price: $60.00 | | | 1 | | | 132 | |
| | | Lowe’s Companies, Inc. | | | | | | | |
| LOW 150117P00023000 | | Expiration: January 2015, Exercise Price: $23.00 | | | 20 | | | 450 | |
| LOW 150117P00025000 | | Expiration: January 2015, Exercise Price: $25.00 | | | 5 | | | 142 | |
| LOW 150117P00030000 | | Expiration: January 2015, Exercise Price: $30.00 | | | 5 | | | 273 | |
| LOW 150117P00035000 | | Expiration: January 2015, Exercise Price: $35.00 | | | 10 | | | 1,030 | |
| LOW 160115P00035000 | | Expiration: January 2016, Exercise Price: $35.00 | | | 8 | | | 1,980 | |
| | | The Sherwin-Williams Company | | | | | | | |
| SHW 140118P00125000 | | Expiration: January 2014, Exercise Price: $125.00 | | | 5 | | | 13 | |
| SHW 140118P00150000 | | Expiration: January 2014, Exercise Price: $150.00 | | | 2 | | | 15 | |
| SHW 140621P00140000 | | Expiration: June 2014, Exercise Price: $140.00 | | | 1 | | | 187 | |
| SHW 150117P00135000 | | Expiration: January 2015, Exercise Price: $135.00 | | | 4 | | | 1,980 | |
| SHW 150117P00150000 | | Expiration: January 2015, Exercise Price: $150.00 | | | 2 | | | 1,620 | |
| | | | | | | | | 13,962 | |
| | | Chemical Manufacturing | | | | | | | |
| | | Celgene Corporation | | | | | | | |
| CELG 150117P00055000 | | Expiration: January 2015, Exercise Price: $55.00 | | | 10 | | | 680 | |
| CELG 150117P00100000 | | Expiration: January 2015, Exercise Price: $100.00 | | | 4 | | | 1,460 | |
| CELG 150117P00110000 | | Expiration: January 2015, Exercise Price: $110.00 | | | 2 | | | 1,035 | |
| CELG 150117P00115000 | | Expiration: January 2015, Exercise Price: $115.00 | | | 4 | | | 2,420 | |
| CELG 160115P00110000 | | Expiration: January 2016, Exercise Price: $110.00 | | | 1 | | | 1,118 | |
| | | The Dow Chemical Company | | | | | | | |
| DOW 140322P00028000 | | Expiration: March 2014, Exercise Price: $28.00 | | | 19 | | | 143 | |
| DOW 140621P00030000 | | Expiration: June 2014, Exercise Price: $30.00 | | | 3 | | | 69 | |
| DOW 150117P00020000 | | Expiration: January 2015, Exercise Price: $20.00 | | | 29 | | | 783 | |
| DOW 150117P00027000 | | Expiration: January 2015, Exercise Price: $27.00 | | | 12 | | | 720 | |
| DOW 150117P00030000 | | Expiration: January 2015, Exercise Price: $30.00 | | | 1 | | | 84 | |
| DOW 160115P00028000 | | Expiration: January 2016, Exercise Price: $28.00 | | | 8 | | | 1,224 | |
| | | E.I. du Pont de Nemours and Company | | | | | | | |
| DD 140419P00042500 | | Expiration: April 2014, Exercise Price: $42.50 | | | 1 | | | 6 | |
| DD 150117P00035000 | | Expiration: January 2015, Exercise Price: $35.00 | | | 10 | | | 220 | |
| DD 150117P00045000 | | Expiration: January 2015, Exercise Price: $45.00 | | | 10 | | | 705 | |
| DD 160115P00045000 | | Expiration: January 2016, Exercise Price: $45.00 | | | 18 | | | 3,438 | |
The accompanying notes are an integral part of these financial statements.
| KINETICS PORTFOLIOS TRUST — MASTER INVESTMENT PORTFOLIOS |
| The Alternative Income Portfolio |
Portfolio of Options Written — December 31, 2013 — (Continued) |
| Identifier | | | | | Contracts* | | | Value | |
| | | Chemical Manufacturing — (Continued) | | | | | | | |
| | | Eastman Chemical Company | | | | | | | |
| EMN 150117P00045000 | | Expiration: January 2015, Exercise Price: $45.00 | | | 10 | | $ | 700 | |
| EMN 150117P00055000 | | Expiration: January 2015, Exercise Price: $55.00 | | | 3 | | | 480 | |
| EMN 150117P00057500 | | Expiration: January 2015, Exercise Price: $57.50 | | | 10 | | | 1,900 | |
| EMN 160115P00055000 | | Expiration: January 2016, Exercise Price: $55.00 | | | 1 | | | 380 | |
| | | Forest Laboratories, Inc. | | | | | | | |
| FRX 150117P00033000 | | Expiration: January 2015, Exercise Price: $33.00 | | | 12 | | | 300 | |
| FRX 160115P00035000 | | Expiration: January 2016, Exercise Price: $35.00 | | | 18 | | | 2,295 | |
| | | Monsanto Company | | | | | | | |
| MON 150117P00075000 | | Expiration: January 2015, Exercise Price: $75.00 | | | 10 | | | 1,215 | |
| MON 150117P00082500 | | Expiration: January 2015, Exercise Price: $82.50 | | | 5 | | | 938 | |
| MON 160115P00075000 | | Expiration: January 2016, Exercise Price: $75.00 | | | 2 | | | 630 | |
| MON 160115P00080000 | | Expiration: January 2016, Exercise Price: $80.00 | | | 1 | | | 397 | |
| | | The Mosaic Company | | | | | | | |
| MOS 140621P00035000 | | Expiration: June 2014, Exercise Price: $35.00 | | | 2 | | | 72 | |
| MOS 150117P00030000 | | Expiration: January 2015, Exercise Price: $30.00 | | | 3 | | | 133 | |
| MOS 150117P00035000 | | Expiration: January 2015, Exercise Price: $35.00 | | | 34 | | | 4,114 | |
| MOS 160115P00035000 | | Expiration: January 2016, Exercise Price: $35.00 | | | 1 | | | 258 | |
| | | Teva Pharmaceutical Industries Ltd. — ADR | | | | | | | |
| TEVA 160115P00030000 | | Expiration: January 2016, Exercise Price: $30.00 | | | 15 | | | 3,338 | |
| | | Westlake Chemical Corporation | | | | | | | |
| WLK 140419P00075000 | | Expiration: April 2014, Exercise Price: $75.00 | | | 5 | | | 150 | |
| WLK 140419P00080000 | | Expiration: April 2014, Exercise Price: $80.00 | | | 2 | | | 65 | |
| | | | | | | | | 31,470 | |
| | | Clothing and Clothing Accessories Stores | | | | | | | |
| | | The Gap, Inc. | | | | | | | |
| GPS 140322P00030000 | | Expiration: March 2014, Exercise Price: $30.00 | | | 5 | | | 63 | |
| GPS 140322P00034000 | | Expiration: March 2014, Exercise Price: $34.00 | | | 9 | | | 423 | |
| GPS 140621P00028000 | | Expiration: June 2014, Exercise Price: $28.00 | | | 3 | | | 75 | |
| GPS 140621P00029000 | | Expiration: June 2014, Exercise Price: $29.00 | | | 9 | | | 297 | |
| GPS 160115P00028000 | | Expiration: January 2016, Exercise Price: $28.00 | | | 3 | | | 631 | |
| | | Nordstrom, Inc. | | | | | | | |
| JWN 150117P00045000 | | Expiration: January 2015, Exercise Price: $45.00 | | | 16 | | | 1,768 | |
| JWN 160115P00045000 | | Expiration: January 2016, Exercise Price: $45.00 | | | 1 | | | 282 | |
The accompanying notes are an integral part of these financial statements.
| KINETICS PORTFOLIOS TRUST — MASTER INVESTMENT PORTFOLIOS |
| The Alternative Income Portfolio |
Portfolio of Options Written — December 31, 2013 — (Continued) |
| Identifier | | | | | Contracts* | | | Value | |
| | | Clothing and Clothing Accessories Stores — (Continued) | | | | | | | |
| | | Tiffany & Co. | | | | | | | |
| TIF 140222P00060000 | | Expiration: February 2014, Exercise Price: $60.00 | | | 5 | | $ | 20 | |
| TIF 150117P00060000 | | Expiration: January 2015, Exercise Price: $60.00 | | | 1 | | | 120 | |
| TIF 160115P00055000 | | Expiration: January 2016, Exercise Price: $55.00 | | | 11 | | | 2,486 | |
| TIF 160115P00067500 | | Expiration: January 2016, Exercise Price: $67.50 | | | 1 | | | 490 | |
| | | | | | | | | 6,655 | |
| | | Computer and Electronic Product Manufacturing | | | | | | | |
| | | Agilent Technologies, Inc. | | | | | | | |
| A 150117P00028000 | | Expiration: January 2015, Exercise Price: $28.00 | | | 20 | | | 470 | |
| A 150117P00035000 | | Expiration: January 2015, Exercise Price: $35.00 | | | 19 | | | 1,206 | |
| A 150117P00040000 | | Expiration: January 2015, Exercise Price: $40.00 | | | 5 | | | 593 | |
| A 160115P00035000 | | Expiration: January 2016, Exercise Price: $35.00 | | | 1 | | | 179 | |
| A 160115P00040000 | | Expiration: January 2016, Exercise Price: $40.00 | | | 6 | | | 1,710 | |
| | | Altera Corporation | | | | | | | |
| ALTR 150117P00023000 | | Expiration: January 2015, Exercise Price: $23.00 | | | 20 | | | 1,400 | |
| | | Apple, Inc. | | | | | | | |
| AAPL 140419P00365000 | | Expiration: April 2014, Exercise Price: $365.00 | | | 1 | | | 39 | |
| AAPL7 140419P00400000 | | Expiration: April 2014, Exercise Price: $400.00e | | | 10 | | | 77 | |
| AAPL 140719P00400000 | | Expiration: July 2014, Exercise Price: $400.00 | | | 1 | | | 320 | |
| AAPL 150117P00350000 | | Expiration: January 2015, Exercise Price: $350.00 | | | 1 | | | 440 | |
| AAPL 160115P00410000 | | Expiration: January 2016, Exercise Price: $410.00 | | | 1 | | | 2,985 | |
| | | Broadcom Corporation — Class A | | | | | | | |
| BRCM 140118P00023000 | | Expiration: January 2014, Exercise Price: $23.00 | | | 20 | | | 10 | |
| BRCM 150117P00023000 | | Expiration: January 2015, Exercise Price: $23.00 | | | 20 | | | 2,270 | |
| | | Cisco Systems, Inc. | | | | | | | |
| CSCO 140419P00018000 | | Expiration: April 2014, Exercise Price: $18.00 | | | 8 | | | 84 | |
| CSCO 140419P00019000 | | Expiration: April 2014, Exercise Price: $19.00 | | | 10 | | | 185 | |
| CSCO 140719P00018000 | | Expiration: July 2014, Exercise Price: $18.00 | | | 29 | | | 812 | |
| CSCO 150117P00015000 | | Expiration: January 2015, Exercise Price: $15.00 | | | 20 | | | 520 | |
| CSCO 150117P00017000 | | Expiration: January 2015, Exercise Price: $17.00 | | | 4 | | | 202 | |
| CSCO 160115P00015000 | | Expiration: January 2016, Exercise Price: $15.00 | | | 10 | | | 660 | |
| | | EMC Corporation | | | | | | | |
| EMC 140419P00022000 | | Expiration: April 2014, Exercise Price: $22.00 | | | 6 | | | 183 | |
| EMC 150117P00018000 | | Expiration: January 2015, Exercise Price: $18.00 | | | 27 | | | 1,094 | |
| | | Hologic, Inc. | | | | | | | |
| HOLX 160115P00015000 | | Expiration: January 2016, Exercise Price: $15.00 | | | 11 | | | 1,210 | |
The accompanying notes are an integral part of these financial statements.
| KINETICS PORTFOLIOS TRUST — MASTER INVESTMENT PORTFOLIOS |
| The Alternative Income Portfolio |
Portfolio of Options Written — December 31, 2013 — (Continued) |
| Identifier | | | | | | Contracts* | | | Value | |
| | | | Computer and Electronic Product Manufacturing — (Continued) | | | | | | | |
| | | | International Business Machines Corporation | | | | | | | |
| IBM 140621P00150000 | | | Expiration: June 2014, Exercise Price: $150.00 | | | 2 | | $ | 225 | |
| IBM 140621P00155000 | | | Expiration: June 2014, Exercise Price: $155.00 | | | 1 | | | 154 | |
| IBM 150117P00160000 | | | Expiration: January 2015, Exercise Price: $160.00 | | | 5 | | | 2,925 | |
| IBM 160115P00130000 | | | Expiration: January 2016, Exercise Price: $130.00 | | | 1 | | | 502 | |
| IBM 160115P00140000 | | | Expiration: January 2016, Exercise Price: $140.00 | | | 2 | | | 1,345 | |
| | | | QUALCOMM Inc. | | | | | | | |
| QCOM 140419P00055000 | | | Expiration: April 2014, Exercise Price: $55.00 | | | 7 | | | 56 | |
| QCOM 150117P00045000 | | | Expiration: January 2015, Exercise Price: $45.00 | | | 10 | | | 385 | |
| QCOM 150117P00050000 | | | Expiration: January 2015, Exercise Price: $50.00 | | | 2 | | | 138 | |
| QCOM 150117P00055000 | | | Expiration: January 2015, Exercise Price: $55.00 | | | 1 | | | 120 | |
| QCOM 160115P00050000 | | | Expiration: January 2016, Exercise Price: $50.00 | | | 15 | | | 3,233 | |
| | | | Sony Corporation | | | | | | | |
| SNE 140118P00015000 | | | Expiration: January 2014, Exercise Price: $15.00 | | | 20 | | | 50 | |
| SNE 140419P00015000 | | | Expiration: April 2014, Exercise Price: $15.00 | | | 32 | | | 1,280 | |
| SNE 150117P00012000 | | | Expiration: January 2015, Exercise Price: $12.00 | | | 14 | | | 700 | |
| SNE 150117P00015000 | | | Expiration: January 2015, Exercise Price: $15.00 | | | 26 | | | 3,380 | |
| | | | St. Jude Medical, Inc. | | | | | | | |
| STJ 150117P00023000 | | | Expiration: January 2015, Exercise Price: $23.00 | | | 20 | | | 250 | |
| STJ 150117P00030000 | | | Expiration: January 2015, Exercise Price: $30.00 | | | 10 | | | 300 | |
| STJ 150117P00040000 | | | Expiration: January 2015, Exercise Price: $40.00 | | | 2 | | | 170 | |
| STJ 160115P00040000 | | | Expiration: January 2016, Exercise Price: $40.00 | | | 20 | | | 4,400 | |
| | | | Texas Instruments Inc. | | | | | | | |
| TXN 140419P00029000 | | | Expiration: April 2014, Exercise Price: $29.00 | | | 18 | | | 90 | |
| TXN 150117P00027000 | | | Expiration: January 2015, Exercise Price: $27.00 | | | 5 | | | 175 | |
| TXN 150117P00030000 | | | Expiration: January 2015, Exercise Price: $30.00 | | | 9 | | | 504 | |
| TXN 160115P00030000 | | | Expiration: January 2016, Exercise Price: $30.00 | | | 2 | | | 298 | |
| | | | Thermo Fisher Scientific, Inc. | | | | | | | |
| TMO 140621P00075000 | | | Expiration: June 2014, Exercise Price: $75.00 | | | 8 | | | 360 | |
| TMO 150117P00075000 | | | Expiration: January 2015, Exercise Price: $75.00 | | | 1 | | | 155 | |
| TMO 160115P00080000 | | | Expiration: January 2016, Exercise Price: $80.00 | | | 4 | | | 1,840 | |
| | | | | | | | | | 39,684 | |
The accompanying notes are an integral part of these financial statements.
| KINETICS PORTFOLIOS TRUST — MASTER INVESTMENT PORTFOLIOS |
| The Alternative Income Portfolio |
Portfolio of Options Written — December 31, 2013 — (Continued) |
| Identifier | | | | | | Contracts* | | | Value | |
| | | | Construction of Buildings | | | | | | | |
| | | | Lennar Corporation — Class A | | | | | | | |
| LEN 140118P00027000 | | | Expiration: January 2014, Exercise Price: $27.00 | | | 20 | | $ | 20 | |
| LEN 140118P00030000 | | | Expiration: January 2014, Exercise Price: $30.00 | | | 5 | | | 10 | |
| LEN 140517P00024000 | | | Expiration: May 2014, Exercise Price: $24.00 | | | 3 | | | 36 | |
| LEN 140517P00025000 | | | Expiration: May 2014, Exercise Price: $25.00 | | | 4 | | | 58 | |
| LEN 140517P00027000 | | | Expiration: May 2014, Exercise Price: $27.00 | | | 3 | | | 72 | |
| LEN 150117P00023000 | | | Expiration: January 2015, Exercise Price: $23.00 | | | 8 | | | 416 | |
| LEN 150117P00028000 | | | Expiration: January 2015, Exercise Price: $28.00 | | | 20 | | | 2,660 | |
| LEN 160115P00025000 | | | Expiration: January 2016, Exercise Price: $25.00 | | | 15 | | | 2,768 | |
| | | | | | | | | | 6,040 | |
| | | | Consumer Staples | | | | | | | |
| | | | The Procter & Gamble Company | | | | | | | |
| PG 140118P00070000 | | | Expiration: January 2014, Exercise Price: $70.00 | | | 10 | | | 60 | |
| PG 150117P00065000 | | | Expiration: January 2015, Exercise Price: $65.00 | | | 8 | | | 1,240 | |
| | | | | | | | | | 1,300 | |
| | | | Couriers and Messengers | | | | | | | |
| | | | FedEx Corp. | | | | | | | |
| FDX 140419P00080000 | | | Expiration: April 2014, Exercise Price: $80.00 | | | 1 | | | 4 | |
| FDX 140419P00085000 | | | Expiration: April 2014, Exercise Price: $85.00 | | | 1 | | | 6 | |
| FDX 150117P00082500 | | | Expiration: January 2015, Exercise Price: $82.50 | | | 7 | | | 560 | |
| FDX 150117P00100000 | | | Expiration: January 2015, Exercise Price: $100.00 | | | 2 | | | 396 | |
| FDX 160115P00090000 | | | Expiration: January 2016, Exercise Price: $90.00 | | | 5 | | | 1,625 | |
| FDX 160115P00095000 | | | Expiration: January 2016, Exercise Price: $95.00 | | | 4 | | | 1,670 | |
| | | | | | | | | | 4,261 | |
| | | | Credit Intermediation and Related Activities | | | | | | | |
| | | | American Express Company | | | | | | | |
| AXP 140419P00060000 | | | Expiration: April 2014, Exercise Price: $60.00 | | | 2 | | | 19 | |
| AXP 150117P00050000 | | | Expiration: January 2015, Exercise Price: $50.00 | | | 3 | | | 118 | |
| AXP 150117P00055000 | | | Expiration: January 2015, Exercise Price: $55.00 | | | 17 | | | 986 | |
| AXP 150117P00065000 | | | Expiration: January 2015, Exercise Price: $65.00 | | | 1 | | | 128 | |
| AXP 160115P00060000 | | | Expiration: January 2016, Exercise Price: $60.00 | | | 1 | | | 239 | |
| | | | Bank of America Corporation | | | | | | | |
| BAC 140517P00012000 | | | Expiration: May 2014, Exercise Price: $12.00 | | | 13 | | | 110 | |
| BAC 150117P00010000 | | | Expiration: January 2015, Exercise Price: $10.00 | | | 30 | | | 585 | |
| BAC 150117P00012000 | | | Expiration: January 2015, Exercise Price: $12.00 | | | 8 | | | 356 | |
| BAC 160115P00010000 | | | Expiration: January 2016, Exercise Price: $10.00 | | | 32 | | | 1,680 | |
| BAC 160115P00012000 | | | Expiration: January 2016, Exercise Price: $12.00 | | | 8 | | | 828 | |
The accompanying notes are an integral part of these financial statements.
| KINETICS PORTFOLIOS TRUST — MASTER INVESTMENT PORTFOLIOS |
| The Alternative Income Portfolio |
Portfolio of Options Written — December 31, 2013 — (Continued) |
| Identifier | | | | | Contracts* | | | Value | |
| | | Credit Intermediation and Related Activities — (Continued) | | | | | | | |
| | | The Bank of New York Mellon Corporation | | | | | | | |
| BK 150117P00018000 | | Expiration: January 2015, Exercise Price: $18.00 | | | 25 | | $ | 500 | |
| BK 150117P00020000 | | Expiration: January 2015, Exercise Price: $20.00 | | | 10 | | | 280 | |
| BK 160115P00025000 | | Expiration: January 2016, Exercise Price: $25.00 | | | 16 | | | 2,440 | |
| | | Capital One Financial Corporation | | | | | | | |
| COF 140322P00050000 | | Expiration: March 2014, Exercise Price: $50.00 | | | 10 | | | 35 | |
| COF 140621P00055000 | | Expiration: June 2014, Exercise Price: $55.00 | | | 1 | | | 33 | |
| COF 150117P00035000 | | Expiration: January 2015, Exercise Price: $35.00 | | | 15 | | | 360 | |
| | | Citigroup Inc. | | | | | | | |
| C 140322P00037000 | | Expiration: March 2014, Exercise Price: $37.00 | | | 15 | | | 90 | |
| C 140621P00035000 | | Expiration: June 2014, Exercise Price: $35.00 | | | 2 | | | 36 | |
| C 140621P00037000 | | Expiration: June 2014, Exercise Price: $37.00 | | | 2 | | | 45 | |
| C 140621P00040000 | | Expiration: June 2014, Exercise Price: $40.00 | | | 10 | | | 400 | |
| C 150117P00037000 | | Expiration: January 2015, Exercise Price: $37.00 | | | 2 | | | 192 | |
| | | Ocwen Financial Corporation | | | | | | | |
| OCN 160115P00040000 | | Expiration: January 2016, Exercise Price: $40.00 | | | 14 | | | 7,141 | |
| | | U.S. Bancorp | | | | | | | |
| USB 140118P00027000 | | Expiration: January 2014, Exercise Price: $27.00 | | | 40 | | | 40 | |
| USB 160115P00030000 | | Expiration: January 2016, Exercise Price: $30.00 | | | 4 | | | 512 | |
| | | Wells Fargo & Company | | | | | | | |
| WFC 150117P00035000 | | Expiration: January 2015, Exercise Price: $35.00 | | | 19 | | | 1,644 | |
| | | | | | | | | 18,797 | |
| | | Data Processor | | | | | | | |
| | | MasterCard, Inc. — Class A | | | | | | | |
| MA 150117P00390000 | | Expiration: January 2015, Exercise Price: $390.00 | | | 1 | | | 244 | |
| MA 150117P00400000 | | Expiration: January 2015, Exercise Price: $400.00 | | | 2 | | | 548 | |
| MA 160115P00550000 | | Expiration: January 2016, Exercise Price: $550.00 | | | 1 | | | 2,885 | |
| | | Visa, Inc. — Class A | | | | | | | |
| V 140621P00155000 | | Expiration: June 2014, Exercise Price: $155.00 | | | 1 | | | 84 | |
| V 150117P00135000 | | Expiration: January 2015, Exercise Price: $135.00 | | | 5 | | | 865 | |
| V 150117P00140000 | | Expiration: January 2015, Exercise Price: $140.00 | | | 2 | | | 411 | |
| V 150117P00145000 | | Expiration: January 2015, Exercise Price: $145.00 | | | 4 | | | 978 | |
| | | | | | | | | 6,015 | |
| | | Diversified Financial Services | | | | | | | |
| | | JPMorgan Chase & Co. | | | | | | | |
| JPM 140322P00045000 | | Expiration: March 2014, Exercise Price: $45.00 | | | 5 | | | 55 | |
| JPM 150117P00030000 | | Expiration: January 2015, Exercise Price: $30.00 | | | 11 | | | 308 | |
| | | | | | | | | 363 | |
The accompanying notes are an integral part of these financial statements.
| KINETICS PORTFOLIOS TRUST — MASTER INVESTMENT PORTFOLIOS |
| The Alternative Income Portfolio |
Portfolio of Options Written — December 31, 2013 — (Continued) |
| Identifier | | | | | Contracts* | | | Value | |
| | | E-Commerce | | | | | | | |
| | | Amazon.com, Inc. | | | | | | | |
| AMZN 140419P00215000 | | Expiration: April 2014, Exercise Price: $215.00 | | | 1 | | $ | 45 | |
| AMZN 150117P00255000 | | Expiration: January 2015, Exercise Price: $255.00 | | | 1 | | | 733 | |
| AMZN 150117P00270000 | | Expiration: January 2015, Exercise Price: $270.00 | | | 4 | | | 3,720 | |
| | | eBay, Inc. | | | | | | | |
| EBAY 140419P00040000 | | Expiration: April 2014, Exercise Price: $40.00 | | | 6 | | | 93 | |
| EBAY 140419P00045000 | | Expiration: April 2014, Exercise Price: $45.00 | | | 2 | | | 97 | |
| EBAY 150117P00033000 | | Expiration: January 2015, Exercise Price: $33.00 | | | 15 | | | 623 | |
| EBAY 150117P00038000 | | Expiration: January 2015, Exercise Price: $38.00 | | | 6 | | | 534 | |
| EBAY 150117P00040000 | | Expiration: January 2015, Exercise Price: $40.00 | | | 7 | | | 822 | |
| EBAY 160115P00035000 | | Expiration: January 2016, Exercise Price: $35.00 | | | 1 | | | 188 | |
| | | IAC/InterActiveCorp | | | | | | | |
| IACI 140419P00035000 | | Expiration: April 2014, Exercise Price: $35.00 | | | 5 | | | 63 | |
| IACI 140419P00040000 | | Expiration: April 2014, Exercise Price: $40.00 | | | 19 | | | 237 | |
| IACI 150117P00030000 | | Expiration: January 2015, Exercise Price: $30.00 | | | 10 | | | 275 | |
| IACI 150117P00040000 | | Expiration: January 2015, Exercise Price: $40.00 | | | 11 | | | 825 | |
| | | Liberty Interactive Corporation — Class A | | | | | | | |
| LINTA 140118P00020000 | | Expiration: January 2014, Exercise Price: $20.00 | | | 5 | | | 37 | |
| LINTA 150117P00017000 | | Expiration: January 2015, Exercise Price: $17.00 | | | 5 | | | 150 | |
| LINTA 150117P00020000 | | Expiration: January 2015, Exercise Price: $20.00 | | | 20 | | | 1,100 | |
| | | | | | | | | 9,542 | |
| | | Electrical Equipment, Appliance, and Component Manufacturing | | | | | | | |
| | | Corning Inc. | | | | | | | |
| GLW 150117P00008000 | | Expiration: January 2015, Exercise Price: $8.00 | | | 60 | | | 540 | |
| GLW 150117P00012000 | | Expiration: January 2015, Exercise Price: $12.00 | | | 30 | | | 1,110 | |
| | | Emerson Electric Co. | | | | | | | |
| EMR 140322P00050000 | | Expiration: March 2014, Exercise Price: $50.00 | | | 7 | | | 70 | |
| EMR 150117P00045000 | | Expiration: January 2015, Exercise Price: $45.00 | | | 10 | | | 675 | |
| | | Whirlpool Corporation | | | | | | | |
| WHR 140322P00095000 | | Expiration: March 2014, Exercise Price: $95.00 | | | 6 | | | 78 | |
| WHR 150117P00070000 | | Expiration: January 2015, Exercise Price: $70.00 | | | 5 | | | 487 | |
| | | | | | | | | 2,960 | |
| | | Fabricated Metal Product Manufacturing | | | | | | | |
| | | Danaher Corporation | | | | | | | |
| DHR 150117P00050000 | | Expiration: January 2015, Exercise Price: $50.00 | | | 12 | | | 720 | |
| DHR 150117P00052500 | | Expiration: January 2015, Exercise Price: $52.50 | | | 8 | | | 600 | |
| DHR 160115P00055000 | | Expiration: January 2016, Exercise Price: $55.00 | | | 3 | | | 720 | |
| | | | | | | | | 2,040 | |
The accompanying notes are an integral part of these financial statements.
| KINETICS PORTFOLIOS TRUST — MASTER INVESTMENT PORTFOLIOS |
| The Alternative Income Portfolio |
Portfolio of Options Written — December 31, 2013 — (Continued) |
| Identifier | | | | | Contracts* | | | Value | |
| | | Food and Beverage Stores | | | | | | | |
| | | The Kroger Co. | | | | | | | |
| KR 150117P00030000 | | Expiration: January 2015, Exercise Price: $30.00 | | | 12 | | $ | 960 | |
| KR 160115P00030000 | | Expiration: January 2016, Exercise Price: $30.00 | | | 9 | | | 1,733 | |
| | | | | | | | | 2,693 | |
| | | Food Manufacturing | | | | | | | |
| | | Archer-Daniels-Midland Company | | | | | | | |
| ADM 140322P00028000 | | Expiration: March 2014, Exercise Price: $28.00 | | | 10 | | | 60 | |
| ADM 140621P00032000 | | Expiration: June 2014, Exercise Price: $32.00 | | | 3 | | | 120 | |
| ADM 150117P00027000 | | Expiration: January 2015, Exercise Price: $27.00 | | | 23 | | | 1,196 | |
| ADM 150117P00030000 | | Expiration: January 2015, Exercise Price: $30.00 | | | 28 | | | 2,422 | |
| ADM 150117P00032000 | | Expiration: January 2015, Exercise Price: $32.00 | | | 1 | | | 119 | |
| | | Bunge Limited | | | | | | | |
| BG 140419P00065000 | | Expiration: April 2014, Exercise Price: $65.00 | | | 1 | | | 30 | |
| BG 150117P00060000 | | Expiration: January 2015, Exercise Price: $60.00 | | | 2 | | | 280 | |
| BG 150117P00065000 | | Expiration: January 2015, Exercise Price: $65.00 | | | 1 | | | 207 | |
| BG 160115P00065000 | | Expiration: January 2016, Exercise Price: $65.00 | | | 10 | | | 4,550 | |
| | | Mead Johnson Nutrition Company | | | | | | | |
| MJN 150117P00055000 | | Expiration: January 2015, Exercise Price: $55.00 | | | 4 | | | 360 | |
| MJN 150117P00060000 | | Expiration: January 2015, Exercise Price: $60.00 | | | 10 | | | 1,335 | |
| | | | | | | | | 10,679 | |
| | | Food Services and Drinking Places | | | | | | | |
| | | Starbucks Corporation | | | | | | | |
| SBUX 140419P00055000 | | Expiration: April 2014, Exercise Price: $55.00 | | | 1 | | | 12 | |
| SBUX 140419P00060000 | | Expiration: April 2014, Exercise Price: $60.00 | | | 4 | | | 100 | |
| SBUX 150117P00050000 | | Expiration: January 2015, Exercise Price: $50.00 | | | 5 | | | 382 | |
| SBUX 150117P00055000 | | Expiration: January 2015, Exercise Price: $55.00 | | | 10 | | | 1,260 | |
| SBUX 150117P00060000 | | Expiration: January 2015, Exercise Price: $60.00 | | | 2 | | | 402 | |
| SBUX 160115P00055000 | | Expiration: January 2016, Exercise Price: $55.00 | | | 3 | | | 967 | |
| SBUX 160115P00060000 | | Expiration: January 2016, Exercise Price: $60.00 | | | 1 | | | 453 | |
| | | Yum! Brands, Inc. | | | | | | | |
| YUM 150117P00045000 | | Expiration: January 2015, Exercise Price: $45.00 | | | 7 | | | 406 | |
| YUM 150117P00047500 | | Expiration: January 2015, Exercise Price: $47.50 | | | 10 | | | 735 | |
| YUM 150117P00055000 | | Expiration: January 2015, Exercise Price: $55.00 | | | 1 | | | 149 | |
| YUM 160115P00050000 | | Expiration: January 2016, Exercise Price: $50.00 | | | 4 | | | 952 | |
| YUM 160115P00055000 | | Expiration: January 2016, Exercise Price: $55.00 | | | 2 | | | 700 | |
| | | | | | | | | 6,518 | |
The accompanying notes are an integral part of these financial statements.
| KINETICS PORTFOLIOS TRUST — MASTER INVESTMENT PORTFOLIOS |
| The Alternative Income Portfolio |
Portfolio of Options Written — December 31, 2013 — (Continued) |
| Identifier | | | | | Contracts* | | | Value | |
| | | Funds, Trusts, and Other Financial Vehicles | | | | | | | |
| | | CBRE Group, Inc. — Class A | | | | | | | |
| CBG 140118P00017000 | | Expiration: January 2014, Exercise Price: $17.00 | | | 30 | | $ | 75 | |
| CBG 140322P00017000 | | Expiration: March 2014, Exercise Price: $17.00 | | | 14 | | | 105 | |
| CBG 140322P00018000 | | Expiration: March 2014, Exercise Price: $18.00 | | | 8 | | | 60 | |
| CBG 150117P00017000 | | Expiration: January 2015, Exercise Price: $17.00 | | | 45 | | | 2,138 | |
| | | Market Vectors Gold Miners ETF | | | | | | | |
| GDX 140118P00020000 | | Expiration: January 2014, Exercise Price: $20.00 | | | 20 | | | 520 | |
| GDX 150117P00015000 | | Expiration: January 2015, Exercise Price: $15.00 | | | 8 | | | 660 | |
| GDX 150117P00020000 | | Expiration: January 2015, Exercise Price: $20.00 | | | 30 | | | 8,310 | |
| GDX 160115P00015000 | | Expiration: January 2016, Exercise Price: $15.00 | | | 21 | | | 3,633 | |
| | | | | | | | | 15,501 | |
| | | Gaming | | | | | | | |
| | | Las Vegas Sands Corp. | | | | | | | |
| LVS 140322P00045000 | | Expiration: March 2014, Exercise Price: $45.00 | | | 3 | | | 9 | |
| LVS 150117P00047250 | | Expiration: January 2015, Exercise Price: $47.25 | | | 1 | | | 93 | |
| LVS 150117P00052250 | | Expiration: January 2015, Exercise Price: $52.25 | | | 9 | | | 1,327 | |
| LVS 160115P00055000 | | Expiration: January 2016, Exercise Price: $55.00 | | | 5 | | | 2,275 | |
| | | Wynn Resorts Limited | | | | | | | |
| WYNN 140621P00122000 | | Expiration: June 2014, Exercise Price: $122.00 | | | 1 | | | 44 | |
| WYNN 140621P00132000 | | Expiration: June 2014, Exercise Price: $132.00 | | | 2 | | | 150 | |
| WYNN 150117P00122000 | | Expiration: January 2015, Exercise Price: $122.00 | | | 6 | | | 1,368 | |
| WYNN 160115P00120000 | | Expiration: January 2016, Exercise Price: $120.00 | | | 1 | | | 615 | |
| | | | | | | | | 5,881 | |
| | | General Merchandise Stores | | | | | | | |
| | | Costco Wholesale Corporation | | | | | | | |
| COST 150117P00083000 | | Expiration: January 2015, Exercise Price: $83.00 | | | 1 | | | 107 | |
| COST 150117P00088000 | | Expiration: January 2015, Exercise Price: $88.00 | | | 6 | | | 867 | |
| COST 160115P00085000 | | Expiration: January 2016, Exercise Price: $85.00 | | | 3 | | | 1,050 | |
| COST 160115P00090000 | | Expiration: January 2016, Exercise Price: $90.00 | | | 6 | | | 2,655 | |
| COST 160115P00095000 | | Expiration: January 2016, Exercise Price: $95.00 | | | 1 | | | 557 | |
| | | Family Dollar Stores, Inc. | | | | | | | |
| FDO 140118P00052500 | | Expiration: January 2014, Exercise Price: $52.50 | | | 5 | | | 25 | |
| FDO 150117P00042500 | | Expiration: January 2015, Exercise Price: $42.50 | | | 11 | | | 742 | |
| | | Macy’s, Inc. | | | | | | | |
| M 160115P00030000 | | Expiration: January 2016, Exercise Price: $30.00 | | | 30 | | | 3,480 | |
| M 160115P00038000 | | Expiration: January 2016, Exercise Price: $38.00 | | | 2 | | | 533 | |
| M 160115P00040000 | | Expiration: January 2016, Exercise Price: $40.00 | | | 2 | | | 634 | |
The accompanying notes are an integral part of these financial statements.
| KINETICS PORTFOLIOS TRUST — MASTER INVESTMENT PORTFOLIOS |
| The Alternative Income Portfolio |
Portfolio of Options Written — December 31, 2013 — (Continued) |
| Identifier | | | | | Contracts* | | | Value | |
| | | General Merchandise Stores — (Continued) | | | | | | | |
| | | Sears Holdings Corporation | | | | | | | |
| SHLD 140621P00030420 | | Expiration: June 2014, Exercise Price: $30.42 | | | 3 | | $ | 558 | |
| SHLD 140621P00033000 | | Expiration: June 2014, Exercise Price: $33.00 | | | 11 | | | 2,590 | |
| SHLD 140621P00038000 | | Expiration: June 2014, Exercise Price: $38.00 | | | 4 | | | 1,480 | |
| SHLD 150117P00030000 | | Expiration: January 2015, Exercise Price: $30.00 | | | 8 | | | 2,920 | |
| | | Wal-Mart Stores, Inc. | | | | | | | |
| WMT 150117P00062500 | | Expiration: January 2015, Exercise Price: $62.50 | | | 5 | | | 518 | |
| WMT 150117P00065000 | | Expiration: January 2015, Exercise Price: $65.00 | | | 4 | | | 540 | |
| | | | | | | | | 19,256 | |
| | | Health and Personal Care Stores | | | | | | | |
| | | CVS Caremark Corporation | | | | | | | |
| CVS 150117P00045000 | | Expiration: January 2015, Exercise Price: $45.00 | | | 21 | | | 998 | |
| CVS 150117P00047000 | | Expiration: January 2015, Exercise Price: $47.00 | | | 5 | | | 290 | |
| | | Walgreen Company | | | | | | | |
| WAG 140419P00041000 | | Expiration: April 2014, Exercise Price: $41.00 | | | 1 | | | 9 | |
| WAG 150117P00033000 | | Expiration: January 2015, Exercise Price: $33.00 | | | 5 | | | 195 | |
| WAG 150117P00035000 | | Expiration: January 2015, Exercise Price: $35.00 | | | 5 | | | 232 | |
| WAG 150117P00042000 | | Expiration: January 2015, Exercise Price: $42.00 | | | 8 | | | 904 | |
| WAG 160115P00040000 | | Expiration: January 2016, Exercise Price: $40.00 | | | 8 | | | 1,672 | |
| WAG 160115P00045000 | | Expiration: January 2016, Exercise Price: $45.00 | | | 20 | | | 6,500 | |
| | | | | | | | | 10,800 | |
| | | Heavy and Civil Engineering Construction | | | | | | | |
| | | Chicago Bridge & Iron Company N.V. | | | | | | | |
| CBI 140419P00050000 | | Expiration: April 2014, Exercise Price: $50.00 | | | 13 | | | 98 | |
| CBI 150117P00045000 | | Expiration: January 2015, Exercise Price: $45.00 | | | 13 | | | 715 | |
| CBI 150117P00055000 | | Expiration: January 2015, Exercise Price: $55.00 | | | 2 | | | 285 | |
| CBI 150117P00057500 | | Expiration: January 2015, Exercise Price: $57.50 | | | 1 | | | 175 | |
| CBI 160115P00060000 | | Expiration: January 2016, Exercise Price: $60.00 | | | 1 | | | 480 | |
| | | | | | | | | 1,753 | |
| | | Holding Company | | | | | | | |
| | | Icahn Enterprises LP | | | | | | | |
| IEP 140322P00060000 | | Expiration: March 2014, Exercise Price: $60.00 | | | 17 | | | 213 | |
| IEP 140621P00080000 | | Expiration: June 2014, Exercise Price: $80.00 | | | 3 | | | 765 | |
The accompanying notes are an integral part of these financial statements.
| KINETICS PORTFOLIOS TRUST — MASTER INVESTMENT PORTFOLIOS |
| The Alternative Income Portfolio |
Portfolio of Options Written — December 31, 2013 — (Continued) |
| Identifier | | | | | Contracts* | | | Value | |
| | | Holding Company — (Continued) | | | | | | | |
| | | Leucadia National Corporation | | | | | | | |
| LUK2 140118P00020000 | | Expiration: January 2014, Exercise Price: $20.00 | | | 20 | | $ | 100 | |
| LUK 140322P00022500 | | Expiration: March 2014, Exercise Price: $22.50 | | | 5 | | | 38 | |
| LUK2 150117P00015000 | | Expiration: January 2015, Exercise Price: $15.00 | | | 33 | | | 742 | |
| LUK2 150117P00020000 | | Expiration: January 2015, Exercise Price: $20.00 | | | 42 | | | 4,305 | |
| | | | | | | | | 6,163 | |
| | | Insurance Carriers and Related Activities | | | | | | | |
| | | Aflac, Inc. | | | | | | | |
| AFL 150117P00035000 | | Expiration: January 2015, Exercise Price: $35.00 | | | 15 | | | 368 | |
| AFL 150117P00038000 | | Expiration: January 2015, Exercise Price: $38.00 | | | 10 | | | 320 | |
| AFL 150117P00050000 | | Expiration: January 2015, Exercise Price: $50.00 | | | 2 | | | 227 | |
| AFL 160115P00050000 | | Expiration: January 2016, Exercise Price: $50.00 | | | 2 | | | 575 | |
| | | American International Group, Inc. | | | | | | | |
| AIG 150117P00035000 | | Expiration: January 2015, Exercise Price: $35.00 | | | 28 | | | 2,506 | |
| AIG 160115P00035000 | | Expiration: January 2016, Exercise Price: $35.00 | | | 6 | | | 1,347 | |
| AIG 160115P00038000 | | Expiration: January 2016, Exercise Price: $38.00 | | | 2 | | | 586 | |
| | | MetLife, Inc. | | | | | | | |
| MET 140118P00035000 | | Expiration: January 2014, Exercise Price: $35.00 | | | 10 | | | 15 | |
| MET 140621P00036000 | | Expiration: June 2014, Exercise Price: $36.00 | | | 2 | | | 52 | |
| MET 150117P00035000 | | Expiration: January 2015, Exercise Price: $35.00 | | | 10 | | | 740 | |
| MET 150117P00037000 | | Expiration: January 2015, Exercise Price: $37.00 | | | 2 | | | 194 | |
| MET 160115P00038000 | | Expiration: January 2016, Exercise Price: $38.00 | | | 13 | | | 3,601 | |
| | | Prudential Financial, Inc. | | | | | | | |
| PRU 160115P00065000 | | Expiration: January 2016, Exercise Price: $65.00 | | | 1 | | | 490 | |
| | | UnitedHealth Group Inc. | | | | | | | |
| UNH 140322P00055000 | | Expiration: March 2014, Exercise Price: $55.00 | | | 14 | | | 161 | |
| UNH 140621P00055000 | | Expiration: June 2014, Exercise Price: $55.00 | | | 1 | | | 41 | |
| UNH 150117P00035000 | | Expiration: January 2015, Exercise Price: $35.00 | | | 15 | | | 397 | |
| UNH 150117P00052500 | | Expiration: January 2015, Exercise Price: $52.50 | | | 7 | | | 861 | |
| | | WellPoint, Inc. | | | | | | | |
| WLP 140322P00065000 | | Expiration: March 2014, Exercise Price: $65.00 | | | 9 | | | 176 | |
| WLP 140621P00065000 | | Expiration: June 2014, Exercise Price: $65.00 | | | 1 | | | 64 | |
| WLP 150117P00047500 | | Expiration: January 2015, Exercise Price: $47.50 | | | 15 | | | 720 | |
| WLP 150117P00062500 | | Expiration: January 2015, Exercise Price: $62.50 | | | 5 | | | 752 | |
| | | | | | | | | 14,193 | |
The accompanying notes are an integral part of these financial statements.
| KINETICS PORTFOLIOS TRUST — MASTER INVESTMENT PORTFOLIOS |
| The Alternative Income Portfolio |
Portfolio of Options Written — December 31, 2013 — (Continued) |
| Identifier | | | | | Contracts* | | | Value | |
| | | Leather and Allied Product Manufacturing | | | | | | | |
| | | Coach, Inc. | | | | | | | |
| COH 140222P00045000 | | Expiration: February 2014, Exercise Price: $45.00 | | | 5 | | $ | 88 | |
| COH 150117P00040000 | | Expiration: January 2015, Exercise Price: $40.00 | | | 9 | | | 1,147 | |
| COH 160115P00040000 | | Expiration: January 2016, Exercise Price: $40.00 | | | 14 | | | 3,990 | |
| | | NIKE, Inc. — Class B | | | | | | | |
| NKE 140419P00055000 | | Expiration: April 2014, Exercise Price: $55.00 | | | 10 | | | 125 | |
| NKE 150117P00050000 | | Expiration: January 2015, Exercise Price: $50.00 | | | 2 | | | 141 | |
| NKE 160115P00055000 | | Expiration: January 2016, Exercise Price: $55.00 | | | 3 | | | 1,042 | |
| NKE 160115P00060000 | | Expiration: January 2016, Exercise Price: $60.00 | | | 1 | | | 475 | |
| | | | | | | | | 7,008 | |
| | | Machinery Manufacturing | | | | | | | |
| | | Cameron International Corporation | | | | | | | |
| CAM 150117P00040000 | | Expiration: January 2015, Exercise Price: $40.00 | | | 15 | | | 1,838 | |
| | | Caterpillar Inc. | | | | | | | |
| CAT 140222P00065000 | | Expiration: February 2014, Exercise Price: $65.00 | | | 8 | | | 44 | |
| CAT 150117P00055000 | | Expiration: January 2015, Exercise Price: $55.00 | | | 10 | | | 640 | |
| CAT 150117P00060000 | | Expiration: January 2015, Exercise Price: $60.00 | | | 2 | | | 189 | |
| CAT 150117P00065000 | | Expiration: January 2015, Exercise Price: $65.00 | | | 3 | | | 435 | |
| CAT 160115P00060000 | | Expiration: January 2016, Exercise Price: $60.00 | | | 1 | | | 271 | |
| CAT 160115P00065000 | | Expiration: January 2016, Exercise Price: $65.00 | | | 8 | | | 2,980 | |
| | | Cummins Inc. | | | | | | | |
| CMI 140322P00090000 | | Expiration: March 2014, Exercise Price: $90.00 | | | 8 | | | 80 | |
| CMI 140621P00100000 | | Expiration: June 2014, Exercise Price: $100.00 | | | 1 | | | 70 | |
| CMI 150117P00075000 | | Expiration: January 2015, Exercise Price: $75.00 | | | 8 | | | 660 | |
| CMI 150117P00097500 | | Expiration: January 2015, Exercise Price: $97.50 | | | 2 | | | 530 | |
| CMI 160115P00095000 | | Expiration: January 2016, Exercise Price: $95.00 | | | 1 | | | 620 | |
| | | Deere & Company | | | | | | | |
| DE 140621P00065000 | | Expiration: June 2014, Exercise Price: $65.00 | | | 1 | | | 22 | |
| DE 150117P00055000 | | Expiration: January 2015, Exercise Price: $55.00 | | | 10 | | | 470 | |
| DE 150117P00060000 | | Expiration: January 2015, Exercise Price: $60.00 | | | 2 | | | 144 | |
| DE 150117P00065000 | | Expiration: January 2015, Exercise Price: $65.00 | | | 1 | | | 111 | |
| DE 160115P00060000 | | Expiration: January 2016, Exercise Price: $60.00 | | | 4 | | | 860 | |
| | | Eaton Corporation plc | | | | | | | |
| ETN 150117P00038000 | | Expiration: January 2015, Exercise Price: $38.00 | | | 20 | | | 950 | |
| ETN 160115P00050000 | | Expiration: January 2016, Exercise Price: $50.00 | | | 8 | | | 2,220 | |
The accompanying notes are an integral part of these financial statements.
| KINETICS PORTFOLIOS TRUST — MASTER INVESTMENT PORTFOLIOS |
| The Alternative Income Portfolio |
Portfolio of Options Written — December 31, 2013 — (Continued) |
| Identifier | | | | | Contracts* | | | Value | |
| | | Machinery Manufacturing — (Continued) | | | | | | | |
| | | General Electric Company | | | | | | | |
| GE 150117P00018000 | | Expiration: January 2015, Exercise Price: $18.00 | | | 50 | | $ | 1,125 | |
| GE 160115P00020000 | | Expiration: January 2016, Exercise Price: $20.00 | | | 5 | | | 515 | |
| | | Ingersoll-Rand plc | | | | | | | |
| IR1 150117P00045000 | | Expiration: January 2015, Exercise Price: $45.00 | | | 4 | | | 190 | |
| | | National Oilwell Varco, Inc. | | | | | | | |
| NOV 140222P00050000 | | Expiration: February 2014, Exercise Price: $50.00 | | | 10 | | | 50 | |
| NOV 140222P00055000 | | Expiration: February 2014, Exercise Price: $55.00 | | | 6 | | | 51 | |
| NOV 150117P00047500 | | Expiration: January 2015, Exercise Price: $47.50 | | | 5 | | | 285 | |
| NOV 150117P00050000 | | Expiration: January 2015, Exercise Price: $50.00 | | | 5 | | | 357 | |
| NOV 150117P00057500 | | Expiration: January 2015, Exercise Price: $57.50 | | | 4 | | | 572 | |
| NOV 160115P00060000 | | Expiration: January 2016, Exercise Price: $60.00 | | | 1 | | | 428 | |
| | | | | | | | | 16,707 | |
| | | Management of Companies and Enterprises | | | | | | | |
| | | The Goldman Sachs Group, Inc. | | | | | | | |
| GS 140419P00110000 | | Expiration: April 2014, Exercise Price: $110.00 | | | 1 | | | 13 | |
| GS 140419P00115000 | | Expiration: April 2014, Exercise Price: $115.00 | | | 2 | | | 35 | |
| GS 150117P00085000 | | Expiration: January 2015, Exercise Price: $85.00 | | | 5 | | | 355 | |
| GS 150117P00115000 | | Expiration: January 2015, Exercise Price: $115.00 | | | 2 | | | 423 | |
| GS 150117P00120000 | | Expiration: January 2015, Exercise Price: $120.00 | | | 2 | | | 488 | |
| GS 150117P00125000 | | Expiration: January 2015, Exercise Price: $125.00 | | | 1 | | | 290 | |
| | | | | | | | | 1,604 | |
| | | Media | | | | | | | |
| | | Time Warner Inc. | | | | | | | |
| TWX 140118P00045000 | | Expiration: January 2014, Exercise Price: $45.00 | | | 15 | | | 22 | |
| TWX 140419P00045000 | | Expiration: April 2014, Exercise Price: $45.00 | | | 14 | | | 112 | |
| | | Viacom Inc. — Class B | | | | | | | |
| VIAB 140322P00060000 | | Expiration: March 2014, Exercise Price: $60.00 | | | 5 | | | 50 | |
| VIAB 150117P00038000 | | Expiration: January 2015, Exercise Price: $38.00 | | | 15 | | | 337 | |
| VIAB 150117P00060000 | | Expiration: January 2015, Exercise Price: $60.00 | | | 3 | | | 420 | |
| VIAB 150117P00062500 | | Expiration: January 2015, Exercise Price: $62.50 | | | 1 | | | 170 | |
| | | | | | | | | 1,111 | |
| | | Merchant Wholesalers, Nondurable Goods | | | | | | | |
| | | Cardinal Health, Inc. | | | | | | | |
| CAH 150117P00040000 | | Expiration: January 2015, Exercise Price: $40.00 | | | 18 | | | 765 | |
| CAH 150117P00045000 | | Expiration: January 2015, Exercise Price: $45.00 | | | 5 | | | 400 | |
| CAH 160115P00050000 | | Expiration: January 2016, Exercise Price: $50.00 | | | 2 | | | 650 | |
The accompanying notes are an integral part of these financial statements.
| KINETICS PORTFOLIOS TRUST — MASTER INVESTMENT PORTFOLIOS |
| The Alternative Income Portfolio |
Portfolio of Options Written — December 31, 2013 — (Continued) |
| Identifier | | | | | Contracts* | | | Value | |
| | | Merchant Wholesalers, Nondurable Goods — (Continued) | | | | | | | |
| | | Express Scripts Holding Company | | | | | | | |
| ESRX 140517P00045000 | | Expiration: May 2014, Exercise Price: $45.00 | | | 1 | | $ | 10 | |
| ESRX 150117P00040000 | | Expiration: January 2015, Exercise Price: $40.00 | | | 12 | | | 534 | |
| ESRX 150117P00047500 | | Expiration: January 2015, Exercise Price: $47.50 | | | 10 | | | 970 | |
| ESRX 160115P00047500 | | Expiration: January 2016, Exercise Price: $47.50 | | | 2 | | | 512 | |
| ESRX 160115P00050000 | | Expiration: January 2016, Exercise Price: $50.00 | | | 2 | | | 604 | |
| | | McKesson Corp. | | | | | | | |
| MCK 140222P00090000 | | Expiration: February 2014, Exercise Price: $90.00 | | | 2 | | | 10 | |
| MCK 140517P00100000 | | Expiration: May 2014, Exercise Price: $100.00 | | | 3 | | | 82 | |
| MCK 150117P00085000 | | Expiration: January 2015, Exercise Price: $85.00 | | | 5 | | | 413 | |
| MCK 150117P00100000 | | Expiration: January 2015, Exercise Price: $100.00 | | | 1 | | | 165 | |
| MCK 150117P00125000 | | Expiration: January 2015, Exercise Price: $125.00 | | | 1 | | | 485 | |
| MCK 160115P00120000 | | Expiration: January 2016, Exercise Price: $120.00 | | | 5 | | | 4,425 | |
| | | Ralph Lauren Corporation | | | | | | | |
| RL 140118P00140000 | | Expiration: January 2014, Exercise Price: $140.00 | | | 5 | | | 50 | |
| RL 150117P00105000 | | Expiration: January 2015, Exercise Price: $105.00 | | | 5 | | | 675 | |
| RL 160115P00125000 | | Expiration: January 2016, Exercise Price: $125.00 | | | 1 | | | 795 | |
| RL 160115P00130000 | | Expiration: January 2016, Exercise Price: $130.00 | | | 1 | | | 880 | |
| | | | | | | | | 12,425 | |
| | | Mining (except Oil and Gas) | | | | | | | |
| | | BHP Billiton Limited - ADR | | | | | | | |
| BHP 140118P00050000 | | Expiration: January 2014, Exercise Price: $50.00 | | | 10 | | | 30 | |
| BHP 150117P00047500 | | Expiration: January 2015, Exercise Price: $47.50 | | | 10 | | | 1,345 | |
| BHP 150117P00055000 | | Expiration: January 2015, Exercise Price: $55.00 | | | 1 | | | 262 | |
| | | Freeport-McMoRan Copper & Gold Inc. | | | | | | | |
| FCX 140222P00023000 | | Expiration: February 2014, Exercise Price: $23.00 | | | 19 | | | 76 | |
| FCX 150117P00019000 | | Expiration: January 2015, Exercise Price: $19.00 | | | 10 | | | 220 | |
| FCX 150117P00022000 | | Expiration: January 2015, Exercise Price: $22.00 | | | 15 | | | 600 | |
| FCX 150117P00024000 | | Expiration: January 2015, Exercise Price: $24.00 | | | 14 | | | 826 | |
| FCX 150117P00027000 | | Expiration: January 2015, Exercise Price: $27.00 | | | 2 | | | 200 | |
| FCX 160115P00025000 | | Expiration: January 2016, Exercise Price: $25.00 | | | 17 | | | 2,966 | |
| | | Rio Tinto plc - ADR | | | | | | | |
| RIO 150117P00037500 | | Expiration: January 2015, Exercise Price: $37.50 | | | 15 | | | 1,800 | |
| | | | | | | | | 8,325 | |
| | | Miscellaneous Manufacturing | | | | | | | |
| | | 3M Co. | | | | | | | |
| MMM 150117P00105000 | | Expiration: January 2015, Exercise Price: $105.00 | | | 1 | | | 191 | |
| MMM 160115P00095000 | | Expiration: January 2016, Exercise Price: $95.00 | | | 3 | | | 975 | |
| MMM 160115P00110000 | | Expiration: January 2016, Exercise Price: $110.00 | | | 1 | | | 602 | |
The accompanying notes are an integral part of these financial statements.
| KINETICS PORTFOLIOS TRUST — MASTER INVESTMENT PORTFOLIOS |
| The Alternative Income Portfolio |
Portfolio of Options Written — December 31, 2013 — (Continued) |
| Identifier | | | | | Contracts* | | | Value | |
| | | Miscellaneous Manufacturing — (Continued) | | | | | | | |
| | | Baxter International Inc. | | | | | | | |
| BAX 140118P00055000 | | Expiration: January 2014, Exercise Price: $55.00 | | | 20 | | $ | 30 | |
| BAX 150117P00052500 | | Expiration: January 2015, Exercise Price: $52.50 | | | 5 | | | 548 | |
| | | Hasbro, Inc. | | | | | | | |
| HAS 140419P00035000 | | Expiration: April 2014, Exercise Price: $35.00 | | | 22 | | | 165 | |
| HAS 160115P00037500 | | Expiration: January 2016, Exercise Price: $37.50 | | | 2 | | | 440 | |
| | | International Game Technology | | | | | | | |
| IGT 140419P00014000 | | Expiration: April 2014, Exercise Price: $14.00 | | | 15 | | | 337 | |
| IGT 150117P00010000 | | Expiration: January 2015, Exercise Price: $10.00 | | | 45 | | | 1,350 | |
| IGT 150117P00012000 | | Expiration: January 2015, Exercise Price: $12.00 | | | 57 | | | 3,420 | |
| | | Stryker Corporation | | | | | | | |
| SYK 150117P00055000 | | Expiration: January 2015, Exercise Price: $55.00 | | | 12 | | | 1,380 | |
| SYK 160115P00055000 | | Expiration: January 2016, Exercise Price: $55.00 | | | 1 | | | 258 | |
| | | | | | | | | 9,696 | |
| | | Motion Picture and Sound Recording Industries | | | | | | | |
| | | DreamWorks Animation SKG, Inc. — Class A | | | | | | | |
| DWA 140322P00017500 | | Expiration: March 2014, Exercise Price: $17.50 | | | 50 | | | 375 | |
| DWA 140322P00020000 | | Expiration: March 2014, Exercise Price: $20.00 | | | 38 | | | 285 | |
| | | | | | | | | 660 | |
| | | Motor Vehicle and Parts Dealers | | | | | | | |
| | | AutoNation, Inc. | | | | | | | |
| AN 140419P00036000 | | Expiration: April 2014, Exercise Price: $36.00 | | | 2 | | | 30 | |
| AN 140419P00040000 | | Expiration: April 2014, Exercise Price: $40.00 | | | 8 | | | 280 | |
| AN 140419P00041000 | | Expiration: April 2014, Exercise Price: $41.00 | | | 14 | | | 630 | |
| | | CarMax, Inc. | | | | | | | |
| KMX 150117P00035000 | | Expiration: January 2015, Exercise Price: $35.00 | | | 10 | | | 1,350 | |
| KMX 160115P00035000 | | Expiration: January 2016, Exercise Price: $35.00 | | | 27 | | | 7,628 | |
| | | | | | | | | 9,918 | |
| | | Non-Store Retailers | | | | | | | |
| | | Sotheby’s | | | | | | | |
| BID 140419P00035000 | | Expiration: April 2014, Exercise Price: $35.00 | | | 19 | | | 475 | |
| BID 150117P00037000 | | Expiration: January 2015, Exercise Price: $37.00 | | | 10 | | | 2,350 | |
| | | | | | | | | 2,825 | |
| | | Oil and Gas Extraction | | | | | | | |
| | | Anadarko Petroleum Corporation | | | | | | | |
| APC 150117P00067500 | | Expiration: January 2015, Exercise Price: $67.50 | | | 9 | | | 3,870 | |
| APC 160115P00055000 | | Expiration: January 2016, Exercise Price: $55.00 | | | 1 | | | 326 | |
The accompanying notes are an integral part of these financial statements.
| KINETICS PORTFOLIOS TRUST — MASTER INVESTMENT PORTFOLIOS |
| The Alternative Income Portfolio |
Portfolio of Options Written — December 31, 2013 — (Continued) |
| Identifier | | | | | Contracts* | | | Value | |
| | | Oil and Gas Extraction — (Continued) | | | | | | | |
| | | Apache Corporation | | | | | | | |
| APA 140419P00067500 | | Expiration: April 2014, Exercise Price: $67.50 | | | 6 | | $ | 219 | |
| APA 150117P00055000 | | Expiration: January 2015, Exercise Price: $55.00 | | | 10 | | | 850 | |
| | | Canadian Natural Resources Ltd. | | | | | | | |
| CNQ 150117P00018000 | | Expiration: January 2015, Exercise Price: $18.00 | | | 25 | | | 500 | |
| CNQ 150117P00020000 | | Expiration: January 2015, Exercise Price: $20.00 | | | 15 | | | 450 | |
| CNQ 150117P00023000 | | Expiration: January 2015, Exercise Price: $23.00 | | | 10 | | | 575 | |
| | | Chesapeake Energy Corporation | | | | | | | |
| CHK 150117P00018000 | | Expiration: January 2015, Exercise Price: $18.00 | | | 30 | | | 1,770 | |
| CHK 160115P00020000 | | Expiration: January 2016, Exercise Price: $20.00 | | | 52 | | | 9,594 | |
| | | Continental Resources, Inc. | | | | | | | |
| CLR 150117P00075000 | | Expiration: January 2015, Exercise Price: $75.00 | | | 12 | | | 3,900 | |
| CLR 150117P00080000 | | Expiration: January 2015, Exercise Price: $80.00 | | | 7 | | | 3,045 | |
| | | Encana Corporation | | | | | | | |
| ECA 140118P00015000 | | Expiration: January 2014, Exercise Price: $15.00 | | | 15 | | | 38 | |
| ECA 150117P00013000 | | Expiration: January 2015, Exercise Price: $13.00 | | | 25 | | | 875 | |
| ECA 150117P00015000 | | Expiration: January 2015, Exercise Price: $15.00 | | | 15 | | | 1,125 | |
| | | EOG Resources, Inc. | | | | | | | |
| EOG 140419P00120000 | | Expiration: April 2014, Exercise Price: $120.00 | | | 2 | | | 86 | |
| EOG 160115P00135000 | | Expiration: January 2016, Exercise Price: $135.00 | | | 5 | | | 7,000 | |
| | | Marathon Oil Corporation | | | | | | | |
| MRO 150117P00020000 | | Expiration: January 2015, Exercise Price: $20.00 | | | 25 | | | 650 | |
| | | Occidental Petroleum Corporation | | | | | | | |
| OXY 150117P00055000 | | Expiration: January 2015, Exercise Price: $55.00 | | | 5 | | | 295 | |
| OXY 160115P00070000 | | Expiration: January 2016, Exercise Price: $70.00 | | | 3 | | | 1,432 | |
| | | Talisman Energy Inc. | | | | | | | |
| TLM 160115P00008000 | | Expiration: January 2016, Exercise Price: $8.00 | | | 58 | | | 3,915 | |
| | | | | | | | | 40,515 | |
| | | Other Exchanges | | | | | | | |
| | | CBOE Holdings Inc. | | | | | | | |
| CBOE 150117P00038750 | | Expiration: January 2015, Exercise Price: $38.75 | | | 30 | | | 3,825 | |
| CBOE 160115P00034500 | | Expiration: January 2016, Exercise Price: $34.50 | | | 4 | | | 710 | |
| | | | | | | | | 4,535 | |
| | | Other Information Services | | | | | | | |
| | | Google Inc. — Class A | | | | | | | |
| GOOG 150117P00660000 | | Expiration: January 2015, Exercise Price: $660.00 | | | 1 | | | 425 | |
| GOOG 160115P00830000 | | Expiration: January 2016, Exercise Price: $830.00 | | | 1 | | | 4,155 | |
| | | | | | | | | 4,580 | |
The accompanying notes are an integral part of these financial statements.
| KINETICS PORTFOLIOS TRUST — MASTER INVESTMENT PORTFOLIOS |
| The Alternative Income Portfolio |
Portfolio of Options Written — December 31, 2013 — (Continued) |
| Identifier | | | | | Contracts* | | | Value | |
| | | Paper Manufacturing | | | | | | | |
| | | Kimberly-Clark Corporation | | | | | | | |
| KMB 150117P00082500 | | Expiration: January 2015, Exercise Price: $82.50 | | | 8 | | $ | 1,560 | |
| | | Performing Arts, Spectator Sports, and Related Industries | | | | | | | |
| | | Live Nation Entertainment, Inc. | | | | | | | |
| LYV 150117P00012000 | | Expiration: January 2015, Exercise Price: $12.00 | | | 79 | | | 3,358 | |
| LYV 160115P00013000 | | Expiration: January 2016, Exercise Price: $13.00 | | | 33 | | | 3,382 | |
| | | | | | | | | 6,740 | |
| | | Petroleum and Coal Products Manufacturing | | | | | | | |
| | | ConocoPhillips | | | | | | | |
| COP 150117P00042500 | | Expiration: January 2015, Exercise Price: $42.50 | | | 10 | | | 385 | |
| COP 150117P00045000 | | Expiration: January 2015, Exercise Price: $45.00 | | | 11 | | | 545 | |
| | | Hess Corporation | | | | | | | |
| HES 150117P00057500 | | Expiration: January 2015, Exercise Price: $57.50 | | | 1 | | | 141 | |
| HES 150117P00060000 | | Expiration: January 2015, Exercise Price: $60.00 | | | 2 | | | 347 | |
| HES 160115P00055000 | | Expiration: January 2016, Exercise Price: $55.00 | | | 1 | | | 305 | |
| HES 160115P00060000 | | Expiration: January 2016, Exercise Price: $60.00 | | | 3 | | | 1,245 | |
| | | Phillips 66 | | | | | | | |
| PSX 140517P00042500 | | Expiration: May 2014, Exercise Price: $42.50 | | | 1 | | | 10 | |
| PSX 150117P00035000 | | Expiration: January 2015, Exercise Price: $35.00 | | | 15 | | | 413 | |
| PSX 150117P00042000 | | Expiration: January 2015, Exercise Price: $42.00 | | | 15 | | | 937 | |
| PSX 160115P00045000 | | Expiration: January 2016, Exercise Price: $45.00 | | | 6 | | | 1,365 | |
| | | Valero Energy Corporation | | | | | | | |
| VLO 140621P00030000 | | Expiration: June 2014, Exercise Price: $30.00 | | | 3 | | | 54 | |
| VLO 160115P00035000 | | Expiration: January 2016, Exercise Price: $35.00 | | | 2 | | | 640 | |
| | | | | | | | | 6,387 | |
| | | Pharmaceutical and Biotechnology | | | | | | | |
| | | AbbVie Inc. | | | | | | | |
| ABBV 150117P00035000 | | Expiration: January 2015, Exercise Price: $35.00 | | | 12 | | | 930 | |
| ABBV 160115P00035000 | | Expiration: January 2016, Exercise Price: $35.00 | | | 20 | | | 4,200 | |
| | | Allergan, Inc. | | | | | | | |
| AGN 140419P00070000 | | Expiration: April 2014, Exercise Price: $70.00 | | | 2 | | | 20 | |
| AGN 150117P00065000 | | Expiration: January 2015, Exercise Price: $65.00 | | | 7 | | | 543 | |
| AGN 160115P00070000 | | Expiration: January 2016, Exercise Price: $70.00 | | | 5 | | | 1,325 | |
| | | Amgen Inc. | | | | | | | |
| AMGN 140419P00080000 | | Expiration: April 2014, Exercise Price: $80.00 | | | 5 | | | 147 | |
| AMGN 150117P00060000 | | Expiration: January 2015, Exercise Price: $60.00 | | | 10 | | | 770 | |
| AMGN 150117P00080000 | | Expiration: January 2015, Exercise Price: $80.00 | | | 1 | | | 231 | |
| AMGN 150117P00082500 | | Expiration: January 2015, Exercise Price: $82.50 | | | 2 | | | 533 | |
The accompanying notes are an integral part of these financial statements.
| KINETICS PORTFOLIOS TRUST — MASTER INVESTMENT PORTFOLIOS |
| The Alternative Income Portfolio |
Portfolio of Options Written — December 31, 2013 — (Continued) |
| Identifier | | | | | Contracts* | | | Value | |
| | | Pharmaceutical and Biotechnology — (Continued) | | | | | | | |
| | | Bristol-Myers Squibb Company | | | | | | | |
| BMY 140322P00031000 | | Expiration: March 2014, Exercise Price: $31.00 | | | 5 | | $ | 28 | |
| BMY 140322P00035000 | | Expiration: March 2014, Exercise Price: $35.00 | | | 10 | | | 90 | |
| BMY 140621P00040000 | | Expiration: June 2014, Exercise Price: $40.00 | | | 2 | | | 93 | |
| BMY 150117P00030000 | | Expiration: January 2015, Exercise Price: $30.00 | | | 10 | | | 460 | |
| BMY 150117P00037000 | | Expiration: January 2015, Exercise Price: $37.00 | | | 12 | | | 1,272 | |
| BMY 150117P00042000 | | Expiration: January 2015, Exercise Price: $42.00 | | | 1 | | | 193 | |
| BMY 160115P00040000 | | Expiration: January 2016, Exercise Price: $40.00 | | | 1 | | | 330 | |
| | | Eli Lilly & Company | | | | | | | |
| LLY 140419P00045000 | | Expiration: April 2014, Exercise Price: $45.00 | | | 9 | | | 373 | |
| LLY 150117P00043000 | | Expiration: January 2015, Exercise Price: $43.00 | | | 10 | | | 1,715 | |
| | | Gilead Sciences, Inc. | | | | | | | |
| GILD 140517P00040000 | | Expiration: May 2014, Exercise Price: $40.00 | | | 2 | | | 31 | |
| GILD 150117P00022500 | | Expiration: January 2015, Exercise Price: $22.50 | | | 20 | | | 520 | |
| GILD 150117P00050000 | | Expiration: January 2015, Exercise Price: $50.00 | | | 4 | | | 1,010 | |
| GILD 160115P00050000 | | Expiration: January 2016, Exercise Price: $50.00 | | | 4 | | | 1,990 | |
| | | Merck & Co., Inc. | | | | | | | |
| MRK 140118P00040000 | | Expiration: January 2014, Exercise Price: $40.00 | | | 15 | | | 45 | |
| MRK 140419P00040000 | | Expiration: April 2014, Exercise Price: $40.00 | | | 16 | | | 224 | |
| MRK 150117P00038000 | | Expiration: January 2015, Exercise Price: $38.00 | | | 6 | | | 489 | |
| MRK 160115P00035000 | | Expiration: January 2016, Exercise Price: $35.00 | | | 7 | | | 1,253 | |
| | | Pfizer, Inc. | | | | | | | |
| PFE 150117P00022000 | | Expiration: January 2015, Exercise Price: $22.00 | | | 50 | | | 2,075 | |
| PFE 160115P00023000 | | Expiration: January 2016, Exercise Price: $23.00 | | | 4 | | | 530 | |
| | | | | | | | | 21,420 | |
| | | Pipeline Transportation | | | | | | | |
| | | The Williams Companies, Inc. | | | | | | | |
| WMB 150117P00025000 | | Expiration: January 2015, Exercise Price: $25.00 | | | 40 | | | 2,080 | |
| WMB 160115P00025000 | | Expiration: January 2016, Exercise Price: $25.00 | | | 21 | | | 3,244 | |
| WMB 160115P00028000 | | Expiration: January 2016, Exercise Price: $28.00 | | | 1 | | | 240 | |
| | | | | | | | | 5,564 | |
| | | Primary Metal Manufacturing | | | | | | | |
| | | Nucor Corporation | | | | | | | |
| NUE 150117P00030000 | | Expiration: January 2015, Exercise Price: $30.00 | | | 45 | | | 1,305 | |
| | | Precision Castparts Corp. | | | | | | | |
| PCP 140621P00185000 | | Expiration: June 2014, Exercise Price: $185.00 | | | 3 | | | 322 | |
| PCP 140621P00200000 | | Expiration: June 2014, Exercise Price: $200.00 | | | 1 | | | 175 | |
| | | | | | | | | 1,802 | |
The accompanying notes are an integral part of these financial statements.
| KINETICS PORTFOLIOS TRUST — MASTER INVESTMENT PORTFOLIOS |
| The Alternative Income Portfolio |
Portfolio of Options Written — December 31, 2013 — (Continued) |
| Identifier | | | | | Contracts* | | | Value | |
| | | Professional, Scientific, and Technical Services | | | | | | | |
| | | Cerner Corporation | | | | | | | |
| CERN 140118P00037500 | | Expiration: January 2014, Exercise Price: $37.50 | | | 10 | | $ | 50 | |
| CERN 140621P00040000 | | Expiration: June 2014, Exercise Price: $40.00 | | | 2 | | | 100 | |
| CERN 140621P00045000 | | Expiration: June 2014, Exercise Price: $45.00 | | | 4 | | | 410 | |
| CERN 150117P00035000 | | Expiration: January 2015, Exercise Price: $35.00 | | | 20 | | | 1,700 | |
| CERN 150117P00037500 | | Expiration: January 2015, Exercise Price: $37.50 | | | 10 | | | 1,175 | |
| CERN 150117P00040000 | | Expiration: January 2015, Exercise Price: $40.00 | | | 2 | | | 310 | |
| CERN 160115P00040000 | | Expiration: January 2016, Exercise Price: $40.00 | | | 2 | | | 660 | |
| | | Computer Sciences Corporation | | | | | | | |
| CSC 150117P00025000 | | Expiration: January 2015, Exercise Price: $25.00 | | | 20 | | | 350 | |
| | | Fluor Corporation | | | | | | | |
| FLR 140419P00050000 | | Expiration: April 2014, Exercise Price: $50.00 | | | 4 | | | 50 | |
| FLR 150117P00040000 | | Expiration: January 2015, Exercise Price: $40.00 | | | 9 | | | 337 | |
| FLR 150117P00042500 | | Expiration: January 2015, Exercise Price: $42.50 | | | 4 | | | 210 | |
| FLR 150117P00045000 | | Expiration: January 2015, Exercise Price: $45.00 | | | 5 | | | 275 | |
| FLR 150117P00052500 | | Expiration: January 2015, Exercise Price: $52.50 | | | 4 | | | 480 | |
| FLR 160115P00050000 | | Expiration: January 2016, Exercise Price: $50.00 | | | 9 | | | 2,453 | |
| | | Foster Wheeler AG | | | | | | | |
| FWLT 150117P00015000 | | Expiration: January 2015, Exercise Price: $15.00 | | | 20 | | | 410 | |
| FWLT 150117P00022000 | | Expiration: January 2015, Exercise Price: $22.00 | | | 20 | | | 1,370 | |
| | | The Interpublic Group of Companies, Inc. | | | | | | | |
| IPG 150117P00008000 | | Expiration: January 2015, Exercise Price: $8.00 | | | 50 | | | 750 | |
| | | Leidos Holdings Inc. | | | | | | | |
| LDOS1 150117P00007000 | | Expiration: January 2015, Exercise Price: $7.00 | | | 50 | | | 625 | |
| LDOS 150117P00035000 | | Expiration: January 2015, Exercise Price: $35.00 | | | 2 | | | 340 | |
| | | | | | | | | 12,055 | |
| | | Publishing Industries (except Internet) | | | | | | | |
| | | Nuance Communications, Inc. | | | | | | | |
| NUAN 150117P00010000 | | Expiration: January 2015, Exercise Price: $10.00 | | | 84 | | | 4,620 | |
| | | Rail Transportation | | | | | | | |
| | | CSX Corporation | | | | | | | |
| CSX 150117P00015000 | | Expiration: January 2015, Exercise Price: $15.00 | | | 30 | | | 315 | |
| CSX 150117P00020000 | | Expiration: January 2015, Exercise Price: $20.00 | | | 10 | | | 420 | |
| CSX 160115P00020000 | | Expiration: January 2016, Exercise Price: $20.00 | | | 5 | | | 540 | |
| | | Norfolk Southern Corporation | | | | | | | |
| NSC 150117P00057500 | | Expiration: January 2015, Exercise Price: $57.50 | | | 4 | | | 270 | |
| NSC 160115P00060000 | | Expiration: January 2016, Exercise Price: $60.00 | | | 1 | | | 242 | |
| NSC 160115P00075000 | | Expiration: January 2016, Exercise Price: $75.00 | | | 1 | | | 580 | |
| | | | | | | | | 2,367 | |
The accompanying notes are an integral part of these financial statements.
| KINETICS PORTFOLIOS TRUST — MASTER INVESTMENT PORTFOLIOS |
| The Alternative Income Portfolio |
Portfolio of Options Written — December 31, 2013 — (Continued) |
| Identifier | | | | | Contracts* | | | Value | |
| | | Real Estate | | | | | | | |
| | | General Growth Properties, Inc. | | | | | | | |
| GGP 150117P00015000 | | Expiration: January 2015, Exercise Price: $15.00 | | | 60 | | $ | 2,790 | |
| | | Satellite Telecommunications | | | | | | | |
| | | DIRECTV | | | | | | | |
| DTV 140621P00050000 | | Expiration: June 2014, Exercise Price: $50.00 | | | 2 | | | 78 | |
| DTV 150117P00047000 | | Expiration: January 2015, Exercise Price: $47.00 | | | 8 | | | 860 | |
| DTV 160115P00050000 | | Expiration: January 2016, Exercise Price: $50.00 | | | 1 | | | 311 | |
| | | DISH Network Corp. — Class A | | | | | | | |
| DISH 140322P00034000 | | Expiration: March 2014, Exercise Price: $34.00 | | | 19 | | | 143 | |
| DISH 150117P00024000 | | Expiration: January 2015, Exercise Price: $24.00 | | | 14 | | | 245 | |
| DISH 150117P00035000 | | Expiration: January 2015, Exercise Price: $35.00 | | | 17 | | | 1,572 | |
| | | Time Warner Cable Inc. | | | | | | | |
| TWC 140419P00090000 | | Expiration: April 2014, Exercise Price: $90.00 | | | 1 | | | 18 | |
| TWC 150117P00082500 | | Expiration: January 2015, Exercise Price: $82.50 | | | 3 | | | 202 | |
| TWC 160115P00090000 | | Expiration: January 2016, Exercise Price: $90.00 | | | 1 | | | 195 | |
| | | | | | | | | 3,624 | |
| | | Securities, Commodity Contracts, and Other Financial | | | | | | | |
| | | Investments and Related Activities | | | | | | | |
| | | The Charles Schwab Corporation | | | | | | | |
| SCHW 140621P00018000 | | Expiration: June 2014, Exercise Price: $18.00 | | | 5 | | | 88 | |
| SCHW 150117P00012000 | | Expiration: January 2015, Exercise Price: $12.00 | | | 41 | | | 410 | |
| SCHW 150117P00015000 | | Expiration: January 2015, Exercise Price: $15.00 | | | 63 | | | 1,732 | |
| SCHW 150117P00017000 | | Expiration: January 2015, Exercise Price: $17.00 | | | 4 | | | 180 | |
| | | CME Group Inc. | | | | | | | |
| CME 140322P00055000 | | Expiration: March 2014, Exercise Price: $55.00 | | | 2 | | | 25 | |
| CME 140621P00055000 | | Expiration: June 2014, Exercise Price: $55.00 | | | 1 | | | 38 | |
| CME 140621P00060000 | | Expiration: June 2014, Exercise Price: $60.00 | | | 8 | | | 580 | |
| CME 150117P00042500 | | Expiration: January 2015, Exercise Price: $42.50 | | | 11 | | | 605 | |
| CME 150117P00045000 | | Expiration: January 2015, Exercise Price: $45.00 | | | 7 | | | 437 | |
| CME 150117P00052500 | | Expiration: January 2015, Exercise Price: $52.50 | | | 1 | | | 120 | |
| CME 150117P00060000 | | Expiration: January 2015, Exercise Price: $60.00 | | | 6 | | | 1,365 | |
| | | IntercontinentalExchange Group, Inc. | | | | | | | |
| ICE 140322P00135000 | | Expiration: March 2014, Exercise Price: $135.00 | | | 1 | | | 10 | |
| ICE 140322P00140000 | | Expiration: March 2014, Exercise Price: $140.00 | | | 2 | | | 25 | |
| ICE 140621P00155000 | | Expiration: June 2014, Exercise Price: $155.00 | | | 2 | | | 150 | |
| | | Morgan Stanley | | | | | | | |
| MS 140118P00018000 | | Expiration: January 2014, Exercise Price: $18.00 | | | 10 | | | 5 | |
| MS 160115P00020000 | | Expiration: January 2016, Exercise Price: $20.00 | | | 4 | | | 484 | |
| MS 160115P00023000 | | Expiration: January 2016, Exercise Price: $23.00 | | | 3 | | | 578 | |
| | | | | | | | | 6,832 | |
The accompanying notes are an integral part of these financial statements.
| KINETICS PORTFOLIOS TRUST — MASTER INVESTMENT PORTFOLIOS |
| The Alternative Income Portfolio |
Portfolio of Options Written — December 31, 2013 — (Continued) |
| Identifier | | | | | Contracts* | | | Value | |
| | | Software Publishers | | | | | | | |
| | | Citrix Systems, Inc. | | | | | | | |
| CTXS 140118P00047500 | | Expiration: January 2014, Exercise Price: $47.50 | | | 5 | | $ | 13 | |
| CTXS 150117P00045000 | | Expiration: January 2015, Exercise Price: $45.00 | | | 10 | | | 1,975 | |
| CTXS 150117P00050000 | | Expiration: January 2015, Exercise Price: $50.00 | | | 6 | | | 1,920 | |
| | | Microsoft Corporation | | | | | | | |
| MSFT 140719P00029000 | | Expiration: July 2014, Exercise Price: $29.00 | | | 3 | | | 114 | |
| MSFT 150117P00020000 | | Expiration: January 2015, Exercise Price: $20.00 | | | 10 | | | 175 | |
| MSFT 150117P00023000 | | Expiration: January 2015, Exercise Price: $23.00 | | | 5 | | | 160 | |
| MSFT 150117P00025000 | | Expiration: January 2015, Exercise Price: $25.00 | | | 20 | | | 960 | |
| MSFT 160115P00025000 | | Expiration: January 2016, Exercise Price: $25.00 | | | 4 | | | 528 | |
| MSFT 160115P00028000 | | Expiration: January 2016, Exercise Price: $28.00 | | | 7 | | | 1,449 | |
| | | Oracle Corporation | | | | | | | |
| ORCL 140118P00028000 | | Expiration: January 2014, Exercise Price: $28.00 | | | 10 | | | 10 | |
| ORCL 140621P00026000 | | Expiration: June 2014, Exercise Price: $26.00 | | | 3 | | | 34 | |
| ORCL 150117P00020000 | | Expiration: January 2015, Exercise Price: $20.00 | | | 25 | | | 363 | |
| ORCL 150117P00025000 | | Expiration: January 2015, Exercise Price: $25.00 | | | 13 | | | 500 | |
| ORCL 150117P00028000 | | Expiration: January 2015, Exercise Price: $28.00 | | | 12 | | | 828 | |
| | | | | | | | | 9,029 | |
| | | Support Activities for Mining | | | | | | | |
| | | Halliburton Company | | | | | | | |
| HAL 140419P00035000 | | Expiration: April 2014, Exercise Price: $35.00 | | | 8 | | | 84 | |
| HAL 140419P00036000 | | Expiration: April 2014, Exercise Price: $36.00 | | | 2 | | | 25 | |
| HAL 150117P00028000 | | Expiration: January 2015, Exercise Price: $28.00 | | | 5 | | | 188 | |
| HAL 160115P00038000 | | Expiration: January 2016, Exercise Price: $38.00 | | | 22 | | | 6,985 | |
| | | Helmerich & Payne, Inc. | | | | | | | |
| HP 140322P00050000 | | Expiration: March 2014, Exercise Price: $50.00 | | | 4 | | | 10 | |
| HP 150117P00042500 | | Expiration: January 2015, Exercise Price: $42.50 | | | 15 | | | 562 | |
| | | Schlumberger Limited | | | | | | | |
| SLB 150117P00067500 | | Expiration: January 2015, Exercise Price: $67.50 | | | 1 | | | 188 | |
| SLB 160115P00065000 | | Expiration: January 2016, Exercise Price: $65.00 | | | 4 | | | 1,470 | |
| SLB 160115P00070000 | | Expiration: January 2016, Exercise Price: $70.00 | | | 6 | | | 2,955 | |
| | | Transocean Ltd. | | | | | | | |
| RIG 140517P00035000 | | Expiration: May 2014, Exercise Price: $35.00 | | | 2 | | | 27 | |
| RIG 150117P00033000 | | Expiration: January 2015, Exercise Price: $33.00 | | | 24 | | | 1,788 | |
| RIG 150117P00038000 | | Expiration: January 2015, Exercise Price: $38.00 | | | 1 | | | 158 | |
| RIG 160115P00035000 | | Expiration: January 2016, Exercise Price: $35.00 | | | 16 | | | 3,184 | |
| RIG 160115P00038000 | | Expiration: January 2016, Exercise Price: $38.00 | | | 1 | | | 304 | |
| | | | | | | | | 17,928 | |
The accompanying notes are an integral part of these financial statements.
| KINETICS PORTFOLIOS TRUST — MASTER INVESTMENT PORTFOLIOS |
| The Alternative Income Portfolio |
Portfolio of Options Written — December 31, 2013 — (Continued) |
| Identifier | | | | | Contracts* | | | Value | |
| | | Support Activities for Transportation | | | | | | | |
| | | Expeditors International of Washington, Inc. | | | | | | | |
| EXPD 140517P00032000 | | Expiration: May 2014, Exercise Price: $32.00 | | | 2 | | $ | 30 | |
| EXPD 150117P00025000 | | Expiration: January 2015, Exercise Price: $25.00 | | | 15 | | | 375 | |
| EXPD 150117P00032500 | | Expiration: January 2015, Exercise Price: $32.50 | | | 26 | | | 2,340 | |
| EXPD 160115P00035000 | | Expiration: January 2016, Exercise Price: $35.00 | | | 1 | | | 285 | |
| | | | | | | | | 3,030 | |
| | | Telecommunications | | | | | | | |
| | | Verizon Communications Inc. | | | | | | | |
| VZ 150117P00035000 | | Expiration: January 2015, Exercise Price: $35.00 | | | 8 | | | 512 | |
| VZ 160115P00035000 | | Expiration: January 2016, Exercise Price: $35.00 | | | 12 | | | 2,268 | |
| | | | | | | | | 2,780 | |
| | | Transportation Equipment Manufacturing | | | | | | | |
| | | The Boeing Company | | | | | | | |
| BA 140517P00085000 | | Expiration: May 2014, Exercise Price: $85.00 | | | 1 | | | 31 | |
| BA 140517P00090000 | | Expiration: May 2014, Exercise Price: $90.00 | | | 1 | | | 41 | |
| BA 150117P00055000 | | Expiration: January 2015, Exercise Price: $55.00 | | | 5 | | | 192 | |
| BA 150117P00085000 | | Expiration: January 2015, Exercise Price: $85.00 | | | 4 | | | 626 | |
| BA 150117P00087500 | | Expiration: January 2015, Exercise Price: $87.50 | | | 1 | | | 176 | |
| BA 150117P00100000 | | Expiration: January 2015, Exercise Price: $100.00 | | | 2 | | | 620 | |
| BA 160115P00100000 | | Expiration: January 2016, Exercise Price: $100.00 | | | 2 | | | 1,400 | |
| | | General Dynamics Corporation | | | | | | | |
| GD 150117P00045000 | | Expiration: January 2015, Exercise Price: $45.00 | | | 10 | | | 300 | |
| GD 160115P00070000 | | Expiration: January 2016, Exercise Price: $70.00 | | | 1 | | | 375 | |
| | | Harley-Davidson, Inc. | | | | | | | |
| HOG 150117P00033000 | | Expiration: January 2015, Exercise Price: $33.00 | | | 15 | | | 435 | |
| | | Johnson Controls, Inc. | | | | | | | |
| JCI 140419P00032000 | | Expiration: April 2014, Exercise Price: $32.00 | | | 3 | | | 23 | |
| JCI 150117P00032000 | | Expiration: January 2015, Exercise Price: $32.00 | | | 2 | | | 125 | |
| JCI 150117P00037000 | | Expiration: January 2015, Exercise Price: $37.00 | | | 2 | | | 230 | |
| JCI 160115P00035000 | | Expiration: January 2016, Exercise Price: $35.00 | | | 14 | | | 2,975 | |
| | | PACCAR Inc. | | | | | | | |
| PCAR 140222P00044100 | | Expiration: February 2014, Exercise Price: $44.10 | | | 8 | | | 80 | |
| PCAR 150117P00028300 | | Expiration: January 2015, Exercise Price: $28.30 | | | 15 | | | 413 | |
| PCAR 150117P00040300 | | Expiration: January 2015, Exercise Price: $40.30 | | | 11 | | | 1,017 | |
| PCAR 150117P00043300 | | Expiration: January 2015, Exercise Price: $43.30 | | | 1 | | | 128 | |
The accompanying notes are an integral part of these financial statements.
| KINETICS PORTFOLIOS TRUST — MASTER INVESTMENT PORTFOLIOS |
| The Alternative Income Portfolio |
Portfolio of Options Written — December 31, 2013 — (Continued) |
| Identifier | | | | | Contracts* | | | Value | |
| | | Transportation Equipment Manufacturing — (Continued) | | | | | | | |
| | | Textron Inc. | | | | | | | |
| TXT 140118P00017000 | | Expiration: January 2014, Exercise Price: $17.00 | | | 25 | | $ | 38 | |
| TXT 140118P00020000 | | Expiration: January 2014, Exercise Price: $20.00 | | | 15 | | | 15 | |
| TXT 140322P00021000 | | Expiration: March 2014, Exercise Price: $21.00 | | | 7 | | | 56 | |
| TXT 150117P00015000 | | Expiration: January 2015, Exercise Price: $15.00 | | | 25 | | | 212 | |
| | | United Technologies Corporation | | | | | | | |
| UTX 160115P00080000 | | Expiration: January 2016, Exercise Price: $80.00 | | | 2 | | | 745 | |
| UTX 160115P00085000 | | Expiration: January 2016, Exercise Price: $85.00 | | | 1 | | | 462 | |
| | | | | | | | | 10,715 | |
| | | U.S. Equity Exchanges | | | | | | | |
| | | The NASDAQ OMX Group, Inc. | | | | | | | |
| NDAQ 140322P00023000 | | Expiration: March 2014, Exercise Price: $23.00 | | | 5 | | | 12 | |
| NDAQ 140621P00028000 | | Expiration: June 2014, Exercise Price: $28.00 | | | 3 | | | 60 | |
| | | | | | | | | 72 | |
| | | TOTAL PUT OPTIONS WRITTEN | | | | | | | |
| | | (premiums received $1,141,683) | | | | | $ | 535,155 | |
* — 100 Shares Per Contract.
e — 10 Shares Per Contract.
ADR — American Depository Receipt.
ETF — Exchange Traded Fund.
The accompanying notes are an integral part of these financial statements.
| KINETICS PORTFOLIOS TRUST — MASTER INVESTMENT PORTFOLIOS |
| The Multi-Disciplinary Portfolio |
Portfolio of Options Written — December 31, 2013 — (Continued) |
| Identifier | | PUT OPTIONS WRITTEN | | | Contracts* | | | Value | |
| | | Accommodation | | | | | | | |
| | | Carnival Corporation | | | | | | | |
| CCL 140118P00029500 | | Expiration: January 2014, Exercise Price: $29.50 | | | 251 | | $ | 628 | |
| CCL 150117P00032500 | | Expiration: January 2015, Exercise Price: $32.50 | | | 16 | | | 2,480 | |
| | | Marriott International Inc. — Class A | | | | | | | |
| MAR 150117P00035000 | | Expiration: January 2015, Exercise Price: $35.00 | | | 16 | | | 1,160 | |
| MAR 160115P00040000 | | Expiration: January 2016, Exercise Price: $40.00 | | | 76 | | | 25,840 | |
| MAR 160115P00042000 | | Expiration: January 2016, Exercise Price: $42.00 | | | 16 | | | 6,480 | |
| | | Royal Caribbean Cruises Ltd. | | | | | | | |
| RCL 140118P00030000 | | Expiration: January 2014, Exercise Price: $30.00 | | | 160 | | | 240 | |
| RCL 150117P00028000 | | Expiration: January 2015, Exercise Price: $28.00 | | | 52 | | | 2,938 | |
| | | | | | | | | 39,766 | |
| | | Administrative and Support Services | | | | | | | |
| | | Expedia, Inc. | | | | | | | |
| EXPE 140118P00049480 | | Expiration: January 2014, Exercise Price: $49.48 | | | 2 | | | 5 | |
| EXPE 150117P00039480 | | Expiration: January 2015, Exercise Price: $39.48 | | | 9 | | | 1,102 | |
| EXPE 160115P00050000 | | Expiration: January 2016, Exercise Price: $50.00 | | | 94 | | | 58,750 | |
| | | | | | | | | 59,857 | |
| | | Ambulatory Health Care Services | | | | | | | |
| | | DaVita HealthCare Partners Inc. | | | | | | | |
| DVA 160115P00050000 | | Expiration: January 2016, Exercise Price: $50.00 | | | 32 | | | 11,360 | |
| | | Apparel Manufacturing | | | | | | | |
| | | Cintas Corp. | | | | | | | |
| CTAS 140118P00037500 | | Expiration: January 2014, Exercise Price: $37.50 | | | 15 | | | 75 | |
| | | L Brands, Inc. | | | | | | | |
| LB 140118P00041000 | | Expiration: January 2014, Exercise Price: $41.00 | | | 15 | | | 75 | |
| LB 140118P00044000 | | Expiration: January 2014, Exercise Price: $44.00 | | | 2 | | | 10 | |
| LB 150117P00042000 | | Expiration: January 2015, Exercise Price: $42.00 | | | 41 | | | 4,510 | |
| | | | | | | | | 4,670 | |
| | | Asset Management | | | | | | | |
| | | BlackRock, Inc. | | | | | | | |
| BLK 140118P00160000 | | Expiration: January 2014, Exercise Price: $160.00 | | | 15 | | | 75 | |
| BLK 160115P00250000 | | Expiration: January 2016, Exercise Price: $250.00 | | | 13 | | | 32,370 | |
| | | The Blackstone Group LP | | | | | | | |
| BX 140118P00010000 | | Expiration: January 2014, Exercise Price: $10.00 | | | 400 | | | 200 | |
| BX 160115P00025000 | | Expiration: January 2016, Exercise Price: $25.00 | | | 7 | | | 2,397 | |
The accompanying notes are an integral part of these financial statements.
| KINETICS PORTFOLIOS TRUST — MASTER INVESTMENT PORTFOLIOS |
| The Multi-Disciplinary Portfolio |
Portfolio of Options Written — December 31, 2013 — (Continued) |
| Identifier | | | | | Contracts* | | | Value | |
| | | Asset Management — (Continued) | | | | | | | |
| | | The Carlyle Group LP | | | | | | | |
| CG 140322P00022500 | | Expiration: March 2014, Exercise Price: $22.50 | | | 65 | | $ | 488 | |
| | | Federated Investors, Inc. — Class B | | | | | | | |
| FII 140419P00025000 | | Expiration: April 2014, Exercise Price: $25.00 | | | 50 | | | 2,750 | |
| | | Franklin Resources, Inc. | | | | | | | |
| BEN 140118P00034000 | | Expiration: January 2014, Exercise Price: $34.00 | | | 30 | | | 75 | |
| BEN 160115P00050000 | | Expiration: January 2016, Exercise Price: $50.00 | | | 56 | | | 29,120 | |
| | | KKR & Co. LP | | | | | | | |
| KKR 150117P00017000 | | Expiration: January 2015, Exercise Price: $17.00 | | | 68 | | | 4,930 | |
| | | Legg Mason, Inc. | | | | | | | |
| LM 140118P00023000 | | Expiration: January 2014, Exercise Price: $23.00 | | | 206 | | | 515 | |
| LM 140118P00025000 | | Expiration: January 2014, Exercise Price: $25.00 | | | 100 | | | 250 | |
| LM 140118P00027000 | | Expiration: January 2014, Exercise Price: $27.00 | | | 18 | | | 45 | |
| | | Oaktree Capital Group LLC | | | | | | | |
| OAK 140419P00050000 | | Expiration: April 2014, Exercise Price: $50.00 | | | 6 | | | 345 | |
| | | | | | | | | 73,560 | |
| | | Beverage and Tobacco Product Manufacturing | | | | | | | |
| | | Ambev SA — ADR | | | | | | | |
| ABEV1 140118P00034990 | | Expiration: January 2014, Exercise Price: $34.99 | | | 30 | | | 1,125 | |
| | | Coca-Cola Enterprises Inc. | | | | | | | |
| CCE 140118P00025000 | | Expiration: January 2014, Exercise Price: $25.00 | | | 150 | | | 375 | |
| | | Constellation Brands, Inc. — Class A | | | | | | | |
| STZ 140118P00022500 | | Expiration: January 2014, Exercise Price: $22.50 | | | 156 | | | 780 | |
| STZ 140118P00025000 | | Expiration: January 2014, Exercise Price: $25.00 | | | 129 | | | 968 | |
| | | Molson Coors Brewing Company — Class B | | | | | | | |
| TAP 140118P00040000 | | Expiration: January 2014, Exercise Price: $40.00 | | | 147 | | | 367 | |
| TAP 150117P00040000 | | Expiration: January 2015, Exercise Price: $40.00 | | | 50 | | | 4,125 | |
| | | PepsiCo, Inc. | | | | | | | |
| PEP 140118P00060000 | | Expiration: January 2014, Exercise Price: $60.00 | | | 25 | | | 13 | |
| PEP 140118P00062500 | | Expiration: January 2014, Exercise Price: $62.50 | | | 18 | | | 9 | |
| | | Philip Morris International, Inc. | | | | | | | |
| PM 140118P00082500 | | Expiration: January 2014, Exercise Price: $82.50 | | | 30 | | | 330 | |
| PM 140118P00087500 | | Expiration: January 2014, Exercise Price: $87.50 | | | 20 | | | 2,280 | |
| PM 150117P00087500 | | Expiration: January 2015, Exercise Price: $87.50 | | | 1 | | | 735 | |
| | | | | | | | | 11,107 | |
The accompanying notes are an integral part of these financial statements.
| KINETICS PORTFOLIOS TRUST — MASTER INVESTMENT PORTFOLIOS |
| The Multi-Disciplinary Portfolio |
Portfolio of Options Written — December 31, 2013 — (Continued) |
| Identifier | | | | | Contracts* | | | Value | |
| | | Broadcasting (except Internet) | | | | | | | |
| | | CBS Corporation — Class B | | | | | | | |
| CBS 150117P00037000 | | Expiration: January 2015, Exercise Price: $37.00 | | | 3 | | $ | 233 | |
| CBS 150117P00040000 | | Expiration: January 2015, Exercise Price: $40.00 | | | 39 | | | 3,705 | |
| CBS 150117P00042000 | | Expiration: January 2015, Exercise Price: $42.00 | | | 10 | | | 1,225 | |
| CBS 150117P00045000 | | Expiration: January 2015, Exercise Price: $45.00 | | | 8 | | | 1,320 | |
| CBS 160115P00050000 | | Expiration: January 2016, Exercise Price: $50.00 | | | 92 | | | 46,000 | |
| | | Comcast Corporation — Class A | | | | | | | |
| CMCSA 140118P00030000 | | Expiration: January 2014, Exercise Price: $30.00 | | | 70 | | | 70 | |
| CMCSA 150117P00037000 | | Expiration: January 2015, Exercise Price: $37.00 | | | 16 | | | 1,272 | |
| | | Twenty-First Century Fox, Inc. — Class A | | | | | | | |
| FOXA1 140118P00022000 | | Expiration: January 2014, Exercise Price: $22.00 | | | 84 | | | 210 | |
| FOXA 150117P00027000 | | Expiration: January 2015, Exercise Price: $27.00 | | | 14 | | | 1,330 | |
| FOXA1 150117P00027000 | | Expiration: January 2015, Exercise Price: $27.00 | | | 37 | | | 3,978 | |
| | | The Walt Disney Company | | | | | | | |
| DIS 140118P00040000 | | Expiration: January 2014, Exercise Price: $40.00 | | | 25 | | | 25 | |
| DIS 140118P00045000 | | Expiration: January 2014, Exercise Price: $45.00 | | | 2 | | | 1 | |
| | | | | | | | | 59,369 | |
| | | Building Material and Garden Equipment and Supplies Dealers | | | | | | | |
| | | Fastenal Company | | | | | | | |
| FAST 140118P00039500 | | Expiration: January 2014, Exercise Price: $39.50 | | | 70 | | | 525 | |
| FAST 150117P00037500 | | Expiration: January 2015, Exercise Price: $37.50 | | | 6 | | | 1,170 | |
| FAST 150117P00042500 | | Expiration: January 2015, Exercise Price: $42.50 | | | 7 | | | 2,380 | |
| | | Lowe’s Companies, Inc. | | | | | | | |
| LOW 140118P00023000 | | Expiration: January 2014, Exercise Price: $23.00 | | | 25 | | | 25 | |
| LOW 140118P00025000 | | Expiration: January 2014, Exercise Price: $25.00 | | | 4 | | | 4 | |
| | | The Sherwin-Williams Company | | | | | | | |
| SHW 150117P00160000 | | Expiration: January 2015, Exercise Price: $160.00 | | | 5 | | | 5,500 | |
| | | | | | | | | 9,604 | |
| | | Chemical Manufacturing | | | | | | | |
| | | Celgene Corporation | | | | | | | |
| CELG 160115P00140000 | | Expiration: January 2016, Exercise Price: $140.00 | | | 33 | | | 71,115 | |
| | | The Clorox Company | | | | | | | |
| CLX 140118P00060000 | | Expiration: January 2014, Exercise Price: $60.00 | | | 22 | | | 55 | |
| CLX 140118P00065000 | | Expiration: January 2014, Exercise Price: $65.00 | | | 5 | | | 12 | |
| | | Monsanto Company | | | | | | | |
| MON 140118P00085000 | | Expiration: January 2014, Exercise Price: $85.00 | | | 1 | | | 3 | |
| MON 150117P00090000 | | Expiration: January 2015, Exercise Price: $90.00 | | | 6 | | | 1,704 | |
The accompanying notes are an integral part of these financial statements.
| KINETICS PORTFOLIOS TRUST — MASTER INVESTMENT PORTFOLIOS |
| The Multi-Disciplinary Portfolio |
Portfolio of Options Written — December 31, 2013 — (Continued) |
| Identifier | | | | | Contracts* | | | Value | |
| | | Chemical Manufacturing — (Continued) | | | | | | | |
| | | OPKO Health, Inc. | | | | | | | |
| OPK 160115P00005000 | | Expiration: January 2016, Exercise Price: $5.00 | | | 24 | | $ | 3,720 | |
| | | | | | | | | 76,609 | |
| | | Clothing and Clothing Accessories Stores | | | | | | | |
| | | The Estee Lauder Companies Inc. — Class A | | | | | | | |
| EL 140118P00047500 | | Expiration: January 2014, Exercise Price: $47.50 | | | 29 | | | 73 | |
| EL 140118P00055000 | | Expiration: January 2014, Exercise Price: $55.00 | | | 15 | | | 37 | |
| | | Tiffany & Co. | | | | | | | |
| TIF 150117P00060000 | | Expiration: January 2015, Exercise Price: $60.00 | | | 4 | | | 482 | |
| TIF 150117P00062500 | | Expiration: January 2015, Exercise Price: $62.50 | | | 40 | | | 5,820 | |
| TIF 150117P00065000 | | Expiration: January 2015, Exercise Price: $65.00 | | | 9 | | | 1,602 | |
| TIF 160115P00067500 | | Expiration: January 2016, Exercise Price: $67.50 | | | 14 | | | 6,860 | |
| TIF 160115P00070000 | | Expiration: January 2016, Exercise Price: $70.00 | | | 30 | | | 16,725 | |
| | | | | | | | | 31,599 | |
| | | Computer and Electronic Product Manufacturing | | | | | | | |
| | | America Movil SAB de C.V. — Series L — ADR | | | | | | | |
| AMX 140118P00018000 | | Expiration: January 2014, Exercise Price: $18.00 | | | 180 | | | 450 | |
| AMX 140118P00020000 | | Expiration: January 2014, Exercise Price: $20.00 | | | 200 | | | 500 | |
| | | Apple, Inc. | | | | | | | |
| AAPL 160115P00450000 | | Expiration: January 2016, Exercise Price: $450.00 | | | 3 | | | 13,110 | |
| AAPL 160115P00480000 | | Expiration: January 2016, Exercise Price: $480.00 | | | 12 | | | 68,610 | |
| AAPL 160115P00500000 | | Expiration: January 2016, Exercise Price: $500.00 | | | 2 | | | 13,360 | |
| | | Hologic, Inc. | | | | | | | |
| HOLX 160115P00018000 | | Expiration: January 2016, Exercise Price: $18.00 | | | 9 | | | 1,800 | |
| | | Sony Corporation | | | | | | | |
| SNE 150117P00015000 | | Expiration: January 2015, Exercise Price: $15.00 | | | 24 | | | 3,120 | |
| SNE 150117P00017000 | | Expiration: January 2015, Exercise Price: $17.00 | | | 180 | | | 41,850 | |
| SNE 160115P00015000 | | Expiration: January 2016, Exercise Price: $15.00 | | | 240 | | | 55,800 | |
| | | | | | | | | 198,600 | |
| | | Construction of Buildings | | | | | | | |
| | | Lennar Corporation — Class A | | | | | | | |
| LEN 140118P00030000 | | Expiration: January 2014, Exercise Price: $30.00 | | | 3 | | | 6 | |
| LEN 150117P00025000 | | Expiration: January 2015, Exercise Price: $25.00 | | | 132 | | | 10,494 | |
| LEN 150117P00033000 | | Expiration: January 2015, Exercise Price: $33.00 | | | 16 | | | 4,424 | |
| LEN 160115P00025000 | | Expiration: January 2016, Exercise Price: $25.00 | | | 56 | | | 10,332 | |
| LEN 160115P00030000 | | Expiration: January 2016, Exercise Price: $30.00 | | | 41 | | | 13,838 | |
| | | | | | | | | 39,094 | |
The accompanying notes are an integral part of these financial statements.
| KINETICS PORTFOLIOS TRUST — MASTER INVESTMENT PORTFOLIOS |
| The Multi-Disciplinary Portfolio |
Portfolio of Options Written — December 31, 2013 — (Continued) |
| Identifier | | | | | Contracts* | | | Value | |
| | | Consumer Staples | | | | | | | |
| | | The Procter & Gamble Company | | | | | | | |
| PG 140118P00057500 | | Expiration: January 2014, Exercise Price: $57.50 | | | 4 | | $ | 2 | |
| | | | | | | | | 2 | |
| | | Couriers and Messengers | | | | | | | |
| | | FedEx Corp. | | | | | | | |
| FDX 140118P00070000 | | Expiration: January 2014, Exercise Price: $70.00 | | | 6 | | | 9 | |
| FDX 140118P00075000 | | Expiration: January 2014, Exercise Price: $75.00 | | | 10 | | | 15 | |
| FDX 140118P00077500 | | Expiration: January 2014, Exercise Price: $77.50 | | | 10 | | | 15 | |
| FDX 140118P00087500 | | Expiration: January 2014, Exercise Price: $87.50 | | | 74 | | | 74 | |
| | | United Parcel Service, Inc. — Class B | | | | | | | |
| UPS 140118P00062500 | | Expiration: January 2014, Exercise Price: $62.50 | | | 8 | | | 8 | |
| UPS 140118P00070000 | | Expiration: January 2014, Exercise Price: $70.00 | | | 11 | | | 11 | |
| UPS 140118P00072500 | | Expiration: January 2014, Exercise Price: $72.50 | | | 61 | | | 61 | |
| UPS 140118P00075000 | | Expiration: January 2014, Exercise Price: $75.00 | | | 21 | | | 21 | |
| UPS 140118P00077500 | | Expiration: January 2014, Exercise Price: $77.50 | | | 11 | | | 11 | |
| | | | | | | | | 225 | |
| | | Credit Intermediation and Related Activities | | | | | | | |
| | | Altisource Portfolio Solutions SA | | | | | | | |
| ASPS 140419P00125000 | | Expiration: April 2014, Exercise Price: $125.00 | | | 4 | | | 1,920 | |
| ASPS 140419P00135000 | | Expiration: April 2014, Exercise Price: $135.00 | | | 9 | | | 5,490 | |
| ASPS 140719P00140000 | | Expiration: July 2014, Exercise Price: $140.00 | | | 16 | | | 18,560 | |
| | | American Express Company | | | | | | | |
| AXP 140118P00050000 | | Expiration: January 2014, Exercise Price: $50.00 | | | 60 | | | 60 | |
| AXP 140118P00055000 | | Expiration: January 2014, Exercise Price: $55.00 | | | 10 | | | 15 | |
| | | Bank of America Corporation | | | | | | | |
| BAC 160115P00015000 | | Expiration: January 2016, Exercise Price: $15.00 | | | 54 | | | 11,961 | |
| | | The Bank Of New York Mellon Corporation | | | | | | | |
| BK 150117P00025000 | | Expiration: January 2015, Exercise Price: $25.00 | | | 6 | | | 378 | |
| | | Citigroup Inc. | | | | | | | |
| C 140118P00035000 | | Expiration: January 2014, Exercise Price: $35.00 | | | 50 | | | 150 | |
| | | Northern Trust Corp. | | | | | | | |
| NTRS 140118P00040000 | | Expiration: January 2014, Exercise Price: $40.00 | | | 71 | | | 177 | |
| | | Ocwen Financial Corporation | | | | | | | |
| OCN 150117P00045000 | | Expiration: January 2015, Exercise Price: $45.00 | | | 16 | | | 6,720 | |
| OCN 160115P00050000 | | Expiration: January 2016, Exercise Price: $50.00 | | | 32 | | | 30,080 | |
| | | State Street Corporation | | | | | | | |
| STT 140118P00035000 | | Expiration: January 2014, Exercise Price: $35.00 | | | 11 | | | 17 | |
| | | Wells Fargo & Company | | | | | | | |
The accompanying notes are an integral part of these financial statements.
| KINETICS PORTFOLIOS TRUST — MASTER INVESTMENT PORTFOLIOS |
| The Multi-Disciplinary Portfolio |
Portfolio of Options Written — December 31, 2013 — (Continued) |
| Identifier | | | | | Contracts* | | | Value | |
| | | Credit Intermediation and Related Activities — (Continued) | | | | | | | |
| WFC 140118P00028000 | | Expiration: January 2014, Exercise Price: $28.00 | | | 80 | | $ | 40 | |
| WFC 140118P00030000 | | Expiration: January 2014, Exercise Price: $30.00 | | | 30 | | | 15 | |
| WFC 140118P00032000 | | Expiration: January 2014, Exercise Price: $32.00 | | | 3 | | | 3 | |
| WFC 160115P00040000 | | Expiration: January 2016, Exercise Price: $40.00 | | | 16 | | | 6,320 | |
| | | | | | | | | 81,906 | |
| | | Defense | | | | | | | |
| | | CACI International, Inc. — Class A | | | | | | | |
| CACI 140621P00070000 | | Expiration: June 2014, Exercise Price: $70.00 | | | 16 | | | 4,800 | |
| | | Northrop Grumman Corporation | | | | | | | |
| NOC 140118P00060000 | | Expiration: January 2014, Exercise Price: $60.00 | | | 20 | | | 50 | |
| | | | | | | | | 4,850 | |
| | | Diversified Financial Services | | | | | | | |
| | | JPMorgan Chase & Co. | | | | | | | |
| JPM 140118P00030000 | | Expiration: January 2014, Exercise Price: $30.00 | | | 100 | | | 50 | |
| JPM 140118P00032000 | | Expiration: January 2014, Exercise Price: $32.00 | | | 25 | | | 25 | |
| JPM 140118P00035000 | | Expiration: January 2014, Exercise Price: $35.00 | | | 12 | | | 18 | |
| | | | | | | | | 93 | |
| | | E-Commerce | | | | | | | |
| | | eBay, Inc. | | | | | | | |
| EBAY 140118P00045000 | | Expiration: January 2014, Exercise Price: $45.00 | | | 2 | | | 7 | |
| | | IAC/InterActiveCorp | | | | | | | |
| IACI 140118P00040000 | | Expiration: January 2014, Exercise Price: $40.00 | | | 25 | | | 62 | |
| IACI 150117P00040000 | | Expiration: January 2015, Exercise Price: $40.00 | | | 20 | | | 1,500 | |
| IACI 150117P00050000 | | Expiration: January 2015, Exercise Price: $50.00 | | | 56 | | | 11,340 | |
| | | Liberty Interactive Corporation — Class A | | | | | | | |
| LINTA 140118P00020000 | | Expiration: January 2014, Exercise Price: $20.00 | | | 72 | | | 540 | |
| LINTA 150117P00022000 | | Expiration: January 2015, Exercise Price: $22.00 | | | 136 | | | 10,540 | |
| LINTA 150117P00025000 | | Expiration: January 2015, Exercise Price: $25.00 | | | 66 | | | 9,735 | |
| | | | | | | | | 33,724 | |
| | | Fabricated Metal Product Manufacturing | | | | | | | |
| | | Danaher Corporation | | | | | | | |
| DHR 140118P00045000 | | Expiration: January 2014, Exercise Price: $45.00 | | | 85 | | | 213 | |
| DHR 140118P00052500 | | Expiration: January 2014, Exercise Price: $52.50 | | | 52 | | | 130 | |
| | | McDermott International, Inc. | | | | | | | |
| MDR 140118P00008000 | | Expiration: January 2014, Exercise Price: $8.00 | | | 85 | | | 212 | |
| MDR 150117P00008000 | | Expiration: January 2015, Exercise Price: $8.00 | | | 600 | | | 60,000 | |
| MDR 150117P00010000 | | Expiration: January 2015, Exercise Price: $10.00 | | | 46 | | | 9,545 | |
| | | | | | | | | 70,100 | |
The accompanying notes are an integral part of these financial statements.
| KINETICS PORTFOLIOS TRUST — MASTER INVESTMENT PORTFOLIOS |
| The Multi-Disciplinary Portfolio |
Portfolio of Options Written — December 31, 2013 — (Continued) |
| Identifier | | | | | Contracts* | | | Value | |
| | | Food Manufacturing | | | | | | | |
| | | Archer-Daniels-Midland Company | | | | | | | |
| ADM 140118P00023000 | | Expiration: January 2014, Exercise Price: $23.00 | | | 25 | | $ | 25 | |
| ADM 140118P00025000 | | Expiration: January 2014, Exercise Price: $25.00 | | | 225 | | | 113 | |
| | | Bunge Limited | | | | | | | |
| BG 140118P00055000 | | Expiration: January 2014, Exercise Price: $55.00 | | | 46 | | | 115 | |
| BG 140118P00057500 | | Expiration: January 2014, Exercise Price: $57.50 | | | 21 | | | 53 | |
| BG 140118P00060000 | | Expiration: January 2014, Exercise Price: $60.00 | | | 40 | | | 100 | |
| BG 140118P00062500 | | Expiration: January 2014, Exercise Price: $62.50 | | | 14 | | | 70 | |
| | | Kellogg Company | | | | | | | |
| K 140118P00050000 | | Expiration: January 2014, Exercise Price: $50.00 | | | 37 | | | 92 | |
| | | Mead Johnson Nutrition Company | | | | | | | |
| MJN 140118P00060000 | | Expiration: January 2014, Exercise Price: $60.00 | | | 58 | | | 406 | |
| MJN 140118P00065000 | | Expiration: January 2014, Exercise Price: $65.00 | | | 48 | | | 360 | |
| MJN 140118P00070000 | | Expiration: January 2014, Exercise Price: $70.00 | | | 12 | | | 156 | |
| | | Mondelez International Inc. — Class A | | | | | | | |
| MDLZ1 140118P00035000 | | Expiration: January 2014, Exercise Price: $35.00 | | | 30 | | | 240 | |
| MDLZ1 140118P00040000 | | Expiration: January 2014, Exercise Price: $40.00 | | | 2 | | | 15 | |
| | | | | | | | | 1,745 | |
| | | Food Services and Drinking Places | | | | | | | |
| | | Starbucks Corporation | | | | | | | |
| SBUX 140118P00035000 | | Expiration: January 2014, Exercise Price: $35.00 | | | 118 | | | 59 | |
| SBUX 140118P00045000 | | Expiration: January 2014, Exercise Price: $45.00 | | | 2 | | | 1 | |
| SBUX 150117P00030000 | | Expiration: January 2015, Exercise Price: $30.00 | | | 30 | | | 270 | |
| SBUX 150117P00045000 | | Expiration: January 2015, Exercise Price: $45.00 | | | 2 | | | 90 | |
| SBUX 150117P00052500 | | Expiration: January 2015, Exercise Price: $52.50 | | | 5 | | | 485 | |
| SBUX 150117P00055000 | | Expiration: January 2015, Exercise Price: $55.00 | | | 9 | | | 1,134 | |
| SBUX 150117P00057500 | | Expiration: January 2015, Exercise Price: $57.50 | | | 24 | | | 3,828 | |
| SBUX 160115P00067500 | | Expiration: January 2016, Exercise Price: $67.50 | | | 24 | | | 16,980 | |
| SBUX 160115P00070000 | | Expiration: January 2016, Exercise Price: $70.00 | | | 28 | | | 22,750 | |
| | | | | | | | | 45,597 | |
| | | Funds, Trusts, and Other Financial Vehicles | | | | | | | |
| | | iShares iBoxx $ High Yield Corporate Bond ETF | | | | | | | |
| HYG 150117P00091000 | | Expiration: January 2015, Exercise Price: $91.00 | | | 57 | | | 33,345 | |
| | | iShares MSCI Japan ETF | | | | | | | |
| EWJ 140118P00009000 | | Expiration: January 2014, Exercise Price: $9.00 | | | 605 | | | 303 | |
| | | iShares Russell 2000 ETF | | | | | | | |
| IWM 140118P00079000 | | Expiration: January 2014, Exercise Price: $79.00 | | | 1 | | | 1 | |
The accompanying notes are an integral part of these financial statements.
| KINETICS PORTFOLIOS TRUST — MASTER INVESTMENT PORTFOLIOS |
| The Multi-Disciplinary Portfolio |
Portfolio of Options Written — December 31, 2013 — (Continued) |
| Identifier | | | | | Contracts* | | | Value | |
| | | Funds, Trusts, and Other Financial Vehicles — (Continued) | | | | | | | |
| | | Market Vectors Gold Miners ETF | | | | | | | |
| GDX 150117P00020000 | | Expiration: January 2015, Exercise Price: $20.00 | | | 50 | | $ | 13,850 | |
| | | Market Vectors Junior Gold Miners ETF | | | | | | | |
| GDXJ1 150117P00007000 | | Expiration: January 2015, Exercise Price: $7.00 | | | 50 | | | 5,625 | |
| | | ProShares Short S&P 500 ETF | | | | | | | |
| SH 140118P00030000 | | Expiration: January 2014, Exercise Price: $30.00 | | | 90 | | | 42,750 | |
| | | ProShares Short VIX Short-Term Futures ETF | | | | | | | |
| SVXY 150117P00040000 | | Expiration: January 2015, Exercise Price: $40.00 | | | 4 | | | 310 | |
| SVXY 150117P00070000 | | Expiration: January 2015, Exercise Price: $70.00 | | | 2 | | | 1,110 | |
| | | SPDR S&P 500 ETF Trust | | | | | | | |
| SPY 140118P00135000 | | Expiration: January 2014, Exercise Price: $135.00 | | | 20 | | | 20 | |
| SPY 140118P00138000 | | Expiration: January 2014, Exercise Price: $138.00 | | | 20 | | | 20 | |
| SPY 141220P00140000 | | Expiration: December 2014, Exercise Price: $140.00 | | | 1 | | | 201 | |
| | | | | | | | | 97,535 | |
| | | Gaming | | | | | | | |
| | | Las Vegas Sands Corp. | | | | | | | |
| LVS 140118P00027250 | | Expiration: January 2014, Exercise Price: $27.25 | | | 70 | | | 70 | |
| LVS 140118P00032250 | | Expiration: January 2014, Exercise Price: $32.25 | | | 32 | | | 32 | |
| LVS 140118P00035250 | | Expiration: January 2014, Exercise Price: $35.25 | | | 3 | | | 3 | |
| LVS 140118P00042250 | | Expiration: January 2014, Exercise Price: $42.25 | | | 52 | | | 78 | |
| LVS 150117P00044250 | | Expiration: January 2015, Exercise Price: $44.25 | | | 9 | | | 626 | |
| LVS 160115P00060000 | | Expiration: January 2016, Exercise Price: $60.00 | | | 26 | | | 16,120 | |
| | | Wynn Resorts Limited | | | | | | | |
| WYNN 140118P00059500 | | Expiration: January 2014, Exercise Price: $59.50 | | | 46 | | | 115 | |
| WYNN 140118P00064500 | | Expiration: January 2014, Exercise Price: $64.50 | | | 12 | | | 30 | |
| WYNN 140118P00069500 | | Expiration: January 2014, Exercise Price: $69.50 | | | 8 | | | 20 | |
| WYNN 140118P00084500 | | Expiration: January 2014, Exercise Price: $84.50 | | | 4 | | | 10 | |
| WYNN 140118P00092000 | | Expiration: January 2014, Exercise Price: $92.00 | | | 8 | | | 8 | |
| WYNN 150117P00117000 | | Expiration: January 2015, Exercise Price: $117.00 | | | 5 | | | 892 | |
| WYNN 160115P00140000 | | Expiration: January 2016, Exercise Price: $140.00 | | | 18 | | | 19,485 | |
| | | | | | | | | 37,489 | |
| | | Gasoline Stations | | | | | | | |
| | | Susser Holdings Corporation | | | | | | | |
| SUSS 140118P00045000 | | Expiration: January 2014, Exercise Price: $45.00 | | | 6 | | | 45 | |
| SUSS 140419P00045000 | | Expiration: April 2014, Exercise Price: $45.00 | | | 8 | | | 140 | |
| | | | | | | | | 185 | |
The accompanying notes are an integral part of these financial statements.
| KINETICS PORTFOLIOS TRUST — MASTER INVESTMENT PORTFOLIOS |
| The Multi-Disciplinary Portfolio |
Portfolio of Options Written — December 31, 2013 — (Continued) |
| Identifier | | | | | Contracts* | | | Value | |
| | | General Merchandise Stores | | | | | | | |
| | | Family Dollar Stores, Inc. | | | | | | | |
| FDO 140118P00050000 | | Expiration: January 2014, Exercise Price: $50.00 | | | 138 | | $ | 345 | |
| FDO 140118P00052500 | | Expiration: January 2014, Exercise Price: $52.50 | | | 6 | | | 30 | |
| FDO 150117P00050000 | | Expiration: January 2015, Exercise Price: $50.00 | | | 25 | | | 4,187 | |
| FDO 150117P00052500 | | Expiration: January 2015, Exercise Price: $52.50 | | | 9 | | | 1,980 | |
| | | J.C. Penney Company, Inc. | | | | | | | |
| JCP 150117P00015000 | | Expiration: January 2015, Exercise Price: $15.00 | | | 6 | | | 4,065 | |
| | | Sears Holdings Corporation | | | | | | | |
| SHLD 140222P00030420 | | Expiration: February 2014, Exercise Price: $30.42 | | | 23 | | | 840 | |
| SHLD 140621P00047920 | | Expiration: June 2014, Exercise Price: $47.92 | | | 2 | | | 1,605 | |
| SHLD 150117P00035000 | | Expiration: January 2015, Exercise Price: $35.00 | | | 6 | | | 3,210 | |
| SHLD 150117P00045000 | | Expiration: January 2015, Exercise Price: $45.00 | | | 65 | | | 64,512 | |
| SHLD 150117P00050000 | | Expiration: January 2015, Exercise Price: $50.00 | | | 92 | | | 117,760 | |
| SHLD 160115P00060000 | | Expiration: January 2016, Exercise Price: $60.00 | | | 6 | | | 14,325 | |
| | | | | | | | | 212,859 | |
| | | Holding Company | | | | | | | |
| | | Berkshire Hathaway Inc. — Class B | | | | | | | |
| BRKB 140118P00080000 | | Expiration: January 2014, Exercise Price: $80.00 | | | 23 | | | 12 | |
| | | Icahn Enterprises LP | | | | | | | |
| IEP 140322P00065000 | | Expiration: March 2014, Exercise Price: $65.00 | | | 58 | | | 725 | |
| IEP 140621P00090000 | | Expiration: June 2014, Exercise Price: $90.00 | | | 6 | | | 2,970 | |
| IEP 140621P00095000 | | Expiration: June 2014, Exercise Price: $95.00 | | | 10 | | | 6,600 | |
| IEP 140621P00100000 | | Expiration: June 2014, Exercise Price: $100.00 | | | 15 | | | 12,825 | |
| | | Leucadia National Corporation | | | | | | | |
| LUK2 150117P00022000 | | Expiration: January 2015, Exercise Price: $22.00 | | | 282 | | | 48,645 | |
| LUK2 150117P00025000 | | Expiration: January 2015, Exercise Price: $25.00 | | | 19 | | | 6,650 | |
| | | Liberty Media Corporation — Class A | | | | | | | |
| LMCA 140419P00135000 | | Expiration: April 2014, Exercise Price: $135.00 | | | 19 | | | 8,550 | |
| LMCA 140419P00140000 | | Expiration: April 2014, Exercise Price: $140.00 | | | 8 | | | 4,800 | |
| LMCA 140719P00135000 | | Expiration: July 2014, Exercise Price: $135.00 | | | 3 | | | 2,250 | |
| | | | | | | | | 94,027 | |
| | | Insurance Carriers and Related Activities | | | | | | | |
| | | American International Group, Inc. | | | | | | | |
| AIG 140118P00030000 | | Expiration: January 2014, Exercise Price: $30.00 | | | 71 | | | 36 | |
| AIG 160115P00045000 | | Expiration: January 2016, Exercise Price: $45.00 | | | 50 | | | 25,875 | |
| | | AmTrust Financial Services, Inc. | | | | | | | |
| AFSI 140322P00035000 | | Expiration: March 2014, Exercise Price: $35.00 | | | 16 | | | 8,080 | |
| AFSI 160115P00030000 | | Expiration: January 2016, Exercise Price: $30.00 | | | 24 | | | 18,720 | |
The accompanying notes are an integral part of these financial statements.
| KINETICS PORTFOLIOS TRUST — MASTER INVESTMENT PORTFOLIOS |
| The Multi-Disciplinary Portfolio |
Portfolio of Options Written — December 31, 2013 — (Continued) |
| Identifier | | | | | Contracts* | | | Value | |
| | | Insurance Carriers and Related Activities — (Continued) | | | | | | | |
| | | Marsh & McLennan Companies, Inc. | | | | | | | |
| MMC 140118P00025000 | | Expiration: January 2014, Exercise Price: $25.00 | | | 16 | | $ | 80 | |
| | | UnitedHealth Group Inc. | | | | | | | |
| UNH 140118P00047000 | | Expiration: January 2014, Exercise Price: $47.00 | | | 60 | | | 30 | |
| | | | | | | | | 52,821 | |
| | | Leather and Allied Product Manufacturing | | | | | | | |
| | | Coach, Inc. | | | | | | | |
| COH 150117P00045000 | | Expiration: January 2015, Exercise Price: $45.00 | | | 15 | | | 3,412 | |
| COH 160115P00045000 | | Expiration: January 2016, Exercise Price: $45.00 | | | 56 | | | 24,360 | |
| | | | | | | | | 27,772 | |
| | | Lessors of Nonresidential Buildings (except Miniwarehouses) | | | | | | | |
| | | The Howard Hughes Corporation | | | | | | | |
| HHC 140419P00100000 | | Expiration: April 2014, Exercise Price: $100.00 | | | 10 | | | 1,625 | |
| HHC 140419P00110000 | | Expiration: April 2014, Exercise Price: $110.00 | | | 7 | | | 2,660 | |
| HHC 140719P00100000 | | Expiration: July 2014, Exercise Price: $100.00 | | | 30 | | | 10,200 | |
| | | | | | | | | 14,485 | |
| | | Machinery Manufacturing | | | | | | | |
| | | Illinois Tool Works Inc. | | | | | | | |
| ITW 140118P00057500 | | Expiration: January 2014, Exercise Price: $57.50 | | | 30 | | | 75 | |
| | | National Oilwell Varco, Inc. | | | | | | | |
| NOV 150117P00057500 | | Expiration: January 2015, Exercise Price: $57.50 | | | 45 | | | 6,435 | |
| | | | | | | | | 6,510 | |
| | | Merchant Wholesalers, Durable Goods | | | | | | | |
| | | Airgas, Inc. | | | | | | | |
| ARG 140118P00090000 | | Expiration: January 2014, Exercise Price: $90.00 | | | 40 | | | 400 | |
| | | Merchant Wholesalers, Nondurable Goods | | | | | | | |
| | | Cardinal Health, Inc. | | | | | | | |
| CAH 150117P00042000 | | Expiration: January 2015, Exercise Price: $42.00 | | | 7 | | | 385 | |
| | | Express Scripts Holding Company | | | | | | | |
| ESRX 140118P00045000 | | Expiration: January 2014, Exercise Price: $45.00 | | | 20 | | | 20 | |
| ESRX 140118P00052500 | | Expiration: January 2014, Exercise Price: $52.50 | | | 40 | | | 160 | |
| | | | | | | | | 565 | |
| | | Media | | | | | | | |
| | | Starz — Class A | | | | | | | |
| STRZA 140419P00025000 | | Expiration: April 2014, Exercise Price: $25.00 | | | 140 | | $ | 6,650 | |
The accompanying notes are an integral part of these financial statements.
| KINETICS PORTFOLIOS TRUST — MASTER INVESTMENT PORTFOLIOS |
| The Multi-Disciplinary Portfolio |
Portfolio of Options Written — December 31, 2013 — (Continued) |
| Identifier | | | | | Contracts* | | | Value | |
| | | Media — (Continued) | | | | | | | |
| | | Time Warner Inc. | | | | | | | |
| TWX 140118P00035000 | | Expiration: January 2014, Exercise Price: $35.00 | | | 59 | | $ | 59 | |
| TWX 140118P00040000 | | Expiration: January 2014, Exercise Price: $40.00 | | | 47 | | | 70 | |
| | | Viacom Inc. — Class B | | | | | | | |
| VIAB 140118P00045000 | | Expiration: January 2014, Exercise Price: $45.00 | | | 30 | | | 75 | |
| VIAB 140118P00047000 | | Expiration: January 2014, Exercise Price: $47.00 | | | 43 | | | 107 | |
| VIAB 140118P00057500 | | Expiration: January 2014, Exercise Price: $57.50 | | | 50 | | | 125 | |
| VIAB 150117P00055000 | | Expiration: January 2015, Exercise Price: $55.00 | | | 32 | | | 3,040 | |
| VIAB 150117P00057500 | | Expiration: January 2015, Exercise Price: $57.50 | | | 10 | | | 1,150 | |
| | | | | | | | | 11,276 | |
| | | Mining (except Oil and Gas) | | | | | | | |
| | | Barrick Gold Corporation | | | | | | | |
| ABX 150117P00015000 | | Expiration: January 2015, Exercise Price: $15.00 | | | 124 | | | 20,956 | |
| ABX 160115P00013000 | | Expiration: January 2016, Exercise Price: $13.00 | | | 68 | | | 12,138 | |
| ABX 160115P00015000 | | Expiration: January 2016, Exercise Price: $15.00 | | | 76 | | | 20,140 | |
| | | Cameco Corporation | | | | | | | |
| CCJ 140118P00015000 | | Expiration: January 2014, Exercise Price: $15.00 | | | 65 | | | 163 | |
| CCJ 140118P00017000 | | Expiration: January 2014, Exercise Price: $17.00 | | | 219 | | | 547 | |
| | | Franco-Nevada Corporation | | | | | | | |
| FNV 140419P00040000 | | Expiration: April 2014, Exercise Price: $40.00 | | | 2 | | | 615 | |
| | | Freeport-McMoRan Copper & Gold Inc. | | | | | | | |
| FCX 140118P00024000 | | Expiration: January 2014, Exercise Price: $24.00 | | | 58 | | | 87 | |
| FCX 150117P00022000 | | Expiration: January 2015, Exercise Price: $22.00 | | | 2 | | | 80 | |
| FCX 150117P00024000 | | Expiration: January 2015, Exercise Price: $24.00 | | | 116 | | | 6,844 | |
| FCX 150117P00027000 | | Expiration: January 2015, Exercise Price: $27.00 | | | 52 | | | 5,200 | |
| FCX 160115P00030000 | | Expiration: January 2016, Exercise Price: $30.00 | | | 4 | | | 1,310 | |
| FCX 160115P00032000 | | Expiration: January 2016, Exercise Price: $32.00 | | | 20 | | | 8,150 | |
| | | McEwen Mining Inc. | | | | | | | |
| MUX 140118P00002500 | | Expiration: January 2014, Exercise Price: $2.50 | | | 48 | | | 2,760 | |
| | | Newmont Mining Corporation | | | | | | | |
| NEM 150117P00025000 | | Expiration: January 2015, Exercise Price: $25.00 | | | 60 | | | 30,000 | |
| | | Rio Tinto plc — ADR | | | | | | | |
| RIO 140118P00032500 | | Expiration: January 2014, Exercise Price: $32.50 | | | 35 | | | 175 | |
| RIO 140118P00037500 | | Expiration: January 2014, Exercise Price: $37.50 | | | 36 | | | 90 | |
| RIO 140118P00040000 | | Expiration: January 2014, Exercise Price: $40.00 | | | 50 | | | 250 | |
| RIO 150117P00040000 | | Expiration: January 2015, Exercise Price: $40.00 | | | 5 | | | 825 | |
The accompanying notes are an integral part of these financial statements.
| KINETICS PORTFOLIOS TRUST — MASTER INVESTMENT PORTFOLIOS |
| The Multi-Disciplinary Portfolio |
Portfolio of Options Written — December 31, 2013 — (Continued) |
| Identifier | | | | | Contracts* | | | Value | |
| | | Mining (except Oil and Gas) — (Continued) | | | | | | | |
| | | Silver Wheaton Corporation | | | | | | | |
| SLW 140118P00020000 | | Expiration: January 2014, Exercise Price: $20.00 | | | 25 | | $ | 1,275 | |
| SLW 150117P00018000 | | Expiration: January 2015, Exercise Price: $18.00 | | | 16 | | | 3,624 | |
| SLW 150117P00020000 | | Expiration: January 2015, Exercise Price: $20.00 | | | 106 | | | 34,980 | |
| SLW 160115P00018000 | | Expiration: January 2016, Exercise Price: $18.00 | | | 32 | | | 11,680 | |
| | | Vale SA | | | | | | | |
| VALE 140118P00015000 | | Expiration: January 2014, Exercise Price: $15.00 | | | 100 | | | 2,850 | |
| | | | | | | | | 164,739 | |
| | | Miscellaneous Manufacturing | | | | | | | |
| | | 3M Co. | | | | | | | |
| MMM 140118P00080000 | | Expiration: January 2014, Exercise Price: $80.00 | | | 10 | | | 5 | |
| MMM 140118P00090000 | | Expiration: January 2014, Exercise Price: $90.00 | | | 33 | | | 16 | |
| | | Hasbro, Inc. | | | | | | | |
| HAS 150117P00040000 | | Expiration: January 2015, Exercise Price: $40.00 | | | 17 | | | 1,913 | |
| | | International Game Technology | | | | | | | |
| IGT 140118P00010000 | | Expiration: January 2014, Exercise Price: $10.00 | | | 104 | | | 260 | |
| IGT 140118P00013000 | | Expiration: January 2014, Exercise Price: $13.00 | | | 457 | | | 1,142 | |
| IGT 150117P00010000 | | Expiration: January 2015, Exercise Price: $10.00 | | | 20 | | | 600 | |
| | | | | | | | | 3,936 | |
| | | Motor Vehicle and Parts Dealers | | | | | | | |
| | | AutoNation, Inc. | | | | | | | |
| AN 140118P00039000 | | Expiration: January 2014, Exercise Price: $39.00 | | | 45 | | | 338 | |
| | | Nonmetallic Mineral Product Manufacturing | | | | | | | |
| | | USG Corporation | | | | | | | |
| USG 150117P00020000 | | Expiration: January 2015, Exercise Price: $20.00 | | | 16 | | | 1,840 | |
| | | Non-Store Retailers | | | | | | | |
| | | Sotheby’s | | | | | | | |
| BID 140118P00023000 | | Expiration: January 2014, Exercise Price: $23.00 | | | 133 | | | 665 | |
| BID 140118P00030000 | | Expiration: January 2014, Exercise Price: $30.00 | | | 120 | | | 600 | |
| BID 150117P00028000 | | Expiration: January 2015, Exercise Price: $28.00 | | | 17 | | | 2,125 | |
| | | | | | | | | 3,390 | |
| | | Oil and Gas Extraction | | | | | | | |
| | | Canadian Natural Resources Ltd. | | | | | | | |
| CNQ 140118P00025000 | | Expiration: January 2014, Exercise Price: $25.00 | | | 117 | | | 293 | |
| CNQ 140118P00028000 | | Expiration: January 2014, Exercise Price: $28.00 | | | 193 | | | 482 | |
| CNQ 160115P00030000 | | Expiration: January 2016, Exercise Price: $30.00 | | | 4 | | | 1,560 | |
The accompanying notes are an integral part of these financial statements.
| KINETICS PORTFOLIOS TRUST — MASTER INVESTMENT PORTFOLIOS |
| The Multi-Disciplinary Portfolio |
Portfolio of Options Written — December 31, 2013 — (Continued) |
| Identifier | | | | | Contracts* | | | Value | |
| | | Oil and Gas Extraction — (Continued) | | | | | | | |
| | | Chesapeake Energy Corporation | | | | | | | |
| CHK 150117P00022000 | | Expiration: January 2015, Exercise Price: $22.00 | | | 16 | | $ | 2,200 | |
| CHK 150117P00025000 | | Expiration: January 2015, Exercise Price: $25.00 | | | 4 | | | 976 | |
| CHK 160115P00020000 | | Expiration: January 2016, Exercise Price: $20.00 | | | 64 | | | 11,808 | |
| CHK 160115P00023000 | | Expiration: January 2016, Exercise Price: $23.00 | | | 46 | | | 13,409 | |
| CHK 160115P00025000 | | Expiration: January 2016, Exercise Price: $25.00 | | | 14 | | | 5,250 | |
| | | Continental Resources, Inc. | | | | | | | |
| CLR 150117P00055000 | | Expiration: January 2015, Exercise Price: $55.00 | | | 1 | | | 92 | |
| CLR 150117P00070000 | | Expiration: January 2015, Exercise Price: $70.00 | | | 23 | | | 5,635 | |
| CLR 150117P00085000 | | Expiration: January 2015, Exercise Price: $85.00 | | | 19 | | | 10,640 | |
| CLR 150117P00090000 | | Expiration: January 2015, Exercise Price: $90.00 | | | 10 | | | 6,900 | |
| CLR 150117P00095000 | | Expiration: January 2015, Exercise Price: $95.00 | | | 12 | | | 10,440 | |
| CLR 160115P00090000 | | Expiration: January 2016, Exercise Price: $90.00 | | | 7 | | | 8,295 | |
| | | Encana Corporation | | | | | | | |
| ECA 140118P00015000 | | Expiration: January 2014, Exercise Price: $15.00 | | | 18 | | | 45 | |
| ECA 140118P00018000 | | Expiration: January 2014, Exercise Price: $18.00 | | | 419 | | | 13,617 | |
| | | EXCO Resources, Inc. | | | | | | | |
| XCO1 140118P00005000 | | Expiration: January 2014, Exercise Price: $5.00 | | | 600 | | | 4,500 | |
| | | Occidental Petroleum Corporation | | | | | | | |
| OXY 140118P00055000 | | Expiration: January 2014, Exercise Price: $55.00 | | | 91 | | | 46 | |
| OXY 140118P00075000 | | Expiration: January 2014, Exercise Price: $75.00 | | | 40 | | | 180 | |
| OXY 140118P00077500 | | Expiration: January 2014, Exercise Price: $77.50 | | | 4 | | | 18 | |
| | | Suncor Energy, Inc. | | | | | | | |
| SU 140118P00023000 | | Expiration: January 2014, Exercise Price: $23.00 | | | 100 | | | 100 | |
| SU 140118P00025000 | | Expiration: January 2014, Exercise Price: $25.00 | | | 32 | | | 32 | |
| | | Talisman Energy Inc. | | | | | | | |
| TLM 150117P00010000 | | Expiration: January 2015, Exercise Price: $10.00 | | | 8 | | | 600 | |
| TLM 160115P00010000 | | Expiration: January 2016, Exercise Price: $10.00 | | | 80 | | | 11,400 | |
| | | Total SA — ADR | | | | | | | |
| TOT 140118P00040000 | | Expiration: January 2014, Exercise Price: $40.00 | | | 14 | | | 105 | |
| TOT 140118P00042500 | | Expiration: January 2014, Exercise Price: $42.50 | | | 22 | | | 110 | |
| TOT 140118P00045000 | | Expiration: January 2014, Exercise Price: $45.00 | | | 35 | | | 175 | |
| | | WPX Energy Inc. | | | | | | | |
| WPX 140118P00012500 | | Expiration: January 2014, Exercise Price: $12.50 | | | 302 | | | 1,510 | |
| WPX 140118P00015000 | | Expiration: January 2014, Exercise Price: $15.00 | | | 229 | | | 1,145 | |
| WPX 140118P00017500 | | Expiration: January 2014, Exercise Price: $17.50 | | | 10 | | | 125 | |
| | | | | | | | | 111,688 | |
The accompanying notes are an integral part of these financial statements.
| KINETICS PORTFOLIOS TRUST — MASTER INVESTMENT PORTFOLIOS |
| The Multi-Disciplinary Portfolio |
Portfolio of Options Written — December 31, 2013 — (Continued) |
| Identifier | | | | | Contracts* | | | Value | |
| | | Other Exchanges | | | | | | | |
| | | CBOE Holdings Inc. | | | | | | | |
| CBOE 140118P00023750 | | Expiration: January 2014, Exercise Price: $23.75 | | | 33 | | $ | 83 | |
| CBOE 140118P00025750 | | Expiration: January 2014, Exercise Price: $25.75 | | | 82 | | | 205 | |
| CBOE 150117P00043750 | | Expiration: January 2015, Exercise Price: $43.75 | | | 34 | | | 8,075 | |
| CBOE 160115P00044500 | | Expiration: January 2016, Exercise Price: $44.50 | | | 28 | | | 13,020 | |
| | | | | | | | | 21,383 | |
| | | Other Information Services | | | | | | | |
| | | Google Inc. — Class A | | | | | | | |
| GOOG 150117P00800000 | | Expiration: January 2015, Exercise Price: $800.00 | | | 1 | | | 1,375 | |
| | | Performing Arts, Spectator Sports, and Related Industries | | | | | | | |
| | | Live Nation Entertainment, Inc. | | | | | | | |
| LYV 150117P00012000 | | Expiration: January 2015, Exercise Price: $12.00 | | | 102 | | | 4,335 | |
| LYV 150117P00015000 | | Expiration: January 2015, Exercise Price: $15.00 | | | 242 | | | 22,990 | |
| LYV 160115P00015000 | | Expiration: January 2016, Exercise Price: $15.00 | | | 88 | | | 16,720 | |
| | | | | | | | | 44,045 | |
| | | Petroleum and Coal Products Manufacturing | | | | | | | |
| | | CVR Energy, Inc. | | | | | | | |
| CVI 140621P00030000 | | Expiration: June 2014, Exercise Price: $30.00 | | | 21 | | | 1,365 | |
| | | Exxon Mobil Corporation | | | | | | | |
| XOM 140118P00082500 | | Expiration: January 2014, Exercise Price: $82.50 | | | 20 | | | 70 | |
| | | Hess Corporation | | | | | | | |
| HES 140118P00055000 | | Expiration: January 2014, Exercise Price: $55.00 | | | 134 | | | 201 | |
| | | Murphy Oil Corporation | | | | | | | |
| MUR1 140118P00052500 | | Expiration: January 2014, Exercise Price: $52.50 | | | 138 | | | 690 | |
| MUR1 140118P00055000 | | Expiration: January 2014, Exercise Price: $55.00 | | | 14 | | | 70 | |
| | | | | | | | | 2,396 | |
| | | Pharmaceutical and Biotechnology | | | | | | | |
| | | Novartis AG — ADR | | | | | | | |
| NVS 140118P00050000 | | Expiration: January 2014, Exercise Price: $50.00 | | | 15 | | | 75 | |
| | | Pipeline Transportation | | | | | | | |
| | | The Williams Companies, Inc. | | | | | | | |
| WMB 150117P00030000 | | Expiration: January 2015, Exercise Price: $30.00 | | | 7 | | | 938 | |
| WMB 160115P00030000 | | Expiration: January 2016, Exercise Price: $30.00 | | | 126 | | | 39,186 | |
| | | | | | | | | 40,124 | |
The accompanying notes are an integral part of these financial statements.
| KINETICS PORTFOLIOS TRUST — MASTER INVESTMENT PORTFOLIOS |
| The Multi-Disciplinary Portfolio |
Portfolio of Options Written — December 31, 2013 — (Continued) |
| Identifier | | | | | Contracts* | | | Value | |
| | | Primary Metal Manufacturing | | | | | | | |
| | | ArcelorMittal | | | | | | | |
| MT 140118P00010000 | | Expiration: January 2014, Exercise Price: $10.00 | | | 100 | | $ | 100 | |
| | | Professional, Scientific, and Technical Services | | | | | | | |
| | | Automatic Data Processing, Inc. | | | | | | | |
| ADP 140118P00050000 | | Expiration: January 2014, Exercise Price: $50.00 | | | 52 | | | 260 | |
| ADP 140118P00052500 | | Expiration: January 2014, Exercise Price: $52.50 | | | 3 | | | 15 | |
| | | Iron Mountain Inc. | | | | | | | |
| IRM 150117P00030000 | | Expiration: January 2015, Exercise Price: $30.00 | | | 13 | | | 6,175 | |
| | | Verisign Inc. | | | | | | | |
| VRSN 150117P00050000 | | Expiration: January 2015, Exercise Price: $50.00 | | | 62 | | | 13,268 | |
| | | | | | | | | 19,718 | |
| | | Publishing Industries (except Internet) | | | | | | | |
| | | Nuance Communications, Inc. | | | | | | | |
| NUAN 160115P00013000 | | Expiration: January 2016, Exercise Price: $13.00 | | | 144 | | | 33,120 | |
| NUAN 160115P00015000 | | Expiration: January 2016, Exercise Price: $15.00 | | | 8 | | | 2,680 | |
| | | | | | | | | 35,800 | |
| | | Rail Transportation | | | | | | | |
| | | CSX Corporation | | | | | | | |
| CSX 140118P00017500 | | Expiration: January 2014, Exercise Price: $17.50 | | | 69 | | | 34 | |
| CSX 140118P00020000 | | Expiration: January 2014, Exercise Price: $20.00 | | | 308 | | | 462 | |
| | | Norfolk Southern Corporation | | | | | | | |
| NSC 140118P00057500 | | Expiration: January 2014, Exercise Price: $57.50 | | | 22 | | | 55 | |
| NSC 140118P00060000 | | Expiration: January 2014, Exercise Price: $60.00 | | | 8 | | | 20 | |
| NSC 140118P00062500 | | Expiration: January 2014, Exercise Price: $62.50 | | | 56 | | | 140 | |
| NSC 140118P00065000 | | Expiration: January 2014, Exercise Price: $65.00 | | | 37 | | | 92 | |
| NSC 150117P00065000 | | Expiration: January 2015, Exercise Price: $65.00 | | | 7 | | | 928 | |
| | | Union Pacific Corporation | | | | | | | |
| UNP 140118P00095000 | | Expiration: January 2014, Exercise Price: $95.00 | | | 11 | | | 6 | |
| UNP 140118P00100000 | | Expiration: January 2014, Exercise Price: $100.00 | | | 5 | | | 2 | |
| | | | | | | | | 1,739 | |
| | | Real Estate | | | | | | | |
| | | General Growth Properties, Inc. | | | | | | | |
| GGP 140118P00017000 | | Expiration: January 2014, Exercise Price: $17.00 | | | 345 | | | 518 | |
| GGP 150117P00020000 | | Expiration: January 2015, Exercise Price: $20.00 | | | 18 | | | 3,816 | |
The accompanying notes are an integral part of these financial statements.
| KINETICS PORTFOLIOS TRUST — MASTER INVESTMENT PORTFOLIOS |
| The Multi-Disciplinary Portfolio |
Portfolio of Options Written — December 31, 2013 — (Continued) |
| Identifier | | | | | Contracts* | | | Value | |
| | | Real Estate — (Continued) | | | | | | | |
| | | TRI Pointe Homes, Inc. | | | | | | | |
| TPH 140719P00015000 | | Expiration: July 2014, Exercise Price: $15.00 | | | 1 | | $ | 65 | |
| | | Vornado Realty Trust - REIT | | | | | | | |
| VNO 140118P00079000 | | Expiration: January 2014, Exercise Price: $79.00 | | | 1 | | | 7 | |
| | | | | | | | | 4,406 | |
| | | Restaurants | | | | | | | |
| | | The Wendy’s Company | | | | | | | |
| WEN 150117P00007000 | | Expiration: January 2015, Exercise Price: $7.00 | | | 232 | | | 16,820 | |
| WEN 160115P00007000 | | Expiration: January 2016, Exercise Price: $7.00 | | | 72 | | | 7,740 | |
| | | | | | | | | 24,560 | |
| | | Satellite Telecommunications | | | | | | | |
| | | DIRECTV | | | | | | | |
| DTV 140118P00043000 | | Expiration: January 2014, Exercise Price: $43.00 | | | 15 | | | 23 | |
| DTV 140118P00050000 | | Expiration: January 2014, Exercise Price: $50.00 | | | 2 | | | 3 | |
| | | DISH Network Corp. — Class A | | | | | | | |
| DISH 140118P00029000 | | Expiration: January 2014, Exercise Price: $29.00 | | | 3 | | | 15 | |
| DISH 150117P00030000 | | Expiration: January 2015, Exercise Price: $30.00 | | | 26 | | | 1,170 | |
| DISH 150117P00032000 | | Expiration: January 2015, Exercise Price: $32.00 | | | 4 | | | 240 | |
| DISH 150117P00036000 | | Expiration: January 2015, Exercise Price: $36.00 | | | 12 | | | 1,230 | |
| DISH 150117P00040000 | | Expiration: January 2015, Exercise Price: $40.00 | | | 78 | | | 13,650 | |
| DISH 160115P00047000 | | Expiration: January 2016, Exercise Price: $47.00 | | | 36 | | | 19,260 | |
| | | Time Warner Cable Inc. | | | | | | | |
| TWC 140118P00082500 | | Expiration: January 2014, Exercise Price: $82.50 | | | 39 | | | 292 | |
| TWC 140118P00087500 | | Expiration: January 2014, Exercise Price: $87.50 | | | 48 | | | 360 | |
| | | | | | | | | 36,243 | |
| | | Securities, Commodity Contracts, and Other Financial | | | | | | | |
| | | Investments and Related Activities | | | | | | | |
| | | The Charles Schwab Corporation | | | | | | | |
| SCHW 140118P00012000 | | Expiration: January 2014, Exercise Price: $12.00 | | | 110 | | | 275 | |
| SCHW 140118P00015000 | | Expiration: January 2014, Exercise Price: $15.00 | | | 140 | | | 350 | |
| | | CME Group Inc. | | | | | | | |
| CME 140118P00042000 | | Expiration: January 2014, Exercise Price: $42.00 | | | 28 | | | 70 | |
| CME 140118P00052000 | | Expiration: January 2014, Exercise Price: $52.00 | | | 2 | | | 5 | |
| CME 150117P00047500 | | Expiration: January 2015, Exercise Price: $47.50 | | | 25 | | | 1,812 | |
| CME 150117P00057500 | | Expiration: January 2015, Exercise Price: $57.50 | | | 2 | | | 365 | |
| CME 160115P00070000 | | Expiration: January 2016, Exercise Price: $70.00 | | | 30 | | | 26,250 | |
| | | Interactive Brokers Group, Inc. — Class A | | | | | | | |
| IBKR 140118P00012000 | | Expiration: January 2014, Exercise Price: $12.00 | | | 250 | | | 625 | |
The accompanying notes are an integral part of these financial statements.
| KINETICS PORTFOLIOS TRUST — MASTER INVESTMENT PORTFOLIOS |
| The Multi-Disciplinary Portfolio |
Portfolio of Options Written — December 31, 2013 — (Continued) |
| Identifier | | | | | Contracts* | | | Value | |
| | | Securities, Commodity Contracts, and Other Financial | | | | | | | |
| | | Investments and Related Activities — (Continued) | | | | | | | |
| | | IntercontinentalExchange Group, Inc. | | | | | | | |
| ICE1 140118P00023000 | | Expiration: January 2014, Exercise Price: $23.00 | | | 74 | | $ | 370 | |
| ICE1 140118P00025000 | | Expiration: January 2014, Exercise Price: $25.00 | | | 4 | | | 20 | |
| ICE 140118P00150000 | | Expiration: January 2014, Exercise Price: $150.00 | | | 1 | | | 2 | |
| | | Morgan Stanley | | | | | | | |
| MS 140118P00015000 | | Expiration: January 2014, Exercise Price: $15.00 | | | 232 | | | 116 | |
| MS 140118P00017000 | | Expiration: January 2014, Exercise Price: $17.00 | | | 232 | | | 232 | |
| | | | | | | | | 30,492 | |
| | | Support Activities for Mining | | | | | | | |
| | | Halliburton Company | | | | | | | |
| HAL 140118P00030000 | | Expiration: January 2014, Exercise Price: $30.00 | | | 180 | | | 180 | |
| | | Transocean Ltd. | | | | | | | |
| RIG 150117P00045000 | | Expiration: January 2015, Exercise Price: $45.00 | | | 20 | | | 7,800 | |
| RIG 160115P00045000 | | Expiration: January 2016, Exercise Price: $45.00 | | | 40 | | | 24,700 | |
| RIG 160115P00050000 | | Expiration: January 2016, Exercise Price: $50.00 | | | 10 | | | 9,200 | |
| | | | | | | | | 41,880 | |
| | | Support Activities for Transportation | | | | | | | |
| | | Expeditors International of Washington, Inc. | | | | | | | |
| EXPD 140118P00030000 | | Expiration: January 2014, Exercise Price: $30.00 | | | 110 | | | 275 | |
| EXPD 140118P00035000 | | Expiration: January 2014, Exercise Price: $35.00 | | | 84 | | | 420 | |
| EXPD 150117P00035000 | | Expiration: January 2015, Exercise Price: $35.00 | | | 30 | | | 3,975 | |
| | | | | | | | | 4,670 | |
| | | Telecommunications | | | | | | | |
| | | Vodafone Group plc — ADR | | | | | | | |
| VOD 140118P00023000 | | Expiration: January 2014, Exercise Price: $23.00 | | | 321 | | | 803 | |
| | | Transportation Equipment Manufacturing | | | | | | | |
| | | American Railcar Industries, Inc. | | | | | | | |
| ARII 140322P00035000 | | Expiration: March 2014, Exercise Price: $35.00 | | | 56 | | | 1,820 | |
| ARII 140322P00040000 | | Expiration: March 2014, Exercise Price: $40.00 | | | 2 | | | 210 | |
| ARII 140621P00035000 | | Expiration: June 2014, Exercise Price: $35.00 | | | 36 | | | 3,600 | |
| | | The Boeing Company | | | | | | | |
| BA 140118P00062500 | | Expiration: January 2014, Exercise Price: $62.50 | | | 31 | | | 15 | |
| BA 140118P00065000 | | Expiration: January 2014, Exercise Price: $65.00 | | | 14 | | | 7 | |
| BA 140118P00067500 | | Expiration: January 2014, Exercise Price: $67.50 | | | 9 | | | 4 | |
| BA 140118P00070000 | | Expiration: January 2014, Exercise Price: $70.00 | | | 12 | | | 6 | |
| BA 140118P00072500 | | Expiration: January 2014, Exercise Price: $72.50 | | | 1 | | | 1 | |
The accompanying notes are an integral part of these financial statements.
| KINETICS PORTFOLIOS TRUST — MASTER INVESTMENT PORTFOLIOS |
| The Multi-Disciplinary Portfolio |
Portfolio of Options Written — December 31, 2013 — (Continued) |
| Identifier | | | | | Contracts* | | | Value | |
| | | Transportation Equipment Manufacturing — (Continued) | | | | | | | |
| | | General Dynamics Corporation | | | | | | | |
| GD 140118P00057500 | | Expiration: January 2014, Exercise Price: $57.50 | | | 20 | | $ | 50 | |
| GD 140118P00060000 | | Expiration: January 2014, Exercise Price: $60.00 | | | 25 | | | 62 | |
| GD 140118P00062500 | | Expiration: January 2014, Exercise Price: $62.50 | | | 60 | | | 150 | |
| | | Toyota Motor Corporation - ADR | | | | | | | |
| TM 140118P00070000 | | Expiration: January 2014, Exercise Price: $70.00 | | | 16 | | | 8 | |
| TM 140118P00075000 | | Expiration: January 2014, Exercise Price: $75.00 | | | 14 | | | 7 | |
| TM 140118P00085000 | | Expiration: January 2014, Exercise Price: $85.00 | | | 15 | | | 8 | |
| TM 140118P00087500 | | Expiration: January 2014, Exercise Price: $87.50 | | | 25 | | | 25 | |
| | | | | | | | | 5,973 | |
| | | U.S. Equity Exchanges | | | | | | | |
| | | The NASDAQ OMX Group, Inc. | | | | | | | |
| NDAQ 140118P00020000 | | Expiration: January 2014, Exercise Price: $20.00 | | | 30 | | | 75 | |
| NDAQ 140118P00023000 | | Expiration: January 2014, Exercise Price: $23.00 | | | 100 | | | 250 | |
| NDAQ 140118P00025000 | | Expiration: January 2014, Exercise Price: $25.00 | | | 170 | | | 425 | |
| NDAQ 140118P00027000 | | Expiration: January 2014, Exercise Price: $27.00 | | | 51 | | | 128 | |
| | | | | | | | | 878 | |
| | | Waste Management and Remediation Services | | | | | | | |
| | | Waste Management, Inc. | | | | | | | |
| WM 140118P00025000 | | Expiration: January 2014, Exercise Price: $25.00 | | | 35 | | | 88 | |
| WM 140118P00030000 | | Expiration: January 2014, Exercise Price: $30.00 | | | 57 | | | 142 | |
| | | | | | | | | 230 | |
| | | TOTAL PUT OPTIONS WRITTEN | | | | | | | |
| | | (premiums received $5,343,721) | | | | | | $2,012,182 | |
* — 100 Shares Per Contract.
ADR — American Depository Receipt.
ETF — Exchange Traded Fund.
REIT — Real Estate Investment Trust.
The accompanying notes are an integral part of these financial statements.
| KINETICS PORTFOLIOS TRUST — MASTER INVESTMENT PORTFOLIOS |
| Statements of Assets & Liabilities |
| December 31, 2013 |
| | | The Internet | | | The Global | |
| | | Portfolio | | | Portfolio | |
| ASSETS: | | | | | | |
Investments, at value (1)(2) | | $ | 208,245,969 | | | $ | 15,799,573 | |
Foreign currencies, at value (3) | | | — | | | | 328 | |
| Cash | | | 1,990 | | | | 43,798 | |
| Receivable for contributed capital | | | 913,417 | | | | 1,817 | |
| Receivable for investments sold | | | — | | | | 225 | |
| Dividends and interest receivable | | | 81,617 | | | | 13,947 | |
| Other accounts receivable | | | 99,877 | | | | — | |
| Prepaid expenses and other assets | | | 11,734 | | | | 5,126 | |
| Total Assets | | | 209,354,604 | | | | 15,864,814 | |
| LIABILITIES: | | | | | | | | |
| Payable to Adviser | | | 184,072 | | | | 12,811 | |
| Payable to Trustees and Officers | | | 6,711 | | | | 385 | |
| Payable for securities purchased | | | — | | | | 96,981 | |
| Payable for collateral received for securities loaned | | | 29,816,268 | | | | 3,519,916 | |
| Payable for withdrawn capital | | | 448,752 | | | | 3,748 | |
| Accrued expenses and other liabilities | | | 39,757 | | | | 13,858 | |
| Total Liabilities | | | 30,495,560 | | | | 3,647,699 | |
| Net Assets | | $ | 178,859,044 | | | $ | 12,217,115 | |
(1) Cost of investments | | $ | 117,372,747 | | | $ | 12,989,084 | |
(2) Includes loaned securities with a market value of | | $ | 28,959,111 | | | $ | 3,458,039 | |
(3) Cost of foreign currencies | | $ | — | | | $ | 328 | |
The accompanying notes are an integral part of these financial statements.
| KINETICS PORTFOLIOS TRUST — MASTER INVESTMENT PORTFOLIOS |
Statements of Assets & Liabilities — (Continued) |
| December 31, 2013 |
| | | The Paradigm | | | The Medical | |
| | | Portfolio | | | Portfolio | |
| ASSETS: | | | | | | |
Investments, at value (1)(2) | | $ | 1,527,688,874 | | | $ | 26,916,486 | |
| Cash | | | 24,683 | | | | — | |
| Receivable for contributed capital | | | 2,031,997 | | | | 95,580 | |
| Receivable for investments sold | | | 1,195,264 | | | | 463,680 | |
| Dividends and interest receivable | | | 1,681,800 | | | | 38,843 | |
| Prepaid expenses and other assets | | | 196,072 | | | | 6,444 | |
| Total Assets | | | 1,532,818,690 | | | | 27,521,033 | |
| LIABILITIES: | | | | | | | | |
| Payable to Adviser | | | 1,387,813 | | | | 25,947 | |
| Payable to Trustees and Officers | | | 44,414 | | | | 873 | |
| Payable for securities purchased | | | 2,388,859 | | | | — | |
| Payable for collateral received for securities loaned | | | 199,757,066 | | | | 2,689,850 | |
| Payable for withdrawn capital | | | 1,308,127 | | | | 2,778 | |
| Accrued expenses and other liabilities | | | 188,814 | | | | 12,247 | |
| Total Liabilities | | | 205,075,093 | | | | 2,731,695 | |
| Net Assets | | $ | 1,327,743,597 | | | $ | 24,789,338 | |
(1) Cost of investments | | $ | 1,080,684,273 | | | $ | 19,400,681 | |
(2) Includes loaned securities with a market value of | | $ | 194,641,999 | | | $ | 2,537,862 | |
The accompanying notes are an integral part of these financial statements.
| KINETICS PORTFOLIOS TRUST — MASTER INVESTMENT PORTFOLIOS |
Statements of Assets & Liabilities — (Continued) |
| December 31, 2013 |
| | | The Small Cap | | | The Market | |
| | | Opportunities | | | Opportunities | |
| | | Portfolio | | | Portfolio | |
| ASSETS: | | | | | | |
Investments, at value (1)(2) | | $ | 419,892,641 | | | $ | 71,512,840 | |
| Cash | | | — | | | | 3,468,469 | |
| Receivable for contributed capital | | | 4,544,890 | | | | 439,162 | |
| Dividends and interest receivable | | | 352,507 | | | | 152,442 | |
| Other accounts receivable | | | 20,977 | | | | — | |
| Prepaid expenses and other assets | | | 57,137 | | | | 17,360 | |
| Total Assets | | | 424,868,152 | | | | 75,590,273 | |
| LIABILITIES: | | | | | | | | |
| Payable to Adviser | | | 339,806 | | | | 67,002 | |
| Payable to Trustees and Officers | | | 7,178 | | | | 2,244 | |
| Payable for securities purchased | | | 6,622,465 | | | | 232,993 | |
| Payable for collateral received for securities loaned | | | 69,687,876 | | | | 8,695,710 | |
| Payable for withdrawn capital | | | 170,479 | | | | 9,508 | |
| Accrued expenses and other liabilities | | | 42,113 | | | | 21,503 | |
| Total Liabilities | | | 76,869,917 | | | �� | 9,028,960 | |
| Net Assets | | $ | 347,998,235 | | | $ | 66,561,313 | |
(1) Cost of investments | | $ | 335,919,866 | | | $ | 51,552,987 | |
(2) Includes loaned securities with a market value of | | $ | 67,341,896 | | | $ | 8,555,011 | |
The accompanying notes are an integral part of these financial statements.
| KINETICS PORTFOLIOS TRUST — MASTER INVESTMENT PORTFOLIOS |
Statements of Assets & Liabilities — (Continued) |
| December 31, 2013 |
| | | The Alternative | | | The Multi- | |
| | | Income | | | Disciplinary | |
| | | Portfolio | | | Portfolio | |
| ASSETS: | | | | | | |
Investments, at value (1)(2) | | $ | 21,218,875 | | | $ | 72,921,841 | |
| Cash | | | 2,788,387 | | | | 26,375,133 | |
| Receivable for contributed capital | | | 614,972 | | | | 706,548 | |
| Receivable for investments sold | | | 20,644 | | | | 32,483 | |
| Dividends and interest receivable | | | 71,792 | | | | 604,679 | |
| Other accounts receivable | | | 36,278 | | | | — | |
| Prepaid expenses and other assets | | | 316 | | | | 1,876 | |
| Total Assets | | | 24,751,264 | | | | 100,642,560 | |
| LIABILITIES: | | | | | | | | |
Written options, at value (3) | | | 535,155 | | | | 2,012,182 | |
| Payable to Adviser | | | 16,599 | | | | 92,639 | |
| Payable to Trustees and Officers | | | 721 | | | | 3,521 | |
| Payable for securities purchased | | | 263,908 | | | | 943,967 | |
| Payable for collateral received for securities loaned | | | 349,200 | | | | 7,084,608 | |
| Payable for withdrawn capital | | | 16,331 | | | | 170,016 | |
| Accrued expenses and other liabilities | | | 16,319 | | | | 24,119 | |
| Total Liabilities | | | 1,198,233 | | | | 10,331,052 | |
| Net Assets | | $ | 23,553,031 | | | $ | 90,311,508 | |
(1) Cost of investments | | $ | 21,276,045 | | | $ | 75,645,848 | |
(2) Includes loaned securities with a market value of | | $ | 342,030 | | | $ | 6,926,554 | |
(3) Premiums received | | $ | 1,141,683 | | | $ | 5,343,721 | |
The accompanying notes are an integral part of these financial statements.
| KINETICS PORTFOLIOS TRUST — MASTER INVESTMENT PORTFOLIOS |
| Statements of Operations |
| For the Year Ended December 31, 2013 |
| | | The Internet | | | The Global | |
| | | Portfolio | | | Portfolio | |
| INVESTMENT INCOME: | | | | | | |
| Dividends† | | $ | 847,576 | | | $ | 122,213 | |
| Interest | | | 1,962 | | | | 127 | |
| Income from securities lending | | | 73,290 | | | | 25,428 | |
| Total investment income | | | 922,828 | | | | 147,768 | |
| EXPENSES: | | | | | | | | |
| Investment advisory fees | | | 2,162,480 | | | | 115,102 | |
| Administration fees | | | 76,300 | | | | 4,040 | |
| Professional fees | | | 19,786 | | | | 8,375 | |
| Fund accounting fees | | | 35,444 | | | | 7,216 | |
| Trustees’ and Officers’ fees and expenses | | | 19,557 | | | | 1,020 | |
| Custodian fees and expenses | | | 55,099 | | | | 22,966 | |
| Other expenses | | | 8,722 | | | | 365 | |
| Total expenses | | | 2,377,388 | | | | 159,084 | |
| Net investment loss | | | (1,454,560 | ) | | | (11,316 | ) |
| REALIZED AND UNREALIZED GAIN ON INVESTMENTS: | | | | | | | | |
| Net realized gain on: | | | | | | | | |
| Investments and foreign currency | | | 11,541,829 | | | | 66,750 | |
| Realized gain distributions received from other investment companies | | | — | | | | 237 | |
| Net change in unrealized appreciation of: | | | | | | | | |
| Investments and foreign currency | | | 52,885,945 | | | | 2,171,749 | |
| Net realized and unrealized gain on investments | | | 64,427,774 | | | | 2,238,736 | |
| Net increase in net assets resulting from operations | | $ | 62,973,214 | | | $ | 2,227,420 | |
| † Net of foreign taxes withheld of: | | $ | 9,878 | | | $ | 9,781 | |
The accompanying notes are an integral part of these financial statements.
| KINETICS PORTFOLIOS TRUST — MASTER INVESTMENT PORTFOLIOS |
Statements of Operations — (Continued) |
| For the Year Ended December 31, 2013 |
| | | The Paradigm | | | The Medical | |
| | | Portfolio | | | Portfolio | |
| INVESTMENT INCOME: | | | | | | |
| Dividends† | | $ | 10,831,723 | | | $ | 244,386 | |
| Interest | | | 241,068 | | | | 78 | |
| Income from securities lending | | | 1,368,787 | | | | 61,574 | |
| Total investment income | | | 12,441,578 | | | | 306,038 | |
| EXPENSES: | | | | | | | | |
| Investment advisory fees | | | 13,886,029 | | | | 275,563 | |
| Administration fees | | | 491,432 | | | | 9,773 | |
| Professional fees | | | 77,683 | | | | 9,200 | |
| Fund accounting fees | | | 195,134 | | | | 6,736 | |
| Trustees’ and Officers’ fees and expenses | | | 119,655 | | | | 2,376 | |
| Custodian fees and expenses | | | 134,723 | | | | 5,542 | |
| Other expenses | | | 56,100 | | | | 1,116 | |
| Total expenses | | | 14,960,756 | | | | 310,306 | |
| Net investment income (loss) | | | (2,519,178 | ) | | | (4,268 | ) |
| REALIZED AND UNREALIZED GAIN (LOSS) ON INVESTMENTS: | | | | | | | | |
| Net realized gain (loss) on: | | | | | | | | |
| Investments and foreign currency | | | 992,713 | | | | (341,050 | ) |
| Net change in unrealized appreciation of: | | | | | | | | |
| Investments and foreign currency | | | 400,868,795 | | | | 8,692,907 | |
| Net realized and unrealized gain on investments | | | 401,861,508 | | | | 8,351,857 | |
| Net increase in net assets resulting from operations | | $ | 399,342,330 | | | $ | 8,347,589 | |
| † Net of foreign taxes withheld of: | | $ | 873,822 | | | $ | 14,635 | |
The accompanying notes are an integral part of these financial statements.
| KINETICS PORTFOLIOS TRUST — MASTER INVESTMENT PORTFOLIOS |
Statements of Operations — (Continued) |
| For the Year Ended December 31, 2013 |
| | | The Small Cap | | | The Market | |
| | | Opportunities | | | Opportunities | |
| | | Portfolio | | | Portfolio | |
| INVESTMENT INCOME: | | | | | | |
| Dividends† | | $ | 2,196,171 | | | $ | 882,838 | |
| Interest | | | 1,615 | | | | 705 | |
| Income from securities lending | | | 165,874 | | | | 70,766 | |
| Total investment income | | | 2,363,660 | | | | 954,309 | |
| EXPENSES: | | | | | | | | |
| Investment advisory fees | | | 2,172,159 | | | | 712,458 | |
| Administration fees | | | 75,462 | | | | 25,400 | |
| Professional fees | | | 17,302 | | | | 11,431 | |
| Fund accounting fees | | | 30,297 | | | | 15,003 | |
| Trustees’ and Officers’ fees and expenses | | | 17,024 | | | | 6,190 | |
| Custodian fees and expenses | | | 22,636 | | | | 25,090 | |
| Other expenses | | | 5,364 | | | | 2,728 | |
| Total expenses | | | 2,340,244 | | | | 798,300 | |
| Net investment income | | | 23,416 | | | | 156,009 | |
| REALIZED AND UNREALIZED GAIN ON INVESTMENTS: | | | | | | | | |
| Net realized gain on: | | | | | | | | |
| Investments and foreign currency | | | 912,482 | | | | 4,579,643 | |
| Realized gain distributions received from other investment companies | | | — | | | | 7,524 | |
| Net change in unrealized appreciation of: | | | | | | | | |
| Investments and foreign currency | | | 74,243,893 | | | | 16,103,917 | |
| Net realized and unrealized gain on investments | | | 75,156,375 | | | | 20,691,084 | |
| Net increase in net assets resulting from operations | | $ | 75,179,791 | | | $ | 20,847,093 | |
| † Net of foreign taxes withheld of: | | $ | 131,509 | | | $ | 41,142 | |
The accompanying notes are an integral part of these financial statements.
| KINETICS PORTFOLIOS TRUST — MASTER INVESTMENT PORTFOLIOS |
Statements of Operations — (Continued) |
| For the Year Ended December 31, 2013 |
| | | The Alternative | | | The Multi- | |
| | | Income | | | Disciplinary | |
| | | Portfolio | | | Portfolio | |
| INVESTMENT INCOME: | | | | | | |
| Dividends | | $ | 41,004 | | | $ | 243,931 | |
| Interest | | | 81,703 | | | | 2,567,851 | |
| Income from securities lending | | | 1,806 | | | | 11,995 | |
| Total investment income | | | 124,513 | | | | 2,823,777 | |
| EXPENSES: | | | | | | | | |
| Investment advisory fees | | | 156,657 | | | | 1,084,708 | |
| Administration fees | | | 7,686 | | | | 41,322 | |
| Professional fees | | | 14,220 | | | | 13,681 | |
| Fund accounting fees | | | 31,770 | | | | 36,316 | |
| Trustees’ and Officers’ fees and expenses | | | 1,850 | | | | 9,662 | |
| Custodian fees and expenses | | | 4,990 | | | | 6,713 | |
| Borrowing expense on securities sold short | | | — | | | | 7,165 | |
| Other expenses | | | 760 | | | | 3,157 | |
| Total expenses | | | 217,933 | | | | 1,202,724 | |
| Net investment income (loss) | | | 93,420 | | | | 1,621,053 | |
| REALIZED AND UNREALIZED GAIN (LOSS) ON INVESTMENTS: | | | | | | | | |
| Net realized gain (loss) on: | | | | | | | | |
| Investments and foreign currency | | | 18,450 | | | | 1,113,583 | |
| Written option contracts expired or closed | | | 312,485 | | | | 1,375,154 | |
| Securities sold short | | | — | | | | (141,511 | ) |
| Realized gain distributions received from other investment companies | | | 1,072 | | | | 34,336 | |
| Net change in unrealized appreciation (depreciation) of: | | | | | | | | |
| Investments and foreign currency | | | (7,210 | ) | | | (1,608,149 | ) |
| Written option contracts | | | 606,358 | | | | 874,785 | |
| Securities sold short | | | — | | | | (10,217 | ) |
| Net realized and unrealized gain on investments | | | 931,155 | | | | 1,637,981 | |
| Net increase in net assets resulting from operations | | $ | 837,735 | | | $ | 3,259,034 | |
The accompanying notes are an integral part of these financial statements.
| KINETICS PORTFOLIOS TRUST — MASTER INVESTMENT PORTFOLIOS |
Statements of Changes in Net Assets — (Continued) |
| | | The Internet Portfolio | | | The Global Portfolio | |
| | | For the | | | For the | | | For the | | | For the | |
| | | Year Ended | | | Year Ended | | | Year Ended | | | Year Ended | |
| | | December 31, | | | December 31, | | | December 31, | | | December 31, | |
| | | 2013 | | | 2012 | | | 2013 | | | 2012 | |
| OPERATIONS: | | | | | | | | | | | | |
| Net investment income (loss) | | $ | (1,454,560 | ) | | $ | 189,258 | | | $ | (11,316 | ) | | $ | 22,327 | |
| Net realized gain on sale of investments, foreign currency and distributions received from other investment companies | | | 11,541,829 | | | | 4,840,072 | | | | 66,987 | | | | 105,224 | |
| Net change in unrealized appreciation of investments and foreign currency | | | 52,885,945 | | | | 19,951,987 | | | | 2,171,749 | | | | 1,012,392 | |
| Net increase in net assets resulting from operations | | | 62,973,214 | | | | 24,981,317 | | | | 2,227,420 | | | | 1,139,943 | |
| NET INCREASE (DECREASE) IN NET ASSETS RESULTING FROM BENEFICIAL INTEREST TRANSACTIONS: | | | | | | | | | | | | | | | | |
| Contributions | | | 12,808,479 | | | | 40,015,908 | | | | 4,489,494 | | | | 2,922,314 | |
| Withdrawals | | | (53,634,097 | ) | | | (13,342,552 | ) | | | (1,037,208 | ) | | | (1,645,472 | ) |
| Net increase (decrease) in net assets resulting from beneficial interest transactions | | | (40,825,618 | ) | | | 26,673,356 | | | | 3,452,286 | | | | 1,276,842 | |
| Total increase in net assets | | | 22,147,596 | | | | 51,654,673 | | | | 5,679,706 | | | | 2,416,785 | |
| NET ASSETS: | | | | | | | | | | | | | | | | |
| Beginning of year | | | 156,711,448 | | | | 105,056,775 | | | | 6,537,409 | | | | 4,120,624 | |
| End of year | | $ | 178,859,044 | | | $ | 156,711,448 | | | $ | 12,217,115 | | | $ | 6,537,409 | |
The accompanying notes are an integral part of these financial statements.
| KINETICS PORTFOLIOS TRUST — MASTER INVESTMENT PORTFOLIOS |
Statements of Changes in Net Assets — (Continued) |
| | | The Paradigm Portfolio | | | The Medical Portfolio | |
| | | For the | | | For the | | | For the | | | For the | |
| | | Year Ended | | | Year Ended | | | Year Ended | | | Year Ended | |
| | | December 31, | | | December 31, | | | December 31, | | | December 31, | |
| | | 2013 | | | 2012 | | | 2013 | | | 2012 | |
| OPERATIONS: | | | | | | | | | | | | |
| Net investment income (loss) | | $ | (2,519,178 | ) | | $ | 4,387,305 | | | $ | (4,268 | ) | | $ | 308,836 | |
| Net realized gain (loss) on sale of investments, foreign currency and distributions received from other investment companies | | | 992,713 | | | | 38,634,514 | | | | (341,050 | ) | | | 524,454 | |
| Net change in unrealized appreciation of investments and foreign currency | | | 400,868,795 | | | | 132,659,116 | | | | 8,692,907 | | | | 852,320 | |
| Net increase in net assets resulting from operations | | | 399,342,330 | | | | 175,680,935 | | | | 8,347,589 | | | | 1,685,610 | |
| NET INCREASE (DECREASE) IN NET ASSETS RESULTING FROM BENEFICIAL INTEREST TRANSACTIONS: | | | | | | | | | | | | | | | | |
| Contributions | | | 130,575,410 | | | | 52,951,684 | | | | 5,013,915 | | | | 486,550 | |
| Withdrawals | | | (85,425,092 | ) | | | (190,008,480 | ) | | | (5,881,082 | ) | | | (5,069,761 | ) |
| Net increase (decrease) in net assets resulting from beneficial interest transactions | | | 45,150,318 | | | | (137,056,796 | ) | | | (867,167 | ) | | | (4,583,211 | ) |
| Total increase (decrease) in net assets | | | 444,492,648 | | | | 38,624,139 | | | | 7,480,422 | | | | (2,897,601 | ) |
| NET ASSETS: | | | | | | | | | | | | | | | | |
| Beginning of year | | | 883,250,949 | | | | 844,626,810 | | | | 17,308,916 | | | | 20,206,517 | |
| End of year | | $ | 1,327,743,597 | | | $ | 883,250,949 | | | $ | 24,789,338 | | | $ | 17,308,916 | |
The accompanying notes are an integral part of these financial statements.
| KINETICS PORTFOLIOS TRUST — MASTER INVESTMENT PORTFOLIOS |
Statements of Changes in Net Assets — (Continued) |
| | | The Small Cap | | | The Market | |
| | | Opportunities Portfolio | | | Opportunities Portfolio | |
| | | For the | | | For the | | | For the | | | For the | |
| | | Year Ended | | | Year Ended | | | Year Ended | | | Year Ended | |
| | | December 31, | | | December 31, | | | December 31, | | | December 31, | |
| | | 2013 | | | 2012 | | | 2013 | | | 2012 | |
| OPERATIONS: | | | | | | | | | | | | |
| Net investment income | | $ | 23,416 | | | $ | 225,038 | | | $ | 156,009 | | | $ | 196,072 | |
| Net realized gain on sale of investments, foreign currency and distributions received from other investment companies | | | 912,482 | | | | 7,836,504 | | | | 4,587,167 | | | | 4,863,610 | |
| Net change in unrealized appreciation of investments and foreign currency | | | 74,243,893 | | | | 12,110,059 | | | | 16,103,917 | | | | 2,198,782 | |
| Net increase in net assets resulting from operations | | | 75,179,791 | | | | 20,171,601 | | | | 20,847,093 | | | | 7,258,464 | |
| NET INCREASE (DECREASE) IN NET ASSETS RESULTING FROM BENEFICIAL INTEREST TRANSACTIONS: | | | | | | | | | | | | | | | | |
| Contributions | | | 200,357,556 | | | | 355,647 | | | | 28,774,153 | | | | 104,996 | |
| Withdrawals | | | (9,127,095 | ) | | | (21,968,834 | ) | | | (26,698,470 | ) | | | (6,941,845 | ) |
| Net increase (decrease) in net assets resulting from beneficial interest transactions | | | 191,230,461 | | | | (21,613,187 | ) | | | 2,075,683 | | | | (6,836,849 | ) |
| Total increase (decrease) in net assets | | | 266,410,252 | | | | (1,441,586 | ) | | | 22,922,776 | | | | 421,615 | |
| NET ASSETS: | | | | | | | | | | | | | | | | |
| Beginning of year | | | 81,587,983 | | | | 83,029,569 | | | | 43,638,537 | | | | 43,216,922 | |
| End of year | | $ | 347,998,235 | | | $ | 81,587,983 | | | $ | 66,561,313 | | | $ | 43,638,537 | |
The accompanying notes are an integral part of these financial statements.
| KINETICS PORTFOLIOS TRUST — MASTER INVESTMENT PORTFOLIOS |
Statements of Changes in Net Assets — (Continued) |
| | | The Alternative | | | The Multi- | |
| | | Income Portfolio | | | Disciplinary Portfolio | |
| | | For the | | | For the | | | For the | | | For the | |
| | | Year Ended | | | Year Ended | | | Year Ended | | | Year Ended | |
| | | December 31, | | | December 31, | | | December 31, | | | December 31, | |
| | | 2013 | | | 2012 | | | 2013 | | | 2012 | |
| OPERATIONS: | | | | | | | | | | | | |
| Net investment income (loss) | | $ | (93,420 | ) | | $ | 229,919 | | | $ | 1,621,053 | | | $ | 1,367,870 | |
| Net realized gain on sale of investments, foreign currency, written options, securities sold short and distributions received from other investment companies | | | 332,007 | | | | 315,020 | | | | 2,381,562 | | | | 1,191,225 | |
| Net change in unrealized appreciation (depreciation) of investments, foreign currency, written options and securities sold short | | | 599,148 | | | | 608,301 | | | | (743,581 | ) | | | 2,750,170 | |
| Net increase in net assets resulting from operations | | | 837,735 | | | | 1,153,240 | | | | 3,259,034 | | | | 5,309,265 | |
| NET INCREASE (DECREASE) IN NET ASSETS RESULTING FROM BENEFICIAL INTEREST TRANSACTIONS: | | | | | | | | | | | | | | | | |
| Contributions | | | 15,277,302 | | | | 2,343,426 | | | | 49,389,741 | | | | 34,091,278 | |
| Withdrawals | | | (3,357,344 | ) | | | (6,080,519 | ) | | | (21,888,150 | ) | | | (3,583,117 | ) |
| Net increase (decrease) in net assets resulting from beneficial interest transactions | | | 11,919,958 | | | | (3,737,093 | ) | | | 27,501,591 | | | | 30,508,161 | |
| Total increase (decrease) in net assets | | | 12,757,693 | | | | (2,583,853 | ) | | | 30,760,625 | | | | 35,817,426 | |
| NET ASSETS: | | | | | | | | | | | | | | | | |
| Beginning of year | | | 10,795,338 | | | | 13,379,191 | | | | 59,550,883 | | | | 23,733,457 | |
| End of year | | $ | 23,553,031 | | | $ | 10,795,338 | | | $ | 90,311,508 | | | $ | 59,550,883 | |
The accompanying notes are an integral part of these financial statements.
| KINETICS PORTFOLIOS TRUST — MASTER INVESTMENT PORTFOLIOS |
| Notes to Financial Statements |
| December 31, 2013 |
1. Organization
The Kinetics Portfolios Trust (the “Trust”) was organized as a Delaware Statutory Trust on March 14, 2000 and is registered under the Investment Company Act of 1940, as amended (the “1940 Act”), as an open-end management investment company issuing its beneficial interests in series, each series representing a distinct portfolio with its own investment objective and policies. The series currently authorized are: The Internet Portfolio, The Global Portfolio, The Paradigm Portfolio, The Medical Portfolio, The Small Cap Opportunities Portfolio, The Market Opportunities Portfolio, The Alternative Income Portfolio (formerly the Water Infrastructure Portfolio) and The Multi-Disciplinary Portfolio (collectively, the “Master Portfolios”). Pursuant to the 1940 Act, the Master Portfolios, are “non-diversified” series of the Trust. The Market Opportunities Portfolio commenced operations on January 31, 2006, The Alternative Income Portfolio commenced operations on June 29, 2007 and The Multi-Disciplinary Portfolio commenced operations on February 11, 2008. Each of the remaining Master Portfolios commenced operations on April 28, 2000.
Each Master Portfolio is a Master Investment Portfolio in a master-feeder fund structure. Each Master Portfolio has multiple feeder funds invested in the Master Portfolio. By contributing assets to the Master Portfolio, the feeder funds receive a beneficial interest in the Master Portfolio. The Master Portfolio then invests the contributed assets in portfolio securities and allocates income, gains (losses) and expenses to the feeder funds based on the feeder funds’ proportionate interests in the Master Portfolio.
Each of the Master Portfolios, except for The Alternative Income Portfolio and The Multi-Disciplinary Portfolio, seeks to provide investors with long-term capital growth. The Alternative Income Portfolio seeks to provide investors with current income and gains. The Multi-Disciplinary Portfolio seeks to provide investors with total return. The Internet Portfolio invests primarily in the equity securities of U.S. and foreign companies engaged in the Internet and Internet-related activities. The Global Portfolio generally invests in the equity securities of foreign companies that have the ability to facilitate an increase in the growth of their traditional business lines and in U.S. companies benefiting from international economic growth. The Paradigm Portfolio invests primarily in the equity securities of U.S. and foreign companies that the investment adviser believes are undervalued and that have high returns on equity and are well positioned to reduce their costs, extend the reach of their distribution channels and experience significant growth in their assets or revenues. The Medical
| KINETICS PORTFOLIOS TRUST — MASTER INVESTMENT PORTFOLIOS |
Notes to Financial Statements — (Continued) |
| December 31, 2013 |
Portfolio invests primarily in the equity securities of U.S. and foreign companies engaged in medical research, pharmaceutical treatments and related medical technology industries and related technology industries, generally, with a focus on companies engaged in cancer research and drug development. The Small Cap Opportunities Portfolio invests primarily in the equity securities of U.S. and foreign small capitalized companies that provide attractive valuation opportunities due to special situations such as lack of institutional ownership, lack of significant analyst coverage or companies with sound fundamentals that have experienced a short-term earnings shortfall. The Market Opportunities Portfolio invests primarily in the equity securities of U.S. and foreign companies engaged in capital markets or related to capital markets, as well as companies involved in the gaming industry. The Alternative Income and Multi-Disciplinary Portfolios utilize a two-part investment strategy, which includes fixed income and derivatives components.
2. Significant Accounting Policies
Security Valuation
Master Portfolio securities that are listed on a U.S. securities exchange for which market quotations are readily available are valued at the last quoted sale price on the day the valuation is made. Price information on listed securities is taken from the exchange where the security is primarily traded. All equity securities that are traded using the National Association of Securities Dealers’ Automated Quotation System (“NASDAQ”) are valued using the NASDAQ Official Closing Price (“NOCP”). Foreign securities are valued by an independent pricing service. In the event market quotations are not readily available or if events occur that may materially affect the value of a particular security between the time trading ends on a particular security and the close of regular trading on the New York Stock Exchange (“NYSE”), “fair value” will be determined. Unlisted U.S. securities and listed U.S. securities not traded on the valuation date for which market quotations are readily available are valued at the last bid price. Exchange traded options are valued at the composite price, using the National Best Bid and Offer quotes (“NBBO”). NBBO consists of the highest bid price and lowest ask price across any of the exchanges on which an option is quoted thus providing a view across the entire U.S. options marketplace. Composite option pricing calculates the mean of the highest bid price and lowest ask price across the exchanges where the option is traded. If the composite option price is not available, the mean between the highest bid and the lowest asked quotations at the close of the exchanges will be used. If
| KINETICS PORTFOLIOS TRUST — MASTER INVESTMENT PORTFOLIOS |
Notes to Financial Statements — (Continued) |
| December 31, 2013 |
none of the above are available, exchange traded options are valued at the last quoted sales price. Non-exchange traded options for which over-the-counter quotations are not readily available are valued at the mean of the current bid and asked prices. Fixed-income securities (other than obligations having a maturity of 60 days or less) are normally valued on the basis of quotes obtained from pricing services, which take into account appropriate factors such as institutional-sized trading in similar groups of securities, yield, quality, coupon rate, maturity, type of issue, trading characteristics and other market data. Instruments with remaining maturities of 60 days or less are valued at amortized cost, which approximates fair value. Other assets and securities for which no quotations are readily available (including restricted securities) will be valued in good faith at fair value using methods determined by the Board of Trustees of the Master Portfolios. In determining the fair value of a security, the Board of Trustees shall take into account the relevant factors and surrounding circumstances, which may include: (i) the nature and pricing history (if any) of the security; (ii) whether any dealer quotations for the security are available; (iii) possible valuation methodologies that could be used to determine the fair value of the security; (iv) the recommendation of the portfolio manager of the Portfolios with respect to the valuation of the security; (v) whether the same or similar securities are held by other funds managed by the Advisor or other funds and the method used to price the security in those funds; (vi) the extent to which the fair value to be determined for the security will result from the use of data or formula produced by third parties independent of the Advisor; (vii) the liquidity or illiquidity of the market for the security; and (viii) the value of a foreign security traded on other foreign markets. At December 31, 2013, 0.00%, 0.00%, 0.00%, 0.06% and 0.58% of the net assets of The Internet Portfolio, The Paradigm Portfolio, The Medical Portfolio, The Market Opportunities Portfolio and The Multi-Disciplinary Portfolio, respectively, were fair valued securities. The other Master Portfolios did not hold any fair valued securities at December 31, 2013.
Repurchase Agreements
Each Master Portfolio may enter into repurchase agreements with banks that are members of the Federal Reserve System or securities dealers who are members of a national securities exchange or are primary dealers in U.S. Government Securities. In connection with transactions in repurchase agreements, it is the Trust’s policy that the Master Portfolio receive, as collateral, securities whose market value, including accrued interest, at all times will be at least equal to 102% of the amount invested by the Master Portfolio in each repurchase
| KINETICS PORTFOLIOS TRUST — MASTER INVESTMENT PORTFOLIOS |
Notes to Financial Statements — (Continued) |
| December 31, 2013 |
agreement. If the seller defaults, and the value of the collateral declines, realization of the collateral by the Master Portfolio may be delayed or limited.
Written Option Accounting
The Master Portfolios may write (sell) call or put options for trading or hedging purposes. When a Master Portfolio writes an option, an amount equal to the premium received by the Master Portfolio is included in the Statement of Assets and Liabilities as an asset and an equivalent liability. The amount of the liability is subsequently marked-to-market to reflect the current value of the option written. By writing the option, the Master Portfolio may become obligated during the term of the option to deliver or purchase the securities underlying the option at the exercise price if the option is exercised. When an option expires on its stipulated expiration date or the Master Portfolio enters into a closing purchase transaction, the Master Portfolio realizes a gain or loss if the cost of the closing transaction differs from the premium received when the option was sold, without regard to any unrealized gain or loss on the underlying security, and the liability related to such option is eliminated. When an option is exercised, the premium originally received decreases the cost basis of the underlying security (or increases the proceeds on the security sold short) and the Master Portfolio realizes a gain or loss from the sale of the security (or closing of the short sale). As collateral for uncovered written options, the Master Portfolio is required under the 1940 Act to maintain assets consisting of cash, cash equivalents or liquid securities. This collateral is required to be adjusted daily to reflect the exercise price of the purchase obligation for put options or the market value of the instrument underlying the contract for call options.
Foreign Currency Translations
The books and records of the Master Portfolios are maintained in U.S. dollars. For the Master Portfolios, foreign currency transactions are translated into U.S. dollars on the following basis: (i) market values of investment securities and other assets and liabilities are translated at the exchange rate of such currencies against the U.S. dollar, as provided by an approved pricing service, and (ii) purchases and sales of investment securities, dividend and interest income and certain expenses at the rates of exchange prevailing on the respective dates of such transactions. The Master Portfolios do not isolate and treat as ordinary income that portion of the results of operations arising as a result of changes in the exchange rate from the fluctuations arising from changes in the market prices of securities held during the period. Such fluctuations are included with
| KINETICS PORTFOLIOS TRUST — MASTER INVESTMENT PORTFOLIOS |
Notes to Financial Statements — (Continued) |
| December 31, 2013 |
the net realized and unrealized gain or loss from investments. However, for federal income tax purposes, the Master Portfolios do isolate and treat as ordinary income the effect of changes in foreign exchange rates arising from actual foreign currency transactions and the effect of changes in foreign exchange rates arising between trade date and settlement date.
Restricted and Illiquid Securities
The Master Portfolios may invest in restricted securities. These securities are valued by the Master Portfolios after giving due consideration to pertinent factors including recent private sales, market conditions and the issuer’s financial performance. The Master Portfolios have no right to require registration of unregistered securities. At December 31, 2013 the following Master Portfolios held securities restricted to institutional investors (144A Securities):
| | | | | | Percentage of |
| | | Market Value | | Net Assets |
| The Multi-Disciplinary Portfolio | | $ | 5,533,094 | | | 6.13 | % |
| The Alternative Income Portfolio | | | 200,440 | | | 0.85 | % |
An illiquid asset is any asset which may not be sold or disposed of in the ordinary course of business within seven days at approximately the value at which the Master Portfolio has valued the investment. At December 31, 2013, the following Master Portfolios held illiquid securities:
| | | | | | Percentage of |
| | | Market Value | | Net Assets |
| The Internet Portfolio | | $ | — | * | | | 0.00 | % |
| The Medical Portfolio | | | — | * | | | 0.00 | % |
| The Paradigm Portfolio | | | — | * | | | 0.00 | % |
| The Market Opportunities Portfolio | | | 41,105 | | | | 0.06 | % |
| The Multi-Disciplinary Portfolio | | | 525,000 | | | | 0.58 | % |
| | |
| * Amount is less than $0.50. |
When-Issued Securities
The Master Portfolios may purchase securities on a when-issued or delayed delivery basis. Although the purchase amounts of these securities are established at the time the purchaser enters into the agreement, these securities may be delivered and paid for at a future date. The Master Portfolios record purchases of when-issued securities and reflect the values of such securities in determining net asset value in the same manner as other portfolio
| KINETICS PORTFOLIOS TRUST — MASTER INVESTMENT PORTFOLIOS |
Notes to Financial Statements — (Continued) |
| December 31, 2013 |
securities. The Master Portfolios maintain at all times cash or other liquid assets in an amount at least equal to the amount of outstanding commitments for when-issued securities.
Securities Lending
Each Master Portfolio may lend its portfolio securities to broker-dealers by entering directly into lending arrangements with such broker dealers or indirectly through repurchase agreements with respect to no more than 331/3% of the total assets of each Master Portfolio (including any collateral posted) or 50% of the total assets of each Master Portfolio (excluding any collateral posted). Securities lending and repurchase transactions will be fully collateralized at all times with cash and/or short-term debt obligations. The Master Portfolios receive interest on the collateral received as well as a fee for the securities loaned.
Short-Term Investments
The Portfolios may invest in money market funds and short-term high quality debt securities such as commercial paper, repurchase agreements and certificates of deposit. Money market funds typically invest in short-term instruments and attempt to maintain a stable net asset value. While the risk is low, these funds may lose value. At December 31, 2013, The Internet Portfolio, The Global Portfolio, The Paradigm Portfolio, The Medical Portfolio, The Small Cap Opportunities Portfolio, The Market Opportunities Portfolio, The Alternative Income Portfolio, and The Multi-Disciplinary Portfolio invested approximately 17%, 29%, 15%, 11%, 20%, 13%, 1% and 8%, respectively, of net assets in the Mount Vernon Securities Lending Trust-Prime Portfolio which normally invests in short-term instruments with an objective of maximizing current income to the extent consistent with the preservation of capital and liquidity. Mount Vernon Securities Lending Trust-Prime Portfolio’s financial statements are available on the SEC website www.sec.gov.
Expense Allocation
Common expenses incurred by the Master Portfolios are allocated among the Master Portfolios (i) based upon relative average net assets, (ii) as incurred on a specific identification basis, or (iii) equally among the Master Portfolios, depending on the nature of the expenditure. All expenses incurred by the Master Portfolios are allocated to the feeder funds daily based on their proportionate interests in the respective Master Portfolios.
| KINETICS PORTFOLIOS TRUST — MASTER INVESTMENT PORTFOLIOS |
Notes to Financial Statements — (Continued) |
| December 31, 2013 |
Federal Income Taxes
Each Master Portfolio will be treated as a partnership for federal income tax purposes. As such, each investor in a Master Portfolio will be subject to taxation on its share of the Master Portfolio’s ordinary income and capital gains. It is intended that each Master Portfolio’s assets will be managed so an investor in the Master Portfolio can satisfy the requirements of subchapter M of the Internal Revenue Code.
There is no tax liability resulting from unrecognized tax benefits relating to uncertain income tax positions taken or expected to be taken in future tax returns. As of December 31, 2013, open tax years include the tax years ended December 31, 2010 through 2013. The Master Portfolios are also not aware of any tax positions for which it is reasonably possible that the total amounts of unrecognized tax benefits will significantly change in the next twelve months.
Use of Estimates
The preparation of financial statements in conformity with U.S. generally accepted accounting principles (“GAAP”) requires management to make estimates and assumptions that affect the reported amounts in the financial statements. Actual results could differ from those estimates.
Other
Realized gains and losses on the sale of investments are calculated on the identified cost basis. Dividend income is recorded on the ex-dividend date. Interest income is accounted for on the accrual basis and includes amortization of premiums and discounts on the interest method. Other noncash dividends are recognized as investment income at the fair value of the property received. Withholding taxes on foreign dividends have been provided for in accordance with the Trust’s understanding of the applicable country’s tax rules and rates.
3. Investment Adviser
The Trust has entered into Investment Advisory Agreements (the “Agreements”) with Kinetics Asset Management LLC (the “Adviser”), with whom certain officers and trustees of the Trust are affiliated, to furnish investment advisory services to the Master Portfolios. The Adviser is a wholly-owned subsidiary of Horizon Kinetics LLC. Under the terms of the Agreements, the Master Portfolios, except the Alternative Income Portfolio, compensate the Adviser for its management services at the annual rate of 1.25% of each Master Portfolio’s
| KINETICS PORTFOLIOS TRUST — MASTER INVESTMENT PORTFOLIOS |
Notes to Financial Statements — (Continued) |
| December 31, 2013 |
average daily net assets. The Alternative Income Portfolio began compensating the Adviser for its management services at the annual rate of 0.90% of the Master Portfolio’s average daily net assets beginning January 1, 2013.
For the year ended December 31, 2013, The Internet Portfolio, The Global Portfolio, The Paradigm Portfolio, The Medical Portfolio, The Small Cap Opportunities Portfolio, The Market Opportunities Portfolio, The Alternative Income Portfolio and The Multi-Disciplinary Portfolio incurred expenses of $2,162,480, $115,102, $13,886,029, $275,563, $2,172,159, $712,458, $156,657 and $1,084,708, respectively, pursuant to the Agreements.
For the year ended December 31, 2013, the Trust was allocated $26,000 for the services of the Chief Compliance Officer employed by the Adviser.
4. Securities Transactions
Purchases and sales of investment securities, other than short-term investments, for the year ended December 31, 2013 were as follows:
| | | Purchases | | Sales |
| | | U.S. | | | | U.S. | | | |
| | | Government | | Other | | Government | | Other | |
| The Internet Portfolio | | $ | — | | $ | 12,801,112 | | $ | — | | $ | 37,437,658 | |
| The Global Portfolio | | | — | | | 4,057,771 | | | — | | | 1,250,434 | |
| The Paradigm Portfolio | | | — | | | 47,896,286 | | | — | | | 36,308,285 | |
| The Medical Portfolio | | | — | | | 2,517,282 | | | — | | | 3,653,970 | |
| The Small Cap Opportunities Portfolio | | | — | | | 182,429,942 | | | — | | | 10,250,095 | |
| The Market Opportunities Portfolio | | | — | | | 10,686,031 | | | — | | | 15,006,801 | |
| The Alternative Income Portfolio | | | 2,441,803 | | | 16,103,629 | | | 300,000 | | | 2,174,284 | |
| The Multi-Disciplinary Portfolio | | | — | | | 33,727,784 | | | — | | | 33,728,553 | |
As of December 31, 2013, the cost of investments and unrealized appreciation (depreciation) on investment securities for federal income tax purposes was as follows:
| | | Internet | | Global | | Paradigm | | Medical | |
| Tax cost of Investments | | | 117,409,807 | | | 13,048,074 | | | 1,104,043,145 | | | 19,467,492 | |
| Unrealized Appreciation | | | 91,055,545 | | | 3,054,298 | | | 484,181,004 | | | 9,603,989 | |
| Unrealized Depreciation | | | (219,383 | ) | | (302,799 | ) | | (60,535,275 | ) | | (2,154,995 | ) |
| Net unrealized appreciation (depreciation) | | | 90,836,162 | | | 2,751,499 | | | 423,645,729 | | | 7,448,994 | |
| KINETICS PORTFOLIOS TRUST — MASTER INVESTMENT PORTFOLIOS |
Notes to Financial Statements — (Continued) |
| December 31, 2013 |
| | | | | | | Alternative | | Multi- | |
| | | Small Cap | | Market | | Income | | Disciplinary | |
| Tax cost of Investments | | | 339,982,206 | | | 52,397,674 | | | 21,276,045 | | | 75,897,875 | |
| Unrealized Appreciation | | | 89,576,151 | | | 21,523,028 | | | 35,933 | | | 683,134 | |
| Unrealized Depreciation | | | (9,665,716 | ) | | (2,407,862 | ) | | (93,103 | ) | | (3,659,168 | ) |
| Net unrealized appreciation (depreciation) | | | 79,910,435 | | | 19,115,166 | | | (57,170 | ) | | (2,976,034 | ) |
For the year ended December 31, 2013, the Master Portfolios wrote the following options:
| | | Number | | Premium | |
| | | of Contracts | | Amount | |
| The Alternative Income Portfolio | | | | | | | |
| Outstanding at the Beginning of the Year | | | 1,766 | | $ | 301,071 | |
| Options Written | | | 8,434 | | | 1,361,624 | |
| Options Expired | | | (5 | ) | | (1,385 | ) |
| Options Closed | | | (3,996 | ) | | (519,627 | ) |
| Outstanding at December 31, 2013 | | | 6,199 | | $ | 1,141,683 | |
| | | | | | | | |
| The Multi-Disciplinary Portfolio | | | | | | | |
| Outstanding at the Beginning of the Year | | | 24,136 | | $ | 5,091,981 | |
| Options Written | | | 31,166 | | | 6,473,342 | |
| Options Exercised | | | (1,318 | ) | | (314,199 | ) |
| Options Expired | | | (19,704 | ) | | (3,322,262 | ) |
| Options Closed | | | (13,517 | ) | | (2,585,141 | ) |
| Outstanding at December 31, 2013 | | | 20,763 | | $ | 5,343,721 | |
5. Portfolio Securities Loaned
As of December 31, 2013, the Master Portfolios had loaned securities that were collateralized by cash. The cash collateral is invested by the custodian in a money market pooled account approved by the Adviser. Although risk is mitigated by the collateral, a Master Portfolio could experience a delay in recovering its securities and possible loss of income or value if the borrower fails to return them. The Master Portfolio receives interest on the collateral received as well as a fee for the securities loaned. The Master Portfolios will continue to receive dividends and interest on all securities loaned. Gain or loss in the fair
| KINETICS PORTFOLIOS TRUST — MASTER INVESTMENT PORTFOLIOS |
Notes to Financial Statements — (Continued) |
| December 31, 2013 |
value of the securities loaned that may occur during the term of the loan will be accounted for by the Master Portfolios. The value of the securities on loan and the value of the related collateral at December 31, 2013, were as follows:
| | | Securities | | Collateral | |
| The Internet Portfolio | | $ | 28,959,111 | | $ | 29,816,268 | |
| The Global Portfolio | | | 3,458,039 | | | 3,519,916 | |
| The Paradigm Portfolio | | | 194,641,999 | | | 199,757,066 | |
| The Medical Portfolio | | | 2,537,862 | | | 2,689,850 | |
| The Small Cap Opportunities Portfolio | | | 67,341,896 | | | 69,687,876 | |
| The Market Opportunities Portfolio | | | 8,555,011 | | | 8,695,710 | |
| The Alternative Income Portfolio | | | 342,030 | | | 349,200 | |
| The Multi-Disciplinary Portfolio | | | 6,926,554 | | | 7,084,608 | |
6. Selected Financial Highlights
Financial highlights for the Master Portfolios were as follows:
| | | The Internet Portfolio |
| | | For the Year Ended | | For the Year Ended | | For the Year Ended | | For the Year Ended | | For the Year Ended |
| | | December 31, | | December 31, | | December 31, | | December 31, | | December 31, |
| | | 2013 | | 2012 | | 2011 | | 2010 | | 2009 |
| Ratio of expenses to average net assets: | | 1.37% | | 1.37% | | 1.38% | | 1.37% | | 1.37% |
| Ratio of net investment income (loss) to average net assets: | | (0.84)% | | 0.16% | | (0.43)% | | (0.33)% | | (0.04)% |
| Portfolio turnover rate | | 8% | | 9% | | 32% | | 12% | | 14% |
| | | The Global Portfolio |
| | | For the Year Ended | | For the Year Ended | | For the Year Ended | | For the Year Ended | | For the Year Ended |
| | | December 31, | | December 31, | | December 31, | | December 31, | | December 31, |
| | | 2013 | | 2012 | | 2011 | | 2010 | | 2009 |
| Ratio of expenses to average net assets: | | 1.73% | | 1.77% | | 2.23% | | 2.43% | | 2.81% |
| Ratio of net investment income (loss) to average net assets: | | (0.12)% | | 0.40% | | 0.61% | | (0.51%) | | (0.74)% |
| Portfolio turnover rate | | 15% | | 23% | | 135% | | 122% | | 53% |
| KINETICS PORTFOLIOS TRUST — MASTER INVESTMENT PORTFOLIOS |
Notes to Financial Statements — (Continued) |
| December 31, 2013 |
| | | The Paradigm Portfolio |
| | | For the Year Ended | | For the Year Ended | | For the Year Ended | | For the Year Ended | | For the Year Ended |
| | | December 31, | | December 31, | | December 31, | | December 31, | | December 31, |
| | | 2013 | | 2012 | | 2011 | | 2010 | | 2009 |
| Ratio of expenses to average net assets: | | 1.35% | | 1.36% | | 1.37% | | 1.36% | | 1.36% |
| Ratio of net investment income (loss) to average net assets: | | (0.23)% | | 0.50% | | 0.37% | | 0.83% | | 1.15% |
| Portfolio turnover rate | | 4% | | 6% | | 58% | | 7% | | 15% |
| | | The Medical Portfolio |
| | | For the Year Ended | | For the Year Ended | | For the Year Ended | | For the Year Ended | | For the Year Ended |
| | | December 31, | | December 31, | | December 31, | | December 31, | | December 31, |
| | | 2013 | | 2012 | | 2011 | | 2010 | | 2009 |
| Ratio of expenses to average net assets: | | 1.41% | | 1.44% | | 1.40% | | 1.39% | | 1.43% |
| Ratio of net investment income (loss) to average net assets: | | (0.02)% | | 1.62% | | 0.86% | | 0.55% | | 1.14% |
| Portfolio turnover rate | | 12% | | 0% | | 5% | | 3% | | 13% |
| | | The Small Cap Opportunities Portfolio |
| | | For the Year Ended | | For the Year Ended | | For the Year Ended | | For the Year Ended | | For the Year Ended |
| | | December 31, | | December 31, | | December 31, | | December 31, | | December 31, |
| | | 2013 | | 2012 | | 2011 | | 2010 | | 2009 |
| Ratio of expenses to average net assets: | | 1.35% | | 1.44% | | 1.43% | | 1.42% | | 1.42% |
| Ratio of net investment income (loss) to average net assets: | | 0.01% | | 0.27% | | 0.03% | | 0.02% | | (0.05)% |
| Portfolio turnover rate | | 6% | | 22% | | 47% | | 4% | | 4% |
| KINETICS PORTFOLIOS TRUST — MASTER INVESTMENT PORTFOLIOS |
Notes to Financial Statements — (Continued) |
| December 31, 2013 |
| | | The Market Opportunities Portfolio |
| | | For the Year Ended | | For the Year Ended | | For the Year Ended | | For the Year Ended | | For the Year Ended |
| | | December 31, | | December 31, | | December 31, | | December 31, | | December 31, |
| | | 2013 | | 2012 | | 2011 | | 2010 | | 2009 |
| Ratio of expenses to average net assets: | | 1.40% | | 1.43% | | 1.42% | | 1.42% | | 1.42% |
| Ratio of net investment income to average net assets: | | 0.27% | | 0.44% | | 0.30% | | 0.56% | | 0.26% |
| Portfolio turnover rate | | 21% | | 26% | | 14% | | 12% | | 14% |
| | | The Alternative Income Portfolio |
| | | For the Year Ended | | For the Year Ended | | For the Year Ended | | For the Year Ended | | For the Year Ended |
| | | December 31, | | December 31, | | December 31, | | December 31, | | December 31, |
| | | 2013 | | 2012 | | 2011 | | 2010 | | 2009 |
| Ratio of expenses to average net assets: | | 1.25% | | 1.49% | | 1.42% | | 1.47% | | 1.49% |
| Ratio of net investment income (loss) to average net assets: | | (0.54)% | | 1.99% | | 1.47% | | 1.04% | | 0.63% |
| Portfolio turnover rate | | 19% | | 56% | | 69% | | 111% | | 45% |
| | | The Multi-Disciplinary Portfolio |
| | | For the Year Ended | | For the Year Ended | | For the Year Ended | | For the Year Ended | | For the Year Ended |
| | | December 31, | | December 31, | | December 31, | | December 31, | | December 31, |
| | | 2013 | | 2012 | | 2011 | | 2010 | | 2009 |
| Ratio of expenses to average net assets: | | 1.39% | | 1.45% | | 1.54% | | 2.41% | | 3.66% |
| Ratio of net investment income (loss) to average net assets: | | 1.87% | | 3.23% | | 8.00% | | 2.58% | | (1.20)% |
| Portfolio turnover rate | | 54% | | 41% | | 74% | | 38% | | 77% |
| KINETICS PORTFOLIOS TRUST — MASTER INVESTMENT PORTFOLIOS |
Notes to Financial Statements — (Continued) |
| December 31, 2013 |
7. Summary of Fair Value Exposure
Various inputs are used in determining the value of a Master Portfolio’s investments. These inputs are summarized in the three broad levels listed below:
Level 1 - Unadjusted quoted prices in active markets for identical assets or liabilities that a Master Portfolio has the ability to access.
Level 2 - Observable inputs other than quoted prices included in Level 1 that are observable for the asset or liability, either directly or indirectly. These inputs may include quoted prices for the identical instrument on an inactive market, prices for similar instruments, interest rates, prepayment speeds, credit risk, yield curves, default rates and similar data.
Level 3 - Unobservable inputs for the asset or liability, to the extent relevant observable inputs are not available, representing a Master Portfolio’s own assumptions about the assumptions a market participant would use in valuing the asset or liability, and would be based on the best information available.
The availability of observable inputs can vary from security to security and is affected by a wide variety of factors, including, for example, the type of security, whether the security is new and not yet established in the marketplace, the liquidity of markets, and other characteristics particular to the security. To the extent that valuation is based on models or inputs that are less observable or unobservable in the market, the determination of fair value requires more judgment. Accordingly, the degree of judgment exercised in determining fair value is greatest for instruments categorized in Level 3.
The inputs used to measure fair value may fall into different levels of the fair value hierarchy. In such cases, for disclosure purposes, the level in the fair value hierarchy within which the fair value measurement falls in its entirety, is determined based on the lowest level input that is significant to the fair value measurement in its entirety.
| KINETICS PORTFOLIOS TRUST — MASTER INVESTMENT PORTFOLIOS |
Notes to Financial Statements — (Continued) |
| December 31, 2013 |
The Internet Portfolio
The following is a summary of the inputs used to value The Internet Portfolio’s net assets as of December 31, 2013:
| Assets^ | | Level 1 | | Level 2 | | Level 3 | | Total | |
| Common Stocks | | $ | 172,328,876 | | $ | 4,787 | (1) | $ | — | (2)* | $ | 172,333,663 | |
| Escrow Notes | | | — | | | — | | | — | * | | — | * |
| Rights | | | 159,362 | | | — | | | — | | | 159,362 | |
| Short-Term Investments | | | 61,676 | | | 5,875,000 | † | | — | | | 5,936,676 | |
Investments Purchased with the Cash Proceeds from Securities Lending | | | 29,816,268 | | | — | | | — | | | 29,816,268 | |
| Total Investments in Securities | | $ | 202,366,182 | | $ | 5,879,787 | | $ | — | | $ | 208,245,969 | |
| (1) | The Common Stocks Level 2 balance consists of the market value of the associated Level 2 investments in the following industries: |
| Administrative and Support Services | | $ | 1,800 | |
| Telecommunications | | | 2,987 | |
| | | $ | 4,787 | |
| (2) | The Common Stocks Level 3 balance consists of the market value of the associated Level 3 investments in the following industry: |
| Holding Company | | $ | — | * |
| | | | | |
| Transfers out of Level 1 into Level 2 | | $ | 1,800 | |
Transfers were made out of Level 1 into Level 2 due to a decrease in market activity.
Transfers between levels are recognized at the end of the reporting period.
Following is a reconciliation of Level 3 assets for which significant unobservable inputs were used to determine fair value:
| Description | Investments in Securities | |
| Balance as of December 31, 2012 | | $ | 3 | |
| Accrued discounts/premiums | | | — | |
| Realized gain (loss) | | | (781,861 | ) |
| Change in unrealized appreciation (depreciation) | | | 783,297 | |
| Net purchases | | | — | |
| Net sales | | | (1,439 | ) |
| Transfer in and/or out of Level 3 | | | — | |
| Balance as of December 31, 2013 | | $ | — | * |
| KINETICS PORTFOLIOS TRUST — MASTER INVESTMENT PORTFOLIOS |
Notes to Financial Statements — (Continued) |
| December 31, 2013 |
| | | Fair Value at | | Valuation | | Unobservable | | |
| Description | | 12/31/2013 | | Techniques | | Input | | Range |
| Common Stocks | | $ | —* | | Delisted-Acquired by | | No active | | $0.00-$0.00 |
| | | | | | the U.S. Government/ | | market | | |
| | | | | | Market Comparables | | | | |
| Escrow Notes | | | —* | | Conservative Value | | No active | | $0.00-$0.00 |
| | | | | | Assigned Pending | | market | | |
| | | | | | Bankruptcy Litigation | | | | |
| | | | | | Proceedings/Market | | | | |
| | | | | | Comparables | | | | |
There is no active market for the Level 3 securities, so a conservative value is being assigned until such time as a market exists.
| ^ | See Portfolio of Investments for breakout of investments by industry classification. |
| * | Amount is less than $0.50. |
| † | Priced at amortized cost. |
The Global Portfolio
The following is a summary of the inputs used to value The Global Portfolio’s net assets as of December 31, 2013:
| Assets^ | | Level 1 | | Level 2 | | Level 3 | | Total | |
| Common Stocks | | $ | 9,644,451 | | $ | 1,507,205 | (1) | $ | — | | $ | 11,151,656 | |
| Preferred Stocks | | | 1 | | | — | | | — | | | 1 | |
| Short-Term Investments | | | 553,000 | | | 575,000 | † | | — | | | 1,128,000 | |
| Investments Purchased with the Cash Proceeds from Securities Lending | | | 3,519,916 | | | — | | | — | | | 3,519,916 | |
| Total Investments in Securities | | $ | 13,717,368 | | $ | 2,082,205 | | $ | — | | $ | 15,799,573 | |
| (1) | The Common Stocks Level 2 balance consists of the market value of the associated Level 2 investments in the following industries: |
| Beverage and Tobacco Product Manufacturing | | $ | 8,000 | |
| Holding Company | | | 31,716 | |
| Oil and Gas Extraction | | | 672,008 | |
| Real Estate | | | 795,481 | |
| | | $ | 1,507,205 | |
| Transfers out of Level 1 into Level 2 | | $ | 51,608 | |
| Transfers out of Level 2 into Level 1 | | $ | 33,701 | |
Transfers were made out of Level 1 into Level 2 due to a decrease in market activity.
Transfers were made out of Level 2 into Level 1 due to an increase in market activity.
Transfers between levels are recognized at the end of the reporting period.
| ^ | See Portfolio of Investments for breakout of investments by industry classification. |
| † | Priced at amortized cost. |
| KINETICS PORTFOLIOS TRUST — MASTER INVESTMENT PORTFOLIOS |
Notes to Financial Statements — (Continued) |
| December 31, 2013 |
The Paradigm Portfolio
The following is a summary of the inputs used to value The Paradigm Portfolio’s net assets as of December 31, 2013:
| Assets^ | | Level 1 | | Level 2 | | Level 3 | | Total | |
| Common Stocks | | $ | 1,223,000,571 | | $ | 6,411,701 | (1) | $ | — | (2)* | $ | 1,229,412,272 | |
| Escrow Notes | | | — | | | — | | | — | * | | — | * |
| Preferred Stocks | | | 231 | | | — | | | — | | | 231 | |
| Short-Term Investments | | | 33,519,305 | | | 65,000,000 | † | | — | | | 98,519,305 | |
| Investments Purchased with the Cash Proceeds from Securities Lending | | | 199,757,066 | | | — | | | — | | | 199,757,066 | |
| Total Investments in Securities | | $ | 1,456,277,173 | | $ | 71,411,701 | | $ | — | * | $ | 1,527,688,874 | |
| (1) | The Common Stocks Level 2 balance consists of the market value of the associated Level 2 investments in the following industries: |
| Holding Company | | $ | 21,144 | |
| Oil and Gas Extraction | | | 2,791,800 | |
| Real Estate | | | 3,598,757 | |
| | | $ | 6,411,701 | |
| | | | | |
| Transfers out of Level 2 into Level 1 | | $ | 5,964,546 | |
Transfers were made out of Level 2 into Level 1 due to an increase in market activity.
Transfers between levels are recognized at the end of the reporting period.
| (2) | The Common Stocks Level 3 balance consists of the market value of the associated Level 3 investments in the following industry: |
Following is a reconciliation of Level 3 assets for which significant unobservable inputs were used to determine fair value:
| Description | Investments in Securities | |
| Balance as of December 31, 2012 | | $ | 31 | |
| Accrued discounts/premiums | | | — | |
| Realized gain (loss) | | | (1,872,092 | ) |
| Change in unrealized appreciation (depreciation) | | | 1,872,061 | |
| Net purchases | | | — | * |
| Net sales/Write-offs | | | — | * |
| Transfer in and/or out of Level 3 | | | — | |
| Balance as of December 31, 2013 | | $ | — | * |
| KINETICS PORTFOLIOS TRUST — MASTER INVESTMENT PORTFOLIOS |
Notes to Financial Statements — (Continued) |
| December 31, 2013 |
| | | Fair Value at | | Valuation | | Unobservable | | |
| Description | | 12/31/2013 | | Techniques | | Input | | Range |
| Common Stocks | | $ | —* | | Delisted-Acquired | | No active | | $0.00-$0.00 |
| | | | | | by the U.S. | | market | | |
| | | | | | Government/Market | | | | |
| | | | | | Comparables | | | | |
| Escrow Notes | | | —* | | Conservative Value | | No active | | $0.00-$0.00 |
| | | | | | Assigned Pending | | market | | |
| | | | | | Bankruptcy Litigation | | | | |
| | | | | | Proceedings/Market | | | | |
| | | | | | Comparables | | | | |
There is no active market for the Level 3 securities, so a conservative value is being assigned until such time as a market exists.
| ^ | See Portfolio of Investments for breakout of investments by industry classification. |
| * | Amount is less than $0.50. |
| † | Priced at amortized cost. |
The Medical Portfolio
The following is a summary of the inputs used to value The Medical Portfolio’s net assets as of December 31, 2013:
| Assets^ | | | Level 1 | | | Level 2 | | | Level 3 | | | Total | |
| Common Stocks | | $ | 23,887,040 | | $ | 111,726 | (1) | $ | — | (2)* | $ | 23,998,766 | |
| Rights | | | 13,797 | | | — | | | — | * | | 13,797 | |
| Short-Term Investments | | | 64,073 | | | 150,000 | † | | — | | | 214,073 | |
| Investments Purchased with the Cash Proceeds from Securities Lending | | | 2,689,850 | | | — | | | — | | | 2,689,850 | |
| Total Investments in Securities | | $ | 26,654,760 | | $ | 261,726 | | $ | — | | $ | 26,916,486 | |
| (1) | The Common Stocks Level 2 balance consists of the market value of the associated Level 2 investments in the following industry: |
| Pharmaceutical and Biotechnology | | $ | 111,726 | |
| (2) | The Common Stocks Level 3 balance consists of the market value of the associated Level 3 investments in the following industry: |
| Pharmaceutical and Biotechnology | | $ | — | * |
| | | | | |
| Transfers out of Level 1 into Level 3 | | $ | — | * |
Transfers were made out of Level 1 into Level 3 due to a decrease in market activity.
Transfers between levels are recognized at the end of the reporting period.
| KINETICS PORTFOLIOS TRUST — MASTER INVESTMENT PORTFOLIOS |
Notes to Financial Statements — (Continued) |
| December 31, 2013 |
Following is a reconciliation of Level 3 assets for which significant unobservable inputs were used to determine fair value:
| Description | Investments in Securities | |
| Balance as of December 31, 2012 | | $ | — | |
| Accrued discounts/premiums | | | — | |
| Realized gain (loss) | | | — | |
| Change in unrealized appreciation (depreciation) | | | — | |
| Net purchases | | | — | * |
| Net sales | | | — | |
| Transfer in and/or out of Level 3 | | | — | * |
| Balance as of December 31, 2013 | | $ | — | * |
| | | Fair Value at | | Valuation | | Unobservable | | |
| Description | | 12/31/2013 | | Techniques | | Input | | Range |
| Common Stocks | | $ | —* | | Market | | No active | | $0.00-$0.00 |
| | | | | | Comparables | | market | | |
| Rights | | | —* | | Market | | No active | | $0.00-$0.00 |
| | | | | | Comparables | | market | | |
There is no active market for the Level 3 securities, so a conservative value is being assigned until such time as a market exists.
| ^ | See Portfolio of Investments for breakout of investments by industry classification. |
| * | Amount is less than $0.50. |
| † | Priced at amortized cost. |
The Small Cap Opportunities Portfolio
The following is a summary of the inputs used to value The Small Cap Opportunities Portfolio’s net assets as of December 31, 2013:
| Assets^ | | Level 1 | | Level 2 | | Level 3 | | Total | |
| Common Stocks | | $ | 287,170,493 | | $ | 39,011,486 | (1) | $ | — | | $ | 326,181,979 | |
| Rights | | | 400,071 | | | — | | | — | | | 400,071 | |
| Short-Term Investments | | | 6,872,715 | | | 16,750,000 | † | | — | | | 23,622,715 | |
| Investments Purchased with the Cash Proceeds from Securities Lending | | | 69,687,676 | | | — | | | — | | | 69,687,676 | |
| Total Investments in Securities | | $ | 364,130,955 | | $ | 55,761,486 | | $ | — | | $ | 419,892,441 | |
| (1) | The Common Stocks Level 2 balance consists of the market value of the associated Level 2 investments in the following industries: |
| Asset Management | | $ | 12,226,388 | |
| Holding Company | | | 3,462,297 | |
| Mining (except Oil and Gas) | | | 709,311 | |
| Oil and Gas Extraction | | | 1,525 | |
| KINETICS PORTFOLIOS TRUST — MASTER INVESTMENT PORTFOLIOS |
Notes to Financial Statements — (Continued) |
| December 31, 2013 |
| Real Estate | | | 22,569,395 | |
| Telecommunications | | | 42,570 | |
| | | $ | 39,011,486 | |
| | | | | |
| Transfers out of Level 1 into Level 2 | | $ | 39,925 | |
| Transfers out of Level 2 into Level 1 | | | 25,200 | |
Transfers were made out of Level 1 into Level 2 due to a decrease in market activity.
Transfers were made out of Level 2 into Level 1 due to an increase in market activity.
Transfers between levels are recognized at the end of the reporting period.
| ^ | See Portfolio of Investments for breakout of investments by industry classification. |
| † | Priced at amortized cost. |
The Market Opportunities Portfolio
The following is a summary of the inputs used to value The Market Opportunities Portfolio’s net assets as of December 31, 2013:
| Assets^ | | Level 1 | | Level 2 | | Level 3 | | Total | |
| Common Stocks | | $ | 53,056,348 | | $ | 3,685,740 | (1) | $ | 41,105 | (2) | $ | 56,783,193 | |
| Rights | | | — | | | — | | | — | * | | — | * |
| Mutual Funds | | | 7,562 | | | — | | | — | | | 7,562 | |
| Short-Term Investments | | | 2,951,375 | | | 3,075,000 | † | | — | | | 6,026,375 | |
| Investments Purchased with the Cash Proceeds from Securities Lending | | | 8,695,710 | | | — | | | — | | | 8,695,710 | |
| Total Investments in Securities | | $ | 64,710,995 | | $ | 6,760,740 | | $ | 41,105 | | $ | 71,512,840 | |
| (1) | The Common Stocks Level 2 balance consists of the market value of the associated Level 2 investments in the following industries: |
| Holding Company | | $ | 1,133,836 | |
| Real Estate | | | 2,551,904 | |
| | | $ | 3,685,740 | |
| (2) | The Common Stocks Level 3 balance consists of the market value of the associated Level 3 investments in the following industry: |
| Other Exchanges | | $ | 41,105 | |
| | | | | |
| Transfers out of Level 2 into Level 1 | | $ | 3,717 | |
| Transfers out of Level 1 into Level 3 | | $ | 41,105 | |
Transfers were made out of Level 2 into Level 1 due to an increase in market activity.
Transfers were made out of Level 1 into Level 3 due to a decrease in market activity.
Transfers between levels are recognized at the end of the reporting period.
| KINETICS PORTFOLIOS TRUST — MASTER INVESTMENT PORTFOLIOS |
Notes to Financial Statements — (Continued) |
| December 31, 2013 |
Following is a reconciliation of Level 3 assets for which significant unobservable inputs were used to determine fair value:
| Description | Investments in Securities | |
| Balance as of December 31, 2012 | | $ | — | * |
| Accrued discounts/premiums | | | — | |
| Realized gain (loss) | | | (120,603 | ) |
| Change in unrealized appreciation (depreciation) | | | (51,373 | ) |
| Net purchases | | | — | * |
| Net sales/Write-offs | | | — | * |
| Transfer in and/or out of Level 3 | | | 213,081 | |
| Balance as of December 31, 2013 | | $ | 41,105 | |
| | | Fair Value at | | Valuation | | Unobservable | | |
| Description | | 12/31/2013 | | Techniques | | Input | | Range |
| Common Stocks | | $ | 41,105 | | | Delisted/Market | | No active | | $0.00-$0.43 |
| | | | | | | Comparables | | market | | |
| Rights | | | — | * | | Market | | No active | | $0.00-$0.00 |
| | | | | | | Comparables | | market | | |
There is no active market for the Level 3 securities, so a conservative value is being assigned until such time as a market exists.
| ^ | See Portfolio of Investments for breakout of investments by industry classification. |
| * | Amount is less than $0.50. |
| † | Priced at amortized cost. |
The Alternative Income Portfolio
The following is a summary of the inputs used to value The Alternative Income Portfolio’s net assets as of December 31, 2013:
| Assets^ | | Level 1 | | Level 2 | | Level 3 | | Total | |
| Corporate Bonds | | $ | — | | $ | 12,617,586 | | $ | — | | $ | 12,617,586 | |
| U.S. Government Agency Issues | | | — | | | 1,238,640 | | | — | | | 1,238,640 | |
| U.S. Treasury Notes | | | — | | | 899,686 | | | — | | | 899,686 | |
| Exchange Traded Funds | | | 4,201,764 | | | — | | | — | | | 4,201,764 | |
| Warrants | | | 396 | | | — | | | — | | | 396 | |
| Short-Term Investments | | | 961,603 | | | 950,000 | † | | — | | | 1,911,603 | |
| Investments Purchased with the Cash Proceeds from Securities Lending | | | 349,200 | | | — | | | — | | | 349,200 | |
| Total Investments in Securities | | $ | 5,512,963 | | $ | 15,705,912 | | $ | — | | $ | 21,218,875 | |
| | | | | | | | | | | | | | |
| Liabilities | | | | | | | | | | | | | |
| Written Options | | $ | — | | $ | 535,155 | | $ | — | | $ | 535,155 | |
For the year ended December 31, 2013, there were no transfers into or out of Level 1 or Level 2, or investments in Level 3 securities.
| ^ | See Portfolio of Investments for breakout of investments by industry classification. |
| † | Priced at amortized cost. |
| KINETICS PORTFOLIOS TRUST — MASTER INVESTMENT PORTFOLIOS |
Notes to Financial Statements — (Continued) |
| December 31, 2013 |
The Multi-Disciplinary Portfolio
The following is a summary of the inputs used to value The Multi-Disciplinary Portfolio’s net assets as of December 31, 2013:
| Assets^ | | Level 1 | | Level 2 | | Level 3 | | Total | |
| Common Stocks | | $ | 212,344 | | $ | — | | $ | — | | $ | 212,344 | |
| Convertible Bonds | | | — | | | 35,852,975 | | | — | | | 35,852,975 | |
| Corporate Bonds | | | — | | | 14,938,623 | | | — | | | 14,938,623 | |
| Municipal Bonds | | | — | | | 525,000 | | | — | | | 525,000 | |
| Exchange Traded Funds | | | 1,298,776 | | | — | | | — | | | 1,298,776 | |
| Mutual Funds | | | 5,630,249 | | | — | | | — | | | 5,630,249 | |
| Purchased Put Options | | | — | | | 378,267 | | | — | | | 378,267 | |
| Short-Term Investments | | | 2,176,000 | | | 4,824,999 | † | | — | | | 7,000,999 | |
| Investments Purchased with the Cash Proceeds from Securities Lending | | | 7,084,608 | | | — | | | — | | | 7,084,608 | |
| Total Investments in Securities | | $ | 16,401,977 | | $ | 56,519,864 | | $ | — | | $ | 72,921,841 | |
| | | | | | | | | | | | | | |
| Liabilities | | | | | | | | | | | | | |
| Written Options | | $ | — | | $ | 2,012,182 | | $ | — | | $ | 2,012,182 | |
For the year ended December 31, 2013, there were no transfers into or out of Level 1 or Level 2, or investments in Level 3 securities.
| ^ | See Portfolio of Investments for breakout of investments by industry classification. |
| † | Priced at amortized cost. |
8. Disclosures about Derivative Instruments and Hedging Activities
The Master Portfolios have adopted enhanced disclosure regarding derivatives and hedging activity intended to improve financial reporting of derivative instruments by enabling investors to understand how and why a Master Portfolio uses derivatives, how derivatives are accounted for by the Master Portfolios, and how derivative instruments affect a Master Portfolio’s results of operations and financial position. The Master Portfolios utilized options to implement or to gain further exposure to their respective investment strategies.
The Alternative Income Portfolio
Statement of Assets and Liabilities
Fair values of derivative instruments as of December 31, 2013:
| | | Assets | | Liabilities |
| Equity Contracts | | Description | | Fair Value | | Description | | Fair Value |
| | | | | | | | Written option | | |
| Written Options | | | | $ | — | | contracts, at value | | $535,155 |
| Total | | | | $ | — | | | | $535,155 |
| KINETICS PORTFOLIOS TRUST — MASTER INVESTMENT PORTFOLIOS |
Notes to Financial Statements — (Continued) |
| December 31, 2013 |
Statement of Operations
The effect of derivative instruments on the Statement of Operations for the year ended December 31, 2013:
Amount of Realized Gain (Loss) on Equity Contracts
| Equity Contracts | | | | |
| Written Options | | $ | 312,485 | |
| Total | | $ | 312,485 | |
Change in Unrealized Appreciation (Depreciation) on Equity Contracts
| Equity Contracts | | | | |
| Written Options | | $ | 606,358 | |
| Total | | $ | 606,358 | |
The Alternative Income Portfolio has adopted authoritative standards regarding disclosure about derivatives and hedging activities and how they affect the Portfolio’s Statement of Assets and Liabilities and Statement of Operations. For the year ended December 31, 2013: written option contracts (8,434 contracts) were opened and $1,361,624 premiums were received during the period.
The Multi-Disciplinary Portfolio
Statement of Assets and Liabilities
Fair values of derivative instruments as of December 31, 2013:
| | | Assets | | Liabilities |
| Equity Contracts | | Description | | | Fair Value | | Description | | | Fair Value |
| | | Investments, | | | | | | | | |
| Purchased Put Options | | at value | | $ | 378,267 | | | | $ | — |
| Total | | | | $ | 378,267 | | | | | |
| | | | | | | | Written option | | | |
| Written Put Options | | | | $ | — | | contracts, at value | | $ | 2,012,182 |
| Total | | | | $ | — | | | | $ | 2,012,182 |
| KINETICS PORTFOLIOS TRUST — MASTER INVESTMENT PORTFOLIOS |
Notes to Financial Statements — (Continued) |
| December 31, 2013 |
Statement of Operations
The effect of derivative instruments on the Statement of Operations for the year ended December 31, 2013:
Amount of Realized Gain (Loss) on Equity Contracts
| Equity Contracts | | | | |
| Purchased Put Options | | $ | — | |
| Written Put Options | | | 1,375,154 | |
| Total | | $ | 1,375,154 | |
Change in Unrealized Appreciation (Depreciation) on Equity Contracts
| Equity Contracts | | | | |
| Purchased Put Options | | $ | 7,881 | |
| Written Put Options | | | 874,785 | |
| Total | | $ | 882,666 | |
The Multi-Disciplinary Portfolio has adopted authoritative standards regarding disclosure about derivatives and hedging activities and how they affect the Portfolio’s Statement of Assets and Liabilities and Statement of Operations. For the year ended December 31, 2013: written option contracts (31,166 contracts) were opened and $6,473,342 premiums were received during the period.
9. Offsetting Assets and Liabilities
The Portfolios are subject to various Master Netting Arrangements, which govern the terms of certain transactions with select counterparties. The Master Netting Arrangements allow the Portfolio to close out and net its total exposure to a counterparty in the event of a default with respect to all the transactions governed under a single agreement with a counterparty. The Master Netting Arrangements also specify collateral posting arrangements at pre-arranged exposure levels. Under the Master Netting Arrangements, collateral is routinely transferred if the total net exposure to certain transactions (net of existing collateral already in place) governed under the relevant Master Netting Arrangement with a counterparty in a given account exceeds a specified threshold depending on the counterparty and the type of Master Netting Arrangement.
| KINETICS PORTFOLIOS TRUST — MASTER INVESTMENT PORTFOLIOS |
Notes to Financial Statements — (Continued) |
| December 31, 2013 |
The Internet Portfolio
The following is a summary of the Assets and Liabilities subject to offsetting in The Internet Portfolio as of December 31, 2013:
| Liabilities: | | | Gross Amounts Offset in the Statement | | Net Amounts Presented in the Statement | | Gross Amounts not offset in the statement of financial position | | | |
| | Gross Amounts of Recognized Liabilities | | of Financial Position | | of Financial Position | | Financial Instruments | | Collateral Pledged (Received) | | Net Amount | |
| Description | | | | | | | | | | | | | | | | | | |
| Securities Lending | | $ | 29,816,268 | | | $ | — | | | $ | 29,816,268 | | | $ | 29,816,268 | | | $ | — | | | $ | — | |
The Global Portfolio
The following is a summary of the Assets and Liabilities subject to offsetting in The Global Portfolio as of December 31, 2013:
| Liabilities: | | | Gross Amounts Offset in the Statement | | Net Amounts Presented in the Statement | | Gross Amounts not offset in the statement of financial position | | | |
| | Gross Amounts of Recognized Liabilities | | of Financial Position | | of Financial Position | | Financial Instruments | | Collateral Pledged (Received) | | Net Amount | |
| Description | | | | | | | | | | | | | | | | | | |
| Securities Lending | | $ | 3,519,916 | | | $ | — | | | $ | 3,519,916 | | | $ | 3,519,916 | | | $ | — | | | $ | — | |
The Paradigm Portfolio
The following is a summary of the Assets and Liabilities subject to offsetting in The Paradigm Portfolio as of December 31, 2013:
| Liabilities: | | | Gross Amounts Offset in the Statement | | Net Amounts Presented in the Statement | | Gross Amounts not offset in the statement of financial position | | | |
| | Gross Amounts of Recognized Liabilities | | of Financial Position | | of Financial Position | | Financial Instruments | | Collateral Pledged (Received) | | Net Amount | |
| Description | | | | | | | | | | | | | | | | | | |
| Securities Lending | | $ | 199,757,066 | | | $ | — | | | $ | 199,757,066 | | | $ | 199,757,066 | | | $ | — | | | $ | — | |
| KINETICS PORTFOLIOS TRUST — MASTER INVESTMENT PORTFOLIOS |
Notes to Financial Statements — (Continued) |
| December 31, 2013 |
The Medical Portfolio
The following is a summary of the Assets and Liabilities subject to offsetting in The Medical Portfolio as of December 31, 2013:
| Liabilities: | | | Gross Amounts Offset in the Statement | | Net Amounts Presented in the Statement | | Gross Amounts not offset in the statement of financial position | | | |
| | Gross Amounts of Recognized Liabilities | | of Financial Position | | of Financial Position | | Financial Instruments | | Collateral Pledged (Received) | | Net Amount | |
| Description | | | | | | | | | | | | | | | | | | |
| Securities Lending | | $ | 2,689,850 | | | $ | — | | | $ | 2,689,850 | | | $ | 2,689,850 | | | $ | — | | | $ | — | |
The Small Cap Opportunities Portfolio
The following is a summary of the Assets and Liabilities subject to offsetting in The Small Cap Opportunities Portfolio as of December 31, 2013:
| Liabilities: | | | Gross Amounts Offset in the Statement | | Net Amounts Presented in the Statement | | Gross Amounts not offset in the statement of financial position | | | |
| | Gross Amounts of Recognized Liabilities | | of Financial Position | | of Financial Position | | Financial Instruments | | Collateral Pledged (Received) | | Net Amount | |
| Description | | | | | | | | | | | | | | | | | | |
| Securities Lending | | $ | 69,687,676 | | | $ | — | | | $ | 69,687,676 | | | $ | 69,687,676 | | | $ | — | | | $ | — | |
The Market Opportunities Portfolio
The following is a summary of the Assets and Liabilities subject to offsetting in The Market Opportunities Portfolio as of December 31, 2013:
| Liabilities: | | | Gross Amounts Offset in the Statement | | Net Amounts Presented in the Statement | | Gross Amounts not offset in the statement of financial position | | | |
| | Gross Amounts of Recognized Liabilities | | of Financial Position | | of Financial Position | | Financial Instruments | | Collateral Pledged (Received) | | Net Amount | |
| Description | | | | | | | | | | | | | | | | | | |
| Securities Lending | | $ | 8,695,710 | | | $ | — | | | $ | 8,695,710 | | | $ | 8,695,710 | | | $ | — | | | $ | — | |
| KINETICS PORTFOLIOS TRUST — MASTER INVESTMENT PORTFOLIOS |
Notes to Financial Statements — (Continued) |
| December 31, 2013 |
The Alternative Income Portfolio
The following is a summary of the Assets and Liabilities subject to offsetting in The Alternative Income Portfolio as of December 31, 2013:
| Liabilities: | | | | | Gross Amounts Offset in the Statement | | | Net Amounts Presented in the Statement | | | Gross Amounts not offset in the statement of financial position | | | | |
| | | Gross Amounts of Recognized Liabilities | | | of Financial Position | | | of Financial Position | | | Financial Instruments | | | Collateral Pledged (Received) | | | Net Amount | |
| Description | | | | | | | | | | | | | | | | | | |
| Written Options | | $ | 535,155 | | | $ | — | | | $ | 535,155 | | | $ | — | | | $ | 535,155 | | | $ | — | |
| Securities Lending | | | 349,200 | | | | — | | | | 349,200 | | | | 349,200 | | | | — | | | | — | |
| | | $ | 884,355 | | | $ | — | | | $ | 884,355 | | | $ | 349,200 | | | $ | 535,155 | | | $ | — | |
The Multi-Disciplinary Portfolio
The following is a summary of the Assets and Liabilities subject to offsetting in The Multi-Disciplinary Portfolio as of December 31, 2013:
| Liabilities: | | | | | Gross Amounts Offset in the Statement | | | Net Amounts Presented in the Statement | | | Gross Amounts not offset in the statement of financial position | | | | |
| | | Gross Amounts of Recognized Liabilities | | | of Financial Position | | | of Financial Position | | | Financial Instruments | | | Collateral Pledged (Received) | | | Net Amount | |
| Description | | | | | | | | | | | | | | | | | | |
| Written Options | | $ | 2,012,182 | | | $ | — | | | $ | 2,012,182 | | | $ | — | | | $ | 2,012,182 | | | $ | — | |
| Securities Lending | | | 7,084,608 | | | | — | | | | 7,084,608 | | | | 7,084,608 | | | | — | | | | — | |
| | | $ | 9,096,790 | | | $ | — | | | $ | 9,096,790 | | | $ | 7,084,608 | | | $ | 2,012,182 | | | $ | — | |
10. Information about Proxy Voting (Unaudited)
Information regarding how the Master Portfolios votes proxies relating to portfolio securities is available without charge upon request by calling toll-free at 1-800-930-3828 or by accessing the Funds’ website at www.kineticsfunds.com and by accessing the SEC’s website at www.sec.gov. Information regarding how the Master Portfolios voted proxies relating to portfolio securities during the most recent twelve month period ended June 30,
| KINETICS PORTFOLIOS TRUST — MASTER INVESTMENT PORTFOLIOS |
Notes to Financial Statements — (Continued) |
| December 31, 2013 |
is available without charge, upon request, by calling toll-free at 1-800-930-3828 or by accessing the SEC’s website at www.sec.gov.
11. Information about the Portfolio Holdings (Unaudited)
The Kinetics Portfolios Trust files its complete schedules of portfolio holdings for its first and third fiscal quarters with the SEC on Form N-Q. The Master Portfolios’ Form N-Q is available without charge, upon request, by calling toll-free at 1-800-930-3828. Furthermore, you can obtain the Form N-Q on the SEC’s website at www.sec.gov. Finally, the Form N-Q may be reviewed and copied at the SEC’s Public Reference Room in Washington, D.C. Information on the operation of the Public Reference Room may be obtained by calling 1-800-SEC-0330.
12. Subsequent Events
In preparing these financial statements, management has evaluated Portfolio related events and transactions for potential recognition or disclosure through the date the financial statements were issued. There were no events or translations that occurred during the period that materially impacted the amounts or disclosures in the Master Portfolios’ financial statements.
13. Reverse Stock Split
During the year ended December 31, 2013, shares of The Alternative Income Fund were adjusted to reflect a reverse stock split. The effect of the reverse stock split was to reduce the number of shares outstanding while maintaining the Fund’s and each shareholder’s aggregate net asset value. A summary of the reverse stock split is as follows:
| | | | | | | Net Asset | | Net Asset | | Shares | | Shares |
| | | | | | | Value | | Value | | Outstanding | | Outstanding |
| | | | | | | Before | | After | | Before | | After |
| | | | | | | Reverse | | Reverse | | Reverse | | Reverse |
| | | Date | | Rate | | Split | | Split | | Split | | Split |
| Alternative Income Fund, | | | | | | | | | | | | |
| No Load Class | | 5/31/13 | | 1:10 | | $8.52 | | $85.24 | | 1,331,968 | | 133,197 |
| Alternative Income Fund, | | | | | | | | | | | | |
| Class A | | 5/31/13 | | 1:10 | | $8.52 | | $85.23 | | 233,864 | | 23,386 |
| Alternative Income Fund, | | | | | | | | | | | | |
| Class C | | 5/31/13 | | 1:10 | | $8.39 | | $83.88 | | 176,674 | | 17,667 |
| Alternative Income Fund, | | | | | | | | | | | | |
| Institutional Class | | 5/31/13 | | 1:10 | | $8.60 | | $86.01 | | 369,501 | | 36,950 |
| KINETICS PORTFOLIOS TRUST |
| Report of Independent Registered Public Accounting Firm |
Board of Directors and Shareholders of
Kinetics Mutual Funds, Inc.
Elmsford, NY
We have audited the accompanying statements of assets and liabilities, including the portfolios of investments, of The Internet Portfolio, The Global Portfolio, The Paradigm Portfolio, The Medical Portfolio, The Small Cap Opportunities Portfolio, The Market Opportunities Portfolio, The Alternative Income Portfolio (formerly the Water Infrastructure Portfolio), and The Multi-Disciplinary Portfolio, each a series of shares of Kinetics Portfolios Trust (the “Trust”), as of December 31, 2013, and the related statements of operations for the year then ended, the statements of changes in net assets for each of the two years in the period then ended and financial highlights for each of the five years in the period then ended. These financial statements and financial highlights are the responsibility of the Trusts’ management. Our responsibility is to express an opinion on these financial statements and financial highlights based on our audits.
We conducted our audits in accordance with the standards of the Public Company Accounting Oversight Board (United States). Those standards require that we plan and perform the audit to obtain reasonable assurance about whether the financial statements and financial highlights are free of material misstatement. We were not engaged to perform, nor was the Trust required to have, an audit of its internal control over financial reporting. Our audits included consideration of internal control over financial reporting as a basis for designing audit procedures that are appropriate in the circumstances, but not for the purpose of expressing an opinion on the effectiveness of the Trust’s internal control over financial reporting. Accordingly, we express no such opinion. An audit also includes examining, on a test basis, evidence supporting the amounts and disclosures in the financial statements. Our procedures included confirmation of securities owned as of December 31, 2013, by correspondence with the custodian and brokers or by other appropriate auditing procedures where replies from brokers were not received. An audit also includes assessing the accounting principles used and significant estimates made by management, as well as evaluating the overall financial statement presentation. We believe that our audits provide a reasonable basis for our opinion.
In our opinion, the financial statements and financial highlights referred to above present fairly in all material respects, the financial position of each of the eight portfolios of the Kinetics Portfolios Trust as of December 31, 2013, the results of their operations for the year then ended, the changes in their net assets for each of the two years in the period then ended and financial highlights for each of the five years in the period then ended, in conformity with accounting principles generally accepted in the United States of America.
Philadelphia, Pennsylvania
February 26, 2014
| KINETICS PORTFOLIOS TRUST |
| Management of the Funds and the Portfolios |
The management and affairs of the Funds and the Portfolios are supervised by the Board of Directors of the Company and the Board of Trustees of the Trust, respectively. Each Board consists of the same eight individuals, five of whom are not “interested persons” of the Company or the Trust as that term is defined in the Investment Company Act of 1940, as amended (the “1940 Act”). The Directors are fiduciaries for the Funds’ shareholders and are governed by the laws of the State of Maryland in this regard. The Trustees are fiduciaries for the Portfolios’ shareholders and are governed by the laws of the State of Delaware in this regard.
Each Board establishes policies for the operation of the Funds and the Portfolios and appoints the officers who conduct the daily business of the Funds and the Portfolios. Directors/Trustees of the Company and the Trust are listed below with their addresses, present positions with the Company and Trust, length of time served, principal occupations over at least the last five years, number of Funds and Portfolios overseen and any other Directorships held. The SAI includes additional information about the Funds’ officers and directors and is available, without charge, upon request by calling 1-800-930-3828.
| KINETICS PORTFOLIOS TRUST |
Management of the Funds and the Portfolios—(Continued) |
| (Unaudited) |
Board of Directors/Board of Trustees
Independent Directors/Trustees
| | | | | | | Number of |
| | | | | | | Portfolios/Funds in |
| | | | | Term of Office/ | | Fund Complex** |
| | | Position(s) with the | | Length of | | Overseen by |
| Name, Address and Year of Birth | | Company and Trust | | Time Served | | Trustee/Director |
| Steven T. Russell | | Independent | | Indefinite/ | | 16 | |
| Year Born: 1963 | | Director/Trustee | | Since 2000 | | | |
| c/o Kinetics Asset Management LLC | | | | | | | |
| 470 Park Avenue South | | | | | | | |
| New York, NY 10016 | | | | | | | |
| | | | | | | | |
| Douglas Cohen, C.P.A | | Independent | | Indefinite/ | | 16 | |
| Year Born: 1961 | | Director/Trustee | | Since 2000 | | | |
| c/o Kinetics Asset Management LLC | | | | | | | |
| 470 Park Avenue South | | | | | | | |
| New York, NY 10016 | | | | | | | |
| | | | | | | | |
| William J. Graham | | Independent | | Indefinite/ | | 16 | |
| Year Born: 1962 | | Director/Trustee | | Since 2000 | | | |
| c/o Kinetics Asset Management LLC | | | | | | | |
| 470 Park Avenue South | | | | | | | |
| New York, NY 10016 | | | | | | | |
| | | | | | | | |
| Joseph E. Breslin | | Independent | | Indefinite/ | | 16 | |
| Year Born: 1953 | | Director/Trustee | | Since 2000 | | | |
| c/o Kinetics Asset Management LLC | | | | | | | |
| 470 Park Avenue South | | | | | | | |
| New York, NY 10016 | | | | | | | |
| | | | | | | | |
| James M. Breen | | Independent | | Indefinite/ | | 16 | |
| Year Born: 1959 | | Director/Trustee | | Since 2008 | | | |
| c/o Kinetics Asset Management LLC. | | | | | | | |
| 470 Park Avenue South | | | | | | | |
| New York, NY 10016 | | | | | | | |
| KINETICS PORTFOLIOS TRUST |
Management of the Funds and the Portfolios—(Continued) |
| (Unaudited) |
| Principal Occupation During the Past Five Years | | Other Directorships Held by Trustee/Director |
| Attorney and Counselor at Law, Partner, Law Firm | | N/A |
| of Russell and Fig (2002-2010); Steven Russell Law | | |
| Firm (1994 to 2002); Professor of Business Law, | | |
| Suffolk County Community College | | |
| (1997 to Present). | | |
| | | |
| Sunrise Credit Services, Inc. (2005 to Present); | | Director, Kinetics Fund, Inc. |
| Wagner & Zwerman, LLP Certified Public | | (a private fund). |
| Accountant (1997 to 2005). | | |
| | | |
| | | |
| | | |
| Attorney, William J. Graham, PC (2001 to | | N/A |
| Present); Bracken & Margolin, LLP (1997 | | |
| to 2001). | | |
| | | |
| | | |
| | | |
| Chief Operating Officer, Central Park Credit | | Trustee, Hatteras Alternative Mutual Funds |
| Holdings, (2007-2009) Chief Operating Officer, | | Trust (5 portfolios); Trustee, Underlying |
| Aladdin Capital Management (2005-2007); | | Funds Trust (5 portfolios). |
| | | |
| | | |
| Homeland Security Investigations, Senior | | N/A |
| Special Agent, Miami, FL (2011 to Present); | | |
| Assistant Attaché Immigration & Customs | | |
| Enforcement, Pretoria, South Africa (2008 to | | |
| 2011); Immigration & Customs Enforcement | | |
| Representative, Athens, Greece (2006 to 2008); | | |
| Immigrations & Customs Enforcement, | | |
| Senior Special Agent, Miami, FL (2000 to 2008). | | |
| KINETICS PORTFOLIOS TRUST |
Management of the Funds and the Portfolios—(Continued) |
| (Unaudited) |
Board of Directors/Board of Trustees (Continued)
Interested Directors/Trustees and Officers
| | | | | | | Number of |
| | | | | | | Portfolios/Funds in |
| | | | | Term of Office/ | | Fund Complex** |
| | | Position(s) with the | | Length of | | Overseen by |
| Name, Address and Year of Birth | | Company and Trust | | Time Served | | Trustee/Director |
| Murray Stahl* | | Director/Trustee | | Indefinite/ | | 16 |
| Year Born: 1953 | | and Secretary | | Since 2000 | | |
| c/o Kinetics Asset Management LLC | | | | | | |
| 470 Park Avenue South | | | | | | |
| New York, NY 10016 | | | | | | |
| | | | | | | |
| | | | | | | |
| Peter B. Doyle* | | Director/Trustee, | | Indefinite/ | | 16 |
| Year Born: 1962 | | President and | | Since 2002 | | |
| c/o Kinetics Asset Management LLC | | Chairman of | | | | |
| 470 Park Avenue South | | the Board | | | | |
| New York, NY 10016 | | | | | | |
| | | | | | | |
| | | | | | | |
| | | | | | | |
| Leonid Polyakov* | | Director/Trustee | | Indefinite/ | | 16 |
| Year Born: 1959 | | and Treasurer | | Since 2002 | | |
| c/o Kinetics Asset Management LLC | | | | | | |
| 470 Park Avenue South | | | | | | |
| New York, NY 10016 | | | | | | |
| * | Directors/Trustees who are considered “interested persons” as defined in Section 2(a)(19) of the 1940 Act because of their association with the Adviser. |
| KINETICS PORTFOLIOS TRUST |
Management of the Funds and the Portfolios—(Continued) |
| (Unaudited) |
| Principal Occupation During the Past Five Years | | Other Directorships Held by Trustee/Director |
| Chairman, Co-Founder & Chief Investment Officer, Horizon Kinetics LLC, parent holding company to, among others, Horizon Asset Management LLC, Kinetics Asset Management LLC and Kinetics Advisers, LLC, registered investment advisers (1994 to Present); Director of Research, Kinetics Mutual Funds, Inc. (2002 to Present). | | Chairman, FRMO Corp. (2001 to Present) (an intellectual capital firm engaged in the analysis of public companies within a framework of identifying investment strategies and techniques that reduce risk.); Director Horizon Kinetics LLC (2011 to Present). |
| | | |
| Co-Founder and Senior Member, Horizon Kinetics LLC, parent holding company to, among others, Horizon Asset Management LLC, Kinetics Asset Management LLC and Kinetics Advisers, LLC, registered investment advisers (1994 to Present); President & Chief Investment Strategist, Kinetics Mutual Funds, Inc. (1998 to Present). | | Director, Kinetics Fund, Inc. (a private fund); Director and Officer, FRMO Corp. (2001 to Present); Director Horizon Kinetics LLC (2011 to Present). |
| | | |
| Chief Financial Officer, Kinetics Asset Management LLC and Kinetics Advisers, LLC, registered investment advisers (2000 to 2011). President, Kinetics Funds Distributor, Inc. (2002 to Present); formerly CFO, KBD Securities, LLC (2000 to 2010). | | Director, Kinetics Fund, Inc. (a private fund); Director Horizon Kinetics LLC (2011 to Present). |
| ** | The term “fund complex” refers to the Company and the Trust, which hold themselves out as related for investment purposes. |
| KINETICS MUTUAL FUNDS, INC. & KINETICS PORTFOLIOS TRUST |
| Privacy Policy |
We collect the following nonpublic personal information about you:
| • | Information we receive from you on or in applications or other forms, correspondence, or conversations, including, but not limited to, your name, address, phone number, social security number, assets, income and date of birth; and |
| | |
| • | Information about your transactions with us, our affiliates, or others, including, but not limited to, your account number and balance, payments history, parties to transactions, cost basis information, and other financial information. |
We do not disclose any nonpublic personal information about our current or former shareholders to nonaffiliated third parties, except as permitted by law. For example, we are permitted by law to disclose all of the information we collect, as described above, to our transfer agent to process your transactions. Furthermore, we restrict access to your nonpublic personal information to those persons who require such information to provide products or services to you. We maintain physical, electronic, and procedural safeguards that comply with federal standards to guard your nonpublic personal information.
In the event that you hold shares of the fund(s) through a financial intermediary, including, but not limited to, a broker-dealer, bank, or trust company, the privacy policy of your financial intermediary would govern how your nonpublic personal information would be shared with nonaffiliated third parties.
This privacy policy is not part of the annual report.
Kinetics Mutual
Funds, Inc.
615 East Michigan Street
Milwaukee, WI 53202
INVESTMENT ADVISER AND
SHAREHOLDER SERVICING AGENT
Kinetics Asset Management LLC
470 Park Avenue South
New York, NY 10016
INDEPENDENT REGISTERED
PUBLIC ACCOUNTING FIRM
Tait, Weller & Baker LLP
1818 Market Street
Suite 2400
Philadelphia, PA 19103
DISTRIBUTOR
Kinetics Funds Distributor LLC
470 Park Avenue South
New York, NY 10016
ADMINISTRATOR
FUND ACCOUNTANT AND
TRANSFER AGENT
U.S. Bancorp Fund Services, LLC
615 East Michigan Street
Milwaukee, WI 53202
CUSTODIAN
U.S. Bank, N.A.
Custody Operations
1555 River Center Drive, Suite 302
Milwaukee, WI 53212
THIS MATERIAL MUST BE PRECEDED OR
ACCOMPANIED BY A PROSPECTUS
Item 2. Code of Ethics.
The registrant has adopted a code of ethics that applies to the registrant’s principal executive officer and principal financial officer. The registrant has not made any amendments to its code of ethics during the period covered by this report. The registrant has not granted any waivers from any provisions of the code of ethics during the period covered by this report. A copy of the registrant’s Code of Ethics is filed herewith.
Item 3. Audit Committee Financial Expert.
The registrant’s board of trustees/directors has determined that there is at least one audit committee financial expert serving on its audit committee. Mr. Douglas Cohen and Mr. Joseph Breslin are the “audit committee financial experts” and are considered to be “independent” as each term is defined in Item 3 of Form N-CSR.
Item 4. Principal Accountant Fees and Services.
The registrant has engaged its principal accountant to perform audit services, audit-related services, tax services and other services during the past two fiscal years. “Audit services” refer to performing an audit of the registrant's annual financial statements or services that are normally provided by the accountant in connection with statutory and regulatory filings or engagements for those fiscal years. “Audit-related services” refer to the assurance and related services by the principal accountant that are reasonably related to the performance of the audit. “Tax services” refer to professional services rendered by the principal accountant for tax compliance, tax advice, and tax planning. There were no “Other services” provided by the principal accountant. The following table details the aggregate fees billed or expected to be billed for each of the last two fiscal years for audit fees, audit-related fees, tax fees and other fees by the principal accountant.
| | FYE 12/31/2013 Kinetics Portfolios Trust | FYE 12/31/2013 Kinetics Mutual Funds | FYE 12/31/2012 Kinetics Portfolios Trust | FYE 12/31/2012 Kinetics Mutual Funds |
| Audit Fees | 82,000 | 82,000 | 79,250 | 79,250 |
| Audit-Related Fees | 0 | 0 | 0 | 0 |
| Tax Fees | 22,500 | 22,500 | 22,000 | 22,000 |
| All Other Fees | 0 | 0 | 0 | 0 |
The audit committee has adopted pre-approval policies and procedures that require the audit committee to pre-approve all audit and non-audit services of the registrant, including services provided to any entity affiliated with the registrant.
The percentage of fees billed by Tait, Weller & Baker LLP applicable to non-audit services pursuant to waiver of pre-approval requirement were as follows:
| | FYE 12/31/2012 | FYE 12/31/2011 |
| Audit-Related Fees | 0% | 0% |
| Tax Fees | 0% | 0% |
| All Other Fees | 0% | 0% |
All of the principal accountant’s hours spent on auditing the registrant’s financial statements were attributed to work performed by full-time permanent employees of the principal accountant.
The following table indicates the non-audit fees billed or expected to be billed by the registrant’s accountant for services to the registrant and to the registrant’s investment adviser (and any other controlling entity, etc.—not sub-adviser) for the last two years. The audit committee of the board of trustees/directors has considered whether the provision of non-audit services that were rendered to the registrant's investment adviser is compatible with maintaining the principal accountant's independence and has concluded that the provision of such non-audit services by the accountant has not compromised the accountant’s independence.
| Non-Audit Related Fees | FYE 12/31/2012 | FYE 12/31/2011 |
| Registrant | 0 | 0 |
| Registrant’s Investment Adviser | 0 | 0 |
Item 5. Audit Committee of Listed Registrants.
Not applicable to registrants who are not listed issuers (as defined in Rule 10A-3 under the Securities Exchange Act of 1934).
Item 6. Schedule of Investments.
The Schedule of Investments is included as part of the report to shareholders filed under Item 1 of this Form.
Item 7. Disclosure of Proxy Voting Policies and Procedures for Closed-End Management Investment Companies.
Not applicable to open-end investment companies.
Item 8. Portfolio Managers of Closed-End Management Investment Companies.
Not applicable to open-end investment companies.
Item 9. Purchases of Equity Securities by Closed-End Management Investment Company and Affiliated Purchasers.
Not applicable to open-end investment companies.
Item 10. Submission of Matters to a Vote of Security Holders.
There have been no material changes to the procedures by which shareholders may recommend nominees to the registrant’s board of trustees.
Item 11. Controls and Procedures.
| (a) | The Registrant’s President/Chief Executive Officer and Treasurer/Chief Financial Officer have concluded that the Registrant's disclosure controls and procedures (as defined in Rule 30a-3(c) under the Investment Company Act of 1940, as amended (the “1940 Act”)) are effective as of a date within 90 days of the filing date of this report, that includes the disclosure required by this paragraph, based on the evaluation of these controls and procedures required by Rule 30a-3(b) under the 1940 Act and Rule 15d-15(b) under the Securities Exchange Act of 1934, as amended. |
| (b) | There were no changes in the Registrant's internal control over financial reporting (as defined in Rule 30a-3(d) under the Act) that occurred during the second fiscal quarter of the period covered by this report that has materially affected, or is reasonably likely to materially affect, the Registrant's internal control over financial reporting. |
Item 12. Exhibits.
| | (2) Certifications pursuant to Section 302 of the Sarbanes-Oxley Act of 2002. Filed herewith. |
| | (3) Not applicable to open-end investment companies. |
| (b) | Certification pursuant to Section 906 of the Sarbanes-Oxley Act of 2002. Furnished herewith. |
SIGNATURES
| | Pursuant to the requirements of the Securities Exchange Act of 1934 and the Investment Company Act of 1940, the registrant has duly caused this report to be signed on its behalf by the undersigned, thereunto duly authorized. |
| | |
| | (Registrant) Kinetics Mutual Funds, Inc. & Kinetics Portfolios Trust |
| | |
| | By (Signature and Title)* /s/ Peter B. Doyle |
| | Peter B. Doyle, President |
| | |
| | Date 3/10/2014 |
| | |
| | |
| | Pursuant to the requirements of the Securities Exchange Act of 1934 and the Investment Company Act of 1940, this report has been signed below by the following persons on behalf of the registrant and in the capacities and on the dates indicated. |
| | |
| | By (Signature and Title)* /s/ Peter B. Doyle |
| | Peter B. Doyle, President |
| | |
| | |
| | |
| | By (Signature and Title)* /s/ Leonid Polyakov |
| | Leonid Polyakov, Treasurer |
| | |
| | |
| | |
* Print the name and title of each signing officer under his or her signature.