U.S. Bancorp Fund Services, LLC
615 E. Michigan Street
| KINETICS MUTUAL FUNDS, INC. |
| Table of Contents |
| December 31, 2018 |
| | Page |
| Shareholders’ Letter | 2 |
| Year 2018 Annual Investment Commentary | 5 |
| KINETICS MUTUAL FUNDS, INC. — FEEDER FUNDS AND THE KINETICS SPIN-OFF AND CORPORATE RESTRUCTURING FUND | |
| Growth of $10,000 and $1,000,000 Investment | 12 |
| Expense Example | 23 |
| Allocation of Assets — The Kinetics Spin-off and Corporate Restructuring Fund | 30 |
| Schedule of Investments — The Kinetics Spin-off and Corporate Restructuring Fund | 31 |
| Statements of Assets & Liabilities | 34 |
| Statements of Operations | 39 |
| Statements of Changes in Net Assets | 44 |
| Notes to Financial Statements | 57 |
| Financial Highlights | 82 |
| Report of Independent Registered Public Accounting Firm | 115 |
| KINETICS PORTFOLIOS TRUST — MASTER INVESTMENT PORTFOLIOS | |
| Allocation of Consolidated Portfolio Assets | 117 |
| Consolidated Portfolio of Investments —The Internet Portfolio | 125 |
| Consolidated Portfolio of Investments — The Global Portfolio | 128 |
| Consolidated Portfolio of Investments — The Paradigm Portfolio | 131 |
| Portfolio of Investments — The Medical Portfolio | 136 |
| Consolidated Portfolio of Investments — The Small Cap Opportunities Portfolio | 138 |
| Consolidated Portfolio of Investments — The Market Opportunities Portfolio | 141 |
| Portfolio of Investments — The Alternative Income Portfolio | 144 |
| Portfolio of Investments — The Multi-Disciplinary Income Portfolio | 145 |
| Portfolio of Options Written — The Alternative Income Portfolio | 149 |
| Consolidated Statements of Assets & Liabilities | 150 |
| Consolidated Statements of Operations | 154 |
| Consolidated Statements of Changes in Net Assets | 158 |
| Consolidated Notes to Financial Statements | 162 |
| Report of Independent Registered Public Accounting Firm | 189 |
| Management of the Funds and the Portfolios | 191 |
| Privacy Policy | 201 |
| KINETICS MUTUAL FUNDS, INC. |
| Shareholders’ Letter |
Dear Fellow Shareholders:
We are pleased to present the Kinetics Mutual Funds (“Funds”) Annual Report for the twelve-month period ended December 31, 2018. During 2018, capital market returns deviated from the previous trend of an unrelenting upward advance in the prices of risk assets. Despite this volatility, and in most cases annual losses for investors, certain market dynamics remain constant at year end. Large capitalization companies continue to outperform smaller issues, particularly high growth companies, while smaller, more stable businesses continue to be out of favor. Concurrently, interest rates across the world continue to be set below reported inflation rates, hence limiting fixed income returns. These factors present unique challenges to long-term value-oriented investors in public markets, yet also corresponding opportunities. We continue to believe that these factors are not permanent, as few market factors are, and have strived to position the Funds to benefit accordingly. A performance summary follows (No-Load Class) for the fiscal year ended December 31, 2018: The Internet Fund -27.32%; The Global Fund -23.58%; The Paradigm Fund -5.55%; The Medical Fund 1.67%; The Small Cap Opportunities Fund 0.29%; The Market Opportunities Fund -10.86%; The Alternative Income Fund 0.92%; The Multi-Disciplinary Income Fund -1.00%; and the Kinetics Spin-Off and Corporate Restructuring Fund -8.22%. This compares to returns of: -4.38% for the S&P 500® Index; -8.48% for the S&P 600 Small Cap Index; -9.42% for the MSCI All Country World (ACWI) Index; 0.01% for the Bloomberg Barclays U.S. Aggregate Bond Index; -2.08% for the Bloomberg Barclays U.S. Corporate High Yield Bond Index; 1.64% for the Bloomberg Barclays 1-3 Year U.S. Credit Index; -3.88% for the Nasdaq Index; and -13.79% for the MSCI EAFE Index.
While we continue to provide equity and fixed income reference benchmark numbers (to aid in your understanding of how the broad asset classes have performed throughout the year ended December 31, 2018), we do not manage our Funds against any specific benchmark, nor have we ever in the history of the Funds. We believe that such benchmark adherence is highly detrimental to the long-term returns of a sound investment strategy.
Investment benchmarks were originally designed to provide a reference for relative performance of an asset class. This, in theory, could both facilitate investors’ ability to evaluate individual investments, but also set expectations for return levels and variability going forward. The widely recognized, although now less prominent Dow Jones Industrial Average can be traced as far back as
1896, when it tracked the performance of 12 industrial stocks. Standard & Poors introduced its first “composite” index in 1923, although it wasn’t until 1957 that the now ubiquitous S&P 500 was formally introduced, when Standard & Poors began to publish an index of 425 stocks.
Around the same time as the S&P 500 was first introduced, two related events were taking place that would have profound implications for indices. In the early 1950s, Harry Markowitz published a paper, followed by a book (1959) advancing Modern Portfolio Theory. Shortly thereafter, Eugene Fama began developing the Efficient Market Hypothesis. These independent, yet related theories promulgate the idea that a.) investors can optimize a portfolio through the balancing of asset classes and b.) markets are always completely efficient, offering no excess returns without corresponding risk. In other words, investors must simply accept asset class level returns and simply attempt to balance these allocations – outsized risk adjusted returns are not possible. There are numerous underlying assumptions to these theories, to many of which we take exception; however, it appears to us that a tremendous amount of capital remains invested to this day based on these premises.
These frameworks relate to indexation, which is premised on the theory that asset classes are quantified by benchmarks, hence optimized based upon historical data for these indices. If one wholly accepts the Efficient Market Hypothesis, the indices represent the return profile afforded by the asset class. Furthermore, as investment managers have found it increasingly difficult to outperform respective benchmarks, many have sought to mimic the benchmarks, only deviating ever so slightly so as to minimize the potential for underperformance. The merits of such an approach are debatable, but it implicitly accepts that the benchmark is the best representation of investments. This leads to questions as to the appropriateness of future return assumptions, as well as the quality of a representative benchmark.
Institutional investment allocators assume certain risk and return parameters for various asset classes, and apportion capital based on these assumptions. Most of these assumptions are predicated upon the long-term historical returns and corresponding return variability experienced by indices. As such, we believe that numerous investors and advisors continue to use 10% annual returns as an expectation for long-term equity returns, based upon S&P Composite data dating back to 1871. Data on the composite, maintained by Robert Shiller at Yale University, amounts to a total return of nearly 9% annually for over 140
years in stocks. It should be noted that this return presumes that dividends are not taxed, and fully reinvested into the index annually. Accordingly, most long-term holding periods throughout this 140 year sample generate returns on the order of 8%-10% annually.
There are numerous caveats to this theoretical long-term equity return assumption, most notably the impact of tax rates for taxable accounts, inflation rates and interest rates. For instance, the return since 1871 declines to under 7% in real terms once adjusted for inflation, and falls an additional 1% annually if dividends are assumed to have been taxed at a 20% rate throughout. Additionally, the current long-term bond rate (U.S. 10-year Treasury) was 2.68% at year-end 2018, versus a simple average during the period of 4.6%. While the current low rate environment may have aided equity returns in recent years, all else equal, higher rates in the future will weigh on equity returns. It should also be noted that at the beginning of this data set (1871) the earnings multiple on the index was less than half of the current valuation multiple.
This alternate analysis begs the question of how to compound wealth at acceptably high rates of return in the absence of a benchmark that purports to double invested capital every seven years (implied in a 10% net return assumption). While many equity market pragmatists advocate long-term buy and hold strategies in indices, we believe that indices are not capable of sustainably generating this presumed return.
Alas, we believe that investors must seek returns outside of benchmark and asset class level returns in order to achieve acceptable rates of return. This requires a truly active approach to security selection and portfolio management, emphasizing the merits of each individual business along with the price paid. Inevitably this results in portfolios of fewer, yet much higher conviction positions. Logically, if the aggregate of the benchmark is an unattractive investment, the more diversification towards a benchmarked investment, the less potential for achieving attractive outsized returns. This stands in stark contrast to the consensus view (largely held by the same individuals who advocate Modern Portfolio Theory, etc.) which endorses mitigating risk through diversification of holdings. As a closing thought on this topic, we reviewed the Bloomberg Billionaire Index, which estimates the wealth of and ranks the wealthiest individuals in the world. That data reveals that virtually all of the top 100 individuals have their concentration of wealth in a single or several companies.
| KINETICS MUTUAL FUNDS, INC. |
| Investment Commentary |
The investment returns of the family of Kinetics Mutual Funds (the “Funds”) are designed to be driven by the fundamental merits of the underlying investments. Over a long enough period, this is achievable; however, in practice, modern market structure make it quite difficult to consistently earn fundamentally driven returns in shorter time periods. Our performance during the previous year can be broken down into two such scenarios, where company specific fundamentals drove much of the Funds’ outperformance during first ten months of the year, yet broader industry and market influences drove much of the subsequent declines in November and December.
A cursory review of the Funds sector allocations will immediately suggest a material overweighting in energy companies, in addition to a relatively outsized cash allocation. We will address these individually, and their impact to performance, but will begin with energy. The majority of the Funds’ allocations to energy are in “asset light” businesses, which benefit from increased activity in energy development, but have minimal or no associated expenses or working capital requirements. This is in stark contrast to upstream oil and gas production companies, which incur heavy operating expenses and reinvestment requirements, in addition to working capital demands. These “asset light” companies, particularly one large position, drove significant positive performance contributions for the year, growing earnings per share over 2.5x compared to the prior year (assisted by a federal tax rate reduction). However, crude oil prices declined over 44% from peak to trough towards the latter end of the year. While we have a strong long-term outlook for oil prices, and believe that this was a temporary market imbalance, it became clear that the fundamentals of these companies were of little importance to the market. Despite this late year deluge, the sector was a material positive contribution to annual performance, albeit, far less so than prior to the market decline.
Energy investments bolstered performance for much of the year, driving outperformance for many of the Funds relative to their benchmarks. This was in spite of a large cash balances held for defensive purposes across most of the Funds. By year end, after equity market returns turned negative for the year, cash shifted from a material performance drag, into a positive contributor to returns. We have espoused a cautious investment allocation for much of the latter stages of the current market advance. The combination of unsustainably
low interest rates, increasing corporate and federal debt levels, and high absolute valuations underpin this caution. We ideally seek to find investments that offer positive potential returns that should be insulated from these factors and an inevitable market decline. To the extent that we are challenged in identifying a sufficient number of such companies, cash is an appealing holding. We believe that it not only serves as a store of value in turbulent markets, but also provides liquidity for future investment at far higher prospective rates of return should valuations correct. At year end, short term interest rates in the United States finally offer a better rate of return, albeit still below the rate of inflation.
Our valuation judgment largely prevented us from being more aggressive in terms of credit quality and the duration of assets in our fixed income investments, and caused us to essentially abstain from option writing for much of the year. We maintain a view that option premium and fixed income returns must be viewed in absolute terms, not simply relative to suppressed risk-free rates. In particular, the risk premium offered for considerably higher risk credit products is only marginally higher than investment grade yields. In terms of option exposure, the VIX (which is used to price option premiums), remained below long-term average levels. As such, options offered below long-term average returns, with what we considered to be above long-term risk.
In juxtaposition to our concern over global capital markets and unsustainable interest rate policies across the globe is our sanguine view of assets that can thrive outside of this system, or even provide solutions to it’s constraints. We believe that blockchain and cryptography-related financial assets have the potential to both maintain value in a world of devaluing fiat government currencies, and to hold abundant practical applications that can increase efficiency and transparency across industries. We were very early in making such investments, driving large gains off small initial investments, yet while the aggregate gains for the Funds who had such exposure remain considerable, returns were materially negative in 2018. We view this as a strategic holdings, as there is a finite supply, and should adoption and or perception change only slightly, we believe that there may be great promise for the future in this space.
While various Funds shared the performance drivers described above, specific attribution can be summarized as follows:
Paradigm Fund – The Fund maintained its defensive posture in 2018, several years after initiating this stance through higher quality equity positions and higher cash balances. For the first time since 2008, cash outperformed the S&P 500 Index for the year, bolstering Fund returns. This was offset by underperforming positions in real estate and financial services.
Small Cap Opportunities Fund – The Fund managed to achieve slightly positive returns for the year, despite a materially negative annual return for the S&P 600 Small Cap Index. This was driven by strong security selection within the energy and consumer staples sectors. Positions in real estate and financial services companies offset gains elsewhere in the portfolio, and the increasingly defensive portfolio positioning (namely cash) had an approximately neutral effect on total returns for the year.
Market Opportunities Fund – The Fund is amongst the most conservatively positioned in the fund family, with a generous cash balance maintained throughout the year. Given negative annual returns for the Fund and its benchmark, this high cash position contributed positively to returns. Strong stock selection in energy, consumer discretionary, and financial services companies was more than offset by exposure to cryptocurrency investments. While the latter investments were materially negative for the year, we believe this positioning may be a new growth segment for this Fund and potentially a defensive allocation over time.
Internet Fund – The investable universe for the Fund is inexorably intertwined with the technology sector, which we believe to be amongst the highest risk segments of the market. While we continue to identify opportunities at the margin, exposure to the information technology sector weighed negatively on returns. Considering the investment universe, the Fund is very defensive and maintains a generous cash position that contributed positively to annual returns, yet this was offset by an outsized exposure to cryptocurrency
investments. We believe cryptocurrency may be a new growth segment within the “Internet” sphere and potentially a defensive allocation over time.
Global Fund – Global investments are not the diversifying exposure that they have historically been; therefore, the Fund continued to be defensively positioned. The associated large cash balance softened losses for the year, while a preference for North American (U.S. & Canadian) companies contributed positively. We believe that international dependence on the U.S. Dollar is likely to come under increasing scrutiny, particularly as foreign borrowers are constrained by U.S. dollar-based debts and a strong exchange rate for the U.S. Dollar. To this end, Fund returns were diminished by related cryptocurrency investments.
Medical Fund – Healthcare stocks exhibited markedly divided returns in 2018, where large capitalization pharmaceutical companies outperformed the broader market, while biotechnology companies lagged. The Fund benefitted from an overweight exposure to such large pharmaceutical companies, while the smaller allocations to biotechnology companies detracted nominally.
Kinetics Spin-Off and Corporate Restructuring Fund – The investment opportunity set for newly issued spin-off securities was limited in the past year; accordingly, seasoned spin-offs and potential future spin-off investments populate most of the portfolio. That being said, many of these companies in the industrial, consumer discretionary and real estate sectors detracted from returns, while security selection within the energy sector slightly offset these declines.
Multi-Disciplinary Income Fund – Fixed income returns remain limited by low interest rate policies across the world, while suppressed volatility (over the long-term) has constrained potential income generation from option strategies. The Fund’s exposure to lower risk and shorter duration investments added to annual returns, while longer duration and lower credit quality issues detracted from returns in aggregate. The limited option exposure and short-term cash position were marginally positive to total returns.
Alternative Income Fund – The Fund was decidedly defensive for the year, given the resolve of the Federal Reserve to increase short-term interest rates. This resulted in overly low duration (cash) of the collateral portfolio, and a conservative, opportunistic approach to option writing. On balance, this resulted in modestly positive returns in an unaccommodating market.
In closing, we will revisit a long-term focus of the Funds, which is that of vested management teams leading the companies in which we invest. We refer to these investments as “owner operators,” and take comfort in a management team having considerable personal wealth investing alongside us as shareholders in their companies. Many of these esteemed allocators exercise similar caution as do we, and have been less aggressive in capital investments during the most recent market advance. As to be expected, this appears to us to have diminished the market perception of these companies, relenting to the market demand for stocks that are rising now. Many of these companies have been amongst the top drivers of the Funds’ long term performance, and we expect them to continue to be so in the fullness of time. We would like to think that we share the patience, discipline, and focus of these individuals – and that these virtues will be manifested in shareholder returns.
Disclosure
This material is intended to be reviewed in conjunction with a current prospectus, which includes all fees and expenses that apply to a continued investment, as well as information regarding the risk factors, policies and objectives of the Funds. Read it carefully before investing.
Mutual fund investing involves risk. Principal loss is possible. Because The Internet Fund, The Medical Fund and The Market Opportunities Fund invest in a single industry or geographic region, their shares are subject to a higher degree of risk than funds with a higher level of diversification. Internet, biotechnology and certain capital markets or gaming stocks are subject to a rate of change in technology, obsolescence and competition that is generally higher than that of other industries, hence they may experience extreme price and volume fluctuations.
International investing [for all Funds] presents special risks including currency exchange fluctuation, government regulations, and the potential for political and economic instability. Accordingly, the share prices for these Funds are expected to be more volatile than that of U.S.-only funds. Past performance is no guarantee of future performance.
Because smaller companies [for The Small Cap Opportunities Fund] often have narrower markets and limited financial resources, they present more risk than larger, more well established, companies.
Non-investment grade debt securities [for all Funds], i.e., junk bonds, are subject to greater credit risk, price volatility and risk of loss than investment grade securities.
Further, options contain special risks including the imperfect correlation between the value of the option and the value of the underlying asset. Investments [for The Multi- Disciplinary Income Fund and The Alternative Income Fund] in futures, swaps and other derivative instruments may result in loss as derivative instruments may be illiquid, difficult to price and leveraged so that small changes may produce disproportionate losses to the Funds. To the extent the Funds segregate assets to cover derivative positions, they may impair their ability to meet current obligations, to honor requests for redemption and to manage the investments in a manner consistent with their respective investment objectives. Purchasing and writing put and call
options and, in particular, writing “uncovered” options are highly specialized activities that entail greater than ordinary investment risk.
As non-diversified Funds, except The Global Fund, The Alternative Income Fund and The Multi-Disciplinary Income Fund, the value of Fund shares may fluctuate more than shares invested in a broader range of industries and companies. Unlike other investment companies that directly acquire and manage their own portfolios of securities, The Kinetics Mutual Funds, except Kinetics Spin-Off and Corporate Restructuring Fund, pursue their investment objectives by investing all of their investable assets in a corresponding portfolio series of the Kinetics Portfolios Trust.
The information concerning the Funds included in the shareholder report contains certain forward-looking statements about the factors that may affect the performance of the Funds in the future. These statements are based on Fund management’s predictions and expectations concerning certain future events and their expected impact on the Funds, such as performance of the economy as a whole and of specific industry sectors, changes in the levels of interest rates, the impact of developing world events, and other factors that may influence the future performance of the Funds. Management believes these forward-looking statements to be reasonable, although they are inherently uncertain and difficult to predict. Actual events may cause adjustments in portfolio management strategies from those currently expected to be employed.
The MSCI All Country World Index, the S&P 500® Index, NASDAQ Composite®, S&P 600® Small Cap Index, MSCI EAFE® Index, Bloomberg Barclays U.S. 1-3 Year Credit Index, Bloomberg Barclays U.S. Aggregate Bond Index and Bloomberg Barclays U.S. Corporate High Yield Bond Index each represent an unmanaged, broad-basket of stocks or bonds. They are typically used as a proxy for overall market performance.
Distributor: Kinetics Funds Distributor LLC is not an affiliate of Kinetics Mutual Funds, Inc. Kinetics Funds Distributor LLC is an affiliate of Kinetics Asset Management LLC, Investment Adviser to Kinetics Mutual Funds, Inc.
For more information, log onto www.kineticsfunds.com. January 1, 2019 — Kinetics Asset Management, LLC®
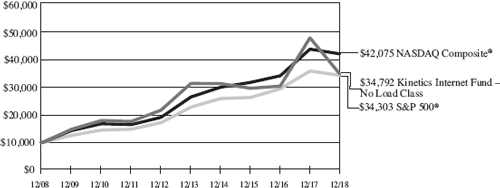
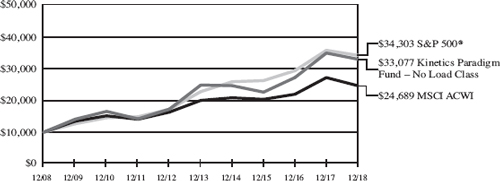
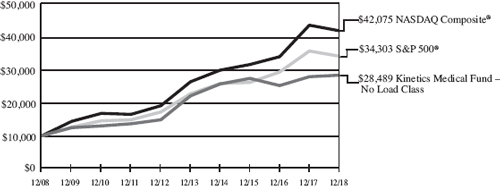
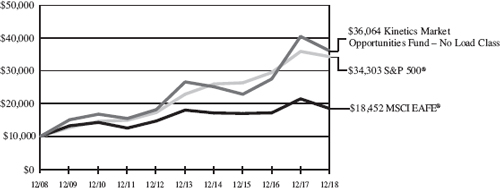
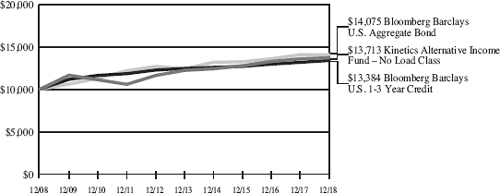
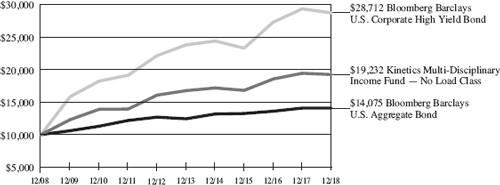
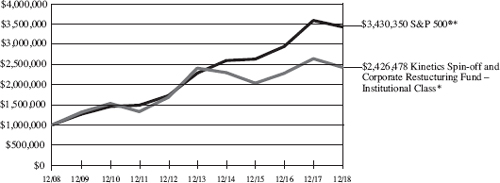
How a $10,000 and $1,000,000 Investment Have Grown:
The charts show the growth of a $10,000 investment in the Feeder Funds and a $1,000,000 investment in The Kinetics Spin-Off and Restructuring Fund (“The Spin-off Fund”) as compared to the performance of one or two representative market indices. The tables below the charts show the average annual total returns on an investment over various periods. Returns for periods greater than one year are average annual total returns. The annual returns assume the reinvestment of all dividends and distributions, however, the graph and table do not reflect the deduction of taxes that a shareholder would pay on fund distributions or the redemption of fund shares. Past performance is not predictive of future performance. Current performance may be lower or higher than the returns quoted below. The performance data reflects voluntary fee waivers and expense reimbursements made by the Adviser and the returns would have been lower if these waivers and expense reimbursements were not in effect. Investment return and principal value will fluctuate, so that shares, when redeemed, may be worth more or less than their original costs.
S&P 500® Index — is a capital-weighted index, representing the aggregate market value of the common equity of 500 stocks primarily traded on the New York Stock Exchange. The S&P 500® is unmanaged and includes the reinvestment of dividends and does not reflect the payments of transaction costs and advisory fees associated with an investment in the Funds. The securities that comprise the S&P 500® may differ substantially from the securities in the Funds’ portfolios. It is not possible to directly invest in an index.
NASDAQ Composite® — is a broad-based capitalization-weighted index of all NASDAQ stocks. The NASDAQ Composite® is unmanaged and does not include the reinvestment of dividends and does not reflect the payment of transaction costs or advisory fees associated with an investment in the Funds. The securities that comprise the NASDAQ Composite® may differ substantially from the securities in the Funds’ portfolios. It is not possible to directly invest in an index.
MSCI ACWI (All Country World Index) Index — is a free float-adjusted market capitalization weighted index that is designed to measure the equity market performance of developed and emerging markets. The MSCI ACWI consists of 46 country indices comprising 23 developed and 24 emerging market country indices. The developed market country indices included are: Australia, Austria, Belgium, Canada, Denmark, Finland, France, Germany, Hong Kong, Ireland, Israel, Italy, Japan, Netherlands, New Zealand, Norway, Portugal, Singapore, Spain, Sweden, Switzerland, the United Kingdom and the United States. The emerging market country indices included are: Brazil, Chile, China, Colombia, Czech Republic,
Egypt, Greece, Hungary, India, Indonesia, Korea, Malaysia, Mexico, Pakistan, Peru, Philippines, Poland, Qatar, Russia, South Africa, Taiwan, Thailand, Turkey, and United Arab Emirates. The securities that compromise the MSCI ACWI may differ substantially from the securities in the Funds’ portfolios. It is not possible to directly invest in an index.
S&P 600® SmallCap Index — measures the small-cap segment of the U.S. equity market. The index is designed to track companies that meet specific inclusion criteria to ensure that they are liquid and financially viable. The securities that comprise the S&P 600® may differ substantially from the securities in the Funds’ portfolios. It is not possible to directly invest in an index.
MSCI EAFE® Index (Europe, Australasia, Far East) — is a free float-adjusted market capitalization index that is designed to measure the equity market performance of developed markets, excluding the United States and Canada. As of June 2, 2014, the MSCI EAFE® Index consisted of the following 21 developed market country indices: Australia, Austria, Belgium, Denmark, Finland, France, Germany, Hong Kong, Ireland, Israel, Italy, Japan, the Netherlands, New Zealand, Norway, Portugal, Singapore, Spain, Sweden, Switzerland, and the United Kingdom. The securities that compromise the MSCI EAFE® may differ substantially from the securities in the Funds’ portfolio. It is not possible to directly invest in an index.
Bloomberg Barclays U.S. 1-3 Year Credit Index — measures the performance of investment grade corporate debt and sovereign, supranational, local authority and non-U.S. agency bonds that are U.S. dollar denominated and have a remaining maturity of greater than or equal to one year and less than three years. The securities that compromise the Bloomberg Barclays U.S. 1-3 Year Credit Index may differ substantially from the securities in the Funds’ portfolio. It is not possible to directly invest in an index.
Bloomberg Barclays U.S. Aggregate Bond Index — covers the USD-denominated, investment-grade, fixed-rate, taxable bond market of SEC-registered securities. The Index includes multiple types of government and corporate-issued bonds, some of which are asset-backed. The securities that compromise the Bloomberg Barclays U.S. Aggregate Bond Index may differ substantially from the securities in the Funds’ portfolio. It is not possible to directly invest in an index.
Bloomberg Barclays U.S. Corporate High Yield Bond Index —is composed of fixed-rate, publicly issued, non-investment grade debt. The securities that comprise the Bloomberg Barclays U.S. Corporate High Yield Bond Index may differ substantially from the securities in the Funds’ portfolio. It is not possible to directly invest in an index.
The Internet Fund
December 31, 2008 — December 31, 2018 (Unaudited)
| | | | Ended 12/31/2018 |
| | | | No Load
Class | | Advisor
Class A
(No Load) | | Advisor
Class A
(Load Adjusted)(1) | | Advisor
Class C | | S&P 500® | | NASDAQ
Composite® |
| One Year | | | -27.32 | % | | -27.47 | % | | -31.65 | % | | -27.86 | % | | -4.38 | % | | -3.88 | % |
| Five Years | | | 2.08 | % | | 1.84 | % | | 0.64 | % | | 1.34 | % | | 8.49 | % | | 9.70 | % |
| Ten Years | | | 13.28 | % | | 13.01 | % | | 12.34 | % | | 12.45 | % | | 13.12 | % | | 15.45 | % |
| Twenty Years | | | 8.14 | % | | N/A | | | N/A | | | N/A | | | 5.62 | % | | 5.69 | % |
| Since Inception | | | | | | | | | | | | | | | | | | | |
| No Load Class | | | | | | | | | | | | | | | | | | | |
| (10/21/96) | | | 12.99 | % | | N/A | | | N/A | | | N/A | | | 7.86 | % | | 7.86 | % |
| Since Inception | | | | | | | | | | | | | | | | | | | |
| Advisor Class A | | | | | | | | | | | | | | | | | | | |
| (4/26/01) | | | N/A | | | 6.51 | % | | 6.16 | % | | N/A | | | 6.19 | % | | 6.91 | % |
| Since Inception | | | | | | | | | | | | | | | | | | | |
| Advisor Class C | | | | | | | | | | | | | | | | | | | |
| (2/16/07) | | | N/A | | | N/A | | | N/A | | | 7.28 | % | | 6.93 | % | | 8.58 | % |
| (1) Reflects front-end sales charge of 5.75%. |
| |
| Returns for periods greater than one year are average annual total returns. |
The Global Fund
December 31, 2008 — December 31, 2018 (Unaudited)

| | | | Ended 12/31/2018 |
| | | | No Load
Class | | Advisor
Class A
(No Load) | | Advisor
Class A
(Load Adjusted)(1) | | Advisor
Class C | | S&P 500® | | MSCI
ACWI |
| One Year | | | -23.58 | % | | -23.72 | % | | -28.14 | % | | -24.20 | % | | -4.38 | % | | -9.42 | % |
| Five Years | | | -0.19 | % | | -0.17 | % | | -1.35 | % | | -0.94 | % | | 8.49 | % | | 4.26 | % |
| Ten Years | | | 10.29 | % | | 10.22 | % | | 9.58 | % | | 9.43 | % | | 13.12 | % | | 9.46 | % |
| Since Inception | | | | | | | | | | | | | | | | | | | |
| No Load Class | | | | | | | | | | | | | | | | | | | |
| (12/31/99) | | | -1.40 | % | | N/A | | | N/A | | | N/A | | | 4.86 | % | | 3.47 | % |
| Since Inception | | | | | | | | | | | | | | | | | | | |
| Advisor Class A | | | | | | | | | | | | | | | | | | | |
| (5/19/08) | | | N/A | | | 3.21 | % | | 2.63 | % | | N/A | | | 7.74 | % | | 3.46 | % |
| Since Inception | | | | | | | | | | | | | | | | | | | |
| Advisor Class C | | | | | | | | | | | | | | | | | | | |
| (5/19/08) | | | N/A | | | N/A | | | N/A | | | 2.51 | % | | 7.74 | % | | 3.46 | % |
| (1) Reflects front-end sales charge of 5.75%. |
| |
| Returns for periods greater than one year are average annual total returns. |
The Paradigm Fund
December 31, 2008 — December 31, 2018 (Unaudited)
| | | | Ended 12/31/2018 |
| | | | No Load
Class | | Advisor
Class A
(No Load) | | Advisor
Class A
(Load Adjusted)(1) | | Advisor
Class C | | Institutional
Class | | S&P 500® | | MSCI
ACWI |
| One Year | | | -5.55 | % | | -5.79 | % | | -11.21 | % | | -6.27 | % | | -5.37 | % | | -4.38 | % | | -9.42 | % |
| Five Years | | | 5.85 | % | | 5.58 | % | | 4.34 | % | | 5.06 | % | | 6.06 | % | | 8.49 | % | | 4.26 | % |
| Ten Years | | | 12.71 | % | | 12.43 | % | | 11.77 | % | | 11.86 | % | | 12.93 | % | | 13.12 | % | | 9.46 | % |
| Since Inception | | | | | | | | | | | | | | | | | | | | | | |
| No Load Class | | | | | | | | | | | | | | | | | | | | | | |
| (12/31/99) | | | 8.88 | % | | N/A | | | N/A | | | N/A | | | N/A | | | 4.86 | % | | 3.47 | % |
| Since Inception | | | | | | | | | | | | | | | | | | | | | | |
| Advisor Class A | | | | | | | | | | | | | | | | | | | | | | |
| (4/26/01) | | | N/A | | | 9.03 | % | | 8.66 | % | | N/A | | | N/A | | | 6.19 | % | | 5.07 | % |
| Since Inception | | | | | | | | | | | | | | | | | | | | | | |
| Advisor Class C | | | | | | | | | | | | | | | | | | | | | | |
| (6/28/02) | | | N/A | | | N/A | | | N/A | | | 9.01 | % | | N/A | | | 7.97 | % | | 6.67 | % |
| Since Inception | | | | | | | | | | | | | | | | | | | | | | |
| Institutional Class | | | | | | | | | | | | | | | | | | | | | | |
| (5/27/05) | | | N/A | | | N/A | | | N/A | | | N/A | | | 7.75 | % | | 7.81 | % | | 5.80 | % |
| (1) Reflects front-end sales charge of 5.75%. |
| |
| Returns for periods greater than one year are average annual total returns. |
The Medical Fund
December 31, 2008 — December 31, 2018 (Unaudited)
| | | | Ended 12/31/2018 |
| | | | No Load
Class | | Advisor
Class A
(No Load) | | Advisor
Class A
(Load Adjusted)(1) | | Advisor
Class C | | S&P 500® | | NASDAQ
Composite® |
| One Year | | | 1.67 | % | | 1.36 | % | | -4.45 | % | | 0.90 | % | | -4.38 | % | | -3.88 | % |
| Five Years | | | 5.14 | % | | 4.87 | % | | 3.64 | % | | 4.35 | % | | 8.49 | % | | 9.70 | % |
| Ten Years | | | 11.04 | % | | 10.76 | % | | 10.11 | % | | 10.20 | % | | 13.12 | % | | 15.45 | % |
| Since Inception | | | | | | | | | | | | | | | | | | | |
| No Load Class | | | | | | | | | | | | | | | | | | | |
| (9/30/99) | | | 8.76 | % | | N/A | | | N/A | | | N/A | | | 5.56 | % | | 4.69 | % |
| Since Inception | | | | | | | | | | | | | | | | | | | |
| Advisor Class A | | | | | | | | | | | | | | | | | | | |
| (4/26/01) | | | N/A | | | 5.62 | % | | 5.27 | % | | N/A | | | 6.19 | % | | 6.91 | % |
| Since Inception | | | | | | | | | | | | | | | | | | | |
| Advisor Class C | | | | | | | | | | | | | | | | | | | |
| (2/16/07) | | | N/A | | | N/A | | | N/A | | | 7.22 | % | | 6.93 | % | | 8.58 | % |
| (1) Reflects front-end sales charge of 5.75%. |
| |
| Returns for periods greater than one year are average annual total returns. |
The Small Cap Opportunities Fund
December 31, 2008 — December 31, 2018 (Unaudited)

| | | | Ended 12/31/2018 |
| | | | No Load
Class | | Advisor
Class A
(No Load) | | Advisor
Class A
(Load Adjusted)(1) | | Advisor
Class C | | Institutional
Class | | S&P 600® | | S&P 500® |
| One Year | | | 0.29 | % | | 0.00 | % | | -5.75 | % | | -0.50 | % | | 0.44 | % | | -8.48 | % | | -4.38 | % |
| Five Years | | | 5.08 | % | | 4.81 | % | | 3.57 | % | | 4.29 | % | | 5.28 | % | | 6.34 | % | | 8.49 | % |
| Ten Years | | | 14.94 | % | | 14.65 | % | | 13.98 | % | | 14.08 | % | | 15.16 | % | | 13.61 | % | | 13.12 | % |
| Since Inception | | | | | | | | | | | | | | | | | | | | | | |
| No Load Class | | | | | | | | | | | | | | | | | | | | | | |
| (3/20/00) | | | 9.78 | % | | N/A | | | N/A | | | N/A | | | N/A | | | 8.86 | % | | 4.95 | % |
| Since Inception | | | | | | | | | | | | | | | | | | | | | | |
| Advisor Class A | | | | | | | | | | | | | | | | | | | | | | |
| (12/31/01) | | | N/A | | | 8.20 | % | | 7.82 | % | | N/A | | | N/A | | | 9.15 | % | | 6.84 | % |
| Since Inception | | | | | | | | | | | | | | | | | | | | | | |
| Advisor Class C | | | | | | | | | | | | | | | | | | | | | | |
| (2/16/07) | | | N/A | | | N/A | | | N/A | | | 4.73 | % | | N/A | | | 7.49 | % | | 6.93 | % |
| Since Inception | | | | | | | | | | | | | | | | | | | | | | |
| Institutional Class | | | | | | | | | | | | | | | | | | | | | | |
| (8/12/05) | | | N/A | | | N/A | | | N/A | | | N/A | | | 7.86 | % | | 8.23 | % | | 7.70 | % |
| (1) Reflects front-end sales charge of 5.75%. |
| |
| Returns for periods greater than one year are average total returns. |
The Market Opportunities Fund
December 31, 2008 — December 31, 2018 (Unaudited)
| | | | Ended 12/31/2018 |
| | | | No Load
Class | | Advisor
Class A
(No Load) | | Advisor
Class A
(Load Adjusted)(1) | | Advisor
Class C | | Institutional
Class | | S&P 500® | | MSCI EAFE® |
| One Year | | | -10.86 | % | | -11.10 | % | | -16.21 | % | | -11.48 | % | | -10.70 | % | | -4.38 | % | | -13.79 | % |
| Five Years | | | 6.30 | % | | 6.04 | % | | 4.80 | % | | 5.51 | % | | 6.53 | % | | 8.49 | % | | 0.53 | % |
| Ten Years | | | 13.69 | % | | 13.40 | % | | 12.73 | % | | 12.86 | % | | 13.95 | % | | 13.12 | % | | 6.32 | % |
| Since Inception | | | | | | | | | | | | | | | | | | | | | | |
| No Load Class | | | | | | | | | | | | | | | | | | | | | | |
| (1/31/06) | | | 7.80 | % | | N/A | | | N/A | | | N/A | | | N/A | | | 7.59 | % | | 2.54 | % |
| Since Inception | | | | | | | | | | | | | | | | | | | | | | |
| Advisor Class A | | | | | | | | | | | | | | | | | | | | | | |
| (1/31/06) | | | N/A | | | 7.53 | % | | 7.04 | % | | N/A | | | N/A | | | 7.59 | % | | 2.54 | % |
| Since Inception | | | | | | | | | | | | | | | | | | | | | | |
| Advisor Class C | | | | | | | | | | | | | | | | | | | | | | |
| (2/16/07) | | | N/A | | | N/A | | | N/A | | | 5.34 | % | | N/A | | | 6.93 | % | | 0.91 | % |
| Since Inception | | | | | | | | | | | | | | | | | | | | | | |
| Institutional Class | | | | | | | | | | | | | | | | | | | | | | |
| (5/19/08) | | | N/A | | | N/A | | | N/A | | | N/A | | | 6.56 | % | | 7.74 | % | | 0.46 | % |
| (1) Reflects front-end sales charge of 5.75%. |
| |
| Returns for periods greater than one year are average total returns. |
The Alternative Income Fund
December 31, 2008 — December 31, 2018 (Unaudited)
| | | | Ended 12/31/2018 |
| | | | No Load
Class | | Advisor
Class A
(No Load) | | Advisor
Class A
(Load Adjusted)(1) | | Advisor
Class C | | Institutional
Class | | Bloomberg
Barclays
U.S. 1-3
Year
Credit | | Bloomberg
Barclays
U.S.
Aggregate
Bond |
| One Year | | | 0.92 | % | | 0.65 | % | | -5.14 | % | | 0.15 | % | | 1.10 | % | | 1.64 | % | | 0.01 | % |
| Five Years | | | 2.33 | % | | 2.06 | % | | 0.86 | % | | 1.56 | % | | 2.52 | % | | 1.47 | % | | 2.52 | % |
| Ten Years | | | 3.21 | % | | 2.95 | % | | 2.34 | % | | 2.44 | % | | 3.46 | % | | 2.96 | % | | 3.48 | % |
| Since Inception | | | | | | | | | | | | | | | | | | | | | | |
| No Load Class | | | | | | | | | | | | | | | | | | | | | | |
| (6/29/07) | | | 0.45 | % | | N/A | | | N/A | | | N/A | | | N/A | | | 2.91 | % | | 3.99 | % |
| Since Inception | | | | | | | | | | | | | | | | | | | | | | |
| Advisor Class A | | | | | | | | | | | | | | | | | | | | | | |
| (6/29/07) | | | N/A | | | 0.20 | % | | -0.31 | % | | N/A | | | N/A | | | 2.91 | % | | 3.99 | % |
| Since Inception | | | | | | | | | | | | | | | | | | | | | | |
| Advisor Class C | | | | | | | | | | | | | | | | | | | | | | |
| (6/29/07) | | | N/A | | | N/A | | | N/A | | | -0.29 | % | | N/A | | | 2.91 | % | | 3.99 | % |
| Since Inception | | | | | | | | | | | | | | | | | | | | | | |
| Institutional Class | | | | | | | | | | | | | | | | | | | | | | |
| (6/29/07) | | | N/A | | | N/A | | | N/A | | | N/A | | | 0.69 | % | | 2.91 | % | | 3.99 | % |
| (1) Reflects front-end sales charge of 5.75%. |
| |
| Returns for periods greater than one year are average total returns. |
The Multi-Disciplinary Income Fund
December 31, 2008 — December 31, 2018 (Unaudited)
| | | | Ended 12/31/2018 |
| | | | No Load
Class | | Advisor
Class A
(No Load) | | Advisor
Class A
(Load Adjusted)(1) | | Advisor
Class C | | Institutional
Class | | Bloomberg
Barclays
U.S.
Aggregate
Bond | | Bloomberg
Barclays
U.S.
Corporate
High
Yield Bond |
| One Year | | | -1.00 | % | | -1.18 | % | | -6.88 | % | | -1.83 | % | | -0.80 | % | | 0.01 | % | | -2.08 | % |
| Five Years | | | 2.79 | % | | 2.52 | % | | 1.31 | % | | 2.00 | % | | 2.98 | % | | 2.52 | % | | 3.83 | % |
| Ten Years | | | 6.76 | % | | 6.50 | % | | 5.87 | % | | 5.95 | % | | 6.97 | % | | 3.48 | % | | 11.12 | % |
| No Load Class | | | | | | | | | | | | | | | | | | | | | | |
| (2/11/08) | | | 4.30 | % | | N/A | | | N/A | | | N/A | | | N/A | | | 3.51 | % | | 7.40 | % |
| Since Inception | | | | | | | | | | | | | | | | | | | | | | |
| Advisor Class A | | | | | | | | | | | | | | | | | | | | | | |
| (2/11/08) | | | N/A | | | 4.04 | % | | 3.48 | % | | N/A | | | N/A | | | 3.51 | % | | 7.40 | % |
| Since Inception | | | | | | | | | | | | | | | | | | | | | | |
| Advisor Class C | | | | | | | | | | | | | | | | | | | | | | |
| (2/11/08) | | | N/A | | | N/A | | | N/A | | | 3.51 | % | | N/A | | | 3.51 | % | | 7.40 | % |
| Since Inception | | | | | | | | | | | | | | | | | | | | | | |
| Institutional Class | | | | | | | | | | | | | | | | | | | | | | |
| (2/11/08) | | | N/A | | | N/A | | | N/A | | | N/A | | | 4.50 | % | | 3.51 | % | | 7.40 | % |
| (1) Reflects front-end sales charge of 5.75%. |
| |
| Returns for periods greater than one year are average total returns. |
The Kinetics Spin-off and Corporate Restructuring Fund
December 31, 2008 — December 31, 2018 (Unaudited)
| | | | Ended 12/31/2018 |
| | | | No Load
Class | | Advisor
Class A
(No Load) | | Advisor
Class A
(Load Adjusted)(1) | | Advisor
Class C | | Institutional
Class | | S&P 500® |
| One Year | | | -8.22 | % | | -8.30 | % | | -13.56 | % | | -9.00 | % | | -8.11 | % | | -4.38 | % |
| Five Years | | | N/A | | | -0.06 | % | | -1.04 | % | | -0.84 | % | | 0.17 | % | | 8.49 | % |
| Ten Years | | | N/A | | | 9.00 | % | | 8.48 | % | | 8.31 | % | | 9.27 | % | | 13.12 | % |
| Since Inception | | | | | | | | | | | | | | | | | | | |
| No Load Class | | | | | | | | | | | | | | | | | | | |
| (12/11/17) | | | -5.14 | % | | N/A | | | N/A | | | N/A | | | N/A | | | -3.62 | % |
| Since Inception | | | | | | | | | | | | | | | | | | | |
| Advisor Class A | | | | | | | | | | | | | | | | | | | |
| (5/4/07) | | | N/A | | | 0.91 | % | | 0.49 | % | | N/A | | | N/A | | | 6.72 | % |
| Since Inception | | | | | | | | | | | | | | | | | | | |
| Advisor Class C | | | | | | | | | | | | | | | | | | | |
| (5/24/07) | | | N/A | | | N/A | | | N/A | | | 0.23 | % | | N/A | | | 6.73 | % |
| Since Inception | | | | | | | | | | | | | | | | | | | |
| Institutional Class | | | | | | | | | | | | | | | | | | | |
| (7/11/07) | | | N/A | | | N/A | | | N/A | | | N/A | | | 0.47 | % | | 6.72 | % |
| (1) Reflects front-end sales charge of 5.75%. |
| |
| Returns for periods greater than one year are average annual total returns. |
| |
| * Reflects the growth of a $1,000,000 investment. |
| KINETICS MUTUAL FUNDS, INC. — THE FUNDS |
| Expense Example |
| December 31, 2018 |
Shareholders incur two types of costs: (1) transaction costs, including sales charges (loads) on purchase payments, reinvestments of dividends or other distributions made by a Fund, redemption fees, and exchange fees, and (2), ongoing costs, including management fees, distribution and/or service (12b-1) fees, and other Fund expenses. This example is intended to help investors understand the ongoing costs (in dollars) of investing in a series of Kinetics Mutual Funds, Inc. (except the Spin-off Fund, each a “Feeder Fund” and including the Spin-off Fund, collectively the “Funds”), and to compare these costs with the ongoing costs of investing in other mutual funds. The example is based on an investment of $1,000 invested on July 1, 2018 and held for the entire period from July 1, 2018 to December 31, 2018.
Actual Expenses
The Actual Expenses comparison provides information about actual account values and actual expenses. Unlike other mutual funds that directly acquire and manage their own portfolio securities, each Feeder Fund invests all or generally all of its investable assets in a corresponding series of The Kinetics Portfolios Trust (each, a “Master Portfolio”, and together the “Master Portfolios”), a separately registered investment company. The Master Portfolio, in turn, invests in securities. With this type of organization, expenses can accrue specifically to the Master Portfolio or the Feeder Fund or both. Each Feeder Fund records its proportionate share of the Master Portfolio’s expenses, including directed brokerage credits, on a daily basis. Any expense reductions include Fund-specific expenses as well as the expenses allocated from the Master Portfolio. Note, the Spin-off Fund is not a Feeder Fund.
The Funds will charge shareholder fees for outgoing wire transfers, returned checks, and exchanges executed by telephone between a Fund and any other Fund. The Funds’ transfer agent charges a $5.00 transaction fee to shareholder accounts for telephone exchanges between any two Funds. The Funds’ transfer agent does not charge a transaction fee for written exchange requests. IRA accounts are assessed a $15.00 annual fee. Finally, as a disincentive to market-timing transactions, the Funds will assess a 2.00% fee on the redemption or exchange of Fund shares held for less than 30 days. These fees will be paid to the Funds to help offset transaction costs. The Funds reserve the right to waive the redemption fee, subject to their sole discretion, in instances deemed not to be disadvantageous to the Funds or shareholders as described in the Funds’ prospectus.
| KINETICS MUTUAL FUNDS, INC. — THE FUNDS |
| Expense Example — (Continued) |
| December 31, 2018 |
A shareholder may use the information provided in the first line, together with the amounts invested, to estimate the expenses paid over the period. A shareholder may divide his/her account value by $1,000 (e.g., an $8,600 account value divided by $1,000 = 8.6), then multiply the result by the number in the first line under the heading entitled “Expenses Paid During Period” to estimate the expenses paid on his/her account during this period.
Hypothetical Example for Comparison Purposes
The Hypothetical Example for Comparison Purposes provides information about hypothetical account values and hypothetical expenses based on the Funds’ actual expense ratios and an assumed rate of return of 5% per year before expenses, which are not the Funds’ actual returns. The hypothetical account values and expenses may not be used to estimate the actual ending account balance or expenses paid for the period. A shareholder may use this information to compare the ongoing costs of investing in the Funds and other funds. To do so, a shareholder would compare this 5% hypothetical example with the 5% hypothetical examples that appear in the shareholder reports of other funds. The expenses shown in the table are meant to highlight ongoing costs only and do not reflect any transactional costs, such as sales charges (loads), redemption fees, or exchange fees. Therefore, the Hypothetical Example for Comparison Purposes is useful in comparing ongoing costs only, and will not help determine the relative total costs of owning different funds. In addition, if these transactional costs were included, shareholders costs would have been higher.
| KINETICS MUTUAL FUNDS, INC. — THE FUNDS |
| Expense Example — (Continued) |
| December 31, 2018 |
| | | | | | | | | | | | | Expenses Paid | |
| | | | Beginning | | | Ending | | | | | | During | |
| | | | Account | | | Account | | | Annualized | | | Period* | |
| | | | Value | | | Value | | | Expense | | | (7/1/18 to | |
| | | | (7/1/18) | | | (12/31/18) | | | Ratio | | | 12/31/18) | |
| | | | | | | | | | | | | | |
| The Internet Fund | | | | | | | | | | | | | |
| No Load Class Actual | | $ | 1,000.00 | | $ | 853.40 | | | 1.85 | % | $ | 8.64 | |
| No Load Class Hypothetical (5% return before expenses) | | $ | 1,000.00 | | $ | 1,015.88 | | | 1.85 | % | $ | 9.40 | |
| Advisor Class A Actual | | $ | 1,000.00 | | $ | 852.50 | | | 2.10 | % | $ | 9.81 | |
| Advisor Class A Hypothetical (5% return before expenses) | | $ | 1,000.00 | | $ | 1,014.62 | | | 2.10 | % | $ | 10.66 | |
| Advisor Class C Actual | | $ | 1,000.00 | | $ | 850.40 | | | 2.60 | % | $ | 12.13 | |
| Advisor Class C Hypothetical (5% return before expenses) | | $ | 1,000.00 | | $ | 1,012.10 | | | 2.60 | % | $ | 13.19 | |
| | | | | | | | | | | | | | |
| The Global Fund | | | | | | | | | | | | | |
| No Load Class Actual - after expense reimbursement | | $ | 1,000.00 | | $ | 820.50 | | | 1.39 | % | $ | 6.38 | |
| No Load Class Hypothetical (5% return before expenses) - after expense reimbursement | | $ | 1,000.00 | | $ | 1,018.20 | | | 1.39 | % | $ | 7.07 | |
| Advisor Class A Actual - after expense reimbursement | | $ | 1,000.00 | | $ | 820.20 | | | 1.64 | % | $ | 7.52 | |
| Advisor Class A Hypothetical (5% return before expenses) - after expense reimbursement | | $ | 1,000.00 | | $ | 1,016.94 | | | 1.64 | % | $ | 8.34 | |
| Advisor Class C Actual - after expense reimbursement | | $ | 1,000.00 | | $ | 817.30 | | | 2.14 | % | $ | 9.80 | |
| Advisor Class C Hypothetical (5% return before expenses) - after expense reimbursement | | $ | 1,000.00 | | $ | 1,014.42 | | | 2.14 | % | $ | 10.87 | |
| KINETICS MUTUAL FUNDS, INC. — THE FUNDS |
| Expense Example — (Continued) |
| December 31, 2018 |
| | | | | | | | | | | | | Expenses Paid | |
| | | | Beginning | | | Ending | | | | | | During | |
| | | | Account | | | Account | | | Annualized | | | Period* | |
| | | | Value | | | Value | | | Expense | | | (7/1/18 to | |
| | | | (7/1/18) | | | (12/31/18) | | | Ratio | | | 12/31/18) | |
| | | | | | | | | | | | | | |
| The Paradigm Fund | | | | | | | | | | | | | |
| No Load Class Actual - after expense reimbursement | | $ | 1,000.00 | | $ | 834.00 | | | 1.64 | % | $ | 7.58 | |
| No Load Class Hypothetical (5% return before expenses) - after expense reimbursement | | $ | 1,000.00 | | $ | 1,016.94 | | | 1.64 | % | $ | 8.34 | |
| Advisor Class A Actual - after expense reimbursement | | $ | 1,000.00 | | $ | 833.10 | | | 1.89 | % | $ | 8.73 | |
| Advisor Class A Hypothetical (5% return before expenses) - after expense reimbursement | | $ | 1,000.00 | | $ | 1,015.68 | | | 1.89 | % | $ | 9.60 | |
| Advisor Class C Actual - after expense reimbursement | | $ | 1,000.00 | | $ | 830.90 | | | 2.39 | % | $ | 11.03 | |
| Advisor Class C Hypothetical (5% return before expenses) - after expense reimbursement | | $ | 1,000.00 | | $ | 1,013.16 | | | 2.39 | % | $ | 12.13 | |
| Institutional Class Actual - after expense reimbursement | | $ | 1,000.00 | | $ | 834.90 | | | 1.44 | % | $ | 6.66 | |
| Institutional Class Hypothetical (5% return before expenses) - after expense reimbursement | | $ | 1,000.00 | | $ | 1,017.95 | | | 1.44 | % | $ | 7.32 | |
| | | | | | | | | | | | | | |
| The Medical Fund | | | | | | | | | | | | | |
| No Load Class Actual - after expense reimbursement | | $ | 1,000.00 | | $ | 1,052.90 | | | 1.39 | % | $ | 7.19 | |
| No Load Class Hypothetical (5% return before expenses) - after expense reimbursement | | $ | 1,000.00 | | $ | 1,018.20 | | | 1.39 | % | $ | 7.07 | |
| Advisor Class A Actual - after expense reimbursement | | $ | 1,000.00 | | $ | 1,051.60 | | | 1.64 | % | $ | 8.48 | |
| Advisor Class A Hypothetical (5% return before expenses) - after expense reimbursement | | $ | 1,000.00 | | $ | 1,016.94 | | | 1.64 | % | $ | 8.34 | |
| Advisor Class C Actual - after expense reimbursement | | $ | 1,000.00 | | $ | 1,049.10 | | | 2.14 | % | $ | 11.05 | |
| Advisor Class C Hypothetical (5% return before expenses) - after expense reimbursement | | $ | 1,000.00 | | $ | 1,014.42 | | | 2.14 | % | $ | 10.87 | |
| KINETICS MUTUAL FUNDS, INC. — THE FUNDS |
| Expense Example — (Continued) |
| December 31, 2018 |
| | | | | | | | | | | | | Expenses Paid | |
| | | | Beginning | | | Ending | | | | | | During | |
| | | | Account | | | Account | | | Annualized | | | Period* | |
| | | | Value | | | Value | | | Expense | | | (7/1/18 to | |
| | | | (7/1/18) | | | (12/31/18) | | | Ratio | | | 12/31/18) | |
| | | | | | | | | | | | | | |
| The Small Cap Opportunities Fund | | | | | | | | | | | | | |
| No Load Class Actual - after expense reimbursement | | $ | 1,000.00 | | $ | 850.60 | | | 1.64 | % | $ | 7.65 | |
| No Load Class Hypothetical (5% return before expenses) - after expense reimbursement | | $ | 1,000.00 | | $ | 1,016.94 | | | 1.64 | % | $ | 8.34 | |
| Advisor Class A Actual - after expense reimbursement | | $ | 1,000.00 | | $ | 849.40 | | | 1.89 | % | $ | 8.81 | |
| Advisor Class A Hypothetical (5% return before expenses) - after expense reimbursement | | $ | 1,000.00 | | $ | 1,015.68 | | | 1.89 | % | $ | 9.60 | |
| Advisor Class C Actual - after expense reimbursement | | $ | 1,000.00 | | $ | 847.20 | | | 2.39 | % | $ | 11.13 | |
| Advisor Class C Hypothetical (5% return before expenses) - after expense reimbursement | | $ | 1,000.00 | | $ | 1,013.16 | | | 2.39 | % | $ | 12.13 | |
| Institutional Class Actual - after expense reimbursement | | $ | 1,000.00 | | $ | 851.40 | | | 1.44 | % | $ | 6.72 | |
| Institutional Class Hypothetical (5% return before expenses) - after expense reimbursement | | $ | 1,000.00 | | $ | 1,017.95 | | | 1.44 | % | $ | 7.32 | |
| | | | | | | | | | | | | | |
| The Market Opportunities Fund | | | | | | | | | | | | | |
| No Load Class Actual - after expense reimbursement | | $ | 1,000.00 | | $ | 874.40 | | | 1.64 | % | $ | 7.75 | |
| No Load Class Hypothetical (5% return before expenses) - after expense reimbursement | | $ | 1,000.00 | | $ | 1,016.94 | | | 1.64 | % | $ | 8.34 | |
| Advisor Class A Actual - after expense reimbursement | | $ | 1,000.00 | | $ | 873.40 | | | 1.89 | % | $ | 8.92 | |
| Advisor Class A Hypothetical (5% return before expenses) - after expense reimbursement | | $ | 1,000.00 | | $ | 1,015.68 | | | 1.89 | % | $ | 9.60 | |
| Advisor Class C Actual - after expense reimbursement | | $ | 1,000.00 | | $ | 871.50 | | | 2.39 | % | $ | 11.27 | |
| Advisor Class C Hypothetical (5% return before expenses) - after expense reimbursement | | $ | 1,000.00 | | $ | 1,013.16 | | | 2.39 | % | $ | 12.13 | |
| Institutional Class Actual - after expense reimbursement | | $ | 1,000.00 | | $ | 875.20 | | | 1.44 | % | $ | 6.81 | |
| Institutional Class Hypothetical (5% return before expenses) - after expense reimbursement | | $ | 1,000.00 | | $ | 1,017.95 | | | 1.44 | % | $ | 7.32 | |
| KINETICS MUTUAL FUNDS, INC. — THE FUNDS |
| Expense Example — (Continued) |
| December 31, 2018 |
| | | | | | | | | | | | | Expenses Paid | |
| | | | Beginning | | | Ending | | | | | | During | |
| | | | Account | | | Account | | | Annualized | | | Period* | |
| | | | Value | | | Value | | | Expense | | | (7/1/18 to | |
| | | | (7/1/18) | | | (12/31/18) | | | Ratio | | | 12/31/18) | |
| | | | | | | | | | | | | | |
| The Alternative Income Fund | | | | | | | | | | | | | |
| No Load Class Actual - after expense reimbursement | | $ | 1,000.00 | | $ | 1,010.00 | | | 0.95 | % | $ | 4.81 | |
| No Load Class Hypothetical (5% return before expenses) - after expense reimbursement | | $ | 1,000.00 | | $ | 1,020.42 | | | 0.95 | % | $ | 4.84 | |
| Advisor Class A Actual - after expense reimbursement | | $ | 1,000.00 | | $ | 1,008.70 | | | 1.20 | % | $ | 6.08 | |
| Advisor Class A Hypothetical (5% return before expenses) - after expense reimbursement | | $ | 1,000.00 | | $ | 1,019.16 | | | 1.20 | % | $ | 6.11 | |
| Advisor Class C Actual - after expense reimbursement | | $ | 1,000.00 | | $ | 1,006.20 | | | 1.70 | % | $ | 8.60 | |
| Advisor Class C Hypothetical (5% return before expenses) - after expense reimbursement | | $ | 1,000.00 | | $ | 1,016.64 | | | 1.70 | % | $ | 8.64 | |
| Institutional Class Actual - after expense reimbursement | | $ | 1,000.00 | | $ | 1,010.90 | | | 0.75 | % | $ | 3.80 | |
| Institutional Class Hypothetical (5% return before expenses) - after expense reimbursement | | $ | 1,000.00 | | $ | 1,021.43 | | | 0.75 | % | $ | 3.82 | |
| | | | | | | | | | | | | | |
| The Multi-Disciplinary Income Fund | | | | | | | | | | | | | |
| No Load Class Actual - after expense reimbursement | | $ | 1,000.00 | | $ | 988.60 | | | 1.49 | % | $ | 7.47 | |
| No Load Class Hypothetical (5% return before expenses) - after expense reimbursement | | $ | 1,000.00 | | $ | 1,017.69 | | | 1.49 | % | $ | 7.58 | |
| Advisor Class A Actual - after expense reimbursement | | $ | 1,000.00 | | $ | 988.00 | | | 1.74 | % | $ | 8.72 | |
| Advisor Class A Hypothetical (5% return before expenses) - after expense reimbursement | | $ | 1,000.00 | | $ | 1,016.43 | | | 1.74 | % | $ | 8.84 | |
| Advisor Class C Actual - after expense reimbursement | | $ | 1,000.00 | | $ | 984.60 | | | 2.24 | % | $ | 11.21 | |
| Advisor Class C Hypothetical (5% return before expenses) - after expense reimbursement | | $ | 1,000.00 | | $ | 1,013.91 | | | 2.24 | % | $ | 11.37 | |
| Institutional Class Actual - after expense reimbursement | | $ | 1,000.00 | | $ | 989.60 | | | 1.29 | % | $ | 6.47 | |
| Institutional Class Hypothetical (5% return before expenses) - after expense reimbursement | | $ | 1,000.00 | | $ | 1,018.70 | | | 1.29 | % | $ | 6.56 | |
| KINETICS MUTUAL FUNDS, INC. — THE FUNDS |
| Expense Example — (Continued) |
| December 31, 2018 |
| | | | | | | | | | | | | Expenses Paid | |
| | | | Beginning | | | Ending | | | | | | During | |
| | | | Account | | | Account | | | Annualized | | | Period* | |
| | | | Value | | | Value | | | Expense | | | (7/1/18 to | |
| | | | (7/1/18) | | | (12/31/18) | | | Ratio | | | 12/31/18) | |
| | | | | | | | | | | | | | |
| The Kinetics Spin-off and Corporate Restructuring Fund | | | | | | | | | | | | | |
| No Load Class Actual - after expense reimbursement | | $ | 1,000.00 | | $ | 808.30 | | | 1.45 | % | $ | 6.61 | |
| No Load Class Hypothetical (5% return before expenses) - after expense reimbursement | | $ | 1,000.00 | | $ | 1,017.89 | | | 1.45 | % | $ | 7.37 | |
| Advisor Class A Actual - after expense reimbursement | | $ | 1,000.00 | | $ | 808.00 | | | 1.68 | % | $ | 7.66 | |
| Advisor Class A Hypothetical (5% return before expenses) - after expense reimbursement | | $ | 1,000.00 | | $ | 1,016.73 | | | 1.68 | % | $ | 8.54 | |
| Advisor Class C Actual - after expense reimbursement | | $ | 1,000.00 | | $ | 804.70 | | | 2.18 | % | $ | 9.92 | |
| Advisor Class C Hypothetical (5% return before expenses) - after expense reimbursement | | $ | 1,000.00 | | $ | 1,014.21 | | | 2.18 | % | $ | 11.07 | |
| Institutional Class Actual - after expense reimbursement | | $ | 1,000.00 | | $ | 808.40 | | | 1.38 | % | $ | 6.29 | |
| Institutional Class Hypothetical (5% return before expenses) - after expense reimbursement | | $ | 1,000.00 | | $ | 1,018.24 | | | 1.38 | % | $ | 7.02 | |
| Note: | Each Feeder Fund records its proportionate share of the respective Master Portfolio’s expenses on a daily basis. Any expense reductions include Feeder Fund-specific expenses as well as the expenses allocated from the Master Portfolio. |
| | |
| * | Expenses are equal to the to the Fund’s annualized expense ratio after expense reimbursement multiplied by the average account value over the period, multiplied by 184/365. |
| KINETICS MUTUAL FUNDS, INC. — THE FUND |
| Allocation of Portfolio Assets |
| December 31, 2018 |
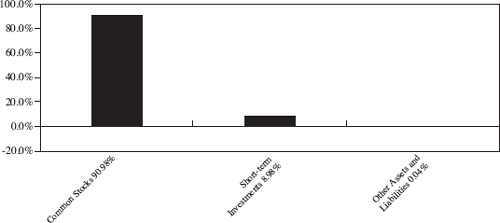
The Kinetics Spin-off and Corporate Restructuring Fund
| | | | | | | Percentage | |
| | | | Market | | | of Total | |
| Sector Allocation* | | | Value | | | Net Assets | |
| Mining, Quarrying, and Oil and Gas Extraction | | $ | 5,811,690 | | | 31.0 | % |
| Manufacturing | | | 2,176,243 | | | 11.6 | % |
| Real Estate and Rental and Leasing | | | 2,094,659 | | | 11.2 | % |
| Information | | | 1,750,116 | | | 9.4 | % |
| Management of Companies and Enterprises | | | 1,629,708 | | | 8.7 | % |
| Administrative and Support and Waste Management and Remediation Services | | | 933,399 | | | 5.0 | % |
| Educational Services | | | 832,754 | | | 4.5 | % |
| Transportation and Warehousing | | | 497,952 | | | 2.7 | % |
| Finance and Insurance | | | 472,693 | | | 2.5 | % |
| Accommodation and Food Services | | | 411,840 | | | 2.2 | % |
| Arts, Entertainment, and Recreation | | | 183,717 | | | 1.0 | % |
| Construction | | | 166,668 | | | 0.9 | % |
| Retail Trade | | | 60,931 | | | 0.3 | % |
| Professional, Scientific, and Technical Services | | | 7,930 | | | 0.0 | % |
| * | Excludes Short-Term Investments |
| KINETICS MUTUAL FUNDS, INC. — THE FUND |
| The Kinetics Spin-off and Corporate |
| Restructuring Fund |
| Schedule of Investments — December 31, 2018 |
| COMMON STOCKS — 90.98% | | | Shares | | | Value | |
| Accommodation — 2.20% | | | | | | | |
| Civeo Corporation* | | | 288,000 | | $ | 411,840 | |
| Administrative and Support Services — 4.99% | | | | | | | |
| PayPal Holdings, Inc.* | | | 11,100 | | | 933,399 | |
| Beverage and Tobacco Product Manufacturing — 0.42% | | | | | | | |
| Crimson Wine Group Limited* | | | 10,000 | | | 78,250 | |
| Broadcasting (except Internet) — 6.49% | | | | | | | |
| Cable One, Inc. | | | 750 | | | 615,075 | |
| The E.W. Scripps Company — Class A | | | 20,000 | | | 314,600 | |
| TEGNA, Inc. | | | 11,600 | | | 126,092 | |
| Tribune Media Company — Class A | | | 3,500 | | | 158,830 | |
| | | | | | | 1,214,597 | |
| Chemical Manufacturing — 0.33% | | | | | | | |
| Rayonier Advanced Materials, Inc. | | | 5,800 | | | 61,770 | |
| Construction of Buildings — 0.89% | | | | | | | |
| Masco Corporation | | | 5,700 | | | 166,668 | |
| Educational Services — 4.45% | | | | | | | |
| Graham Holdings Company — Class B | | | 1,300 | | | 832,754 | |
| Funds, Trusts, and Other Financial Vehicles — 1.77% | | | | | | | |
| Capital Southwest Corporation | | | 17,300 | | | 332,506 | |
| Health and Personal Care Stores — 0.13% | | | | | | | |
| Prestige Consumer Healthcare, Inc.* | | | 797 | | | 24,611 | |
| Lessors of Nonfinancial Intangible Assets (except Copyrighted Works) — 0.03% | | | | | | | |
| PrairieSky Royalty Limited | | | 500 | | | 6,472 | |
| Machinery Manufacturing — 4.31% | | | | | | | |
| General Electric Company | | | 42,100 | | | 318,697 | |
| The Manitowoc Company, Inc.* | | | 8,025 | | | 118,529 | |
| Welbilt, Inc.* | | | 33,300 | | | 369,963 | |
| | | | | | | 807,189 | |
| Management of Companies and Enterprises — 8.71% | | | | | | | |
| Associated Capital Group, Inc. — Class Ac | | | 33,600 | | | 1,183,728 | |
| Dundee Corporation — Class A* | | | 48,400 | | | 46,420 | |
| Icahn Enterprises LP | | | 7,000 | | | 399,560 | |
| | | | | | | 1,629,708 | |
The accompanying notes are an integral part of these financial statements.
| KINETICS MUTUAL FUNDS, INC. — THE FUND |
| The Kinetics Spin-off and Corporate |
| Restructuring Fund |
| Schedule of Investments — December 31, 2018 — (Continued) |
| | | | Shares | | | Value | |
| Medical Equipment and Supplies Manufacturing — 2.54% | | | | | | | |
| Avanos Medical, Inc.* | | | 10,600 | | $ | 474,774 | |
| Miscellaneous Manufacturing — 4.03% | | | | | | | |
| CSW Industrials, Inc.* | | | 15,600 | | | 754,260 | |
| Oil and Gas Extraction — 31.05% | | | | | | | |
| Texas Pacific Land Trustc | | | 10,730 | | | 5,811,690 | |
| Other Financial Investment Activities — 0.75% | | | | | | | |
| GAMCO Investors, Inc. — Class A | | | 8,300 | | | 140,187 | |
| Other Telecommunications — 1.74% | | | | | | | |
| Liberty Broadband Corporation — Series A* | | | 3,000 | | | 215,430 | |
| Liberty Media Corp.-Liberty SiriusXM — Class C* | | | 3,000 | | | 110,940 | |
| | | | | | | 326,370 | |
| Publishing Industries (except Internet) — 1.12% | | | | | | | |
| Gannett Company, Inc. | | | 7,700 | | | 65,681 | |
| New Media Investment Group, Inc. | | | 12,400 | | | 143,468 | |
| | | | | | | 209,149 | |
| Real Estate — 11.16% | | | | | | | |
| DREAM Unlimited Corp. — Class A*c | | | 203,200 | | | 1,024,128 | |
| The Howard Hughes Corporation*c | | | 10,900 | | | 1,064,059 | |
| | | | | | | 2,088,187 | |
| Scientific Research and Development Services — 0.04% | | | | | | | |
| Rafael Holdings, Inc. — Class B* | | | 1,000 | | | 7,930 | |
| Spectator Sports — 0.98% | | | | | | | |
| Liberty Media Corp.-Liberty Braves — Class C* | | | 1,590 | | | 39,575 | |
| Liberty Media Corp.-Liberty Formula One — Class A* | | | 4,850 | | | 144,142 | |
| | | | | | | 183,717 | |
| Sporting Goods, Hobby, Musical Instrument, and Book Stores — 0.19% | | | | | | | |
| Vista Outdoor, Inc.* | | | 3,200 | | | 36,320 | |
| Water Transportation — 2.66% | | | | | | | |
| A.P. Moeller-Maersk A/S — Class B — ADR | | | 79,800 | | | 497,952 | |
| TOTAL COMMON STOCKS | | | | | | | |
| (cost $13,294,313) | | | | | | 17,030,300 | |
The accompanying notes are an integral part of these financial statements.
| KINETICS MUTUAL FUNDS, INC. — THE FUND |
| The Kinetics Spin-off and Corporate |
| Restructuring Fund |
| Schedule of Investments — December 31, 2018 — (Continued) |
| SHORT-TERM INVESTMENTS — 8.98% | | | Shares | | | Value | |
| Money Market Funds — 0.01% | | | | | | | |
| Fidelity Institutional Government Portfolio — Class I, 2.25%b | | | 1,102 | | $ | 1,102 | |
| | | | Principal | | | | |
| | | | Amount | | | | |
| U.S. Treasury Obligations — 8.97% | | | | | | | |
| United States Treasury Bills | | | | | | | |
| Maturity Date: 01/22/2019, Yield to Maturity 2.25% | | $ | 1,682,000 | | | 1,679,855 | |
| TOTAL SHORT-TERM INVESTMENTS | | | | | | | |
| (cost $1,680,904) | | | | | | 1,680,957 | |
| TOTAL INVESTMENTS — 99.96% | | | | | | | |
| (cost $14,975,217) | | | | | $ | 18,711,257 | |
| Percentages are stated as a percent of net assets. |
| * — | Non-income producing security. |
| b — | The rate quoted is the annualized seven-day yield as of December 31, 2018. |
| c — | Significant Investment — See note 6. |
| ADR — | American Depository Receipt. |
The accompanying notes are an integral part of these financial statements.
| KINETICS MUTUAL FUNDS, INC. — THE FEEDER FUNDS |
| Statements of Assets & Liabilities |
| December 31, 2018 |
| | | | The Internet | | | The Global | |
| | | | Fund | | | Fund | |
| ASSETS: | | | | | | | |
| Investments in the Master Portfolio, at value* | | $ | 105,872,779 | | $ | 10,963,919 | |
| Receivable from Adviser | | | — | | | 19,731 | |
| Receivable for Master Portfolio interest sold | | | 664,387 | | | — | |
| Receivable for Fund shares sold | | | 27,138 | | | 9,380 | |
| Prepaid expenses and other assets | | | 27,212 | | | 21,538 | |
| Total Assets | | | 106,591,516 | | | 11,014,568 | |
| LIABILITIES: | | | | | | | |
| Payable for Master Portfolio interest purchased | | | — | | | 6,597 | |
| Payable to Directors | | | 2,874 | | | 293 | |
| Payable to Chief Compliance Officer | | | 258 | | | 21 | |
| Payable for Fund shares repurchased | | | 691,522 | | | 2,782 | |
| Payable for shareholder servicing fees | | | 22,939 | | | 2,377 | |
| Payable for distribution fees | | | 8,424 | | | 24,096 | |
| Fund distribution payable | | | 2 | | | — | |
| Accrued expenses and other liabilities | | | 51,811 | | | 17,050 | |
| Total Liabilities | | | 777,830 | | | 53,216 | |
| Net Assets | | $ | 105,813,686 | | $ | 10,961,352 | |
| NET ASSETS CONSIST OF: | | | | | | | |
| Paid in capital | | $ | 108,513,058 | | $ | 10,467,794 | |
| Accumulated earnings (deficit) | | | (2,699,372 | ) | | 493,558 | |
| Total net assets | | $ | 105,813,686 | | $ | 10,961,352 | |
| CALCULATION OF NET ASSET VALUE PER SHARE - NO LOAD CLASS: | | | | | | | |
| Net Assets | | $ | 102,268,024 | | $ | 5,665,173 | |
| Shares outstanding | | | 3,760,778 | | | 1,036,757 | |
| Net asset value per share (offering price and redemption price) | | $ | 27.19 | | $ | 5.46 | |
| CALCULATION OF NET ASSET VALUE PER SHARE - ADVISOR CLASS A: | | | | | | | |
| Net Assets | | $ | 2,480,795 | | $ | 1,012,132 | |
| Shares outstanding | | | 99,244 | | | 185,825 | |
| Net asset value per share (redemption price) | | $ | 25.00 | | $ | 5.45 | |
| Offering price per share ($25.00 divided by .9425 and $5.45 divided by .9425) | | $ | 26.53 | | $ | 5.78 | |
| CALCULATION OF NET ASSET VALUE PER SHARE - ADVISOR CLASS C: | | | | | | | |
| Net Assets | | $ | 1,064,867 | | $ | 4,284,047 | |
| Shares outstanding | | | 50,281 | | | 836,093 | |
| Net asset value per share (offering price and redemption price) | | $ | 21.18 | | $ | 5.12 | |
| * | Each Feeder Fund invests all or generally all its assets directly in the corresponding Master Portfolio. The financial statements for the Master Portfolios, along with the portfolio of investments in securities, are contained elsewhere in this report and should be read in conjunction with the Feeder Funds’ financial statements. |
The accompanying notes are an integral part of these financial statements.
| KINETICS MUTUAL FUNDS, INC. — THE FEEDER FUNDS |
| Statements of Assets & Liabilities — (Continued) |
| December 31, 2018 |
| | | | The Paradigm | | | The Medical | |
| | | | Fund | | | Fund | |
| ASSETS: | | | | | | | |
| Investments in the Master Portfolio, at value* | | $ | 643,491,784 | | $ | 16,433,880 | |
| Receivable from Adviser | | | 96,601 | | | 19,146 | |
| Receivable for Master Portfolio interest sold | | | 158,341 | | | — | |
| Receivable for Fund shares sold | | | 632,985 | | | 3,819 | |
| Prepaid expenses and other assets | | | 47,068 | | | 23,403 | |
| Total Assets | | | 644,426,779 | | | 16,480,248 | |
| LIABILITIES: | | | | | | | |
| Payable for Master Portfolio interest purchased | | | — | | | 3,744 | |
| Payable to Directors | | | 17,845 | | | 383 | |
| Payable to Chief Compliance Officer | | | 1,235 | | | 27 | |
| Payable for Fund shares repurchased | | | 788,533 | | | 75 | |
| Payable for shareholder servicing fees | | | 116,156 | | | 3,521 | |
| Payable for distribution fees | | | 141,226 | | | 935 | |
| Fund distribution payable | | | 2,794 | | | — | |
| Accrued expenses and other liabilities | | | 180,323 | | | 18,064 | |
| Total Liabilities | | | 1,248,112 | | | 26,749 | |
| Net Assets | | $ | 643,178,667 | | $ | 16,453,499 | |
| NET ASSETS CONSIST OF: | | | | | | | |
| Paid in capital | | $ | 473,673,297 | | $ | 12,063,293 | |
| Accumulated earnings | | | 169,505,370 | | | 4,390,206 | |
| Total net assets | | $ | 643,178,667 | | $ | 16,453,499 | |
| CALCULATION OF NET ASSET VALUE PER SHARE - NO LOAD CLASS: | | | | | | | |
| Net Assets | | $ | 297,990,444 | | $ | 14,814,221 | |
| Shares outstanding | | | 7,211,588 | | | 631,333 | |
| Net asset value per share (offering price and redemption price) | | $ | 41.32 | | $ | 23.47 | |
| CALCULATION OF NET ASSET VALUE PER SHARE - ADVISOR CLASS A: | | | | | | | |
| Net Assets | | $ | 95,502,773 | | $ | 1,319,191 | |
| Shares outstanding | | | 2,390,691 | | | 58,639 | |
| Net asset value per share (redemption price) | | $ | 39.95 | | $ | 22.50 | |
| Offering price per share ($39.95 divided by .9425 and $22.50 divided by .9425) | | $ | 42.39 | | $ | 23.87 | |
| CALCULATION OF NET ASSET VALUE PER SHARE - ADVISOR CLASS C: | | | | | | | |
| Net Assets | | $ | 100,717,915 | | $ | 320,087 | |
| Shares outstanding | | | 2,713,549 | | | 14,761 | |
| Net asset value per share (offering price and redemption price) | | $ | 37.12 | | $ | 21.69 | |
| CALCULATION OF NET ASSET VALUE PER SHARE - INSTITUTIONAL CLASS: | | | | | | | |
| Net Assets | | $ | 148,967,535 | | | N/A | |
| Shares outstanding | | | 3,573,011 | | | N/A | |
| Net asset value per share (offering price and redemption price) | | $ | 41.69 | | | N/A | |
| * | Each Feeder Fund invests all or generally all its assets directly in the corresponding Master Portfolio. The financial statements for the Master Portfolios, along with the portfolio of investments in securities, are contained elsewhere in this report and should be read in conjunction with the Feeder Funds’ financial statements. |
The accompanying notes are an integral part of these financial statements.
| KINETICS MUTUAL FUNDS, INC. — THE FEEDER FUNDS |
| Statements of Assets & Liabilities — (Continued) |
| December 31, 2018 |
| | | | The Small Cap | | | The Market | |
| | | | Opportunities | | | Opportunities | |
| | | | Fund | | | Fund | |
| ASSETS: | | | | | | | |
| Investments in the Master Portfolio, at value* | | $ | 223,337,175 | | $ | 72,915,722 | |
| Receivable from Adviser | | | 49,735 | | | 23,227 | |
| Receivable for Master Portfolio interest sold | | | — | | | 13,262 | |
| Receivable for Fund shares sold | | | 1,129,744 | | | 3,204 | |
| Prepaid expenses and other assets | | | 32,934 | | | 36,635 | |
| Total Assets | | | 224,549,588 | | | 72,992,050 | |
| LIABILITIES: | | | | | | | |
| Payable for Master Portfolio interest purchased | | | 173,992 | | | — | |
| Payable to Directors | | | 6,469 | | | 1,820 | |
| Payable to Chief Compliance Officer | | | 354 | | | 132 | |
| Payable for Fund shares repurchased | | | 955,752 | | | 16,275 | |
| Payable for shareholder servicing fees | | | 42,819 | | | 13,909 | |
| Payable for distribution fees | | | 16,265 | | | 27,107 | |
| Fund distribution payable | | | — | | | 191 | |
| Accrued expenses and other liabilities | | | 71,048 | | | 31,354 | |
| Total Liabilities | | | 1,266,699 | | | 90,788 | |
| Net Assets | | $ | 223,282,889 | | $ | 72,901,262 | |
| NET ASSETS CONSIST OF: | | | | | | | |
| Paid in capital | | $ | 208,860,349 | | $ | 62,177,266 | |
| Accumulated earnings | | | 14,422,540 | | | 10,723,996 | |
| Total net assets | | $ | 223,282,889 | | $ | 72,901,262 | |
| CALCULATION OF NET ASSET VALUE PER SHARE - NO LOAD CLASS: | | | | | | | |
| Net Assets | | $ | 164,330,086 | | $ | 48,486,656 | |
| Shares outstanding | | | 3,196,857 | | | 2,220,905 | |
| Net asset value per share (offering price and redemption price) | | $ | 51.40 | | $ | 21.83 | |
| CALCULATION OF NET ASSET VALUE PER SHARE - ADVISOR CLASS A: | | | | | | | |
| Net Assets | | $ | 10,505,241 | | $ | 6,425,834 | |
| Shares outstanding | | | 210,915 | | | 298,971 | |
| Net asset value per share (redemption price) | | $ | 49.81 | | $ | 21.49 | |
| Offering price per share ($49.81 divided by .9425 and $21.49 divided by .9425) | | $ | 52.85 | | $ | 22.80 | |
| CALCULATION OF NET ASSET VALUE PER SHARE - ADVISOR CLASS C: | | | | | | | |
| Net Assets | | $ | 8,372,940 | | $ | 8,517,358 | |
| Shares outstanding | | | 176,161 | | | 413,358 | |
| Net asset value per share (offering price and redemption price) | | $ | 47.53 | | $ | 20.61 | |
| CALCULATION OF NET ASSET VALUE PER SHARE - INSTITUTIONAL CLASS: | | | | | | | |
| Net Assets | | $ | 40,074,622 | | $ | 9,471,414 | |
| Shares outstanding | | | 766,195 | | | 427,351 | |
| Net asset value per share (offering price and redemption price) | | $ | 52.30 | | $ | 22.16 | |
| * | Each Feeder Fund invests all or generally all its assets directly in the corresponding Master Portfolio. The financial statements for the Master Portfolios, along with the portfolio of investments in securities, are contained elsewhere in this report and should be read in conjunction with the Feeder Funds’ financial statements. |
The accompanying notes are an integral part of these financial statements.
| KINETICS MUTUAL FUNDS, INC. — THE FEEDER FUNDS |
| Statements of Assets & Liabilities — (Continued) |
| December 31, 2018 |
| | | The Alternative | | | The Multi-
Disciplinary | |
| | | | Income | | | Income | |
| | | | Fund | | | Fund | |
| ASSETS: | | | | | | | |
| Investments in the Master Portfolio, at value* | | $ | 19,005,671 | | $ | 37,240,162 | |
| Receivable from Adviser | | | 22,139 | | | 23,250 | |
| Receivable for Master Portfolio interest sold | | | — | | | 65,842 | |
| Receivable for Fund shares sold | | | 11,016 | | | — | |
| Prepaid expenses and other assets | | | 21,075 | | | 41,967 | |
| Total Assets | | | 19,059,901 | | | 37,371,221 | |
| LIABILITIES: | | | | | | | |
| Payable for Master Portfolio interest purchased | | | 10,558 | | | — | |
| Payable to Directors | �� | | 426 | | | 882 | |
| Payable to Chief Compliance Officer | | | 33 | | | 71 | |
| Payable for Fund shares repurchased | | | 457 | | | 65,842 | |
| Payable for shareholder servicing fees | | | 1,883 | | | 4,486 | |
| Payable for distribution fees | | | 4,555 | | | 36,931 | |
| Accrued expenses and other liabilities | | | 19,400 | | | 23,888 | |
| Total Liabilities | | | 37,312 | | | 132,100 | |
| Net Assets | | $ | 19,022,589 | | $ | 37,239,121 | |
| NET ASSETS CONSIST OF: | | | | | | | |
| Paid in capital | | $ | 19,127,825 | | $ | 41,528,090 | |
| Accumulated deficit | | | (105,236 | ) | | (4,288,969 | ) |
| Total net assets | | $ | 19,022,589 | | $ | 37,239,121 | |
| CALCULATION OF NET ASSET VALUE PER SHARE - NO LOAD CLASS: | | | | | | | |
| Net Assets | | $ | 4,264,957 | | $ | 6,134,469 | |
| Shares outstanding | | | 43,763 | | | 586,662 | |
| Net asset value per share (offering price and redemption price) | | $ | 97.46 | | $ | 10.46 | |
| CALCULATION OF NET ASSET VALUE PER SHARE - ADVISOR CLASS A: | | | | | | | |
| Net Assets | | $ | 932,468 | | $ | 2,811,196 | |
| Shares outstanding | | | 9,689 | | | 270,152 | |
| Net asset value per share (redemption price) | | $ | 96.24 | | $ | 10.41 | |
| Offering price per share ($96.24 divided by .9425 and $10.41 divided by .9425) | | $ | 102.11 | | $ | 11.05 | |
| CALCULATION OF NET ASSET VALUE PER SHARE - ADVISOR CLASS C: | | | | | | | |
| Net Assets | | $ | 1,107,037 | | $ | 7,726,834 | |
| Shares outstanding | | | 11,948 | | | 750,665 | |
| Net asset value per share (offering price and redemption price) | | $ | 92.65 | | $ | 10.29 | |
| CALCULATION OF NET ASSET VALUE PER SHARE - INSTITUTIONAL CLASS: | | | | | | | |
| Net Assets | | $ | 12,718,127 | | $ | 20,566,622 | |
| Shares outstanding | | | 128,811 | | | 1,963,085 | |
| Net asset value per share (offering price and redemption price) | | $ | 98.73 | | $ | 10.48 | |
| * | Each Feeder Fund invests all or generally all its assets directly in the corresponding Master Portfolio. The financial statements for the Master Portfolios, along with the portfolio of investments in securities, are contained elsewhere in this report and should be read in conjunction with the Feeder Funds’ financial statements. |
The accompanying notes are an integral part of these financial statements.
| KINETICS MUTUAL FUNDS, INC. — THE FUND |
| Statements of Assets & Liabilities — (Continued) |
| December 31, 2018 |
| | | | The Kinetics | |
| | | | Spin-off and | |
| | | | Corporate | |
| | | | Restructuring | |
| | | | Fund | |
| ASSETS: | | | | |
| Investments, at value(1) | | $ | 18,711,257 | |
| Receivable from Adviser | | | 9,524 | |
| Receivable for investments sold | | | 5,670 | |
| Dividends and interest receivable | | | 7,006 | |
| Prepaid expenses and other assets | | | 28,724 | |
| Total Assets | | | 18,762,181 | |
| LIABILITIES: | | | | |
| Payable to Directors | | | 534 | |
| Payable to Chief Compliance Officer | | | 35 | |
| Payable to custodian | | | 1,542 | |
| Payable for Fund shares repurchased | | | 4 | |
| Payable for shareholder servicing fees | | | 2,099 | |
| Payable for distribution fees | | | 4,430 | |
| Accrued expenses and other liabilities | | | 35,074 | |
| Total Liabilities | | | 43,718 | |
| Net Assets | | $ | 18,718,463 | |
| (1) Cost of investments | | $ | 14,975,217 | |
| NET ASSETS CONSIST OF: | | | | |
| Paid in capital | | $ | 16,346,531 | |
| Accumulated earnings | | | 2,371,932 | |
| Net Assets | | $ | 18,718,463 | |
| CALCULATION OF NET ASSET VALUE PER SHARE - NO LOAD CLASS: | | | | |
| Net Assets | | $ | 11,442 | |
| Shares outstanding | | | 1,172 | |
| Net asset value per share (offering price and redemption price) | | $ | 9.77 | |
| CALCULATION OF NET ASSET VALUE PER SHARE - ADVISOR CLASS A: | | | | |
| Net Assets | | $ | 3,303,148 | |
| Shares outstanding | | | 354,209 | |
| Net asset value per share (redemption price) | | $ | 9.33 | |
| Offering price per share ($9.33 divided by .9425) | | $ | 9.90 | |
| CALCULATION OF NET ASSET VALUE PER SHARE - ADVISOR CLASS C: | | | | |
| Net Assets | | $ | 4,113,722 | |
| Shares outstanding | | | 467,277 | |
| Net asset value per share (offering price and redemption price) | | $ | 8.80 | |
| CALCULATION OF NET ASSET VALUE PER SHARE - INSTITUTIONAL CLASS: | | | | |
| Net Assets | | $ | 11,290,151 | |
| Shares outstanding | | | 1,205,712 | |
| Net asset value per share (offering price and redemption price) | | $ | 9.36 | |
The accompanying notes are an integral part of these financial statements.
| KINETICS MUTUAL FUNDS, INC. — THE FEEDER FUNDS |
| Statements of Operations |
| For the Year Ended December 31, 2018 |
| | | | The Internet | | | The Global | |
| | | | Fund | | | Fund | |
| INVESTMENT LOSS ALLOCATED FROM MASTER PORTFOLIOS: | | | | | | | |
| Dividends† | | $ | 273,417 | | $ | 42,449 | |
| Interest | | | 848,124 | | | 109,973 | |
| Income from securities lending | | | 837 | | | 606 | |
| Expenses allocated from Master Portfolio | | | (1,975,148 | ) | | (232,647 | ) |
| Net investment loss from Master Portfolio | | | (852,770 | ) | | (79,619 | ) |
| EXPENSES: | | | | | | | |
| Distribution fees — Advisor Class A | | | 8,761 | | | 3,213 | |
| Distribution fees — Advisor Class C | | | 13,449 | | | 40,058 | |
| Shareholder servicing fees — Advisor Class A | | | 8,761 | | | 3,213 | |
| Shareholder servicing fees — Advisor Class C | | | 4,483 | | | 13,353 | |
| Shareholder servicing fees — No Load Class | | | 343,786 | | | 18,591 | |
| Transfer agent fees and expenses | | | 107,817 | | | 18,054 | |
| Reports to shareholders | | | 31,965 | | | 4,373 | |
| Administration fees | | | 56,564 | | | 8,115 | |
| Professional fees | | | 25,907 | | | 9,796 | |
| Directors’ fees | | | 12,464 | | | 1,237 | |
| Chief Compliance Officer fees | | | 2,733 | | | 276 | |
| Registration fees | | | 45,695 | | | 44,446 | |
| Fund accounting fees | | | 7,505 | | | 750 | |
| Other expenses | | | 5,619 | | | 492 | |
| Total expenses | | | 675,509 | | | 165,967 | |
| Less, expense reimbursement | | | — | | | (159,873 | ) |
| Net expenses | | | 675,509 | | | 6,094 | |
| Net investment loss | | | (1,528,279 | ) | | (85,713 | ) |
| REALIZED AND UNREALIZED GAIN (LOSS) ON INVESTMENTS | | | | | | | |
| ALLOCATED FROM MASTER PORTFOLIOS: | | | | | | | |
| Net realized gain (loss) on: | | | | | | | |
| Investments and foreign currency | | | 32,297,461 | | | (275,998 | ) |
| Net change in unrealized depreciation of: | | | | | | | |
| Investments and foreign currency | | | (74,911,350 | ) | | (3,290,792 | ) |
| Net loss on investments | | | (42,613,889 | ) | | (3,566,790 | ) |
| Net decrease in net assets resulting from operations | | $ | (44,142,168 | ) | $ | (3,652,503 | ) |
| † Net of foreign taxes withheld of: | | $ | 2,182 | | $ | 4,375 | |
The accompanying notes are an integral part of these financial statements.
| KINETICS MUTUAL FUNDS, INC. — THE FEEDER FUNDS |
| Statements of Operations — (Continued) |
| For the Year Ended December 31, 2018 |
| | | | The Paradigm | | | The Medical | |
| | | | Fund | | | Fund | |
| INVESTMENT INCOME (LOSS) ALLOCATED FROM MASTER PORTFOLIOS: | | | | | | | |
| Dividends† | | $ | 3,773,954 | | $ | 428,913 | |
| Interest | | | 1,982,712 | | | 2,266 | |
| Income from securities lending | | | 13,268 | | | 2,066 | |
| Expenses allocated from Master Portfolio | | | (11,112,765 | ) | | (262,080 | ) |
| Net investment income (loss) from Master Portfolio | | | (5,342,831 | ) | | 171,165 | |
| EXPENSES: | | | | | | | |
| Distribution fees — Advisor Class A | | | 288,892 | | | 5,063 | |
| Distribution fees — Advisor Class C | | | 921,944 | | | 2,652 | |
| Shareholder servicing fees — Advisor Class A | | | 288,892 | | | 5,063 | |
| Shareholder servicing fees — Advisor Class C | | | 307,315 | | | 884 | |
| Shareholder servicing fees — No Load Class | | | 950,960 | | | 38,759 | |
| Shareholder servicing fees — Institutional Class | | | 395,910 | | | — | |
| Transfer agent fees and expenses | | | 194,065 | | | 21,350 | |
| Reports to shareholders | | | 103,974 | | | 4,880 | |
| Administration fees | | | 316,255 | | | 7,883 | |
| Professional fees | | | 101,686 | | | 10,044 | |
| Directors’ fees | | | 67,883 | | | 1,474 | |
| Chief Compliance Officer fees | | | 14,652 | | | 316 | |
| Registration fees | | | 66,668 | | | 45,130 | |
| Fund accounting fees | | | 42,387 | | | 900 | |
| Other expenses | | | 30,030 | | | 750 | |
| Total expenses | | | 4,091,513 | | | 145,148 | |
| Less, expense waiver for Institutional Class shareholder servicing fees | | | (296,932 | ) | | — | |
| Less, expense reimbursement | | | (696,542 | ) | | (150,946 | ) |
| Net expenses | | | 3,098,039 | | | (5,798 | ) |
| Net investment income (loss) | | | (8,440,870 | ) | | 176,963 | |
| REALIZED AND UNREALIZED GAIN (LOSS) ON INVESTMENTS ALLOCATED FROM MASTER PORTFOLIOS: | | | | | | | |
| Net realized gain on: | | | | | | | |
| Investments and foreign currency | | | 126,256,576 | | | 1,558,346 | |
| Net change in unrealized depreciation of: | | | | | | | |
| Investments and foreign currency | | | (161,220,219 | ) | | (1,464,481 | ) |
| Net gain (loss) on investments | | | (34,963,643 | ) | | 93,865 | |
| Net increase (decrease) in net assets resulting from operations | | $ | (43,404,513 | ) | $ | 270,828 | |
| † Net of foreign taxes withheld of: | | $ | 133,331 | | $ | 16,583 | |
The accompanying notes are an integral part of these financial statements.
| KINETICS MUTUAL FUNDS, INC. — THE FEEDER FUNDS |
| Statements of Operations — (Continued) |
| For the Year Ended December 31, 2018 |
| | | | The Small Cap | | | The Market | |
| | | | Opportunities | | | Opportunities | |
| | | | Fund | | | Fund | |
| INVESTMENT LOSS ALLOCATED FROM MASTER PORTFOLIOS: | | | | | | | |
| Dividends† | | $ | 1,483,357 | | $ | 301,423 | |
| Interest | | | 1,403,329 | | | 629,964 | |
| Income from securities lending | | | 952 | | | 1,055 | |
| Expenses allocated from Master Portfolio | | | (3,797,187 | ) | | (1,182,842 | ) |
| Net investment loss from Master Portfolio | | | (909,549 | ) | | (250,400 | ) |
| EXPENSES: | | | | | | | |
| Distribution fees — Advisor Class A | | | 31,170 | | | 19,488 | |
| Distribution fees — Advisor Class C | | | 67,863 | | | 70,104 | |
| Shareholder servicing fees — Advisor Class A | | | 31,170 | | | 19,488 | |
| Shareholder servicing fees — Advisor Class C | | | 22,621 | | | 23,368 | |
| Shareholder servicing fees — No Load Class | | | 524,777 | | | 138,615 | |
| Shareholder servicing fees — Institutional Class | | | 94,909 | | | 23,388 | |
| Transfer agent fees and expenses | | | 64,493 | | | 33,680 | |
| Reports to shareholders | | | 41,591 | | | 13,543 | |
| Administration fees | | | 108,108 | | | 35,333 | |
| Professional fees | | | 38,308 | | | 17,959 | |
| Directors’ fees | | | 23,100 | | | 7,269 | |
| Chief Compliance Officer fees | | | 4,897 | | | 1,582 | |
| Registration fees | | | 57,810 | | | 53,854 | |
| Fund accounting fees | | | 14,520 | | | 4,434 | |
| Other expenses | | | 8,794 | | | 2,781 | |
| Total expenses | | | 1,134,131 | | | 464,886 | |
| Less, expense waiver for Institutional Class shareholder servicing fees | | | (71,182 | ) | | (17,541 | ) |
| Less, expense reimbursement | | | (282,352 | ) | | (181,749 | ) |
| Net expenses | | | 780,597 | | | 265,596 | |
| Net investment loss | | | (1,690,146 | ) | | (515,996 | ) |
| REALIZED AND UNREALIZED GAIN (LOSS) ON INVESTMENTS ALLOCATED FROM MASTER PORTFOLIOS: | | | | | | | |
| Net realized gain on: | | | | | | | |
| Investments and foreign currency | | | 1,459,768 | | | 3,265,471 | |
| Net change in unrealized depreciation of: | | | | | | | |
| Investments and foreign currency | | | (7,770,718 | ) | | (12,163,458 | ) |
| Net loss on investments | | | (6,310,950 | ) | | (8,897,987 | ) |
| Net decrease in net assets resulting from operations | | $ | (8,001,096 | ) | $ | (9,413,983 | ) |
| † Net of foreign taxes withheld of: | | $ | 50,818 | | $ | 15,752 | |
The accompanying notes are an integral part of these financial statements.
| KINETICS MUTUAL FUNDS, INC. — THE FEEDER FUNDS |
| Statements of Operations — (Continued) |
| For the Year Ended December 31, 2018 |
| | | The Alternative | | | The Multi- Disciplinary | |
| | | | Income | | | Income | |
| | | | Fund | | | Fund | |
| INVESTMENT INCOME ALLOCATED FROM MASTER PORTFOLIOS: | | | | | | | |
| Dividends | | $ | 140,622 | | $ | 406,483 | |
| Interest | | | 254,945 | | | 1,987,174 | |
| Income from securities lending | | | — | | | 8,729 | |
| Expenses allocated from Master Portfolio | | | (229,583 | ) | | (615,352 | ) |
| Net investment income from Master Portfolio | | | 165,984 | | | 1,787,034 | |
| EXPENSES: | | | | | | | |
| Distribution fees - Advisor Class A | | | 2,514 | | | 9,116 | |
| Distribution fees - Advisor Class C | | | 9,641 | | | 57,769 | |
| Shareholder servicing fees - Advisor Class A | | | 2,514 | | | 9,116 | |
| Shareholder servicing fees - Advisor Class C | | | 3,214 | | | 19,256 | |
| Shareholder servicing fees - No Load Class | | | 12,035 | | | 17,001 | |
| Shareholder servicing fees - Institutional Class | | | 27,660 | | | 50,293 | |
| Transfer agent fees and expenses | | | 23,230 | | | 26,912 | |
| Reports to shareholders | | | 5,989 | | | 7,847 | |
| Administration fees | | | 11,032 | | | 19,710 | |
| Professional fees | | | 10,423 | | | 12,915 | |
| Directors’ fees | | | 1,684 | | | 3,269 | |
| Chief Compliance Officer fees | | | 357 | | | 734 | |
| Registration fees | | | 56,024 | | | 52,945 | |
| Fund accounting fees | | | 1,030 | | | 2,168 | |
| Other expenses | | | 943 | | | 2,379 | |
| Total expenses | | | 168,290 | | | 291,430 | |
| Less, expense waiver for Institutional Class shareholder servicing fees | | | (20,745 | ) | | (37,720 | ) |
| Less, expense reimbursement | | | (193,765 | ) | | (207,361 | ) |
| Net expenses | | | (46,220 | ) | | 46,349 | |
| Net investment income | | | 212,204 | | | 1,740,685 | |
| REALIZED AND UNREALIZED GAIN (LOSS) ON INVESTMENTS ALLOCATED FROM MASTER PORTFOLIOS: | | | | | | | |
| Net realized gain (loss) on: | | | | | | | |
| Investments and foreign currency | | | (844 | ) | | (106,042 | ) |
| Written option contracts expired or closed | | | 13,055 | | | — | |
| Net change in unrealized appreciation (depreciation) of: | | | | | | | |
| Investments and foreign currency | | | (71,433 | ) | | (2,045,258 | ) |
| Written option contracts | | | 18,960 | | | — | |
| Net loss on investments | | | (40,262 | ) | | (2,151,300 | ) |
| Net increase (decrease) in net assets resulting from operations | | $ | 171,942 | | $ | (410,615 | ) |
The accompanying notes are an integral part of these financial statements.
| KINETICS MUTUAL FUNDS, INC. — THE FUND |
| Statements of Operations — (Continued) |
| For the Year Ended December 31, 2018 |
| | | | The Kinetics | |
| | | | Spin-off and | |
| | | | Corporate | |
| | | | Restructuring | |
| | | | Fund | |
| INVESTMENT INCOME: | | | | |
| Dividends† | | $ | 152,439 | |
| Interest | | | 43,580 | |
| Total investment income | | | 196,019 | |
| EXPENSES: | | | | |
| Distribution fees — Advisor Class A | | | 10,450 | |
| Distribution fees — Advisor Class C | | | 40,315 | |
| Shareholder servicing fees — Advisor Class A | | | 10,450 | |
| Shareholder servicing fees — Advisor Class C | | | 13,438 | |
| Shareholder servicing fees — No Load Class | | | 30 | |
| Shareholder servicing fees — Institutional Class | | | 28,647 | |
| Investment advisory fees | | | 238,911 | |
| Professional fees | | | 38,542 | |
| Registration fees | | | 29,727 | |
| Transfer agent fees and expenses | | | 23,873 | |
| Administration fees | | | 17,600 | |
| Custodian fees and expenses | | | 9,544 | |
| Fund accounting fees | | | 7,355 | |
| Reports to shareholders | | | 2,859 | |
| Directors’ fees | | | 2,608 | |
| Other expenses | | | 591 | |
| Chief Compliance Officer fees | | | 415 | |
| Total expenses | | | 475,355 | |
| Less, expense waiver for Institutional Class shareholder servicing fees | | | (21,485 | ) |
| Less, expense reimbursement | | | (91,005 | ) |
| Net expenses | | | 362,865 | |
| Net investment loss | | | (166,846 | ) |
| REALIZED AND UNREALIZED GAIN (LOSS) ON INVESTMENTS AND FOREIGN CURRENCY: | | | | |
| Net realized loss on: | | | | |
| Investments and foreign currency | | | (117,499 | ) |
| Net change in unrealized appreciation (depreciation) of: | | | | |
| Investments and foreign currency | | | (1,246,793 | ) |
| Net loss on investments | | | (1,364,292 | ) |
| Net decrease in net assets resulting from operations | | $ | (1,531,138 | ) |
| † Net of foreign taxes withheld of: | | $ | 1,715 | |
The accompanying notes are an integral part of these financial statements.
| KINETICS MUTUAL FUNDS, INC. — THE FEEDER FUNDS |
| Statements of Changes in Net Assets |
| | | The Internet Fund | | The Global Fund |
| | | | For the
Year Ended
December 31,
2018 | | | For the
Year Ended
December 31,
2017 | | | For the
Year Ended
December 31,
2018 | | | For the
Year Ended
December 31,
2017 | |
| OPERATIONS: | | | | | | | | | | | | | |
| Net investment income (loss) | | $ | (1,528,279 | ) | $ | 982,169 | | $ | (85,713 | ) | $ | 140,344 | |
| Net realized gain (loss) on sale of investments and foreign currency | | | 32,297,461 | | | 26,950,019 | | | (275,998 | ) | | 1,161,004 | |
| Reimbursement by Affiliate | | | — | | | 422 | | | — | | | — | |
| Net change in unrealized appreciation (depreciation) of investments and foreign currency | | | (74,911,350 | ) | | 32,196,353 | | | (3,290,792 | ) | | 3,026,419 | |
| Net increase (decrease) in net assets resulting from operations | | | (44,142,168 | ) | | 60,128,963 | | | (3,652,503 | ) | | 4,327,767 | |
| DISTRIBUTIONS TO SHAREHOLDERS: | | | | | | | | | | | | | |
| No Load Class (See Note 5) | | | (29,829,211 | ) | | (25,520,599 | )(1) | | (4,521 | ) | | (712,458 | )(2) |
| Advisor Class A (See Note 5) | | | (761,641 | ) | | (701,439 | )(1) | | (802 | ) | | (128,002 | )(2) |
| Advisor Class C (See Note 5) | | | (385,282 | ) | | (327,682 | )(1) | | (3,643 | ) | | (467,204 | )(2) |
| Total distributions to shareholders | | | (30,976,134 | ) | | (26,549,720 | ) | | (8,966 | ) | | (1,307,664 | ) |
| CAPITAL SHARE TRANSACTIONS — NO LOAD CLASS: | | | | | | | | | | | | | |
| Proceeds from shares sold | | | 15,506,662 | | | 13,869,121 | | | 1,114,685 | | | 4,438,066 | |
| Redemption fees | | | 71,771 | | | 9,591 | | | 5,543 | | | 640 | |
| Proceeds from shares issued to holders in reinvestment of dividends | | | 29,208,393 | | | 25,016,016 | | | 4,459 | | | 703,941 | |
| Cost of shares redeemed | | | (32,343,565 | ) | | (19,722,027 | ) | | (2,135,351 | ) | | (3,673,657 | ) |
| Net increase (decrease) in net assets resulting from capital share transactions | | | 12,443,261 | | | 19,172,701 | | | (1,010,664 | ) | | 1,468,990 | |
| CAPITAL SHARE TRANSACTIONS — ADVISOR CLASS A: | | | | | | | | | | | | | |
| Proceeds from shares sold | | | 1,208,292 | | | 1,993,592 | | | 160,717 | | | 1,394,573 | |
| Redemption fees | | | 2,647 | | | 663 | | | 75 | | | 6,708 | |
| Proceeds from shares issued to holders in reinvestment of dividends | | | 701,010 | | | 620,514 | | | 733 | | | 109,578 | |
| Cost of shares redeemed | | | (1,754,869 | ) | | (776,608 | ) | | (336,656 | ) | | (495,581 | ) |
| Net increase (decrease) in net assets resulting from capital share transactions | | | 157,080 | | | 1,838,161 | | | (175,131 | ) | | 1,015,278 | |
The accompanying notes are an integral part of these financial statements.
| KINETICS MUTUAL FUNDS, INC. — THE FEEDER FUNDS |
| Statements of Changes in Net Assets — (Continued) |
| | | The Internet Fund | | The Global Fund |
| | | | For the
Year Ended
December 31,
2018 | | | For the
Year Ended
December 31,
2017 | | | For the
Year Ended
December 31,
2018 | | | For the
Year Ended
December 31,
2017 | |
| | | | | | | | | | | | | | |
| CAPITAL SHARE TRANSACTIONS — ADVISOR CLASS C: | | | | | | | | | | | | | |
| Proceeds from shares sold | | $ | 617,031 | | $ | 832,414 | | $ | 542,381 | | $ | 2,370,433 | |
| Redemption fees | | | 673 | | | 916 | | | — | | | — | |
| Proceeds from shares issued to holders in reinvestment of dividends | | | 378,088 | | | 317,411 | | | 3,544 | | | 450,731 | |
| Cost of shares redeemed | | | (816,194 | ) | | (145,331 | ) | | (380,036 | ) | | (228,255 | ) |
| Net increase in net assets resulting from capital share transactions | | | 179,598 | | | 1,005,410 | | | 165,889 | | | 2,592,909 | |
| TOTAL INCREASE (DECREASE) IN NET ASSETS: | | | (62,338,363 | ) | | 55,595,515 | | | (4,681,375 | ) | | 8,097,280 | |
| NET ASSETS: | | | | | | | | | | | | | |
| Beginning of year | | | 168,152,049 | | | 112,556,534 | | | 15,642,727 | | | 7,545,447 | |
| End of year | | $ | 105,813,686 | | $ | 168,152,049 | (1) | $ | 10,961,352 | | $ | 15,642,727 | (2) |
| CHANGES IN SHARES OUTSTANDING — NO LOAD CLASS: | | | | | | | | | | | | | |
| Shares sold | | | 312,559 | | | 239,537 | | | 160,540 | | | 670,595 | |
| Shares issued in reinvestments of dividends and distributions | | | 1,071,144 | | | 484,056 | | | 815 | | | 99,427 | |
| Shares redeemed | | | (730,044 | ) | | (411,798 | ) | | (323,558 | ) | | (586,998 | ) |
| Net increase (decrease) in shares outstanding | | | 653,659 | | | 311,795 | | | (162,203 | ) | | 183,024 | |
| CHANGES IN SHARES OUTSTANDING — ADVISOR CLASS A: | | | | | | | | | | | | | |
| Shares sold | | | 26,425 | | | 38,254 | | | 23,309 | | | 218,380 | |
| Shares issued in reinvestments of dividends and distributions | | | 27,962 | | | 12,715 | | | 134 | | | 15,477 | |
| Shares redeemed | | | (40,084 | ) | | (17,221 | ) | | (50,489 | ) | | (80,469 | ) |
| Net increase (decrease) in shares outstanding | | | 14,303 | | | 33,748 | | | (27,046 | ) | | 153,388 | |
| CHANGES IN SHARES OUTSTANDING — ADVISOR CLASS C: | | | | | | | | | | | | | |
| Shares sold | | | 14,737 | | | 17,566 | | | 84,067 | | | 407,943 | |
| Shares issued in reinvestments of dividends and distributions | | | 17,801 | | | 7,244 | | | 691 | | | 67,374 | |
| Shares redeemed | | | (24,012 | ) | | (3,436 | ) | | (68,137 | ) | | (40,660 | ) |
| Net increase in shares outstanding | | | 8,526 | | | 21,374 | | | 16,621 | | | 434,657 | |
| (1) | For the year ended December 31, 2017, net realized gain distributions for The Internet Fund were $25,520,599 for the No Load Class, $701,439 for the Advisor Class A and $327,682 for the Advisor Class C and accumulated net investment income was $698,156. |
| (2) | For the year ended December 31, 2017, net investment income distributions for The Global Fund were $105,961 for the No Load Class, $18,535 for the Advisor Class A and $52,170 for the Advisor Class C and net realized gain distributions were $606,497 for the No Load Class, $109,467 for the Advisor Class A and $415,034 for the Advisor Class C and accumulated net investment loss was $47,172. |
The accompanying notes are an integral part of these financial statements.
| KINETICS MUTUAL FUNDS, INC. — THE FEEDER FUNDS |
| Statements of Changes in Net Assets — (Continued) |
| | | The Paradigm Fund | | The Medical Fund | |
| | | | For the
Year Ended
December 31,
2018 | | | For the
Year Ended
December 31,
2017 | | | For the
Year Ended
December 31,
2018 | | | For the
Year Ended
December 31,
2017 | |
| OPERATIONS: | | | | | | | | | | | | | |
| Net investment income (loss) | | $ | (8,440,870 | ) | $ | (6,776,233 | ) | $ | 176,963 | | $ | 164,870 | |
| Net realized gain on sale of investments and foreign currency | | | 126,256,576 | | | 116,233,814 | | | 1,558,346 | | | 2,350,183 | |
| Net change in unrealized appreciation (depreciation) of investments and foreign currency | | | (161,220,219 | ) | | 70,690,428 | | | (1,464,481 | ) | | (424,529 | ) |
| Net increase (decrease) in net assets resulting from operations | | | (43,404,513 | ) | | 180,148,009 | | | 270,828 | | | 2,090,524 | |
| DISTRIBUTIONS TO SHAREHOLDERS: | | | | | | | | | | | | | |
| No Load Class (See Note 5) | | | (28,537,272 | ) | | — | | | (1,297,367 | ) | | (2,278,093 | )(2) |
| Advisor Class A (See Note 5) | | | (9,460,887 | ) | | — | | | (114,972 | ) | | (435,315 | )(2) |
| Advisor Class C (See Note 5) | | | (10,598,549 | ) | | — | | | (28,691 | ) | | (54,651 | )(2) |
| Institutional Class (See Note 5) | | | (14,412,154 | ) | | — | | | N/A | | | N/A | |
| Total distributions to shareholders | | | (63,008,862 | ) | | — | | | (1,441,030 | ) | | (2,768,059 | ) |
| CAPITAL SHARE TRANSACTIONS — NO LOAD CLASS: | | | | | | | | | | | | | |
| Proceeds from shares sold | | | 82,815,246 | | | 44,431,611 | | | 275,511 | | | 369,030 | |
| Redemption fees | | | 36,638 | | | 9,270 | | | 600 | | | 438 | |
| Proceeds from shares issued to holders in reinvestment of dividends | | | 27,524,795 | | | — | | | 1,275,339 | | | 2,244,865 | |
| Cost of shares redeemed | | | (101,236,433 | ) | | (119,870,442 | ) | | (1,751,133 | ) | | (3,553,923 | ) |
| Net increase (decrease) in net assets resulting from capital share transactions | | | 9,140,246 | | | (75,429,561 | ) | | (199,683 | ) | | (939,590 | ) |
The accompanying notes are an integral part of these financial statements.
| KINETICS MUTUAL FUNDS, INC. — THE FEEDER FUNDS |
| Statements of Changes in Net Assets — (Continued) |
| | | The Paradigm Fund | | | The Medical Fund | |
| | | | For the
Year Ended
December 31,
2018 | | | For the
Year Ended
December 31,
2017 | | | For the
Year Ended
December 31,
2018 | | | For the
Year Ended
December 31,
2017 | |
| | | | | | | | | | | | | | |
| CAPITAL SHARE TRANSACTIONS — ADVISOR CLASS A: | | | | | | | | | | | | | |
| Proceeds from shares sold | | $ | 21,835,533 | | $ | 8,957,538 | | $ | 43,479 | | $ | 248,099 | |
| Redemption fees | | | 435 | | | 734 | | | — | | | 6 | |
| Proceeds from shares issued to holders in reinvestment of dividends | | | 8,391,508 | | | — | | | 106,203 | | | 409,945 | |
| Cost of shares redeemed | | | (26,515,410 | ) | | (30,363,497 | ) | | (1,718,121 | ) | | (1,258,535 | ) |
| Net increase (decrease) in net assets resulting from capital share transactions | | | 3,712,066 | | | (21,405,225 | ) | | (1,568,439 | ) | | (600,485 | ) |
| CAPITAL SHARE TRANSACTIONS — ADVISOR CLASS C: | | | | | | | | | | | | | |
| Proceeds from shares sold | | | 4,108,371 | | | 2,792,488 | | | 6,203 | | | 52,217 | |
| Redemption fees | | | 233 | | | 2,133 | | | — | | | — | |
| Proceeds from shares issued to holders in reinvestment of dividends | | | 9,940,055 | | | — | | | 17,314 | | | 34,720 | |
| Cost of shares redeemed | | | (15,531,853 | ) | | (23,266,717 | ) | | (60,909 | ) | | (109,191 | ) |
| Net decrease in net assets resulting from capital share transactions | | | (1,483,194 | ) | | (20,472,096 | ) | | (37,392 | ) | | (22,254 | ) |
| CAPITAL SHARE TRANSACTIONS — INSTITUTIONAL CLASS: | | | | | | | | | | | | | |
| Proceeds from shares sold | | | 55,326,340 | | | 49,616,717 | | | N/A | | | N/A | |
| Redemption fees | | | 667 | | | 2,714 | | | N/A | | | N/A | |
| Proceeds from shares issued to holders in reinvestment of dividends | | | 12,639,473 | | | — | | | N/A | | | N/A | |
| Cost of shares redeemed | | | (104,577,445 | ) | | (161,237,337 | ) | | N/A | | | N/A | |
| Net decrease in net assets resulting from capital share transactions | | | (36,610,965 | ) | | (111,617,906 | ) | | N/A | | | N/A | |
| TOTAL DECREASE IN NET ASSETS: | | | (131,655,222 | ) | | (48,776,779 | ) | | (2,975,716 | ) | | (2,239,864 | ) |
| NET ASSETS: | | | | | | | | | | | | | |
| Beginning of year | | | 774,833,889 | | | 823,610,668 | | | 19,429,215 | | | 21,669,079 | |
| End of year | | $ | 643,178,667 | | $ | 774,833,889 | (1) | $ | 16,453,499 | | $ | 19,429,215 | (2) |
| CHANGES IN SHARES OUTSTANDING — NO LOAD CLASS: | | | | | | | | | | | | | |
| Shares sold | | | 1,519,083 | | | 1,066,897 | | | 10,660 | | | 13,162 | |
| Shares issued in reinvestments of dividends and distributions | | | 666,945 | | | — | | | 55,235 | | | 88,242 | |
| Shares redeemed | | | (1,993,617 | ) | | (2,999,016 | ) | | (68,554 | ) | | (126,969 | ) |
| Net increase (decrease) in shares outstanding | | | 192,411 | | | (1,932,119 | ) | | (2,659 | ) | | (25,565 | ) |
| (1) | For the year ended December 31, 2017, The Paradigm Fund accumulated net investment loss was $4,569,146. |
| (2) | For the year ended December 31, 2017, net investment income distributions for The Medical Fund were $141,468 for the No Load Class, $19,097 for the Advisor Class A and $0 for the Advisor Class C and net realized gain distributions were $2,136,625 for the No Load Class, $416,218 for the Advisor Class A and $54,651 for the Advisor Class C and accumulated net investment income was $22,369. |
The accompanying notes are an integral part of these financial statements.
| KINETICS MUTUAL FUNDS, INC. — THE FEEDER FUNDS |
| Statements of Changes in Net Assets — (Continued) |
| | | | The Paradigm Fund | | | The Medical Fund | |
| | | | For the
Year Ended
December 31,
2018 | | | For the
Year Ended
December 31,
2017 | | | For the
Year Ended
December 31,
2018 | | | For the
Year Ended
December 31,
2017 | |
| | | | | | | | | | | | | | |
| CHANGES IN SHARES OUTSTANDING — ADVISOR CLASS A: | | | | | | | | | | | | | |
| Shares sold | | | 412,429 | | | 222,108 | | | 1,803 | | | 8,935 | |
| Shares issued in reinvestments of dividends and distributions | | | 210,314 | | | — | | | 4,797 | | | 16,780 | |
| Shares redeemed | | | (530,967 | ) | | (755,960 | ) | | (70,696 | ) | | (46,381 | ) |
| Net increase (decrease) in shares outstanding | | | 91,776 | | | (533,852 | ) | | (64,096 | ) | | (20,666 | ) |
| CHANGES IN SHARES OUTSTANDING — ADVISOR CLASS C: | | | | | | | | | | | | | |
| Shares sold | | | 83,476 | | | 75,564 | | | 261 | | | 2,016 | |
| Shares issued in reinvestments of dividends and distributions | | | 268,071 | | | — | | | 811 | | | 1,467 | |
| Shares redeemed | | | (328,265 | ) | | (613,780 | ) | | (2,576 | ) | | (4,125 | ) |
| Net increase (decrease) in shares outstanding | | | 23,282 | | | (538,216 | ) | | (1,504 | ) | | (642 | ) |
| CHANGES IN SHARES OUTSTANDING — INSTITUTIONAL CLASS: | | | | | | | | | | | | | |
| Shares sold | | | 1,056,356 | | | 1,214,145 | | | N/A | | | N/A | |
| Shares issued in reinvestments of dividends and distributions | | | 303,541 | | | — | | | N/A | | | N/A | |
| Shares redeemed | | | (2,078,833 | ) | | (4,090,122 | ) | | N/A | | | N/A | |
| Net decrease in shares outstanding | | | (718,936 | ) | | (2,875,977 | ) | | N/A | | | N/A | |
The accompanying notes are an integral part of these financial statements.
| KINETICS MUTUAL FUNDS, INC. — THE FEEDER FUNDS |
| Statements of Changes in Net Assets — (Continued) |
| | | | The Small Cap
Opportunities Fund | | | The Market
Opportunities Fund | |
| | | | For the
Year Ended
December 31,
2018 | | | For the
Year Ended
December 31,
2017 | | | For the
Year Ended
December 31,
2018 | | | For the
Year Ended
December 31,
2017 | |
| OPERATIONS: | | | | | | | | | | | | | |
| Net investment income (loss) | | $ | (1,690,146 | ) | $ | (1,367,022 | ) | $ | (515,996 | ) | $ | 363,427 | |
| Net realized gain on sale of investments and foreign currency | | | 1,459,768 | | | 15,142,437 | | | 3,265,471 | | | 7,024,052 | |
| Net change in unrealized appreciation (depreciation) of investments and foreign currency | | | (7,770,718 | ) | | 25,743,329 | | | (12,163,458 | ) | | 13,982,989 | |
| Net increase (decrease) in net assets resulting from operations | | | (8,001,096 | ) | | 39,518,744 | | | (9,413,983 | ) | | 21,370,468 | |
| DISTRIBUTIONS TO SHAREHOLDERS: | | | | | | | | | | | | | |
| No Load Class (See Note 5) | | | — | | | — | | | (4,071,130 | ) | | (323,879 | )(2) |
| Advisor Class A (See Note 5) | | | — | | | — | | | (550,627 | ) | | (38,468 | )(2) |
| Advisor Class C (See Note 5) | | | — | | | — | | | (756,822 | ) | | (17,693 | )(2) |
| Institutional Class (See Note 5) | | | — | | | — | | | (797,447 | ) | | (80,207 | )(2) |
| Total distributions to shareholders | | | — | | | — | | | (6,176,026 | ) | | (460,247 | ) |
| CAPITAL SHARE TRANSACTIONS — NO LOAD CLASS: | | | | | | | | | | | | | |
| Proceeds from shares sold | | | 143,962,162 | | | 5,823,148 | | | 11,158,690 | | | 5,965,626 | |
| Redemption fees | | | 105,311 | | | 1,091 | | | 22,294 | | | 1,131 | |
| Proceeds from shares issued to holders in reinvestment of dividends | | | — | | | — | | | 4,049,701 | | | 321,648 | |
| Cost of shares redeemed | | | (107,174,264 | ) | | (33,621,459 | ) | | (7,907,108 | ) | | (2,056,025 | ) |
| Net increase (decrease) in net assets resulting from capital share transactions | | | 36,893,209 | | | (27,797,220 | ) | | 7,323,577 | | | 4,232,380 | |
The accompanying notes are an integral part of these financial statements.
| KINETICS MUTUAL FUNDS, INC. — THE FEEDER FUNDS |
| Statements of Changes in Net Assets — (Continued) |
| | | | The Small Cap
Opportunities Fund | | | The Market
Opportunities Fund | |
| | | | For the
Year Ended
December 31,
2018 | | | For the
Year Ended
December 31,
2017 | | | For the
Year Ended
December 31,
2018 | | | For the
Year Ended
December 31,
2017 | |
| CAPITAL SHARE TRANSACTIONS — ADVISOR CLASS A: | | | | | | | | | | | | | |
| Proceeds from shares sold | | $ | 10,894,936 | | $ | 890,057 | | $ | 2,608,472 | | $ | 3,106,373 | |
| Redemption fees | | | 42 | | | 68 | | | 1,069 | | | 17 | |
| Proceeds from shares issued to holders in reinvestment of dividends | | | — | | | — | | | 488,996 | | | 34,324 | |
| Cost of shares redeemed | | | (11,614,360 | ) | | (5,565,578 | ) | | (2,750,126 | ) | | (2,088,142 | ) |
| Net increase (decrease) in net assets resulting from capital share transactions | | | (719,382 | ) | | (4,675,453 | ) | | 348,411 | | | 1,052,572 | |
| CAPITAL SHARE TRANSACTIONS — ADVISOR CLASS C: | | | | | | | | | | | | | |
| Proceeds from shares sold | | | 2,267,642 | | | 236,039 | | | 2,488,206 | | | 2,156,163 | |
| Redemption fees | | | 61 | | | — | | | — | | | — | |
| Proceeds from shares issued to holders in reinvestment of dividends | | | — | | | — | | | 710,825 | | | 16,105 | |
| Cost of shares redeemed | | | (1,950,729 | ) | | (2,296,457 | ) | | (898,991 | ) | | (576,992 | ) |
| Net increase (decrease) in net assets resulting from capital share transactions | | | 316,974 | | | (2,060,418 | ) | | 2,300,040 | | | 1,595,276 | |
| CAPITAL SHARE TRANSACTIONS — INSTITUTIONAL CLASS: | | | | | | | | | | | | | |
| Proceeds from shares sold | | | 59,836,127 | | | 11,570,347 | | | 4,583,098 | | | 7,213,450 | |
| Redemption fees | | | 194 | | | 206 | | | 3,077 | | | 3,507 | |
| Proceeds from shares issued to holders in reinvestment of dividends | | | — | | | — | | | 772,205 | | | 78,499 | |
| Cost of shares redeemed | | | (46,387,833 | ) | | (40,291,007 | ) | | (4,061,116 | ) | | (1,432,381 | ) |
| Net increase (decrease) in net assets resulting from capital share transactions | | | 13,448,488 | | | (28,720,454 | ) | | 1,297,264 | | | 5,863,075 | |
| TOTAL INCREASE (DECREASE) IN NET ASSETS: | | | 41,938,193 | | | (23,734,801 | ) | | (4,320,717 | ) | | 33,653,524 | |
| NET ASSETS: | | | | | | | | | | | | | |
| Beginning of year | | | 181,344,696 | | | 205,079,497 | | | 77,221,979 | | | 43,568,455 | |
| End of year | | $ | 223,282,889 | | $ | 181,344,696 | (1) | $ | 72,901,262 | | $ | 77,221,979 | (2) |
| (1) | For the year ended December 31, 2017 , The Small Cap Opportunities Fund accumulated net investment loss was $8,214,302. |
| (2) | For the year ended December 31, 2017, net investment income distributions for The Market Opportunities Fund were $323,879 for the No Load Class, $38,468 for the Advisor Class A, $17,693 for the Advisor Class C and $80,207 for the Institutional Class and accumulated net investment loss was $941,895. |
The accompanying notes are an integral part of these financial statements.
| KINETICS MUTUAL FUNDS, INC. — THE FEEDER FUNDS |
| Statements of Changes in Net Assets — (Continued) |
| | | | The Small Cap
Opportunities Fund | | | The Market
Opportunities Fund | |
| | | | For the
Year Ended
December 31,
2018 | | | For the
Year Ended
December 31,
2017 | | | For the
Year Ended
December 31,
2018 | | | For the
Year Ended
December 31,
2017 | |
| CHANGES IN SHARES OUTSTANDING — NO LOAD CLASS: | | | | | | | | | | | | | |
| Shares sold | | | 2,475,834 | | | 133,314 | | | 409,732 | | | 240,026 | |
| Shares issued in reinvestments of dividends and distributions | | | — | | | — | | | 184,918 | | | 12,142 | |
| Shares redeemed | | | (1,892,831 | ) | | (781,891 | ) | | (293,818 | ) | | (94,372 | ) |
| Net increase (decrease) in shares outstanding | | | 583,003 | | | (648,577 | ) | | 300,832 | | | 157,796 | |
| CHANGES IN SHARES OUTSTANDING — ADVISOR CLASS A: | | | | | | | | | | | | | |
| Shares sold | | | 181,646 | | | 20,307 | | | 96,994 | | | 134,566 | |
| Shares issued in reinvestments of dividends and distributions | | | — | | | — | | | 22,681 | | | 1,310 | |
| Shares redeemed | | | (206,344 | ) | | (130,908 | ) | | (106,854 | ) | | (100,805 | ) |
| Net increase (decrease) in shares outstanding | | | (24,698 | ) | | (110,601 | ) | | 12,821 | | | 35,071 | |
| CHANGES IN SHARES OUTSTANDING — ADVISOR CLASS C: | | | | | | | | | | | | | |
| Shares sold | | | 42,783 | | | 5,891 | | | 95,868 | | | 93,535 | |
| Shares issued in reinvestments of dividends and distributions | | | — | | | — | | | 34,389 | | | 636 | |
| Shares redeemed | | | (36,924 | ) | | (56,617 | ) | | (35,654 | ) | | (28,312 | ) |
| Net increase (decrease) in shares outstanding | | | 5,859 | | | (50,726 | ) | | 94,603 | | | 65,859 | |
| CHANGES IN SHARES OUTSTANDING — INSTITUTIONAL CLASS: | | | | | | | | | | | | | |
| Shares sold | | | 1,013,611 | | | 263,166 | | | 164,990 | | | 311,032 | |
| Shares issued in reinvestments of dividends and distributions | | | — | | | — | | | 34,737 | | | 2,927 | |
| Shares redeemed | | | (775,830 | ) | | (962,015 | ) | | (150,570 | ) | | (67,182 | ) |
| Net increase (decrease) in shares outstanding | | | 237,781 | | | (698,849 | ) | | 49,157 | | | 246,777 | |
The accompanying notes are an integral part of these financial statements.
| KINETICS MUTUAL FUNDS, INC. — THE FEEDER FUNDS |
| Statements of Changes in Net Assets — (Continued) |
| | | | The Alternative
Income Fund | | | The Multi-
Disciplinary Income Fund | |
| | | | For the
Year Ended
December 31,
2018 | | | For the
Year Ended
December 31,
2017 | | | For the
Year Ended
December 31,
2018 | | | For the
Year Ended
December 31,
2017 | |
| OPERATIONS: | | | | | | | | | | | | | |
| Net investment income | | $ | 212,204 | | $ | 37,594 | | $ | 1,740,685 | | $ | 2,190,155 | |
| Net realized gain (loss) on sale of investments, foreign currency and written options and distributions received from other investment companies | | | 12,211 | | | 829,417 | | | (106,042 | ) | | 508,100 | |
| Net change in unrealized appreciation (depreciation) of investments, foreign currency and written options | | | (52,473 | ) | | (227,788 | ) | | (2,045,258 | ) | | 315,183 | |
| Net increase (decrease) in net assets resulting from operations | | | 171,942 | | | 639,223 | | | (410,615 | ) | | 3,013,438 | |
| DISTRIBUTIONS TO SHAREHOLDERS: | | | | | | | | | | | | | |
| No Load Class (See Note 5) | | | (43,839 | ) | | — | | | (279,550 | ) | | (293,689 | )(2) |
| Advisor Class A (See Note 5) | | | (7,366 | ) | | — | | | (135,583 | ) | | (213,170 | )(2) |
| Advisor Class C (See Note 5) | | | (2,517 | ) | | — | | | (274,465 | ) | | (262,131 | )(2) |
| Institutional Class (See Note 5) | | | (157,514 | ) | | (31,226 | )(1) | | (1,052,523 | ) | | (1,366,421 | )(2) |
| Total distributions to shareholders | | | (211,236 | ) | | (31,226 | ) | | (1,742,121 | ) | | (2,135,411 | ) |
| CAPITAL SHARE TRANSACTIONS — NO LOAD CLASS: | | | | | | | | | | | | | |
| Proceeds from shares sold | | | 1,775,799 | | | 2,783,461 | | | 1,580,972 | | | 3,890,740 | |
| Redemption fees | | | 693 | | | 819 | | | — | | | 455 | |
| Proceeds from shares issued to holders in reinvestment of dividends | | | 38,990 | | | — | | | 269,844 | | | 277,189 | |
| Cost of shares redeemed | | | (2,508,132 | ) | | (3,604,721 | ) | | (2,346,967 | ) | | (4,053,501 | ) |
| Net increase (decrease) in net assets resulting from capital share transactions | | | (692,650 | ) | | (820,441 | ) | | (496,151 | ) | | 114,883 | |
The accompanying notes are an integral part of these financial statements.
| KINETICS MUTUAL FUNDS, INC. — THE FEEDER FUNDS |
| Statements of Changes in Net Assets — (Continued) |
| | | | The Alternative
Income Fund | | | The Multi-
Disciplinary Income Fund | |
| | | | For the
Year Ended
December 31,
2018 | | | For the
Year Ended
December 31,
2017 | | | For the
Year Ended
December 31,
2018 | | | For the
Year Ended
December 31,
2017 | |
| | | | | | | | | | | | | | |
| CAPITAL SHARE TRANSACTIONS — ADVISOR CLASS A: | | | | | | | | | | | | | |
| Proceeds from shares sold | | | 200,164 | | | 1,651,244 | | | 740,005 | | | 2,068,915 | |
| Redemption fees | | | — | | | 78 | | | — | | | 120 | |
| Proceeds from shares issued to holders in reinvestment of dividends | | | 7,098 | | | — | | | 120,015 | | | 177,261 | |
| Cost of shares redeemed | | | (769,557 | ) | | (2,663,363 | ) | | (2,516,680 | ) | | (4,603,923 | ) |
| Net decrease in net assets resulting from capital share transactions | | | (562,295 | ) | | (1,012,041 | ) | | (1,656,660 | ) | | (2,357,627 | ) |
| CAPITAL SHARE TRANSACTIONS — ADVISOR CLASS C: | | | | | | | | | | | | | |
| Proceeds from shares sold | | | 100,725 | | | 176,934 | | | 2,550,446 | | | 3,044,872 | |
| Proceeds from shares issued to holders in reinvestment of dividends | | | 2,361 | | | — | | | 240,821 | | | 243,911 | |
| Cost of shares redeemed | | | (506,070 | ) | | (327,819 | ) | | (1,640,422 | ) | | (4,144,246 | ) |
| Net increase (decrease) in net assets resulting from capital share transactions | | | (402,984 | ) | | (150,885 | ) | | 1,150,845 | | | (855,463 | ) |
| CAPITAL SHARE TRANSACTIONS — INSTITUTIONAL CLASS: | | | | | | | | | | | | | |
| Proceeds from shares sold | | | 2,595,166 | | | 4,510,618 | | | 4,284,382 | | | 11,448,169 | |
| Redemption fees | | | 21 | | | 497 | | | — | | | — | |
| Proceeds from shares issued to holders in reinvestment of dividends | | | 157,456 | | | 31,187 | | | 1,044,349 | | | 1,361,419 | |
| Cost of shares redeemed | | | (5,023,911 | ) | | (8,102,698 | ) | | (13,935,784 | ) | | (61,206,726 | ) |
| Net decrease in net assets resulting from capital share transactions | | | (2,271,268 | ) | | (3,560,396 | ) | | (8,607,053 | ) | | (48,397,138 | ) |
| TOTAL DECREASE IN NET ASSETS: | | | (3,968,491 | ) | | (4,935,766 | ) | | (11,761,755 | ) | | (50,617,318 | ) |
| NET ASSETS: | | | | | | | | | | | | | |
| Beginning of year | | | 22,991,080 | | | 27,926,846 | | | 49,000,876 | | | 99,618,194 | |
| End of year | | $ | 19,022,589 | | $ | 22,991,080 | (1) | $ | 37,239,121 | | $ | 49,000,876 | (2) |
| (1) | For the year ended December 31, 2017 , net investment income distributions for the The Alternative Income Fund were $0 for the No Load Class, $0 for the Advisor Class A, $0 for the Advisor Class C and $31,226 for the Institutional Class and accumulated net investment income was $19,869. |
| (2) | For the year ended December 31, 2017, net investment income distributions for The Multi-Disciplinary Income Fund were $293,689 for the No Load Class, $213,170 for the Advisor Class A, $262,131 for the Advisor Class C and $1,366,421 for the Institutional Class and accumulated net investment income was $47,460. |
The accompanying notes are an integral part of these financial statements.
| KINETICS MUTUAL FUNDS, INC. — THE FEEDER FUNDS |
| Statements of Changes in Net Assets — (Continued) |
| | | | The Alternative
Income Fund | | | The Multi-
Disciplinary Income Fund | |
| | | | For the
Year Ended
December 31,
2018 | | | For the
Year Ended
December 31,
2017 | | | For the
Year Ended
December 31,
2018 | | | For the
Year Ended
December 31,
2017 | |
| CHANGES IN SHARES OUTSTANDING — NO LOAD CLASS: | | | | | | | | | | | | | |
| Shares sold | | | 18,217 | | | 28,909 | | | 144,240 | | | 351,176 | |
| Shares issued in reinvestments of dividends and distributions | | | 401 | | | — | | | 25,153 | | | 25,155 | |
| Shares redeemed | | | (25,771 | ) | | (37,382 | ) | | (215,707 | ) | | (365,175 | ) |
| Net increase (decrease) in shares outstanding | | | (7,153 | ) | | (8,473 | ) | | (46,314 | ) | | 11,156 | |
| CHANGES IN SHARES OUTSTANDING — ADVISOR CLASS A: | | | | | | | | | | | | | |
| Shares sold | | | 2,079 | | | 17,311 | | | 67,860 | | | 187,839 | |
| Shares issued in reinvestments of dividends and distributions | | | 74 | | | — | | | 11,231 | | | 16,178 | |
| Shares redeemed | | | (8,043 | ) | | (27,761 | ) | | (232,124 | ) | | (417,326 | ) |
| Net decrease in shares outstanding | | | (5,890 | ) | | (10,450 | ) | | (153,033 | ) | | (213,309 | ) |
| CHANGES IN SHARES OUTSTANDING — ADVISOR CLASS C: | | | | | | | | | | | | | |
| Shares sold | | | 1,088 | | | 1,923 | | | 237,920 | | | 278,685 | |
| Shares issued in reinvestments of dividends and distributions | | | 25 | | | — | | | 22,803 | | | 22,473 | |
| Shares redeemed | | | (5,485 | ) | | (3,559 | ) | | (153,690 | ) | | (379,376 | ) |
| Net increase (decrease) in shares outstanding | | | (4,372 | ) | | (1,636 | ) | | 107,033 | | | (78,218 | ) |
| CHANGES IN SHARES OUTSTANDING — INSTITUTIONAL CLASS: | | | | | | | | | | | | | |
| Shares sold | | | 26,221 | | | 46,069 | | | 391,889 | | | 1,031,652 | |
| Shares issued in reinvestments of dividends and distributions | | | 1,595 | | | 316 | | | 97,116 | | | 123,315 | |
| Shares redeemed | | | (50,795 | ) | | (82,531 | ) | | (1,279,794 | ) | | (5,520,986 | ) |
| Net decrease in shares outstanding | | | (22,979 | ) | | (36,146 | ) | | (790,789 | ) | | (4,366,019 | ) |
The accompanying notes are an integral part of these financial statements.
| KINETICS MUTUAL FUNDS, INC. — THE FUND |
| Statements of Changes in Net Assets — (Continued) |
| | | | The Kinetics Spin-off and
Corporate Restructuring Fund | |
| | | | For the
Year Ended
December 31,
2018 | | | For the
Period Ended
December 31,
2017# | | | For the
Year Ended
April 30,
2017 | |
| OPERATIONS: | | | | | | | | | | |
| Net investment income (loss) | | $ | (166,846 | ) | $ | (47,508 | ) | $ | 68,414 | |
| Net realized (loss) on sale of investments and foreign currency | | | (117,499 | ) | | (741,847 | ) | | 2,119,392 | |
| Net change in unrealized appreciation (depreciation) of investments | | | (1,246,793 | ) | | 3,468,089 | | | 1,761,869 | |
| Net increase (decrease) in net assets resulting from operations | | | (1,531,138 | ) | | 2,678,734 | | | 3,949,675 | |
| DISTRIBUTIONS TO SHAREHOLDERS: | | | | | | | | | | |
| No Load Class (See Note 5)(1) | | | (506 | ) | | — | (2) | | N/A | (3) |
| Advisor Class A (See Note 5) | | | (153,489 | ) | | (165,194 | )(2) | | (98,796 | )(3) |
| Advisor Class C (See Note 5) | | | (201,832 | ) | | (219,845 | )(2) | | (112,198 | )(3) |
| Institutional Class (See Note 5) | | | (525,309 | ) | | (580,919 | )(2) | | (234,363 | (3) |
| Total distributions to shareholders | | | (881,136 | ) | | (965,958 | ) | | (445,357 | ) |
| CAPITAL SHARE TRANSACTIONS — NO LOAD CLASS(1): | | | | | | | | | | |
| Proceeds from shares sold | | | 2,600 | | | 10,000 | | | N/A | |
| Proceeds from shares issued to holders in reinvestment of dividends | | | 506 | | | — | | | N/A | |
| Cost of shares redeemed | | | — | | | — | | | N/A | |
| Net increase in net assets resulting from capital share transactions | | | 3,106 | | | 10,000 | | | N/A | |
| CAPITAL SHARE TRANSACTIONS — ADVISOR CLASS A: | | | | | | | | | | |
| Proceeds from shares sold | | | 83,577 | | | 279,270 | | | 519,984 | |
| Proceeds from shares issued to holders in reinvestment of dividends | | | 149,160 | | | 161,908 | | | 97,422 | |
| Cost of shares redeemed | | | (823,693 | ) | | (1,057,741 | ) | | (2,893,486 | ) |
| Net decrease in net assets resulting from capital share transactions | | | (590,956 | ) | | (616,563 | ) | | (2,276,080 | ) |
The accompanying notes are an integral part of these financial statements.
| KINETICS MUTUAL FUNDS, INC. — THE FUND |
| Statements of Changes in Net Assets — (Continued) |
| | | | The Kinetics Spin-off and
Corporate Restructuring Fund | |
| | | | For the
Year Ended
December 31,
2018 | | | For the
Period Ended
December 31,
2017# | | | For the
Year Ended
April 30,
2017 | |
| CAPITAL SHARE TRANSACTIONS — ADVISOR CLASS C: | | | | | | | | | | |
| Proceeds from shares sold | | | 40,259 | | | 242 | | | 167,241 | |
| Proceeds from shares issued to holders in reinvestment of dividends | | | 201,572 | | | 219,361 | | | 112,097 | |
| Cost of shares redeemed | | | (1,087,034 | ) | | (800,895 | ) | | (1,715,649 | ) |
| Net decrease in net assets resulting from capital share transactions | | | (845,203 | ) | | (581,292 | ) | | (1,436,311 | ) |
| CAPITAL SHARE TRANSACTIONS — INSTITUTIONAL CLASS: | | | | | | | | | | |
| Proceeds from shares sold | | | 300,943 | | | 2,918,080 | | | 1,052,025 | |
| Redemption fees | | | — | | | 31 | | | — | |
| Proceeds from shares issued to holders in reinvestment of dividends | | | 442,957 | | | 501,434 | | | 231,186 | |
| Cost of shares redeemed | | | (2,088,988 | ) | | (2,318,318 | ) | | (15,334,344 | ) |
| Net increase (decrease) in net assets resulting from capital share transactions | | | (1,345,088 | ) | | 1,101,227 | | | (14,051,133 | ) |
| TOTAL INCREASE (DECREASE) IN NET ASSETS: | | | (5,190,415 | ) | | 1,626,148 | | | (14,259,206 | ) |
| NET ASSETS: | | | | | | | | | | |
| Beginning of year | | | 23,908,878 | | | 22,282,730 | | | 36,541,936 | |
| End of year | | $ | 18,718,463 | | $ | 23,908,878 | (2) | $ | 22,282,730 | (3) |
| CHANGES IN SHARES OUTSTANDING — NO LOAD CLASS(1): | | | | | | | | | | |
| Shares sold | | | 195 | | | 925 | | | N/A | |
| Shares issued in reinvestments of dividends and distributions | | | 52 | | | — | | | N/A | |
| Shares redeemed | | | — | | | — | | | N/A | |
| Net increase in shares outstanding | | | 247 | | | 925 | | | N/A | |
| CHANGES IN SHARES OUTSTANDING — ADVISOR CLASS A: | | | | | | | | | | |
| Shares sold | | | 6,872 | | | 26,603 | | | 56,647 | |
| Shares issued in reinvestments of dividends and distributions | | | 16,073 | | | 15,217 | | | 10,064 | |
| Shares redeemed | | | (73,949 | ) | | (103,280 | ) | | (311,752 | ) |
| Net decrease in shares outstanding | | | (51,004 | ) | | (61,460 | ) | | (245,041 | ) |
| CHANGES IN SHARES OUTSTANDING — ADVISOR CLASS C: | | | | | | | | | | |
| Shares sold | | | 3,328 | | | 24 | | | 18,841 | |
| Shares issued in reinvestments of dividends and distributions | | | 23,010 | | | 21,612 | | | 12,028 | |
| Shares redeemed | | | (102,216 | ) | | (80,502 | ) | | (190,922 | ) |
| Net decrease in shares outstanding | | | (75,878 | ) | | (58,866 | ) | | (160,053 | ) |
| CHANGES IN SHARES OUTSTANDING — INSTITUTIONAL CLASS: | | | | | | | | | | |
| Shares sold | | | 25,225 | | | 270,805 | | | 113,358 | |
| Shares issued in reinvestments of dividends and distributions | | | 47,528 | | | 47,083 | | | 23,833 | |
| Shares redeemed | | | (182,315 | ) | | (223,137 | ) | | (1,752,462 | ) |
| Net increase (decrease) in capital shares outstanding | | | (109,562 | ) | | 94,751 | | | (1,615,271 | ) |
| # | For the period May 1, 2017 through December 31,2017. The Fund changed its fiscal year end from April 30 to December 31. |
| (1) | No Load Class shares of the Spin-off Fund commenced operations on December 11, 2017. |
| (2) | For the period ended December 31, 2017, net investment income distributions for The Kinetics Spin-off and Corporate Restructuring Fund were $0 for the No Load Class, $300 for the Advisor Class A, $0 for the Advisor Class C and $46,299 for the Institutional Class and net realized gain distributions were $0 for the No Load Class, $164,894 for the Advisor Class A, $219,845 for the Advisor Class C and $534,620 for the Institutional Class and accumulated net investment loss was $580,003. |
| (3) | For the year ended April 30, 2017, net realized gain distributions for The Kinetics Spin-off and Corporate Restructuring Fund were $98,796 for the Advisor Class A, $112,198 for the Advisor Class C and $234,363 for the Institutional Class and accumulated net investment loss was $533,370. |
The accompanying notes are an integral part of these financial statements.
| KINETICS MUTUAL FUNDS, INC. — THE FEEDER FUNDS |
| Notes to Financial Statements |
| December 31, 2018 |
1. Organization
Kinetics Mutual Funds, Inc. (the “Company”) is registered under the Investment Company Act of 1940, as amended (the “1940 Act”), and is incorporated in the State of Maryland. The Company is an open-end management investment company issuing its shares in series. One billion shares are authorized for the Company with a par value of $0.001 per share. The series of the Company presently authorized are The Internet Fund (“Internet”), The Global Fund (“Global”), The Paradigm Fund (“Paradigm”), The Medical Fund (“Medical”), The Small Cap Opportunities Fund (“Small Cap”), The Market Opportunities Fund (“Market Opportunities”), The Alternative Income Fund (“Alternative Income”), The Multi-Disciplinary Income Fund (“Multi-Disciplinary Income”) and The Kinetics Spin-off and Corporate Restructuring Fund (“Spin-off Fund”). Investment operations of the Company began on October 21, 1996 (Internet), September 30, 1999 (Medical), December 31, 1999 (Global and Paradigm), March 20, 2000 (Small Cap), January 31, 2006 (Market Opportunities), June 29, 2007 (Alternative Income), February 11, 2008 (Multi-Disciplinary Income) and May 4, 2007 (Spin-off Fund). The Spin-off Fund completed a plan of reorganization at the close of business on December 8, 2017 to begin operations under the Company. Prior to December 8, 2017, the Spin-off Fund, was known as Horizon Spin-off and Corporate Restructuring a series of Investment Managers Series Trust. Each series, except the Spin-off Fund, unlike many other investment companies which directly acquire and manage their own portfolios of securities, seeks to achieve its investment objective by investing all of its investable assets in a corresponding portfolio series (each a “Master Portfolio” and collectively the “Master Portfolios”) of Kinetics Portfolios Trust (the “Trust”). The Spin-off Fund does not invest all of its investable assets in a Master Portfolio and will directly acquire and manage its own portfolio of securities.
On April 28, 2000 (January 31, 2006, with respect to Market Opportunities, June 29, 2007, with respect to Alternative Income, and February 11, 2008, with respect to Multi-Disciplinary Income), each series in the Company, except for the Spin-off Fund, entered into a master-feeder fund structure. By entering into this structure, each series, except for the Spin-off Fund, (each a “Feeder Fund” and collectively, the “Feeder Funds”) invested all of its assets in a corresponding Master Portfolio which had the same investment objective as the Feeder Fund. Each Master Portfolio has multiple feeder funds. Each Feeder Fund receives a proportionate amount of interest in the Master Portfolio equal to its relative contribution of capital. Thus, each Feeder Fund is allocated its portion of income, gains (losses) and expenses from the Master Portfolio.
| KINETICS MUTUAL FUNDS, INC. — THE FEEDER FUNDS |
| Notes to Financial Statements — (Continued) |
| December 31, 2018 |
Each Feeder Fund’s respective interest in the corresponding Master Portfolio as of December 31, 2018, is as follows:
| | | | Interest in |
| | | | Master Portfolio |
| The Internet Fund | | | 99.979 | % |
| The Global Fund | | | 99.926 | % |
| The Paradigm Fund | | | 97.754 | % |
| The Medical Fund | | | 99.783 | % |
| The Small Cap Opportunities Fund | | | 99.975 | % |
| The Market Opportunities Fund | | | 99.969 | % |
| The Alternative Income Fund | | | 99.339 | % |
| The Multi-Disciplinary Income Fund | | | 99.529 | % |
Prior to the conversion to a master-feeder fund structure on April 28, 2000, each then existing series conducted its own investment operations.
As of December 31, 2018, each of the Funds offers Advisor Class A shares. Advisor Class A shares are subject to an annual Rule 12b-1 fee of 0.25% of average daily net assets and a shareholder servicing fee of 0.25% of average daily net assets. The Advisor Class A shares are also subject to a front-end sales charge of 5.75%.
As of December 31, 2018, each of the Funds offers Advisor Class C shares. Advisor Class C shares are subject to an annual Rule 12b-1 fee of 0.75% of average daily net assets and a shareholder servicing fee of 0.25% of average daily net assets. If you sell your Advisor Class C shares within 12 months of purchase, you will have to pay a contingent deferred sales charge of 1.00%, which is applied to the NAV of the shares on the date of original purchase or on the date of redemption, whichever is less.
As of December 31, 2018, each of the Funds offers No Load Class shares. No Load Class shares are subject to a shareholder servicing fee of 0.25% of average daily net assets but do not have 12b-1 fees or a sales charge.
As of December 31, 2018, the Paradigm, Small Cap, Market Opportunities, Alternative Income, Multi-Disciplinary Income and Spin-off funds offer Institutional Class shares. Institutional Class shares are subject to a shareholder servicing fee of 0.20% of average daily net assets but do not have 12b-1 fees or a sales charge. The Adviser has contractually agreed to waive the portion of the Institutional Class shareholder servicing fee in excess of 0.05%.
| KINETICS MUTUAL FUNDS, INC. — THE FEEDER FUNDS |
| Notes to Financial Statements — (Continued) |
| December 31, 2018 |
Each class of shares for each Feeder Fund and the Spin-off Fund has identical rights and privileges except with respect to the Rule 12b-1 fees paid by the Advisor Class A and Advisor Class C shares, the front-end sales charge on the Advisor Class A shares, the contingent deferred sales charge on Class C, the shareholder servicing fees paid by the Advisor Class A, Advisor Class C, No Load Class and Institutional Class shares, voting rights on matters pertaining to a single class of shares and the exchange privileges of each class of shares. Shares of each Feeder Fund and the Spin-off Fund will assess a 2.00% redemption fee (with exceptions) on shares redeemed or exchanged within 30 days of purchase. Income, expenses (other than expenses attributable to a specific class), and realized and unrealized gains or losses on investments are allocated to each class based on its relative net assets.
Refer to the Master Portfolios’ financial statements to obtain information about the investment objective of the corresponding Feeder Fund. The financial statements of the Master Portfolios, including the portfolios of investments, are contained elsewhere in this report and should be read in conjunction with the Feeder Funds’ financial statements.
2. Significant Accounting Policies
Security Valuation
Master Portfolios and Spin-off Fund equity securities that are listed on a securities exchange for which market quotations are readily available are valued at the last quoted sale price on the day the valuation is made. Price information on listed securities is taken from the exchange where the security is primarily traded. All equity securities, including exchange-traded funds, that are traded using the National Association of Securities Dealers’ Automated Quotation System (“NASDAQ”) are valued using the NASDAQ Official Closing Price (“NOCP”). In the event market quotations are not readily available or if events occur that may materially affect the value of a particular security between the time trading ends on a particular security and the close of regular trading on the New York Stock Exchange (“NYSE”), “fair value” will be determined. Unlisted equity securities and listed equity securities not traded on the valuation date for which market quotations are readily available are valued at the last bid price. Futures, options on futures and swap contracts that are listed or traded on a national securities exchange, commodities exchange, contract market or over-the-counter markets and are freely transferable will be
| KINETICS MUTUAL FUNDS, INC. — THE FEEDER FUNDS |
| Notes to Financial Statements — (Continued) |
| December 31, 2018 |
valued at the composite price, using the National Best Bid and Offer quotes (“NBBO”). NBBO consists of the highest bid price and lowest ask price across any of the exchanges on which an option is quoted, thus providing a view across the entire U.S. options marketplace. Composite option pricing calculates the mean of the highest bid price and lowest ask price across the exchanges where the option is traded. If a composite option price is not available, then a quote provided by one of the authorized pricing vendors will be used. If neither a composite price nor a quote from an authorized pricing provider is available, and it is the day of expiration or post-expiration, expiring options will be priced at intrinsic value. Non-exchange-traded options for which over-the-counter quotations are not readily available are valued at the mean between the last bid and asked quotations. Debt obligations (including convertible securities) that are either investment grade or below investment grade and irrespective of days to maturity are valued at evaluated mean by one of the authorized third party pricing agents which rely on various valuation methodologies such as matrix pricing and other analytical pricing models as well as market transactions and dealer quotations. Certain instruments, such as repurchase agreements and demand notes, do not have values from third parties and are valued at amortized cost. Investments in registered open-end investment companies (including money market funds), other than exchange-traded funds, are valued at their reported net asset value (“NAV”).
Other assets and securities for which no quotations are readily available (including restricted securities) will be valued in good faith at fair value using methods determined by the Board of Trustees of the Master Portfolios and Spinoff Fund. In determining the fair value of a security, the Board of Trustees shall take into account the relevant factors and surrounding circumstances, which may include: (i) the nature and pricing history (if any) of the security; (ii) whether any dealer quotations for the security are available; (iii) possible valuation methodologies that could be used to determine the fair value of the security; (iv) the recommendation of the portfolio manager of the Portfolios with respect to the valuation of the security; (v) whether the same or similar securities are held by other funds managed by the Adviser or other funds and the method used to price the security in those funds; (vi) the extent to which the fair value to be determined for the security will result from the use of data or formula produced by third parties independent of the Adviser; (vii) the liquidity or illiquidity of the market for the security; and (viii) the value of a foreign security traded on other foreign markets. At December 31, 2018, 0.00% and
| KINETICS MUTUAL FUNDS, INC. — THE FEEDER FUNDS |
| Notes to Financial Statements — (Continued) |
| December 31, 2018 |
0.00% of the net assets of The Internet Portfolio and The Paradigm Portfolio, respectively, were fair valued securities. The other Master Portfolios and Spin-off Fund did not hold any fair valued securities at December 31, 2018.
Bitcoin
The Master Portfolios and Spin-off Fund may invest in Grayscale Bitcoin Trust, a Delaware statutory trust (“Bitcoin Trust”) that invests in bitcoins. From time to time, the Bitcoin Trust issues creation units in exchange for bitcoins and distributes bitcoins in exchange for redemption units. The performance of the Bitcoin Trust is intended to reflect changes in the value of the Trust’s bitcoin investments. At December 31, 2018, 8.0%, 5.7%, 1.2%, 0.5%, and 3.3% of the net assets of The Internet Portfolio, The Global Portfolio, The Paradigm Portfolio, The Small Cap Opportunities Portfolio and The Market Opportunities Portfolio, respectively, were invested in the Bitcoin Trust. Investments in bitcoins produce non qualifying income under subchapter M of the Internal Revenue Code.
Bitcoin is a decentralized digital currency that enables instant transfers to anyone, anywhere in the world. Managing transactions in bitcoins occurs via an open source, cryptographic protocol central authority. The Bitcoin Network is an online, end-user-to-end-user network that hosts the public transaction ledger, known as the Blockchain, and the source code that comprises the basis for the cryptographic and algorithmic protocols governing the Bitcoin Network. No single entity owns or operates the Bitcoin Network, the infrastructure of which is collectively maintained by a decentralized user base. Since the Bitcoin Network is decentralized, it does not rely on either governmental authorities or financial institutions to create, transmit or determine the value of bitcoins. Rather, the value of bitcoins is determined by the supply of and demand for bitcoins in the global bitcoin exchange market for the trading of bitcoins, which consists of transactions on electronic bitcoin exchanges (“Bitcoin Exchanges”). Pricing on Bitcoin Exchanges and other venues can be volatile and can adversely affect the value of the Bitcoin Trust. Currently, there is relatively small use of bitcoins in the retail and commercial marketplace in comparison to the relatively large use of bitcoins by speculators, thus contributing to price volatility that could adversely affect a Master Portfolio’s direct or indirect investment in the Bitcoin Trust. Bitcoin transactions are irrevocable, and stolen or incorrectly transferred bitcoins may be irretrievable. As a result, any incorrectly executed bitcoin transactions could adversely affect the value of a Master Portfolio’s direct or indirect investment in the Bitcoin Trust. Shares of the
| KINETICS MUTUAL FUNDS, INC. — THE FEEDER FUNDS |
| Notes to Financial Statements — (Continued) |
| December 31, 2018 |
Bitcoin Trust may trade at a premium or discount to the net asset value of the Bitcoin Trust. The price of bitcoins is set in transfers by mutual agreement or barter as well as the number of merchants that accept bitcoins. Because bitcoins are digital files that can be transferred without the involvement of intermediaries or third parties, there are little or no transaction costs in direct end-user-to-end-user transactions. Bitcoins can be used to pay for goods and services or can be converted to fiat currencies, such as the U.S. dollar, at rates determined by the Bitcoin Exchanges. Additionally, third party service providers such as Bitcoin Exchanges are also used for transfers but they may charge significant fees for processing transactions.
As bitcoins have grown in popularity, the U.S. Congress and a number of federal and state agencies (including the Financial Crimes Enforcement Network (FinCEN), the U.S. Securities and Exchange Commission, the Commodity Futures Trading Commission, the Financial Industry Regulatory Authority, the Consumer Financial Protection Bureau, the Department of Justice, the Department of Homeland Security, the Federal Bureau of Investigation, the IRS, and state financial institution regulators) have begun to examine the operations of the network that facilitates bitcoins, bitcoin users and the Bitcoin Exchanges, with particular focus on (1) the extent to which bitcoins can be used to launder the proceeds of illegal activities or fund criminal or terrorist enterprises, (2) the safety and soundness of the Bitcoin Exchange or other service-providers that hold bitcoins for users and (3) other risks to investors and consumers who hold and use bitcoins. Ongoing and future regulatory actions may alter, perhaps to a materially adverse extent, the value of a Master Portfolio’s and it’s Subsidiary’s investment in the Bitcoin Trust or the ability of the Bitcoin Trust to continue to operate.
Repurchase Agreements
Each Master Portfolio and the Spin-off Fund may enter into repurchase agreements with banks that are members of the Federal Reserve System or securities dealers who are members of a national securities exchange or are primary dealers in U.S. Government Securities. In connection with transactions in repurchase agreements, it is the Trust’s policy that the Master Portfolios and Spin-off Fund receive, as collateral, securities whose market value, including accrued interest, at all times will be at least equal to 102% of the amount invested by the Master Portfolio and Spin-off Fund in each repurchase
| KINETICS MUTUAL FUNDS, INC. — THE FEEDER FUNDS |
| Notes to Financial Statements — (Continued) |
| December 31, 2018 |
agreement. If the seller defaults and the value of the collateral declines, realization of the collateral by the Master Portfolio and Spin-off Fund may be delayed or limited.
Written Options
The Master Portfolios and Spin-off Fund may write (sell) call or put options for trading or hedging purposes. When a Master Portfolio or Spin-off Fund writes an option, an amount equal to the premium received by the Master Portfolio or Spin-off Fund is included in the Statement of Assets and Liabilities as an asset and an equivalent liability. The amount of the liability is subsequently marked-to-market to reflect the current value of the option written. By writing the option, the Master Portfolio or Spin-off Fund may become obligated during the term of the option to deliver or purchase the securities underlying the option at the exercise price if the option is exercised. When an option expires on its stipulated expiration date or the Master Portfolio or Spin-off Fund enters into a closing purchase transaction, the Master Portfolio or Spin-off Fund realizes a gain or loss if the cost of the closing transaction differs from the premium received when the option was sold, without regard to any unrealized gain or loss on the underlying security, and the liability related to such option is eliminated. When an option is exercised, the premium originally received decreases the cost basis of the underlying security (or increases the proceeds on the security sold short) and the Master Portfolio or Spin-off Fund realizes a gain or loss from the sale of the security (or closing of the short sale). As collateral for uncovered written options, each of the Master Portfolios and Spin-off Fund are required under the 1940 Act to maintain assets consisting of cash, cash equivalents or unencumbered, liquid securities. This collateral is required to be adjusted daily to reflect the exercise price of the purchase obligation for put options or the market value of the instrument underlying the contract for call options.
| KINETICS MUTUAL FUNDS, INC. — THE FEEDER FUNDS |
| Notes to Financial Statements — (Continued) |
| December 31, 2018 |
Foreign Currency Translations
The books and records of the Master Portfolios and Spin-off Fund are maintained in U.S. dollars. For the Master Portfolios and Spin-off Fund, foreign currency transactions are translated into U.S. dollars on the following basis: (i) market values of investment securities and other assets and liabilities are translated at the exchange rate of such currencies against the U.S. dollar, as provided by an approved pricing service, and (ii) purchases and sales of investment securities, dividend and interest income and certain expenses at the rates of exchange prevailing on the respective dates of such transactions. The Master Portfolios and Spin-off Fund do not isolate and treat as ordinary income that portion of the results of operations arising as a result of changes in the exchange rate from the fluctuations arising from changes in the market prices of securities held during the year. Such fluctuations are included with the net realized and unrealized gain or loss from investments. However, for federal income tax purposes, the Master Portfolios and Spin-off Fund do isolate and treat as ordinary income the effect of changes in foreign exchange rates arising from actual foreign currency transactions and the effect of changes in foreign exchange rates arising between trade date and settlement date.
Restricted and Illiquid Securities
The Master Portfolios and Spin-off Fund may invest in restricted securities. These securities are valued by the Master Portfolios and Spin-off Fund after giving due consideration to pertinent factors including recent private sales, market conditions and the issuer’s financial performance. The Master Portfolios and Spin-off Fund have no right to require registration of unregistered securities. The 144A securities have been deemed to be liquid by the Master Portfolio and Spin-off Fund’s Adviser under the supervision of the Board of Trustees/Directors. At December 31, 2018, the following Master Portfolios and Spin-off Fund held securities restricted to institutional investors (144A securities):
| | | | Market Value | | Percentage of
Net Assets |
| The Multi-Disciplinary Income Portfolio | | | $10,172,499 | | | 27.19 | % |
| | | | | | | | |
| KINETICS MUTUAL FUNDS, INC. — THE FEEDER FUNDS |
| Notes to Financial Statements — (Continued) |
| December 31, 2018 |
An illiquid asset is any asset which may not be sold or disposed of in current market conditions within seven days without the sale or disposition significantly changing the market value of the investment. At December 31, 2018, the following Master Portfolios and Spin-off Fund held illiquid securities:
| | | | Market Value | | Percentage of
Net Assets |
| The Internet Portfolio | | $ | — | * | | 0.00 | % |
| The Paradigm Portfolio | | | — | * | | 0.00 | % |
| The Multi-Disciplinary Income Portfolio | | | 154,207 | | | 0.41 | % |
| * | Amount is less than $0.50. |
When-Issued Securities
The Master Portfolios and Spin-off Fund may purchase securities on a when-issued or delayed delivery basis. Although the purchase amounts of these securities are established at the time the purchaser enters into the agreement, these securities may be delivered and paid for at a future date. The Master Portfolios and Spin-off Fund record purchases of when-issued securities and reflect the values of such securities in determining net asset value in the same manner as other portfolio securities. The Master Portfolios and Spin-off Fund maintain at all times cash or other liquid assets in an amount at least equal to the amount of outstanding commitments for when-issued securities.
Securities Lending
Each Master Portfolio and Spin-off Fund may lend its portfolio securities to broker-dealers by entering directly into lending arrangements with such broker-dealers or indirectly through repurchase agreements with respect to no more than 331/³% of the total assets of each Master Portfolio and Spin-off Fund (including any collateral posted) or 50% of the total assets of each Master Portfolio and Spin-off Fund (excluding any collateral posted). Securities lending and repurchase transactions will be fully collateralized at all times with cash and/or short-term debt obligations. The Master Portfolios and Spinoff Fund receive interest on the collateral received as well as a fee for the securities loaned.
| KINETICS MUTUAL FUNDS, INC. — THE FEEDER FUNDS |
| Notes to Financial Statements — (Continued) |
| December 31, 2018 |
Expense Allocation
Common expenses incurred by the Funds are allocated among the Funds (i) based upon relative average net assets, (ii) as incurred on a specific identification basis, or (iii) equally among the Funds, depending on the nature of the expenditure.
Each Feeder Fund records its proportionate share of the corresponding Master Portfolio’s expenses on a daily basis. In addition, each Feeder Fund accrues its own separate expenses. Any cap on expenses includes Feeder Fund-specific expenses as well as the expenses allocated from the Master Portfolio.
Federal Income Taxes
Each Master Portfolio will be treated as a partnership for federal income tax purposes. As such, each investor in a Master Portfolio via its investment in a Feeder Fund will be subject to taxation on its share of the Master Portfolio’s ordinary income and capital gains. It is intended that the Master Portfolio’s assets will be managed so an investor in the Master Portfolio via its investment in a Feeder Fund can satisfy the requirements of subchapter M of the Internal Revenue Code. It is intended that the Spin-off Fund will be managed to satisfy the requirements of subchapter M of the Internal Revenue Code.
The consolidated financial statements include the accounts of Cayman, Ltd., Cayman wholly-owned Controlled Foreign Corporations (“CFCs”) and the accounts of Delaware Corporations (“Cayman” or “Delaware”, respectively, or “Subsidiaries” for both). The respective Master Portfolios hold a CFC: Internet Portfolio, Global Portfolio, Paradigm Portfolio, Small Cap Opportunities Portfolio and Market Opportunities Portfolio. The respective Master Portfolios hold a Delaware subsidiary: Internet Portfolio, Global Portfolio, Paradigm Portfolio, and Market Opportunities Portfolio. The investment of up to 25% of a Master Portfolio’s assets in the Subsidiaries is a structure that has been used by a number of Registered Investment Companies (“RICs”), avoiding bad income generation by indirectly making commodities-related investments. These investments would not generate qualifying income if they were made directly by the RIC. Section 851(b) of the Internal Revenue Code provides that income earned by a CFC or controlled subsidiary, such as the Subsidiaries, will be treated as qualifying income for a RIC provided the Subsidiaries distribute those earnings out to the RIC each year. If the IRS were to determine that income derived from a Master Portfolio’s investment in its Subsidiaries do not constitute
| KINETICS MUTUAL FUNDS, INC. — THE FEEDER FUNDS |
| Notes to Financial Statements — (Continued) |
| December 31, 2018 |
qualifying income and if such positions were upheld by a court, or if future legislation or Treasury regulations were to adversely affect the tax treatment of such investments, then the corresponding Feeder Fund might cease to qualify as a RIC and could be required to reduce its exposure to such investments. In that event, a Feeder Fund’s taxable income would be subject to tax at the Feeder Fund level at regular corporate tax rates (without reduction for distributions to shareholders) and to a further tax at the shareholder level when such income is distributed. In such an event, in order to re-qualify for taxation as a regulated investment company, the Feeder Fund may be required to recognize unrealized gains, pay substantial taxes and interest and make certain distributions.
It is the Funds’ policy to meet the requirements of the Internal Revenue Code applicable to regulated investment companies and the Funds intend to distribute investment company net taxable income and net capital gains to shareholders.
Dividends from net investment income and distributions of net realized capital gains, if any, will be declared and paid at least annually. The character of distributions made during the year from net investment income or net realized gains may differ from the characterization for federal income tax purposes due to differences in the recognition of income, expenses and realized gain items for financial statement and tax purposes. Additionally, the Funds may utilize earnings and profits distributed to shareholders on redemption of shares as part of the dividends paid deduction for income tax purposes. Where appropriate, reclassifications between capital accounts are made for such differences that are permanent in nature.
There is no tax liability resulting from unrecognized tax benefits relating to uncertain income tax positions taken or expected to be taken in future tax returns. As of December 31, 2018, open tax years include the tax years ended December 31, 2015 through December 31, 2018. The Funds are also not aware of any tax positions for which it is reasonably possible that the total amounts of unrecognized tax benefits will significantly change in the next twelve months.
Use of Estimates
The preparation of financial statements in conformity with U.S. generally accepted accounting principles (“GAAP”) requires management to make estimates and assumptions that affect the reported amounts in the financial statements. Actual results could differ from those estimates.
| KINETICS MUTUAL FUNDS, INC. — THE FEEDER FUNDS |
| Notes to Financial Statements — (Continued) |
| December 31, 2018 |
Other
Realized gains and losses on the sale of investments are calculated on the identified cost basis. Dividend income is recorded on the ex-dividend date. Interest income is accounted for on the accrual basis and includes amortization of premiums and accretion of discounts on the effective interest method. Other noncash dividends are recognized as investment income at the fair value of the property received. Withholding taxes on foreign dividends have been incorporated in accordance with the Company’s understanding of the applicable country’s tax rules and rates.
3. Investment Adviser
The Trust has entered into Investment Advisory Agreements (the “Agreements”) with Kinetics Asset Management LLC (the “Adviser”), with whom certain officers and trustees of the Trust are affiliated, to furnish investment advisory services to the Master Portfolios and Spin-off Fund. The Adviser is a wholly-owned subsidiary of Horizon Kinetics LLC. Under the terms of the Agreements, the Master Portfolios, except the Alternative Income Portfolio, compensate the Adviser for its management services at the annual rate of 1.25% of each Master Portfolio’s average daily net assets. The Alternative Income Portfolio compensates the Adviser for its management services at the annual rate of 0.90% of the Master Portfolio’s average daily net assets. The Spin-off Fund compensates the Adviser for its management services at the annual rate of 1.00% of the Fund’s average daily net assets.
The Adviser has agreed to waive a portion of its advisory fee and/or reimburse certain operating expenses as deemed appropriate through at least May 1, 2019. The Adviser may discontinue the waiver/reimbursement at any time after May 1, 2019; these waivers/reimbursements are not subject to recapture. Please see Note 9 regarding Market Opportunities ability to recapture commencing January 1, 2019. Operating expenses exclude brokerage commissions, borrowing costs on securities sold short, short dividends, interest expense, taxes, acquired fund fees and expenses and extraordinary expenses. Below are operating expense limitations by each share class of each of the funds:
| | | | The Internet | | | The Global |
| | | | Fund | | | Fund |
| No Load Class | | | 1.89 | % | | | 1.39 | % |
| Class A | | | 2.14 | % | | | 1.64 | % |
| Class C | | | 2.64 | % | | | 2.14 | % |
| KINETICS MUTUAL FUNDS, INC. — THE FEEDER FUNDS |
| Notes to Financial Statements — (Continued) |
| December 31, 2018 |
| | | | The Paradigm | | | The Medical |
| | | | Fund | | | Fund |
| No Load Class | | | 1.64 | % | | | 1.39 | % |
| Class A | | | 1.89 | % | | | 1.64 | % |
| Class C | | | 2.39 | % | | | 2.14 | % |
| Institutional Class | | | 1.44 | % | | | N/A | |
| | | | The Small Cap | | | The Market |
| | | | Opportunities | | | Opportunities |
| | | | Fund | | | Fund |
| No Load Class | | | 1.64 | % | | | 1.64 | % |
| Class A | | | 1.89 | % | | | 1.89 | % |
| Class C | | | 2.39 | % | | | 2.39 | % |
| Institutional Class | | | 1.44 | % | | | 1.44 | % |
| | | | The Alternative
Income
Fund | | | The Multi-
Disciplinary Income
Fund |
| No Load Class | | | 0.95 | % | | | 1.49 | % |
| Class A | | | 1.20 | % | | | 1.74 | % |
| Class C | | | 1.70 | % | | | 2.24 | % |
| Institutional Class | | | 0.75 | % | | | 1.29 | % |
| | | | The | | | | |
| | | | Spin-off | | | | |
| | | | Fund | | | | |
| No Load Class | | | 1.45 | % | | | | |
| Class A | | | 1.50 | % | | | | |
| Class C | | | 2.25 | % | | | | |
| Institutional Class | | | 1.25 | % | | | | |
For the year ended December 31, 2018, the rate earned by the Adviser from the Master Portfolios and Spin-off Fund and the waived fees/reimbursed expenses for the Funds are as follows:
| | | | The Internet | | | The Global |
| | | | Fund | | | Fund |
| Annual Advisory Rate | | | 1.25 | % | | | 1.25 | % |
| Expenses Reimbursed by Adviser through voluntary waiver | | | $ — | | | | $159,873 | |
| KINETICS MUTUAL FUNDS, INC. — THE FEEDER FUNDS |
| Notes to Financial Statements — (Continued) |
| December 31, 2018 |
| | | | The Paradigm | | | The Medical |
| | | | Fund | | | Fund |
| Annual Advisory Rate | | | 1.25 | % | | | 1.25 | % |
| Expenses Reimbursed by Adviser through voluntary waiver | | $ | 696,542 | | | $ | 150,946 | |
| Expenses Reimbursed by Adviser through institutional class shareholder servicing fee waiver | | $ | 296,932 | | | | N/A | |
| | | | The Small Cap | | | The Market |
| | | | Opportunities | | | Opportunities |
| | | | Fund | | | Fund |
| Annual Advisory Rate | | | 1.25 | % | | | 1.25 | % |
| Expenses Reimbursed by Adviser through voluntary waiver | | $ | 282,352 | | | $ | 181,749 | |
| Expenses Reimbursed by Adviser through institutional class shareholder servicing fee waiver | | $ | 71,182 | | | $ | 17,541 | |
| | | | | | | |
| | | | The Alternative
Income
Fund | | | The Multi-
Disciplinary Income
Fund |
| Annual Advisory Rate | | | 0.90 | % | | | 1.25 | % |
| Expenses Reimbursed by Adviser through voluntary waiver | | $ | 193,765 | | | $ | 207,361 | |
| Expenses Reimbursed by Adviser through institutional class shareholder servicing fee waiver | | $ | 20,745 | | | $ | 37,720 | |
| | | | The | | | | |
| | | | Spin-off | | | | |
| | | | Fund | | | | |
| Annual Advisory Rate | | | 1.00 | % | | | | |
| Expenses Reimbursed by Adviser through voluntary waiver | | $ | 91,005 | | | | | |
| Expenses Reimbursed by Adviser through institutional class shareholder servicing fee waiver | | $ | 21,485 | | | | | |
The Adviser receives the shareholder servicing fees from the No Load Class, Advisor Class A and Advisor Class C shares of a Fund pursuant to a Shareholder Servicing Agreement in the amount equal to 0.25% of the Funds’ average daily net assets attributable to No Load Class, Advisor Class A and Advisor Class C shares, respectively. For the Institutional Class, the Adviser receives a shareholder servicing fee pursuant to a shareholder servicing agreement in the amount equal to 0.20% of a Funds’ average daily net assets attributable to Institutional Class shares. At this time, the Adviser has contractually agreed to waive and/or reimburse the portion of the Institutional Class shareholder
| KINETICS MUTUAL FUNDS, INC. — THE FEEDER FUNDS |
| Notes to Financial Statements — (Continued) |
| December 31, 2018 |
servicing fee in excess of 0.05% of a Funds’ average daily net assets attributable to Institutional Class shares until at least May 1, 2019. For the year ended December 31, 2018, the Adviser waived amounts depicted in the above table in shareholder servicing fees for the Institutional Class of the Paradigm, Small Cap, Market Opportunities, Alternative Income, Multi-Disciplinary Income and Spin-off Funds.
| | | Shareholder Servicing
Expenses for the
year ended
December 31, 2018 |
| The Internet Fund | | $ | 357,030 | |
| The Global Fund | | | 35,157 | |
| The Paradigm Fund | | | 1,943,077 | |
| The Medical Fund | | | 44,706 | |
| The Small Cap Opportunities Fund | | | 673,477 | |
| The Market Opportunities Fund | | | 204,859 | |
| The Alternative Income Fund | | | 45,423 | |
| The Multi-Disciplinary Income Fund | | | 95,666 | |
| The Spin-off Fund | | | 52,565 | |
The Adviser is responsible for paying a portion of these shareholder servicing fees to various agents that have a written shareholder servicing agreement with the Adviser and that perform shareholder servicing functions and maintenance of shareholder accounts on behalf of their clients who own shares of the Funds.
For the year ended December 31, 2018, the Funds were allocated approximately $26,000 for the services of the Chief Compliance Officer employed by the Adviser.
The Company, on behalf of the Funds, has adopted two Retail Distribution Plans pursuant to Rule 12b-1 under the 1940 Act (each a “12b-1 Plan”). One 12b-1 Plan is for Advisor Class A shares, while the other 12b-1 Plan is for Advisor Class C shares. Under the 12b-1 Plan for Advisor Class A shares, Advisor Class A shares may pay up to an annual rate of 0.50% of the average daily net asset value of Advisor Class A shares to the Distributor or other qualified recipients under the 12b-1 Plan. During the year ended December 31, 2018, payments under the 12b-1 Plan for the Advisor Class A shares of the Internet, Global, Paradigm, Medical, Small Cap, Market Opportunities, Alternative Income, Multi-Disciplinary Income and Spin-off Funds were limited
| KINETICS MUTUAL FUNDS, INC. — THE FEEDER FUNDS |
| Notes to Financial Statements — (Continued) |
| December 31, 2018 |
to 0.25% of the average daily net asset value of such shares of such Funds. Under the second 12b-1 Plan, Advisor Class C shares pay an annual rate of 0.75% of the average daily net asset value of such shares.
| | | 12b-1 Expenses for
the year ended
December 31, 2018 |
| | | Advisor Class A | | Advisor Class C |
| The Internet Fund | | $ | 8,761 | | | $ | 13,449 | |
| The Global Fund | | | 3,213 | | | | 40,058 | |
| The Paradigm Fund | | | 288,892 | | | | 921,944 | |
| The Medical Fund | | | 5,063 | | | | 2,652 | |
| The Small Cap Opportunities Fund | | | 31,170 | | | | 67,863 | |
| The Market Opportunities Fund | | | 19,488 | | | | 70,104 | |
| The Alternative Income Fund | | | 2,514 | | | | 9,641 | |
| The Multi-Disciplinary Income Fund | | | 9,116 | | | | 57,769 | |
| The Spin-off Fund | | | 10,450 | | | | 40,315 | |
Kinetics Funds Distributor, LLC (the “Distributor”) acts as the Funds’ principal underwriter in a continuous public offering of the Funds’ shares. The Distributor is an affiliate of the Adviser.
| | | Distributor Sales
Load Fees for
the year ended
December 31, 2018 |
| The Internet Fund | | $ | 3,985 | |
| The Global Fund | | | 627 | |
| The Paradigm Fund | | | 16,869 | |
| The Medical Fund | | | 152 | |
| The Small Cap Opportunities Fund | | | 4,850 | |
| The Market Opportunities Fund | | | 5,512 | |
| The Alternative Income Fund | | | 261 | |
| The Multi-Disciplinary Income Fund | | | 181 | |
| The Spin-off Fund | | | 6 | |
| KINETICS MUTUAL FUNDS, INC. — THE FEEDER FUNDS |
| Notes to Financial Statements — (Continued) |
| December 31, 2018 |
4. Reclassification of Capital Accounts
GAAP requires that certain components of net assets relating to permanent differences be reclassified between financial and tax reporting. These reclassifications have no effect on net assets or net asset value per share. For the year ended December 31, 2018, each Fund recorded the following reclassifications to the accounts listed below:
| | | INCREASE/(DECREASE) |
| | | Accumulated | | |
| | | Earnings | | |
| | | (Deficit) | | Paid In Capital |
| The Internet Fund | | $ | (3,671,159 | ) | | $ | 3,671,159 | |
| The Global Fund | | | 96,636 | | | | (96,636 | ) |
| The Paradigm Fund | | | 63,983,762 | | | | (63,983,762 | ) |
| The Medical Fund | | | (135,633 | ) | | | 135,633 | |
| The Small Cap Opportunities Fund | | | 8,444,103 | | | | (8,444,103 | ) |
| The Market Opportunities Fund | | | 5,499,335 | | | | (5,499,335 | ) |
| The Alternative Income Fund | | | 2,172,468 | | | | (2,172,468 | ) |
| The Multi-Disciplinary Income Fund | | | — | | | | — | |
| The Spin-off Fund | | | 305,339 | | | | (305,339 | ) |
5. Income Taxes
At December 31, 2018, the components of accumulated earnings (losses) on a tax basis were as follows:
| | | | Internet | | | Global | | | Paradigm | | | Medical | |
| Net Unrealized | | | | | | | | | | | | | |
| Appreciation (Depreciation) | | $ | (4,479,838 | ) | $ | 821,657 | | $ | 171,515,040 | | $ | 4,211,630 | |
| Undistributed Ordinary Income | | | 584,678 | | | — | | | — | | | 33,026 | |
| Undistributed Long-Term | | | | | | | | | | | | | |
| Capital Gains | | | 1,370,903 | | | — | | | — | | | 145,550 | |
| Total Distributable Earnings | | $ | 1,955,581 | | $ | — | | $ | — | | $ | 178,576 | |
| Other Accumulated Loss | | | (175,115 | ) | | (328,099 | ) | | (2,009,670 | ) | | — | |
| Total Accumulated Gain (Loss) | | $ | (2,699,372 | ) | $ | 493,558 | | $ | 169,505,370 | | $ | 4,390,206 | |
| KINETICS MUTUAL FUNDS, INC. — THE FEEDER FUNDS |
| Notes to Financial Statements — (Continued) |
| December 31, 2018 |
| | | | | | | | | | | | | Multi- | |
| | | | Small Cap | | | Market | | | Alternative | | | Disciplinary | |
| | | | Opportunities | | | Opportunities | | | Income | | | Income | |
| Net Unrealized | | | | | | | | | | | | | |
| Appreciation (Depreciation) | | $ | 18,831,624 | | $ | 11,178,621 | | $ | (99,324 | ) | $ | (2,723,858 | ) |
| Undistributed Ordinary Income | | | — | | | — | | | 20,837 | | | 46,024 | |
| Undistributed Long-Term | | | | | | | | | | | | | |
| Capital Gains | | | — | | | — | | | — | | | — | |
| Total Distributable Earnings | | $ | — | | $ | — | | $ | 20,837 | | $ | 46,024 | |
| Other Accumulated Loss | | | (4,409,084 | ) | | (454,625 | ) | | (26,749 | ) | | (1,611,135 | ) |
| Total Accumulated Gain (Loss) | | $ | 14,422,540 | | $ | 10,723,996 | | $ | (105,236 | ) | $ | (4,288,969 | ) |
| | | | Spin-off | | | | | | | | | | |
| | | | Fund | | | | | | | | | | |
| Net Unrealized Appreciation | | $ | 3,971,944 | | | | | | | | | | |
| Undistributed Ordinary Income | | | — | | | | | | | | | | |
| Undistributed Long-Term | | | | | | | | | | | | | |
| Capital Gains | | | — | | | | | | | | | | |
| Total Distributable Earnings | | $ | — | | | | | | | | | | |
| Other Accumulated Loss | | | (1,600,012 | ) | | | | | | | | | |
| Total Accumulated Gain | | $ | 2,371,932 | | | | | | | | | | |
At December 31, 2018, the Funds had no accumulated net realized capital loss carryforwards that will expire in 2019.
At December 31, 2018, the Global Fund had $137,054 in short-term capital loss carryforwards without expiration and $190,565 in long-term capital loss carryforwards without expiration. The Multi-Disciplinary Income Fund had $6,135 in short-term capital loss carryforwards without expiration and $1,605,000 in long-term capital loss carryforwards without expiration.
| KINETICS MUTUAL FUNDS, INC. — THE FEEDER FUNDS |
| Notes to Financial Statements — (Continued) |
| December 31, 2018 |
For the year ended December 31, 2018, the following Funds utilized capital loss carryforwards:
| | | | Capital Loss |
| | | | Carryforward |
| The Internet Fund | | $ | — | |
| The Global Fund | | | — | |
| The Paradigm Fund | | | 60,551,088 | |
| The Medical Fund | | | — | |
| The Small Cap Opportunities Fund | | | 1,512,633 | |
| The Market Opportunities Fund | | | — | |
| The Alternative Income Fund | | | 31,179 | |
| The Multi-Disciplinary Income Fund | | | — | |
| The Spin-off Fund | | | — | |
For the year ended December 31, 2018, the Paradigm Fund, the Small Cap Opportunities Fund, the Market Opportunities Fund and the Alternative Income Fund had $55,234,994, $6,712,069, $906,590 and $2,172,468 of capital loss carryforwards expire without being utilized.
At December 31, 2018, the following Funds deferred, on a tax basis, post-October losses:
| | | | Late Year | | | Post-October |
| | | | Ordinary | | | Capital Loss |
| | | | Loss Deferral | | | Deferral |
| The Internet Fund | | $ | — | | | $ | — | |
| The Global Fund | | | (480 | ) | | | — | |
| The Paradigm Fund | | | (1,768,802 | ) | | | — | |
| The Medical Fund | | | — | | | | — | |
| The Small Cap Opportunities Fund | | | (3,865,853 | ) | | | (40,662 | ) |
| The Market Opportunities Fund | | | (275,163 | ) | | | (164,377 | ) |
| The Alternative Income Fund | | | — | | | | — | |
| The Multi-Disciplinary Income Fund | | | — | | | | — | |
| The Spin-off Fund | | | (102,987 | ) | | | (1,003,864 | ) |
| KINETICS MUTUAL FUNDS, INC. — THE FEEDER FUNDS |
| Notes to Financial Statements — (Continued) |
| December 31, 2018 |
The tax components of dividends paid during the year ended December 31, 2018 and the year ended December 31, 2017, are:
| | | | The Internet Fund | | | The Global Fund | |
| | | | Ordinary | | | Long-Term | | | Ordinary | | | Long-Term | |
| | | | Income | | | Capital Gains | | | Income | | | Capital Gains | |
| | | | Distribution | | | Distribution | | | Distribution | | | Distribution | |
| 2018 | | $ | 777,455 | | $ | 30,198,679 | | $ | — | | $ | 8,966 | |
| 2017 | | $ | 38,984 | | $ | 26,510,736 | | $ | 209,196 | | $ | 1,098,468 | |
| | | | The Paradigm Fund | | | The Medical Fund | |
| | | | Ordinary | | | Long-Term | | | Ordinary | | | Long-Term | |
| | | | Income | | | Capital Gains | | | Income | | | Capital Gains | |
| | | | Distribution | | | Distribution | | | Distribution | | | Distribution | |
| 2018 | | $ | — | | $ | 63,008,862 | | $ | 176,000 | | $ | 1,265,030 | |
| 2017 | | $ | — | | $ | — | | $ | 172,460 | | $ | 2,595,599 | |
| | | | The Small Cap | | | The Market | |
| | | | Opportunities Fund | | | Opportunities Fund | |
| | | | Ordinary | | | Long-Term | | | Ordinary | | | Long-Term | |
| | | | Income | | | Capital Gains | | | Income | | | Capital Gains | |
| | | | Distribution | | | Distribution | | | Distribution | | | Distribution | |
| 2018 | | $ | — | | $ | — | | $ | 4,281,585 | | $ | 1,894,441 | |
| 2017 | | $ | — | | $ | — | | $ | 460,247 | | $ | — | |
| | | | The Alternative Income Fund | | | The Multi-Disciplinary Income Fund | |
| | | | Ordinary | | | Long-Term | | | Ordinary | | | Long-Term | |
| | | | Income | | | Capital Gains | | | Income | | | Capital Gains | |
| | | | Distribution | | | Distribution | | | Distribution | | | Distribution | |
| 2018 | | $ | 211,236 | | $ | — | | $ | 1,742,121 | | $ | — | |
| 2017 | | $ | 31,226 | | $ | — | | $ | 2,135,411 | | $ | — | |
| | | | The Spin-off Fund | | | | | | | |
| | | | Ordinary | | | Long-Term | | | | | | | |
| | | | Income | | | Capital Gains | | | | | | | |
| | | | Distribution | | | Distribution | | | | | | | |
| 2018 | | $ | 71,090 | | $ | 810,046 | | | | | | | |
| 2017 | | $ | 46,599 | | $ | 919,359 | | | | | | | |
Each Feeder Fund and the Spin-off Fund designated as long-term capital gain dividend, pursuant to Internal Revenue Code Section 852(b)(3), the amount necessary to reduce the earnings and profits of the Feeder Funds and the Spin-off Fund related to net capital gain to zero for the tax year ended December 31, 2018.
| KINETICS MUTUAL FUNDS, INC. — THE FEEDER FUNDS |
| Notes to Financial Statements — (Continued) |
| December 31, 2018 |
6. Securities Transactions, Tax Cost and Significant Investments – The Spin-off Fund
Purchases and sales of investment securities, other than short-term investments and short-term options, for the year ended December 31, 2018, were as follows for the Spin-off Fund:
| | | | Purchases | | | Sales | |
| | | | U.S. Government | | | Other | | | U.S. Government | | | Other | |
| The Spin-off Fund | | | $ — | | | $ 1,831,270 | | | $ — | | | $ 3,320,364 | |
As of December 31, 2018, the cost of investments and unrealized appreciation (depreciation) on investment securities for federal income tax purposes was as follows for the Spin-off Fund:
| | | | The Spin-off | |
| | | | Fund | |
| Tax Cost of Investments | | $ | 14,739,313 | |
| Unrealized Appreciation | | | 7,799,439 | |
| Unrealized Depreciation | | | (3,827,495 | ) |
| Net Unrealized Appreciation | | $ | 3,971,944 | |
Significant Investments
The Spin-off Fund may invest a greater percentage of its assets in one or more individual securities at any time. The greater percentage of assets in individual securities (not including short-term investments or other funds) exposes the portfolio to the risk of unanticipated industry conditions, the risks particular to a single company or security, and the risk of potentially lower liquidity. At December 31, 2018, Spin-off Fund invested approximately 49% of its net assets in individual securities greater than 5% of net assets. Please see the Schedule of Investments for further details.
| KINETICS MUTUAL FUNDS, INC. — THE FEEDER FUNDS |
| Notes to Financial Statements — (Continued) |
| December 31, 2018 |
7. Summary of Fair Value Exposure – Spin-off Fund
Various inputs are used in determining the value of the Spin-off Fund’s investments. These inputs are summarized in the three broad levels listed below:
Level 1 — Unadjusted quoted prices in active markets for identical assets or liabilities that the Spin-off Fund has the ability to access.
Level 2 — Observable inputs other than quoted prices included in Level 1 that are observable for the asset or liability, either directly or indirectly. These inputs may include quoted prices for the identical instrument on an inactive market, prices for similar instruments, interest rates, prepayment speeds, credit risk, yield curves, default rates and similar data.
Level 3 — Unobservable inputs for the asset or liability, to the extent relevant observable inputs are not available, representing the Spin-off Fund’s own assumptions about the assumptions a market participant would use in valuing the asset or liability, and would be based on the best information available.
The availability of observable inputs can vary from security to security and is affected by a wide variety of factors, including, for example, the type of security, whether the security is new and not yet established in the marketplace, the liquidity of markets, and other characteristics particular to the security. To the extent that valuation is based on models or inputs that are less observable or unobservable in the market, the determination of fair value requires more judgment. Accordingly, the degree of judgment exercised in determining fair value is greatest for instruments categorized in Level 3.
The inputs used to measure fair value may fall into different levels of the fair value hierarchy. In such cases, for disclosure purposes, the level in the fair value hierarchy within which the fair value measurement falls in its entirety, is determined based on the lowest level input that is significant to the fair value measurement in its entirety.
| KINETICS MUTUAL FUNDS, INC. — THE FEEDER FUNDS |
| Notes to Financial Statements — (Continued) |
| December 31, 2018 |
The following is a summary of the inputs used to value The Spin-off Fund’s net assets as of December 31, 2018:
| Assets^ | | | Level 1 | | | Level 2 | | | Level 3 | | | Total | |
| Common Stocks | | $ | 17,030,300 | | $ | — | | $ | — | | $ | 17,030,300 | |
| Short-Term Investments | | | 1,102 | | | 1,679,855 | | | — | | | 1,680,957 | |
| Total Investments in Securities | | $ | 17,031,402 | | $ | 1,679,855 | | $ | — | | $ | 18,711,257 | |
As of December 31, 2018, there were no Level 3 securities. During the year ended December 31, 2018, there were no transfers into or out of Level 3.
| ^ | See Schedule of Investments for breakout of investments by industry classification. |
8. Investment Adviser
The Spin-off Fund entered into Investment Advisory Agreements (the “Agreement”) with Kinetics Asset Management LLC (the “Adviser”), with whom certain officers and trustees of the Trust are affiliated, to furnish investment advisory services to the Spin-off Fund. The Adviser is a wholly-owned subsidiary of Horizon Kinetics LLC. Under the terms of the Agreements, the Spin-off Fund compensates the Adviser for its management services at the annual rate of 1.00% of the Spin-off Fund’s average daily net assets. For the year ended December 31, 2018, Spin-off Fund incurred $238,911 in expenses pursuant to the Agreement.
9. Subsequent Events
In preparing these financial statements, management has evaluated Fund related events and transactions for potential recognition or disclosure through the date the financial statements were issued. There were no events or translations that occurred during the year that materially impacted the amounts or disclosures in the Funds’ financial statements.
Effective January 1, 2019, the Market Opportunities Fund has voluntarily agreed to waive fees or pay expenses to reduce the total annual fund operating expenses until May 1, 2022, which may not be terminated without the approval of the Board. These limitations exclude acquired fund fees and expenses (“AFFE”), taxes, brokerage commissions, extraordinary items and
| KINETICS MUTUAL FUNDS, INC. — THE FEEDER FUNDS |
| Notes to Financial Statements — (Continued) |
| December 31, 2018 |
interest. These waivers/reimbursements are subject to recapture. Listed below are the new operating expense limitations based on average daily net assets for each of the classes:
| No Load Class: | | | 1.40 | % |
| Advisor Class A: | | | 1.65 | % |
| Advisor Class C: | | | 2.15 | % |
| Institutional Class: | | | 1.20 | % |
10. Tax Information (Unaudited)
The Internet, Medical, Market Opportunities, and Spin-off Funds designated 18%, 100%, 8% and 100%, respectively, of dividends declared after December 31, 2018, from net investment income as qualified dividend income under the Jobs and Growth Tax Relief Reconciliation Act of 2003.
The Internet, Medical, Market Opportunities, Alternative Income, Multi-Disciplinary Income and Spin-off Funds designated 3%, 12%, 76%, 100%, 100% and 8%, respectively, as ordinary income distributions and 97%, 100%, 100%, 88%, 24% and 92%, respectively, for the Internet, Global, Paradigm, Medical, Market Opportunities and Spin-off Funds as long-term capital gain distribution for the purposes of the dividends paid deduction, which include earnings and profits distributed to shareholders on redemptions of Fund shares.
For corporate shareholders in the Internet, Medical, Market Opportunities and Spin-off Funds, the percentage of ordinary dividend income distributed for the year ended December 31, 2018, which was designated as qualifying for the dividends-received deduction, is 15%, 100%, 4% and 100%, respectively. The Internet, Medical, Market Opportunities, Alternative Income, Multi-Disciplinary Income and Spin-off Funds designated 14%, 1%, 11%, 58%, 72% and 9%, respectively, of their ordinary income distributions for the fiscal year ended December 31, 2018, as interest-related dividends under Internal Revenue Code Section 871(k)(l)(C).
The Internet, Market Opportunities and Spin-off Funds designated 100%, 100% and 100%, respectively, of their ordinary income distributions as short-term capital gain distributions under Internal Revenue Code Section 871(k)(2)(C).
| KINETICS MUTUAL FUNDS, INC. — THE FEEDER FUNDS |
| Notes to Financial Statements — (Continued) |
| December 31, 2018 |
11. Recent Accounting Pronouncements
In August 2018, FASB issued ASU 2018-13, Fair Value Measurement (Topic 820): Disclosure Framework-Changes to the Disclosure Requirements for Fair Value Measurement (“ASU 2018-13”). The primary focus of ASU 2018-13 is to improve the effectiveness of the disclosure requirements for fair value measurements. The changes affect all companies that are required to include fair value measurement disclosures. In general, the amendments in ASU 2018-13 are effective for all entities for fiscal years and interim periods within those fiscal years, beginning after December 15, 2019. An entity is permitted to early adopt the removed or modified disclosures upon the issuance of ASU 2018-13 and may delay adoption of the additional disclosures, which are required for public companies only, until their effective date. Management has chosen to early adopt the eliminated or modified disclosures for the year ended December 31, 2018.
12. Information about Proxy Voting (Unaudited)
Information regarding how the Spin-off Fund, the Feeder Funds and the Master Portfolios vote proxies relating to portfolio securities is available without charge, upon request by calling toll-free at 1-800-930-3828 or by accessing the Company’s website at www.kineticsfunds.com and by accessing the SEC’s website at www.sec.gov. Information regarding how the Spin-off Fund, the Feeder Funds and the Master Portfolios voted proxies relating to portfolio securities during the most recent twelve month period ended June 30, is available without charge, upon request, by calling toll-free at 1-800-930-3828 or by accessing the SEC’s website at www.sec.gov.
13. Information about the Portfolio Holdings (Unaudited)
The Spin-off Fund and Feeder Funds file their complete schedule of portfolio holdings for their first and third fiscal quarters with the SEC on Form N-Q or Part F of Form N-PORT (beginning with filings after March 31, 2019). The Spin-off Fund’s and Feeder Funds’ Form N-Q or Part F of Form N-PORT is available without charge, upon request, by calling toll-free at 1-800-930-3828. Furthermore, you can obtain the Form N-Q or Part F of Form N-PORT on the SEC’s website at www.sec.gov.
| KINETICS MUTUAL FUNDS, INC. — THE FEEDER FUNDS |
| Financial Highlights |
| | | | The Internet Fund | |
| | | | No Load Class | |
| | | | For the | | | For the | | | For the | | | For the | | | For the | |
| | | | Year Ended | | | Year Ended | | | Year Ended | | | Year Ended | | | Year Ended | |
| | | | December 31, | | | December 31, | | | December 31, | | | December 31, | | | December 31, | |
| | | | 2018 | | | 2017 | | | 2016 | | | 2015 | | | 2014 | |
| PER SHARE DATA:(1) | | | | | | | | | | | | | | | | |
| Net Asset Value, Beginning of Year | | $ | 52.18 | | $ | 39.33 | | $ | 41.68 | | $ | 56.08 | | $ | 59.27 | |
| Income from Investment Operations: | | | | | | | | | | | | | | | | |
| Net investment income (loss)(2) | | | (0.48 | ) | | 0.36 | | | (0.68 | ) | | (0.84 | ) | | (0.77 | ) |
| Net realized and unrealized gain (loss) on investments | | | (13.77 | ) | | 22.13 | | | 1.76 | | | (2.21 | ) | | 0.69 | |
| Total from Investment Operations | | | (14.25 | ) | | 22.49 | | | 1.08 | | | (3.05 | ) | | (0.08 | ) |
| Redemption Fees | | | 0.02 | | | 0.00 | (3) | | 0.00 | (3) | | 0.00 | (3) | | 0.01 | |
| Less Distributions: | | | | | | | | | | | | | | | | |
| From net realized gains | | | (10.76 | ) | | (9.64 | ) | | (3.43 | ) | | (11.35 | ) | | (3.12 | ) |
| Total Distributions | | | (10.76 | ) | | (9.64 | ) | | (3.43 | ) | | (11.35 | ) | | (3.12 | ) |
| Net Asset Value, End of Year | | $ | 27.19 | | $ | 52.18 | | $ | 39.33 | | $ | 41.68 | | $ | 56.08 | |
| Total return | | | (27.32 | )% | | 57.43 | % | | 2.59 | % | | (5.42 | )% | | (0.16 | )% |
| | | | | | | | | | | | | | | | | |
| SUPPLEMENTAL DATA AND RATIOS | | | | | | | | | | | | | | | | |
| Net assets, end of year (000’s) | | $ | 102,268 | | $ | 162,120 | | $ | 109,930 | | $ | 122,332 | | $ | 151,200 | |
| Ratio of operating expenses to average net assets:(4) | | | 1.84 | % | | 1.84 | % | | 1.87 | % | | 1.82 | % | | 1.78 | % |
| Ratio of net investment income (loss) to average net assets: | | | (1.05 | )% | | 0.79 | % | | (1.68 | )% | | (1.51 | )% | | (1.34 | )% |
| Portfolio turnover rate(5) | | | 15 | % | | 44 | % | | 2 | % | | 1 | % | | 1 | % |
| (1) | Information presented relates to a share of capital stock outstanding for each year. |
| (2) | Net investment income per share represents net investment income divided by the average shares outstanding throughout the year. |
| (3) | Amount calculated is less than $0.005. |
| (4) | See Note #3, Investment Adviser, for the waiver and expense reimbursement discussion. |
| (5) | Portfolio turnover of The Internet Portfolio. |
The accompanying notes are an integral part of these financial statements.
| KINETICS MUTUAL FUNDS, INC. — THE FEEDER FUNDS |
| Financial Highlights — (Continued) |
| | | | The Internet Fund | |
| | | | Advisor Class A | |
| | | | For the | | | For the | | | For the | | | For the | | | For the | |
| | | | Year Ended | | | Year Ended | | | Year Ended | | | Year Ended | | | Year Ended | |
| | | | December 31, | | | December 31, | | | December 31, | | | December 31, | | | December 31, | |
| | | | 2018 | | | 2017 | | | 2016 | | | 2015 | | | 2014 | |
| PER SHARE DATA:(1) | | | | | | | | | | | | | | | | |
| Net Asset Value, Beginning of Year | | $ | 49.27 | | $ | 37.57 | | $ | 40.07 | | $ | 54.51 | | $ | 57.84 | |
| Income from Investment Operations: | | | | | | | | | | | | | | | | |
| Net investment income (loss)(2) | | | (0.57 | ) | | 0.24 | | | (0.75 | ) | | (0.95 | ) | | (0.89 | ) |
| Net realized and unrealized gain (loss) on investments | | | (12.97 | ) | | 21.09 | | | 1.68 | | | (2.14 | ) | | 0.68 | |
| Total from Investment Operations | | | (13.54 | ) | | 21.33 | | | 0.93 | | | (3.09 | ) | | (0.21 | ) |
| Redemption Fees | | | 0.03 | | | 0.01 | | | — | | | — | | | 0.00 | (3) |
| Less Distributions: | | | | | | | | | | | | | | | | |
| From net realized gains | | | (10.76 | ) | | (9.64 | ) | | (3.43 | ) | | (11.35 | ) | | (3.12 | ) |
| Total Distributions | | | (10.76 | ) | | (9.64 | ) | | (3.43 | ) | | (11.35 | ) | | (3.12 | ) |
| Net Asset Value, End of Year | | $ | 25.00 | | $ | 49.27 | | $ | 37.57 | | $ | 40.07 | | $ | 54.51 | |
| Total return(4) | | | (27.47 | )% | | 57.06 | % | | 2.32 | % | | (5.65 | )% | | (0.41 | )% |
| | | | | | | | | | | | | | | | | |
| SUPPLEMENTAL DATA AND RATIOS | | | | | | | | | | | | | | | | |
| Net assets, end of year (000’s) | | $ | 2,481 | | $ | 4,185 | | $ | 1,923 | | $ | 2,978 | | $ | 5,143 | |
| Ratio of operating expenses to average net assets:(5) | | | 2.09 | % | | 2.09 | % | | 2.12 | % | | 2.07 | % | | 2.03 | % |
| Ratio of net investment income (loss) to average net assets: | | | (1.30 | )% | | 0.54 | % | | (1.93 | )% | | (1.76 | )% | | (1.59 | )% |
| Portfolio turnover rate(6) | | | 15 | % | | 44 | % | | 2 | % | | 1 | % | | 1 | % |
| (1) | Information presented relates to a share of capital stock outstanding for each year. |
| (2) | Net investment income per share represents net investment income divided by the average shares outstanding throughout the year. |
| (3) | Amount calculated is less than $0.005. |
| (4) | The total return calculation does not reflect the 5.75% front end sales charge on Advisor Class A shares. |
| (5) | See Note #3, Investment Adviser, for the waiver and expense reimbursement discussion. |
| (6) | Portfolio turnover of The Internet Portfolio. |
The accompanying notes are an integral part of these financial statements.
| KINETICS MUTUAL FUNDS, INC. — THE FEEDER FUNDS |
| Financial Highlights — (Continued) |
| | | | The Internet Fund | |
| | | | Advisor Class C | |
| | | | For the | | | For the | | | For the | | | For the | | | For the | |
| | | | Year Ended | | | Year Ended | | | Year Ended | | | Year Ended | | | Year Ended | |
| | | | December 31, | | | December 31, | | | December 31, | | | December 31, | | | December 31, | |
| | | | 2018 | | | 2017 | | | 2016 | | | 2015 | | | 2014 | |
| PER SHARE DATA:(1) | | | | | | | | | | | | | | | | |
| Net Asset Value, Beginning of Year | | $ | 44.24 | | $ | 34.52 | | $ | 37.27 | | $ | 51.81 | | $ | 55.38 | |
| Income from Investment Operations: | | | | | | | | | | | | | | | | |
| Net investment income (loss)(2) | | | (0.70 | ) | | 0.02 | | | (0.88 | ) | | (1.15 | ) | | (1.11 | ) |
| Net realized and unrealized gain (loss) on investments | | | (11.61 | ) | | 19.30 | | | 1.56 | | | (2.04 | ) | | 0.64 | |
| Total from Investment Operations | | | (12.31 | ) | | 19.32 | | | 0.68 | | | (3.19 | ) | | (0.47 | ) |
| Redemption Fees | | | 0.01 | | | 0.04 | | | — | | | — | | | 0.02 | |
| Less Distributions: | | | | | | | | | | | | | | | | |
| From net realized gains | | | (10.76 | ) | | (9.64 | ) | | (3.43 | ) | | (11.35 | ) | | (3.12 | ) |
| Total Distributions | | | (10.76 | ) | | (9.64 | ) | | (3.43 | ) | | (11.35 | ) | | (3.12 | ) |
| Net Asset Value, End of Year | | $ | 21.18 | | $ | 44.24 | | $ | 34.52 | | $ | 37.27 | | $ | 51.81 | |
| Total return | | | (27.86 | )% | | 56.36 | % | | 1.83 | % | | (6.14 | )% | | (0.86 | )% |
| | | | | | | | | | | | | | | | | |
| SUPPLEMENTAL DATA AND RATIOS | | | | | | | | | | | | | | | | |
| Net assets, end of year (000’s) | | $ | 1,065 | | $ | 1,847 | | $ | 704 | | $ | 848 | | $ | 1,105 | |
| Ratio of operating expenses to average net assets:(3) | | | 2.59 | % | | 2.59 | % | | 2.62 | % | | 2.57 | % | | 2.53 | % |
| Ratio of net investment income (loss) to average net assets: | | | (1.80 | )% | | 0.04 | % | | (2.43 | )% | | (2.26 | )% | | (2.09 | )% |
| Portfolio turnover rate(4) | | | 15 | % | | 44 | % | | 2 | % | | 1 | % | | 1 | % |
| (1) | Information presented relates to a share of capital stock outstanding for each year. |
| (2) | Net investment income per share represents net investment income divided by the average shares outstanding throughout the year. |
| (3) | See Note #3, Investment Adviser, for the waiver and expense reimbursement discussion. |
| (4) | Portfolio turnover of The Internet Portfolio. |
The accompanying notes are an integral part of these financial statements.
| KINETICS MUTUAL FUNDS, INC. — THE FEEDER FUNDS |
| Financial Highlights — (Continued) |
| | | | The Global Fund | |
| | | | No Load Class | |
| | | | For the | | | For the | | | For the | | | For the | | | For the | |
| | | | Year Ended | | | Year Ended | | | Year Ended | | | Year Ended | | | Year Ended | |
| | | | December 31, | | | December 31, | | | December 31, | | | December 31, | | | December 31, | |
| | | | 2018 | | | 2017 | | | 2016 | | | 2015 | | | 2014 | |
| PER SHARE DATA:(1) | | | | | | | | | | | | | | | | |
| Net Asset Value, Beginning of Year | | $ | 7.15 | | $ | 5.23 | | $ | 4.59 | | $ | 5.33 | | $ | 6.05 | |
| Income from Investment Operations: | | | | | | | | | | | | | | | | |
| Net investment income (loss)(2) | | | (0.02 | ) | | 0.10 | | | (0.01 | ) | | (0.02 | ) | | (0.02 | ) |
| Net realized and unrealized gain (loss) on investments | | | (1.67 | ) | | 2.47 | | | 0.67 | | | (0.72 | ) | | (0.70 | ) |
| Total from Investment Operations | | | (1.69 | ) | | 2.57 | | | 0.66 | | | (0.74 | ) | | (0.72 | ) |
| Redemption Fees(3) | | | 0.00 | | | 0.00 | | | 0.00 | | | 0.00 | | | 0.00 | |
| Less Distributions: | | | | | | | | | | | | | | | | |
| From net investment income | | | — | | | (0.10 | ) | | — | | | — | | | — | |
| From net realized gains | | | (0.00 | )(3) | | (0.55 | ) | | (0.02 | ) | | (0.00 | )(3) | | (0.00 | )(3) |
| Total Distributions | | | (0.00 | )(3) | | (0.65 | ) | | (0.02 | ) | | (0.00 | )(3) | | (0.00 | )(3) |
| Net Asset Value, End of Year | | $ | 5.46 | | $ | 7.15 | | $ | 5.23 | | $ | 4.59 | | $ | 5.33 | |
| Total return | | | (23.58 | )% | | 49.20 | % | | 14.40 | % | | (13.83 | )% | | (11.89 | )% |
| | | | | | | | | | | | | | | | | |
| SUPPLEMENTAL DATA AND RATIOS | | | | | | | | | | | | | | | | |
| Net assets, end of year (000’s) | | $ | 5,665 | | $ | 8,577 | | $ | 5,316 | | $ | 4,745 | | $ | 6,771 | |
| Ratio of operating expenses to average net assets: | | | | | | | | | | | | | | | | |
| Before expense reimbursement | | | 2.53 | % | | 3.07 | %(6) | | 3.04 | % | | 2.87 | % | | 2.61 | % |
| After expense reimbursement(4) | | | 1.39 | % | | 1.76 | %(6) | | 1.39 | % | | 1.39 | % | | 1.39 | % |
| Ratio of net investment income (loss) to average net assets: | | | (0.30 | )% | | 1.69 | % | | (0.17 | )% | | (0.29 | )% | | (0.32 | )% |
| Portfolio turnover rate(5) | | | 28 | % | | 169 | % | | 11 | % | | 16 | % | | 14 | % |
| (1) | Information presented relates to a share of capital stock outstanding for each year. |
| (2) | Net investment income per share represents net investment income divided by the average shares outstanding throughout the year. |
| (3) | Amount calculated is less than $0.005. |
| (4) | See Note #3, Investment Adviser, for the waiver and expense reimbursement discussion. |
| (5) | Portfolio turnover of The Global Portfolio. |
| (6) | The ratio of expenses includes a tax expense. The expense ratio excluding the tax expense was 2.69% before expense reimbursement and 1.39% after expense reimbursement. |
The accompanying notes are an integral part of these financial statements.
| KINETICS MUTUAL FUNDS, INC. — THE FEEDER FUNDS |
| Financial Highlights — (Continued) |
| | | | The Global Fund | |
| | | | Advisor Class A | |
| | | | For the | | | For the | | | For the | | | For the | | | For the | |
| | | | Year Ended | | | Year Ended | | | Year Ended | | | Year Ended | | | Year Ended | |
| | | | December 31, | | | December 31, | | | December 31, | | | December 31, | | | December 31, | |
| | | | 2018 | | | 2017 | | | 2016 | | | 2015 | | | 2014 | |
| PER SHARE DATA:(1) | | | | | | | | | | | | | | | | |
| Net Asset Value, Beginning of Year | | $ | 7.15 | | $ | 5.19 | | $ | 4.57 | | $ | 5.31 | | $ | 6.03 | |
| Income from Investment Operations: | | | | | | | | | | | | | | | | |
| Net investment income (loss)(2) | | | (0.04 | ) | | 0.09 | | | (0.02 | ) | | (0.03 | ) | | (0.03 | ) |
| Net realized and unrealized gain (loss) on investments | | | (1.66 | ) | | 2.45 | | | 0.66 | | | (0.71 | ) | | (0.70 | ) |
| Total from Investment Operations | | | (1.70 | ) | | 2.54 | | | 0.64 | | | (0.74 | ) | | (0.73 | ) |
| Redemption Fees | | | 0.00 | (3) | | 0.06 | | | 0.00 | (3) | | — | | | 0.01 | |
| Less Distributions: | | | | | | | | | | | | | | | | |
| From net investment income | | | — | | | (0.09 | ) | | — | | | — | | | — | |
| From net realized gains | | | (0.00 | )(3) | | (0.55 | ) | | (0.02 | ) | | (0.00 | )(3) | | (0.00 | )(3) |
| Total Distributions | | | (0.00 | )(3) | | (0.64 | ) | | (0.02 | ) | | (0.00 | )(3) | | (0.00 | )(3) |
| Net Asset Value, End of Year | | $ | 5.45 | | $ | 7.15 | | $ | 5.19 | | $ | 4.57 | | $ | 5.31 | |
| Total return(4) | | | (23.72 | )% | | 50.29 | % | | 14.03 | % | | (13.89 | )% | | (11.93 | )% |
| | | | | | | | | | | | | | | | | |
| SUPPLEMENTAL DATA AND RATIOS | | | | | | | | | | | | | | | | |
| Net assets, end of year (000’s) | | $ | 1,012 | | $ | 1,523 | | $ | 309 | | $ | 376 | | $ | 497 | |
| Ratio of operating expenses to average net assets: | | | | | | | | | | | | | | | | |
| Before expense reimbursement | | | 2.78 | % | | 3.32 | %(7) | | 3.29 | % | | 3.12 | % | | 2.86 | % |
| After expense reimbursement(5) | | | 1.64 | % | | 2.01 | %(7) | | 1.64 | % | | 1.64 | % | | 1.64 | % |
| Ratio of net investment income (loss) to average net assets: | | | (0.55 | )% | | 1.44 | % | | (0.42 | )% | | (0.54 | )% | | (0.57 | )% |
| Portfolio turnover rate(6) | | | 28 | % | | 169 | % | | 11 | % | | 16 | % | | 14 | % |
| (1) | Information presented relates to a share of capital stock outstanding for each year. |
| (2) | Net investment income per share represents net investment income divided by the average shares outstanding throughout the year. |
| (3) | Amount calculated is less than $0.005. |
| (4) | The total return calculation does not reflect the 5.75% front end sales charge on Advisor class A shares. |
| (5) | See Note #3, Investment Adviser, for the waiver and expense reimbursement discussion. |
| (6) | Portfolio turnover of The Global Portfolio. |
| (7) | The ratio of expenses includes a tax expense. The expense ratio excluding the tax expense was 2.94% before expense reimbursement and 1.64% after expense reimbursement. |
The accompanying notes are an integral part of these financial statements.
| KINETICS MUTUAL FUNDS, INC. — THE FEEDER FUNDS |
| Financial Highlights — (Continued) |
| | | | The Global Fund | |
| | | | Advisor Class C | |
| | | | For the | | | For the | | | For the | | | For the | | | For the | |
| | | | Year Ended | | | Year Ended | | | Year Ended | | | Year Ended | | | Year Ended | |
| | | | December 31, | | | December 31, | | | December 31, | | | December 31, | | | December 31, | |
| | | | 2018 | | | 2017 | | | 2016 | | | 2015 | | | 2014 | |
| PER SHARE DATA:(1) | | | | | | | | | | | | | | | | |
| Net Asset Value, Beginning of Year | | $ | 6.76 | | $ | 4.99 | | $ | 4.41 | | $ | 5.16 | | $ | 5.90 | |
| Income from Investment Operations: | | | | | | | | | | | | | | | | |
| Net investment income (loss)(2) | | | (0.07 | ) | | 0.05 | | | (0.04 | ) | | (0.05 | ) | | (0.06 | ) |
| Net realized and unrealized gain (loss) on investments | | | (1.57 | ) | | 2.34 | | | 0.64 | | | (0.70 | ) | | (0.68 | ) |
| Total from Investment Operations | | | (1.64 | ) | | 2.39 | | | 0.60 | | | (0.75 | ) | | (0.74 | ) |
| Redemption Fees | | | — | | | — | | | — | | | — | | | 0.00 | (3) |
| Less Distributions: | | | | | | | | | | | | | | | | |
| From net investment income | | | — | | | (0.07 | ) | | — | | | — | | | — | |
| From net realized gains | | | (0.00 | )(3) | | (0.55 | ) | | (0.02 | ) | | (0.00 | )(3) | | (0.00 | )(3) |
| Total Distributions | | | (0.00 | )(3) | | (0.62 | ) | | (0.02 | ) | | (0.00 | )(3) | | (0.00 | )(3) |
| Net Asset Value, End of Year | | $ | 5.12 | | $ | 6.76 | | $ | 4.99 | | $ | 4.41 | | $ | 5.16 | |
| Total return | | | (24.20 | )% | | 48.02 | % | | 13.63 | % | | (14.48 | )% | | (12.53 | )% |
| | | | | | | | | | | | | | | | | |
| SUPPLEMENTAL DATA AND RATIOS | | | | | | | | | | | | | | | | |
| Net assets, end of year (000’s) | | $ | 4,284 | | $ | 5,542 | | $ | 1,920 | | $ | 1,614 | | $ | 1,608 | |
| Ratio of operating expenses to average net assets: | | | | | | | | | | | | | | | | |
| Before expense reimbursement | | | 3.28 | % | | 3.82 | %(6) | | 3.79 | % | | 3.62 | % | | 3.36 | % |
| After expense reimbursement(4) | | | 2.14 | % | | 2.51 | %(6) | | 2.14 | % | | 2.14 | % | | 2.14 | % |
| Ratio of net investment income (loss) to average net assets: | | | (1.05 | )% | | 0.94 | % | | (0.92 | )% | | (1.04 | )% | | (1.07 | )% |
| Portfolio turnover rate(5) | | | 28 | % | | 169 | % | | 11 | % | | 16 | % | | 14 | % |
| (1) | Information presented relates to a share of capital stock outstanding for each year. |
| (2) | Net investment income per share represents net investment income divided by the average shares outstanding throughout the year. |
| (3) | Amount calculated is less than $0.005. |
| (4) | See Note #3, Investment Adviser, for the waiver and expense reimbursement discussion. |
| (5) | Portfolio turnover of The Global Portfolio. |
| (6) | The ratio of expenses includes a tax expense. The expense ratio excluding the tax expense was 3.44% before expense reimbursement and 2.14% after expense reimbursement. |
The accompanying notes are an integral part of these financial statements.
| KINETICS MUTUAL FUNDS, INC. — THE FEEDER FUNDS |
| Financial Highlights — (Continued) |
| | | | The Paradigm Fund | |
| | | | No Load Class | |
| | | | For the | | | For the | | | For the | | | For the | | | For the | |
| | | | Year Ended | | | Year Ended | | | Year Ended | | | Year Ended | | | Year Ended | |
| | | | December 31, | | | December 31, | | | December 31, | | | December 31, | | | December 31, | |
| | | | 2018 | | | 2017 | | | 2016 | | | 2015 | | | 2014 | |
| PER SHARE DATA:(1) | | | | | | | | | | | | | | | | |
| Net Asset Value, Beginning of Year | | $ | 48.32 | | $ | 37.63 | | $ | 31.24 | | $ | 34.08 | | $ | 34.35 | |
| Income from Investment Operations: | | | | | | | | | | | | | | | | |
| Net investment loss(2) | | | (0.50 | ) | | (0.34 | ) | | (0.36 | ) | | (0.32 | ) | | (0.36 | ) |
| Net realized and unrealized gain (loss) on investments | | | (2.20 | ) | | 11.03 | | | 6.75 | | | (2.52 | ) | | 0.09 | |
| Total from Investment Operations | | | (2.70 | ) | | 10.69 | | | 6.39 | | | (2.84 | ) | | (0.27 | ) |
| Redemption Fees | | | 0.01 | | | 0.00 | (3) | | 0.00 | (3) | | 0.00 | (3) | | 0.00 | (3) |
| Less Distributions: | | | | | | | | | | | | | | | | |
| From net realized gains | | | (4.31 | ) | | — | | | — | | | — | | | — | |
| Total Distributions | | | (4.31 | ) | | — | | | — | | | — | | | — | |
| Net Asset Value, End of Year | | $ | 41.32 | | $ | 48.32 | | $ | 37.63 | | $ | 31.24 | | $ | 34.08 | |
| Total return | | | (5.55 | )% | | 28.41 | % | | 20.45 | % | | (8.33 | )% | | (0.79 | )% |
| | | | | | | | | | | | | | | | | |
| SUPPLEMENTAL DATA AND RATIOS | | | | | | | | | | | | | | | | |
| Net assets, end of year (000’s) | | $ | 297,990 | | $ | 339,189 | | $ | 336,837 | | $ | 292,014 | | $ | 521,738 | |
| Ratio of operating expenses to average net assets: | | | | | | | | | | | | | | | | |
| Before expense reimbursement | | | 1.73 | % | | 1.74 | % | | 1.75 | % | | 1.71 | % | | 1.68 | % |
| After expense reimbursement(4) | | | 1.64 | % | | 1.64 | % | | 1.64 | % | | 1.64 | % | | 1.64 | % |
| Ratio of net investment loss to average net assets: | | | (0.93 | )% | | (0.82 | )% | | (1.11 | )% | | (0.92 | )% | | (1.02 | )% |
| Portfolio turnover rate(5) | | | 3 | % | | 14 | % | | 2 | % | | 2 | % | | 7 | % |
| (1) | Information presented relates to a share of capital stock outstanding for each year. |
| (2) | Net investment income per share represents net investment income divided by the average shares outstanding throughout the year. |
| (3) | Amount calculated is less than $0.005. |
| (4) | See Note #3, Investment Adviser, for the waiver and expense reimbursement discussion. |
| (5) | Portfolio turnover of The Paradigm Portfolio. |
The accompanying notes are an integral part of these financial statements.
| KINETICS MUTUAL FUNDS, INC. — THE FEEDER FUNDS |
| Financial Highlights — (Continued) |
| | | | The Paradigm Fund | |
| | | | Advisor Class A | |
| | | | For the | | | For the | | | For the | | | For the | | | For the | |
| | | | Year Ended | | | Year Ended | | | Year Ended | | | Year Ended | | | Year Ended | |
| | | | December 31, | | | December 31, | | | December 31, | | | December 31, | | | December 31, | |
| | | | 2018 | | | 2017 | | | 2016 | | | 2015 | | | 2014 | |
| PER SHARE DATA:(1) | | | | | | | | | | | | | | | | |
| Net Asset Value, Beginning of Year | | $ | 46.99 | | $ | 36.69 | | $ | 30.53 | | $ | 33.39 | | $ | 33.74 | |
| Income from Investment Operations: | | | | | | | | | | | | | | | | |
| Net investment loss(2) | | | (0.61 | ) | | (0.43 | ) | | (0.43 | ) | | (0.39 | ) | | (0.43 | ) |
| Net realized and unrealized gain (loss) on investments | | | (2.12 | ) | | 10.73 | | | 6.59 | | | (2.47 | ) | | 0.08 | |
| Total from Investment Operations | | | (2.73 | ) | | 10.30 | | | 6.16 | | | (2.86 | ) | | (0.35 | ) |
| Redemption Fees(3) | | | 0.00 | | | 0.00 | | | 0.00 | | | 0.00 | | | 0.00 | |
| Less Distributions: | | | | | | | | | | | | | | | | |
| From net realized gains | | | (4.31 | ) | | — | | | — | | | — | | | — | |
| Total Distributions | | | (4.31 | ) | | — | | | — | | | — | | | — | |
| Net Asset Value, End of Year | | $ | 39.95 | | $ | 46.99 | | $ | 36.69 | | $ | 30.53 | | $ | 33.39 | |
| Total return(4) | | | (5.79 | )% | | 28.07 | % | | 20.18 | % | | (8.57 | )% | | (1.04 | )% |
| | | | | | | | | | | | | | | | | |
| SUPPLEMENTAL DATA AND RATIOS | | | | | | | | | | | | | | | | |
| Net assets, end of year (000’s) | | $ | 95,503 | | $ | 108,029 | | $ | 103,921 | | $ | 129,707 | | $ | 171,958 | |
| Ratio of operating expenses to average net assets: | | | | | | | | | | | | | | | | |
| Before expense reimbursement | | | 1.98 | % | | 1.99 | % | | 2.00 | % | | 1.96 | % | | 1.93 | % |
| After expense reimbursement(5) | | | 1.89 | % | | 1.89 | % | | 1.89 | % | | 1.89 | % | | 1.89 | % |
| Ratio of net investment loss to average net assets: | | | (1.18 | )% | | (1.07 | )% | | (1.36 | )% | | (1.17 | )% | | (1.27 | )% |
| Portfolio turnover rate(6) | | | 3 | % | | 14 | % | | 2 | % | | 2 | % | | 7 | % |
| (1) | Information presented relates to a share of capital stock outstanding for each year. |
| (2) | Net investment income per share represents net investment income divided by the average shares outstanding throughout the year. |
| (3) | Amount calculated is less than $0.005. |
| (4) | The total return calculation does not reflect the 5.75% front end sales charge on Advisor Class A shares. |
| (5) | See Note #3, Investment Adviser, for the waiver and expense reimbursement discussion. |
| (6) | Portfolio turnover of The Paradigm Portfolio. |
The accompanying notes are an integral part of these financial statements.
| KINETICS MUTUAL FUNDS, INC. — THE FEEDER FUNDS |
| Financial Highlights — (Continued) |
| | | | The Paradigm Fund | |
| | | | Advisor Class C | |
| | | | For the | | | For the | | | For the | | | For the | | | For the | |
| | | | Year Ended | | | Year Ended | | | Year Ended | | | Year Ended | | | Year Ended | |
| | | | December 31, | | | December 31, | | | December 31, | | | December 31, | | | December 31, | |
| | | | 2018 | | | 2017 | | | 2016 | | | 2015 | | | 2014 | |
| PER SHARE DATA:(1) | | | | | | | | | | | | | | | | |
| Net Asset Value, Beginning of Year | | $ | 44.21 | | $ | 34.68 | | $ | 29.01 | | $ | 31.88 | | $ | 32.38 | |
| Income from Investment Operations: | | | | | | | | | | | | | | | | |
| Net investment loss(2) | | | (0.81 | ) | | (0.60 | ) | | (0.56 | ) | | (0.53 | ) | | (0.58 | ) |
| Net realized and unrealized gain (loss) on investments | | | (1.97 | ) | | 10.13 | | | 6.23 | | | (2.34 | ) | | 0.08 | |
| Total from Investment Operations | | | (2.78 | ) | | 9.53 | | | 5.67 | | | (2.87 | ) | | (0.50 | ) |
| Redemption Fees(3) | | | 0.00 | | | 0.00 | | | 0.00 | | | 0.00 | | | 0.00 | |
| Less Distributions: | | | | | | | | | | | | | | | | |
| From net realized gains | | | (4.31 | ) | | — | | | — | | | — | | | — | |
| Total Distributions | | | (4.31 | ) | | — | | | — | | | — | | | — | |
| Net Asset Value, End of Year | | $ | 37.12 | | $ | 44.21 | | $ | 34.68 | | $ | 29.01 | | $ | 31.88 | |
| Total return | | | (6.27 | )% | | 27.48 | % | | 19.55 | % | | (9.00 | )% | | (1.54 | )% |
| | | | | | | | | | | | | | | | | |
| SUPPLEMENTAL DATA AND RATIOS | | | | | | | | | | | | | | | | |
| Net assets, end of year (000’s) | | $ | 100,718 | | $ | 118,924 | | $ | 111,973 | | $ | 114,008 | | $ | 135,333 | |
| Ratio of operating expenses to average net assets: | | | | | | | | | | | | | | | | |
| Before expense reimbursement | | | 2.48 | % | | 2.49 | % | | 2.50 | % | | 2.46 | % | | 2.43 | % |
| After expense reimbursement(4) | | | 2.39 | % | | 2.39 | % | | 2.39 | % | | 2.39 | % | | 2.39 | % |
| Ratio of net investment loss to average net assets: | | | (1.68 | )% | | (1.57 | )% | | (1.86 | )% | | (1.67 | )% | | (1.77 | )% |
| Portfolio turnover rate(5) | | | 3 | % | | 14 | % | | 2 | % | | 2 | % | | 7 | % |
| (1) | Information presented relates to a share of capital stock outstanding for each year. |
| (2) | Net investment income per share represents net investment income divided by the average shares outstanding throughout the year. |
| (3) | Amount calculated is less than $0.005. |
| (4) | See Note #3, Investment Adviser, for the waiver and expense reimbursement discussion. |
| (5) | Portfolio turnover of The Paradigm Portfolio. |
The accompanying notes are an integral part of these financial statements.
| KINETICS MUTUAL FUNDS, INC. — THE FEEDER FUNDS |
| Financial Highlights — (Continued) |
| | | | The Paradigm Fund | |
| | | | Institutional Class | |
| | | | For the | | | For the | | | For the | | | For the | | | For the | |
| | | | Year Ended | | | Year Ended | | | Year Ended | | | Year Ended | | | Year Ended | |
| | | | December 31, | | | December 31, | | | December 31, | | | December 31, | | | December 31, | |
| | | | 2018 | | | 2017 | | | 2016 | | | 2015 | | | 2014 | |
| PER SHARE DATA:(1) | | | | | | | | | | | | | | | | |
| Net Asset Value, Beginning of Year | | $ | 48.62 | | $ | 37.79 | | $ | 31.30 | | $ | 34.08 | | $ | 34.28 | |
| Income from Investment Operations: | | | | | | | | | | | | | | | | |
| Net investment loss(2) | | | (0.39 | ) | | (0.26 | ) | | (0.30 | ) | | (0.25 | ) | | (0.29 | ) |
| Net realized and unrealized gain (loss) on investments | | | (2.23 | ) | | 11.09 | | | 6.79 | | | (2.53 | ) | | 0.09 | |
| Total from Investment Operations | | | (2.62 | ) | | 10.83 | | | 6.49 | | | (2.78 | ) | | (0.20 | ) |
| Redemption Fees(3) | | | 0.00 | | | 0.00 | | | 0.00 | | | 0.00 | | | 0.00 | |
| Less Distributions: | | | | | | | | | | | | | | | | |
| From net realized gains | | | (4.31 | ) | | — | | | — | | | — | | | — | |
| Total Distributions | | | (4.31 | ) | | — | | | — | | | — | | | — | |
| Net Asset Value, End of Year | | $ | 41.69 | | $ | 48.62 | | $ | 37.79 | | $ | 31.30 | | $ | 34.08 | |
| Total return | | | (5.37 | )% | | 28.66 | % | | 20.73 | % | | (8.16 | )% | | (0.61 | )% |
| | | | | | | | | | | | | | | | | |
| SUPPLEMENTAL DATA AND RATIOS | | | | | | | | | | | | | | | | |
| Net assets, end of year (000’s) | | $ | 148,968 | | $ | 208,692 | | $ | 270,880 | | $ | 302,130 | | $ | 346,273 | |
| Ratio of operating expenses to average net assets: | | | | | | | | | | | | | | | | |
| Before expense reimbursement | | | 1.68 | % | | 1.69 | % | | 1.70 | % | | 1.66 | % | | 1.63 | % |
| After expense reimbursement(4) | | | 1.44 | % | | 1.44 | % | | 1.44 | % | | 1.44 | % | | 1.44 | % |
| Ratio of net investment loss to average net assets: | | | (0.73 | )% | | (0.62 | )% | | (0.91 | )% | | (0.72 | )% | | (0.82 | )% |
| Portfolio turnover rate(5) | | | 3 | % | | 14 | % | | 2 | % | | 2 | % | | 7 | % |
| (1) | Information presented relates to a share of capital stock outstanding for each year. |
| (2) | Net investment income per share represents net investment income divided by the average shares outstanding throughout the year. |
| (3) | Amount calculated is less than $0.005. |
| (4) | See Note #3, Investment Adviser, for the waiver and expense reimbursement discussion. |
| (5) | Portfolio turnover of The Paradigm Portfolio. |
The accompanying notes are an integral part of these financial statements.
| KINETICS MUTUAL FUNDS, INC. — THE FEEDER FUNDS |
| Financial Highlights — (Continued) |
| | | | The Medical Fund | |
| | | | No Load Class | |
| | | | For the | | | For the | | | For the | | | For the | | | For the | |
| | | | Year Ended | | | Year Ended | | | Year Ended | | | Year Ended | | | Year Ended | |
| | | | December 31, | | | December 31, | | | December 31, | | | December 31, | | | December 31, | |
| | | | 2018 | | | 2017 | | | 2016 | | | 2015 | | | 2014 | |
| PER SHARE DATA:(1) | | | | | | | | | | | | | | | | |
| Net Asset Value, Beginning of Year | | $ | 25.33 | | $ | 26.62 | | $ | 30.62 | | $ | 30.67 | | $ | 26.38 | |
| Income from Investment Operations: | | | | | | | | | | | | | | | | |
| Net investment income(2) | | | 0.27 | | | 0.24 | | | 0.19 | | | 0.08 | | | 0.13 | |
| Net realized and unrealized gain (loss) on investments | | | 0.12 | | | 2.63 | | | (2.64 | ) | | 1.96 | | | 4.21 | |
| Total from Investment Operations | | | 0.39 | | | 2.87 | | | (2.45 | ) | | 2.04 | | | 4.34 | |
| Redemption Fees(3) | | | 0.00 | | | 0.00 | | | 0.00 | | | 0.00 | | | 0.00 | |
| Less Distributions: | | | | | | | | | | | | | | | | |
| From net investment income | | | (0.29 | ) | | (0.26 | ) | | (0.22 | ) | | (0.12 | ) | | — | |
| From net realized gains | | | (1.96 | ) | | (3.90 | ) | | (1.33 | ) | | (1.97 | ) | | (0.05 | ) |
| Total Distributions | | | (2.25 | ) | | (4.16 | ) | | (1.55 | ) | | (2.09 | ) | | (0.05 | ) |
| Net Asset Value, End of Year | | $ | 23.47 | | $ | 25.33 | | $ | 26.62 | | $ | 30.62 | | $ | 30.67 | |
| Total return | | | 1.67 | % | | 10.71 | % | | (8.01 | )% | | 6.59 | % | | 16.44 | % |
| | | | | | | | | | | | | | | | | |
| SUPPLEMENTAL DATA AND RATIOS | | | | | | | | | | | | | | | | |
| Net assets, end of year (000’s) | | $ | 14,814 | | $ | 16,060 | | $ | 17,560 | | $ | 22,257 | | $ | 21,876 | |
| Ratio of operating expenses to average net assets: | | | | | | | | | | | | | | | | |
| Before expense reimbursement | | | 2.23 | % | | 2.15 | % | | 2.08 | % | | 1.99 | % | | 2.02 | % |
| After expense reimbursement(4) | | | 1.39 | % | | 1.39 | % | | 1.39 | % | | 1.39 | % | | 1.39 | % |
| Ratio of net investment income to average net assets: | | | 1.03 | % | | 0.86 | % | | 0.69 | % | | 0.25 | % | | 0.46 | % |
| Portfolio turnover rate(5) | | | 0 | % | | 0 | % | | 0 | % | | 12 | % | | 3 | % |
| (1) | Information presented relates to a share of capital stock outstanding for each year. |
| (2) | Net investment income per share represents net investment income divided by the average shares outstanding throughout the year. |
| (3) | Amount calculated is less than $0.005. |
| (4) | See Note #3, Investment Adviser, for the waiver and expense reimbursement discussion. |
| (5) | Portfolio turnover of The Medical Portfolio. |
The accompanying notes are an integral part of these financial statements.
| KINETICS MUTUAL FUNDS, INC. — THE FEEDER FUNDS |
| Financial Highlights — (Continued) |
| | | | The Medical Fund | |
| | | | Advisor Class A | |
| | | | For the | | | For the | | | For the | | | For the | | | For the | |
| | | | Year Ended | | | Year Ended | | | Year Ended | | | Year Ended | | | Year Ended | |
| | | | December 31, | | | December 31, | | | December 31, | | | December 31, | | | December 31, | |
| | | | 2018 | | | 2017 | | | 2016 | | | 2015 | | | 2014 | |
| PER SHARE DATA:(1) | | | | | | | | | | | | | | | | |
| Net Asset Value, Beginning of Year | | $ | 24.33 | | $ | 25.71 | | $ | 29.57 | | $ | 29.71 | | $ | 25.62 | |
| Income from Investment Operations: | | | | | | | | | | | | | | | | |
| Net investment income(2) | | | 0.19 | | | 0.17 | | | 0.12 | | | 0.00(3 | ) | | 0.06 | |
| Net realized and unrealized gain (loss) on investments | | | 0.11 | | | 2.53 | | | (2.55 | ) | | 1.90 | | | 4.08 | |
| Total from Investment Operations | | | 0.30 | | | 2.70 | | | (2.43 | ) | | 1.90 | | | 4.14 | |
| Redemption Fees | | | — | | | 0.00 | (3) | | 0.00 | (3) | | 0.00 | (3) | | 0.00 | (3) |
| Less Distributions: | | | | | | | | | | | | | | | | |
| From net investment income | | | (0.17 | ) | | (0.18 | ) | | (0.10 | ) | | (0.07 | ) | | — | |
| From net realized gains | | | (1.96 | ) | | (3.90 | ) | | (1.33 | ) | | (1.97 | ) | | (0.05 | ) |
| Total Distributions | | | (2.13 | ) | | (4.08 | ) | | (1.43 | ) | | (2.04 | ) | | (0.05 | ) |
| Net Asset Value, End of Year | | $ | 22.50 | | $ | 24.33 | | $ | 25.71 | | $ | 29.57 | | $ | 29.71 | |
| Total return(4) | | | 1.36 | % | | 10.43 | % | | (8.24 | )% | | 6.34 | % | | 16.15 | % |
| | | | | | | | | | | | | | | | | |
| SUPPLEMENTAL DATA AND RATIOS | | | | | | | | | | | | | | | | |
| Net assets, end of year (000’s) | | $ | 1,319 | | $ | 2,986 | | $ | 3,687 | | $ | 6,241 | | $ | 4,578 | |
| Ratio of operating expenses to average net assets: | | | | | | | | | | | | | | | | |
| Before expense reimbursement | | | 2.48 | % | | 2.40 | % | | 2.33 | % | | 2.24 | % | | 2.27 | % |
| After expense reimbursement(5) | | | 1.64 | % | | 1.64 | % | | 1.64 | % | | 1.64 | % | | 1.64 | % |
| Ratio of net investment income to average net assets: | | | 0.78 | % | | 0.61 | % | | 0.44 | % | | 0.00 | % | | 0.21 | % |
| Portfolio turnover rate(6) | | | 0 | % | | 0 | % | | 0 | % | | 12 | % | | 3 | % |
| (1) | Information presented relates to a share of capital stock outstanding for each year. |
| (2) | Net investment income per share represents net investment income divided by the average shares outstanding throughout the year. |
| (3) | Amount calculated is less than $0.005. |
| (4) | The total return calculation does not reflect the 5.75% front end sales charge on Advisor Class A shares. |
| (5) | See Note #3, Investment Adviser, for the waiver and expense reimbursement discussion. |
| (6) | Portfolio turnover of The Medical Portfolio. |
The accompanying notes are an integral part of these financial statements.
| KINETICS MUTUAL FUNDS, INC. — THE FEEDER FUNDS |
| Financial Highlights — (Continued) |
| | | | The Medical Fund | |
| | | | Advisor Class C | |
| | | | For the | | | For the | | | For the | | | For the | | | For the | |
| | | | Year Ended | | | Year Ended | | | Year Ended | | | Year Ended | | | Year Ended | |
| | | | December 31, | | | December 31, | | | December 31, | | | December 31, | | | December 31, | |
| | | | 2018 | | | 2017 | | | 2016 | | | 2015 | | | 2014 | |
| PER SHARE DATA:(1) | | | | | | | | | | | | | | | | |
| Net Asset Value, Beginning of Year | | $ | 23.57 | | $ | 24.99 | | $ | 28.82 | | $ | 29.15 | | $ | 25.27 | |
| Income from Investment Operations: | | | | | | | | | | | | | | | | |
| Net investment income (loss)(2) | | | 0.07 | | | 0.03 | | | (0.02 | ) | | (0.16 | ) | | (0.08 | ) |
| Net realized and unrealized gain (loss) on investments | | | 0.11 | | | 2.45 | | | (2.48 | ) | | 1.87 | | | 4.01 | |
| Total from Investment Operations | | | 0.18 | | | 2.48 | | | (2.50 | ) | | 1.71 | | | 3.93 | |
| Redemption Fees | | | — | | | — | | | — | | | — | | | — | |
| Less Distributions: | | | | | | | | | | | | | | | | |
| From net investment income | | | (0.10 | ) | | — | | | — | | | (0.07 | ) | | — | |
| From net realized gains | | | (1.96 | ) | | (3.90 | ) | | (1.33 | ) | | (1.97 | ) | | (0.05 | ) |
| Total Distributions | | | (2.06 | ) | | (3.90 | ) | | (1.33 | ) | | (2.04 | ) | | (0.05 | ) |
| Net Asset Value, End of Year | | $ | 21.69 | | $ | 23.57 | | $ | 24.99 | | $ | 28.82 | | $ | 29.15 | |
| Total return | | | 0.90 | % | | 9.86 | % | | (8.69 | )% | | 5.81 | % | | 15.54 | % |
| | | | | | | | | | | | | | | | | |
| SUPPLEMENTAL DATA AND RATIOS | | | | | | | | | | | | | | | | |
| Net assets, end of year (000’s) | | $ | 320 | | $ | 383 | | $ | 422 | | $ | 608 | | $ | 631 | |
| Ratio of operating expenses to average net assets: | | | | | | | | | | | | | | | | |
| Before expense reimbursement | | | 2.98 | % | | 2.90 | % | | 2.83 | % | | 2.74 | % | | 2.77 | % |
| After expense reimbursement(3) | | | 2.14 | % | | 2.14 | % | | 2.14 | % | | 2.14 | % | | 2.14 | % |
| Ratio of net investment income (loss) to average net assets: | | | 0.28 | % | | 0.11 | % | | (0.06 | )% | | (0.50 | )% | | (0.29 | )% |
| Portfolio turnover rate(4) | | | 0 | % | | 0 | % | | 0 | % | | 12 | % | | 3 | % |
| (1) | Information presented relates to a share of capital stock outstanding for each year. |
| (2) | Net investment income per share represents net investment income divided by the average shares outstanding throughout the year. |
| (3) | See Note #3, Investment Adviser, for the waiver and expense reimbursement discussion. |
| (4) | Portfolio turnover of The Medical Portfolio. |
The accompanying notes are an integral part of these financial statements.
| KINETICS MUTUAL FUNDS, INC. — THE FEEDER FUNDS |
| Financial Highlights — (Continued) |
| | | | The Small Cap Opportunities Fund | |
| | | | No Load Class | |
| | | | For the | | | For the | | | For the | | | For the | | | For the | |
| | | | Year Ended | | | Year Ended | | | Year Ended | | | Year Ended | | | Year Ended | |
| | | | December 31, | | | December 31, | | | December 31, | | | December 31, | | | December 31, | |
| | | | 2018 | | | 2017 | | | 2016 | | | 2015 | | | 2014 | |
| PER SHARE DATA:(1) | | | | | | | | | | | | | | | | |
| Net Asset Value, Beginning of Year | | $ | 51.25 | | $ | 40.60 | | $ | 32.64 | | $ | 37.21 | | $ | 40.12 | |
| Income from Investment Operations: | | | | | | | | | | | | | | | | |
| Net investment loss(2) | | | (0.35 | ) | | (0.33 | ) | | (0.36 | ) | | (0.35 | ) | | (0.36 | ) |
| Net realized and unrealized gain (loss) on investments | | | 0.47 | | | 10.98 | | | 8.32 | | | (4.22 | ) | | (2.56 | ) |
| Total from Investment Operations | | | 0.12 | | | 10.65 | | | 7.96 | | | (4.57 | ) | | (2.92 | ) |
| Redemption Fees | | | 0.03 | | | 0.00 | (3) | | 0.00 | (3) | | 0.00 | (3) | | 0.01 | |
| Less Distributions: | | | | | | | | | | | | | | | | |
| From net investment income | | | — | | | — | | | — | | | — | | | — | |
| Total Distributions | | | — | | | — | | | — | | | — | | | — | |
| Net Asset Value, End of Year | | $ | 51.40 | | $ | 51.25 | | $ | 40.60 | | $ | 32.64 | | $ | 37.21 | |
| Total return | | | 0.29 | % | | 26.23 | % | | 24.39 | % | | (12.26 | )% | | (7.28 | )% |
| | | | | | | | | | | | | | | | | |
| SUPPLEMENTAL DATA AND RATIOS | | | | | | | | | | | | | | | | |
| Net assets, end of year (000’s) | | $ | 164,330 | | $ | 133,960 | | $ | 132,443 | | $ | 145,032 | | $ | 251,110 | |
| Ratio of operating expenses to average net assets: | | | | | | | | | | | | | | | | |
| Before expense reimbursement | | | 1.74 | % | | 1.78 | % | | 1.76 | % | | 1.73 | % | | 1.71 | % |
| After expense reimbursement(4) | | | 1.64 | % | | 1.64 | % | | 1.64 | % | | 1.64 | % | | 1.64 | % |
| Ratio of net investment loss to average net assets: | | | (0.60 | )% | | (0.74 | )% | | (1.03 | )% | | (0.94 | )% | | (0.89 | )% |
| Portfolio turnover rate(5) | | | 3 | % | | 9 | % | | 4 | % | | 2 | % | | 19 | % |
| (1) | Information presented relates to a share of capital stock outstanding for each year. |
| (2) | Net investment income per share represents net investment income divided by the average shares outstanding throughout the year. |
| (3) | Amount calculated is less than $0.005. |
| (4) | See Note #3, Investment Adviser, for the waiver and expense reimbursement discussion. |
| (5) | Portfolio turnover of The Small Cap Opportunities Portfolio. |
The accompanying notes are an integral part of these financial statements.
| KINETICS MUTUAL FUNDS, INC. — THE FEEDER FUNDS |
| Financial Highlights — (Continued) |
| | | | The Small Cap Opportunities Fund | |
| | | | Advisor Class A | |
| | | | For the | | | For the | | | For the | | | For the | | | For the | |
| | | | Year Ended | | | Year Ended | | | Year Ended | | | Year Ended | | | Year Ended | |
| | | | December 31, | | | December 31, | | | December 31, | | | December 31, | | | December 31, | |
| | | | 2018 | | | 2017 | | | 2016 | | | 2015 | | | 2014 | |
| PER SHARE DATA:(1) | | | | | | | | | | | | | | | | |
| Net Asset Value, Beginning of Year | | $ | 49.81 | | $ | 39.55 | | $ | 31.88 | | $ | 36.43 | | $ | 39.39 | |
| Income from Investment Operations: | | | | | | | | | | | | | | | | |
| Net investment loss(2) | | | (0.48 | ) | | (0.42 | ) | | (0.43 | ) | | (0.43 | ) | | (0.45 | ) |
| Net realized and unrealized gain (loss) on investments | | | 0.48 | | | 10.68 | | | 8.10 | | | (4.12 | ) | | (2.51 | ) |
| Total from Investment Operations | | | — | | | 10.26 | | | 7.67 | | | (4.55 | ) | | (2.96 | ) |
| Redemption Fees | | | 0.00 | (3) | | 0.00 | (3) | | 0.00 | (3) | | 0.00 | (3) | | 0.00 | (3) |
| Less Distributions: | | | | | | | | | | | | | | | | |
| From net investment income | | | — | | | — | | | — | | | — | | | — | |
| Total Distributions | | | — | | | — | | | — | | | — | | | — | |
| Net Asset Value, End of Year | | $ | 49.81 | | $ | 49.81 | | $ | 39.55 | | $ | 31.88 | | $ | 36.43 | |
| Total return(4) | | | 0.00 | % | | 25.94 | % | | 24.06 | % | | (12.47 | )% | | (7.54 | )% |
| | | | | | | | | | | | | | | | | |
| SUPPLEMENTAL DATA AND RATIOS | | | | | | | | | | | | | | | | |
| Net assets, end of year (000’s) | | $ | 10,505 | | $ | 11,735 | | $ | 13,694 | | $ | 14,857 | | $ | 25,591 | |
| Ratio of operating expenses to average net assets: | | | | | | | | | | | | | | | | |
| Before expense reimbursement | | | 1.99 | % | | 2.03 | % | | 2.01 | % | | 1.98 | % | | 1.96 | % |
| After expense reimbursement(5) | | | 1.89 | % | | 1.89 | % | | 1.89 | % | | 1.89 | % | | 1.89 | % |
| Ratio of net investment loss to average net assets: | | | (0.85 | )% | | (0.99 | )% | | (1.28 | )% | | (1.19 | )% | | (1.14 | )% |
| Portfolio turnover rate(6) | | | 3 | % | | 9 | % | | 4 | % | | 2 | % | | 19 | % |
| (1) | Information presented relates to a share of capital stock outstanding for each year. |
| (2) | Net investment income per share represents net investment income divided by the average shares outstanding throughout the year. |
| (3) | Amount calculated is less than $0.005. |
| (4) | The total return calculation does not reflect the 5.75% front end sales charge on Advisor Class A shares. |
| (5) | See Note #3, Investment Adviser, for the waiver and expense reimbursement discussion. |
| (6) | Portfolio turnover of The Small Cap Opportunities Portfolio. |
The accompanying notes are an integral part of these financial statements.
| KINETICS MUTUAL FUNDS, INC. — THE FEEDER FUNDS |
| Financial Highlights — (Continued) |
| | | | The Small Cap Opportunities Fund | |
| | | | Advisor Class C | |
| | | | For the | | | For the | | | For the | | | For the | | | For the | |
| | | | Year Ended | | | Year Ended | | | Year Ended | | | Year Ended | | | Year Ended | |
| | | | December 31, | | | December 31, | | | December 31, | | | December 31, | | | December 31, | |
| | | | 2018 | | | 2017 | | | 2016 | | | 2015 | | | 2014 | |
| PER SHARE DATA:(1) | | | | | | | | | | | | | | | | |
| Net Asset Value, Beginning of Year | | $ | 47.77 | | $ | 38.12 | | $ | 30.88 | | $ | 35.47 | | $ | 38.53 | |
| Income from Investment Operations: | | | | | | | | | | | | | | | | |
| Net investment loss(2) | | | (0.73 | ) | | (0.61 | ) | | (0.58 | ) | | (0.59 | ) | | (0.63 | ) |
| Net realized and unrealized gain (loss) on investments | | | 0.49 | | | 10.26 | | | 7.82 | | | (4.00 | ) | | (2.44 | ) |
| Total from Investment Operations | | | (0.24 | ) | | 9.65 | | | 7.24 | | | (4.59 | ) | | (3.07 | ) |
| Redemption Fees | | | 0.00 | (3) | | — | | | 0.00 | (3) | | — | | | 0.01 | |
| Less Distributions: | | | | | | | | | | | | | | | | |
| From net investment income | | | — | | | — | | | — | | | — | | | — | |
| Total Distributions | | | — | | | — | | | — | | | — | | | — | |
| Net Asset Value, End of Year | | $ | 47.53 | | $ | 47.77 | | $ | 38.12 | | $ | 30.88 | | $ | 35.47 | |
| Total return | | | (0.50 | )% | | 25.31 | % | | 23.45 | % | | (12.92 | )% | | (7.97 | )% |
| | | | | | | | | | | | | | | | | |
| SUPPLEMENTAL DATA AND RATIOS | | | | | | | | | | | | | | | | |
| Net assets, end of year (000’s) | | $ | 8,373 | | $ | 8,135 | | $ | 8,426 | | $ | 8,840 | | $ | 12,928 | |
| Ratio of operating expenses to average net assets: | | | | | | | | | | | | | | | | |
| Before expense reimbursement | | | 2.49 | % | | 2.53 | % | | 2.51 | % | | 2.48 | % | | 2.46 | % |
| After expense reimbursement(4) | | | 2.39 | % | | 2.39 | % | | 2.39 | % | | 2.39 | % | | 2.39 | % |
| Ratio of net investment loss to average net assets: | | | (1.35 | )% | | (1.49 | )% | | (1.78 | )% | | (1.69 | )% | | (1.64 | )% |
| Portfolio turnover rate(5) | | | 3 | % | | 9 | % | | 4 | % | | 2 | % | | 19 | % |
| (1) | Information presented relates to a share of capital stock outstanding for each year. |
| (2) | Net investment income per share represents net investment income divided by the average shares outstanding throughout the year. |
| (3) | Amount calculated is less than $0.005. |
| (4) | See Note #3, Investment Adviser, for the waiver and expense reimbursement discussion. |
| (5) | Portfolio turnover of The Small Cap Opportunities Portfolio. |
The accompanying notes are an integral part of these financial statements.
| KINETICS MUTUAL FUNDS, INC. — THE FEEDER FUNDS |
| Financial Highlights — (Continued) |
| | | | The Small Cap Opportunities Fund | |
| | | | Institutional Class | |
| | | | For the | | | For the | | | For the | | | For the | | | For the | |
| | | | Year Ended | | | Year Ended | | | Year Ended | | | Year Ended | | | Year Ended | |
| | | | December 31, | | | December 31, | | | December 31, | | | December 31, | | | December 31, | |
| | | | 2018 | | | 2017 | | | 2016 | | | 2015 | | | 2014 | |
| PER SHARE DATA:(1) | | | | | | | | | | | | | | | | |
| Net Asset Value, Beginning of Year | | $ | 52.07 | | $ | 41.16 | | $ | 33.03 | | $ | 37.57 | | $ | 40.44 | |
| Income from Investment Operations: | | | | | | | | | | | | | | | | |
| Net investment loss(2) | | | (0.24 | ) | | (0.24 | ) | | (0.29 | ) | | (0.28 | ) | | (0.28 | ) |
| Net realized and unrealized gain (loss) on investments | | | 0.47 | | | 11.15 | | | 8.42 | | | (4.26 | ) | | (2.59 | ) |
| Total from Investment Operations | | | 0.23 | | | 10.91 | | | 8.13 | | | (4.54 | ) | | (2.87 | ) |
| Redemption Fees(3) | | | 0.00 | | | 0.00 | | | 0.00 | | | 0.00 | | | 0.00 | |
| Less Distributions: | | | | | | | | | | | | | | | | |
| From net investment income | | | — | | | — | | | — | | | — | | | — | |
| Total Distributions | | | — | | | — | | | — | | | — | | | — | |
| Net Asset Value, End of Year | | $ | 52.30 | | $ | 52.07 | | $ | 41.16 | | $ | 33.03 | | $ | 37.57 | |
| Total return | | | 0.44 | % | | 26.51 | % | | 24.61 | % | | (12.06 | )% | | (7.12 | )% |
| | | | | | | | | | | | | | | | | |
| SUPPLEMENTAL DATA AND RATIOS | | | | | | | | | | | | | | | | |
| Net assets, end of year (000’s) | | $ | 40,075 | | $ | 27,514 | | $ | 50,517 | | $ | 51,258 | | $ | 63,392 | |
| Ratio of operating expenses to average net assets: | | | | | | | | | | | | | | | | |
| Before expense reimbursement | | | 1.69 | % | | 1.73 | % | | 1.71 | % | | 1.68 | % | | 1.66 | % |
| After expense reimbursement(4) | | | 1.44 | % | | 1.44 | % | | 1.44 | % | | 1.44 | % | | 1.44 | % |
| Ratio of net investment loss to average net assets: | | | (0.40 | )% | | (0.54 | )% | | (0.83 | )% | | (0.74 | )% | | (0.69 | )% |
| Portfolio turnover rate(5) | | | 3 | % | | 9 | % | | 4 | % | | 2 | % | | 19 | % |
| (1) | Information presented relates to a share of capital stock outstanding for each year. |
| (2) | Net investment income per share represents net investment income divided by the average shares outstanding throughout the year. |
| (3) | Amount calculated is less than $0.005. |
| (4) | See Note #3, Investment Adviser, for the waiver and expense reimbursement discussion. |
| (5) | Portfolio turnover of The Small Cap Opportunities Portfolio. |
The accompanying notes are an integral part of these financial statements.
| KINETICS MUTUAL FUNDS, INC. — THE FEEDER FUNDS |
| Financial Highlights — (Continued) |
| | | | The Market Opportunities Fund | |
| | | | No Load Class | |
| | | | For the | | | For the | | | For the | | | For the | | | For the | |
| | | | Year Ended | | | Year Ended | | | Year Ended | | | Year Ended | | | Year Ended | |
| | | | December 31, | | | December 31, | | | December 31, | | | December 31, | | | December 31, | |
| | | | 2018 | | | 2017 | | | 2016 | | | 2015 | | | 2014 | |
| PER SHARE DATA:(1) | | | | | | | | | | | | | | | | |
| Net Asset Value, Beginning of Year | | $ | 26.72 | | $ | 18.26 | | $ | 15.16 | | $ | 16.68 | | $ | 17.66 | |
| Income from Investment Operations: | | | | | | | | | | | | | | | | |
| Net investment income (loss)(2) | | | (0.14 | ) | | 0.17 | | | (0.15 | ) | | (0.15 | ) | | (0.10 | ) |
| Net realized and unrealized gain (loss) on investments | | | (2.77 | ) | | 8.46 | | | 3.25 | | | (1.37 | ) | | (0.88 | ) |
| Total from Investment Operations | | | (2.91 | ) | | 8.63 | | | 3.10 | | | (1.52 | ) | | (0.98 | ) |
| Redemption Fees | | | 0.01 | | | 0.00 | (3) | | 0.00 | (3) | | — | | | 0.00 | (3) |
| Less Distributions: | | | | | | | | | | | | | | | | |
| From net investment income | | | — | | | (0.17 | ) | | — | | | — | | | — | |
| From net realized gains | | | (1.99 | ) | | — | | | — | | | — | | | — | |
| Total Distributions | | | (1.99 | ) | | (0.17 | ) | | — | | | — | | | — | |
| Net Asset Value, End of Year | | $ | 21.83 | | $ | 26.72 | | $ | 18.26 | | $ | 15.16 | | $ | 16.68 | |
| Total return | | | (10.86 | )% | | 47.28 | % | | 20.45 | % | | (9.11 | )% | | (5.55 | )% |
| | | | | | | | | | | | | | | | | |
| SUPPLEMENTAL DATA AND RATIOS | | | | | | | | | | | | | | | | |
| Net assets, end of year (000’s) | | $ | 48,487 | | $ | 51,298 | | $ | 32,178 | | $ | 31,230 | | $ | 37,318 | |
| Ratio of operating expenses to average net assets: | | | | | | | | | | | | | | | | |
| Before expense reimbursement | | | 1.86 | % | | 1.92 | % | | 1.97 | % | | 1.90 | % | | 1.86 | % |
| After expense reimbursement(4) | | | 1.64 | % | | 1.64 | % | | 1.64 | % | | 1.64 | % | | 1.64 | % |
| Ratio of net investment income (loss) to average net assets: | | | (0.53 | )% | | 0.81 | % | | (0.96 | )% | | (0.91 | )% | | (0.55 | )% |
| Portfolio turnover rate(5) | | | 8 | % | | 35 | % | | 5 | % | | 2 | % | | 18 | % |
| (1) | Information presented relates to a share of capital stock outstanding for each year. |
| (2) | Net investment income per share represents net investment income divided by the average shares outstanding throughout the year. |
| (3) | Amount calculated is less than $0.005. |
| (4) | See Note #3, Investment Adviser, for the waiver and expense reimbursement discussion. |
| (5) | Portfolio turnover of The Market Opportunities Portfolio. |
The accompanying notes are an integral part of these financial statements.
| KINETICS MUTUAL FUNDS, INC. — THE FEEDER FUNDS |
| Financial Highlights — (Continued) |
| | | | The Market Opportunities Fund | |
| | | | Advisor Class A | |
| | | | For the | | | For the | | | For the | | | For the | | | For the | |
| | | | Year Ended | | | Year Ended | | | Year Ended | | | Year Ended | | | Year Ended | |
| | | | December 31, | | | December 31, | | | December 31, | | | December 31, | | | December 31, | |
| | | | 2018 | | | 2017 | | | 2016 | | | 2015 | | | 2014 | |
| PER SHARE DATA:(1) | | | | | | | | | | | | | | | | |
| Net Asset Value, Beginning of Year | | $ | 26.41 | | $ | 18.07 | | $ | 15.04 | | $ | 16.59 | | $ | 17.60 | |
| Income from Investment Operations: | | | | | | | | | | | | | | | | |
| Net investment income (loss)(2) | | | (0.21 | ) | | 0.11 | | | (0.19 | ) | | (0.19 | ) | | (0.14 | ) |
| Net realized and unrealized gain (loss) on investments | | | (2.72 | ) | | 8.37 | | | 3.22 | | | (1.36 | ) | | (0.87 | ) |
| Total from Investment Operations | | | (2.93 | ) | | 8.48 | | | 3.03 | | | (1.55 | ) | | (1.01 | ) |
| Redemption Fees | | | 0.00 | (3) | | 0.00 | (3) | | — | | | 0.00 | (3) | | — | |
| Less Distributions: | | | | | | | | | | | | | | | | |
| From net investment income | | | — | | | (0.14 | ) | | — | | | — | | | — | |
| From net realized gains | | | (1.99 | ) | | — | | | — | | | — | | | — | |
| Total Distributions | | | (1.99 | ) | | (0.14 | ) | | — | | | — | | | — | |
| Net Asset Value, End of Year | | $ | 21.49 | | $ | 26.41 | | $ | 18.07 | | $ | 15.04 | | $ | 16.59 | |
| Total return(4) | | | (11.10 | )% | | 46.91 | % | | 20.15 | % | | (9.34 | )% | | (5.74 | )% |
| | | | | | | | | | | | | | | | | |
| SUPPLEMENTAL DATA AND RATIOS | | | | | | | | | | | | | | | | |
| Net assets, end of year (000’s) | | $ | 6,426 | | $ | 7,557 | | $ | 4,537 | | $ | 4,502 | | $ | 8,817 | |
| Ratio of operating expenses to average net assets: | | | | | | | | | | | | | | | | |
| Before expense reimbursement | | | 2.11 | % | | 2.17 | % | | 2.22 | % | | 2.15 | % | | 2.11 | % |
| After expense reimbursement(5) | | | 1.89 | % | | 1.89 | % | | 1.89 | % | | 1.89 | % | | 1.89 | % |
| Ratio of net investment income (loss) to average net assets: | | | (0.78 | )% | | 0.56 | % | | (1.21 | )% | | (1.16 | )% | | (0.80 | )% |
| Portfolio turnover rate(6) | | | 8 | % | | 35 | % | | 5 | % | | 2 | % | | 18 | % |
| (1) | Information presented relates to a share of capital stock outstanding for each year. |
| (2) | Net investment income per share represents net investment income divided by the average shares outstanding throughout the year. |
| (3) | Amount calculated is less than $0.005. |
| (4) | The total return calculation does not reflect the 5.75% front end sales charge on Advisor Class A shares. |
| (5) | See Note #3, Investment Adviser, for the waiver and expense reimbursement discussion. |
| (6) | Portfolio turnover of The Market Opportunities Portfolio. |
The accompanying notes are an integral part of these financial statements.
| KINETICS MUTUAL FUNDS, INC. — THE FEEDER FUNDS |
| Financial Highlights — (Continued) |
| | | | The Market Opportunities Fund | |
| | | | Advisor Class C | |
| | | | For the | | | For the | | | For the | | | For the | | | For the | |
| | | | Year Ended | | | Year Ended | | | Year Ended | | | Year Ended | | | Year Ended | |
| | | | December 31, | | | December 31, | | | December 31, | | | December 31, | | | December 31, | |
| | | | 2018 | | | 2017 | | | 2016 | | | 2015 | | | 2014 | |
| PER SHARE DATA:(1) | | | | | | | | | | | | | | | | |
| Net Asset Value, Beginning of Year | | $ | 25.53 | | $ | 17.51 | | $ | 14.65 | | $ | 16.24 | | $ | 17.32 | |
| Income from Investment Operations: | | | | | | | | | | | | | | | | |
| Net investment income (loss)(2) | | | (0.33 | ) | | 0.01 | | | (0.26 | ) | | (0.27 | ) | | (0.22 | ) |
| Net realized and unrealized gain (loss) on investments | | | (2.60 | ) | | 8.07 | | | 3.12 | | | (1.32 | ) | | (0.86 | ) |
| Total from Investment Operations | | | (2.93 | ) | | 8.08 | | | 2.86 | | | (1.59 | ) | | (1.08 | ) |
| Redemption Fees | | | — | | | — | | | — | | | — | | | 0.00 | (3) |
| Less Distributions: | | | | | | | | | | | | | | | | |
| From net investment income | | | — | | | (0.06 | ) | | — | | | — | | | — | |
| From net realized gains | | | (1.99 | ) | | — | | | — | | | — | | | — | |
| Total Distributions | | | (1.99 | ) | | (0.06 | ) | | — | | | — | | | — | |
| Net Asset Value, End of Year | | $ | 20.61 | | $ | 25.53 | | $ | 17.51 | | $ | 14.65 | | $ | 16.24 | |
| Total return | | | (11.48 | )% | | 46.12 | % | | 19.52 | % | | (9.79 | )% | | (6.24 | )% |
| | | | | | | | | | | | | | | | | |
| SUPPLEMENTAL DATA AND RATIOS | | | | | | | | | | | | | | | | |
| Net assets, end of year (000’s) | | $ | 8,517 | | $ | 8,139 | | $ | 4,428 | | $ | 4,079 | | $ | 5,109 | |
| Ratio of operating expenses to average net assets: | | | | | | | | | | | | | | | | |
| Before expense reimbursement | | | 2.61 | % | | 2.67 | % | | 2.72 | % | | 2.65 | % | | 2.61 | % |
| After expense reimbursement(4) | | | 2.39 | % | | 2.39 | % | | 2.39 | % | | 2.39 | % | | 2.39 | % |
| Ratio of net investment income (loss) to average net assets: | | | (1.28 | )% | | 0.06 | % | | (1.71 | )% | | (1.66 | )% | | (1.30 | )% |
| Portfolio turnover rate(5) | | | 8 | % | | 35 | % | | 5 | % | | 2 | % | | 18 | % |
| (1) | Information presented relates to a share of capital stock outstanding for each year. |
| (2) | Net investment income per share represents net investment income divided by the average shares outstanding throughout the year. |
| (3) | Amount calculated is less than $0.005. |
| (4) | See Note #3, Investment Adviser, for the waiver and expense reimbursement discussion. |
| (5) | Portfolio turnover of The Market Opportunities Portfolio. |
The accompanying notes are an integral part of these financial statements.
| KINETICS MUTUAL FUNDS, INC. — THE FEEDER FUNDS |
| Financial Highlights — (Continued) |
| | | | The Market Opportunities Fund | |
| | | | Institutional Class | |
| | | | For the | | | For the | | | For the | | | For the | | | For the | |
| | | | Year Ended | | | Year Ended | | | Year Ended | | | Year Ended | | | Year Ended | |
| | | | December 31, | | | December 31, | | | December 31, | | | December 31, | | | December 31, | |
| | | | 2018 | | | 2017 | | | 2016 | | | 2015 | | | 2014 | |
| PER SHARE DATA:(1) | | | | | | | | | | | | | | | | |
| Net Asset Value, Beginning of Year | | $ | 27.04 | | $ | 18.46 | | $ | 15.29 | | $ | 16.80 | | $ | 17.74 | |
| Income from Investment Operations: | | | | | | | | | | | | | | | | |
| Net investment income (loss)(2) | | | (0.09 | ) | | 0.22 | | | (0.12 | ) | | (0.12 | ) | | (0.06 | ) |
| Net realized and unrealized gain (loss) on investments | | | (2.81 | ) | | 8.55 | | | 3.29 | | | (1.39 | ) | | (0.88 | ) |
| Total from Investment Operations | | | (2.90 | ) | | 8.77 | | | 3.17 | | | (1.51 | ) | | (0.94 | ) |
| Redemption Fees | | | 0.01 | | | 0.02 | | | — | | | — | | | — | |
| Less Distributions: | | | | | | | | | | | | | | | | |
| From net investment income | | | — | | | (0.21 | ) | | — | | | — | | | — | |
| From net realized gains | | | (1.99 | ) | | — | | | — | | | — | | | — | |
| Total Distributions | | | (1.99 | ) | | (0.21 | ) | | — | | | — | | | — | |
| Net Asset Value, End of Year | | $ | 22.16 | | $ | 27.04 | | $ | 18.46 | | $ | 15.29 | | $ | 16.80 | |
| Total return | | | (10.70 | )% | | 47.65 | % | | 20.73 | % | | (8.93 | )% | | (5.36 | )% |
| | | | | | | | | | | | | | | | | |
| SUPPLEMENTAL DATA AND RATIOS | | | | | | | | | | | | | | | | |
| Net assets, end of year (000’s) | | $ | 9,471 | | $ | 10,228 | | $ | 2,426 | | $ | 2,355 | | $ | 3,108 | |
| Ratio of operating expenses to average net assets: | | | | | | | | | | | | | | | | |
| Before expense reimbursement | | | 1.81 | % | | 1.87 | % | | 1.92 | % | | 1.85 | % | | 1.81 | % |
| After expense reimbursement(3) | | | 1.44 | % | | 1.44 | % | | 1.44 | % | | 1.44 | % | | 1.44 | % |
| Ratio of net investment income (loss) to average net assets: | | | (0.33 | )% | | 1.01 | % | | (0.76 | )% | | (0.71 | )% | | (0.35 | )% |
| Portfolio turnover rate(4) | | | 8 | % | | 35 | % | | 5 | % | | 2 | % | | 18 | % |
| (1) | Information presented relates to a share of capital stock outstanding for each year. |
| (2) | Net investment income per share represents net investment income divided by the average shares outstanding throughout the year. |
| (3) | See Note #3, Investment Adviser, for the waiver and expense reimbursement discussion. |
| (4) | Portfolio turnover of The Market Opportunities Portfolio. |
The accompanying notes are an integral part of these financial statements.
| KINETICS MUTUAL FUNDS, INC. — THE FEEDER FUNDS |
| Financial Highlights — (Continued) |
| | | | The Alternative Income Fund | |
| | | | No Load Class | |
| | | | For the | | | For the | | | For the | | | For the | | | For the | |
| | | | Year Ended | | | Year Ended | | | Year Ended | | | Year Ended | | | Year Ended | |
| | | | December 31, | | | December 31, | | | December 31, | | | December 31, | | | December 31, | |
| | | | 2018 | | | 2017 | | | 2016 | | | 2015 | | | 2014 | |
| PER SHARE DATA:(1) | | | | | | | | | | | | | | | | |
| Net Asset Value, Beginning of Year | | $ | 97.57 | | $ | 95.36 | | $ | 91.68 | | $ | 89.06 | | $ | 87.88 | |
| Income from Investment Operations: | | | | | | | | | | | | | | | | |
| Net investment income (loss)(2) | | | 0.92 | | | 0.08 | | | (0.01 | ) | | 0.01 | | | (0.12 | ) |
| Net realized and unrealized gain (loss) on investments | | | (0.03 | ) | | 2.12 | | | 3.69 | | | 2.56 | | | 1.30 | |
| Total from Investment Operations | | | 0.89 | | | 2.20 | | | 3.68 | | | 2.57 | | | 1.18 | |
| Redemption Fees | | | 0.01 | | | 0.01 | | | 0.00 | (3) | | 0.05 | | | 0.00 | (3) |
| Less Distributions: | | | | | | | | | | | | | | | | |
| From net investment income | | | (1.01 | ) | | — | | | — | | | — | | | — | |
| Total Distributions | | | (1.01 | ) | | — | | | — | | | — | | | — | |
| Net Asset Value, End of Year | | $ | 97.46 | | $ | 97.57 | | $ | 95.36 | | $ | 91.68 | | $ | 89.06 | |
| Total return | | | 0.92 | % | | 2.32 | % | | 4.00 | % | | 2.94 | % | | 1.50 | % |
| | | | | | | | | | | | | | | | | |
| SUPPLEMENTAL DATA AND RATIOS | | | | | | | | | | | | | | | | |
| Net assets, end of year (000’s) | | $ | 4,265 | | $ | 4,968 | | $ | 5,664 | | $ | 4,570 | | $ | 8,202 | |
| Ratio of operating expenses to average net assets: | | | | | | | | | | | | | | | | |
| Before expense reimbursement | | | 1.88 | % | | 1.75 | % | | 1.78 | % | | 1.74 | % | | 1.80 | % |
| After expense reimbursement(4) | | | 0.95 | % | | 0.95 | % | | 0.95 | % | | 0.95 | % | | 0.95 | % |
| Ratio of net investment income (loss) to average net assets: | | | 0.94 | % | | 0.08 | % | | (0.01 | )% | | 0.01 | % | | (0.14 | )% |
| Portfolio turnover rate(5) | | | 0 | % | | 0 | % | | 1 | % | | 6 | % | | 17 | % |
| (1) | Information presented relates to a share of capital stock outstanding for each year. |
| (2) | Net investment income per share represents net investment income divided by the average shares outstanding throughout the year. |
| (3) | Amount calculated is less than $0.005. |
| (4) | See Note #3, Investment Adviser, for the waiver and expense reimbursement discussion. |
| (5) | Portfolio turnover of The Alternative Income Portfolio. |
The accompanying notes are an integral part of these financial statements.
| KINETICS MUTUAL FUNDS, INC. — THE FEEDER FUNDS |
| Financial Highlights — (Continued) |
| | | | The Alternative Income Fund | |
| | | | Advisor Class A | |
| | | | For the | | | For the | | | For the | | | For the | | | For the | |
| | | | Year Ended | | | Year Ended | | | Year Ended | | | Year Ended | | | Year Ended | |
| | | | December 31, | | | December 31, | | | December 31, | | | December 31, | | | December 31, | |
| | | | 2018 | | | 2017 | | | 2016 | | | 2015 | | | 2014 | |
| PER SHARE DATA:(1) | | | | | | | | | | | | | | | | |
| Net Asset Value, Beginning of Year | | $ | 96.38 | | $ | 94.44 | | $ | 91.02 | | $ | 88.69 | | $ | 87.73 | |
| Income from Investment Operations: | | | | | | | | | | | | | | | | |
| Net investment income (loss)(2) | | | 0.66 | | | (0.16 | ) | | (0.24 | ) | | (0.22 | ) | | (0.34 | ) |
| Net realized and unrealized gain (loss) on investments | | | (0.03 | ) | | 2.10 | | | 3.65 | | | 2.55 | | | 1.30 | |
| Total from Investment Operations | | | 0.63 | | | 1.94 | | | 3.41 | | | 2.33 | | | 0.96 | |
| Redemption Fees | | | — | | | 0.00 | (3) | | 0.01 | | | — | | | 0.00 | (3) |
| Less Distributions: | | | | | | | | | | | | | | | | |
| From net investment income | | | (0.77 | ) | | — | | | — | | | — | | | — | |
| Total Distributions | | | (0.77 | ) | | — | | | — | | | — | | | — | |
| Net Asset Value, End of Year | | $ | 96.24 | | $ | 96.38 | | $ | 94.44 | | $ | 91.02 | | $ | 88.69 | |
| Total return(4) | | | 0.65 | % | | 2.05 | % | | 3.76 | % | | 2.63 | % | | 1.24 | % |
| | | | | | | | | | | | | | | | | |
| SUPPLEMENTAL DATA AND RATIOS | | | | | | | | | | | | | | | | |
| Net assets, end of year (000’s) | | $ | 932 | | $ | 1,501 | | $ | 2,458 | | $ | 1,565 | | $ | 1,554 | |
| Ratio of operating expenses to average net assets: | | | | | | | | | | | | | | | | |
| Before expense reimbursement | | | 2.13 | % | | 2.00 | % | | 2.03 | % | | 1.99 | % | | 2.05 | % |
| After expense reimbursement(5) | | | 1.20 | % | | 1.20 | % | | 1.20 | % | | 1.20 | % | | 1.20 | % |
| Ratio of net investment income (loss) to average net assets: | | | 0.69 | % | | (0.17 | )% | | (0.26 | )% | | (0.24 | )% | | (0.39 | )% |
| Portfolio turnover rate(6) | | | 0 | % | | 0 | % | | 1 | % | | 6 | % | | 17 | % |
| (1) | Information presented relates to a share of capital stock outstanding for each year. |
| (2) | Net investment income per share represents net investment income divided by the average shares outstanding throughout the year. |
| (3) | Amount calculated is less than $0.005. |
| (4) | The total return calculation does not reflect the 5.75% front end sales charge on Advisor Class A shares. |
| (5) | See Note #3, Investment Adviser, for the waiver and expense reimbursement discussion. |
| (6) | Portfolio turnover of The Alternative Income Portfolio. |
The accompanying notes are an integral part of these financial statements.
| KINETICS MUTUAL FUNDS, INC. — THE FEEDER FUNDS |
| Financial Highlights — (Continued) |
| | | | The Alternative Income Fund | |
| | | | Advisor Class C | |
| | | | For the | | | For the | | | For the | | | For the | | | For the | |
| | | | Year Ended | | | Year Ended | | | Year Ended | | | Year Ended | | | Year Ended | |
| | | | December 31, | | | December 31, | | | December 31, | | | December 31, | | | December 31, | |
| | | | 2018 | | | 2017 | | | 2016 | | | 2015 | | | 2014 | |
| PER SHARE DATA:(1) | | | | | | | | | | | | | | | | |
| Net Asset Value, Beginning of Year | | $ | 92.73 | | $ | 91.33 | | $ | 88.46 | | $ | 86.60 | | $ | 86.10 | |
| Income from Investment Operations: | | | | | | | | | | | | | | | | |
| Net investment income (loss)(2) | | | 0.17 | | | (0.62 | ) | | (0.68 | ) | | (0.65 | ) | | (0.77 | ) |
| Net realized and unrealized gain (loss) on investments | | | (0.04 | ) | | 2.02 | | | 3.55 | | | 2.48 | | | 1.27 | |
| Total from Investment Operations | | | 0.13 | | | 1.40 | | | 2.87 | | | 1.83 | | | 0.50 | |
| Redemption Fees | | | — | | | — | | | — | | | 0.03 | | | — | |
| Less Distributions: | | | | | | | | | | | | | | | | |
| From net investment income | | | (0.21 | ) | | — | | | — | | | — | | | — | |
| Total Distributions | | | (0.21 | ) | | — | | | — | | | — | | | — | |
| Net Asset Value, End of Year | | $ | 92.65 | | $ | 92.73 | | $ | 91.33 | | $ | 88.46 | | $ | 86.60 | |
| Total return | | | 0.15 | % | | 1.53 | % | | 3.23 | % | | 2.15 | % | | 0.74 | % |
| | | | | | | | | | | | | | | | | |
| SUPPLEMENTAL DATA AND RATIOS | | | | | | | | | | | | | | | | |
| Net assets, end of year (000’s) | | $ | 1,107 | | $ | 1,513 | | $ | 1,640 | | $ | 1,356 | | $ | 1,506 | |
| Ratio of operating expenses to average net assets: | | | | | | | | | | | | | | | | |
| Before expense reimbursement | | | 2.63 | % | | 2.50 | % | | 2.53 | % | | 2.49 | % | | 2.55 | % |
| After expense reimbursement(3) | | | 1.70 | % | | 1.70 | % | | 1.70 | % | | 1.70 | % | | 1.70 | % |
| Ratio of net investment income (loss) to average net assets: | | | 0.19 | % | | (0.67 | )% | | (0.76 | )% | | (0.74 | )% | | (0.89 | )% |
| Portfolio turnover rate(4) | | | 0 | % | | 0 | % | | 1 | % | | 6 | % | | 17 | % |
| (1) | Information presented relates to a share of capital stock outstanding for each year. |
| (2) | Net investment income per share represents net investment income divided by the average shares outstanding throughout the year. |
| (3) | See Note #3, Investment Adviser, for the waiver and expense reimbursement discussion. |
| (4) | Portfolio turnover of The Alternative Income Portfolio. |
The accompanying notes are an integral part of these financial statements.
| KINETICS MUTUAL FUNDS, INC. — THE FEEDER FUNDS |
| Financial Highlights — (Continued) |
| | | | The Alternative Income Fund | |
| | | | Institutional Class | |
| | | | For the | | | For the | | | For the | | | For the | | | For the | |
| | | | Year Ended | | | Year Ended | | | Year Ended | | | Year Ended | | | Year Ended | |
| | | | December 31, | | | December 31, | | | December 31, | | | December 31, | | | December 31, | |
| | | | 2018 | | | 2017 | | | 2016 | | | 2015 | | | 2014 | |
| PER SHARE DATA:(1) | | | | | | | | | | | | | | | | |
| Net Asset Value, Beginning of Year | | $ | 98.88 | | $ | 96.66 | | $ | 92.84 | | $ | 90.14 | | $ | 88.76 | |
| Income from Investment Operations: | | | | | | | | | | | | | | | | |
| Net investment income(2) | | | 1.13 | | | 0.27 | | | 0.18 | | | 0.19 | | | 0.06 | |
| Net realized and unrealized gain (loss) on investments | | | (0.05 | ) | | 2.16 | | | 3.75 | | | 2.60 | | | 1.32 | |
| Total from Investment Operations | | | 1.08 | | | 2.43 | | | 3.93 | | | 2.79 | | | 1.38 | |
| Redemption Fees(3) | | | 0.00 | | | 0.00 | | | 0.00 | | | 0.00 | | | 0.00 | |
| Less Distributions: | | | | | | | | | | | | | | | | |
| From net investment income | | | (1.23 | ) | | (0.21 | ) | | (0.11 | ) | | (0.09 | ) | | — | |
| Total Distributions | | | (1.23 | ) | | (0.21 | ) | | (0.11 | ) | | (0.09 | ) | | — | |
| Net Asset Value, End of Year | | $ | 98.73 | | $ | 98.88 | | $ | 96.66 | | $ | 92.84 | | $ | 90.14 | |
| Total return | | | 1.10 | % | | 2.51 | % | | 4.22 | % | | 3.09 | % | | 1.72 | % |
| | | | | | | | | | | | | | | | | |
| SUPPLEMENTAL DATA AND RATIOS | | | | | | | | | | | | | | | | |
| Net assets, end of year (000’s) | | $ | 12,718 | | $ | 15,008 | | $ | 18,165 | | $ | 20,255 | | $ | 26,874 | |
| Ratio of operating expenses to average net assets: | | | | | | | | | | | | | | | | |
| Before expense reimbursement | | | 1.83 | % | | 1.70 | % | | 1.73 | % | | 1.69 | % | | 1.75 | % |
| After expense reimbursement(4) | | | 0.75 | % | | 0.75 | % | | 0.75 | % | | 0.75 | % | | 0.75 | % |
| Ratio of net investment income to average net assets: | | | 1.14 | % | | 0.28 | % | | 0.19 | % | | 0.21 | % | | 0.06 | % |
| Portfolio turnover rate(5) | | | 0 | % | | 0 | % | | 1 | % | | 6 | % | | 17 | % |
| (1) | Information presented relates to a share of capital stock outstanding for each year. |
| (2) | Net investment income per share represents net investment income divided by the average shares outstanding throughout the year. |
| (3) | Amount calculated is less than $0.005. |
| (4) | See Note #3, Investment Adviser, for the waiver and expense reimbursement discussion. |
| (5) | Portfolio turnover of The Alternative Income Portfolio. |
The accompanying notes are an integral part of these financial statements.
| KINETICS MUTUAL FUNDS, INC. — THE FEEDER FUNDS |
| Financial Highlights — (Continued) |
| | | | The Multi-Disciplinary Income Fund | |
| | | | No Load Class | |
| | | | For the | | | For the | | | For the | | | For the | | | For the | |
| | | | Year Ended | | | Year Ended | | | Year Ended | | | Year Ended | | | Year Ended | |
| | | | December 31, | | | December 31, | | | December 31, | | | December 31, | | | December 31, | |
| | | | 2018 | | | 2017 | | | 2016 | | | 2015 | | | 2014 | |
| PER SHARE DATA:(1) | | | | | | | | | | | | | | | | |
| Net Asset Value, Beginning of Year | | $ | 11.02 | | $ | 10.95 | | $ | 10.32 | | $ | 10.79 | | $ | 11.02 | |
| Income from Investment Operations: | | | | | | | | | | | | | | | | |
| Net investment income(2) | | | 0.44 | | | 0.37 | | | 0.43 | | | 0.37 | | | 0.33 | |
| Net realized and unrealized gain (loss) on investments | | | (0.55 | ) | | 0.14 | | | 0.63 | | | (0.60 | ) | | (0.06 | ) |
| Total from Investment Operations | | | (0.11 | ) | | 0.51 | | | 1.06 | | | (0.23 | ) | | 0.27 | |
| Redemption Fees | | | — | | | 0.00 | (3) | | — | | | 0.00 | (3) | | 0.00 | (3) |
| Less Distributions: | | | | | | | | | | | | | | | | |
| From net investment income | | | (0.45 | ) | | (0.44 | ) | | (0.43 | ) | | (0.23 | ) | | (0.29 | ) |
| From net realized gains | | | — | | | — | | | — | | | (0.01 | ) | | (0.21 | ) |
| Total Distributions | | | (0.45 | ) | | (0.44 | ) | | (0.43 | ) | | (0.24 | ) | | (0.50 | ) |
| Net Asset Value, End of Year | | $ | 10.46 | | $ | 11.02 | | $ | 10.95 | | $ | 10.32 | | $ | 10.79 | |
| Total return | | | (1.00 | )% | | 4.75 | % | | 10.41 | % | | (2.17 | )% | | 2.46 | % |
| | | | | | | | | | | | | | | | | |
| SUPPLEMENTAL DATA AND RATIOS | | | | | | | | | | | | | | | | |
| Net assets, end of year (000’s) | | $ | 6,134 | | $ | 6,974 | | $ | 6,809 | | $ | 6,108 | | $ | 10,105 | |
| Ratio of operating expenses to average net assets: | | | | | | | | | | | | | | | | |
| Before expense reimbursement | | | 1.97 | % | | 1.91 | % | | 1.85 | % | | 1.79 | % | | 1.79 | % |
| After expense reimbursement(4) | | | 1.49 | % | | 1.49 | % | | 1.49 | % | | 1.49 | % | | 1.49 | % |
| Ratio of net investment income to average net assets: | | | 4.06 | % | | 3.37 | % | | 4.02 | % | | 3.38 | % | | 2.93 | % |
| Portfolio turnover rate(5) | | | 2 | % | | 16 | % | | 9 | % | | 10 | % | | 35 | % |
| (1) | Information presented relates to a share of capital stock outstanding for each year. |
| (2) | Net investment income per share represents net investment income divided by the average shares outstanding throughout the year. |
| (3) | Amount calculated is less than $0.005. |
| (4) | See Note #3, Investment Adviser, for the waiver and expense reimbursement discussion. |
| (5) | Portfolio turnover of The Multi-Disciplinary Income Portfolio. |
The accompanying notes are an integral part of these financial statements.
| KINETICS MUTUAL FUNDS, INC. — THE FEEDER FUNDS |
| Financial Highlights — (Continued) |
| | | | The Multi-Disciplinary Income Fund | |
| | | | Advisor Class A | |
| | | | For the | | | For the | | | For the | | | For the | | | For the | |
| | | | Year Ended | | | Year Ended | | | Year Ended | | | Year Ended | | | Year Ended | |
| | | | December 31, | | | December 31, | | | December 31, | | | December 31, | | | December 31, | |
| | | | 2018 | | | 2017 | | | 2016 | | | 2015 | | | 2014 | |
| PER SHARE DATA:(1) | | | | | | | | | | | | | | | | |
| Net Asset Value, Beginning of Year | | $ | 10.96 | | $ | 10.90 | | $ | 10.27 | | $ | 10.75 | | $ | 10.98 | |
| Income from Investment Operations: | | | | | | | | | | | | | | | | |
| Net investment income(2) | | | 0.41 | | | 0.34 | | | 0.40 | | | 0.34 | | | 0.30 | |
| Net realized and unrealized gain (loss) on investments | | | (0.54 | ) | | 0.13 | | | 0.63 | | | (0.60 | ) | | (0.06 | ) |
| Total from Investment Operations | | | (0.13 | ) | | 0.47 | | | 1.03 | | | (0.26 | ) | | 0.24 | |
| Redemption Fees | | | — | | | 0.00 | (3) | | — | | | 0.00 | (3) | | 0.00 | (3) |
| Less Distributions: | | | | | | | | | | | | | | | | |
| From net investment income | | | (0.42 | ) | | (0.41 | ) | | (0.40 | ) | | (0.21 | ) | | (0.26 | ) |
| From net realized gains | | | — | | | — | | | — | | | (0.01 | ) | | (0.21 | ) |
| Total Distributions | | | (0.42 | ) | | (0.41 | ) | | (0.40 | ) | | (0.22 | ) | | (0.47 | ) |
| Net Asset Value, End of Year | | $ | 10.41 | | $ | 10.96 | | $ | 10.90 | | $ | 10.27 | | $ | 10.75 | |
| Total return(4) | | | (1.18 | )% | | 4.40 | % | | 10.17 | % | | (2.46 | )% | | 2.17 | % |
| | | | | | | | | | | | | | | | | |
| SUPPLEMENTAL DATA AND RATIOS | | | | | | | | | | | | | | | | |
| Net assets, end of year (000’s) | | $ | 2,811 | | $ | 4,640 | | $ | 6,935 | | $ | 8,754 | | $ | 12,281 | |
| Ratio of operating expenses to average net assets: | | | | | | | | | | | | | | | | |
| Before expense reimbursement | | | 2.22 | % | | 2.16 | % | | 2.10 | % | | 2.04 | % | | 2.04 | % |
| After expense reimbursement(5) | | | 1.74 | % | | 1.74 | % | | 1.74 | % | | 1.74 | % | | 1.74 | % |
| Ratio of net investment income to average net assets: | | | 3.81 | % | | 3.12 | % | | 3.77 | % | | 3.13 | % | | 2.68 | % |
| Portfolio turnover rate(6) | | | 2 | % | | 16 | % | | 9 | % | | 10 | % | | 35 | % |
| (1) | Information presented relates to a share of capital stock outstanding for each year. |
| (2) | Net investment income per share represents net investment income divided by the average shares outstanding throughout the year. |
| (3) | Amount calculated is less than $0.005. |
| (4) | The total return calculation does not reflect the 5.75% front end sales charge on Advisor Class A shares. |
| (5) | See Note #3, Investment Adviser, for the waiver and expense reimbursement discussion. |
| (6) | Portfolio turnover of The Multi-Disciplinary Income Portfolio. |
The accompanying notes are an integral part of these financial statements.
| KINETICS MUTUAL FUNDS, INC. — THE FEEDER FUNDS |
| Financial Highlights — (Continued) |
| | | | The Multi-Disciplinary Income Fund | |
| | | | Advisor Class C | |
| | | | For the | | | For the | | | For the | | | For the | | | For the | |
| | | | Year Ended | | | Year Ended | | | Year Ended | | | Year Ended | | | Year Ended | |
| | | | December 31, | | | December 31, | | | December 31, | | | December 31, | | | December 31, | |
| | | | 2018 | | | 2017 | | | 2016 | | | 2015 | | | 2014 | |
| PER SHARE DATA:(1) | | | | | | | | | | | | | | | | |
| Net Asset Value, Beginning of Year | | $ | 10.86 | | $ | 10.79 | | $ | 10.18 | | $ | 10.65 | | $ | 10.90 | |
| Income from Investment Operations: | | | | | | | | | | | | | | | | |
| Net investment income(2) | | | 0.35 | | | 0.29 | | | 0.34 | | | 0.28 | | | 0.24 | |
| Net realized and unrealized gain (loss) on investments | | | (0.54 | ) | | 0.14 | | | 0.62 | | | (0.58 | ) | | (0.06 | ) |
| Total from Investment Operations | | | (0.19 | ) | | 0.43 | | | 0.96 | | | (0.30 | ) | | 0.18 | |
| Redemption Fees | | | — | | | — | | | — | | | — | | | 0.00 | (3) |
| Less Distributions: | | | | | | | | | | | | | | | | |
| From net investment income | | | (0.38 | ) | | (0.36 | ) | | (0.35 | ) | | (0.16 | ) | | (0.22 | ) |
| From net realized gains | | | — | | | — | | | — | | | (0.01 | ) | | (0.21 | ) |
| Total Distributions | | | (0.38 | ) | | (0.36 | ) | | (0.35 | ) | | (0.17 | ) | | (0.43 | ) |
| Net Asset Value, End of Year | | $ | 10.29 | | $ | 10.86 | | $ | 10.79 | | $ | 10.18 | | $ | 10.65 | |
| Total return | | | (1.83 | )% | | 4.00 | % | | 9.51 | % | | (2.84 | )% | | 1.61 | % |
| | | | | | | | | | | | | | | | | |
| SUPPLEMENTAL DATA AND RATIOS | | | | | | | | | | | | | | | | |
| Net assets, end of year (000’s) | | $ | 7,727 | | $ | 6,987 | | $ | 7,790 | | $ | 9,266 | | $ | 10,403 | |
| Ratio of operating expenses to average net assets: | | | | | | | | | | | | | | | | |
| Before expense reimbursement | | | 2.72 | % | | 2.66 | % | | 2.60 | % | | 2.54 | % | | 2.54 | % |
| After expense reimbursement(4) | | | 2.24 | % | | 2.24 | % | | 2.24 | % | | 2.24 | % | | 2.24 | % |
| Ratio of net investment income to average net assets: | | | 3.31 | % | | 2.62 | % | | 3.27 | % | | 2.63 | % | | 2.18 | % |
| Portfolio turnover rate(5) | | | 2 | % | | 16 | % | | 9 | % | | 10 | % | | 35 | % |
| (1) | Information presented relates to a share of capital stock outstanding for each year. |
| (2) | Net investment income per share represents net investment income divided by the average shares outstanding throughout the year. |
| (3) | Amount calculated is less than $0.005. |
| (4) | See Note #3, Investment Adviser, for the waiver and expense reimbursement discussion. |
| (5) | Portfolio turnover of The Multi-Disciplinary Income Portfolio. |
The accompanying notes are an integral part of these financial statements.
| KINETICS MUTUAL FUNDS, INC. — THE FEEDER FUNDS |
| Financial Highlights — (Continued) |
| | | | The Multi-Disciplinary Income Fund | |
| | | | Institutional Class | |
| | | | For the | | | For the | | | For the | | | For the | | | For the | |
| | | | Year Ended | | | Year Ended | | | Year Ended | | | Year Ended | | | Year Ended | |
| | | | December 31, | | | December 31, | | | December 31, | | | December 31, | | | December 31, | |
| | | | 2018 | | | 2017 | | | 2016 | | | 2015 | | | 2014 | |
| PER SHARE DATA:(1) | | | | | | | | | | | | | | | | |
| Net Asset Value, Beginning of Year | | $ | 11.04 | | $ | 10.97 | | $ | 10.34 | | $ | 10.82 | | $ | 11.06 | |
| Income from Investment Operations: | | | | | | | | | | | | | | | | |
| Net investment income(2) | | | 0.46 | | | 0.40 | | | 0.45 | | | 0.39 | | | 0.35 | |
| Net realized and unrealized gain (loss) on investments | | | (0.54 | ) | | 0.13 | | | 0.63 | | | (0.59 | ) | | (0.06 | ) |
| Total from Investment Operations | | | (0.08 | ) | | 0.53 | | | 1.08 | | | (0.20 | ) | | 0.29 | |
| Redemption Fees | | | — | | | — | | | 0.00 | (3) | | 0.00 | (3) | | — | |
| Less Distributions: | | | | | | | | | | | | | | | | |
| From net investment income | | | (0.48 | ) | | (0.46 | ) | | (0.45 | ) | | (0.27 | ) | | (0.32 | ) |
| From net realized gains | | | — | | | — | | | — | | | (0.01 | ) | | (0.21 | ) |
| Total Distributions | | | (0.48 | ) | | (0.46 | ) | | (0.45 | ) | | (0.28 | ) | | (0.53 | ) |
| Net Asset Value, End of Year | | $ | 10.48 | | $ | 11.04 | | $ | 10.97 | | $ | 10.34 | | $ | 10.82 | |
| Total return | | | (0.80 | )% | | 4.93 | % | | 10.61 | % | | (1.96 | )% | | 2.61 | % |
| | | | | | | | | | | | | | | | | |
| SUPPLEMENTAL DATA AND RATIOS | | | | | | | | | | | | | | | | |
| Net assets, end of year (000’s) | | $ | 20,567 | | $ | 30,399 | | $ | 78,084 | | $ | 66,199 | | $ | 102,590 | |
| Ratio of operating expenses to average net assets: | | | | | | | | | | | | | | | | |
| Before expense reimbursement | | | 1.92 | % | | 1.86 | % | | 1.80 | % | | 1.74 | % | | 1.74 | % |
| After expense reimbursement(4) | | | 1.29 | % | | 1.29 | % | | 1.29 | % | | 1.29 | % | | 1.29 | % |
| Ratio of net investment income to average net assets: | | | 4.26 | % | | 3.57 | % | | 4.22 | % | | 3.58 | % | | 3.13 | % |
| Portfolio turnover rate(5) | | | 2 | % | | 16 | % | | 9 | % | | 10 | % | | 35 | % |
| (1) | Information presented relates to a share of capital stock outstanding for each year. |
| (2) | Net investment income per share represents net investment income divided by the average shares outstanding throughout the year. |
| (3) | Amount calculated is less than $0.005. |
| (4) | See Note #3, Investment Adviser, for the waiver and expense reimbursement discussion. |
| (5) | Portfolio turnover of The Multi-Disciplinary Income Portfolio. |
The accompanying notes are an integral part of these financial statements.
| KINETICS MUTUAL FUNDS, INC. — THE FUND |
| Financial Highlights — (Continued) |
| | | | The Spin-off Fund | |
| | | | No Load Class | |
| | | | For the
Year Ended
December 31,
2018 | | | December 11,
2017^
through
December 31,
2017 | |
| PER SHARE DATA:(1) | | | | | | | |
| Net Asset Value, Beginning of Period | | $ | 11.14 | | $ | 10.81 | |
| Income from Investment Operations: | | | | | | | |
| Net investment income (loss)(2) | | | (0.08 | ) | | 0.00 | (3) |
| Net realized and unrealized gain (loss) on investments | | | (0.84 | ) | | 0.33 | |
| Total from Investment Operations | | | (0.92 | ) | | 0.33 | |
| Redemption Fees | | | — | | | — | |
| Less Distributions: | | | | | | | |
| From net realized gains | | | (0.45 | ) | | — | |
| Total Distributions | | | (0.45 | ) | | — | |
| Net Asset Value, End of Period | | $ | 9.77 | | $ | 11.14 | |
| Total return | | | (8.22 | )% | | 3.05 | %(4) |
| | | | | | | | |
| SUPPLEMENTAL DATA AND RATIOS | | | | | | | |
| Net assets, end of period (000’s) | | $ | 11 | | $ | 10 | |
| Ratio of operating expenses to average net assets: | | | | | | | |
| Before expense reimbursement | | | 1.84 | % | | 1.70 | %(5) |
| After expense reimbursement(6) | | | 1.45 | % | | 1.45 | %(5) |
| Ratio of net investment loss to average net assets: | | | (0.63 | )% | | (0.61 | )%(5) |
| Portfolio turnover rate | | | 9 | % | | 0 | %(4) |
| ^ | Commencement of operations. |
| (1) | Information presented relates to a share of capital stock outstanding for each period. |
| (2) | Net investment income per share represents net investment income divided by the average shares outstanding throughout the period. |
| (3) | Amount calculated is less than $0.005. |
| (4) | Not annualized. |
| (5) | Annualized. |
| (6) | See Note #3, Investment Adviser, for the waiver and expense reimbursement discussion. |
The accompanying notes are an integral part of these financial statements.
| KINETICS MUTUAL FUNDS, INC. — THE FUND |
| Financial Highlights — (Continued) |
| | | | The Spin-off Fund | |
| | | | Advisor Class A | |
| | | | For the Year Ended December 31, 2018 | | | For the Period Ended December 31, 2017^ | | �� | For the Year Ended April 30, 2017 | | | For the Year Ended April 30, 2016 | | | For the Year Ended April 30, 2015 | | | For the Year Ended April 30, 2014 | |
| PER SHARE DATA:(1) | | | | | | | | | | | | | | | | | | | |
| Net Asset Value, Beginning of Period | | $ | 10.67 | | $ | 9.82 | | $ | 8.52 | | $ | 10.22 | | $ | 10.32 | | $ | 8.74 | |
| Income from Investment Operations: | | | | | | | | | | | | | | | | | | | |
| Net investment income (loss)(2) | | | (0.08 | ) | | (0.02 | ) | | 0.03 | | | 0.00 | (3) | | (0.03 | ) | | (0.03 | ) |
| Net realized and unrealized gain (loss) on investments | | | (0.81 | ) | | 1.29 | | | 1.45 | | | (1.70 | ) | | (0.07 | ) | | 1.60 | |
| Net increase from payment by affiliates | | | — | | | — | | | — | | | — | | | — | | | 0.01 | |
| Total from Investment Operations | | | (0.89 | ) | | 1.27 | | | 1.48 | | | (1.70 | ) | | (0.10 | ) | | 1.58 | |
| Redemption Fees | | | — | | | — | | | — | | | — | | | — | | | — | |
| Less Distributions: | | | | | | | | | | | | | | | | | | | |
| From net investment income | | | — | | | 0.00 | (3) | | — | | | — | | | — | | | — | |
| From net realized gains | | | (0.45 | ) | | (0.42 | ) | | (0.18 | ) | | — | | | — | | | — | |
| Total Distributions | | | (0.45 | ) | | (0.42 | ) | | (0.18 | ) | | — | | | — | | | — | |
| Net Asset Value, End of Period | | $ | 9.33 | | $ | 10.67 | | $ | 9.82 | | $ | 8.52 | | $ | 10.22 | | $ | 10.32 | |
| Total return(4) | | | (8.30 | )% | | 12.95 | %(5) | | 17.36 | % | | (16.63 | )% | | (0.97 | )% | | 18.08 | %(8) |
| | | | | | | | | | | | | | | | | | | | |
| SUPPLEMENTAL DATA AND RATIOS | | | | | | | | | | | | | | | | | | | |
| Net assets, end of period (000’s) | | $ | 3,303 | | $ | 4,322 | | $ | 4,583 | | $ | 6,067 | | $ | 14,604 | | $ | 12,536 | |
| Ratio of operating expenses to average net assets: | | | | | | | | | | | | | | | | | | | |
| Before expense reimbursement | | | 2.06 | % | | 2.07% | (6) | | 2.45 | % | | 1.74 | % | | 1.77 | % | | 1.94 | % |
| After expense reimbursement(7) | | | 1.50 | % | | 1.50 | %(6) | | 1.50 | % | | 1.50 | % | | 1.50 | % | | 1.50 | % |
| Ratio of net investment income (loss) to average net assets: | | | (0.68 | )% | | (0.27 | )%(6) | | 0.31 | % | | 0.05 | % | | (0.30 | )% | | (0.32 | )% |
| Portfolio turnover rate | | | 9 | % | | 0 | %(5) | | 11 | % | | 2 | % | | 40 | % | | 18 | % |
| ^ | For the period May 1, 2017 through December 31, 2017. The Fund changed its fiscal year end from April 30 to December 31. |
| (1) | Information presented relates to a share of capital stock outstanding for each period. |
| (2) | Net investment income per share represents net investment income divided by the average shares outstanding throughout the period. |
| (3) | Amount calculated is less than $0.005. |
| (4) | The total return calculation does not reflect the 5.75% front end sales charge on Advisor Class A shares. |
| (5) | Not annualized. |
| (6) | Annualized. |
| (7) | See Note #3, Investment Adviser, for the waiver and expense reimbursement discussion. |
| (8) | Total return would have been 17.96% had the Advisor not reimbursed the Fund for the loss on a portfolio investment. |
The accompanying notes are an integral part of these financial statements.
| KINETICS MUTUAL FUNDS, INC. — THE FUND |
| Financial Highlights — (Continued) |
| | | | The Spin-off Fund | |
| | | | Advisor Class C | |
| | | | For the Year Ended December 31, 2018 | | | For the Period Ended December 31, 2017^ | | | For the Year Ended April 30, 2017 | | | For the Year Ended April 30, 2016 | | | For the Year Ended April 30, 2015 | | | For the Year Ended April 30, 2014 | |
| PER SHARE DATA:(1) | | | | | | | | | | | | | | | | | | | |
| Net Asset Value, Beginning of Period | | $ | 10.17 | | $ | 9.43 | | $ | 8.25 | | $ | 9.97 | | $ | 10.14 | | $ | 8.64 | |
| Income from Investment Operations: | | | | | | | | | | | | | | | | | | | |
| Net investment loss(2) | | | (0.16 | ) | | (0.07 | ) | | (0.04 | ) | | (0.06 | ) | | (0.11 | ) | | (0.09 | ) |
| Net realized and unrealized gain (loss) on investments | | | (0.76 | ) | | 1.23 | | | 1.40 | | | (1.66 | ) | | (0.06 | ) | | 1.58 | |
| Net increase from payment by affiliates | | | — | | | — | | | — | | | — | | | — | | | 0.01 | |
| Total from Investment Operations | | | (0.92 | ) | | 1.16 | | | 1.36 | | | (1.72 | ) | | (0.17 | ) | | 1.50 | |
| Redemption Fees | | | — | | | — | | | — | | | — | | | — | | | — | |
| Less Distributions: | | | | | | | | | | | | | | | | | | | |
| From net realized gains | | | (0.45 | ) | | (0.42 | ) | | (0.18 | ) | | — | | | — | | | — | |
| Total Distributions | | | (0.45 | ) | | (0.42 | ) | | (0.18 | ) | | — | | | — | | | — | |
| Net Asset Value, End of Period | | $ | 8.80 | | $ | 10.17 | | $ | 9.43 | | $ | 8.25 | | $ | 9.97 | | $ | 10.14 | |
| Total return | | | (9.00 | )% | | 12.31 | %(3) | | 16.46 | % | | (17.25 | )% | | (1.68 | )% | | 17.36 | %(6) |
| | | | | | | | | | | | | | | | | | | | |
| SUPPLEMENTAL DATA AND RATIOS | | | | | | | | | | | | | | | | | | | |
| Net assets, end of period (000’s) | | $ | 4,114 | | $ | 5,526 | | $ | 5,678 | | $ | 6,290 | | $ | 12,057 | | $ | 10,701 | |
| Ratio of operating expenses to average net assets: | | | | | | | | | | | | | | | | | | | |
| Before expense reimbursement | | | 2.56 | % | | 2.82 | %(4) | | 3.20 | % | | 2.49 | % | | 2.52 | % | | 2.53 | % |
| After expense reimbursement(5) | | | 2.25 | % | | 2.25 | %(4) | | 2.25 | % | | 2.25 | % | | 2.25 | % | | 2.09 | % |
| Ratio of net investment loss to average net assets: | | | (1.43 | )% | | (1.02 | )%(4) | | (0.44 | )% | | (0.70 | )% | | (1.05 | )% | | (0.91 | )% |
| Portfolio turnover rate | | | 9 | % | | 0 | %(3) | | 11 | % | | 2 | % | | 40 | % | | 18 | % |
| ^ | For the period May 1, 2017 through December 31, 2017. The Fund changed its fiscal year end from April 30 to December 31. |
| (1) | Information presented relates to a share of capital stock outstanding for each period. |
| (2) | Net investment income per share represents net investment income divided by the average shares outstanding throughout the period. |
| (3) | Not annualized. |
| (4) | Annualized. |
| (5) | See Note #3, Investment Adviser, for the waiver and expense reimbursement discussion. |
| (6) | Total return would have been 17.25% had the Advisor not reimbursed the Fund for the loss on a portfolio investment. |
The accompanying notes are an integral part of these financial statements.
| KINETICS MUTUAL FUNDS, INC. — THE FUND |
| Financial Highlights — (Continued) |
| | | | The Spin-off Fund | |
| | | | Institutional Class | |
| | | | For the
Year Ended
December 31,
2018 | | | For the
Period Ended
December 31,
2017^ | | | For the
Year Ended
April 30,
2017 | | | For the
Year Ended
April 30,
2016 | | | For the
Year Ended
April 30,
2015 | | | For the
Year Ended
April 30,
2014 | |
| PER SHARE DATA:(1) | | | | | | | | | | | | | | | | | | | |
| Net Asset Value, Beginning of Period | | $ | 10.68 | | $ | 9.85 | | $ | 8.53 | | $ | 10.20 | | $ | 10.27 | | $ | 8.67 | |
| Income from Investment Operations: | | | | | | | | | | | | | | | | | | | |
| Net investment income (loss)(2) | | | (0.05 | ) | | 0.00 | (3) | | 0.05 | | | 0.03 | | | (0.01 | ) | | (0.01 | ) |
| Net realized and unrealized gain (loss) on investments | | | (0.82 | ) | | 1.29 | | | 1.45 | | | (1.70 | ) | | (0.06 | ) | | 1.60 | |
| Net increase from payment by affiliates | | | — | | | — | | | — | | | — | | | — | | | 0.01 | |
| Total from Investment Operations | | | (0.87 | ) | | 1.29 | | | 1.50 | | | (1.67 | ) | | (0.07 | ) | | 1.60 | |
| Redemption Fees | | | — | | | 0.00 | (3) | | — | | | — | | | — | | | — | |
| Less Distributions: | | | | | | | | | | | | | | | | | | | |
| From net investment income | | | — | | | (0.04 | ) | | — | | | — | | | — | | | — | |
| From net realized gains | | | (0.45 | ) | | (0.42 | ) | | (0.18 | ) | | — | | | — | | | — | |
| Total Distributions | | | (0.45 | ) | | (0.46 | ) | | (0.18 | ) | | — | | | — | | | — | |
| Net Asset Value, End of Period | | $ | 9.36 | | $ | 10.68 | | $ | 9.85 | | $ | 8.53 | | $ | 10.20 | | $ | 10.27 | |
| Total return | | | (8.11 | )% | | 13.07 | %(4) | | 17.57 | % | | (16.37 | )% | | (0.68 | )% | | 18.45 | %(6) |
| | | | | | | | | | | | | | | | | | | | |
| SUPPLEMENTAL DATA AND RATIOS | | | | | | | | | | | | | | | | | | | |
| Net assets, end of period (000’s) | | $ | 11,290 | | $ | 14,050 | | $ | 12,022 | | $ | 24,185 | | $ | 52,312 | | $ | 52,635 | |
| Ratio of operating expenses to average net assets: | | | | | | | | | | | | | | | | | | | |
| Before expense reimbursement | | | 1.76 | % | | 1.83 | %(5) | | 2.20 | % | | 1.49 | % | | 1.52 | % | | 1.69 | % |
| After expense reimbursement(7) | | | 1.25 | % | | 1.25 | %(5) | | 1.25 | % | | 1.25 | % | | 1.25 | % | | 1.25 | % |
| Ratio of net investment income (loss) to average net assets: | | | (0.43 | )% | | (0.02 | )%(5) | | 0.56 | % | | 0.30 | % | | (0.05 | )% | | (0.07 | )% |
| Portfolio turnover rate | | | 9 | % | | 0 | %(4) | | 11 | % | | 2 | % | | 40 | % | | 18 | % |
| ^ | For the period May 1, 2017 through December 31, 2017. The Fund changed its fiscal year end from April 30 to December 31. |
| (1) | Information presented relates to a share of capital stock outstanding for each period. |
| (2) | Net investment income per share represents net investment income divided by the average shares outstanding throughout the period. |
| (3) | Amount calculated is less than $0.005. |
| (4) | Not annualized. |
| (5) | Annualized. |
| (6) | Total return would have been 18.34% had the Advisor not reimbursed the Fund for the loss on a portfolio investment. |
| (7) | See Note #3, Investment Adviser, for the waiver and expense reimbursement discussion. |
The accompanying notes are an integral part of these financial statements.
| KINETICS MUTUAL FUNDS, INC. |
| Report of Independent Registered |
| Public Accounting Firm |
To the Shareholders and Board of
Directors of Kinetics Mutual Funds, Inc.
Opinion on the Financial Statements
We have audited the accompanying statements of assets and liabilities of The Internet Fund, The Global Fund, The Paradigm Fund, The Medical Fund, The Small Cap Opportunities Fund, The Market Opportunities Fund, The Alternative Income Fund, The Multi-Disciplinary Income Fund, and the Kinetics Spin-off and Corporate Restructuring Fund (the “Funds”), each a series of Kinetics Mutual Funds, Inc. (the “Trust”), including the portfolios of investments, as of December 31, 2018, the related statements of operations for the year then ended, the statements of changes in net assets for each of the two years in the period then ended, financial highlights for each of the five years in the period then ended, and the related notes (collectively referred to as the “financial statements”) and with respect to Kinetics Spin-off and Corporate Restructuring Fund, the statements of changes in net assets for the year ended December 31, 2018, the period ended December 31, 2017, and the year ended April 30, 2017, and the financial highlights for the year ended December 31, 2018, the period ended December 31, 2017, and each year in the four year period ended April 30, 2017. In our opinion, the financial statements present fairly, in all material respects, the financial position of the Funds as of December 31, 2018, the results of their operations for the year then ended, and the changes in their net assets and their financial highlights for the periods indicated above, in conformity with accounting principles generally accepted in the United States of America.
Basis for Opinion
These financial statements are the responsibility of the Funds’ management. Our responsibility is to express an opinion on the Funds’ financial statements based on our audits. We are a public accounting firm registered with the Public Company Accounting Oversight Board (United States) (“PCAOB”) and are required to be independent with respect to the Funds in accordance with the U.S. federal securities laws and the applicable rules and regulations of the Securities and Exchange Commission and the PCAOB. We have served as the auditor of one or more of the funds in the Trust since 2004.
We conducted our audits in accordance with the standards of the PCAOB. Those standards require that we plan and perform the audits to obtain reasonable assurance about whether the financial statements are free of material misstatement, whether due to error or fraud. The Funds are not required to have, nor were we engaged to perform, an audit of the Funds’ internal control over financial reporting. As part of our audits we are required to obtain an understanding of internal control over financial reporting, but not for the purpose of expressing an opinion on the effectiveness of the Funds’ internal control over financial reporting. Accordingly, we express no such opinion.
| KINETICS MUTUAL FUNDS, INC. |
| Report of Independent Registered |
| Public Accounting Firm (Continued) |
Our audits included performing procedures to assess the risks of material misstatement of the financial statements, whether due to error or fraud, and performing procedures that respond to those risks. Such procedures included examining, on a test basis, evidence regarding the amounts and disclosures in the financial statements. Our audits also included evaluating the accounting principles used and significant estimates made by management, as well as evaluating the overall presentation of the financial statements. With respect to Kinetics Spin-off and Corporate Restructing Fund, our procedures included confirmation of securities owned as of December 31, 2018 by correspondence with the custodian. We believe that our audits provide a reasonable basis for our opinion.

Philadelphia, Pennsylvania
March 1, 2019
| KINETICS PORTFOLIOS TRUST — MASTER INVESTMENT PORTFOLIOS |
| Allocation of Consolidated Portfolio Assets |
| December 31, 2018 |
The Internet Portfolio
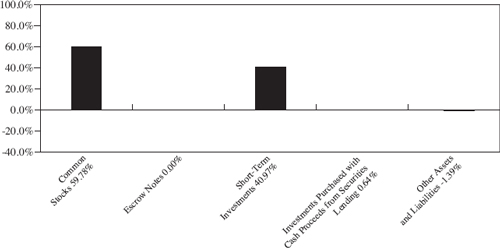
| | | | | | | Percentage | |
| | | | Market | | | of Total | |
| Sector Allocation* | | | Value | | | Net Assets | |
| Information | | $ | 22,684,837 | | | 21.4 | % |
| Finance and Insurance# | | | 16,187,580 | | | 15.3 | % |
| Mining, Quarrying, and Oil and Gas Extraction | | | 11,388,312 | | | 10.8 | % |
| Professional, Scientific, and Technical Services | | | 5,894,205 | | | 5.6 | % |
| Administrative and Support and Waste Management and | | | | | | | |
| Remediation Services | | | 5,299,230 | | | 5.0 | % |
| Arts, Entertainment, and Recreation | | | 993,040 | | | 0.9 | % |
| Management of Companies and Enterprises | | | 781,996 | | | 0.7 | % |
| Retail Trade | | | 75,176 | | | 0.1 | % |
| * | Excludes Short-Term Investments |
| # | In the Finance and Insurance Sector, $8,511,265 represents a cryptocurrency investment of 8.0% of total net assets as of December 31, 2018. |
| KINETICS PORTFOLIOS TRUST — MASTER INVESTMENT PORTFOLIOS |
| Allocation of Portfolio Assets |
| December 31, 2018 — (Continued) |
The Global Portfolio
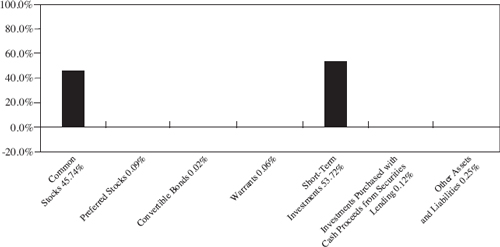
| | | | | | | Percentage | |
| | | | Market | | | of Total | |
| Country Allocation* | | | Value | | | Net Assets | |
| United States# | | $ | 3,001,151 | | | 27.3 | % |
| Canada | | | 1,073,626 | | | 9.8 | % |
| France | | | 299,472 | | | 2.7 | % |
| Cayman Islands | | | 275,000 | | | 2.5 | % |
| United Kingdom | | | 271,553 | | | 2.5 | % |
| Brazil | | | 69,174 | | | 0.6 | % |
| Australia | | | 33,175 | | | 0.3 | % |
| New Zealand | | | 6,550 | | | 0.1 | % |
| Guernsey | | | 6,332 | | | 0.1 | % |
| Bermuda | | | 451 | | | 0.0 | % |
| * | Excludes Short-Term Investments |
| # | In the United States Sector, $620,602 represents a cryptocurrency investment of 5.7% of total net assets as of December 31, 2018. |
| KINETICS PORTFOLIOS TRUST — MASTER INVESTMENT PORTFOLIOS |
| Allocation of Consolidated Portfolio Assets |
| December 31, 2018 — (Continued) |
The Paradigm Portfolio
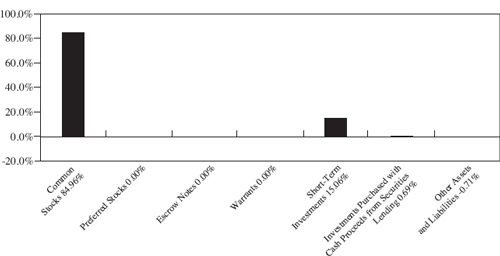
| | | | | | | Percentage | |
| | | | Market | | | of Total | |
| Sector Allocation* | | | Value | | | Net Assets | |
| Mining, Quarrying, and Oil and Gas Extraction | | $ | 249,528,852 | | | 37.9 | % |
| Finance and Insurance# | | | 81,105,338 | | | 12.3 | % |
| Information | | | 65,608,324 | | | 10.0 | % |
| Real Estate and Rental and Leasing | | | 59,901,470 | | | 9.1 | % |
| Management of Companies and Enterprises | | | 41,768,229 | | | 6.3 | % |
| Arts, Entertainment, and Recreation | | | 31,369,788 | | | 4.8 | % |
| Accommodation and Food Services | | | 12,339,438 | | | 1.9 | % |
| Retail Trade | | | 5,076,964 | | | 0.8 | % |
| Professional, Scientific, and Technical Services | | | 4,375,892 | | | 0.7 | % |
| Manufacturing | | | 3,413,786 | | | 0.5 | % |
| Transportation and Warehousing | | | 2,455,644 | | | 0.4 | % |
| Utilities | | | 2,358,399 | | | 0.3 | % |
| * | Excludes Short-Term Investments |
| # | In the Finance and Insurance Sector, $7,793,603 represents a cryptocurrency investment of 1.2% of total net assets as of December 31, 2018. |
| KINETICS PORTFOLIOS TRUST — MASTER INVESTMENT PORTFOLIOS |
| Allocation of Portfolio Assets |
| December 31, 2018 — (Continued) |
The Medical Portfolio
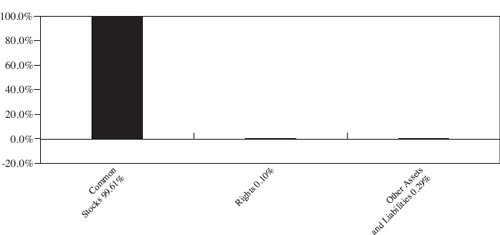
| | | | | | | Percentage | |
| | | | Market | | | of Total | |
| Sector Allocation* | | | Value | | | Net Assets | |
| Manufacturing | | $ | 13,486,088 | | | 81.9 | % |
| Professional, Scientific, and Technical Services | | | 2,935,842 | | | 17.8 | % |
| * | Excludes Short-Term Investments |
| KINETICS PORTFOLIOS TRUST — MASTER INVESTMENT PORTFOLIOS |
| Allocation of Consolidated Portfolio Assets |
| December 31, 2018 — (Continued) |
The Small Cap Opportunities Portfolio

| | | | | | | Percentage | |
| | | | Market | | | of Total | |
| Sector Allocation* | | | Value | | | Net Assets | |
| Mining, Quarrying, and Oil and Gas Extraction | | $ | 65,601,519 | | | 29.4 | % |
| Management of Companies and Enterprises | | | 27,464,354 | | | 12.3 | % |
| Real Estate and Rental and Leasing | | | 20,357,490 | | | 9.1 | % |
| Finance and Insurance# | | | 14,203,621 | | | 6.4 | % |
| Accommodation and Food Services | | | 10,626,514 | | | 4.8 | % |
| Arts, Entertainment, and Recreation | | | 8,126,250 | | | 3.6 | % |
| Manufacturing | | | 7,029,018 | | | 3.1 | % |
| Transportation and Warehousing | | | 6,324,111 | | | 2.8 | % |
| Professional, Scientific, and Technical Services | | | 1,944,405 | | | 0.9 | % |
| Wholesale Trade | | | 900,200 | | | 0.4 | % |
| Information | | | 334,560 | | | 0.1 | % |
| * | Excludes Short-Term Investments |
| # | In the Finance and Insurance Sector, $1,217,751 represents a cryptocurrency investment of 0.5% of total net assets as of December 31, 2018. |
| KINETICS PORTFOLIOS TRUST — MASTER INVESTMENT PORTFOLIOS |
| Allocation of Consolidated Portfolio Assets |
| December 31, 2018 — (Continued) |
The Market Opportunities Portfolio
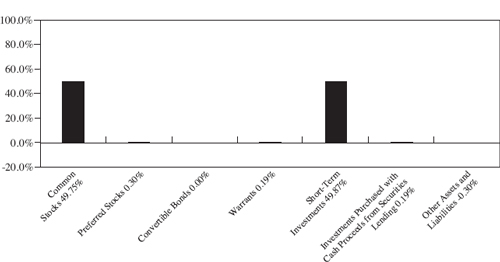
| | | | | | | Percentage | |
| | | | Market | | | of Total | |
| Sector Allocation* | | | Value | | | Net Assets | |
| Mining, Quarrying, and Oil and Gas Extraction | | $ | 19,816,744 | | | 27.2 | % |
| Finance and Insurance# | | | 9,065,419 | | | 12.4 | % |
| Management of Companies and Enterprises | | | 3,165,400 | | | 4.3 | % |
| Real Estate and Rental and Leasing | | | 2,450,380 | | | 3.4 | % |
| Information | | | 1,819,714 | | | 2.5 | % |
| Transportation and Warehousing | | | 283,343 | | | 0.4 | % |
| Manufacturing | | | 23,475 | | | 0.0 | % |
| Wholesale Trade | | | 18,864 | | | 0.0 | % |
| Retail Trade | | | 314 | | | 0.0 | % |
| * | Excludes Short-Term Investments |
| # | In the Finance and Insurance Sector, $2,386,430 represents a cryptocurrency investment of 3.3% of total net assets as of December 31, 2018. |
| KINETICS PORTFOLIOS TRUST — MASTER INVESTMENT PORTFOLIOS |
| Allocation of Portfolio Assets |
| December 31, 2018 — (Continued) |
The Alternative Income Portfolio
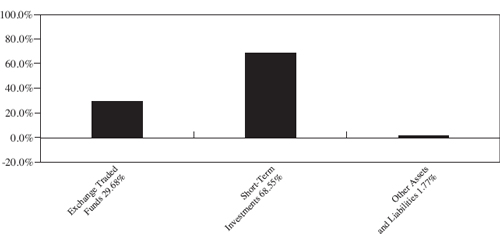
| | | | | | | Percentage | |
| | | | Market | | | of Total | |
| Sector Allocation* | | | Value | | | Net Assets | |
| Finance and Insurance | | $ | 5,677,683 | | | 29.7 | % |
| * | Excludes Short-Term Investments & Written Options |
| KINETICS PORTFOLIOS TRUST — MASTER INVESTMENT PORTFOLIOS |
| Allocation of Portfolio Assets |
| December 31, 2018 — (Continued) |
The Multi-Disciplinary Income Portfolio
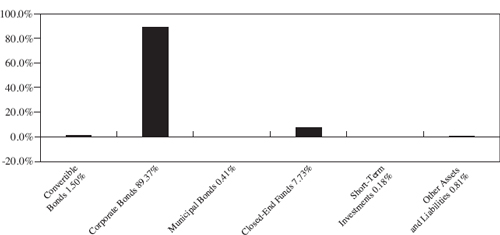
| | | | | | | Percentage | |
| | | | Market | | | of Total | |
| Sector Allocation* | | | Value | | | Net Assets | |
| Construction | | $ | 7,844,780 | | | 21.0 | % |
| Manufacturing | | | 6,961,317 | | | 18.6 | % |
| Information | | | 4,700,960 | | | 12.6 | % |
| Retail Trade | | | 3,558,875 | | | 9.5 | % |
| Mining, Quarrying, and Oil and Gas Extraction | | | 3,496,268 | | | 9.3 | % |
| Management of Companies and Enterprises | | | 2,951,250 | | | 7.9 | % |
| Finance and Insurance | | | 2,890,435 | | | 7.7 | % |
| Transportation and Warehousing | | | 2,580,401 | | | 6.9 | % |
| Real Estate and Rental and Leasing | | | 1,559,250 | | | 4.2 | % |
| Professional, Scientific, and Technical Services | | | 500,000 | | | 1.3 | % |
| * | Excludes Short-Term Investments |
| KINETICS PORTFOLIOS TRUST — MASTER INVESTMENT PORTFOLIOS |
| The Internet Portfolio |
| Consolidated Portfolio of Investments — December 31, 2018 |
| COMMON STOCKS — 59.78% | | | Shares | | | Value | |
| Administrative and Support Services — 5.00% | | | | | | | |
| CreditRiskMonitor.com, Inc. | | | 780 | | $ | 1,560 | |
| PayPal Holdings, Inc.*c | | | 63,000 | | | 5,297,670 | |
| | | | | | | 5,299,230 | |
| Broadcasting (except Internet) — 5.82% | | | | | | | |
| The E.W. Scripps Company — Class A | | | 40,000 | | | 629,200 | |
| The Madison Square Garden Company — Class A* | | | 16,366 | | | 4,381,178 | |
| MSG Networks Inc. — Class A* | | | 49,100 | | | 1,156,796 | |
| | | | | | | 6,167,174 | |
| Credit Intermediation and Related Activities — 1.71% | | | | | | | |
| LendingTree, Inc.* | | | 8,233 | | | 1,807,720 | |
| Data Processing, Hosting, and Related Services — 4.59% | | | | | | | |
| IHS Markit Limited* | | | 200 | | | 9,594 | |
| MasterCard, Inc. — Class A | | | 7,000 | | | 1,320,550 | |
| Verisk Analytics, Inc.* | | | 7,000 | | | 763,280 | |
| Visa, Inc. — Class A | | | 21,000 | | | 2,770,740 | |
| | | | | | | 4,864,164 | |
| Electronic Shopping and Mail-Order Houses — 0.07% | | | | | | | |
| Liberty Expedia Holdings, Inc. — Class A* | | | 1,800 | | | 70,398 | |
| Management of Companies and Enterprises — 0.74% | | | | | | | |
| Icahn Enterprises LP | | | 13,700 | | | 781,996 | |
| Oil and Gas Extraction — 10.75% | | | | | | | |
| Texas Pacific Land Trustc | | | 21,026 | | | 11,388,312 | |
| Other Information Services — 6.29% | | | | | | | |
| Alphabet, Inc. — Class A* | | | 3,200 | | | 3,343,872 | |
| Alphabet, Inc. — Class C* | | | 3,200 | | | 3,313,952 | |
| | | | | | | 6,657,824 | |
| Other Motor Vehicle Dealers — 0.00% | | | | | | | |
| Copart, Inc.* | | | 100 | | | 4,778 | |
| Other Professional, Scientific, and Technical Services — 0.36% | | | | | | | |
| GMO Internet, Inc. | | | 28,400 | | | 381,154 | |
The accompanying notes are an integral part of these financial statements.
| KINETICS PORTFOLIOS TRUST — MASTER INVESTMENT PORTFOLIOS |
| The Internet Portfolio |
| Consolidated Portfolio of Investments — December 31, 2018 — (Continued) |
| | | | Shares | | | Value | |
| Other Telecommunications — 3.11% | | | | | | | |
| Liberty Broadband Corporation — Series A* | | | 8,000 | | $ | 574,480 | |
| Liberty Broadband Corporation — Series C* | | | 8,000 | | | 576,240 | |
| Liberty Global plc — Series C* | | | 60,000 | | | 1,238,400 | |
| Liberty Latin America Limited — Class C* | | | 16,496 | | | 240,347 | |
| Liberty Media Corp.-Liberty SiriusXM — Class A* | | | 18,000 | | | 662,400 | |
| | | | | | | 3,291,867 | |
| Professional, Scientific, and Technical Services — 5.21% | | | | | | | |
| CACI International, Inc. — Class A* | | | 29,200 | | | 4,205,676 | |
| ManTech International Corporation — Class A | | | 25,000 | | | 1,307,375 | |
| | | | | | | 5,513,051 | |
| Satellite Telecommunications — 1.61% | | | | | | | |
| EchoStar Corporation — Class A* | | | 46,400 | | | 1,703,808 | |
| Securities and Commodity Exchanges — 0.59% | | | | | | | |
| Cboe Global Markets, Inc. | | | 6,424 | | | 628,460 | |
| Securities, Commodity Contracts, and Other Financial Investments and | | | | | | | |
| Related Activities — 12.99% | | | | | | | |
| Grayscale Bitcoin Trust^c | | | 2,146,599 | | | 8,511,265 | |
| CME Group, Inc. | | | 4,180 | | | 786,341 | |
| MarketAxess Holdings, Inc. | | | 5,000 | | | 1,056,550 | |
| OTC Markets Group Inc. — Class A | | | 116,985 | | | 3,397,244 | |
| | | | | | | 13,751,400 | |
| Spectator Sports — 0.94% | | | | | | | |
| Liberty Media Corp.-Liberty Braves — Class A* | | | 8,000 | | | 199,520 | |
| Liberty Media Corp.-Liberty Braves — Class C* | | | 8,000 | | | 199,120 | |
| Liberty Media Corp.-Liberty Formula One — Class A* | | | 20,000 | | | 594,400 | |
| | | | | | | 993,040 | |
| TOTAL COMMON STOCKS | | | | | | | |
| (cost $67,822,404) | | | | | | 63,304,376 | |
The accompanying notes are an integral part of these financial statements.
| KINETICS PORTFOLIOS TRUST — MASTER INVESTMENT PORTFOLIOS |
| The Internet Portfolio |
| Consolidated Portfolio of Investments — December 31, 2018 — (Continued) |
| | | | Principal | | | | |
| ESCROW NOTES — 0.00% | | | Amount | | | Value | |
| Other Telecommunications — 0.00% | | | | | | | |
| Adelphia Communications Corp. Preferred*+a | | $ | 190,000 | | $ | — | |
| TOTAL ESCROW NOTES | | | | | | | |
| (cost $0) | | | | | | — | |
| SHORT-TERM INVESTMENTS — 40.97% | | | Shares | | | | |
| Money Market Funds — 0.00% | | | | | | | |
| Fidelity Institutional Government Portfolio — Class I, 2.25%b | | | 169 | | | 169 | |
| | | | Principal | | | | |
| | | | Amount | | | | |
| U.S. Treasury Obligations — 40.97% | | | | | | | |
| United States Treasury Bills | | | | | | | |
| Maturity Date: 01/22/2019, Yield to Maturity 2.25% | | $ | 40,785,000 | | $ | 40,732,999 | |
| Maturity Date: 02/07/2019, Yield to Maturity 2.28% | | | 2,661,000 | | | 2,654,724 | |
| | | | | | | 43,387,723 | |
| TOTAL SHORT-TERM INVESTMENTS | | | | | | | |
| (cost $43,386,679) | | | | | | 43,387,892 | |
| INVESTMENTS PURCHASED WITH THE CASH | | | | | | | |
| PROCEEDS FROM SECURITIES LENDING — 0.64% | | | Shares | | | | |
| Money Market Funds — 0.64% | | | | | | | |
| First American Government Obligations Fund — Class X, 2.36%b | | | 672,458 | | | 672,458 | |
| TOTAL INVESTMENTS PURCHASED WITH THE CASH PROCEEDS | | | | | | | |
| FROM SECURITIES LENDING | | | | | | | |
| (cost $672,458) | | | | | | 672,458 | |
| | | | | | | | |
| TOTAL INVESTMENTS — 101.39% | | | | | | | |
| (cost $111,881,541) | | | | | $ | 107,364,726 | |
| Percentages are stated as a percent of net assets. |
| * — | Non-income producing security. |
| ^ — | This security or a portion of this security was out on loan at December 31, 2018. Total loaned securities had a market value of $592,510 at December 31, 2018. The remaining contractual maturities of all of the securities lending transactions were overnight and continuous. |
| + — | Security is considered illiquid and was fair valued. The aggregate value of such securities is $0 or 0.00% of net assets. |
| a — | Value determined using significant unobservable inputs. |
| b — | The rate quoted is the annualized seven-day yield as of December 31, 2018. |
| c — | Significant Investment — See note 2. |
The accompanying notes are an integral part of these financial statements.
| KINETICS PORTFOLIOS TRUST — MASTER INVESTMENT PORTFOLIOS |
| The Global Portfolio |
| Consolidated Portfolio of Investments — December 31, 2018 — (Continued) |
| COMMON STOCKS — 45.74% | | | Shares | | | Value | |
| Accommodation — 2.63% | | | | | | | |
| Civeo Corporation* | | | 201,600 | | $ | 288,288 | |
| Lessors of Nonfinancial Intangible Assets (except Copyrighted Works) — 0.02% | | | | | | | |
| PrairieSky Royalty Limited | | | 200 | | | 2,588 | |
| Management of Companies and Enterprises — 4.91% | | | | | | | |
| Bollore SA | | | 72,000 | | | 288,729 | |
| Clarke Inc.* | | | 24,800 | | | 227,073 | |
| Icahn Enterprises LP | | | 400 | | | 22,832 | |
| | | | | | | 538,634 | |
| Mining (except Oil and Gas) — 3.01% | | | | | | | |
| Franco-Nevada Corporation | | | 2,800 | | | 196,476 | |
| NovaGold Resources Inc.* | | | 4,000 | | | 15,800 | |
| Wheaton Precious Metals Corporation | | | 6,050 | | | 118,157 | |
| | | | | | | 330,433 | |
| Oil and Gas Extraction — 14.27% | | | | | | | |
| Texas Pacific Land Trustc | | | 2,890 | | | 1,565,311 | |
| Other Financial Investment Activities — 1.76% | | | | | | | |
| Brookfield Asset Management Inc. — Class A | | | 4,000 | | | 153,400 | |
| Burford Capital Limited | | | 300 | | | 6,332 | |
| IMF Bentham Limited | | | 15,000 | | | 33,175 | |
| | | | | | | 192,907 | |
| Other Investment Pools and Funds — 0.51% | | | | | | | |
| Partners Value Investments LP | | | 1,993 | | | 56,205 | |
| Other Pipeline Transportation — 0.10% | | | | | | | |
| Rubis SCA | | | 200 | | | 10,743 | |
| Other Telecommunications — 0.06% | | | | | | | |
| Liberty Latin America Limited — Class A* | | | 9 | | | 130 | |
| Liberty Latin America Limited — Class C* | | | 22 | | | 321 | |
| NZME Limited | | | 20,000 | | | 6,550 | |
| | | | | | | 7,001 | |
| Professional, Scientific, and Technical Services — 4.86% | | | | | | | |
| CACI International, Inc. — Class A* | | | 3,700 | | | 532,911 | |
The accompanying notes are an integral part of these financial statements.
| KINETICS PORTFOLIOS TRUST — MASTER INVESTMENT PORTFOLIOS |
| The Global Portfolio |
| Consolidated Portfolio of Investments — December 31, 2018 — (Continued) |
| | | | Shares | | | Value | |
| Securities and Commodity Exchanges — 1.63% | | | | | | | |
| B3 SA — Brasil Bolsa Balcao | | | 10,000 | | $ | 69,174 | |
| Cboe Global Markets, Inc. | | | 1,118 | | | 109,374 | |
| | | | | | | 178,548 | |
| Securities, Commodity Contracts, and Other Financial Investments and | | | | | | | |
| Related Activities — 7.00% | | | | | | | |
| Grayscale Bitcoin Trust^c | | | 156,520 | | | 620,602 | |
| CME Group, Inc. | | | 786 | | | 147,862 | |
| | | | | | | 768,464 | |
| Support Activities for Mining — 2.51% | | | | | | | |
| Siem Industries Inc.* | | | 5,500 | | | 275,000 | |
| Support Activities for Water Transportation — 2.47% | | | | | | | |
| Braemar Shipping Services plc | | | 2,000 | | | 5,162 | |
| Clarkson plc | | | 11,000 | | | 266,391 | |
| | | | | | | 271,553 | |
| TOTAL COMMON STOCKS | | | | | | | |
| (cost $4,159,811) | | | | | | 5,018,586 | |
| | | | | | | | |
| PREFERRED STOCKS — 0.09% | | | | | | | |
| Other Investment Pools and Funds — 0.09% | | | | | | | |
| Partners Value Investments LP — Class A | | | 515 | | | 9,538 | |
| TOTAL PREFERRED STOCKS | | | | | | | |
| (cost $9,785) | | | | | �� | 9,538 | |
| | | | Principal | | | | |
| CONVERTIBLE BONDS — 0.02% | | | Amount | | | | |
| Department Stores — 0.02% | | | | | | | |
| Sears Holdings Corporation, 8.000%, 12/15/2019e | | $ | 41,080 | | | 2,259 | |
| TOTAL CONVERTIBLE BONDS | | | | | | | |
| (cost $41,080) | | | | | | 2,259 | |
| WARRANTS — 0.06% | | | Shares | | | | |
| Other Investment Pools and Funds — 0.06% | | | | | | | |
| Partners Value Investments LP* | | | 1,893 | | | 6,101 | |
| TOTAL WARRANTS | | | | | | | |
| (cost $7,160) | | | | | | 6,101 | |
The accompanying notes are an integral part of these financial statements.
| KINETICS PORTFOLIOS TRUST — MASTER INVESTMENT PORTFOLIOS |
| The Global Portfolio |
| Consolidated Portfolio of Investments — December 31, 2018 — (Continued) |
| SHORT-TERM INVESTMENTS — 53.72% | | | Shares | | | Value | |
| Money Market Funds — 0.01% | | | | | | | |
| Fidelity Institutional Government Portfolio — Class I, 2.25%b | | | 951 | | $ | 951 | |
| | | | Principal | | | | |
| | | | Amount | | | | |
| U.S. Treasury Obligations — 53.71% | | | | | | | |
| United States Treasury Bills | | | | | | | |
| Maturity Date: 01/08/2019, Yield to Maturity 2.23% | | $ | 68,000 | | | 67,975 | |
| Maturity Date: 01/22/2019, Yield to Maturity 2.25% | | | 986,000 | | | 984,743 | |
| Maturity Date: 02/12/2019, Yield to Maturity 2.29% | | | 4,597,000 | | | 4,584,375 | |
| Maturity Date: 02/19/2019, Yield to Maturity 2.33% | | | 257,000 | | | 256,188 | |
| | | | | | | 5,893,281 | |
| TOTAL SHORT-TERM INVESTMENTS | | | | | | | |
| (cost $5,894,593) | | | | | | 5,894,232 | |
| INVESTMENTS PURCHASED WITH THE CASH | | | | | | | |
| PROCEEDS FROM SECURITIES LENDING — 0.12% | | | Shares | | | | |
| Money Market Funds — 0.12% | | | | | | | |
| First American Government Obligations Fund — Class X, 2.36%b | | | 13,590 | | | 13,590 | |
| TOTAL INVESTMENTS PURCHASED WITH THE CASH PROCEEDS | | | | | | | |
| FROM SECURITIES LENDING | | | | | | | |
| (cost $13,590) | | | | | | 13,590 | |
| TOTAL INVESTMENTS — 99.75% | | | | | | | |
| (cost $10,126,019) | | | | | $ | 10,944,306 | |
| Percentages are stated as a percent of net assets. |
| * — | Non-income producing security. |
| ^ — | This security or a portion of this security was out on loan at December 31, 2018. Total loaned securities had a market value of $11,974 at December 31, 2018. The remaining contractual maturities of all of the securities lending transactions were overnight and continuous. |
| b — | The rate quoted is the annualized seven-day yield as of December 31, 2018. |
| c — | Significant Investment — See note 2. |
| e — | Default or other conditions exist and the security is not presently accruing income. |
The accompanying notes are an integral part of these financial statements.
| KINETICS PORTFOLIOS TRUST — MASTER INVESTMENT PORTFOLIOS |
| The Paradigm Portfolio |
| Consolidated Portfolio of Investments — December 31, 2018 — (Continued) |
| COMMON STOCKS — 84.96% | | | Shares | | | Value | |
| Accommodation — 0.49% | | | | | | | |
| Civeo Corporation* | | | 2,278,000 | | $ | 3,257,540 | |
| Amusement, Gambling, and Recreation Industries — 0.55% | | | | | | | |
| Las Vegas Sands Corp. | | | 45,800 | | | 2,383,890 | |
| MGM Resorts International | | | 49,700 | | | 1,205,722 | |
| | | | | | | 3,589,612 | |
| Beverage and Tobacco Product Manufacturing — 0.11% | | | | | | | |
| Crimson Wine Group Limited* | | | 88,800 | | | 694,860 | |
| Broadcasting (except Internet) — 0.24% | | | | | | | |
| CBS Corporation — Class B | | | 36,000 | | | 1,573,920 | |
| Cable and Other Subscription Programming — 0.83% | | | | | | | |
| Discovery Communications, Inc. — Class A* | | | 150,300 | | | 3,718,422 | |
| Discovery Communications, Inc. — Class C* | | | 76,000 | | | 1,754,080 | |
| | | | | | | 5,472,502 | |
| Chemical Manufacturing — 0.04% | | | | | | | |
| Platform Specialty Products Corporation* | | | 26,800 | | | 276,844 | |
| Data Processing, Hosting, and Related Services — 0.01% | | | | | | | |
| IHS Markit Limited* | | | 800 | | | 38,376 | |
| Electronic Shopping and Mail-Order Houses — 0.77% | | | | | | | |
| Liberty Expedia Holdings, Inc. — Class A* | | | 25,200 | | | 985,572 | |
| Qurate Retail, Inc.* | | | 209,600 | | | 4,091,392 | |
| | | | | | | 5,076,964 | |
| Food Services and Drinking Places — 1.38% | | | | | | | |
| The Wendy’s Company | | | 581,800 | | | 9,081,898 | |
| Insurance Carriers and Related Activities — 2.29% | | | | | | | |
| Markel Corporation* | | | 14,500 | | | 15,051,725 | |
| Machinery Manufacturing — 0.37% | | | | | | | |
| General Electric Company | | | 322,600 | | | 2,442,082 | |
| Management of Companies and Enterprises — 6.35% | | | | | | | |
| Associated Capital Group, Inc. — Class A | | | 261,200 | | | 9,202,076 | |
| Bollore SA | | | 371,000 | | | 1,487,758 | |
| Icahn Enterprises LP | | | 541,400 | | | 30,903,112 | |
| RIT Capital Partners plc | | | 7,200 | | | 175,283 | |
| | | | | | | 41,768,229 | |
The accompanying notes are an integral part of these financial statements.
| KINETICS PORTFOLIOS TRUST — MASTER INVESTMENT PORTFOLIOS |
| The Paradigm Portfolio |
| Consolidated Portfolio of Investments — December 31, 2018 — (Continued) |
| | | | Shares | | | Value | |
| Mining (except Oil and Gas) — 2.31% | | | | | | | |
| Franco-Nevada Corporation | | | 216,600 | | $ | 15,198,822 | |
| Motion Picture and Sound Recording Industries — 0.47% | | | | | | | |
| Lions Gate Entertainment Corporation — Class B | | | 185,600 | | | 2,761,728 | |
| Viacom Inc. — Class B | | | 12,000 | | | 308,400 | |
| | | | | | | 3,070,128 | |
| Oil and Gas Extraction — 35.38% | | | | | | | |
| Continental Resources, Inc.* | | | 50,400 | | | 2,025,576 | |
| Texas Pacific Land Trustcd | | | 423,168 | | | 229,200,484 | |
| Tourmaline Oil Corp. | | | 137,000 | | | 1,703,970 | |
| | | | | | | 232,930,030 | |
| Other Financial Investment Activities — 5.65% | | | | | | | |
| Brookfield Asset Management Inc. — Class A | | | 715,200 | | | 27,427,920 | |
| Brookfield Business Partners LP | | | 5,000 | | | 151,950 | |
| GAMCO Investors, Inc. — Class A | | | 1,800 | | | 30,402 | |
| Onex Corporation | | | 176,400 | | | 9,608,508 | |
| | | | | | | 37,218,780 | |
| Other Investment Pools and Funds — 0.00% | | | | | | | |
| Partners Value Investments LP | | | 800 | | | 22,561 | |
| Other Professional, Scientific, and Technical Services — 0.07% | | | | | | | |
| GMO Internet, Inc. | | | 32,000 | | | 429,470 | |
| Other Telecommunications — 6.68% | | | | | | | |
| GCI Liberty, Inc. — Class A* | | | 74,400 | | | 3,062,304 | |
| Liberty Broadband Corporation — Series A* | | | 47,400 | | | 3,403,794 | |
| Liberty Broadband Corporation — Series C* | | | 145,400 | | | 10,473,162 | |
| Liberty Media Corp.-Liberty SiriusXM — Class A* | | | 298,800 | | | 10,995,840 | |
| Liberty Media Corp.-Liberty SiriusXM — Class C* | | | 433,800 | | | 16,041,924 | |
| | | | | | | 43,977,024 | |
| Performing Arts, Spectator Sports, and Related Industries — 3.21% | | | | | | | |
| Live Nation Entertainment, Inc.* | | | 428,400 | | | 21,098,700 | |
| Professional, Scientific, and Technical Services — 0.60% | | | | | | | |
| CACI International, Inc. — Class A* | | | 27,400 | | | 3,946,422 | |
The accompanying notes are an integral part of these financial statements.
| KINETICS PORTFOLIOS TRUST — MASTER INVESTMENT PORTFOLIOS |
| The Paradigm Portfolio |
| Consolidated Portfolio of Investments — December 31, 2018 — (Continued) |
| | | | Shares | | | Value | |
| Real Estate — 9.10% | | | | | | | |
| Dream Unlimited Corp. — Class A* | | | 272,000 | | $ | 1,362,789 | |
| Equity Lifestyle Properties, Inc. — REIT | | | 68,000 | | | 6,604,840 | |
| The Howard Hughes Corporation*c | | | 532,000 | | | 51,933,841 | |
| | | | | | | 59,901,470 | |
| Satellite Telecommunications — 1.74% | | | | | | | |
| DISH Network Corp. — Class A* | | | 130,200 | | | 3,251,094 | |
| EchoStar Corporation — Class A* | | | 224,000 | | | 8,225,280 | |
| | | | | | | 11,476,374 | |
| Securities and Commodity Exchanges — 2.59% | | | | | | | |
| Cboe Global Markets, Inc. | | | 174,400 | | | 17,061,552 | |
| Securities, Commodity Contracts, and Other Financial Investments | | | | | | | |
| and Related Activities — 1.78% | | | | | | | |
| Grayscale Bitcoin Trust^ | | | 1,965,600 | | | 7,793,603 | |
| CME Group, Inc. | | | 21,000 | | | 3,950,520 | |
| | | | | | | 11,744,123 | |
| Spectator Sports — 1.01% | | | | | | | |
| Liberty Media Corp.-Liberty Formula One — Class A* | | | 92,800 | | | 2,758,016 | |
| Liberty Media Corp.-Liberty Formula One — Class C* | | | 127,800 | | | 3,923,460 | |
| | | | | | | 6,681,476 | |
| Support Activities for Mining — 0.21% | | | | | | | |
| Siem Industries Inc.* | | | 28,000 | | | 1,400,000 | |
| Support Activities for Water Transportation — 0.37% | | | | | | | |
| Clarkson plc | | | 101,400 | | | 2,455,644 | |
| Utilities — 0.36% | | | | | | | |
| Brookfield Infrastructure Partners LP | | | 68,300 | | | 2,358,399 | |
| TOTAL COMMON STOCKS | | | | | | | |
| (cost $377,560,960) | | | | | | 559,295,527 | |
The accompanying notes are an integral part of these financial statements.
| KINETICS PORTFOLIOS TRUST — MASTER INVESTMENT PORTFOLIOS |
| The Paradigm Portfolio |
| Consolidated Portfolio of Investments — December 31, 2018 — (Continued) |
| PREFERRED STOCKS — 0.00% | | | Shares | | | Value | |
| Other Investment Pools and Funds — 0.00% | | | | | | | |
| Partners Value Investments LP — Class A | | | 217 | | $ | 4,019 | |
| TOTAL PREFERRED STOCKS | | | | | | | |
| (cost $1,764) | | | | | | 4,019 | |
| | | | Principal | | | | |
| ESCROW NOTES — 0.00% | | | Amount | | | | |
| Other Telecommunications — 0.00% | | | | | | | |
| Adelphia Communications Corp.*+a | | $ | 200,000 | | | — | |
| TOTAL ESCROW NOTES | | | | | | | |
| (cost $0) | | | | | | — | |
| WARRANTS — 0.00% | | | Shares | | | | |
| Other Investment Pools and Funds — 0.00% | | | | | | | |
| Partners Value Investments LP* | | | 800 | | | 2,578 | |
| TOTAL WARRANTS | | | | | | | |
| (cost $2,368) | | | | | | 2,578 | |
| | | | | | | | |
| SHORT-TERM INVESTMENTS — 15.06% | | | | | | | |
| Money Market Funds — 0.00% | | | | | | | |
| Fidelity Institutional Government Portfolio — Class I, 2.25%b | | | 24,604 | | | 24,604 | |
| | | | Principal | | | | |
| | | | Amount | | | | |
| U.S. Treasury Obligations — 15.06% | | | | | | | |
| United States Treasury Bills | | | | | | | |
| Maturity Date: 01/22/2019, Yield to Maturity 2.25% | | $ | 78,358,000 | | | 78,258,094 | |
| Maturity Date: 01/31/2019, Yield to Maturity 2.27% | | | 4,000 | | | 3,992 | |
| Maturity Date: 02/12/2019, Yield to Maturity 2.29% | | | 20,881,000 | | | 20,823,657 | |
| Maturity Date: 02/14/2019, Yield to Maturity 2.33% | | | 18,000 | | | 17,949 | |
| | | | | | | 99,103,692 | |
| TOTAL SHORT-TERM INVESTMENTS | | | | | | | |
| (cost $99,127,613) | | | | | | 99,128,296 | |
The accompanying notes are an integral part of these financial statements.
| KINETICS PORTFOLIOS TRUST — MASTER INVESTMENT PORTFOLIOS |
| The Paradigm Portfolio |
| Consolidated Portfolio of Investments — December 31, 2018 — (Continued) |
| INVESTMENTS PURCHASED WITH THE CASH | | | | | | | |
| PROCEEDS FROM SECURITIES LENDING — 0.69% | | | Shares | | | Value | |
| Money Market Funds — 0.69% | | | | | | | |
| First American Government Obligations Fund — Class X, 2.36%b | | | 4,528,201 | | $ | 4,528,201 | |
| TOTAL INVESTMENTS PURCHASED WITH THE CASH PROCEEDS | | | | | | | |
| FROM SECURITIES LENDING | | | | | | | |
| (cost $4,528,201) | | | | | | 4,528,201 | |
| TOTAL INVESTMENTS — 100.71% | | | | | | | |
| (cost $481,220,906) | | | | | $ | 662,958,621 | |
| Percentages are stated as a percent of net assets. |
| * — | Non-income producing security. |
| ^ — | This security or a portion of this security was out on loan at December 31, 2018. Total loaned securities had a market value of $3,989,849 at December 31, 2018. The remaining contractual maturities of all of the securities lending transactions were overnight and continuous. |
| + — | Security is considered illiquid and was fair valued. The aggregate value of such securities is $0.00 or 0.00% of net assets. |
| a — | Value determined using significant unobservable inputs. |
| b — | The rate quoted is the annualized seven-day yield as of December 31, 2018. |
| c — | Significant Investment — See note 2. |
| d — | Affiliated issuer — See note 10. |
| REIT — | Real Estate Investment Trust. |
The accompanying notes are an integral part of these financial statements.
| KINETICS PORTFOLIOS TRUST — MASTER INVESTMENT PORTFOLIOS |
| The Medical Portfolio |
| Portfolio of Investments — December 31, 2018 — (Continued) |
| COMMON STOCKS — 99.61% | | | Shares | | | Value | |
| Pharmaceutical and Medicine Manufacturing — 81.84% | | | | | | | |
| AbbVie Inc.c | | | 10,000 | | $ | 921,900 | |
| Alkermes plc* | | | 21,000 | | | 619,710 | |
| Arena Pharmaceuticals, Inc.* | | | 4,500 | | | 175,275 | |
| AstraZeneca plc — ADRc | | | 24,000 | | | 911,520 | |
| Bristol-Myers Squibb Companyc | | | 20,500 | | | 1,065,590 | |
| Eli Lilly & Companyc | | | 13,500 | | | 1,562,220 | |
| Gilead Sciences, Inc. | | | 9,000 | | | 562,950 | |
| GlaxoSmithKline plc — ADRc | | | 22,673 | | | 866,335 | |
| Johnson & Johnsonc | | | 9,000 | | | 1,161,450 | |
| Merck & Co., Inc.c | | | 15,000 | | | 1,146,150 | |
| Novartis AG — ADRc | | | 14,000 | | | 1,201,340 | |
| Pfizer, Inc.c | | | 34,000 | | | 1,484,100 | |
| Roche Holding AG Limited — ADR | | | 23,000 | | | 714,840 | |
| Sanofi — ADRc | | | 25,000 | | | 1,085,250 | |
| | | | | | | 13,478,630 | |
| Professional, Scientific, and Technical Services — 0.00% | | | | | | | |
| Onconova Therapeutics, Inc.* | | | 160 | | | 338 | |
| Scientific Research and Development Services — 17.77% | | | | | | | |
| Agenus, Inc.* | | | 148 | | | 352 | |
| AmpliPhi Biosciences Corp.* | | | 2 | | | — | |
| Biogen Inc.*c | | | 3,750 | | | 1,128,450 | |
| Celgene Corporation* | | | 7,000 | | | 448,630 | |
| Celldex Therapeutics Inc.* | | | 26,294 | | | 5,204 | |
| Immune Pharmaceuticals, Inc.* | | | 1 | | | — | |
| Ionis Pharmaceuticals, Inc.* | | | 12,000 | | | 648,720 | |
| Madrigal Pharmaceuticals, Inc.* | | | 514 | | | 57,938 | |
| Merrimack Pharmaceuticals, Inc.* | | | 2,500 | | | 9,650 | |
| Osiris Therapeutics, Inc.* | | | 19,000 | | | 256,500 | |
| Pacific Biosciences of California Inc.* | | | 12,000 | | | 88,800 | |
| Progenics Pharmaceuticals, Inc.* | | | 67,200 | | | 282,240 | |
| | | | | | | 2,926,484 | |
| TOTAL COMMON STOCKS | | | | | | | |
| (cost $12,140,329) | | | | | | 16,405,452 | |
The accompanying notes are an integral part of these financial statements.
| KINETICS PORTFOLIOS TRUST — MASTER INVESTMENT PORTFOLIOS |
| The Medical Portfolio |
| Portfolio of Investments — December 31, 2018 — (Continued) |
| RIGHTS — 0.10% | | | Shares | | | Value | |
| Pharmaceutical and Medicine Manufacturing — 0.05% | | | | | | | |
| Sanofi* | | | 15,538 | | $ | 7,458 | |
| Scientific Research and Development Services — 0.05% | | | | | | | |
| Ligand Pharmaceuticals Inc.* | | | 44,000 | | | 6,160 | |
| Ligand Pharmaceuticals Inc. | | | 44,000 | | | 2,420 | |
| Ligand Pharmaceuticals Inc.* | | | 44,000 | | | 198 | |
| Ligand Pharmaceuticals Inc.*# | | | 44,000 | | | 242 | |
| | | | | | | 9,020 | |
| TOTAL RIGHTS | | | | | | | |
| (cost $0) | | | | | | 16,478 | |
| TOTAL INVESTMENTS — 99.71% | | | | | | | |
| (cost $12,140,329) | | | | | $ | 16,421,930 | |
| Percentages are stated as a percent of net assets. |
| * — | Non-income producing security. |
| # — | Contingent value right (contingent upon profitability of company). |
| c — | Significant Investment — See note 2. |
| ADR — | American Depository Receipt. |
The accompanying notes are an integral part of these financial statements.
| KINETICS PORTFOLIOS TRUST — MASTER INVESTMENT PORTFOLIOS |
| The Small Cap Opportunities Portfolio |
| Consolidated Portfolio of Investments — December 31, 2018 — (Continued) |
| COMMON STOCKS — 72.22% | | | Shares | | | Value | |
| Accommodation — 1.96% | | | | | | | |
| Civeo Corporation* | | | 3,064,695 | | $ | 4,382,514 | |
| Beverage and Tobacco Product Manufacturing — 0.37% | | | | | | | |
| Crimson Wine Group Limited* | | | 106,800 | | | 835,710 | |
| Chemical Manufacturing — 2.55% | | | | | | | |
| Inter Parfums, Inc. | | | 69,600 | | | 4,563,672 | |
| Platform Specialty Products Corporation* | | | 109,200 | | | 1,128,036 | |
| | | | | | | 5,691,708 | |
| Food Services and Drinking Places — 2.80% | | | | | | | |
| The Wendy’s Company | | | 400,000 | | | 6,244,000 | |
| Insurance Carriers and Related Activities — 0.04% | | | | | | | |
| Greenlight Capital Re, Limited — Class A* | | | 9,400 | | | 81,028 | |
| Machinery Manufacturing — 0.22% | | | | | | | |
| Colfax Corporation* | | | 24,000 | | | 501,600 | |
| Management of Companies and Enterprises — 12.29% | | | | | | | |
| Associated Capital Group, Inc. — Class A | | | 164,750 | | | 5,804,142 | |
| Dundee Corporation — Class A* | | | 1,832,400 | | | 1,757,455 | |
| Icahn Enterprises LPc | | | 318,400 | | | 18,174,272 | |
| RIT Capital Partners plc | | | 71,000 | | | 1,728,485 | |
| | | | | | | 27,464,354 | |
| Merchant Wholesalers, Durable Goods — 0.40% | | | | | | | |
| Dorman Products, Inc.* | | | 10,000 | | | 900,200 | |
| Mining (except Oil and Gas) — 0.01% | | | | | | | |
| Wheaton Precious Metals Corporation | | | 1,000 | | | 19,530 | |
| Motion Picture and Sound Recording Industries — 0.05% | | | | | | | |
| Lions Gate Entertainment Corporation — Class B | | | 7,000 | | | 104,160 | |
| Oil and Gas Extraction — 29.36% | | | | | | | |
| Permian Basin Royalty Trust | | | 164,200 | | | 968,780 | |
| Texas Pacific Land Trustc | | | 119,294 | | | 64,613,209 | |
| | | | | | | 65,581,989 | |
| Other Financial Investment Activities — 1.91% | | | | | | | |
| GAMCO Investors, Inc. — Class A | | | 22,000 | | | 371,580 | |
| Onex Corporation | | | 71,500 | | | 3,893,953 | |
| | | | | | | 4,265,533 | |
The accompanying notes are an integral part of these financial statements.
| KINETICS PORTFOLIOS TRUST — MASTER INVESTMENT PORTFOLIOS |
| The Small Cap Opportunities Portfolio |
| Consolidated Portfolio of Investments — December 31, 2018 — (Continued) |
| | | | Shares | | | Value | |
| Other Investment Pools and Funds — 3.16% | | | | | | | |
| JZ Capital Partners Limited* | | | 97,200 | | $ | 551,316 | |
| Partners Value Investments LP | | | 191,000 | | | 5,386,390 | |
| Urbana Corporation — Class A | | | 694,471 | | | 1,124,217 | |
| | | | | | | 7,061,923 | |
| Other Pipeline Transportation — 2.31% | | | | | | | |
| Rubis SCA | | | 96,100 | | | 5,161,801 | |
| Performing Arts, Spectator Sports, and Related Industries — 3.64% | | | | | | | |
| Live Nation Entertainment, Inc.* | | | 165,000 | | | 8,126,250 | |
| Professional, Scientific, and Technical Services — 0.87% | | | | | | | |
| CACI International, Inc. — Class A* | | | 13,500 | | | 1,944,405 | |
| Real Estate — 9.11% | | | | | | | |
| Dream Unlimited Corp. — Class A* | | | 2,188,800 | | | 10,966,446 | |
| The Howard Hughes Corporation* | | | 96,200 | | | 9,391,044 | |
| | | | | | | 20,357,490 | |
| Securities, Commodity Contracts, and Other Financial Investments | | | | | | | |
| and Related Activities — 0.55% | | | | | | | |
| Grayscale Bitcoin Trust^ | | | 307,125 | | | 1,217,751 | |
| Support Activities for Water Transportation — 0.52% | | | | | | | |
| Braemar Shipping Services plc | | | 450,322 | | | 1,162,310 | |
| Telecommunications — 0.10% | | | | | | | |
| LICT Corporation* | | | 16 | | | 230,400 | |
| TOTAL COMMON STOCKS | | | | | | | |
| (cost $138,258,524) | | | | | | 161,334,656 | |
| | | | | | | | |
| PREFERRED STOCKS — 0.43% | | | | | | | |
| Other Investment Pools and Funds — 0.43% | | | | | | | |
| Partners Value Investments LP — Class A | | | 51,933 | | | 961,799 | |
| TOTAL PREFERRED STOCKS | | | | | | | |
| (cost $420,822) | | | | | | 961,799 | |
| | | | | | | | |
| WARRANTS — 0.27% | | | | | | | |
| Other Investment Pools and Funds — 0.27% | | | | | | | |
| Partners Value Investments LP* | | | 191,000 | | | 615,587 | |
| TOTAL WARRANTS | | | | | | | |
| (cost $564,856) | | | | | | 615,587 | |
The accompanying notes are an integral part of these financial statements.
| KINETICS PORTFOLIOS TRUST — MASTER INVESTMENT PORTFOLIOS |
| The Small Cap Opportunities Portfolio |
| Consolidated Portfolio of Investments — December 31, 2018 — (Continued) |
| SHORT-TERM INVESTMENTS — 27.05% | | | Shares | | | Value | |
| Money Market Funds — 0.00% | | | | | | | |
| Fidelity Institutional Government Portfolio — Class I, 2.25%b | | | 4,210 | | $ | 4,210 | |
| | | | Principal | | | | |
| | | | Amount | | | | |
| U.S. Treasury Obligations — 27.05% | | | | | | | |
| United States Treasury Bills | | | | | | | |
| Maturity Date: 01/22/2019, Yield to Maturity 2.25% | | $ | 56,045,000 | | | 55,973,543 | |
| Maturity Date: 01/31/2019, Yield to Maturity 2.27% | | | 1,000 | | | 998 | |
| Maturity Date: 02/07/2019, Yield to Maturity 2.28% | | | 3,587,000 | | | 3,578,539 | |
| Maturity Date: 02/19/2019, Yield to Maturity 2.33% | | | 11,000 | | | 10,965 | |
| Maturity Date: 02/28/2019, Yield to Maturity 2.34% | | | 863,000 | | | 859,754 | |
| | | | | | | 60,423,799 | |
| TOTAL SHORT-TERM INVESTMENTS | | | | | | | |
| (cost $60,426,333) | | | | | | 60,428,009 | |
| INVESTMENTS PURCHASED WITH THE CASH | | | | | | | |
| PROCEEDS FROM SECURITIES LENDING — 0.25% | | | Shares | | | | |
| Money Market Funds — 0.25% | | | | | | | |
| First American Government Obligations Fund — Class X, 2.36%b | | | 552,825 | | | 552,825 | |
| TOTAL INVESTMENTS PURCHASED WITH THE CASH PROCEEDS | | | | | | | |
| FROM SECURITIES LENDING | | | | | | | |
| (cost $552,825) | | | | | | 552,825 | |
| TOTAL INVESTMENTS — 100.22% | | | | | | | |
| (cost $200,223,360) | | | | | $ | 223,892,876 | |
| Percentages are stated as a percent of net assets. |
| * — | Non-income producing security. |
| ^ — | This security or a portion of this security was out on loan at December 31, 2018. Total loaned securities had a market value of $487,100 at December 31, 2018. The remaining contractual maturities of all of the securities lending transactions were overnight and continuous. |
| b — | The rate quoted is the annualized seven-day yield as of December 31, 2018. |
| c — | Significant Investment — See note 2. |
The accompanying notes are an integral part of these financial statements.
| KINETICS PORTFOLIOS TRUST — MASTER INVESTMENT PORTFOLIOS |
| The Market Opportunities Portfolio |
| Consolidated Portfolio of Investments — December 31, 2018 — (Continued) |
| COMMON STOCKS — 49.75% | | | Shares | | | Value | |
| Beverage and Tobacco Product Manufacturing — 0.03% | | | | | | | |
| Crimson Wine Group Limited* | | | 3,000 | | $ | 23,475 | |
| Data Processing, Hosting, and Related Services — 2.50% | | | | | | | |
| IHS Markit Limited* | | | 200 | | | 9,594 | |
| MasterCard, Inc. — Class A | | | 4,000 | | | 754,600 | |
| Visa, Inc. — Class A | | | 8,000 | | | 1,055,520 | |
| | | | | | | 1,819,714 | |
| Insurance Carriers and Related Activities — 0.89% | | | | | | | |
| Arthur J. Gallagher & Co. | | | 400 | | | 29,480 | |
| Markel Corporation* | | | 600 | | | 622,830 | |
| | | | | | | 652,310 | |
| Management of Companies and Enterprises — 4.34% | | | | | | | |
| Associated Capital Group, Inc. — Class A | | | 33,800 | | | 1,190,774 | |
| Clarke Inc.* | | | 1,000 | | | 9,156 | |
| Dundee Corporation — Class A* | | | 2,000 | | | 1,918 | |
| Icahn Enterprises LP | | | 34,400 | | | 1,963,552 | |
| | | | | | | 3,165,400 | |
| Merchant Wholesalers, Durable Goods — 0.03% | | | | | | | |
| A-Mark Precious Metals, Inc. | | | 1,600 | | | 18,864 | |
| Mining (except Oil and Gas) — 0.19% | | | | | | | |
| Franco-Nevada Corporation | | | 1,500 | | | 105,255 | |
| Wheaton Precious Metals Corporation | | | 1,800 | | | 35,154 | |
| | | | | | | 140,409 | |
| Oil and Gas Extraction — 26.98% | | | | | | | |
| Texas Pacific Land Trustc | | | 36,328 | | | 19,676,335 | |
| Other Financial Investment Activities — 1.16% | | | | | | | |
| GAMCO Investors, Inc. — Class A | | | 3,800 | | | 64,182 | |
| Oaktree Capital Group LLC | | | 9,000 | | | 357,750 | |
| Onex Corporation | | | 6,300 | | | 343,161 | |
| Sprott, Inc. | | | 41,155 | | | 77,475 | |
| | | | | | | 842,568 | |
| Other Investment Pools and Funds — 2.48% | | | | | | | |
| Partners Value Investments LP | | | 43,516 | | | 1,227,194 | |
| Urbana Corporation | | | 3,200 | | | 5,860 | |
| Urbana Corporation — Class A | | | 356,004 | | | 576,303 | |
| | | | | | | 1,809,357 | |
The accompanying notes are an integral part of these financial statements.
| KINETICS PORTFOLIOS TRUST — MASTER INVESTMENT PORTFOLIOS |
| The Market Opportunities Portfolio |
| Consolidated Portfolio of Investments — December 31, 2018 — (Continued) |
| | | | Shares | | | Value | |
| Real Estate — 3.36% | | | | | | | |
| Dream Unlimited Corp. — Class A* | | | 272,800 | | $ | 1,366,798 | |
| The Howard Hughes Corporation* | | | 11,100 | | | 1,083,582 | |
| | | | | | | 2,450,380 | |
| Securities and Commodity Exchanges — 1.58% | | | | | | | |
| Cboe Global Markets, Inc. | | | 7,806 | | | 763,661 | |
| NASDAQ, Inc. | | | 1,800 | | | 146,826 | |
| NZX Limited | | | 359,002 | | | 243,372 | |
| | | | | | | 1,153,859 | |
| Securities, Commodity Contracts, and Other Financial Investments | | | | | | | |
| and Related Activities — 5.82% | | | | | | | |
| Grayscale Bitcoin Trust^ | | | 601,874 | | | 2,386,430 | |
| CME Group, Inc. | | | 5,891 | | | 1,108,215 | |
| IntercontinentalExchange Group, Inc. | | | 10,000 | | | 753,300 | |
| | | | | | | 4,247,945 | |
| Support Activities for Water Transportation — 0.39% | | | | | | | |
| Clarkson plc | | | 11,700 | | | 283,343 | |
| TOTAL COMMON STOCKS | | | | | | | |
| (cost $25,034,247) | | | | | | 36,283,959 | |
| | | | | | | | |
| PREFERRED STOCKS — 0.30% | | | | | | | |
| Other Investment Pools and Funds — 0.30% | | | | | | | |
| Partners Value Investments LP — Class A | | | 11,832 | | | 219,129 | |
| TOTAL PREFERRED STOCKS | | | | | | | |
| (cost $219,010) | | | | | | 219,129 | |
| | | | Principal | | | | |
| CONVERTIBLE BONDS — 0.00% | | | Amount | | | | |
| Department Stores — 0.00% | | | | | | | |
| Sears Holdings Corporation, 8.000%, 12/15/2019e | | $ | 5,720 | | | 314 | |
| TOTAL CONVERTIBLE BONDS | | | | | | | |
| (cost $5,720) | | | | | | 314 | |
The accompanying notes are an integral part of these financial statements.
| KINETICS PORTFOLIOS TRUST — MASTER INVESTMENT PORTFOLIOS |
| The Market Opportunities Portfolio |
| Consolidated Portfolio of Investments — December 31, 2018 — (Continued) |
| WARRANTS — 0.19% | | | Shares | | | Value | |
| Other Investment Pools and Funds — 0.19% | | | | | | | |
| Partners Value Investments LP* | | | 43,516 | | $ | 140,251 | |
| TOTAL WARRANTS | | | | | | | |
| (cost $130,104) | | | | | | 140,251 | |
| SHORT-TERM INVESTMENTS — 49.87% | | | | | | | |
| Money Market Funds — 0.00% | | | | | | | |
| Fidelity Institutional Government Portfolio — Class I, 2.25%b | | | 1,577 | | | 1,577 | |
| | | | Principal | | | | |
| | | | Amount | | | | |
| U.S. Treasury Obligations — 49.87% | | | | | | | |
| United States Treasury Bills | | | | | | | |
| Maturity Date: 01/22/2019, Yield to Maturity 2.25% | | $ | 24,871,000 | | | 24,839,289 | |
| Maturity Date: 02/12/2019, Yield to Maturity 2.29% | | | 9,675,000 | | | 9,648,431 | |
| Maturity Date: 02/19/2019, Yield to Maturity 2.33% | | | 1,892,000 | | | 1,886,025 | |
| | | | | | | 36,373,745 | |
| TOTAL SHORT-TERM INVESTMENTS | | | | | | | |
| (cost $36,375,369) | | | | | | 36,375,322 | |
| | | | | | | | |
| INVESTMENTS PURCHASED WITH THE CASH | | | | | | | |
| PROCEEDS FROM SECURITIES LENDING — 0.19% | | | Shares | | | | |
| Money Market Funds — 0.19% | | | | | | | |
| First American Government Obligations Fund — Class X, 2.36%b | | | 139,626 | | | 139,626 | |
| TOTAL INVESTMENTS PURCHASED WITH THE CASH PROCEEDS | | | | | | | |
| FROM SECURITIES LENDING | | | | | | | |
| (cost $139,626) | | | | | | 139,626 | |
| TOTAL INVESTMENTS — 100.30% | | | | | | | |
| (cost $61,904,076) | | | | | $ | 73,158,601 | |
| Percentages are stated as a percent of net assets. |
| * — | Non-income producing security. |
| ^ — | This security or a portion of this security was out on loan at December 31, 2018. Total loaned securities had a market value of $123,026 at December 31, 2018. The remaining contractual maturities of all of the securities lending transactions were overnight and continuous. |
| b — | The rate quoted is the annualized seven-day yield as of December 31, 2018. |
| c — | Significant Investment — See note 2. |
| e — | Default or other conditions exist and the security is not presently accruing income. |
The accompanying notes are an integral part of these financial statements.
| KINETICS PORTFOLIOS TRUST — MASTER INVESTMENT PORTFOLIOS |
| The Alternative Income Portfolio |
| Portfolio of Investments — December 31, 2018 — (Continued) |
| EXCHANGE TRADED FUNDS — 29.68% | | | Shares | | | Value | |
| Funds, Trusts, and Other Financial Vehicles — 29.68% | | | | | | | |
| iShares 1-3 Year Credit Bond ETF | | | 54,000 | | $ | 2,788,560 | |
| PIMCO Enhanced Short Maturity Active ETF | | | 4,700 | | | 474,465 | |
| SPDR Barclays Short Term Corporate Bond ETF# | | | 24,000 | | | 723,360 | |
| Vanguard Short-Term Corporate Bond ETF | | | 21,700 | | | 1,691,298 | |
| TOTAL EXCHANGE TRADED FUNDS | | | | | | | |
| (cost $5,804,793) | | | | | | 5,677,683 | |
| | | | | | | | |
| SHORT-TERM INVESTMENTS — 68.55% | | | | | | | |
| Money Market Funds — 12.09% | | | | | | | |
| Fidelity Institutional Government Portfolio — Class I, 2.25%#b | | | 2,314,068 | | | 2,314,068 | |
| | | | Principal | | | | |
| | | | Amount | | | | |
| U.S. Treasury Obligations — 56.46% | | | | | | | |
| United States Treasury Bills | | | | | | | |
| Maturity Date: 01/02/2019, Yield to Maturity 2.19% | | $ | 49,000 | | | 49,000 | |
| Maturity Date: 01/22/2019, Yield to Maturity 2.25% | | | 10,555,000 | | | 10,541,542 | |
| Maturity Date: 02/14/2019, Yield to Maturity 2.33% | | | 212,000 | | | 211,395 | |
| | | | | | | 10,801,937 | |
| TOTAL SHORT-TERM INVESTMENTS | | | | | | | |
| (cost $13,115,672) | | | | | | 13,116,005 | |
| TOTAL INVESTMENTS — 98.23% | | | | | | | |
| (cost $18,920,465) | | | | | $ | 18,793,688 | |
| Percentages are stated as a percent of net assets. |
| # — | All or a portion of the securities have been committed as collateral for written option contracts, totaling $3,036,580. |
| b — | The rate quoted is the annualized seven-day yield as of December 31, 2018. |
| ETF — | Exchange Traded Fund. |
The accompanying notes are an integral part of these financial statements.
| KINETICS PORTFOLIOS TRUST — MASTER INVESTMENT PORTFOLIOS |
| The Multi-Disciplinary Income Portfolio |
| Portfolio of Investments — December 31, 2018 — (Continued) |
| | | | Principal | | | | |
| CONVERTIBLE BONDS — 1.50% | | | Amount | | | Value | |
| Pipeline Transportation of Natural Gas — 1.50% | | | | | | | |
| Cheniere Energy, Inc., 4.250%, 03/15/2045 | | $ | 800,000 | | $ | 560,480 | |
| TOTAL CONVERTIBLE BONDS | | | | | | | |
| (cost $620,733) | | | | | | 560,480 | |
| | | | | | | | |
| CORPORATE BONDS — 89.37% | | | | | | | |
| Advertising, Public Relations, and Related Services — 1.34% | | | | | | | |
| Lamar Media Corp., 5.000%, 05/01/2023 | | | 500,000 | | | 500,000 | |
| Broadcasting (except Internet) — 5.53% | | | | | | | |
| Altice Luxembourg SA, 7.750%, 05/15/2022■ | | | 250,000 | | | 228,437 | |
| Cablevision Systems Corporation, 5.875%, 09/15/2022 | | | 200,000 | | | 197,000 | |
| Sinclair Television Group, Inc., 5.375%, 04/01/2021 | | | 250,000 | | | 250,000 | |
| Sirius XM Radio, Inc., 4.625%, 05/15/2023■ | | | 1,050,000 | | | 1,010,625 | |
| TEGNA, Inc. | | | | | | | |
| 5.125%, 10/15/2019 | | | 133,000 | | | 133,104 | |
| 5.125%, 07/15/2020 | | | 250,000 | | | 250,055 | |
| | | | | | | 2,069,221 | |
| Chemical Manufacturing — 9.79% | | | | | | | |
| Ashland Inc., 4.750%, 08/15/2022c | | | 3,000,000 | | | 2,966,250 | |
| The Chemours Company | | | | | | | |
| 6.625%, 05/15/2023 | | | 474,000 | | | 480,517 | |
| 7.000%, 05/15/2025 | | | 214,000 | | | 216,675 | |
| | | | | | | 3,663,442 | |
| Construction of Buildings — 15.65% | | | | | | | |
| Brookfield Residential Propertiesc | | | | | | | |
| 6.500%, 12/15/2020■ | | | 3,250,000 | | | 3,254,062 | |
| 6.125%, 07/01/2022■ | | | 100,000 | | | 94,875 | |
| 6.375%, 05/15/2025■ | | | 651,000 | | | 597,293 | |
| Lennar Corporation, 4.750%, 11/15/2022c | | | 1,960,000 | | | 1,908,550 | |
| | | | | | | 5,854,780 | |
| Deep Sea, Coastal, and Great Lakes Water Transportation — 4.99% | | | | | | | |
| Stolt-Nielsen Limited, 6.375%, 09/21/2022 | | | 2,000,000 | | | 1,865,714 | |
| Fabricated Metal Product Manufacturing — 0.60% | | | | | | | |
| Ball Corp., 5.250%, 07/01/2025 | | | 224,000 | | | 224,000 | |
The accompanying notes are an integral part of these financial statements.
| KINETICS PORTFOLIOS TRUST — MASTER INVESTMENT PORTFOLIOS |
| The Multi-Disciplinary Income Portfolio |
| Portfolio of Investments — December 31, 2018 — (Continued) |
| | | | Principal | | | | |
| | | | Amount | | | Value | |
| Food Manufacturing — 8.22% | | | | | | | |
| Lamb Weston Holdings, Inc.c | | | | | | | |
| 4.625%, 11/01/2024■ | | $ | 1,000,000 | | $ | 975,000 | |
| 4.875%, 11/01/2026■ | | | 2,175,000 | | | 2,098,875 | |
| | | | | | | 3,073,875 | |
| Management of Companies and Enterprises — 7.89% | | | | | | | |
| Icahn Enterprises, 5.875%, 02/01/2022c | | | 3,000,000 | | | 2,951,250 | |
| Metal Ore Mining — 0.70% | | | | | | | |
| Teck Resources Limited, 4.750%, 01/15/2022 | | | 264,000 | | | 263,010 | |
| Motor Vehicle and Parts Dealers — 9.51% | | | | | | | |
| Penske Automotive Group, Inc., 5.750%, 10/01/2022c | | | 3,550,000 | | | 3,558,875 | |
| Oil and Gas Extraction — 5.84% | | | | | | | |
| Continental Resources, Inc., 5.000%, 09/15/2022 | | | 479,000 | | | 476,157 | |
| Murphy Oil Corp., 4.450%, 12/01/2022 | | | 1,208,000 | | | 1,140,376 | |
| QEP Resources, Inc. | | | | | | | |
| 6.875%, 03/01/2021 | | | 250,000 | | | 253,125 | |
| 5.375%, 10/01/2022 | | | 120,000 | | | 109,650 | |
| 5.250%, 05/01/2023 | | | 230,000 | | | 204,700 | |
| | | | | | | 2,184,008 | |
| Publishing Industries (except Internet) — 0.67% | | | | | | | |
| Tribune Media Company, 5.875%, 07/15/2022 | | | 250,000 | | | 252,500 | |
| Real Estate — 4.17% | | | | | | | |
| The Howard Hughes Corporation, 5.375%, 03/15/2025■ | | | 1,650,000 | | | 1,559,250 | |
| Residential Building Construction — 5.32% | | | | | | | |
| TRI Pointe Holdings, Inc., 4.375%, 06/15/2019c | | | 2,000,000 | | | 1,990,000 | |
| Software Publishers — 0.53% | | | | | | | |
| Nuance Communications, Inc., 5.375%, 08/15/2020■ | | | 200,000 | | | 199,875 | |
| Support Activities for Mining — 2.80% | | | | | | | |
| Ensco plc, 4.700%, 03/15/2021 | | | 600,000 | | | 552,000 | |
| Rowan Companies, Inc., 4.875%, 06/01/2022 | | | 600,000 | | | 497,250 | |
| | | | | | | 1,049,250 | |
The accompanying notes are an integral part of these financial statements.
| KINETICS PORTFOLIOS TRUST — MASTER INVESTMENT PORTFOLIOS |
| The Multi-Disciplinary Income Portfolio |
| Portfolio of Investments — December 31, 2018 — (Continued) |
| | | | Principal | | | | |
| | | | Amount | | | Value | |
| Telecommunications — 5.82% | | | | | | | |
| CenturyLink, Inc., 5.800%, 03/15/2022 | | $ | 500,000 | | $ | 483,750 | |
| Crown Castle International Corp., 4.875%, 04/15/2022 | | | 700,000 | | | 720,833 | |
| Hughes Satellite Systems Corp. | | | | | | | |
| 6.500%, 06/15/2019 | | | 450,000 | | | 454,781 | |
| 7.625%, 06/15/2021 | | | 500,000 | | | 520,000 | |
| | | | | | | 2,179,364 | |
| TOTAL CORPORATE BONDS | | | | | | | |
| (cost $34,196,570) | | | | | | 33,438,414 | |
| | | | | | | | |
| MUNICIPAL BONDS — 0.41% | | | | | | | |
| Support Activities for Air Transportation — 0.41% | | | | | | | |
| Branson Missouri Regional Airport Transportation Development District, | | | | | | | |
| 5.000%, 04/01/2043■+e | | | 1,020,425 | | | 154,207 | |
| TOTAL MUNICIPAL BONDS | | | | | | | |
| (cost $2,249,479) | | | | | | 154,207 | |
| CLOSED-END FUNDS — 7.73% | | | Shares | | | | |
| Funds, Trusts, and Other Financial Vehicles — 7.73% | | | | | | | |
| DoubleLine Opportunistic Credit Fund | | | 50,900 | | | 964,555 | |
| PIMCO Dynamic Income Fund | | | 66,000 | | | 1,925,880 | |
| TOTAL CLOSED-END FUNDS | | | | | | | |
| (cost $3,394,068) | | | | | | 2,890,435 | |
| | | | | | | | |
| SHORT-TERM INVESTMENTS — 0.18% | | | | | | | |
| Money Market Funds — 0.00% | | | | | | | |
| Fidelity Institutional Government Portfolio — Class I, 2.25%b | | | 1,105 | | | 1,105 | |
| | | | Principal | | | | |
| | | | Amount | | | | |
| U.S. Treasury Obligations — 0.18% | | | | | | | |
| United States Treasury Bills | | | | | | | |
| Maturity Date: 01/31/2019, Yield to Maturity 2.27% | | $ | 67,000 | | | 66,877 | |
| TOTAL SHORT-TERM INVESTMENTS | | | | | | | |
| (cost $67,979) | | | | | | 67,982 | |
| TOTAL INVESTMENTS — 99.19% | | | | | | | |
| (cost $40,528,829) | | | | | $ | 37,111,518 | |
The accompanying notes are an integral part of these financial statements.
| KINETICS PORTFOLIOS TRUST — MASTER INVESTMENT PORTFOLIOS |
| The Multi-Disciplinary Income Portfolio |
| Portfolio of Investments — December 31, 2018 — (Continued) |
| Percentages are stated as a percent of net assets. |
| ■ — | The percentage of net assets comprised of 144a securities was 27.19%. |
| + — | Security is considered illiquid. The aggregate value of such securities is $154,207 or 0.41% of net assets. |
| b — | The rate quoted is the annualized seven-day yield as of December 31, 2018. |
| c — | Significant Investment — See note 2. |
| e — | Default or other conditions exist and the security is not presently accruing income. |
The accompanying notes are an integral part of these financial statements.
| KINETICS PORTFOLIOS TRUST — MASTER INVESTMENT PORTFOLIOS |
| The Alternative Income Portfolio |
| Portfolio of Options Written — December 31, 2018 |
| PUT OPTIONS WRITTEN | | | Contractsd | | | Notional | | | Value | |
| Equity Index | | | | | | | | | | |
| S&P 500 Index | | | | | | | | | | |
| Expiration: January 2019, Exercise Price: $2,100.00 | | | 16 | | $ | 3,360,000 | | $ | 4,760 | |
| TOTAL PUT OPTIONS WRITTEN | | | | | | | | | | |
| (premiums received $31,663) | | | 16 | | | | | $ | 4,760 | |
| d — | 100 shares per contract. |
The accompanying notes are an integral part of these financial statements.
| KINETICS PORTFOLIOS TRUST — MASTER INVESTMENT PORTFOLIOS |
| Statements of Assets & Liabilities |
| December 31, 2018 |
| | | | The Internet | | | The Global | |
| | | | Portfolio | | | Portfolio | |
| | | | (Consolidated) | | | (Consolidated) | |
| ASSETS: | | | | | | | |
| Investments, at value(1)(2) | | $ | 107,364,726 | | $ | 10,944,306 | |
| Cash | | | 414 | | | 660 | |
| Receivable for contributed capital | | | 27,135 | | | 9,380 | |
| Receivable for investments sold | | | 14,344 | | | 46,735 | |
| Dividends and interest receivable | | | 9,460 | | | 17,464 | |
| Prepaid expenses and other assets | | | 2,042 | | | 271 | |
| Total Assets | | | 107,418,121 | | | 11,018,816 | |
| LIABILITIES: | | | | | | | |
| Payable to Adviser | | | 117,971 | | | 11,876 | |
| Payable to Trustees | | | 2,909 | | | 304 | |
| Payable to Chief Compliance Officer | | | 251 | | | 22 | |
| Payable for collateral received for securities loaned | | | 672,458 | | | 13,590 | |
| Payable for withdrawn capital | | | 691,522 | | | 2,782 | |
| Accrued expenses and other liabilities | | | 38,417 | | | 18,246 | |
| Total Liabilities | | | 1,523,528 | | | 46,820 | |
| Net Assets | | $ | 105,894,593 | | $ | 10,971,996 | |
| (1) Cost of investments | | $ | 111,881,541 | | $ | 10,126,019 | |
| (2) Includes loaned securities with a market value of | | $ | 592,510 | | $ | 11,974 | |
The accompanying notes are an integral part of these financial statements.
| KINETICS PORTFOLIOS TRUST — MASTER INVESTMENT PORTFOLIOS |
| Statements of Assets & Liabilities — (Continued) |
| December 31, 2018 |
| | | | The Paradigm
Portfolio | | | The Medical | |
| | | | (Consolidated) | | | Portfolio | |
| ASSETS: | | | | | | | |
| Investments, at value | | | | | | | |
| Unaffiliated issuers(1) | | $ | 433,758,137 | | $ | 16,421,930 | |
| Affiliated issuers(2) | | | 229,200,484 | | | — | |
| Total investments, at value(3)(4) | | $ | 662,958,621 | | $ | 16,421,930 | |
| Cash | | | 126,806 | | | — | |
| Receivable for contributed capital | | | 630,191 | | | 3,819 | |
| Receivable for investments sold | | | 650,480 | | | 114,724 | |
| Dividends and interest receivable | | | 134,635 | | | 39,240 | |
| Prepaid expenses and other assets | | | 17,535 | | | 867 | |
| Total Assets | | | 664,518,268 | | | 16,580,580 | |
| LIABILITIES: | | | | | | | |
| Payable to Adviser | | | 740,183 | | | 17,780 | |
| Payable to Custodian | | | — | | | 75,285 | |
| Payable to Trustees | | | 20,011 | | | 398 | |
| Payable to Chief Compliance Officer | | | 1,264 | | | 27 | |
| Payable for collateral received for securities loaned | | | 4,528,201 | | | — | |
| Payable for withdrawn capital | | | 788,533 | | | 75 | |
| Accrued expenses and other liabilities | | | 160,410 | | | 17,323 | |
| Total Liabilities | | | 6,238,602 | | | 110,888 | |
| Net Assets | | $ | 658,279,666 | | $ | 16,469,692 | |
| (1) Unaffiliated issuers cost | | $ | 434,508,026 | | $ | 12,140,329 | |
| (2) Affiliated issuers cost | | $ | 46,712,880 | | | — | |
| (3) Total issuers cost | | $ | 481,220,906 | | $ | 12,140,329 | |
| (4) Includes loaned securities with a market value of | | $ | 3,989,849 | | | — | |
The accompanying notes are an integral part of these financial statements.
| KINETICS PORTFOLIOS TRUST — MASTER INVESTMENT PORTFOLIOS |
| Statements of Assets & Liabilities — (Continued) |
| December 31, 2018 |
| | | | The Small Cap | | | The Market | |
| | | | Opportunities | | | Opportunities | |
| | | | Portfolio | | | Portfolio | |
| | | | (Consolidated) | | | (Consolidated) | |
| ASSETS: | | | | | | | |
| Investments, at value(1)(2) | | $ | 223,892,876 | | $ | 73,158,601 | |
| Cash | | | 3 | | | 1,497 | |
| Receivable for contributed capital | | | 1,129,744 | | | 3,014 | |
| Receivable for investments sold | | | 41,137 | | | 41,052 | |
| Dividends and interest receivable | | | 162,135 | | | 36,028 | |
| Prepaid expenses and other assets | | | 2,606 | | | 1,477 | |
| Total Assets | | | 225,228,501 | | | 73,241,669 | |
| LIABILITIES: | | | | | | | |
| Payable to Adviser | | | 249,027 | | | 78,526 | |
| Payable to Trustees | | | 7,447 | | | 1,969 | |
| Payable to Chief Compliance Officer | | | 364 | | | 133 | |
| Payable for securities purchased | | | 3,900 | | | 36,507 | |
| Payable for collateral received for securities loaned | | | 552,825 | | | 139,626 | |
| Payable for withdrawn capital | | | 955,752 | | | 16,275 | |
| Accrued expenses and other liabilities | | | 65,571 | | | 30,105 | |
| Total Liabilities | | | 1,834,886 | | | 303,141 | |
| Net Assets | | $ | 223,393,615 | | $ | 72,938,528 | |
| (1) Cost of investments | | $ | 200,223,360 | | $ | 61,904,076 | |
| (2) Includes loaned securities with a market value of | | $ | 487,100 | | $ | 123,026 | |
The accompanying notes are an integral part of these financial statements.
| KINETICS PORTFOLIOS TRUST — MASTER INVESTMENT PORTFOLIOS |
| Statements of Assets & Liabilities — (Continued) |
| December 31, 2018 |
| | | The Alternative | | | The Multi-
Disciplinary | |
| | | | Income | | | Income | |
| | | | Portfolio | | | Portfolio | |
| ASSETS: | | | | | | | |
| Investments, at value(1) | | $ | 18,793,688 | | $ | 37,111,518 | |
| Cash at broker | | | 359,868 | | | — | |
| Receivable for contributed capital | | | 11,015 | | | — | |
| Dividends and interest receivable | | | 5,354 | | | 433,967 | |
| Prepaid expenses and other assets | | | 222 | | | 621 | |
| Total Assets | | | 19,170,147 | | | 37,546,106 | |
| LIABILITIES: | | | | | | | |
| Written options, at value(2) | | | 4,760 | | | — | |
| Payable to Adviser | | | 14,645 | | | 40,384 | |
| Payable to Trustees | | | 442 | | | 901 | |
| Payable to Chief Compliance Officer | | | 33 | | | 72 | |
| Payable for withdrawn capital | | | 457 | | | 65,842 | |
| Accrued expenses and other liabilities | | | 17,718 | | | 22,450 | |
| Total Liabilities | | | 38,055 | | | 129,649 | |
| Net Assets | | $ | 19,132,092 | | $ | 37,416,457 | |
| (1) Cost of investments | | $ | 18,920,465 | | $ | 40,528,829 | |
| (2) Premiums received | | $ | 31,663 | | $ | — | |
The accompanying notes are an integral part of these financial statements.
| KINETICS PORTFOLIOS TRUST — MASTER INVESTMENT PORTFOLIOS |
| Statements of Operations |
| For the Year Ended December 31, 2018 |
| | | | The Internet | | | The Global | |
| | | | Portfolio | | | Portfolio | |
| | | | (Consolidated) | | | (Consolidated) | |
| INVESTMENT INCOME: | | | | | | | |
| Dividends† | | $ | 273,468 | | $ | 42,469 | |
| Interest | | | 848,275 | | | 110,044 | |
| Income from securities lending | | | 837 | | | 606 | |
| Total investment income | | | 1,122,580 | | | 153,119 | |
| EXPENSES: | | | | | | | |
| Investment advisory fees | | | 1,788,649 | | | 175,456 | |
| Administration fees | | | 74,009 | | | 14,268 | |
| Professional fees | | | 32,366 | | | 13,912 | |
| Fund accounting fees | | | 30,453 | | | 6,685 | |
| Trustees’ fees | | | 14,779 | | | 1,456 | |
| Chief Compliance Officer fees | | | 2,743 | | | 277 | |
| Custodian fees and expenses | | | 26,717 | | | 20,171 | |
| Registration fees | | | 161 | | | 86 | |
| Other expenses | | | 5,636 | | | 494 | |
| Total expenses | | | 1,975,513 | | | 232,805 | |
| Net investment loss | | | (852,933 | ) | | (79,686 | ) |
| REALIZED AND UNREALIZED GAIN (LOSS) ON INVESTMENTS: | | | | | | | |
| Net realized gain (loss) on: | | | | | | | |
| Investments and foreign currency | | | 32,301,030 | | | (276,114 | ) |
| Net change in unrealized depreciation of: | | | | | | | |
| Investments and foreign currency | | | (74,922,835 | ) | | (3,293,146 | ) |
| Net realized and unrealized loss on investments | | | (42,621,805 | ) | | (3,569,260 | ) |
| Net decrease in net assets resulting from operations | | $ | (43,474,738 | ) | $ | (3,648,946 | ) |
| † Net of foreign taxes withheld of: | | $ | 2,183 | | $ | 4,378 | |
The accompanying notes are an integral part of these financial statements.
| KINETICS PORTFOLIOS TRUST — MASTER INVESTMENT PORTFOLIOS |
| Statements of Operations — (Continued) |
| For the Year Ended December 31, 2018 |
| | | | The Paradigm
Portfolio | | | The Medical | |
| | | | (Consolidated) | | | Portfolio | |
| INVESTMENT INCOME: | | | | | | | |
| Dividends† | | $ | 1,767,934 | | $ | 429,761 | |
| Interest | | | 2,023,148 | | | 2,271 | |
| Income from securities lending | | | 13,468 | | | 2,069 | |
| Dividends from affiliated issuer | | | 2,085,199 | | | — | |
| Total investment income | | | 5,889,749 | | | 434,101 | |
| EXPENSES: | | | | | | | |
| Investment advisory fees | | | 10,428,744 | | | 224,006 | |
| Administration fees | | | 387,725 | | | 14,683 | |
| Professional fees | | | 120,480 | | | 10,113 | |
| Fund accounting fees | | | 161,410 | | | 5,070 | |
| Trustees’ fees | | | 83,642 | | | 1,773 | |
| Chief Compliance Officer fees | | | 15,051 | | | 318 | |
| Custodian fees and expenses | | | 117,539 | | | 5,800 | |
| Registration fees | | | 574 | | | 91 | |
| Other expenses | | | 30,669 | | | 753 | |
| Total expenses | | | 11,345,834 | | | 262,607 | |
| Net investment income (loss) | | | (5,456,085 | ) | | 171,494 | |
| REALIZED AND UNREALIZED GAIN (LOSS) ON INVESTMENTS: | | | | | | | |
| Net realized gain on: | | | | | | | |
| Investments and foreign currency | | | 66,283,100 | | | 1,560,378 | |
| Affiliated issuer | | | 63,293,241 | | | — | |
| Net change in unrealized depreciation of: | | | | | | | |
| Investments and foreign currency | | | (162,235,008 | ) | | (1,466,285 | ) |
| Affiliated Issuer | | | (3,016,067 | ) | | — | |
| Net realized and unrealized gain (loss) on investments | | | (35,674,734 | ) | | 94,093 | |
| Net increase (decrease) in net assets resulting from operations | | $ | (41,130,819 | ) | $ | 265,587 | |
| † Net of foreign taxes withheld of: | | $ | 136,125 | | $ | 16,615 | |
The accompanying notes are an integral part of these financial statements.
| KINETICS PORTFOLIOS TRUST — MASTER INVESTMENT PORTFOLIOS |
| Statements of Operations — (Continued) |
| For the Year Ended December 31, 2018 |
| | | | The Small Cap | | | The Market | |
| | | | Opportunities | | | Opportunities | |
| | | | Portfolio | | | Portfolio | |
| | | | (Consolidated) | | | (Consolidated) | |
| INVESTMENT INCOME: | | | | | | | |
| Dividends† | | $ | 1,483,705 | | $ | 301,515 | |
| Interest | | | 1,403,456 | | | 630,106 | |
| Income from securities lending | | | 963 | | | 1,055 | |
| Total investment income | | | 2,888,124 | | | 932,676 | |
| EXPENSES: | | | | | | | |
| Investment advisory fees | | | 3,477,392 | | | 1,053,737 | |
| Administration fees | | | 134,355 | | | 46,471 | |
| Professional fees | | | 42,602 | | | 23,143 | |
| Fund accounting fees | | | 55,336 | | | 19,241 | |
| Trustees’ fees | | | 27,873 | | | 8,616 | |
| Chief Compliance Officer fees | | | 4,922 | | | 1,590 | |
| Custodian fees and expenses | | | 46,544 | | | 27,494 | |
| Registration fees | | | 219 | | | 119 | |
| Other expenses | | | 8,812 | | | 2,792 | |
| Total expenses | | | 3,798,055 | | | 1,183,203 | |
| Net investment loss | | | (909,931 | ) | | (250,527 | ) |
| REALIZED AND UNREALIZED GAIN (LOSS) ON INVESTMENTS: | | | | | | | |
| Net realized gain on: | | | | | | | |
| Investments and foreign currency | | | 1,460,421 | | | 3,266,854 | |
| Net change in unrealized depreciation of: | | | | | | | |
| Investments and foreign currency | | | (7,770,750 | ) | | (12,167,425 | ) |
| Net realized and unrealized loss on investments | | | (6,310,329 | ) | | (8,900,571 | ) |
| Net decrease in net assets resulting from operations | | $ | (7,220,260 | ) | $ | (9,151,098 | ) |
| † Net of foreign taxes withheld of: | | $ | 50,830 | | $ | 15,757 | |
The accompanying notes are an integral part of these financial statements.
| KINETICS PORTFOLIOS TRUST — MASTER INVESTMENT PORTFOLIOS |
| Statements of Operations — (Continued) |
| For the Year Ended December 31, 2018 |
| | | The Alternative | | | The Multi-
Disciplinary | |
| | | | Income | | | Income | |
| | | | Portfolio | | | Portfolio | |
| INVESTMENT INCOME: | | | | | | | |
| Dividends | | $ | 141,488 | | $ | 408,154 | |
| Interest | | | 256,493 | | | 1,995,405 | |
| Income from securities lending | | | — | | | 8,755 | |
| Total investment income | | | 397,981 | | | 2,412,314 | |
| EXPENSES: | | | | | | | |
| Investment advisory fees | | | 189,281 | | | 543,389 | |
| Administration fees | | | 17,718 | | | 28,403 | |
| Professional fees | | | 10,505 | | | 13,086 | |
| Fund accounting fees | | | 4,373 | | | 15,780 | |
| Trustees’ fees | | | 2,072 | | | 4,192 | |
| Chief Compliance Officer fees | | | 362 | | | 735 | |
| Custodian fees and expenses | | | 5,612 | | | 9,806 | |
| Borrowing expense on securities sold short | | | 14 | | | — | |
| Registration fees | | | 94 | | | 114 | |
| Other expenses | | | 949 | | | 2,391 | |
| Total expenses | | | 230,980 | | | 617,896 | |
| Net investment income | | | 167,001 | | | 1,794,418 | |
| REALIZED AND UNREALIZED GAIN (LOSS) ON INVESTMENTS: | | | | | | | |
| Net realized gain (loss) on: | | | | | | | |
| Investments and foreign currency | | | (734 | ) | | (106,210 | ) |
| Written option contracts expired or closed | | | 13,143 | | | — | |
| Net change in unrealized appreciation (depreciation) of: | | | | | | | |
| Investments and foreign currency | | | (71,861 | ) | | (2,054,163 | ) |
| Written option contracts | | | 19,095 | | | — | |
| Net realized and unrealized loss on investments | | | (40,357 | ) | | (2,160,373 | ) |
| Net increase (decrease) in net assets resulting from operations | | $ | 126,644 | | $ | (365,955 | ) |
The accompanying notes are an integral part of these financial statements.
| KINETICS PORTFOLIOS TRUST — MASTER INVESTMENT PORTFOLIOS |
| Statements of Changes in Net Assets |
| | | | The Internet Portfolio | | | The Global Portfolio | |
| | | | (Consolidated) | | | (Consolidated) | |
| | | | For the | | | For the | | | For the | | | For the | |
| | | | Year Ended | | | Year Ended | | | Year Ended | | | Year Ended | |
| | | | December 31, | | | December 31, | | | December 31, | | | December 31, | |
| | | | 2018 | | | 2017 | | | 2018 | | | 2017 | |
| OPERATIONS: | | | | | | | | | | | | | |
| Net investment income (loss) | | $ | (852,933 | ) | $ | 1,589,057 | | $ | (79,686 | ) | $ | 182,198 | |
| Net realized gain (loss) on sale of investments and foreign currency | | | 32,301,030 | | | 26,953,722 | | | (276,114 | ) | | 1,161,990 | |
| Net change in unrealized appreciation (depreciation) of investments and foreign currency | | | (74,922,835 | ) | | 32,203,348 | | | (3,293,146 | ) | | 3,028,801 | |
| Net increase (decrease) in net assets resulting from operations | | | (43,474,738 | ) | | 60,746,127 | | | (3,648,946 | ) | | 4,372,989 | |
| NET INCREASE (DECREASE) IN NET ASSETS RESULTING FROM BENEFICIAL INTEREST TRANSACTIONS: | | | | | | | | | | | | | |
| Contributions | | | 6,470,678 | | | 10,131,294 | | | 1,307,577 | | | 7,108,538 | |
| Withdrawals | | | (25,363,999 | ) | | (15,244,544 | ) | | (2,373,818 | ) | | (3,336,395 | ) |
| Net increase (decrease) in net assets resulting from beneficial interest transactions | | | (18,893,321 | ) | | (5,113,250 | ) | | (1,066,241 | ) | | 3,772,143 | |
| Total increase (decrease) in net assets | | | (62,368,059 | ) | | 55,632,877 | | | (4,715,187 | ) | | 8,145,132 | |
| NET ASSETS: | | | | | | | | | | | | | |
| Beginning of year | | | 168,262,652 | | | 112,629,775 | | | 15,687,183 | | | 7,542,051 | |
| End of year | | $ | 105,894,593 | | $ | 168,262,652 | | $ | 10,971,996 | | $ | 15,687,183 | |
The accompanying notes are an integral part of these financial statements.
| KINETICS PORTFOLIOS TRUST — MASTER INVESTMENT PORTFOLIOS |
| Statements of Changes in Net Assets — (Continued) |
| | | | The Paradigm Portfolio | | | | |
| | | | (Consolidated) | | | The Medical Portfolio | |
| | | | For the | | | For the | | | For the | | | For the | |
| | | | Year Ended | | | Year Ended | | | Year Ended | | | Year Ended | |
| | | | December 31, | | | December 31, | | | December 31, | | | December 31, | |
| | | | 2018 | | | 2017 | | | 2018 | | | 2017 | |
| OPERATIONS: | | | | | | | | | | | | | |
| Net investment income (loss) | | $ | (5,456,085 | ) | $ | (4,045,308 | ) | $ | 171,494 | | $ | 167,801 | |
| Net realized gain on sale of investments and foreign currency | | | 129,576,341 | | | 119,634,321 | | | 1,560,378 | | | 2,353,068 | |
| Net change in unrealized appreciation (depreciation) of investments and foreign currency | | | (165,251,075 | ) | | 70,781,962 | | | (1,466,285 | ) | | (424,289 | ) |
| Net increase (decrease) in net assets resulting from operations | | | (41,130,819 | ) | | 186,370,975 | | | 265,587 | | | 2,096,580 | |
| NET DECREASE IN NET ASSETS RESULTING FROM BENEFICIAL INTEREST TRANSACTIONS: | | | | | | | | | | | | | |
| Contributions | | | 77,369,100 | | | 12,803,836 | | | 206,115 | | | 254,967 | |
| Withdrawals | | | (168,838,467 | ) | | (244,444,530 | ) | | (3,464,345 | ) | | (4,582,568 | ) |
| Net decrease in net assets resulting from beneficial interest transactions | | | (91,469,367 | ) | | (231,640,694 | ) | | (3,258,230 | ) | | (4,327,601 | ) |
| Total decrease in net assets | | | (132,600,186 | ) | | (45,269,719 | ) | | (2,992,643 | ) | | (2,231,021 | ) |
| NET ASSETS: | | | | | | | | | | | | | |
| Beginning of year | | | 790,879,852 | | | 836,149,571 | | | 19,462,335 | | | 21,693,356 | |
| End of year | | $ | 658,279,666 | | $ | 790,879,852 | | $ | 16,469,692 | | $ | 19,462,335 | |
The accompanying notes are an integral part of these financial statements.
| KINETICS PORTFOLIOS TRUST — MASTER INVESTMENT PORTFOLIOS |
| Statements of Changes in Net Assets — (Continued) |
| | | | The Small Cap
Opportunities Portfolio
(Consolidated) | | | The Market
Opportunities Portfolio
(Consolidated) | |
| | | | For the | | | For the | | | For the | | | For the | |
| | | | Year Ended | | | Year Ended | | | Year Ended | | | Year Ended | |
| | | | December 31, | | | December 31, | | | December 31, | | | December 31, | |
| | | | 2018 | | | 2017 | | | 2018 | | | 2017 | |
| OPERATIONS: | | | | | | | | | | | | | |
| Net investment income (loss) | | $ | (909,931 | ) | $ | (856,096 | ) | $ | (250,527 | ) | $ | 532,051 | |
| Net realized gain on sale of investments and foreign currency | | | 1,460,421 | | | 15,147,605 | | | 3,266,854 | | | 7,026,703 | |
| Net change in unrealized appreciation (depreciation) of investments and foreign currency | | | (7,770,750 | ) | | 25,750,188 | | | (12,167,425 | ) | | 13,988,377 | |
| Net increase (decrease) in net assets resulting from operations | | | (7,220,260 | ) | | 40,041,697 | | | (9,151,098 | ) | | 21,547,131 | |
| NET INCREASE (DECREASE) IN NET ASSETS RESULTING FROM BENEFICIAL INTEREST TRANSACTIONS: | | | | | | | | | | | | | |
| Contributions | | | 153,048,372 | | | 4,633,887 | | | 12,968,925 | | | 15,384,639 | |
| Withdrawals | | | (103,903,461 | ) | | (68,405,319 | ) | | (8,159,216 | ) | | (3,235,027 | ) |
| Net increase (decrease) in net assets resulting from beneficial interest transactions | | | 49,144,911 | | | (63,771,432 | ) | | 4,809,709 | | | 12,149,612 | |
| Total increase (decrease) in net assets | | | 41,924,651 | | | (23,729,735 | ) | | (4,341,389 | ) | | 33,696,743 | |
| NET ASSETS: | | | | | | | | | | | | | |
| Beginning of year | | | 181,468,964 | | | 205,198,699 | | | 77,279,917 | | | 43,583,174 | |
| End of year | | $ | 223,393,615 | | $ | 181,468,964 | | $ | 72,938,528 | | $ | 77,279,917 | |
The accompanying notes are an integral part of these financial statements.
| KINETICS PORTFOLIOS TRUST — MASTER INVESTMENT PORTFOLIOS |
| Statements of Changes in Net Assets — (Continued) |
| | | | The Alternative | | | The Multi-Disciplinary | |
| | | | Income Portfolio | | | Income Portfolio | |
| | | | For the | | | For the | | | For the | | | For the | |
| | | | Year Ended | | | Year Ended | | | Year Ended | | | Year Ended | |
| | | | December 31, | | | December 31, | | | December 31, | | | December 31, | |
| | | | 2018 | | | 2017 | | | 2018 | | | 2017 | |
| OPERATIONS: | | | | | | | | | | | | | |
| Net investment income (loss) | | $ | 167,001 | | $ | (9,802 | ) | $ | 1,794,418 | | $ | 2,243,561 | |
| Net realized gain (loss) on sale of investments, foreign currency and written options and distributions received from other investment companies | | | 12,409 | | | 833,223 | | | (106,210 | ) | | 510,492 | |
| Net change in unrealized appreciation (depreciation) of investments, foreign currency and written options | | | (52,766 | ) | | (228,882 | ) | | (2,054,163 | ) | | 314,866 | |
| Net increase (decrease) in net assets resulting from operations | | | 126,644 | | | 594,539 | | | (365,955 | ) | | 3,068,919 | |
| NET DECREASE IN NET ASSETS RESULTING FROM BENEFICIAL INTEREST TRANSACTIONS: | | | | | | | | | | | | | |
| Contributions | | | 2,933,892 | | | 4,826,367 | | | 5,144,814 | | | 11,080,450 | |
| Withdrawals | | | (7,035,790 | ) | | (10,355,569 | ) | | (16,568,073 | ) | | (64,717,800 | ) |
| Net decrease in net assets resulting from beneficial interest transactions | | | (4,101,898 | ) | | (5,529,202 | ) | | (11,423,259 | ) | | (53,637,350 | ) |
| Total decrease in net assets | | | (3,975,254 | ) | | (4,934,663 | ) | | (11,789,214 | ) | | (50,568,431 | ) |
| NET ASSETS: | | | | | | | | | | | | | |
| Beginning of year | | | 23,107,346 | | | 28,042,009 | | | 49,205,671 | | | 99,774,102 | |
| End of year | | $ | 19,132,092 | | $ | 23,107,346 | | $ | 37,416,457 | | $ | 49,205,671 | |
The accompanying notes are an integral part of these financial statements.
| KINETICS PORTFOLIOS TRUST — MASTER INVESTMENT PORTFOLIOS |
| Notes to Consolidated Financial Statements |
| December 31, 2018 |
1. Organization
The Kinetics Portfolios Trust (the “Trust”) was organized as a Delaware Statutory Trust on March 14, 2000 and is registered under the Investment Company Act of 1940, as amended (the “1940 Act”), as an open-end management investment company issuing its beneficial interests in series, each series representing a distinct portfolio with its own investment objective and policies. The series currently authorized are: The Internet Portfolio, The Global Portfolio, The Paradigm Portfolio, The Medical Portfolio, The Small Cap Opportunities Portfolio, The Market Opportunities Portfolio, The Alternative Income Portfolio and The Multi-Disciplinary Income Portfolio (collectively, the “Master Portfolios”). Pursuant to the 1940 Act, the Master Portfolios, are “non-diversified” series of the Trust, except The Global Portfolio, The Alternative Income Portfolio and The Multi-Disciplinary Income Portfolio. The Market Opportunities Portfolio commenced operations on January 31, 2006, The Alternative Income Portfolio commenced operations on June 29, 2007 and The Multi-Disciplinary Income Portfolio commenced operations on February 11, 2008. Each of the remaining Master Portfolios commenced operations on April 28, 2000.
Each Master Portfolio is a Master Investment Portfolio in a master-feeder fund structure. Each Master Portfolio has multiple feeder funds invested in the Master Portfolio. By contributing assets to the Master Portfolio, the feeder funds receive a beneficial interest in the Master Portfolio. The Master Portfolio then invests the contributed assets in portfolio securities and allocates income, gains (losses) and expenses to the feeder funds based on the feeder funds’ proportionate interests in the Master Portfolio.
Each of the Master Portfolios, except for The Alternative Income Portfolio and The Multi-Disciplinary Income Portfolio, seeks to provide investors with long-term capital growth. The Alternative Income Portfolio seeks to provide current income and gains. The Multi-Disciplinary Income Portfolio seeks to provide investors with total return. The Internet Portfolio invests primarily in the equity securities of U.S. and foreign companies engaged in the Internet and Internet-related activities. The Global Portfolio generally invests in the equity securities of foreign companies that have the ability to facilitate an increase in the growth of their traditional business lines and in U.S. companies benefiting from international economic growth. The Paradigm Portfolio invests primarily in the equity securities of U.S. and foreign companies that the investment adviser
| KINETICS PORTFOLIOS TRUST — MASTER INVESTMENT PORTFOLIOS |
| Notes to Consolidated Financial Statements — |
| (Continued) December 31, 2018 |
believes are undervalued and that have high returns on equity and are well positioned to reduce their costs, extend the reach of their distribution channels and experience significant growth in their assets or revenues. The Medical Portfolio invests primarily in the equity securities of U.S. and foreign companies engaged in medical research, pharmaceutical treatments and related medical technology industries and related technology industries, generally, with a focus on companies engaged in cancer research and drug development. The Small Cap Opportunities Portfolio invests primarily in the equity securities of U.S. and foreign small capitalized companies that provide attractive valuation opportunities due to special situations such as lack of institutional ownership, lack of significant analyst coverage or companies with sound fundamentals that have experienced a short-term earnings shortfall. The Market Opportunities Portfolio invests primarily in the equity securities of U.S. and foreign companies engaged in capital markets or related to capital markets, as well as companies involved in the gaming industry. The Alternative Income and Multi-Disciplinary Income Portfolios utilize a two-part investment strategy, which includes fixed income and derivatives components. The Internet Portfolio, Global Portfolio, Paradigm Portfolio, Small Cap Opportunities Portfolio and Market Opportunities Portfolio utilize wholly-owned subsidiaries to achieve their investment objectives. Please see Note 2 for further details.
2. Significant Accounting Policies
Security Valuation
Master Portfolios equity securities that are listed on a securities exchange for which market quotations are readily available are valued at the last quoted sale price on the day the valuation is made. Price information on listed securities is taken from the exchange where the security is primarily traded. All equity securities, including exchange-traded funds, that are traded using the National Association of Securities Dealers’ Automated Quotation System (“NASDAQ”) are valued using the NASDAQ Official Closing Price (“NOCP”). In the event market quotations are not readily available or if events occur that may materially affect the value of a particular security between the time trading ends on a particular security and the close of regular trading on the New York Stock Exchange (“NYSE”), “fair value” will be determined. Unlisted equity securities and listed equity securities not traded on the valuation date for which market quotations are readily available are valued at the last bid price. Futures, options on futures and swap contracts that are listed or traded on a national securities exchange, commodities exchange, contract market or over-the-counter markets
| KINETICS PORTFOLIOS TRUST — MASTER INVESTMENT PORTFOLIOS |
| Notes to Consolidated Financial Statements — |
| (Continued) December 31, 2018 |
and are freely transferable will be valued at the composite price, using the National Best Bid and Offer quotes (“NBBO”). NBBO consists of the highest bid price and lowest ask price across any of the exchanges on which an option is quoted, thus providing a view across the entire U.S. options marketplace.
Composite option pricing calculates the mean of the highest bid price and lowest asked price across the exchanges where the option is traded. If a composite option price is not available, then a quote provided by one of the authorized pricing vendors will be used. If neither a composite price nor a quote from an authorized pricing provider is available, and it is the day of expiration or post-expiration, expiring options will be priced at intrinsic value. Non-exchange-traded options for which over-the-counter quotations are not readily available are valued at the mean between the last bid and asked quotations. Debt obligations (including convertible securities) that are either investment grade or below investment grade and irrespective of days to maturity are valued at evaluated mean by one of the authorized third party pricing agents which rely on various valuation methodologies such as matrix pricing and other analytical pricing models as well as market transactions and dealer quotations. Certain instruments, such as repurchase agreements and demand notes, do not have values from third parties and are valued at amortized cost. Investments in registered open-end investment companies (including money market funds), other than exchange-traded funds, are valued at their reported net asset value (“NAV”).
Other assets and securities for which no quotations are readily available (including restricted securities) will be valued in good faith at fair value using methods determined by the Board of Trustees of the Master Portfolios. In determining the fair value of a security, the Board of Trustees shall take into account the relevant factors and surrounding circumstances, which may include: (i) the nature and pricing history (if any) of the security; (ii) whether any dealer quotations for the security are available; (iii) possible valuation methodologies that could be used to determine the fair value of the security; (iv) the recommendation of the portfolio manager of the Portfolios with respect to the valuation of the security; (v) whether the same or similar securities are held by other funds managed by the Adviser or other funds and the method used to price the security in those funds; (vi) the extent to which the fair value to be determined for the security will result from the use of data or formula produced by third parties independent of the Adviser; (vii) the liquidity or illiquidity of the market for the security; and (viii) the value of a foreign security
| KINETICS PORTFOLIOS TRUST — MASTER INVESTMENT PORTFOLIOS |
| Notes to Consolidated Financial Statements — |
| (Continued) December 31, 2018 |
traded on other foreign markets. At December 31, 2018, 0.00% and 0.00% of the net assets of The Internet Portfolio and The Paradigm Portfolio, respectively, were fair valued securities. The other Master Portfolios did not hold any fair valued securities at December 31, 2018.
Bitcoin
The Master Portfolios may invest in Grayscale Bitcoin Trust, a Delaware statutory trust (“Bitcoin Trust”) that invests in bitcoins. From time to time, the Bitcoin Trust issues creation units in exchange for bitcoins and distributes bitcoins in exchange for redemption units. The performance of the Bitcoin Trust is intended to reflect changes in the value of the Trust’s bitcoin investments. At December 31, 2018, 8.0%, 5.7%, 1.2%, 0.5%, and 3.3% of the net assets of The Internet Portfolio, The Global Portfolio, The Paradigm Portfolio, The Small Cap Opportunities Portfolio and The Market Opportunities Portfolio, respectively, were invested in the Bitcoin Trust. Investments in bitcoins produce non qualifying income under Subchapter M of the Internal Revenue Code.
Bitcoin is a decentralized digital currency that enables instant transfers to anyone, anywhere in the world. Managing transactions in bitcoins occurs via an open source, cryptographic protocol central authority. The Bitcoin Network is an online, end-user-to-end-user network that hosts the public transaction ledger, known as the Blockchain, and the source code that comprises the basis for the cryptographic and algorithmic protocols governing the Bitcoin Network. No single entity owns or operates the Bitcoin Network, the infrastructure of which is collectively maintained by a decentralized user base. Since the Bitcoin Network is decentralized, it does not rely on either governmental authorities or financial institutions to create, transmit or determine the value of bitcoins. Rather, the value of bitcoins is determined by the supply of and demand for bitcoins in the global bitcoin exchange market for the trading of bitcoins, which consists of transactions on electronic bitcoin exchanges (“Bitcoin Exchanges”). Pricing on Bitcoin Exchanges and other venues can be volatile and can adversely affect the value of the Bitcoin Trust. Currently, there is relatively small use of bitcoins in the retail and commercial marketplace in comparison to the relatively large use of bitcoins by speculators, thus contributing to price volatility that could adversely affect a Master Portfolio’s direct or indirect investment in the Bitcoin Trust. Bitcoin transactions are irrevocable, and stolen or incorrectly transferred bitcoins may be irretrievable. As a result, any
| KINETICS PORTFOLIOS TRUST — MASTER INVESTMENT PORTFOLIOS |
| Notes to Consolidated Financial Statements — |
| (Continued) December 31, 2018 |
incorrectly executed bitcoin transactions could adversely affect the value of a Master Portfolio’s direct or indirect investment in the Bitcoin Trust. Shares of the Bitcoin Trust may trade at a premium or discount to the net asset value of the Bitcoin Trust. The price of bitcoins is set in transfers by mutual agreement or barter as well as the number of merchants that accept bitcoins. Because bitcoins are digital files that can be transferred without the involvement of intermediaries or third parties, there are little or no transaction costs in direct end-user-to-end-user transactions. Bitcoins can be used to pay for goods and services or can be converted to fiat currencies, such as the U.S. dollar, at rates determined by the Bitcoin Exchanges. Additionally, third party service providers such as Bitcoin Exchanges are also used for transfers but they may charge significant fees for processing transactions.
As bitcoins have grown in popularity, the U.S. Congress and a number of federal and state agencies (including the Financial Crimes Enforcement Network (FinCEN), the U.S. Securities and Exchange Commission, the Commodity Futures Trading Commission, the Financial Industry Regulatory Authority, the Consumer Financial Protection Bureau, the Department of Justice, the Department of Homeland Security, the Federal Bureau of Investigation, the IRS, and state financial institution regulators) have begun to examine the operations of the network that facilitates bitcoins, bitcoin users and the Bitcoin Exchanges, with particular focus on (1) the extent to which bitcoins can be used to launder the proceeds of illegal activities or fund criminal or terrorist enterprises, (2) the safety and soundness of the Bitcoin Exchange or other service-providers that hold bitcoins for users and (3) other risks to investors and consumers who hold and use bitcoins. Ongoing and future regulatory actions may alter, perhaps to a materially adverse extent, the value of a Master Portfolio’s and its Subsidiary’s investment in the Bitcoin Trust or the ability of the Bitcoin Trust to continue to operate.
Consolidation of Subsidiaries
The consolidated financial statements include the accounts of Cayman, Ltd., Cayman wholly-owned Controlled Foreign Corporations (“CFCs”) and the accounts of Delaware Corporations (the “Cayman” or “Delaware”, respectively, or “Subsidiaries” for both). The respective Master Portfolios hold a CFC: Internet Portfolio, Global Portfolio, Paradigm Portfolio, Small Cap Opportunities Portfolio and Market Opportunities Portfolio. The respective Master Portfolios hold a Delaware subsidiary: Internet Portfolio, Global Portfolio, Paradigm
| KINETICS PORTFOLIOS TRUST — MASTER INVESTMENT PORTFOLIOS |
| Notes to Consolidated Financial Statements — |
| (Continued) December 31, 2018 |
Portfolio, and Market Opportunities Portfolio. Each Master Portfolio can invest up to 25% of its total assets in the Subsidiaries. The Subsidiaries act as an investment vehicle in order to invest in commodity-linked and bitcoin-linked instruments consistent with the Portfolio’s investment objectives and policies. By investing in its Subsidiaries, a Master Portfolio is indirectly exposed to the risks associated with the Subsidiary’s investments. The investments held by a Subsidiary are generally similar to those that are permitted to be held by the Master Portfolio and are subject to the same risks that apply to similar investments if held directly by the Master Portfolio. Each Subsidiary is not registered under the 1940 Act and is not subject to all the investor protections of the 1940 Act. However, each Master Portfolio wholly-owns and controls its Subsidiaries, making it unlikely that the Subsidiaries will take action contrary to the interests of the Master Portfolio. Each Subsidiary will be subject to the same investment restrictions and limitations and follow the same compliance policies and procedures as its Master Portfolio.
The Cayman Subsidiary is an exempted Cayman investment company and is not subject to Cayman Islands taxes at the present time. For U.S. income tax purposes, each Cayman Subsidiary is a CFC not subject to U.S. income taxes. As a wholly-owned CFC, however, each Cayman Subsidiary’s net income and capital gain will be included each year in the respective Portfolio’s investment company taxable income.
As of December 31, 2018, the respective Cayman Subsidiary’s market value and percent of the respective Portfolio’s net assets were:
| The Internet Portfolio | | $ | 7,207,550 | | | 6.81 | % |
| Global Portfolio | | $ | 567,404 | | | 5.17 | % |
| Paradigm Portfolio | | $ | 14,651,822 | | | 2.23 | % |
| Small Cap Opportunities Portfolio | | $ | 4,982,482 | | | 2.23 | % |
| Market Opportunities Portfolio | | $ | 1,836,506 | | | 2.52 | % |
The Delaware Subsidiary is organized under Delaware law. Any net gains that the Delaware Subsidiary recognizes on future sales of the contributed Bitcoin Trust shares will be subject to federal and state corporate income tax, but the dividends that the Delaware Subsidiary pays to its respective Master Portfolio (i.e., those gains, net of the tax paid and any other expenses of the Delaware Subsidiary) will be eligible to be treated as “qualified dividend income” under the Internal Revenue Code.
| KINETICS PORTFOLIOS TRUST — MASTER INVESTMENT PORTFOLIOS |
| Notes to Consolidated Financial Statements — |
| (Continued) December 31, 2018 |
As of December 31, 2018, the respective Delaware Subsidiary’s net assets and percent of the respective Portfolio’s net assets were:
| The Internet Portfolio | | $ | 278 | | | 0.00 | % |
| Global Portfolio | | $ | 1,061 | | | 0.01 | % |
| Paradigm Portfolio | | $ | 3,970 | | | 0.00 | % |
| Market Opportunities Portfolio | | $ | 710 | | | 0.00 | % |
Repurchase Agreements
Each Master Portfolio may enter into repurchase agreements with banks that are members of the Federal Reserve System or securities dealers who are members of a national securities exchange or are primary dealers in U.S. Government Securities. In connection with transactions in repurchase agreements, it is the Trust’s policy that the Master Portfolio receive, as collateral, securities whose market value, including accrued interest, at all times will be at least equal to 102% of the amount invested by the Master Portfolio in each repurchase agreement. If the seller defaults, and the value of the collateral declines, realization of the collateral by the Master Portfolio may be delayed or limited.
Written Options
The Master Portfolios may write (sell) call or put options for trading or hedging purposes. When a Master Portfolio writes an option, an amount equal to the premium received by the Master Portfolio is included in the Statement of Assets and Liabilities as an asset and an equivalent liability. The amount of the liability is subsequently marked-to-market to reflect the current value of the option written. By writing the option, the Master Portfolio may become obligated during the term of the option to deliver or purchase the securities underlying the option at the exercise price if the option is exercised. When an option expires on its stipulated expiration date or the Master Portfolio enters into a closing purchase transaction, the Master Portfolio realizes a gain or loss if the cost of the closing transaction differs from the premium received when the option was sold, without regard to any unrealized gain or loss on the underlying security, and the liability related to such option is eliminated. When an option is exercised, the premium originally received decreases the cost basis of the underlying security (or increases the proceeds on the security sold short) and the Master Portfolio realizes a gain or loss from the sale of the security (or closing of the short sale). As collateral for uncovered written options, the Master Portfolio is required under the 1940 Act to maintain assets consisting of cash, cash equivalents or unencumbered, liquid securities. This collateral is required to be adjusted daily to reflect the exercise price of the purchase obligation for
| KINETICS PORTFOLIOS TRUST — MASTER INVESTMENT PORTFOLIOS |
| Notes to Consolidated Financial Statements — |
| (Continued) December 31, 2018 |
put options or the market value of the instrument underlying the contract for call options.
Foreign Currency Translations
The books and records of the Master Portfolios are maintained in U.S. dollars. For the Master Portfolios, foreign currency transactions are translated into U.S. dollars on the following basis: (i) market values of investment securities and other assets and liabilities are translated at the exchange rate of such currencies against the U.S. dollar, as provided by an approved pricing service, and (ii) purchases and sales of investment securities, dividend and interest income and certain expenses at the rates of exchange prevailing on the respective dates of such transactions. The Master Portfolios do not isolate and treat as ordinary income that portion of the results of operations arising as a result of changes in the exchange rate from the fluctuations arising from changes in the market prices of securities held during the year. Such fluctuations are included with the net realized and unrealized gain or loss from investments. However, for federal income tax purposes, the Master Portfolios do isolate and treat as ordinary income the effect of changes in foreign exchange rates arising from actual foreign currency transactions and the effect of changes in foreign exchange rates arising between trade date and settlement date.
Restricted and Illiquid Securities
The Master Portfolios may invest in restricted securities. These securities are valued by the Master Portfolios after giving due consideration to pertinent factors including recent private sales, market conditions and the issuer’s financial performance. The Master Portfolios have no right to require registration of unregistered securities. The 144A securities have been deemed to be liquid by the Master Portfolios Adviser under the supervision of the Board of Trustees. At December 31, 2018, the following Master Portfolios held securities restricted to institutional investors (144A Securities):
| | | | | | | Percentage of |
| | | | Market Value | | | Net Assets |
| The Multi-Disciplinary Income Portfolio | | $ | 10,172,499 | | | | 27.19 | % |
| | | | | | | | | |
An illiquid asset is any asset which may not be sold or disposed of in current market conditions within seven days without the sale or disposition
| KINETICS PORTFOLIOS TRUST — MASTER INVESTMENT PORTFOLIOS |
| Notes to Consolidated Financial Statements — |
| (Continued) December 31, 2018 |
significantly changing the market value of the investment. At December 31, 2018, the following Master Portfolios held illiquid securities:
| | | | | | | Percentage of |
| | | | Market Value | | | Net Assets |
| The Internet Portfolio | | $ | — | * | | | 0.00 | % |
| The Paradigm Portfolio | | | — | * | | | 0.00 | % |
| The Multi-Disciplinary Income Portfolio | | | 154,207 | | | | 0.41 | % |
| * | Amount is less than $0.50. |
When-Issued Securities
The Master Portfolios may purchase securities on a when-issued or delayed delivery basis. Although the purchase amounts of these securities are established at the time the purchaser enters into the agreement, these securities may be delivered and paid for at a future date. The Master Portfolios record purchases of when-issued securities and reflect the values of such securities in determining net asset value in the same manner as other portfolio securities. The Master Portfolios maintain at all times cash or other liquid assets in an amount at least equal to the amount of outstanding commitments for when-issued securities.
Securities Lending
Each Master Portfolio may lend its portfolio securities to broker-dealers by entering directly into lending arrangements with such broker dealers or indirectly through repurchase agreements with respect to no more than 331/3% of the total assets of each Master Portfolio (including any collateral posted) or 50% of the total assets of each Master Portfolio (excluding any collateral posted). Securities lending and repurchase transactions will be fully collateralized at all times with cash and/or short-term debt obligations. The Master Portfolios receive interest on the collateral received as well as a fee for the securities loaned.
Significant Investments
The Portfolios may invest a greater percentage of their assets in one or more individual securities at any time. The greater percentage of assets in individual securities (not including short-term investments or other funds) expose the Portfolios to the risk of unanticipated industry conditions, the risks particular to a single company or security, and the risk of potentially lower liquidity. At
| KINETICS PORTFOLIOS TRUST — MASTER INVESTMENT PORTFOLIOS |
| Notes to Consolidated Financial Statements — |
| (Continued) December 31, 2018 |
December 31, 2018, The Internet Portfolio, The Global Portfolio, The Paradigm Portfolio, The Medical Portfolio, The Small Cap Opportunities Portfolio, The Market Opportunities Portfolio and The Multi-Disciplinary Income Portfolio invested approximately 25%, 20%, 43%, 76%, 37%, 27% and 55% of their respective net assets in individual securities greater than 5% of net assets. Please see the respective Schedule of Investments for further details.
Short-Term Investments
The Portfolios may invest in money market funds and short-term high quality debt securities such as commercial paper, repurchase agreements and certificates of deposit. Money market funds typically invest in short-term instruments and attempt to maintain a stable net asset value. While the risk is low, these funds may lose value.
Expense Allocation
Common expenses incurred by the Master Portfolios are allocated among the Master Portfolios (i) based upon relative average net assets, (ii) as incurred on a specific identification basis, or (iii) equally among the Master Portfolios, depending on the nature of the expenditure. All expenses incurred by the Master Portfolios are allocated to the Feeder Funds daily based on their proportionate interests in the respective Master Portfolios.
Federal Income Taxes
Each Master Portfolio will be treated as a partnership for federal income tax purposes. As such, each investor in a Master Portfolio will be subject to taxation on its share of the Master Portfolio’s ordinary income and capital gains. It is intended that each Master Portfolio’s assets will be managed so an investor in the Master Portfolio can satisfy the requirements of subchapter M of the Internal Revenue Code.
There is no tax liability resulting from unrecognized tax benefits relating to uncertain income tax positions taken or expected to be taken in future tax returns. As of December 31, 2018, open tax years include the tax years ended December 31, 2015 through December 31, 2018. The Master Portfolios are
| KINETICS PORTFOLIOS TRUST — MASTER INVESTMENT PORTFOLIOS |
| Notes to Consolidated Financial Statements — |
| (Continued) December 31, 2018 |
also not aware of any tax positions for which it is reasonably possible that the total amounts of unrecognized tax benefits will significantly change in the next twelve months.
Use of Estimates
The preparation of financial statements in conformity with U.S. generally accepted accounting principles (“GAAP”) requires management to make estimates and assumptions that affect the reported amounts in the financial statements. Actual results could differ from those estimates.
Other
Realized gains and losses on the sale of investments are calculated on the identified cost basis. Dividend income is recorded on the ex-dividend date. Interest income is accounted for on the accrual basis and includes amortization of premiums and accretion of discounts on the effective interest method. Other noncash dividends are recognized as investment income at the fair value of the property received. Withholding taxes on foreign dividends have been incorporated in accordance with the Trust’s understanding of the applicable country’s tax rules and rates.
3. Investment Adviser
The Trust has entered into Investment Advisory Agreements (the “Agreements”) with Kinetics Asset Management LLC (the “Adviser”), with whom certain officers and trustees of the Trust are affiliated, to furnish investment advisory services to the Master Portfolios. The Adviser is a wholly-owned subsidiary of Horizon Kinetics LLC. Under the terms of the Agreements, the Master Portfolios, except the Alternative Income Portfolio, compensate the Adviser for its management services at the annual rate of 1.25% of each Master Portfolio’s average daily net assets. The Alternative Income Portfolio compensates the Adviser for its management services at the annual rate of 0.90% of the Master Portfolio’s average daily net assets.
| KINETICS PORTFOLIOS TRUST — MASTER INVESTMENT PORTFOLIOS |
| Notes to Consolidated Financial Statements — |
| (Continued) December 31, 2018 |
For the year ended December 31, 2018, Master Portfolios incurred the following expenses pursuant to the Agreements:
| | | | Investment Advisory Fees |
| The Internet Portfolio | | $ | 1,788,649 | |
| The Global Portfolio | | | 175,456 | |
| The Paradigm Portfolio | | | 10,428,744 | |
| The Medical Portfolio | | | 224,006 | |
| The Small Cap Opportunities Portfolio | | | 3,477,392 | |
| The Market Opportunities Portfolio | | | 1,053,737 | |
| The Alternative Income Portfolio | | | 189,281 | |
| The Multi-Disciplinary Income Portfolio | | | 543,389 | |
For the year ended December 31, 2018, the Trust was allocated approximately $26,000 for the services of the Chief Compliance Officer employed by the Adviser.
4. Securities Transactions
Purchases and sales of investment securities, other than short-term investments and short-term options, for the year ended December 31, 2018, were as follows:
| | | | Purchases | | | Sales | |
| | | | U.S.
Government | | | Other | | | U.S.
Government | | | Other | |
| The Internet Portfolio | | $ | — | | $ | 14,215,453 | | $ | — | | $ | 21,514,652 | |
| The Global Portfolio | | | — | | | 2,163,165 | | | — | | | 2,565,288 | |
| The Paradigm Portfolio | | | — | | | 21,651,989 | | | — | | | 152,041,346 | |
| The Medical Portfolio | | | — | | | — | | | — | | | 2,623,249 | |
| The Small Cap Opportunities Portfolio | | | — | | | 5,099,672 | | | — | | | 11,807,737 | |
| The Market Opportunities Portfolio | | | — | | | 3,918,421 | | | — | | | 4,044,011 | |
| The Alternative Income Portfolio | | | — | | | — | | | — | | | — | |
| The Multi-Disciplinary Income Portfolio | | | — | | | 635,367 | | | — | | | 8,346,498 | |
As of December 31, 2018, the cost of investments and unrealized appreciation (depreciation) on investment securities for federal income tax purposes was as follows:
| | | | Internet | | | Global | | | Paradigm | | | Medical | |
| Tax Cost of Investments | | $ | 111,845,606 | | $ | 10,122,935 | | $ | 485,771,770 | | $ | 12,204,701 | |
| Unrealized Appreciation | | | 5,961,464 | | | 1,794,922 | | | 246,828,639 | | | 6,492,815 | |
| Unrealized Depreciation | | | (10,442,344 | ) | | (973,551 | ) | | (69,641,788 | ) | | (2,275,586 | ) |
| Net Unrealized Appreciation (Depreciation) | | $ | (4,480,880 | ) | $ | 821,371 | | $ | 177,186,851 | | $ | 4,217,229 | |
| KINETICS PORTFOLIOS TRUST — MASTER INVESTMENT PORTFOLIOS |
| Notes to Consolidated Financial Statements — |
| (Continued) December 31, 2018 |
| | | | | | | | | | | | | Multi- | |
| | | | Small Cap | | | Market | | | Alternative | | | Disciplinary | |
| | | | Opportunities | | | Opportunities | | | Income | | | Income | |
| Tax Cost of Investments | | $ | 205,050,760 | | $ | 61,972,397 | | $ | 18,920,465 | | $ | 39,845,695 | |
| Unrealized Appreciation | | | 72,325,091 | | | 16,645,203 | | | 27,086 | | | 721,261 | |
| Unrealized Depreciation | | | (53,482,975 | ) | | (5,458,999 | ) | | (153,863 | ) | | (3,455,438 | ) |
| Net Unrealized Appreciation (Depreciation) | | $ | 18,842,116 | | $ | 11,186,204 | | $ | (126,777 | ) | $ | (2,734,177 | ) |
5. Portfolio Securities Loaned
As of December 31, 2018, the Master Portfolios had loaned securities that were collateralized by cash. The majority of the cash collateral is invested by the custodian in a money market pooled account approved by the Adviser. Although risk is mitigated by the collateral, a Master Portfolio could experience a delay in recovering its securities and possible loss of income or value if the borrower fails to return them. The Master Portfolio receives interest on the collateral received as well as a fee for the securities loaned. The Master Portfolios will continue to receive dividends and interest on all securities loaned. Gain or loss in the fair value of the securities loaned that may occur during the term of the loan will be accounted for by the Master Portfolios. Loans of securities are terminable at any time and the borrower, after notice, is required to return borrowed securities within the standard time period for settlement of securities transactions. As the securities loans are subject to termination by the Funds or the borrower at any time, the remaining maturities of the outstanding securities lending transactions are considered to be overnight and continuous. The value of the securities on loan and the value of the related collateral at December 31, 2018, were as follows:
| | | | Securities | | | Collateral | |
| The Internet Portfolio | | $ | 592,510 | | $ | 672,458 | |
| The Global Portfolio | | | 11,974 | | | 13,590 | |
| The Paradigm Portfolio | | | 3,989,849 | | | 4,528,201 | |
| The Medical Portfolio | | | — | | | — | |
| The Small Cap Opportunities Portfolio | | | 487,100 | | | 552,825 | |
| The Market Opportunities Portfolio | | | 123,026 | | | 139,626 | |
| The Alternative Income Portfolio | | | — | | | — | |
| The Multi-Disciplinary Income Portfolio | | | — | | | — | |
| KINETICS PORTFOLIOS TRUST — MASTER INVESTMENT PORTFOLIOS |
| Notes to Consolidated Financial Statements — |
| (Continued) December 31, 2018 |
6. Selected Financial Highlights
Financial highlights for the Master Portfolios were as follows:
| | | | The Internet Portfolio |
| | | | For the Year Ended
December 31,
2018 | | For the Year Ended
December 31,
2017 | | For the Year Ended
December 31,
2016 | | For the Year Ended
December 31,
2015 | | For the Year Ended
December 31,
2014 |
| Total Return | | | (26.86 | )% | | 57.90 | % | | 3.09 | % | | (4.95 | )% | | 0.28 | % |
| Ratio of expenses to average net assets: | | | 1.38 | % | | 1.37 | % | | 1.37 | % | | 1.35 | % | | 1.34 | % |
| Ratio of net investment income (loss) to average net assets: | | | (0.60 | )% | | 1.27 | % | | (1.18 | )% | | (1.05 | )% | | (0.90 | )% |
| Portfolio turnover rate | | | 15 | % | | 44 | % | | 2 | % | | 1 | % | | 1 | % |
| | | | The Global Portfolio |
| | | | For the Year Ended
December 31,
2018 | | For the Year Ended
December 31,
2017 | | For the Year Ended
December 31,
2016 | | For the Year Ended
December 31,
2015 | | For the Year Ended
December 31,
2014 |
| Total Return | | | (23.85 | )% | | 49.37 | % | | 14.13 | % | | (14.13 | )% | | (12.10 | )% |
| Ratio of expenses to average net assets: | | | 1.66 | % | | 1.59 | % | | 1.66 | % | | 1.69 | % | | 1.60 | % |
| Ratio of net investment income (loss) to average net assets: | | | (0.57 | )% | | 1.88 | % | | (0.44 | )% | | (0.59 | )% | | (0.52 | )% |
| Portfolio turnover rate | | | 28 | % | | 169 | % | | 11 | % | | 16 | % | | 14 | % |
| | | | The Paradigm Portfolio |
| | | | For the Year Ended
December 31,
2018 | | For the Year Ended
December 31,
2017 | | For the Year Ended
December 31,
2016 | | For the Year Ended
December 31,
2015 | | For the Year Ended
December 31,
2014 |
| Total Return | | | (5.27 | )% | | 28.69 | % | | 20.72 | % | | (8.04 | )% | | (0.48 | )% |
| Ratio of expenses to average net assets: | | | 1.36 | % | | 1.36 | % | | 1.37 | % | | 1.35 | % | | 1.33 | % |
| Ratio of net investment loss to average net assets: | | | (0.65 | )% | | (0.53 | )% | | (0.84 | )% | | (0.63 | )% | | (0.72 | )% |
| Portfolio turnover rate | | | 3 | % | | 14 | % | | 2 | % | | 2 | % | | 7 | % |
| KINETICS PORTFOLIOS TRUST — MASTER INVESTMENT PORTFOLIOS |
| Notes to Consolidated Financial Statements — |
| (Continued) December 31, 2018 |
| | | | The Medical Portfolio |
| | | | For the Year Ended
December 31,
2018 | | For the Year Ended
December 31,
2017 | | For the Year Ended
December 31,
2016 | | For the Year Ended
December 31,
2015 | | For the Year Ended
December 31,
2014 |
| Total Return | | | 1.59 | % | | 10.67 | % | | (8.04 | )% | | 6.58 | % | | 16.42 | % |
| Ratio of expenses to average net assets: | | | 1.47 | % | | 1.43 | % | | 1.42 | % | | 1.40 | % | | 1.41 | % |
| Ratio of net investment income to average net assets: | | | 0.96 | % | | 0.82 | % | | 0.66 | % | | 0.24 | % | | 0.44 | % |
| Portfolio turnover rate | | | 0 | % | | 0 | % | | 0 | % | | 12 | % | | 3 | % |
| | | | The Small Cap Opportunities Portfolio |
| | | | For the Year Ended
December 31,
2018 | | For the Year Ended
December 31,
2017 | | For the Year Ended
December 31,
2016 | | For the Year Ended
December 31,
2015 | | For the Year Ended
December 31,
2014 |
| Total Return | | | 0.56 | % | | 26.50 | % | | 24.67 | % | | (11.97 | )% | | (6.98 | )% |
| Ratio of expenses to average net assets: | | | 1.37 | % | | 1.37 | % | | 1.36 | % | | 1.35 | % | | 1.34 | % |
| Ratio of net investment loss to average net assets: | | | (0.33 | )% | | (0.47 | )% | | (0.75 | )% | | (0.65 | )% | | (0.59 | )% |
| Portfolio turnover rate | | | 3 | % | | 9 | % | | 4 | % | | 2 | % | | 19 | % |
| | | | The Market Opportunities Portfolio |
| | | | For the Year Ended
December 31,
2018 | | For the Year Ended
December 31,
2017 | | For the Year Ended
December 31,
2016 | | For the Year Ended
December 31,
2015 | | For the Year Ended
December 31,
2014 |
| Total Return | | | (10.62 | )% | | 47.53 | % | | 20.68 | % | | (8.87 | )% | | (5.30 | )% |
| Ratio of expenses to average net assets: | | | 1.40 | % | | 1.39 | % | | 1.41 | % | | 1.40 | % | | 1.39 | % |
| Ratio of net investment income (loss) to average net assets: | | | (0.30 | )% | | 1.05 | % | | (0.73 | )% | | (0.66 | )% | | (0.30 | )% |
| Portfolio turnover rate | | | 8 | % | | 35 | % | | 5 | % | | 2 | % | | 18 | % |
| | | | The Alternative Income Portfolio |
| | | | For the Year Ended
December 31,
2018 | | For the Year Ended
December 31,
2017 | | For the Year Ended
December 31,
2016 | | For the Year Ended
December 31,
2015 | | For the Year Ended
December 31,
2014 |
| Total Return | | | 0.77 | % | | 2.20 | % | | 3.85 | % | | 2.73 | % | | 1.23 | % |
| Ratio of expenses to average net assets: | | | 1.10 | % | | 1.07 | % | | 1.10 | % | | 1.16 | % | | 1.22 | % |
| Ratio of net investment income (loss) to average net assets: | | | 0.79 | % | | (0.04 | )% | | (0.16 | )% | | (0.20 | )% | | (0.40 | )% |
| Portfolio turnover rate | | | 0 | % | | 0 | % | | 1 | % | | 6 | % | | 17 | % |
| KINETICS PORTFOLIOS TRUST — MASTER INVESTMENT PORTFOLIOS |
| Notes to Consolidated Financial Statements — |
| (Continued) December 31, 2018 |
| | | | The Multi-Disciplinary Income Portfolio |
| | | | For the Year Ended
December 31,
2018 | | For the Year Ended
December 31,
2017 | | For the Year Ended
December 31,
2016 | | For the Year Ended
December 31,
2015 | | For the Year Ended
December 31,
2014 |
| Total Return | | | (0.93 | )% | | 4.84 | % | | 10.52 | % | | (2.05 | )% | | 2.58 | % |
| Ratio of expenses to average net assets: | | | 1.42 | % | | 1.40 | % | | 1.38 | % | | 1.37 | % | | 1.37 | % |
| Ratio of net investment income to average net assets: | | | 4.13 | % | | 3.47 | % | | 4.13 | % | | 3.50 | % | | 3.06 | % |
| Portfolio turnover rate | | | 2 | % | | 16 | % | | 9 | % | | 10 | % | | 35 | % |
7. Summary of Fair Value Exposure
Various inputs are used in determining the value of a Master Portfolio’s investments. These inputs are summarized in the three broad levels listed below:
Level 1 — Unadjusted quoted prices in active markets for identical assets or liabilities that a Master Portfolio has the ability to access.
Level 2 — Observable inputs other than quoted prices included in Level 1 that are observable for the asset or liability, either directly or indirectly. These inputs may include quoted prices for the identical instrument on an inactive market, prices for similar instruments, interest rates, prepayment speeds, credit risk, yield curves, default rates and similar data.
Level 3 — Unobservable inputs for the asset or liability, to the extent relevant observable inputs are not available, representing a Master Portfolio’s own assumptions about the assumptions a market participant would use in valuing the asset or liability, and would be based on the best information available.
The availability of observable inputs can vary from security to security and is affected by a wide variety of factors, including, for example, the type of security, whether the security is new and not yet established in the marketplace, the liquidity of markets, and other characteristics particular to the security. To the extent that valuation is based on models or inputs that are less observable or unobservable in the market, the determination of fair value requires more judgment. Accordingly, the degree of judgment exercised in determining fair value is greatest for instruments categorized in Level 3.
| KINETICS PORTFOLIOS TRUST — MASTER INVESTMENT PORTFOLIOS |
| Notes to Consolidated Financial Statements — |
| (Continued) December 31, 2018 |
The inputs used to measure fair value may fall into different levels of the fair value hierarchy. In such cases, for disclosure purposes, the level in the fair value hierarchy within which the fair value measurement falls in its entirety, is determined based on the lowest level input that is significant to the fair value measurement in its entirety.
The Internet Portfolio
The following is a summary of the inputs used to value The Internet Portfolio’s net assets as of December 31, 2018:
| Assets^ | | | Level 1 | | | Level 2 | | | Level 3 | | | Total | |
| Common Stocks | | $ | 63,302,816 | | $ | 1,560 | (1) | $ | — | | $ | 63,304,376 | |
| Escrow Notes | | | — | | | — | | | — | * | | — | * |
| Short-Term Investments | | | 169 | | | 43,387,723 | | | — | | | 43,387,892 | |
| Investments Purchased with the Cash Proceeds from Securities Lending | | | 672,458 | | | — | | | — | | | 672,458 | |
| Total Investments in Securities | | $ | 63,975,443 | | $ | 43,389,283 | | $ | — | * | $ | 107,364,726 | |
| (1) | The Common Stocks Level 2 balance consists of the market value of the associated Level 2 investments in the following industries: |
| Administrative and Support Services | | $ | 1,560 | |
| | | $ | 1,560 | |
During the year ended December 31, 2018, there were no transfers into or out of Level 3.
Following is a reconciliation of Level 3 assets for which significant unobservable inputs were used to determine fair value:
| Description | | | Investments in Securities | |
| Balance as of December 31, 2017 | | $ | — | * |
| Accrued discounts/premiums | | | — | |
| Realized gain (loss) | | | — | |
| Change in unrealized appreciation (depreciation) | | | — | ** |
| Net purchases and/or acquisitions | | | — | |
| Net sales and/or write-offs | | | — | |
| Transfer in and/or out of Level 3 | | | — | |
| Balance as of December 31, 2018 | | $ | — | * |
| KINETICS PORTFOLIOS TRUST — MASTER INVESTMENT PORTFOLIOS |
| Notes to Consolidated Financial Statements — |
| (Continued) December 31, 2018 |
| Description | | Fair Value at
12/31/2018 | | Valuation
Techniques | | Unobservable
Input | | Range |
| Escrow Notes | | $—* | | Conservative Value Assigned Pending Bankruptcy Litigation Proceedings/Market Comparables | | No active market | | $0.00-$0.00 |
There is no active market for the Level 3 securities, so a conservative value is being assigned until such time as a market exists.
| ^ | See Consolidated Portfolio of Investments for breakout of investments by industry classification. |
| * | Amount is less than $0.50. |
| ** | Total change in unrealized appreciation/depreciation included in the statement of operations attributable to Level 3 securities held on December 31, 2018 is zero. |
The Global Portfolio
The following is a summary of the inputs used to value The Global Portfolio’s net assets as of December 31, 2018:
| Assets^ | | | Level 1 | | | Level 2 | | | Level 3 | | | Total | |
| Common Stocks | | $ | 4,728,758 | | $ | 289,828 | (1) | $ | — | | $ | 5,018,586 | |
| Preferred Stocks | | | — | | | 9,538 | | | — | | | 9,538 | |
| Convertible Bonds | | | — | | | 2,259 | | | — | | | 2,259 | |
| Warrants | | | — | | | 6,101 | | | — | | | 6,101 | |
| Short-Term Investments | | | 951 | | | 5,893,281 | | | — | | | 5,894,232 | |
| Investments Purchased with the Cash Proceeds from Securities Lending | | | 13,590 | | | — | | | — | | | 13,590 | |
| Total Investments in Securities | | $ | 4,743,299 | | $ | 6,201,007 | | $ | — | | $ | 10,944,306 | |
| (1) | The Common Stocks Level 2 balance consists of the market value of the associated Level 2 investments in the following industries: |
| | | | | |
| Management of Companies and Enterprises | | | 227,073 | |
| Other Investment Pools and Funds | | | 56,205 | |
| Other Telecommunications | | | 6,550 | |
| | | $ | 289,828 | |
As of December 31, 2018, there were no Level 3 securities. During the year ended December 31, 2018, there were no transfers into or out of Level 3.
| ^ | See Consolidated Portfolio of Investments for breakout of investments by industry classification. |
| KINETICS PORTFOLIOS TRUST — MASTER INVESTMENT PORTFOLIOS |
| Notes to Consolidated Financial Statements — |
| (Continued) December 31, 2018 |
The Paradigm Portfolio
The following is a summary of the inputs used to value The Paradigm Portfolio’s net assets as of December 31, 2018:
| Assets^ | | | Level 1 | | | Level 2 | | | Level 3 | | | Total | |
| Common Stocks | | $ | 556,206,207 | | $ | 3,089,320 | (1) | $ | — | | $ | 559,295,527 | |
| Preferred Stocks | | | — | | | 4,019 | | | — | | | 4,019 | |
| Escrow Notes | | | — | | | — | | | — | * | | — | * |
| Warrants | | | — | | | 2,578 | | | — | | | 2,578 | |
| Short-Term Investments | | | 24,604 | | | 99,103,692 | | | — | | | 99,128,296 | |
| Investments Purchased with the Cash Proceeds from Securities Lending | | | 4,528,201 | | | — | | | — | | | 4,528,201 | |
| Total Investments in Securities | | $ | 560,759,012 | | $ | 102,199,609 | | $ | — | * | | 662,958,621 | |
| (1) | The Common Stocks Level 2 balance consists of the market value of the associated Level 2 investments in the following industries: |
| | | | | |
| Oil and Gas Extraction | | | 1,703,970 | |
| Other Investment Pools and Funds | | | 22,561 | |
| Real Estate | | | 1,362,789 | |
| | | $ | 3,089,320 | |
During the year ended December 31, 2018, there were no transfers into or out of Level 3.
Following is a reconciliation of Level 3 assets for which significant unobservable inputs were used to determine fair value:
| Description | | | Investments in Securities | |
| Balance as of December 31, 2017 | | $ | — | * |
| Accrued discounts/premiums | | | — | |
| Realized gain (loss) | | | — | |
| Change in unrealized appreciation (depreciation) | | | — | ** |
| Net purchases and/or acquisitions | | | — | |
| Net sales and/or write-offs | | | — | |
| Transfer in and/or out of Level 3 | | | — | |
| Balance as of December 31, 2018 | | $ | — | * |
| Description | | Fair Value at
12/31/2018 | | Valuation
Techniques | | Unobservable
Input | | Range |
| Escrow Notes | | $—* | | Conservative Value Assigned Pending Bankruptcy Litigation Proceedings/Market Comparables | | No active
market | | $0.00-$0.00 |
There is no active market for the Level 3 securities, so a conservative value is being assigned until such time as a market exists.
| KINETICS PORTFOLIOS TRUST — MASTER INVESTMENT PORTFOLIOS |
| Notes to Consolidated Financial Statements — |
| (Continued) December 31, 2018 |
| ^ | See Consolidated Portfolio of Investments for breakout of investments by industry classification. |
| * | Amount is less than $0.50. |
| ** | Total change in unrealized appreciation/depreciation included in the statement of operations attributable to Level 3 securities held on December 31, 2018 is zero. |
The Medical Portfolio
The following is a summary of the inputs used to value The Medical Portfolio’s net assets as of December 31, 2018:
| Assets^ | | | Level 1 | | | Level 2 | | | Level 3 | | | Total | |
| Common Stocks | | $ | 16,405,452 | | $ | — | | $ | — | | $ | 16,405,452 | |
| Rights | | | 13,618 | | | 2,860 | | | — | | | 16,478 | |
| Total Investments in Securities | | $ | 16,419,070 | | $ | 2,860 | | $ | — | | $ | 16,421,930 | |
As of December 31, 2018, there were no Level 3 securities. During the year ended December 31, 2018, there were no transfers into or out of Level 3.
| ^ | See Portfolio of Investments for breakout of investments by industry classification. |
The Small Cap Opportunities Portfolio
The following is a summary of the inputs used to value The Small Cap Opportunities Portfolio’s net assets as of December 31, 2018:
| Assets^ | | | Level 1 | | | Level 2 | | | Level 3 | | | Total | |
| Common Stocks | | $ | 140,857,467 | | $ | 20,477,189 | (1) | $ | — | | $ | 161,334,656 | |
| Preferred Stocks | | | — | | | 961,799 | | | — | | | 961,799 | |
| Warrants | | | — | | | 615,587 | | | — | | | 615,587 | |
| Short-Term Investments | | | 4,210 | | | 60,423,799 | | | — | | | 60,428,009 | |
| Investments Purchased with the Cash Proceeds from Securities Lending | | | 552,825 | | | — | | | — | | | 552,825 | |
| Total Investments in Securities | | $ | 141,414,502 | | $ | 82,478,374 | | $ | — | | $ | 223,892,876 | |
| (1) | The Common Stocks Level 2 balance consists of the market value of the associated Level 2 investments in the following industries: |
| Other Financial Investment Activities | | | 3,893,953 | |
| Other Investment Pools and Funds | | | 5,386,390 | |
| Real Estate | | | 10,966,446 | |
| Telecommunications | | | 230,400 | |
| | | $ | 20,477,189 | |
As of December 31, 2018, there were no Level 3 securities. During the year ended December 31, 2018, there were no transfers into or out of Level 3.
| ^ | See Consolidated Portfolio of Investments for breakout of investments by industry classification. |
| KINETICS PORTFOLIOS TRUST — MASTER INVESTMENT PORTFOLIOS |
| Notes to Consolidated Financial Statements — |
| (Continued) December 31, 2018 |
The Market Opportunities Portfolio
The following is a summary of the inputs used to value The Market Opportunities Portfolio’s net assets as of December 31, 2018:
| Assets^ | | | Level 1 | | | Level 2 | | | Level 3 | | | Total | |
| Common Stocks | | $ | 33,680,811 | | $ | 2,603,148 | (1) | $ | — | | $ | 36,283,959 | |
| Preferred Stocks | | | — | | | 219,129 | | | — | | | 219,129 | |
| Convertible Bonds | | | — | | | 314 | | | — | | | 314 | |
| Warrants | | | — | | | 140,251 | | | — | | | 140,251 | |
| Short-Term Investments | | | 1,577 | | | 36,373,745 | | | — | | | 36,375,322 | |
| Investments Purchased with the Cash Proceeds from Securities Lending | | | 139,626 | | | — | | | — | | | 139,626 | |
| Total Investments in Securities | | $ | 33,822,014 | | $ | 39,336,587 | | $ | — | | $ | 73,158,601 | |
| (1) | The Common Stocks Level 2 balance consists of the market value of the associated Level 2 investments in the following industries: |
| | | | | |
| Management of Companies and Enterprises | | | 9,156 | |
| Other Investment Pools and Funds | | | 1,227,194 | |
| Real Estate | | | 1,366,798 | |
| | | $ | 2,603,148 | |
As of December 31, 2018, there were no Level 3 securities. During the year ended December 31, 2018, there were no transfers into or out of Level 3.
| ^ | See Consolidated Portfolio of Investments for breakout of investments by industry classification. |
| KINETICS PORTFOLIOS TRUST — MASTER INVESTMENT PORTFOLIOS |
| Notes to Consolidated Financial Statements — |
| (Continued) December 31, 2018 |
The Alternative Income Portfolio
The following is a summary of the inputs used to value The Alternative Income Portfolio’s net assets as of December 31, 2018:
| Assets^ | | | Level 1 | | | Level 2 | | | Level 3 | | | Total | |
| Exchange Traded Funds | | $ | 5,677,683 | | $ | — | | $ | — | | $ | 5,677,683 | |
| Short-Term Investments | | | 2,314,068 | | | 10,801,937 | | | — | | | 13,116,005 | |
| Total Investments in Securities | | $ | 7,991,751 | | $ | 10,801,937 | | $ | — | | $ | 18,793,688 | |
| Liabilities | | | | | | | | | | | | | |
| Put Options Written | | $ | — | | $ | 4,760 | | $ | — | | $ | 4,760 | |
As of December 31, 2018, there were no Level 3 securities. During the year ended December 31, 2018, there were no transfers into or out of Level 3.
| ^ | See Portfolio of Investments for breakout of investments by industry classification. |
The Multi-Disciplinary Income Portfolio
The following is a summary of the inputs used to value The Multi-Disciplinary Income Portfolio’s net assets as of December 31, 2018:
| Assets^ | | | Level 1 | | | Level 2 | | | Level 3 | | | Total | |
| Convertible Bonds | | $ | — | | $ | 560,480 | | $ | — | | $ | 560,480 | |
| Corporate Bonds | | | — | | | 33,438,414 | | | — | | | 33,438,414 | |
| Municipal Bonds | | | — | | | 154,207 | | | — | | | 154,207 | |
| Closed-End Funds | | | 2,890,435 | | | — | | | — | | | 2,890,435 | |
| Short-Term Investments | | | 1,105 | | | 66,877 | | | — | | | 67,982 | |
| Total Investments in Securities | | $ | 2,891,540 | | $ | 34,219,978 | | $ | — | | $ | 37,111,518 | |
As of December 31, 2018, there were no Level 3 securities. During the year ended December 31, 2018, there were no transfers into or out of Level 3.
| ^ | See Portfolio of Investments for breakout of investments by industry classification. |
| 8. | Disclosures about Derivative Instruments and Hedging Activities |
The Master Portfolios have adopted authoritative standards regarding disclosure of derivatives and hedging activity intended to improve financial reporting of derivative instruments by enabling investors to understand how and why a Master Portfolio uses derivatives, how derivatives are accounted for by the Master Portfolios, and how derivative instruments affect a Master Portfolio’s results of operations and financial position. The Master Portfolios utilized options to implement or to gain further exposure to their respective investment strategies.
| KINETICS PORTFOLIOS TRUST — MASTER INVESTMENT PORTFOLIOS |
| Notes to Consolidated Financial Statements — |
| (Continued) December 31, 2018 |
The following is a summary of the fair value and location of derivative instruments on the Statement of Assets and Liabilities as of December 31, 2018:
| | | | | Statement of Assets & Liabilities |
| | | Derivative
Equity Contracts | | Liability
Description | | Liability Fair Value |
| The Alternative | | Put Options | | Written options, | | $4,760 |
| Income Portfolio | | Written | | at value | | |
The following is a summary of the transactions in and effect of derivative instruments on the Statement of Operations for the year ended December 31, 2018:
| | | | | Statement of Operations |
| | | Derivative Equity Contracts | | Realized Gain | | Change in Unrealized
Appreciation |
| The Alternative | | | | | | |
| Income Portfolio | | Put Options Written | | $13,143 | | $19,095 |
The following is a summary of the volume of derivative instrument activity during the year ended December 31, 2018:
| | | Derivative Equity Contracts | | Number of
Contracts
Purchased
or Written | | Premiums
Paid or
Received | | Average
Notional
Value |
| The Alternative | | | | | | | | |
| Income Portfolio | | Put Options Written | | 253 | | $575,237 | | $4,770,500 |
9. Offsetting Assets and Liabilities
The Master Portfolios are subject to various Master Netting Arrangements, which govern the terms of certain transactions with select counterparties. The Master Netting Arrangements allow a Portfolio to close out and net its total exposure to a counterparty in the event of a default with respect to all the transactions governed under a single agreement with a counterparty. The Master Netting Arrangements also specify collateral posting arrangements at prearranged exposure levels. Under the Master Netting Arrangements, collateral is routinely transferred if the total net exposure to certain transactions (net of existing collateral already in place) governed under the relevant Master Netting Arrangement with a counterparty in a given account exceeds a specific threshold depending on the counterparty and the type of Master Netting Arrangement.
| KINETICS PORTFOLIOS TRUST — MASTER INVESTMENT PORTFOLIOS |
| Notes to Consolidated Financial Statements — |
| (Continued) December 31, 2018 |
The following is a summary of the Assets and Liabilities subject to offsetting in the Master Portfolios as of December 31, 2018:
| | | | Gross | | | Gross
Amounts
Offset in the | | | Net
Amounts
Presented
in the | | | Gross Amounts not Offset
in the Statement of
Assets & Liabilities | | | | |
| | | | Amounts of
Recognized
Liabilities | | | Statement
of Assets &
Liabilities | | | Statement
of Assets &
Liabilities | | | Financial
Instruments | | | Collateral
Pledged
(Received) | | | Net
Amount | |
| The Internet Portfolio | | | | | | | | | | | | | | | | | | | |
| Securities Lending | | $ | 672,458 | | $ | — | | $ | 672,458 | | $ | 672,458 | | $ | — | | $ | — | |
| | | $ | 672,458 | | $ | — | | $ | 672,458 | | $ | 672,458 | | $ | — | | $ | — | |
| The Global Portfolio | | | | | | | | | | | | | | | | | | | |
| Securities Lending | | $ | 13,590 | | $ | — | | $ | 13,590 | | $ | 13,590 | | $ | — | | $ | — | |
| | | $ | 13,590 | | $ | — | | $ | 13,590 | | $ | 13,590 | | $ | — | | $ | — | |
| The Paradigm Portfolio | | | | | | | | | | | | | | | | | | | |
| Securities Lending | | $ | 4,528,201 | | $ | — | | $ | 4,528,201 | | $ | 4,528,201 | | $ | — | | $ | — | |
| | | $ | 4,528,201 | | $ | — | | $ | 4,528,201 | | $ | 4,528,201 | | $ | — | | $ | — | |
| The Small Cap | | | | | | | | | | | | | | | | | | | |
| Opportunities Portfolio | | | | | | | | | | | | | | | | | | | |
| Securities Lending | | $ | 552,825 | | $ | — | | $ | 552,825 | | $ | 552,825 | | $ | — | | $ | — | |
| | | $ | 552,825 | | $ | — | | $ | 552,825 | | $ | 552,825 | | $ | — | | $ | — | |
| The Market | | | | | | | | | | | | | | | | | | | |
| Opportunities Portfolio | | | | | | | | | | | | | | | | | | | |
| Securities Lending | | $ | 139,626 | | $ | — | | $ | 139,626 | | $ | 139,626 | | $ | — | | $ | — | |
| | | $ | 139,626 | | $ | — | | $ | 139,626 | | $ | 139,626 | | $ | — | | $ | — | |
| The Alternative | | | | | | | | | | | | | | | | | | | |
| Income Portfolio | | | | | | | | | | | | | | | | | | | |
| Written Options | | $ | 4,760 | | $ | — | | $ | 4,760 | | $ | — | | $ | 4,760 | | $ | — | |
| | | $ | 4,760 | | $ | — | | $ | 4,760 | | $ | — | | $ | 4,760 | | $ | — | |
| KINETICS PORTFOLIOS TRUST — MASTER INVESTMENT PORTFOLIOS |
| Notes to Consolidated Financial Statements — |
| (Continued) December 31, 2018 |
10. Affiliated Issuers
Under section 2(a)(3) of the 1940 Act, an investment company is defined as being an affiliated person of a company if it owns five percent or more of a company’s outstanding voting stock.
Investments in affiliated companies for The Paradigm Portfolio as of December 31, 2018, are shown below:
Name
of Issuer | | | Fair value at
December 31,
2017 | | | Purchases | | | Sales
Proceeds | | | Net
Realized
Gain | | | Change in
Unrealized
Appreciation | | | Fair value at
December 31,
2018 | | | Dividend
Income | |
| Texas Pacific | | | | | | | | | | | | | | | | | | | | | | |
| Land Trust | | $ | 239,385,194 | | $ | — | | $ | 70,461,884 | | $ | 63,293,241 | | $ | (3,016,067 | ) | $ | 229,200,484 | | $ | 2,085,199 | |
| Name of Issuer | | | | | | Number of
shares held at
December 31,
2017 | | | Purchases | | | Sales | | | Number of
shares held at
December 31,
2018 | |
| Texas Pacific Land Trust | | | | | | 535,981 | | | — | | | (112,813 | ) | | 423,168 | |
11. Subsequent Events
In preparing these financial statements, management has evaluated Portfolio related events and transactions for potential recognition or disclosure through the date the financial statements were issued. There were no events or translations that occurred during the year that materially impacted the amounts or disclosures in the Master Portfolios’ financial statements.
| KINETICS PORTFOLIOS TRUST — MASTER INVESTMENT PORTFOLIOS |
| Notes to Consolidated Financial Statements — |
| (Continued) December 31, 2018 |
12. Recent Accounting Pronouncements
In August 2018, FASB issued ASU 2018-13, Fair Value Measurement (Topic 820): Disclosure Framework-Changes to the Disclosure Requirements for Fair Value Measurement (“ASU 2018-13”). The primary focus of ASU 2018-13 is to improve the effectiveness of the disclosure requirements for fair value measurements. The changes affect all companies that are required to include fair value measurement disclosures. In general, the amendments in ASU 2018-13 are effective for all entities for fiscal years and interim periods within those fiscal years, beginning after December 15, 2019. An entity is permitted to early adopt the removed or modified disclosures upon the issuance of ASU 2018-13 and may delay adoption of the additional disclosures, which are required for public companies only, until their effective date. Management has chosen to early adopt the eliminated or modified disclosures for the year ended December 31, 2018.
13. Information about Proxy Voting (Unaudited)
Information regarding how the Feeder Funds and the Master Portfolios vote proxies relating to portfolio securities is available without charge upon request by calling toll-free at 1-800-930-3828 or by accessing the Funds’ website at www.kineticsfunds.com and by accessing the SEC’s website at www.sec.gov. Information regarding how the Feeder Funds and the Master Portfolios voted proxies relating to portfolio securities during the most recent twelve month period ended June 30, is available without charge, upon request, by calling toll-free at 1-800-930-3828 or by accessing the SEC’s website at www.sec.gov.
| KINETICS PORTFOLIOS TRUST — MASTER INVESTMENT PORTFOLIOS |
| Notes to Consolidated Financial Statements — |
| (Continued) December 31, 2018 |
14. Information about the Portfolio Holdings (Unaudited)
The Master Portfolios file their complete schedule of portfolio holdings for their first and third fiscal quarters with the SEC on Form N-Q or Part F of Form N-PORT (beginning with filings after March 31, 2019). The Master Portfolios’ Form N-Q or Part F of Form N-PORT is available without charge, upon request, by calling toll-free at 1-800-930-3828. Furthermore, you can obtain the Form N-Q or Part F of Form N-PORT on the SEC’s website at www.sec.gov.
| KINETICS PORTFOLIOS TRUST |
| Report of Independent Registered |
| Public Accounting Firm |
To the Shareholders and Board of Trustees of Kinetics Portfolios Trust
Opinion on the Financial Statements
We have audited the accompanying statements [consolidated where noted as such] of assets and liabilities of The Internet Portfolio, The Global Portfolio, The Paradigm Portfolio, The Medical Portfolio, The Small Cap Opportunities Portfolio, The Market Opportunities Portfolio, The Alternative Income Portfolio, and The Multi-Disciplinary Income Portfolio (the “Funds”), each a series of Kinetics Portfolios Trust (the “Trust”), including the schedules of investments, as of December 31, 2018, the related statements of operations for the year then ended, the statements of changes in net assets for each of the two years in the period then ended, and financial highlights for each of the five years in the period then ended, and the related notes (collectively referred to as the “financial statements”). In our opinion, the financial statements present fairly, in all material respects, the [consolidated where noted as such] financial position of the Funds as of December 31, 2018, the results of their operations for the year then ended, the changes in their net assets for each of the two years in the period then ended, and their financial highlights for each of the five years in the period then ended, in conformity with accounting principles generally accepted in the United States of America.
Basis for Opinion
These financial statements are the responsibility of the Funds’ management. Our responsibility is to express an opinion on the Funds’ financial statements based on our audits. We are a public accounting firm registered with the Public Company Accounting Oversight Board (United States) (“PCAOB”) and are required to be independent with respect to the Funds in accordance with the U.S. federal securities laws and the applicable rules and regulations of the Securities and Exchange Commission and the PCAOB. We have served as the auditor of one or more of the funds in the Trust since 2004.
We conducted our audits in accordance with the standards of the PCAOB. Those standards require that we plan and perform the audits to obtain reasonable assurance about whether the financial statements are free of material misstatement, whether due to error or fraud. The Funds are not required to have, nor were we engaged to perform, an audit of the Funds’ internal control over financial reporting. As part of our audits we are required to obtain an understanding of internal control over financial reporting, but not for the purpose of expressing an opinion on the effectiveness of the Funds’ internal control over financial reporting. Accordingly, we express no such opinion.
Our audits included performing procedures to assess the risks of material misstatement of the financial statements, whether due to error or fraud, and performing procedures that respond to those risks. Such procedures included examining, on a test basis, evidence regarding the amounts and disclosures in the financial statements. Our audits also included evaluating the accounting principles used and significant estimates made by management, as well as evaluating the overall presentation of the financial statements.
| KINETICS PORTFOLIOS TRUST |
| Report of Independent Registered |
| Public Accounting Firm (Continued) |
Our procedures included confirmation of securities owned as of December 31, 2018 by correspondence with the custodian and brokers; when replies were not received from brokers, we performed other auditing procedures. We believe that our audits provide a reasonable basis for our opinion.
Philadelphia, Pennsylvania
March 1, 2019
| KINETICS PORTFOLIOS TRUST |
| Management of the Funds and the Portfolios |
| (Unaudited) |
Management of the Funds and the Portfolios
The management and affairs of the Funds and the Portfolios are supervised by the Board of Directors of the Company and the Board of Trustees of the Trust, respectively. Each Board consists of the same eight individuals, five of whom are not “interested persons” of the Company or the Trust as that term is defined in the Investment Company Act of 1940, as amended (the “1940 Act”). The Directors are fiduciaries for the Funds’ shareholders and are governed by the laws of the State of Maryland in this regard. The Trustees are fiduciaries for the Portfolios’ shareholders and are governed by the laws of the State of Delaware in this regard.
Each Board establishes policies for the operation of the Funds and the Portfolios and appoints the officers who conduct the daily business of the Funds and the Portfolios. Directors/Trustees of the Company and the Trust are listed below with their addresses, present positions with the Company and Trust, length of time served, principal occupations over at least the last five years, number of Funds and Portfolios overseen and any other Directorships held. The SAI includes additional information about the Funds’ officers and directors and is available, without charge, upon request by calling 1-800-930-3828.
Board of Directors/Board of Trustees
Independent Directors/Trustees
| Name, Address and Year of Birth | | Position(s)
Held with
Company/ Trust | | Term of
Office and
Length of
Time Served |
Steven T. Russell
Year Born: 1963
c/o Kinetics Asset Management LLC
470 Park Avenue South
New York, New York 10016 | | Independent Director/
Independent Trustee | | Indefinite/
18 years |
| | | | | |
Douglas Cohen, CPA
Year Born: 1961
c/o Kinetics Asset Management LLC
470 Park Avenue South
New York, New York 10016 | | Independent Director/
Independent Trustee | | Indefinite/
18 years |
| KINETICS PORTFOLIOS TRUST |
| Management of the Funds and the Portfolios — |
| (Continued) (Unaudited) |
Principal Occupation(s)
During Past Five Years | | # of Portfolios
in Fund Complex(1)
Overseen by
Director/
Trustee | | Other Directorships
Held by Director/Trustee(2) |
Steven Russell Law Firm (April 2010
to present); Professor of Business Law and
Finance, Suffolk County Community
College (1997 to present). | | 17 | | N/A |
| | | | | |
Chief Financial Officer, Sunrise Credit
Services, Inc. (2005 to present). | | 17 | | N/A |
| KINETICS PORTFOLIOS TRUST |
| Management of the Funds and the Portfolios — |
| (Continued) (Unaudited) |
Board of Directors/Board of Trustees (Continued)
Independent Directors/Trustees (Continued)
| Name, Address and Year of Birth | | Position(s)
Held with
Company/ Trust | | Term of
Office and
Length of
Time Served |
William J. Graham
Year Born: 1962
c/o Kinetics Asset Management LLC
470 Park Avenue South
New York, New York 10016 | | Independent Director/
Independent Trustee | | Indefinite/
18 years |
| | | | | |
Joseph E. Breslin
Year Born: 1953
c/o Kinetics Asset Management LLC
470 Park Avenue South
New York, New York 10016 | | Independent Director/
Independent Trustee | | Indefinite/
18 years |
| | | | | |
James M. Breen
Year Born: 1959
c/o Kinetics Asset Management LLC
470 Park Avenue South
New York, New York 10016 | | Independent Director/
Independent Trustee | | Indefinite/
10 years |
| KINETICS PORTFOLIOS TRUST |
| Management of the Funds and the Portfolios — |
| (Continued) (Unaudited) |
Principal Occupation(s)
During Past Five Years | | # of Portfolios
in Fund Complex(1)
Overseen by
Director/
Trustee | | Other Directorships
Held by Director/Trustee(2) |
Attorney, William J. Graham, PC
(2001 to present).; Assistant Town
Attorney, Town of Islip, NY
(2016 to present). | | 17 | | N/A |
| | | | | |
J.E. Breslin & Co. – Consulting
(2010 to present). | | 17 | | Trustee, Forethought Variable Insurance Trust (5 portfolios); Trustee, Hatteras Alternative Mutual Funds Trust (8 portfolios) (2004-2016); Trustee, Underlying Funds Trust (2 portfolios) (2004-2016); Trustee, HCIM Trust (2 portfolios) (2013- 2015); Manager, Hatteras Global Private Equity Partners Institutional, LLC (2012-2016); Manager, Hatteras GPEP Fund II, LLC (2012-2016); Manager, Hatteras VC Co-Investment Fund II LLC (2012-2016); Manager, Hatteras Master Fund, L.P. (2012- 2016); Manager, Hatteras Core Alternatives TEI Fund, L.P. (2012- 2016); Manager, Hatteras Core Alternatives Fund, L.P. (2012- 2016); Manager, Hatteras Core Alternatives Institutional Fund, L.P. (2012-2016); Manager, Hatteras Core Alternatives TEI Institutional Fund, L.P. (2012- 2016); and Trustee, Hatteras Variable Trust (2012-2013). |
| | | | | |
| Special Agent, Florida Department of Law Enforcement (2015 to present); Senior AML Analyst, Citibank (2014-2015); Senior Special Agent, Homeland Security Investigations, Miami, FL (2011 to 2014); Assistant Attaché Immigration & Customs Enforcement, Pretoria, South Africa (2008 to 2011). | | 17 | | N/A |
| KINETICS PORTFOLIOS TRUST |
| Management of the Funds and the Portfolios — |
| (Continued) (Unaudited) |
Board of Directors/Board of Trustees (Continued)
Interested Directors/Trustees and Officers
| Name, Address and Year of Birth | | Position(s)
Held with the
Company/ Trust | | Term of
Office and
Length of
Time Served |
Murray Stahl(3)
Year Born: 1953
c/o Kinetics Asset Management LLC
470 Park Avenue South
New York, New York 10016 | | Director/Trustee
& Secretary | | Indefinite/
18 years |
| KINETICS PORTFOLIOS TRUST |
| Management of the Funds and the Portfolios — |
| (Continued) (Unaudited) |
Principal Occupation(s)
During Past Five Years | | # of Portfolios
in Fund Complex(1)
Overseen by
Director/
Trustee | | Other Directorships
Held by Director/Trustee(2) |
| Chairman, FRMO Corp. (2001 to present) (provides consulting services to private investment funds and research services with respect to marketable securities); Chairman and Chief Investment Officer, Horizon Kinetics LLC, (including Horizon Asset Management LLC (an investment adviser) (1994 to present); Kinetics Asset Management LLC and Kinetics Advisers LLC (2000 to present)); CEO, Horizon Kinetics LLC (2015 to present). Chairman, President, RENN Fund, Inc. (2017-present). | | 17 | | Director and Officer of FRMO Corp. Additionally, Murray is an owner and director of MSRH, LLC (“MSRH”), an independent exempt reporting adviser that serves as the investment manager and general partner of two U.S. private funds. Murray is also the Chairman of the Board of Directors of the Minneapolis Grain Exchange (“MGEX”), a designated contract market and derivatives clearing organization. Murray is a member of the Board of the Bermuda Stock Exchange (“BSX”), incorporated pursuant to The Bermuda Stock Exchange Company Act of 1992. Murray is a Director of IL&FS Securities Services Limited, a company based in India. Murray is also a shareholder and Director of Winland Holdings Corporation (“WELX”), a publicly traded company. |
| KINETICS PORTFOLIOS TRUST |
| Management of the Funds and the Portfolios — |
| (Continued) (Unaudited) |
Board of Directors/Board of Trustees (Continued)
Interested Directors/Trustees and Officers
| Name, Address and Year of Birth | | Position(s)
Held with the
Company/ Trust | | Term of
Office and
Length of
Time Served |
Peter B. Doyle(3)
Year Born: 1962
c/o Kinetics Asset Management LLC
470 Park Avenue South
New York, New York 10016 | | Director/Trustee,
President & Chairman
of the Board | | Indefinite/
16 years |
| | | | | |
Leonid Polyakov(3)
Year Born: 1959
c/o Kinetics Asset Management LLC
470 Park Avenue South
New York, New York 10016 | | Director/Trustee
& Treasurer | | Indefinite/
16 years |
| (1) | The term “fund complex” refers to the Company and the Trust, which hold themselves out as related for investment purposes. |
| (2) | “Other Directorships Held” includes only directorships of companies required to register or file reports with the SEC under the Securities Exchange Act of 1934, as amended, (that is, “public companies”) or investment companies registered under the 1940 Act. |
| KINETICS PORTFOLIOS TRUST |
| Management of the Funds and the Portfolios — |
| (Continued) (Unaudited) |
Principal Occupation(s)
During Past Five Years | | # of Portfolios
in Fund Complex(1)
Overseen by
Director/
Trustee | | Other Directorships
Held by Director/Trustee(2) |
| Vice President, Horizon Asset Management LLC (1994 to 2011); Vice President, FMRO Corp. 2001 to present) (provides consulting services (to private investment funds and research services with respect to marketable securities); Managing Director, Horizon Kinetics LLC (including Horizon Asset Management LLC (an investment adviser) (1994 to present); Kinetics Asset Management LLC and Kinetics Advisers LLC (2000 to present)); and President of Kinetics Mutual Funds, Inc. (1998 to present). | | 17 | | Director and Officer of
FRMO Corp. |
| | | | | |
| CFO, Kinetics Asset Management LLC (2000 to 2011); CFO and FINOP, Kinetics Funds Distributor LLC (2002 to 2011); Director, Kinetics Advisers LLC (2000 to 2011). | | 17 | | N/A |
| (3) | Directors/Trustees who are considered “interested persons” as defined in Section 2(a)(19) of the 1940 Act because of their association with the Adviser and its affiliates. |
| KINETICS PORTFOLIOS TRUST |
| Management of the Funds and the Portfolios — |
| (Continued) (Unaudited) |
Board of Directors/Board of Trustees (Continued)
Officers
| Name, Address and Age | | Position(s)
Held with the
Company/ Trust | | Term of
Office and
Length of
Time Served |
Andrew M. Fishman
Year Born: 1950
c/o Kinetics Asset Management LLC
470 Park Avenue South
New York, New York 10016 | | Chief Compliance
Officer | | Indefinite/
14 years |
| | | | | |
Jay H. Kesslen
Year Born: 1973
c/o Kinetics Asset Management LLC
470 Park Avenue South
New York, New York 10016 | | Vice President and
Assistant Secretary | | Indefinite/
14 years |
| KINETICS PORTFOLIOS TRUST |
| Management of the Funds and the Portfolios — |
| (Continued) (Unaudited) |
Principal Occupation(s)
During Past Five Years | | Other Directorships
Held by Officer |
| Associate General Counsel, Horizon Kinetics LLC (2011 to present); General Counsel, Horizon Asset Management, Inc. (1997 to 2011); Secretary, Horizon Asset Management, Inc. (2006 to 2011); Chief Compliance Officer, Horizon Asset Management, Inc. (1997 to 2008); Chief Compliance Officer, Kinetics Asset Management LLC. (1999 to 2011); Chief Compliance Officer, Kinetics Advisers LLC (2000 to 2011). | | N/A |
| | | |
| General Counsel, Horizon Kinetics LLC (including Horizon Asset Management LLC (an investment adviser) (2011 to present), Kinetics Asset Management LLC (2000 to present), Kinetics Advisers LLC (2000 to present), Kinetics Funds Distributor LLC (2000 to present), KBDSecurities LLC (2000 to present)); FRMO Corp. (2014 to present); Chief Compliance Officer, Horizon Kinetics LLC (2015-2016). Vice President, Chief Compliance Officer, RENN Fund, Inc. (2017-present). | | N/A |
| KINETICS MUTUAL FUNDS, INC. & KINETICS PORTFOLIOS TRUST |
| Privacy Policy (Unaudited) |
We collect the following nonpublic personal information about you:
| | • | Information we receive from you on or in applications or other forms, correspondence, or conversations, including, but not limited to, your name, address, phone number, social security number, assets, income and date of birth; and |
| | • | Information about your transactions with us, our affiliates, or others, including, but not limited to, your account number and balance, payments history, parties to transactions, cost basis information, and other financial information. |
We do not disclose any nonpublic personal information about our current or former shareholders to nonaffiliated third parties, except as permitted by law. For example, we are permitted by law to disclose all of the information we collect, as described above, to our transfer agent to process your transactions. Furthermore, we restrict access to your nonpublic personal information to those persons who require such information to provide products or services to you. We maintain physical, electronic, and procedural safeguards that comply with federal standards to guard your nonpublic personal information.
In the event that you hold shares of the fund(s) through a financial intermediary, including, but not limited to, a broker-dealer, bank, or trust company, the privacy policy of your financial intermediary would govern how your nonpublic personal information would be shared with nonaffiliated third parties.
This privacy policy is not part of the annual report.
| |
| Kinetics Mutual |
| Funds, Inc. |
| |
| 615 East Michigan Street |
| Milwaukee, WI 53202 |
| |
| INVESTMENT ADVISER AND |
| SHAREHOLDER SERVICING AGENT |
| Kinetics Asset Management LLC |
| 470 Park Avenue South |
| New York, NY 10016 |
| |
| INDEPENDENT REGISTERED |
| PUBLIC ACCOUNTING FIRM |
| Tait, Weller & Baker LLP |
| 50 South 16th Street |
| Suite 2900 |
| Philadelphia, PA 19102 |
| |
| DISTRIBUTOR |
| Kinetics Funds Distributor LLC |
| 470 Park Avenue South |
| New York, NY 10016 |
| |
| ADMINISTRATOR |
| FUND ACCOUNTANT AND |
| TRANSFER AGENT |
| U.S. Bancorp Fund Services, LLC |
| 615 East Michigan Street |
| Milwaukee, WI 53202 |
| |
| CUSTODIAN |
| U.S. Bank, N.A. |
| Custody Operations |
| 1555 River Center Drive, Suite 302 |
| Milwaukee, WI 53212 |
| |
| THIS MATERIAL MUST BE PRECEDED OR |
| ACCOMPANIED BY A PROSPECTUS |
| |
The registrant has adopted a code of ethics that applies to the registrant’s principal executive officer and principal financial officer. The registrant has not made any amendments to its code of ethics during the period covered by this report. The registrant has not granted any waivers from any provisions of the code of ethics during the period covered by this report. A copy of the registrant’s Code of Ethics is filed herewith.
The registrant’s board of trustees/directors has determined that there is at least one audit committee financial expert serving on its audit committee. Mr. Douglas Cohen and Mr. Joseph Breslin are the “audit committee financial experts” and are considered to be “independent” as each term is defined in Item 3 of Form N‑CSR.
The registrant has engaged its principal accountant to perform audit services, audit-related services, tax services and other services during the past two fiscal years. “Audit services” refer to performing an audit of the registrant's annual financial statements or services that are normally provided by the accountant in connection with statutory and regulatory filings or engagements for those fiscal years. “Audit-related services” refer to the assurance and related services by the principal accountant that are reasonably related to the performance of the audit. “Tax services” refer to professional services rendered by the principal accountant for tax compliance, tax advice, and tax planning. There were no “Other services” provided by the principal accountant. The following table details the aggregate fees billed or expected to be billed for each of the last two fiscal years for audit fees, audit-related fees, tax fees and other fees by the principal accountant.
The audit committee has adopted pre-approval policies and procedures that require the audit committee to pre‑approve all audit and non‑audit services of the registrant, including services provided to any entity affiliated with the registrant.
All of the principal accountant’s hours spent on auditing the registrant’s financial statements were attributed to work performed by full‑time permanent employees of the principal accountant.
Not applicable to registrants who are not listed issuers (as defined in Rule 10A-3 under the Securities Exchange Act of 1934).
The Schedule of Investments is included as part of the report to shareholders filed under Item 1 of this Form.
Not applicable to open-end investment companies.
Not applicable to open-end investment companies.
Not applicable to open-end investment companies.
There have been no material changes to the procedures by which shareholders may recommend nominees to the registrant’s board of trustees.
Not applicable to open-end investment companies.
(3) Not applicable to open-end investment companies.
Pursuant to the requirements of the Securities Exchange Act of 1934 and the Investment Company Act of 1940, the registrant has duly caused this report to be signed on its behalf by the undersigned, thereunto duly authorized.
Pursuant to the requirements of the Securities Exchange Act of 1934 and the Investment Company Act of 1940, this report has been signed below by the following persons on behalf of the registrant and in the capacities and on the dates indicated.
Peter B. Doyle, President
* Print the name and title of each signing officer under his or her signature.