| | |
| KINETICS MUTUAL FUNDS, INC. | |
| Table of Contents | |
| December 31, 2019 | |
|
| Page |
Shareholders’ Letter | 2 |
Year 2019 Annual Investment Commentary | 5 |
KINETICS MUTUAL FUNDS, INC. — FEEDER FUNDS AND | |
| THE KINETICS SPIN-OFF AND CORPORATE RESTRUCTURING FUND | |
| Growth of $10,000 and $1,000,000 Investment | 12 |
| Expense Example | 23 |
| Allocation of Assets — The Kinetics Spin-off and Corporate | |
| Restructuring Fund | 30 |
| Schedule of Investments — The Kinetics Spin-off and Corporate | |
| Restructuring Fund | 31 |
| Statements of Assets & Liabilities | 34 |
| Statements of Operations | 39 |
| Statements of Changes in Net Assets | 44 |
| Notes to Financial Statements | 57 |
| Financial Highlights | 82 |
| Report of Independent Registered Public Accounting Firm | 115 |
KINETICS PORTFOLIOS TRUST — MASTER INVESTMENT PORTFOLIOS | |
| Allocation of Consolidated Portfolio Assets | 117 |
| Consolidated Portfolio of Investments —The Internet Portfolio | 125 |
| Consolidated Portfolio of Investments — The Global Portfolio | 128 |
| Consolidated Portfolio of Investments — The Paradigm Portfolio | 131 |
| Portfolio of Investments — The Medical Portfolio | 135 |
| Consolidated Portfolio of Investments — The Small Cap | |
| Opportunities Portfolio | 137 |
| Consolidated Portfolio of Investments — The Market | |
| Opportunities Portfolio | 140 |
| Portfolio of Investments — The Alternative Income Portfolio | 143 |
| Portfolio of Investments — The Multi-Disciplinary Income Portfolio | 144 |
| Consolidated Statements of Assets & Liabilities | 147 |
| Consolidated Statements of Operations | 151 |
| Consolidated Statements of Changes in Net Assets | 155 |
| Consolidated Notes to Financial Statements | 159 |
| Report of Independent Registered Public Accounting Firm | 182 |
| Management of the Funds and the Portfolios | 184 |
| Privacy Policy | 194 |
1
KINETICS MUTUAL FUNDS, INC.
Shareholders’ Letter
Dear Fellow Shareholders:
We are pleased to present the Kinetics Mutual Funds (“Fund” or “Funds”) Annual Report for the twelve-month period ended December 31, 2019. One year ago, capital markets were in relative disarray, as the S&P 500 Index declined nearly 20% from peak to trough in the fourth quarter of 2018, while high yield bonds collapsed over 10% during this period and new (non-investment grade) debt issuance all but ceased. In the past year, the S&P 500 Index rose over 31%, and high yield debt rose over 14%, more than erasing the declines of late 2018. Pundits can argue as to the root cause of the decline, and subsequent recovery, but an objective fact is the response of the U.S. Federal Reserve Bank (“Federal Reserve”), which reduced the target overnight rate three times in 2019 – despite the fact that financial markets had already recovered to all-time high levels before the first rate cut. The Federal Reserve communicated its intentions to reduce rates well in advance of the actual cuts, hence restoring the confidence of risk-oriented capital investors. We are more skeptical than the market regarding the sustainability and net benefit of these policies, and we have adjusted our portfolios accordingly. A performance summary follow (No-Load Class) for the fiscal year ended December 31, 2019: The Internet Fund +26.45%; The Global Fund +21.61%; The Paradigm Fund +30.48%; The Medical Fund +16.04%; The Small Cap Opportunities Fund +27.06%; The Market Opportunities Fund +22.76%; The Alternative Income Fund +2.47%; The Multi-Disciplinary Income Fund +9.08%; and the Kinetics Spin-Off and Corporate Restructuring Fund +31.32%. This compares to returns of: +31.49% for the S&P 500 Index; +22.78% for the S&P 600 Small Cap Index; +26.60% for the MSCI All Country World (ACWI) Index; +8.72% for the Bloomberg Barclays U.S. Aggregate Bond Index; +14.32% for the Bloomberg Barclays U.S. Corporate High Yield Bond Index; +5.01% for the Bloomberg Barclays U.S. 1-3 Year Credit Index; +35.23% for the Nasdaq Composite Index; and +22.01% for the MSCI EAFE Index.
While we continue to provide equity and fixed income reference benchmark performance (to aid in your understanding of how broad asset classes have performed throughout the year ended December 31, 2019), we do not manage our Funds against any specific benchmark, nor have we ever done so in the history of the Funds. We believe that such benchmark adherence is highly detrimental to the long-term returns of a sound investment strategy. Furthermore, in both years of positive and negative returns, it should be noted that the Funds generated returns with little to no exposure to the top positions in the major benchmarks.
2
The investment team at Horizon Kinetics is widely recognized as being contrarian in our investment process, which produces highly differentiated investments, portfolios and returns. This proclivity towards unconventional thinking is a consequence of our value driven philosophy, as opposed to an underpinning of the investment process. In other words, we are not contrarian for the sake of being contrarian, but rather, we are so due to our price discipline in making investments. In our experience, a company widely thought to be a wonderful investment is seldom available for purchase at a reasonable, let alone a cheap valuation. Hence, whether we agree with conventional wisdom is irrelevant if this optimism is fully discounted into a security price. A security that trades at a reasonable or cheap valuation is generally inexpensive for a specific reason (or perceived reason). If the pessimism is overly discounted in the security price, and/or is not factually grounded, in our view an opportunity exists to purchase the security at an unwarranted discount.
This price discipline has driven the construction and performance of our portfolios over the past several years, despite broad market (beta) exposure and in our opinion, unbridled optimism regarding corporate valuations being consistently rewarded with high absolute returns. We believe that the index (benchmark) performance review should give investors pause, not due to the magnitude of the gains (i.e., the Nasdaq Index +35%), but rather, due to the fact that virtually every asset class generated a positive return last year. Consider that the iShares 20+ Year Treasury Bond ETF, with a portfolio weighted average maturity of 25.52 years in U.S. Treasuries returned over 15% in 2019. This compares to the 30-Year U.S. Treasury offering a yield to maturity of approximately 3% at the outset of the year. That return was generated by declining interest rates and because the yield on a 30-Year U.S. Treasury declined to approximately 2.39% at year-end 2019. This equates to over a 20% decline in the 30-Year yield. This phenomenon has occurred only 5 times in the past 30 years (4 of which were following a global financial crisis), and it coincided with an average equity market return of approximately 8%. In the past 30 years, only one other year has experienced over a 20% decline in 30-year bond yields and over a 20% equity market gain: 1995. In 1995, the U.S. 30-Year Treasury yield declined from 7.89% to 5.96% and the market rose over 34%. This drop in rates catalyzed the technology market’s speculative period leading into 1999-2000, as excess liquidity was directed into rapidly appreciating technology stocks. However, with 6% “risk-free” yields in 30-Year Treasuries and indexation in its infancy, the financial asset inflation was largely isolated to a single niche of stocks.
3
The foremost differences at year-end 2019 (as compared to 1995) is the absolute level of interest rates (2.39% 30-Year Yield) and the maturity of indexation. This combination has driven excess liquidity into all financial assets, driving prospective future returns to their lowest levels in history. Accordingly, in our view a pragmatic investment solution for this future would be to focus on something upon which the market places zero focus: inflation. The U.S. 10-Year Inflation Protected Bond (TIPs) is pricing a 10-Year inflation breakeven of approximately 1.8% (note that as of February 18, 2020, the 10-Year Treasury offered a 1.55% yield). While the Consumer Price Index and Personal Consumption Expenditures inflation composites are devoid of financial asset inflation, it appears feasible that a belief in inflation spills into the core consumption items that drive these benchmarks. Should this inflation occur, we believe that most portfolios (particularly those thought to be most conservatively positioned) will be exposed to considerable risks. We seek to offset these risks through companies that are inflation beneficiaries, largely as a function of hard asset bases. This hard asset emphasis is apparent across all of our portfolios, as we believe that these companies can continue to achieve strong performance in a “status quo” environment, but are uniquely positioned should interest rates, inflation and/or economic growth deviate from the current equilibrium.
The returns of financial assets over the past decade have been extraordinary, but in our opinion the current backdrop lacks the preconditions for these returns to be repeated or sustained indefinitely. We are thoughtful regarding our investment decisions, and cash balances in light of this belief. As we enter 2020, we recognize that markets can run further from our determination of fair value, but also, we expect that this decade will be wholly unique from the past decade.
4
KINETICS MUTUAL FUNDS, INC.
Investment Commentary
A cursory review of equity market returns in 2019 would suggest that returns were well diversified across all facets of the U.S. economy. In fact, the average return across the 11 Global Industry Classification Standards (“GICS”) sectors in the S&P 500 Index for the year was over 25%. Furthermore, 9 out of the 11 GICS sectors achieved total returns between approximately 20% and 30% for the year. The outliers were Energy (+7.6%) and Information Technology (+48%). The S&P 500 Index returned over 31% by the year, outperforming the average sector by over 600 basis points by virtue of a 24.5% weighting in Information Technology and a 3.7% weighting in Energy. But even this sectoral analysis fails to fully represent index level drivers; consider the top five companies in the S&P 500 Index (Apple, Microsoft, Alphabet, Amazon and Facebook), which represent approximately 17% of the benchmark. These top 5 constituents rose by an average of nearly 51% for the year (nearly 2,000 basis points over the broader index return), ranging from 23% (Amazon) to 88% (Apple). The performance divide is even more stark in comparison to the S&P 600 Small Cap Index, which returned almost 23% for the year, over 800 basis points below the S&P 500 Index, and 2,800 basis points below the average performance of the top five S&P 500 positions.
This exceptional performance was achieved in a year that “required” the Federal Reserve to reduce overnight lending rates on three separate occasions, amounting to over an 80-basis point reduction in the effective rate (1.56% at year-end). This direct policy easing is addition to what amounted to over $255 billion of “temporary” liquidity outstanding in the U.S. Repurchase Market (“Repo”) at year end. The Federal Reserve is concerted in its effort not to define this as “quantitative easing,” as it is intended to be a temporary activity. This ignores the notion that all of the previous government asset purchases (easing) have been communicated as temporary. While the Federal Reserve did attempt to reduce its balance sheet from a peak of $4.5 trillion (compared to an $890 billion pre-crisis peak), it could only reduce its assets to approximately $3.75 trillion before reversing course, and assets exceeded $4 trillion again by year-end.
In our view, there is a logical inconsistency between declining interest rates and financial market liquidity intervention, along with risk assets (equities, high yield bonds) rising to all-time peak levels. Rather than rejoicing over the market
5
returns associated with these policies, we have become increasingly concerned about the sustainability of this process and its various potential unintended consequences. This, coupled with objectively high equity (relative to normalized cash flow) and debt (relative to yields) prices, resulted in sustained defensive positioning of the portfolios in 2019. The limited value opportunities that we can identify in financial markets have been in sectors that are underweight in the major indexes and in smaller companies, both of which are underrepresented in passive fund flows (ETFs). Despite these top-down performance impediments (sector, small cap and cash), the Kinetics Mutual Funds (“Funds”) generated strong gains on an absolute and relative basis driven by specific security selection.
While these performance drivers are shared across various Funds, specific attribution summaries are as follows:
Paradigm Fund – The Fund continued to maintain a defensive cash position and to emphasize companies with strong balance sheets replete with tangible “hard” assets. These allocations generated positive absolute returns but were less than those of the S&P 500 Index. Specific hard asset-oriented companies with operations in energy, precious metals, real estate and infrastructure drove Fund performance, largely outperforming both the broader market and their respective sectors. The large cash position provided nominal income for the year, hence detracting from overall performance relative to a fully invested portfolio, while a small position in oil field services declined for the year and also detracted from returns.
Small Cap Opportunities Fund – The Fund generated strong absolute and relative returns for the year despite a defensive cash position and a concentration in underperforming sectors (energy, real estate and industrials). However, stock selection within these sectors and position weighting drove performance with the top 5 positions returning over 48% on average (more than double the S&P 600 Small Cap Index).
Market Opportunities Fund – The opportunistic nature of the Fund dictated an ultra-defensive positioning for the year, with a very high cash balance awaiting superior investment opportunities. This was ultimately a material headwind to
6
returns for the year, despite broader market outperformance achieved by each of the top 5 positions. Specifically, positions in energy, cryptocurrency and Canadian real estate drove Fund returns; it should be noted that these asset classes have minimal or no representation in indexes. Despite the speculative nature of nascent asset classes, we believe that hard assets (specifically cryptocurrency) have the potential to preserve purchasing power, a defensive attribute that is seldom appreciated. The large cash position provided nominal income for the year, hence detracting from overall performance relative to a fully invested portfolio, while certain cyclical companies involved in shipping and oil field services declined and detracted from returns.
Internet Fund – The Fund’s mandate is focused on U.S. and foreign companies engaged in the Internet and Internet related activities and whose businesses are vastly improved through the distribution of content and reduction of costs with the use of the Internet. These sectors are the highest valued sectors in the marketplace based on trailing cash flows. These valuations prompted a degree of diversification away from the core sectors, as well as a defensive cash position, both of which detracted from relative returns. Amongst these investments, specific technology-oriented investments in cryptocurrency, energy and defense companies outperformed even the Nasdaq Composite Index. Consequently, these positions also outperformed large Fund holdings in more traditional “Internet” companies that are leaders in web search and payments. We continue to have high conviction in our unique approach towards investing in Internet/technology beneficiary companies.
Global Fund – The Fund is defensively positioned with a large cash balance, which negatively impacted returns for the year. The global equity landscape is divided between the highest valued, but highest quality companies in the United States, along with much cheaper, but lower quality stocks in foreign developed and emerging markets. Most managers (and indexes) work around this predicament by owning multinational corporations that are only globally diversified insomuch as the country of domicile, as compared to the Fund which focuses on global companies that derive a substantial portion of their revenue from local economies. Domestic oriented corporations held by the Fund detracted from returns, as large multinationals outperformed most
7
domestic oriented enterprises. Specific Canadian and British companies held by the Fund involved in precious metals royalties and ship brokerage outperformed on both an aggregate and regional basis.
Medical Fund – The Fund performed largely in line with a composite of U.S. pharmaceutical companies, but it underperformed the broader health care sector due to the lack of exposure to medical equipment and managed care (insurance) companies, both of which are outside the mandate of the Fund. In our view, U.S. pharmaceutical companies continue to offer the best value proposition in the health care universe and are the least exposed to potential regulatory reforms. We continue to view these companies as having robust product pipelines and as attractive long-term compounding investments.
Kinetics Spin-Off and Corporate Restructuring Fund – The Fund generated strong absolute and relative returns for the year, primarily driven by legacy positions with potential future spin-offs or of older vintage. The annual activity for spin-offs continues a recent trend of “asset swapping,” a term that we use for separating business lines with no other motive than seeking higher independent valuations. In past eras the market rewarded scale and diverse business lines, but more recently, it has paid a premium for focused business alignment. A poignant example of this is the Dow/DuPont merger (2017), which has already been reversed through the spin-off of Corteva (agriculture) and Dow (performance materials). To the extent that there is no financial benefit beyond market perception, we find little value in these types of transactions.
Multi-Disciplinary Income Fund – The Fund achieved a respectable return for the year, consistent with a long-term record of exceeding the Bloomberg Barclays U.S. Aggregate Bond Index (lower risk) and underperforming the Bloomberg Barclays U.S. Corporate High Yield Index (higher risk). We believe that the Fund will outperform both benchmarks over a full business cycle when high yield defaults increase, and option premiums rise. Option writing has been minimal throughout the year given suppressed levels of volatility and poor risk-adjusted economics of option exposure. At year end, the CBOE Volatility Index level (an indicator for option pricing) was below 14 and high yield bonds
8
offered forward yields of less than 4.5% - these are conditions in which capital preservation should take primacy.
Alternative Income Fund – The Fund utilized selective, conservative option exposure, largely collateralized by cash, to achieve a reasonable net return (yield) of 2.47%. Furthermore, the Fund lived up to its name, with an “alternative” income stream as evidenced by a 0.05 beta relative to the Bloomberg Barclays U.S. Aggregate Bond Index. In the event that there is an eventual end to the current business cycle, we believe that lower short-term rates and higher implied volatility will align well with this strategy.
In aggregate, the Funds performed very well on an absolute basis, and remarkably well on a relative basis given the lack of overlap with holdings in reference benchmarks. We will strive to continue to deliver reasonable returns as the current market cycles sustains itself and expect to truly differentiate our returns in the eventuality that this cycle ends.
9
Disclosure
This material is intended to be reviewed in conjunction with a current prospectus, which includes all fees and expenses that apply to a continued investment, as well as information regarding the risk factors, policies and objectives of the Funds. Read it carefully before investing.
Mutual fund investing involves risk. Principal loss is possible. Because The Internet Fund, The Medical Fund and The Market Opportunities Fund invest in a single industry or geographic region, their shares are subject to a higher degree of risk than funds with a higher level of diversification. Internet, biotechnology and certain capital markets or gaming stocks are subject to a rate of change in technology, obsolescence and competition that is generally higher than that of other industries, hence they may experience extreme price and volume fluctuations.
International investing [for all Funds] presents special risks including currency exchange fluctuation, government regulations, and the potential for political and economic instability. Accordingly, the share prices for these Funds are expected to be more volatile than that of U.S.-only funds. Past performance is no guarantee of future performance.
Because smaller companies [for The Small Cap Opportunities Fund] often have narrower markets and limited financial resources, they present more risk than larger, more well established, companies.
Non-investment grade debt securities [for all Funds], i.e., junk bonds, are subject to greater credit risk, price volatility and risk of loss than investment grade securities.
Further, options contain special risks including the imperfect correlation between the value of the option and the value of the underlying asset. Investments [for The Multi- Disciplinary Income Fund and The Alternative Income Fund] in futures, swaps and other derivative instruments may result in loss as derivative instruments may be illiquid, difficult to price and leveraged so that small changes may produce disproportionate losses to the Funds. To the extent the Funds segregate assets to cover derivative positions, they may impair their ability to meet current obligations, to honor requests for redemption and to manage the investments in a manner consistent with their respective investment objectives. Purchasing and writing put and call
10
options and, in particular, writing “uncovered” options are highly specialized activities that entail greater than ordinary investment risk.
As non-diversified Funds, except The Global Fund, The Alternative Income Fund and The Multi-Disciplinary Income Fund, the value of Fund shares may fluctuate more than shares invested in a broader range of industries and companies. Unlike other investment companies that directly acquire and manage their own portfolios of securities, The Kinetics Mutual Funds, except Kinetics Spin-Off and Corporate Restructuring Fund, pursue their investment objectives by investing all of their investable assets in a corresponding portfolio series of the Kinetics Portfolios Trust.
The information concerning the Funds included in the shareholder report contains certain forward-looking statements about the factors that may affect the performance of the Funds in the future. These statements are based on Fund management’s predictions and expectations concerning certain future events and their expected impact on the Funds, such as performance of the economy as a whole and of specific industry sectors, changes in the levels of interest rates, the impact of developing world events, and other factors that may influence the future performance of the Funds. Management believes these forward-looking statements to be reasonable, although they are inherently uncertain and difficult to predict. Actual events may cause adjustments in portfolio management strategies from those currently expected to be employed.
The MSCI All Country World Index, the S&P 500® Index, NASDAQ Composite®, S&P 600® Small Cap Index, MSCI EAFE® Index, Bloomberg Barclays U.S. 1-3 Year Credit Index, Bloomberg Barclays U.S. Aggregate Bond Index and Bloomberg Barclays U.S. Corporate High Yield Bond Index each represent an unmanaged, broad-basket of stocks or bonds. They are typically used as a proxy for overall market performance.
Distributor: Kinetics Funds Distributor LLC is not an affiliate of Kinetics Mutual Funds, Inc. Kinetics Funds Distributor LLC is an affiliate of Horizon Kinetics Asset Management LLC, Investment Adviser to Kinetics Mutual Funds, Inc.
For more information, log onto www.kineticsfunds.com. January 1, 2020 — Horizon Kinetics Asset Management, LLC®
11
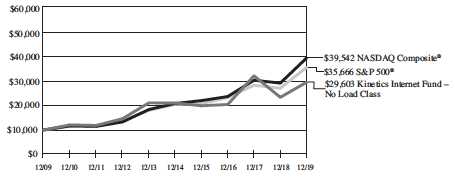
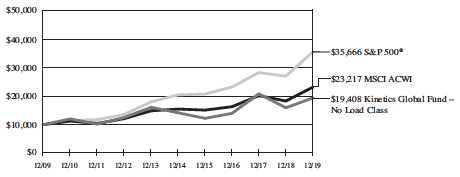
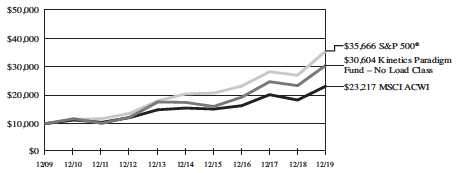
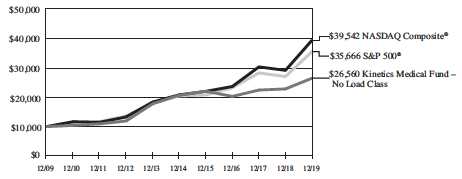
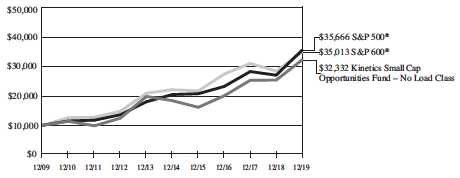
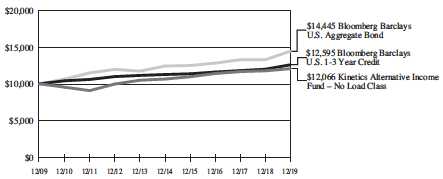
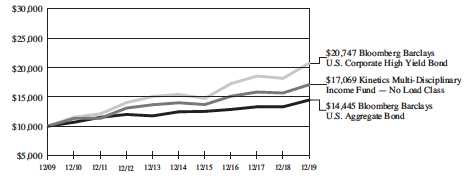
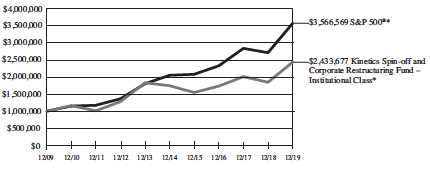
How a $10,000 and $1,000,000 Investment Have Grown:
The charts show the growth of a $10,000 investment in the Feeder Funds and a $1,000,000 investment in The Kinetics Spin-Off and Restructuring Fund (“The Spin-off Fund”) as compared to the performance of one or two representative market indices. The tables below the charts show the average annual total returns on an investment over various periods. Returns for periods greater than one year are average annual total returns. The annual returns assume the reinvestment of all dividends and distributions, however, the graph and table do not reflect the deduction of taxes that a shareholder would pay on fund distributions or the redemption of fund shares. Past performance is not predictive of future performance. Current performance may be lower or higher than the returns quoted below. The performance data reflects voluntary fee waivers and expense reimbursements made by the Adviser and the returns would have been lower if these waivers and expense reimbursements were not in effect. Investment return and principal value will fluctuate, so that shares, when redeemed, may be worth more or less than their original costs.
S&P 500® Index — is a capital-weighted index, representing the aggregate market value of the common equity of 500 stocks primarily traded on the New York Stock Exchange. The S&P 500® is unmanaged and includes the reinvestment of dividends and does not reflect the payments of transaction costs and advisory fees associated with an investment in the Funds. The securities that comprise the S&P 500® may differ substantially from the securities in the Funds’ portfolios. It is not possible to directly invest in an index.
NASDAQ Composite® — is a broad-based capitalization-weighted index of all NASDAQ stocks. The NASDAQ Composite® is unmanaged and does not include the reinvestment of dividends and does not reflect the payment of transaction costs or advisory fees associated with an investment in the Funds. The securities that comprise the NASDAQ Composite® may differ substantially from the securities in the Funds’ portfolios. It is not possible to directly invest in an index.
MSCI ACWI (All Country World Index) Index — is a free float-adjusted market capitalization weighted index that is designed to measure the equity market performance of developed and emerging markets. The MSCI ACWI consists of 46 country indices comprising 23 developed and 26 emerging market country indices. The developed market country indices included are: Australia, Austria, Belgium, Canada, Denmark, Finland, France, Germany, Hong Kong, Ireland, Israel, Italy, Japan, Netherlands, New Zealand, Norway, Portugal, Singapore, Spain, Sweden, Switzerland, the United Kingdom and the United States. The emerging market country indices included are: Argentina, Brazil, Chile, China, Colombia, Czech
12
Republic, Egypt, Greece, Hungary, India, Indonesia, Korea, Malaysia, Mexico, Pakistan, Peru, Philippines, Poland, Qatar, Russia, Saudi Arabia, South Africa, Taiwan, Thailand, Turkey, and United Arab Emirates. The securities that compromise the MSCI ACWI may differ substantially from the securities in the Funds’ portfolios. It is not possible to directly invest in an index.
S&P 600® SmallCap Index — measures the small-cap segment of the U.S. equity market. The index is designed to track companies that meet specific inclusion criteria to ensure that they are liquid and financially viable. The securities that comprise the S&P 600® may differ substantially from the securities in the Funds’ portfolios. It is not possible to directly invest in an index.
MSCI EAFE® Index (Europe, Australasia, Far East) — is a free float-adjusted market capitalization index that is designed to measure the equity market performance of developed markets, excluding the United States and Canada. As of June 2, 2014, the MSCI EAFE® Index consisted of the following 21 developed market country indices: Australia, Austria, Belgium, Denmark, Finland, France, Germany, Hong Kong, Ireland, Israel, Italy, Japan, the Netherlands, New Zealand, Norway, Portugal, Singapore, Spain, Sweden, Switzerland, and the United Kingdom. The securities that compromise the MSCI EAFE® may differ substantially from the securities in the Funds’ portfolio. It is not possible to directly invest in an index.
Bloomberg Barclays U.S. 1-3 Year Credit Index — measures the performance of investment grade corporate debt and sovereign, supranational, local authority and non-U.S. agency bonds that are U.S. dollar denominated and have a remaining maturity of greater than or equal to one year and less than three years. The securities that compromise the Bloomberg Barclays U.S. 1-3 Year Credit Index may differ substantially from the securities in the Funds’ portfolio. It is not possible to directly invest in an index.
Bloomberg Barclays U.S. Aggregate Bond Index — covers the USD-denominated, investment-grade, fixed-rate, taxable bond market of SEC-registered securities. The Index includes multiple types of government and corporate-issued bonds, some of which are asset-backed. The securities that compromise the Bloomberg Barclays U.S. Aggregate Bond Index may differ substantially from the securities in the Funds’ portfolio. It is not possible to directly invest in an index.
Bloomberg Barclays U.S. Corporate High Yield Bond Index —is composed of fixed-rate, publicly issued, non-investment grade debt. The securities that comprise the Bloomberg Barclays U.S. Corporate High Yield Bond Index may differ substantially from the securities in the Funds’ portfolio. It is not possible to directly invest in an index.
13
The Internet Fund
December 31, 2009 — December 31, 2019 (Unaudited)
| | | | | | | |
| Ended 12/31/2019
|
| | Advisor | Advisor | | | |
| No Load | Class A | Class A | Advisor | | NASDAQ |
| Class | (No Load) | (Load Adjusted)(1) | Class C | S&P 500® | Composite® |
One Year | 26.45% | 26.08% | 18.81% | 25.45% | 31.49% | 35.23% |
Five Years | 7.02% | 6.76% | 5.50% | 6.22% | 11.70% | 13.63% |
Ten Years | 11.46% | 11.19% | 10.54% | 10.64% | 13.56% | 14.74% |
Twenty Years | 3.29% | N/A | N/A | N/A | 6.06% | 4.03% |
Since Inception | | | | | | |
| No Load Class | | | | | | |
| (10/21/96) | 13.54% | N/A | N/A | N/A | 8.79% | 8.92% |
Since Inception | | | | | | |
| Advisor Class A | | | | | | |
| (4/26/01) | N/A | 7.48% | 7.14% | N/A | 7.41% | 8.27% |
Since Inception | | | | | | |
| Advisor Class C | | | | | | |
| (2/16/07) | N/A | N/A | N/A | 8.59% | 8.66% | 10.45% |
| |
(1) Reflects front-end sales charge of 5.75%. |
Returns for periods greater than one year are average annual total returns.
14
The Global Fund
December 31, 2009 — December 31, 2019 (Unaudited)
| | | | | | | |
| Ended 12/31/2019
|
| | Advisor | Advisor | | | |
| No Load | Class A | Class A | Advisor | | MSCI |
| Class | (No Load) | (Load Adjusted)(1) | Class C | S&P 500® | ACWI |
One Year | 21.61% | 21.10% | 14.19% | 20.70% | 31.49% | 26.60% |
Five Years | 6.45% | 6.39% | 5.16% | 5.65% | 11.70% | 8.41% |
Ten Years | 6.86% | 6.72% | 6.09% | 6.05% | 13.56% | 8.79% |
Twenty Years | -0.36% | N/A | N/A | N/A | 6.06% | 4.52% |
Since Inception | | | | | | |
| No Load Class | | | | | | |
| (12/31/99) | -0.36% | N/A | N/A | N/A | 6.06% | 4.52% |
Since Inception | | | | | | |
| Advisor Class A | | | | | | |
| (5/19/08) | N/A | 4.64% | 4.10% | N/A | 9.60% | 5.27% |
Since Inception | | | | | | |
| Advisor Class C | | | | | | |
| (5/19/08) | N/A | N/A | N/A | 3.96% | 9.60% | 5.27% |
| |
(1) Reflects front-end sales charge of 5.75%. |
Returns for periods greater than one year are average annual total returns.
15
The Paradigm Fund
December 31, 2009 — December 31, 2019 (Unaudited)
| | | | | | | | |
| Ended 12/31/2019
|
| | Advisor | Advisor | | | | |
| No Load
| Class A | Class A | Advisor | Institutional
| | MSCI |
| Class | (No Load) | (Load Adjusted)(1) | Class C | Class | S&P 500® | ACWI |
One Year | 30.48% | 30.15% | 22.66% | 29.49% | 30.75% | 31.49% | 26.60% |
Five Years | 11.81% | 11.53% | 10.21% | 10.97% | 12.04% | 11.70% | 8.41% |
Ten Years | 11.84% | 11.56% | 10.90% | 11.00% | 12.06% | 13.56% | 8.79% |
Twenty Years | 9.87% | N/A | N/A | N/A | N/A | 6.06% | 4.52% |
Since Inception | | | | | | | |
| No Load Class | | | | | | | |
| (12/31/99) | 9.87% | N/A | N/A | N/A | N/A | 6.06% | 4.52% |
Since Inception | | | | | | | |
| Advisor Class A | | | | | | | |
| (4/26/01) | N/A | 10.06% | 9.71% | N/A | N/A | 7.41% | 6.12% |
Since Inception | | | | | | | |
| Advisor Class C | | | | | | | |
| (6/28/02) | N/A | N/A | N/A | 10.09% | N/A | 9.19% | 7.72% |
Since Inception | | | | | | | |
| Institutional Class | | | | | | | |
| (5/27/05) | N/A | N/A | N/A | N/A | 9.19% | 9.28% | 7.11% |
| |
(1) Reflects front-end sales charge of 5.75%. |
Returns for periods greater than one year are average annual total returns.
16
The Medical Fund
December 31, 2009 — December 31, 2019 (Unaudited)
| | | | | | | |
| Ended 12/31/2019
|
| | Advisor | Advisor | | | |
| No Load | Class A | Class A | Advisor | | NASDAQ |
| Class | (No Load) | (Load Adjusted)(1) | Class C | S&P 500® | Composite® |
One Year | 16.04% | 15.74% | 9.10% | 15.18% | 31.49% | 35.23% |
Five Years | 5.07% | 4.80% | 3.57% | 4.29% | 11.70% | 13.63% |
Ten Years | 10.26% | 9.99% | 9.34% | 9.44% | 13.56% | 14.74% |
Twenty Years | 7.66% | N/A | N/A | N/A | 6.06% | 4.03% |
Since Inception | | | | | | |
| No Load Class | | | | | | |
| (9/30/99) | 9.11% | N/A | N/A | N/A | 6.71% | 6.02% |
Since Inception | | | | | | |
| Advisor Class A | | | | | | |
| (4/26/01) | N/A | 6.14% | 5.81% | N/A | 7.41% | 8.27% |
Since Inception | | | | | | |
| Advisor Class C | | | | | | |
| (2/16/07) | N/A | N/A | N/A | 7.82% | 8.66% | 10.45% |
| |
(1) Reflects front-end sales charge of 5.75%. |
Returns for periods greater than one year are average annual total returns.
17
The Small Cap Opportunities Fund
December 31, 2009 — December 31, 2019 (Unaudited)
| | | | | | | | |
| Ended 12/31/2019
|
| | Advisor | Advisor | | | | |
| No Load | Class A
| Class A | Advisor | Institutional
| | |
| Class | (No Load) | (Load Adjusted)(1)
| Class C
| Class | S&P 500® | S&P 600® |
One Year | 27.06% | 26.72% | 19.43% | 26.09% | 27.30% | 31.49% | 22.78% |
Five Years | 11.91% | 11.63% | 10.31% | 11.07% | 12.13% | 11.70% | 9.56% |
Ten Years | 12.45% | 12.17% | 11.50% | 11.60% | 12.67% | 13.56% | 13.35% |
Since Inception | | | | | | | |
| No Load Class | | | | | | | |
| (3/20/00) | 10.60% | N/A | N/A | N/A | N/A | 6.16% | 9.52% |
Since Inception | | | | | | | |
| Advisor Class A | | | | | | | |
| (12/31/01) | N/A | 9.15% | 8.80% | N/A | N/A | 8.08% | 9.87% |
Since Inception | | | | | | | |
| Advisor Class C | | | | | | | |
| (2/16/07) | N/A | N/A | N/A | 6.25% | N/A | 8.66% | 8.60% |
Since Inception | | | | | | | |
| Institutional Class | | | | | | | |
| (8/12/05) | N/A | N/A | N/A | N/A | 9.11% | 9.20% | 9.18% |
| |
(1) Reflects front-end sales charge of 5.75%. |
Returns for periods greater than one year are average total returns.
18
The Market Opportunities Fund
December 31, 2009 — December 31, 2019 (Unaudited)
| | | | | | | | |
| Ended 12/31/2019 |
| | Advisor | Advisor | | | | |
| No Load
| Class A | Class A | Advisor | Institutional
| | |
| Class | (No Load) | (Load Adjusted)(1)
| Class C
| Class | S&P 500®
| MSCI EAFE® |
One Year | 22.76% | 22.42% | 15.38% | 21.79% | 22.98% | 31.49% | 22.01% |
Five Years | 12.02% | 11.73% | 10.42% | 11.17% | 12.26% | 11.70% | 5.67% |
Ten Years | 11.41% | 11.15% | 10.49% | 10.59% | 11.65% | 13.56% | 5.50% |
Since Inception | | | | | | | |
| No Load Class | | | | | | | |
| (1/31/06) | 8.81% | N/A | N/A | N/A | N/A | 9.15% | 3.83% |
Since Inception | | | | | | | |
| Advisor Class A | | | | | | | |
| (1/31/06) | N/A | 8.54% | 8.08% | N/A | N/A | 9.15% | 3.83% |
Since Inception | | | | | | | |
| Advisor Class C | | | | | | | |
| (2/16/07) | N/A | N/A | N/A | 6.53% | N/A | 8.66% | 2.41% |
Since Inception | | | | | | | |
| Institutional Class | | | | | | | |
| (5/19/08) | N/A | N/A | N/A | N/A | 7.89% | 9.60% | 2.16% |
| |
(1) Reflects front-end sales charge of 5.75%. |
Returns for periods greater than one year are average total returns.
19
The Alternative Income Fund
December 31, 2009 — December 31, 2019 (Unaudited)
| | | | | | | | |
| Ended 12/31/2019
|
| | | | | | Bloomberg
| Bloomberg |
| | | | | | Barclays | Barclays
|
| | Advisor | Advisor | | | U.S. 1-3 | U.S. |
| No Load | Class A | Class A | Advisor
| Institutional
| Year | Aggregate |
| Class | (No Load) | (Load Adjusted)(1)
| Class C
| Class | Credit | Bond |
One Year | 2.47% | 2.22% | -3.65% | 1.71% | 2.69% | 5.01% | 8.72% |
Five Years | 2.53% | 2.26% | 1.05% | 1.75% | 2.72% | 2.24% | 3.05% |
Ten Years | 1.90% | 1.64% | 1.03% | 1.15% | 2.13% | 2.33% | 3.75% |
Since Inception | | | | | | | |
| No Load Class | | | | | | | |
| (6/29/07) | 0.61% | N/A | N/A | N/A | N/A | 3.08% | 4.36% |
Since Inception | | | | | | | |
| Advisor Class A | | | | | | | |
| (6/29/07) | N/A | 0.36% | -0.11% | N/A | N/A | 3.08% | 4.36% |
Since Inception | | | | | | | |
| Advisor Class C | | | | | | | |
| (6/29/07) | N/A | N/A | N/A | -0.13% | N/A | 3.08% | 4.36% |
Since Inception | | | | | | | |
| Institutional Class | | | | | | | |
| (6/29/07) | N/A | N/A | N/A | N/A | 0.85% | 3.08% | 4.36% |
| |
(1) Reflects front-end sales charge of 5.75%. |
Returns for periods greater than one year are average total returns.
20
The Multi-Disciplinary Income Fund
December 31, 2009 — December 31, 2019 (Unaudited)
| | | | | | | | |
| Ended 12/31/2019
|
| | | | | | | Bloomberg |
| | | | | | Bloomberg
| Barclays |
| | | | | | Barclays | U.S. |
| | Advisor | Advisor | | | U.S. | Corporate |
| No Load | Class A | Class A | Advisor | Institutional
| Aggregate
| High |
| Class | (No Load)
| (Load Adjusted)(1)
| Class C
| Class | Bond | Yield Bond |
One Year | 9.08% | 8.81% | 2.51% | 8.40% | 9.38% | 8.72% | 14.32% |
Five Years | 4.09% | 3.82% | 2.59% | 3.32% | 4.31% | 3.05% | 6.13% |
Ten Years | 5.49% | 5.22% | 4.60% | 4.70% | 5.70% | 3.75% | 7.57% |
Since Inception | | | | | | | |
| No Load Class | | | | | | | |
| (2/11/08) | 4.69% | N/A | N/A | N/A | N/A | 3.94% | 7.97% |
Since Inception | | | | | | | |
| Advisor Class A | | | | | | | |
| (2/11/08) | N/A | 4.44% | 3.92% | N/A | N/A | 3.94% | 7.97% |
Since Inception | | | | | | | |
| Advisor Class C | | | | | | | |
| (2/11/08) | N/A | N/A | N/A | 3.92% | N/A | 3.94% | 7.97% |
Since Inception | | | | | | | |
| Institutional Class | | | | | | | |
| (2/11/08) | N/A | N/A | N/A | N/A | 4.90% | 3.94% | 7.97% |
| |
(1) Reflects front-end sales charge of 5.75%. |
Returns for periods greater than one year are average total returns.
21
The Kinetics Spin-off and Corporate Restructuring Fund
December 31, 2009 — December 31, 2019 (Unaudited)
| | | | | | | |
| Ended 12/31/2019
|
| | Advisor | Advisor | | | |
| No Load | Class A | Class A | Advisor | Institutional
| |
| Class | (No Load) | (Load Adjusted)(1) | Class C | Class | S&P 500® |
One Year | 31.32% | 31.30% | 23.74% | 30.34% | 31.74% | 31.49% |
Five Years | N/A | 6.60% | 5.57% | 5.79% | 6.86% | 11.70% |
Ten Years | N/A | 9.02% | 8.49% | 8.31% | 9.30% | 13.56% |
Since Inception | | | | | | |
| No Load Class | | | | | | |
| (12/11/17) | 11.13% | N/A | N/A | N/A | N/A | 12.11% |
Since Inception | | | | | | |
| Advisor Class A | | | | | | |
| (5/4/07) | N/A | 3.03% | 2.63% | N/A | N/A | 8.49% |
Since Inception | | | | | | |
| Advisor Class C | | | | | | |
| (5/24/07) | N/A | N/A | N/A | 2.34% | N/A | 8.51% |
Since Inception | | | | | | |
| Institutional Class | | | | | | |
| (7/11/07) | N/A | N/A | N/A | N/A | 2.67% | 8.52% |
| |
(1) Reflects front-end sales charge of 5.75%. |
| |
| Returns for periods greater than one year are average annual total returns. |
| |
| * Reflects the growth of a $1,000,000 investment. |
22
KINETICS MUTUAL FUNDS, INC. — THE FUNDS
Expense Example
December 31, 2019
Shareholders incur two types of costs: (1) transaction costs, including sales charges (loads) on purchase payments, reinvestments of dividends or other distributions made by a Fund, redemption fees, and exchange fees, and (2), ongoing costs, including management fees, distribution and/or service (12b-1) fees, and other Fund expenses. This example is intended to help investors understand the ongoing costs (in dollars) of investing in a series of Kinetics Mutual Funds, Inc. (except the Spin-off Fund, each a “Feeder Fund” and including the Spin-off Fund, collectively the “Funds”), and to compare these costs with the ongoing costs of investing in other mutual funds. The example is based on an investment of $1,000 invested on July 1, 2019 and held for the entire period from July 1, 2019 to December 31, 2019.
Actual Expenses
The Actual Expenses comparison provides information about actual account values and actual expenses. Unlike other mutual funds that directly acquire and manage their own portfolio securities, each Feeder Fund invests all or generally all of its investable assets in a corresponding series of The Kinetics Portfolios Trust (each, a “Master Portfolio”, and together the “Master Portfolios”), a separately registered investment company. The Master Portfolio, in turn, invests in securities. With this type of organization, expenses can accrue specifically to the Master Portfolio or the Feeder Fund or both. Each Feeder Fund records its proportionate share of the Master Portfolio’s expenses, including directed brokerage credits, on a daily basis. Any expense reductions include Fund-specific expenses as well as the expenses allocated from the Master Portfolio. Note, the Spin-off Fund is not a Feeder Fund.
The Funds will charge shareholder fees for outgoing wire transfers, returned checks, and exchanges executed by telephone between a Fund and any other Fund. The Funds’ transfer agent charges a $5.00 transaction fee to shareholder accounts for telephone exchanges between any two Funds. The Funds’ transfer agent does not charge a transaction fee for written exchange requests. IRA accounts are assessed a $15.00 annual fee. Finally, as a disincentive to market-timing transactions, the Funds will assess a 2.00% fee on the redemption or exchange of Fund shares held for less than 30 days. These fees will be paid to the Funds to help offset transaction costs. The Funds reserve the right to waive the redemption fee, subject to their sole discretion, in instances deemed not to be disadvantageous to the Funds or shareholders as described in the Funds’ prospectus.
23
KINETICS MUTUAL FUNDS, INC. — THE FUNDS
Expense Example — (Continued)
December 31, 2019
A shareholder may use the information provided in the first line, together with the amounts invested, to estimate the expenses paid over the period. A shareholder may divide his/her account value by $1,000 (e.g., an $8,600 account value divided by $1,000 = 8.6), then multiply the result by the number in the first line under the heading entitled “Expenses Paid During Period” to estimate the expenses paid on his/her account during this period.
Hypothetical Example for Comparison Purposes
The Hypothetical Example for Comparison Purposes provides information about hypothetical account values and hypothetical expenses based on the Funds’ actual expense ratios and an assumed rate of return of 5% per year before expenses, which are not the Funds’ actual returns. The hypothetical account values and expenses may not be used to estimate the actual ending account balance or expenses paid for the period. A shareholder may use this information to compare the ongoing costs of investing in the Funds and other funds. To do so, a shareholder would compare this 5% hypothetical example with the 5% hypothetical examples that appear in the shareholder reports of other funds. The expenses shown in the table are meant to highlight ongoing costs only and do not reflect any transactional costs, such as sales charges (loads), redemption fees, or exchange fees. Therefore, the Hypothetical Example for Comparison Purposes is useful in comparing ongoing costs only, and will not help determine the relative total costs of owning different funds. In addition, if these transactional costs were included, shareholders costs would have been higher.
24
KINETICS MUTUAL FUNDS, INC. — THE FUNDS
Expense Example — (Continued)
December 31, 2019
| | | | | | | | | | | | | |
| | | | | | | | | | | Expenses Paid | |
| | Beginning | | | Ending | | | | | | During | |
| | Account | | | Account | | | Annualized | | | Period* | |
| | Value | | | Value | | | Expense | | | (7/1/19 to | |
| | (7/1/19) | | | (12/31/19) | | | Ratio | | | 12/31/19) | |
| | |
| The Internet Fund | | | | | | | | | | | | |
| No Load Class Actual | | $ | 1,000.00 | | | $ | 913.20 | | | | 1.80 | % | | $ | 8.68 | |
| No Load Class Hypothetical (5% return | | | | | | | | | | | | | | | | |
| before expenses) | | $ | 1,000.00 | | | $ | 1,016.13 | | | | 1.80 | % | | $ | 9.15 | |
| Advisor Class A Actual | | $ | 1,000.00 | | | $ | 911.80 | | | | 2.05 | % | | $ | 9.88 | |
| Advisor Class A Hypothetical (5% return | | | | | | | | | | | | | | | | |
| before expenses) | | $ | 1,000.00 | | | $ | 1,014.87 | | | | 2.05 | % | | $ | 10.41 | |
| Advisor Class C Actual | | $ | 1,000.00 | | | $ | 909.30 | | | | 2.55 | % | | $ | 12.27 | |
| Advisor Class C Hypothetical (5% return | | | | | | | | | | | | | | | | |
| before expenses) | | $ | 1,000.00 | | | $ | 1,012.35 | | | | 2.55 | % | | $ | 12.93 | |
| | |
| The Global Fund | | | | | | | | | | | | | | | | |
| No Load Class Actual - after expense | | | | | | | | | | | | | | | | |
| reimbursement | | $ | 1,000.00 | | | $ | 949.90 | | | | 1.39 | % | | $ | 6.83 | |
| No Load Class Hypothetical (5% return | | | | | | | | | | | | | | | | |
| before expenses) - after expense | | | | | | | | | | | | | | | | |
| reimbursement | | $ | 1,000.00 | | | $ | 1,018.19 | | | | 1.39 | % | | $ | 7.07 | |
| Advisor Class A Actual - after expense | | | | | | | | | | | | | | | | |
| reimbursement | | $ | 1,000.00 | | | $ | 948.30 | | | | 1.64 | % | | $ | 8.05 | |
| Advisor Class A Hypothetical (5% return | | | | | | | | | | | | | | | | |
| before expenses) - after expense | | | | | | | | | | | | | | | | |
| reimbursement | | $ | 1,000.00 | | | $ | 1,016.93 | | | | 1.64 | % | | $ | 8.34 | |
| Advisor Class C Actual - after expense | | | | | | | | | | | | | | | | |
| reimbursement | | $ | 1,000.00 | | | $ | 946.40 | | | | 2.14 | % | | $ | 10.50 | |
| Advisor Class C Hypothetical (5% return | | | | | | | | | | | | | | | | |
| before expenses) - after expense | | | | | | | | | | | | | | | | |
| reimbursement | | $ | 1,000.00 | | | $ | 1,014.41 | | | | 2.14 | % | | $ | 10.87 | |
25
| | | | | |
| KINETICS MUTUAL FUNDS, INC. — THE FUNDS | | |
|
Expense Example — (Continued) | | | |
|
| December 31, 2019 | | | | |
| | |
| | | | | | | | | | | Expenses Paid | |
| | Beginning | | | Ending | | | | | | During | |
| | Account | | | Account | | | Annualized | | | Period* | |
| | Value | | | Value | | | Expense | | | (7/1/19 to | |
| | (7/1/19) | | | (12/31/19) | | | Ratio | | | 12/31/19) | |
| | |
| The Paradigm Fund | | | | | | | | | | | | |
| No Load Class Actual - after expense | | | | | | | | | | | | |
| reimbursement | | $ | 1,000.00 | | | $ | 1,012.10 | | | | 1.64 | % | | $ | 8.32 | |
| No Load Class Hypothetical (5% return | | | | | | | | | | | | | | | | |
| before expenses) - after expense | | | | | | | | | | | | | | | | |
| reimbursement | | $ | 1,000.00 | | | $ | 1,016.93 | | | | 1.64 | % | | $ | 8.34 | |
| Advisor Class A Actual - after expense | | | | | | | | | | | | | | | | |
| reimbursement | | $ | 1,000.00 | | | $ | 1,010.80 | | | | 1.89 | % | | $ | 9.58 | |
| Advisor Class A Hypothetical (5% return | | | | | | | | | | | | | | | | |
| before expenses) - after expense | | | | | | | | | | | | | | | | |
| reimbursement | | $ | 1,000.00 | | | $ | 1,015.67 | | | | 1.89 | % | | $ | 9.60 | |
| Advisor Class C Actual - after expense | | | | | | | | | | | | | | | | |
| reimbursement | | $ | 1,000.00 | | | $ | 1,008.10 | | | | 2.39 | % | | $ | 12.10 | |
| Advisor Class C Hypothetical (5% return | | | | | | | | | | | | | | | | |
| before expenses) - after expense | | | | | | | | | | | | | | | | |
| reimbursement | | $ | 1,000.00 | | | $ | 1,013.15 | | | | 2.39 | % | | $ | 12.13 | |
| Institutional Class Actual - after expense | | | | | | | | | | | | | | | | |
| reimbursement | | $ | 1,000.00 | | | $ | 1,013.00 | | | | 1.44 | % | | $ | 7.31 | |
| Institutional Class Hypothetical (5% return | | | | | | | | | | | | | | | | |
| before expenses) - after expense | | | | | | | | | | | | | | | | |
| reimbursement | | $ | 1,000.00 | | | $ | 1,017.94 | | | | 1.44 | % | | $ | 7.32 | |
| | |
| The Medical Fund | | | | | | | | | | | | | | | | |
| No Load Class Actual - after expense | | | | | | | | | | | | | | | | |
| reimbursement | | $ | 1,000.00 | | | $ | 1,112.10 | | | | 1.39 | % | | $ | 7.40 | |
| No Load Class Hypothetical (5% return | | | | | | | | | | | | | | | | |
| before expenses) - after expense | | | | | | | | | | | | | | | | |
| reimbursement | | $ | 1,000.00 | | | $ | 1,018.19 | | | | 1.39 | % | | $ | 7.07 | |
| Advisor Class A Actual - after expense | | | | | | | | | | | | | | | | |
| reimbursement | | $ | 1,000.00 | | | $ | 1,110.50 | | | | 1.64 | % | | $ | 8.72 | |
| Advisor Class A Hypothetical (5% return | | | | | | | | | | | | | | | | |
| before expenses) - after expense | | | | | | | | | | | | | | | | |
| reimbursement | | $ | 1,000.00 | | | $ | 1,016.93 | | | | 1.64 | % | | $ | 8.34 | |
| Advisor Class C Actual - after expense | | | | | | | | | | | | | | | | |
| reimbursement | | $ | 1,000.00 | | | $ | 1,107.90 | | | | 2.14 | % | | $ | 11.37 | |
| Advisor Class C Hypothetical (5% return | | | | | | | | | | | | | | | | |
| before expenses) - after expense | | | | | | | | | | | | | | | | |
| reimbursement | | $ | 1,000.00 | | | $ | 1,014.41 | | | | 2.14 | % | | $ | 10.87 | |
26
| | | | | |
| KINETICS MUTUAL FUNDS, INC. — THE FUNDS | | |
|
Expense Example — (Continued) | | | |
|
| December 31, 2019 | | | | |
| | |
| | | | | | | | | | | Expenses Paid | |
| | Beginning | | | Ending | | | | | | During | |
| | Account | | | Account | | | Annualized | | | Period* | |
| | Value | | | Value | | | Expense | | | (7/1/19 to | |
| | (7/1/19) | | | (12/31/19) | | | Ratio | | | 12/31/19) | |
| | |
| The Small Cap Opportunities Fund | | | | | | | | | | | | |
| No Load Class Actual - after expense | | | | | | | | | | | | |
| reimbursement | | $ | 1,000.00 | | | $ | 1,038.30 | | | | 1.64 | % | | $ | 8.43 | |
| No Load Class Hypothetical (5% return | | | | | | | | | | | | | | | | |
| before expenses) - after expense | | | | | | | | | | | | | | | | |
| reimbursement | | $ | 1,000.00 | | | $ | 1,016.93 | | | | 1.64 | % | | $ | 8.34 | |
| Advisor Class A Actual - after expense | | | | | | | | | | | | | | | | |
| reimbursement | | $ | 1,000.00 | | | $ | 1,037.00 | | | | 1.89 | % | | $ | 9.70 | |
| Advisor Class A Hypothetical (5% return | | | | | | | | | | | | | | | | |
| before expenses) - after expense | | | | | | | | | | | | | | | | |
| reimbursement | | $ | 1,000.00 | | | $ | 1,015.67 | | | | 1.89 | % | | $ | 9.60 | |
| Advisor Class C Actual - after expense | | | | | | | | | | | | | | | | |
| reimbursement | | $ | 1,000.00 | | | $ | 1,034.30 | | | | 2.39 | % | | $ | 12.25 | |
| Advisor Class C Hypothetical (5% return | | | | | | | | | | | | | | | | |
| before expenses) - after expense | | | | | | | | | | | | | | | | |
| reimbursement | | $ | 1,000.00 | | | $ | 1,013.15 | | | | 2.39 | % | | $ | 12.13 | |
| Institutional Class Actual - after expense | | | | | | | | | | | | | | | | |
| reimbursement | | $ | 1,000.00 | | | $ | 1,039.30 | | | | 1.44 | % | | $ | 7.40 | |
| Institutional Class Hypothetical (5% return | | | | | | | | | | | | | | | | |
| before expenses) - after expense | | | | | | | | | | | | | | | | |
| reimbursement | | $ | 1,000.00 | | | $ | 1,017.94 | | | | 1.44 | % | | $ | 7.32 | |
| | |
| The Market Opportunities Fund | | | | | | | | | | | | | | | | |
| No Load Class Actual - after expense | | | | | | | | | | | | | | | | |
| reimbursement | | $ | 1,000.00 | | | $ | 976.60 | | | | 1.40 | % | | $ | 6.97 | |
| No Load Class Hypothetical (5% return | | | | | | | | | | | | | | | | |
| before expenses) - after expense | | | | | | | | | | | | | | | | |
| reimbursement | | $ | 1,000.00 | | | $ | 1,018.14 | | | | 1.40 | % | | $ | 7.12 | |
| Advisor Class A Actual - after expense | | | | | | | | | | | | | | | | |
| reimbursement | | $ | 1,000.00 | | | $ | 975.10 | | | | 1.65 | % | | $ | 8.21 | |
| Advisor Class A Hypothetical (5% return | | | | | | | | | | | | | | | | |
| before expenses) - after expense | | | | | | | | | | | | | | | | |
| reimbursement | | $ | 1,000.00 | | | $ | 1,016.88 | | | | 1.65 | % | | $ | 8.39 | |
| Advisor Class C Actual - after expense | | | | | | | | | | | | | | | | |
| reimbursement | | $ | 1,000.00 | | | $ | 972.90 | | | | 2.15 | % | | $ | 10.69 | |
| Advisor Class C Hypothetical (5% return | | | | | | | | | | | | | | | | |
| before expenses) - after expense | | | | | | | | | | | | | | | | |
| reimbursement | | $ | 1,000.00 | | | $ | 1,014.36 | | | | 2.15 | % | | $ | 10.92 | |
| Institutional Class Actual - after expense | | | | | | | | | | | | | | | | |
| reimbursement | | $ | 1,000.00 | | | $ | 977.40 | | | | 1.20 | % | | $ | 5.98 | |
| Institutional Class Hypothetical (5% return | | | | | | | | | | | | | | | | |
| before expenses) - after expense | | | | | | | | | | | | | | | | |
| reimbursement | | $ | 1,000.00 | | | $ | 1,019.15 | | | | 1.20 | % | | $ | 6.11 | |
27
| | | | | |
| KINETICS MUTUAL FUNDS, INC. — THE FUNDS | | |
|
Expense Example — (Continued) | | | |
|
| December 31, 2019 | | | | |
| | |
| | | | | | | | | | | Expenses Paid | |
| | Beginning | | | Ending | | | | | | During | |
| | Account | | | Account | | | Annualized | | | Period* | |
| | Value | | | Value | | | Expense | | | (7/1/19 to | |
| | (7/1/19) | | | (12/31/19) | | | Ratio | | | 12/31/19) | |
| | |
| The Alternative Income Fund | | | | | | | | | | | | |
| No Load Class Actual - after expense | | | | | | | | | | | | |
| reimbursement | | $ | 1,000.00 | | | $ | 1,008.10 | | | | 0.95 | % | | $ | 4.81 | |
| No Load Class Hypothetical (5% return | | | | | | | | | | | | | | | | |
| before expenses) - after expense | | | | | | | | | | | | | | | | |
| reimbursement | | $ | 1,000.00 | | | $ | 1,020.41 | | | | 0.95 | % | | $ | 4.84 | |
| Advisor Class A Actual - after expense | | | | | | | | | | | | | | | | |
| reimbursement | | $ | 1,000.00 | | | $ | 1,006.80 | | | | 1.20 | % | | $ | 6.07 | |
| Advisor Class A Hypothetical (5% return | | | | | | | | | | | | | | | | |
| before expenses) - after expense | | | | | | | | | | | | | | | | |
| reimbursement | | $ | 1,000.00 | | | $ | 1,019.15 | | | | 1.20 | % | | $ | 6.11 | |
| Advisor Class C Actual - after expense | | | | | | | | | | | | | | | | |
| reimbursement | | $ | 1,000.00 | | | $ | 1,004.40 | | | | 1.70 | % | | $ | 8.59 | |
| Advisor Class C Hypothetical (5% return | | | | | | | | | | | | | | | | |
| before expenses) - after expense | | | | | | | | | | | | | | | | |
| reimbursement | | $ | 1,000.00 | | | $ | 1,016.63 | | | | 1.70 | % | | $ | 8.64 | |
| Institutional Class Actual - after expense | | | | | | | | | | | | | | | | |
| reimbursement | | $ | 1,000.00 | | | $ | 1,009.10 | | | | 0.75 | % | | $ | 3.80 | |
| Institutional Class Hypothetical (5% return | | | | | | | | | | | | | | | | |
| before expenses) - after expense | | | | | | | | | | | | | | | | |
| reimbursement | | $ | 1,000.00 | | | $ | 1,021.42 | | | | 0.75 | % | | $ | 3.82 | |
| | |
| The Multi-Disciplinary Income Fund | | | | | | | | | | | | | | | | |
| No Load Class Actual - after expense | | | | | | | | | | | | | | | | |
| reimbursement | | $ | 1,000.00 | | | $ | 1,020.00 | | | | 1.49 | % | | $ | 7.59 | |
| No Load Class Hypothetical (5% return | | | | | | | | | | | | | | | | |
| before expenses) - after expense | | | | | | | | | | | | | | | | |
| reimbursement | | $ | 1,000.00 | | | $ | 1,017.69 | | | | 1.49 | % | | $ | 7.58 | |
| Advisor Class A Actual - after expense | | | | | | | | | | | | | | | | |
| reimbursement | | $ | 1,000.00 | | | $ | 1,018.40 | | | | 1.74 | % | | $ | 8.85 | |
| Advisor Class A Hypothetical (5% return | | | | | | | | | | | | | | | | |
| before expenses) - after expense | | | | | | | | | | | | | | | | |
| reimbursement | | $ | 1,000.00 | | | $ | 1,016.43 | | | | 1.74 | % | | $ | 8.84 | |
| Advisor Class C Actual - after expense | | | | | | | | | | | | | | | | |
| reimbursement | | $ | 1,000.00 | | | $ | 1,016.10 | | | | 2.24 | % | | $ | 11.38 | |
| Advisor Class C Hypothetical (5% return | | | | | | | | | | | | | | | | |
| before expenses) - after expense | | | | | | | | | | | | | | | | |
| reimbursement | | $ | 1,000.00 | | | $ | 1,013.91 | | | | 2.24 | % | | $ | 11.37 | |
| Institutional Class Actual - after expense | | | | | | | | | | | | | | | | |
| reimbursement | | $ | 1,000.00 | | | $ | 1,021.00 | | | | 1.29 | % | | $ | 6.57 | |
| Institutional Class Hypothetical (5% return | | | | | | | | | | | | | | | | |
| before expenses) - after expense | | | | | | | | | | | | | | | | |
| reimbursement | | $ | 1,000.00 | | | $ | 1,018.70 | | | | 1.29 | % | | $ | 6.56 | |
28
| |
| KINETICS MUTUAL FUNDS, INC. — THE FUNDS |
| |
Expense Example — (Continued) |
| |
| December 31, 2019 |
| | |
| | | | | | | | | | | Expenses Paid | |
| | Beginning | | | Ending | | | | | | During | |
| | Account | | | Account | | | Annualized | | | Period* | |
| | Value | | | Value | | | Expense | | | (7/1/19 to | |
| | (7/1/19) | | | (12/31/19) | | | Ratio | | | 12/31/19) | |
| | |
| The Kinetics Spin-off and Corporate Restructuring Fund | | | | | | | | | | |
| No Load Class Actual - after expense | | | | | | | | | | | | |
| reimbursement | | $ | 1,000.00 | | | $ | 1,038.00 | | | | 1.45 | % | | $ | 7.45 | |
| No Load Class Hypothetical (5% return | | | | | | | | | | | | | | | | |
| before expenses) - after expense | | | | | | | | | | | | | | | | |
| reimbursement | | $ | 1,000.00 | | | $ | 1,017.99 | | | | 1.45 | % | | $ | 7.37 | |
| Advisor Class A Actual - after expense | | | | | | | | | | | | | | | | |
| reimbursement | | $ | 1,000.00 | | | $ | 1,038.10 | | | | 1.50 | % | | $ | 7.71 | |
| Advisor Class A Hypothetical (5% return | | | | | | | | | | | | | | | | |
| before expenses) - after expense | | | | | | | | | | | | | | | | |
| reimbursement | | $ | 1,000.00 | | | $ | 1,017.64 | | | | 1.50 | % | | $ | 7.63 | |
| Advisor Class C Actual - after expense | | | | | | | | | | | | | | | | |
| reimbursement | | $ | 1,000.00 | | | $ | 1,034.30 | | | | 2.25 | % | | $ | 11.54 | |
| Advisor Class C Hypothetical (5% return | | | | | | | | | | | | | | | | |
| before expenses) - after expense | | | | | | | | | | | | | | | | |
| reimbursement | | $ | 1,000.00 | | | $ | 1,013.86 | | | | 2.25 | % | | $ | 11.42 | |
| Institutional Class Actual - after expense | | | | | | | | | | | | | | | | |
| reimbursement | | $ | 1,000.00 | | | $ | 1,039.70 | | | | 1.25 | % | | $ | 6.43 | |
| Institutional Class Hypothetical (5% return | | | | | | | | | | | | | | | | |
| before expenses) - after expense | | | | | | | | | | | | | | | | |
| reimbursement | | $ | 1,000.00 | | | $ | 1,018.90 | | | | 1.25 | % | | $ | 6.36 | |
| Note: Each Feeder Fund records its proportionate share of the respective Master Portfolio’s expenses on a daily basis. Any expense reductions include Feeder Fund-specific expenses as well as the expenses allocated from the Master Portfolio. |
| * Expenses are equal to the to the Fund’s annualized expense ratio after expense reimbursement multiplied by the average account value over the period, multiplied by 184/365. |
29
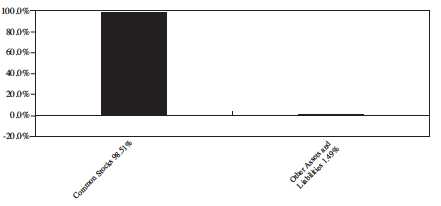
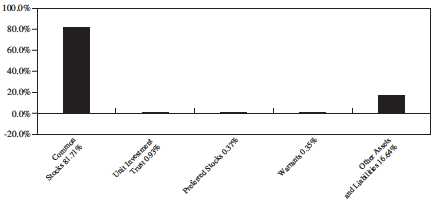
KINETICS MUTUAL FUNDS, INC. — THE FUND
Allocation of Portfolio Assets
December 31, 2019
The Kinetics Spin-off and Corporate Restructuring Fund
| | | | | | | |
| | | | | Percentage | |
| | Market | | | of Total | |
| Sector Allocation | | Value | | | Net Assets | |
Mining, Quarrying, and Oil and Gas Extraction | | $ | 8,382,490 | | | | 39.1 | % |
Real Estate and Rental and Leasing | | | 3,168,106 | | | | 14.8 | % |
Manufacturing | | | 2,363,613 | | | | 11.0 | % |
Information | | | 2,103,604 | | | | 9.8 | % |
Management of Companies and Enterprises | | | 1,365,849 | | | | 6.4 | % |
Administrative and Support and Waste Management and | | | | | | | | |
| Remediation Services | | | 1,200,687 | | | | 5.6 | % |
Educational Services | | | 830,687 | | | | 3.9 | % |
Finance and Insurance | | | 521,780 | | | | 2.4 | % |
Transportation and Warehousing | | | 502,600 | | | | 2.3 | % |
Accommodation and Food Services | | | 389,580 | | | | 1.8 | % |
Arts, Entertainment, and Recreation | | | 259,302 | | | | 1.2 | % |
Retail Trade | | | 23,936 | | | | 0.1 | % |
Professional, Scientific, and Technical Services | | | 17,840 | | | | 0.1 | % |
30
| | | |
| KINETICS MUTUAL FUNDS, INC. — THE FUND | | |
| The Kinetics Spin-off and Corporate | | |
| Restructuring Fund | | |
| Schedule of Investments — December 31, 2019 | | |
| COMMON STOCKS — 98.51% | | Shares | | | Value | |
| Accommodation — 1.82% | | | | | | |
Civeo Corporation* | | | 302,000 | | | $ | 389,580 | |
| Beverage and Tobacco Product Manufacturing — 0.35% | | | | | | | | |
Crimson Wine Group Limited* | | | 10,000 | | | | 74,000 | |
| Broadcasting (except Internet) — 7.57% | | | | | | | | |
Cable One, Inc.c | | | 750 | | | | 1,116,352 | |
The E.W. Scripps Company — Class A | | | 20,000 | | | | 314,200 | |
TEGNA, Inc. | | | 11,600 | | | | 193,604 | |
| | | | | | | 1,624,156 | |
| Chemical Manufacturing — 0.25% | | | | | | | | |
Prestige Consumer Healthcare, Inc.* | | | 797 | | | | 32,279 | |
Rayonier Advanced Materials, Inc. | | | 5,800 | | | | 22,272 | |
| | | | | | | 54,551 | |
| Data Processor — 5.60% | | | | | | | | |
PayPal Holdings, Inc.*c | | | 11,100 | | | | 1,200,687 | |
| Educational Services — 3.87% | | | | | | | | |
Graham Holdings Company — Class B | | | 1,300 | | | | 830,687 | |
| Fabricated Metal Product Manufacturing — 1.12% | | | | | | | | |
Masco Corporation | | | 5,000 | | | | 239,950 | |
| Funds, Trusts, and Other Financial Vehicles — 1.68% | | | | | | | | |
Capital Southwest Corporation | | | 17,300 | | | | 360,013 | |
| Lessors of Nonfinancial Intangible Assets (except Copyrighted Works) — 0.03% | | | | | | | | |
PrairieSky Royalty Limited | | | 500 | | | | 5,864 | |
| Machinery Manufacturing — 2.84% | | | | | | | | |
The Manitowoc Company, Inc.* | | | 8,025 | | | | 140,438 | |
Welbilt, Inc.* | | | 30,000 | | | | 468,300 | |
| | | | | | | 608,738 | |
| Management of Companies and Enterprises — 6.37% | | | | | | | | |
Associated Capital Group, Inc. — Class Ac | | | 33,600 | | | | 1,317,120 | |
Dundee Corporation — Class A* | | | 48,400 | | | | 43,831 | |
Galaxy Digital Holdings Ltd.* | | | 6,000 | | | | 4,898 | |
| | | | | | | 1,365,849 | |
The accompanying notes are an integral part of these financial statements.
31
KINETICS MUTUAL FUNDS, INC. — THE FUND
The Kinetics Spin-off and Corporate Restructuring Fund
Schedule of Investments — December 31, 2019 — (Continued)
| | | | | | |
| | Shares | | | Value | |
| | |
| Medical Equipment and Supplies Manufacturing — 0.94% | | | | | | |
Avanos Medical, Inc.* | | | 6,000 | | | $ | 202,200 | |
| Miscellaneous Manufacturing — 5.39% | | | | | | | | |
CSW Industrials, Inc.c | | | 15,000 | | | | 1,154,999 | |
| Oil and Gas Extraction — 39.08% | | | | | | | | |
Texas Pacific Land Trustc | | | 10,730 | | | | 8,382,490 | |
| Other Financial Investment Activities — 0.75% | | | | | | | | |
GAMCO Investors, Inc. — Class A | | | 8,300 | | | | 161,767 | |
| Other Telecommunications — 1.74% | | | | | | | | |
Liberty Broadband Corporation — Series A* | | | 3,000 | | | | 373,680 | |
| Publishing Industries (except Internet) — 0.49% | | | | | | | | |
Gannett Co, Inc. | | | 16,578 | | | | 105,768 | |
| Real Estate — 14.74% | | | | | | | | |
Dream Unlimited Corp. — Class Acf | | | 203,200 | | | | 1,830,842 | |
The Howard Hughes Corporation*c | | | 10,500 | | | | 1,331,400 | |
| | | | | | | 3,162,242 | |
| Scientific Research and Development Services — 0.08% | | | | | | | | |
Rafael Holdings, Inc. — Class B* | | | 1,000 | | | | 17,840 | |
| Spectator Sports — 1.21% | | | | | | | | |
Liberty Media Corp.-Liberty Braves — Class C* | | | 1,590 | | | | 46,969 | |
Liberty Media Corp.-Liberty Formula One — Class A* | | | 4,850 | | | | 212,333 | |
| | | | | | | 259,302 | |
| Sporting Goods, Hobby, Musical Instrument, and Book Stores — 0.11% | | | | | | | | |
Vista Outdoor, Inc.* | | | 3,200 | | | | 23,936 | |
| Transportation Equipment Manufacturing — 0.14% | | | | | | | | |
Westinghouse Air Brake Technologies Corp. | | | 375 | | | | 29,175 | |
| Water Transportation — 2.34% | | | | | | | | |
A.P. Moeller-Maersk A/S — Class B — ADR | | | 70,000 | | | | 502,600 | |
TOTAL COMMON STOCKS | | | | | | | | |
(cost $11,813,715) | | | | | | | 21,130,074 | |
| TOTAL INVESTMENTS — 98.51% | | | | | | | | |
| (cost $11,813,715) | | | | | | $ | 21,130,074 | |
The accompanying notes are an integral part of these financial statements.
32
KINETICS MUTUAL FUNDS, INC. — THE FUND
The Kinetics Spin-off and Corporate Restructuring Fund
Schedule of Investments — December 31, 2019 — (Continued)
| Percentages are stated as a percent of net assets. |
| * — Non-income producing security. |
c — Significant Investment — See note 6. |
f — Level 2 Investment — See note 7. |
| ADR — American Depository Receipt. |
The accompanying notes are an integral part of these financial statements.
33
KINETICS MUTUAL FUNDS, INC. — THE FEEDER FUNDS
Statements of Assets & Liabilities
December 31, 2019
| | | | | | | |
| | The Internet | | | The Global | |
| | Fund | | | Fund | |
| ASSETS: | | | | | | |
| Investments in the Master Portfolio, at value* | | $ | 118,658,325 | | | $ | 14,408,577 | |
| Receivable from Adviser | | | — | | | | 13,825 | |
| Receivable for Master Portfolio interest sold | | | 240,200 | | | | — | |
| Receivable for Fund shares sold | | | 110,800 | | | | 14,140 | |
| Prepaid expenses and other assets | | | 25,107 | | | | 21,066 | |
| Total Assets | | | 119,034,432 | | | | 14,457,608 | |
| LIABILITIES: | | | | | | | | |
| Payable for Master Portfolio interest purchased | | | — | | | | 1,313 | |
| Payable to Directors | | | 2,895 | | | | 322 | |
| Payable to Chief Compliance Officer | | | 188 | | | | 17 | |
| Payable for Fund shares repurchased | | | 351,000 | | | | 12,827 | |
| Payable for shareholder servicing fees | | | 25,307 | | | | 3,025 | |
| Payable for distribution fees | | | 1,216 | | | | 3,569 | |
| Accrued expenses and other liabilities | | | 63,225 | | | | 21,531 | |
| Total Liabilities | | | 443,831 | | | | 42,604 | |
| Net Assets | | $ | 118,590,601 | | | $ | 14,415,004 | |
| NET ASSETS CONSIST OF: | | | | | | | | |
| Paid in capital | | $ | 94,951,546 | | | $ | 11,665,051 | |
| Accumulated earnings | | | 23,639,055 | | | | 2,749,953 | |
| Net Assets | | $ | 118,590,601 | | | $ | 14,415,004 | |
| CALCULATION OF NET ASSET VALUE PER SHARE – NO LOAD CLASS: | | | | | | | | |
| Net Assets | | $ | 115,351,082 | | | $ | 8,115,062 | |
| Shares outstanding | | | 3,403,777 | | | | 1,222,019 | |
| Net asset value per share (offering price and redemption price) | | $ | 33.89 | | | $ | 6.64 | |
| CALCULATION OF NET ASSET VALUE PER SHARE – ADVISOR CLASS A: | | | | | | | | |
| Net Assets | | $ | 2,296,324 | | | $ | 1,330,647 | |
| Shares outstanding | | | 74,001 | | | | 201,479 | |
| Net asset value per share (redemption price) | | $ | 31.03 | | | $ | 6.60 | |
| Offering price per share ($31.03 divided by .9425 and $6.60 | | | | | | | | |
| divided by .9425) | | $ | 32.92 | | | $ | 7.00 | |
| CALCULATION OF NET ASSET VALUE PER SHARE - ADVISOR CLASS C: | | | | | | | | |
| Net Assets | | $ | 943,195 | | | $ | 4,969,295 | |
| Shares outstanding | | | 36,162 | | | | 804,067 | |
| Net asset value per share (offering price and redemption price) | | $ | 26.08 | | | $ | 6.18 | |
| * Each Feeder Fund invests all or generally all its assets directly in the corresponding Master Portfolio. The financial statements for the Master Portfolios, along with the portfolio of investments in securities, are contained elsewhere in this report and should be read in conjunction with the Feeder Funds’ financial statements. |
The accompanying notes are an integral part of these financial statements.
34
KINETICS MUTUAL FUNDS, INC. — THE FEEDER FUNDS
Statements of Assets & Liabilities — (Continued)
December 31, 2019
| | | | | | | |
| | The Paradigm | | | The Medical | |
| | Fund | | | Fund | |
| ASSETS: | | | | | | |
| Investments in the Master Portfolio, at value* | | $ | 780,117,417 | | | $ | 16,742,127 | |
| Receivable from Adviser | | | — | | | | 10,797 | |
| Receivable for Master Portfolio interest sold | | | — | | | | 151,330 | |
| Receivable for Fund shares sold | | | 643,956 | | | | 734 | |
| Prepaid expenses and other assets | | | 37,980 | | | | 20,908 | |
| Total Assets | | | 780,799,353 | | | | 16,925,896 | |
| LIABILITIES: | | | | | | | | |
| Payable for Master Portfolio interest purchased | | | 113,570 | | | | — | |
| Payable to Adviser | | | 48,384 | | | | — | |
| Payable to Directors | | | 17,834 | | | | 386 | |
| Payable to Chief Compliance Officer | | | 1,193 | | | | 25 | |
| Payable for Fund shares repurchased | | | 530,389 | | | | 152,063 | |
| Payable for shareholder servicing fees | | | 126,901 | | | | 3,570 | |
| Payable for distribution fees | | | 98,476 | | | | 360 | |
| Accrued expenses and other liabilities | | | 202,933 | | | | 21,492 | |
| Total Liabilities | | | 1,139,680 | | | | 177,896 | |
| Net Assets | | $ | 779,659,673 | | | $ | 16,748,000 | |
| NET ASSETS CONSIST OF: | | | | | | | | |
| Paid in capital | | $ | 419,930,530 | | | $ | 10,440,841 | |
| Accumulated earnings | | | 359,729,143 | | | | 6,307,159 | |
| Net Assets | | $ | 779,659,673 | | | $ | 16,748,000 | |
| CALCULATION OF NET ASSET VALUE PER SHARE – NO LOAD CLASS: | | | | | | | | |
| Net Assets | | $ | 348,402,419 | | | $ | 15,442,064 | |
| Shares outstanding | | | 6,526,290 | | | | 582,090 | |
| Net asset value per share (offering price and redemption price) | | $ | 53.38 | | | $ | 26.53 | |
| CALCULATION OF NET ASSET VALUE PER SHARE – ADVISOR CLASS A: | | | | | | | | |
| Net Assets | | $ | 115,579,708 | | | $ | 1,136,730 | |
| Shares outstanding | | | 2,245,635 | | | | 44,727 | |
| Net asset value per share (redemption price) | | $ | 51.47 | | | $ | 25.41 | |
| Offering price per share ($51.47 divided by .9425 and $25.41 | | | | | | | | |
| divided by .9425) | | $ | 54.61 | | | $ | 26.96 | |
| CALCULATION OF NET ASSET VALUE PER SHARE – ADVISOR CLASS C: | | | | | | | | |
| Net Assets | | $ | 113,299,996 | | | $ | 169,206 | |
| Shares outstanding | | | 2,383,135 | | | | 6,896 | |
| Net asset value per share (offering price and redemption price) | | $ | 47.54 | | | $ | 24.54 | |
| CALCULATION OF NET ASSET VALUE PER SHARE – INSTITUTIONAL CLASS: | | | | | | | | |
| Net Assets | | $ | 202,377,550 | | | | N/A | |
| Shares outstanding | | | 3,756,459 | | | | N/A | |
| Net asset value per share (offering price and redemption price) | | $ | 53.87 | | | | N/A | |
| * Each Feeder Fund invests all or generally all its assets directly in the corresponding Master Portfolio. The financial statements for the Master Portfolios, along with the portfolio of investments in securities, are contained elsewhere in this report and should be read in conjunction with the Feeder Funds’ financial statements. |
The accompanying notes are an integral part of these financial statements.
35
KINETICS MUTUAL FUNDS, INC. — THE FEEDER FUNDS
Statements of Assets & Liabilities — (Continued)
December 31, 2019
| | | | | | | |
| | The Small Cap | | | The Market | |
| | Opportunities
| | | Opportunities | |
| | Fund | | | Fund | |
| ASSETS: | | | | | | |
| Investments in the Master Portfolio, at value* | | $ | 269,698,838 | | | $ | 86,451,427 | |
| Receivable from Adviser | | | — | | | | 19,454 | |
| Receivable for Master Portfolio interest sold | | | 1,071,275 | | | | 52,295 | |
| Receivable for Fund shares sold | | | 452,540 | | | | 3,719 | |
| Prepaid expenses and other assets | | | 33,149 | | | | 32,855 | |
| Total Assets | | | 271,255,802 | | | | 86,559,750 | |
| LIABILITIES: | | | | | | | | |
| Payable to Adviser | | | 17,231 | | | | — | |
| Payable to Directors | | | 6,648 | | | | 1,981 | |
| Payable to Chief Compliance Officer | | | 509 | | | | 121 | |
| Payable for Fund shares repurchased | | | 1,523,815 | | | | 56,012 | |
| Payable for shareholder servicing fees | | | 44,773 | | | | 15,802 | |
| Payable for distribution fees | | | 10,765 | | | | 7,972 | |
| Fund distribution payable | | | — | | | | 2 | |
| Accrued expenses and other liabilities | | | 88,042 | | | | 39,082 | |
| Total Liabilities | | | 1,691,783 | | | | 120,972 | |
| Net Assets | | $ | 269,564,019 | | | $ | 86,438,778 | |
| NET ASSETS CONSIST OF: | | | | | | | | |
| Paid in capital | | $ | 195,604,165 | | | $ | 59,840,725 | |
| Accumulated earnings | | | 73,959,854 | | | | 26,598,053 | |
| Net Assets | | $ | 269,564,019 | | | $ | 86,438,778 | |
| CALCULATION OF NET ASSET VALUE PER SHARE – NO LOAD CLASS: | | | | | | | | |
| Net Assets | | $ | 180,575,412 | | | $ | 56,986,740 | |
| Shares outstanding | | | 2,764,945 | | | | 2,133,735 | |
| Net asset value per share (offering price and redemption price) | | $ | 65.31 | | | $ | 26.71 | |
| CALCULATION OF NET ASSET VALUE PER SHARE – ADVISOR CLASS A: | | | | | | | | |
| Net Assets | | $ | 11,985,627 | | | $ | 6,867,907 | |
| Shares outstanding | | | 189,881 | | | | 261,200 | |
| Net asset value per share (redemption price) | | $ | 63.12 | | | $ | 26.29 | |
| Offering price per share ($63.12 divided by .9425 and $26.29 | | | | | | | | |
| divided by .9425) | | $ | 66.97 | | | $ | 27.89 | |
| CALCULATION OF NET ASSET VALUE PER SHARE – ADVISOR CLASS C: | | | | | | | | |
| Net Assets | | $ | 10,544,133 | | | $ | 10,050,558 | |
| Shares outstanding | | | 175,932 | | | | 400,437 | |
| Net asset value per share (offering price and redemption price) | | $ | 59.93 | | | $ | 25.10 | |
| CALCULATION OF NET ASSET VALUE PER SHARE – INSTITUTIONAL CLASS: | | | | | | | | |
| Net Assets | | $ | 66,458,847 | | | $ | 12,533,573 | |
| Shares outstanding | | | 998,153 | | | | 462,277 | |
| Net asset value per share (offering price and redemption price) | | $ | 66.58 | | | $ | 27.11 | |
| * Each Feeder Fund invests all or generally all its assets directly in the corresponding Master Portfolio. The financial statements for the Master Portfolios, along with the portfolio of investments in securities, are contained elsewhere in this report and should be read in conjunction with the Feeder Funds’ financial statements. |
The accompanying notes are an integral part of these financial statements.
36
KINETICS MUTUAL FUNDS, INC. — THE FEEDER FUNDS
Statements of Assets & Liabilities — (Continued)
December 31, 2019
| | | | | | | |
| | | | | The Multi- | |
| | The Alternative | | | Disciplinary | |
| | Income | | | Income | |
| | Fund | | | Fund | |
| | |
| ASSETS: | | | | | | |
| Investments in the Master Portfolio, at value* | | $ | 16,411,892 | | | $ | 35,011,778 | |
| Receivable from Adviser | | | 13,062 | | | | 9,214 | |
| Receivable for Master Portfolio interest sold | | | 27,659 | | | | — | |
| Receivable for Fund shares sold | | | 10,251 | | | | 50,700 | |
| Prepaid expenses and other assets | | | 17,813 | | | | 38,952 | |
| Total Assets | | | 16,480,677 | | | | 35,110,644 | |
| LIABILITIES: | | | | | | | | |
| Payable for Master Portfolio interest purchased | | | — | | | | 42,305 | |
| Payable to Directors | | | 429 | | | | 866 | |
| Payable to Chief Compliance Officer | | | 32 | | | | 54 | |
| Payable for Fund shares repurchased | | | 37,910 | | | | 8,344 | |
| Payable for shareholder servicing fees | | | 1,609 | | | | 4,047 | |
| Payable for distribution fees | | | 832 | | | | 5,292 | |
| Fund distribution payable | | | — | | | | 52 | |
| Accrued expenses and other liabilities | | | 23,426 | | | | 27,637 | |
| Total Liabilities | | | 64,238 | | | | 88,597 | |
| Net Assets | | $ | 16,416,439 | | | $ | 35,022,047 | |
| NET ASSETS CONSIST OF: | | | | | | | | |
| Paid in capital | | $ | 16,349,798 | | | $ | 37,563,253 | |
| Accumulated earnings (deficit) | | | 66,641 | | | | (2,541,206 | ) |
| Net Assets | | $ | 16,416,439 | | | $ | 35,022,047 | |
| CALCULATION OF NET ASSET VALUE PER SHARE – NO LOAD CLASS: | | | | | | | | |
| Net Assets | | $ | 3,481,597 | | | $ | 6,024,939 | |
| Shares outstanding | | | 35,424 | | | | 550,023 | |
| Net asset value per share (offering price and redemption price) | | $ | 98.28 | | | $ | 10.95 | |
| CALCULATION OF NET ASSET VALUE PER SHARE – ADVISOR CLASS A: | | | | | | | | |
| Net Assets | | $ | 856,021 | | | $ | 1,851,814 | |
| Shares outstanding | | | 8,821 | | | | 169,847 | |
| Net asset value per share (redemption price) | | $ | 97.04 | | | $ | 10.90 | |
| Offering price per share ($97.04 divided by .9425 and $10.90 | | | | | | | | |
| divided by .9425) | | $ | 102.96 | | | $ | 11.56 | |
| CALCULATION OF NET ASSET VALUE PER SHARE – ADVISOR CLASS C: | | | | | | | | |
| Net Assets | | $ | 711,091 | | | $ | 6,831,183 | |
| Shares outstanding | | | 7,613 | | | | 633,775 | |
| Net asset value per share (offering price and redemption price) | | $ | 93.41 | | | $ | 10.78 | |
| CALCULATION OF NET ASSET VALUE PER SHARE – INSTITUTIONAL CLASS: | | | | | | | | |
| Net Assets | | $ | 11,367,730 | | | $ | 20,314,111 | |
| Shares outstanding | | | 114,143 | | | | 1,850,663 | |
| Net asset value per share (offering price and redemption price) | | $ | 99.59 | | | $ | 10.98 | |
| * Each Feeder Fund invests all or generally all its assets directly in the corresponding Master Portfolio. The financial statements for the Master Portfolios, along with the portfolio of investments in securities, are contained elsewhere in this report and should be read in conjunction with the Feeder Funds’ financial statements. |
The accompanying notes are an integral part of these financial statements.
37
KINETICS MUTUAL FUNDS, INC. — THE FUND
Statements of Assets & Liabilities — (Continued)
December 31, 2019
| | | | |
| | The Kinetics | |
| | Spin-off and | |
| | Corporate | |
| | Restructuring | |
| | Fund | |
| | |
| ASSETS: | | | |
Investments, at value(1) | | $ | 21,130,074 | |
| Cash | | | 277,289 | |
| Fund shares sold | | | 77,678 | |
| Dividends and interest receivable | | | 7,888 | |
| Prepaid expenses and other assets | | | 22,872 | |
| Total Assets | | | 21,515,801 | |
| LIABILITIES: | | | | |
| Payable to Adviser | | | 9,850 | |
| Payable to Directors | | | 520 | |
| Payable to Chief Compliance Officer | | | 39 | |
| Payable to custodian | | | 488 | |
| Payable for Fund shares repurchased | | | 9,051 | |
| Payable for shareholder servicing fees | | | 2,127 | |
| Payable for distribution fees | | | 3,361 | |
| Accrued expenses and other liabilities | | | 41,381 | |
| Total Liabilities | | | 66,817 | |
| Net Assets | | $ | 21,448,984 | |
(1) Cost of investments | | $ | 11,813,715 | |
| NET ASSETS CONSIST OF: | | | | |
| Paid in capital | | $ | 12,827,312 | |
| Accumulated earnings | | | 8,621,672 | |
| Net Assets | | $ | 21,448,984 | |
| CALCULATION OF NET ASSET VALUE PER SHARE - NO LOAD CLASS: | | | | |
| Net Assets | | $ | 60,097 | |
| Shares outstanding | | | 4,684 | |
| Net asset value per share (offering price and redemption price) | | $ | 12.83 | |
| CALCULATION OF NET ASSET VALUE PER SHARE - ADVISOR CLASS A: | | | | |
| Net Assets | | $ | 3,574,435 | |
| Shares outstanding | | | 291,888 | |
| Net asset value per share (redemption price) | | $ | 12.25 | |
| Offering price per share ($12.25 divided by .9425) | | $ | 13.00 | |
| CALCULATION OF NET ASSET VALUE PER SHARE - ADVISOR CLASS C: | | | | |
| Net Assets | | $ | 4,063,910 | |
| Shares outstanding | | | 354,184 | |
| Net asset value per share (offering price and redemption price) | | $ | 11.47 | |
| CALCULATION OF NET ASSET VALUE PER SHARE - INSTITUTIONAL CLASS: | | | | |
| Net Assets | | $ | 13,750,542 | |
| Shares outstanding | | | 1,116,436 | |
| Net asset value per share (offering price and redemption price) | | $ | 12.32 | |
The accompanying notes are an integral part of these financial statements.
38
KINETICS MUTUAL FUNDS, INC. — THE FEEDER FUNDS
Statements of Operations
For the Year Ended December 31, 2019
| | | | | | | |
| | The Internet | | | The Global | |
| | Fund | | | Fund | |
| INVESTMENT LOSS ALLOCATED FROM MASTER PORTFOLIOS: | | | | | | |
| Dividends† | | $ | 394,372 | | | $ | 48,873 | |
| Interest | | | 792,773 | | | | 133,871 | |
| Income from securities lending | | | 137,568 | | | | 5,041 | |
| Expenses allocated from Master Portfolio | | | (1,685,392 | ) | | | (213,760 | ) |
| Net investment loss from Master Portfolio | | | (360,679 | ) | | | (25,975 | ) |
| EXPENSES: | | | | | | | | |
| Distribution fees – Advisor Class A | | | 6,883 | | | | 3,229 | |
| Distribution fees – Advisor Class C | | | 8,218 | | | | 37,085 | |
| Shareholder servicing fees – Advisor Class A | | | 6,883 | | | | 3,229 | |
| Shareholder servicing fees – Advisor Class C | | | 2,739 | | | | 12,362 | |
| Shareholder servicing fees – No Load Class | | | 297,332 | | | | 17,968 | |
| Transfer agent fees and expenses | | | 90,126 | | | | 17,538 | |
| Reports to shareholders | | | 29,536 | | | | 3,049 | |
| Administration fees | | | 45,586 | | | | 8,960 | |
| Professional fees | | | 21,326 | | | | 9,922 | |
| Directors’ fees | | | 10,918 | | | | 1,187 | |
| Chief Compliance Officer fees | | | 2,266 | | | | 248 | |
| Registration fees | | | 51,071 | | | | 49,645 | |
| Fund accounting fees | | | 5,407 | | | | 588 | |
| Other expenses | | | 4,792 | | | | 485 | |
| Total expenses | | | 583,083 | | | | 165,495 | |
| Less, expense reimbursement | | | — | | | | (152,355 | ) |
| Net expenses | | | 583,083 | | | | 13,140 | |
| Net investment loss | | | (943,762 | ) | | | (39,115 | ) |
| REALIZED AND UNREALIZED GAIN (LOSS) ON INVESTMENTS | | | | | | | | |
| ALLOCATED FROM MASTER PORTFOLIOS: | | | | | | | | |
| Net realized loss on: | | | | | | | | |
| Investments and foreign currency | | | (1,224,136 | ) | | | (70,328 | ) |
| Net change in unrealized appreciation of: | | | | | | | | |
| Investments and foreign currency | | | 29,302,593 | | | | 2,331,121 | |
| Net gain on investments | | | 28,078,457 | | | | 2,260,793 | |
| Net increase in net assets resulting from operations | | $ | 27,134,695 | | | $ | 2,221,678 | |
| † Net of foreign taxes withheld of: | | $ | 1,099 | | | $ | 2,427 | |
The accompanying notes are an integral part of these financial statements.
39
KINETICS MUTUAL FUNDS, INC. — THE FEEDER FUNDS
Statements of Operations — (Continued)
For the Year Ended December 31, 2019
| | | | | | | |
| | The Paradigm | | | The Medical | |
| | Fund | | | Fund | |
| INVESTMENT INCOME (LOSS) ALLOCATED FROM MASTER PORTFOLIOS: | | | | | | |
| Dividends† | | $ | 4,298,387 | | | $ | 436,064 | |
| Interest | | | 2,413,076 | | | | 2,910 | |
| Income from securities lending | | | 354,822 | | | | 7,801 | |
| Expenses allocated from Master Portfolio | | | (10,325,022 | ) | | | (247,047 | ) |
| Net investment income (loss) from Master Portfolio | | | (3,258,737 | ) | | | 199,728 | |
| EXPENSES: | | | | | | | | |
| Distribution fees – Advisor Class A | | | 283,634 | | | | 3,047 | |
| Distribution fees – Advisor Class C | | | 858,886 | | | | 1,660 | |
| Shareholder servicing fees – Advisor Class A | | | 283,634 | | | | 3,047 | |
| Shareholder servicing fees – Advisor Class C | | | 286,295 | | | | 553 | |
| Shareholder servicing fees – No Load Class | | | 862,414 | | | | 37,372 | |
| Shareholder servicing fees – Institutional Class | | | 380,640 | | | | — | |
| Transfer agent fees and expenses | | | 175,880 | | | | 19,685 | |
| Reports to shareholders | | | 76,279 | | | | 3,807 | |
| Administration fees | | | 275,833 | | | | 8,076 | |
| Professional fees | | | 90,416 | | | | 10,294 | |
| Directors’ fees | | | 68,701 | | | | 1,478 | |
| Chief Compliance Officer fees | | | 14,465 | | | | 313 | |
| Registration fees | | | 92,875 | | | | 50,400 | |
| Fund accounting fees | | | 33,300 | | | | 735 | |
| Other expenses | | | 29,306 | | | | 674 | |
| Total expenses | | | 3,812,558 | | | | 141,141 | |
| Less, expense waiver for Institutional Class shareholder servicing fees | | | (285,480 | ) | | | — | |
| Less, expense reimbursement | | | (572,803 | ) | | | (155,676 | ) |
| Net expenses | | | 2,954,275 | | | | (14,535 | ) |
| Net investment income (loss) | | | (6,213,012 | ) | | | 214,263 | |
| REALIZED AND UNREALIZED GAIN ON INVESTMENTS ALLOCATED | | | | | | | | |
| FROM MASTER PORTFOLIOS: | | | | | | | | |
| Net realized gain on: | | | | | | | | |
| Investments and foreign currency | | | 9,743,514 | | | | 72,699 | |
| Net change in unrealized appreciation of: | | | | | | | | |
| Investments and foreign currency | | | 188,910,352 | | | | 2,139,892 | |
| Net gain on investments | | | 198,653,866 | | | | 2,212,591 | |
| Net increase in net assets resulting from operations | | $ | 192,440,854 | | | $ | 2,426,854 | |
| † Net of foreign taxes withheld of: | | $ | 116,112 | | | $ | 16,187 | |
The accompanying notes are an integral part of these financial statements.
40
KINETICS MUTUAL FUNDS, INC. — THE FEEDER FUNDS
Statements of Operations — (Continued)
For the Year Ended December 31, 2019
| | | | | | | |
| | The Small Cap | | | The Market | |
| | Opportunities
| | | Opportunities | |
| | Fund | | | Fund | |
| | |
| INVESTMENT LOSS ALLOCATED FROM MASTER PORTFOLIOS: | | | | | | |
| Dividends† | | $ | 1,515,434 | | | $ | 374,256 | |
| Interest | | | 1,826,154 | | | | 755,774 | |
| Income from securities lending | | | 55,560 | | | | 28,269 | |
| Expenses allocated from Master Portfolio | | | (3,969,425 | ) | | | (1,161,256 | ) |
| Net investment loss from Master Portfolio | | | (572,277 | ) | | | (2,957 | ) |
| EXPENSES: | | | | | | | | |
| Distribution fees – Advisor Class A | | | 52,541 | | | | 17,875 | |
| Distribution fees – Advisor Class C | | | 76,645 | | | | 74,534 | |
| Shareholder servicing fees – Advisor Class A | | | 52,541 | | | | 17,875 | |
| Shareholder servicing fees – Advisor Class C | | | 25,548 | | | | 24,845 | |
| Shareholder servicing fees – No Load Class | | | 505,635 | | | | 138,168 | |
| Shareholder servicing fees – Institutional Class | | | 116,983 | | | | 22,479 | |
| Transfer agent fees and expenses | | | 65,390 | | | | 32,986 | |
| Reports to shareholders | | | 46,763 | | | | 8,864 | |
| Administration fees | | | 106,290 | | | | 33,855 | |
| Professional fees | | | 41,039 | | | | 18,161 | |
| Directors’ fees | | | 26,569 | | | | 7,524 | |
| Chief Compliance Officer fees | | | 5,689 | | | | 1,575 | |
| Registration fees | | | 87,506 | | | | 61,856 | |
| Fund accounting fees | | | 12,857 | | | | 3,682 | |
| Other expenses | | | 10,860 | | | | 3,098 | |
| Total expenses | | | 1,232,856 | | | | 467,377 | |
| Less, expense waiver for Institutional Class shareholder servicing fees | | | (87,737 | ) | | | (16,859 | ) |
| Less, expense reimbursement | | | (313,853 | ) | | | (371,524 | ) |
| Net expenses | | | 831,266 | | | | 78,994 | |
| Net investment loss | | | (1,403,543 | ) | | | (81,951 | ) |
| REALIZED AND UNREALIZED GAIN (LOSS) ON INVESTMENTS | | | | | | | | |
| ALLOCATED FROM MASTER PORTFOLIOS: | | | | | | | | |
| Net realized loss on: | | | | | | | | |
| Investments and foreign currency | | | (1,522,409 | ) | | | (64,759 | ) |
| Net change in unrealized appreciation of: | | | | | | | | |
| Investments and foreign currency | | | 62,286,980 | | | | 16,276,528 | |
| Net gain on investments | | | 60,764,571 | | | | 16,211,769 | |
| Net increase in net assets resulting from operations | | $ | 59,361,028 | | | $ | 16,129,818 | |
| † Net of foreign taxes withheld of: | | $ | 61,624 | | | $ | 10,035 | |
The accompanying notes are an integral part of these financial statements.
41
KINETICS MUTUAL FUNDS, INC. — THE FEEDER FUNDS
Statements of Operations — (Continued)
For the Year Ended December 31, 2019
| | | | | | | |
| | | | | The Multi- | |
| | The Alternative | | | Disciplinary | |
| | Income | | | Income | |
| | Fund | | | Fund | |
| INVESTMENT INCOME ALLOCATED FROM MASTER PORTFOLIOS: | | | | | | |
| Dividends | | $ | 171,142 | | | $ | 248,870 | |
| Interest | | | 262,281 | | | | 1,743,224 | |
| Income from securities lending | | | — | | | | 55,674 | |
| Expenses allocated from Master Portfolio | | | (209,508 | ) | | | (526,341 | ) |
| Net investment income from Master Portfolio | | | 223,915 | | | | 1,521,427 | |
| EXPENSES: | | | | | | | | |
| Distribution fees – Advisor Class A | | | 2,464 | | | | 6,379 | |
| Distribution fees – Advisor Class C | | | 7,199 | | | | 57,749 | |
| Shareholder servicing fees – Advisor Class A | | | 2,464 | | | | 6,379 | |
| Shareholder servicing fees – Advisor Class C | | | 2,399 | | | | 19,250 | |
| Shareholder servicing fees – No Load Class | | | 10,041 | | | | 14,743 | |
| Shareholder servicing fees – Institutional Class | | | 24,763 | | | | 40,963 | |
| Transfer agent fees and expenses | | | 22,974 | | | | 25,925 | |
| Reports to shareholders | | | 3,888 | | | | 5,031 | |
| Administration fees | | | 9,788 | | | | 16,273 | |
| Professional fees | | | 10,516 | | | | 12,425 | |
| Directors’ fees | | | 1,678 | | | | 3,310 | |
| Chief Compliance Officer fees | | | 356 | | | | 692 | |
| Registration fees | | | 62,365 | | | | 62,975 | |
| Fund accounting fees | | | 837 | | | | 1,652 | |
| Other expenses | | | 778 | | | | 1,550 | |
| Total expenses | | | 162,510 | | | | 275,296 | |
| Less, expense waiver for Institutional Class shareholder servicing fees | | | (18,572 | ) | | | (30,722 | ) |
| Less, expense reimbursement | | | (194,285 | ) | | | (201,964 | ) |
| Net expenses | | | (50,347 | ) | | | 42,610 | |
| Net investment income | | | 274,262 | | | | 1,478,817 | |
| REALIZED AND UNREALIZED GAIN (LOSS) ON INVESTMENTS | | | | | | | | |
| ALLOCATED FROM MASTER PORTFOLIOS: | | | | | | | | |
| Net realized gain (loss) on: | | | | | | | | |
| Investments and foreign currency | | | (117 | ) | | | (15,235 | ) |
| Written option contracts expired or closed | | | 31,453 | | | | — | |
| Net change in unrealized appreciation (depreciation) of: | | | | | | | | |
| Investments and foreign currency | | | 192,690 | | | | 1,760,724 | |
| Written option contracts | | | (26,725 | ) | | | — | |
| Net gain on investments | | | 197,301 | | | | 1,745,489 | |
| Net increase in net assets resulting from operations | | $ | 471,563 | | | $ | 3,224,306 | |
The accompanying notes are an integral part of these financial statements.
42
KINETICS MUTUAL FUNDS, INC. — THE FUND
Statements of Operations — (Continued)
For the Year Ended December 31, 2019
| | | | |
| | The Kinetics | |
| | Spin-off and | |
| | Corporate | |
| | Restructuring | |
| | Fund | |
| INVESTMENT INCOME: | | | |
| Dividends† | | $ | 277,530 | |
| Interest | | | 19,759 | |
| Total investment income | | | 297,289 | |
| EXPENSES: | | | | |
| Distribution fees - Advisor Class A | | | 9,431 | |
| Distribution fees - Advisor Class C | | | 30,875 | |
| Shareholder servicing fees - Advisor Class A | | | 9,431 | |
| Shareholder servicing fees - Advisor Class C | | | 10,292 | |
| Shareholder servicing fees - No Load Class | | | 33 | |
| Shareholder servicing fees - Institutional Class | | | 26,468 | |
| Investment advisory fees | | | 211,365 | |
| Transfer agent fees and expenses | | | 23,259 | |
| Reports to shareholders | | | 3,159 | |
| Administration fees | | | 22,511 | |
| Professional fees | | | 21,032 | |
| Directors’ fees | | | 2,239 | |
| Chief Compliance Officer fees | | | 407 | |
| Registration fees | | | 65,138 | |
| Fund accounting fees | | | 4,950 | |
| Custodian fees and expenses | | | 5,493 | |
| Other expenses | | | 865 | |
| Total expenses | | | 446,948 | |
| Less, expense waiver for Institutional Class shareholder servicing fees | | | (19,851 | ) |
| Less, expense reimbursement | | | (112,267 | ) |
| Net expenses | | | 314,830 | |
| Net investment loss | | | (17,541 | ) |
| REALIZED AND UNREALIZED GAIN (LOSS) ON INVESTMENTS AND FOREIGN CURRENCY: | | | | |
| Net realized loss on: | | | | |
| Investments and foreign currency | | | (11,715 | ) |
| Net change in unrealized appreciation of: | | | | |
| Investments and foreign currency | | | 5,580,320 | |
| Net gain on investments | | | 5,568,605 | |
| Net increase in net assets resulting from operations | | $ | 5,551,064 | |
| † Net of foreign taxes withheld of: | | $ | 3,528 | |
The accompanying notes are an integral part of these financial statements.
43
KINETICS MUTUAL FUNDS, INC. — THE FEEDER FUNDS
Statements of Changes in Net Assets
| | | | | | | | | | | | | |
| | The Internet Fund | | | The Global Fund | |
| | For the | | | For the | | | For the | | | For the | |
| | Year Ended | | | Year Ended | | | Year Ended | | | Year Ended | |
| | December 31, | | | December 31, | | | December 31, | | | December 31, | |
| | 2019 | | | 2018 | | | 2019 | | | 2018 | |
| | |
| OPERATIONS: | | | | | | | | | | | | |
| Net investment loss | | $ | (943,762 | ) | | $ | (1,528,279 | ) | | $ | (39,115 | ) | | $ | (85,713 | ) |
| Net realized gain (loss) on sale of | | | | | | | | | | | | | | | | |
| investments and foreign currency | | | (1,224,136 | ) | | | 32,297,461 | | | | (70,328 | ) | | | (275,998 | ) |
| Net change in unrealized appreciation | | | | | | | | | | | | | | | | |
| (depreciation) of investments and | | | | | | | | | | | | | | | | |
| foreign currency | | | 29,302,593 | | | | (74,911,350 | ) | | | 2,331,121 | | | | (3,290,792 | ) |
| Net increase (decrease) in net assets | | | | | | | | | | | | | | | | |
| resulting from operations | | | 27,134,695 | | | | (44,142,168 | ) | | | 2,221,678 | | | | (3,652,503 | ) |
| DISTRIBUTIONS TO SHAREHOLDERS: | | | | | | | | | | | | | | | | |
| No Load Class (See Note 5) | | | (1,660,688 | ) | | | (29,829,211 | ) | | | — | | | | (4,521 | ) |
| Advisor Class A (See Note 5) | | | (37,323 | ) | | | (761,641 | ) | | | — | | | | (802 | ) |
| Advisor Class C (See Note 5) | | | (17,498 | ) | | | (385,282 | ) | | | — | | | | (3,643 | ) |
| Total distributions to shareholders | | | (1,715,509 | ) | | | (30,976,134 | ) | | | — | | | | (8,966 | ) |
| CAPITAL SHARE TRANSACTIONS — | | | | | | | | | | | | | | | | |
| NO LOAD CLASS: | | | | | | | | | | | | | | | | |
| Proceeds from shares sold | | | 5,270,641 | | | | 15,506,662 | | | | 2,256,422 | | | | 1,114,685 | |
| Redemption fees | | | 8,714 | | | | 71,771 | | | | 745 | | | | 5,543 | |
| Proceeds from shares issued to holders | | | | | | | | | | | | | | | | |
| in reinvestment of dividends | | | 1,624,992 | | | | 29,208,393 | | | | — | | | | 4,459 | |
| Cost of shares redeemed | | | (18,393,908 | ) | | | (32,343,565 | ) | | | (957,402 | ) | | | (2,135,351 | ) |
| Net increase (decrease) in net assets | | | | | | | | | | | | | | | | |
| resulting from capital | | | | | | | | | | | | | | | | |
| share transactions | | | (11,489,561 | ) | | | 12,443,261 | | | | 1,299,765 | | | | (1,010,664 | ) |
| CAPITAL SHARE TRANSACTIONS — | | | | | | | | | | | | | | | | |
| ADVISOR CLASS A: | | | | | | | | | | | | | | | | |
| Proceeds from shares sold | | | 224,346 | | | | 1,208,292 | | | | 230,935 | | | | 160,717 | |
| Redemption fees | | | — | | | | 2,647 | | | | 194 | | | | 75 | |
| Proceeds from shares issued to holders | | | | | | | | | | | | | | | | |
| in reinvestment of dividends | | | 35,088 | | | | 701,010 | | | | — | | | | 733 | |
| Cost of shares redeemed | | | (1,042,186 | ) | | | (1,754,869 | ) | | | (131,383 | ) | | | (336,656 | ) |
| Net increase (decrease) in net assets | | | | | | | | | | | | | | | | |
| resulting from capital | | | | | | | | | | | | | | | | |
| share transactions | | | (782,752 | ) | | | 157,080 | | | | 99,746 | | | | (175,131 | ) |
The accompanying notes are an integral part of these financial statements.
44
KINETICS MUTUAL FUNDS, INC. — THE FEEDER FUNDS
Statements of Changes in Net Assets — (Continued)
| | | | | | | | | | | | | |
| | The Internet Fund | | | The Global Fund | |
| | For the | | | For the | | | For the | | | For the | |
| | Year Ended | | | Year Ended | | | Year Ended | | | Year Ended | |
| | December 31, | | | December 31, | | | December 31, | | | December 31, | |
| | 2019 | | | 2018 | | | 2019 | | | 2018 | |
| | |
| CAPITAL SHARE TRANSACTIONS — | | | | | | | | | | | | |
| ADVISOR CLASS C: | | | | | | | | | | | | |
| Proceeds from shares sold | | $ | 60,875 | | | $ | 617,031 | | | $ | 346,590 | | | $ | 542,381 | |
| Redemption fees | | | — | | | | 673 | | | | — | | | | — | |
| Proceeds from shares issued to holders | | | | | | | | | | | | | | | | |
| in reinvestment of dividends | | | 17,339 | | | | 378,088 | | | | — | | | | 3,544 | |
| Cost of shares redeemed | | | (448,172 | ) | | | (816,194 | ) | | | (514,127 | ) | | | (380,036 | ) |
| Net increase (decrease) in net assets | | | | | | | | | | | | | | | | |
| resulting from capital | | | | | | | | | | | | | | | | |
| share transactions | | | (369,958 | ) | | | 179,598 | | | | (167,537 | ) | | | 165,889 | |
| TOTAL INCREASE (DECREASE) IN | | | | | | | | | | | | | | | | |
| NET ASSETS: | | | 12,776,915 | | | | (62,338,363 | ) | | | 3,453,652 | | | | (4,681,375 | ) |
| NET ASSETS: | | | | | | | | | | | | | | | | |
| Beginning of year | | | 105,813,686 | | | | 168,152,049 | | | | 10,961,352 | | | | 15,642,727 | |
| End of year | | $ | 118,590,601 | | | $ | 105,813,686 | | | $ | 14,415,004 | | | $ | 10,961,352 | |
| CHANGES IN SHARES OUTSTANDING — | | | | | | | | | | | | | | | | |
| NO LOAD CLASS: | | | | | | | | | | | | | | | | |
| Shares sold | | | 149,438 | | | | 312,559 | | | | 335,378 | | | | 160,540 | |
| Shares issued in reinvestments of | | | | | | | | | | | | | | | | |
| dividends and distributions | | | 47,738 | | | | 1,071,144 | | | | — | | | | 815 | |
| Shares redeemed | | | (554,177 | ) | | | (730,044 | ) | | | (150,116 | ) | | | (323,558 | ) |
| Net increase (decrease) in | | | | | | | | | | | | | | | | |
| shares outstanding | | | (357,001 | ) | | | 653,659 | | | | 185,262 | | | | (162,203 | ) |
| CHANGES IN SHARES OUTSTANDING — | | | | | | | | | | | | | | | | |
| ADVISOR CLASS A: | | | | | | | | | | | | | | | | |
| Shares sold | | | 7,075 | | | | 26,425 | | | | 36,555 | | | | 23,309 | |
| Shares issued in reinvestments of | | | | | | | | | | | | | | | | |
| dividends and distributions | | | 1,126 | | | | 27,962 | | | | — | | | | 134 | |
| Shares redeemed | | | (33,444 | ) | | | (40,084 | ) | | | (20,901 | ) | | | (50,489 | ) |
| Net increase (decrease) in | | | | | | | | | | | | | | | | |
| shares outstanding | | | (25,243 | ) | | | 14,303 | | | | 15,654 | | | | (27,046 | ) |
| CHANGES IN SHARES OUTSTANDING — | | | | | | | | | | | | | | | | |
| ADVISOR CLASS C: | | | | | | | | | | | | | | | | |
| Shares sold | | | 2,262 | | | | 14,737 | | | | 54,991 | | | | 84,067 | |
| Shares issued in reinvestments of | | | | | | | | | | | | | | | | |
| dividends and distributions | | | 662 | | | | 17,801 | | | | — | | | | 691 | |
| Shares redeemed | | | (17,043 | ) | | | (24,012 | ) | | | (87,017 | ) | | | (68,137 | ) |
| Net increase (decrease) in | | | | | | | | | | | | | | | | |
| shares outstanding | | | (14,119 | ) | | | 8,526 | | | | (32,026 | ) | | | 16,621 | |
The accompanying notes are an integral part of these financial statements.
45
KINETICS MUTUAL FUNDS, INC. — THE FEEDER FUNDS
Statements of Changes in Net Assets — (Continued)
| | | | | | | | | | | | | |
| | The Paradigm Fund | | | The Medical Fund | |
| | For the | | | For the | | | For the | | | For the | |
| | Year Ended | | | Year Ended | | | Year Ended | | | Year Ended | |
| | December 31, | | | December 31, | | | December 31, | | | December 31, | |
| | 2019 | | | 2018 | | | 2019 | | | 2018 | |
| | |
| OPERATIONS: | | | | | | | | | | | | |
| Net investment income (loss) | | $ | (6,213,012 | ) | | $ | (8,440,870 | ) | | $ | 214,263 | | | $ | 176,963 | |
| Net realized gain on sale of investments | | | | | | | | | | | | | | | | |
| and foreign currency | | | 9,743,514 | | | | 126,256,576 | | | | 72,699 | | | | 1,558,346 | |
| Net change in unrealized appreciation | | | | | | | | | | | | | | | | |
| (depreciation) of investments and | | | | | | | | | | | | | | | | |
| foreign currency | | | 188,910,352 | | | | (161,220,219 | ) | | | 2,139,892 | | | | (1,464,481 | ) |
| Net increase (decrease) in net assets | | | | | | | | | | | | | | | | |
| resulting from operations | | | 192,440,854 | | | | (43,404,513 | ) | | | 2,426,854 | | | | 270,828 | |
| DISTRIBUTIONS TO SHAREHOLDERS: | | | | | | | | | | | | | | | | |
| No Load Class (See Note 5) | | | (3,462,184 | ) | | | (28,537,272 | ) | | | (403,200 | ) | | | (1,297,367 | ) |
| Advisor Class A (See Note 5) | | | (1,174,407 | ) | | | (9,460,887 | ) | | | (27,988 | ) | | | (114,972 | ) |
| Advisor Class C (See Note 5) | | | (1,246,265 | ) | | | (10,598,549 | ) | | | (2,996 | ) | | | (28,691 | ) |
| Institutional Class (See Note 5) | | | (2,393,279 | ) | | | (14,412,154 | ) | | | N/A | | | | N/A | |
| Total distributions to shareholders | | | (8,276,135 | ) | | | (63,008,862 | ) | | | (434,184 | ) | | | (1,441,030 | ) |
| CAPITAL SHARE TRANSACTIONS — | | | | | | | | | | | | | | | | |
| NO LOAD CLASS: | | | | | | | | | | | | | | | | |
| Proceeds from shares sold | | | 20,519,088 | | | | 82,815,246 | | | | 182,053 | | | | 275,511 | |
| Redemption fees | | | 6,123 | | | | 36,638 | | | | 4 | | | | 600 | |
| Proceeds from shares issued to holders | | | | | | | | | | | | | | | | |
| in reinvestment of dividends | | | 3,353,506 | | | | 27,524,795 | | | | 396,772 | | | | 1,275,339 | |
| Cost of shares redeemed | | | (57,909,348 | ) | | | (101,236,433 | ) | | | (1,774,845 | ) | | | (1,751,133 | ) |
| Net increase (decrease) in net assets | | | | | | | | | | | | | | | | |
| resulting from capital | | | | | | | | | | | | | | | | |
| share transactions | | | (34,030,631 | ) | | | 9,140,246 | | | | (1,196,016 | ) | | | (199,683 | ) |
The accompanying notes are an integral part of these financial statements.
46
KINETICS MUTUAL FUNDS, INC. — THE FEEDER FUNDS
Statements of Changes in Net Assets — (Continued)
| | | | | | | | | | | | | |
| | The Paradigm Fund | | | The Medical Fund | |
| | For the | | | For the | | | For the | | | For the | |
| | Year Ended | | | Year Ended | | | Year Ended | | | Year Ended | |
| | December 31, | | | December 31, | | | December 31, | | | December 31, | |
| | 2019 | | | 2018 | | | 2019 | | | 2018 | |
| | |
| CAPITAL SHARE TRANSACTIONS — | | | | | | | | | | | | |
| ADVISOR CLASS A: | | | | | | | | | | | | |
| Proceeds from shares sold | | $ | 21,543,168 | | | $ | 21,835,533 | | | $ | 4,266 | | | $ | 43,479 | |
| Redemption fees | | | 446 | | | | 435 | | | | — | | | | — | |
| Proceeds from shares issued to holders | | | | | | | | | | | | | | | | |
| in reinvestment of dividends | | | 1,049,968 | | | | 8,391,508 | | | | 25,639 | | | | 106,203 | |
| Cost of shares redeemed | | | (29,606,020 | ) | | | (26,515,410 | ) | | | (353,673 | ) | | | (1,718,121 | ) |
| Net increase (decrease) in net assets | | | | | | | | | | | | | | | | |
| resulting from capital | | | | | | | | | | | | | | | | |
| share transactions | | | (7,012,438 | ) | | | 3,712,066 | | | | (323,768 | ) | | | (1,568,439 | ) |
| CAPITAL SHARE TRANSACTIONS — | | | | | | | | | | | | | | | | |
| ADVISOR CLASS C: | | | | | | | | | | | | | | | | |
| Proceeds from shares sold | | | 3,856,068 | | | | 4,108,371 | | | | 222 | | | | 6,203 | |
| Redemption fees | | | 419 | | | | 233 | | | | — | | | | — | |
| Proceeds from shares issued to holders | | | | | | | | | | | | | | | | |
| in reinvestment of dividends | | | 1,161,370 | | | | 9,940,055 | | | | 2,751 | | | | 17,314 | |
| Cost of shares redeemed | | | (20,255,099 | ) | | | (15,531,853 | ) | | | (181,358 | ) | | | (60,909 | ) |
| Net decrease in net assets resulting | | | | | | | | | | | | | | | | |
| from capital share transactions | | | (15,237,242 | ) | | | (1,483,194 | ) | | | (178,385 | ) | | | (37,392 | ) |
| CAPITAL SHARE TRANSACTIONS — | | | | | | | | | | | | | | | | |
| INSTITUTIONAL CLASS: | | | | | | | | | | | | | | | | |
| Proceeds from shares sold | | | 43,225,437 | | | | 55,326,340 | | | | N/A | | | | N/A | |
| Redemption fees | | | 17,598 | | | | 667 | | | | N/A | | | | N/A | |
| Proceeds from shares issued to holders | | | | | | | | | | | | | | | | |
| in reinvestment of dividends | | | 1,981,530 | | | | 12,639,473 | | | | N/A | | | | N/A | |
| Cost of shares redeemed | | | (36,627,967 | ) | | | (104,577,445 | ) | | | N/A | | | | N/A | |
| Net increase (decrease) in net assets | | | | | | | | | | | | | | | | |
| resulting from capital | | | | | | | | | | | | | | | | |
| share transactions | | | 8,596,598 | | | | (36,610,965 | ) | | | N/A | | | | N/A | |
| TOTAL INCREASE (DECREASE) IN | | | | | | | | | | | | | | | | |
| NET ASSETS: | | | 136,481,006 | | | | (131,655,222 | ) | | | 294,501 | | | | (2,975,716 | ) |
| NET ASSETS: | | | | | | | | | | | | | | | | |
| Beginning of year | | | 643,178,667 | | | | 774,833,889 | | | | 16,453,499 | | | | 19,429,215 | |
| End of year | | $ | 779,659,673 | | | $ | 643,178,667 | | | $ | 16,748,000 | | | $ | 16,453,499 | |
| CHANGES IN SHARES OUTSTANDING — | | | | | | | | | | �� | | | | | | |
| NO LOAD CLASS: | | | | | | | | | | | | | | | | |
| Shares sold | | | 410,154 | | | | 1,519,083 | | | | 7,386 | | | | 10,660 | |
| Shares issued in reinvestments of | | | | | | | | | | | | | | | | |
| dividends and distributions | | | 62,635 | | | | 666,945 | | | | 14,984 | | | | 55,235 | |
| Shares redeemed | | | (1,158,087 | ) | | | (1,993,617 | ) | | | (71,613 | ) | | | (68,554 | ) |
| Net increase (decrease) in | | | | | | | | | | | | | | | | |
| shares outstanding | | | (685,298 | ) | | | 192,411 | | | | (49,243 | ) | | | (2,659 | ) |
The accompanying notes are an integral part of these financial statements.
47
KINETICS MUTUAL FUNDS, INC. — THE FEEDER FUNDS
Statements of Changes in Net Assets — (Continued)
| | | | | | | | | | | | | |
| | The Paradigm Fund | | | The Medical Fund | |
| | For the | | | For the | | | For the | | | For the | |
| | Year Ended | | | Year Ended | | | Year Ended | | | Year Ended | |
| | December 31, | | | December 31, | | | December 31, | | | December 31, | |
| | 2019 | | | 2018 | | | 2019 | | | 2018 | |
| | |
| CHANGES IN SHARES OUTSTANDING — | | | | | | | | | | | | |
| ADVISOR CLASS A: | | | | | | | | | | | | |
| Shares sold | | | 437,515 | | | | 412,429 | | | | 180 | | | | 1,803 | |
| Shares issued in reinvestments of | | | | | | | | | | | | | | | | |
| dividends and distributions | | | 20,345 | | | | 210,314 | | | | 1,011 | | | | 4,797 | |
| Shares redeemed | | | (602,916 | ) | | | (530,967 | ) | | | (15,103 | ) | | | (70,696 | ) |
| Net increase (decrease) in | | | | | | | | | | | | | | | | |
| shares outstanding | | | (145,056 | ) | | | 91,776 | | | | (13,912 | ) | | | (64,096 | ) |
| CHANGES IN SHARES OUTSTANDING — | | | | | | | | | | | | | | | | |
| ADVISOR CLASS C: | | | | | | | | | | | | | | | | |
| Shares sold | | | 83,907 | | | | 83,476 | | | | 9 | | | | 261 | |
| Shares issued in reinvestments of | | | | | | | | | | | | | | | | |
| dividends and distributions | | | 24,363 | | | | 268,071 | | | | 112 | | | | 811 | |
| Shares redeemed | | | (438,684 | ) | | | (328,265 | ) | | | (7,986 | ) | | | (2,576 | ) |
| Net increase (decrease) in | | | | | | | | | | | | | | | | |
| shares outstanding | | | (330,414 | ) | | | 23,282 | | | | (7,865 | ) | | | (1,504 | ) |
| CHANGES IN SHARES OUTSTANDING — | | | | | | | | | | | | | | | | |
| INSTITUTIONAL CLASS: | | | | | | | | | | | | | | | | |
| Shares sold | | | 862,820 | | | | 1,056,356 | | | | N/A | | | | N/A | |
| Shares issued in reinvestments of | | | | | | | | | | | | | | | | |
| dividends and distributions | | | 36,681 | | | | 303,541 | | | | N/A | | | | N/A | |
| Shares redeemed | | | (716,053 | ) | | | (2,078,833 | ) | | | N/A | | | | N/A | |
| Net increase (decrease) in | | | | | | | | | | | | | | | | |
| shares outstanding | | | 183,448 | | | | (718,936 | ) | | | N/A | | | | N/A | |
The accompanying notes are an integral part of these financial statements.
48
KINETICS MUTUAL FUNDS, INC. — THE FEEDER FUNDS
Statements of Changes in Net Assets — (Continued)
| | | | | | | | | | | | | |
| | The Small Cap | | | The Market | |
| | Opportunities Fund | | | Opportunities Fund | |
| | For the | | | For the | | | For the | | | For the | |
| | Year Ended | | | Year Ended | | | Year Ended | | | Year Ended | |
| | December 31, | | | December 31, | | | December 31, | | | December 31, | |
| | 2019 | | | 2018 | | | 2019 | | | 2018 | |
| | |
| OPERATIONS: | | | | | | | | | | | | |
| Net investment loss | | $ | (1,403,543 | ) | | $ | (1,690,146 | ) | | $ | (81,951 | ) | | $ | (515,996 | ) |
| Net realized gain (loss) on sale of | | | | | | | | | | | | | | | | |
| investments and foreign currency | | | (1,522,409 | ) | | | 1,459,768 | | | | (64,759 | ) | | | 3,265,471 | |
| Net change in unrealized appreciation | | | | | | | | | | | | | | | | |
| (depreciation) of investments and | | | | | | | | | | | | | | | | |
| foreign currency | | | 62,286,980 | | | | (7,770,718 | ) | | | 16,276,528 | | | | (12,163,458 | ) |
| Net increase (decrease) in net assets | | | | | | | | | | | | | | | | |
| resulting from operations | | | 59,361,028 | | | | (8,001,096 | ) | | | 16,129,818 | | | | (9,413,983 | ) |
| DISTRIBUTIONS TO SHAREHOLDERS: | | | | | | | | | | | | | | | | |
| No Load Class (See Note 5) | | | — | | | | — | | | | (189,407 | ) | | | (4,071,130 | ) |
| Advisor Class A (See Note 5) | | | — | | | | — | | | | (4,687 | ) | | | (550,627 | ) |
| Advisor Class C (See Note 5) | | | — | | | | — | | | | — | | | | (756,822 | ) |
| Institutional Class (See Note 5) | | | — | | | | — | | | | (65,460 | ) | | | (797,447 | ) |
| Total distributions to shareholders | | | — | | | | — | | | | (259,554 | ) | | | (6,176,026 | ) |
| CAPITAL SHARE TRANSACTIONS — | | | | | | | | | | | | | | | | |
| NO LOAD CLASS: | | | | | | | | | | | | | | | | |
| Proceeds from shares sold | | | 85,965,444 | | | | 143,962,162 | | | | 3,345,164 | | | | 11,158,690 | |
| Redemption fees | | | 12,776 | | | | 105,311 | | | | 6,039 | | | | 22,294 | |
| Proceeds from shares issued to holders | | | | | | | | | | | | | | | | |
| in reinvestment of dividends | | | — | | | | — | | | | 188,418 | | | | 4,049,701 | |
| Cost of shares redeemed | | | (112,344,511 | ) | | | (107,174,264 | ) | | | (5,586,777 | ) | | | (7,907,108 | ) |
| Net increase (decrease) in net assets | | | | | | | | | | | | | | | | |
| resulting from capital | | | | | | | | | | | | | | | | |
| share transactions | | | (26,366,291 | ) | | | 36,893,209 | | | | (2,047,156 | ) | | | 7,323,577 | |
The accompanying notes are an integral part of these financial statements.
49
KINETICS MUTUAL FUNDS, INC. — THE FEEDER FUNDS
Statements of Changes in Net Assets — (Continued)
| | | | | | | | | | | | | |
| | The Small Cap | | | The Market | |
| | Opportunities Fund | | | Opportunities Fund | |
| | For the | | | For the | | | For the | | | For the | |
| | Year Ended | | | Year Ended | | | Year Ended | | | Year Ended | |
| | December 31, | | | December 31, | | | December 31, | | | December 31, | |
| | 2019 | | | 2018 | | | 2019 | | | 2018 | |
| | |
| CAPITAL SHARE TRANSACTIONS — | | | | | | | | | | | | |
| ADVISOR CLASS A: | | | | | | | | | | | | |
| Proceeds from shares sold | | $ | 22,994,981 | | | $ | 10,894,936 | | | $ | 844,247 | | | $ | 2,608,472 | |
| Redemption fees | | | 437 | | | | 42 | | | | — | | | | 1,069 | |
| Proceeds from shares issued to holders | | | | | | | | | | | | | | | | |
| in reinvestment of dividends | | | — | | | | — | | | | 4,056 | | | | 488,996 | |
| Cost of shares redeemed | | | (24,146,901 | ) | | | (11,614,360 | ) | | | (1,786,138 | ) | | | (2,750,126 | ) |
| Net increase (decrease) in net assets | | | | | | | | | | | | | | | | |
| resulting from capital | | | | | | | | | | | | | | | | |
| share transactions | | | (1,151,483 | ) | | | (719,382 | ) | | | (937,835 | ) | | | 348,411 | |
| CAPITAL SHARE TRANSACTIONS — | | | | | | | | | | | | | | | | |
| ADVISOR CLASS C: | | | | | | | | | | | | | | | | |
| Proceeds from shares sold | | | 2,459,311 | | | | 2,267,642 | | | | 770,063 | | | | 2,488,206 | |
| Redemption fees | | | — | | | | 61 | | | | — | | | | — | |
| Proceeds from shares issued to holders | | | | | | | | | | | | | | | | |
| in reinvestment of dividends | | | — | | | | — | | | | — | | | | 710,825 | |
| Cost of shares redeemed | | | (2,527,500 | ) | | | (1,950,729 | ) | | | (1,093,490 | ) | | | (898,991 | ) |
| Net increase (decrease) in net assets | | | | | | | | | | | | | | | | |
| resulting from capital | | | | | | | | | | | | | | | | |
| share transactions | | | (68,189 | ) | | | 316,974 | | | | (323,427 | ) | | | 2,300,040 | |
| CAPITAL SHARE TRANSACTIONS — | | | | | | | | | | | | | | | | |
| INSTITUTIONAL CLASS: | | | | | | | | | | | | | | | | |
| Proceeds from shares sold | | | 28,923,360 | | | | 59,836,127 | | | | 2,934,130 | | | | 4,583,098 | |
| Redemption fees | | | 550 | | | | 194 | | | | 50 | | | | 3,077 | |
| Proceeds from shares issued to holders | | | | | | | | | | | | | | | | |
| in reinvestment of dividends | | | — | | | | — | | | | 61,881 | | | | 772,205 | |
| Cost of shares redeemed | | | (14,417,845 | ) | | | (46,387,833 | ) | | | (2,020,391 | ) | | | (4,061,116 | ) |
| Net increase in net assets resulting | | | | | | | | | | | | | | | | |
| from capital share transactions | | | 14,506,065 | | | | 13,448,488 | | | | 975,670 | | | | 1,297,264 | |
| TOTAL INCREASE (DECREASE) IN | | | | | | | | | | | | | | | | |
NET ASSETS: | | | 46,281,130 | | | | 41,938,193 | | | | 13,537,516 | | | | (4,320,717 | ) |
| NET ASSETS: | | | | | | | | | | | | | | | | |
| Beginning of year | | | 223,282,889 | | | | 181,344,696 | | | | 72,901,262 | | | | 77,221,979 | |
| End of year | | $ | 269,564,019 | | | $ | 223,282,889 | | | $ | 86,438,778 | | | $ | 72,901,262 | |
The accompanying notes are an integral part of these financial statements.
50
KINETICS MUTUAL FUNDS, INC. — THE FEEDER FUNDS
Statements of Changes in Net Assets — (Continued)
| | | | | | | | | | | | | |
| | The Small Cap | | | The Market | |
| | Opportunities Fund | | | Opportunities Fund | |
| | For the | | | For the | | | For the | | | For the | |
| | Year Ended | | | Year Ended | | | Year Ended | | | Year Ended | |
| | December 31, | | | December 31, | | | December 31, | | | December 31, | |
| | 2019 | | | 2018 | | | 2019 | | | 2018 | |
| | |
| CHANGES IN SHARES OUTSTANDING — | | | | | | | | | | | | |
| NO LOAD CLASS: | | | | | | | | | | | | |
| Shares sold | | | 1,418,304 | | | | 2,475,834 | | | | 128,868 | | | | 409,732 | |
| Shares issued in reinvestments of | | | | | | | | | | | | | | | | |
| dividends and distributions | | | — | | | | — | | | | 7,028 | | | | 184,918 | |
| Shares redeemed | | | (1,850,216 | ) | | | (1,892,831 | ) | | | (223,066 | ) | | | (293,818 | ) |
| Net increase (decrease) in | | | | | | | | | | | | | | | | |
| shares outstanding | | | (431,912 | ) | | | 583,003 | | | | (87,170 | ) | | | 300,832 | |
| CHANGES IN SHARES OUTSTANDING — | | | | | | | | | | | | | | | | |
| ADVISOR CLASS A: | | | | | | | | | | | | | | | | |
| Shares sold | | | 391,959 | | | | 181,646 | | | | 33,361 | | | | 96,994 | |
| Shares issued in reinvestments of | | | | | | | | | | | | | | | | |
| dividends and distributions | | | — | | | | — | | | | 154 | | | | 22,681 | |
| Shares redeemed | | | (412,993 | ) | | | (206,344 | ) | | | (71,286 | ) | | | (106,854 | ) |
| Net increase (decrease) in | | | | | | | | | | | | | | | | |
| shares outstanding | | | (21,034 | ) | | | (24,698 | ) | | | (37,771 | ) | | | 12,821 | |
| CHANGES IN SHARES OUTSTANDING — | | | | | | | | | | | | | | | | |
| ADVISOR CLASS C: | | | | | | | | | | | | | | | | |
| Shares sold | | | 44,115 | | | | 42,783 | | | | 32,048 | | | | 95,868 | |
| Shares issued in reinvestments of | | | | | | | | | | | | | | | | |
| dividends and distributions | | | — | | | | — | | | | — | | | | 34,389 | |
| Shares redeemed | | | (44,344 | ) | | | (36,924 | ) | | | (44,969 | ) | | | (35,654 | ) |
| Net increase (decrease) in | | | | | | | | | | | | | | | | |
| shares outstanding | | | (229 | ) | | | 5,859 | | | | (12,921 | ) | | | 94,603 | |
| CHANGES IN SHARES OUTSTANDING — | | | | | | | | | | | | | | | | |
| INSTITUTIONAL CLASS: | | | | | | | | | | | | | | | | |
| Shares sold | | | 467,046 | | | | 1,013,611 | | | | 111,877 | | | | 164,990 | |
| Shares issued in reinvestments of | | | | | | | | | | | | | | | | |
| dividends and distributions | | | — | | | | — | | | | 2,273 | | | | 34,737 | |
| Shares redeemed | | | (235,088 | ) | | | (775,830 | ) | | | (79,224 | ) | | | (150,570 | ) |
| Net increase in shares outstanding | | | 231,958 | | | | 237,781 | | | | 34,926 | | | | 49,157 | |
The accompanying notes are an integral part of these financial statements.
51
KINETICS MUTUAL FUNDS, INC. — THE FEEDER FUNDS
Statements of Changes in Net Assets — (Continued)
| | | | | | | | | | | | | |
| | The Alternative | | | The Multi- | |
| | Income Fund | | | Disciplinary Income Fund | |
| | For the | | | For the | | | For the | | | For the | |
| | Year Ended | | | Year Ended | | | Year Ended | | | Year Ended | |
| | December 31, | | | December 31, | | | December 31, | | | December 31, | |
| | 2019 | | | 2018 | | | 2019 | | | 2018 | |
| | |
| OPERATIONS: | | | | | | | | | | | | |
| Net investment income | | $ | 274,262 | | | $ | 212,204 | | | $ | 1,478,817 | | | $ | 1,740,685 | |
| Net realized gain (loss) on sale of | | | | | | | | | | | | | | | | |
| investments, foreign currency and | | | | | | | | | | | | | | | | |
| written options | | | 31,336 | | | | 12,211 | | | | (15,235 | ) | | | (106,042 | ) |
| Net change in unrealized appreciation | | | | | | | | | | | | | | | | |
| (depreciation) of investments, | | | | | | | | | | | | | | | | |
| foreign currency and | | | | | | | | | | | | | | | | |
| written options | | | 165,965 | | | | (52,473 | ) | | | 1,760,724 | | | | (2,045,258 | ) |
| Net increase (decrease) in net assets | | | | | | | | | | | | | | | | |
| resulting from operations | | | 471,563 | | | | 171,942 | | | | 3,224,306 | | | | (410,615 | ) |
| DISTRIBUTIONS TO SHAREHOLDERS: | | | | | | | | | | | | | | | | |
| No Load Class (See Note 5) | | | (62,862 | ) | | | (43,839 | ) | | | (244,012 | ) | | | (279,550 | ) |
| Advisor Class A (See Note 5) | | | (13,082 | ) | | | (7,366 | ) | | | (94,067 | ) | | | (135,583 | ) |
| Advisor Class C (See Note 5) | | | (8,243 | ) | | | (2,517 | ) | | | (258,173 | ) | | | (274,465 | ) |
| Institutional Class (See Note 5) | | | (218,994 | ) | | | (157,514 | ) | | | (880,291 | ) | | | (1,052,523 | ) |
| Total distributions to shareholders | | | (303,181 | ) | | | (211,236 | ) | | | (1,476,543 | ) | | | (1,742,121 | ) |
| CAPITAL SHARE TRANSACTIONS — | | | | | | | | | | | | | | | | |
| NO LOAD CLASS: | | | | | | | | | | | | | | | | |
| Proceeds from shares sold | | | 356,721 | | | | 1,775,799 | | | | 920,806 | | | | 1,580,972 | |
| Redemption fees | | | — | | | | 693 | | | | 1 | | | | — | |
| Proceeds from shares issued to holders | | | | | | | | | | | | | | | | |
| in reinvestment of dividends | | | 55,029 | | | | 38,990 | | | | 237,006 | | | | 269,844 | |
| Cost of shares redeemed | | | (1,232,243 | ) | | | (2,508,132 | ) | | | (1,540,353 | ) | | | (2,346,967 | ) |
| Net decrease in net assets resulting | | | | | | | | | | | | | | | | |
| from capital | | | | | | | | | | | | | | | | |
| share transactions | | | (820,493 | ) | | | (692,650 | ) | | | (382,540 | ) | | | (496,151 | ) |
The accompanying notes are an integral part of these financial statements.
52
KINETICS MUTUAL FUNDS, INC. — THE FEEDER FUNDS
Statements of Changes in Net Assets — (Continued)
| | | | | | | | | | | | | |
| | The Alternative | | | The Multi- | |
| | Income Fund | | | Disciplinary Income Fund | |
| | For the | | | For the | | | For the | | | For the | |
| | Year Ended | | | Year Ended | | | Year Ended | | | Year Ended | |
| | December 31, | | | December 31, | | | December 31, | | | December 31, | |
| | 2019 | | | 2018 | | | 2019 | | | 2018 | |
| CAPITAL SHARE TRANSACTIONS — | | | | | | | | | | | | |
| ADVISOR CLASS A: | | | | | | | | | | | | |
| Proceeds from shares sold | | | 319,008 | | | | 200,164 | | | | 105,243 | | | | 740,005 | |
| Proceeds from shares issued to holders | | | | | | | | | | | | | | | | |
| in reinvestment of dividends | | | 12,567 | | | | 7,098 | | | | 81,281 | | | | 120,015 | |
| Cost of shares redeemed | | | (416,587 | ) | | | (769,557 | ) | | | (1,280,504 | ) | | | (2,516,680 | ) |
| Net decrease in net assets resulting | | | | | | | | | | | | | | | | |
| from capital share transactions | | | (85,012 | ) | | | (562,295 | ) | | | (1,093,980 | ) | | | (1,656,660 | ) |
| CAPITAL SHARE TRANSACTIONS — | | | | | | | | | | | | | | | | |
| ADVISOR CLASS C: | | | | | | | | | | | | | | | | |
| Proceeds from shares sold | | | — | | | | 100,725 | | | | 295,850 | | | | 2,550,446 | |
| Proceeds from shares issued to holders | | | | | | | | | | | | | | | | |
| in reinvestment of dividends | | | 7,626 | | | | 2,361 | | | | 221,021 | | | | 240,821 | |
| Cost of shares redeemed | | | (412,199 | ) | | | (506,070 | ) | | | (1,778,627 | ) | | | (1,640,422 | ) |
| Net increase (decrease) in net assets | | | | | | | | | | | | | | | | |
| resulting from capital | | | | | | | | | | | | | | | | |
| share transactions | | | (404,573 | ) | | | (402,984 | ) | | | (1,261,756 | ) | | | 1,150,845 | |
| CAPITAL SHARE TRANSACTIONS — | | | | | | | | | | | | | | | | |
| INSTITUTIONAL CLASS: | | | | | | | | | | | | | | | | |
| Proceeds from shares sold | | | 2,070,884 | | | | 2,595,166 | | | | 1,913,614 | | | | 4,284,382 | |
| Redemption fees | | | 59 | | | | 21 | | | | — | | | | — | |
| Proceeds from shares issued to holders | | | | | | | | | | | | | | | | |
| in reinvestment of dividends | | | 218,911 | | | | 157,456 | | | | 874,052 | | | | 1,044,349 | |
| Cost of shares redeemed | | | (3,754,308 | ) | | | (5,023,911 | ) | | | (4,014,227 | ) | | | (13,935,784 | ) |
| Net decrease in net assets resulting | | | | | | | | | | | | | | | | |
| from capital share transactions | | | (1,464,454 | ) | | | (2,271,268 | ) | | | (1,226,561 | ) | | | (8,607,053 | ) |
TOTAL DECREASE IN NET ASSETS: | | | (2,606,150 | ) | | | (3,968,491 | ) | | | (2,217,074 | ) | | | (11,761,755 | ) |
| NET ASSETS: | | | | | | | | | | | | | | | | |
| Beginning of year | | | 19,022,589 | | | | 22,991,080 | | | | 37,239,121 | | | | 49,000,876 | |
| End of year | | $ | 16,416,439 | | | $ | 19,022,589 | | | $ | 35,022,047 | | | $ | 37,239,121 | |
The accompanying notes are an integral part of these financial statements.
53
KINETICS MUTUAL FUNDS, INC. — THE FEEDER FUNDS
Statements of Changes in Net Assets — (Continued)
| | | | | | | | | | | | | |
| | The Alternative | | | The Multi- | |
| | Income Fund | | | Disciplinary Income Fund | |
| | For the | | | For the | | | For the | | | For the | |
| | Year Ended | | | Year Ended | | | Year Ended | | | Year Ended | |
| | December 31, | | | December 31, | | | December 31, | | | December 31, | |
| | 2019 | | | 2018 | | | 2019 | | | 2018 | |
| | |
| CHANGES IN SHARES OUTSTANDING — | | | | | | | | | | | | |
| NO LOAD CLASS: | | | | | | | | | | | | |
| Shares sold | | | 3,638 | | | | 18,217 | | | | 84,261 | | | | 144,240 | |
| Shares issued in reinvestments of | | | | | | | | | | | | | | | | |
| dividends and distributions | | | 560 | | | | 401 | | | | 21,719 | | | | 25,153 | |
| Shares redeemed | | | (12,537 | ) | | | (25,771 | ) | | | (142,619 | ) | | | (215,707 | ) |
| Net decrease in shares outstanding | | | (8,339 | ) | | | (7,153 | ) | | | (36,639 | ) | | | (46,314 | ) |
| CHANGES IN SHARES OUTSTANDING — | | | | | | | | | | | | | | | | |
| ADVISOR CLASS A: | | | | | | | | | | | | | | | | |
| Shares sold | | | 3,292 | | | | 2,079 | | | | 9,643 | | | | 67,860 | |
| Shares issued in reinvestments of | | | | | | | | | | | | | | | | |
| dividends and distributions | | | 130 | | | | 74 | | | | 7,489 | | | | 11,231 | |
| Shares redeemed | | | (4,290 | ) | | | (8,043 | ) | | | (117,437 | ) | | | (232,124 | ) |
| Net decrease in shares outstanding | | | (868 | ) | | | (5,890 | ) | | | (100,305 | ) | | | (153,033 | ) |
| CHANGES IN SHARES OUTSTANDING — | | | | | | | | | | | | | | | | |
| ADVISOR CLASS C: | | | | | | | | | | | | | | | | |
| Shares sold | | | — | | | | 1,088 | | | | 27,584 | | | | 237,920 | |
| Shares issued in reinvestments of | | | | | | | | | | | | | | | | |
| dividends and distributions | | | 82 | | | | 25 | | | | 20,594 | | | | 22,803 | |
| Shares redeemed | | | (4,417 | ) | | | (5,485 | ) | | | (165,068 | ) | | | (153,690 | ) |
| Net increase (decrease) in | | | | | | | | | | | | | | | | |
| shares outstanding | | | (4,335 | ) | | | (4,372 | ) | | | (116,890 | ) | | | 107,033 | |
| CHANGES IN SHARES OUTSTANDING — | | | | | | | | | | | | | | | | |
| INSTITUTIONAL CLASS: | | | | | | | | | | | | | | | | |
| Shares sold | | | 20,813 | | | | 26,221 | | | | 174,341 | | | | 391,889 | |
| Shares issued in reinvestments of | | | | | | | | | | | | | | | | |
| dividends and distributions | | | 2,200 | | | | 1,595 | | | | 79,936 | | | | 97,116 | |
| Shares redeemed | | | (37,681 | ) | | | (50,795 | ) | | | (366,699 | ) | | | (1,279,794 | ) |
| Net decrease in shares outstanding | | | (14,668 | ) | | | (22,979 | ) | | | (112,422 | ) | | | (790,789 | ) |
The accompanying notes are an integral part of these financial statements.
54
KINETICS MUTUAL FUNDS, INC. — THE FUND
Statements of Changes in Net Assets — (Continued)
| | | | | | | |
| | The Kinetics Spin-off and | |
| | Corporate Restructuring Fund | |
| | For the | | | For the | |
| | Year Ended | | | Year Ended | |
| | December 31, | | | December 31, | |
| | 2019 | | | 2018 | |
| OPERATIONS: | | | | | | |
| Net investment loss | | $ | (17,541 | ) | | $ | (166,846 | ) |
| Net realized loss on sale of investments and foreign currency | | | (11,715 | ) | | | (117,499 | ) |
| Net change in unrealized appreciation (depreciation) of investments | | | 5,580,320 | | | | (1,246,793 | ) |
| Net increase (decrease) in net assets resulting from operations | | | 5,551,064 | | | | (1,531,138 | ) |
| DISTRIBUTIONS TO SHAREHOLDERS: | | | | | | | | |
| No Load Class (See Note 5) | | | — | | | | (506 | ) |
| Advisor Class A (See Note 5) | | | — | | | | (153,489 | ) |
| Advisor Class C (See Note 5) | | | — | | | | (201,832 | ) |
| Institutional Class (See Note 5) | | | (12,075 | ) | | | (525,309 | ) |
| Total distributions to shareholders | | | (12,075 | ) | | | (881,136 | ) |
| CAPITAL SHARE TRANSACTIONS — NO LOAD CLASS: | | | | | | | | |
| Proceeds from shares sold | | | 47,677 | | | | 2,600 | |
| Proceeds from shares issued to holders in reinvestment of dividends | | | — | | | | 506 | |
| Cost of shares redeemed | | | (2,356 | ) | | | — | |
| Net increase in net assets resulting from capital share transactions | | | 45,321 | | | | 3,106 | |
| CAPITAL SHARE TRANSACTIONS — ADVISOR CLASS A: | | | | | | | | |
| Proceeds from shares sold | | | 458,418 | | | | 83,577 | |
| Proceeds from shares issued to holders in reinvestment of dividends | | | — | | | | 149,160 | |
| Cost of shares redeemed | | | (1,143,509 | ) | | | (823,693 | ) |
| Net decrease in net assets resulting from capital share transactions | | | (685,091 | ) | | | (590,956 | ) |
| CAPITAL SHARE TRANSACTIONS — ADVISOR CLASS C: | | | | | | | | |
| Proceeds from shares sold | | | 21,995 | | | | 40,259 | |
| Proceeds from shares issued to holders in reinvestment of dividends | | | — | | | | 201,572 | |
| Cost of shares redeemed | | | (1,213,923 | ) | | | (1,087,034 | ) |
| Net decrease in net assets resulting from capital share transactions | | | (1,191,928 | ) | | | (845,203 | ) |
| CAPITAL SHARE TRANSACTIONS — INSTITUTIONAL CLASS: | | | | | | | | |
| Proceeds from shares sold | | | 294,903 | | | | 300,943 | |
| Proceeds from shares issued to holders in reinvestment of dividends | | | 10,093 | | | | 442,957 | |
| Cost of shares redeemed | | | (1,281,766 | ) | | | (2,088,988 | ) |
| Net decrease in net assets resulting from capital share transactions | | | (976,770 | ) | | | (1,345,088 | ) |
| TOTAL INCREASE (DECREASE) IN NET ASSETS: | | | 2,730,521 | | | | (5,190,415 | ) |
| NET ASSETS: | | | | | | | | |
| Beginning of year | | | 18,718,463 | | | | 23,908,878 | |
| End of year | | $ | 21,448,984 | | | $ | 18,718,463 | |
The accompanying notes are an integral part of these financial statements.
55
KINETICS MUTUAL FUNDS, INC. — THE FUND
Statements of Changes in Net Assets — (Continued)
| | | | | | | |
| | The Kinetics Spin-off and | |
| | Corporate Restructuring Fund | |
| | For the | | | For the | |
| | Year Ended | | | Year Ended | |
| | December 31, | | | December 31, | |
| | 2019 | | | 2018 | |
| CHANGES IN SHARES OUTSTANDING — NO LOAD CLASS: | | | | | | |
| Shares sold | | | 3,716 | | | | 195 | |
| Shares issued in reinvestments of dividends and distributions | | | — | | | | 52 | |
| Shares redeemed | | | (204 | ) | | | — | |
| Net increase in shares outstanding | | | 3,512 | | | | 247 | |
| CHANGES IN SHARES OUTSTANDING — ADVISOR CLASS A: | | | | | | | | |
| Shares sold | | | 40,907 | | | | 6,872 | |
| Shares issued in reinvestments of dividends and distributions | | | — | | | | 16,073 | |
| Shares redeemed | | | (103,228 | ) | | | (73,949 | ) |
| Net decrease in shares outstanding | | | (62,321 | ) | | | (51,004 | ) |
| CHANGES IN SHARES OUTSTANDING — ADVISOR CLASS C: | | | | | | | | |
| Shares sold | | | 2,038 | | | | 3,328 | |
| Shares issued in reinvestments of dividends and distributions | | | — | | | | 23,010 | |
| Shares redeemed | | | (115,131 | ) | | | (102,216 | ) |
| Net decrease in shares outstanding | | | (113,093 | ) | | | (75,878 | ) |
| CHANGES IN SHARES OUTSTANDING — INSTITUTIONAL CLASS: | | | | | | | | |
| Shares sold | | | 25,013 | | | | 25,225 | |
| Shares issued in reinvestments of dividends and distributions | | | 818 | | | | 47,528 | |
| Shares redeemed | | | (115,107 | ) | | | (182,315 | ) |
| Net decrease in shares outstanding | | | (89,276 | ) | | | (109,562 | ) |
The accompanying notes are an integral part of these financial statements.
56
KINETICS MUTUAL FUNDS, INC. — THE FEEDER FUNDS
Notes to Financial Statements
December 31, 2019
1. Organization
Kinetics Mutual Funds, Inc. (the “Company”) is registered under the Investment Company Act of 1940, as amended (the “1940 Act”), and is incorporated in the State of Maryland. The Company is an open-end management investment company issuing its shares in series. One billion shares are authorized for the Company with a par value of $0.001 per share. The series of the Company presently authorized are The Internet Fund (“Internet”), The Global Fund (“Global”), The Paradigm Fund (“Paradigm”), The Medical Fund (“Medical”), The Small Cap Opportunities Fund (“Small Cap”), The Market Opportunities Fund (“Market Opportunities”), The Alternative Income Fund (“Alternative Income”), The Multi-Disciplinary Income Fund (“Multi-Disciplinary Income”) and The Kinetics Spin-off and Corporate Restructuring Fund (“Spin-off Fund”). Investment operations of the Company began on October 21, 1996 (Internet), September 30, 1999 (Medical), December 31, 1999 (Global and Paradigm), March 20, 2000 (Small Cap), January 31, 2006 (Market Opportunities), June 29, 2007 (Alternative Income), February 11, 2008 (Multi-Disciplinary Income) and May 4, 2007 (Spin-off Fund). The Spin-off Fund completed a plan of reorganization at the close of business on December 8, 2017 to begin operations under the Company. Prior to December 8, 2017, the Spin-off Fund, was known as Horizon Spin-off and Corporate Restructuring a series of Investment Managers Series Trust. Each series, except the Spin-off Fund, unlike many other investment companies which directly acquire and manage their own portfolios of securities, seeks to achieve its investment objective by investing all of its investable assets in a corresponding portfolio series (each a “Master Portfolio” and collectively the “Master Portfolios”) of Kinetics Portfolios Trust (the “Trust”). The Spin-off Fund does not invest all of its investable assets in a Master Portfolio and will directly acquire and manage its own portfolio of securities.
On April 28, 2000 (January 31, 2006, with respect to Market Opportunities, June 29, 2007, with respect to Alternative Income, and February 11, 2008, with respect to Multi-Disciplinary Income), each series in the Company, except for the Spin-off Fund, entered into a master-feeder fund structure. By entering into this structure, each series, except for the Spin-off Fund, (each a “Feeder Fund” and collectively, the “Feeder Funds”) invested all of its assets in a corresponding Master Portfolio which had the same investment objective as the Feeder Fund. Each Master Portfolio has multiple feeder funds. Each Feeder Fund receives a
57
KINETICS MUTUAL FUNDS, INC. — THE FEEDER FUNDS
Notes to Financial Statements — (Continued)
December 31, 2019
proportionate amount of interest in the Master Portfolio equal to its relative contribution of capital. Thus, each Feeder Fund is allocated its portion of income, gains (losses) and expenses from the Master Portfolio.
Each Feeder Fund’s respective interest in the corresponding Master Portfolio as of December 31, 2019, is as follows:
| | |
| Interest in |
| Master Portfolio |
The Internet Fund | 99.977% |
The Global Fund | 99.932% |
The Paradigm Fund | 97.576% |
The Medical Fund | 99.753% |
The Small Cap Opportunities Fund | 99.973% |
The Market Opportunities Fund | 99.968% |
The Alternative Income Fund | 99.218% |
The Multi-Disciplinary Income Fund | 99.453% |
Prior to the conversion to a master-feeder fund structure on April 28, 2000, each then existing series conducted its own investment operations.
As of December 31, 2019, each of the Funds offers Advisor Class A shares. Advisor Class A shares are subject to an annual Rule 12b-1 fee of 0.25% of average daily net assets and a shareholder servicing fee of 0.25% of average daily net assets. The Advisor Class A shares are also subject to a front-end sales charge of 5.75%.
As of December 31, 2019, each of the Funds offers Advisor Class C shares. Advisor Class C shares are subject to an annual Rule 12b-1 fee of 0.75% of average daily net assets and a shareholder servicing fee of 0.25% of average daily net assets. If you sell your Advisor Class C shares within 12 months of purchase, you will have to pay a contingent deferred sales charge of 1.00%, which is applied to the NAV of the shares on the date of original purchase or on the date of redemption, whichever is less.
As of December 31, 2019, each of the Funds offers No Load Class shares. No Load Class shares are subject to a shareholder servicing fee of 0.25% of average daily net assets but do not have 12b-1 fees or a sales charge.
58
KINETICS MUTUAL FUNDS, INC. — THE FEEDER FUNDS
Notes to Financial Statements — (Continued)
December 31, 2019
As of December 31, 2019, the Paradigm, Small Cap, Market Opportunities, Alternative Income, Multi-Disciplinary Income and Spin-off funds offer Institutional Class shares. Institutional Class shares are subject to a shareholder servicing fee of 0.20% of average daily net assets but do not have 12b-1 fees or a sales charge. The Adviser has contractually agreed to waive the portion of the Institutional Class shareholder servicing fee in excess of 0.05%.
Each class of shares for each Feeder Fund and the Spin-off Fund has identical rights and privileges except with respect to the Rule 12b-1 fees paid by the Advisor Class A and Advisor Class C shares, the front-end sales charge on the Advisor Class A shares, the contingent deferred sales charge on Class C, the shareholder servicing fees paid by the Advisor Class A, Advisor Class C, No Load Class and Institutional Class shares, voting rights on matters pertaining to a single class of shares and the exchange privileges of each class of shares. Shares of each Feeder Fund and the Spin-off Fund will assess a 2.00% redemption fee (with exceptions) on shares redeemed or exchanged within 30 days of purchase. Income, expenses (other than expenses attributable to a specific class), and realized and unrealized gains or losses on investments are allocated to each class based on its relative net assets.
Refer to the Master Portfolios’ financial statements to obtain information about the investment objective of the corresponding Feeder Fund. The financial statements of the Master Portfolios, including the portfolios of investments, are contained elsewhere in this report and should be read in conjunction with the Feeder Funds’ financial statements.
2. Significant Accounting Policies
Security Valuation
Master Portfolios and Spin-off Fund equity securities that are listed on a securities exchange for which market quotations are readily available are valued at the last quoted sale price on the day the valuation is made. Price information on listed securities is taken from the exchange where the security is primarily traded. All equity securities, including exchange-traded funds, that are traded using the National Association of Securities Dealers’ Automated Quotation System (“NASDAQ”) are valued using the NASDAQ Official Closing Price (“NOCP”). In the event market quotations are not readily available or if events occur that may materially affect the value of a particular security
59
KINETICS MUTUAL FUNDS, INC. — THE FEEDER FUNDS
Notes to Financial Statements — (Continued)
December 31, 2019
between the time trading ends on a particular security and the close of regular trading on the New York Stock Exchange (“NYSE”), “fair value” will be determined. Unlisted equity securities and listed equity securities not traded on the valuation date for which market quotations are readily available are valued at the last bid price. Futures, options on futures and swap contracts that are listed or traded on a national securities exchange, commodities exchange, contract market or over-the-counter markets and are freely transferable will be valued at the composite price, using the National Best Bid and Offer quotes (“NBBO”). NBBO consists of the highest bid price and lowest ask price across any of the exchanges on which an option is quoted, thus providing a view across the entire U.S. options marketplace. Composite option pricing calculates the mean of the highest bid price and lowest ask price across the exchanges where the option is traded. If a composite option price is not available, then a quote provided by one of the authorized pricing vendors will be used. If neither a composite price nor a quote from an authorized pricing provider is available, and it is the day of expiration or post-expiration, expiring options will be priced at intrinsic value. Non-exchange-traded options for which over-the-counter quotations are not readily available are valued at the mean between the last bid and asked quotations. Debt obligations (including convertible securities) that are either investment grade or below investment grade and irrespective of days to maturity are valued at evaluated mean by one of the authorized third party pricing agents which rely on various valuation methodologies such as matrix pricing and other analytical pricing models as well as market transactions and dealer quotations. Certain instruments, such as repurchase agreements and demand notes, do not have values from third parties and are valued at amortized cost. Investments in registered open-end investment companies (including money market funds), other than exchange-traded funds, are valued at their reported net asset value (“NAV”).
Other assets and securities for which no quotations are readily available (including restricted securities) will be valued in good faith at fair value using methods determined by the Board of Trustees of the Master Portfolios and Spinoff Fund. In determining the fair value of a security, the Board of Trustees shall take into account the relevant factors and surrounding circumstances, which may include: (i) the nature and pricing history (if any) of the security; (ii) whether any dealer quotations for the security are available; (iii) possible valuation methodologies that could be used to determine the fair value of the security; (iv) the recommendation of the portfolio manager of the Portfolios with respect
60
KINETICS MUTUAL FUNDS, INC. — THE FEEDER FUNDS
Notes to Financial Statements — (Continued)
December 31, 2019
to the valuation of the security; (v) whether the same or similar securities are held by other funds managed by the Adviser or other funds and the method used to price the security in those funds; (vi) the extent to which the fair value to be determined for the security will result from the use of data or formula produced by third parties independent of the Adviser; (vii) the liquidity or illiquidity of the market for the security; and (viii) the value of a foreign security traded on other foreign markets. At December 31, 2019, 0.00% and 0.00% of the net assets of The Internet Portfolio and The Paradigm Portfolio, respectively, were fair valued securities. The other Master Portfolios and Spin-off Fund did not hold any fair valued securities at December 31, 2019.
Bitcoin
The Master Portfolios and Spin-off Fund may invest in Grayscale Bitcoin Trust, a Delaware statutory trust (“Bitcoin Trust”) that invests in bitcoins. From time to time, the Bitcoin Trust issues creation units in exchange for bitcoins and distributes bitcoins in exchange for redemption units. The performance of the Bitcoin Trust is intended to reflect changes in the value of the Trust’s bitcoin investments. At December 31, 2019, 14.8%, 8.9%, 2.0%, 0.9%, and 5.7% of the net assets of The Internet Portfolio, The Global Portfolio, The Paradigm Portfolio, The Small Cap Opportunities Portfolio and The Market Opportunities Portfolio, respectively, were invested in the Bitcoin Trust. Investments in bitcoins produce non-qualifying income under Subchapter M of the Internal Revenue Code.
Bitcoin is a decentralized digital currency that enables instant transfers to anyone, anywhere in the world. Managing transactions in bitcoins occurs via an open source, cryptographic protocol central authority. The Bitcoin Network is an online, end-user-to-end-user network that hosts the public transaction ledger, known as the Blockchain, and the source code that comprises the basis for the cryptographic and algorithmic protocols governing the Bitcoin Network. No single entity owns or operates the Bitcoin Network, the infrastructure of which is collectively maintained by a decentralized user base. Since the Bitcoin Network is decentralized, it does not rely on either governmental authorities or financial institutions to create, transmit or determine the value of bitcoins. Rather, the value of bitcoins is determined by the supply of and demand for bitcoins in the global bitcoin exchange market for the trading of bitcoins, which consists of transactions on electronic bitcoin exchanges (“Bitcoin Exchanges”). Pricing on Bitcoin Exchanges and other venues can be volatile and can
61
KINETICS MUTUAL FUNDS, INC. — THE FEEDER FUNDS
Notes to Financial Statements — (Continued)
December 31, 2019
adversely affect the value of the Bitcoin Trust. Currently, there is relatively small use of bitcoins in the retail and commercial marketplace in comparison to the relatively large use of bitcoins by speculators, thus contributing to price volatility that could adversely affect a Master Portfolio’s direct or indirect investment in the Bitcoin Trust. Bitcoin transactions are irrevocable, and stolen or incorrectly transferred bitcoins may be irretrievable. As a result, any incorrectly executed bitcoin transactions could adversely affect the value of a Master Portfolio’s direct or indirect investment in the Bitcoin Trust. Shares of the Bitcoin Trust may trade at a premium or discount to the net asset value of the Bitcoin Trust. The price of bitcoins is set in transfers by mutual agreement or barter as well as the number of merchants that accept bitcoins. Because bitcoins are digital files that can be transferred without the involvement of intermediaries or third parties, there are little or no transaction costs in direct end-user-to-end-user transactions. Bitcoins can be used to pay for goods and services or can be converted to fiat currencies, such as the U.S. dollar, at rates determined by the Bitcoin Exchanges. Additionally, third party service providers such as Bitcoin Exchanges are also used for transfers but they may charge significant fees for processing transactions.
As bitcoins have grown in popularity, the U.S. Congress and a number of federal and state agencies (including the Financial Crimes Enforcement Network (FinCEN), the U.S. Securities and Exchange Commission, the Commodity Futures Trading Commission, the Financial Industry Regulatory Authority, the Consumer Financial Protection Bureau, the Department of Justice, the Department of Homeland Security, the Federal Bureau of Investigation, the IRS, and state financial institution regulators) have begun to examine the operations of the network that facilitates bitcoins, bitcoin users and the Bitcoin Exchanges, with particular focus on (1) the extent to which bitcoins can be used to launder the proceeds of illegal activities or fund criminal or terrorist enterprises, (2) the safety and soundness of the Bitcoin Exchange or other service-providers that hold bitcoins for users and (3) other risks to investors and consumers who hold and use bitcoins. Ongoing and future regulatory actions may alter, perhaps to a materially adverse extent, the value of a Master Portfolio’s and it’s Subsidiary’s investment in the Bitcoin Trust or the ability of the Bitcoin Trust to continue to operate.
62
KINETICS MUTUAL FUNDS, INC. — THE FEEDER FUNDS
Notes to Financial Statements — (Continued)
December 31, 2019
Repurchase Agreements
Each Master Portfolio and the Spin-off Fund may enter into repurchase agreements with banks that are members of the Federal Reserve System or securities dealers who are members of a national securities exchange or are primary dealers in U.S. Government Securities. In connection with transactions in repurchase agreements, it is the Trust’s policy that the Master Portfolios and Spin-off Fund receive, as collateral, securities whose market value, including accrued interest, at all times will be at least equal to 102% of the amount invested by the Master Portfolio and Spin-off Fund in each repurchase agreement. If the seller defaults and the value of the collateral declines, realization of the collateral by the Master Portfolio and Spin-off Fund may be delayed or limited.
Written Options
The Master Portfolios and Spin-off Fund may write (sell) call or put options for trading or hedging purposes. When a Master Portfolio or Spin-off Fund writes an option, an amount equal to the premium received by the Master Portfolio or Spin-off Fund is included in the Statement of Assets and Liabilities as an asset and an equivalent liability. The amount of the liability is subsequently marked- to-market to reflect the current value of the option written. By writing the option, the Master Portfolio or Spin-off Fund may become obligated during the term of the option to deliver or purchase the securities underlying the option at the exercise price if the option is exercised. When an option expires on its stipulated expiration date or the Master Portfolio or Spin-off Fund enters into a closing purchase transaction, the Master Portfolio or Spin-off Fund realizes a gain or loss if the cost of the closing transaction differs from the premium received when the option was sold, without regard to any unrealized gain or loss on the underlying security, and the liability related to such option is eliminated. When an option is exercised, the premium originally received decreases the cost basis of the underlying security (or increases the proceeds on the security sold short) and the Master Portfolio or Spin-off Fund realizes a gain or loss from the sale of the security (or closing of the short sale). As collateral for uncovered written options, each of the Master Portfolios and Spin-off Fund are required under the 1940 Act to maintain assets consisting of cash, cash equivalents or unencumbered, liquid securities. This collateral is required to be adjusted daily to reflect the exercise price of the purchase obligation for put options or the market value of the instrument underlying the contract for call options.
63
KINETICS MUTUAL FUNDS, INC. — THE FEEDER FUNDS
Notes to Financial Statements — (Continued)
December 31, 2019
Foreign Currency Translations
The books and records of the Master Portfolios and Spin-off Fund are maintained in U.S. dollars. For the Master Portfolios and Spin-off Fund, foreign currency transactions are translated into U.S. dollars on the following basis: (i) market values of investment securities and other assets and liabilities are translated at the exchange rate of such currencies against the U.S. dollar, as provided by an approved pricing service, and (ii) purchases and sales of investment securities, dividend and interest income and certain expenses at the rates of exchange prevailing on the respective dates of such transactions. The Master Portfolios and Spin-off Fund do not isolate and treat as ordinary income that portion of the results of operations arising as a result of changes in the exchange rate from the fluctuations arising from changes in the market prices of securities held during the year. Such fluctuations are included with the net realized and unrealized gain or loss from investments. However, for federal income tax purposes, the Master Portfolios and Spin-off Fund do isolate and treat as ordinary income the effect of changes in foreign exchange rates arising from actual foreign currency transactions and the effect of changes in foreign exchange rates arising between trade date and settlement date.
Restricted and Illiquid Securities
The Master Portfolios and Spin-off Fund may invest in restricted securities. These securities are valued by the Master Portfolios and Spin-off Fund after giving due consideration to pertinent factors including recent private sales, market conditions and the issuer’s financial performance. The Master Portfolios and Spin-off Fund have no right to require registration of unregistered securities. The 144A securities have been deemed to be liquid by the Master Portfolio and Spin-off Fund’s Adviser under the supervision of the Board of Trustees/Directors. At December 31, 2019, the following Master Portfolios and Spin-off Fund held securities restricted to institutional investors (144A securities):
| | | | | | | |
| | | | | Percentage of | |
| | Market Value | | | Net Assets | |
The Multi-Disciplinary Income Portfolio | | $ | 5,618,406 | | | | 15.96 | % |
64
KINETICS MUTUAL FUNDS, INC. — THE FEEDER FUNDS
Notes to Financial Statements — (Continued)
December 31, 2019
An illiquid asset is any asset which may not be sold or disposed of in current market conditions within seven days without the sale or disposition significantly changing the market value of the investment. At December 31, 2019, the following Master Portfolios and Spin-off Fund held illiquid securities:
| | | | | |
| | | Percentage of | |
| Market Value | | Net Assets | |
The Internet Portfolio | | $ | — | * | | | 0.00 | % |
The Paradigm Portfolio | | | — | * | | | 0.00 | % |
The Multi-Disciplinary Income Portfolio | | | 166,398 | | | | 0.47 | % |
* Amount is less than $0.50 |
When-Issued Securities
The Master Portfolios and Spin-off Fund may purchase securities on a when-issued or delayed delivery basis. Although the purchase amounts of these securities are established at the time the purchaser enters into the agreement, these securities may be delivered and paid for at a future date. The Master Portfolios and Spin-off Fund record purchases of when-issued securities and reflect the values of such securities in determining net asset value in the same manner as other portfolio securities. The Master Portfolios and Spin-off Fund maintain at all times cash or other liquid assets in an amount at least equal to the amount of outstanding commitments for when-issued securities.
Securities Lending
Each Master Portfolio and Spin-off Fund may lend its portfolio securities to broker-dealers by entering directly into lending arrangements with such broker- dealers or indirectly through repurchase agreements with respect to no more than 33 1 / ³ % of the total assets of each Master Portfolio and Spin-off Fund (including any collateral posted) or 50% of the total assets of each Master Portfolio and Spin-off Fund (excluding any collateral posted). Securities lending and repurchase transactions will be fully collateralized at all times with cash and/or short-term debt obligations. The Master Portfolios and Spinoff Fund receive interest on the collateral received as well as a fee for the securities loaned.
Expense Allocation
Common expenses incurred by the Funds are allocated among the Funds (i) based upon relative average net assets, (ii) as incurred on a specific identification basis, or (iii) equally among the Funds, depending on the nature of the expenditure.
65
KINETICS MUTUAL FUNDS, INC. — THE FEEDER FUNDS
Notes to Financial Statements — (Continued)
December 31, 2019
Each Feeder Fund records its proportionate share of the corresponding Master Portfolio’s expenses on a daily basis. In addition, each Feeder Fund accrues its own separate expenses. Any cap on expenses includes Feeder Fund-specific expenses as well as the expenses allocated from the Master Portfolio.
Federal Income Taxes
Each Master Portfolio will be treated as a partnership for federal income tax purposes. As such, each investor in a Master Portfolio via its investment in a Feeder Fund will be subject to taxation on its share of the Master Portfolio’s ordinary income and capital gains. It is intended that the Master Portfolio’s assets will be managed so an investor in the Master Portfolio via its investment in a Feeder Fund can satisfy the requirements of subchapter M of the Internal Revenue Code. It is intended that the Spin-off Fund will be managed to satisfy the requirements of subchapter M of the Internal Revenue Code.
The consolidated financial statements include the accounts of Cayman, Ltd., Cayman wholly-owned Controlled Foreign Corporations (“CFCs”) and the accounts of Delaware Corporations (“Cayman” or “Delaware”, respectively, or “Subsidiaries” for both). The respective Master Portfolios hold a CFC: Internet Portfolio, Global Portfolio, Paradigm Portfolio, Small Cap Opportunities Portfolio and Market Opportunities Portfolio. The respective Master Portfolios hold a Delaware subsidiary: Internet Portfolio, Global Portfolio and Market Opportunities Portfolio. The investment of up to 25% of a Master Portfolio’s assets in the Subsidiaries is a structure that has been used by a number of Registered Investment Companies (“RICs”), avoiding bad income generation by indirectly making commodities-related investments. These investments would not generate qualifying income if they were made directly by the RIC. Section 851(b) of the Internal Revenue Code provides that income earned by a CFC or controlled subsidiary, such as the Subsidiaries, will be treated as qualifying income for a RIC provided the Subsidiaries distribute those earnings out to the RIC each year. If the IRS were to determine that income derived from a Master Portfolio’s investment in its Subsidiaries do not constitute qualifying income and if such positions were upheld by a court, or if future legislation or Treasury regulations were to adversely affect the tax treatment of such investments, then the corresponding Feeder Fund might cease to qualify as a RIC and could be required to reduce its exposure to such investments. In that event, a Feeder Fund’s taxable income would be subject to tax at the Feeder Fund level at regular corporate tax rates (without reduction for distributions to shareholders)
66
KINETICS MUTUAL FUNDS, INC. — THE FEEDER FUNDS
Notes to Financial Statements — (Continued)
December 31, 2019
and to a further tax at the shareholder level when such income is distributed. In such an event, in order to re-qualify for taxation as a regulated investment company, the Feeder Fund may be required to recognize unrealized gains, pay substantial taxes and interest and make certain distributions.
It is the Funds’ policy to meet the requirements of the Internal Revenue Code applicable to regulated investment companies and the Funds intend to distribute investment company net taxable income and net capital gains to shareholders.
Dividends from net investment income and distributions of net realized capital gains, if any, will be declared and paid at least annually. The character of distributions made during the year from net investment income or net realized gains may differ from the characterization for federal income tax purposes due to differences in the recognition of income, expenses and realized gain items for financial statement and tax purposes. Additionally, the Funds may utilize earnings and profits distributed to shareholders on redemption of shares as part of the dividends paid deduction for income tax purposes. Where appropriate, reclassifications between capital accounts are made for such differences that are permanent in nature.
There is no tax liability resulting from unrecognized tax benefits relating to uncertain income tax positions taken or expected to be taken in future tax returns. As of December 31, 2019, open tax years include the tax years ended December 31, 2016 through December 31, 2019. The Funds are also not aware of any tax positions for which it is reasonably possible that the total amounts of unrecognized tax benefits will significantly change in the next twelve months.
Use of Estimates
The preparation of financial statements in conformity with U.S. generally accepted accounting principles (”GAAP”) requires management to make estimates and assumptions that affect the reported amounts in the financial statements. Actual results could differ from those estimates.
Other
Realized gains and losses on the sale of investments are calculated on the identified cost basis. Dividend income is recorded on the ex-dividend date. Interest income is accounted for on the accrual basis and includes amortization of premiums and accretion of discounts on the effective interest method. Other
67
KINETICS MUTUAL FUNDS, INC. — THE FEEDER FUNDS
Notes to Financial Statements — (Continued)
December 31, 2019
noncash dividends are recognized as investment income at the fair value of the property received. Withholding taxes on foreign dividends have been incorporated in accordance with the Company’s understanding of the applicable country’s tax rules and rates.
3. Investment Adviser
The Trust has entered into Investment Advisory Agreements (the “Agreements”) with Horizon Kinetics Asset Management LLC (the “Adviser”), with whom certain officers and trustees of the Trust are affiliated, to furnish investment advisory services to the Master Portfolios and Spin-off Fund. The Adviser is a wholly-owned subsidiary of Horizon Kinetics LLC. Under the terms of the Agreements, the Master Portfolios, except the Alternative Income Portfolio, compensate the Adviser for its management services at the annual rate of 1.25% of each Master Portfolio’s average daily net assets. The Alternative Income Portfolio compensates the Adviser for its management services at the annual rate of 0.90% of the Master Portfolio’s average daily net assets. The Spinoff Fund compensates the Adviser for its management services at the annual rate of 1.00% of the Fund’s average daily net assets.
The Adviser has agreed to waive a portion of its advisory fee and/or reimburse certain operating expenses as deemed appropriate through at least May 1, 2020. The Adviser may discontinue the waiver/reimbursement at any time after May 1, 2020; these waivers/reimbursements are not subject to recapture. Operating expenses exclude brokerage commissions, borrowing costs on securities sold short, short dividends, interest expense, taxes, acquired fund fees and expenses and extraordinary expenses. Below are operating expense limitations by each share class of each of the funds:
| | | | | |
| The Internet | | The Global | |
| Fund | | Fund | |
No Load Class | | | 1.89 | % | | | 1.39 | % |
Class A | | | 2.14 | % | | | 1.64 | % |
Class C | | | 2.64 | % | | | 2.14 | % |
68
KINETICS MUTUAL FUNDS, INC. — THE FEEDER FUNDS
Notes to Financial Statements — (Continued)
December 31, 2019
| | | | | |
| The Paradigm | | The Medical | |
| Fund | | Fund | |
No Load Class | | | 1.64 | % | | | 1.39 | % |
Class A | | | 1.89 | % | | | 1.64 | % |
Class C | | | 2.39 | % | | | 2.14 | % |
Institutional Class | | | 1.44 | % | NA | |
| | | | | |
| The Small Cap | | The Market | |
| Opportunities | | Opportunities | |
| Fund | | Fund | |
No Load Class | | | 1.64 | % | | | 1.40 | % |
Class A | | | 1.89 | % | | | 1.65 | % |
Class C | | | 2.39 | % | | | 2.15 | % |
Institutional Class | | | 1.44 | % | | | 1.20 | % |
| | | | | |
| The Alternative | | The Multi- | |
| Income | | Disciplinary Income | |
| Fund | | Fund | |
No Load Class | | | 0.95 | % | | | 1.49 | % |
Class A | | | 1.20 | % | | | 1.74 | % |
Class C | | | 1.70 | % | | | 2.24 | % |
Institutional Class | | | 0.75 | % | | | 1.29 | % |
| | | |
| The | |
| Spin-off | |
| Fund | |
No Load Class | | | 1.45 | % |
Class A | | | 1.50 | % |
Class C | | | 2.25 | % |
Institutional Class | | | 1.25 | % |
For the year ended December 31, 2019, the rate earned by the Adviser from the Master Portfolios and Spin-off Fund and the waived fees/reimbursed expenses for the Funds are as follows:
| | | | | |
| The Internet | | The Global | |
| Fund | | Fund | |
Annual Advisory Rate | | | 1.25 | % | | | 1.25 | % |
Expenses Reimbursed by Adviser through | | | | | | | | |
| voluntary waiver | | $ | — | | | $ | 152,355 | |
69
KINETICS MUTUAL FUNDS, INC. — THE FEEDER FUNDS
Notes to Financial Statements — (Continued)
December 31, 2019
| | | | | | | |
| | The Paradigm | | | The Medical | |
| | Fund | | | Fund | |
Annual Advisory Rate | | | 1.25 | % | | | 1.25 | % |
Expenses Reimbursed by Adviser through | | | | | | | | |
| voluntary waiver | | $ | 572,803 | | | $ | 155,676 | |
Expenses Reimbursed by Adviser through | | | | | | | | |
| institutional class shareholder servicing | | | | | | | | |
| fee waiver | | $ | 285,480 | | | | N/A | |
| | |
| The Small Cap | | The Market | |
| Opportunities | | Opportunities | |
| Fund | | Fund | |
Annual Advisory Rate | | | 1.25 | % | | | 1.25 | % |
Expenses Reimbursed by Adviser through | | | | | | | | |
| voluntary waiver | | $ | 313,853 | | | $ | 371,524 | |
Expenses Reimbursed by Adviser through | | | | | | | | |
| institutional class shareholder servicing | | | | | | | | |
| fee waiver | | $ | 87,737 | | | $ | 16,859 | |
| | |
| The Alternative | | The Multi- | |
| Income | | Disciplinary Income | |
| Fund | | Fund | |
Annual Advisory Rate | | | 0.90 | % | | | 1.25 | % |
Expenses Reimbursed by Adviser through | | | | | | | | |
| voluntary waiver | | $ | 194,285 | | | $ | 201,964 | |
Expenses Reimbursed by Adviser through | | | | | | | | |
| institutional class shareholder servicing | | | | | | | | |
| fee waiver | | $ | 18,572 | | | $ | 30,722 | |
| |
| The | |
| Spin-off | |
| Fund | |
Annual Advisory Rate | | 1.00 | % |
Expenses Reimbursed by Adviser through | | | |
| voluntary waiver | $ | 112,267 | |
Expenses Reimbursed by Adviser through | | | |
| institutional class shareholder servicing | | | |
| fee waiver | $ | 19,851 | |
The Adviser receives the shareholder servicing fees from the No Load Class, Advisor Class A and Advisor Class C shares of a Fund pursuant to a Shareholder Servicing Agreement in the amount equal to 0.25% of the Funds’ average daily net assets attributable to No Load Class, Advisor Class A and Advisor Class C shares, respectively. For the Institutional Class, the Adviser receives a shareholder servicing fee pursuant to a shareholder servicing agreement in the amount equal to 0.20% of a Funds’ average daily net assets attributable to Institutional Class shares. At this time, the Adviser has contractually agreed to waive and/or reimburse the portion of the Institutional Class shareholder
70
KINETICS MUTUAL FUNDS, INC. — THE FEEDER FUNDS
Notes to Financial Statements — (Continued)
December 31, 2019
servicing fee in excess of 0.05% of a Funds’ average daily net assets attributable to Institutional Class shares until at least May 1, 2020. For the year ended December 31, 2019, the Adviser waived amounts depicted in the above table in shareholder servicing fees for the Institutional Class of the Paradigm, Small Cap, Market Opportunities, Alternative Income, Multi-Disciplinary Income and Spin- off Funds.
| | | | |
| | Shareholder Servicing | |
| | Expenses for the | |
| | year ended | |
| | December 31, 2019 | |
The Internet Fund | | $ | 306,954 | |
The Global Fund | | | 33,559 | |
The Paradigm Fund | | | 1,812,983 | |
The Medical Fund | | | 40,972 | |
The Small Cap Opportunities Fund | | | 700,707 | |
The Market Opportunities Fund | | | 203,367 | |
The Alternative Income Fund | | | 39,667 | |
The Multi-Disciplinary Income Fund | | | 81,335 | |
The Spin-off Fund | | | 46,224 | |
The Adviser is responsible for paying a portion of these shareholder servicing fees to various agents that have a written shareholder servicing agreement with the Adviser and that perform shareholder servicing functions and maintenance of shareholder accounts on behalf of their clients who own shares of the Funds.
For the year ended December 31, 2019, the Funds were allocated approximately $26,000 for the services of the Chief Compliance Officer employed by the Adviser.
The Company, on behalf of the Funds, has adopted two Retail Distribution Plans pursuant to Rule 12b-1 under the 1940 Act (each a “12b-1 Plan”). One 12b-1 Plan is for Advisor Class A shares, while the other 12b-1 Plan is for Advisor Class C shares. Under the 12b-1 Plan for Advisor Class A shares, Advisor Class A shares may pay up to an annual rate of 0.50% of the average daily net asset value of Advisor Class A shares to the Distributor or other qualified recipients under the 12b-1 Plan. During the year ended December 31, 2019, payments under the 12b-1 Plan for the Advisor Class A shares of the Internet, Global, Paradigm, Medical, Small Cap, Market Opportunities, Alternative Income, Multi-Disciplinary Income and Spin-off Funds were limited
71
KINETICS MUTUAL FUNDS, INC. — THE FEEDER FUNDS
Notes to Financial Statements — (Continued)
December 31, 2019
to 0.25% of the average daily net asset value of such shares of such Funds. Under the second 12b-1 Plan, Advisor Class C shares pay an annual rate of 0.75% of the average daily net asset value of such shares.
| | | | | |
| 12b-1 Expenses for | |
| the year ended | |
| December 31, 2019 | |
| Advisor Class A | | Advisor Class C | |
The Internet Fund | | $ | 6,883 | | | $ | 8,218 | |
The Global Fund | | | 3,229 | | | | 37,085 | |
The Paradigm Fund | | | 283,634 | | | | 858,886 | |
The Medical Fund | | | 3,047 | | | | 1,660 | |
The Small Cap Opportunities Fund | | | 52,541 | | | | 76,645 | |
The Market Opportunities Fund | | | 17,875 | | | | 74,534 | |
The Alternative Income Fund | | | 2,464 | | | | 7,199 | |
The Multi-Disciplinary Income Fund | | | 6,379 | | | | 57,749 | |
The Spin-off Fund | | | 9,431 | | | | 30,875 | |
Kinetics Funds Distributor, LLC (the “Distributor”) acts as the Funds’ principal underwriter in a continuous public offering of the Funds’ shares. The Distributor is an affiliate of the Adviser.
| | | | |
| | Distributor Sales | |
| | Load Fees for | |
| | the year ended | |
| | December 31, 2019 | |
The Internet Fund | | $ | 158 | |
The Global Fund | | | 69 | |
The Paradigm Fund | | | 15,544 | |
The Medical Fund | | | — | |
The Small Cap Opportunities Fund | | | 2,462 | |
The Market Opportunities Fund | | | 1,037 | |
The Alternative Income Fund | | | 537 | |
The Multi-Disciplinary Income Fund | | | 171 | |
The Spin-off Fund | | | 6 | |
72
KINETICS MUTUAL FUNDS, INC. — THE FEEDER FUNDS
Notes to Financial Statements — (Continued)
December 31, 2019
4. Reclassification of Capital Accounts
GAAP requires that certain components of net assets relating to permanent differences be reclassified between financial and tax reporting. These reclassifications have no effect on net assets or net asset value per share. For the year ended December 31, 2019, each Fund recorded the following reclassifications to the accounts listed below:
| | | | | |
| INCREASE/(DECREASE) | |
| Accumulated | | | |
| Earnings | | | |
| (Deficit) | | Paid In Capital | |
The Internet Fund | | $ | 919,241 | | | $ | (919,241 | ) |
The Global Fund | | | 34,717 | | | | (34,717 | ) |
The Paradigm Fund | | | 6,059,054 | | | | (6,059,054 | ) |
The Medical Fund | | | (75,717 | ) | | | 75,717 | |
The Small Cap Opportunities Fund | | | 176,286 | | | | (176,286 | ) |
The Market Opportunities Fund | | | 3,793 | | | | (3,793 | ) |
The Alternative Income Fund | | | 3,495 | | | | (3,495 | ) |
The Multi-Disciplinary Income Fund | | | — | | | | — | |
The Spin-off Fund | | | 710,751 | | | | (710,751 | ) |
5. Income Taxes
At December 31, 2019, the components of accumulated earnings (losses) on a tax basis were as follows:
| | | | | | | | | | | | | |
| | Internet | | | Global | | | Paradigm | | | Medical | |
Net Unrealized Appreciation | | $ | 24,855,352 | | | $ | 3,124,555 | | | $ | 360,603,946 | | | $ | 6,351,522 | |
Undistributed Ordinary Income | | | — | | | | — | | | | — | | | | 47,129 | |
Undistributed Long-Term | | | | | | | | | | | | | | | | |
| Capital Gains | | | — | | | | — | | | | 872,279 | | | | — | |
Total Distributable Earnings | | $ | — | | | $ | — | | | $ | 872,279 | | | $ | 47,129 | |
Other Accumulated Loss | | | (1,216,297 | ) | | | (374,602 | ) | | | (1,747,082 | ) | | | (91,492 | ) |
Total Accumulated Gain | | $ | 23,639,055 | | | $ | 2,749,953 | | | $ | 359,729,143 | | | $ | 6,307,159 | |
73
KINETICS MUTUAL FUNDS, INC. — THE FEEDER FUNDS
Notes to Financial Statements — (Continued)
December 31, 2019
| | | | | | | | | | | | | |
| | | | | | | | | | | Multi- | |
| | Small Cap | | | Market | | | Alternative | | | Disciplinary | |
| | Opportunities | | | Opportunities
| | | Income | | | Income | |
Net Unrealized | | | | | | | | | | | | |
| Appreciation (Depreciation) | | $ | 78,616,178 | | | $ | 26,934,382 | | | $ | 66,641 | | | $ | (963,134 | ) |
Undistributed Ordinary Income | | | — | | | | — | | | | — | | | | 48,298 | |
Undistributed Long-Term | | | | | | | | | | | | | | | | |
| Capital Gains | | | — | | | | — | | | | — | | | | — | |
Total Distributable Earnings | | $ | — | | | $ | — | | | $ | — | | | $ | 48,298 | |
Other Accumulated Loss | | | (4,656,324 | ) | | | (336,329 | ) | | | — | | | | (1,626,370 | ) |
Total Accumulated Gain (Loss) | | $ | 73,959,854 | | | $ | 26,598,053 | | | $ | 66,641 | | | $ | (2,541,206 | ) |
| | | | |
| | Spin-off | |
| | Fund | |
Net Unrealized Appreciation | | $ | 9,341,994 | |
Undistributed Ordinary Income | | | — | |
Undistributed Long-Term | | | | |
| Capital Gains | | | — | |
Total Distributable Earnings | | $ | — | |
Other Accumulated Loss | | | (720,322 | ) |
Total Accumulated Gain | | $ | 8,621,672 | |
At December 31, 2019, the Funds had no accumulated net realized capital loss carryforwards that will expire in 2020.
At December 31, 2019, the Funds had the following short-term and long-term capital loss carryforwards without expiration.
| | | | | | | | | | |
| | Capital Loss Carryforward
| |
| | Short-Term | | | Long-Term | | | Total | |
The Internet Fund | | $ | (72,863 | ) | | $ | (1,143,434 | ) | | $ | (1,216,297 | ) |
The Global Fund | | | (138,131 | ) | | | (236,471 | ) | | | (374,602 | ) |
The Paradigm Fund | | | — | | | | — | | | | — | |
The Medical Fund | | | — | | | | — | | | | — | |
The Small Cap Opportunities Fund | | | — | | | | (1,664,104 | ) | | | (1,664,104 | ) |
The Market Opportunities Fund | | | (305,260 | ) | | | — | | | | (305,260 | ) |
The Alternative Income Fund | | | — | | | | — | | | | — | |
The Multi-Disciplinary Income Fund | | | (6,142 | ) | | | (1,620,228 | ) | | | (1,626,370 | ) |
The Spin-off Fund | | | (283,493 | ) | | | (436,829 | ) | | | (720,322 | ) |
For the year ended December 31, 2019, the Funds did not utilize any capital loss carryforwards.
74
KINETICS MUTUAL FUNDS, INC. — THE FEEDER FUNDS
Notes to Financial Statements — (Continued)
December 31, 2019
At December 31, 2019, the following Funds deferred, on a tax basis, post-October losses:
| | | | |
| | Post-October | |
| | Capital Loss | |
| | Deferral | |
The Internet Fund | | $ | — | |
The Global Fund | | | — | |
The Paradigm Fund | | | (1,747,335 | ) |
The Medical Fund | | | — | |
The Small Cap Opportunities Fund | | | (2,413,689 | ) |
The Market Opportunities Fund | | | (14,655 | ) |
The Alternative Income Fund | | | — | |
The Multi-Disciplinary Income Fund | | | — | |
The Spin-off Fund | | | — | |
The tax components of dividends paid during the year ended December 31, 2019 and the year ended December 31, 2018, are:
| | | | | | | | | |
| The Internet Fund | | The Global Fund | |
| Ordinary | | Long-Term | | Ordinary | | Long-Term | |
| Income | | Capital Gains | | Income | | Capital Gains | |
| Distribution | | Distribution | | Distribution | | Distribution | |
2019 | | $ | 66,233 | | | $ | 1,649,276 | | | $ | — | | | $ | — | |
2018 | | $ | 777,455 | | | $ | 30,198,679 | | | $ | — | | | $ | 8,966 | |
| | |
| The Paradigm Fund | | The Medical Fund | |
| Ordinary | | Long-Term | | Ordinary | | Long-Term | |
| Income | | Capital Gains | | Income | | Capital Gains | |
| Distribution | | Distribution | | Distribution | | Distribution | |
2019 | | $ | — | | | $ | 8,276,134 | | | $ | 225,196 | | | $ | 208,988 | |
2018 | | $ | — | | | $ | 63,008,862 | | | $ | 176,000 | | | $ | 1,265,030 | |
| | |
| The Small Cap | | The Market | |
| Opportunities Fund | | Opportunities Fund | |
| Ordinary | | Long-Term | | Ordinary | | Long-Term | |
| Income | | Capital Gains | | Income | | Capital Gains | |
| Distribution | | Distribution | | Distribution | | Distribution | |
2019 | | $ | — | | | $ | — | | | $ | 259,554 | | | $ | — | |
2018 | | $ | — | | | $ | — | | | $ | 4,281,585 | | | $ | 1,894,441 | |
75
KINETICS MUTUAL FUNDS, INC. — THE FEEDER FUNDS
Notes to Financial Statements — (Continued)
December 31, 2019
| | | | | | | | | | | | | |
| | The Alternative | | | The Multi-Disciplinary | |
| | Income Fund | | | Income Fund | |
| | Ordinary | | | Long-Term | | | Ordinary | | | Long-Term | |
| | Income | | | Capital Gains | | | Income | | | Capital Gains | |
| | Distribution | | | Distribution | | | Distribution | | | Distribution | |
2019 | | $ | 303,181 | | | $ | — | | | $ | 1,476,543 | | | $ | — | |
2018 | | $ | 211,236 | | | $ | — | | | $ | 1,742,121 | | | $ | — | |
| | |
| | The Spin-off Fund | | | | | | | | | |
| | Ordinary | | | Long-Term | | | | | | | | | |
| | Income | | | Capital Gains | | | | | | | | | |
| | Distribution | | | Distribution | | | | | | | | | |
2019 | | $ | 12,075 | | | $ | — | | | | | | | | | |
2018 | | $ | 71,090 | | | $ | 810,046 | | | | | | | | | |
Each Feeder Fund and the Spin-off Fund designated as long-term capital gain dividend, pursuant to Internal Revenue Code Section 852(b)(3), the amount necessary to reduce the earnings and profits of the Feeder Funds and the Spin-off Fund related to net capital gain to zero for the tax year ended December 31, 2019.
6. Securities Transactions, Tax Cost and Significant Investments – The Spin-off Fund
Purchases and sales of investment securities, other than short-term investments and short-term options, for the year ended December 31, 2019, were as follows for the Spin-off Fund:
| | | | | | | | | | | | | |
| | Purchases | | | Sales | |
| | U.S. Government | | | Other | | | U.S. Government | | | Other | |
The Spin-off Fund | | $ | — | | | $ | 407,502 | | | $ | — | | | $ | 1,819,006 | |
As of December 31, 2019, the cost of investments and unrealized appreciation (depreciation) on investment securities for federal income tax purposes was as follows for the Spin-off Fund:
| | | | |
| | The Spin-off | |
| | Fund | |
Tax Cost of Investments | | $ | 11,788,080 | |
Unrealized Appreciation | | | 12,078,043 | |
Unrealized Depreciation | | | (2,736,049 | ) |
Net Unrealized Appreciation | | $ | 9,341,994 | |
76
KINETICS MUTUAL FUNDS, INC. — THE FEEDER FUNDS
Notes to Financial Statements — (Continued)
December 31, 2019
Significant Investments
The Spin-off Fund may invest a greater percentage of its assets in one or more individual securities at any time. The greater percentage of assets in individual securities (not including short-term investments or other funds) exposes the fund to the risk of unanticipated industry conditions, the risks particular to a single company or security, and the risk of potentially lower liquidity. At December 31, 2019, Spin-off Fund invested approximately 76% of its net assets in individual securities greater than 5% of net assets. See the Schedule of Investments for further details.
Holding a large concentration in a single security or issuer may expose the fund to the market volatility of that specific security or issuer if the security or issuer performs worse than the market as a whole, which could adversely affect the fund’s performance. At December 31, 2019, the Spin-off Fund holds 39% of its net assets in Texas Pacific Land Trust and because a large portion of its revenue is derived from oil and gas royalties, the performance of the fund could be adversely affected if the underlying markets for oil or gas were to decline, thereby having a more significant impact on the fund given the concentration in this holding.
7. Summary of Fair Value Exposure – Spin-off Fund
Various inputs are used in determining the value of the Spin-off Fund’s investments. These inputs are summarized in the three broad levels listed below:
Level 1 — Unadjusted quoted prices in active markets for identical assets or liabilities that the Spin-off Fund has the ability to access.
Level 2 — Observable inputs other than quoted prices included in Level 1 that are observable for the asset or liability, either directly or indirectly. These inputs may include quoted prices for the identical instrument on an inactive market, prices for similar instruments, interest rates, prepayment speeds, credit risk, yield curves, default rates and similar data.
Level 3 — Unobservable inputs for the asset or liability, to the extent relevant observable inputs are not available, representing the Spin-off Fund’s own assumptions about the assumptions a market participant would use in valuing the asset or liability, and would be based on the best information available.
77
KINETICS MUTUAL FUNDS, INC. — THE FEEDER FUNDS
Notes to Financial Statements — (Continued)
December 31, 2019
The availability of observable inputs can vary from security to security and is affected by a wide variety of factors, including, for example, the type of security, whether the security is new and not yet established in the marketplace, the liquidity of markets, and other characteristics particular to the security. To the extent that valuation is based on models or inputs that are less observable or unobservable in the market, the determination of fair value requires more judgment. Accordingly, the degree of judgment exercised in determining fair value is greatest for instruments categorized in Level 3.
The inputs used to measure fair value may fall into different levels of the fair value hierarchy. In such cases, for disclosure purposes, the level in the fair value hierarchy within which the fair value measurement falls in its entirety, is determined based on the lowest level input that is significant to the fair value measurement in its entirety.
The following is a summary of the inputs used to value The Spin-off Fund’s net assets as of December 31, 2019:
| | | | | | | | | | | | | |
| Assets^ | | Level 1 | | | Level 2 | | | Level 3 | | | Total | |
Common Stocks | | $ | 19,299,232 | | | $ | 1,830,842 | | | $ | — | | | $ | 21,130,074 | |
Total Investments in Securities | | $ | 19,299,232 | | | $ | 1,830,842 | | | $ | — | | | $ | 21,130,074 | |
As of December 31, 2019, there were no investments in Level 3 securities. During the year ended December 31, 2019, there were no transfers into or out of Level 3.
| ^ See Schedule of Investments for breakout of investments by industry classification. |
8. Investment Adviser
The Spin-off Fund entered into Investment Advisory Agreements (the “Agreement”) with Horizon Kinetics Asset Management LLC (the “Adviser”), with whom certain officers and trustees of the Trust are affiliated, to furnish investment advisory services to the Spin-off Fund. The Adviser is a wholly-owned subsidiary of Horizon Kinetics LLC. Under the terms of the Agreements, the Spin-off Fund compensates the Adviser for its management services at the annual rate of 1.00% of the Spin-off Fund’s average daily net assets. For the year ended December 31, 2019, Spin-off Fund incurred $211,365 in expenses pursuant to the Agreement.
78
KINETICS MUTUAL FUNDS, INC. — THE FEEDER FUNDS
Notes to Financial Statements — (Continued)
December 31, 2019
9. Subsequent Events
In preparing these financial statements, management has evaluated Fund related events and transactions for potential recognition or disclosure through the date the financial statements were issued. There were no events or translations that occurred during the year that materially impacted the amounts or disclosures in the Funds’ financial statements.
10. Tax Information (Unaudited)
The Internet, Medical, Market Opportunities, and Spin-off Funds designated 100%, 100%, 100% and 100%, respectively, of dividends declared after December 31, 2019, from net investment income as qualified dividend income under the Jobs and Growth Tax Relief Reconciliation Act of 2003.
The Internet, Medical, Market Opportunities, Alternative Income, Multi-Disciplinary Income and Spin-off Funds designated 4%, 52%, 100%, 100%, 100% and 100%, respectively, as ordinary income distributions and 96%, 100% and 48%, respectively, for the Internet, Paradigm and Medical as long-term capital gain distribution for the purposes of the dividends paid deduction, which include earnings and profits distributed to shareholders on redemptions of Fund shares.
For corporate shareholders in the Internet, Medical, Market Opportunities and Spin-off Funds, the percentage of ordinary dividend income distributed for the year ended December 31, 2019, which was designated as qualifying for the dividends-received deduction, is 100%, 100%, 100% and 100%, respectively. The Internet, Medical, Market Opportunities, Alternative Income, Multi-Disciplinary Income and Spin-off Funds designated 39%, 1%, 53%, 54%, 72% and 6%, respectively, of their ordinary income distributions for the fiscal year ended December 31, 2019, as interest-related dividends under Internal Revenue Code Section 871(k)(l)(C).
79
KINETICS MUTUAL FUNDS, INC. — THE FEEDER FUNDS
Notes to Financial Statements — (Continued)
December 31, 2019
The Internet and Medical Funds designated 100% and 5%, respectively, of their ordinary income distributions as short-term capital gain distributions under Internal Revenue Code Section 871(k)(2)(C).
11. Recent Accounting Pronouncements
In March 2017, the FASB issued ASU 2017-08, Receivables—Nonrefundable Fees and Other Costs (Subtopic 310-20): Premium Amortization on Purchased Callable Debt Securities (“ASU 2017-08”). The amendments in ASU 2017-08 shorten the amortization period for certain callable debt securities, held at a premium, to be amortized to the earliest call date. ASU 2017-08 is effective for fiscal years and interim periods within those fiscal years beginning after December 15, 2018. Effective, January 1, 2019, the Funds adopted ASU 2017-08 and the adoption did not have a material impact on the Funds’ financial statements.
12. Information about Proxy Voting (Unaudited)
Information regarding how the Spin-off Fund, the Feeder Funds and the Master Portfolios vote proxies relating to portfolio securities is available without charge, upon request by calling toll-free at 1-800-930-3828 or by accessing the Company’s website at www.kineticsfunds.com and by accessing the SEC’s website at www.sec.gov. Information regarding how the Spin-off Fund, the Feeder Funds and the Master Portfolios voted proxies relating to portfolio securities during the most recent twelve month period ended June 30, is available without charge, upon request, by calling toll-free at 1-800-930-3828 or by accessing the SEC’s website at www.sec.gov.
80
KINETICS MUTUAL FUNDS, INC. — THE FEEDER FUNDS
Notes to Financial Statements — (Continued)
December 31, 2019
13. Information about the Portfolio Holdings (Unaudited)
The Spin-off Fund and Feeder Funds file their complete schedule of portfolio holdings for their first and third fiscal quarters with the SEC on Part F of Form N-PORT. The Spin-off Fund’s and Feeder Funds’ Part F of Form N-PORT is available without charge, upon request, by calling toll-free at 1-800-930-3828. Furthermore, you can obtain the Part F of Form N-PORT on the SEC’s website at www.sec.gov.
81
KINETICS MUTUAL FUNDS, INC. — THE FEEDER FUNDS
Financial Highlights
| | | | | | | | | | | | | | | | |
| | The Internet Fund
| |
| | No Load Class | |
| | For the | | | For the | | | For the | | | For the | | | For the | |
| | Year Ended | | | Year Ended | | | Year Ended | | | Year Ended
| | | Year Ended | |
| | December 31, | | | December 31,
| | | December 31, | | | December 31,
| | | December 31, | |
| | 2019 | | | 2018 | | | 2017 | | | 2016 | | | 2015 | |
| | |
PER SHARE DATA:(1) | | | | | | | | | | | | | | | |
| Net Asset Value, Beginning of Year | | $ | 27.19 | | | $ | 52.18 | | | $ | 39.33 | | | $ | 41.68 | | | $ | 56.08 | |
| Income from Investment Operations: | | | | | | | | | | | | | | | | | | | | |
Net investment income (loss)(2) | | | (0.25 | ) | | | (0.48 | ) | | | 0.36 | | | | (0.68 | ) | | | (0.84 | ) |
| Net realized and unrealized gain (loss) | | | | | | | | | | | | | | | | | | | | |
| on investments | | | 7.44 | | | | (13.77 | ) | | | 22.13 | | | | 1.76 | | | | (2.21 | ) |
| Total from Investment Operations | | | 7.19 | | | | (14.25 | ) | | | 22.49 | | | | 1.08 | | | | (3.05 | ) |
| Redemption Fees | | | 0.00 | (3) | | | 0.02 | | | | 0.00 | (3) | | | 0.00 | (3) | | | 0.00 | (3) |
| Less Distributions: | | | | | | | | | | | | | | | | | | | | |
| From net realized gains | | | (0.49 | ) | | | (10.76 | ) | | | (9.64 | ) | | | (3.43 | ) | | | (11.35 | ) |
| Total Distributions | | | (0.49 | ) | | | (10.76 | ) | | | (9.64 | ) | | | (3.43 | ) | | | (11.35 | ) |
| Net Asset Value, End of Year | | $ | 33.89 | | | $ | 27.19 | | | $ | 52.18 | | | $ | 39.33 | | | $ | 41.68 | |
| Total return | | | 26.45 | % | | | (27.32 | )% | | | 57.43 | % | | | 2.59 | % | | | (5.42 | )% |
| | |
| SUPPLEMENTAL DATA AND RATIOS | | | | | | | | | | | | | | | | | | | | |
| Net assets, end of year (000’s) | | $ | 115,351 | | | $ | 102,268 | | | $ | 162,120 | | | $ | 109,930 | | | $ | 122,332 | |
| Ratio of operating expenses to average | | | | | | | | | | | | | | | | | | | | |
net assets:(4) | | | 1.84 | % | | | 1.84 | % | | | 1.84 | % | | | 1.87 | % | | | 1.82 | % |
| Ratio of net investment income (loss) to | | | | | | | | | | | | | | | | | | | | |
| average net assets: | | | (0.76 | )% | | | (1.05 | )% | | | 0.79 | % | | | (1.68 | )% | | | (1.51 | )% |
Portfolio turnover rate(5) | | | 1 | % | | | 15 | % | | | 44 | % | | | 2 | % | | | 1 | % |
| (1) | Information presented relates to a share of capital stock outstanding for each year. |
| (2) | Net investment income per share represents net investment income divided by the average shares outstanding throughout the year. |
| (3) | Amount calculated is less than $0.005. |
| (4) | See Note #3, Investment Adviser, for the waiver and expense reimbursement discussion. |
| (5) | Portfolio turnover of The Internet Portfolio. |
The accompanying notes are an integral part of these financial statements.
82
KINETICS MUTUAL FUNDS, INC. — THE FEEDER FUNDS
Financial Highlights — (Continued)
| | | | | | | | | | | | | | | | |
| | The Internet Fund
| |
| | Advisor Class A
| |
| | For the | | | For the | | | For the | | | For the | | | For the | |
| | Year Ended | | | Year Ended | | | Year Ended | | | Year Ended | | | Year Ended | |
| | December 31,
| | | December 31, | | | December 31, | | | December 31, | | | December 31, | |
| | 2019 | | | 2018 | | | 2017 | | | 2016 | | | 2015 | |
| | |
PER SHARE DATA:(1) | | | | | | | | | | | | | | | |
| Net Asset Value, Beginning of Year | | $ | 25.00 | | | $ | 49.27 | | | $ | 37.57 | | | $ | 40.07 | | | $ | 54.51 | |
| Income from Investment Operations: | | | | | | | | | | | | | | | | | | | | |
Net investment income (loss)(2) | | | (0.31 | ) | | | (0.57 | ) | | | 0.24 | | | | (0.75 | ) | | | (0.95 | ) |
| Net realized and unrealized gain (loss) | | | | | | | | | | | | | | | | | | | | |
| on investments | | | 6.83 | | | | (12.97 | ) | | | 21.09 | | | | 1.68 | | | | (2.14 | ) |
| Total from Investment Operations | | | 6.52 | | | | (13.54 | ) | | | 21.33 | | | | 0.93 | | | | (3.09 | ) |
| Redemption Fees | | | — | | | | 0.03 | | | | 0.01 | | | | — | | | | — | |
| Less Distributions: | | | | | | | | | | | | | | | | | | | | |
| From net realized gains | | | (0.49 | ) | | | (10.76 | ) | | | (9.64 | ) | | | (3.43 | ) | | | (11.35 | ) |
| Total Distributions | | | (0.49 | ) | | | (10.76 | ) | | | (9.64 | ) | | | (3.43 | ) | | | (11.35 | ) |
| Net Asset Value, End of Year | | $ | 31.03 | | | $ | 25.00 | | | $ | 49.27 | | | $ | 37.57 | | | $ | 40.07 | |
Total return(3) | | | 26.08 | % | | | (27.47 | )% | | | 57.06 | % | | | 2.32 | % | | | (5.65 | )% |
| | |
| SUPPLEMENTAL DATA AND RATIOS | | | | | | | | | | | | | | | | | | | | |
| Net assets, end of year (000’s) | | $ | 2,296 | | | $ | 2,481 | | | $ | 4,185 | | | $ | 1,923 | | | $ | 2,978 | |
| Ratio of operating expenses to average | | | | | | | | | | | | | | | | | | | | |
net assets:(4) | | | 2.09 | % | | | 2.09 | % | | | 2.09 | % | | | 2.12 | % | | | 2.07 | % |
| Ratio of net investment income (loss) to | | | | | | | | | | | | | | | | | | | | |
| average net assets: | | | (1.01 | )% | | | (1.30 | )% | | | 0.54 | % | | | (1.93 | )% | | | (1.76 | )% |
Portfolio turnover rate(5) | | | 1 | % | | | 15 | % | | | 44 | % | | | 2 | % | | | 1 | % |
| (1) | Information presented relates to a share of capital stock outstanding for each year. |
| (2) | Net investment income per share represents net investment income divided by the average shares outstanding throughout the year. |
| (3) | The total return calculation does not reflect the 5.75% front end sales charge on Advisor Class A shares. |
| (4) | See Note #3, Investment Adviser, for the waiver and expense reimbursement discussion. |
| (5) | Portfolio turnover of The Internet Portfolio. |
The accompanying notes are an integral part of these financial statements.
83
KINETICS MUTUAL FUNDS, INC. — THE FEEDER FUNDS
Financial Highlights — (Continued)
| | | | | | | | | | | | | | | | |
| | The Internet Fund
| |
| | Advisor Class C
| |
| | For the | | | For the | | | For the | | | For the | | | For the | |
| | Year Ended | | | Year Ended | | | Year Ended | | | Year Ended | | | Year Ended | |
| | December 31,
| | | December 31, | | | December 31, | | | December 31, | | | December 31, | |
| | 2019 | | | 2018 | | | 2017 | | | 2016 | | | 2015 | |
| | |
PER SHARE DATA:(1) | | | | | | | | | | | | | | | |
| Net Asset Value, Beginning of Year | | $ | 21.18 | | | $ | 44.24 | | | $ | 34.52 | | | $ | 37.27 | | | $ | 51.81 | |
| Income from Investment Operations: | | | | | | | | | | | | | | | | | | | | |
Net investment income (loss)(2) | | | (0.39 | ) | | | (0.70 | ) | | | 0.02 | | | | (0.88 | ) | | | (1.15 | ) |
| Net realized and unrealized gain (loss) | | | | | | | | | | | | | | | | | | | | |
| on investments | | | 5.78 | | | | (11.61 | ) | | | 19.30 | | | | 1.56 | | | | (2.04 | ) |
| Total from Investment Operations | | | 5.39 | | | | (12.31 | ) | | | 19.32 | | | | 0.68 | | | | (3.19 | ) |
| Redemption Fees | | | — | | | | 0.01 | | | | 0.04 | | | | — | | | | — | |
| Less Distributions: | | | | | | | | | | | | | | | | | | | | |
| From net realized gains | | | (0.49 | ) | | | (10.76 | ) | | | (9.64 | ) | | | (3.43 | ) | | | (11.35 | ) |
| Total Distributions | | | (0.49 | ) | | | (10.76 | ) | | | (9.64 | ) | | | (3.43 | ) | | | (11.35 | ) |
| Net Asset Value, End of Year | | $ | 26.08 | | | $ | 21.18 | | | $ | 44.24 | | | $ | 34.52 | | | $ | 37.27 | |
| Total return | | | 25.45 | % | | | (27.86 | )% | | | 56.36 | % | | | 1.83 | % | | | (6.14 | )% |
| | |
| SUPPLEMENTAL DATA AND RATIOS | | | | | | | | | | | | | | | | | | | | |
| Net assets, end of year (000’s) | | $ | 943 | | | $ | 1,065 | | | $ | 1,847 | | | $ | 704 | | | $ | 848 | |
| Ratio of operating expenses to average | | | | | | | | | | | | | | | | | | | | |
net assets:(3) | | | 2.59 | % | | | 2.59 | % | | | 2.59 | % | | | 2.62 | % | | | 2.57 | % |
| Ratio of net investment income (loss) to | | | | | | | | | | | | | | | | | | | | |
| average net assets: | | | (1.51 | )% | | | (1.80 | )% | | | 0.04 | % | | | (2.43 | )% | | | (2.26 | )% |
Portfolio turnover rate(4) | | | 1 | % | | | 15 | % | | | 44 | % | | | 2 | % | | | 1 | % |
| (1) | Information presented relates to a share of capital stock outstanding for each year. |
| (2) | Net investment income per share represents net investment income divided by the average shares outstanding throughout the year. |
| (3) | See Note #3, Investment Adviser, for the waiver and expense reimbursement discussion. |
| (4) | Portfolio turnover of The Internet Portfolio. |
The accompanying notes are an integral part of these financial statements.
84
KINETICS MUTUAL FUNDS, INC. — THE FEEDER FUNDS
Financial Highlights — (Continued)
| | | | | | | | | | | | | | | | |
| | The Global Fund
| |
| | No Load Class | |
| | For the | | | For the | | | For the | | | For the
| | | For the | |
| | Year Ended | | | Year Ended | | | Year Ended | | | Year Ended
| | | Year Ended | |
| | December 31,
| | | December 31, | | | December 31, | | | December 31, | | | December 31, | |
| | 2019 | | | 2018 | | | 2017 | | | 2016
| | | 2015 | |
| | |
PER SHARE DATA:(1) | | | | | | | | | | | | | | | |
| Net Asset Value, Beginning of Year | | $ | 5.46 | | | $ | 7.15 | | | $ | 5.23 | | | $ | 4.59 | | | $ | 5.33 | |
| Income from Investment Operations: | | | | | | | | | | | | | | | | | | | | |
Net investment income (loss)(2) | | | (0.00 | )(3) | | | (0.02 | ) | | | 0.10 | | | | (0.01 | ) | | | (0.02 | ) |
| Net realized and unrealized gain (loss) | | | | | | | | | | | | | | | | | | | | |
| on investments | | | 1.18 | | | | (1.67 | ) | | | 2.47 | | | | 0.67 | | | | (0.72 | ) |
| Total from Investment Operations | | | 1.18 | | | | (1.69 | ) | | | 2.57 | | | | 0.66 | | | | (0.74 | ) |
Redemption Fees(3) | | | 0.00 | | | | 0.00 | | | | 0.00 | | | | 0.00 | | | | 0.00 | |
| Less Distributions: | | | | | | | | | | | | | | | | | | | | |
| From net investment income | | | — | | | | — | | | | (0.10 | ) | | | — | | | | — | |
| From net realized gains | | | — | | | | (0.00 | )(3) | | | (0.55 | ) | | | (0.02 | ) | | | (0.00 | )(3) |
| Total Distributions | | | — | | | | (0.00 | )(3) | | | (0.65 | ) | | | (0.02 | ) | | | (0.00 | )(3) |
| Net Asset Value, End of Year | | $ | 6.64 | | | $ | 5.46 | | | $ | 7.15 | | | $ | 5.23 | | | $ | 4.59 | |
| Total return | | | 21.61 | % | | | (23.58 | )% | | | 49.20 | % | | | 14.40 | % | | | (13.83 | )% |
| | |
| SUPPLEMENTAL DATA AND RATIOS | | | | | | | | | | | | | | | | | | | | |
| Net assets, end of year (000’s) | | $ | 8,115 | | | $ | 5,665 | | | $ | 8,577 | | | $ | 5,316 | | | $ | 4,745 | |
| Ratio of operating expenses to average net assets: | | | | | | | | | | | | | | | | | | | | |
| Before expense reimbursement | | | 2.53 | % | | | 2.53 | % | | | 3.07 | %(6) | | | 3.04 | % | | | 2.87 | % |
After expense reimbursement(4) | | | 1.39 | % | | | 1.39 | % | | | 1.76 | %(6) | | | 1.39 | % | | | 1.39 | % |
| Ratio of net investment income (loss) to | | | | | | | | | | | | | | | | | | | | |
| average net assets: | | | 0.01 | % | | | (0.30 | )% | | | 1.69 | % | | | (0.17 | )% | | | (0.29 | )% |
Portfolio turnover rate(5) | | | 5 | % | | | 28 | % | | | 169 | % | | | 11 | % | | | 16 | % |
| (1) | Information presented relates to a share of capital stock outstanding for each year. |
| (2) | Net investment income per share represents net investment income divided by the average shares outstanding throughout the year. |
| (3) | Amount calculated is less than $0.005. |
| (4) | See Note #3, Investment Adviser, for the waiver and expense reimbursement discussion. |
| (5) | Portfolio turnover of The Global Portfolio. |
| (6) | The ratio of expenses includes a tax expense. The expense ratio excluding the tax expense was 2.69% before expense reimbursement and 1.39% after expense reimbursement. |
The accompanying notes are an integral part of these financial statements.
85
KINETICS MUTUAL FUNDS, INC. — THE FEEDER FUNDS
Financial Highlights — (Continued)
| | | | | | | | | | | | | | | | |
| | The Global Fund
| |
| | Advisor Class A
| |
| | For the | | | For the | | | For the | | | For the
| | | For the | |
| | Year Ended | | | Year Ended | | | Year Ended | | | Year Ended
| | | Year Ended | |
| | December 31, | | | December 31, | | | December 31, | | | December 31, | | | December 31, | |
| | 2019 | | | 2018 | | | 2017 | | | 2016
| | | 2015 | |
| | |
PER SHARE DATA:(1) | | | | | | | | | | | | | | | |
| Net Asset Value, Beginning of Year | | $ | 5.45 | | | $ | 7.15 | | | $ | 5.19 | | | $ | 4.57 | | | $ | 5.31 | |
| Income from Investment Operations: | | | | | | | | | | | | | | | | | | | | |
Net investment income (loss)(2) | | | (0.02 | ) | | | (0.04 | ) | | | 0.09 | | | | (0.02 | ) | | | (0.03 | ) |
| Net realized and unrealized gain (loss) | | | | | | | | | | | | | | | | | | | | |
| on investments | | | 1.17 | | | | (1.66 | ) | | | 2.45 | | | | 0.66 | | | | (0.71 | ) |
| Total from Investment Operations | | | 1.15 | | | | (1.70 | ) | | | 2.54 | | | | 0.64 | | | | (0.74 | ) |
| Redemption Fees | | | 0.00 | (3) | | | 0.00 | (3) | | | 0.06 | | | | 0.00 | (3) | | | — | |
| Less Distributions: | | | | | | | | | | | | | | | | | | | | |
| From net investment income | | | — | | | | — | | | | (0.09 | ) | | | — | | | | — | |
| From net realized gains | | | — | | | | (0.00 | )(3) | | | (0.55 | ) | | | (0.02 | ) | | | (0.00 | )(3) |
| Total Distributions | | | — | | | | (0.00 | )(3) | | | (0.64 | ) | | | (0.02 | ) | | | (0.00 | )(3) |
| Net Asset Value, End of Year | | $ | 6.60 | | | $ | 5.45 | | | $ | 7.15 | | | $ | 5.19 | | | $ | 4.57 | |
Total return(4) | | | 21.10 | % | | | (23.72 | )% | | | 50.29 | % | | | 14.03 | % | | | (13.89 | )% |
| | |
| SUPPLEMENTAL DATA AND RATIOS | | | | | | | | | | | | | | | | | | | | |
| Net assets, end of year (000’s) | | $ | 1,331 | | | $ | 1,012 | | | $ | 1,523 | | | $ | 309 | | | $ | 376 | |
| Ratio of operating expenses to average net assets: | | | | | | | | | | | | | | | | | | | | |
| Before expense reimbursement | | | 2.78 | % | | | 2.78 | % | | | 3.32 | %(7) | | | 3.29 | % | | | 3.12 | % |
After expense reimbursement(5) | | | 1.64 | % | | | 1.64 | % | | | 2.01 | %(7) | | | 1.64 | % | | | 1.64 | % |
| Ratio of net investment income (loss) to | | | | | | | | | | | | | | | | | | | | |
| average net assets: | | | (0.24 | )% | | | (0.55 | )% | | | 1.44 | % | | | (0.42 | )% | | | (0.54 | )% |
Portfolio turnover rate(6) | | | 5 | % | | | 28 | % | | | 169 | % | | | 11 | % | | | 16 | % |
| (1) | Information presented relates to a share of capital stock outstanding for each year. |
| (2) | Net investment income per share represents net investment income divided by the average shares outstanding throughout the year. |
| (3) | Amount calculated is less than $0.005. |
| (4) | The total return calculation does not reflect the 5.75% front end sales charge on Advisor Class A shares. |
| (5) | See Note #3, Investment Adviser, for the waiver and expense reimbursement discussion. |
| (6) | Portfolio turnover of The Global Portfolio. |
| (7) | The ratio of expenses includes a tax expense. The expense ratio excluding the tax expense was 2.94% before expense reimbursement and 1.64% after expense reimbursement. |
The accompanying notes are an integral part of these financial statements.
86
KINETICS MUTUAL FUNDS, INC. — THE FEEDER FUNDS
Financial Highlights — (Continued)
| | | | | | | | | | | | | | | | |
| | The Global Fund
| |
| | Advisor Class C
| |
| | For the | | | For the | | | For the | | | For the
| | | For the | |
| | Year Ended | | �� | Year Ended | | | Year Ended | | | Year Ended
| | | Year Ended | |
| | December 31, | | | December 31, | | | December 31, | | | December 31, | | | December 31, | |
| | 2019 | | | 2018 | | | 2017 | | | 2016
| | | 2015 | |
| | |
PER SHARE DATA:(1) | | | | | | | | | | | | | | | |
| Net Asset Value, Beginning of Year | | $ | 5.12 | | | $ | 6.76 | | | $ | 4.99 | | | $ | 4.41 | | | $ | 5.16 | |
| Income from Investment Operations: | | | | | | | | | | | | | | | | | | | | |
Net investment income (loss)(2) | | | (0.04 | ) | | | (0.07 | ) | | | 0.05 | | | | (0.04 | ) | | | (0.05 | ) |
| Net realized and unrealized gain (loss) | | | | | | | | | | | | | | | | | | | | |
| on investments | | | 1.10 | | | | (1.57 | ) | | | 2.34 | | | | 0.64 | | | | (0.70 | ) |
| Total from Investment Operations | | | 1.06 | | | | (1.64 | ) | | | 2.39 | | | | 0.60 | | | | (0.75 | ) |
| Redemption Fees | | | — | | | | — | | | | — | | | | — | | | | — | |
| Less Distributions: | | | | | | | | | | | | | | | | | | | | |
| From net investment income | | | — | | | | — | | | | (0.07 | ) | | | — | | | | — | |
| From net realized gains | | | — | | | | (0.00 | )(3) | | | (0.55 | ) | | | (0.02 | ) | | | (0.00 | )(3) |
| Total Distributions | | | — | | | | (0.00 | )(3) | | | (0.62 | ) | | | (0.02 | ) | | | (0.00 | )(3) |
| Net Asset Value, End of Year | | $ | 6.18 | | | $ | 5.12 | | | $ | 6.76 | | | $ | 4.99 | | | $ | 4.41 | |
| Total return | | | 20.70 | % | | | (24.20 | )% | | | 48.02 | % | | | 13.63 | % | | | (14.48 | )% |
| | |
| SUPPLEMENTAL DATA AND RATIOS | | | | | | | | | | | | | | | | | | | | |
| Net assets, end of year (000’s) | | $ | 4,969 | | | $ | 4,284 | | | $ | 5,542 | | | $ | 1,920 | | | $ | 1,614 | |
| Ratio of operating expenses to average net assets: | | | | | | | | | | | | | | | | | | | | |
| Before expense reimbursement | | | 3.28 | % | | | 3.28 | % | | | 3.82 | %(6) | | | 3.79 | % | | | 3.62 | % |
After expense reimbursement(4) | | | 2.14 | % | | | 2.14 | % | | | 2.51 | %(6) | | | 2.14 | % | | | 2.14 | % |
| Ratio of net investment income (loss) to | | | | | | | | | | | | | | | | | | | | |
| average net assets: | | | (0.74 | )% | | | (1.05 | )% | | | 0.94 | % | | | (0.92 | )% | | | (1.04 | )% |
Portfolio turnover rate(5) | | | 5 | % | | | 28 | % | | | 169 | % | | | 11 | % | | | 16 | % |
| (1) | Information presented relates to a share of capital stock outstanding for each year. |
| (2) | Net investment income per share represents net investment income divided by the average shares outstanding throughout the year. |
| (3) | Amount calculated is less than $0.005. |
| (4) | See Note #3, Investment Adviser, for the waiver and expense reimbursement discussion. |
| (5) | Portfolio turnover of The Global Portfolio. |
| (6) | The ratio of expenses includes a tax expense. The expense ratio excluding the tax expense was 3.44% before expense reimbursement and 2.14% after expense reimbursement. |
The accompanying notes are an integral part of these financial statements.
87
KINETICS MUTUAL FUNDS, INC. — THE FEEDER FUNDS
Financial Highlights — (Continued)
| | | | | | | | | | | | | | | | |
| | The Paradigm Fund
| |
| | No Load Class | |
| | For the | | | For the | | | For the | | | For the | | | For the | |
| | Year Ended | | | Year Ended | | | Year Ended | | | Year Ended
| | | Year Ended | |
| | December 31,
| | | December 31, | | | December 31, | | | December 31, | | | December 31, | |
| | 2019 | | | 2018 | | | 2017 | | | 2016 | | | 2015 | |
| | |
PER SHARE DATA:(1) | | | | | | | | | | | | | | | |
| Net Asset Value, Beginning of Year | | $ | 41.32 | | | $ | 48.32 | | | $ | 37.63 | | | $ | 31.24 | | | $ | 34.08 | |
| Income from Investment Operations: | | | | | | | | | | | | | | | | | | | | |
Net investment loss(2) | | | (0.36 | ) | | | (0.50 | ) | | | (0.34 | ) | | | (0.36 | ) | | | (0.32 | ) |
| Net realized and unrealized gain (loss) | | | | | | | | | | | | | | | | | | | | |
| on investments | | | 12.96 | | | | (2.20 | ) | | | 11.03 | | | | 6.75 | | | | (2.52 | ) |
| Total from Investment Operations | | | 12.60 | | | | (2.70 | ) | | | 10.69 | | | | 6.39 | | | | (2.84 | ) |
| Redemption Fees | | | 0.00 | (3) | | | 0.01 | | | | 0.00 | (3) | | | 0.00 | (3) | | | 0.00 | (3) |
| Less Distributions: | | | | | | | | | | | | | | | | | | | | |
| From net investment income | | | (0.01 | ) | | | — | | | | — | | | | — | | | | — | |
| From net realized gains | | | (0.53 | ) | | | (4.31 | ) | | | — | | | | — | | | | — | |
| Total Distributions | | | (0.54 | ) | | | (4.31 | ) | | | — | | | | — | | | | — | |
| Net Asset Value, End of Year | | $ | 53.38 | | | $ | 41.32 | | | $ | 48.32 | | | $ | 37.63 | | | $ | 31.24 | |
| Total return | | | 30.48 | % | | | (5.55 | )% | | | 28.41 | % | | | 20.45 | % | | | (8.33 | )% |
| | |
| SUPPLEMENTAL DATA AND RATIOS | | | | | | | | | | | | | | | | | | | | |
| Net assets, end of year (000’s) | | $ | 348,402 | | | $ | 297,990 | | | $ | 339,189 | | | $ | 336,837 | | | $ | 292,014 | |
| Ratio of operating expenses to average net assets: | | | | | | | | | | | | | | | | | | | | |
| Before expense reimbursement | | | 1.72 | % | | | 1.73 | % | | | 1.74 | % | | | 1.75 | % | | | 1.71 | % |
After expense reimbursement(4) | | | 1.64 | % | | | 1.64 | % | | | 1.64 | % | | | 1.64 | % | | | 1.64 | % |
| Ratio of net investment loss to average | | | | | | | | | | | | | | | | | | | | |
| net assets: | | | (0.71 | )% | | | (0.93 | )% | | | (0.82 | )% | | | (1.11 | )% | | | (0.92 | )% |
Portfolio turnover rate(5) | | | 1 | % | | | 3 | % | | | 14 | % | | | 2 | % | | | 2 | % |
| (1) | Information presented relates to a share of capital stock outstanding for each year. |
| (2) | Net investment income per share represents net investment income divided by the average shares outstanding throughout the year. |
| (3) | Amount calculated is less than $0.005. |
| (4) | See Note #3, Investment Adviser, for the waiver and expense reimbursement discussion. |
| (5) | Portfolio turnover of The Paradigm Portfolio. |
The accompanying notes are an integral part of these financial statements.
88
KINETICS MUTUAL FUNDS, INC. — THE FEEDER FUNDS
Financial Highlights — (Continued)
| | | | | | | | | | | | | | | | |
| | The Paradigm Fund
| |
| | Advisor Class A
| |
| | For the | | | For the | | | For the | | | For the | | | For the | |
| | Year Ended | | | Year Ended | | | Year Ended | | | Year Ended
| | | Year Ended | |
| | December 31,
| | | December 31, | | | December 31, | | | December 31, | | | December 31, | |
| | 2019 | | | 2018 | | | 2017 | | | 2016 | | | 2015 | |
| | |
PER SHARE DATA:(1) | | | | | | | | | | | | | | | |
| Net Asset Value, Beginning of Year | | $ | 39.95 | | | $ | 46.99 | | | $ | 36.69 | | | $ | 30.53 | | | $ | 33.39 | |
| Income from Investment Operations: | | | | | | | | | | | | | | | | | | | | |
Net investment loss(2) | | | (0.47 | ) | | | (0.61 | ) | | | (0.43 | ) | | | (0.43 | ) | | | (0.39 | ) |
| Net realized and unrealized gain (loss) | | | | | | | | | | | | | | | | | | | | |
| on investments | | | 12.52 | | | | (2.12 | ) | | | 10.73 | | | | 6.59 | | | | (2.47 | ) |
| Total from Investment Operations | | | 12.05 | | | | (2.73 | ) | | | 10.30 | | | | 6.16 | | | | (2.86 | ) |
Redemption Fees(3) | | | 0.00 | | | | 0.00 | | | | 0.00 | | | | 0.00 | | | | 0.00 | |
| Less Distributions: | | | | | | | | | | | | | | | | | | | | |
| From net investment income | | | — | | | | — | | | | — | | | | — | | | | — | |
| From net realized gains | | | (0.53 | ) | | | (4.31 | ) | | | — | | | | — | | | | — | |
| Total Distributions | | | (0.53 | ) | | | (4.31 | ) | | | — | | | | — | | | | — | |
| Net Asset Value, End of Year | | $ | 51.47 | | | $ | 39.95 | | | $ | 46.99 | | | $ | 36.69 | | | $ | 30.53 | |
Total return(4) | | | 30.15 | % | | | (5.79 | )% | | | 28.07 | % | | | 20.18 | % | | | (8.57 | )% |
| | |
| SUPPLEMENTAL DATA AND RATIOS | | | | | | | | | | | | | | | | | | | | |
| Net assets, end of year (000’s) | | $ | 115,580 | | | $ | 95,503 | | | $ | 108,029 | | | $ | 103,921 | | | $ | 129,707 | |
| Ratio of operating expenses to average net assets: | | | | | | | | | | | | | | | | | | | | |
| Before expense reimbursement | | | 1.97 | % | | | 1.98 | % | | | 1.99 | % | | | 2.00 | % | | | 1.96 | % |
After expense reimbursement(5) | | | 1.89 | % | | | 1.89 | % | | | 1.89 | % | | | 1.89 | % | | | 1.89 | % |
| Ratio of net investment loss to average net assets: | | | (0.96 | )% | | | (1.18 | )% | | | (1.07 | )% | | | (1.36 | )% | | | (1.17 | )% |
Portfolio turnover rate(6) | | | 1 | % | | | 3 | % | | | 14 | % | | | 2 | % | | | 2 | % |
| (1) | Information presented relates to a share of capital stock outstanding for each year. |
| (2) | Net investment income per share represents net investment income divided by the average shares outstanding throughout the year. |
| (3) | Amount calculated is less than $0.005. |
| (4) | The total return calculation does not reflect the 5.75% front end sales charge on Advisor Class A shares. |
| (5) | See Note #3, Investment Adviser, for the waiver and expense reimbursement discussion. |
| (6) | Portfolio turnover of The Paradigm Portfolio. |
The accompanying notes are an integral part of these financial statements.
89
KINETICS MUTUAL FUNDS, INC. — THE FEEDER FUNDS
Financial Highlights — (Continued)
| | | | | | | | | | | | | | | | |
| | The Paradigm Fund
| |
| | Advisor Class C
| |
| | For the | | | For the | | | For the | | | For the | | | For the | |
| | Year Ended | | | Year Ended | | | Year Ended | | | Year Ended
| | | Year Ended | |
| | December 31,
| | | December 31, | | | December 31, | | | December 31, | | | December 31, | |
| | 2019 | | | 2018 | | | 2017 | | | 2016 | | | 2015 | |
| | |
PER SHARE DATA:(1) | | | | | | | | | | | | | | | |
| Net Asset Value, Beginning of Year | | $ | 37.12 | | | $ | 44.21 | | | $ | 34.68 | | | $ | 29.01 | | | $ | 31.88 | |
| Income from Investment Operations: | | | | | | | | | | | | | | | | | | | | |
Net investment loss(2) | | | (0.66 | ) | | | (0.81 | ) | | | (0.60 | ) | | | (0.56 | ) | | | (0.53 | ) |
| Net realized and unrealized gain (loss) | | | | | | | | | | | | | | | | | | | | |
| on investments | | | 11.61 | | | | (1.97 | ) | | | 10.13 | | | | 6.23 | | | | (2.34 | ) |
| Total from Investment Operations | | | 10.95 | | | | (2.78 | ) | | | 9.53 | | | | 5.67 | | | | (2.87 | ) |
Redemption Fees(3) | | | 0.00 | | | | 0.00 | | | | 0.00 | | | | 0.00 | | | | 0.00 | |
| Less Distributions: | | | | | | | | | | | | | | | | | | | | |
| From net investment income | | | — | | | | — | | | | — | | | | — | | | | — | |
| From net realized gains | | | (0.53 | ) | | | (4.31 | ) | | | — | | | | — | | | | — | |
| Total Distributions | | | (0.53 | ) | | | (4.31 | ) | | | — | | | | — | | | | — | |
| Net Asset Value, End of Year | | $ | 47.54 | | | $ | 37.12 | | | $ | 44.21 | | | $ | 34.68 | | | $ | 29.01 | |
| Total return | | | 29.49 | % | | | (6.27 | )% | | | 27.48 | % | | | 19.55 | % | | | (9.00 | )% |
| | |
| SUPPLEMENTAL DATA AND RATIOS | | | | | | | | | | | | | | | | | | | | |
| Net assets, end of year (000’s) | | $ | 113,300 | | | $ | 100,718 | | | $ | 118,924 | | | $ | 111,973 | | | $ | 114,008 | |
| Ratio of operating expenses to average net assets: | | | | | | | | | | | | | | | | | | | | |
| Before expense reimbursement | | | 2.47 | % | | | 2.48 | % | | | 2.49 | % | | | 2.50 | % | | | 2.46 | % |
After expense reimbursement(4) | | | 2.39 | % | | | 2.39 | % | | | 2.39 | % | | | 2.39 | % | | | 2.39 | % |
| Ratio of net investment loss to average net assets: | | | (1.46 | )% | | | (1.68 | )% | | | (1.57 | )% | | | (1.86 | )% | | | (1.67 | )% |
Portfolio turnover rate(5) | | | 1 | % | | | 3 | % | | | 14 | % | | | 2 | % | | | 2 | % |
| (1) | Information presented relates to a share of capital stock outstanding for each year. |
| (2) | Net investment income per share represents net investment income divided by the average shares outstanding throughout the year. |
| (3) | Amount calculated is less than $0.005. |
| (4) | See Note #3, Investment Adviser, for the waiver and expense reimbursement discussion. |
| (5) | Portfolio turnover of The Paradigm Portfolio. |
The accompanying notes are an integral part of these financial statements.
90
KINETICS MUTUAL FUNDS, INC. — THE FEEDER FUNDS
Financial Highlights — (Continued)
| | | | | | | | | | | | | | | | |
| | The Paradigm Fund
| |
| | Institutional Class
| |
| | For the | | | For the | | | For the | | | For the | | | For the | |
| | Year Ended | | | Year Ended | | | Year Ended | | | Year Ended
| | | Year Ended | |
| | December 31, | | | December 31, | | | December 31, | | | December 31, | | | December 31, | |
| | 2019 | | | 2018 | | | 2017 | | | 2016 | | | 2015 | |
| | |
PER SHARE DATA:(1) | | | | | | | | | | | | | | | |
| Net Asset Value, Beginning of Year | | $ | 41.69 | | | $ | 48.62 | | | $ | 37.79 | | | $ | 31.30 | | | $ | 34.08 | |
| Income from Investment Operations: | | | | | | | | | | | | | | | | | | | | |
Net investment loss(2) | | | (0.26 | ) | | | (0.39 | ) | | | (0.26 | ) | | | (0.30 | ) | | | (0.25 | ) |
| Net realized and unrealized gain (loss) | | | | | | | | | | | | | | | | | | | | |
| on investments | | | 13.08 | | | | (2.23 | ) | | | 11.09 | | | | 6.79 | | | | (2.53 | ) |
| Total from Investment Operations | | | 12.82 | | | | (2.62 | ) | | | 10.83 | | | | 6.49 | | | | (2.78 | ) |
Redemption Fees(3) | | | 0.00 | | | | 0.00 | | | | 0.00 | | | | 0.00 | | | | 0.00 | |
| Less Distributions: | | | | | | | | | | | | | | | | | | | | |
| From net investment income | | | (0.11 | ) | | | — | | | | — | | | | — | | | | — | |
| From net realized gains | | | (0.53 | ) | | | (4.31 | ) | | | — | | | | — | | | | — | |
| Total Distributions | | | (0.64 | ) | | | (4.31 | ) | | | — | | | | — | | | | — | |
| Net Asset Value, End of Year | | $ | 53.87 | | | $ | 41.69 | | | $ | 48.62 | | | $ | 37.79 | | | $ | 31.30 | |
| Total return | | | 30.75 | % | | | (5.37 | )% | | | 28.66 | % | | | 20.73 | % | | | (8.16 | )% |
| | |
| SUPPLEMENTAL DATA AND RATIOS | | | | | | | | | | | | | | | | | | | | |
| Net assets, end of year (000’s) | | $ | 202,378 | | | $ | 148,968 | | | $ | 208,692 | | | $ | 270,880 | | | $ | 302,130 | |
| Ratio of operating expenses to average net assets: | | | | | | | | | | | | | | | | | | | | |
| Before expense reimbursement | | | 1.67 | % | | | 1.68 | % | | | 1.69 | % | | | 1.70 | % | | | 1.66 | % |
After expense reimbursement(4) | | | 1.44 | % | | | 1.44 | % | | | 1.44 | % | | | 1.44 | % | | | 1.44 | % |
| Ratio of net investment loss to average net assets: | | | (0.51 | )% | | | (0.73 | )% | | | (0.62 | )% | | | (0.91 | )% | | | (0.72 | )% |
Portfolio turnover rate(5) | | | 1 | % | | | 3 | % | | | 14 | % | | | 2 | % | | | 2 | % |
| (1) | Information presented relates to a share of capital stock outstanding for each year. |
| (2) | Net investment income per share represents net investment income divided by the average shares outstanding throughout the year. |
| (3) | Amount calculated is less than $0.005. |
| (4) | See Note #3, Investment Adviser, for the waiver and expense reimbursement discussion. |
| (5) | Portfolio turnover of The Paradigm Portfolio. |
The accompanying notes are an integral part of these financial statements.
91
KINETICS MUTUAL FUNDS, INC. — THE FEEDER FUNDS
Financial Highlights — (Continued)
| | | | | | | | | | | | | | | | |
| | The Medical Fund
| |
| | No Load Class
| |
| | For the | | | For the | | | For the | | | For the | | | For the | |
| | Year Ended | | | Year Ended | | | Year Ended | | | Year Ended | | | Year Ended | |
| | December 31, | | | December 31,
| | | December 31,
| | | December 31,
| | | December 31,
| |
| | 2019 | | | 2018 | | | 2017 | | | 2016 | | | 2015 | |
| | |
PER SHARE DATA:(1) | | | | | | | | | | | | | | | |
| Net Asset Value, Beginning of Year | | $ | 23.47 | | | $ | 25.33 | | | $ | 26.62 | | | $ | 30.62 | | | $ | 30.67 | |
| Income from Investment Operations: | | | | | | | | | | | | | | | | | | | | |
Net investment income(2) | | | 0.33 | | | | 0.27 | | | | 0.24 | | | | 0.19 | | | | 0.08 | |
| Net realized and unrealized gain (loss) | | | | | | | | | | | | | | | | | | | | |
| on investments | | | 3.43 | | | | 0.12 | | | | 2.63 | | | | (2.64 | ) | | | 1.96 | |
| Total from Investment Operations | | | 3.76 | | | | 0.39 | | | | 2.87 | | | | (2.45 | ) | | | 2.04 | |
Redemption Fees(3) | | | 0.00 | | | | 0.00 | | | | 0.00 | | | | 0.00 | | | | 0.00 | |
| Less Distributions: | | | | | | | | | | | | | | | | | | | | |
| From net investment income | | | (0.35 | ) | | | (0.29 | ) | | | (0.26 | ) | | | (0.22 | ) | | | (0.12 | ) |
| From net realized gains | | | (0.35 | ) | | | (1.96 | ) | | | (3.90 | ) | | | (1.33 | ) | | | (1.97 | ) |
| Total Distributions | | | (0.70 | ) | | | (2.25 | ) | | | (4.16 | ) | | | (1.55 | ) | | | (2.09 | ) |
| Net Asset Value, End of Year | | $ | 26.53 | | | $ | 23.47 | | | $ | 25.33 | | | $ | 26.62 | | | $ | 30.62 | |
| Total return | | | 16.04 | % | | | 1.67 | % | | | 10.71 | % | | | (8.01 | )% | | | 6.59 | % |
| | |
| SUPPLEMENTAL DATA AND RATIOS | | | | | | | | | | | | | | | | | | | | |
| Net assets, end of year (000’s) | | $ | 15,442 | | | $ | 14,814 | | | $ | 16,060 | | | $ | 17,560 | | | $ | 22,257 | |
| Ratio of operating expenses to average net assets: | | | | | | | | | | | | | | | | | | | | |
| Before expense reimbursement | | | 2.34 | % | | | 2.23 | % | | | 2.15 | % | | | 2.08 | % | | | 1.99 | % |
After expense reimbursement(4) | | | 1.39 | % | | | 1.39 | % | | | 1.39 | % | | | 1.39 | % | | | 1.39 | % |
| Ratio of net investment income to average | | | | | | | | | | | | | | | | | | | | |
| net assets: | | | 1.34 | % | | | 1.03 | % | | | 0.86 | % | | | 0.69 | % | | | 0.25 | % |
Portfolio turnover rate(5) | | | 6 | % | | | 0 | % | | | 0 | % | | | 0 | % | | | 12 | % |
| (1) | Information presented relates to a share of capital stock outstanding for each year. |
| (2) | Net investment income per share represents net investment income divided by the average shares outstanding throughout the year. |
| (3) | Amount calculated is less than $0.005. |
| (4) | See Note #3, Investment Adviser, for the waiver and expense reimbursement discussion. |
| (5) | Portfolio turnover of The Medical Portfolio. |
The accompanying notes are an integral part of these financial statements.
92
KINETICS MUTUAL FUNDS, INC. — THE FEEDER FUNDS
Financial Highlights — (Continued)
| | | | | | | | | | | | | | | | |
| | The Medical Fund
| |
| | Advisor Class A
| |
| | For the | | | For the | | | For the | | | For the | | | For the | |
| | Year Ended | | | Year Ended | | | Year Ended | | | Year Ended | | | Year Ended | |
| | December 31, | | | December 31,
| | | December 31,
| | | December 31,
| | | December 31,
| |
| | 2019 | | | 2018 | | | 2017 | | | 2016 | | | 2015 | |
| | |
PER SHARE DATA:(1) | | | | | | | | | | | | | | | |
| Net Asset Value, Beginning of Year | | $ | 22.50 | | | $ | 24.33 | | | $ | 25.71 | | | $ | 29.57 | | | $ | 29.71 | |
| Income from Investment Operations: | | | | | | | | | | | | | | | | | | | | |
Net investment income(2) | | | 0.26 | | | | 0.19 | | | | 0.17 | | | | 0.12 | | | | 0.00 | (3) |
| Net realized and unrealized gain (loss) | | | | | | | | | | | | | | | | | | | | |
| on investments | | | 3.28 | | | | 0.11 | | | | 2.53 | | | | (2.55 | ) | | | 1.90 | |
| Total from Investment Operations | | | 3.54 | | | | 0.30 | | | | 2.70 | | | | (2.43 | ) | | | 1.90 | |
| Redemption Fees | | | — | | | | — | | | | 0.00 | (3) | | | 0.00 | (3) | | | 0.00 | (3) |
| Less Distributions: | | | | | | | | | | | | | | | | | | | | |
| From net investment income | | | (0.28 | ) | | | (0.17 | ) | | | (0.18 | ) | | | (0.10 | ) | | | (0.07 | ) |
| From net realized gains | | | (0.35 | ) | | | (1.96 | ) | | | (3.90 | ) | | | (1.33 | ) | | | (1.97 | ) |
| Total Distributions | | | (0.63 | ) | | | (2.13 | ) | | | (4.08 | ) | | | (1.43 | ) | | | (2.04 | ) |
| Net Asset Value, End of Year | | $ | 25.41 | | | $ | 22.50 | | | $ | 24.33 | | | $ | 25.71 | | | $ | 29.57 | |
Total return(4) | | | 15.74 | % | | | 1.36 | % | | | 10.43 | % | | | (8.24 | )% | | | 6.34 | % |
| | |
| SUPPLEMENTAL DATA AND RATIOS | | | | | | | | | | | | | | | | | | | | |
| Net assets, end of year (000’s) | | $ | 1,137 | | | $ | 1,319 | | | $ | 2,986 | | | $ | 3,687 | | | $ | 6,241 | |
| Ratio of operating expenses to average net assets: | | | | | | | | | | | | | | | | | | | | |
| Before expense reimbursement | | | 2.59 | % | | | 2.48 | % | | | 2.40 | % | | | 2.33 | % | | | 2.24 | % |
After expense reimbursement(5) | | | 1.64 | % | | | 1.64 | % | | | 1.64 | % | | | 1.64 | % | | | 1.64 | % |
| Ratio of net investment income to average | | | | | | | | | | | | | | | | | | | | |
| net assets: | | | 1.09 | % | | | 0.78 | % | | | 0.61 | % | | | 0.44 | % | | | 0.00 | % |
Portfolio turnover rate(6) | | | 6 | % | | | 0 | % | | | 0 | % | | | 0 | % | | | 12 | % |
| (1) | Information presented relates to a share of capital stock outstanding for each year. |
| (2) | Net investment income per share represents net investment income divided by the average shares outstanding throughout the year. |
| (3) | Amount calculated is less than $0.005. |
| (4) | The total return calculation does not reflect the 5.75% front end sales charge on Advisor Class A shares. |
| (5) | See Note #3, Investment Adviser, for the waiver and expense reimbursement discussion. |
| (6) | Portfolio turnover of The Medical Portfolio. |
The accompanying notes are an integral part of these financial statements.
93
KINETICS MUTUAL FUNDS, INC. — THE FEEDER FUNDS
Financial Highlights — (Continued)
| | | | | | | | | | | | | | | | |
| | The Medical Fund
| |
| | Advisor Class C
| |
| | For the | | | For the | | | For the | | | For the | | | For the | |
| | Year Ended | | | Year Ended | | | Year Ended | | | Year Ended | | | Year Ended | |
| | December 31,
| | | December 31,
| | | December 31,
| | | December 31,
| | | December 31,
| |
| | 2019 | | | 2018 | | | 2017 | | | 2016 | | | 2015 | |
| | |
PER SHARE DATA:(1) | | | | | | | | | | | | | | | |
| Net Asset Value, Beginning of Year | | $ | 21.69 | | | $ | 23.57 | | | $ | 24.99 | | | $ | 28.82 | | | $ | 29.15 | |
| Income from Investment Operations: | | | | | | | | | | | | | | | | | | | | |
Net investment income (loss)(2) | | | 0.13 | | | | 0.07 | | | | 0.03 | | | | (0.02 | ) | | | (0.16 | ) |
| Net realized and unrealized gain (loss) | | | | | | | | | | | | | | | | | | | | |
| on investments | | | 3.16 | | | | 0.11 | | | | 2.45 | | | | (2.48 | ) | | | 1.87 | |
| Total from Investment Operations | | | 3.29 | | | | 0.18 | | | | 2.48 | | | | (2.50 | ) | | | 1.71 | |
| Redemption Fees | | | — | | | | — | | | | — | | | | — | | | | — | |
| Less Distributions: | | | | | | | | | | | | | | | | | | | | |
| From net investment income | | | (0.09 | ) | | | (0.10 | ) | | | — | | | | — | | | | (0.07 | ) |
| From net realized gains | | | (0.35 | ) | | | (1.96 | ) | | | (3.90 | ) | | | (1.33 | ) | | | (1.97 | ) |
| Total Distributions | | | (0.44 | ) | | | (2.06 | ) | | | (3.90 | ) | | | (1.33 | ) | | | (2.04 | ) |
| Net Asset Value, End of Year | | $ | 24.54 | | | $ | 21.69 | | | $ | 23.57 | | | $ | 24.99 | | | $ | 28.82 | |
| Total return | | | 15.18 | % | | | 0.90 | % | | | 9.86 | % | | | (8.69 | )% | | | 5.81 | % |
| | |
| SUPPLEMENTAL DATA AND RATIOS | | | | | | | | | | | | | | | | | | | | |
| Net assets, end of year (000’s) | | $ | 169 | | | $ | 320 | | | $ | 383 | | | $ | 422 | | | $ | 608 | |
| Ratio of operating expenses to average | | | | | | | | | | | | | | | | | | | | |
| net assets: | | | | | | | | | | | | | | | | | | | | |
| Before expense reimbursement | | | 3.09 | % | | | 2.98 | % | | | 2.90 | % | | | 2.83 | % | | | 2.74 | % |
After expense reimbursement(3) | | | 2.14 | % | | | 2.14 | % | | | 2.14 | % | | | 2.14 | % | | | 2.14 | % |
| Ratio of net investment income (loss) to | | | | | | | | | | | | | | | | | | | | |
| average net assets: | | | 0.59 | % | | | 0.28 | % | | | 0.11 | % | | | (0.06 | )% | | | (0.50 | )% |
Portfolio turnover rate(4) | | | 6 | % | | | 0 | % | | | 0 | % | | | 0 | % | | | 12 | % |
| (1) | Information presented relates to a share of capital stock outstanding for each year. |
| (2) | Net investment income per share represents net investment income divided by the average shares outstanding throughout the year. |
| (3) | See Note #3, Investment Adviser, for the waiver and expense reimbursement discussion. |
| (4) | Portfolio turnover of The Medical Portfolio. |
The accompanying notes are an integral part of these financial statements.
94
KINETICS MUTUAL FUNDS, INC. — THE FEEDER FUNDS
Financial Highlights — (Continued)
| | | | | | | | | | | | | | | | |
| | The Small Cap Opportunities Fund | |
| | No Load Class | |
| | For the | | | For the | | | For the | | | For the | | | For the | |
| | Year Ended | | | Year Ended | | | Year Ended | | | Year Ended | | | Year Ended | |
| | December 31,
| | | December 31,
| | | December 31,
| | | December 31,
| | | December 31,
| |
| | 2019 | | | 2018 | | | 2017 | | | 2016 | | | 2015 | |
| | |
PER SHARE DATA:(1) | | | | | | | | | | | | | | | |
| Net Asset Value, Beginning of Year | | $ | 51.40 | | | $ | 51.25 | | | $ | 40.60 | | | $ | 32.64 | | | $ | 37.21 | |
| Income from Investment Operations: | | | | | | | | | | | | | | | | | | | | |
Net investment loss(2) | | | (0.29 | ) | | | (0.35 | ) | | | (0.33 | ) | | | (0.36 | ) | | | (0.35 | ) |
| Net realized and unrealized gain (loss) | | | | | | | | | | | | | | | | | | | | |
| on investments | | | 14.20 | | | | 0.47 | | | | 10.98 | | | | 8.32 | | | | (4.22 | ) |
| Total from Investment Operations | | | 13.91 | | | | 0.12 | | | | 10.65 | | | | 7.96 | | | | (4.57 | ) |
| Redemption Fees | | | 0.00 | (3) | | | 0.03 | | | | 0.00 | (3) | | | 0.00 | (3) | | | 0.00 | (3) |
| Less Distributions: | | | | | | | | | | | | | | | | | | | | |
| From net investment income | | | — | | | | — | | | | — | | | | — | | | | — | |
| Total Distributions | | | — | | | | — | | | | — | | | | — | | | | — | |
| Net Asset Value, End of Year | | $ | 65.31 | | | $ | 51.40 | | | $ | 51.25 | | | $ | 40.60 | | | $ | 32.64 | |
| Total return | | | 27.06 | % | | | 0.29 | % | | | 26.23 | % | | | 24.39 | % | | | (12.26 | )% |
| | |
| SUPPLEMENTAL DATA AND RATIOS | | | | | | | | | | | | | | | | | | | | |
| Net assets, end of year (000’s) | | $ | 180,575 | | | $ | 164,330 | | | $ | 133,960 | | | $ | 132,443 | | | $ | 145,032 | |
| Ratio of operating expenses to average net assets: | | | | | | | | | | | | | | | | | | | | |
| Before expense reimbursement | | | 1.75 | % | | | 1.74 | % | | | 1.78 | % | | | 1.76 | % | | | 1.73 | % |
After expense reimbursement(4) | | | 1.64 | % | | | 1.64 | % | | | 1.64 | % | | | 1.64 | % | | | 1.64 | % |
| Ratio of net investment loss to average net assets: | | | (0.48 | )% | | | (0.60 | )% | | | (0.74 | )% | | | (1.03 | )% | | | (0.94 | )% |
Portfolio turnover rate(5) | | | 4 | % | | | 3 | % | | | 9 | % | | | 4 | % | | | 2 | % |
| (1) | Information presented relates to a share of capital stock outstanding for each year. |
| (2) | Net investment income per share represents net investment income divided by the average shares outstanding throughout the year. |
| (3) | Amount calculated is less than $0.005. |
| (4) | See Note #3, Investment Adviser, for the waiver and expense reimbursement discussion. |
| (5) | Portfolio turnover of The Small Cap Opportunities Portfolio. |
The accompanying notes are an integral part of these financial statements.
95
KINETICS MUTUAL FUNDS, INC. — THE FEEDER FUNDS
Financial Highlights — (Continued)
| | | | | | | | | | | | | | | | |
| | The Small Cap Opportunities Fund | |
| | Advisor Class A
| |
| | For the | | | For the | | | For the | | | For the | | | For the | |
| | Year Ended | | | Year Ended | | | Year Ended | | | Year Ended | | | Year Ended | |
| | December 31,
| | | December 31,
| | | December 31,
| | | December 31,
| | | December 31,
| |
| | 2019 | | | 2018 | | | 2017 | | | 2016 | | | 2015 | |
| | |
PER SHARE DATA:(1) | | | | | | | | | | | | | | | |
| Net Asset Value, Beginning of Year | | $ | 49.81 | | | $ | 49.81 | | | $ | 39.55 | | | $ | 31.88 | | | $ | 36.43 | |
| Income from Investment Operations: | | | | | | | | | | | | | | | | | | | | |
Net investment loss(2) | | | (0.43 | ) | | | (0.48 | ) | | | (0.42 | ) | | | (0.43 | ) | | | (0.43 | ) |
| Net realized and unrealized gain (loss) | | | | | | | | | | | | | | | | | | | | |
| on investments | | | 13.74 | | | | 0.48 | | | | 10.68 | | | | 8.10 | | | | (4.12 | ) |
| Total from Investment Operations | | | 13.31 | | | | — | | | | 10.26 | | | | 7.67 | | | | (4.55 | ) |
Redemption Fees(3) | | | 0.00 | | | | 0.00 | | | | 0.00 | | | | 0.00 | | | | 0.00 | |
| Less Distributions: | | | | | | | | | | | | | | | | | | | | |
| From net investment income | | | — | | | | — | | | | — | | | | — | | | | — | |
| Total Distributions | | | — | | | | — | | | | — | | | | — | | | | — | |
| Net Asset Value, End of Year | | $ | 63.12 | | | $ | 49.81 | | | $ | 49.81 | | | $ | 39.55 | | | $ | 31.88 | |
Total return(4) | | | 26.72 | | | | 0.00 | % | | | 25.94 | % | | | 24.06 | % | | | (12.47 | )% |
| | |
| SUPPLEMENTAL DATA AND RATIOS | | | | | | | | | | | | | | | | | | | | |
| Net assets, end of year (000’s) | | $ | 11,986 | | | $ | 10,505 | | | $ | 11,735 | | | $ | 13,694 | | | $ | 14,857 | |
| Ratio of operating expenses to average net assets: | | | | | | | | | | | | | | | | | | | | |
| Before expense reimbursement | | | 2.00 | % | | | 1.99 | % | | | 2.03 | % | | | 2.01 | % | | | 1.98 | % |
After expense reimbursement(5) | | | 1.89 | % | | | 1.89 | % | | | 1.89 | % | | | 1.89 | % | | | 1.89 | % |
| Ratio of net investment loss to average | | | | | | | | | | | | | | | | | | | | |
net assets:(5) | | | (0.73 | )% | | | (0.85 | )% | | | (0.99 | )% | | | (1.28 | )% | | | (1.19 | )% |
Portfolio turnover rate(6) | | | 4 | % | | | 3 | % | | | 9 | % | | | 4 | % | | | 2 | % |
| (1) | Information presented relates to a share of capital stock outstanding for each year. |
| (2) | Net investment income per share represents net investment income divided by the average shares outstanding throughout the year. |
| (3) | Amount calculated is less than $0.005. |
| (4) | The total return calculation does not reflect the 5.75% front end sales charge on Advisor Class A shares. |
| (5) | See Note #3, Investment Adviser, for the waiver and expense reimbursement discussion. |
| (6) | Portfolio turnover of The Small Cap Opportunities Portfolio. |
The accompanying notes are an integral part of these financial statements.
96
KINETICS MUTUAL FUNDS, INC. — THE FEEDER FUNDS
Financial Highlights — (Continued)
| | | | | | | | | | | | | | | | |
| | The Small Cap Opportunities Fund | |
| | Advisor Class C
| |
| | For the | | | For the | | | For the | | | For the | | | For the | |
| | Year Ended | | | Year Ended | | | Year Ended | | | Year Ended | | | Year Ended | |
| | December 31,
| | | December 31,
| | | December 31,
| | | December 31,
| | | December 31,
| |
| | 2019 | | | 2018 | | | 2017 | | | 2016 | | | 2015 | |
| | |
PER SHARE DATA:(1) | | | | | | | | | | | | | | | |
| Net Asset Value, Beginning of Year | | $ | 47.53 | | | $ | 47.77 | | | $ | 38.12 | | | $ | 30.88 | | | $ | 35.47 | |
| Income from Investment Operations: | | | | | | | | | | | | | | | | | | | | |
Net investment loss(2) | | | (0.69 | ) | | | (0.73 | ) | | | (0.61 | ) | | | (0.58 | ) | | | (0.59 | ) |
| Net realized and unrealized gain (loss) | | | | | | | | | | | | | | | | | | | | |
| on investments | | | 13.09 | | | | 0.49 | | | | 10.26 | | | | 7.82 | | | | (4.00 | ) |
| Total from Investment Operations | | | 12.40 | | | | (0.24 | ) | | | 9.65 | | | | 7.24 | | | | (4.59 | ) |
| Redemption Fees | | | — | | | | 0.00 | (3) | | | — | | | | 0.00 | (3) | | | — | |
| Less Distributions: | | | | | | | | | | | | | | | | | | | | |
| From net investment income | | | — | | | | — | | | | — | | | | — | | | | — | |
| Total Distributions | | | — | | | | — | | | | — | | | | — | | | | — | |
| Net Asset Value, End of Year | | $ | 59.93 | | | $ | 47.53 | | | $ | 47.77 | | | $ | 38.12 | | | $ | 30.88 | |
| Total return | | | 26.09 | % | | | (0.50 | )% | | | 25.31 | % | | | 23.45 | % | | | (12.92 | )% |
| | |
| SUPPLEMENTAL DATA AND RATIOS | | | | | | | | | | | | | | | | | | | | |
| Net assets, end of year (000’s) | | $ | 10,544 | | | $ | 8,373 | | | $ | 8,135 | | | $ | 8,426 | | | $ | 8,840 | |
| Ratio of operating expenses to average net assets: | | | | | | | | | | | | | | | | | | | | |
| Before expense reimbursement | | | 2.50 | % | | | 2.49 | % | | | 2.53 | % | | | 2.51 | % | | | 2.48 | % |
After expense reimbursement(4) | | | 2.39 | % | | | 2.39 | % | | | 2.39 | % | | | 2.39 | % | | | 2.39 | % |
| Ratio of net investment loss to average | | | | | | | | | | | | | | | | | | | | |
| net assets: | | | (1.23 | )% | | | (1.35 | )% | | | (1.49 | )% | | | (1.78 | )% | | | (1.69 | )% |
Portfolio turnover rate(5) | | | 4 | % | | | 3 | % | | | 9 | % | | | 4 | % | | | 2 | % |
| (1) | Information presented relates to a share of capital stock outstanding for each year. |
| (2) | Net investment income per share represents net investment income divided by the average shares outstanding throughout the year. |
| (3) | Amount calculated is less than $0.005. |
| (4) | See Note #3, Investment Adviser, for the waiver and expense reimbursement discussion. |
| (5) | Portfolio turnover of The Small Cap Opportunities Portfolio. |
The accompanying notes are an integral part of these financial statements.
97
KINETICS MUTUAL FUNDS, INC. — THE FEEDER FUNDS
Financial Highlights — (Continued)
| | | | | | | | | | | | | | | | |
| | The Small Cap Opportunities Fund | |
| | Institutional Class | |
| | For the | | | For the | | | For the | | | For the | | | For the | |
| | Year Ended | | | Year Ended | | | Year Ended | | | Year Ended | | | Year Ended | |
| | December 31,
| | | December 31,
| | | December 31,
| | | December 31,
| | | December 31,
| |
| | 2019 | | | 2018 | | | 2017 | | | 2016 | | | 2015 | |
| | |
PER SHARE DATA:(1) | | | | | | | | | | | | | | | |
| Net Asset Value, Beginning of Year | | $ | 52.30 | | | $ | 52.07 | | | $ | 41.16 | | | $ | 33.03 | | | $ | 37.57 | |
| Income from Investment Operations: | | | | | | | | | | | | | | | | | | | | |
Net investment loss(2) | | | (0.17 | ) | | | (0.24 | ) | | | (0.24 | ) | | | (0.29 | ) | | | (0.28 | ) |
| Net realized and unrealized gain (loss) | | | | | | | | | | | | | | | | | | | | |
| on investments | | | 14.45 | | | | 0.47 | | | | 11.15 | | | | 8.42 | | | | (4.26 | ) |
| Total from Investment Operations | | | 14.28 | | | | 0.23 | | | | 10.91 | | | | 8.13 | | | | (4.54 | ) |
Redemption Fees(3) | | | 0.00 | | | | 0.00 | | | | 0.00 | | | | 0.00 | | | | 0.00 | |
| Less Distributions: | | | | | | | | | | | | | | | | | | | | |
| From net investment income | | | — | | | | — | | | | — | | | | — | | | | — | |
| Total Distributions | | | — | | | | — | | | | — | | | | — | | | | — | |
| Net Asset Value, End of Year | | $ | 66.58 | | | $ | 52.30 | | | $ | 52.07 | | | $ | 41.16 | | | $ | 33.03 | |
| Total return | | | 27.30 | % | | | 0.44 | % | | | 26.51 | % | | | 24.61 | % | | | (12.06 | )% |
| | |
| SUPPLEMENTAL DATA AND RATIOS | | | | | | | | | | | | | | | | | | | | |
| Net assets, end of year (000’s) | | $ | 66,459 | | | $ | 40,075 | | | $ | 27,514 | | | $ | 50,517 | | | $ | 51,258 | |
| Ratio of operating expenses to average net assets: | | | | | | | | | | | | | | | | | | | | |
| Before expense reimbursement | | | 1.70 | % | | | 1.69 | % | | | 1.73 | % | | | 1.71 | % | | | 1.68 | % |
After expense reimbursement(4) | | | 1.44 | % | | | 1.44 | % | | | 1.44 | % | | | 1.44 | % | | | 1.44 | % |
| Ratio of net investment loss to average net assets: | | | (0.28 | )% | | | (0.40 | )% | | | (0.54 | )% | | | (0.83 | )% | | | (0.74 | )% |
Portfolio turnover rate(5) | | | 4 | % | | | 3 | % | | | 9 | % | | | 4 | % | | | 2 | % |
| (1) | Information presented relates to a share of capital stock outstanding for each year. |
| (2) | Net investment income per share represents net investment income divided by the average shares outstanding throughout the year. |
| (3) | Amount calculated is less than $0.005. |
| (4) | See Note #3, Investment Adviser, for the waiver and expense reimbursement discussion. |
| (5) | Portfolio turnover of The Small Cap Opportunities Portfolio. |
The accompanying notes are an integral part of these financial statements.
98
KINETICS MUTUAL FUNDS, INC. — THE FEEDER FUNDS
Financial Highlights — (Continued)
| | | | | | | | | | | | | | | | |
| | The Market Opportunities Fund | |
| | No Load Class
| |
| | For the | | | For the | | | For the | | | For the | | | For the | |
| | Year Ended | | | Year Ended | | | Year Ended | | | Year Ended | | | Year Ended | |
| | December 31,
| | | December 31,
| | | December 31,
| | | December 31,
| | | December 31,
| |
| | 2019 | | | 2018 | | | 2017 | | | 2016 | | | 2015 | |
| | |
PER SHARE DATA:(1) | | | | | | | | | | | | | | | |
| Net Asset Value, Beginning of Year | | $ | 21.83 | | | $ | 26.72 | | | $ | 18.26 | | | $ | 15.16 | | | $ | 16.68 | |
| Income from Investment Operations: | | | | | | | | | | | | | | | | | | | | |
Net investment income (loss)(2) | | | (0.00 | )(3) | | | (0.14 | ) | | | 0.17 | | | | (0.15 | ) | | | (0.15 | ) |
| Net realized and unrealized gain (loss) | | | | | | | | | | | | | | | | | | | | |
| on investments | | | 4.97 | | | | (2.77 | ) | | | 8.46 | | | | 3.25 | | | | (1.37 | ) |
| Total from Investment Operations | | | 4.97 | | | | (2.91 | ) | | | 8.63 | | | | 3.10 | | | | (1.52 | ) |
| Redemption Fees | | | 0.00 | (3) | | | 0.01 | | | | 0.00 | (3) | | | 0.00 | (3) | | | — | |
| Less Distributions: | | | | | | | | | | | | | | | | | | | | |
| From net investment income | | | (0.09 | ) | | | — | | | | (0.17 | ) | | | — | | | | — | |
| From net realized gains | | | — | | | | (1.99 | ) | | | — | | | | — | | | | — | |
| Total Distributions | | | (0.09 | ) | | | (1.99 | ) | | | (0.17 | ) | | | — | | | | — | |
| Net Asset Value, End of Year | | $ | 26.71 | | | $ | 21.83 | | | $ | 26.72 | | | $ | 18.26 | | | $ | 15.16 | |
| Total return | | | 22.76 | % | | | (10.86 | )% | | | 47.28 | % | | | 20.45 | % | | | (9.11 | )% |
| | |
| SUPPLEMENTAL DATA AND RATIOS | | | | | | | | | | | | | | | | | | | | |
| Net assets, end of year (000’s) | | $ | 56,987 | | | $ | 48,487 | | | $ | 51,298 | | | $ | 32,178 | | | $ | 31,230 | |
| Ratio of operating expenses to average net assets: | | | | | | | | | | | | | | | | | | | | |
| Before expense reimbursement | | | 1.84 | % | | | 1.86 | % | | | 1.92 | % | | | 1.97 | % | | | 1.90 | % |
After expense reimbursement(4) | | | 1.40 | % | | | 1.64 | % | | | 1.64 | % | | | 1.64 | % | | | 1.64 | % |
| Ratio of net investment income (loss) to | | | | | | | | | | | | | | | | | | | | |
| average net assets: | | | (0.01 | )% | | | (0.53 | )% | | | 0.81 | % | | | (0.96 | )% | | | (0.91 | )% |
Portfolio turnover rate(5) | | | 4 | % | | | 8 | % | | | 35 | % | | | 5 | % | | | 2 | % |
| (1) | Information presented relates to a share of capital stock outstanding for each year. |
| (2) | Net investment income per share represents net investment income divided by the average shares outstanding throughout the year. |
| (3) | Amount calculated is less than $0.005. |
| (4) | See Note #3, Investment Adviser, for the waiver and expense reimbursement discussion. |
| (5) | Portfolio turnover of The Market Opportunities Portfolio. |
The accompanying notes are an integral part of these financial statements.
99
KINETICS MUTUAL FUNDS, INC. — THE FEEDER FUNDS
Financial Highlights — (Continued)
| | | | | | | | | | | | | | | | |
| | The Market Opportunities Fund | |
| | Advisor Class A
| |
| | For the | | | For the | | | For the | | | For the | | | For the | |
| | Year Ended | | | Year Ended | | | Year Ended | | | Year Ended | | | Year Ended | |
| | December 31,
| | | December 31,
| | | December 31,
| | | December 31,
| | | December 31,
| |
| | 2019 | | | 2018 | | | 2017 | | | 2016 | | | 2015 | |
| | |
PER SHARE DATA:(1) | | | | | | | | | | | | | | | |
| Net Asset Value, Beginning of Year | | $ | 21.49 | | | $ | 26.41 | | | $ | 18.07 | | | $ | 15.04 | | | $ | 16.59 | |
| Income from Investment Operations: | | | | | | | | | | | | | | | | | | | | |
Net investment income (loss)(2) | | | (0.07 | ) | | | (0.21 | ) | | | 0.11 | | | | (0.19 | ) | | | (0.19 | ) |
| Net realized and unrealized gain (loss) | | | | | | | | | | | | | | | | | | | | |
| on investments | | | 4.89 | | | | (2.72 | ) | | | 8.37 | | | | 3.22 | | | | (1.36 | ) |
| Total from Investment Operations | | | 4.82 | | | | (2.93 | ) | | | 8.48 | | | | 3.03 | | | | (1.55 | ) |
| Redemption Fees | | | — | | | | 0.00 | (3) | | | 0.00 | (3) | | | — | | | | 0.00 | (3) |
| Less Distributions: | | | | | | | | | | | | | | | | | | | | |
| From net investment income | | | (0.02 | ) | | | — | | | | (0.14 | ) | | | — | | | | — | |
| From net realized gains | | | — | | | | (1.99 | ) | | | — | | | | — | | | | — | |
| Total Distributions | | | (0.02 | ) | | | (1.99 | ) | | | (0.14 | ) | | | — | | | | — | |
| Net Asset Value, End of Year | | $ | 26.29 | | | $ | 21.49 | | | $ | 26.41 | | | $ | 18.07 | | | $ | 15.04 | |
Total return(4) | | | 22.42 | % | | | (11.10 | )% | | | 46.91 | % | | | 20.15 | % | | | (9.34 | )% |
| | |
| SUPPLEMENTAL DATA AND RATIOS | | | | | | | | | | | | | | | | | | | | |
| Net assets, end of year (000’s) | | $ | 6,868 | | | $ | 6,426 | | | $ | 7,557 | | | $ | 4,537 | | | $ | 4,502 | |
| Ratio of operating expenses to average net assets: | | | | | | | | | | | | | | | | | | | | |
| Before expense reimbursement | | | 2.09 | % | | | 2.11 | % | | | 2.17 | % | | | 2.22 | % | | | 2.15 | % |
After expense reimbursement(5) | | | 1.65 | % | | | 1.89 | % | | | 1.89 | % | | | 1.89 | % | | | 1.89 | % |
| Ratio of net investment income (loss) to | | | | | | | | | | | | | | | | | | | | |
| average net assets: | | | (0.26 | )% | | | (0.78 | )% | | | 0.56 | % | | | (1.21 | )% | | | (1.16 | )% |
Portfolio turnover rate(6) | | | 4 | % | | | 8 | % | | | 35 | % | | | 5 | % | | | 2 | % |
| (1) | Information presented relates to a share of capital stock outstanding for each year. |
| (2) | Net investment income per share represents net investment income divided by the average shares outstanding throughout the year. |
| (3) | Amount calculated is less than $0.005. |
| (4) | The total return calculation does not reflect the 5.75% front end sales charge on Advisor Class A shares. |
| (5) | See Note #3, Investment Adviser, for the waiver and expense reimbursement discussion. |
| (6) | Portfolio turnover of The Market Opportunities Portfolio. |
The accompanying notes are an integral part of these financial statements.
100
KINETICS MUTUAL FUNDS, INC. — THE FEEDER FUNDS
Financial Highlights — (Continued)
| | | | | | | | | | | | | | | | |
| | The Market Opportunities Fund | |
| | Advisor Class C
| |
| | For the | | | For the | | | For the | | | For the | | | For the | |
| | Year Ended | | | Year Ended | | | Year Ended | | | Year Ended | | | Year Ended | |
| | December 31,
| | | December 31,
| | | December 31,
| | | December 31,
| | | December 31,
| |
| | 2019 | | | 2018 | | | 2017 | | | 2016 | | | 2015 | |
| | |
PER SHARE DATA:(1) | | | | | | | | | | | | | | | |
| Net Asset Value, Beginning of Year | | $ | 20.61 | | | $ | 25.53 | | | $ | 17.51 | | | $ | 14.65 | | | $ | 16.24 | |
| Income from Investment Operations: | | | | | | | | | | | | | | | | | | | | |
Net investment income (loss)(2) | | | (0.18 | ) | | | (0.33 | ) | | | 0.01 | | | | (0.26 | ) | | | (0.27 | ) |
| Net realized and unrealized gain (loss) | | | | | | | | | | | | | | | | | | | | |
| on investments | | | 4.67 | | | | (2.60 | ) | | | 8.07 | | | | 3.12 | | | | (1.32 | ) |
| Total from Investment Operations | | | 4.49 | | | | (2.93 | ) | | | 8.08 | | | | 2.86 | | | | (1.59 | ) |
| Redemption Fees | | | — | | | | — | | | | — | | | | — | | | | — | |
| Less Distributions: | | | | | | | | | | | | | | | | | | | | |
| From net investment income | | | — | | | | — | | | | (0.06 | ) | | | — | | | | — | |
| From net realized gains | | | — | | | | (1.99 | ) | | | — | | | | — | | | | — | |
| Total Distributions | | | — | | | | (1.99 | ) | | | (0.06 | ) | | | — | | | | — | |
| Net Asset Value, End of Year | | $ | 25.10 | | | $ | 20.61 | | | $ | 25.53 | | | $ | 17.51 | | | $ | 14.65 | |
| Total return | | | 21.79 | % | | | (11.48 | )% | | | 46.12 | % | | | 19.52 | % | | | (9.79 | )% |
| | |
| SUPPLEMENTAL DATA AND RATIOS | | | | | | | | | | | | | | | | | | | | |
| Net assets, end of year (000’s) | | $ | 10,051 | | | $ | 8,517 | | | $ | 8,139 | | | $ | 4,428 | | | $ | 4,079 | |
| Ratio of operating expenses to average net assets: | | | | | | | | | | | | | | | | | | | | |
| Before expense reimbursement | | | 2.59 | % | | | 2.61 | % | | | 2.67 | % | | | 2.72 | % | | | 2.65 | % |
After expense reimbursement(3) | | | 2.15 | % | | | 2.39 | % | | | 2.39 | % | | | 2.39 | % | | | 2.39 | % |
| Ratio of net investment income (loss) to | | | | | | | | | | | | | | | | | | | | |
| average net assets: | | | (0.76 | )% | | | (1.28 | )% | | | 0.06 | % | | | (1.71 | )% | | | (1.66 | )% |
Portfolio turnover rate(4) | | | 4 | % | | | 8 | % | | | 35 | % | | | 5 | % | | | 2 | % |
| (1) | Information presented relates to a share of capital stock outstanding for each year. |
| (2) | Net investment income per share represents net investment income divided by the average shares outstanding throughout the year. |
| (3) | See Note #3, Investment Adviser, for the waiver and expense reimbursement discussion. |
| (4) | Portfolio turnover of The Market Opportunities Portfolio. |
The accompanying notes are an integral part of these financial statements.
101
KINETICS MUTUAL FUNDS, INC. — THE FEEDER FUNDS
Financial Highlights — (Continued)
| | | | | | | | | | | | | | | | |
| | The Market Opportunities Fund | |
| | Institutional Class
| |
| | For the | | | For the | | | For the | | | For the | | | For the | |
| | Year Ended | | | Year Ended | | | Year Ended | | | Year Ended | | | Year Ended | |
| | December 31,
| | | December 31,
| | | December 31,
| | | December 31,
| | | December 31,
| |
| | 2019 | | | 2018 | | | 2017 | | | 2016 | | | 2015 | |
| | |
PER SHARE DATA:(1) | | | | | | | | | | | | | | | |
| Net Asset Value, Beginning of Year | | $ | 22.16 | | | $ | 27.04 | | | $ | 18.46 | | | $ | 15.29 | | | $ | 16.80 | |
| Income from Investment Operations: | | | | | | | | | | | | | | | | | | | | |
Net investment income (loss)(2) | | | 0.05 | | | | (0.09 | ) | | | 0.22 | | | | (0.12 | ) | | | (0.12 | ) |
| Net realized and unrealized gain (loss) | | | | | | | | | | | | | | | | | | | | |
| on investments | | | 5.04 | | | | (2.81 | ) | | | 8.55 | | | | 3.29 | | | | (1.39 | ) |
| Total from Investment Operations | | | 5.09 | | | | (2.90 | ) | | | 8.77 | | | | 3.17 | | | | (1.51 | ) |
| Redemption Fees | | | 0.00 | (3) | | | 0.01 | | | | 0.02 | | | | — | | | | — | |
| Less Distributions: | | | | | | | | | | | | | | | | | | | | |
| From net investment income | | | (0.14 | ) | | | — | | | | (0.21 | ) | | | — | | | | — | |
| From net realized gains | | | — | | | | (1.99 | ) | | | — | | | | — | | | | — | |
| Total Distributions | | | (0.14 | ) | | | (1.99 | ) | | | (0.21 | ) | | | — | | | | — | |
| Net Asset Value, End of Year | | $ | 27.11 | | | $ | 22.16 | | | $ | 27.04 | | | $ | 18.46 | | | $ | 15.29 | |
| Total return | | | 22.98 | % | | | (10.70 | )% | | | 47.65 | % | | | 20.73 | % | | | (8.93 | )% |
| | |
| SUPPLEMENTAL DATA AND RATIOS | | | | | | | | | | | | | | | | | | | | |
| Net assets, end of year (000’s) | | $ | 12,534 | | | $ | 9,471 | | | $ | 10,228 | | | $ | 2,426 | | | $ | 2,355 | |
| Ratio of operating expenses to average net assets: | | | | | | | | | | | | | | | | | | | | |
| Before expense reimbursement | | | 1.79 | % | | | 1.81 | % | | | 1.87 | % | | | 1.92 | % | | | 1.85 | % |
After expense reimbursement(4) | | | 1.20 | % | | | 1.44 | % | | | 1.44 | % | | | 1.44 | % | | | 1.44 | % |
| Ratio of net investment income (loss) to | | | | | | | | | | | | | | | | | | | | |
| average net assets: | | | 0.19 | % | | | (0.33 | )% | | | 1.01 | % | | | (0.76 | )% | | | (0.71 | )% |
Portfolio turnover rate(5) | | | 4 | % | | | 8 | % | | | 35 | % | | | 5 | % | | | 2 | % |
| (1) | Information presented relates to a share of capital stock outstanding for each year. |
| (2) | Net investment income per share represents net investment income divided by the average shares outstanding throughout the year. |
| (3) | Amount calculated is less than $0.005. |
| (4) | See Note #3, Investment Adviser, for the waiver and expense reimbursement discussion. |
| (5) | Portfolio turnover of The Market Opportunities Portfolio. |
The accompanying notes are an integral part of these financial statements.
102
KINETICS MUTUAL FUNDS, INC. — THE FEEDER FUNDS
Financial Highlights — (Continued)
| | | | | | | | | | | | | | | | |
| | The Alternative Income Fund | |
| | No Load Class | |
| | For the | | | For the | | | For the | | | For the | | | For the | |
| | Year Ended | | | Year Ended | | | Year Ended | | | Year Ended | | | Year Ended | |
| | December 31,
| | | December 31,
| | | December 31,
| | | December 31,
| | | December 31,
| |
| | 2019 | | | 2018 | | | 2017 | | | 2016 | | | 2015 | |
| | |
PER SHARE DATA:(1) | | | | | | | | | | | | | | | |
| Net Asset Value, Beginning of Year | | $ | 97.46 | | | $ | 97.57 | | | $ | 95.36 | | | $ | 91.68 | | | $ | 89.06 | |
| Income from Investment Operations: | | | | | | | | | | | | | | | | | | | | |
Net investment income (loss)(2) | | | 1.39 | | | | 0.92 | | | | 0.08 | | | | (0.01 | ) | | | 0.01 | |
| Net realized and unrealized gain (loss) | | | | | | | | | | | | | | | | | | | | |
| on investments | | | 1.01 | | | | (0.03 | ) | | | 2.12 | | | | 3.69 | | | | 2.56 | |
| Total from Investment Operations | | | 2.40 | | | | 0.89 | | | | 2.20 | | | | 3.68 | | | | 2.57 | |
| Redemption Fees | | | — | | | | 0.01 | | | | 0.01 | | | | 0.00 | (3) | | | 0.05 | |
| Less Distributions: | | | | | | | | | | | | | | | | | | | | |
| From net investment income | | | (1.58 | ) | | | (1.01 | ) | | | — | | | | — | | | | — | |
| Total Distributions | | | (1.58 | ) | | | (1.01 | ) | | | — | | | | — | | | | — | |
| Net Asset Value, End of Year | | $ | 98.28 | | | $ | 97.46 | | | $ | 97.57 | | | $ | 95.36 | | | $ | 91.68 | |
| Total return | | | 2.47 | % | | | 0.92 | % | | | 2.32 | % | | | 4.00 | % | | | 2.94 | % |
| | |
| SUPPLEMENTAL DATA AND RATIOS | | | | | | | | | | | | | | | | | | | | |
| Net assets, end of year (000’s) | | $ | 3,482 | | | $ | 4,265 | | | $ | 4,968 | | | $ | 5,664 | | | $ | 4,570 | |
| Ratio of operating expenses to average net assets: | | | | | | | | | | | | | | | | | | | | |
| Before expense reimbursement | | | 2.01 | % | | | 1.88 | % | | | 1.75 | % | | | 1.78 | % | | | 1.74 | % |
After expense reimbursement(4) | | | 0.95 | % | | | 0.95 | % | | | 0.95 | % | | | 0.95 | % | | | 0.95 | % |
| Ratio of net investment income (loss) to | | | | | | | | | | | | | | | | | | | | |
| average net assets: | | | 1.41 | % | | | 0.94 | % | | | 0.08 | % | | | (0.01 | )% | | | 0.01 | % |
Portfolio turnover rate(5) | | | 0 | % | | | 0 | % | | | 0 | % | | | 1 | % | | | 6 | % |
| (1) | Information presented relates to a share of capital stock outstanding for each year. |
| (2) | Net investment income per share represents net investment income divided by the average shares outstanding throughout the year. |
| (3) | Amount calculated is less than $0.005. |
| (4) | See Note #3, Investment Adviser, for the waiver and expense reimbursement discussion. |
| (5) | Portfolio turnover of The Alternative Income Portfolio. |
The accompanying notes are an integral part of these financial statements.
103
KINETICS MUTUAL FUNDS, INC. — THE FEEDER FUNDS
Financial Highlights — (Continued)
| | | | | | | | | | | | | | | | |
| | The Alternative Income Fund | |
| | Advisor Class A | |
| | For the | | | For the | | | For the | | | For the | | | For the | |
| | Year Ended | | | Year Ended | | | Year Ended | | | Year Ended | | | Year Ended | |
| | December 31,
| | | December 31,
| | | December 31,
| | | December 31,
| | | December 31,
| |
| | 2019 | | | 2018 | | | 2017 | | | 2016 | | | 2015 | |
| | |
PER SHARE DATA:(1) | | | | | | | | | | | | | | | |
| Net Asset Value, Beginning of Year | | $ | 96.24 | | | $ | 96.38 | | | $ | 94.44 | | | $ | 91.02 | | | $ | 88.69 | |
| Income from Investment Operations: | | | | | | | | | | | | | | | | | | | | |
Net investment income (loss)(2) | | | 1.13 | | | | 0.66 | | | | (0.16 | ) | | | (0.24 | ) | | | (0.22 | ) |
| Net realized and unrealized gain (loss) | | | | | | | | | | | | | | | | | | | | |
| on investments | | | 1.00 | | | | (0.03 | ) | | | 2.10 | | | | 3.65 | | | | 2.55 | |
| Total from Investment Operations | | | 2.13 | | | | 0.63 | | | | 1.94 | | | | 3.41 | | | | 2.33 | |
| Redemption Fees | | | — | | | | — | | | | 0.00 | (3) | | | 0.01 | | | | — | |
| Less Distributions: | | | | | | | | | | | | | | | | | | | | |
| From net investment income | | | (1.33 | ) | | | (0.77 | ) | | | — | | | | — | | | | — | |
| Total Distributions | | | (1.33 | ) | | | (0.77 | ) | | | — | | | | — | | | | — | |
| Net Asset Value, End of Year | | $ | 97.04 | | | $ | 96.24 | | | $ | 96.38 | | | $ | 94.44 | | | $ | 91.02 | |
Total return(4) | | | 2.22 | % | | | 0.65 | % | | | 2.05 | % | | | 3.76 | % | | | 2.63 | % |
| | |
| SUPPLEMENTAL DATA AND RATIOS | | | | | | | | | | | | | | | | | | | | |
| Net assets, end of year (000’s) | | $ | 856 | | | $ | 932 | | | $ | 1,501 | | | $ | 2,458 | | | $ | 1,565 | |
| Ratio of operating expenses to average net assets: | | | | | | | | | | | | | | | | | | | | |
| Before expense reimbursement | | | 2.26 | % | | | 2.13 | % | | | 2.00 | % | | | 2.03 | % | | | 1.99 | % |
After expense reimbursement(5) | | | 1.20 | % | | | 1.20 | % | | | 1.20 | % | | | 1.20 | % | | | 1.20 | % |
| Ratio of net investment income (loss) to | | | | | | | | | | | | | | | | | | | | |
| average net assets: | | | 1.16 | % | | | 0.69 | % | | | (0.17 | )% | | | (0.26 | )% | | | (0.24 | )% |
Portfolio turnover rate(6) | | | 0 | % | | | 0 | % | | | 0 | % | | | 1 | % | | | 6 | % |
| (1) | Information presented relates to a share of capital stock outstanding for each year. |
| (2) | Net investment income per share represents net investment income divided by the average shares outstanding throughout the year. |
| (3) | Amount calculated is less than $0.005. |
| (4) | The total return calculation does not reflect the 5.75% front end sales charge on Advisor Class A shares. |
| (5) | See Note #3, Investment Adviser, for the waiver and expense reimbursement discussion. |
| (6) | Portfolio turnover of The Alternative Income Portfolio. |
The accompanying notes are an integral part of these financial statements.
104
KINETICS MUTUAL FUNDS, INC. — THE FEEDER FUNDS
Financial Highlights — (Continued)
| | | | | | | | | | | | | | | | |
| | The Alternative Income Fund | |
| | Advisor Class C
| |
| | For the | | | For the | | | For the | | | For the | | | For the | |
| | Year Ended | | | Year Ended | | | Year Ended | | | Year Ended | | | Year Ended | |
| | December 31,
| | | December 31,
| | | December 31,
| | | December 31,
| | | December 31,
| |
| | 2019 | | | 2018 | | | 2017 | | | 2016 | | | 2015 | |
| | |
PER SHARE DATA:(1) | | | | | | | | | | | | | | | |
| Net Asset Value, Beginning of Year | | $ | 92.65 | | | $ | 92.73 | | | $ | 91.33 | | | $ | 88.46 | | | $ | 86.60 | |
| Income from Investment Operations: | | | | | | | | | | | | | | | | | | | | |
Net investment income (loss)(2) | | | 0.62 | | | | 0.17 | | | | (0.62 | ) | | | (0.68 | ) | | | (0.65 | ) |
| Net realized and unrealized gain (loss) | | | | | | | | | | | | | | | | | | | | |
| on investments | | | 0.98 | | | | (0.04 | ) | | | 2.02 | | | | 3.55 | | | | 2.48 | |
| Total from Investment Operations | | | 1.60 | | | | 0.13 | | | | 1.40 | | | | 2.87 | | | | 1.83 | |
| Redemption Fees | | | — | | | | — | | | | — | | | | — | | | | 0.03 | |
| Less Distributions: | | | | | | | | | | | | | | | | | | | | |
| From net investment income | | | (0.84 | ) | | | (0.21 | ) | | | — | | | | — | | | | — | |
| Total Distributions | | | (0.84 | ) | | | (0.21 | ) | | | — | | | | — | | | | — | |
| Net Asset Value, End of Year | | $ | 93.41 | | | $ | 92.65 | | | $ | 92.73 | | | $ | 91.33 | | | $ | 88.46 | |
| Total return | | | 1.71 | % | | | 0.15 | % | | | 1.53 | % | | | 3.23 | % | | | 2.15 | % |
| | |
| SUPPLEMENTAL DATA AND RATIOS | | | | | | | | | | | | | | | | | | | | |
| Net assets, end of year (000’s) | | $ | 711 | | | $ | 1,107 | | | $ | 1,513 | | | $ | 1,640 | | | $ | 1,356 | |
| Ratio of operating expenses to average net assets: | | | | | | | | | | | | | | | | | | | | |
| Before expense reimbursement | | | 2.76 | % | | | 2.63 | % | | | 2.50 | % | | | 2.53 | % | | | 2.49 | % |
After expense reimbursement(3) | | | 1.70 | % | | | 1.70 | % | | | 1.70 | % | | | 1.70 | % | | | 1.70 | % |
| Ratio of net investment income (loss) to | | | | | | | | | | | | | | | | | | | | |
| average net assets: | | | 0.66 | % | | | 0.19 | % | | | (0.67 | )% | | | (0.76 | )% | | | (0.74 | )% |
Portfolio turnover rate(4) | | | 0 | % | | | 0 | % | | | 0 | % | | | 1 | % | | | 6 | % |
| (1) | Information presented relates to a share of capital stock outstanding for each year. |
| (2) | Net investment income per share represents net investment income divided by the average shares outstanding throughout the year. |
| (3) | See Note #3, Investment Adviser, for the waiver and expense reimbursement discussion. |
| (4) | Portfolio turnover of The Alternative Income Portfolio. |
The accompanying notes are an integral part of these financial statements.
105
KINETICS MUTUAL FUNDS, INC. — THE FEEDER FUNDS
Financial Highlights — (Continued)
| | | | | | | | | | | | | | | | |
| | The Alternative Income Fund | |
| | Institutional Class
| |
| | For the | | | For the | | | For the | | | For the | | | For the | |
| | Year Ended | | | Year Ended | | | Year Ended | | | Year Ended | | | Year Ended | |
| | December 31,
| | | December 31,
| | | December 31,
| | | December 31,
| | | December 31,
| |
| | 2019 | | | 2018 | | | 2017 | | | 2016 | | | 2015 | |
| | |
PER SHARE DATA:(1) | | | | | | | | | | | | | | | |
| Net Asset Value, Beginning of Year | | $ | 98.73 | | | $ | 98.88 | | | $ | 96.66 | | | $ | 92.84 | | | $ | 90.14 | |
| Income from Investment Operations: | | | | | | | | | | | | | | | | | | | | |
Net investment income(2) | | | 1.61 | | | | 1.13 | | | | 0.27 | | | | 0.18 | | | | 0.19 | |
| Net realized and unrealized gain (loss) | | | | | | | | | | | | | | | | | | | | |
| on investments | | | 1.03 | | | | (0.05 | ) | | | 2.16 | | | | 3.75 | | | | 2.60 | |
| Total from Investment Operations | | | 2.64 | | | | 1.08 | | | | 2.43 | | | | 3.93 | | | | 2.79 | |
Redemption Fees(3) | | | 0.00 | | | | 0.00 | | | | 0.00 | | | | 0.00 | | | | 0.00 | |
| Less Distributions: | | | | | | | | | | | | | | | | | | | | |
| From net investment income | | | (1.78 | ) | | | (1.23 | ) | | | (0.21 | ) | | | (0.11 | ) | | | (0.09 | ) |
| Total Distributions | | | (1.78 | ) | | | (1.23 | ) | | | (0.21 | ) | | | (0.11 | ) | | | (0.09 | ) |
| Net Asset Value, End of Year | | $ | 99.59 | | | $ | 98.73 | | | $ | 98.88 | | | $ | 96.66 | | | $ | 92.84 | |
| Total return | | | 2.69 | % | | | 1.10 | % | | | 2.51 | % | | | 4.22 | % | | | 3.09 | % |
| | |
| SUPPLEMENTAL DATA AND RATIOS | | | | | | | | | | | | | | | | | | | | |
| Net assets, end of year (000’s) | | $ | 11,368 | | | $ | 12,718 | | | $ | 15,008 | | | $ | 18,165 | | | $ | 20,255 | |
| Ratio of operating expenses to average net assets: | | | | | | | | | | | | | | | | | | | | |
| Before expense reimbursement | | | 1.96 | % | | | 1.83 | % | | | 1.70 | % | | | 1.73 | % | | | 1.69 | % |
After expense reimbursement(4) | | | 0.75 | % | | | 0.75 | % | | | 0.75 | % | | | 0.75 | % | | | 0.75 | % |
| Ratio of net investment income to | | | | | | | | | | | | | | | | | | | | |
| average net assets: | | | 1.61 | % | | | 1.14 | % | | | 0.28 | % | | | 0.19 | % | | | 0.21 | % |
Portfolio turnover rate(5) | | | 0 | % | | | 0 | % | | | 0 | % | | | 1 | % | | | 6 | % |
| (1) | Information presented relates to a share of capital stock outstanding for each year. |
| (2) | Net investment income per share represents net investment income divided by the average shares outstanding throughout the year. |
| (3) | Amount calculated is less than $0.005. |
| (4) | See Note #3, Investment Adviser, for the waiver and expense reimbursement discussion. |
| (5) | Portfolio turnover of The Alternative Income Portfolio. |
The accompanying notes are an integral part of these financial statements.
106
KINETICS MUTUAL FUNDS, INC. — THE FEEDER FUNDS
Financial Highlights — (Continued)
| | | | | | | | | | | | | | | | |
| | The Multi-Disciplinary Income Fund | |
| | No Load Class
| |
| | For the | | | For the | | | For the | | | For the | | | For the | |
| | Year Ended | | | Year Ended | | | Year Ended | | | Year Ended | | | Year Ended | |
| | December 31,
| | | December 31,
| | | December 31,
| | | December 31,
| | | December 31,
| |
| | 2019 | | | 2018 | | | 2017 | | | 2016 | | | 2015 | |
| | |
PER SHARE DATA:(1) | | | | | | | | | | | | | | | |
| Net Asset Value, Beginning of Year | | $ | 10.46 | | | $ | 11.02 | | | $ | 10.95 | | | $ | 10.32 | | | $ | 10.79 | |
| Income from Investment Operations: | | | | | | | | | | | | | | | | | | | | |
Net investment income(2) | | | 0.45 | | | | 0.44 | | | | 0.37 | | | | 0.43 | | | | 0.37 | |
| Net realized and unrealized gain (loss) | | | | | | | | | | | | | | | | | | | | |
| on investments | | | 0.49 | | | | (0.55 | ) | | | 0.14 | | | | 0.63 | | | | (0.60 | ) |
| Total from Investment Operations | | | 0.94 | | | | (0.11 | ) | | | 0.51 | | | | 1.06 | | | | (0.23 | ) |
| Redemption Fees | | | 0.00 | (3) | | | — | | | | 0.00 | (3) | | | — | | | | 0.00 | (3) |
| Less Distributions: | | | | | | | | | | | | | | | | | | | | |
| From net investment income | | | (0.45 | ) | | | (0.45 | ) | | | (0.44 | ) | | | (0.43 | ) | | | (0.23 | ) |
| From net realized gains | | | — | | | | — | | | | — | | | | — | | | | (0.01 | ) |
| Total Distributions | | | (0.45 | ) | | | (0.45 | ) | | | (0.44 | ) | | | (0.43 | ) | | | (0.24 | ) |
| Net Asset Value, End of Year | | $ | 10.95 | | | $ | 10.46 | | | $ | 11.02 | | | $ | 10.95 | | | $ | 10.32 | |
| Total return | | | 9.08 | % | | | (1.00 | )% | | | 4.75 | % | | | 10.41 | % | | | (2.17 | )% |
| | |
| SUPPLEMENTAL DATA AND RATIOS | | | | | | | | | | | | | | | | | | | | |
| Net assets, end of year (000’s) | | $ | 6,025 | | | $ | 6,134 | | | $ | 6,974 | | | $ | 6,809 | | | $ | 6,108 | |
| Ratio of operating expenses to average net assets: | | | | | | | | | | | | | | | | | | | | |
| Before expense reimbursement | | | 2.04 | % | | | 1.97 | % | | | 1.91 | % | | | 1.85 | % | | | 1.79 | % |
After expense reimbursement(4) | | | 1.49 | % | | | 1.49 | % | | | 1.49 | % | | | 1.49 | % | | | 1.49 | % |
| Ratio of net investment income to | | | | | | | | | | | | | | | | | | | | |
| average net assets: | | | 4.10 | % | | | 4.06 | % | | | 3.37 | % | | | 4.02 | % | | | 3.38 | % |
Portfolio turnover rate(5) | | | 0 | % | | | 2 | % | | | 16 | % | | | 9 | % | | | 10 | % |
| (1) | Information presented relates to a share of capital stock outstanding for each year. |
| (2) | Net investment income per share represents net investment income divided by the average shares outstanding throughout the year. |
| (3) | Amount calculated is less than $0.005. |
| (4) | See Note #3, Investment Adviser, for the waiver and expense reimbursement discussion. |
| (5) | Portfolio turnover of The Multi-Disciplinary Income Portfolio. |
The accompanying notes are an integral part of these financial statements.
107
KINETICS MUTUAL FUNDS, INC. — THE FEEDER FUNDS
Financial Highlights — (Continued)
| | | | | | | | | | | | | | | | |
| | The Multi-Disciplinary Income Fund | |
| | Advisor Class A
| |
| | For the | | | For the | | | For the | | | For the | | | For the | |
| | Year Ended | | | Year Ended | | | Year Ended | | | Year Ended | | | Year Ended | |
| | December 31,
| | | December 31,
| | | December 31,
| | | December 31,
| | | December 31,
| |
| | 2019 | | | 2018 | | | 2017 | | | 2016 | | | 2015 | |
| | |
PER SHARE DATA:(1) | | | | | | | | | | | | | | | |
| Net Asset Value, Beginning of Year | | $ | 10.41 | | | $ | 10.96 | | | $ | 10.90 | | | $ | 10.27 | | | $ | 10.75 | |
| Income from Investment Operations: | | | | | | | | | | | | | | | | | | | | |
Net investment income(2) | | | 0.42 | | | | 0.41 | | | | 0.34 | | | | 0.40 | | | | 0.34 | |
| Net realized and unrealized gain (loss) | | | | | | | | | | | | | | | | | | | | |
| on investments | | | 0.49 | | | | (0.54 | ) | | | 0.13 | | | | 0.63 | | | | (0.60 | ) |
| Total from Investment Operations | | | 0.91 | | | | (0.13 | ) | | | 0.47 | | | | 1.03 | | | | (0.26 | ) |
| Redemption Fees | | | — | | | | — | | | | 0.00 | (3) | | | — | | | | 0.00 | (3) |
| Less Distributions: | | | | | | | | | | | | | | | | | | | | |
| From net investment income | | | (0.42 | ) | | | (0.42 | ) | | | (0.41 | ) | | | (0.40 | ) | | | (0.21 | ) |
| From net realized gains | | | — | | | | — | | | | — | | | | — | | | | (0.01 | ) |
| Total Distributions | | | (0.42 | ) | | | (0.42 | ) | | | (0.41 | ) | | | (0.40 | ) | | | (0.22 | ) |
| Net Asset Value, End of Year | | $ | 10.90 | | | $ | 10.41 | | | $ | 10.96 | | | $ | 10.90 | | | $ | 10.27 | |
Total return(4) | | | 8.81 | % | | | (1.18 | )% | | | 4.40 | % | | | 10.17 | % | | | (2.46 | )% |
| | |
| SUPPLEMENTAL DATA AND RATIOS | | | | | | | | | | | | | | | | | | | | |
| Net assets, end of year (000’s) | | $ | 1,852 | | | $ | 2,811 | | | $ | 4,640 | | | $ | 6,935 | | | $ | 8,754 | |
| Ratio of operating expenses to average net assets: | | | | | | | | | | | | | | | | | | | | |
| Before expense reimbursement | | | 2.29 | % | | | 2.22 | % | | | 2.16 | % | | | 2.10 | % | | | 2.04 | % |
After expense reimbursement(5) | | | 1.74 | % | | | 1.74 | % | | | 1.74 | % | | | 1.74 | % | | | 1.74 | % |
| Ratio of net investment income to | | | | | | | | | | | | | | | | | | | | |
| average net assets: | | | 3.85 | % | | | 3.81 | % | | | 3.12 | % | | | 3.77 | % | | | 3.13 | % |
Portfolio turnover rate(6) | | | 0 | % | | | 2 | % | | | 16 | % | | | 9 | % | | | 10 | % |
| (1) | Information presented relates to a share of capital stock outstanding for each year. |
| (2) | Net investment income per share represents net investment income divided by the average shares outstanding throughout the year. |
| (3) | Amount calculated is less than $0.005. |
| (4) | The total return calculation does not reflect the 5.75% front end sales charge on Advisor Class A shares. |
| (5) | See Note #3, Investment Adviser, for the waiver and expense reimbursement discussion. |
| (6) | Portfolio turnover of The Multi-Disciplinary Income Portfolio. |
The accompanying notes are an integral part of these financial statements.
108
KINETICS MUTUAL FUNDS, INC. — THE FEEDER FUNDS
Financial Highlights — (Continued)
| | | | | | | | | | | | | | | | |
| | The Multi-Disciplinary Income Fund | |
| | Advisor Class C
| |
| | For the | | | For the | | | For the | | | For the | | | For the | |
| | Year Ended | | | Year Ended | | | Year Ended | | | Year Ended | | | Year Ended | |
| | December 31,
| | | December 31,
| | | December 31,
| | | December 31,
| | | December 31,
| |
| | 2019 | | | 2018 | | | 2017 | | | 2016 | | | 2015 | |
| | |
PER SHARE DATA:(1) | | | | | | | | | | | | | | | |
| Net Asset Value, Beginning of Year | | $ | 10.29 | | | $ | 10.86 | | | $ | 10.79 | | | $ | 10.18 | | | $ | 10.65 | |
| Income from Investment Operations: | | | | | | | | | | | | | | | | | | | | |
Net investment income(2) | | | 0.36 | | | | 0.35 | | | | 0.29 | | | | 0.34 | | | | 0.28 | |
| Net realized and unrealized gain (loss) | | | | | | | | | | | | | | | | | | | | |
| on investments | | | 0.50 | | | | (0.54 | ) | | | 0.14 | | | | 0.62 | | | | (0.58 | ) |
| Total from Investment Operations | | | 0.86 | | | | (0.19 | ) | | | 0.43 | | | | 0.96 | | | | (0.30 | ) |
| Redemption Fees | | | — | | | | — | | | | — | | | | — | | | | — | |
| Less Distributions: | | | | | | | | | | | | | | | | | | | | |
| From net investment income | | | (0.37 | ) | | | (0.38 | ) | | | (0.36 | ) | | | (0.35 | ) | | | (0.16 | ) |
| From net realized gains | | | — | | | | — | | | | — | | | | — | | | | (0.01 | ) |
| Total Distributions | | | (0.37 | ) | | | (0.38 | ) | | | (0.36 | ) | | | (0.35 | ) | | | (0.17 | ) |
| Net Asset Value, End of Year | | $ | 10.78 | | | $ | 10.29 | | | $ | 10.86 | | | $ | 10.79 | | | $ | 10.18 | |
| Total return | | | 8.40 | % | | | (1.83 | )% | | | 4.00 | % | | | 9.51 | % | | | (2.84 | )% |
| | |
| SUPPLEMENTAL DATA AND RATIOS | | | | | | | | | | | | | | | | | | | | |
| Net assets, end of year (000’s) | | $ | 6,831 | | | $ | 7,727 | | | $ | 6,987 | | | $ | 7,790 | | | $ | 9,266 | |
| Ratio of operating expenses to average net assets: | | | | | | | | | | | | | | | | | | | | |
| Before expense reimbursement | | | 2.79 | % | | | 2.72 | % | | | 2.66 | % | | | 2.60 | % | | | 2.54 | % |
After expense reimbursement(3) | | | 2.24 | % | | | 2.24 | % | | | 2.24 | % | | | 2.24 | % | | | 2.24 | % |
| Ratio of net investment income to | | | | | | | | | | | | | | | | | | | | |
| average net assets: | | | 3.35 | % | | | 3.31 | % | | | 2.62 | % | | | 3.27 | % | | | 2.63 | % |
Portfolio turnover rate(4) | | | 0 | % | | | 2 | % | | | 16 | % | | | 9 | % | | | 10 | % |
| (1) | Information presented relates to a share of capital stock outstanding for each year. |
| (2) | Net investment income per share represents net investment income divided by the average shares outstanding throughout the year. |
| (3) | See Note #3, Investment Adviser, for the waiver and expense reimbursement discussion. |
| (4) | Portfolio turnover of The Multi-Disciplinary Income Portfolio. |
The accompanying notes are an integral part of these financial statements.
109
KINETICS MUTUAL FUNDS, INC. ��� THE FEEDER FUNDS
Financial Highlights — (Continued)
| | | | | | | | | | | | | | | | |
| | The Multi-Disciplinary Income Fund | |
| | Institutional Class
| |
| | For the | | | For the | | | For the | | | For the | | | For the | |
| | Year Ended | | | Year Ended | | | Year Ended | | | Year Ended | | | Year Ended | |
| | December 31,
| | | December 31,
| | | December 31,
| | | December 31,
| | | December 31,
| |
| | 2019 | | | 2018 | | | 2017 | | | 2016 | | | 2015 | |
| | |
PER SHARE DATA:(1) | | | | | | | | | | | | | | | |
| Net Asset Value, Beginning of Year | | $ | 10.48 | | | $ | 11.04 | | | $ | 10.97 | | | $ | 10.34 | | | $ | 10.82 | |
| Income from Investment Operations: | | | | | | | | | | | | | | | | | | | | |
Net investment income(2) | | | 0.47 | | | | 0.46 | | | | 0.40 | | | | 0.45 | | | | 0.39 | |
| Net realized and unrealized gain (loss) | | | | | | | | | | | | | | | | | | | | |
| on investments | | | 0.50 | | | | (0.54 | ) | | | 0.13 | | | | 0.63 | | | | (0.59 | ) |
| Total from Investment Operations | | | 0.97 | | | | (0.08 | ) | | | 0.53 | | | | 1.08 | | | | (0.20 | ) |
| Redemption Fees | | | — | | | | — | | | | — | | | | 0.00 | (3) | | | 0.00 | (3) |
| Less Distributions: | | | | | | | | | | | | | | | | | | | | |
| From net investment income | | | (0.47 | ) | | | (0.48 | ) | | | (0.46 | ) | | | (0.45 | ) | | | (0.27 | ) |
| From net realized gains | | | — | | | | — | | | | — | | | | — | | | | (0.01 | ) |
| Total Distributions | | | (0.47 | ) | | | (0.48 | ) | | | (0.46 | ) | | | (0.45 | ) | | | (0.28 | ) |
| Net Asset Value, End of Year | | $ | 10.98 | | | $ | 10.48 | | | $ | 11.04 | | | $ | 10.97 | | | $ | 10.34 | |
| Total return | | | 9.38 | % | | | (0.80 | )% | | | 4.93 | % | | | 10.61 | % | | | (1.96 | )% |
| | |
| SUPPLEMENTAL DATA AND RATIOS | | | | | | | | | | | | | | | | | | | | |
| Net assets, end of year (000’s) | | $ | 20,314 | | | $ | 20,567 | | | $ | 30,399 | | | $ | 78,084 | | | $ | 66,199 | |
| Ratio of operating expenses to average net assets: | | | | | | | | | | | | | | | | | | | | |
| Before expense reimbursement | | | 1.99 | % | | | 1.92 | % | | | 1.86 | % | | | 1.80 | % | | | 1.74 | % |
After expense reimbursement(4) | | | 1.29 | % | | | 1.29 | % | | | 1.29 | % | | | 1.29 | % | | | 1.29 | % |
| Ratio of net investment income to | | | | | | | | | | | | | | | | | | | | |
| average net assets: | | | 4.30 | % | | | 4.26 | % | | | 3.57 | % | | | 4.22 | % | | | 3.58 | % |
Portfolio turnover rate(5) | | | 0 | % | | | 2 | % | | | 16 | % | | | 9 | % | | | 10 | % |
| (1) | Information presented relates to a share of capital stock outstanding for each year. |
| (2) | Net investment income per share represents net investment income divided by the average shares outstanding throughout the year. |
| (3) | Amount calculated is less than $0.005. |
| (4) | See Note #3, Investment Adviser, for the waiver and expense reimbursement discussion. |
| (5) | Portfolio turnover of The Multi-Disciplinary Income Portfolio. |
The accompanying notes are an integral part of these financial statements.
110
| | | | | | | | | | |
| KINETICS MUTUAL FUNDS, INC. — THE FUND | | | | | | | | | |
| | |
Financial Highlights — (Continued) | | | | | | | |
| | |
| | |
| | The Spin-off Fund | |
| | No Load Class | |
| | | | | | | | December 11, | |
| | For the | | | For the | | | 2017^ | |
| | Year Ended | | | Year Ended | | | through | |
| | December 31, | | | December 31,
| | | December 31, | |
| | 2019 | | | 2018 | | | 2017 | |
PER SHARE DATA:(1) | | | | | | | | | |
| Net Asset Value, Beginning of Period | | $ | 9.77 | | | $ | 11.14 | | | $ | 10.81 | |
| Income from Investment Operations: | | | | | | | | | | | | |
Net investment income (loss)(2) | | | (0.00 | )(3) | | | (0.08 | ) | | | 0.00 | (3) |
| Net realized and unrealized gain (loss) on investments | | | 3.06 | | | | (0.84 | ) | | | 0.33 | |
| Total from Investment Operations | | | 3.06 | | | | (0.92 | ) | | | 0.33 | |
| Redemption Fees | | | — | | | | — | | | | — | |
| Less Distributions: | | | | | | | | | | | | |
| From net realized gains | | | — | | | | (0.45 | ) | | | — | |
| Total Distributions | | | — | | | | (0.45 | ) | | | — | |
| Net Asset Value, End of Period | | $ | 12.83 | | | $ | 9.77 | | | $ | 11.14 | |
| Total return | | | 31.32 | % | | | (8.22 | )% | | | 3.05 | %(4) |
| | |
| SUPPLEMENTAL DATA AND RATIOS | | | | | | | | | | | | |
| Net assets, end of period (000’s) | | $ | 60 | | | $ | 11 | | | $ | 10 | |
| Ratio of operating expenses to average net assets: | | | | | | | | | | | | |
| Before expense reimbursement | | | 1.96 | % | | | 1.81 | % | | | 1.70 | %(5) |
After expense reimbursement(6) | | | 1.45 | % | | | 1.45 | % | | | 1.45 | %(5) |
| Ratio of net investment loss to average net assets: | | | (0.04 | )% | | | (0.63 | )% | | | (0.61 | )%(5) |
| Portfolio turnover rate | | | 2 | % | | | 9 | % | | | 0 | %(4) |
| ^ | Commencement of operations. |
| (1) | Information presented relates to a share of capital stock outstanding for each period. |
| (2) | Net investment income per share represents net investment income divided by the average shares outstanding throughout the period. |
| (3) | Amount calculated is less than $0.005. |
| (4) | Not annualized. |
| (5) | Annualized. |
| (6) | See Note #3, Investment Adviser, for the waiver and expense reimbursement discussion. |
The accompanying notes are an integral part of these financial statements.
111
| |
KINETICS MUTUAL FUNDS, INC. — THE FUND |
|
Financial Highlights — (Continued) |
|
| | |
| | The Spin-off Fund
| |
| | Advisor Class A
| |
| | For the | | | For the | | | For the | | | For the | | | For the | | | For the | |
| | Year Ended | | | Year Ended | | | Period Ended | | | Year Ended | | | Year Ended | | | Year Ended | |
| | December 31,
| | | December 31, | | | December 31, | | | April 30, | | | April 30, | | | April 30, | |
| | 2019 | | | 2018 | | | 2017^ | | | 2017 | | | 2016 | | | 2015 | |
| | |
PER SHARE DATA:(1) | | | | | | | | | | | | | | | | | | |
| Net Asset Value, Beginning | | | | | | | | | | | | | | | | | | |
| of Period | | $ | 9.33 | | | $ | 10.67 | | | $ | 9.82 | | | $ | 8.52 | | | $ | 10.22 | | | $ | 10.32 | |
| Income from Investment Operations: | | | | | | | | | | | | | | | | | | | | | | | | |
Net investment income (loss)(2) | | | (0.01 | ) | | | (0.08 | ) | | | (0.02 | ) | | | 0.03 | | | | 0.00 | (3) | | | (0.03 | ) |
| Net realized and unrealized gain | | | | | | | | | | | | | | | | | | | | | | | | |
| (loss) on investments | | | 2.93 | | | | (0.81 | ) | | | 1.29 | | | | 1.45 | | | | (1.70 | ) | | | (0.07 | ) |
| Total from Investment | | | | | | | | | | | | | | | | | | | | | | | | |
| Operations | | | 2.92 | | | | (0.89 | ) | | | 1.27 | | | | 1.48 | | | | (1.70 | ) | | | (0.10 | ) |
| Redemption Fees | | | — | | | | — | | | | — | | | | — | | | | — | | | | — | |
| Less Distributions: | | | | | | | | | | | | | | | | | | | | | | | | |
| From net investment income | | | — | | | | — | | | | 0.00 | (3) | | | — | | | | — | | | | — | |
| From net realized gains | | | — | | | | (0.45 | ) | | | (0.42 | ) | | | (0.18 | ) | | | — | | | | — | |
| Total Distributions | | | — | | | | (0.45 | ) | | | (0.42 | ) | | | (0.18 | ) | | | — | | | | — | |
| Net Asset Value, End of Period | | $ | 12.25 | | | $ | 9.33 | | | $ | 10.67 | | | $ | 9.82 | | | $ | 8.52 | | | $ | 10.22 | |
Total return(4) | | | 31.30 | % | | | (8.30 | )% | | | 12.95 | %(5) | | | 17.36 | % | | | (16.63 | )% | | | (0.97 | )% |
| | |
| SUPPLEMENTAL DATA AND RATIOS | | | | | | | | | | | | | | | | | | | | | | | | |
| Net assets, end of period (000’s) | | $ | 3,574 | | | $ | 3,303 | | | $ | 4,322 | | | $ | 4,583 | | | $ | 6,067 | | | $ | 14,604 | |
| Ratio of operating expenses to | | | | | | | | | | | | | | | | | | | | | | | | |
| average net assets: | | | | | | | | | | | | | | | | | | | | | | | | |
| Before expense reimbursement | | | 2.21 | % | | | 2.06 | % | | | 2.07 | %(6) | | | 2.45 | % | | | 1.74 | % | | | 1.77 | % |
After expense reimbursement(7) | | | 1.50 | % | | | 1.50 | % | | | 1.50 | %(6) | | | 1.50 | % | | | 1.50 | % | | | 1.50 | % |
| Ratio of net investment income | | | | | | | | | | | | | | | | | | | | | | | | |
| (loss) to average net assets: | | | (0.09 | )% | | | (0.68 | )% | | | (0.27 | )%(6) | | | 0.31 | % | | | 0.05 | % | | | (0.30 | )% |
| Portfolio turnover rate | | | 2 | % | | | 9 | % | | | 0 | %(5) | | | 11 | % | | | 2 | % | | | 40 | % |
| ^ | For the period May 1, 2017 through December 31, 2017. The Fund changed its fiscal year end from April 30 to December 31. |
| (1) | Information presented relates to a share of capital stock outstanding for each period. |
| (2) | Net investment income per share represents net investment income divided by the average shares outstanding throughout the period. |
| (3) | Amount calculated is less than $0.005. |
| (4) | The total return calculation does not reflect the 5.75% front end sales charge on Advisor Class A shares. |
| (5) | Not annualized. |
| (6) | Annualized. |
| (7) | See Note #3, Investment Adviser, for the waiver and expense reimbursement discussion. |
The accompanying notes are an integral part of these financial statements.
112
| |
KINETICS MUTUAL FUNDS, INC. — THE FUND |
|
Financial Highlights — (Continued) |
|
| | |
| | The Spin-off Fund
| |
| | Advisor Class C
| |
| | For the | | | For the | | | For the | | | For the | | | For the | | | For the | |
| | Year Ended | | | Year Ended | | | Period Ended | | | Year Ended | | | Year Ended | | | Year Ended | |
| | December 31, | | | December 31, | | | December 31, | | | April 30, | | | April 30, | | | April 30, | |
| | 2019 | | | 2018 | | | 2017^ | | | 2017 | | | 2016 | | | 2015 | |
| | |
PER SHARE DATA:(1) | | | | | | | | | | | | | | | | | | |
| Net Asset Value, Beginning | | | | | | | | | | | | | | | | | | |
| of Period | | $ | 8.80 | | | $ | 10.17 | | | $ | 9.43 | | | $ | 8.25 | | | $ | 9.97 | | | $ | 10.14 | |
| Income from Investment Operations: | | | | | | | | | | | | | | | | | | | | | | | | |
Net investment loss(2) | | | (0.09 | ) | | | (0.16 | ) | | | (0.07 | ) | | | (0.04 | ) | | | (0.06 | ) | | | (0.11 | ) |
| Net realized and unrealized gain | | | | | | | | | | | | | | | | | | | | | | | | |
| (loss) on investments | | | 2.76 | | | | (0.76 | ) | | | 1.23 | | | | 1.40 | | | | (1.66 | ) | | | (0.06 | ) |
| Total from Investment | | | | | | | | | | | | | | | | | | | | | | | | |
| Operations | | | 2.67 | | | | (0.92 | ) | | | 1.16 | | | | 1.36 | | | | (1.72 | ) | | | (0.17 | ) |
| Redemption Fees | | | — | | | | — | | | | — | | | | — | | | | — | | | | — | |
| Less Distributions: | | | | | | | | | | | | | | | | | | | | | | | | |
| From net realized gains | | | — | | | | (0.45 | ) | | | (0.42 | ) | | | (0.18 | ) | | | — | | | | — | |
| Total Distributions | | | — | | | | (0.45 | ) | | | (0.42 | ) | | | (0.18 | ) | | | — | | | | — | |
| Net Asset Value, End of Period | | $ | 11.47 | | | $ | 8.80 | | | $ | 10.17 | | | $ | 9.43 | | | $ | 8.25 | | | $ | 9.97 | |
| Total return | | | 30.34 | % | | | (9.00 | )% | | | 12.31 | %(3) | | | 16.46 | % | | | (17.25 | )% | | | (1.68 | )% |
| | |
| SUPPLEMENTAL DATA AND RATIOS | | | | | | | | | | | | | | | | | | | | | | | | |
| Net assets, end of period (000’s) | | $ | 4,064 | | | $ | 4,114 | | | $ | 5,526 | | | $ | 5,678 | | | $ | 6,290 | | | $ | 12,057 | |
| Ratio of operating expenses to | | | | | | | | | | | | | | | | | | | | | | | | |
| average net assets: | | | | | | | | | | | | | | | | | | | | | | | | |
| Before expense reimbursement | | | 2.71 | % | | | 2.56 | % | | | 2.82 | %(4) | | | 3.20 | % | | | 2.49 | % | | | 2.52 | % |
After expense reimbursement(5) | | | 2.25 | % | | | 2.25 | % | | | 2.25 | %(4) | | | 2.25 | % | | | 2.25 | % | | | 2.25 | % |
| Ratio of net investment loss | | | | | | | | | | | | | | | | | | | | | | | | |
| to average net assets: | | | (0.84 | )% | | | (1.43 | )% | | | (1.02 | )%(4) | | | (0.44 | )% | | | (0.70 | )% | | | (1.05 | )% |
| Portfolio turnover rate | | | 2 | % | | | 9 | % | | | 0 | %(3) | | | 11 | % | | | 2 | % | | | 40 | % |
| ^ | For the period May 1, 2017 through December 31, 2017. The Fund changed its fiscal year end from April 30 to December 31. |
| (1) | Information presented relates to a share of capital stock outstanding for each period. |
| (2) | Net investment income per share represents net investment income divided by the average shares outstanding throughout the period. |
| (3) | Not annualized. |
| (4) | Annualized. |
| (5) | See Note #3, Investment Adviser, for the waiver and expense reimbursement discussion. |
The accompanying notes are an integral part of these financial statements.
113
| |
| KINETICS MUTUAL FUNDS, INC. — THE FUND |
|
Financial Highlights — (Continued) |
|
| | |
| | The Spin-off Fund
| |
| | Institutional Class
| |
| | For the | | | For the | | | For the | | | For the | | | For the | | | For the | |
| | Year Ended | | | Year Ended | | | Period Ended | | | Year Ended | | | Year Ended | | | Year Ended | |
| | December 31, | | | December 31, | | | December 31, | | | April 30, | | | April 30, | | | April 30, | |
| | 2019 | | | 2018 | | | 2017^ | | | 2017 | | | 2016 | | | 2015 | |
| | |
PER SHARE DATA:(1) | | | | | | | | | | | | | | | | | | |
| Net Asset Value, Beginning | | | | | | | | | | | | | | | | | | |
| of Period | | $ | 9.36 | | | $ | 10.68 | | | $ | 9.85 | | | $ | 8.53 | | | $ | 10.20 | | | $ | 10.27 | |
| Income from Investment Operations: | | | | | | | | | | | | | | | | | | | | | | | | |
Net investment income (loss)(2) | | | 0.02 | | | | (0.05 | ) | | | 0.00 | (3) | | | 0.05 | | | | 0.03 | | | | (0.01 | ) |
| Net realized and unrealized gain | | | | | | | | | | | | | | | | | | | | | | | | |
| (loss) on investments | | | 2.95 | | | | (0.82 | ) | | | 1.29 | | | | 1.45 | | | | (1.70 | ) | | | (0.06 | ) |
| Total from Investment | | | | | | | | | | | | | | | | | | | | | | | | |
| Operations | | | 2.97 | | | | (0.87 | ) | | | 1.29 | | | | 1.50 | | | | (1.67 | ) | | | (0.07 | ) |
| Redemption Fees | | | — | | | | — | | | | 0.00 | (3) | | | — | | | | — | | | | — | |
| Less Distributions: | | | | | | | | | | | | | | | | | | | | | | | | |
| From net investment income | | | (0.01 | ) | | | — | | | | (0.04 | ) | | | — | | | | — | | | | — | |
| From net realized gains | | | — | | | | (0.45 | ) | | | (0.42 | ) | | | (0.18 | ) | | | — | | | | — | |
| Total Distributions | | | (0.01 | ) | | | (0.45 | ) | | | (0.46 | ) | | | (0.18 | ) | | | — | | | | — | |
| Net Asset Value, End of Period | | $ | 12.32 | | | $ | 9.36 | | | $ | 10.68 | | | $ | 9.85 | | | $ | 8.53 | | | $ | 10.20 | |
| Total return | | | 31.74 | % | | | (8.11 | )% | | | 13.07 | %(4) | | | 17.57 | % | | | (16.37 | )% | | | (0.68 | )% |
| | |
| SUPPLEMENTAL DATA AND RATIOS | | | | | | | | | | | | | | | | | | | | | | | | |
| Net assets, end of period (000’s) | | $ | 13,751 | | | $ | 11,290 | | | $ | 14,050 | | | $ | 12,022 | | | $ | 24,185 | | | $ | 52,312 | |
| Ratio of operating expenses to | | | | | | | | | | | | | | | | | | | | | | | | |
| average net assets: | | | | | | | | | | | | | | | | | | | | | | | | |
| Before expense reimbursement | | | 1.91 | % | | | 1.76 | % | | | 1.83 | %(5) | | | 2.20 | % | | | 1.49 | % | | | 1.52 | % |
After expense reimbursement(6) | | | 1.25 | % | | | 1.25 | % | | | 1.25 | %(5) | | | 1.25 | % | | | 1.25 | % | | | 1.25 | % |
| Ratio of net investment income | | | | | | | | | | | | | | | | | | | | | | | | |
| (loss) to average net assets: | | | 0.16 | % | | | (0.43 | )% | | | (0.02 | )%(5) | | | 0.56 | % | | | 0.30 | % | | | (0.05 | )% |
| Portfolio turnover rate | | | 2 | % | | | 9 | % | | | 0 | %(4) | | | 11 | % | | | 2 | % | | | 40 | % |
| ^ | For the period May 1, 2017 through December 31, 2017. The Fund changed its fiscal year end from April 30 to December 31. |
| (1) | Information presented relates to a share of capital stock outstanding for each period. |
| (2) | Net investment income per share represents net investment income divided by the average shares outstanding throughout the period. |
| (3) | Amount calculated is less than $0.005. |
| (4) | Not annualized. |
| (5) | Annualized. |
| (6) | See Note #3, Investment Adviser, for the waiver and expense reimbursement discussion. |
The accompanying notes are an integral part of these financial statements.
114
KINETICS MUTUAL FUNDS, INC.
Report of Independent Registered Public Accounting Firm
To the Shareholders and Board of Directors
of Kinetics Mutual Funds, Inc.
Opinion on the Financial Statements
We have audited the accompanying statements of assets and liabilities of The Internet Fund, The Global Fund, The Paradigm Fund, The Medical Fund, The Small Cap Opportunities Fund, The Market Opportunities Fund, The Alternative Income Fund, The Multi-Disciplinary Income Fund, and the Kinetics Spin-off and Corporate Restructuring Fund (the “Funds”), each a series of Kinetics Mutual Funds, Inc. (the “Trust”), including the portfolios of investments, as of December 31, 2019, the related statements of operations for the year then ended, the statements of changes in net assets for each of the two years in the period then ended, financial highlights for each of the five years in the period then ended, and the related notes (collectively referred to as the “financial statements”) and with respect to Kinetics Spin-off and Corporate Restructuring Fund, the financial highlights for each of the two years in the period ended December 31, 2019, the period ended December 31, 2017, and each year in the three year period ended April 30, 2017. In our opinion, the financial statements present fairly, in all material respects, the financial position of the Funds as of December 31, 2019, the results of their operations for the year then ended, the changes in their net assets for each of the two years in the period then ended, and their financial highlights for the periods indicated above, in conformity with accounting principles generally accepted in the United States of America.
Basis for Opinion
These financial statements are the responsibility of the Funds’ management. Our responsibility is to express an opinion on the Funds’ financial statements based on our audits. We are a public accounting firm registered with the Public Company Accounting Oversight Board (United States) (“PCAOB”) and are required to be independent with respect to the Funds in accordance with the U.S. federal securities laws and the applicable rules and regulations of the Securities and Exchange Commission and the PCAOB. We have served as the auditor of one or more of the funds in the Trust since 2004.
We conducted our audits in accordance with the standards of the PCAOB. Those standards require that we plan and perform the audits to obtain reasonable assurance about whether the financial statements are free of material misstatement, whether due to error or fraud. The Funds are not required to have, nor were we engaged to perform, an audit of the Funds’ internal control over financial reporting. As part of our audits we are required to obtain an understanding of internal control over financial reporting, but not for the purpose of expressing an opinion on the effectiveness of the Funds’ internal control over financial reporting. Accordingly, we express no such opinion.
Our audits included performing procedures to assess the risks of material misstatement of the financial statements, whether due to error or fraud, and performing procedures that respond to those risks. Such procedures included examining, on a test basis, evidence
115
KINETICS MUTUAL FUNDS, INC.
Report of Independent Registered Public Accounting Firm (Continued)
regarding the amounts and disclosures in the financial statements. Our audits also included evaluating the accounting principles used and significant estimates made by management, as well as evaluating the overall presentation of the financial statements. With respect to Kinetics Spin-off and Corporate Restructuring Fund, our procedures included confirmation of securities owned as of December 31, 2019 by correspondence with the custodian. We believe that our audits provide a reasonable basis for our opinion.
Philadelphia, Pennsylvania
March 2, 2020
116
KINETICS PORTFOLIOS TRUST — MASTER INVESTMENT PORTFOLIOS
Allocation of Consolidated Portfolio Assets
December 31, 2019
The Internet Portfolio
| | | | | | | |
| | | | | Percentage | |
| | Market | | | of Total | |
| Sector Allocation | | Value | | | Net Assets | |
Finance and Insurance# | | $ | 26,907,902 | | | | 22.6 | % |
Information | | | 18,937,138 | | | | 16.0 | % |
Mining, Quarrying, and Oil and Gas Extraction | | | 16,425,932 | | | | 13.8 | % |
Professional, Scientific, and Technical Services | | | 10,743,360 | | | | 9.1 | % |
Administrative and Support and Waste Management and | | | | | | | | |
| Remediation Services | | | 6,815,935 | | | | 5.7 | % |
Arts, Entertainment, and Recreation | | | 2,525,880 | | | | 2.1 | % |
Retail Trade | | | 79,169 | | | | 0.1 | % |
Management of Companies and Enterprises | | | 62,038 | | | | 0.1 | % |
| # | In the Finance and Insurance Sector, $17,580,646 represents a cryptocurrency investment of 14.8% of total net assets as of December 31, 2019. |
117
KINETICS PORTFOLIOS TRUST — MASTER INVESTMENT PORTFOLIOS
Allocation of Consolidated Portfolio Assets
December 31, 2019 — (Continued)
The Global Portfolio
| | | | | | | |
| | | | | Percentage | |
| | Market | | | of Total | |
| Country Allocation | | Value | | | Net Assets | |
United States# | | $ | 4,757,232 | | | | 33.1 | % |
Canada | | | 1,801,216 | | | | 12.5 | % |
United Kingdom | | | 446,473 | | | | 3.1 | % |
Cayman Islands | | | 204,600 | | | | 1.4 | % |
Brazil | | | 106,943 | | | | 0.7 | % |
Australia | | | 47,052 | | | | 0.3 | % |
Spain | | | 18,890 | | | | 0.1 | % |
France | | | 12,283 | | | | 0.1 | % |
Guernsey | | | 2,829 | | | | 0.0 | % |
Bermuda | | | 602 | | | | 0.0 | % |
| # | In the United States Sector, $1,281,899 represents a cryptocurrency investment of 8.9% of total net assets as of December 31, 2019. |
118
KINETICS PORTFOLIOS TRUST — MASTER INVESTMENT PORTFOLIOS
Allocation of Consolidated Portfolio Assets
December 31, 2019 — (Continued)
The Paradigm Portfolio
| | | | | | | |
| | | | | Percentage | |
| | Market | | | of Total | |
| Sector Allocation | | Value | | | Net Assets | |
Mining, Quarrying, and Oil and Gas Extraction | | $ | 321,203,820 | | | | 40.3 | % |
Finance and Insurance# | | | 90,455,106 | | | | 11.3 | % |
Real Estate and Rental and Leasing | | | 69,654,558 | | | | 8.7 | % |
Information | | | 60,876,297 | | | | 7.6 | % |
Arts, Entertainment, and Recreation | | | 39,216,011 | | | | 4.9 | % |
Management of Companies and Enterprises | | | 35,549,388 | | | | 4.5 | % |
Accommodation and Food Services | | | 15,300,168 | | | | 1.9 | % |
Professional, Scientific, and Technical Services | | | 12,730,023 | | | | 1.6 | % |
Transportation and Warehousing | | | 5,057,426 | | | | 0.6 | % |
Utilities | | | 2,419,516 | | | | 0.3 | % |
Retail Trade | | | 934,330 | | | | 0.1 | % |
Manufacturing | | | 273,800 | | | | 0.0 | % |
| # | In the Finance and Insurance Sector, $16,098,264 represents a cryptocurrency investment of 2.0% of total net assets as of December 31, 2019. |
119
KINETICS PORTFOLIOS TRUST — MASTER INVESTMENT PORTFOLIOS
Allocation of Portfolio Assets
December 31, 2019 — (Continued)
The Medical Portfolio
| | | | | | | |
| | | | | Percentage | |
| | Market | | | of Total | |
| Sector Allocation | | Value | | | Net Assets | |
Manufacturing | | $ | 16,481,822 | | | | 98.2 | % |
Professional, Scientific, and Technical Services | | | 10,503 | | | | 0.1 | % |
120
KINETICS PORTFOLIOS TRUST — MASTER INVESTMENT PORTFOLIOS
Allocation of Consolidated Portfolio Assets
December 31, 2019 — (Continued)
The Small Cap Opportunities Portfolio
| | | | | | | |
| | | | | Percentage | |
| | Market | | | of Total | |
| Sector Allocation | | Value | | | Net Assets | |
Mining, Quarrying, and Oil and Gas Extraction | | $ | 93,885,736 | | | | 34.8 | % |
Real Estate and Rental and Leasing | | | 31,738,685 | | | | 11.8 | % |
Management of Companies and Enterprises | | | 27,639,060 | | | | 10.3 | % |
Finance and Insurance# | | | 16,995,868 | | | | 6.3 | % |
Professional, Scientific, and Technical Services | | | 16,575,923 | | | | 6.1 | % |
Accommodation and Food Services | | | 12,157,140 | | | | 4.5 | % |
Arts, Entertainment, and Recreation | | | 11,263,672 | | | | 4.2 | % |
Transportation and Warehousing | | | 6,812,660 | | | | 2.5 | % |
Manufacturing | | | 6,777,144 | | | | 2.5 | % |
Wholesale Trade | | | 757,200 | | | | 0.3 | % |
Information | | | 284,800 | | | | 0.1 | % |
| # | In the Finance and Insurance Sector, $2,515,354 represents a cryptocurrency investment of 0.9% of total net assets as of December 31, 2019. |
121
KINETICS PORTFOLIOS TRUST — MASTER INVESTMENT PORTFOLIOS
Allocation of Consolidated Portfolio Assets
December 31, 2019 — (Continued)
The Market Opportunities Portfolio
| | | | | | | |
| | | | | Percentage | |
| | Market | | | of Total | |
| Sector Allocation | | Value | | | Net Assets | |
Mining, Quarrying, and Oil and Gas Extraction | | $ | 29,605,165 | | | | 34.2 | % |
Finance and Insurance# | | | 11,884,382 | | | | 13.7 | % |
Real Estate and Rental and Leasing | | | 3,687,902 | | | | 4.3 | % |
Information | | | 2,727,700 | | | | 3.2 | % |
Management of Companies and Enterprises | | | 2,047,294 | | | | 2.4 | % |
Transportation and Warehousing | | | 993,721 | | | | 1.2 | % |
Accommodation and Food Services | | | 165,120 | | | | 0.2 | % |
Manufacturing | | | 20,720 | | | | 0.0 | % |
Professional, Scientific, and Technical Services | | | 18,552 | | | | 0.0 | % |
Wholesale Trade | | | 13,232 | | | | 0.0 | % |
Retail Trade | | | 100 | | | | 0.0 | % |
| # | In the Finance and Insurance Sector, $4,929,348 represents a cryptocurrency investment of 5.7% of total net assets as of December 31, 2019. |
122
KINETICS PORTFOLIOS TRUST — MASTER INVESTMENT PORTFOLIOS
Allocation of Portfolio Assets
December 31, 2019 — (Continued)
The Alternative Income Portfolio
| | | | | | | |
| | | | | Percentage | |
| | Market | | | of Total | |
| Sector Allocation | | Value | | | Net Assets | |
Finance and Insurance | | $ | 5,872,004 | | | | 35.5 | % |
123
KINETICS PORTFOLIOS TRUST — MASTER INVESTMENT PORTFOLIOS
Allocation of Portfolio Assets
December 31, 2019 — (Continued)
The Multi-Disciplinary Income Portfolio
| | | | | | | |
| | | | | Percentage | |
| | Market | | | of Total | |
| Sector Allocation | | Value | | | Net Assets | |
Manufacturing | | $ | 6,130,847 | | | | 17.4 | % |
Retail Trade | | | 3,607,663 | | | | 10.3 | % |
Mining, Quarrying, and Oil and Gas Extraction | | | 3,406,023 | | | | 9.7 | % |
Information | | | 3,215,654 | | | | 9.1 | % |
Finance and Insurance | | | 3,152,688 | | | | 9.0 | % |
Management of Companies and Enterprises | | | 3,009,090 | | | | 8.5 | % |
Transportation and Warehousing | | | 2,860,703 | | | | 8.1 | % |
Construction | | | 2,842,176 | | | | 8.1 | % |
Real Estate and Rental and Leasing | | | 1,724,234 | | | | 4.9 | % |
Professional, Scientific, and Technical Services | | | 509,995 | | | | 1.4 | % |
124
KINETICS PORTFOLIOS TRUST — MASTER INVESTMENT PORTFOLIOS
The Internet Portfolio
Consolidated Portfolio of Investments — December 31, 2019
| | | | | | | |
| COMMON STOCKS — 54.70% | | Shares | | | Value | |
| Administrative and Support Services — 0.00% | | | | | | |
CreditRiskMonitor.com, Inc. | | | 780 | | | $ | 1,225 | |
| Broadcasting (except Internet) — 0.65% | | | | | | | | |
The E.W. Scripps Company — Class A | | | 40,000 | | | | 628,400 | |
MSG Networks, Inc. — Class A* | | | 8,000 | | | | 139,200 | |
| | | | | | | 767,600 | |
| Credit Intermediation and Related Activities — 2.10% | | | | | | | | |
LendingTree, Inc.*^ | | | 8,233 | | | | 2,498,221 | |
| Data Processing, Hosting, and Related Services — 5.98% | | | | | | | | |
IHS Markit Limited* | | | 200 | | | | 15,070 | |
MasterCard, Inc. — Class A | | | 7,000 | | | | 2,090,130 | |
Verisk Analytics, Inc. | | | 7,000 | | | | 1,045,380 | |
Visa, Inc. — Class A | | | 21,000 | | | | 3,945,900 | |
| | | | | | | 7,096,480 | |
| Data Processor — 5.74% | | | | | | | | |
PayPal Holdings, Inc.*c | | | 63,000 | | | | 6,814,710 | |
| Management of Companies and Enterprises — 0.05% | | | | | | | | |
Galaxy Digital Holdings Ltd.* | | | 76,000 | | | | 62,038 | |
| Nonstore Retailers — 0.06% | | | | | | | | |
Expedia Group, Inc. | | | 648 | | | | 70,075 | |
| Oil and Gas Extraction — 13.84% | | | | | | | | |
Texas Pacific Land Trustc | | | 21,026 | | | | 16,425,932 | |
| Other Information Services — 7.22% | | | | | | | | |
Alphabet, Inc. — Class A* | | | 3,200 | | | | 4,286,048 | |
Alphabet, Inc. — Class C* | | | 3,200 | | | | 4,278,464 | |
| | | | | | | 8,564,512 | |
| Other Motor Vehicle Dealers — 0.01% | | | | | | | | |
Copart, Inc.* | | | 100 | | | | 9,094 | |
| Other Professional, Scientific, and Technical Services — 0.46% | | | | | | | | |
GMO Internet, Inc. | | | 28,400 | | | | 542,359 | |
| Other Telecommunications — 1.92% | | | | | | | | |
Liberty Broadband Corporation — Series A* | | | 8,000 | | | | 996,480 | |
Liberty Broadband Corporation — Series C* | | | 7,600 | | | | 955,700 | |
Liberty Latin America Limited — Class C* | | | 16,496 | | | | 321,012 | |
| | | | | | | 2,273,192 | |
The accompanying notes are an integral part of these financial statements.
125
KINETICS PORTFOLIOS TRUST — MASTER INVESTMENT PORTFOLIOS
The Internet Portfolio
Consolidated Portfolio of Investments — December 31, 2019 — (Continued)
| | | | | | | |
| | Shares | | | Value | |
| Professional, Scientific, and Technical Services — 8.59% | | | | | | |
CACI International, Inc. — Class A*c | | | 29,200 | | | $ | 7,299,708 | |
Cookpad, Inc.* | | | 276,000 | | | | 904,293 | |
ManTech International Corporation — Class A | | | 25,000 | | | | 1,997,000 | |
| | | | | | | 10,201,001 | |
| Promoters of Performing Arts, Sports, and Similar Events — 0.99% | | | | | | | | |
The Madison Square Garden Company — Class A* | | | 4,000 | | | | 1,176,760 | |
| Satellite Telecommunications — 0.20% | | | | | | | | |
DISH Network Corp. — Class A* | | | 2,728 | | | | 96,762 | |
EchoStar Corporation — Class A* | | | 3,200 | | | | 138,592 | |
| | | | | | | 235,354 | |
| Securities, Commodity Contracts, and Other Financial Investments and | | | | | | | | |
| Related Activities — 5.75% | | | | | | | | |
CME Group, Inc. | | | 4,180 | | | | 839,010 | |
MarketAxess Holdings, Inc. | | | 5,000 | | | | 1,895,550 | |
OTC Markets Group, Inc. — Class A | | | 116,985 | | | | 4,094,475 | |
| | | | | | | 6,829,035 | |
| Spectator Sports — 1.14% | | | | | | | | |
Liberty Media Corp.-Liberty Braves — Class A* | | | 8,000 | | | | 237,200 | |
Liberty Media Corp.-Liberty Braves — Class C* | | | 8,000 | | | | 236,320 | |
Liberty Media Corp.-Liberty Formula One — Class A* | | | 20,000 | | | | 875,600 | |
| | | | | | | 1,349,120 | |
TOTAL COMMON STOCKS | | | | | | | | |
(cost $51,344,987) | | | | | | | 64,916,708 | |
| | |
| UNIT INVESTMENT TRUST — 14.81% | | | | | | | | |
| Securities, Commodity Contracts, and Other Financial Investments and | | | | | | | | |
| Related Activities — 14.81% | | | | | | | | |
Grayscale Bitcoin Trust*^c | | | 2,146,599 | | | | 17,580,646 | |
TOTAL UNIT INVESTMENT TRUST | | | | | | | | |
(cost $6,360,042) | | | | | | | 17,580,646 | |
The accompanying notes are an integral part of these financial statements.
126
KINETICS PORTFOLIOS TRUST — MASTER INVESTMENT PORTFOLIOS
The Internet Portfolio
Consolidated Portfolio of Investments — December 31, 2019 — (Continued)
| | | | | | | |
| | Principal | | | | |
| ESCROW NOTES — 0.00% | | Amount | | | Value | |
| Other Telecommunications — 0.00% | | | | | | |
Adelphia Communications Corp. Preferred *+a | | $ | 190,000 | | | $ | — | |
TOTAL ESCROW NOTES | | | | | | | | |
(cost $0) | | | | | | | — | |
| TOTAL INVESTMENTS — 69.51% | | | | | | | | |
| (cost $57,705,029) | | | | | | $ | 82,497,354 | |
| Percentages are stated as a percent of net assets. |
| * — Non-income producing security. |
| ^ — This security or a portion of this security was out on loan at December 31, 2019. Total loaned securities had a market value of $6,192,934 at December 31, 2019. The remaining contractual maturities of all of the securities lending transactions were overnight and continuous. The total collateral for the loaned securities was cash in the amount of $6,498,625. |
+ — Security is considered illiquid and was fair valued. The aggregate value of such securities is $0 or 0.00% of net assets.
|
| a — Value determined using significant unobservable inputs. |
| c — Significant Investment — See note 2. |
The accompanying notes are an integral part of these financial statements.
127
KINETICS PORTFOLIOS TRUST — MASTER INVESTMENT PORTFOLIOS
The Global Portfolio
Consolidated Portfolio of Investments — December 31, 2019 — (Continued)
| | | | | | | |
| COMMON STOCKS — 42.28% | | Shares | | | Value | |
| Accommodation — 1.89% | | | | | | |
Civeo Corporation* | | | 211,000 | | | $ | 272,190 | |
| Lessors of Nonfinancial Intangible Assets (except Copyrighted Works) — 0.03% | | | | | | | | |
PrairieSky Royalty Limited | | | 400 | | | | 4,691 | |
| Management of Companies and Enterprises — 1.90% | | | | | | | | |
Clarke, Inc.* | | | 24,800 | | | | 237,582 | |
Galaxy Digital Holdings Ltd.* | | | 44,000 | | | | 35,917 | |
| | | | | | | 273,499 | |
| Mining (except Oil and Gas) — 6.33% | | | | | | | | |
Franco-Nevada Corporation | | | 4,800 | | | | 495,840 | |
NovaGold Resources, Inc.* | | | 4,000 | | | | 35,840 | |
Wheaton Precious Metals Corporation | | | 12,800 | | | | 380,800 | |
| | | | | | | 912,480 | |
| Oil and Gas Extraction — 15.66% | | | | | | | | |
Texas Pacific Land Trustc | | | 2,890 | | | | 2,257,726 | |
| Other Financial Investment Activities — 1.95% | | | | | | | | |
Brookfield Asset Management, Inc. — Class A | | | 4,000 | | | | 231,200 | |
Burford Capital Limited | | | 300 | | | | 2,830 | |
IMF Bentham Limited* | | | 15,000 | | | | 47,052 | |
| | | | | | | 281,082 | |
| Other Investment Pools and Funds — 0.61% | | | | | | | | |
Partners Value Investments LP*f | | | 2,193 | | | | 87,818 | |
| Other Pipeline Transportation — 0.09% | | | | | | | | |
Rubis SCA | | | 200 | | | | 12,283 | |
| Other Telecommunications — 0.00% | | | | | | | | |
Liberty Latin America Limited — Class A* | | | 9 | | | | 174 | |
Liberty Latin America Limited — Class C* | | | 22 | | | | 428 | |
| | | | | | | 602 | |
| Professional, Scientific, and Technical Services — 6.41% | | | | | | | | |
CACI International, Inc. — Class A*c | | | 3,700 | | | | 924,963 | |
| Securities and Commodity Exchanges — 1.80% | | | | | | | | |
B3 SA — Brasil Bolsa Balcao | | | 10,000 | | | | 106,943 | |
Bolsas y Mercados Espanoles SHMSF — ADR | | | 1,000 | | | | 18,890 | |
Cboe Global Markets, Inc. | | | 1,118 | | | | 134,160 | |
| | | | | | | 259,993 | |
The accompanying notes are an integral part of these financial statements.
128
KINETICS PORTFOLIOS TRUST — MASTER INVESTMENT PORTFOLIOS
The Global Portfolio
Consolidated Portfolio of Investments — December 31, 2019 — (Continued)
| | | | | | | |
| | Shares | | | Value | |
| Securities, Commodity Contracts, and Other Financial Investments and | | | | | | |
| Related Activities — 1.09% | | | | | | |
CME Group, Inc. | | | 786 | | | $ | 157,766 | |
| Support Activities for Water Transportation — 4.52% | | | | | | | | |
Braemar Shipping Services plc | | | 2,000 | | | | 5,709 | |
Clarkson plc | | | 11,000 | | | | 440,763 | |
Siem Industries, Inc.*f | | | 5,500 | | | | 204,600 | |
| | | | | | | 651,072 | |
TOTAL COMMON STOCKS | | | | | | | | |
(cost $3,969,314) | | | | | | | 6,096,165 | |
| | |
| UNIT INVESTMENT TRUST — 8.89% | | | | | | | | |
| Securities, Commodity Contracts, and Other Financial Investments and | | | | | | | | |
| Related Activities — 8.89% | | | | | | | | |
Grayscale Bitcoin Trust*^c | | | 156,520 | | | | 1,281,899 | |
TOTAL UNIT INVESTMENT TRUST | | | | | | | | |
(cost $222,484) | | | | | | | 1,281,899 | |
| | |
| PREFERRED STOCKS — 0.07% | | | | | | | | |
| Other Investment Pools and Funds — 0.07% | | | | | | | | |
Partners Value Investments LP — Class Af | | | 515 | | | | 9,862 | |
TOTAL PREFERRED STOCKS | | | | | | | | |
(cost $9,785) | | | | | | | 9,862 | |
| | |
| | Principal | | | | | |
| CONVERTIBLE BONDS — 0.00% | | Amount | | | | | |
| Department Stores — 0.00% | | | | | | | | |
Sears Holdings Corporation, 8.000%, 12/15/2019 ef | | $ | 41,080 | | | | 719 | |
TOTAL CONVERTIBLE BONDS | | | | | | | | |
(cost $41,080) | | | | | | | 719 | |
The accompanying notes are an integral part of these financial statements.
129
KINETICS PORTFOLIOS TRUST — MASTER INVESTMENT PORTFOLIOS
The Global Portfolio
Consolidated Portfolio of Investments — December 31, 2019 — (Continued)
| | | | | | | |
| WARRANTS — 0.07% | | Shares | | | Value | |
| Other Investment Pools and Funds — 0.07% | | | | | | |
Partners Value Investments LP*f | | | 1,893 | | | $ | 9,475 | |
Expiration: 06/30/2026, Exercise Price: 32.45 CAD | | | | | | | | |
TOTAL WARRANTS | | | | | | | | |
(cost $7,160) | | | | | | | 9,475 | |
| TOTAL INVESTMENTS — 51.31% | | | | | | | | |
| (cost $4,249,823) | | | | | | $ | 7,398,120 | |
| Percentages are stated as a percent of net assets. |
| * — Non-income producing security. |
^ — This security or a portion of this security was out on loan at December 31, 2019. Total loaned securities had a market value of $86,265 at December 31, 2019. The remaining contractual maturities of all of the securities lending transactions were overnight and continuous. The total collateral for the loaned securities was cash in the amount of $92,164. |
c — Significant Investment — See note 2. |
e — Default or other conditions exist and the security is not presently accruing income. |
f — Level 2 Investment — See note 7. |
| ADR— American Depositary Receipt. |
| CAD— Canadian Dollars. |
The accompanying notes are an integral part of these financial statements.
130
KINETICS PORTFOLIOS TRUST — MASTER INVESTMENT PORTFOLIOS
The Paradigm Portfolio
Consolidated Portfolio of Investments — December 31, 2019 — (Continued)
| | | | | | | |
| COMMON STOCKS — 79.75% | | Shares | | | Value | |
| Accommodation — 0.37% | | | | | | |
Civeo Corporation* | | | 2,294,800 | | | $ | 2,960,292 | |
| Amusement, Gambling, and Recreation Industries — 0.27% | | | | | | | | |
Las Vegas Sands Corp. | | | 31,300 | | | | 2,160,952 | |
| Beverage and Tobacco Product Manufacturing — 0.04% | | | | | | | | |
Crimson Wine Group Limited* | | | 37,000 | | | | 273,800 | |
| Cable and Other Subscription Programming — 0.86% | | | | | | | | |
Discovery Communications, Inc. — Class A*^ | | | 142,400 | | | | 4,662,176 | |
Discovery Communications, Inc. — Class C* | | | 71,700 | | | | 2,186,133 | |
| | | | | | | 6,848,309 | |
| Data Processing, Hosting, and Related Services — 0.01% | | | | | | | | |
IHS Markit Limited* | | | 1,200 | | | | 90,420 | |
| Food Services and Drinking Places — 1.54% | | | | | | | | |
The Wendy’s Company | | | 555,600 | | | | 12,339,876 | |
| Insurance Carriers and Related Activities — 1.47% | | | | | | | | |
Markel Corporation* | | | 10,300 | | | | 11,774,651 | |
| Management of Companies and Enterprises — 4.45% | | | | | | | | |
Associated Capital Group, Inc. — Class A^ | | | 261,200 | | | | 10,239,040 | |
Bollore SA | | | 253,000 | | | | 1,103,948 | |
Icahn Enterprises LP | | | 393,600 | | | | 24,206,400 | |
| | | | | | | 35,549,388 | |
| Mining (except Oil and Gas) — 2.92% | | | | | | | | |
Franco-Nevada Corporation^ | | | 216,600 | | | | 22,374,780 | |
Wheaton Precious Metals Corporation | | | 32,400 | | | | 963,900 | |
| | | | | | | 23,338,680 | |
| Nonstore Retailers — 0.12% | | | | | | | | |
Expedia Group, Inc. | | | 8,640 | | | | 934,330 | |
| Oil and Gas Extraction — 37.26% | | | | | | | | |
Texas Pacific Land Trustc | | | 381,186 | | | | 297,790,127 | |
Tourmaline Oil Corp.f | | | 6,400 | | | | 75,013 | |
| | | | | | | 297,865,140 | |
The accompanying notes are an integral part of these financial statements.
131
KINETICS PORTFOLIOS TRUST — MASTER INVESTMENT PORTFOLIOS
The Paradigm Portfolio
Consolidated Portfolio of Investments — December 31, 2019 — (Continued)
| | | | | | | |
| | Shares | | | Value | |
| Other Financial Investment Activities — 5.96% | | | | | | |
Brookfield Asset Management, Inc. — Class A | | | 679,800 | | | $ | 39,292,440 | |
Brookfield Business Partners LP | | | 5,000 | | | | 206,400 | |
GAMCO Investors, Inc. — Class A | | | 1,800 | | | | 35,082 | |
Onex Corp. | | | 128,500 | | | | 8,103,930 | |
| | | | | | | 47,637,852 | |
| Other Investment Pools and Funds — 0.00% | | | | | | | | |
Partners Value Investments LP*f | | | 800 | | | | 32,036 | |
| Other Professional, Scientific, and Technical Services — 0.08% | | | | | | | | |
GMO Internet, Inc. | | | 32,000 | | | | 611,108 | |
| Other Telecommunications — 5.49% | | | | | | | | |
GCI Liberty, Inc. — Class A* | | | 72,000 | | | | 5,101,200 | |
Liberty Broadband Corporation — Series A* | | | 36,000 | | | | 4,484,160 | |
Liberty Broadband Corporation — Series C* | | | 111,200 | | | | 13,983,400 | |
Liberty Media Corp.-Liberty SiriusXM — Class A* | | | 177,400 | | | | 8,575,516 | |
Liberty Media Corp.-Liberty SiriusXM — Class C* | | | 244,200 | | | | 11,755,788 | |
| | | | | | | 43,900,064 | |
| Performing Arts, Spectator Sports, and Related Industries — 3.50% | | | | | | | | |
Live Nation Entertainment, Inc.* | | | 392,000 | | | | 28,016,240 | |
| Professional, Scientific, and Technical Services — 1.52% | | | | | | | | |
CACI International, Inc. — Class A* | | | 46,800 | | | | 11,699,532 | |
Cookpad, Inc.* | | | 128,000 | | | | 419,382 | |
| | | | | | | 12,118,914 | |
| Real Estate — 8.71% | | | | | | | | |
Dream Unlimited Corp. — Class Af | | | 257,000 | | | | 2,315,583 | |
Equity Lifestyle Properties, Inc. — REIT | | | 134,500 | | | | 9,467,455 | |
The Howard Hughes Corporation*c | | | 456,400 | | | | 57,871,520 | |
| | | | | | | 69,654,558 | |
| Satellite Telecommunications — 1.26% | | | | | | | | |
DISH Network Corp. — Class A* | | | 63,200 | | | | 2,241,704 | |
EchoStar Corporation — Class A* | | | 180,000 | | | | 7,795,800 | |
| | | | | | | 10,037,504 | |
The accompanying notes are an integral part of these financial statements.
132
KINETICS PORTFOLIOS TRUST — MASTER INVESTMENT PORTFOLIOS
The Paradigm Portfolio
Consolidated Portfolio of Investments — December 31, 2019 — (Continued)
| | | | | | | |
| | Shares | | | Value | |
| Securities and Commodity Exchanges — 1.33% | | | | | | |
Bolsas y Mercados Espanoles SHMSF — ADR | | | 3,600 | | | $ | 68,004 | |
Cboe Global Markets, Inc. | | | 88,200 | | | | 10,584,000 | |
| | | | | | | 10,652,004 | |
| Securities, Commodity Contracts, and Other Financial Investments and | | | | | | | | |
| Related Activities — 0.53% | | | | | | | | |
CME Group, Inc. | | | 21,000 | | | | 4,215,120 | |
IntercontinentalExchange Group, Inc. | | | 400 | | | | 37,020 | |
| | | | | | | 4,252,140 | |
| Spectator Sports — 1.13% | | | | | | | | |
Liberty Media Corp.-Liberty Formula One — Class A* | | | 91,600 | | | | 4,010,248 | |
Liberty Media Corp.-Liberty Formula One — Class C* | | | 109,400 | | | | 5,028,571 | |
| | | | | | | 9,038,819 | |
| Support Activities for Water Transportation — 0.63% | | | | | | | | |
Clarkson plc | | | 101,800 | | | | 4,079,066 | |
Siem Industries, Inc.*f | | | 26,300 | | | | 978,360 | |
| | | | | | | 5,057,426 | |
| Utilities — 0.30% | | | | | | | | |
Brookfield Infrastructure Partners LP | | | 48,400 | | | | 2,419,516 | |
TOTAL COMMON STOCKS | | | | | | | | |
(cost $252,243,112) | | | | | | | 637,564,019 | |
| | |
| UNIT INVESTMENT TRUST — 2.01% | | | | | | | | |
| Securities, Commodity Contracts, and Other Financial Investments and | | | | | | | | |
| Related Activities — 2.01% | | | | | | | | |
Grayscale Bitcoin Trust*^ | | | 1,965,600 | | | | 16,098,264 | |
TOTAL UNIT INVESTMENT TRUST | | | | | | | | |
(cost $26,406,964) | | | | | | | 16,098,264 | |
The accompanying notes are an integral part of these financial statements.
133
KINETICS PORTFOLIOS TRUST — MASTER INVESTMENT PORTFOLIOS
The Paradigm Portfolio
Consolidated Portfolio of Investments — December 31, 2019 — (Continued)
| | | | | | | |
| PREFERRED STOCKS — 0.00% | | Shares | | | Value | |
| Other Investment Pools and Funds — 0.00% | | | | | | |
Partners Value Investments LP — Class Af | | | 217 | | | $ | 4,156 | |
TOTAL PREFERRED STOCKS | | | | | | | | |
(cost $1,764) | | | | | | | 4,156 | |
| | |
| | Principal | | | | | |
| ESCROW NOTES — 0.00% | | Amount | | | | | |
| Other Telecommunications — 0.00% | | | | | | | | |
Adelphia Communications Corp.*+a | | $ | 200,000 | | | | — | |
TOTAL ESCROW NOTES | | | | | | | | |
(cost $0) | | | | | | | — | |
| | |
| WARRANTS — 0.00% | | Shares | | | | | |
| Other Investment Pools and Funds — 0.00% | | | | | | | | |
Partners Value Investments LP*f | | | 800 | | | | 4,004 | |
Expiration: 06/30/2026, Exercise Price: 32.45 CAD | | | | | | | | |
TOTAL WARRANTS | | | | | | | | |
(cost $2,368) | | | | | | | 4,004 | |
| TOTAL INVESTMENTS — 81.76% | | | | | | | | |
| (cost $278,654,208) | | | | | | $ | 653,670,443 | |
| Percentages are stated as a percent of net assets. |
| * — Non-income producing security. |
| ^ — This security or a portion of this security was out on loan at December 31, 2019. Total loaned securities had a market value of $23,594,367 at December 31, 2019. The remaining contractual maturities of all of the securities lending transactions were overnight and continuous. The total collateral for the loaned securities was cash in the amount of $24,872,480. |
|
|
|
| + — Security is considered illiquid and was fair valued. The aggregate value of such securities is $0.00 or 0.00% of net assets. |
|
| a — Value determined using significant unobservable inputs. |
| c — Significant Investment — See note 2. |
| f — Level 2 Investment — See note 7. |
| ADR—American Depositary Receipt. |
| CAD—Canadian Dollars. |
| REIT —Real Estate Investment Trust. |
The accompanying notes are an integral part of these financial statements.
134
KINETICS PORTFOLIOS TRUST — MASTER INVESTMENT PORTFOLIOS
The Medical Portfolio
Portfolio of Investments — December 31, 2019 — (Continued)
| | | | | | | |
| COMMON STOCKS — 97.99% | | Shares | | | Value | |
| Pharmaceutical and Medicine Manufacturing — 97.99% | | | | | | |
AbbVie, Inc.^c | | | 10,000 | | | $ | 885,400 | |
Agenus, Inc.* | | | 148 | | | | 602 | |
Alkermes plc* | | | 21,000 | | | | 428,400 | |
AMGEN, Inc.c | | | 4,000 | | | | 964,280 | |
Arena Pharmaceuticals, Inc.* | | | 4,500 | | | | 204,390 | |
AstraZeneca plc — ADRc | | | 24,000 | | | | 1,196,640 | |
Biogen, Inc.*c | | | 3,750 | | | | 1,112,738 | |
Bristol-Myers Squibb Companyc | | | 27,500 | | | | 1,765,225 | |
Celldex Therapeutics, Inc.* | | | 1,752 | | | | 3,907 | |
Eli Lilly & Companyc | | | 8,500 | | | | 1,117,155 | |
Gilead Sciences, Inc. | | | 11,000 | | | | 714,780 | |
GlaxoSmithKline plc — ADRc | | | 22,673 | | | | 1,065,404 | |
Immune Pharmaceuticals, Inc.* | | | 1 | | | | — | |
Ionis Pharmaceuticals, Inc.* | | | 12,000 | | | | 724,920 | |
Johnson & Johnsonc | | | 8,000 | | | | 1,166,960 | |
Merck & Co., Inc.c | | | 15,000 | | | | 1,364,250 | |
Merrimack Pharmaceuticals, Inc. | | | 7,500 | | | | 23,625 | |
Novartis AG — ADRc | | | 14,000 | | | | 1,325,660 | |
Pacific Biosciences of California, Inc.* | | | 12,000 | | | | 61,680 | |
Pfizer, Inc.c | | | 30,000 | | | | 1,175,400 | |
Sanofi — ADRc | | | 21,000 | | | | 1,054,200 | |
Xenon Pharmaceuticals, Inc.* | | | 7,000 | | | | 91,770 | |
| | | | | | | 16,447,386 | |
TOTAL COMMON STOCKS | | | | | | | | |
(cost $10,050,189) | | | | | | | 16,447,386 | |
| | |
| RIGHTS — 0.27% | | | | | | | | |
| Pharmaceutical and Medicine Manufacturing — 0.21% | | | | | | | | |
Bristol-Myers Squibb Company* | | | 7,000 | | | | 21,070 | |
Sanofi* | | | 15,538 | | | | 13,366 | |
| | | | | | | 34,436 | |
The accompanying notes are an integral part of these financial statements.
135
KINETICS PORTFOLIOS TRUST — MASTER INVESTMENT PORTFOLIOS
The Medical Portfolio
Portfolio of Investments — December 31, 2019 — (Continued)
| | | | | | | |
| | Shares | | | Value | |
| | |
| Scientific Research and Development Services — 0.06% | | | | | | |
Ligand Pharmaceuticals, Inc.* | | | 44,000 | | | $ | 8,800 | |
Ligand Pharmaceuticals, Inc.*f | | | 44,000 | | | | 1,452 | |
Ligand Pharmaceuticals, Inc.* | | | 44,000 | | | | 154 | |
Ligand Pharmaceuticals, Inc.*#f | | | 44,000 | | | | 97 | |
| | | | | | | 10,503 | |
TOTAL RIGHTS | | | | | | | | |
(cost $14,910) | | | | | | | 44,939 | |
| TOTAL INVESTMENTS — 98.26% | | | | | | | | |
| (cost $10,065,099) | | | | | | $ | 16,492,325 | |
| Percentages are stated as a percent of net assets. |
| * — Non-income producing security. |
| ^ — This security or a portion of this security was out on loan at December 31, 2019. Total loaned securities had a market value of $26,562 at December 31, 2019. The remaining contractual maturities of all of the securities lending transactions were overnight and continuous. The total collateral for the loaned securities was cash in the amount of $27,300. |
|
|
|
| # — Contingent value right (contingent upon profitability of company). |
| c — Significant Investment — See note 2. |
| f — Level 2 Investment — See note 7. |
| ADR — American Depositary Receipt. |
The accompanying notes are an integral part of these financial statements.
136
KINETICS PORTFOLIOS TRUST — MASTER INVESTMENT PORTFOLIOS
The Small Cap Opportunities Portfolio
Consolidated Portfolio of Investments — December 31, 2019 — (Continued)
| | | | | | | |
| COMMON STOCKS — 81.71% | | Shares | | | Value | |
| Accommodation — 1.54% | | | | | | |
Civeo Corporation* | | | 3,226,000 | | | $ | 4,161,540 | |
| Beverage and Tobacco Product Manufacturing — 0.28% | | | | | | | | |
Crimson Wine Group Limited* | | | 100,400 | | | | 742,960 | |
| Chemical Manufacturing — 1.91% | | | | | | | | |
Element Solutions, Inc.* | | | 8,600 | | | | 100,448 | |
Inter Parfums, Inc. | | | 69,600 | | | | 5,060,616 | |
| | | | | | | 5,161,064 | |
| Food Services and Drinking Places — 2.96% | | | | | | | | |
The Wendy’s Company | | | 360,000 | | | | 7,995,600 | |
| Machinery Manufacturing — 0.32% | | | | | | | | |
Colfax Corporation* | | | 24,000 | | | | 873,120 | |
| Management of Companies and Enterprises — 10.25% | | | | | | | | |
Associated Capital Group, Inc. — Class A | | | 164,750 | | | | 6,458,200 | |
Dundee Corporation — Class A* | | | 1,994,400 | | | | 1,806,129 | |
Galaxy Digital Holdings Ltd.* | | | 436,000 | | | | 355,905 | |
Icahn Enterprises LPc | | | 290,800 | | | | 17,884,200 | |
RIT Capital Partners plc | | | 40,500 | | | | 1,134,626 | |
| | | | | | | 27,639,060 | |
| Merchant Wholesalers, Durable Goods — 0.28% | | | | | | | | |
Dorman Products, Inc.* | | | 10,000 | | | | 757,200 | |
| Mining (except Oil and Gas) — 0.06% | | | | | | | | |
Sandstorm Gold Ltd.*^ | | | 1,800 | | | | 13,410 | |
Wheaton Precious Metals Corporation | | | 5,000 | | | | 148,750 | |
| | | | | | | 162,160 | |
| Oil and Gas Extraction — 34.74% | | | | | | | | |
Permian Basin Royalty Trust | | | 152,800 | | | | 589,808 | |
Texas Pacific Land Trustc | | | 119,204 | | | | 93,124,549 | |
| | | | | | | 93,714,357 | |
| Other Financial Investment Activities — 1.26% | | | | | | | | |
GAMCO Investors, Inc. — Class A | | | 22,000 | | | | 428,780 | |
Onex Corporationf | | | 47,000 | | | | 2,974,079 | |
| | | | | | | 3,402,859 | |
The accompanying notes are an integral part of these financial statements.
137
KINETICS PORTFOLIOS TRUST — MASTER INVESTMENT PORTFOLIOS
The Small Cap Opportunities Portfolio
Consolidated Portfolio of Investments — December 31, 2019 — (Continued)
| | | | | | | |
| | Shares | | | Value | |
| Other Investment Pools and Funds — 3.38% | | | | | | |
JZ Capital Partners Limited* | | | 430 | | | $ | 1,754 | |
Partners Value Investments LP*f | | | 191,000 | | | | 7,648,531 | |
Urbana Corporation — Class A | | | 693,771 | | | | 1,469,231 | |
| | | | | | | 9,119,516 | |
| Other Pipeline Transportation — 2.05% | | | | | | | | |
Rubis SCA | | | 90,000 | | | | 5,527,201 | |
| Performing Arts, Spectator Sports, and Related Industries — 4.18% | | | | | | | | |
Live Nation Entertainment, Inc.* | | | 157,600 | | | | 11,263,672 | |
| Professional, Scientific, and Technical Services — 6.14% | | | | | | | | |
CACI International, Inc. — Class A*c | | | 55,900 | | | | 13,974,441 | |
Cookpad, Inc.* | | | 794,000 | | | | 2,601,482 | |
| | | | | | | 16,575,923 | |
| Real Estate — 11.77% | | | | | | | | |
Dream Unlimited Corp. — Class Acf | | | 2,188,400 | | | | 19,717,593 | |
Equity Commonwealth REIT | | | 400 | | | | 13,132 | |
The Howard Hughes Corporation* | | | 94,700 | | | | 12,007,960 | |
| | | | | | | 31,738,685 | |
| Securities and Commodity Exchanges — 0.00% | | | | | | | | |
Bolsas y Mercados Espanoles SHMSF — ADR | | | 400 | | | | 7,556 | |
| Support Activities for Mining — 0.00% | | | | | | | | |
Altius Minerals Corporation | | | 1,000 | | | | 9,220 | |
| Support Activities for Water Transportation — 0.48% | | | | | | | | |
Braemar Shipping Services plc | | | 450,322 | | | | 1,285,458 | |
| Telecommunications — 0.11% | | | | | | | | |
LICT Corporation*f | | | 16 | | | | 284,800 | |
TOTAL COMMON STOCKS | | | | | | | | |
(cost $134,689,013) | | | | | | | 220,421,951 | |
The accompanying notes are an integral part of these financial statements.
138
KINETICS PORTFOLIOS TRUST — MASTER INVESTMENT PORTFOLIOS
The Small Cap Opportunities Portfolio
Consolidated Portfolio of Investments — December 31, 2019 — (Continued)
| | | | | | | |
| UNIT INVESTMENT TRUST — 0.93% | | Shares | | | Value | |
| Securities, Commodity Contracts, and Other Financial Investments and | | | | | | |
| Related Activities — 0.93% | | | | | | |
Grayscale Bitcoin Trust*^ | | | 307,125 | | | $ | 2,515,354 | |
TOTAL UNIT INVESTMENT TRUST | | | | | | | | |
(cost $3,240,000) | | | | | | | 2,515,354 | |
| | |
| PREFERRED STOCKS — 0.37% | | | | | | | | |
| Other Investment Pools and Funds — 0.37% | | | | | | | | |
Partners Value Investments LP — Class Af | | | 51,933 | | | | 994,517 | |
TOTAL PREFERRED STOCKS | | | | | | | | |
(cost $420,822) | | | | | | | 994,517 | |
| | |
| WARRANTS — 0.35% | | | | | | | | |
| Other Investment Pools and Funds — 0.35% | | | | | | | | |
Partners Value Investments LP*f | | | 191,000 | | | | 956,066 | |
Expiration: 06/30/2026, Exercise Price: 32.45 CAD | | | | | | | | |
TOTAL WARRANTS | | | | | | | | |
(cost $564,856) | | | | | | | 956,066 | |
| TOTAL INVESTMENTS — 83.36% | | | | | | | | |
| (cost $138,914,691) | | | | | | $ | 224,887,888 | |
| Percentages are stated as a percent of net assets. |
| * — Non-income producing security. |
| ^ — This security or a portion of this security was out on loan at December 31, 2019. Total loaned securities had a market value of $2,502,504 at December 31, 2019. The remaining contractual maturities of all of the securities lending transactions were overnight and continuous. The total collateral for the loaned securities was cash in the amount of $2,673,242. |
| c — Significant Investment — See note 2. |
| f — Level 2 Investment — See note 7. |
| ADR— American Depositary Receipt. |
| CAD— Canadian Dollars. |
| REIT — Real Estate Investment Trust. |
The accompanying notes are an integral part of these financial statements.
139
KINETICS PORTFOLIOS TRUST — MASTER INVESTMENT PORTFOLIOS
The Market Opportunities Portfolio
Consolidated Portfolio of Investments — December 31, 2019 — (Continued)
| | | | | | | |
| COMMON STOCKS — 52.95% | | Shares | | | Value | |
| Accommodation — 0.19% | | | | | | |
Civeo Corporation* | | | 128,000 | | | $ | 165,120 | |
| Beverage and Tobacco Product Manufacturing — 0.02% | | | | | | | | |
Crimson Wine Group Limited* | | | 2,800 | | | | 20,720 | |
| Data Processing, Hosting, and Related Services — 3.15% | | | | | | | | |
IHS Markit Limited* | | | 400 | | | | 30,140 | |
MasterCard, Inc. — Class A | | | 4,000 | | | | 1,194,360 | |
Visa, Inc. — Class A | | | 8,000 | | | | 1,503,200 | |
| | | | | | | 2,727,700 | |
| Insurance Carriers and Related Activities — 0.04% | | | | | | | | |
Arthur J. Gallagher & Co. | | | 400 | | | | 38,092 | |
| Management of Companies and Enterprises — 2.37% | | | | | | | | |
Associated Capital Group, Inc. — Class A | | | 33,800 | | | | 1,324,960 | |
Clarke, Inc.* | | | 1,000 | | | | 9,580 | |
Dundee Corporation — Class A* | | | 2,000 | | | | 1,811 | |
Galaxy Digital Holdings Ltd.* | | | 110,000 | | | | 89,793 | |
Icahn Enterprises LP | | | 10,100 | | | | 621,150 | |
| | | | | | | 2,047,294 | |
| Merchant Wholesalers, Durable Goods — 0.02% | | | | | | | | |
A-Mark Precious Metals, Inc.* | | | 1,600 | | | | 13,232 | |
| Mining (except Oil and Gas) — 1.42% | | | | | | | | |
Franco-Nevada Corporation | | | 5,350 | | | | 552,655 | |
Wheaton Precious Metals Corporation | | | 22,600 | | | | 672,350 | |
| | | | | | | 1,225,005 | |
| Oil and Gas Extraction — 32.82% | | | | | | | | |
Texas Pacific Land Trustc | | | 36,328 | | | | 28,380,160 | |
| Other Financial Investment Activities — 0.36% | | | | | | | | |
Brookfield Asset Management, Inc. — Class A | | | 2,469 | | | | 142,708 | |
GAMCO Investors, Inc. — Class A | | | 3,800 | | | | 74,062 | |
Sprott, Inc. | | | 41,155 | | | | 94,445 | |
| | | | | | | 311,215 | |
The accompanying notes are an integral part of these financial statements.
140
KINETICS PORTFOLIOS TRUST — MASTER INVESTMENT PORTFOLIOS
The Market Opportunities Portfolio
Consolidated Portfolio of Investments — December 31, 2019 — (Continued)
| | | | | | | |
| | Shares | | | Value | |
| Other Investment Pools and Funds — 2.90% | | | | | | |
Partners Value Investments LP*f | | | 43,516 | | | $ | 1,742,584 | |
Urbana Corporation | | | 3,200 | | | | 7,072 | |
Urbana Corporation — Class A | | | 356,004 | | | | 753,926 | |
| | | | | | | 2,503,582 | |
| Professional, Scientific, and Technical Services — 0.02% | | | | | | | | |
CACI International, Inc. — Class A* | | | 48 | | | | 11,999 | |
Cookpad, Inc.* | | | 2,000 | | | | 6,553 | |
| | | | | | | 18,552 | |
| Real Estate — 4.26% | | | | | | | | |
Dream Unlimited Corp. — Class Af | | | 272,800 | | | | 2,457,942 | |
The Howard Hughes Corporation* | | | 9,700 | | | | 1,229,960 | |
| | | | | | | 3,687,902 | |
| Securities and Commodity Exchanges — 1.74% | | | | | | | | |
Bolsas y Mercados Espanoles SHMSF — ADR | | | 2,400 | | | | 45,336 | |
Cboe Global Markets, Inc. | | | 7,806 | | | | 936,720 | |
NASDAQ, Inc. | | | 1,800 | | | | 192,780 | |
NZX Limited | | | 359,002 | | | | 328,686 | |
| | | | | | | 1,503,522 | |
| Securities, Commodity Contracts, and Other Financial Investments | | | | | | | | |
| and Related Activities — 2.49% | | | | | | | | |
CME Group, Inc. | | | 5,891 | | | | 1,182,442 | |
IntercontinentalExchange Group, Inc. | | | 10,500 | | | | 971,775 | |
| | | | | | | 2,154,217 | |
| Support Activities for Water Transportation — 1.15% | | | | | | | | |
Clarkson plc | | | 24,800 | | | | 993,721 | |
TOTAL COMMON STOCKS | | | | | | | | |
(cost $21,926,885) | | | | | | | 45,790,034 | |
| | |
| UNIT INVESTMENT TRUST — 5.70% | | | | | | | | |
| Securities, Commodity Contracts, and Other Financial Investments | | | | | | | | |
| and Related Activities — 5.70% | | | | | | | | |
Grayscale Bitcoin Trust*^c | | | 601,874 | | | | 4,929,348 | |
TOTAL UNIT INVESTMENT TRUST | | | | | | | | |
(cost $1,348,653) | | | | | | | 4,929,348 | |
The accompanying notes are an integral part of these financial statements.
141
KINETICS PORTFOLIOS TRUST — MASTER INVESTMENT PORTFOLIOS
The Market Opportunities Portfolio
Consolidated Portfolio of Investments — December 31, 2019 — (Continued)
| | | | | | | |
| PREFERRED STOCKS — 0.26% | | Shares | | | Value | |
| Other Investment Pools and Funds — 0.26% | | | | | | |
Partners Value Investments LP — Class Af | | | 11,832 | | | $ | 226,583 | |
TOTAL PREFERRED STOCKS | | | | | | | | |
(cost $219,010) | | | | | | | 226,583 | |
| | |
| | Principal | | | | | |
| CONVERTIBLE BONDS — 0.00% | | Amount | | | | | |
| Department Stores — 0.00% | | | | | | | | |
Sears Holdings Corporation, 8.000%, 12/15/2019*ef | | $ | 5,720 | | | | 100 | |
TOTAL CONVERTIBLE BONDS | | | | | | | | |
(cost $5,720) | | | | | | | 100 | |
| | |
| WARRANTS — 0.25% | | Shares | | | | | |
| Other Investment Pools and Funds — 0.25% | | | | | | | | |
Partners Value Investments LP*f | | | 43,516 | | | | 217,823 | |
Expiration: 06/30/2026, Exercise Price: 32.45 CAD | | | | | | | | |
TOTAL WARRANTS | | | | | | | | |
(cost $130,105) | | | | | | | 217,823 | |
| TOTAL INVESTMENTS — 59.16% | | | | | | | | |
| (cost $23,630,373) | | | | | | $ | 51,163,888 | |
| Percentages are stated as a percent of net assets. |
| * — Non-income producing security. |
| ^ — This security or a portion of this security was out on loan at December 31, 2019.Total loaned securities had a market value of $740,589 at December 31, 2019.The remaining contractual maturities of all of the securities lending transactions were overnight and continuous. The total collateral for the loaned securities was cash in the amount of $791,228. |
| c — Significant Investment - See note 2. |
| e — Default or other conditions exist and the security is not presently accruing income. |
| f — Level 2 Investment - See note 7. |
| ADR —American Depositary Receipt. |
| CAD —Canadian Dollars. |
The accompanying notes are an integral part of these financial statements.
142
KINETICS PORTFOLIOS TRUST — MASTER INVESTMENT PORTFOLIOS
The Alternative Income Portfolio
Portfolio of Investments — December 31, 2019 — (Continued)
| | | | | | | |
| EXCHANGE TRADED FUNDS — 35.50% | | Shares | | | Value | |
| Funds, Trusts, and Other Financial Vehicles — 35.50% | | | | | | |
iShares 1-3 Year Credit Bond ETF | | | 54,000 | | | $ | 2,896,020 | |
PIMCO Enhanced Short Maturity Active ETF | | | 4,700 | | | | 477,473 | |
SPDR Barclays Short Term Corporate Bond ETF# | | | 24,000 | | | | 740,160 | |
Vanguard Short-Term Corporate Bond ETF | | | 21,700 | | | | 1,758,351 | |
TOTAL EXCHANGE TRADED FUNDS | | | | | | | | |
(cost $5,804,792) | | | | | | | 5,872,004 | |
| | |
| | Principal | | | | | |
| SHORT-TERM INVESTMENTS — 14.41% | | Amount | | | | | |
| Money Market Funds — 14.41% | | | | | | | | |
Fidelity Institutional Government Portfolio — Class I, 1.49%#b | | $ | 2,383,461 | | | | 2,383,461 | |
TOTAL SHORT-TERM INVESTMENTS | | | | | | | | |
(cost $2,383,461) | | | | | | | 2,383,461 | |
| TOTAL INVESTMENTS — 49.91% | | | | | | | | |
| (cost $8,188,253) | | | | | | $ | 8,255,465 | |
| Percentages are stated as a percent of net assets. |
| # — All or a portion of the securities have been committed as collateral for written option contracts, totaling $3,123,621. |
| b — The rate quoted is the annualized seven-day yield as of December 31, 2019. |
| ETF — Exchange Traded Fund. |
The accompanying notes are an integral part of these financial statements.
143
KINETICS PORTFOLIOS TRUST — MASTER INVESTMENT PORTFOLIOS
The Multi-Disciplinary Income Portfolio
Portfolio of Investments — December 31, 2019 — (Continued)
| | | | | | | |
| | Principal | | | | |
| CONVERTIBLE BONDS — 1.80% | | Amount | | | Value | |
| Pipeline Transportation of Natural Gas — 1.80% | | | | | | |
Cheniere Energy, Inc., 4.250%, 03/15/2045f | | $ | 800,000 | | | $ | 634,042 | |
TOTAL CONVERTIBLE BONDS | | | | | | | | |
(cost $656,658) | | | | | | | 634,042 | |
| | |
| CORPORATE BONDS — 75.29% | | | | | | | | |
| Advertising, Public Relations, and Related Services — 1.45% | | | | | | | | |
Lamar Media Corp., 5.000%, 05/01/2023f | | | 500,000 | | | | 509,995 | |
| Broadcasting (except Internet) — 4.01% | | | | | | | | |
Cablevision Systems Corporation, 5.875%, 09/15/2022f | | | 200,000 | | | | 215,856 | |
TEGNA, Inc., 5.125%, 07/15/2020f | | | 128,000 | | | | 128,448 | |
Sirius XM Radio, Inc., 4.625%, 05/15/2023◾f | | | 1,050,000 | | | | 1,067,939 | |
| | | | | | | 1,412,243 | |
| Chemical Manufacturing — 10.89% | | | | | | | | |
Ashland, Inc., 4.750%, 08/15/2022cf | | | 3,000,000 | | | | 3,142,500 | |
The Chemours Companyf | | | | | | | | |
6.625%, 05/15/2023 | | | 474,000 | | | | 476,804 | |
7.000%, 05/15/2025^ | | | 214,000 | | | | 216,051 | |
| | | | | | | 3,835,355 | |
| Construction of Buildings — 8.07% | | | | | | | | |
Brookfield Residential Propertiesf | | | | | | | | |
6.125%, 07/01/2022◾ | | | 100,000 | | | | 101,749 | |
6.375%, 05/15/2025◾ | | | 651,000 | | | | 678,938 | |
Lennar Corporation, 4.750%, 11/15/2022cf | | | 1,960,000 | | | | 2,061,489 | |
| | | | | | | 2,842,176 | |
| Deep Sea, Coastal, and Great Lakes Water Transportation — 5.85% | | | | | | | | |
Stolt-Nielsen Limited, 6.375%, 09/21/2022cf | | | 2,000,000 | | | | 2,060,263 | |
| Fabricated Metal Product Manufacturing — 0.71% | | | | | | | | |
Ball Corporation, 5.250%, 07/01/2025f | | | 224,000 | | | | 249,947 | |
| Food Manufacturing — 5.81% | | | | | | | | |
Lamb Weston Holdings, Inc.f | | | | | | | | |
4.625%, 11/01/2024◾ | | | 1,000,000 | | | | 1,063,335 | |
4.875%, 11/01/2026◾ | | | 925,000 | | | | 982,211 | |
| | | | | | | 2,045,546 | |
The accompanying notes are an integral part of these financial statements.
144
KINETICS PORTFOLIOS TRUST — MASTER INVESTMENT PORTFOLIOS
The Multi-Disciplinary Income Portfolio
Portfolio of Investments — December 31, 2019 — (Continued)
| | | | | | | |
| | Principal | | | | |
| | Amount | | | Value | |
| Management of Companies and Enterprises — 8.55% | | | | | | |
Icahn Enterprises, 5.875%, 02/01/2022cf | | $ | 3,000,000 | | | $ | 3,009,090 | |
| Metal Ore Mining — 0.78% | | | | | | | | |
Teck Resources Limited, 4.750%, 01/15/2022f | | | 264,000 | | | | 273,587 | |
| Motor Vehicle and Parts Dealers — 10.25% | | | | | | | | |
Penske Automotive Group, Inc., 5.750%, 10/01/2022cf | | | 3,550,000 | | | | 3,607,663 | |
| Oil and Gas Extraction — 6.21% | | | | | | | | |
Continental Resources, Inc., 5.000%, 09/15/2022f | | | 328,000 | | | | 330,559 | |
Murphy Oil Corp., 4.450%, 12/01/2022f | | | 1,208,000 | | | | 1,247,252 | |
QEP Resources, Inc.f | | | | | | | | |
6.875%, 03/01/2021 | | | 250,000 | | | | 259,475 | |
5.375%, 10/01/2022 | | | 120,000 | | | | 120,937 | |
5.250%, 05/01/2023 | | | 230,000 | | | | 228,275 | |
| | | | | | | 2,186,498 | |
| Real Estate — 4.90% | | | | | | | | |
The Howard Hughes Corporation, 5.375%, 03/15/2025◾f | | | 1,650,000 | | | | 1,724,234 | |
| Support Activities for Mining — 2.69% | | | | | | | | |
Rowan Companies, Inc., 4.875%, 06/01/2022f | | | 600,000 | | | | 439,687 | |
Valaris plc, 4.700%, 03/15/2021f | | | 600,000 | | | | 506,250 | |
| | | | | | | 945,937 | |
| Telecommunications — 5.12% | | | | | | | | |
CenturyLink, Inc., 5.800%, 03/15/2022f | | | 500,000 | | | | 526,525 | |
Crown Castle International Corp., 4.875%, 04/15/2022f | | | 700,000 | | | | 741,751 | |
Hughes Satellite Systems Corp., 7.625%, 06/15/2021f | | | 500,000 | | | | 535,135 | |
| | | | | | | 1,803,411 | |
TOTAL CORPORATE BONDS | | | | | | | | |
(cost $25,861,274) | | | | | | | 26,505,945 | |
| | |
| MUNICIPAL BONDS — 0.47% | | | | | | | | |
| Support Activities for Air Transportation — 0.47% | | | | | | | | |
Branson Missouri Regional Airport Transportation Development District, | | | | | | | | |
5.000%, 04/01/2043+ef | | | 1,072,084 | | | | 166,398 | |
TOTAL MUNICIPAL BONDS | | | | | | | | |
(cost $2,257,446) | | | | | | | 166,398 | |
The accompanying notes are an integral part of these financial statements.
145
KINETICS PORTFOLIOS TRUST — MASTER INVESTMENT PORTFOLIOS
The Multi-Disciplinary Income Portfolio
Portfolio of Investments — December 31, 2019 — (Continued)
| | | | | | | |
| CLOSED-END FUNDS — 8.96% | | Shares | | | Value | |
| Funds, Trusts, and Other Financial Vehicles — 8.96% | | | | | | |
DoubleLine Opportunistic Credit Fund | | | 50,900 | | | $ | 1,050,576 | |
PIMCO Dynamic Income Fund^ | | | 64,800 | | | | 2,102,112 | |
TOTAL CLOSED-END FUNDS | | | | | | | | |
(cost $3,331,810) | | | | | | | 3,152,688 | |
| TOTAL INVESTMENTS — 86.52% | | | | | | | | |
| (cost $32,107,188) | | | | | | $ | 30,459,073 | |
| Percentages are stated as a percent of net assets. |
◾— The percentage of net assets comprised of 144a securities was 15.96%. |
| ^ — This security or a portion of this security was out on loan at December 31, 2019. Total loaned securities had a market value of $2,296,938 at December 31, 2019. The remaining contractual maturities of all of the securities lending transactions were overnight and continuous. The total collateral for the loaned securities was cash in the amount of $2,353,350. |
| + — Security is considered illiquid. The aggregate value of such securities is $166,398 or 0.47% of net assets. |
| c — Significant Investment — See note 2. |
| e — Default or other conditions exist and the security is not presently accruing income. |
| f — Level 2 Investment — See note 7. |
The accompanying notes are an integral part of these financial statements.
146
KINETICS PORTFOLIOS TRUST — MASTER INVESTMENT PORTFOLIOS
Statements of Assets & Liabilities
December 31, 2019
| | | | | | | | |
| | | The Internet | | | The Global | |
| | | Portfolio | | | Portfolio | |
| | | (Consolidated) | | | (Consolidated) | |
| ASSETS: | | | | | | |
Investments, at value(1)(2) | | $ | 82,497,354 | | | $ | 7,398,120 | |
Cash | | | 36,533,458 | | | | 7,028,002 | |
Cash proceeds from securities lending | | | 6,498,625 | | | | 92,164 | |
Receivable for contributed capital | | | 110,800 | | | | 14,140 | |
Dividends and interest receivable | | | 66,926 | | | | 27,590 | |
Prepaid expenses and other assets | | | 6,138 | | | | 242 | |
| Total Assets | | | 125,713,301 | | | | 14,560,258 | |
| LIABILITIES: | | | | | | | | |
Payable to Adviser | | | 126,682 | | | | 15,135 | |
Payable to Trustees | | | 3,228 | | | | 378 | |
Payable to Chief Compliance Officer | | | 180 | | | | 17 | |
Payable for collateral received for securities loaned | | | 6,498,625 | | | | 92,164 | |
Payable for withdrawn capital | | | 351,000 | | | | 12,826 | |
Accrued expenses and other liabilities | | | 47,560 | | | | 21,382 | |
| Total Liabilities | | | 7,027,275 | | | | 141,902 | |
| Net Assets | | $ | 118,686,026 | | | $ | 14,418,356 | |
(1) | Cost of investments | | $ | 57,705,029 | | | $ | 4,249,823 | |
(2) | Includes loaned securities with a market value of | | $ | 6,192,934 | | | $ | 86,265 | |
The accompanying notes are an integral part of these financial statements.
147
KINETICS PORTFOLIOS TRUST — MASTER INVESTMENT PORTFOLIOS
Statements of Assets & Liabilities — (Continued)
December 31, 2019
| | | | | | | | |
| | | The Paradigm | | | | |
| | | Portfolio | | | The Medical | |
| | | (Consolidated) | | | Portfolio | |
| ASSETS: | | | | | | |
Investments, at value(1)(2) | | $ | 653,670,443 | | | $ | 16,492,325 | |
Cash | | | 146,369,264 | | | | 429,515 | |
Cash proceeds from securities lending | | | 24,872,480 | | | | 27,300 | |
Receivable for contributed capital | | | 643,958 | | | | 733 | |
Dividends and interest receivable | | | 358,671 | | | | 52,237 | |
Prepaid expenses and other assets | | | 29,527 | | | | 186 | |
| Total Assets | | | 825,944,343 | | | | 17,002,296 | |
| LIABILITIES: | | | | | | | | |
Payable to Adviser | | | 821,319 | | | | 17,905 | |
Payable to Trustees | | | 19,825 | | | | 413 | |
Payable to Chief Compliance Officer | | | 1,218 | | | | 26 | |
Payable for collateral received for securities loaned | | | 24,872,480 | | | | 27,300 | |
Payable for withdrawn capital | | | 530,389 | | | | 152,063 | |
Accrued expenses and other liabilities | | | 199,009 | | | | 20,943 | |
| Total Liabilities | | | 26,444,240 | | | | 218,650 | |
| Net Assets | | $ | 799,500,103 | | | $ | 16,783,646 | |
(1) | Cost of investments | | $ | 278,654,208 | | | $ | 10,065,099 | |
(2) | Includes loaned securities with a market value of | | $ | 23,594,367 | | | $ | 26,562 | |
The accompanying notes are an integral part of these financial statements.
148
KINETICS PORTFOLIOS TRUST — MASTER INVESTMENT PORTFOLIOS
Statements of Assets & Liabilities — (Continued)
December 31, 2019
| | | | | | | | |
| | | The Small Cap | | | The Market | |
| | | Opportunities
| | | Opportunities | |
| | | Portfolio | | | Portfolio | |
| | | (Consolidated) | | | (Consolidated) | |
| ASSETS: | | | | | | |
Investments, at value(1)(2) | | $ | 224,887,888 | | | $ | 51,163,888 | |
Cash | | | 46,105,451 | | | | 35,425,984 | |
Cash proceeds from securities lending | | | 2,673,242 | | | | 791,228 | |
Receivable for contributed capital | | | 452,540 | | | | 3,716 | |
Dividends and interest receivable | | | 213,463 | | | | 70,434 | |
Prepaid expenses and other assets | | | 6,042 | | | | 1,750 | |
| Total Assets | | | 274,338,626 | | | | 87,457,000 | |
| LIABILITIES: | | | | | | | | |
Payable to Adviser | | | 278,720 | | | | 89,505 | |
Payable to Trustees | | | 7,081 | | | | 2,184 | |
Payable to Chief Compliance Officer | | | 508 | | | | 122 | |
Payable for collateral received for securities loaned | | | 2,673,242 | | | | 791,228 | |
Payable for withdrawn capital | | | 1,523,815 | | | | 56,011 | |
Accrued expenses and other liabilities | | | 84,502 | | | | 38,559 | |
| Total Liabilities | | | 4,567,868 | | | | 977,609 | |
| Net Assets | | $ | 269,770,758 | | | $ | 86,479,391 | |
(1) | Cost of investments | | $ | 138,914,691 | | | $ | 23,630,373 | |
(2) | Includes loaned securities with a market value of | | $ | 2,502,504 | | | $ | 740,589 | |
The accompanying notes are an integral part of these financial statements.
149
KINETICS PORTFOLIOS TRUST — MASTER INVESTMENT PORTFOLIOS
Statements of Assets & Liabilities — (Continued)
December 31, 2019
| | | | | | | | |
| | | | | | The Multi- | |
| | | The Alternative | | | Disciplinary | |
| | | Income | | | Income | |
| | | Portfolio | | | Portfolio | |
| ASSETS: | | | | | | |
Investments, at value(1)(2) | | $ | 8,255,465 | | | $ | 30,459,073 | |
Cash | | | 8,331,938 | | | | 4,370,851 | |
Cash proceeds from securities lending | | | — | | | | 2,353,350 | |
Receivable for contributed capital | | | 10,250 | | | | 50,648 | |
Dividends and interest receivable | | | 15,901 | | | | 387,424 | |
Prepaid expenses and other assets | | | 197 | | | | 9,259 | |
| Total Assets | | | 16,613,751 | | | | 37,630,605 | |
| LIABILITIES: | | | | | | | | |
Payable to Adviser | | | 12,828 | | | | 37,615 | |
Payable to Trustees | | | 453 | | | | 942 | |
Payable to Chief Compliance Officer | | | 32 | | | | 54 | |
Payable for collateral received for securities loaned | | | — | | | | 2,353,350 | |
Payable for withdrawn capital | | | 37,910 | | | | 8,344 | |
Accrued expenses and other liabilities | | | 21,321 | | | | 25,990 | |
| Total Liabilities | | | 72,544 | | | | 2,426,295 | |
| Net Assets | | $ | 16,541,207 | | | $ | 35,204,310 | |
(1) | Cost of investments | | $ | 8,188,253 | | | $ | 32,107,188 | |
(2) | Includes loaned securities with a market value of | | $ | — | | | $ | 2,296,938 | |
The accompanying notes are an integral part of these financial statements.
150
KINETICS PORTFOLIOS TRUST — MASTER INVESTMENT PORTFOLIOS
Statements of Operations
For the Year Ended December 31, 2019
| | | | | | | |
| | The Internet | | | The Global | |
| | Portfolio | | | Portfolio | |
| | (Consolidated) | | | (Consolidated) | |
| INVESTMENT INCOME: | | | | | | |
| Dividends† | | $ | 394,456 | | | $ | 48,908 | |
| Interest | | | 792,921 | | | | 136,198 | |
| Income from securities lending | | | 137,434 | | | | 5,037 | |
| Total investment income | | | 1,324,811 | | | | 190,143 | |
| EXPENSES: | | | | | | | | |
| Investment advisory fees | | | 1,535,712 | | | | 167,722 | |
| Administration fees | | | 64,920 | | | | 19,189 | |
| Professional fees | | | 25,174 | | | | 13,698 | |
| Fund accounting fees | | | 24,321 | | | | 4,636 | |
| Trustees’ fees | | | 13,067 | | | | 1,417 | |
| Chief Compliance Officer fees | | | 2,276 | | | | 248 | |
| Custodian fees and expenses | | | 14,937 | | | | 5,964 | |
| Registration fees | | | 549 | | | | 549 | |
| Other expenses | | | 4,805 | | | | 486 | |
| Total expenses | | | 1,685,761 | | | | 213,909 | |
| Net investment loss | | | (360,950 | ) | | | (23,766 | ) |
| REALIZED AND UNREALIZED GAIN (LOSS) ON INVESTMENTS: | | | | | | | | |
| Net realized loss on: | | | | | | | | |
| Investments and foreign currency | | | (1,224,519 | ) | | | (70,372 | ) |
| Net change in unrealized appreciation of: | | | | | | | | |
| Investments and foreign currency | | | 29,309,130 | | | | 2,330,656 | |
Net realized and unrealized gain on investments | | | 28,084,611 | | | | 2,260,284 | |
Net increase in net assets resulting from operations | | $ | 27,723,661 | | | $ | 2,236,518 | |
† Net of foreign taxes withheld of: | | $ | 1,099 | | | $ | 2,429 | |
The accompanying notes are an integral part of these financial statements.
151
KINETICS PORTFOLIOS TRUST — MASTER INVESTMENT PORTFOLIOS
Statements of Operations — (Continued)
For the Year Ended December 31, 2019
| | | | | | | |
| | The Paradigm | | | | |
| | Portfolio | | | The Medical | |
| | (Consolidated) | | | Portfolio | |
| INVESTMENT INCOME: | | | | | | |
| Dividends† | | $ | 4,398,654 | | | $ | 437,055 | |
| Interest | | | 2,466,696 | | | | 2,917 | |
| Income from securities lending | | | 354,481 | | | | 7,818 | |
| Total investment income | | | 7,219,831 | | | | 447,790 | |
| EXPENSES: | | | | | | | | |
| Investment advisory fees | | | 9,769,583 | | | | 205,196 | |
| Administration fees | | | 343,679 | | | | 20,200 | |
| Professional fees | | | 89,287 | | | | 10,225 | |
| Fund accounting fees | | | 144,307 | | | | 4,489 | |
| Trustees’ fees | | | 82,248 | | | | 1,752 | |
| Chief Compliance Officer fees | | | 14,839 | | | | 315 | |
| Custodian fees and expenses | | | 94,815 | | | | 4,711 | |
| Registration fees | | | 549 | | | | 50 | |
| Other expenses | | | 30,082 | | | | 674 | |
| Total expenses | | | 10,569,389 | | | | 247,612 | |
| Net investment income (loss) | | | (3,349,558 | ) | | | 200,178 | |
| REALIZED AND UNREALIZED GAIN ON INVESTMENTS: | | | | | | | | |
| Net realized gain on: | | | | | | | | |
| Investments and foreign currency | | | 10,032,976 | | | | 72,224 | |
| Net change in unrealized appreciation of: | | | | | | | | |
| Investments and foreign currency | | | 193,278,590 | | | | 2,145,624 | |
Net realized and unrealized gain on investments | | | 203,311,566 | | | | 2,217,848 | |
Net increase in net assets resulting from operations | | $ | 199,962,008 | | | $ | 2,418,026 | |
† Net of foreign taxes withheld of: | | $ | 118,868 | | | $ | 16,223 | |
The accompanying notes are an integral part of these financial statements.
152
KINETICS PORTFOLIOS TRUST — MASTER INVESTMENT PORTFOLIOS
Statements of Operations — (Continued)
For the Year Ended December 31, 2019
| | | | | | | |
| | The Small Cap | | | The Market | |
| | Opportunities | | | Opportunities | |
| | Portfolio | | | Portfolio | |
| | (Consolidated) | | | (Consolidated) | |
| INVESTMENT INCOME: | | | | | | |
| Dividends† | | $ | 1,515,770 | | | $ | 374,375 | |
| Interest | | | 1,826,544 | | | | 756,017 | |
| Income from securities lending | | | 55,363 | | | | 28,213 | |
| Total investment income | | | 3,397,677 | | | | 1,158,605 | |
| EXPENSES: | | | | | | | | |
| Investment advisory fees | | | 3,645,433 | | | | 1,045,328 | |
| Administration fees | | | 136,957 | | | | 48,632 | |
| Professional fees | | | 44,841 | | | | 22,669 | |
| Fund accounting fees | | | 55,555 | | | | 17,661 | |
| Trustees’ fees | | | 30,693 | | | | 8,844 | |
| Chief Compliance Officer fees | | | 5,681 | | | | 1,578 | |
| Custodian fees and expenses | | | 40,267 | | | | 13,264 | |
| Registration fees | | | 51 | | | | 549 | |
| Other expenses | | | 10,854 | | | | 3,102 | |
| Total expenses | | | 3,970,332 | | | | 1,161,627 | |
| Net investment loss | | | (572,655 | ) | | | (3,022 | ) |
| REALIZED AND UNREALIZED GAIN (LOSS) ON INVESTMENTS: | | | | | | | | |
| Net realized loss on: | | | | | | | | |
| Investments and foreign currency | | | (1,522,717 | ) | | | (64,771 | ) |
| Net change in unrealized appreciation of: | | | | | | | | |
| Investments and foreign currency | | | 62,303,135 | | | | 16,281,763 | |
Net realized and unrealized gain on investments | | | 60,780,418 | | | | 16,216,992 | |
Net increase in net assets resulting from operations | | $ | 60,207,763 | | | $ | 16,213,970 | |
† Net of foreign taxes withheld of: | | $ | 61,638 | | | $ | 10,038 | |
The accompanying notes are an integral part of these financial statements.
153
KINETICS PORTFOLIOS TRUST — MASTER INVESTMENT PORTFOLIOS
Statements of Operations — (Continued)
For the Year Ended December 31, 2019
| | | | | | | |
| | | | | The Multi- | |
| | The Alternative | | | Disciplinary | |
| | Income | | | Income | |
| | Portfolio | | | Portfolio | |
| INVESTMENT INCOME: | | | | | | |
| Dividends | | $ | 172,351 | | | $ | 250,147 | |
| Interest | | | 264,102 | | | | 1,752,114 | |
| Income from securities lending | | | — | | | | 55,966 | |
| Total investment income | | | 436,453 | | | | 2,058,227 | |
| EXPENSES: | | | | | | | | |
| Investment advisory fees | | | 166,040 | | | | 460,664 | |
| Administration fees | | | 21,707 | | | | 29,836 | |
| Professional fees | | | 10,445 | | | | 12,285 | |
| Fund accounting fees | | | 3,887 | | | | 13,621 | |
| Trustees’ fees | | | 1,990 | | | | 3,965 | |
| Chief Compliance Officer fees | | | 359 | | | | 697 | |
| Custodian fees and expenses | | | 5,719 | | | | 6,356 | |
| Registration fees | | | 50 | | | | 50 | |
| Other expenses | | | 777 | | | | 1,556 | |
| Total expenses | | | 210,974 | | | | 529,030 | |
| Net investment income | | | 225,479 | | | | 1,529,197 | |
| REALIZED AND UNREALIZED GAIN (LOSS) ON INVESTMENTS: | | | | | | | | |
| Net realized gain (loss) on: | | | | | | | | |
| Investments and foreign currency | | | (116 | ) | | | (15,242 | ) |
| Written option contracts expired or closed | | | 31,663 | | | | — | |
| Net change in unrealized appreciation (depreciation) of: | | | | | | | | |
| Investments and foreign currency | | | 193,989 | | | | 1,769,197 | |
| Written option contracts | | | (26,903 | ) | | | — | |
Net realized and unrealized gain on investments | | | 198,633 | | | | 1,753,955 | |
Net increase in net assets resulting from operations | | $ | 424,112 | | | $ | 3,283,152 | |
The accompanying notes are an integral part of these financial statements.
154
KINETICS PORTFOLIOS TRUST — MASTER INVESTMENT PORTFOLIOS
Statements of Changes in Net Assets
| | | | | | | | | | | | | |
| | The Internet Portfolio | | | The Global Portfolio | |
| | (Consolidated) | | | (Consolidated) | |
| | For the | | | For the | | | For the | | | For the | |
| | Year Ended | | | Year Ended | | | Year Ended | | | Year Ended | |
| | December 31, | | | December 31, | | | December 31, | | | December 31, | |
| | 2019 | | | 2018 | | | 2019 | | | 2018 | |
| OPERATIONS: | | | | | | | | | | | | |
| Net investment loss | | $ | (360,950 | ) | | $ | (852,933 | ) | | $ | (23,766 | ) | | $ | (79,686 | ) |
| Net realized gain (loss) on sale of | | | | | | | | | | | | | | | | |
| investments and foreign currency | | | (1,224,519 | ) | | | 32,301,030 | | | | (70,372 | ) | | | (276,114 | ) |
| Net change in unrealized appreciation | | | | | | | | | | | | | | | | |
| (depreciation) of investments and | | | | | | | | | | | | | | | | |
| foreign currency | | | 29,309,130 | | | | (74,922,835 | ) | | | 2,330,656 | | | | (3,293,146 | ) |
| Net increase (decrease) in net assets | | | | | | | | | | | | | | | | |
| resulting from operations | | | 27,723,661 | | | | (43,474,738 | ) | | | 2,236,518 | | | | (3,648,946 | ) |
| NET INCREASE (DECREASE) IN NET ASSETS | | | | | | | | | | | | | | | | |
| RESULTING FROM BENEFICIAL | | | | | | | | | | | | | | | | |
| INTEREST TRANSACTIONS: | | | | | | | | | | | | | | | | |
| Contributions | | | 2,215,210 | | | | 6,470,678 | | | | 2,427,025 | | | | 1,307,577 | |
| Withdrawals | | | (17,147,438 | ) | | | (25,363,999 | ) | | | (1,217,183 | ) | | | (2,373,818 | ) |
| Net increase (decrease) in net assets | | | | | | | | | | | | | | | | |
| resulting from capital | | | | | | | | | | | | | | | | |
| share transactions | | | (14,932,228 | ) | | | (18,893,321 | ) | | | 1,209,842 | | | | (1,066,241 | ) |
| Total increase (decrease) in | | | | | | | | | | | | | | | | |
| net assets | | | 12,791,433 | | | | (62,368,059 | ) | | | 3,446,360 | | | | (4,715,187 | ) |
| NET ASSETS: | | | | | | | | | | | | | | | | |
| Beginning of year | | | 105,894,593 | | | | 168,262,652 | | | | 10,971,996 | | | | 15,687,183 | |
| End of year | | $ | 118,686,026 | | | $ | 105,894,593 | | | $ | 14,418,356 | | | $ | 10,971,996 | |
The accompanying notes are an integral part of these financial statements.
155
KINETICS PORTFOLIOS TRUST — MASTER INVESTMENT PORTFOLIOS
Statements of Changes in Net Assets — (Continued)
| | | | | | | | | | | | | |
| | The Paradigm Portfolio | | | | | | | |
| | (Consolidated) | | | The Medical Portfolio | |
| | For the | | | For the | | | For the | | | For the | |
| | Year Ended | | | Year Ended | | | Year Ended | | | Year Ended | |
| | December 31, | | | December 31, | | | December 31, | | | December 31, | |
| | 2019 | | | 2018 | | | 2019 | | | 2018 | |
| OPERATIONS: | | | | | | | | | | | | |
| Net investment income (loss) | | $ | (3,349,558 | ) | | $ | (5,456,085 | ) | | $ | 200,178 | | | $ | 171,494 | |
| Net realized gain on sale of investments | | | | | | | | | | | | | | | | |
| and foreign currency | | | 10,032,976 | | | | 129,576,341 | | | | 72,224 | | | | 1,560,378 | |
| Net change in unrealized appreciation | | | | | | | | | | | | | | | | |
| (depreciation) of investments and | | | | | | | | | | | | | | | | |
| foreign currency | | | 193,278,590 | | | | (165,251,075 | ) | | | 2,145,624 | | | | (1,466,285 | ) |
| Net increase (decrease) in net assets | | | | | | | | | | | | | | | | |
| resulting from operations | | | 199,962,008 | | | | (41,130,819 | ) | | | 2,418,026 | | | | 265,587 | |
| NET DECREASE IN NET ASSETS | | | | | | | | | | | | | | | | |
| RESULTING FROM BENEFICIAL | | | | | | | | | | | | | | | | |
| INTEREST TRANSACTIONS: | | | | | | | | | | | | | | | | |
| Contributions | | | 14,773,055 | | | | 77,369,100 | | | | 171,014 | | | | 206,115 | |
| Withdrawals | | | (73,514,626 | ) | | | (168,838,467 | ) | | | (2,275,086 | ) | | | (3,464,345 | ) |
| Net decrease in net assets | | | | | | | | | | | | | | | | |
| resulting from beneficial | | | | | | | | | | | | | | | | |
| interest transactions | | | (58,741,571 | ) | | | (91,469,367 | ) | | | (2,104,072 | ) | | | (3,258,230 | ) |
| Total increase (decrease) in net assets | | | 141,220,437 | | | | (132,600,186 | ) | | | 313,954 | | | | (2,992,643 | ) |
| NET ASSETS: | | | | | | | | | | | | | | | | |
| Beginning of year | | | 658,279,666 | | | | 790,879,852 | | | | 16,469,692 | | | | 19,462,335 | |
| End of year | | $ | 799,500,103 | | | $ | 658,279,666 | | | $ | 16,783,646 | | | $ | 16,469,692 | |
The accompanying notes are an integral part of these financial statements.
156
KINETICS PORTFOLIOS TRUST — MASTER INVESTMENT PORTFOLIOS
Statements of Changes in Net Assets — (Continued)
| | | | | | | | | | | | | |
| | The Small Cap | | | The Market | |
| | Opportunities Portfolio | | | Opportunities Portfolio | |
| | (Consolidated) | | | (Consolidated) | |
| | For the | | | For the | | | For the | | | For the | |
| | Year Ended | | | Year Ended | | | Year Ended | | | Year Ended | |
| | December 31, | | | December 31, | | | December 31, | | | December 31, | |
| | 2019 | | | 2018 | | | 2019 | | | 2018 | |
| OPERATIONS: | | | | | | | | | | | | |
| Net investment loss | | $ | (572,655 | ) | | $ | (909,931 | ) | | $ | (3,022 | ) | | $ | (250,527 | ) |
| Net realized gain (loss) on sale | | | | | | | | | | | | | | | | |
| of investments and | | | | | | | | | | | | | | | | |
| foreign currency | | | (1,522,717 | ) | | | 1,460,421 | | | | (64,771 | ) | | | 3,266,854 | |
| Net change in unrealized appreciation | | | | | | | | | | | | | | | | |
| (depreciation) of investments and | | | | | | | | | | | | | | | | |
| foreign currency | | | 62,303,135 | | | | (7,770,750 | ) | | | 16,281,763 | | | | (12,167,425 | ) |
| Net increase (decrease) in net assets | | | | | | | | | | | | | | | | |
| resulting from operations | | | 60,207,763 | | | | (7,220,260 | ) | | | 16,213,970 | | | | (9,151,098 | ) |
| NET INCREASE (DECREASE) IN NET ASSETS | | | | | | | | | | | | | | | | |
| RESULTING FROM BENEFICIAL | | | | | | | | | | | | | | | | |
| INTEREST TRANSACTIONS: | | | | | | | | | | | | | | | | |
| Contributions | | | 83,789,647 | | | | 153,048,372 | | | | 5,055,082 | | | | 12,968,925 | |
| Withdrawals | | | (97,620,267 | ) | | | (103,903,461 | ) | | | (7,728,189 | ) | | | (8,159,216 | ) |
| Net increase (decrease) in net assets | | | | | | | | | | | | | | | | |
| resulting from beneficial | | | | | | | | | | | | | | | | |
| interest transactions | | | (13,830,620 | ) | | | 49,144,911 | | | | (2,673,107 | ) | | | 4,809,709 | |
| Total increase (decrease) in net assets | | | 46,377,143 | | | | 41,924,651 | | | | 13,540,863 | | | | (4,341,389 | ) |
| NET ASSETS: | | | | | | | | | | | | | | | | |
| Beginning of year | | | 223,393,615 | | | | 181,468,964 | | | | 72,938,528 | | | | 77,279,917 | |
| End of year | | $ | 269,770,758 | | | $ | 223,393,615 | | | $ | 86,479,391 | | | $ | 72,938,528 | |
The accompanying notes are an integral part of these financial statements.
157
KINETICS PORTFOLIOS TRUST — MASTER INVESTMENT PORTFOLIOS
Statements of Changes in Net Assets — (Continued)
| | | | | | | | | | | | | |
| | The Alternative | | | The Multi-Disciplinary | |
| | Income Portfolio | | | Income Portfolio | |
| | For the | | | For the | | | For the | | | For the | |
| | Year Ended | | | Year Ended | | | Year Ended | | | Year Ended | |
| | December 31, | | | December 31, | | | December 31, | | | December 31, | |
| | 2019 | | | 2018 | | | 2019 | | | 2018 | |
| OPERATIONS: | | | | | | | | | | | | |
| Net investment income | | $ | 225,479 | | | $ | 167,001 | | | $ | 1,529,197 | | | $ | 1,794,418 | |
| Net realized gain (loss) on sale of | | | | | | | | | | | | | | | | |
| investments, foreign currency, | | | | | | | | | | | | | | | | |
| written options and distributions received | | | | | | | | | | | | | | | | |
| from other investment companies | | | 31,547 | | | | 12,409 | | | | (15,242 | ) | | | (106,210 | ) |
| Net change in unrealized appreciation | | | | | | | | | | | | | | | | |
| (depreciation) of investments, foreign | | | | | | | | | | | | | | | | |
| currency and written options | | | 167,086 | | | | (52,766 | ) | | | 1,769,197 | | | | (2,054,163 | ) |
| Net increase (decrease) in net assets | | | | | | | | | | | | | | | | |
| resulting from operations | | | 424,112 | | | | 126,644 | | | | 3,283,152 | | | | (365,955 | ) |
| NET DECREASE IN NET ASSETS | | | | | | | | | | | | | | | | |
| RESULTING FROM BENEFICIAL | | | | | | | | | | | | | | | | |
| INTEREST TRANSACTIONS: | | | | | | | | | | | | | | | | |
| Contributions | | | 1,542,929 | | | | 2,933,892 | | | | 1,410,845 | | | | 5,144,814 | |
| Withdrawals | | | (4,557,926 | ) | | | (7,035,790 | ) | | | (6,906,144 | ) | | | (16,568,073 | ) |
| Net decrease in net assets | | | | | | | | | | | | | | | | |
| resulting from beneficial | | | | | | | | | | | | | | | | |
| interest transactions | | | (3,014,997 | ) | | | (4,101,898 | ) | | | (5,495,299 | ) | | | (11,423,259 | ) |
| Total decrease in net assets | | | (2,590,885 | ) | | | (3,975,254 | ) | | | (2,212,147 | ) | | | (11,789,214 | ) |
| NET ASSETS: | | | | | | | | | | | | | | | | |
| Beginning of year | | | 19,132,092 | | | | 23,107,346 | | | | 37,416,457 | | | | 49,205,671 | |
| End of year | | $ | 16,541,207 | | | $ | 19,132,092 | | | $ | 35,204,310 | | | $ | 37,416,457 | |
The accompanying notes are an integral part of these financial statements.
158
KINETICS PORTFOLIOS TRUST — MASTER INVESTMENT PORTFOLIOS
Notes to Consolidated Financial Statements
December 31, 2019
1. Organization
The Kinetics Portfolios Trust (the “Trust”) was organized as a Delaware Statutory Trust on March 14, 2000 and is registered under the Investment Company Act of 1940, as amended (the “1940 Act”), as an open-end management investment company issuing its beneficial interests in series, each series representing a distinct portfolio with its own investment objective and policies. The series currently authorized are: The Internet Portfolio, The Global Portfolio, The Paradigm Portfolio, The Medical Portfolio, The Small Cap Opportunities Portfolio, The Market Opportunities Portfolio, The Alternative Income Portfolio and The Multi-Disciplinary Income Portfolio (collectively, the “Master Portfolios”). Pursuant to the 1940 Act, the Master Portfolios, are “non- diversified” series of the Trust, except The Global Portfolio, The Alternative Income Portfolio and The Multi-Disciplinary Income Portfolio. The Market Opportunities Portfolio commenced operations on January 31, 2006, The Alternative Income Portfolio commenced operations on June 29, 2007 and The Multi-Disciplinary Income Portfolio commenced operations on February 11, 2008. Each of the remaining Master Portfolios commenced operations on April 28, 2000.
Each Master Portfolio is a Master Investment Portfolio in a master-feeder fund structure. Each Master Portfolio has multiple feeder funds invested in the Master Portfolio. By contributing assets to the Master Portfolio, the feeder funds receive a beneficial interest in the Master Portfolio. The Master Portfolio then invests the contributed assets in portfolio securities and allocates income, gains (losses) and expenses to the feeder funds based on the feeder funds’ proportionate interests in the Master Portfolio.
Each of the Master Portfolios, except for The Alternative Income Portfolio and The Multi-Disciplinary Income Portfolio, seeks to provide investors with long-term capital growth. The Alternative Income Portfolio seeks to provide current income and gains. The Multi-Disciplinary Income Portfolio seeks to provide investors with total return. The Internet Portfolio invests primarily in the equity securities of U.S. and foreign companies engaged in the Internet and Internet-related activities. The Global Portfolio generally invests in the equity securities of foreign companies that have the ability to facilitate an increase in the growth of their traditional business lines and in U.S. companies benefiting from international economic growth. The Paradigm Portfolio invests primarily in the equity securities of U.S. and foreign companies that the investment adviser believes are undervalued and that have high returns on equity and are well
159
KINETICS PORTFOLIOS TRUST — MASTER INVESTMENT PORTFOLIOS
Notes to Consolidated Financial Statements —
(Continued) December 31, 2019
positioned to reduce their costs, extend the reach of their distribution channels and experience significant growth in their assets or revenues. The Medical Portfolio invests primarily in the equity securities of U.S. and foreign companies engaged in medical research, pharmaceutical treatments and related medical technology industries and related technology industries, generally, with a focus on companies engaged in cancer research and drug development. The Small Cap Opportunities Portfolio invests primarily in the equity securities of U.S. and foreign small capitalized companies that provide attractive valuation opportunities due to special situations such as lack of institutional ownership, lack of significant analyst coverage or companies with sound fundamentals that have experienced a short-term earnings shortfall. The Market Opportunities Portfolio invests primarily in the equity securities of U.S. and foreign companies engaged in capital markets or related to capital markets, as well as companies involved in the gaming industry. The Alternative Income and Multi-Disciplinary Income Portfolios utilize a two-part investment strategy, which includes fixed income and derivatives components. The Internet Portfolio, Global Portfolio, Paradigm Portfolio, Small Cap Opportunities Portfolio and Market Opportunities Portfolio utilize wholly-owned subsidiaries to achieve their investment objectives. Please see Note 2 for further details.
2. Significant Accounting Policies
Security Valuation
Master Portfolios equity securities that are listed on a securities exchange for which market quotations are readily available are valued at the last quoted sale price on the day the valuation is made. Price information on listed securities is taken from the exchange where the security is primarily traded. All equity securities, including exchange-traded funds, that are traded using the National Association of Securities Dealers’ Automated Quotation System (“NASDAQ”) are valued using the NASDAQ Official Closing Price (“NOCP”). In the event market quotations are not readily available or if events occur that may materially affect the value of a particular security between the time trading ends on a particular security and the close of regular trading on the New York Stock Exchange (“NYSE”), “fair value” will be determined. Unlisted equity securities and listed equity securities not traded on the valuation date for which market quotations are readily available are valued at the last bid price. Futures, options on futures and swap contracts that are listed or traded on a national securities exchange, commodities exchange, contract market or over-the-counter markets and are freely transferable will be valued at the composite price, using the
160
KINETICS PORTFOLIOS TRUST — MASTER INVESTMENT PORTFOLIOS
Notes to Consolidated Financial Statements —
(Continued) December 31, 2019
National Best Bid and Offer quotes (“NBBO”). NBBO consists of the highest bid price and lowest ask price across any of the exchanges on which an option is quoted, thus providing a view across the entire U.S. options marketplace.
Composite option pricing calculates the mean of the highest bid price and lowest asked price across the exchanges where the option is traded. If a composite option price is not available, then a quote provided by one of the authorized pricing vendors will be used. If neither a composite price nor a quote from an authorized pricing provider is available, and it is the day of expiration or post-expiration, expiring options will be priced at intrinsic value. Non-exchange-traded options for which over-the-counter quotations are not readily available are valued at the mean between the last bid and asked quotations. Debt obligations (including convertible securities) that are either investment grade or below investment grade and irrespective of days to maturity are valued at evaluated mean by one of the authorized third party pricing agents which rely on various valuation methodologies such as matrix pricing and other analytical pricing models as well as market transactions and dealer quotations. Certain instruments, such as repurchase agreements and demand notes, do not have values from third parties and are valued at amortized cost. Investments in registered open-end investment companies (including money market funds), other than exchange-traded funds, are valued at their reported net asset value (“NAV”).
Other assets and securities for which no quotations are readily available (including restricted securities) will be valued in good faith at fair value using methods determined by the Board of Trustees of the Master Portfolios. In determining the fair value of a security, the Board of Trustees shall take into account the relevant factors and surrounding circumstances, which may include: (i) the nature and pricing history (if any) of the security; (ii) whether any dealer quotations for the security are available; (iii) possible valuation methodologies that could be used to determine the fair value of the security; (iv) the recommendation of the portfolio manager of the Portfolios with respect to the valuation of the security; (v) whether the same or similar securities are held by other funds managed by the Adviser or other funds and the method used to price the security in those funds; (vi) the extent to which the fair value to be determined for the security will result from the use of data or formula produced by third parties independent of the Adviser; (vii) the liquidity or illiquidity of the market for the security; and (viii) the value of a foreign security traded on other foreign markets. At December 31, 2019, 0.00% and 0.00% of
161
KINETICS PORTFOLIOS TRUST — MASTER INVESTMENT PORTFOLIOS
Notes to Consolidated Financial Statements —
(Continued) December 31, 2019
the net assets of The Internet Portfolio and The Paradigm Portfolio, respectively, were fair valued securities. The other Master Portfolios did not hold any fair valued securities at December 31, 2019.
Bitcoin
The Master Portfolios may invest in Grayscale Bitcoin Trust, a Delaware statutory trust (“Bitcoin Trust”) that invests in bitcoins. From time to time, the Bitcoin Trust issues creation units in exchange for bitcoins and distributes bitcoins in exchange for redemption units. The performance of the Bitcoin Trust is intended to reflect changes in the value of the Trust’s bitcoin investments. At December 31, 2019, 14.8%, 8.9%, 2.0%, 0.9% and 5.7% of the net assets of The Internet Portfolio, The Global Portfolio, The Paradigm Portfolio, The Small Cap Opportunities Portfolio and The Market Opportunities Portfolio, respectively, were invested in the Bitcoin Trust. Investments in bitcoins produce non-qualifying income under Subchapter M of the Internal Revenue Code.
Bitcoin is a decentralized digital currency that enables instant transfers to anyone, anywhere in the world. Managing transactions in bitcoins occurs via an open source, cryptographic protocol central authority. The Bitcoin Network is an online, end-user-to-end-user network that hosts the public transaction ledger, known as the Blockchain, and the source code that comprises the basis for the cryptographic and algorithmic protocols governing the Bitcoin Network. No single entity owns or operates the Bitcoin Network, the infrastructure of which is collectively maintained by a decentralized user base. Since the Bitcoin Network is decentralized, it does not rely on either governmental authorities or financial institutions to create, transmit or determine the value of bitcoins. Rather, the value of bitcoins is determined by the supply of and demand for bitcoins in the global bitcoin exchange market for the trading of bitcoins, which consists of transactions on electronic bitcoin exchanges (“Bitcoin Exchanges”). Pricing on Bitcoin Exchanges and other venues can be volatile and can adversely affect the value of the Bitcoin Trust. Currently, there is relatively small use of bitcoins in the retail and commercial marketplace in comparison to the relatively large use of bitcoins by speculators, thus contributing to price volatility that could adversely affect a Master Portfolio’s direct or indirect investment in the Bitcoin Trust. Bitcoin transactions are irrevocable, and stolen or incorrectly transferred bitcoins may be irretrievable. As a result, any incorrectly executed bitcoin transactions could adversely affect the value of a Master Portfolio’s direct or indirect investment in the Bitcoin Trust. Shares of the
162
KINETICS PORTFOLIOS TRUST — MASTER INVESTMENT PORTFOLIOS
Notes to Consolidated Financial Statements —
(Continued) December 31, 2019
Bitcoin Trust may trade at a premium or discount to the net asset value of the Bitcoin Trust. The price of bitcoins is set in transfers by mutual agreement or barter as well as the number of merchants that accept bitcoins. Because bitcoins are digital files that can be transferred without the involvement of intermediaries or third parties, there are little or no transaction costs in direct end-user-to-end-user transactions. Bitcoins can be used to pay for goods and services or can be converted to fiat currencies, such as the U.S. dollar, at rates determined by the Bitcoin Exchanges. Additionally, third party service providers such as Bitcoin Exchanges are also used for transfers but they may charge significant fees for processing transactions.
As bitcoins have grown in popularity, the U.S. Congress and a number of federal and state agencies (including the Financial Crimes Enforcement Network (FinCEN), the U.S. Securities and Exchange Commission, the Commodity Futures Trading Commission, the Financial Industry Regulatory Authority, the Consumer Financial Protection Bureau, the Department of Justice, the Department of Homeland Security, the Federal Bureau of Investigation, the IRS, and state financial institution regulators) have begun to examine the operations of the network that facilitates bitcoins, bitcoin users and the Bitcoin Exchanges, with particular focus on (1) the extent to which bitcoins can be used to launder the proceeds of illegal activities or fund criminal or terrorist enterprises, (2) the safety and soundness of the Bitcoin Exchange or other service-providers that hold bitcoins for users and (3) other risks to investors and consumers who hold and use bitcoins. Ongoing and future regulatory actions may alter, perhaps to a materially adverse extent, the value of a Master Portfolio’s and its Subsidiary’s investment in the Bitcoin Trust or the ability of the Bitcoin Trust to continue to operate.
Consolidation of Subsidiaries
The consolidated financial statements include the accounts of Cayman, Ltd., Cayman wholly-owned Controlled Foreign Corporations (“CFCs”) and the accounts of Delaware Corporations (the “Cayman” or “Delaware”, respectively, or “Subsidiaries” for both). The respective Master Portfolios hold a CFC: Internet Portfolio, Global Portfolio, Paradigm Portfolio, Small Cap Opportunities Portfolio and Market Opportunities Portfolio. The respective Master Portfolios hold a Delaware subsidiary: Internet Portfolio, Global Portfolio and Market Opportunities Portfolio. Each Master Portfolio can invest up to 25% of its total assets in the Subsidiaries. The Subsidiaries act as an investment vehicle in order
163
KINETICS PORTFOLIOS TRUST — MASTER INVESTMENT PORTFOLIOS
Notes to Consolidated Financial Statements —
(Continued) December 31, 2019
to invest in commodity-linked and bitcoin-linked instruments consistent with the Portfolio’s investment objectives and policies. By investing in its Subsidiaries, a Master Portfolio is indirectly exposed to the risks associated with the Subsidiary’s investments. The investments held by a Subsidiary are generally similar to those that are permitted to be held by the Master Portfolio and are subject to the same risks that apply to similar investments if held directly by the Master Portfolio. Each Subsidiary is not registered under the 1940 Act and is not subject to all the investor protections of the 1940 Act. However, each Master Portfolio wholly-owns and controls its Subsidiaries, making it unlikely that the Subsidiaries will take action contrary to the interests of the Master Portfolio. Each Subsidiary will be subject to the same investment restrictions and limitations and follow the same compliance policies and procedures as its Master Portfolio.
The Cayman Subsidiary is an exempted Cayman investment company and is not subject to Cayman Islands taxes at the present time. For U.S. income tax purposes, each Cayman Subsidiary is a CFC not subject to U.S. income taxes. As a wholly-owned CFC, however, each Cayman Subsidiary’s net income and capital gain will be included each year in the respective Portfolio’s investment company taxable income.
As of December 31, 2019, the respective Cayman Subsidiary’s net assets and percent of the respective Portfolio’s net assets were:
| | | | | | | |
Internet Portfolio | | $ | 9,091,681 | | | | 7.66 | % |
Global Portfolio | | $ | 591,678 | | | | 4.10 | % |
Paradigm Portfolio | | $ | 22,969,712 | | | | 2.87 | % |
Small Cap Opportunities Portfolio | | $ | 6,280,521 | | | | 2.33 | % |
Market Opportunities Portfolio | | $ | 2,160,736 | | | | 2.50 | % |
The Delaware Subsidiary is organized under Delaware law. Any net gains that the Delaware Subsidiary recognizes on future sales of the contributed Bitcoin Trust shares will be subject to federal and state corporate income tax, but the dividends that the Delaware Subsidiary pays to its respective Master Portfolio (i.e., those gains, net of the tax paid and any other expenses of the Delaware Subsidiary) will be eligible to be treated as “qualified dividend income” under the Internal Revenue Code.
164
KINETICS PORTFOLIOS TRUST — MASTER INVESTMENT PORTFOLIOS
Notes to Consolidated Financial Statements —
(Continued) December 31, 2019
As of December 31, 2019, the respective Delaware Subsidiary’s net assets and percent of the respective Portfolio’s net assets were:
| | | | | | | |
Internet Portfolio | | $ | 463 | | | | 0.00 | % |
Global Portfolio | | $ | 252 | | | | 0.00 | % |
Market Opportunities Portfolio | | $ | 899 | | | | 0.00 | % |
Repurchase Agreements
Each Master Portfolio may enter into repurchase agreements with banks that are members of the Federal Reserve System or securities dealers who are members of a national securities exchange or are primary dealers in U.S. Government Securities. In connection with transactions in repurchase agreements, it is the Trust’s policy that the Master Portfolio receive, as collateral, securities whose market value, including accrued interest, at all times will be at least equal to 102% of the amount invested by the Master Portfolio in each repurchase agreement. If the seller defaults, and the value of the collateral declines, realization of the collateral by the Master Portfolio may be delayed or limited.
Written Options
The Master Portfolios may write (sell) call or put options for trading or hedging purposes. When a Master Portfolio writes an option, an amount equal to the premium received by the Master Portfolio is included in the Statement of Assets and Liabilities as an asset and an equivalent liability. The amount of the liability is subsequently marked-to-market to reflect the current value of the option written. By writing the option, the Master Portfolio may become obligated during the term of the option to deliver or purchase the securities underlying the option at the exercise price if the option is exercised. When an option expires on its stipulated expiration date or the Master Portfolio enters into a closing purchase transaction, the Master Portfolio realizes a gain or loss if the cost of the closing transaction differs from the premium received when the option was sold, without regard to any unrealized gain or loss on the underlying security, and the liability related to such option is eliminated. When an option is exercised, the premium originally received decreases the cost basis of the underlying security (or increases the proceeds on the security sold short) and the Master Portfolio realizes a gain or loss from the sale of the security (or closing of the short sale). As collateral for uncovered written options, the Master Portfolio is required under the 1940 Act to maintain assets consisting of cash, cash equivalents or unencumbered, liquid securities. This collateral is required to be adjusted daily to reflect the exercise price of the purchase obligation for
165
KINETICS PORTFOLIOS TRUST — MASTER INVESTMENT PORTFOLIOS
Notes to Consolidated Financial Statements —
(Continued) December 31, 2019
put options or the market value of the instrument underlying the contract for call options.
Foreign Currency Translations
The books and records of the Master Portfolios are maintained in U.S. dollars. For the Master Portfolios, foreign currency transactions are translated into U.S. dollars on the following basis: (i) market values of investment securities and other assets and liabilities are translated at the exchange rate of such currencies against the U.S. dollar, as provided by an approved pricing service, and (ii) purchases and sales of investment securities, dividend and interest income and certain expenses at the rates of exchange prevailing on the respective dates of such transactions. The Master Portfolios do not isolate and treat as ordinary income that portion of the results of operations arising as a result of changes in the exchange rate from the fluctuations arising from changes in the market prices of securities held during the period. Such fluctuations are included with the net realized and unrealized gain or loss from investments. However, for federal income tax purposes, the Master Portfolios do isolate and treat as ordinary income the effect of changes in foreign exchange rates arising from actual foreign currency transactions and the effect of changes in foreign exchange rates arising between trade date and settlement date.
Restricted and Illiquid Securities
The Master Portfolios may invest in restricted securities. These securities are valued by the Master Portfolios after giving due consideration to pertinent factors including recent private sales, market conditions and the issuer’s financial performance. The Master Portfolios have no right to require registration of unregistered securities. The 144A securities have been deemed to be liquid by the Master Portfolios Adviser under the supervision of the Board of Trustees. At December 31, 2019, the following Master Portfolios held securities restricted to institutional investors (144A Securities):
| | | | | | | |
| | | | | Percentage of | |
| | Market Value | | | Net Assets | |
The Multi-Disciplinary Income Portfolio | | $ | 5,618,406 | | | | 15.96 | % |
An illiquid asset is any asset which may not be sold or disposed of in current market conditions within seven days without the sale or disposition
166
KINETICS PORTFOLIOS TRUST — MASTER INVESTMENT PORTFOLIOS
Notes to Consolidated Financial Statements —
(Continued) December 31, 2019
significantly changing the market value of the investment. At December 31, 2019, the following Master Portfolios held illiquid securities:
| | | | | | | |
| | | | | Percentage of | |
| | Market Value | | | Net Assets | |
The Internet Portfolio | | $ | — | * | | | 0.00 | % |
The Paradigm Portfolio | | | — | * | | | 0.00 | % |
The Multi-Disciplinary Income Portfolio | | | 166,398 | | | | 0.47 | % |
* Amount is less than $0.50 |
When-Issued Securities
The Master Portfolios may purchase securities on a when-issued or delayed delivery basis. Although the purchase amounts of these securities are established at the time the purchaser enters into the agreement, these securities may be delivered and paid for at a future date. The Master Portfolios record purchases of when-issued securities and reflect the values of such securities in determining net asset value in the same manner as other portfolio securities. The Master Portfolios maintain at all times cash or other liquid assets in an amount at least equal to the amount of outstanding commitments for when-issued securities.
Securities Lending
Each Master Portfolio may lend its portfolio securities to broker-dealers by entering directly into lending arrangements with such broker dealers or indirectly through repurchase agreements with respect to no more than 33 1 / 3 % of the total assets of each Master Portfolio (including any collateral posted) or 50% of the total assets of each Master Portfolio (excluding any collateral posted). Securities lending and repurchase transactions will be fully collateralized at all times with cash and/or short-term debt obligations. The Master Portfolios receive interest on the collateral received as well as a fee for the securities loaned.
Significant Investments
The Portfolios may invest a greater percentage of their assets in one or more individual securities at any time. The greater percentage of assets in individual securities (not including short-term investments or other funds) expose the portfolios to the risk of unanticipated industry conditions, the risks particular to a single company or security, and the risk of potentially lower liquidity. At December 31, 2019, The Internet Portfolio, The Global Portfolio, The Paradigm
167
KINETICS PORTFOLIOS TRUST — MASTER INVESTMENT PORTFOLIOS
Notes to Consolidated Financial Statements —
(Continued) December 31, 2019
Portfolio, The Medical Portfolio, The Small Cap Opportunities Portfolio, The Market Opportunities Portfolio and The Multi-Disciplinary Income Portfolio invested approximately 41%, 31%, 44%, 85%, 54%, 39% and 45% of their respective net assets in individual securities greater than 5% of net assets. See the respective Schedule of Investments for further details.
Holding a large concentration in a single security or issuer may expose the portfolios to the market volatility of that specific security or issuer if the security or issuer performs worse than the market as a whole, which could adversely affect the portfolios’ performance. At December 31, 2019, The Internet Portfolio, The Global Portfolio, The Paradigm Portfolio, The Small Cap Opportunities Portfolio and The Market Opportunities Portfolio holds 14%, 16%, 37%, 35% and 33% of their respective net assets in Texas Pacific Land Trust and because a large portion of its revenue is derived from oil and gas royalties, the performance of the portfolios could be adversely affected if the underlying markets for oil and gas were to decline, thereby having a more significant impact on the portfolios given the concentration in this holding.
Short-Term Investments
The Portfolios may invest in money market funds and short-term high quality debt securities such as commercial paper, repurchase agreements and certificates of deposit. Money market funds typically invest in short-term instruments and attempt to maintain a stable net asset value. While the risk is low, these funds may lose value.
Expense Allocation
Common expenses incurred by the Master Portfolios are allocated among the Master Portfolios (i) based upon relative average net assets, (ii) as incurred on a specific identification basis, or (iii) equally among the Master Portfolios, depending on the nature of the expenditure. All expenses incurred by the Master Portfolios are allocated to the Feeder Funds daily based on their proportionate interests in the respective Master Portfolios.
Federal Income Taxes
Each Master Portfolio will be treated as a partnership for federal income tax purposes. As such, each investor in a Master Portfolio will be subject to taxation on its share of the Master Portfolio’s ordinary income and capital gains. It is intended that each Master Portfolio’s assets will be managed so an investor in
168
KINETICS PORTFOLIOS TRUST — MASTER INVESTMENT PORTFOLIOS
Notes to Consolidated Financial Statements —
(Continued) December 31, 2019
the Master Portfolio can satisfy the requirements of subchapter M of the Internal Revenue Code.
There is no tax liability resulting from unrecognized tax benefits relating to uncertain income tax positions taken or expected to be taken in future tax returns. As of December 31, 2019, open tax years include the tax years ended December 31, 2016 through December 31, 2019. The Master Portfolios are also not aware of any tax positions for which it is reasonably possible that the total amounts of unrecognized tax benefits will significantly change in the next twelve months.
Use of Estimates
The preparation of financial statements in conformity with U.S. generally accepted accounting principles (“GAAP”) requires management to make estimates and assumptions that affect the reported amounts in the financial statements. Actual results could differ from those estimates.
Other
Realized gains and losses on the sale of investments are calculated on the identified cost basis. Dividend income is recorded on the ex-dividend date. Interest income is accounted for on the accrual basis and includes amortization of premiums and accretion of discounts on the effective interest method. Other noncash dividends are recognized as investment income at the fair value of the property received. Withholding taxes on foreign dividends have been incorporated in accordance with the Trust’s understanding of the applicable country’s tax rules and rates.
3. Investment Adviser
The Trust has entered into Investment Advisory Agreements (the “Agreements”) with Horizon Kinetics Asset Management LLC (the “Adviser”), with whom certain officers and trustees of the Trust are affiliated, to furnish investment advisory services to the Master Portfolios. The Adviser is a wholly-owned subsidiary of Horizon Kinetics LLC. Under the terms of the Agreements, the Master Portfolios, except the Alternative Income Portfolio, compensate the Adviser for its management services at the annual rate of 1.25% of each Master Portfolio’s average daily net assets. The Alternative Income Portfolio compensates the Adviser for its management services at the annual rate of 0.90% of the Master Portfolio’s average daily net assets.
169
KINETICS PORTFOLIOS TRUST — MASTER INVESTMENT PORTFOLIOS
Notes to Consolidated Financial Statements —
(Continued) December 31, 2019
For the year ended December 31, 2019, Master Portfolios incurred the following expenses pursuant to the Agreements:
| | | | |
| | Investment Advisory Fees | |
The Internet Portfolio | | $ | 1,535,712 | |
The Global Portfolio | | | 167,722 | |
The Paradigm Portfolio | | | 9,769,583 | |
The Medical Portfolio | | | 205,196 | |
The Small Cap Opportunities Portfolio | | | 3,645,433 | |
The Market Opportunities Portfolio | | | 1,045,328 | |
The Alternative Income Portfolio | | | 166,040 | |
The Multi-Disciplinary Income Portfolio | | | 460,664 | |
For the year ended December 31, 2019, the Trust was allocated approximately $26,000 for the services of the Chief Compliance Officer employed by the Adviser.
4. Securities Transactions
Purchases and sales of investment securities, other than short-term investments and short-term options, for the year ended December 31, 2019, were as follows:
| | | | | | | | | | | | | |
| | Purchases | | | Sales | |
| | U.S. | | | | | | U.S. | | | | |
| | Government | | | Other | | | Government | | | Other | |
The Internet Portfolio | | $ | — | | | $ | 938,198 | | | $ | — | | | $ | 9,701,299 | |
The Global Portfolio | | | — | | | | 441,685 | | | | — | | | | 340,992 | |
The Paradigm Portfolio | | | — | | | | 5,711,413 | | | | — | | | | 110,725,059 | |
The Medical Portfolio | | | — | | | | 968,335 | | | | — | | | | 2,762,109 | |
The Small Cap | | | | | | | | | | | | | | | | |
| Opportunities Portfolio | | | — | | | | 11,449,978 | | | | — | | | | 7,779,476 | |
The Market Opportunities Portfolio | | | — | | | | 1,701,668 | | | | — | | | | 3,120,840 | |
The Alternative Income Portfolio | | | — | | | | — | | | | — | | | | — | |
The Multi-Disciplinary | | | | | | | | | | | | | | | | |
| Income Portfolio | | | — | | | | 7,967 | | | | — | | | | 8,330,080 | |
170
KINETICS PORTFOLIOS TRUST — MASTER INVESTMENT PORTFOLIOS
Notes to Consolidated Financial Statements —
(Continued) December 31, 2019
As of December 31, 2019, the cost of investments and unrealized appreciation (depreciation) on investment securities for federal income tax purposes was as follows:
| | | | | | | | | | | | | |
| | Internet | | | Global | | | Paradigm | | | Medical | |
Tax Cost of Investments | | $ | 57,636,497 | | | $ | 4,272,772 | | | $ | 283,026,517 | | | $ | 10,129,471 | |
Unrealized Appreciation | | | 26,772,318 | | | | 3,732,313 | | | | 392,855,096 | | | | 7,444,778 | |
Unrealized Depreciation | | | (1,911,461 | ) | | | (606,965 | ) | | | (22,211,170 | ) | | | (1,081,924 | ) |
Net Unrealized Appreciation | | $ | 24,860,857 | | | $ | 3,125,348 | | | $ | 370,643,926 | | | $ | 6,362,854 | |
| | |
| | | | | | | | | | | Multi- | |
| | Small Cap | | | Market | | | Alternative | | | Disciplinary | |
| | Opportunities | | | Opportunities | | | Income | | | Income | |
Tax Cost of Investments | | $ | 146,244,517 | | | $ | 24,219,461 | | | $ | 8,188,253 | | | $ | 31,424,054 | |
Unrealized Appreciation | | | 117,857,723 | | | | 29,695,243 | | | | 67,260 | | | | 1,525,192 | |
Unrealized Depreciation | | | (39,214,352 | ) | | | (2,750,816 | ) | | | (48 | ) | | | (2,490,173 | ) |
Net Unrealized | | | | | | | | | | | | | | | | |
| Appreciation (Depreciation) | | $ | 78,643,371 | | | $ | 26,944,427 | | | $ | 67,212 | | | $ | (964,981 | ) |
5. Portfolio Securities Loaned
As of December 31, 2019, the Master Portfolios had loaned securities that were collateralized by cash. The majority of the cash collateral is invested by the custodian in a money market pooled account approved by the Adviser. Although risk is mitigated by the collateral, a Master Portfolio could experience a delay in recovering its securities and possible loss of income or value if the borrower fails to return them. The Master Portfolio receives interest on the collateral received as well as a fee for the securities loaned. The Master Portfolios will continue to receive dividends and interest on all securities loaned. Gain or loss in the fair value of the securities loaned that may occur during the term of the loan will be accounted for by the Master Portfolios. Loans of securities are terminable at any time and the borrower, after notice, is required to return borrowed securities within the standard time period for settlement of securities transactions. As the securities loans are subject to termination by the Funds or the borrower at any time, the remaining maturities of the outstanding securities lending transactions are considered to be overnight and continuous. The value of the securities on loan and the value of the related collateral at December 31, 2019, were as follows:
171
KINETICS PORTFOLIOS TRUST — MASTER INVESTMENT PORTFOLIOS
Notes to Consolidated Financial Statements —
(Continued) December 31, 2019
| | | | | | | |
| | Securities | | | Collateral | |
The Internet Portfolio | | $ | 6,192,934 | | | $ | 6,498,625 | |
The Global Portfolio | | | 86,265 | | | | 92,164 | |
The Paradigm Portfolio | | | 23,594,367 | | | | 24,872,480 | |
The Medical Portfolio | | | 26,562 | | | | 27,300 | |
The Small Cap Opportunities Portfolio | | | 2,502,504 | | | | 2,673,242 | |
The Market Opportunities Portfolio | | | 740,589 | | | | 791,228 | |
The Alternative Income Portfolio | | | — | | | | — | |
The Multi-Disciplinary Income Portfolio | | | 2,296,938 | | | | 2,353,350 | |
6. Selected Financial Highlights
Financial highlights for the Master Portfolios were as follows:
| | | | | | |
| The Internet Portfolio
|
| For the Year Ended
| For the Year Ended
| For the Year Ended
| For the Year Ended
| For the Year Ended
|
| December 31, | December 31, | December 31, | December 31, | December 31, |
| 2019 | 2018 | 2017 | 2016 | 2015 |
Total Return | 26.92% | (26.86)% | 57.90% | 3.09% | (4.95)% |
Ratio of expenses to | | | | | |
| average net assets: | 1.37% | 1.38% | 1.37% | 1.37% | 1.35% |
Ratio of net investment | | | | | |
| income (loss) to | | | | | |
| average net assets: | (0.29)% | (0.60)% | 1.27% | (1.18)% | (1.05)% |
Portfolio turnover rate | 1% | 15% | 44% | 2% | 1% |
| | | | | | |
| The Global Portfolio
|
| For the Year Ended
| For the Year Ended
| For the Year Ended
| For the Year Ended
| For the Year Ended
|
| December 31, | December 31, | December 31, | December 31, | December 31, |
| 2019 | 2018 | 2017 | 2016 | 2015 |
Total Return | 21.41% | (23.85)% | 49.37% | 14.13% | (14.13)% |
Ratio of expenses to | | | | | |
| average net assets: | 1.59% | 1.66% | 1.59% | 1.66% | 1.69% |
Ratio of net investment | | | | | |
| income (loss) to | | | | | |
| average net assets: | (0.18)% | (0.57)% | 1.88% | (0.44)% | (0.59)% |
Portfolio turnover rate | 5% | 28% | 169% | 11% | 16% |
172
KINETICS PORTFOLIOS TRUST — MASTER INVESTMENT PORTFOLIOS
Notes to Consolidated Financial Statements —
(Continued) December 31, 2019
| | | | | | |
| The Paradigm Portfolio
|
| For the Year Ended
| For the Year Ended
| For the Year Ended
| For the Year Ended
| For the Year Ended
|
| December 31, | December 31, | December 31, | December 31, | December 31, |
| 2019 | 2018 | 2017 | 2016 | 2015 |
Total Return | 30.77% | (5.27)% | 28.69% | 20.72% | (8.04)% |
Ratio of expenses to | | | | | |
| average net assets: | 1.35% | 1.36% | 1.36% | 1.37% | 1.35% |
Ratio of net investment | | | | | |
| income (loss) to | | | | | |
| average net assets: | (0.43)% | (0.65)% | (0.53)% | (0.84)% | (0.63)% |
Portfolio turnover rate | 1% | 3% | 14% | 2% | 2% |
| | | | | | |
| The Medical Portfolio
|
| For the Year Ended
| For the Year Ended
| For the Year Ended
| For the Year Ended
| For the Year Ended
|
| December 31, | December 31, | December 31, | December 31, | December 31, |
| 2019 | 2018 | 2017 | 2016 | 2015 |
Total Return | 15.92% | 1.59% | 10.67% | (8.04)% | 6.58% |
Ratio of expenses to | | | | | |
| average net assets: | 1.51% | 1.47% | 1.43% | 1.42% | 1.40% |
Ratio of net investment | | | | | |
| income (loss) to | | | | | |
| average net assets: | 1.22% | 0.96% | 0.82% | 0.66% | 0.24% |
Portfolio turnover rate | 6% | 0% | 0% | 0% | 12% |
| | | | | | |
| The Small Cap Opportunities Portfolio
|
| For the Year Ended
| For the Year Ended
| For the Year Ended
| For the Year Ended
| For the Year Ended
|
| December 31, | December 31, | December 31, | December 31, | December 31, |
| 2019 | 2018 | 2017 | 2016 | 2015 |
Total Return | 27.34% | 0.56% | 26.50% | 24.67% | (11.97)% |
Ratio of expenses to | | | | | |
| average net assets: | 1.36% | 1.37% | 1.37% | 1.36% | 1.35% |
Ratio of net investment | | | | | |
| income (loss) to | | | | | |
| average net assets: | (0.20)% | (0.33)% | (0.47)% | (0.75)% | (0.65)% |
Portfolio turnover rate | 4% | 3% | 9% | 4% | 2% |
| | | | | | |
| The Market Opportunities Portfolio |
| For the Year Ended
| For the Year Ended
| For the Year Ended
| For the Year Ended
| For the Year Ended
|
| December 31, | December 31, | December 31, | December 31, | December 31, |
| 2019 | 2018 | 2017 | 2016 | 2015 |
Total Return | 22.77% | (10.62)% | 47.53% | 20.68% | (8.87)% |
Ratio of expenses to | | | | | |
| average net assets: | 1.39% | 1.40% | 1.39% | 1.41% | 1.40% |
Ratio of net investment | | | | | |
| income (loss) to | | | | | |
| average net assets: | (0.00)% | (0.30)% | 1.05% | (0.73)% | (0.66)% |
Portfolio turnover rate | 4% | 8% | 35% | 5% | 2% |
173
KINETICS PORTFOLIOS TRUST — MASTER INVESTMENT PORTFOLIOS
Notes to Consolidated Financial Statements —
(Continued) December 31, 2019
| | | | | | |
| The Alternative Income Portfolio
|
| For the Year Ended
| For the Year Ended
| For the Year Ended
| For the Year Ended
| For the Year Ended
|
| December 31, | December 31, | December 31, | December 31, | December 31, |
| 2019 | 2018 | 2017 | 2016 | 2015 |
Total Return | 2.28% | 0.77% | 2.20% | 3.85% | 2.73% |
Ratio of expenses to | | | | | |
| average net assets: | 1.14% | 1.10% | 1.07% | 1.10% | 1.16% |
Ratio of net investment | | | | | |
| income (loss) to | | | | | |
| average net assets: | 1.22% | 0.79% | (0.04)% | (0.16)% | (0.20)% |
Portfolio turnover rate | 0% | 0% | 0% | 1% | 6% |
| | | | | | |
| The Multi-Disciplinary Income Portfolio
|
| For the Year Ended
| For the Year Ended
| For the Year Ended
| For the Year Ended
| For the Year Ended
|
| December 31, | December 31, | December 31, | December 31, | December 31, |
| 2019 | 2018 | 2017 | 2016 | 2015 |
Total Return | 9.13% | (0.93 )% | 4.84% | 10.52% | (2.05)% |
Ratio of expenses to | | | | | |
| average net assets: | 1.44% | 1.42% | 1.40% | 1.38% | 1.37% |
Ratio of net investment | | | | | |
| income (loss) to | | | | | |
| average net assets: | 4.15% | 4.13% | 3.47% | 4.13% | 3.50% |
Portfolio turnover rate | 0% | 2% | 16% | 9% | 10% |
7. Summary of Fair Value Exposure
Various inputs are used in determining the value of a Master Portfolio’s investments. These inputs are summarized in the three broad levels listed below:
Level 1 — Unadjusted quoted prices in active markets for identical assets or liabilities that a Master Portfolio has the ability to access.
Level 2 — Observable inputs other than quoted prices included in Level 1 that are observable for the asset or liability, either directly or indirectly. These inputs may include quoted prices for the identical instrument on an inactive market, prices for similar instruments, interest rates, prepayment speeds, credit risk, yield curves, default rates and similar data.
Level 3 — Unobservable inputs for the asset or liability, to the extent relevant observable inputs are not available, representing a Master Portfolio’s own assumptions about the assumptions a market participant would use in valuing the asset or liability, and would be based on the best information available.
174
KINETICS PORTFOLIOS TRUST — MASTER INVESTMENT PORTFOLIOS
Notes to Consolidated Financial Statements —
(Continued) December 31, 2019
The availability of observable inputs can vary from security to security and is affected by a wide variety of factors, including, for example, the type of security, whether the security is new and not yet established in the marketplace, the liquidity of markets, and other characteristics particular to the security. To the extent that valuation is based on models or inputs that are less observable or unobservable in the market, the determination of fair value requires more judgment. Accordingly, the degree of judgment exercised in determining fair value is greatest for instruments categorized in Level 3.
The inputs used to measure fair value may fall into different levels of the fair value hierarchy. In such cases, for disclosure purposes, the level in the fair value hierarchy within which the fair value measurement falls in its entirety, is determined based on the lowest level input that is significant to the fair value measurement in its entirety.
The Internet Portfolio
The following is a summary of the inputs used to value the The Internet Portfolio’s net assets as of December 31, 2019:
| | | | | | | | | | | | | |
| Assets^ | | Level 1 | | | Level 2 | | | Level 3 | | | Total | |
Common Stocks | | $ | 64,916,708 | | | $ | — | | | $ | — | | | $ | 64,916,708 | |
Unit Investment Trust | | | 17,580,646 | | | | — | | | | — | | | | 17,580,646 | |
Escrow Notes | | | — | | | | — | | | | — | * | | | — | * |
Total Investments in Securities | | $ | 82,497,354 | | | $ | — | | | $ | — | * | | $ | 82,497,354 | |
During the year ended December 31, 2019, there were no transfers into or out of Level 3.
Following is a reconciliation of Level 3 assets for which significant unobservable inputs were used to determine fair value:
| | | | |
| Description | | Investments in Securities | |
Balance as of December 31, 2018 | | $ | — | * |
Accrued discounts/premiums | | | — | |
Realized gain (loss) | | | — | |
Change in unrealized appreciation (depreciation) | | | — | ** |
Net purchases and/or acquisitions | | | — | |
Net sales and/or write-offs | | | — | |
Transfer in and/or out of Level 3 | | | — | |
Balance as of December 31, 2019 | | $ | — | * |
175
KINETICS PORTFOLIOS TRUST — MASTER INVESTMENT PORTFOLIOS
Notes to Consolidated Financial Statements —
(Continued) December 31, 2019
| | | | | | | | | |
| | Fair Value at | | Valuation | Unobservable | | | |
| Description | | 12/31/2019 | | Techniques | Input | | Range | |
Escrow Notes | | $ | — | * | Value Assigned | No active | | $ | 0.00-$0.00 | |
| | | | | Pending Bankruptcy | market | | | | |
| | | | | Litigation | | | | | |
| | | | | Proceedings/Market | | | | | |
| | | | | Comparables | | | | | |
There is no active market for the Level 3 securities, so a value is being assigned until such time as a market exists.
| ^ | See Consolidated Portfolio of Investments for breakout of investments by industry classification. |
| * | Amount is less than $0.50. |
| ** | Total change in unrealized appreciation/depreciation included in the Statement of Operations attributable to Level 3 Securities held on December 31, 2019 is zero.
|
The Global Portfolio
The following is a summary of the inputs used to value the The Global Portfolio’s net assets as of December 31, 2019:
| | | | | | | | | | | | | |
| Assets^ | | Level 1 | | | Level 2 | | | Level 3 | | | Total | |
Common Stocks | | $ | 5,803,747 | | | $ | 292,418 | | | $ | — | | | $ | 6,096,165 | |
Unit Investment Trust | | | 1,281,899 | | | | — | | | | — | | | | 1,281,899 | |
Preferred Stocks | | | — | | | | 9,862 | | | | — | | | | 9,862 | |
Convertible Bonds | | | — | | | | 719 | | | | — | | | | 719 | |
Warrants | | | — | | | | 9,475 | | | | — | | | | 9,475 | |
Total Investments in Securities | | $ | 7,085,646 | | | $ | 312,474 | | | $ | — | | | $ | 7,398,120 | |
As of December 31, 2019, there were no investments in Level 3 securities. During the year ended December 31, 2019, there were no transfers into or out of Level 3.
| ^ | See Consolidated Portfolio of Investments for breakout of investments by industry classification. |
The Paradigm Portfolio
The following is a summary of the inputs used to value the The Paradigm Portfolio’s net assets as of December 31, 2019:
| | | | | | | | | | | | | |
| Assets^ | | Level 1 | | | Level 2 | | | Level 3 | | | Total | |
Common Stocks | | $ | 634,163,027 | | | $ | 3,400,992 | | | $ | — | | | $ | 637,564,019 | |
Unit Investment Trust | | | 16,098,264 | | | | — | | | | — | | | | 16,098,264 | |
Preferred Stocks | | | — | | | | 4,156 | | | | — | | | | 4,156 | |
Escrow Notes | | | — | | | | — | | | | — | * | | | — | * |
Warrants | | | — | | | | 4,004 | | | | — | | | | 4,004 | |
Total Investments in Securities | | $ | 650,261,291 | | | $ | 3,409,152 | | | $ | — | * | | $ | 653,670,443 | |
During the year ended December 31, 2019, there were no transfers into or out of Level 3.
176
KINETICS PORTFOLIOS TRUST — MASTER INVESTMENT PORTFOLIOS
Notes to Consolidated Financial Statements —
(Continued) December 31, 2019
Following is a reconciliation of Level 3 assets for which significant unobservable inputs were used to determine fair value:
| | | | |
| Description | | Investments in Securities | |
Balance as of December 31, 2018 | | $ | — | * |
Accrued discounts/premiums | | | — | |
Realized gain (loss) | | | — | |
Change in unrealized appreciation (depreciation) | | | — | ** |
Net purchases and/or acquisitions | | | — | |
Net sales and/or write-offs | | | — | |
Transfer in and/or out of Level 3 | | | — | |
Balance as of December 31, 2019 | | $ | — | * |
| | | | | | | | | |
| | Fair Value at | | Valuation | Unobservable | | | |
| Description | | 12/31/2019 | | Techniques | Input | | Range | |
Escrow Notes | | $ | — | * | Value Assigned | No active | | $ | 0.00-$0.00 | |
| | | | | Pending Bankruptcy | market | | | | |
| | | | | Litigation | | | | | |
| | | | | Proceedings/Market | | | | | |
| | | | | Comparables | | | | | |
There is no active market for the Level 3 securities, so a value is being assigned until such time as a market exists.
| ^ | See Consolidated Portfolio of Investments for breakout of investments by industry classification. |
| * | Amount is less than $0.50. |
| ** | Total change in unrealized appreciation/depreciation included in the Statement of Operations |
| attributable to Level 3 Securities held on December 31, 2019 is zero. |
The Medical Portfolio
The following is a summary of the inputs used to value the The Medical Portfolio’s net assets as of December 31, 2019:
| | | | | | | | | | | | | |
| Assets^ | | Level 1 | | | Level 2 | | | Level 3 | | | Total | |
Common Stocks | | $ | 16,447,386 | | | $ | — | | | $ | — | | | $ | 16,447,386 | |
Rights | | | 43,390 | | | | 1,549 | | | | — | | | | 44,939 | |
Total Investments in Securities | | $ | 16,490,776 | | | $ | 1,549 | | | $ | — | | | $ | 16,492,325 | |
As of December 31, 2019, there were no investments in Level 3 securities. During the year ended December 31, 2019, there were no transfers into or out of Level 3.
| ^ | See Portfolio of Investments for breakout of investments by industry classification. |
177
KINETICS PORTFOLIOS TRUST — MASTER INVESTMENT PORTFOLIOS
Notes to Consolidated Financial Statements —
(Continued) December 31, 2019
The Small Cap Opportunities Portfolio
The following is a summary of the inputs used to value the The Small Cap Opportunities Portfolio’s net assets as of December 31, 2019:
| | | | | | | | | | | | | |
| Assets^ | | Level 1 | | | Level 2 | | | Level 3 | | | Total | |
Common Stocks | | $ | 189,796,948 | | | $ | 30,625,003 | | | $ | — | | | $ | 220,421,951 | |
Unit Investment Trust | | | 2,515,354 | | | | — | | | | — | | | | 2,515,354 | |
Preferred Stocks | | | — | | | | 994,517 | | | | — | | | | 994,517 | |
Warrants | | | — | | | | 956,066 | | | | — | | | | 956,066 | |
Total Investments in Securities | | $ | 192,312,302 | | | $ | 32,575,586 | | | $ | — | | | $ | 224,887,888 | |
As of December 31, 2019, there were no investments in Level 3 securities. During the year ended December 31, 2019, there were no transfers into or out of Level 3.
| ^ | See Consolidated Portfolio of Investments for breakout of investments by industry classification. |
The Market Opportunities Portfolio
The following is a summary of the inputs used to value the The Market Opportunities Portfolio’s net assets as of December 31, 2019:
| | | | | | | | | | | | | |
| Assets^ | | Level 1 | | | Level 2 | | | Level 3 | | | Total | |
Common Stocks | | $ | 41,589,508 | | | $ | 4,200,526 | | | $ | — | | | $ | 45,790,034 | |
Unit Investment Trust | | | 4,929,348 | | | | — | | | | — | | | | 4,929,348 | |
Preferred Stocks | | | — | | | | 226,583 | | | | — | | | | 226,583 | |
Convertible Bonds | | | — | | | | 100 | | | | — | | | | 100 | |
Warrants | | | — | | | | 217,823 | | | | — | | | | 217,823 | |
Total Investments in Securities | | $ | 46,518,856 | | | $ | 4,645,032 | | | $ | — | | | $ | 51,163,888 | |
As of December 31, 2019, there were no investments in Level 3 securities. During the year ended December 31, 2019, there were no transfers into or out of Level 3.
| ^ | See Consolidated Portfolio of Investments for breakout of investments by industry classification. |
The Alternative Income Portfolio
The following is a summary of the inputs used to value the The Alternative Income Portfolio’s net assets as of December 31, 2019:
| | | | | | | | | | | | | |
| Assets^ | | Level 1 | | | Level 2 | | | Level 3 | | | Total | |
Exchange Traded Funds | | $ | 5,872,004 | | | $ | — | | | $ | — | | | $ | 5,872,004 | |
Short-Term Investments | | | 2,383,461 | | | | — | | | | — | | | | 2,383,461 | |
Total Investments in Securities | | $ | 8,255,465 | | | $ | — | | | $ | — | | | $ | 8,255,465 | |
As of December 31, 2019, there were no investments in Level 3 securities. During the year ended December 31, 2019, there were no transfers into or out of Level 3.
| ^ | See Portfolio of Investments for breakout of investments by industry classification. |
178
KINETICS PORTFOLIOS TRUST — MASTER INVESTMENT PORTFOLIOS
Notes to Consolidated Financial Statements —
(Continued) December 31, 2019
The Multi-Disciplinary Income Portfolio
The following is a summary of the inputs used to value the The Multi-Disciplinary Income Portfolio’s net assets as of December 31, 2019:
| | | | | | | | | | | | | |
| Assets^ | | Level 1 | | | Level 2 | | | Level 3 | | | Total | |
Convertible Bonds | | $ | — | | | $ | 634,042 | | | $ | — | | | $ | 634,042 | |
Corporate Bonds | | | — | | | | 26,505,945 | | | | — | | | | 26,505,945 | |
Municipal Bonds | | | — | | | | 166,398 | | | | — | | | | 166,398 | |
Closed-End Funds | | | 3,152,688 | | | | — | | | | — | | | | 3,152,688 | |
Total Investments in Securities | | $ | 3,152,688 | | | $ | 27,306,385 | | | $ | — | | | $ | 30,459,073 | |
As of December 31, 2019, there were no investments in Level 3 securities. During the year ended December 31, 2019, there were no transfers into or out of Level 3.
| ^ | See Portfolio of Investments for breakout of investments by industry classification. |
8. Disclosures about Derivative Instruments and Hedging Activities
The Master Portfolios have adopted authoritative standards regarding disclosure of derivatives and hedging activity intended to improve financial reporting of derivative instruments by enabling investors to understand how and why a Master Portfolio uses derivatives, how derivatives are accounted for by the Master Portfolios, and how derivative instruments affect a Master Portfolio’s results of operations and financial position. The Master Portfolios utilized options to implement or to gain further exposure to their respective investment strategies. At December 31, 2019, none of the Portfolios held any derivative instruments.
The following is a summary of the transactions in and effect of derivative instruments on the Statement of Operations for the year ended December 31, 2019:
| | | | |
| | Statement of Operations |
| | Realized | Change in Unrealized |
| Derivative Equity Contracts | Gain (Loss) | Depreciation |
The Alternative | | | |
| Income Portfolio | Put Options Written | $31,663 | $(26,903) |
9. Offsetting Assets and Liabilities
The Master Portfolios are subject to various Master Netting Arrangements, which govern the terms of certain transactions with select counterparties. The Master Netting Arrangements allow a Portfolio to close out and net its total exposure to a counterparty in the event of a default with respect to all the transactions governed under a single agreement with a counterparty. The Master
179
KINETICS PORTFOLIOS TRUST — MASTER INVESTMENT PORTFOLIOS
Notes to Consolidated Financial Statements —
(Continued) December 31, 2019
Netting Arrangements also specify collateral posting arrangements at prearranged exposure levels. Under the Master Netting Arrangements, collateral is routinely transferred if the total net exposure to certain transactions (net of existing collateral already in place) governed under the relevant Master Netting Arrangement with a counterparty in a given account exceeds a specific threshold depending on the counterparty and the type of Master Netting Arrangement.
The following is a summary of the Assets and Liabilities subject to offsetting in the Master Portfolios as of December 31, 2019:
| | | | | | | | | | | | | | | | | | | |
| | | | | | | | Net | | | | | | | | | | |
| | | | | Gross | | | Amounts | | | Gross Amounts not Offset | | | | |
| | | | | Amounts | | | Presented | | | in the Statement of | | | | |
| | Gross | | | Offset in the | | | in the | | | Assets & Liabilities | | | | |
| | Amounts of | | | Statement | | | Statement | | | | | | Collateral | | | | |
| | | Recognized | | | of Assets & | | | of Assets & | | | Financial
| | | Pledged
| | | Net
| |
| | Liabilities | | | Liabilities | | | Liabilities | | | Instruments
| | | (Received) | | | Amount | |
| The Internet Portfolio | | | | | | | | | | | | | | | | | | |
| Securities Lending | | $ | 6,498,625 | | | $ | — | | | $ | 6,498,625 | | | $ | 6,498,625 | | | $ | — | | | $ | — | |
| | $ | 6,498,625 | | | $ | — | | | $ | 6,498,625 | | | $ | 6,498,625 | | | $ | — | | | $ | — | |
| | |
| The Global Portfolio | | | | | | | | | | | | | | | | | | | | | | | | |
| Securities Lending | | $ | 92,164 | | | $ | — | | | $ | 92,164 | | | $ | 92,164 | | | $ | — | | | $ | — | |
| | $ | 92,164 | | | $ | — | | | $ | 92,164 | | | $ | 92,164 | | | $ | — | | | $ | — | |
| | |
| The Paradigm Portfolio | | | | | | | | | | | | | | | | | | | | | | | | |
| Securities Lending | | $ | 24,872,480 | | | $ | — | | | $ | 24,872,480 | | | $ | 24,872,480 | | | $ | — | | | $ | — | |
| | $ | 24,872,480 | | | $ | — | | | $ | 24,872,480 | | | $ | 24,872,480 | | | $ | — | | | $ | — | |
| | |
| The Medical Portfolio | | | | | | | | | | | | | | | | | | | | | | | | |
| Securities Lending | | $ | 27,300 | | | $ | — | | | $ | 27,300 | | | $ | 27,300 | | | $ | — | | | $ | — | |
| | $ | 27,300 | | | $ | — | | | $ | 27,300 | | | $ | 27,300 | | | $ | — | | | $ | — | |
| | |
| The Small Cap | | | | | | | | | | | | | | | | | | | | | | | | |
| Opportunities Portfolio | | | | | | | | | | | | | | | | | | | | | | | | |
| Securities Lending | | $ | 2,673,242 | | | $ | — | | | $ | 2,673,242 | | | $ | 2,673,242 | | | $ | — | | | $ | — | |
| | $ | 2,673,242 | | | $ | — | | | $ | 2,673,242 | | | $ | 2,673,242 | | | $ | — | | | $ | — | |
| | |
| The Market | | | | | | | | | | | | | | | | | | | | | | | | |
| Opportunities Portfolio | | | | | | | | | | | | | | | | | | | | | | | | |
| Securities Lending | | $ | 791,228 | | | $ | — | | | $ | 791,228 | | | $ | 791,228 | | | $ | — | | | $ | — | |
| | $ | 791,228 | | | $ | — | | | $ | 791,228 | | | $ | 791,228 | | | $ | — | | | $ | — | |
| | |
| The Multi-Disciplinary | | | | | | | | | | | | | | | | | | | | | | | | |
| Income Portfolio | | | | | | | | | | | | | | | | | | | | | | | | |
| Securities Lending | | $ | 2,353,350 | | | $ | — | | | $ | 2,353,350 | | | $ | 2,353,350 | | | $ | — | | | $ | — | |
| | $ | 2,353,350 | | | $ | — | | | $ | 2,353,350 | | | $ | 2,353,350 | | | $ | — | | | $ | — | |
180
KINETICS PORTFOLIOS TRUST — MASTER INVESTMENT PORTFOLIOS
Notes to Consolidated Financial Statements —
(Continued) December 31, 2019
10. Subsequent Events
In preparing these financial statements, management has evaluated Portfolio related events and transactions for potential recognition or disclosure through the date the financial statements were issued. There were no events or translations that occurred during the year that materially impacted the amounts or disclosures in the Master Portfolios’ financial statements.
11. Recent Accounting Pronouncements
In March 2017, the FASB issued ASU 2017-08, Receivables—Nonrefundable Fees and Other Costs (Subtopic 310-20): Premium Amortization on Purchased Callable Debt Securities (“ASU 2017-08”). The amendments in ASU2017-08 shorten the amortization period for certain callable debt securities, held at a premium, to be amortized to the earliest call date. ASU 2017-08 is effective for fiscal years and interim periods within those fiscal years beginning after December 15, 2018. Effective, January 1, 2019, the Master Portfolios adopted ASU 2017-08 and the adoption did not have a material impact on the Master Portfolios’ financial statements.
12. Information about Proxy Voting (Unaudited)
Information regarding how the Feeder Funds and the Master Portfolios vote proxies relating to portfolio securities is available without charge upon request by calling toll-free at 1-800-930-3828 or by accessing the Funds’ website at www.kineticsfunds.com and by accessing the SEC’s website at www.sec.gov. Information regarding how the Feeder Funds and the Master Portfolios voted proxies relating to portfolio securities during the most recent twelve month period ended June 30, is available without charge, upon request, by calling toll- free at 1-800-930-3828 or by accessing the SEC’s website at www.sec.gov.
13. Information about the Portfolio Holdings (Unaudited)
The Master Portfolios file their complete schedule of portfolio holdings for their first and third fiscal quarters with the SEC on Part F of Form N-PORT. The Master Portfolios’ Part F of Form N-PORT is available without charge, upon request, by calling toll-free at 1-800-930-3828. Furthermore, you can obtain the Part F of Form N-PORT on the SEC’s website at www.sec.gov.
181
KINETICS PORTFOLIOS TRUST
Report of Independent Registered Public Accounting Firm
To the Shareholders and Board of Trustees
of Kinetics Portfolios Trust
Opinion on the Financial Statements
We have audited the accompanying statements [consolidated where noted as such] of assets and liabilities of The Internet Portfolio, The Global Portfolio, The Paradigm Portfolio, The Medical Portfolio, The Small Cap Opportunities Portfolio, The Market Opportunities Portfolio, The Alternative Income Portfolio, and The Multi-Disciplinary Income Portfolio (the “Funds”), each a series of Kinetics Portfolios Trust (the “Trust”), including the schedules of investments, as of December 31, 2019, the related statements of operations for the year then ended, the statements of changes in net assets for each of the two years in the period then ended, and financial highlights for each of the five years in the period then ended, and the related notes (collectively referred to as the “financial statements”). In our opinion, the financial statements present fairly, in all material respects, the [consolidated where noted as such] financial position of the Funds as of December 31, 2019, the results of their operations for the year then ended, the changes in their net assets for each of the two years in the period then ended, and their financial highlights for each of the five years in the period then ended, in conformity with accounting principles generally accepted in the United States of America.
Basis for Opinion
These financial statements are the responsibility of the Funds’ management. Our responsibility is to express an opinion on the Funds’ financial statements based on our audits. We are a public accounting firm registered with the Public Company Accounting Oversight Board (United States) (“PCAOB”) and are required to be independent with respect to the Funds in accordance with the U.S. federal securities laws and the applicable rules and regulations of the Securities and Exchange Commission and the PCAOB. We have served as the auditor of one or more of the funds in the Trust since 2004.
We conducted our audits in accordance with the standards of the PCAOB. Those standards require that we plan and perform the audits to obtain reasonable assurance about whether the financial statements are free of material misstatement, whether due to error or fraud. The Funds are not required to have, nor were we engaged to perform, an audit of the Funds’ internal control over financial reporting. As part of our audits we are required to obtain an understanding of internal control over financial reporting, but not for the purpose of expressing an opinion on the effectiveness of the Funds’ internal control over financial reporting. Accordingly, we express no such opinion.
Our audits included performing procedures to assess the risks of material misstatement of the financial statements, whether due to error or fraud, and performing procedures that respond to those risks. Such procedures included examining, on a test basis, evidence regarding the amounts and disclosures in the financial statements. Our audits also included evaluating the accounting principles used and significant estimates made
182
KINETICS PORTFOLIOS TRUST
Report of Independent Registered Public Accounting Firm (Continued)
by management, as well as evaluating the overall presentation of the financial statements. Our procedures included confirmation of securities owned as of December 31, 2019 by correspondence with the custodian. We believe that our audits provide a reasonable basis for our opinion.
Philadelphia, Pennsylvania
March 2, 2020
183
KINETICS PORTFOLIOS TRUST
Management of the Funds and the Portfolios
(Unaudited)
Management of the Funds and the Portfolios
The management and affairs of the Funds and the Portfolios are supervised by the Board of Directors of the Company and the Board of Trustees of the Trust, respectively. Each Board consists of the same eight individuals, five of whom are not “interested persons” of the Company or the Trust as that term is defined in the Investment Company Act of 1940, as amended (the “1940 Act”). The Directors are fiduciaries for the Funds’ shareholders and are governed by the laws of the State of Maryland in this regard. The Trustees are fiduciaries for the Portfolios’ shareholders and are governed by the laws of the State of Delaware in this regard.
Each Board establishes policies for the operation of the Funds and the Portfolios and appoints the officers who conduct the daily business of the Funds and the Portfolios. Directors/Trustees of the Company and the Trust are listed below with their addresses, present positions with the Company and Trust, length of time served, principal occupations over at least the last five years, number of Funds and Portfolios overseen and any other Directorships held. The SAI includes additional information about the Funds’ officers and directors and is available, without charge, upon request by calling 1-800-930-3828.
Board of Directors/Board of Trustees
Independent Directors/Trustees
| | | |
| | Term of |
| Position(s) | Office and |
| Held with | Length of |
| Name, Address and Year of Birth | Company/ Trust | Time Served |
Steven T. Russell | Independent Director/ | Indefinite/ |
Year Born: 1963 | Independent Trustee | 19 years |
c/o Horizon Kinetics Asset Management LLC | | |
470 Park Avenue South | | |
New York, New York 10016 | | |
|
Douglas Cohen, CPA | Independent Director/ | Indefinite/ |
Year Born: 1961 | Independent Trustee | 19 years |
c/o Horizon Kinetics Asset Management LLC | | |
470 Park Avenue South | | |
New York, New York 10016 | | |
184
KINETICS PORTFOLIOS TRUST
Management of the Funds and the Portfolios —
(Continued) (Unaudited)
| | | |
| # of Portfolios | |
| in Fund Complex(1) | |
| Overseen by | |
| Principal Occupation(s) | Director/ | Other Directorships |
| During Past Five Years | Trustee | Held by Director/Trustee(2) |
Steven Russell Law Firm (April 2010 | 17 | N/A |
to present); Professor of Business Law and | | |
Finance, Suffolk County Community | | |
College (1997 to present). | | |
|
Chief Financial Officer, Sunrise Credit | 17 | N/A |
Services, Inc. (2005 to present). | | |
185
KINETICS PORTFOLIOS TRUST
Management of the Funds and the Portfolios —
(Continued) (Unaudited)
Board of Directors/Board of Trustees (Continued)
Independent Directors/Trustees (Continued)
| | | |
| | Term of |
| Position(s) | Office and |
| Held with | Length of |
| Name, Address and Year of Birth | Company/ Trust | Time Served |
William J. Graham | Independent Director/ | Indefinite/ |
Year Born: 1962 | Independent Trustee | 19 years |
c/o Horizon Kinetics Asset Management LLC | | |
470 Park Avenue South | | |
New York, New York 10016 | | |
|
Joseph E. Breslin | Independent Director/ | Indefinite/ |
Year Born: 1953 | Independent Trustee | 19 years |
c/o Horizon Kinetics Asset Management LLC | | |
470 Park Avenue South | | |
New York, New York 10016 | | |
|
James M. Breen | Independent Director/ | Indefinite/ |
Year Born: 1959 | Independent Trustee | 11 years |
c/o Horizon Kinetics Asset Management LLC | | |
470 Park Avenue South | | |
New York, New York 10016 | | |
186
KINETICS PORTFOLIOS TRUST
Management of the Funds and the Portfolios —
(Continued) (Unaudited)
| | | |
| # of Portfolios | |
| in Fund Complex(1) | |
| Overseen by | |
| Principal Occupation(s) | Director/ | Other Directorships |
| During Past Five Years | Trustee | Held by Director/Trustee(2) |
Attorney, William J. Graham, PC | 17 | N/A |
(2001 to present); Assistant Town | | |
Attorney, Town of Islip, NY | | |
(2016 to present). | | |
|
J.E. Breslin & Co. – Consulting | 17 | Northern Lights Fund Trust IV |
(2010 to present); Senior Counsel, | | (20 portfolios) (2016-present); |
White Oak Global Advisors, LLC | | Trustee, Forethought Variable |
(2017 to present). | | Insurance Trust (5 portfolios); |
| | Trustee, Hatteras Alternative |
| | Mutual Funds Trust (8 portfolios) |
| | (2004-2016); Trustee, Underlying |
| | Funds Trust (2 portfolios) (2004- |
| | 2016); Trustee, HCIM Trust (2 |
| | portfolios) (2013-2015); Manager, |
| | Hatteras Global Private Equity |
| | Partners Institutional, LLC (2012- |
| | 2016); Manager, Hatteras GPEP |
| | Fund II, LLC (2012-2016); |
| | Manager, Hatteras VC Co- |
| | Investment Fund II LLC (2012- |
| | 2016); Manager, Hatteras Master |
| | Fund, L.P. (2012-2016); Manager, |
| | Hatteras Core Alternatives TEI |
| | Fund, L.P. (2012-2016); Manager, |
| | Hatteras Core Alternatives Fund, |
| | L.P. (2012-2016); Manager, |
| | Hatteras Core Alternatives |
| | Institutional Fund, L.P. (2012- |
| | 2016); Manager, Hatteras Core |
| | Alternatives TEI Institutional |
| | Fund, L.P. (2012-2016); and |
| | Trustee, Hatteras Variable Trust |
| | (2012-2013); Trustee. |
|
Special Agent, Florida Department of Law | 17 | N/A |
Enforcement (2015 to 2019); Senior AML | | |
Analyst, Citibank (2014-2015); Senior | | |
Special Agent, Homeland Security | | |
Investigations, Miami, FL (2011 to 2014). | | |
187
KINETICS PORTFOLIOS TRUST
Management of the Funds and the Portfolios —
(Continued) (Unaudited)
Board of Directors/Board of Trustees (Continued)
Interested Directors/Trustees and Officers
| | Term of |
| Position(s) | Office and |
| Held with the | Length of |
| Name, Address and Year of Birth | Company/ Trust | Time Served |
Murray Stahl(3) | Director/Trustee | Indefinite/ |
Year Born: 1953 | & Secretary | 19 years |
c/o Horizon Kinetics Asset Management LLC | | |
470 Park Avenue South | | |
New York, New York 10016 | | |
188
KINETICS PORTFOLIOS TRUST
Management of the Funds and the Portfolios —
(Continued) (Unaudited)
| | | |
| # of Portfolios | |
| in Fund Complex(1) | |
| Overseen by | |
| Principal Occupation(s) | Director/ | Other Directorships |
| During Past Five Years | Trustee | Held by Director/Trustee(2) |
Chairman, FRMO Corp. (2001 to present) | 17 | Director and Officer of |
(provides consulting services to private | | FRMO Corp. |
investment funds and research services with | | |
respect to marketable securities); Chairman | | Additionally, Murray is an |
and Chief Investment Officer, Horizon | | owner and director of |
Kinetics LLC, (including Horizon Asset | | MSRH, LLC (“MSRH”), |
Management LLC (an investment adviser) | | an independent exempt |
(1994 to present); Horizon Kinetics Asset | | reporting adviser that |
Management LLC and Kinetics Advisers LLC | | serves as the investment |
(2000 to present)); CEO, Horizon Kinetics | | manager and general |
LLC (2015 to present). Chairman, President, | | partner of two U.S. |
RENN Fund, Inc. (2017-present). | | private funds. |
|
| | Murray is also the Chairman |
| | of the Board of Directors of |
| | the Minneapolis Grain |
| | Exchange (“MGEX”), a |
| | designated contract market |
| | and derivatives clearing |
| | organization. |
|
| | Murray is a member of the |
| | Board of the Bermuda Stock |
| | Exchange (“BSX”), |
| | incorporated pursuant to The |
| | Bermuda Stock Exchange |
| | Company Act of 1992. |
|
| | Murray is a Director of IL&FS |
| | Securities Services Limited, a |
| | company based in India. |
|
| | Murray is also a shareholder |
| | and Director of Winland |
| | Holdings Corporation |
| | (“WELX”), a publicly traded |
| | company. |
189
(Missing Graphic Reference)
KINETICS PORTFOLIOS TRUST
Management of the Funds and the Portfolios —
(Continued) (Unaudited)
Board of Directors/Board of Trustees (Continued)
Interested Directors/Trustees and Officers
| | | |
| | Term of |
| Position(s) | Office and |
| Held with the | Length of |
| Name, Address and Year of Birth | Company/ Trust | Time Served |
Peter B. Doyle(3) | Director/Trustee, | Indefinite/ |
Year Born: 1962 | President & Chairman | 17 years |
c/o Horizon Kinetics Asset Management LLC | of the Board | |
470 Park Avenue South | | |
New York, New York 10016 | | |
|
|
|
|
Leonid Polyakov(3) | Director/Trustee | Indefinite/ |
Year Born: 1959 | & Treasurer | 17 years |
c/o Horizon Kinetics Asset Management LLC | | |
470 Park Avenue South | | |
New York, New York 10016 | | |
| | |
| (1) | The term “fund complex” refers to the Company and the Trust, which hold themselves out as related for investment purposes.
|
| (2) | “Other Directorships Held” includes only directorships of companies required to register or file reports with the SEC under the Securities Exchange Act of 1934, as amended, (that is, “public companies”) or investment companies registered under the 1940 Act.
|
190
KINETICS PORTFOLIOS TRUST
Management of the Funds and the Portfolios —
(Continued) (Unaudited)
| | | |
| # of Portfolios | |
| | in Fund Complex(1)
| |
| Overseen by | |
| Principal Occupation(s) | Director/ | Other Directorships |
| During Past Five Years | Trustee | Held by Director/Trustee(2) |
Vice President, Horizon Asset Management | | |
LLC (1994 to 2011); Vice President, FMRO Corp. | 17 | Director and Officer of |
2001 to present) (provides consulting services | | FRMO Corp. |
(to private investment funds and research | | |
services with respect to marketable securities); | | |
Managing Director, Horizon Kinetics LLC | | |
(including Horizon Asset Management LLC (an | | |
investment adviser) (1994 to present); Horizon | | |
Kinetics Asset Management LLC and Kinetics | | |
Advisers LLC (2000 to present)); and President of | | |
Kinetics Mutual Funds, Inc. (1998 to present). | | |
|
CFO, Horizon Kinetics Asset Management | 17 | N/A |
LLC (2000 to 2011); CFO and FINOP, Kinetics | | |
Funds Distributor LLC (2002 to 2011); Director, | | |
Kinetics Advisers LLC (2000 to 2011). | | |
| | |
| (3) | Directors/Trustees who are considered “interested persons” as defined in Section 2(a)(19) of the 1940 |
| Act because of their association with the Adviser and its affiliates. |
191
KINETICS PORTFOLIOS TRUST
Management of the Funds and the Portfolios —
(Continued) (Unaudited)
Board of Directors/Board of Trustees (Continued)
Officers
| | | |
| | Term of |
| Position(s) | Office and |
| Held with the | Length of |
| Name, Address and Age | Company/ Trust | Time Served |
Andrew M. Fishman | Chief Compliance | Indefinite/ |
Year Born: 1950 | Officer | 15 years |
c/o Horizon Kinetics Asset Management LLC | | |
470 Park Avenue South | | |
New York, New York 10016 | | |
|
|
|
Jay H. Kesslen | Vice President and | Indefinite/ |
Year Born: 1973 | Assistant Secretary | 15 years |
c/o Horizon Kinetics Asset Management LLC | | |
470 Park Avenue South | | |
New York, New York 10016 | | |
192
KINETICS PORTFOLIOS TRUST
Management of the Funds and the Portfolios —
(Continued) (Unaudited)
| Principal Occupation(s) During Past Five Years | Other Directorships Held by Officer |
| Associate General Counsel, Horizon Kinetics LLC (2011 to present); General Counsel, Horizon Asset Management, Inc. (1997 to 2011); Secretary, Horizon Asset Management, Inc. (2006 to 2011); Chief Compliance Officer, Horizon Asset Management, Inc. (1997 to 2008); Chief Compliance Officer, Horizon Kinetics Asset Management LLC. (1999 to 2011); Chief Compliance Officer, Kinetics Advisers LLC (2000 to 2011). | N/A |
| | |
General Counsel, Horizon Kinetics LLC (including Horizon Asset Management LLC (an investment adviser) (2011 to present), Horizon Kinetics Asset Management LLC (2000 to present), Kinetics Advisers LLC (2000 to present), Kinetics Funds Distributor LLC (2000 to present), KBDSecurities LLC (2000 to present)); FRMO Corp. (2014 to present); Chief Compliance Officer, Horizon Kinetics LLC (2015-2016). Vice President, Chief Compliance Officer, RENN Fund, Inc. (2017-present). | N/A |
193
KINETICS MUTUAL FUNDS, INC. & KINETICS PORTFOLIOS TRUST
Privacy Policy (Unaudited)
We collect the following nonpublic personal information about you:
| • | Information we receive from you on or in applications or other forms, correspondence, or conversations, including, but not limited to, your name, address, phone number, social security number, assets, income and date of birth; and |
| • | Information about your transactions with us, our affiliates, or others, including, but not limited to, your account number and balance, payments history, parties to transactions, cost basis information, and other financial information. |
We do not disclose any nonpublic personal information about our current or former shareholders to nonaffiliated third parties, except as permitted by law. For example, we are permitted by law to disclose all of the information we collect, as described above, to our transfer agent to process your transactions. Furthermore, we restrict access to your nonpublic personal information to those persons who require such information to provide products or services to you. We maintain physical, electronic, and procedural safeguards that comply with federal standards to guard your nonpublic personal information.
In the event that you hold shares of the fund(s) through a financial intermediary, including, but not limited to, a broker-dealer, bank, or trust company, the privacy policy of your financial intermediary would govern how your nonpublic personal information would be shared with nonaffiliated third parties.
This privacy policy is not part of the annual report.
194
[THIS PAGE INTENTIONALLY LEFT BLANK]
195
[THIS PAGE INTENTIONALLY LEFT BLANK]
196
[THIS PAGE INTENTIONALLY LEFT BLANK]
197
[THIS PAGE INTENTIONALLY LEFT BLANK]
198
[THIS PAGE INTENTIONALLY LEFT BLANK]
199
[THIS PAGE INTENTIONALLY LEFT BLANK]
200