Life is Complex.
Nuveen makes things e-simple.
It only takes a minute to sign up for e-Reports. Once enrolled, you’ll receive an e-mail as soon as your Nuveen Fund information is ready—no more waiting for delivery by regular mail. Just click on the link within the e-mail to see the report and save it on your computer if you wish.
Free e-Reports
right to your e-mail!
www.investordelivery.com
If you receive your Nuveen Fund
dividends and statements from your
financial professional or brokerage account.
or
www.nuveen.com/client-access
If you receive your Nuveen Fund
dividends and statements directly from
Nuveen.
NOT FDIC INSURED MAY LOSE
VALUE NO BANK GUARANTEE
3
Chair’s Letterto Shareholders
Dear Shareholders,
The COVID-19 crisis is taking an unprecedented toll on our health, societies, economies and financial markets. Our thoughts are with all whose lives have been affected by the disease and its economic fallout. With some regions of the world having appeared to “flatten the curve” of infections, governments and public health officials are now facing the extraordinary challenge of balancing the resumption of economic activity with public safety, in a way that minimizes the potential for a second wave of outbreaks. Markets have turned their focus to the potential for an economic recovery – the timing and magnitude of which remain highly uncertain. Elevated market volatility is likely to continue, with economic data, coronavirus infection rates and the upcoming U.S. presidential election under scrutiny.
While we do not want to understate the dampening effect on the global economy, it is important to differentiate short-term interruptions from the longer-lasting implications to the economy. Some areas of the global economy were already on the mend prior to the coronavirus epidemic. Temporary bans on movement and travel are being lifted, and some near-term economic indicators have shown modest improvement in countries that have reopened. Central banks and governments around the world have announced economic stimulus measures and pledged to continue doing what it takes to support their economies. In the U.S., the Federal Reserve has cut its benchmark interest rate to near zero and introduced programs that helped revive the U.S. economy after the 2008 financial crisis. The U.S. Government has approved three relief packages, including a $2 trillion-dollar package directly supporting businesses and individuals. The Coronavirus Aid, Relief and Economic Security Act, called the CARES Act, provides direct payments and expanded unemployment benefits to individuals, loans and grants to small businesses, loans and other money to large corporations and funding for hospitals, public health, education and state and local governments.
In the meantime, patience and a long-term perspective are key for investors. When market fluctuations are the leading headlines day after day, it’s tempting to “do something.” However, your long-term goals can’t be met with short-term thinking. We encourage you to talk to your financial professional, who can review your time horizon, risk tolerance and investment goals. On behalf of the other members of the Nuveen Fund Board, we look forward to continuing to earn your trust in the months and years ahead.
Terence J. Toth
Chair of the Board
June 23, 2020
4
Portfolio Manager’s Comments
Nuveen Quality Municipal Income Fund (NAD)
Nuveen AMT-Free Quality Municipal Income Fund (NEA)
These Funds feature portfolio management by Nuveen Asset Management, LLC (NAM), an affiliate of Nuveen Fund Advisors, LLC, the Funds’ investment adviser. Portfolio manager Christopher L. Drahn, CFA, reviews key investment strategies and the six-month performance of these two national Funds.
During May 2019, the Board of Trustees approved the merger of the Nuveen Texas Quality Municipal Income Fund (NTX) into the acquiring Fund, the Nuveen Quality Municipal Income Fund (NAD) and the Nuveen North Carolina Quality Municipal Income Fund (NNC) into the acquiring Fund the Nuveen AMT-Free Quality Municipal Income Fund (NEA). Shareholders approved the merger of NNC into NEA during October 2019 and the mergers were completed prior to the open of business on November 18, 2019. Shareholders approved the merger of NTX into NAD during January 2020 and the mergers were completed prior to the open of business on February 18, 2020.
An Update on COVID-19 Coronavirus and its Impact on the Securities Markets
With daily new COVID-19 coronavirus cases now slowing across much of the world, economies are beginning to reopen and movement bans are easing. The focus is shifting to whether the resumption of activity triggers a second wave of infections and how quickly economies may rebound. Early indications, first from China, South Korea and Hong Kong, and more recently from various U.S. states that opened their economies earlier and more thoroughly than others, showed there is a risk of new infection outbreaks. Economic indicators have begun to reflect the severe supply and demand disruptions resulting from the shutdowns, and a more prolonged recovery looks more likely than a rapid snap-back to growth.
Although the detection of the virus in China was made public in December 2019, markets did not start to fully acknowledge the risks and potential economic impact until the latter portion of February 2020, when outbreaks outside of China were first reported. Global stock markets sold off severely, with the S&P 500® index reaching a bear market (a 20% drop from the previous high) within three weeks, the fastest bear market decline in history. Even certain parts of the bond market suffered; below investment grade municipal and corporate bonds generally dropped the furthest, mostly out of concerns for the continued financial stability of lower quality issuers. Demand for safe-haven assets, along with mounting recession fears, drove the yield on the 10-year U.S. Treasury note to 0.5% in March 2020, an all-time low. Additionally, oil prices collapsed to an 18-year low on supply glut concerns, as shutdowns across the global economy sharply reduced oil demand, although oil prices have recovered to well above those lows.
This material is not intended to be a recommendation or investment advice, does not constitute a solicitation to buy, sell or hold a security or an investment strategy and is not provided in a fiduciary capacity. The information provided does not take into account the specific objectives or circumstances of any particular investor, or suggest any specific course of action. Investment decisions should be made based on an investor’s objectives and circumstances and in consultation with his or her advisors.Certain statements in this report are forward-looking statements. Discussions of specific investments are for illustration only and are not intended as recommendations of individual investments. The forward-looking statements and other views expressed herein are those of the portfolio manager as of the date of this report. Actual future results or occurrences may differ significantly from those anticipated in any forward-looking statements, and the views expressed herein are subject to change at any time, due to numerous market and other factors. The Funds disclaim any obligation to update publicly or revise any forward-looking statements or views expressed herein.
The ratings disclosed are the lowest rating given by one of the following national rating agencies: Standard & Poor’s Group (S&P), Moody’s Investors Service, Inc. (Moody’s) or Fitch, Inc. (Fitch). Credit ratings are subject to change. AAA, AA, A and BBB are investment grade ratings, while BB, B, CCC, CC, C and D are below investment grade ratings. Holdings designated N/R are not rated by these national rating agencies.
Bond insurance guarantees only the payment of principal and interest on the bond when due, and not the value of the bonds themselves, which will fluctuate with the bond market and the financial success of the issuer and the insurer. Insurance relates specifically to the bonds in the portfolio and not to the share prices of a Fund. No representation is made as to the insurers’ ability to meet their commitments.
Refer to the Glossary of Terms Used in this Report for further definition of the terms used within this section.
5
Portfolio Manager’s Comments (continued)
Central banks and governments have responded with liquidity injections to ease the strain on financial systems and stimulus measures to buffer the shock to businesses and consumers. These measures have helped stabilize the markets over the short term, and most markets have recovered most of their losses. But volatility will likely remain elevated until the health crisis itself is under control (via fewer new cases, lower infection rates and/or verified treatments or vaccines). There are still many unknowns and new information is incoming daily, compounding the difficulty of modeling outcomes for epidemiologists and economists alike.
Nuveen, LLC and our portfolio management teams are monitoring the situation carefully and continuously refining our views and approaches to managing the Funds to best pursue investment objectives while mitigating risks through all market environments.
What key strategies were used to manage the Funds during the six-month reporting period ended April 30, 2020, and how did these strategies influence performance?
Each Fund seeks to provide current income exempt from regular federal income tax, and in the case of NEA the alternative minimum tax (“AMT”) applicable to individuals, by investing primarily in a portfolio of municipal obligations issued by state and local government authorities or certain U.S. territories.
For most of the reporting period, a favorable macroeconomic backdrop, strong demand, narrowing credit spreads and falling interest rates supported municipal bond performance. However, the coronavirus pandemic and the shutdown of the economy introduced significant uncertainty about the future of economic growth and impact to municipal credit fundamentals. As the nearer-term impacts began to materialize, we looked for relative value and income enhancement opportunities among credits we believe may demonstrate resilience over the long term.
Our trading activity continued to focus on pursuing the Funds’ investment objectives. In the more normal market conditions of the first four months of the reporting period, we continued to reinvest the proceeds of called and maturing bonds. One of the more notable transactions in this reporting period was the state of Ohio refunding its legacy Buckeye Tobacco Settlement bonds, which both NEA and NAD held. We partially replaced the position with some of the new issue replacement Buckeye Tobacco bonds. After the market sell-off in March 2020, credit spreads for mid and lower grade bonds widened considerably. Focus shifted to gauging the effect of the economic disruptions to municipal issuers over the nearer and longer terms while still attempting to take advantage of potential opportunities. As is often the case when yields rise, a primary emphasis in March and April 2020 involved selling depreciated bonds with lower embedded yields to buy replacement positions at the higher yields now available in the marketplace. This exchanging strategy allows the Funds to take advantage of tax efficiencies and enhances the Funds’ income earnings capability to support the dividend. The volatility in the latter months of the reporting period marginally lengthened the Funds’ (and benchmark indexes’) overall duration. As yields rose and credit spreads widened, bonds previously priced to shorter call dates become less likely to be called early, lengthening their duration profile. There were no significant shifts in the Funds’ overall positioning, although the government guaranteed weightings increased somewhat due to advance refundings, while the transportation sector weighting declined primarily due to spread widening.
As of April 30, 2020, the Funds continued to use inverse floating rate securities. We employ inverse floaters for a variety of reasons, including duration management and income and total return enhancement.
How did the Funds perform during the six-month reporting period ended April 30, 2020?
The tables in each Fund's Performance Overview and Holding Summaries section of this report provide the Funds’ total returns for the six-month, one-year, five-year and ten-year periods ended April 30, 2020. Each Fund's total returns at net asset value (NAV) are compared with the performance of a corresponding market index.
6
For the six months ended April 30, 2020, the total returns on common share NAV for the two Funds underperformed the returns for the national S&P Municipal Bond Index and the secondary benchmark, composed of 80% S&P Municipal Bond Investment Grade Index and 20% S&P Municipal Bond High Yield Index.
The main factors influencing the Funds’ relative performance during this reporting period were yield curve and duration positioning, credit quality allocation and sector allocation. The high grade municipal yield curve steepened in this reporting period, with yields on the short end of the curve falling and yields on the longer end of the curve increasing. The Funds’ overweight allocations to the longer end of the yield curve detracted from relative performance, as longer maturity bonds underperformed.
The major detractor for relative performance came from the disproportionate credit spread widening among lower rated and high yield bonds during March 2020. The Funds’ overweight allocations in mid-grade quality (single A and BBB rated) credits and underweights in high grade (AAA and AA rated) paper were detrimental to performance as the mid-grade segment significantly underper-formed the highest credit quality segments. The Funds’ held a smaller overweight to the primary benchmark to below investment grade bonds, which also had a negative impact, although to a lesser degree.
Sectors composed of predominantly high grade bonds outperformed, despite their lower yields, while those made up of primarily lower rated, higher yielding bonds lagged. The two Funds benefited from their overweight allocation to the pre-refunded sector, whose bonds are backed by U.S. Treasuries or other high quality government bonds, and was among the best performing sectors in this reporting period. The Funds held an underweight allocation in general obligation (GO) bonds, which was disadvantageous to performance. GO bonds were a stronger performing sector due to their tax-backed revenues streams being perceived as somewhat more resistant to economic disruption. Additionally, overweight allocations to transportation (especially airports and toll roads) and hospitals detracted from the Funds’ performance, as these sectors came under significant pressure from coronavirus-related concerns. We note that NEA’s overweight to airport bonds was smaller than NAD’s because NEA does not invest in bonds subject to the alternative minimum tax (AMT), of which airports tend to be larger issuers. Other bonds that were disproportionately affected by the March sell-off, and therefore underperformed for the reporting period overall, included Illinois and Chicago GOs and U.S. territory debt. For these issuers, investors worried that credit concerns pre-dating the health crisis could be exacerbated by the uncertain outlook. While NEA and NAD’s exposure to Illinois (Chicago) and Puerto Rico bonds (the Funds do not own any Virgin Islands bonds) was a detractor from performance, the relative impact was generally in line with the credit spread widening seen across many other lower rated bonds.
In addition, the use of regulatory leverage was an important factor affecting performance of the Funds. Leverage is discussed in more detail later in the Fund Leverage section of this report.
7
IMPACT OF THE FUNDS’ LEVERAGE STRATEGIES ON PERFORMANCE
One important factor impacting the returns of the Funds’ common shares relative to their comparative benchmarks was the Funds’ use of leverage. The Funds obtain leverage through the issuance of preferred shares and/or investments in inverse floating rate securities, which represent a leveraged investment in an underlying bond.
The Funds primarily utilize leverage in order to generate incremental income. The Funds are able to do so by earning a greater amount of interest on additional higher yielding long-term bond investments than its associated leverage expense, which is typically based upon short-term rates. This has been particularly true in recent market environments where short-term rates have been low by historical standards. Common share income in leveraged funds will typically decrease in comparison to unleveraged funds when short-term rates increase and increase when short-term rates decrease.
In return for the opportunity of higher incremental income, the Funds’ common shareholders assume additional price variability, so their net asset value will be more volatile. Common shareholders will experience a greater increase in their net asset value due to leverage if the municipal bonds acquired through the use of leverage increase in value, but correspondingly will have a greater decline in their net asset value if the bonds acquired through leverage decline in price.
Management believes that the potential benefit from leverage continues to outweigh the associated risk of loss from increased price variability as previously described. Historically, over almost all longer periods of time, incremental income derived from leverage has more than offset any negative impact on net asset value due to the added price variability caused by leverage, in which cases leverage has resulted in higher total returns. However, during shorter time periods, increased losses due to this added price variability can equal or exceed any incremental income so that, when compared to an unleveraged fund, leverage may reduce total returns during the period.
During the recent semi-annual period, leverage had a negative impact on the total return performance of both Funds. Over the first four months of the reporting period the total return performance for each Fund was aided by not only the incremental income from leverage, but also an amplification of the modest price appreciation of its underlying bond portfolio. However, beginning of the second week of March, the overall municipal market experienced a severe sell-off due to the COVID-19 economic shutdown. The Funds’ leverage amplified these market declines, and those amplified declines more than offset leverage’s favorable impact on the prior months’ net asset value appreciation and incremental income.
During this period of sharp portfolio value decline, each Fund’s effective leverage ratio increased. Neither Fund was forced to reduce leverage during this period, however, and as markets began to somewhat recover, albeit in fits and starts, starting in the last days of March and through April, leverage again worked in each Fund’s favor. That recovery also caused the Funds’ respective leverage ratios to decline.
Despite the significant negative impact of leverage over the last two months of the fiscal period, management continues to believe that over the longer term leverage for each Fund will continue to enhance both net income and total return prospects. We point to the strong 10-year returns of the Funds compared to their unlevered benchmark index, shown on ensuing pages, which results encompass the negative impact of leverage during March and April of 2020.
8
As of April 30, 2020, the Funds’ percentages of leverage are as shown in the accompanying table. | | |
| NAD | NEA |
Effective Leverage* | 39.23% | 39.31% |
Regulatory Leverage* | 37.44% | 37.28% |
* | Effective leverage is a Fund’s effective economic leverage, and includes both regulatory leverage and the leverage effects of certain derivative and other investments in a Fund’s portfolio that increase the Fund’s investment exposure. Currently, the leverage effects of Tender Option Bond (TOB) inverse floater holdings are included in effective leverage values, in addition to any regulatory leverage. Regulatory leverage consists of preferred shares issued or borrowings of a Fund. Both of these are part of a Fund’s capital structure. A Fund, however, may from time to time borrow on a typically transient basis in connection with its day-to-day operations, primarily in connection with the need to settle portfolio trades. Such incidental borrowings are excluded from the calculation of a Fund’s effective leverage ratio. Regulatory leverage is subject to asset coverage limits set forth in the Investment Company Act of 1940. |
THE FUNDS’ REGULATORY LEVERAGE
As of April 30, 2020, the Funds have issued and outstanding preferred shares as shown in the accompanying table.
| | | Variable Rate
| |
| Variable Rate | Remarketed
| |
| Preferred* | Preferred** | |
| Shares | Shares | |
| Issued at | Issued at | |
| Liquidation | Liquidation | |
| Preference | Preference | Total |
NAD | $1,224,500,000 | $ 632,000,000 | $1,856,500,000 |
NEA | $ 901,500,000 | $1,490,300,000 | $2,391,800,000 |
* | Preferred shares of the Fund featuring a floating rate dividend based on a predetermined formula or spread to an index rate. Includes the following preferred shares AMTP, iMTP, MFP-VRM and VRDP in Special Rate Mode, where applicable. See Notes to Financial Statements, Note 5 – Fund Shares for further details. |
** | Preferred shares of the Fund featuring floating rate dividends set by a remarketing agent via a regular remarketing. Includes the following preferred shares VRDP not in Special Rate Mode, MFP-VRRM and MFP-VRDM, where applicable. See Notes to Financial Statements, Note 5 – Fund Shares for further details. |
Refer to Notes to Financial Statements, Note 5 — Fund Shares for further details on preferred shares and each Fund’s respective transactions.
9
COMMON SHARE DISTRIBUTION INFORMATION
The following information regarding the Funds’ distributions is current as of April 30, 2020. Each Fund’s distribution levels may vary over time based on each Fund’s investment activity and portfolio investment value changes.
During the current reporting period, each Fund’s distributions to common shareholders were as shown in the accompanying table.
| Per Common |
| Share Amounts |
| Monthly Distributions (Ex-Dividend Date) | NAD | NEA |
November 2019 | $0.0535 | $0.0535 |
December | 0.0535 | 0.0535 |
January | 0.0535 | 0.0535 |
February | 0.0535 | 0.0535 |
March | 0.0535 | 0.0535 |
April 2020 | 0.0535 | 0.0535 |
| Total Distributions from Net Investment Income | $0.3210 | $0.3210 |
|
| Yields | | |
Market Yield* | 4.92% | 4.97% |
Tax-Equivalent Yield* | 8.31% | 8.40% |
* | Market Yield is based on the Fund’s current annualized monthly dividend divided by the Fund’s current market price as of the end of the reporting period. Taxable-Equivalent Yield represents the yield that must be earned on a fully taxable investment in order to equal the yield of the Fund on an after-tax basis. It is based on a federal income tax rate of 40.8%. Your actual federal income tax rate may differ from the assumed rate. The Taxable-Equivalent Yield also takes into account the percentage of the Fund’s income generated and paid by the Fund (based on payments made during the previous calendar year) that was not exempt from federal income tax. Separately, if the comparison were instead to investments that generate qualified dividend income, which is taxable at a rate lower than an individual’s ordinary graduated tax rate, the fund’s Taxable-Equivalent Yield would be lower. |
Each Fund seeks to pay regular monthly dividends out of its net investment income at a rate that reflects its past and projected net income performance. To permit each Fund to maintain a more stable monthly dividend, the Fund may pay dividends at a rate that may be more or less than the amount of net income actually earned by the Fund during the period. Distributions to common shareholders are determined on a tax basis, which may differ from amounts recorded in the accounting records. In instances where the monthly dividend exceeds the earned net investment income, the Fund would report a negative undistributed net ordinary income. Refer to Note 6 – Income Tax Information for additional information regarding the amounts of undistributed net ordinary income and undistributed net long-term capital gains and the character of the actual distributions paid by the Fund during the period.
All monthly dividends paid by each Fund during the current reporting period were paid from net investment income. If a portion of the Fund’s monthly distributions is sourced or comprised of elements other than net investment income, including capital gains and/or a return of capital, shareholders will be notified of those sources. For financial reporting purposes, the per share amounts of each Fund’s distributions for the reporting period are presented in this report’s Financial Highlights. For income tax purposes, distribution information for each Fund as of its most recent tax year end is presented in Note 6 – Income Tax Information within the Notes to Financial Statements of this report.
10
CHANGE IN METHOD OF PUBLISHING NUVEEN CLOSED-END FUND DISTRIBUTION AMOUNTS
During November 2019, the Nuveen Closed-End Funds discontinued the practice of announcing Fund distribution amounts and timing via press release. Instead, information about the Nuveen Closed-End Funds’ monthly and quarterly periodic distributions to shareholders will be posted and can be found on Nuveen’s enhanced closed-end fund resource page, which is at www.nuveen.com/closed-end-fund-distributions, along with other Nuveen closed-end fund product updates. Shareholders can expect regular distribution information to be posted on www.nuveen.com on the first business day of each month. To ensure that our shareholders have timely access to the latest information, a subscribe function can be activated at this link here, or at this web page (www.nuveen.com/en-us/people/about-nuveen/for-the-media).
COMMON SHARE REPURCHASES
During August 2019, the Funds’ Board of Trustees reauthorized an open-market share repurchase program, allowing each Fund to repurchase an aggregate of up to approximately 10% of its outstanding common shares.
As of April 30, 2020, and since the inception of the Funds’ repurchase programs, the Funds have cumulatively repurchased and retired their outstanding common shares as shown in the accompanying table.
| NAD | NEA |
Common shares cumulatively repurchased and retired | 17,900 | 75,000 |
Common shares authorized for repurchase | 20,185,000 | 26,270,000 |
During the current reporting period, the Funds did not repurchase any of their outstanding common shares. | | |
OTHER COMMON SHARE INFORMATION
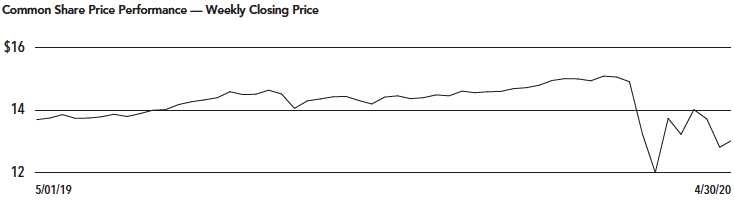
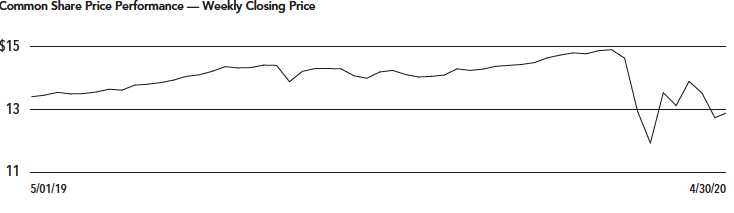
As of April 30, 2020, and during the current reporting period, the Funds’ common share prices were trading at a premium/(discount) to their common share NAVs as shown in the accompanying table.
| NAD | NEA |
Common share NAV | $14.66 | $14.45 |
Common share price | $13.05 | $12.91 |
Premium/(Discount) to NAV | (10.98)% | (10.66)% |
6-month average premium/(discount) to NAV | (9.11)% | (8.82)% |
11
Fund shares are not guaranteed or endorsed by any bank or other insured depository institution, and are not federally insured by the Federal Deposit Insurance Corporation.
Nuveen Quality Municipal Income Fund (NAD)
Investing in closed-end funds involves risk; principal loss is possible. There is no guarantee the Fund’s investment objectives will be achieved. Closed-end fund shares may frequently trade at a discount or premium to their net asset value. Debt or fixed income securities such as those held by the Fund, are subject to market risk, credit risk, interest rate risk, derivatives risk, liquidity risk, and income risk. As interest rates rise, bond prices fall. Leverage increases return volatility and magnifies the Fund’s potential return and its risks; there is no guarantee a fund’s leverage strategy will be successful. These and other risk considerations such as inverse floater risk and tax risk are described in more detail on the Fund’s web page at www.nuveen.com/NAD.
Nuveen AMT-Free Quality Municipal Income Fund (NEA)
Investing in closed-end funds involves risk; principal loss is possible. There is no guarantee the Fund’s investment objectives will be achieved. Closed-end fund shares may frequently trade at a discount or premium to their net asset value. Debt or fixed income securities such as those held by the Fund, are subject to market risk, credit risk, interest rate risk, derivatives risk, liquidity risk, and income risk. As interest rates rise, bond prices fall. Leverage increases return volatility and magnifies the Fund’s potential return and its risks; there is no guarantee a fund’s leverage strategy will be successful. These and other risk considerations such as inverse floater risk and tax risk are described in more detail on the Fund’s web page at www.nuveen.com/NEA.
12
| | |
| NAD | Nuveen Quality Municipal Income Fund |
| Performance Overview and Holding Summaries as of April 30, 2020 |
Refer to the Glossary of Terms Used in this Report for further definition of the terms used within this section. | | |
| Average Annual Total Returns as of April 30, 2020 | | | | |
|
| Cumulative | Average Annual |
| 6-Month | 1-Year | 5-Year | 10-Year |
NAD at Common Share NAV | (5.95)% | (0.33)% | 3.71% | 5.87% |
NAD at Common Share Price | (7.45)% | 0.59% | 3.47% | 5.24% |
S&P Municipal Bond Index | (1.26)% | 2.21% | 3.02% | 3.97% |
NAD Custom Blended Fund Performance Benchmark(1) | (2.10)% | 1.58% | 3.04% | 3.97% |
Past performance is not predictive of future results. Current performance may be higher or lower than the data shown. Returns do not reflect the deduction of taxes that shareholders may have to pay on Fund distributions or upon the sale of Fund shares. Returns at NAV are net of Fund expenses, and assume reinvestment of distributions. Comparative index return information is provided for the Fund’s shares at NAV only. Indexes are not available for direct investment.
(1) | The Blended Index consists of the returns of the S&P Municipal Bond Index prior to 9/12/16 and thereafter: 1) 80% of the return of the S&P Municipal Bond Investment Grade Index and 2) 20% of the return the S&P Municipal Bond High Yield Index. |
13
| NAD | Performance Overview and Holding Summaries as of |
| April 30, 2020 (continued) |
This data relates to the securities held in the Fund’s portfolio of investments as of the end of the reporting period. It should not be construed as a measure of performance for the Fund itself. Holdings are subject to change.
The ratings disclosed are the lowest rating given by one of the following national rating agencies: Standard & Poor’s Group, Moody’s Investors Service, Inc. or Fitch, Inc. Credit ratings are subject to change. AAA, AA, A and BBB are investment grade ratings; BB, B, CCC, CC, C and D are below-investment grade ratings. Holdings designated N/R are not rated by these national rating agencies.
| Fund Allocation | |
| (% of net assets) | |
Long-Term Municipal Bonds | 159.4% |
Investment Companies | 0.0% |
Short-Term Municipal Bonds | 1.4% |
Other Assets Less Liabilities | 2.1% |
| Net Assets Plus Floating Rate Obligations, | |
| AMTP Shares, net of deferred offering costs, |
| MFP Shares, net of deferred offering | |
| costs & VRDP Shares, net of deferred | |
| offering costs | 162.9% |
Floating Rate Obligations | (3.1)% |
AMTP Shares, net of deferred | |
| offering costs | (17.6)% |
MFP Shares, net of deferred | |
| offering costs | (21.9)% |
VRDP Shares, net of deferred | |
| offering costs | (20.3)% |
| Net Assets | 100% |
| Portfolio Credit Quality | |
| (% of total investment exposure) | |
U.S. Guaranteed | 9.8% |
AAA | 3.0% |
AA | 19.3% |
A | 39.2% |
BBB | 18.2% |
BB or Lower | 7.2% |
N/R (not rated) | 3.3% |
N/A (not applicable) | 0.0% |
| Total | 100% |
| | |
| Portfolio Composition | |
| (% of total investments) | |
Transportation | 28.3% |
Health Care | 15.9% |
Tax Obligation/Limited | 13.7% |
U.S. Guaranteed | 10.4% |
Tax Obligation/General | 9.2% |
Utilities | 6.4% |
Water and Sewer | 5.1% |
Education and Civic Organizations | 5.1% |
Other | 5.9% |
| Total | 100% |
| | |
| States and Territories | |
| (% of total municipal bonds) | |
Texas | 14.5% |
Illinois | 10.9% |
California | 9.1% |
Colorado | 6.7% |
Florida | 6.1% |
New York | 5.3% |
Ohio | 4.3% |
Pennsylvania | 3.1% |
New Jersey | 2.8% |
South Carolina | 2.7% |
Missouri | 2.6% |
Washington | 2.1% |
Arizona | 2.1% |
Louisiana | 2.0% |
Virginia | 1.9% |
Michigan | 1.7% |
Oregon | 1.3% |
Indiana | 1.2% |
Tennessee | 1.1% |
Other | 18.5% |
| Total | 100% |
14
| | |
| NEA | Nuveen AMT-Free Quality Municipal Income Fund Performance Overview and Holding Summaries as of April 30, 2020 |
Refer to the Glossary of Terms Used in this Report for further definition of the terms used within this section. | | |
| Average Annual Total Returns as of April 30, 2020 | | | | |
|
| Cumulative | Average Annual |
| 6-Month | 1-Year | 5-Year | 10-Year |
NEA at Common Share NAV | (5.29)% | 0.48% | 4.11% | 5.11% |
NEA at Common Share Price | (6.99)% | 1.44% | 3.63% | 4.46% |
S&P Municipal Bond Index | (1.26)% | 2.21% | 3.02% | 3.97% |
NEA Custom Blended Fund Performance Benchmark(1) | (2.10)% | 1.58% | 3.04% | 3.97% |
Past performance is not predictive of future results. Current performance may be higher or lower than the data shown. Returns do not reflect the deduction of taxes that shareholders may have to pay on Fund distributions or upon the sale of Fund shares. Returns at NAV are net of Fund expenses, and assume reinvestment of distributions. Comparative index return information is provided for the Fund’s shares at NAV only. Indexes are not available for direct investment.
(1) | The Blended Index consists of the returns of the S&P Municipal Bond Index prior to 9/12/16 and thereafter: 1) 80% of the return of the S&P Municipal Bond Investment Grade Index and 2) 20% of the return the S&P Municipal Bond High Yield Index. |
15
| NEA | Performance Overview and Holding Summaries as of |
| April 30, 2020 (continued) |
This data relates to the securities held in the Fund’s portfolio of investments as of the end of the reporting period. It should not be construed as a measure of performance for the Fund itself. Holdings are subject to change.
The ratings disclosed are the lowest rating given by one of the following national rating agencies: Standard & Poor’s Group, Moody’s Investors Service, Inc. or Fitch, Inc. Credit ratings are subject to change. AAA, AA, A and BBB are investment grade ratings; BB, B, CCC, CC, C and D are below-investment grade ratings. Holdings designated N/R are not rated by these national rating agencies.
| Fund Allocation | |
| (% of net assets) | |
Long-Term Municipal Bonds | 157.8% |
Short-Term Municipal Bonds | 0.9% |
Other Assets Less Liabilities | 3.2% |
| Net Assets Plus Floating Rate Obligations, | |
| AMTP Shares, net of deferred offering costs, |
| MFP Shares, net of deferred offering | |
| costs & VRDP Shares, net of deferred | |
| offering costs | 161.9% |
Floating Rate Obligations | (2.6)% |
AMTP Shares, net of deferred | |
| offering costs | (3.6)% |
MFP Shares, net of deferred | |
| offering costs | (23.8)% |
VRDP Shares, net of deferred | |
| offering costs | (31.9)% |
| Net Assets | 100% |
| Portfolio Credit Quality | |
| (% of total investment exposure) | |
U.S. Guaranteed | 11.8% |
AAA | 3.3% |
AA | 21.5% |
A | 35.5% |
BBB | 17.2% |
BB or Lower | 7.4% |
N/R (not rated) | 3.3% |
| Total | 100% |
| Portfolio Composition | |
| (% of total investments) | |
Health Care | 20.6% |
Transportation | 16.2% |
Tax Obligation/Limited | 15.1% |
U.S. Guaranteed | 13.0% |
Tax Obligation/General | 11.4% |
Education and Civic Organizations | 6.4% |
Water and Sewer | 5.8% |
Utilities | 5.2% |
Other | 6.3% |
| Total | 100% |
| States and Territories | |
| (% of total municipal bonds) | |
Illinois | 12.7% |
Texas | 7.8% |
California | 7.3% |
Colorado | 6.6% |
North Carolina | 5.9% |
New York | 5.0% |
Florida | 4.9% |
Ohio | 4.5% |
New Jersey | 3.7% |
Michigan | 3.4% |
Pennsylvania | 3.2% |
South Carolina | 2.4% |
Georgia | 2.3% |
Missouri | 2.3% |
Washington | 2.0% |
Indiana | 2.0% |
Wisconsin | 1.9% |
Louisiana | 1.8% |
Virginia | 1.8% |
Other | 18.5% |
| Total | 100% |
16
| | |
| NAD | Nuveen Quality Municipal Income Fund Portfolio of Investments April 30, 2020 (Unaudited) |
| | | | | | |
| Principal | | | Optional Call | | |
| Amount (000) | | Description (1) | Provisions (2) | Ratings (3) | Value |
| | LONG-TERM INVESTMENTS – 159.4% (99.1% of Total Investments) | | | |
| | MUNICIPAL BONDS – 159.4% (99.1% of Total Investments) | | | |
| | Alabama – 1.5% (1.0% of Total Investments) | | | |
| | Alabama State Port Authority, Docks Facilities Revenue Bonds, Refunding Series 2017A: | | | |
| $ 5,000 | | 5.000%, 10/01/33 – AGM Insured (AMT) | 10/27 at 100.00 | BBB+ | $ 5,807,900 |
| 5,455 | | 5.000%, 10/01/34 – AGM Insured (AMT) | 10/27 at 100.00 | BBB+ | 6,316,290 |
| 5,550 | | 5.000%, 10/01/35 – AGM Insured (AMT) | 10/27 at 100.00 | BBB+ | 6,401,315 |
| 20,000 | | Lower Alabama Gas District, Alabama, Gas Project Revenue Bonds, Series 2016A, | No Opt. Call | A3 | 24,965,800 |
| | 5.000%, 9/01/46 | | | |
| 4,165 | | Tuscaloosa County Industrial Development Authority, Florida, Gulf Opportunity Zone | 5/29 at 100.00 | N/R | 4,142,467 |
| | Bonds, Hunt Refining Project, Refunding Series 2019A, 5.250%, 5/01/44, 144A | | | |
| 40,170 | | Total Alabama | | | 47,633,772 |
| | Alaska – 0.7% (0.5% of Total Investments) | | | |
| | Alaska Industrial Development and Export Authority, Power Revenue Bonds, Snettisham | | | |
| | Hydroelectric Project, Refunding Series 2015: | | | |
| 1,580 | | 5.000%, 1/01/24 (AMT) | No Opt. Call | Baa2 | 1,714,031 |
| 3,400 | | 5.000%, 1/01/25 (AMT) | No Opt. Call | Baa2 | 3,742,346 |
| 1,000 | | 5.000%, 1/01/28 (AMT) | 7/25 at 100.00 | Baa2 | 1,096,680 |
| 1,075 | | 5.000%, 1/01/29 (AMT) | 7/25 at 100.00 | Baa2 | 1,173,363 |
| 300 | | 5.000%, 1/01/31 (AMT) | 7/25 at 100.00 | Baa2 | 323,634 |
| | Northern Tobacco Securitization Corporation, Alaska, Tobacco Settlement Asset-Backed | | | |
| | Bonds, Series 2006A: | | | |
| 195 | | 4.625%, 6/01/23 | 5/20 at 100.00 | A2 | 195,411 |
| 14,500 | | 5.000%, 6/01/32 | 5/20 at 100.00 | B3 | 14,530,595 |
| 22,050 | | Total Alaska | | | 22,776,060 |
| | Arizona – 3.3% (2.1% of Total Investments) | | | |
| 980 | | Apache County Industrial Development Authority, Arizona, Pollution Control Revenue | 3/22 at 100.00 | A– | 1,002,432 |
| | Bonds, Tucson Electric Power Company, Series 20102A, 4.500%, 3/01/30 | | | |
| 2,500 | | Arizona Health Facilities Authority, Revenue Bonds, Scottsdale Lincoln Hospitals | 12/24 at 100.00 | A2 | 2,680,225 |
| | Project, Refunding Series 2014A, 5.000%, 12/01/39 | | | |
| 2,000 | | Arizona Industrial Development Authority, Arizona, Education Revenue Bonds, Academies of | 1/28 at 100.00 | AA– | 2,210,880 |
| | Math & Science Projects, Series 2018A, 5.000%, 7/01/48 | | | |
| | Arizona Sports and Tourism Authority, Tax Revenue Bonds, Multipurpose Stadium Facility | | | |
| | Project, Refunding Senior Series 2012A: | | | |
| 1,490 | | 5.000%, 7/01/30 | 7/22 at 100.00 | A | 1,584,183 |
| 2,500 | | 5.000%, 7/01/32 | 7/22 at 100.00 | A | 2,653,650 |
| 2,335 | | 5.000%, 7/01/36 | 7/22 at 100.00 | A | 2,472,415 |
| 11,795 | | Maricopa County Industrial Development Authority, Arizona, Revenue Bonds, Banner Health, | 1/27 at 100.00 | AA– | 12,251,466 |
| | Refunding Series 2016A, 4.000%, 1/01/36 | | | |
| 9,740 | | Phoenix Civic Improvement Corporation, Arizona, Airport Revenue Bonds, Junior Lien | 7/20 at 100.00 | A+ (4) | 9,806,232 |
| | Series 2010A, 5.000%, 7/01/40 (Pre-refunded 7/01/20) | | | |
| 3,165 | | Phoenix Civic Improvement Corporation, Arizona, Airport Revenue Bonds, Junior Lien | 7/29 at 100.00 | A+ | 3,512,960 |
| | Series 2019B, 5.000%, 7/01/44 (AMT) | | | |
| 12,935 | | Phoenix Civic Improvement Corporation, Arizona, Airport Revenue Bonds, Senior Lien | 7/27 at 100.00 | AA– | 14,121,657 |
| | Series 2017A, 5.000%, 7/01/47 (AMT) | | | |
| 6,000 | | Phoenix Civic Improvement Corporation, Arizona, Airport Revenue Bonds, Senior Lien | 7/28 at 100.00 | AA– | 6,596,760 |
| | Series 2018, 5.000%, 7/01/48 (AMT) | | | |
| 7,000 | | Phoenix Civic Improvement Corporation, Arizona, Revenue Bonds, Civic Plaza Expansion | No Opt. Call | AA | 9,750,790 |
| | Project, Series 2005B, 5.500%, 7/01/39 – FGIC Insured | | | |
| 1,000 | | Pima County Industrial Development Authority, Arizona, Revenue Bonds, Tucson Electric | 10/20 at 100.00 | A– | 1,005,680 |
| | Power Company, Series 2010A, 5.250%, 10/01/40 | | | |
17
| | |
| NAD | Nuveen Quality Municipal Income Fund Portfolio of Investments (continued) April 30, 2020 (Unaudited) |
| | | | | | |
| Principal | | | Optional Call | | |
| Amount (000) | | Description (1) | Provisions (2) | Ratings (3) | Value |
| | Arizona (continued) | | | |
| $ 1,000 | | Pinal County Electrical District 4, Arizona, Electric System Revenue Bonds, Refunding | 12/25 at 100.00 | AA | $ 1,060,030 |
| | Series 2015, 4.000%, 12/01/38 – AGM Insured | | | |
| | Salt Verde Financial Corporation, Arizona, Senior Gas Revenue Bonds, Citigroup Energy | | | |
| | Inc Prepay Contract Obligations, Series 2007: | | | |
| 500 | | 5.500%, 12/01/29 | No Opt. Call | BBB+ | 614,005 |
| 24,765 | | 5.000%, 12/01/37 | No Opt. Call | BBB+ | 30,224,940 |
| 1,100 | | Student and Academic Services LLC, Arizona, Lease Revenue Bonds, Northern Arizona | 6/24 at 100.00 | A2 | 1,240,437 |
| | University Project, Series 2014, 5.000%, 6/01/34 – BAM Insured | | | |
| 90,805 | | Total Arizona | | | 102,788,742 |
| | Arkansas – 0.2% (0.1% of Total Investments) | | | |
| 4,000 | | Arkansas Development Finance Authority, Industrial Development Revenue Bonds, Big River | 9/26 at 103.00 | B | 3,510,040 |
| | Steel Project, Series 2019, 4.500%, 9/01/49 (AMT), 144A | | | |
| 2,055 | | Arkansas State University, Student Fee Revenue Bonds, Jonesboro Campus, Series 2013, | 12/23 at 100.00 | A1 | 2,236,189 |
| | 4.875%, 12/01/43 | | | |
| 6,055 | | Total Arkansas | | | 5,746,229 |
| | California – 14.7% (9.1% of Total Investments) | | | |
| | Alameda Corridor Transportation Authority, California, Revenue Bonds, Refunding | | | |
| | Subordinate Lien Series 2004A: | | | |
| 185 | | 0.000%, 10/01/20 – AMBAC Insured | No Opt. Call | Baa2 | 183,553 |
| 9,015 | | 0.000%, 10/01/20 – AMBAC Insured (ETM) | No Opt. Call | Aaa | 8,987,865 |
| 1,535 | | Alameda Corridor Transportation Authority, California, Revenue Bonds, Senior Lien Series | No Opt. Call | A– | 906,172 |
| | 1999A, 0.000%, 10/01/37 – NPFG Insured | | | |
| | Anaheim Public Financing Authority, California, Lease Revenue Bonds, Public Improvement | | | |
| | Project, Series 1997C: | | | |
| 2,945 | | 0.000%, 9/01/27 | No Opt. Call | A2 | 2,596,665 |
| 7,150 | | 0.000%, 9/01/28 – AGM Insured | No Opt. Call | A2 | 6,143,852 |
| 2,455 | | 0.000%, 9/01/32 – AGM Insured | No Opt. Call | A2 | 1,833,296 |
| 95 | | 0.000%, 9/01/35 – AGM Insured | No Opt. Call | AA | 63,307 |
| 105 | | 0.000%, 9/01/35 – AGM Insured (ETM) | No Opt. Call | AA (4) | 73,847 |
| | Bay Area Toll Authority, California, Revenue Bonds, San Francisco Bay Area Toll Bridge, | | | |
| | Series 2013S-4: | | | |
| 10,000 | | 5.000%, 4/01/38 (Pre-refunded 4/01/23) | 4/23 at 100.00 | A1 (4) | 11,223,400 |
| 3,500 | | 5.250%, 4/01/53 (Pre-refunded 4/01/23) | 4/23 at 100.00 | A1 (4) | 3,953,320 |
| 1,055 | | Brisbane School District, San Mateo County, California, General Obligation Bonds, | No Opt. Call | A2 | 692,565 |
| | Election 2003 Series 2005, 0.000%, 7/01/35 – AGM Insured | | | |
| | Byron Unified School District, Contra Costa County, California, General Obligation | | | |
| | Bonds, Series 2007B: | | | |
| 60 | | 0.000%, 8/01/32 (ETM) | No Opt. Call | A2 (4) | 46,292 |
| 1,640 | | 0.000%, 8/01/32 | No Opt. Call | A2 | 1,217,831 |
| | Calexico Unified School District, Imperial County, California, General Obligation Bonds, | | | |
| | Series 2005B: | | | |
| 3,685 | | 0.000%, 8/01/31 – FGIC Insured | No Opt. Call | A3 | 2,781,954 |
| 4,505 | | 0.000%, 8/01/33 – FGIC Insured | No Opt. Call | A3 | 3,137,057 |
| 2,750 | | California County Tobacco Securitization Agency, Tobacco Settlement Asset-Backed Bonds, | 6/20 at 100.00 | BB+ | 2,750,742 |
| | Sonoma County Tobacco Securitization Corporation, Series 2005, 5.000%, 6/01/26 | | | |
| 7,000 | | California Health Facilities Financing Authority, California, Revenue Bonds, Sutter | 11/26 at 100.00 | A+ | 7,656,670 |
| | Health, Refunding Series 2016B, 5.000%, 11/15/46 | | | |
| 22,520 | | California Health Facilities Financing Authority, California, Revenue Bonds, Sutter | 11/27 at 100.00 | A+ | 24,753,759 |
| | Health, Refunding Series 2017A, 5.000%, 11/15/48 | | | |
| 2,275 | | California Health Facilities Financing Authority, California, Revenue Bonds, Sutter | 11/27 at 100.00 | A+ | 2,374,577 |
| | Health, Series 2018A, 4.000%, 11/15/42 | | | |
| 710 | | California Health Facilities Financing Authority, Revenue Bonds, Saint Joseph Health | 7/23 at 100.00 | AA– | 766,481 |
| | System, Series 2013A, 5.000%, 7/01/37 | | | |
18
| | | | | | |
| Principal | | | Optional Call | | |
| Amount (000) | | Description (1) | Provisions (2) | Ratings (3) | Value |
| | California (continued) | | | |
| | California Health Facilities Financing Authority, Revenue Bonds, Stanford Hospitals and | | | |
| | Clinics, Tender Option Bond Trust 2016-XG0049: | | | |
| $ 790 | | 9.214%, 8/15/51, 144A (IF) (5) | 8/22 at 100.00 | AA– | $ 857,110 |
| 825 | | 9.222%, 8/15/51, 144A (IF) (5) | 8/22 at 100.00 | AA– | 895,150 |
| 2,140 | | 9.222%, 8/15/51, 144A (IF) (5) | 8/22 at 100.00 | AA– | 2,321,964 |
| 5,600 | | California Municipal Finance Authority, Revenue Bonds, Linxs APM Project, Senior Lien | 6/28 at 100.00 | BBB– | 5,841,640 |
| | Series 2018A, 5.000%, 12/31/43 (AMT) | | | |
| 3,250 | | California Municipal Finance Authority, Revenue Bonds, Community Medical Centers, Series | 2/27 at 100.00 | A– | 3,486,795 |
| | 2017A, 5.000%, 2/01/42 | | | |
| 815 | | California State Public Works Board, Lease Revenue Bonds, Various Capital Projects, | 11/23 at 100.00 | A+ | 891,145 |
| | Series 2013I, 5.000%, 11/01/38 | | | |
| | California State, General Obligation Bonds, Various Purpose Series 2010: | | | |
| 2,100 | | 5.250%, 3/01/30 | 6/20 at 100.00 | AA– | 2,106,426 |
| 4,250 | | 5.250%, 11/01/40 | 11/20 at 100.00 | AA– | 4,328,412 |
| 500 | | California Statewide Communities Development Authority, California, Revenue Bonds, Loma | 12/24 at 100.00 | BB– | 505,425 |
| | Linda University Medical Center, Series 2014A, 5.250%, 12/01/44 | | | |
| | California Statewide Communities Development Authority, California, Revenue Bonds, Loma | | | |
| | Linda University Medical Center, Series 2016A: | | | |
| 6,000 | | 5.000%, 12/01/46, 144A | 6/26 at 100.00 | BB– | 5,898,000 |
| 3,070 | | 5.250%, 12/01/56, 144A | 6/26 at 100.00 | BB– | 3,072,886 |
| 5,480 | | California Statewide Communities Development Authority, California, Revenue Bonds, Loma | 6/28 at 100.00 | BB– | 5,561,433 |
| | Linda University Medical Center, Series 2018A, 5.500%, 12/01/58, 144A | | | |
| | California Statewide Community Development Authority, Revenue Bonds, Daughters of | | | |
| | Charity Health System, Series 2005A: | | | |
| 2,640 | | 5.750%, 7/01/30 (6) | 6/20 at 100.00 | N/R | 2,220,821 |
| 7,230 | | 5.500%, 7/01/39 (6) | 6/20 at 100.00 | N/R | 6,082,021 |
| 4,890 | | Clovis Unified School District, Fresno County, California, General Obligation Bonds, | No Opt. Call | Baa2 | 4,356,110 |
| | Series 2006B, 0.000%, 8/01/26 – NPFG Insured | | | |
| 1,000 | | Coachella Valley Unified School District, Riverside County, California, General | No Opt. Call | A– | 790,230 |
| | Obligation Bonds, Series 2005A, 0.000%, 8/01/30 – FGIC Insured | | | |
| 5,045 | | Culver City Redevelopment Agency, California, Tax Allocation Revenue Bonds, Redevelopment | 11/21 at 61.42 | AA– (4) | 3,061,710 |
| | Project, Capital Appreciation Series 2011A, 0.000%, 11/01/27 (Pre-refunded 11/01/21) | | | |
| 1,260 | | Davis Redevelopment Agency, California, Tax Allocation Bonds, Davis Redevelopment | 12/21 at 100.00 | A+ (4) | 1,383,694 |
| | Project, Subordinate Series 2011A, 7.000%, 12/01/36 (Pre-refunded 12/01/21) | | | |
| 4,000 | | East Bay Municipal Utility District, Alameda and Contra Costa Counties, California, | 6/24 at 100.00 | Aa1 | 4,527,520 |
| | Water System Revenue Bonds, Series 2014C, 5.000%, 6/01/44 | | | |
| 3,010 | | El Camino Community College District, California, General Obligation Bonds, Election of | No Opt. Call | AA+ | 2,810,768 |
| | 2002 Series 2012C, 0.000%, 8/01/25 | | | |
| 3,500 | | Foothill/Eastern Transportation Corridor Agency, California, Toll Road Revenue Bonds, | No Opt. Call | BBB | 2,352,735 |
| | Refunding Senior Lien Series 2015A, 0.000%, 1/15/34 – AGM Insured | | | |
| | Foothill/Eastern Transportation Corridor Agency, California, Toll Road Revenue Bonds, | | | |
| | Refunding Series 2013A: | | | |
| 1,480 | | 5.750%, 1/15/46 | 1/24 at 100.00 | Baa2 | 1,593,442 |
| 6,480 | | 6.000%, 1/15/49 (Pre-refunded 1/15/24) | 1/24 at 100.00 | Baa2 (4) | 7,692,019 |
| 1,500 | | Gavilan Joint Community College District, Santa Clara and San Benito Counties, | 8/21 at 100.00 | AA (4) | 1,596,180 |
| | California, General Obligation Bonds, Election of 2004 Series 2011D, 5.750%, 8/01/35 | | | |
| | (Pre-refunded 8/01/21) | | | |
| 9,930 | | Golden State Tobacco Securitization Corporation, California, Enhanced Tobacco Settlement | 6/25 at 100.00 | A+ | 10,950,605 |
| | Asset-Backed Revenue Bonds, Refunding Series 2015A, 5.000%, 6/01/45 | | | |
| | Golden State Tobacco Securitization Corporation, California, Enhanced Tobacco Settlement | | | |
| | Asset-Backed Revenue Bonds, Series 2005A: | | | |
| 1,455 | | 0.000%, 6/01/24 – AMBAC Insured | No Opt. Call | A+ | 1,355,231 |
| 3,500 | | 0.000%, 6/01/26 – AGM Insured | No Opt. Call | Aa3 | 3,125,290 |
19
| | |
| NAD | Nuveen Quality Municipal Income Fund Portfolio of Investments (continued) April 30, 2020 (Unaudited) |
| | | | | | |
| Principal | | | Optional Call | | |
| Amount (000) | | Description (1) | Provisions (2) | Ratings (3) | Value |
| | California (continued) | | | |
| $ 3,000 | | Golden State Tobacco Securitization Corporation, California, Tobacco Settlement | 6/22 at 100.00 | N/R | $ 2,924,280 |
| | Asset-Backed Bonds, Series 2018A-1, 5.000%, 6/01/47 | | | |
| 5,945 | | Golden State Tobacco Securitization Corporation, California, Tobacco Settlement | 6/22 at 100.00 | N/R | 5,794,948 |
| | Asset-Backed Bonds, Series 2018A-2, 5.000%, 6/01/47 | | | |
| 2,500 | | Huntington Beach Union High School District, Orange County, California, General | No Opt. Call | AA– | 1,786,025 |
| | Obligation Bonds, Series 2007, 0.000%, 8/01/32 – FGIC Insured | | | |
| 5,000 | | Kern Community College District, California, General Obligation Bonds, Safety, Repair & | No Opt. Call | AA | 4,682,650 |
| | Improvement, Election 2002 Series 2006, 0.000%, 11/01/24 – AGM Insured | | | |
| 1,045 | | Lake Tahoe Unified School District, El Dorado County, California, General Obligation | No Opt. Call | A– | 811,129 |
| | Bonds, Series 2001B, 0.000%, 8/01/31 – NPFG Insured | | | |
| 90 | | Los Angeles Department of Airports, California, Revenue Bonds, Los Angeles International | 5/26 at 100.00 | AA– | 98,542 |
| | Airport, Subordinate Lien Series 2016A, 5.000%, 5/15/42 (AMT) | | | |
| | Los Angeles Department of Airports, California, Revenue Bonds, Los Angeles International | | | |
| | Airport, Subordinate Lien Series 2016B: | | | |
| 2,000 | | 5.000%, 5/15/41 (AMT) | 5/26 at 100.00 | AA– | 2,193,260 |
| 20,015 | | 5.000%, 5/15/46 (AMT) | 5/26 at 100.00 | AA– | 21,798,737 |
| 4,615 | | Los Angeles Department of Airports, California, Revenue Bonds, Los Angeles International | 5/28 at 100.00 | AA– | 5,141,156 |
| | Airport, Subordinate Lien Series 2018A, 5.000%, 5/15/44 (AMT) | | | |
| 2,665 | | Los Angeles Department of Water and Power, California, Power System Revenue Bonds, | 1/24 at 100.00 | AA– | 2,960,015 |
| | Series 2014B, 5.000%, 7/01/43 | | | |
| 15,000 | | Los Angeles Department of Water and Power, California, Waterworks Revenue Bonds, Series | 1/21 at 100.00 | Aa2 | 15,343,350 |
| | 2011A, 5.000%, 7/01/41 | | | |
| 250 | | Lynwood Redevelopment Agency, California, Tax Allocation Revenue Bonds, Project Area A, | 9/21 at 100.00 | A | 264,308 |
| | Subordinate Lien Series 2011A, 7.000%, 9/01/31 | | | |
| 6,215 | | Martinez Unified School District, Contra Costa County, California, General Obligation | 8/24 at 100.00 | AA | 7,316,857 |
| | Bonds, Series 2011, 5.875%, 8/01/31 | | | |
| 5,955 | | Mount San Antonio Community College District, Los Angeles County, California, General | 8/35 at 100.00 | AA | 5,840,604 |
| | Obligation Bonds, Election of 2008, Series 2013A, 0.000%, 8/01/43 (7) | | | |
| 2,700 | | M-S-R Energy Authority, California, Gas Revenue Bonds, Citigroup Prepay Contracts, | No Opt. Call | BBB+ | 3,807,000 |
| | Series 2009A, 7.000%, 11/01/34 | | | |
| 2,200 | | M-S-R Energy Authority, California, Gas Revenue Bonds, Citigroup Prepay Contracts, | No Opt. Call | BBB+ | 3,155,416 |
| | Series 2009C, 6.500%, 11/01/39 | | | |
| 170 | | Natomas Union School District, Sacramento County, California, General Obligation | No Opt. Call | Baa2 | 176,513 |
| | Refunding Bonds, Series 1999, 5.950%, 9/01/21 – NPFG Insured | | | |
| 12,230 | | Ontario Redevelopment Financing Authority, San Bernardino County, California, Revenue | No Opt. Call | Baa2 | 13,630,702 |
| | Bonds, Redevelopment Project 1, Refunding Series 1995, 7.400%, 8/01/25 – NPFG Insured | | | |
| 605 | | Palomar Pomerado Health Care District, California, Certificates of Participation, Series | 11/20 at 100.00 | Ba1 (4) | 618,153 |
| | 2010, 5.250%, 11/01/21 (Pre-refunded 11/01/20) | | | |
| 13,145 | | Perris, California, GNMA Mortgage-Backed Securities Program Single Family Mortgage | No Opt. Call | AA+ (4) | 16,062,664 |
| | Revenue Bonds, Series 1988B, 8.200%, 9/01/23 (ETM) | | | |
| 2,500 | | Petaluma, Sonoma County, California, Wastewater Revenue Bonds, Refunding Series 2011, | 5/21 at 100.00 | AA+ (4) | 2,611,750 |
| | 5.500%, 5/01/32 (Pre-refunded 5/01/21) | | | |
| 6,000 | | Placentia-Yorba Linda Unified School District, Orange County, California, Certificates | No Opt. Call | A2 (4) | 4,340,340 |
| | of Participation, Series 2006, 0.000%, 10/01/34 – FGIC Insured (ETM) | | | |
| 5,505 | | Pomona, California, GNMA/FNMA Collateralized Securities Program Single Family Mortgage | No Opt. Call | AA+ (4) | 6,015,754 |
| | Revenue Bonds, Series 1990A, 7.600%, 5/01/23 (ETM) | | | |
| 2,000 | | Poway Unified School District, San Diego County, California, General Obligation Bonds, | No Opt. Call | AA– | 1,042,660 |
| | School Facilities Improvement District 2007-1, Series 2011A, 0.000%, 8/01/41 | | | |
| 5,000 | | Rialto Unified School District, San Bernardino County, California, General Obligation | 8/36 at 100.00 | Aa3 | 5,805,150 |
| | Bonds, Series 2011A, 0.000%, 8/01/41 – AGM Insured (7) | | | |
| 5,000 | | Riverside County Asset Leasing Corporation, California, Leasehold Revenue Bonds, | No Opt. Call | A1 | 4,639,450 |
| | Riverside County Hospital Project, Series 1997, 0.000%, 6/01/25 – NPFG Insured | | | |
20
| | | | | | |
| Principal | | | Optional Call | | |
| Amount (000) | | Description (1) | Provisions (2) | Ratings (3) | Value |
| | California (continued) | | | |
| $ 4,615 | | Riverside County Redevelopment Agency, California, Tax Allocation Bonds, Jurupa Valley | No Opt. Call | A | $ 2,633,088 |
| | Project Area, Series 2011B, 0.000%, 10/01/38 | | | |
| 330 | | Riverside County Transportation Commission, California, Toll Revenue Senior Lien Bonds, | 6/23 at 100.00 | BBB+ | 348,401 |
| | Series 2013A, 5.750%, 6/01/48 | | | |
| 14,900 | | San Francisco Airports Commission, California, Revenue Bonds, San Francisco | 5/26 at 100.00 | A+ | 16,221,034 |
| | International Airport, Second Series 2016B, 5.000%, 5/01/46 (AMT) | | | |
| | San Francisco Airports Commission, California, Revenue Bonds, San Francisco | | | |
| | International Airport, Second Series 2018D: | | | |
| 11,615 | | 5.000%, 5/01/43 (AMT) | 5/28 at 100.00 | A+ | 13,008,916 |
| 12,285 | | 5.000%, 5/01/48 (AMT) | 5/28 at 100.00 | A+ | 13,669,519 |
| 11,025 | | San Francisco Airports Commission, California, Revenue Bonds, San Francisco | 5/29 at 100.00 | A+ | 12,372,365 |
| | International Airport, Second Series 2019A, 5.000%, 5/01/49 (AMT) | | | |
| 2,000 | | San Francisco, California, Community Facilities District 6, Mission Bay South Public | 8/22 at 29.31 | N/R | 542,840 |
| | Improvements, Special Tax Refunding Bonds, Series 2013C, 0.000%, 8/01/43 | | | |
| 2,000 | | San Joaquin Hills Transportation Corridor Agency, Orange County, California, Toll Road | 1/25 at 100.00 | BBB– | 2,107,720 |
| | Revenue Bonds, Refunding Junior Lien Series 2014B, 5.250%, 1/15/44 | | | |
| | San Joaquin Hills Transportation Corridor Agency, Orange County, California, Toll Road | | | |
| | Revenue Bonds, Refunding Senior Lien Series 2014A: | | | |
| 15,350 | | 5.000%, 1/15/44 | 1/25 at 100.00 | BBB | 16,249,817 |
| 25,840 | | 5.000%, 1/15/50 | 1/25 at 100.00 | BBB | 27,263,526 |
| | San Jose, California, Airport Revenue Bonds, Refunding Series 2017A: | | | |
| 5,000 | | 5.000%, 3/01/41 (AMT) | 3/27 at 100.00 | A | 5,491,200 |
| 5,000 | | 5.000%, 3/01/47 (AMT) | 3/27 at 100.00 | A | 5,441,100 |
| 6,660 | | San Ysidro School District, San Diego County, California, General Obligation Bonds, | 8/25 at 38.93 | A2 | 2,298,699 |
| | Refunding Series 2015, 0.000%, 8/01/43 | | | |
| 880 | | Santee Community Development Commission, California, Santee Redevelopment Project Tax | 2/21 at 100.00 | A (4) | 920,788 |
| | Allocation Bonds, Series 2011A, 7.000%, 8/01/31 (Pre-refunded 2/01/21) | | | |
| 2,460 | | Santee School District, San Diego County, California, General Obligation Bonds, Capital | No Opt. Call | AA | 1,769,921 |
| | Appreciation, Election 2006, Series 2008D, 0.000%, 8/01/33 – AGC Insured | | | |
| 5,000 | | Solano Community College District, Solano and Yolo Counties, California, General | 8/23 at 100.00 | AA (4) | 5,680,950 |
| | Obligation Bonds, Election 2012 Series 2013A, 5.000%, 8/01/43 (Pre-refunded 8/01/23) | | | |
| 1,145 | | Southern Kern Unified School District, Kern County, California, General Obligation | No Opt. Call | A2 | 915,691 |
| | Bonds, Series 2006C, 0.000%, 11/01/30 – AGM Insured | | | |
| 1,175 | | Southern Kern Unified School District, Kern County, California, General Obligation | No Opt. Call | A2 | 785,535 |
| | Bonds, Series 2010B, 0.000%, 11/01/35 – AGM Insured | | | |
| | Union City Community Redevelopment Agency, California, Tax Allocation Revenue Bonds, | | | |
| | Redevelopment Project, Subordinate Lien Series 2011: | | | |
| 1,000 | | 6.375%, 12/01/23 (Pre-refunded 12/01/21) | 12/21 at 100.00 | A+ (4) | 1,089,560 |
| 1,000 | | 6.500%, 12/01/24 (Pre-refunded 12/01/21) | 12/21 at 100.00 | A+ (4) | 1,091,020 |
| 1,000 | | 6.625%, 12/01/25 (Pre-refunded 12/01/21) | 12/21 at 100.00 | A+ (4) | 1,092,970 |
| 1,325 | | 6.750%, 12/01/26 (Pre-refunded 12/01/21) | 12/21 at 100.00 | A+ (4) | 1,450,769 |
| 2,410 | | Victor Elementary School District, San Bernardino County, California, General Obligation | No Opt. Call | A+ | 2,173,603 |
| | Bonds, Series 2002A, 0.000%, 8/01/26 – FGIC Insured | | | |
| 2,000 | | West Contra Costa Unified School District, Contra Costa County, California, General | 8/21 at 100.00 | A+ (4) | 2,109,700 |
| | Obligation Bonds, Election 2010 Series 2011A, 5.000%, 8/01/41 (Pre-refunded 8/01/21) | | | |
| 3,750 | | Wiseburn School District, Los Angeles County, California, General Obligation Bonds, | 8/31 at 100.00 | AA | 3,871,200 |
| | Series 2011B, 0.000%, 8/01/36 – AGM Insured (7) | | | |
| 4,000 | | Yuba Community College District, California, General Obligation Bonds, Election 2006 | 8/21 at 100.00 | Aa2 (4) | 4,231,760 |
| | Series 2011C, 5.250%, 8/01/47 (Pre-refunded 8/01/21) | | | |
| 450,040 | | Total California | | | 455,501,072 |
21
| | |
| NAD | Nuveen Quality Municipal Income Fund Portfolio of Investments (continued) April 30, 2020 (Unaudited) |
| | | | | | |
| Principal | | | Optional Call | | |
| Amount (000) | | Description (1) | Provisions (2) | Ratings (3) | Value |
| | Colorado – 10.8% (6.7% of Total Investments) | | | |
| $ 3,000 | | Anthem West Metropolitan District, Colorado, General Obligation Bonds, Refunding Series | 12/25 at 100.00 | A3 | $ 3,485,910 |
| | 2015, 5.000%, 12/01/35 – BAM Insured | | | |
| 4,195 | | Boulder Larimer & Weld Counties School District RE-1J Saint Vrain Valley, Colorado, | 12/26 at 100.00 | Aa2 | 4,632,245 |
| | General Obligation Bonds, Series 2016C, 4.000%, 12/15/34 | | | |
| 10,000 | | Boulder Valley School District RE2, Boulder County, Colorado, General Obligation Bonds, | 6/29 at 100.00 | AA+ | 11,030,200 |
| | Series 2019A, 4.000%, 12/01/48 | | | |
| 4,000 | | Centennial Water and Sanitation District, Douglas County, Colorado, Water and Wastewater | 12/28 at 100.00 | AA+ | 4,828,600 |
| | Revenue Bonds, Series 2019, 5.000%, 12/01/43 | | | |
| 1,775 | | Centerra Metropolitan District 1, Loveland, Colorado, Special Revenue Bonds, Refunding & | 12/22 at 103.00 | N/R | 1,736,216 |
| | Improvement Series 2017, 5.000%, 12/01/29, 144A | | | |
| 2,945 | | Colorado Educational and Cultural Facilities Authority, Charter School Revenue Bonds, | 8/23 at 100.00 | BB+ | 3,154,890 |
| | Community Leadership Academy, Inc Second Campus Project, Series 2013, 7.350%, 8/01/43 | | | |
| 1,715 | | Colorado Educational and Cultural Facilities Authority, Charter School Revenue Bonds, | 8/26 at 100.00 | A+ | 1,629,799 |
| | Flagstaff Academy Project, Refunding Series 2016, 3.625%, 8/01/46 | | | |
| 500 | | Colorado Educational and Cultural Facilities Authority, Charter School Revenue Bonds, | 1/24 at 100.00 | A+ | 526,020 |
| | Liberty Common Charter School, Series 2014A, 5.000%, 1/15/44 | | | |
| 1,000 | | Colorado Educational and Cultural Facilities Authority, Charter School Revenue Bonds, | 8/24 at 100.00 | A+ | 1,099,780 |
| | Peak-to-Peak Charter School, Refunding Series 2014, 5.000%, 8/15/30 | | | |
| 3,915 | | Colorado Educational and Cultural Facilities Authority, Charter School Revenue Bonds, | 6/26 at 100.00 | A+ | 3,514,965 |
| | Weld County School District 6 – Frontier Academy, Refunding & Improvement Series 2016, | | | |
| | 3.250%, 6/01/46 | | | |
| 1,250 | | Colorado Educational and Cultural Facilities Authority, Revenue Bonds, University | No Opt. Call | A+ | 1,344,688 |
| | Corporation for Atmospheric Research Project, Refunding Series 2012A, 4.500%, 9/01/22 | | | |
| 545 | | Colorado Educational and Cultural Facilities Authority, Revenue Bonds, University | 9/27 at 100.00 | A2 | 562,336 |
| | Corporation for Atmospheric Research Project, Refunding Series 2017, 3.625%, 9/01/31 | | | |
| | Colorado Educational and Cultural Facilities Authority, Revenue Bonds, University of | | | |
| | Denver, Series 2017A: | | | |
| 1,200 | | 4.000%, 3/01/36 | 3/27 at 100.00 | A1 | 1,297,668 |
| 1,600 | | 4.000%, 3/01/37 | 3/27 at 100.00 | A1 | 1,725,168 |
| 2,300 | | Colorado Health Facilities Authority, Colorado, Revenue Bonds, Catholic Health | 2/21 at 100.00 | BBB+ (4) | 2,372,657 |
| | Initiatives, Series 2011A, 5.000%, 2/01/41 (Pre-refunded 2/01/21) | | | |
| | Colorado Health Facilities Authority, Colorado, Revenue Bonds, Catholic Health | | | |
| | Initiatives, Series 2013A: | | | |
| 3,020 | | 5.250%, 1/01/40 (Pre-refunded 1/01/23) | 1/23 at 100.00 | BBB+ (4) | 3,353,317 |
| 4,890 | | 5.250%, 1/01/45 (Pre-refunded 1/01/23) | 1/23 at 100.00 | BBB+ (4) | 5,429,709 |
| 4,600 | | Colorado Health Facilities Authority, Colorado, Revenue Bonds, Christian Living | 1/24 at 102.00 | N/R | 4,155,272 |
| | Neighborhoods Project, Refunding Series 2016, 5.000%, 1/01/37 | | | |
| 8,500 | | Colorado Health Facilities Authority, Colorado, Revenue Bonds, CommonSpirit Health, | 8/29 at 100.00 | BBB+ | 8,117,670 |
| | Series 2019A-2, 4.000%, 8/01/49 | | | |
| 270 | | Colorado Health Facilities Authority, Colorado, Revenue Bonds, Evangelical Lutheran Good | 6/23 at 100.00 | N/R (4) | 309,668 |
| | Samaritan Society Project, Series 2013, 5.625%, 6/01/43 (Pre-refunded 6/01/23) | | | |
| | Colorado Health Facilities Authority, Colorado, Revenue Bonds, Evangelical Lutheran Good | | | |
| | Samaritan Society Project, Series 2013A: | | | |
| 2,670 | | 5.000%, 6/01/28 (Pre-refunded 6/01/25) | 6/25 at 100.00 | N/R (4) | 3,195,723 |
| 6,425 | | 5.000%, 6/01/40 (Pre-refunded 6/01/25) | 6/25 at 100.00 | N/R (4) | 7,690,082 |
| 665 | | Colorado Health Facilities Authority, Colorado, Revenue Bonds, Frasier Meadows Project, | 5/27 at 100.00 | BB+ | 593,798 |
| | Refunding & Improvement Series 2017A, 5.250%, 5/15/47 | | | |
| 5,000 | | Colorado Health Facilities Authority, Colorado, Revenue Bonds, Sanford Health, Series | 11/29 at 100.00 | A+ | 5,495,750 |
| | 2019A, 5.000%, 11/01/44 | | | |
| 3,300 | | Colorado Health Facilities Authority, Colorado, Revenue Bonds, SCL Health System, | 1/30 at 100.00 | AA– | 3,461,370 |
| | Refunding Series 2019A, 4.000%, 1/01/38 | | | |
| 2,620 | | Colorado Health Facilities Authority, Colorado, Revenue Bonds, SCL Health System, | 1/30 at 100.00 | AA– | 2,713,115 |
| | Refunding Series 2019B, 4.000%, 1/01/40 | | | |
22
| | | | | | |
| Principal | | | Optional Call | | |
| Amount (000) | | Description (1) | Provisions (2) | Ratings (3) | Value |
| | Colorado (continued) | | | |
| $ 625 | | Colorado Health Facilities Authority, Colorado, Revenue Bonds, Total Longterm Care | 11/20 at 100.00 | N/R (4) | $ 641,900 |
| | National Obligated Group Project, Series 2010A, 6.000%, 11/15/30 (Pre-refunded 11/15/20) | | | |
| 1,100 | | Colorado High Performance Transportation Enterprise, C-470 Express Lanes Revenue Bonds, | 12/24 at 100.00 | BBB | 1,021,746 |
| | Senior Lien Series 2017, 5.000%, 12/31/56 | | | |
| | Colorado Mesa University, Colorado, Enterprise Revenue Bonds, Series 2012B: | | | |
| 750 | | 4.250%, 5/15/37 (Pre-refunded 5/15/21) | 5/21 at 100.00 | N/R (4) | 776,738 |
| 1,250 | | 4.250%, 5/15/37 | 5/21 at 100.00 | Aa2 | 1,284,713 |
| | Colorado State Board of Governors, Colorado State University Auxiliary Enterprise System | | | |
| | Revenue Bonds, Refunding Series 2017C: | | | |
| 1,115 | | 5.000%, 3/01/43 (Pre-refunded 3/01/28) | 3/28 at 100.00 | N/R (4) | 1,438,227 |
| 1,660 | | 5.000%, 3/01/43 | 3/28 at 100.00 | AA | 1,973,225 |
| 2,360 | | Colorado State Board of Governors, Colorado State University Auxiliary Enterprise System | 3/28 at 100.00 | AA | 2,577,474 |
| | Revenue Bonds, Refunding Series 2017E, 4.000%, 3/01/43 | | | |
| 3,000 | | Commerce City, Colorado, Sales and Use Tax Revenue Bonds, Series 2014, 5.000%, 8/01/44 – | 8/24 at 100.00 | A1 | 3,362,790 |
| | AGM Insured | | | |
| 7,250 | | Commerce City, Colorado, Sales and Use Tax Revenue Bonds, Series 2016, 5.000%, 8/01/46 | 8/26 at 100.00 | A1 | 8,436,390 |
| 2,000 | | Denver City and County, Colorado, Airport System Revenue Bonds, Series 2012B, | 11/22 at 100.00 | A+ | 2,133,780 |
| | 5.000%, 11/15/32 | | | |
| 1,100 | | Denver City and County, Colorado, Airport System Revenue Bonds, Subordinate Lien Series | 11/23 at 100.00 | A | 1,183,457 |
| | 2013A, 5.250%, 11/15/43 (AMT) | | | |
| 4,515 | | Denver City and County, Colorado, Airport System Revenue Bonds, Subordinate Lien Series | 11/23 at 100.00 | A | 4,864,326 |
| | 2013B, 5.000%, 11/15/43 | | | |
| | Denver City and County, Colorado, Airport System Revenue Bonds, Subordinate Lien | | | |
| | Series 2018A: | | | |
| 20,460 | | 5.000%, 12/01/43 (AMT) | 12/28 at 100.00 | A | 23,248,903 |
| 30,435 | | 5.000%, 12/01/48 (AMT) | 12/28 at 100.00 | A | 34,364,463 |
| 1,820 | | Denver City and County, Colorado, Dedicated Tax Revenue Bonds, Refunding & Improvement | 8/26 at 100.00 | AA– | 1,836,962 |
| | Series 2016A, 4.000%, 8/01/46 | | | |
| 2,005 | | Denver City and County, Colorado, Special Facilities Airport Revenue Bonds, United | 10/23 at 100.00 | BB– | 1,979,577 |
| | Airlines, Inc Project, Refunding Series 2017, 5.000%, 10/01/32 (AMT) | | | |
| | Denver Convention Center Hotel Authority, Colorado, Revenue Bonds, Convention Center | | | |
| | Hotel, Refunding Senior Lien Series 2016: | | | |
| 2,955 | | 5.000%, 12/01/28 | 12/26 at 100.00 | BBB– | 3,016,139 |
| 2,000 | | 5.000%, 12/01/29 | 12/26 at 100.00 | BBB– | 2,031,040 |
| 2,635 | | 5.000%, 12/01/35 | 12/26 at 100.00 | BBB– | 2,647,911 |
| 1,605 | | 5.000%, 12/01/40 | 12/26 at 100.00 | BBB– | 1,613,426 |
| | E-470 Public Highway Authority, Colorado, Senior Revenue Bonds, Capital Appreciation | | | |
| | Series 2010A: | | | |
| 385 | | 0.000%, 9/01/35 | No Opt. Call | A | 223,273 |
| 150 | | 0.000%, 9/01/37 | No Opt. Call | A | 79,478 |
| 75 | | 0.000%, 9/01/38 | No Opt. Call | A | 37,980 |
| 20 | | 0.000%, 9/01/39 | No Opt. Call | A | 9,695 |
| 110 | | 0.000%, 9/01/41 | No Opt. Call | A | 48,837 |
| | E-470 Public Highway Authority, Colorado, Senior Revenue Bonds, Series 1997B: | | | |
| 1,420 | | 0.000%, 9/01/23 – NPFG Insured | No Opt. Call | A | 1,307,493 |
| 18,380 | | 0.000%, 9/01/25 – NPFG Insured | No Opt. Call | A | 15,909,177 |
| | E-470 Public Highway Authority, Colorado, Senior Revenue Bonds, Series 2000B: | | | |
| 1,045 | | 0.000%, 9/01/29 – NPFG Insured | No Opt. Call | A | 782,883 |
| 2,175 | | 0.000%, 9/01/30 – NPFG Insured | No Opt. Call | A | 1,564,934 |
| 25,050 | | 0.000%, 9/01/31 – NPFG Insured | No Opt. Call | A | 17,291,013 |
| 23,305 | | 0.000%, 9/01/32 – NPFG Insured | No Opt. Call | A | 15,369,181 |
| 100 | | 0.000%, 9/01/33 – NPFG Insured | No Opt. Call | A | 63,206 |
| 12,500 | | E-470 Public Highway Authority, Colorado, Senior Revenue Bonds, Series 2006A, 0.000%, | 9/26 at 54.77 | A | 5,461,125 |
| | 9/01/38 – NPFG Insured | | | |
23
| | |
| NAD | Nuveen Quality Municipal Income Fund Portfolio of Investments (continued) April 30, 2020 (Unaudited) |
| | | | | | |
| Principal | | | Optional Call | | |
| Amount (000) | | Description (1) | Provisions (2) | Ratings (3) | Value |
| | Colorado (continued) | | | |
| | E-470 Public Highway Authority, Colorado, Toll Revenue Bonds, Series 2004A: | | | |
| $ 385 | | 0.000%, 9/01/28 – NPFG Insured | No Opt. Call | A | $ 299,730 |
| 60,000 | | 0.000%, 3/01/36 – NPFG Insured | No Opt. Call | A | 33,972,600 |
| | E-470 Public Highway Authority, Colorado, Toll Revenue Bonds, Series 2004B: | | | |
| 345 | | 0.000%, 9/01/28 – NPFG Insured | 9/20 at 63.99 | A | 218,768 |
| 13,000 | | 0.000%, 9/01/34 – NPFG Insured | 9/20 at 45.40 | A | 5,840,510 |
| 14,500 | | 0.000%, 3/01/36 – NPFG Insured | 9/20 at 41.72 | A | 5,984,150 |
| 340 | | Eagle County Air Terminal Corporation, Colorado, Airport Terminal Project Revenue Bonds, | 5/21 at 100.00 | Baa2 | 339,633 |
| | Refunding Series 2011A, 5.500%, 5/01/22 (AMT) | | | |
| 4,000 | | Ebert Metropolitan District, Denver Colorado, Limited Tax General Obligation Bonds, | 12/28 at 100.00 | A2 | 4,777,120 |
| | Refunding Series 2018A-1, 5.000%, 12/01/43 – BAM Insured | | | |
| 1,860 | | Metropolitan State University of Denver, Colorado, Institutional Enterprise Revenue | 12/25 at 100.00 | Aa2 | 2,006,847 |
| | Bonds, Aerospace and Engineering Sciences Building Project, Series 2016, 4.000%, 12/01/40 | | | |
| | Park 70 Metropolitan District, Aurora, Colorado, General Obligation Bonds, Limited Tax | | | |
| | Refunding & Improvement Series 2016: | | | |
| 1,565 | | 5.000%, 12/01/36 | 12/26 at 100.00 | Baa3 | 1,686,194 |
| 2,100 | | 5.000%, 12/01/46 | 12/26 at 100.00 | Baa3 | 2,246,916 |
| 6,705 | | Park Creek Metropolitan District, Colorado, Senior Limited Property Tax Supported | 12/25 at 100.00 | A | 7,560,223 |
| | Revenue Bonds, Refunding Series 2015A, 5.000%, 12/01/45 | | | |
| 2,395 | | Park Creek Metropolitan District, Colorado, Senior Limited Property Tax Supported | 12/29 at 100.00 | A | 2,704,961 |
| | Revenue Bonds, Series 2019A, 4.000%, 12/01/36 – AGM Insured | | | |
| 5,715 | | Park Creek Metropolitan District, Colorado, Senior Limited Property Tax Supported | 12/20 at 100.00 | A2 (4) | 5,891,536 |
| | Revenue Refunding Bonds, Series 2011, 6.125%, 12/01/41 (Pre-refunded 12/01/20) – AGM Insured | | | |
| 700 | | Public Authority for Colorado Energy, Natural Gas Purchase Revenue Bonds, Colorado | No Opt. Call | A– | 988,519 |
| | Springs Utilities, Series 2008, 6.500%, 11/15/38 | | | |
| | Regional Transportation District, Colorado, Denver Transit Partners Eagle P3 Project | | | |
| | Private Activity Bonds, Series 2010: | | | |
| 2,500 | | 6.500%, 1/15/30 | 7/20 at 100.00 | Baa3 | 2,509,400 |
| 3,115 | | 6.000%, 1/15/34 | 7/20 at 100.00 | Baa3 | 3,123,691 |
| 2,615 | | 6.000%, 1/15/41 | 7/20 at 100.00 | Baa3 | 2,622,296 |
| 1,500 | | Sierra Ridge Metropolitan District 2, Douglas County, Colorado, General Obligation | 12/21 at 103.00 | N/R | 1,404,075 |
| | Bonds, Limited Tax Series 2016A, 5.500%, 12/01/46 | | | |
| 750 | | Thompson Crossing Metropolitan District 2, Johnstown, Larimer County, Colorado, General | 12/26 at 100.00 | AA | 883,050 |
| | Obligation Bonds, Limited Tax Convertible to Unlimited Tax, Series 2016B, 5.000%, | | | |
| | 12/01/36 – AGM Insured | | | |
| | Traditions Metropolitan District 2, Colorado, Limited Tax General Obligation Bonds, | | | |
| | Refunding Series 2016: | | | |
| 1,050 | | 5.000%, 12/01/32 – BAM Insured | 12/26 at 100.00 | Baa2 | 1,238,391 |
| 1,000 | | 4.125%, 12/01/37 – BAM Insured | 12/26 at 100.00 | Baa2 | 1,088,590 |
| 2,000 | | Vista Ridge Metropolitan District, In the Town of Erie, Weld County, Colorado, General | 12/26 at 100.00 | Baa1 | 2,166,500 |
| | Obligation Refunding Bonds, Series 2016A, 4.000%, 12/01/36 – BAM Insured | | | |
| 385,395 | | Total Colorado | | | 335,591,778 |
| | Connecticut – 1.3% (0.8% of Total Investments) | | | |
| 3,430 | | Connecticut Health and Educational Facilities Authority, Revenue Bonds, Sacred Heart | 7/22 at 100.00 | A2 (4) | 3,747,687 |
| | University, Series 2012H, 5.000%, 7/01/24 (Pre-refunded 7/01/22) – AGM Insured | | | |
| | Connecticut Municipal Electric Energy Cooperative, Power Supply System Revenue Bonds, | | | |
| | Tender Option Bond Trust 2016-XG0059: | | | |
| 1,295 | | 16.675%, 1/01/32, 144A (IF) (5) | 1/23 at 100.00 | Aa3 | 1,770,550 |
| 190 | | 16.522%, 1/01/38, 144A (IF) (5) | 1/23 at 100.00 | Aa3 | 251,932 |
| | Connecticut State, Special Tax Obligation Bonds, Transportation Infrastructure Purposes | | | |
| | Series 2018A: | | | |
| 14,775 | | 5.000%, 1/01/34 | 1/28 at 100.00 | A+ | 16,936,139 |
| 6,410 | | 5.000%, 1/01/37 | 1/28 at 100.00 | A+ | 7,268,299 |
| 6,000 | | 5.000%, 1/01/38 | 1/28 at 100.00 | A+ | 6,784,140 |
24
| | | | | | |
| Principal | | | Optional Call | | |
| Amount (000) | | Description (1) | Provisions (2) | Ratings (3) | Value |
| | Connecticut (continued) | | | |
| $ 3,565 | | Hartford County Metropolitan District, Connecticut, Clean Water Project Revenue Bonds, | 4/22 at 100.00 | AA– | $ 3,635,801 |
| | Series 2013A, 4.000%, 4/01/39 | | | |
| 5,051 | | Mashantucket Western Pequot Tribe, Connecticut, Special Revenue Bonds, Subordinate | No Opt. Call | N/R | 328,299 |
| | Series 2013A, 0.230%, 7/01/31 (cash 4.000%, PIK 2.050%) (8) | | | |
| 40,716 | | Total Connecticut | | | 40,722,847 |
| | Delaware – 0.3% (0.2% of Total Investments) | | | |
| 800 | | Delaware Health Facilities Authority, Revenue Bonds, Beebe Medical Center Project, | 12/28 at 100.00 | BBB | 857,520 |
| | Series 2018, 5.000%, 6/01/48 | | | |
| 7,255 | | Delaware Transportation Authority, Revenue Bonds, US 301 Project, Series 2015, | 6/25 at 100.00 | AA– | 8,055,734 |
| | 5.000%, 6/01/55 | | | |
| 8,055 | | Total Delaware | | | 8,913,254 |
| | District of Columbia – 1.7% (1.0% of Total Investments) | | | |
| 815 | | District of Columbia Housing Finance Agency, GNMA Collateralized Single Family Mortgage | 6/20 at 100.00 | AA+ | 817,632 |
| | Revenue Bonds, Series 1988E-4, 6.375%, 6/01/26 (AMT) | | | |
| 3,580 | | District of Columbia Tobacco Settlement Corporation, Tobacco Settlement Asset-Backed | No Opt. Call | Baa1 | 3,697,603 |
| | Bonds, Series 2001, 6.500%, 5/15/33 | | | |
| 21,000 | | District of Columbia Tobacco Settlement Corporation, Tobacco Settlement Asset-Backed | 6/20 at 20.14 | N/R | 3,524,850 |
| | Bonds, Series 2006A, 0.000%, 6/15/46 | | | |
| 19,490 | | District of Columbia Water and Sewer Authority, Public Utility Revenue Bonds, Series | No Opt. Call | Aa1 | 21,195,180 |
| | 1998, 5.500%, 10/01/23 – AGM Insured (UB) | | | |
| 9,505 | | District of Columbia, General Obligation Bonds, Series 1998B, 6.000%, 6/01/20 – NPFG Insured | No Opt. Call | AA+ | 9,542,735 |
| | Metropolitan Washington Airports Authority, Virginia, Dulles Toll Road Revenue Bonds, | | | |
| | Dulles Metrorail & Capital improvement Projects, Refunding & Subordinate Lien Series 2019B: | | | |
| 11,000 | | 4.000%, 10/01/49 | 10/29 at 100.00 | Baa2 | 10,655,480 |
| 1,810 | | 4.000%, 10/01/53 – AGM Insured | 10/29 at 100.00 | A2 | 1,826,200 |
| 67,200 | | Total District of Columbia | | | 51,259,680 |
| | Florida – 9.8% (6.1% of Total Investments) | | | |
| 1,480 | | Atlantic Beach, Florida, Healthcare Facilities Revenue Refunding Bonds, Fleet Landing | 11/23 at 100.00 | BBB | 1,447,854 |
| | Project, Series 2013A, 5.000%, 11/15/37 | | | |
| | Bay County, Florida, Educational Facilities Revenue Refunding Bonds, Bay Haven Charter | | | |
| | Academy, Inc Project, Series 2013A: | | | |
| 450 | | 5.000%, 9/01/45 | 9/23 at 100.00 | BBB | 461,101 |
| 2,260 | | 5.000%, 9/01/48 | 9/23 at 100.00 | BBB | 2,315,709 |
| 7,500 | | Broward County, Florida, Airport System Revenue Bonds, Series 2015A, 5.000%, 10/01/45 (AMT) | 10/25 at 100.00 | A+ | 8,242,950 |
| 6,000 | | Broward County, Florida, Airport System Revenue Bonds, Series 2019A, 5.000%, 10/01/49 (AMT) | 10/29 at 100.00 | A+ | 6,705,480 |
| 4,315 | | Cape Coral, Florida, Water and Sewer Revenue Bonds, Refunding Series 2011, 5.000%, | 10/21 at 100.00 | A1 (4) | 4,570,146 |
| | 10/01/41 (Pre-refunded 10/01/21) – AGM Insured | | | |
| 100 | | Florida Development Finance Corporation, Educational Facilities Revenue Bonds, | 6/22 at 100.00 | N/R | 98,594 |
| | Renaissance Charter School, Inc Projects, Series 2012A, 6.125%, 6/15/43, 144A | | | |
| | Florida Development Finance Corporation, Florida, Surface Transportation Facility | | | |
| | Revenue Bonds, Virgin Trains USA Passenger Rail Project , Series 2019A: | | | |
| 12,000 | | 6.375%, 1/01/49 (AMT) (Mandatory Put 1/01/26), 144A | 7/20 at 105.00 | N/R | 10,283,520 |
| 19,000 | | 6.500%, 1/01/49 (AMT) (Mandatory Put 1/01/29), 144A | 7/20 at 105.00 | N/R | 16,122,070 |
| 4,165 | | Florida Higher Educational Facilities Financing Authority, Revenue Bonds, Nova | 4/22 at 100.00 | Baa1 | 4,295,115 |
| | Southeastern University Project, Refunding Series 2012A, 5.000%, 4/01/32 | | | |
| 1,150 | | Florida Higher Educational Facilities Financing Authority, Revenue Bonds, Nova | 4/21 at 100.00 | Baa1 | 1,182,453 |
| | Southeastern University, Refunding Series 2011, 6.375%, 4/01/31 | | | |
| 2,000 | | Florida Ports Financing Commission, Revenue Bonds, State Transportation Trust | 10/21 at 100.00 | Aa3 | 2,116,160 |
| | Fund-Intermodal Program, Refunding Series 2011B, 5.375%, 10/01/29 (AMT) | | | |
| | Greater Orlando Aviation Authority, Florida, Orlando Airport Facilities Revenue Bonds, | | | |
| | Priority Subordinated Series 2017: | | | |
| 31,985 | | 5.000%, 10/01/47 (AMT) | 10/27 at 100.00 | A+ | 34,834,544 |
| 8,565 | | 5.000%, 10/01/52 (AMT) | 10/27 at 100.00 | A+ | 9,300,562 |
25
| | |
| NAD | Nuveen Quality Municipal Income Fund Portfolio of Investments (continued) April 30, 2020 (Unaudited) |
| | | | | | |
| Principal | | | Optional Call | | |
| Amount (000) | | Description (1) | Provisions (2) | Ratings (3) | Value |
| | Florida (continued) | | | |
| $ 3,890 | | Greater Orlando Aviation Authority, Florida, Orlando Airport Facilities Revenue Bonds, | 10/26 at 100.00 | AA– | $ 4,257,838 |
| | Series 2016A, 5.000%, 10/01/40 (AMT) | | | |
| 6,020 | | Hillsborough County Aviation Authority, Florida, Revenue Bonds, Tampa International | 10/24 at 100.00 | A+ | 6,332,859 |
| | Airport, Senior Lien Series 2015A, 5.000%, 10/01/44 (AMT) | | | |
| 5,000 | | Hillsborough County Aviation Authority, Florida, Revenue Bonds, Tampa International | 10/28 at 100.00 | AA– | 5,380,500 |
| | Airport, Series 2018E, 5.000%, 10/01/48 (AMT) | | | |
| 2,290 | | Hillsborough County Aviation Authority, Florida, Revenue Bonds, Tampa International | 10/24 at 100.00 | A+ | 2,459,094 |
| | Airport, Subordinate Lien Series 2015B, 5.000%, 10/01/40 | | | |
| 10,305 | | Hillsborough County Aviation Authority, Florida, Tampa International Airport Customer | 10/24 at 100.00 | A3 | 10,802,113 |
| | Facility Charge Revenue Bonds, Series 2015A, 5.000%, 10/01/44 | | | |
| 5,000 | | Hillsborough County Port District, Florida, Revenue Bonds, Tampa Port Authority Project, | 6/28 at 100.00 | A | 5,815,050 |
| | Series 2018B, 5.000%, 6/01/46 (AMT) | | | |
| 2,690 | | JEA, Florida, Water and Sewer System Revenue Bonds, Series 2010D, 5.000%, 10/01/39 | 6/20 at 100.00 | A2 | 2,697,640 |
| 5,075 | | Lakeland, Florida, Hospital System Revenue Bonds, Lakeland Regional Health, Series 2015, | 11/24 at 100.00 | A2 | 5,442,176 |
| | 5.000%, 11/15/35 | | | |
| 1,500 | | Martin County Industrial Development Authority, Florida, Industrial Development Revenue | 6/20 at 100.00 | Baa2 | 1,503,060 |
| | Refunding Bonds, Indiantown Cogeneration LP, Series 2013, 3.950%, 12/15/21 (AMT), 144A | | | |
| 9,820 | | Miami Beach Redevelopment Agency, Florida, Tax Increment Revenue Bonds, City | 2/24 at 100.00 | A1 | 10,966,780 |
| | Center/Historic Convention Village, Series 2015A, 5.000%, 2/01/44 – AGM Insured | | | |
| 2,000 | | Miami Health Facilities Authority, Florida, Health Facilities Revenue Bonds, Miami | 7/27 at 100.00 | BBB– | 1,458,760 |
| | Jewish Health System Inc Project, Series 2017, 5.125%, 7/01/46 | | | |
| 2,930 | | Miami-Dade County Educational Facilities Authority, Florida, Revenue Bonds, University | 4/23 at 100.00 | A– | 3,052,064 |
| | of Miami, Series 2012A, 5.000%, 4/01/42 | | | |
| 8,070 | | Miami-Dade County Educational Facilities Authority, Florida, Revenue Bonds, University | 4/25 at 100.00 | A– | 8,544,435 |
| | of Miami, Series 2015A, 5.000%, 4/01/45 | | | |
| 12,545 | | Miami-Dade County Educational Facilities Authority, Florida, Revenue Bonds, University | 4/28 at 100.00 | A– | 13,591,127 |
| | of Miami, Series 2018A, 5.000%, 4/01/53 | | | |
| 1,500 | | Miami-Dade County Health Facility Authority, Florida, Hospital Revenue Bonds, Nicklaus | 8/27 at 100.00 | A | 1,649,835 |
| | Children’s Hospital, Refunding Series 2017, 5.000%, 8/01/42 | | | |
| 1,000 | | Miami-Dade County, Florida, Aviation Revenue Bonds, Miami International Airport, | 10/22 at 100.00 | A (4) | 1,094,440 |
| | Refunding Series 2012A, 5.000%, 10/01/29 (Pre-refunded 10/01/22) (AMT) | | | |
| 1,000 | | Miami-Dade County, Florida, Aviation Revenue Bonds, Miami International Airport, | 10/24 at 100.00 | A | 1,095,380 |
| | Refunding Series 2014B, 5.000%, 10/01/37 | | | |
| | Miami-Dade County, Florida, Aviation Revenue Bonds, Miami International Airport, Series 2010B: | | | |
| 4,000 | | 5.000%, 10/01/28 (Pre-refunded 10/01/20) | 10/20 at 100.00 | A (4) | 4,070,160 |
| 7,890 | | 5.000%, 10/01/41 | 10/20 at 100.00 | A | 7,993,675 |
| 5,000 | | Miami-Dade County, Florida, Aviation Revenue Bonds, Refunding Series 2014A, 5.000%, | 10/24 at 100.00 | A | 5,457,350 |
| | 10/01/35 (AMT) | | | |
| 3,410 | | Miami-Dade County, Florida, Aviation Revenue Bonds, Refunding Series 2015A, 5.000%, | 10/25 at 100.00 | A | 3,724,641 |
| | 10/01/38 (AMT) | | | |
| 2,865 | | Miami-Dade County, Florida, Special Obligation Bonds, Refunding Subordinate Series | 10/22 at 100.00 | A2 | 3,107,379 |
| | 2012B, 5.000%, 10/01/37 | | | |
| 3,000 | | Miami-Dade County, Florida, Transit System Sales Surtax Revenue Bonds, Refunding Series | 7/22 at 100.00 | A1 | 3,188,310 |
| | 2012, 5.000%, 7/01/42 | | | |
| 1,000 | | Miami-Dade County, Florida, Water and Sewer System Revenue Bonds, Series 2010, 5.000%, | 10/20 at 100.00 | Aa3 (4) | 1,017,950 |
| | 10/01/39 (Pre-refunded 10/01/20) – AGM Insured | | | |
| 12,370 | | Miami-Dade County, Florida, Water and Sewer System Revenue Bonds, Series 2013A, 5.000%, | 10/22 at 100.00 | A+ (4) | 13,647,450 |
| | 10/01/42 (Pre-refunded 10/01/22) | | | |
| 6,035 | | Miami-Dade County, Florida, Water and Sewer System Revenue Bonds, Series 2019B, | 10/29 at 100.00 | A+ | 6,577,727 |
| | 4.000%, 10/01/49 | | | |
26
| | | | | | |
| Principal | | | Optional Call | | |
| Amount (000) | | Description (1) | Provisions (2) | Ratings (3) | Value |
| | Florida (continued) | | | |
| $ 4,000 | | North Sumter County Utility Dependent District, Florida, Utility Revenue Bonds, Series | 10/20 at 100.00 | A2 | $ 4,070,920 |
| | 2010, 5.375%, 10/01/40 | | | |
| 2,360 | | Osceola County, Florida, Transportation Revenue Bonds, Osceola Parkway, Refunding & | 10/29 at 100.00 | BBB– | 2,673,998 |
| | Improvement Series 2019A-1, 5.000%, 10/01/44 | | | |
| 2,000 | | Palm Beach County Health Facilities Authority, Florida, Retirement Communities Revenue | 11/26 at 100.00 | A– | 2,095,180 |
| | Bonds, ACTS Retirement – Life Communities, Inc Obligated Group, Series 2016, 5.000%, 11/15/32 | | | |
| 115 | | Palm Beach County Health Facilities Authority, Florida, Revenue Bonds, Sinai Residences | 6/22 at 102.00 | N/R | 119,324 |
| | of Boca Raton Project, Series 2014A, 7.250%, 6/01/34 | | | |
| 4,635 | | Port Saint Lucie, Florida, Public Service Tax Revenue Bonds, Recovery Zone Facility Bond | 9/24 at 100.00 | AA– | 5,310,644 |
| | Series 2014B, 5.000%, 9/01/43 | | | |
| 10,095 | | Putnam County Development Authority, Florida, Pollution Control Revenue Bonds, Seminole | 5/28 at 100.00 | A– | 11,739,072 |
| | Electric Cooperatice, Inc Project, Refunding Series 2018B, 5.000%, 3/15/42 | | | |
| | South Miami Health Facilities Authority, Florida, Hospital Revenue Bonds, Baptist Health | | | |
| | Systems of South Florida Obligated Group, Series 2017: | | | |
| 5,770 | | 5.000%, 8/15/42 | 8/27 at 100.00 | A1 | 6,333,094 |
| 6,040 | | 5.000%, 8/15/47 | 8/27 at 100.00 | A1 | 6,582,090 |
| 705 | | Southeast Overtown/Park West Community Redevelopement Agency, Florida, Tax Increment | 3/24 at 100.00 | BBB+ | 771,411 |
| | Revenue Bonds, Series 2014A-1, 5.000%, 3/01/30, 144A | | | |
| 1,500 | | Sumter County Industrial Development Authority, Florida, Hospital Revenue Bonds, Central | 1/24 at 100.00 | A– | 1,589,820 |
| | Florida Health Alliance Projects, Series 2014A, 5.250%, 7/01/44 | | | |
| 700 | | Tampa, Florida, Cigarette Tax Allocation Bonds, H Lee Moffitt Cancer Center Project, | 9/22 at 100.00 | A+ | 741,748 |
| | Refunding & Capital Improvement Series 2012A, 5.000%, 9/01/29 | | | |
| 2,405 | | Tampa, Florida, Health System Revenue Bonds, Baycare Health System, Series 2016A, | 5/26 at 100.00 | Aa2 | 2,531,792 |
| | 4.000%, 11/15/46 | | | |
| 14,610 | | Tampa-Hillsborough County Expressway Authority, Florida, Revenue Bonds, Refunding Series | 7/22 at 100.00 | A2 (4) | 15,930,160 |
| | 2012B, 5.000%, 7/01/42 (Pre-refunded 7/01/22) | | | |
| 85 | | Tolomato Community Development District, Florida, Special Assessment Bonds, Convertible, | 5/22 at 100.00 | N/R | 62,124 |
| | Capital Appreciation, Series 2012A-4, 0.000%, 5/01/40 (7) | | | |
| 120 | | Tolomato Community Development District, Florida, Special Assessment Bonds, Hope Note, | 6/20 at 100.00 | N/R | 1 |
| | Series 2007-3, 6.650%, 5/01/40 (8) | | | |
| 290 | | Tolomato Community Development District, Florida, Special Assessment Bonds, Refunding | 6/20 at 100.00 | N/R | 250,650 |
| | Series 2015-1, 0.000%, 5/01/40 (7) | | | |
| 180 | | Tolomato Community Development District, Florida, Special Assessment Bonds, Refunding | 6/20 at 100.00 | N/R | 119,342 |
| | Series 2015-2, 0.000%, 5/01/40 (7) | | | |
| 195 | | Tolomato Community Development District, Florida, Special Assessment Bonds, Refunding | 6/20 at 100.00 | N/R | 2 |
| | Series 2015-3, 6.610%, 5/01/40 (8) | | | |
| 750 | | Volusia County Educational Facilities Authority, Florida, Revenue Bonds, Embry-Riddle | 10/29 at 100.00 | A3 | 768,795 |
| | Aeronautical University, Series 2020A, 4.000%, 10/15/38 | | | |
| 6,510 | | Volusia County Educational Facilities Authority, Florida, Revenue Bonds, Stetson | 6/25 at 100.00 | A– | 6,839,080 |
| | University Inc Project, Series 2015, 5.000%, 6/01/45 | | | |
| 290,240 | | Total Florida | | | 305,433,298 |
| | Georgia – 1.6% (1.0% of Total Investments) | | | |
| 1,820 | | Atlanta Development Authority, Georgia, Revenue Bonds, New Downtown Atlanta Stadium | 7/25 at 100.00 | A+ | 1,894,238 |
| | Project, Senior Lien Series 2015A-1, 5.250%, 7/01/40 | | | |
| 5,000 | | Atlanta, Georgia, Water and Wastewater Revenue Bonds, Refunding Series 2015, 5.000%, 11/01/32 | 5/25 at 100.00 | AA– | 5,761,100 |
| 1,520 | | Dalton Development Authority, Georgia, Revenue Certificates, Hamilton Health Care System | No Opt. Call | Baa2 | 1,673,155 |
| | Inc, Series 1996, 5.500%, 8/15/26 – NPFG Insured | | | |
| 2,000 | | Fulton County Development Authority, Georgia, Hospital Revenue Bonds, Wellstar Health | 4/27 at 100.00 | A | 2,176,860 |
| | System, Inc Project, Series 2017A, 5.000%, 4/01/47 | | | |
| 3,180 | | Georgia Municipal Electric Authority, Plant Vogtle Units 3 & 4 Project M Bonds, Series | 7/28 at 100.00 | BBB+ | 3,347,077 |
| | 2019A, 5.000%, 1/01/63 | | | |
27
| | |
| NAD | Nuveen Quality Municipal Income Fund Portfolio of Investments (continued) April 30, 2020 (Unaudited) |
| | | | | | |
| Principal | | | Optional Call | | |
| Amount (000) | | Description (1) | Provisions (2) | Ratings (3) | Value |
| | Georgia (continued) | | | |
| | Main Street Natural Gas Inc, Georgia, Gas Supply Revenue Bonds, Series 2019A: | | | |
| $ 1,460 | | 5.000%, 5/15/43 | 5/29 at 100.00 | A3 | $ 1,574,084 |
| 5,000 | | 5.000%, 5/15/49 | No Opt. Call | A3 | 5,832,900 |
| 425 | | Metropolitan Atlanta Rapid Transit Authority, Georgia, Sales Tax Revenue Bonds, | No Opt. Call | N/R (4) | 428,494 |
| | Refunding Series 1992P, 6.250%, 7/01/20 – AMBAC Insured (ETM) | | | |
| 3,265 | | Metropolitan Atlanta Rapid Transit Authority, Georgia, Sales Tax Revenue Bonds, Third | 7/26 at 100.00 | AA– | 3,738,621 |
| | Indenture, Series 2015B, 5.000%, 7/01/41 | | | |
| 10,260 | | Municipal Electric Authority of Georgia, Plant Vogtle Units 3 & 4 Project J Bonds, | 7/25 at 100.00 | Baa3 | 10,412,566 |
| | Series 2015A, 5.000%, 7/01/60 | | | |
| 5,000 | | Private Colleges and Universities Authority, Georgia, Revenue Bonds, Emory University, | 10/26 at 100.00 | AA | 5,774,550 |
| | Refunding Series 2016A, 5.000%, 10/01/46 | | | |
| 1,220 | | Private Colleges and Universities Authority, Georgia, Revenue Bonds, Mercer University, | 10/21 at 100.00 | Baa1 | 1,249,048 |
| | Series 2012A, 5.250%, 10/01/27 | | | |
| 5,370 | | Rockdale County Development Authority, Georgia, Revenue Bonds, Piedmont Healthcare, Inc | 7/29 at 100.00 | A1 | 5,447,758 |
| | Project, Series 2019A, 4.000%, 7/01/44 | | | |
| 1,425 | | Valdosta and Lowndes County Hospital Authority, Georgia, Revenue Certificates, South | 10/21 at 100.00 | AA– (4) | 1,510,301 |
| | Georgia Medical Center Project, Series 2011B, 5.000%, 10/01/41 (Pre-refunded 10/01/21) | | | |
| 46,945 | | Total Georgia | | | 50,820,752 |
| | Guam – 0.1% (0.1% of Total Investments) | | | |
| 765 | | Government of Guam, Business Privilege Tax Bonds, Series 2011A, 5.000%, 1/01/31 | 1/22 at 100.00 | BB | 767,792 |
| 1,770 | | Guam Government Waterworks Authority, Water and Wastewater System Revenue Bonds, Series | 7/20 at 100.00 | BBB– (4) | 1,783,771 |
| | 2010, 5.625%, 7/01/40 (Pre-refunded 7/01/20) | | | |
| 1,220 | | Guam Government Waterworks Authority, Water and Wastewater System Revenue Bonds, Series | 7/23 at 100.00 | BBB– | 1,242,997 |
| | 2013, 5.500%, 7/01/43 | | | |
| 3,755 | | Total Guam | | | 3,794,560 |
| | Hawaii – 1.6% (1.0% of Total Investments) | | | |
| 13,000 | | Hawaii Department of Budget and Finance, Special Purpose Revenue Bonds, Hawaii Pacific | 7/23 at 100.00 | A1 | 13,803,790 |
| | Health Obligated Group, Series 2013A, 5.500%, 7/01/43 | | | |
| 6,000 | | Hawaii Department of Budget and Finance, Special Purpose Revenue Bonds, Hawaiian | 3/27 at 100.00 | Baa2 | 6,149,280 |
| | Electric Company, Inc and Subsidiary Projects, Refunding Series 2017B, 4.000%, 3/01/37 (AMT) | | | |
| 11,205 | | Hawaii State, Airport System Revenue Bonds, Series 2015A, 5.000%, 7/01/45 (AMT) | 7/25 at 100.00 | A1 | 12,103,753 |
| 10,000 | | Hawaii State, Airport System Revenue Bonds, Series 2018A, 5.000%, 7/01/43 (AMT) | 7/28 at 100.00 | A1 | 11,126,200 |
| 5,000 | | Hawaii State, General Obligation Bonds, Series 2017FK, 4.000%, 5/01/35 | 5/27 at 100.00 | AA+ | 5,550,850 |
| 45,205 | | Total Hawaii | | | 48,733,873 |
| | Idaho – 0.7% (0.4% of Total Investments) | | | |
| 5,000 | | Idaho Health Facilities Authority, Hospital Revenue Bonds, CHE Trinity Helath Group, | 12/27 at 100.00 | AA– | 5,548,450 |
| | Series 2017A, 5.000%, 12/01/47 | | | |
| 11,205 | | Idaho Health Facilities Authority, Hospital Revenue Bonds, CHE Trinity Helath Group, | 6/27 at 100.00 | AA– | 12,370,096 |
| | Series 2017ID, 5.000%, 12/01/46 | | | |
| 1,700 | | Idaho Health Facilities Authority, Revenue Bonds, Madison Memorial Hospital Project, | 9/26 at 100.00 | BB+ | 1,884,382 |
| | Refunding Series 2016, 5.000%, 9/01/29 | | | |
| | Idaho Water Resource Board, Water Resource Loan Program Revenue, Ground Water Rights | | | |
| | Mitigation Series 2012A: | | | |
| 1,155 | | 4.750%, 9/01/26 | 9/22 at 100.00 | A3 | 1,238,368 |
| 310 | | 5.000%, 9/01/32 | 9/22 at 100.00 | A3 | 335,237 |
| 19,370 | | Total Idaho | | | 21,376,533 |
| | Illinois – 17.5% (10.9% of Total Investments) | | | |
| | Bensenville, Illinois, General Obligation Bonds, Series 2011A: | | | |
| 1,055 | | 5.000%, 12/15/30 – AGM Insured | 12/21 at 100.00 | AA | 1,119,429 |
| 1,945 | | 5.000%, 12/15/30 (Pre-refunded 12/15/21) – AGM Insured | 12/21 at 100.00 | AA (4) | 2,078,310 |
| 6,000 | | Chicago Board of Education, Illinois, Dedicated Capital Improvement Tax Revenue Bonds, | 4/27 at 100.00 | A | 6,213,120 |
| | Series 2016, 6.000%, 4/01/46 | | | |
28
| | | | | | |
| Principal | | | Optional Call | | |
| Amount (000) | | Description (1) | Provisions (2) | Ratings (3) | Value |
| | Illinois (continued) | | | |
| $ 1,470 | | Chicago Board of Education, Illinois, General Obligation Bonds, Dedicated Revenues | 12/21 at 100.00 | B1 | $ 1,386,328 |
| | Series 2011A, 5.000%, 12/01/41 | | | |
| 9,250 | | Chicago Board of Education, Illinois, General Obligation Bonds, Dedicated Revenues, | 12/25 at 100.00 | BB– | 9,970,390 |
| | Series 2016A, 7.000%, 12/01/44 | | | |
| 2,400 | | Chicago Board of Education, Illinois, General Obligation Bonds, Dedicated Revenues, | 12/26 at 100.00 | BB– | 2,545,296 |
| | Series 2016B, 6.500%, 12/01/46 | | | |
| 11,295 | | Chicago Board of Education, Illinois, General Obligation Bonds, Dedicated Revenues, | 12/27 at 100.00 | BB– | 12,410,833 |
| | Series 2017A, 7.000%, 12/01/46, 144A | | | |
| | Chicago Board of Education, Illinois, Unlimited Tax General Obligation Bonds, Dedicated | | | |
| | Tax Revenues, Series 1998B-1: | | | |
| 10,000 | | 0.000%, 12/01/20 – FGIC Insured | No Opt. Call | BB– | 9,835,800 |
| 10,130 | | 0.000%, 12/01/24 – FGIC Insured | No Opt. Call | BB– | 8,705,418 |
| 7,140 | | 0.000%, 12/01/25 – FGIC Insured | No Opt. Call | BB– | 5,906,137 |
| 4,325 | | 0.000%, 12/01/29 – FGIC Insured | No Opt. Call | BB– | 3,021,229 |
| 4,235 | | 0.000%, 12/01/31 – FGIC Insured | No Opt. Call | BB– | 2,680,416 |
| | Chicago Board of Education, Illinois, Unlimited Tax General Obligation Bonds, Dedicated | | | |
| | Tax Revenues, Series 1999A: | | | |
| 15,000 | | 0.000%, 12/01/21 – FGIC Insured | No Opt. Call | BB– | 14,307,150 |
| 10,000 | | 0.000%, 12/01/23 – FGIC Insured | No Opt. Call | BB– | 8,911,300 |
| 8,845 | | 5.500%, 12/01/26 – NPFG Insured | No Opt. Call | BB– | 9,548,354 |
| 7,900 | | Chicago Transit Authority, Illinois, Sales Tax Receipts Revenue Bonds, Series 2011, | 12/21 at 100.00 | A3 | 8,291,524 |
| | 5.250%, 12/01/40 | | | |
| | Chicago, Illinois, FHA/GNMA Multifamily Housing Revenue Bonds, Archer Court Apartments, | | | |
| | Series 1999A: | | | |
| 1,145 | | 5.600%, 12/20/29 (AMT) | 6/20 at 100.00 | AA– | 1,147,588 |
| 1,925 | | 5.650%, 12/20/40 (AMT) | 6/20 at 100.00 | AA– | 1,928,369 |
| | Chicago, Illinois, General Airport Revenue Bonds, O’Hare International Airport, | | | |
| | Refunding Senior Lien Series 2018A: | | | |
| 5,450 | | 5.000%, 1/01/48 (AMT) | 1/29 at 100.00 | A | 5,950,146 |
| 10,285 | | 5.000%, 1/01/53 (AMT) | 1/29 at 100.00 | A | 11,189,771 |
| 2,245 | | Chicago, Illinois, General Airport Revenue Bonds, O’Hare International Airport, Senior | 1/25 at 100.00 | A | 2,362,324 |
| | Lien Series 2015C, 5.000%, 1/01/46 (AMT) | | | |
| | Chicago, Illinois, General Airport Revenue Bonds, O’Hare International Airport, Senior | | | |
| | Lien Series 2017D: | | | |
| 11,250 | | 5.000%, 1/01/42 (AMT) | 1/27 at 100.00 | A | 12,165,862 |
| 3,000 | | 5.000%, 1/01/47 (AMT) | 1/27 at 100.00 | A | 3,220,950 |
| | Chicago, Illinois, General Obligation Bonds, City Colleges, Series 1999: | | | |
| 4,115 | | 0.000%, 1/01/33 – FGIC Insured | No Opt. Call | BBB– | 2,293,290 |
| 29,600 | | 0.000%, 1/01/38 – FGIC Insured | No Opt. Call | BBB– | 12,501,264 |
| 11,675 | | Chicago, Illinois, General Obligation Bonds, Project & Refunding Series 2017A, | 1/27 at 100.00 | BBB– | 12,154,025 |
| | 6.000%, 1/01/38 | | | |
| | Chicago, Illinois, General Obligation Bonds, Series 2019A: | | | |
| 4,000 | | 5.000%, 1/01/40 | 1/29 at 100.00 | BBB– | 3,830,320 |
| 3,630 | | 5.500%, 1/01/49 | 1/29 at 100.00 | BBB– | 3,601,904 |
| 22,750 | | Chicago, Illinois, General Obligation Refunding Bonds, Emergency Telephone System, | No Opt. Call | BBB– | 24,000,567 |
| | Series 1999, 5.500%, 1/01/23 – FGIC Insured | | | |
| 6,280 | | Chicago, Illinois, Sales Tax Revenue Bonds, Series 2011A, 5.000%, 1/01/41 (Pre-refunded 1/01/22) | 1/22 at 100.00 | N/R (4) | 6,727,638 |
| 6,410 | | Chicago, Illinois, Wastewater Transmission Revenue Bonds, Second Lien Series 2001A, | No Opt. Call | Baa2 | 7,908,466 |
| | 5.500%, 1/01/30 – NPFG Insured | | | |
| 1,500 | | Chicago, Illinois, Water Revenue Bonds, Senior Lien Series 2001, 5.750%, 11/01/30 – | No Opt. Call | Baa2 | 1,853,610 |
| | AMBAC Insured | | | |
| 4,500 | | Cook County Community College District 508, Illinois, General Obligation Bonds, Chicago | 12/27 at 100.00 | A+ | 5,044,770 |
| | City Colleges, Series 2017, 5.000%, 12/01/47 | | | |
29
| | |
| NAD | Nuveen Quality Municipal Income Fund Portfolio of Investments (continued) April 30, 2020 (Unaudited) |
| | | | | | |
| Principal | | | Optional Call | | |
| Amount (000) | | Description (1) | Provisions (2) | Ratings (3) | Value |
| | Illinois (continued) | | | |
| $ 13,310 | | Cook County, Illinois, General Obligation Bonds, Refunding Series 2010A, 5.250%, 11/15/33 | 11/20 at 100.00 | A2 | $ 13,353,657 |
| | Cook County, Illinois, General Obligation Bonds, Refunding Series 2018: | | | |
| 4,800 | | 5.000%, 11/15/34 | 11/26 at 100.00 | A2 | 4,872,768 |
| 3,250 | | 5.000%, 11/15/35 | 11/26 at 100.00 | A2 | 3,288,058 |
| | Illinois Educational Facilities Authority, Revenue Bonds, Field Museum of Natural | | | |
| | History, Series 2002RMKT: | | | |
| 5,000 | | 4.450%, 11/01/36 | 11/25 at 102.00 | A2 | 5,433,600 |
| 815 | | 4.500%, 11/01/36 | 11/24 at 100.00 | A | 878,105 |
| 2,785 | | 5.500%, 11/01/36 | 11/23 at 100.00 | A | 3,110,622 |
| 410 | | Illinois Finance Authority, Charter School Revenue Bonds, Intrinsic Charter Schools | 12/25 at 100.00 | N/R | 416,954 |
| | Belmont School Project, Series 2015A, 6.000%, 12/01/45, 144A | | | |
| 13,955 | | Illinois Finance Authority, Revenue Bonds, Advocate Health Care Network, Refunding | 5/25 at 100.00 | Aa3 | 15,198,670 |
| | Series 2015, 5.000%, 5/01/45 (UB) (5) | | | |
| 2,000 | | Illinois Finance Authority, Revenue Bonds, Art Institute of Chicago, Series 2016, | 3/26 at 100.00 | AA– | 2,130,500 |
| | 4.000%, 3/01/38 | | | |
| 2,500 | | Illinois Finance Authority, Revenue Bonds, Ascension Health/fkaPresence Health Network, | 2/27 at 100.00 | Aa2 | 2,868,425 |
| | Series 2016C, 5.000%, 2/15/33 | | | |
| 4,985 | | Illinois Finance Authority, Revenue Bonds, Centegra Health System, Series 2012, | 9/22 at 100.00 | AA+ | 5,290,979 |
| | 5.000%, 9/01/32 | | | |
| | Illinois Finance Authority, Revenue Bonds, Centegra Health System, Series 2014A: | | | |
| 4,750 | | 5.000%, 9/01/39 | 9/24 at 100.00 | AA+ | 5,176,170 |
| 6,000 | | 5.000%, 9/01/42 | 9/24 at 100.00 | AA+ | 6,513,060 |
| 10,745 | | Illinois Finance Authority, Revenue Bonds, OSF Healthcare System, Series 2015A, | 11/25 at 100.00 | A3 | 11,075,194 |
| | 5.000%, 11/15/45 | | | |
| 12,125 | | Illinois Finance Authority, Revenue Bonds, Palos Community Hospital, Series 2010C, | 6/20 at 100.00 | AA– | 12,150,705 |
| | 5.125%, 5/15/35 | | | |
| | Illinois Finance Authority, Revenue Bonds, Rehabilitation Institute of Chicago, Series | | | |
| | 2013A: | | | |
| 415 | | 5.500%, 7/01/28 | 7/23 at 100.00 | A– | 449,985 |
| 390 | | 6.000%, 7/01/43 | 7/23 at 100.00 | A– | 425,030 |
| 4,250 | | Illinois Finance Authority, Revenue Bonds, Rush University Medical Center Obligated | 5/25 at 100.00 | A+ | 4,513,797 |
| | Group, Series 2015B, 5.000%, 11/15/39 | | | |
| | Illinois Finance Authority, Revenue Bonds, Silver Cross Hospital and Medical Centers, | | | |
| | Refunding Series 2015C: | | | |
| 560 | | 5.000%, 8/15/35 | 8/25 at 100.00 | Baa1 | 602,851 |
| 3,745 | | 5.000%, 8/15/44 | 8/25 at 100.00 | Baa1 | 3,931,688 |
| | Illinois Finance Authority, Revenue Bonds, The University of Chicago Medical Center, | | | |
| | Series 2009B: | | | |
| 470 | | 5.000%, 8/15/26 (Pre-refunded 8/15/20) | 8/20 at 100.00 | N/R (4) | 475,664 |
| 930 | | 5.000%, 8/15/26 | 8/20 at 100.00 | A1 | 937,347 |
| 2,500 | | Illinois Finance Authority, Revenue Bonds, The University of Chicago Medical Center, | 2/21 at 100.00 | AA- (4) | 2,592,825 |
| | Series 2011C, 5.500%, 8/15/41 (Pre-refunded 2/15/21) (UB) (5) | | | |
| 3,000 | | Illinois Finance Authority, Revenue Bonds, University of Chicago, Refunding Series | 10/25 at 100.00 | AA– | 3,347,580 |
| | 2015A, 5.000%, 10/01/46 | | | |
| 11,140 | | Illinois Finance Authority, Revenue Bonds, University of Chicago, Series 2012A, 5.000%, 10/01/51 | 10/21 at 100.00 | AA– | 11,628,155 |
| 2,000 | | Illinois Health Facilities Authority, Revenue Bonds, Midwest Care Center I Inc, Series | 5/20 at 100.00 | Aa3 | 2,003,300 |
| | 2001, 5.950%, 2/20/36 | | | |
| 1,830 | | Illinois Sports Facility Authority, State Tax Supported Bonds, Refunding Series 2014, | 6/24 at 100.00 | BB+ | 1,938,464 |
| | 5.250%, 6/15/32 – AGM Insured | | | |
| | Illinois State, General Obligation Bonds, February Series 2014: | | | |
| 3,500 | | 5.250%, 2/01/30 | 2/24 at 100.00 | BBB– | 3,383,170 |
| 4,100 | | 5.250%, 2/01/31 | 2/24 at 100.00 | BBB– | 3,952,933 |
| 3,200 | | 5.250%, 2/01/32 | 2/24 at 100.00 | BBB– | 3,077,664 |
| 2,000 | | 5.250%, 2/01/33 | 2/24 at 100.00 | BBB– | 1,910,360 |
| 1,575 | | 5.250%, 2/01/34 | 2/24 at 100.00 | BBB– | 1,500,739 |
| 2,000 | | 5.000%, 2/01/39 | 2/24 at 100.00 | BBB– | 1,861,660 |
30
| | | | | | |
| Principal | | | Optional Call | | |
| Amount (000) | | Description (1) | Provisions (2) | Ratings (3) | Value |
| | Illinois (continued) | | | |
| $ 8,250 | | Illinois State, General Obligation Bonds, January Series 2016, 5.000%, 1/01/32 | 1/26 at 100.00 | BBB– | $ 7,897,807 |
| 1,025 | | Illinois State, General Obligation Bonds, March Series 2012, 5.000%, 3/01/34 | 3/22 at 100.00 | BBB– | 971,003 |
| 450 | | Illinois State, General Obligation Bonds, May Series 2014, 5.000%, 5/01/39 | 5/24 at 100.00 | BBB– | 418,676 |
| 1,500 | | Illinois State, General Obligation Bonds, November Series 2016, 5.000%, 11/01/37 | 11/26 at 100.00 | BBB– | 1,400,445 |
| | Illinois State, General Obligation Bonds, October Series 2016: | | | |
| 3,790 | | 5.000%, 2/01/26 | No Opt. Call | BBB– | 3,715,261 |
| 3,510 | | 5.000%, 2/01/28�� | 2/27 at 100.00 | BBB– | 3,400,277 |
| 2,375 | | Illinois State, General Obligation Bonds, Refunding Series 2012, 5.000%, 8/01/25 | 8/22 at 100.00 | BBB– | 2,339,375 |
| | Illinois State, General Obligation Bonds, Series 2013: | | | |
| 2,500 | | 5.250%, 7/01/31 | 7/23 at 100.00 | BBB– | 2,407,850 |
| 1,520 | | 5.500%, 7/01/38 | 7/23 at 100.00 | BBB– | 1,469,095 |
| 2,020 | | Illinois State, Sales Tax Revenue Bonds, Build Illinois Series 2011, 3.750%, 6/15/25 | 6/21 at 100.00 | BBB | 2,004,971 |
| 1,395 | | Illinois Toll Highway Authority, Toll Highway Revenue Bonds, Senior Lien Series 2013A, | 1/23 at 100.00 | A1 | 1,491,339 |
| | 5.000%, 1/01/38 | | | |
| 4,685 | | Illinois Toll Highway Authority, Toll Highway Revenue Bonds, Senior Lien Series 2015A, | 7/25 at 100.00 | A1 | 5,242,234 |
| | 5.000%, 1/01/40 | | | |
| 4,435 | | Illinois Toll Highway Authority, Toll Highway Revenue Bonds, Senior Lien Series 2015B, | 1/26 at 100.00 | A1 | 4,950,170 |
| | 5.000%, 1/01/40 | | | |
| 1,815 | | Illinois Toll Highway Authority, Toll Highway Revenue Bonds, Tender Option Bond Trust | 1/23 at 100.00 | A1 | 2,316,848 |
| | 2015-XF0051, 17.176%, 1/01/38, 144A (IF) | | | |
| 1,875 | | Illinois Toll Highway Authority, Toll Highway Revenue Bonds, Tender Option Bond Trust | 1/23 at 100.00 | A1 | 2,392,913 |
| | 2015-XF0052, 17.160%, 1/01/38, 144A (IF) | | | |
| 2,000 | | Kane & DeKalb Counties Community Unit School District 301, Illinois, General Obligation | No Opt. Call | Aa2 | 1,955,760 |
| | Bonds, Series 2006, 0.000%, 12/01/21 – NPFG Insured | | | |
| 1,510 | | Macon County School District 61 Decatur, Illinois, General Obligation Bonds, Alternate | 1/21 at 100.00 | A2 | 1,548,747 |
| | Revenue Source Series 2011A, 5.250%, 1/01/39 – AGM Insured | | | |
| 9,000 | | McHenry County Community Unit School District 200, Woodstock, Illinois, General | No Opt. Call | Aa2 | 8,619,210 |
| | Obligation Bonds, Series 2006B, 0.000%, 1/15/23 – FGIC Insured | | | |
| 1,890 | | Metropolitan Pier and Exposition Authority, Illinois, McCormick Place Expansion Project | 12/25 at 100.00 | BB+ | 1,718,350 |
| | Bonds, Refunding Series 2015B, 5.000%, 6/15/52 | | | |
| 2,350 | | Metropolitan Pier and Exposition Authority, Illinois, McCormick Place Expansion Project | 12/29 at 100.00 | BB+ | 2,147,994 |
| | Bonds, Refunding Series 2020A, 5.000%, 6/15/50 | | | |
| 5,000 | | Metropolitan Pier and Exposition Authority, Illinois, McCormick Place Expansion Project | 12/25 at 100.00 | BB+ | 4,907,650 |
| | Bonds, Series 2015A, 5.500%, 6/15/53 | | | |
| 2,750 | | Metropolitan Pier and Exposition Authority, Illinois, McCormick Place Expansion Project | 12/27 at 100.00 | BB+ | 2,476,733 |
| | Bonds, Series 2017A, 5.000%, 6/15/57 | | | |
| | Metropolitan Pier and Exposition Authority, Illinois, McCormick Place Expansion Project | | | |
| | Refunding Bonds, Series 2010A: | | | |
| 2,585 | | 5.500%, 6/15/50 (Pre-refunded 6/15/20) | 6/20 at 100.00 | BB+ (4) | 2,598,209 |
| 8,055 | | 5.500%, 6/15/50 | 6/20 at 100.00 | Ba1 | 8,092,858 |
| 1,050 | | Metropolitan Pier and Exposition Authority, Illinois, Revenue Bonds, McCormick Place | 6/20 at 100.00 | BB+ | 1,054,767 |
| | Expansion Project, Capital Appreciation Refunding Series 2010B-1, 5.000%, 6/15/50 | | | |
| | Metropolitan Pier and Exposition Authority, Illinois, Revenue Bonds, McCormick Place | | | |
| | Expansion Project, Refunding Series 1996A: | | | |
| 6,015 | | 0.000%, 12/15/21 – NPFG Insured | No Opt. Call | BB+ | 5,769,528 |
| 12,250 | | 0.000%, 12/15/22 – NPFG Insured | No Opt. Call | BB+ | 11,399,482 |
| 23,575 | | 0.000%, 12/15/23 – NPFG Insured | No Opt. Call | BB+ | 21,220,565 |
| 10,775 | | 0.000%, 12/15/24 – NPFG Insured | No Opt. Call | BB+ | 9,360,889 |
| 2,685 | | Metropolitan Pier and Exposition Authority, Illinois, Revenue Bonds, McCormick Place | 6/20 at 100.00 | BB+ | 2,696,089 |
| | Expansion Project, Refunding Series 2010B-2, 5.000%, 6/15/50 | | | |
31
| | |
| NAD | Nuveen Quality Municipal Income Fund Portfolio of Investments (continued) April 30, 2020 (Unaudited) |
| | | | | | |
| Principal | | | Optional Call | | |
| Amount (000) | | Description (1) | Provisions (2) | Ratings (3) | Value |
| | Illinois (continued) | | | |
| | Metropolitan Pier and Exposition Authority, Illinois, Revenue Bonds, McCormick Place | | | |
| | Expansion Project, Series 2002A: | | | |
| $ 155 | | 0.000%, 12/15/23 (ETM) | No Opt. Call | N/R (4) | $ 148,547 |
| 6,610 | | 0.000%, 12/15/23 | No Opt. Call | BBB | 5,949,859 |
| 5,000 | | 0.000%, 12/15/34 – NPFG Insured | No Opt. Call | BB+ | 2,703,450 |
| 1,100 | | 0.000%, 12/15/35 – NPFG Insured | No Opt. Call | BB+ | 562,342 |
| 3,805 | | 0.000%, 6/15/41 – NPFG Insured | No Opt. Call | BB+ | 1,416,145 |
| 2,480 | | Metropolitan Pier and Exposition Authority, Illinois, Revenue Bonds, McCormick Place | No Opt. Call | AA+ (4) | 2,932,575 |
| | Hospitality Facility, Series 1996A, 7.000%, 7/01/26 (ETM) | | | |
| | Railsplitter Tobacco Settlement Authority, Illinois, Tobacco Settlement Revenue Bonds, | | | |
| | Series 2010: | | | |
| 1,550 | | 5.250%, 6/01/21 | No Opt. Call | A | 1,614,170 |
| 800 | | 6.000%, 6/01/28 (Pre-refunded 6/01/21) | 6/21 at 100.00 | N/R (4) | 844,792 |
| 3,500 | | Regional Transportation Authority, Cook, DuPage, Kane, Lake, McHenry and Will Counties, | No Opt. Call | A2 | 3,809,820 |
| | Illinois, General Obligation Bonds, Series 1999, 5.750%, 6/01/23 – AGM Insured | | | |
| 2,395 | | Southwestern Illinois Development Authority, Local Government Revenue Bonds, | No Opt. Call | AA | 2,295,272 |
| | Edwardsville Community Unit School District 7 Project, Series 2007, 0.000%, 12/01/22 – | | | |
| | AGM Insured | | | |
| | Springfield, Illinois, Electric Revenue Bonds, Senior Lien Series 2015: | | | |
| 2,250 | | 5.000%, 3/01/29 | 3/25 at 100.00 | A3 | 2,589,683 |
| 3,505 | | 5.000%, 3/01/40 – AGM Insured | 3/25 at 100.00 | A2 | 3,957,811 |
| | University of Illinois, Health Services Facilities System Revenue Bonds, Series 2013: | | | |
| 1,580 | | 6.000%, 10/01/32 | 10/23 at 100.00 | Baa1 | 1,712,120 |
| 9,625 | | 6.250%, 10/01/38 | 10/23 at 100.00 | Baa1 | 10,403,181 |
| 2,745 | | 6.000%, 10/01/42 | 10/23 at 100.00 | Baa1 | 2,933,142 |
| 4,930 | | Will County Community High School District 210 Lincoln-Way, Illinois, General Obligation | No Opt. Call | A2 | 4,537,473 |
| | Bonds, Series 2006, 0.000%, 1/01/23 – AGM Insured | | | |
| 560,450 | | Total Illinois | | | 541,498,054 |
| | Indiana – 2.0% (1.2% of Total Investments) | | | |
| 6,180 | | Crown Point Multi-School Building Corporation, Indiana, First Mortgage Bonds, Crown | No Opt. Call | Baa2 | 5,967,841 |
| | Point Community School Corporation, Series 2000, 0.000%, 1/15/23 – NPFG Insured | | | |
| 1,555 | | Indiana Finance Authority, Educational Facilities Revenue Bonds, Butler University | 2/22 at 100.00 | A– | 1,633,901 |
| | Project, Refunding Series 2012B, 5.000%, 2/01/28 | | | |
| 1,050 | | Indiana Finance Authority, Educational Facilities Revenue Bonds, Drexel Foundation For | 6/20 at 100.00 | B | 1,050,567 |
| | Educational Excellence, Inc, Series 2009A, 7.000%, 10/01/39 | | | |
| 2,865 | | Indiana Finance Authority, Hospital Revenue Bonds, Community Health Network Project, | 5/23 at 100.00 | A | 2,992,464 |
| | Series 2012A, 5.000%, 5/01/42 | | | |
| 10,000 | | Indiana Finance Authority, Hospital Revenue Bonds, Indiana University Health Obligation | 12/29 at 100.00 | AA | 10,765,700 |
| | Group, Fixed Rate Series 2019A, 4.000%, 12/01/49 | | | |
| 7,480 | | Indiana Finance Authority, Hospital Revenue Bonds, Indiana University Health Obligation | 6/25 at 100.00 | AA | 8,111,462 |
| | Group, Refunding 2015A, 5.000%, 12/01/40 | | | |
| | Indiana Finance Authority, Provate Activity Bonds, Ohio River Bridges East End Crossing | | | |
| | Project, Series 2013A: | | | |
| 3,015 | | 5.000%, 7/01/44 (AMT) | 7/23 at 100.00 | BBB+ | 3,094,114 |
| 1,420 | | 5.000%, 7/01/48 (AMT) | 7/23 at 100.00 | BBB+ | 1,453,725 |
| 1,500 | | Indiana Finance Authority, Provate Activity Bonds, Ohio River Bridges East End Crossing | 7/23 at 100.00 | BBB+ | 1,545,315 |
| | Project, Series 2013B, 5.000%, 7/01/40 (AMT) | | | |
| 2,500 | | Indiana Finance Authority, Revenue Bonds, Trinity Health Care Group, Refunding Series | 12/20 at 100.00 | AA– (4) | 2,562,450 |
| | 2010B, 5.000%, 12/01/37 (Pre-refunded 12/01/20) | | | |
| 5,115 | | Indiana Finance Authority, Wastewater Utility Revenue Bonds, CWA Authority Project, | 10/26 at 100.00 | A+ | 5,882,403 |
| | First Lien Green Series 2016A, 5.000%, 10/01/41 | | | |
| 2,750 | | Indiana Finance Authority, Wastewater Utility Revenue Bonds, CWA Authority Project, | 10/21 at 100.00 | A1 | 2,871,577 |
| | Series 2011B, 5.000%, 10/01/41 | | | |
| 4,500 | | Indiana Finance Authority, Wastewater Utility Revenue Bonds, CWA Authority Project, | 10/22 at 100.00 | Aa3 | 4,675,545 |
| | Series 2012A, 4.000%, 10/01/42 | | | |
32
| | | | | | |
| Principal | | | Optional Call | | |
| Amount (000) | | Description (1) | Provisions (2) | Ratings (3) | Value |
| | Indiana (continued) | | | |
| $ 4,375 | | Indiana Municipal Power Agency Power Supply System Revenue Bonds, Refunding Series | 7/26 at 100.00 | A+ | $ 4,984,131 |
| | 2016A, 5.000%, 1/01/42 | | | |
| 3,985 | | Valparaiso, Indiana, Exempt Facilities Revenue Bonds, Pratt Paper LLC Project, Series | 1/24 at 100.00 | N/R | 4,176,160 |
| | 2013, 7.000%, 1/01/44 (AMT) | | | |
| 58,290 | | Total Indiana | | | 61,767,355 |
| | Iowa – 1.4% (0.9% of Total Investments) | | | |
| 1,505 | | Iowa Finance Authority, Iowa, Midwestern Disaster Area Revenue Bonds, Alcoa Inc Project, | 8/22 at 100.00 | Ba3 | 1,490,612 |
| | Series 2012, 4.750%, 8/01/42 | | | |
| 1,335 | | Iowa Finance Authority, Iowa, Midwestern Disaster Area Revenue Bonds, Iowa Fertilizer | 12/23 at 100.00 | B | 1,338,818 |
| | Company Project, Series 2013, 5.250%, 12/01/25 | | | |
| 1,710 | | Iowa Finance Authority, Iowa, Midwestern Disaster Area Revenue Bonds, Iowa Fertilizer | 6/20 at 104.00 | B | 1,740,438 |
| | Company Project, Series 2016, 5.875%, 12/01/26, 144A | | | |
| 1,990 | | Iowa Finance Authority, Iowa, Midwestern Disaster Area Revenue Bonds, Iowa Fertilizer | 12/22 at 105.00 | BB– | 1,949,663 |
| | Company Project, Series 2018B, 5.250%, 12/01/50 (Mandatory Put 12/01/37) | | | |
| | Iowa Tobacco Settlement Authority, Asset Backed Settlement Revenue Bonds, Series 2005C: | | | |
| 24,420 | | 5.500%, 6/01/42 | 6/20 at 100.00 | B– | 24,646,862 |
| 12,100 | | 5.625%, 6/01/46 | 6/20 at 100.00 | B– | 12,212,409 |
| 43,060 | | Total Iowa | | | 43,378,802 |
| | Kansas – 0.2% (0.1% of Total Investments) | | | |
| 1,240 | | Johnson/Miami County Unified School District 230 Spring Hill, Kansas, General Obligation | 9/21 at 100.00 | Aa3 | 1,302,917 |
| | Bonds, Series 2011A, 5.000%, 9/01/26 | | | |
| 3,965 | | Lawrence, Kansas, Hospital Revenue Bonds, Lawrence Memorial Hospital, Series 2018A, | 7/28 at 100.00 | A | 4,368,201 |
| | 5.000%, 7/01/48 | | | |
| 380 | | Overland Park Transportation Development District, Kansas, Sales Tax Revenue Bonds, Oak | 6/20 at 100.00 | BBB | 359,298 |
| | Park Mall Project, Series 2010, 5.900%, 4/01/32 | | | |
| 5,585 | | Total Kansas | | | 6,030,416 |
| | Kentucky – 1.6% (1.0% of Total Investments) | | | |
| 5,540 | | Kentucky Economic Development Finance Authority, Hospital Revenue Bonds, Baptist | 8/21 at 100.00 | Baa1 | 5,626,590 |
| | Healthcare System Obligated Group, Series 2011, 5.250%, 8/15/46 | | | |
| | Kentucky Economic Development Finance Authority, Hospital Revenue Bonds, Owensboro | | | |
| | Medical Health System, Series 2010A: | | | |
| 2,000 | | 6.000%, 6/01/30 (Pre-refunded 6/01/20) | 6/20 at 100.00 | BB+ (4) | 2,007,800 |
| 5,500 | | 6.500%, 3/01/45 (Pre-refunded 6/01/20) | 6/20 at 100.00 | BB+ (4) | 5,523,375 |
| 2,730 | | Kentucky Economic Development Finance Authority, Revenue Bonds, Next Generation Kentucky | 7/25 at 100.00 | Baa2 | 2,600,407 |
| | Information Highway Project, Senior Series 2015A, 5.000%, 1/01/45 | | | |
| | Kentucky Public Transportation Infrastructure Authority, First Tier Toll Revenue Bonds, | | | |
| | Downtown Crossing Project, Convertible Capital Appreciation Series 2013C: | | | |
| 4,790 | | 0.000%, 7/01/43 (7) | 7/31 at 100.00 | Baa3 | 4,484,302 |
| 3,655 | | 0.000%, 7/01/46 (7) | 7/31 at 100.00 | Baa3 | 3,427,257 |
| | Kentucky Public Transportation Infrastructure Authority, First Tier Toll Revenue Bonds, | | | |
| | Downtown Crossing Project, Series 2013A: | | | |
| 8,360 | | 5.750%, 7/01/49 | 7/23 at 100.00 | Baa3 | 8,506,300 |
| 585 | | 6.000%, 7/01/53 | 7/23 at 100.00 | Baa3 | 598,765 |
| 9,195 | | Lexington-Fayette Urban County Government Public Facilities Corporation, Kentucky State | 6/21 at 100.00 | A– | 9,469,379 |
| | Lease Revenue Bonds, Eastern State Hospital Project, Series 2011A, 5.250%, 6/01/30 | | | |
| | Pikeville, Kentucky, Hospital Revenue Bonds, Pikeville Medical Center, Inc Project, | | | |
| | Improvement and Refunding Series 2011: | | | |
| 495 | | 6.250%, 3/01/31 (Pre-refunded 3/01/21) | 3/21 at 100.00 | Baa2 (4) | 517,300 |
| 4,505 | | 6.250%, 3/01/31 | 3/21 at 100.00 | Baa2 | 4,640,105 |
| 1,375 | | 6.500%, 3/01/41 | 3/21 at 100.00 | N/R | 1,412,304 |
| 48,730 | | Total Kentucky | | | 48,813,884 |
33
| | |
| NAD | Nuveen Quality Municipal Income Fund Portfolio of Investments (continued) April 30, 2020 (Unaudited) |
| | | | | | |
| Principal | | | Optional Call | | |
| Amount (000) | | Description (1) | Provisions (2) | Ratings (3) | Value |
| | Louisiana – 3.2% (2.0% of Total Investments) | | | |
| $ 4,780 | | Ascension Parish Industrial development Board, Louisiana, Revenue Bonds, Impala | 7/23 at 100.00 | N/R | $ 4,848,019 |
| | Warehousing (US) LLC Project, Series 2013, 6.000%, 7/01/36 | | | |
| 2,665 | | East Baton Rouge Sewerage Commission, Louisiana, Revenue Bonds, Refunding Series 2014B, | 2/25 at 100.00 | AA– | 3,032,024 |
| | 5.000%, 2/01/39 | | | |
| 3,130 | | Jefferson Sales Tax District, Jefferson Parish, Louisiana, Special Sales Tax Revenue | 12/27 at 100.00 | A1 | 3,686,044 |
| | Bonds, Series 2017B, 5.000%, 12/01/42 – AGM Insured | | | |
| | Lafayette Parish School Board, Louisiana, Sales Tax Revenue Bonds, Series 2018: | | | |
| 1,500 | | 4.000%, 4/01/40 | 4/27 at 100.00 | AA+ | 1,635,165 |
| 4,685 | | 4.000%, 4/01/43 | 4/27 at 100.00 | AA+ | 5,066,968 |
| 5,200 | | Louisiana Local Government Environmental Facilities and Community Development Authority, | 2/24 at 100.00 | A+ | 5,696,964 |
| | Revenue Bonds, East Baton Rouge Sewerage Commission Projects, Subordinate Lien Series 2014A, | | | |
| | 5.000%, 2/01/44 | | | |
| 1,380 | | Louisiana Local Government Environmental Facilities and Community Development Authority, | 8/20 at 100.00 | BBB– | 1,381,435 |
| | Revenue Bonds, Westlake Chemical Corporation Projects, Series 2009A, 6.500%, 8/01/29 | | | |
| | Louisiana Public Facilities Authority, Louisiana, Revenue Bonds, Ochsner Clinic Foundation | | | |
| | Project, Refunding Series 2017: | | | |
| 5,000 | | 5.000%, 5/15/42 | 5/27 at 100.00 | A3 | 5,449,550 |
| 965 | | 5.000%, 5/15/46 | 5/27 at 100.00 | A3 | 1,040,473 |
| 8,065 | | Louisiana Public Facilities Authority, Dock and Wharf Revenue Bonds, Impala Warehousing | 7/23 at 100.00 | N/R | 8,283,400 |
| | (US) LLC Project, Series 2013, 6.500%, 7/01/36 (AMT), 144A | | | |
| 1,265 | | Louisiana Public Facilities Authority, Hospital Revenue and Refunding Bonds, Lafayette | 11/25 at 100.00 | Baa2 | 1,328,883 |
| | General Medical Center Project, Series 2016A, 5.000%, 11/01/45 | | | |
| 1,830 | | Louisiana Public Facilities Authority, Revenue Bonds, Ochsner Clinic Foundation Project, | 5/26 at 100.00 | A3 | 1,880,508 |
| | Refunding Series 2016, 4.000%, 5/15/35 | | | |
| 4,305 | | Louisiana Public Facilities Authority, Revenue Bonds, Ochsner Clinic Foundation Project, | 5/21 at 100.00 | A3 (4) | 4,570,102 |
| | Series 2011, 6.750%, 5/15/41 (Pre-refunded 5/15/21) | | | |
| 330 | | Louisiana Stadium and Exposition District, Revenue Refunding Bonds, Senior Lien Series | 7/23 at 100.00 | A2 | 345,629 |
| | 2013A, 5.000%, 7/01/36 | | | |
| 14,000 | | Louisiana State, Gasoline and Fuels Tax Revenue Bonds, Refunding Series 2015A, | 5/25 at 100.00 | AA– | 14,889,980 |
| | 4.000%, 5/01/41 | | | |
| | New Orleans Aviation Board, Louisiana, General Airport Revenue Bonds, North Terminal | | | |
| | Project, Series 2015B: | | | |
| 6,235 | | 5.000%, 1/01/40 (AMT) | 1/25 at 100.00 | A | 6,766,035 |
| 6,895 | | 5.000%, 1/01/45 (AMT) | 1/25 at 100.00 | A | 7,451,082 |
| 4,800 | | New Orleans Aviation Board, Louisiana, General Airport Revenue Bonds, North Terminal | 1/27 at 100.00 | A | 5,239,536 |
| | Project, Series 2017B, 5.000%, 1/01/48 (AMT) | | | |
| 1,000 | | New Orleans, Louisiana, General Obligation Bonds, Refunding Series 2012, 5.000%, | 12/22 at 100.00 | A2 | 1,090,970 |
| | 12/01/28 – AGM Insured | | | |
| 5,350 | | New Orleans, Louisiana, Sewerage Service Revenue Bonds, Refunding Series 2014, | 6/24 at 100.00 | BBB+ | 5,920,042 |
| | 5.000%, 6/01/44 | | | |
| 1,200 | | New Orleans, Louisiana, Water Revenue Bonds, Refunding Series 2014, 5.000%, 12/01/44 | 12/24 at 100.00 | BBB+ | 1,331,604 |
| 485 | | Saint Charles Parish, Louisiana, Gulf Opportunity Zone Revenue Bonds, Valero Project, | No Opt. Call | BBB | 494,923 |
| | Series 2010, 4.000%, 12/01/40 (Mandatory Put 6/01/22) | | | |
| 5,655 | | Shreveport, Louisiana, Water and Sewer Revenue Bonds, Refunding Series 2015, | 12/25 at 100.00 | A– | 6,394,222 |
| | 5.000%, 12/01/40 | | | |
| 90,720 | | Total Louisiana | | | 97,823,558 |
| | Maine – 0.8% (0.5% of Total Investments) | | | |
| 2,775 | | Maine Health and Higher Educational Facilities Authority Revenue Bonds, Eastern Maine | 7/23 at 100.00 | Ba1 | 2,895,074 |
| | Medical Center Obligated Group Issue, Series 2013, 5.000%, 7/01/33 | | | |
| | Maine Health and Higher Educational Facilities Authority Revenue Bonds, Eastern Maine | | | |
| | Medical Center Obligated Group Issue, Series 2016A: | | | |
| 3,820 | | 4.000%, 7/01/41 | 7/26 at 100.00 | Ba1 | 3,767,437 |
| 2,800 | | 4.000%, 7/01/46 | 7/26 at 100.00 | Ba1 | 2,678,060 |
34
| | | | | | |
| Principal | | | Optional Call | | |
| Amount (000) | | Description (1) | Provisions (2) | Ratings (3) | Value |
| | Maine (continued) | | | |
| $ 3,245 | | Maine Health and Higher Educational Facilities Authority Revenue Bonds, MaineHealth | 7/28 at 100.00 | A+ | $ 3,622,686 |
| | Issue, Series 2018A, 5.000%, 7/01/43 | | | |
| 2,000 | | Maine Health and Higher Educational Facilities Authority, Revenue Bonds, Bates College, | 7/23 at 100.00 | A+ | 2,190,100 |
| | Series 2013, 5.000%, 7/01/43 | | | |
| | Maine Health and Higher Educational Facilities Authority, Revenue Bonds, Maine General | | | |
| | Medical Center, Series 2011: | | | |
| 3,000 | | 6.750%, 7/01/36 | 7/21 at 100.00 | Ba3 | 3,100,740 |
| 2,260 | | 6.750%, 7/01/41 | 7/21 at 100.00 | Ba3 | 2,328,275 |
| | Maine Health and Higher Educational Facilities Authority, Revenue Bonds, Series 2010A: | | | |
| 415 | | 5.000%, 7/01/40 | 7/20 at 100.00 | A1 | 417,440 |
| 1,305 | | 5.000%, 7/01/40 | 7/20 at 100.00 | N/R | 1,313,874 |
| | Maine Turnpike Authority, Special Obligation Bonds, Series 2014: | | | |
| 1,290 | | 5.000%, 7/01/33 | 7/24 at 100.00 | A– | 1,435,151 |
| 1,020 | | 5.000%, 7/01/34 | 7/24 at 100.00 | A– | 1,132,628 |
| 23,930 | | Total Maine | | | 24,881,465 |
| | Maryland – 0.4% (0.2% of Total Investments) | | | |
| 5,000 | | Baltimore, Maryland, Revenue Bonds, Wastewater Projects, Series 2014C, 5.000%, 7/01/44 | 1/25 at 100.00 | AA– | 5,536,850 |
| 2,000 | | Maryland Health and Higher Educational Facilities Authority, Revenue Bonds, LifeBridge | 7/27 at 100.00 | A+ | 2,091,480 |
| | Health Issue, Series 2017, 4.000%, 7/01/42 | | | |
| 450 | | Maryland Health and Higher Educational Facilities Authority, Revenue Bonds, Mercy | 7/21 at 100.00 | BBB+ | 469,301 |
| | Medical Cente, Series 2011, 6.000%, 7/01/25 | | | |
| 1,790 | | Maryland Health and Higher Educational Facilities Authority, Revenue Bonds, Peninsula | 7/24 at 100.00 | A3 | 1,908,784 |
| | Regional Medical Center Issue, Refunding Series 2015, 5.000%, 7/01/39 | | | |
| 1,070 | | Rockville Mayor and Council, Maryland, Economic Development Revenue Bonds, Ingleside | 11/24 at 103.00 | BB– | 1,077,971 |
| | King Farm Project, Series 2017A-1, 5.000%, 11/01/28 | | | |
| 10,310 | | Total Maryland | | | 11,084,386 |
| | Massachusetts – 1.1% (0.7% of Total Investments) | | | |
| | Mass Development Finance Agency, Revenue Bonds, Boston University, Massachusetts, | | | |
| | Tender Option Bond Trust 2016-XG0070: | | | |
| 930 | | 17.311%, 10/01/48, 144A (IF) (5) | 10/23 at 100.00 | AA– | 1,198,556 |
| 505 | | 17.411%, 10/01/48, 144A (IF) (5) | 10/23 at 100.00 | AA– | 651,011 |
| 650 | | Massachusetts Development Finance Agency, Health Care Facility Revenue Bonds, Adventcare | 6/20 at 100.00 | N/R | 487,500 |
| | Project, Series 2007A, 6.750%, 10/15/37 (8) | | | |
| 815 | | Massachusetts Development Finance Agency, Health Care Facility Revenue Bonds, Adventcare | 10/20 at 100.00 | N/R | 611,250 |
| | Project, Series 2010, 7.625%, 10/15/37 (8) | | | |
| | Massachusetts Development Finance Agency, Revenue Bonds, Atrius Health Issue, Series 2019A: | | | |
| 275 | | 5.000%, 6/01/39 | 6/29 at 100.00 | BBB | 306,229 |
| 270 | | 4.000%, 6/01/49 | 6/29 at 100.00 | BBB | 260,080 |
| 825 | | Massachusetts Development Finance Agency, Revenue Bonds, Boston Medical Center Issue, | 7/25 at 100.00 | BBB | 861,473 |
| | Green Bonds, Series 2015D, 5.000%, 7/01/44 | | | |
| 3,500 | | Massachusetts Development Finance Agency, Revenue Bonds, Boston University, Series | 10/26 at 100.00 | AA– | 3,963,295 |
| | 2016BB-1, 5.000%, 10/01/46 | | | |
| 3,200 | | Massachusetts Development Finance Agency, Revenue Bonds, Emerson College, Series 2015, | 1/25 at 100.00 | Baa2 | 3,206,112 |
| | 4.500%, 1/01/45 | | | |
| 1,220 | | Massachusetts Development Finance Agency, Revenue Bonds, Loomis Communities, Series | 1/23 at 100.00 | BBB | 1,246,828 |
| | 2013A, 5.125%, 1/01/25 | | | |
| 2,300 | | Massachusetts Development Finance Agency, Revenue Bonds, Olin College, Series 2013E, | 11/23 at 100.00 | A2 | 2,438,184 |
| | 5.000%, 11/01/43 | | | |
| 1,500 | | Massachusetts Development Finance Agency, Revenue Bonds, UMass Memorial Health Care, | 7/26 at 100.00 | BBB+ | 1,405,110 |
| | Series 2016I, 4.000%, 7/01/41 | | | |
35
| | |
| NAD | Nuveen Quality Municipal Income Fund Portfolio of Investments (continued) April 30, 2020 (Unaudited) |
| | | | | | |
| Principal | | | Optional Call | | |
| Amount (000) | | Description (1) | Provisions (2) | Ratings (3) | Value |
| | Massachusetts (continued) | | | |
| | Massachusetts Development Finance Agency, Revenue Bonds, Western New England University, | | | |
| | Series 2015: | | | |
| $ 1,145 | | 5.000%, 9/01/40 | 9/25 at 100.00 | BBB | $ 1,204,735 |
| 1,280 | | 5.000%, 9/01/45 | 9/25 at 100.00 | BBB | 1,337,318 |
| 700 | | Massachusetts Port Authority, Special Facilities Revenue Bonds, ConRac Project, Series | 7/21 at 100.00 | A3 | 721,252 |
| | 2011A, 5.125%, 7/01/41 | | | |
| 5,930 | | Massachusetts School Building Authority, Dedicated Sales Tax Revenue Bonds, Senior | 5/23 at 100.00 | Aa2 | 6,474,849 |
| | Series 2013A, 5.000%, 5/15/43 | | | |
| 1,100 | | Massachusetts Turnpike Authority, Metropolitan Highway System Revenue Bonds, Senior | No Opt. Call | A2 | 1,035,243 |
| | Series 1997A, 0.000%, 1/01/24 – NPFG Insured | | | |
| 6,700 | | Metropolitan Boston Transit Parking Corporation, Systemwide Parking Revenue Bonds, | 7/21 at 100.00 | A+ | 6,948,972 |
| | Massachusetts, Senior Lien Series 2011, 5.000%, 7/01/41 | | | |
| 32,845 | | Total Massachusetts | | | 34,357,997 |
| | Michigan – 2.7% (1.7% of Total Investments) | | | |
| 3,535 | | Detroit Water and Sewerage Department, Michigan, Sewage Disposal System Revenue Bonds, | 7/22 at 100.00 | A1 | 3,753,852 |
| | Refunding Senior Lien Series 2012A, 5.250%, 7/01/39 | | | |
| 2,020 | | Detroit, Michigan, Water Supply System Revenue Bonds, Senior Lien Series 2011A, | 7/21 at 100.00 | A1 | 2,103,446 |
| | 5.250%, 7/01/41 | | | |
| 1,000 | | Eastern Michigan University, General Revenue Bonds, Series 2018A, 4.000%, 3/01/44 – | 3/28 at 100.00 | A2 | 1,027,670 |
| | AGM Insured | | | |
| 6,910 | | Hudsonville Public Schools, Ottawa and Allegan Counties, Michigan, General Obligation | 5/30 at 100.00 | AA | 7,573,429 |
| | Bonds, School Building & Site Series 2020-I, 4.000%, 5/01/47 | | | |
| 3,665 | | Lansing Board of Water and Light, Michigan, Utility System Revenue Bonds, Series 2011A, | 7/21 at 100.00 | AA– (4) | 3,868,884 |
| | 5.500%, 7/01/41 (Pre-refunded 7/01/21) | | | |
| 5,000 | | Michigan Finance Authority, Hospital Revenue Bonds, McLaren Health Care, Refunding | 8/29 at 100.00 | A1 | 5,245,300 |
| | Series 2019A, 4.000%, 2/15/44 | | | |
| 1,500 | | Michigan Finance Authority, Hospital Revenue Bonds, Sparrow Obligated Group, Series | 11/22 at 100.00 | A2 | 1,556,310 |
| | 2012, 5.000%, 11/15/42 | | | |
| 405 | | Michigan Finance Authority, Local Government Loan Program Revenue Bonds, Detroit Water & | 7/24 at 100.00 | A1 | 443,807 |
| | Sewerage Department Water Supply System Local Project, Refunding Senior Loan Series 2014D-1, | | | |
| | 5.000%, 7/01/37 – AGM Insured | | | |
| 2,690 | | Michigan Finance Authority, Local Government Loan Program Revenue Bonds, Detroit Water & | 7/24 at 100.00 | A1 | 2,980,251 |
| | Sewerage Department Water Supply System Local Project, Series 2014C-3, 5.000%, 7/01/32 – | | | |
| | AGM Insured | | | |
| 1,000 | | Michigan Finance Authority, Local Government Loan Program Revenue Bonds, Detroit Water & | 7/24 at 100.00 | A2 | 1,118,020 |
| | Sewerage Department Water Supply System Local Project, Series 2014D-6, 5.000%, 7/01/36 – | | | |
| | NPFG Insured | | | |
| 5,085 | | Michigan Finance Authority, Michigan, Revenue Bonds, Trinity Health Credit Group, | 12/29 at 100.00 | AA– | 5,219,041 |
| | Refunding Series 2019A-MI, 4.000%, 12/01/49 | | | |
| | Michigan Finance Authority, Revenue Bonds, Trinity Health Credit Group, Refunding | | | |
| | Series 2015MI: | | | |
| 2,500 | | 5.000%, 12/01/31 (Pre-refunded 6/01/22) | 6/22 at 100.00 | AA– (4) | 2,709,150 |
| 3,670 | | 5.000%, 12/01/32 (Pre-refunded 6/01/22) | 6/22 at 100.00 | AA– (4) | 3,977,032 |
| 2,000 | | Michigan Finance Authority, State Revolving Fund Revenue Bonds, Clean Water Series 2012, | 10/22 at 100.00 | AAA | 2,204,000 |
| | 5.000%, 10/01/31 (Pre-refunded 10/01/22) | | | |
| 5,000 | | Michigan Hospital Finance Authority, Revenue Bonds, Ascension Health Senior Credit | 11/26 at 100.00 | Aa2 | 5,177,850 |
| | Group, Refunding & Project Series 2010F-6, 4.000%, 11/15/47 | | | |
| 1,000 | | Michigan State Building Authority, Revenue Bonds, Facilities Program, Refunding Series | 10/21 at 100.00 | AA– | 1,063,210 |
| | 2011-I-A, 5.375%, 10/15/41 | | | |
| 10,000 | | Michigan State Building Authority, Revenue Bonds, Facilities Program, Refunding Series | 10/25 at 100.00 | AA– | 11,667,900 |
| | 2015-I, 5.000%, 4/15/34 | | | |
| 5,200 | | Michigan State Hospital Finance Authority, Revenue Bonds, Trinity Health Care Group, | 6/22 at 100.00 | AA– (4) | 5,651,880 |
| | Series 2009C, 5.000%, 12/01/48 (Pre-refunded 6/01/22) | | | |
36
| | | | | | |
| Principal | | | Optional Call | | |
| Amount (000) | | Description (1) | Provisions (2) | Ratings (3) | Value |
| | Michigan (continued) | | | |
| $ 5,000 | | Michigan Tobacco Settlement Finance Authority, Tobacco Settlement Asset-Backed Revenue | 5/20 at 100.00 | B2 | $ 5,021,750 |
| | Bonds, Series 2008A, 6.875%, 6/01/42 | | | |
| 3,000 | | Wayne County Airport Authority, Michigan, Revenue Bonds, Detroit Metropolitan Wayne | 12/22 at 100.00 | A | 3,191,400 |
| | County Airport, Series 2012A, 5.000%, 12/01/37 | | | |
| | Wayne County Airport Authority, Michigan, Revenue Bonds, Detroit Metropolitan Wayne | | | |
| | County Airport, Series 2015D: | | | |
| 1,325 | | 5.000%, 12/01/40 | 12/25 at 100.00 | A | 1,462,800 |
| 1,200 | | 5.000%, 12/01/45 | 12/25 at 100.00 | A | 1,315,104 |
| | Wayne County Airport Authority, Michigan, Revenue Bonds, Detroit Metropolitan Wayne | | | |
| | County Airport, Series 2017B: | | | |
| 1,350 | | 5.000%, 12/01/42 (AMT) | 12/27 at 100.00 | A | 1,479,087 |
| 3,140 | | 5.000%, 12/01/47 (AMT) | 12/27 at 100.00 | A | 3,416,477 |
| 1,120 | | Wayne State University, Michigan, General Revenue Bonds, Series 2018A, 5.000%, 11/15/36 | 11/25 at 100.00 | A+ | 1,241,094 |
| 78,315 | | Total Michigan | | | 84,468,744 |
| | Minnesota – 1.7% (1.0% of Total Investments) | | | |
| 310 | | Baytown Township, Minnesota Charter School Lease Revenue Bonds, Saint Croix Preparatory | 8/26 at 100.00 | BB+ | 281,902 |
| | Academy, Refunding Series 2016A, 4.000%, 8/01/36 | | | |
| 2,000 | | Brainerd Independent School District 181, Crow Wing County, Minnesota, General | 2/27 at 100.00 | AAA | 2,170,120 |
| | Obligation Bonds, School Building Series 2018A, 4.000%, 2/01/42 | | | |
| 500 | | Deephaven, Minnesota, Charter School Lease Revenue Bonds, Eagle Ridge Academy Project, | 7/25 at 100.00 | BB+ | 447,620 |
| | Series 2016A, 4.000%, 7/01/37 | | | |
| 5,625 | | Duluth Economic Development Authority, Minnesota, Health Care Facilities Revenue Bonds, | 2/28 at 100.00 | A– | 6,040,406 |
| | Essentia Health Obligated Group, Series 2018A, 5.000%, 2/15/53 | | | |
| 3,010 | | Independent School District 621, Mounds View, Minnesota, General Obligation Bonds, | 2/27 at 100.00 | AAA | 3,275,723 |
| | School Building Series 2018A, 4.000%, 2/01/42 | | | |
| | Minneapolis-St Paul Metropolitan Airports Commission, Minnesota, Airport Revenue Bonds, | | | |
| | Refunding Subordinate Lien Series 2019B: | | | |
| 1,235 | | 5.000%, 1/01/37 (AMT) | 7/29 at 100.00 | A+ | 1,407,332 |
| 6,000 | | 5.000%, 1/01/44 (AMT) | 7/29 at 100.00 | A+ | 6,712,380 |
| 2,295 | | Minneapolis-St Paul Metropolitan Airports Commission, Minnesota, Airport Revenue Bonds, | 1/27 at 100.00 | AA– | 2,545,270 |
| | Senior Lien Series 2016C, 5.000%, 1/01/46 | | | |
| | Minneapolis-St Paul Metropolitan Airports Commission, Minnesota, Airport Revenue Bonds, | | | |
| | Subordinate Lien Series 2016D: | | | |
| 470 | | 5.000%, 1/01/32 (AMT) | 1/27 at 100.00 | A+ | 530,578 |
| 450 | | 5.000%, 1/01/35 (AMT) | 1/27 at 100.00 | A+ | 502,065 |
| 580 | | 5.000%, 1/01/37 (AMT) | 1/27 at 100.00 | A+ | 642,965 |
| 750 | | 5.000%, 1/01/41 (AMT) | 1/27 at 100.00 | A+ | 824,288 |
| | Minnesota Higher Education Facilities Authority, Revenue Bonds, Carleton College, | | | |
| | Refunding Series 2017: | | | |
| 1,460 | | 4.000%, 3/01/41 | 3/27 at 100.00 | Aa2 | 1,597,985 |
| 1,700 | | 4.000%, 3/01/47 | 3/27 at 100.00 | Aa2 | 1,843,123 |
| 2,150 | | Minnesota Higher Education Facilities Authority, Revenue Bonds, Macalester College, | 3/27 at 100.00 | Aa3 | 2,310,777 |
| | Refunding Series 2017, 4.000%, 3/01/48 | | | |
| 910 | | Rochester, Minnesota, Health Care Facilities Revenue Bonds, Mayo Clinic, Series 2018A, | 5/28 at 100.00 | AA | 970,451 |
| | 4.000%, 11/15/48 | | | |
| 1,520 | | Saint Paul Housing & Redevelopment Authority, Minnesota, Charter School Lease Revenue | 12/24 at 100.00 | BBB– | 1,561,374 |
| | Bonds, Community of Peace Academy Project, Refunding Series 2015A, 5.000%, 12/01/50 | | | |
| | Saint Paul Housing & Redevelopment Authority, Minnesota, Charter School Lease Revenue | | | |
| | Bonds, Hmong College Prep Academy Project, Series 2016A: | | | |
| 2,205 | | 5.500%, 9/01/36 | 9/26 at 100.00 | BB+ | 2,301,623 |
| 2,500 | | 5.750%, 9/01/46 | 9/26 at 100.00 | BB+ | 2,599,025 |
37
| | |
| NAD | Nuveen Quality Municipal Income Fund Portfolio of Investments (continued) April 30, 2020 (Unaudited) |
| | | | | | |
| Principal | | | Optional Call | | |
| Amount (000) | | Description (1) | Provisions (2) | Ratings (3) | Value |
| | Minnesota (continued) | | | |
| | Saint Paul Housing and Redevelopment Authority Minnesota, Senior Housing and Health Care | | | |
| | Revenue Bonds, Episcopal Homes Project, Series 2013: | | | |
| $ 500 | | 5.000%, 5/01/33 | 5/23 at 100.00 | N/R | $ 456,165 |
| 1,000 | | 5.125%, 5/01/48 | 5/23 at 100.00 | N/R | 823,760 |
| 2,245 | | Saint Paul Housing and Redevelopment Authority, Minnesota, Health Care Revenue Bonds, | 11/27 at 100.00 | A3 | 2,382,506 |
| | Fairview Health Services, Series 2017A, 5.000%, 11/15/47 | | | |
| 750 | | St Paul Housing and Redevelopment Authority, Minnesota, Hospital Revenue Bonds, | 11/25 at 100.00 | N/R (4) | 910,567 |
| | HealthEast Inc, Series 2015A, 5.000%, 11/15/29 (Pre-refunded 11/15/25) | | | |
| 2,000 | | Wayzata, Minnesota Senior Housing Revenue Bonds, Folkestone Senior Living Community, | 8/24 at 102.00 | N/R | 1,939,280 |
| | Refunding Series 2019, 5.000%, 8/01/54 | | | |
| 3,855 | | West Saint Paul-Mendota Heights-Eagan Independent School District 197, Dakota County, | 2/27 at 100.00 | AAA | 4,216,098 |
| | Minnesota, General Obligation Bonds, School Building Series 2018A, 4.000%, 2/01/41 | | | |
| 2,000 | | Western Minnesota Municipal Power Agency, Minnesota, Power Supply Revenue Bonds, Series | 1/24 at 100.00 | Aa3 (4) | 2,294,420 |
| | 2014A, 5.000%, 1/01/46 (Pre-refunded 1/01/24) | | | |
| 48,020 | | Total Minnesota | | | 51,587,803 |
| | Mississippi – 0.8% (0.5% of Total Investments) | | | |
| | Mississippi Hospital Equipment and Facilities Authority, Revenue Bonds, Baptist Memorial | | | |
| | Healthcare, Series 2016A: | | | |
| 7,500 | | 5.000%, 9/01/36 | 9/26 at 100.00 | BBB+ | 7,867,275 |
| 15,500 | | 5.000%, 9/01/46 | 9/26 at 100.00 | BBB+ | 15,740,870 |
| 23,000 | | Total Mississippi | | | 23,608,145 |
| | Missouri – 4.2% (2.6% of Total Investments) | | | |
| 1,000 | | Boone County, Missouri, Hospital Revenue Bonds, Boone Hospital Center, Refunding Series | 8/26 at 100.00 | Ba1 | 1,074,510 |
| | 2016, 5.000%, 8/01/28 | | | |
| 2,000 | | Bridgeton Industrial Development Authority, Missouri, Senior Housing Revenue Bonds, The | 5/25 at 100.00 | N/R | 1,665,520 |
| | Sarah Community Project, Refunding Series 2016, 3.625%, 5/01/30 | | | |
| 500 | | Curators of the University of Missouri, System Facilities Revenue Bonds, Series 2014A, | 11/24 at 100.00 | AA+ | 556,815 |
| | 4.000%, 11/01/33 | | | |
| 1,785 | | Hanley Road Corridor Transportation Development District, Brentwood and Maplewood, | 6/20 at 100.00 | A– | 1,787,695 |
| | Missouri, Transportation Sales Revenue Bonds, Refunding Series 2009A, 5.875%, 10/01/36 | | | |
| | Kansas City Industrial Development Authority, Missouri, Airport Special Obligation | | | |
| | Bonds, Kansas City International Airport Terminal Modernization Project, Series 2019B: | | | |
| 3,425 | | 5.000%, 3/01/35 (AMT) | 3/29 at 100.00 | A | 3,874,360 |
| 2,200 | | 5.000%, 3/01/46 (AMT) | 3/29 at 100.00 | A | 2,418,438 |
| 7,000 | | 5.000%, 3/01/54 (AMT) | 3/29 at 100.00 | A | 7,635,810 |
| 400 | | Kansas City Industrial Development Authority, Missouri, Sales Tax Revenue Bonds, Ward | 4/26 at 100.00 | N/R | 336,668 |
| | Parkway Center Community Improvement District, Senior Refunding & Improvement Series 2016, | | | |
| | 5.000%, 4/01/46, 144A | | | |
| | Kansas City Municipal Assistance Corporation, Missouri, Leasehold Revenue Bonds, Series 2004B-1: | | | |
| 7,000 | | 0.000%, 4/15/27 – AMBAC Insured | No Opt. Call | A1 | 6,085,450 |
| 5,000 | | 0.000%, 4/15/28 – AMBAC Insured | No Opt. Call | A1 | 4,225,100 |
| 5,000 | | 0.000%, 4/15/29 – AMBAC Insured | No Opt. Call | A1 | 4,085,000 |
| 4,470 | | Kansas City, Missouri, Sanitary Sewer System Revenue Bonds, Improvement Series 2018A, | 1/28 at 100.00 | AA | 4,953,431 |
| | 4.000%, 1/01/42 | | | |
| 500 | | Missouri Development Finance Board, Infrastructure Facilities Revenue Bonds, Branson | No Opt. Call | A3 | 501,835 |
| | Landing Project, Series 2005A, 6.000%, 6/01/20 | | | |
| 1,000 | | Missouri Environmental Improvement and Energy Resources Authority, Revenue Bonds, Union | 6/27 at 102.00 | A | 1,028,850 |
| | Electric Company Project, Series 1998C, 2.750%, 9/01/33 | | | |
| 1,000 | | Missouri Health and Education Facilities Authority, Health Facilities Revenue Bonds, | 5/26 at 100.00 | A+ | 1,094,720 |
| | Saint Luke’s Health System, Inc, Series 2016, 5.000%, 11/15/34 | | | |
| 3,080 | | Missouri Health and Educational Facilities Authority, Educational Facilities Revenue | 5/23 at 100.00 | BBB | 3,185,274 |
| | Bonds, Saint Louis College of Pharmacy, Series 2013, 5.500%, 5/01/43 | | | |
38
| | | | | | |
| Principal | | | Optional Call | | |
| Amount (000) | | Description (1) | Provisions (2) | Ratings (3) | Value |
| | Missouri (continued) | | | |
| $ 1,260 | | Missouri Health and Educational Facilities Authority, Educational Facilities Revenue | 10/23 at 100.00 | A+ | $ 1,394,492 |
| | Bonds, University of Central Missouri, Series 2013C-2, 5.000%, 10/01/34 | | | |
| | Missouri Health and Educational Facilities Authority, Health Facilities Revenue Bonds, | | | |
| | CoxHealth, Series 2013A: | | | |
| 1,045 | | 5.000%, 11/15/44 | 11/23 at 100.00 | A2 | 1,096,623 |
| 11,090 | | 5.000%, 11/15/48 | 11/23 at 100.00 | A2 | 11,615,112 |
| | Missouri Health and Educational Facilities Authority, Health Facilities Revenue Bonds, | | | |
| | Mercy Health, Series 2017C: | | | |
| 5,000 | | 5.000%, 11/15/42 | 11/27 at 100.00 | AA– | 5,728,350 |
| 10,000 | | 4.000%, 11/15/47 | 11/27 at 100.00 | AA– | 10,636,200 |
| 3,000 | | 5.000%, 11/15/47 | 11/27 at 100.00 | AA– | 3,402,150 |
| | Missouri Health and Educational Facilities Authority, Health Facilities Revenue Bonds, | | | |
| | SSM Health Care, Series 2018A: | | | |
| 2,000 | | 4.000%, 6/01/48 | 6/28 at 100.00 | A+ | 2,076,800 |
| 3,500 | | 5.000%, 6/01/48 | 6/28 at 100.00 | A+ | 3,905,335 |
| | Missouri Health and Educational Facilities Authority, Revenue Bonds, Children’s Mercy | | | |
| | Hospital, Series 2017A: | | | |
| 1,250 | | 4.000%, 5/15/42 | 5/25 at 102.00 | A+ | 1,306,588 |
| 16,750 | | 4.000%, 5/15/48 | 5/25 at 102.00 | A+ | 17,278,462 |
| 7,925 | | Missouri Health and Educational Facilities Authority, Revenue Bonds, Lutheran Senior | 2/26 at 100.00 | BBB | 7,382,138 |
| | Services Projects, Series 2016A, 5.000%, 2/01/46 | | | |
| 3,370 | | Missouri Health and Educational Facilities Authority, Revenue Bonds, Lutheran Senior | 2/26 at 100.00 | BBB | 3,139,155 |
| | Services Projects, Series 2016B, 5.000%, 2/01/46 | | | |
| 400 | | Missouri Health and Educational Facilities Authority, Revenue Bonds, Maryville | 6/22 at 100.00 | Baa2 | 403,384 |
| | University of St Louis Project, Series 2015, 3.500%, 6/15/30 | | | |
| | Missouri Health and Educational Facilities Authority, Revenue Bonds, Saint Louis | | | |
| | University, Series 2017A: | | | |
| 725 | | 4.000%, 10/01/36 | 4/27 at 100.00 | A1 | 793,795 |
| 3,510 | | 5.000%, 10/01/42 | 4/27 at 100.00 | A1 | 4,062,474 |
| 3,775 | | Missouri Health and Educational Facilities Authority, Revenue Bonds, Webster University, | 4/21 at 100.00 | Baa1 (4) | 3,920,979 |
| | Series 2011, 5.000%, 4/01/26 (Pre-refunded 4/01/21) | | | |
| 2,000 | | Missouri Joint Municipal Electric Utility Commission, Power Supply System Revenue Bonds, | 6/27 at 100.00 | A2 | 2,262,540 |
| | MoPEP Facilities, Series 2018, 5.000%, 12/01/43 | | | |
| 1,000 | | North Central Missouri Regional Water Commission, Waterworks System Revenue Bonds, | 6/20 at 100.00 | N/R | 1,000,690 |
| | Series 2006, 5.000%, 1/01/37 | | | |
| 2,000 | | Saint Charles County Public Water Supply District 2, Missouri, Certificates of | 12/21 at 100.00 | AA+ | 2,059,000 |
| | Participation, Series 2015, 4.125%, 12/01/38 | | | |
| 575 | | Saint Louis County Industrial Development Authority, Missouri, Revenue Bonds, Friendship | 9/22 at 100.00 | N/R (4) | 630,235 |
| | Village of Chesterfield, Series 2012, 5.000%, 9/01/42 (Pre-refunded 9/01/22) | | | |
| 375 | | Saint Louis County Industrial Development Authority, Missouri, Revenue Bonds, Friendship | 9/23 at 100.00 | BB+ | 376,590 |
| | Village of Sunset Hills, Series 2013A, 5.875%, 9/01/43 | | | |
| 1,000 | | Saint Louis County Industrial Development Authority, Missouri, Revenue Bonds, Friendship | 9/27 at 100.00 | BB+ | 833,750 |
| | Village Saint Louis Obligated Group, Series 2017, 5.000%, 9/01/48 | | | |
| 490 | | Saint Louis, Missouri, Airport Revenue Bonds, Lambert-St Louis International Airport, | 7/22 at 100.00 | A | 506,513 |
| | Refunding Series 2012, 4.250%, 7/01/29 – FGIC Insured (AMT) | | | |
| 127,400 | | Total Missouri | | | 130,320,831 |
| | Montana – 0.2% (0.1% of Total Investments) | | | |
| 3,315 | | Montana Facilities Finance Authority, Montana, Health Facilities Reveue Bonds, Bozeman | 6/28 at 100.00 | A | 3,649,616 |
| | Deaconess Health Services Obligated Group, Series 2018, 5.000%, 6/01/48 | | | |
| 2,090 | | Montana Facility Finance Authority, Healthcare Facility Revenue Bonds, Kalispell | 7/28 at 100.00 | BBB | 2,263,407 |
| | Regional Medical Center, Series 2018B, 5.000%, 7/01/43 | | | |
| 5,405 | | Total Montana | | | 5,913,023 |
39
| | |
| NAD | Nuveen Quality Municipal Income Fund Portfolio of Investments (continued) April 30, 2020 (Unaudited) |
| | | | | | |
| Principal | | | Optional Call | | |
| Amount (000) | | Description (1) | Provisions (2) | Ratings (3) | Value |
| | Nebraska – 0.2% (0.1% of Total Investments) | | | |
| $ 2,300 | | Central Plains Energy Project, Nebraska, Gas Project 3 Revenue Bonds, Series 2012, | 9/22 at 100.00 | BBB+ | $ 2,440,277 |
| | 5.000%, 9/01/32 | | | |
| | Douglas County Hospital Authority 3, Nebraska, Health Facilities Revenue Bonds, Nebraska | | | |
| | Methodist Health System, Refunding Series 2015: | | | |
| 1,635 | | 4.125%, 11/01/36 | 11/25 at 100.00 | A | 1,692,290 |
| 1,000 | | 5.000%, 11/01/45 | 11/25 at 100.00 | A | 1,073,440 |
| 4,935 | | Total Nebraska | | | 5,206,007 |
| | Nevada – 0.8% (0.5% of Total Investments) | | | |
| | Las Vegas Valley Water District, Nevada, General Obligation Bonds, Refunding Series 2015: | | | |
| 9,000 | | 5.000%, 6/01/32 | 12/24 at 100.00 | AA+ | 10,297,440 |
| 5,000 | | 5.000%, 6/01/39 | 12/24 at 100.00 | AA+ | 5,615,300 |
| 2,600 | | Las Vegas Valley Water District, Nevada, General Obligation Bonds, Water Series 2012B, | 6/22 at 100.00 | AA+ | 2,760,732 |
| | 5.000%, 6/01/42 | | | |
| | Nevada System of Higher Education, Community College Revenue Bonds, Series 2017: | | | |
| 2,400 | | 4.000%, 7/01/41 | 7/27 at 100.00 | AA– | 2,595,672 |
| 2,000 | | 4.000%, 7/01/47 | 7/27 at 100.00 | AA– | 2,142,940 |
| | Washoe County, Nevada, General Obligation Bonds, Reno-Sparks Convention & Visitors | | | |
| | Authority, Refunding Series 2011: | | | |
| 95 | | 5.000%, 7/01/32 (Pre-refunded 7/01/21) | 7/21 at 100.00 | N/R (4) | 99,681 |
| 130 | | 5.000%, 7/01/32 (Pre-refunded 7/01/21) | 7/21 at 100.00 | N/R (4) | 136,405 |
| 1,825 | | 5.000%, 7/01/32 (Pre-refunded 7/01/21) | 7/21 at 100.00 | AA (4) | 1,916,013 |
| 23,050 | | Total Nevada | | | 25,564,183 |
| | New Hampshire – 0.4% (0.2% of Total Investments) | | | |
| 3,500 | | New Hampshire Health and Education Facilities Authority, Revenue Bonds, Catholic Medical | 7/22 at 100.00 | Baa2 | 3,557,190 |
| | Center, Series 2012, 4.000%, 7/01/32 | | | |
| 4,000 | | New Hampshire Health and Education Facilities Authority, Revenue Bonds, | 2/28 at 100.00 | A | 4,443,400 |
| | Dartmouth-Hitchcock Obligated Group, Series 2018A, 5.000%, 8/01/35 | | | |
| 2,445 | | New Hampshire Health and Education Facilities Authority, Revenue Bonds, | No Opt. Call | A | 2,982,460 |
| | Dartmouth-Hitchcock Obligated Group, Series 2020A, 5.000%, 8/01/59 | | | |
| 9,945 | | Total New Hampshire | | | 10,983,050 |
| | New Jersey – 4.5% (2.8% of Total Investments) | | | |
| 905 | | Camden County Improvement Authority, New Jersey, Health Care Redevelopment Revenue | 2/23 at 100.00 | BBB+ | 951,906 |
| | Bonds, Cooper Health System Obligated Group Issue, Series 2013A, 5.750%, 2/15/42 | | | |
| 5,000 | | New Jersey Economic Development Authority, New Jersey, Transit Transportation Project | 11/29 at 100.00 | BBB+ | 4,931,300 |
| | Revenue Bonds, Series 2020A, 5.000%, 11/01/44 | | | |
| | New Jersey Economic Development Authority, Private Activity Bonds, The Goethals Bridge | | | |
| | Replacement Project, Series 2013: | | | |
| 1,965 | | 5.000%, 1/01/31 – AGM Insured (AMT) | 1/24 at 100.00 | BBB | 2,011,001 |
| 1,865 | | 5.125%, 1/01/39 – AGM Insured (AMT) | 1/24 at 100.00 | BBB | 1,889,991 |
| 1,585 | | 5.125%, 7/01/42 – AGM Insured (AMT) | 1/24 at 100.00 | BBB | 1,600,929 |
| 2,000 | | New Jersey Economic Development Authority, School Facilities Construction Bonds, | 12/26 at 100.00 | BBB+ | 2,082,640 |
| | Refunding Series 2016BBB, 5.500%, 6/15/31 | | | |
| 6,770 | | New Jersey Economic Development Authority, School Facilities Construction Bonds, Series | No Opt. Call | BBB+ | 7,299,279 |
| | 2005N-1, 5.500%, 9/01/27 – NPFG Insured | | | |
| 2,825 | | New Jersey Economic Development Authority, School Facilities Construction Bonds, Series | 6/24 at 100.00 | BBB+ | 2,859,126 |
| | 2014UU, 5.000%, 6/15/30 | | | |
| 555 | | New Jersey Economic Development Authority, Student Housing Revenue Bonds, Provident | 6/20 at 100.00 | N/R (4) | 557,142 |
| | Group-Montclair Properties LLC, Montclair State University Student Housing Project, Series | | | |
| | 2010A, 5.750%, 6/01/31 (Pre-refunded 6/01/20) | | | |
40
| | | | | | |
| Principal | | | Optional Call | | |
| Amount (000) | | Description (1) | Provisions (2) | Ratings (3) | Value |
| | New Jersey (continued) | | | |
| $ 6,030 | | New Jersey Economic Development Authority, Sublease Revenue Bonds, New Jersey Transit | No Opt. Call | BBB+ | $ 6,253,351 |
| | Corporation Projects, Refunding Series 2017B, 5.000%, 11/01/25 | | | |
| 1,480 | | New Jersey Health Care Facilities Financing Authority, New Jersey, Revenue Bonds, Saint | 6/20 at 100.00 | BB+ | 1,479,852 |
| | Peters University Hospital, Series 2007, 5.750%, 7/01/37 | | | |
| 8,415 | | New Jersey Health Care Facilities Financing Authority, Revenue Bonds, RWJ Barnabas | 7/26 at 100.00 | A1 | 9,188,002 |
| | Health Obligated Group, Refunding Series 2016A, 5.000%, 7/01/43 | | | |
| 2,000 | | New Jersey Health Care Facilities Financing Authority, Revenue Bonds, Saint Barnabas | 7/21 at 100.00 | N/R (4) | 2,112,940 |
| | Health Care System, Refunding Series 2011A, 5.625%, 7/01/32 (Pre-refunded 7/01/21) | | | |
| 1,235 | | New Jersey Health Care Facilities Financing Authority, Revenue Bonds, University | 7/25 at 100.00 | BB– | 1,252,969 |
| | Hospital Issue, Refunding Series 2015A, 5.000%, 7/01/46 – AGM Insured | | | |
| | New Jersey Transportation Trust Fund Authority, Federal Highway Reimbursement Revenue | | | |
| | Notes, Series 2016A-1: | | | |
| 2,020 | | 5.000%, 6/15/28 | 6/26 at 100.00 | Baa1 | 2,180,449 |
| 3,340 | | 5.000%, 6/15/29 | 6/26 at 100.00 | Baa1 | 3,589,231 |
| 1,000 | | New Jersey Transportation Trust Fund Authority, Transportation System Bonds, Capital | No Opt. Call | BBB+ | 795,500 |
| | Appreciation Series 2010A, 0.000%, 12/15/26 | | | |
| | New Jersey Transportation Trust Fund Authority, Transportation System Bonds, Refunding | | | |
| | Series 2006C: | | | |
| 21,120 | | 0.000%, 12/15/28 – AMBAC Insured | No Opt. Call | BBB+ | 15,539,462 |
| 10,000 | | 0.000%, 12/15/32 – AGM Insured | No Opt. Call | BBB+ | 6,776,600 |
| 20,000 | | 0.000%, 12/15/33 – AGM Insured | No Opt. Call | BBB+ | 13,003,600 |
| 25,000 | | 0.000%, 12/15/35 – AMBAC Insured | No Opt. Call | BBB+ | 13,057,000 |
| 30,000 | | 0.000%, 12/15/36 – AMBAC Insured | No Opt. Call | BBB+ | 14,928,300 |
| 7,330 | | New Jersey Transportation Trust Fund Authority, Transportation System Bonds, Series | 6/21 at 100.00 | BBB+ | 7,387,467 |
| | 2011B, 5.500%, 6/15/31 | | | |
| 1,000 | | New Jersey Transportation Trust Fund Authority, Transportation System Bonds, Series | 6/22 at 100.00 | BBB+ | 996,480 |
| | 2012A, 5.000%, 6/15/42 | | | |
| | New Jersey Transportation Trust Fund Authority, Transportation System Bonds, Series 2015AA: | | | |
| 1,690 | | 5.250%, 6/15/33 | 6/25 at 100.00 | BBB+ | 1,720,454 |
| 2,840 | | 5.000%, 6/15/45 | 6/25 at 100.00 | BBB+ | 2,794,872 |
| | New Jersey Transportation Trust Fund Authority, Transportation System Bonds, Series 2019A: | | | |
| 665 | | 4.000%, 12/15/39 | 12/29 at 100.00 | BBB+ | 610,523 |
| 2,800 | | 5.000%, 12/15/39 | 12/29 at 100.00 | BBB+ | 2,812,516 |
| 2,460 | | New Jersey Turnpike Authority, Revenue Bonds, Series 2017B, 4.000%, 1/01/34 | 1/28 at 100.00 | A2 | 2,603,074 |
| 1,315 | | New Jersey Turnpike Authority, Revenue Bonds, Tender Option Bond Trust 2016-XF1057, | 7/22 at 100.00 | A2 | 1,697,770 |
| | 16.958%, 1/01/43, 144A (IF) (5) | | | |
| 570 | | Rutgers State University, New Jersey, Revenue Bonds, Refunding Series 2013L, 5.000%, | 5/23 at 100.00 | A+ (4) | 640,994 |
| | 5/01/43 (Pre-refunded 5/01/23) | | | |
| 3,215 | | Tobacco Settlement Financing Corporation, New Jersey, Tobacco Settlement Asset-Backed | 6/28 at 100.00 | A– | 3,608,612 |
| | Bonds, Series 2018A, 5.000%, 6/01/36 | | | |
| 380 | | Tobacco Settlement Financing Corporation, New Jersey, Tobacco Settlement Asset-Backed | 6/28 at 100.00 | BB+ | 382,531 |
| | Bonds, Series 2018B, 5.000%, 6/01/46 | | | |
| 179,375 | | Total New Jersey | | | 139,595,863 |
| | New Mexico – 0.6% (0.4% of Total Investments) | | | |
| 2,000 | | Farmington, New Mexico, Pollution Control Revenue Bonds, Public Service Company of New | 6/20 at 100.00 | BBB | 2,001,020 |
| | Mexico San Juan Project, Refunding Series 2010D, 5.900%, 6/01/40 | | | |
| 3,370 | | New Mexico Hospital Equipment Loan Council, Hospital Revenue Bonds, Presbyterian | 11/27 at 100.00 | Aa3 | 3,824,074 |
| | Healthcare Services, Series 2017A, 5.000%, 8/01/46 | | | |
| | New Mexico Hospital Equipment Loan Council, Hospital Revenue Bonds, Presbyterian | | | |
| | Healthcare Services, Series 2019A: | | | |
| 1,575 | | 5.000%, 8/01/44 | 8/29 at 100.00 | Aa3 | 1,835,442 |
| 4,760 | | 4.000%, 8/01/48 | 8/29 at 100.00 | Aa3 | 5,092,153 |
| 4,585 | | Santa Fe County, New Mexico, Correctional System Gross Receipts Tax Revenue Bonds, | No Opt. Call | A2 | 5,336,710 |
| | Series 1997, 6.000%, 2/01/27 – AGM Insured | | | |
| 16,290 | | Total New Mexico | | | 18,089,399 |
41
| | |
| NAD | Nuveen Quality Municipal Income Fund Portfolio of Investments (continued) April 30, 2020 (Unaudited) |
| | | | | | |
| Principal | | | Optional Call | | |
| Amount (000) | | Description (1) | Provisions (2) | Ratings (3) | Value |
| | New York – 8.5% (5.3% of Total Investments) | | | |
| $ 6,600 | | Brooklyn Arena Local Development Corporation, New York, Payment in Lieu of Taxes Revenue | No Opt. Call | B+ | $ 1,835,262 |
| | Bonds, Barclays Center Project, Series 2009, 0.000%, 7/15/44 | | | |
| 490 | | Buffalo and Erie County Industrial Land Development Corporation, New York, Revenue | 7/25 at 100.00 | Baa2 | 546,125 |
| | Bonds, Catholic Health System, Inc Project, Series 2015, 5.250%, 7/01/35 | | | |
| 3,125 | | Dormitory Authority of the State of New York, General Revenue Bonds, Saint Johns | 7/23 at 100.00 | A– | 3,269,500 |
| | University, Series 2013A, 5.000%, 7/01/44 | | | |
| | Dormitory Authority of the State of New York, Revenue Bonds, North Shore Long Island | | | |
| | Jewish Obligated Group, Series 2015A: | | | |
| 1,680 | | 4.125%, 5/01/42 | 5/25 at 100.00 | A– | 1,741,522 |
| 3,195 | | 5.000%, 5/01/43 | 5/25 at 100.00 | A– | 3,435,360 |
| 600 | | Dormitory Authority of the State of New York, Revenue Bonds, Orange Regional Medical | 6/27 at 100.00 | BBB– | 661,500 |
| | Center Obligated Group, Series 2017, 5.000%, 12/01/34, 144A | | | |
| 5,325 | | Dormitory Authority of the State of New York, State Personal Income Tax Revenue Bonds, | 3/21 at 100.00 | AA+ | 5,477,295 |
| | General Purpose Series 2011C, 5.000%, 3/15/41 | | | |
| 20,000 | | Dormitory Authority of the State of New York, State Personal Income Tax Revenue Bonds, | 2/30 at 100.00 | Aa1 | 23,687,200 |
| | General Purpose, Series 2019D, 5.000%, 2/15/48 | | | |
| | Hudson Yards Infrastructure Corporation, New York, Revenue Bonds, Senior Fiscal 2012 | | | |
| | Series 2011A: | | | |
| 135 | | 5.250%, 2/15/47 (Pre-refunded 2/15/21) | 2/21 at 100.00 | Aa2 (4) | 139,837 |
| 2,965 | | 5.250%, 2/15/47 | 2/21 at 100.00 | AA– | 3,051,370 |
| 990 | | 5.750%, 2/15/47 | 2/21 at 100.00 | AA– | 1,022,502 |
| 1,610 | | 5.750%, 2/15/47 (Pre-refunded 2/15/21) | 2/21 at 100.00 | Aa2 (4) | 1,673,933 |
| 7,500 | | Liberty Development Corporation, New York, Goldman Sachs Headquarter Revenue Bonds, | No Opt. Call | BBB+ | 9,367,725 |
| | Series 2005, 5.250%, 10/01/35 | | | |
| | Long Island Power Authority, New York, Electric System General Revenue Bonds, Series 2014A: | | | |
| 1,155 | | 4.000%, 9/01/39 – AGM Insured | 9/24 at 100.00 | A2 | 1,220,569 |
| 3,000 | | 5.000%, 9/01/39 | 9/24 at 100.00 | A | 3,355,770 |
| 860 | | 5.000%, 9/01/44 | 9/24 at 100.00 | A | 955,967 |
| 5,000 | | Long Island Power Authority, New York, Electric System General Revenue Bonds, Series | 9/28 at 100.00 | A | 5,833,000 |
| | 2018, 5.000%, 9/01/37 | | | |
| 10,000 | | Metropolitan Transportation Authority, New York, Dedicated Tax Fund Bonds, Refunding | No Opt. Call | AA | 5,830,800 |
| | Series 2012A, 0.000%, 11/15/32 | | | |
| | Metropolitan Transportation Authority, New York, Transportation Revenue Bonds, Series 2011A: | | | |
| 285 | | 5.000%, 11/15/41 (Pre-refunded 11/15/21) | 11/21 at 100.00 | N/R (4) | 303,896 |
| 465 | | 5.000%, 11/15/41 (Pre-refunded 11/15/21) | 11/21 at 100.00 | A– (4) | 495,829 |
| 5,000 | | Metropolitan Transportation Authority, New York, Transportation Revenue Bonds, Series | 5/23 at 100.00 | A– | 5,006,850 |
| | 2013A, 5.000%, 11/15/38 | | | |
| | New York City Industrial Development Agency, New York, Civic Facility Revenue Bonds, | | | |
| | Bronx Parking Development Company, LLC Project, Series 2007: | | | |
| 500 | | 3.163%, 10/01/37 (8) | 6/20 at 100.00 | N/R | 385,000 |
| 1,000 | | 3.231%, 10/01/46 (8) | 6/20 at 100.00 | N/R | 770,000 |
| 4,755 | | New York City Industrial Development Agency, New York, Revenue Bonds, Yankee Stadium | 6/20 at 100.00 | A3 | 4,801,409 |
| | Project PILOT, Series 2009A, 7.000%, 3/01/49 – AGC Insured | | | |
| | New York City Municipal Water Finance Authority, New York, Water and Sewer System | | | |
| | Revenue Bonds, Second Generation Resolution, Fiscal 2011 Series EE: | | | |
| 1,150 | | 5.375%, 6/15/43 | 12/20 at 100.00 | AA+ | 1,176,036 |
| 2,250 | | 5.375%, 6/15/43 (Pre-refunded 12/15/20) | 12/20 at 100.00 | N/R (4) | 2,314,867 |
| 5,900 | | New York City Municipal Water Finance Authority, New York, Water and Sewer System Second | 6/23 at 100.00 | AA+ | 6,405,099 |
| | General Resolution Revenue Bonds, Fiscal 2014 Series BB, 5.000%, 6/15/46 | | | |
| 5,000 | | New York City Transitional Finance Authority, New York, Future Tax Secured Bonds, | 5/23 at 100.00 | Aa1 | 5,454,050 |
| | Subordinate Fiscal 2013 Series I, 5.000%, 5/01/38 | | | |
| 2,000 | | New York City Transitional Finance Authority, New York, Future Tax Secured Bonds, | 5/26 at 100.00 | Aa1 | 2,283,960 |
| | Subordinate Fiscal 2017 Series A-1, 5.000%, 5/01/40 | | | |
42
| | | | | | |
| Principal | | | Optional Call | | |
| Amount (000) | | Description (1) | Provisions (2) | Ratings (3) | Value |
| | New York (continued) | | | |
| $ 3,760 | | New York City Transitional Finance Authority, New York, Future Tax Secured Bonds, | 2/27 at 100.00 | Aa1 | $ 4,271,360 |
| | Subordinate Fiscal 2017 Series E-1, 5.000%, 2/01/43 | | | |
| 5,000 | | New York City Transitional Finance Authority, New York, Future Tax Secured Bonds, | 5/28 at 100.00 | Aa1 | 5,829,500 |
| | Subordinate Fiscal 2018 Series C-3, 5.000%, 5/01/40 | | | |
| | New York City Transitional Finance Authority, New York, Future Tax Secured Bonds, | | | |
| | Subordinate Fiscal 2020 Subseries B-1: | | | |
| 14,405 | | 4.000%, 11/01/41 | 11/29 at 100.00 | Aa1 | 15,574,686 |
| 5,875 | | 4.000%, 11/01/47 | 11/29 at 100.00 | Aa1 | 6,297,941 |
| 2,060 | | New York City, New York, General Obligation Bonds, Fiscal 2017 Series B-1, 5.000%, 12/01/41 | 12/26 at 100.00 | AA | 2,378,909 |
| 11,000 | | New York City, New York, General Obligation Bonds, Fiscal 2020 Series A-1, 4.000%, 8/01/40 | 8/29 at 100.00 | AA | 11,853,490 |
| 5 | | New York City, New York, General Obligation Bonds, Fiscal Series 2005M, 5.000%, 4/01/24 | 6/20 at 100.00 | AA | 5,016 |
| 2,000 | | New York Convention Center Development Corporation, New York, Revenue Bonds, Hotel Unit | 11/25 at 100.00 | Aa3 | 2,072,400 |
| | Fee Secured, Refunding Series 2015, 5.000%, 11/15/45 | | | |
| 535 | | New York Counties Tobacco Trust I, Tobacco Settlement Pass-Through Bonds, Series 2000B, | 6/20 at 100.00 | Baa1 | 525,900 |
| | 6.500%, 6/01/35 | | | |
| 25,170 | | New York Liberty Development Corporation, New York, Liberty Revenue Bonds, 3 World Trade | 11/24 at 100.00 | N/R | 24,139,792 |
| | Center Project, Class 1 Series 2014, 5.000%, 11/15/44, 144A | | | |
| | New York Liberty Development Corporation, New York, Liberty Revenue Bonds, 4 World Trade | | | |
| | Center Project, Series 2011: | | | |
| 1,560 | | 5.000%, 11/15/44 | 11/21 at 100.00 | A | 1,614,335 |
| 4,350 | | 5.750%, 11/15/51 | 11/21 at 100.00 | A | 4,545,445 |
| | New York Transportation Development Corporation, New York, Special Facilities Bonds, | | | |
| | LaGuardia Airport Terminal B Redevelopment Project, Series 2016A: | | | |
| 2,000 | | 4.000%, 7/01/35 – AGM Insured (AMT) | 7/24 at 100.00 | BBB | 2,028,560 |
| 10,800 | | 5.000%, 7/01/41 (AMT) | 7/24 at 100.00 | Baa3 | 11,026,692 |
| 29,390 | | 5.000%, 7/01/46 (AMT) | 7/24 at 100.00 | Baa3 | 29,797,639 |
| 5,260 | | New York Transportation Development Corporation, New York, Special Facility Revenue | 8/21 at 100.00 | B | 5,141,019 |
| | Bonds, American Airlines, Inc John F Kennedy International Airport Project, Refunding Series | | | |
| | 2016, 5.000%, 8/01/31 (AMT) | | | |
| 3,050 | | New York Transportation Development Corporation, New York, Special Facility Revenue | 1/28 at 100.00 | BB+ | 3,061,346 |
| | Bonds, Delta Air Lines, Inc – LaGuardia Airport Terminals C&D Redevelopment Project, Series | | | |
| | 2018, 5.000%, 1/01/33 (AMT) | | | |
| 1,310 | | Port Authority of New York and New Jersey, Consolidated Revenue Bonds, One Hundred | 12/23 at 100.00 | AA– | 1,415,691 |
| | Seventy Eighth Series 2013, 5.000%, 12/01/43 (AMT) | | | |
| 4,320 | | Port Authority of New York and New Jersey, Consolidated Revenue Bonds, One Hundred | 12/23 at 100.00 | AA– | 4,707,115 |
| | Seventy Ninth Series 2013, 5.000%, 12/01/38 | | | |
| | Port Authority of New York and New Jersey, Special Project Bonds, JFK International Air | | | |
| | Terminal LLC Project, Eighth Series 2010: | | | |
| 5,000 | | 6.500%, 12/01/28 | 6/20 at 100.00 | BBB+ | 5,045,250 |
| 590 | | 5.500%, 12/01/31 | 12/20 at 100.00 | BBB+ | 593,552 |
| 1,670 | | 6.000%, 12/01/36 | 12/20 at 100.00 | BBB+ | 1,682,258 |
| 3,045 | | 6.000%, 12/01/42 | 12/20 at 100.00 | BBB+ | 3,069,664 |
| 1,170 | | Suffolk County Economic Development Corporation, New York, Revenue Bonds, Peconic | 12/20 at 100.00 | BBB– | 1,204,609 |
| | Landing At Southold, Inc Project, Refunding Series 2010, 5.875%, 12/01/30 | | | |
| | Syracuse Industrial Development Authority, New York, PILOT Revenue Bonds, Carousel | | | |
| | Center Project, Refunding Series 2016A: | | | |
| 2,835 | | 5.000%, 1/01/29 (AMT) | 1/26 at 100.00 | Ba3 | 2,629,207 |
| 2,700 | | 5.000%, 1/01/34 (AMT) | 1/26 at 100.00 | Ba3 | 2,334,555 |
| 8,750 | | TSASC Inc, New York, Tobacco Asset-Backed Bonds, Series 2006, 5.000%, 6/01/45 | 6/27 at 100.00 | CCC+ | 8,080,012 |
| 260,145 | | Total New York | | | 263,428,176 |
| | North Carolina – 1.5% (1.0% of Total Investments) | | | |
| 12,250 | | Fayetteville State University, North Carolina, General Revenue Bonds, Series 2013A, | 4/23 at 100.00 | BBB+ | 13,388,883 |
| | 5.125%, 4/01/43 | | | |
| 3,480 | | North Carolina Department of Transportation, Private Activity Revenue Bonds, I-77 Hot | 6/25 at 100.00 | BBB– | 3,407,199 |
| | Lanes Project, Series 2015, 5.000%, 6/30/54 (AMT) | | | |
43
| | |
| NAD | Nuveen Quality Municipal Income Fund Portfolio of Investments (continued) April 30, 2020 (Unaudited) |
| | | | | | |
| Principal | | | Optional Call | | |
| Amount (000) | | Description (1) | Provisions (2) | Ratings (3) | Value |
| | North Carolina (continued) | | | |
| $ 10,300 | | North Carolina Eastern Municipal Power Agency, Power System Revenue Bonds, Refunding | No Opt. Call | Baa2 (4) | $ 11,178,693 |
| | Series 1993B, 6.000%, 1/01/22 – CAPMAC Insured (ETM) (UB) (5) | | | |
| 1,570 | | North Carolina Medical Care Commission, Retirement Facilities First Mortgage Revenue | 10/24 at 102.00 | N/R | 1,533,921 |
| | Bonds, Southminster Project, Refunding Series 2016, 5.000%, 10/01/31 | | | |
| 8,275 | | North Carolina Medical Care Commission, Health Care Facilities Revenue Bonds, Novant | 11/29 at 100.00 | AA– | 8,619,819 |
| | Health Obligated Group, Series 2019A, 4.000%, 11/01/49 | | | |
| | North Carolina Medical Care Commission, Health Care Facilities Revenue Bonds, WakeMed, | | | |
| | Refunding Series 2012A: | | | |
| 5,000 | | 5.000%, 10/01/27 | 10/22 at 100.00 | A2 | 5,296,250 |
| 3,400 | | 5.000%, 10/01/31 | 10/22 at 100.00 | A2 | 3,570,204 |
| 500 | | North Carolina Municipal Power Agency 1, Catawba Electric Revenue Bonds, Refunding | 1/26 at 100.00 | A | 570,950 |
| | Series 2015A, 5.000%, 1/01/32 | | | |
| 44,775 | | Total North Carolina | | | 47,565,919 |
| | North Dakota – 0.5% (0.3% of Total Investments) | | | |
| 675 | | Burleigh County, North Dakota, Health Care Revenue Bonds, Saint Alexius Medical Center | 7/22 at 100.00 | N/R (4) | 734,474 |
| | Project, Refunding Series 2012A, 5.000%, 7/01/38 (Pre-refunded 7/01/22) | | | |
| 6,100 | | Fargo, North Dakota, Health System Revenue Bonds, Sanford Health, Refunding Series | 11/21 at 100.00 | A2 | 6,401,462 |
| | 2011, 6.250%, 11/01/31 | | | |
| 1,875 | | Grand Forks, North Dakota, Health Care System Revenue Bonds, Altru Health System | 12/21 at 100.00 | Baa2 | 1,910,607 |
| | Obligated Group, Series 2012, 5.000%, 12/01/32 | | | |
| 5,000 | | Grand Forks, North Dakota, Health Care System Revenue Bonds, Altru Health System | 12/27 at 100.00 | Baa2 | 4,838,950 |
| | Obligated Group, Series 2017A, 4.000%, 12/01/47 | | | |
| 700 | | Grand Forks, North Dakota, Senior Housing & Nursing Facilities Revenue Bonds, Valley | 12/26 at 100.00 | N/R | 631,862 |
| | Homes and Services Obligated Group, Series 2017, 5.000%, 12/01/36 | | | |
| 14,350 | | Total North Dakota | | | 14,517,355 |
| | Ohio – 6.9% (4.3% of Total Investments) | | | |
| 6,250 | | Akron, Bath and Copley Joint Township Hospital District, Ohio, Hospital Facilities | 11/26 at 100.00 | Baa2 | 6,869,563 |
| | Revenue Bonds, Summa Health System, Refunding & Improvement Series 2016, 5.250%, 11/15/46 | | | |
| 6,000 | | Allen County, Ohio, Hospital Facilities Revenue Bonds, Mercy Health, Series 2017A, | 2/28 at 100.00 | A+ | 6,302,220 |
| | 4.000%, 8/01/36 | | | |
| 1,340 | | Bowling Green State University, Ohio, General Receipts Bonds, Series 2017B, 5.000%, 6/01/45 | 6/27 at 100.00 | A+ | 1,490,509 |
| 24,740 | | Buckeye Tobacco Settlement Financing Authority, Ohio, Tobacco Settlement Asset-Backed | 6/30 at 22.36 | N/R | 2,618,729 |
| | Revenue Bonds, Refunding Senior Lien Capital Appreciation Series 2020B-3 Class 2, | | | |
| | 0.000%, 6/01/57 | | | |
| 790 | | Buckeye Tobacco Settlement Financing Authority, Ohio, Tobacco Settlement Asset-Backed | 6/30 at 100.00 | BBB+ | 792,583 |
| | Revenue Bonds, Refunding Senior Lien Series 2020A-2 Class 1, 4.000%, 6/01/48 | | | |
| 32,855 | | Buckeye Tobacco Settlement Financing Authority, Ohio, Tobacco Settlement Asset-Backed | 6/30 at 100.00 | N/R | 29,331,630 |
| | Revenue Bonds, Refunding Senior Lien Series 2020B-2 Class 2, 5.000%, 6/01/55 | | | |
| 24,910 | | Buckeye Tobacco Settlement Financing Authority, Ohio, Tobacco Settlement Asset-Backed | 6/22 at 100.00 | Caa3 (4) | 27,719,848 |
| | Revenue Bonds, Senior Lien Series 2007A-3, 6.250%, 6/01/37 (Pre-refunded 6/01/22) | | | |
| | Butler County, Ohio, Hospital Facilities Revenue Bonds, UC Health, Refunding Series 2017: | | | |
| 3,940 | | 4.000%, 11/15/34 | 11/27 at 100.00 | A3 | 4,107,253 |
| 3,000 | | 4.000%, 11/15/35 | 11/27 at 100.00 | A3 | 3,104,820 |
| | Butler County, Ohio, Hospital Facilities Revenue Bonds, UC Health, Series 2010: | | | |
| 7,125 | | 5.250%, 11/01/29 (Pre-refunded 11/01/20) | 11/20 at 100.00 | A3 (4) | 7,284,172 |
| 1,665 | | 5.500%, 11/01/40 (Pre-refunded 11/01/20) | 11/20 at 100.00 | N/R (4) | 1,704,244 |
| 3,335 | | 5.500%, 11/01/40 (Pre-refunded 11/01/20) | 11/20 at 100.00 | A3 (4) | 3,413,606 |
| 1,000 | | 5.750%, 11/01/40 (Pre-refunded 11/01/20) | 11/20 at 100.00 | A3 (4) | 1,024,790 |
| 4,795 | | Fairfield County, Ohio, Hospital Facilities Revenue Bonds, Fairfield Medical Center | 6/23 at 100.00 | Ba2 | 4,920,437 |
| | Project, Series 2013, 5.000%, 6/15/43 | | | |
| 760 | | Franklin County, Ohio, Healthcare Facilities Revenue Bonds, Ohio Presbyterian Retirement | 7/20 at 100.00 | BBB | 763,952 |
| | Services, Improvement Series 2010A, 5.625%, 7/01/26 | | | |
44
| | | | | | |
| Principal | | | Optional Call | | |
| Amount (000) | | Description (1) | Provisions (2) | Ratings (3) | Value |
| | Ohio (continued) | | | |
| $ 5,000 | | Hamilton County, Ohio, Hospital Facilities Revenue Bonds, TriHealth, Inc Obligated Group | 8/27 at 100.00 | A+ | $ 5,586,800 |
| | Project, Series 2017A, 5.000%, 8/15/42 | | | |
| | JobsOhio Beverage System, Ohio, Statewide Liquor Profits Revenue Bonds, Senior Lien | | | |
| | Series 2013A: | | | |
| 1,000 | | 5.000%, 1/01/38 (Pre-refunded 1/01/23) | 1/23 at 100.00 | Aa3 (4) | 1,110,800 |
| 16,820 | | 5.000%, 1/01/38 (Pre-refunded 1/01/23) (UB) (5) | 1/23 at 100.00 | Aa3 (4) | 18,683,656 |
| | JobsOhio Beverage System, Ohio, Statewide Senior Lien Liquor Profits Revenue Bonds, | | | |
| | Tender Option Bond Trust 2016-XG0052: | | | |
| 265 | | 17.288%, 1/01/38, (Pre-refunded 1/01/23) 144A (IF) (5) | 1/23 at 100.00 | Aa3 (4) | 381,555 |
| 625 | | 17.415%, 1/01/38, (Pre-refunded 1/01/23) 144A (IF) (5) | 1/23 at 100.00 | Aa3 (4) | 902,006 |
| 975 | | 17.415%, 1/01/38, (Pre-refunded 1/01/23) 144A (IF) (5) | 1/23 at 100.00 | Aa3 (4) | 1,407,130 |
| 1,315 | | 17.415%, 1/01/38, (Pre-refunded 1/01/23) 144A (IF) (5) | 1/23 at 100.00 | Aa3 (4) | 1,897,821 |
| 8,360 | | Lake County, Ohio, Hospital Facilities Revenue Bonds, Lake Hospital System, Inc, | 8/25 at 100.00 | Baa1 | 8,953,226 |
| | Refunding Series 2015, 5.000%, 8/15/45 | | | |
| 7,495 | | Lucas County, Ohio, Hospital Revenue Bonds, ProMedica Healthcare Obligated Group, Series | 11/21 at 100.00 | Baa3 (4) | 8,085,456 |
| | 2011A, 6.000%, 11/15/41 (Pre-refunded 11/15/21) | | | |
| 1,000 | | Middleburg Heights, Ohio, Hospital Facilities Revenue Bonds, Southwest General Health | 8/21 at 100.00 | A2 | 1,027,930 |
| | Center Project, Refunding Series 2011, 5.125%, 8/01/31 | | | |
| 2,000 | | Muskingum County, Ohio, Hospital Facilities Revenue Bonds, Genesis HealthCare System | 2/23 at 100.00 | Ba2 | 2,040,740 |
| | Obligated Group Project, Series 2013, 5.000%, 2/15/33 | | | |
| 3,000 | | Ohio Air Quality Development Authority, Ohio, Pollution Control Revenue Bonds, | No Opt. Call | N/R | 3,007,500 |
| | FirstEnergy Generation Corporation Project, Refunding Series 2009D, 4.250%, 8/01/29 | | | |
| | (Mandatory Put 9/15/21) (8) | | | |
| 1,000 | | Ohio Higher Educational Facilities Commission, Revenue Bonds, University of Dayton, | 12/20 at 100.00 | A2 | 1,014,170 |
| | Refunding Series 2011A, 5.375%, 12/01/30 | | | |
| 4,350 | | Ohio Higher Educational Facility Commission, Revenue Bonds, University of Dayton, Series | 6/25 at 100.00 | A2 | 4,586,510 |
| | 2015A, 5.000%, 12/01/44 | | | |
| 4,165 | | Ohio State, Hospital Revenue Bonds, University Hospitals Health System, Inc, Series | 1/30 at 100.00 | A | 4,641,851 |
| | 2020A, 5.000%, 1/15/50 | | | |
| | Ohio Turnpike Commission, Turnpike Revenue Bonds, Infrastructure Project, Junior Lien | | | |
| | Series 2013A-1: | | | |
| 1,500 | | 5.250%, 2/15/39 | 2/23 at 100.00 | A+ | 1,612,725 |
| 10,530 | | 5.000%, 2/15/48 (Pre-refunded 2/15/23) | 2/23 at 100.00 | A+ (4) | 11,734,316 |
| 3,710 | | Ohio Turnpike Commission, Turnpike Revenue Bonds, Infrastructure Projects, Junior Lien | 2/31 at 100.00 | A+ | 4,193,561 |
| | Convertible Series 2013A-3, 0.000%, 2/15/36 (7) | | | |
| | Ohio Turnpike Commission, Turnpike Revenue Bonds, Infrastructure Projects, Junior Lien | | | |
| | Series 2018A: | | | |
| 3,375 | | 4.000%, 2/15/38 | 2/28 at 100.00 | A+ | 3,699,101 |
| 16,325 | | 5.000%, 2/15/43 | 2/28 at 100.00 | A+ | 19,012,095 |
| 8,510 | | Ross County, Ohio, Hospital Facilities Revenue Bonds, Adena Health System Obligated | 12/29 at 100.00 | A– | 9,329,683 |
| | Group Project, Refunding & Improvement Series 2019, 5.000%, 12/01/49 | | | |
| 725 | | Warren County, Ohio, Healthcare Facilities Revenue Bonds, Otterbein Homes Obligated | 7/29 at 100.00 | A | 728,843 |
| | Group, Refunding Series 2019A, 4.000%, 7/01/45 | | | |
| 224,550 | | Total Ohio | | | 215,085,831 |
| | Oklahoma – 0.4% (0.2% of Total Investments) | | | |
| 1,750 | | Fort Sill Apache Tribe of Oklahoma Economic Development Authority, Gaming Enterprise | 8/21 at 100.00 | N/R (4) | 1,894,095 |
| | Revenue Bonds, Fort Sill Apache Casino, Series 2011A, 8.500%, 8/25/26 (Pre-refunded | | | |
| | 8/25/21), 144A | | | |
| 3,000 | | Tulsa Airports Improvement Trust, Oklahoma, General Airport Revenue Bonds, Series 2013A, | 6/23 at 100.00 | Baa1 | 3,311,370 |
| | 5.625%, 6/01/43 (AMT) | | | |
| 4,985 | | Tulsa Airports Improvement Trust, Oklahoma, General Airport Revenue Bonds, Series 2015A, | 6/24 at 100.00 | Baa1 | 5,418,346 |
| | 5.000%, 6/01/45 – BAM Insured (AMT) | | | |
| 1,000 | | Tulsa County Industrial Authority, Oklahoma, Senior Living Community Revenue Bonds, | 11/25 at 102.00 | BBB– | 999,930 |
| | Montereau, Inc Project, Refunding Series 2017, 5.250%, 11/15/37 | | | |
| 10,735 | | Total Oklahoma | | | 11,623,741 |
45
| | |
| NAD | Nuveen Quality Municipal Income Fund Portfolio of Investments (continued) April 30, 2020 (Unaudited) |
| | | | | | |
| Principal | | | Optional Call | | |
| Amount (000) | | Description (1) | Provisions (2) | Ratings (3) | Value |
| | Oregon – 2.0% (1.3% of Total Investments) | | | |
| $ 2,435 | | Beaverton School District 48J, Washington and Multnomah Counties, Oregon, General | 6/27 at 100.00 | AA+ | $ 2,943,647 |
| | Obligation Bonds, Convertible Deferred Interest Series 2017D, 5.000%, 6/15/36 | | | |
| 4,875 | | Deschutes County Hospital Facility Authority, Oregon, Hospital Revenue Bonds, Saint | 1/26 at 100.00 | A2 | 5,234,678 |
| | Charles Health System, Inc, Series 2016A, 5.000%, 1/01/48 | | | |
| 15,440 | | Oregon Facilities Authority, Revenue Bonds, Legacy Health Project, Series 2016A, 5.000%, 6/01/46 | 6/26 at 100.00 | A+ | 16,850,753 |
| 1,500 | | Oregon Health and Science University, Revenue Bonds, Refunding Series 2016B, 5.000%, 7/01/39 | 7/26 at 100.00 | AA– | 1,776,015 |
| | Port of Portland, Oregon, International Airport Revenue Bonds, Series 2017-24B: | | | |
| 4,000 | | 5.000%, 7/01/36 (AMT) | 1/27 at 100.00 | AA– | 4,402,320 |
| 1,000 | | 5.000%, 7/01/37 (AMT) | 1/27 at 100.00 | AA– | 1,097,700 |
| 7,645 | | 5.000%, 7/01/42 (AMT) | 1/27 at 100.00 | AA– | 8,307,592 |
| 19,000 | | 5.000%, 7/01/47 (AMT) | 1/27 at 100.00 | AA– | 20,506,320 |
| 2,000 | | University of Oregon, General Revenue Bonds, Series 2018A, 5.000%, 4/01/48 | 4/28 at 100.00 | AA– | 2,364,780 |
| 57,895 | | Total Oregon | | | 63,483,805 |
| | Pennsylvania – 5.0% (3.1% of Total Investments) | | | |
| 7,500 | | Allegheny County Hospital Development Authority, Pennsylvania, Revenue Bonds, Allegheny | 4/28 at 100.00 | A | 8,112,150 |
| | Health Network Obligated Group Issue, Series 2018A, 5.000%, 4/01/47 | | | |
| | Allegheny County, Pennsylvania, General Obligation Bonds, Series 2011C-65: | | | |
| 1,960 | | 5.375%, 5/01/31 | 5/21 at 100.00 | AA– | 2,042,418 |
| 2,570 | | 5.375%, 5/01/31 (Pre-refunded 5/01/21) | 5/21 at 100.00 | N/R (4) | 2,690,636 |
| 345 | | Commonwealth Financing Authority, Pennsylvania, State Appropriation Lease Bonds, Master | 6/28 at 100.00 | A | 390,492 |
| | Settlement, Series 2018, 5.000%, 6/01/34 | | | |
| | Delaware River Joint Toll Bridge Commission, New Jersey and Pennsylvania, Bridge System | | | |
| | Revenue Bonds, Series 2017: | | | |
| 3,500 | | 5.000%, 7/01/37 | 7/27 at 100.00 | A | 4,171,230 |
| 8,385 | | 5.000%, 7/01/42 | 7/27 at 100.00 | A | 9,884,909 |
| | Lehigh County Authority, Pennsylvania, Water and Sewer Revenue Bonds, Allentown | | | |
| | Concession, Capital Appreciation Series 2013B: | | | |
| 5,400 | | 0.000%, 12/01/33 | No Opt. Call | A | 3,684,582 |
| 11,000 | | 0.000%, 12/01/38 | No Opt. Call | A | 6,101,480 |
| 5,375 | | Lehigh County Authority, Pennsylvania, Water and Sewer Revenue Bonds, Allentown | 12/23 at 100.00 | A | 5,973,184 |
| | Concession, Series 2013A, 5.125%, 12/01/47 | | | |
| | Montgomery County Higher Education and Health Authority, Pennsylvania, Revenue Bonds, | | | |
| | Thomas Jefferson University, Series 2018A: | | | |
| 2,400 | | 5.000%, 9/01/35 | 9/28 at 100.00 | A | 2,664,144 |
| 5,210 | | 5.000%, 9/01/43 | 9/28 at 100.00 | A | 5,632,010 |
| | Montgomery County Higher Education and Health Authority, Pennsylvania, Revenue Bonds, | | | |
| | Thomas Jefferson University, Series 2019: | | | |
| 500 | | 4.000%, 9/01/44 | 9/29 at 100.00 | A | 503,670 |
| 165 | | 4.000%, 9/01/49 | 9/29 at 100.00 | A | 165,241 |
| 1,665 | | Montgomery County Industrial Development Authority, Pennsylvania, FHA Insured Mortgage | 8/20 at 100.00 | N/R (4) | 1,684,197 |
| | Revenue Bonds, New Regional Medical Center Project, Series 2010, 5.375%, 8/01/38 | | | |
| | (Pre-refunded 8/01/20) | | | |
| 3,430 | | Montgomery County Industrial Development Authority, Pennsylvania, Health System Revenue | 1/25 at 100.00 | Ba1 | 3,526,795 |
| | Bonds, Albert Einstein Healthcare Network Issue, Series 2015A, 5.250%, 1/15/45 | | | |
| 235 | | Pennsylvania Economic Development Financing Authority, Exempt Facilities Revenue Bonds, | 11/24 at 100.00 | N/R | 215,519 |
| | National Gypsum Company, Refunding Series 2014, 5.500%, 11/01/44 (AMT) | | | |
| 400 | | Pennsylvania Higher Educational Facilities Authority, Revenue Bonds, Edinboro University | 7/20 at 100.00 | N/R (4) | 403,324 |
| | Foundation Student Housing Project, Series 2010, 6.000%, 7/01/43 (Pre-refunded 7/01/20) | | | |
| 9,575 | | Pennsylvania Higher Educational Facilities Authority, Revenue Bonds, University of | 8/29 at 100.00 | Aa3 | 10,150,936 |
| | Pennsylvania Health System, Series 2019, 4.000%, 8/15/44 | | | |
| | Pennsylvania Turnpike Commission, Motor License Fund-Enhanced Turnpike Special Revenue | | | |
| | Bonds, Subordinate Series 2010A1&2: | | | |
| 940 | | 5.500%, 12/01/34 (Pre-refunded 12/01/20) | 12/20 at 100.00 | N/R (4) | 963,133 |
| 4,310 | | 5.500%, 12/01/34 (Pre-refunded 12/01/20) | 12/20 at 100.00 | A2 (4) | 4,416,069 |
46
| | | | | | |
| Principal | | | Optional Call | | |
| Amount (000) | | Description (1) | Provisions (2) | Ratings (3) | Value |
| | Pennsylvania (continued) | | | |
| $ 16,750 | | Pennsylvania Turnpike Commission, Turnpike Revenue Bonds, Capital Appreciation Series | 12/27 at 100.00 | A3 | $ 20,392,120 |
| | 2009E, 6.375%, 12/01/38 | | | |
| 4,305 | | Pennsylvania Turnpike Commission, Turnpike Revenue Bonds, Series 2015A-1, | 6/25 at 100.00 | A+ | 4,673,594 |
| | 5.000%, 12/01/45 | | | |
| 2,000 | | Pennsylvania Turnpike Commission, Turnpike Revenue Bonds, Subordinate Lien Series | 12/24 at 100.00 | A3 | 2,169,740 |
| | 2014A-1, 5.000%, 12/01/38 | | | |
| 14,500 | | Pennsylvania Turnpike Commission, Turnpike Revenue Bonds, Subordinate Series 2009C, | 6/26 at 100.00 | A2 | 18,109,340 |
| | 6.250%, 6/01/33 – AGM Insured | | | |
| 6,250 | | Pennsylvania Turnpike Commission, Turnpike Revenue Bonds, Subordinate Series 2015B-1, | 12/25 at 100.00 | A3 | 6,802,750 |
| | 5.000%, 12/01/45 | | | |
| 5,000 | | Pennsylvania Turnpike Commission, Turnpike Revenue Bonds, Subordinate Series 2016A-1, | 12/25 at 100.00 | A3 | 5,436,900 |
| | 5.000%, 12/01/46 | | | |
| 8,650 | | Philadelphia, Pennsylvania, Airport Revenue Bonds, Refunding Series 2017B, 5.000%, | 7/27 at 100.00 | A | 9,477,891 |
| | 7/01/42 (AMT) | | | |
| 1,425 | | Philadelphia, Pennsylvania, General Obligation Bonds, Refunding Series 2011, 6.500%, | 8/20 at 100.00 | A– (4) | 1,444,864 |
| | 8/01/41 (Pre-refunded 8/01/20) | | | |
| 2,350 | | Union County Hospital Authority, Pennsylvania, Hospital Revenue Bonds, Evangelical | No Opt. Call | A– (4) | 2,377,495 |
| | Community Hospital Project, Refunding & Improvement Series 2011, 5.500%, 8/01/20 (ETM) | | | |
| 10,000 | | Westmoreland County Municipal Authority, Pennsylvania, Municipal Service Revenue Bonds, | 8/25 at 100.00 | AA | 11,537,500 |
| | Series 2016, 5.000%, 8/15/38 – BAM Insured | | | |
| 146,095 | | Total Pennsylvania | | | 155,798,313 |
| | Puerto Rico – 0.6% (0.4% of Total Investments) | | | |
| 4,300 | | Puerto Rico Housing Finance Authority, Capital Fund Program Revenue Bonds, Series 2003, | 6/20 at 100.00 | A2 | 4,399,158 |
| | 4.500%, 12/01/23 | | | |
| 800 | | Puerto Rico Public Buildings Authority, Guaranteed Government Facilities Revenue Bonds, | 6/20 at 100.00 | N/R | 800,640 |
| | Refunding Series 2002D, 5.450%, 7/01/31 – AMBAC Insured | | | |
| | Puerto Rico Sales Tax Financing Corporation, Sales Tax Revenue Bonds, Restructured 2018A-1: | | | |
| 2,808 | | 4.550%, 7/01/40 | 7/28 at 100.00 | N/R | 2,591,840 |
| 2,796 | | 0.000%, 7/01/46 | 7/28 at 41.38 | N/R | 656,864 |
| 8,202 | | 5.000%, 7/01/58 | 7/28 at 100.00 | N/R | 7,706,353 |
| | Puerto Rico Sales Tax Financing Corporation, Sales Tax Revenue Bonds, Taxable | | | |
| | Restructured Cofina Project Series 2019A-2: | | | |
| 2,000 | | 4.329%, 7/01/40 | 7/28 at 100.00 | N/R | 1,791,040 |
| 17 | | 4.536%, 7/01/53 | 7/28 at 100.00 | N/R | 14,791 |
| 237 | | 4.784%, 7/01/58 | 7/28 at 100.00 | N/R | 214,405 |
| 21,160 | | Total Puerto Rico | | | 18,175,091 |
| | Rhode Island – 0.5% (0.3% of Total Investments) | | | |
| 7,230 | | Rhode Island Health and Educational Building Corporation, Higher Education Facility | 9/23 at 100.00 | AA+ | 7,994,211 |
| | Revenue Bonds, Brown University, Series 2013, 5.000%, 9/01/43 | | | |
| 3,320 | | Rhode Island Health and Educational Building Corporation, Hospital Financing Revenue | 5/26 at 100.00 | BBB+ | 3,450,210 |
| | Bonds, Lifespan Obligated Group, Refunding Series 2016, 5.000%, 5/15/39 | | | |
| 30,175 | | Rhode Island Tobacco Settlement Financing Corporation, Tobacco Settlement Asset-Backed | 5/20 at 15.05 | CCC– | 3,761,314 |
| | Bonds, Series 2007A, 0.000%, 6/01/52 | | | |
| 40,725 | | Total Rhode Island | | | 15,205,735 |
| | South Carolina – 4.4% (2.7% of Total Investments) | | | |
| | Lexington County Health Services District, Inc, South Carolina, Hospital Revenue Bonds, | | | |
| | Lexington Medical Center, Series 2016: | | | |
| 7,500 | | 5.000%, 11/01/41 | 5/26 at 100.00 | A | 8,163,525 |
| 3,180 | | 5.000%, 11/01/46 | 5/26 at 100.00 | A | 3,429,471 |
| | Piedmont Municipal Power Agency, South Carolina, Electric Revenue Bonds, Series 2004A-2: | | | |
| 21,565 | | 0.000%, 1/01/30 – AMBAC Insured | No Opt. Call | A– | 17,192,049 |
| 1,250 | | 0.000%, 1/01/31 – AGC Insured | No Opt. Call | A3 | 975,037 |
47
| | |
| NAD | Nuveen Quality Municipal Income Fund Portfolio of Investments (continued) April 30, 2020 (Unaudited) |
| | | | | | |
| Principal | | | Optional Call | | |
| Amount (000) | | Description (1) | Provisions (2) | Ratings (3) | Value |
| | South Carolina (continued) | | | |
| $ 4,610 | | Rock Hill, South Carolina, Combined Utility System Revenue Bonds, Series 2016, | 1/26 at 100.00 | A | $ 5,191,275 |
| | 5.000%, 1/01/47 | | | |
| | South Carolina Jobs-Economic Development Authority, Economic Development Revenue Bonds, | | | |
| | Bishop Gadsden Episcopal Retirement Community, Series 2019A: | | | |
| 645 | | 5.000%, 4/01/44 | 4/26 at 103.00 | BBB– | 656,107 |
| 625 | | 5.000%, 4/01/49 | 4/26 at 103.00 | BBB– | 632,594 |
| 1,640 | | South Carolina Jobs-Economic Development Authority, Economic Development Revenue Bonds, | 10/25 at 100.00 | A1 | 1,784,090 |
| | Furman University, Refunding Series 2015, 5.000%, 10/01/45 | | | |
| 1,000 | | South Carolina Jobs-Economic Development Authority, Hospital Revenue Bonds, McLeod | 5/28 at 100.00 | AA– | 1,128,400 |
| | Health Projects, Refunding & Improvement Series 2018, 5.000%, 11/01/43 | | | |
| 875 | | South Carolina Jobs-Economic Development Authority, Hospital Revenue Bonds, Palmetto | 8/21 at 100.00 | AA (4) | 935,463 |
| | Health, Refunding Series 2011A, 6.500%, 8/01/39 (Pre-refunded 8/01/21) – AGM Insured | | | |
| 9,000 | | South Carolina Public Service Authority Santee Cooper Revenue Obligations, Refunding | 12/26 at 100.00 | A– | 9,504,360 |
| | Series 2016B, 5.000%, 12/01/56 | | | |
| 14,765 | | South Carolina Public Service Authority, Santee Cooper Revenue Obligations, Refunding & | 6/25 at 100.00 | A– | 15,452,606 |
| | Improvement Series 2015A, 5.000%, 12/01/50 | | | |
| | South Carolina Public Service Authority, Santee Cooper Revenue Obligations, Refunding | | | |
| | Series 2014C: | | | |
| 8,900 | | 5.000%, 12/01/39 | 12/24 at 100.00 | A– | 9,367,517 |
| 12,760 | | 5.000%, 12/01/46 | 12/24 at 100.00 | A– | 13,322,206 |
| 5,500 | | South Carolina Public Service Authority, Santee Cooper Revenue Obligations, Series | 12/23 at 100.00 | A– | 5,727,920 |
| | 2013A, 5.125%, 12/01/43 | | | |
| 3,455 | | South Carolina Public Service Authority, Santee Cooper Revenue Obligations, Series | 6/24 at 100.00 | A– | 3,665,755 |
| | 2014A, 5.500%, 12/01/54 | | | |
| | South Carolina State Ports Authority, Revenue Bonds, Series 2015: | | | |
| 860 | | 5.250%, 7/01/55 (Pre-refunded 7/01/25) (AMT) | 7/25 at 100.00 | A1 (4) | 1,038,003 |
| 4,140 | | 5.250%, 7/01/55 (Pre-refunded 7/01/25) (AMT) | 7/25 at 100.00 | A+ (4) | 4,996,897 |
| | South Carolina State Ports Authority, Revenue Bonds, Series 2018: | | | |
| 14,350 | | 5.000%, 7/01/48 (AMT) | 7/28 at 100.00 | A+ | 15,809,251 |
| 8,000 | | 5.000%, 7/01/55 (AMT) | 7/28 at 100.00 | A+ | 8,743,360 |
| 7,500 | | South Carolina State Ports Authority, Revenue Bonds, Series 2019A, 5.000%, 7/01/54 | 7/29 at 100.00 | A+ | 8,460,750 |
| 132,120 | | Total South Carolina | | | 136,176,636 |
| | South Dakota – 0.8% (0.5% of Total Investments) | | | |
| 11,320 | | South Dakota Board of Regents, Housing and Auxiliary Facilities System Revenue Bonds, | 10/27 at 100.00 | Aa3 | 12,167,868 |
| | Series 2017, 4.000%, 4/01/42 | | | |
| 2,685 | | South Dakota Health and Educational Facilities Authority, Revenue Bonds, Regional | 9/27 at 100.00 | A1 | 2,876,387 |
| | Health, Refunding Series 2017, 4.000%, 9/01/36 | | | |
| 1,460 | | South Dakota Health and Educational Facilities Authority, Revenue Bonds, Sanford Health, | 11/24 at 100.00 | A2 | 1,550,359 |
| | Series 2014B, 5.000%, 11/01/44 | | | |
| 7,185 | | South Dakota Health and Educational Facilities Authority, Revenue Bonds, Sanford Health, | 11/25 at 100.00 | A2 | 7,712,667 |
| | Series 2015, 5.000%, 11/01/45 | | | |
| 22,650 | | Total South Dakota | | | 24,307,281 |
| | Tennessee – 1.9% (1.1% of Total Investments) | | | |
| 9,460 | | Chattanooga Health, Educational and Housing Facility Board, Tennessee, Revenue Bonds, | 1/23 at 100.00 | BBB+ (4) | 10,517,250 |
| | Catholic Health Initiatives, Series 2013A, 5.250%, 1/01/45 (Pre-refunded 1/01/23) | | | |
| | Greeneville Health and Educational Facilities Board, Tennessee, Hospital Revenue Bonds, | | | |
| | Ballad Health, Series 2018A: | | | |
| 2,000 | | 5.000%, 7/01/36 | 7/28 at 100.00 | Baa1 | 2,263,660 |
| 7,000 | | 5.000%, 7/01/37 | 7/28 at 100.00 | Baa1 | 7,898,100 |
| 3,125 | | Johnson City Health and Educational Facilities Board, Tennessee, Hospital Revenue Bonds, | 7/20 at 100.00 | Baa1 (4) | 3,150,969 |
| | Mountain States Health Alliance, Refunding Series 2010A, 6.000%, 7/01/38 (Pre-refunded 7/01/20) | | | |
| 60 | | Johnson City Health and Educational Facilities Board, Tennessee, Hospital Revenue | 7/23 at 100.00 | N/R (4) | 61,028 |
| | Refunding and Improvement Bonds, Johnson City Medical Center, Series 1998C, 5.125%, 7/01/25 | | | |
| | (Pre-refunded 7/01/23) – NPFG Insured | | | |
48
| | | | | | |
| Principal | | | Optional Call | | |
| Amount (000) | | Description (1) | Provisions (2) | Ratings (3) | Value |
| | Tennessee (continued) | | | |
| $ 17,000 | | Knox County Health, Educational and Housing Facility Board, Tennessee, Hospital Revenue | 1/27 at 100.00 | A | $ 18,460,640 |
| | Bonds, Covenant Health, Refunding Series 2016A, 5.000%, 1/01/47 | | | |
| | Metropolitan Government of Nashville-Davidson County Health and Educational Facilities | | | |
| | Board, Tennessee, Revenue Bonds, Belmont University Project, Series 2012: | | | |
| 3,000 | | 5.000%, 11/01/23 | 11/21 at 100.00 | A3 | 3,117,870 |
| 3,200 | | 5.000%, 11/01/24 | 11/21 at 100.00 | A3 | 3,322,848 |
| 3,400 | | 5.000%, 11/01/25 | 11/21 at 100.00 | A3 | 3,527,398 |
| 535 | | Metropolitan Government of Nashville-Davidson County Health and Educational Facilities Board, | 7/26 at 100.00 | Aa1 | 576,997 |
| | Tennessee, Revenue Bonds, Vanderbilt University Medical Center, Series 2016A, 5.000%, 7/01/46 | | | |
| 4,000 | | The Tennessee Energy Acquisition Corporation, Gas Revenue Bonds, Series 2006A, | No Opt. Call | BBB+ | 4,484,240 |
| | 5.250%, 9/01/26 | | | |
| 52,780 | | Total Tennessee | | | 57,381,000 |
| | Texas – 23.4% (14.6% of Total Investments) | | | |
| 1,975 | | Allen Independent School District, Collin County, Texas, General Obligation Bonds, | 2/26 at 100.00 | AAA | 2,278,715 |
| | School Building Series 2016, 5.000%, 2/15/39 | | | |
| 8,835 | | Arlington, Texas, Special Tax Revenue Bonds, Senior Lien Series 2018A, 5.000%, 2/15/43 – | 2/28 at 100.00 | A1 | 9,886,807 |
| | AGM Insured | | | |
| 500 | | Austin Community College District, Texas, General Obligation Bonds, Refunding Limited | No Opt. Call | AA+ | 559,715 |
| | Tax Series 2016, 5.000%, 8/01/23 | | | |
| | Austin, Texas, Airport System Revenue Bonds, Series 2015: | | | |
| 3,000 | | 5.000%, 11/15/39 (AMT) | 11/24 at 100.00 | A | 3,230,250 |
| 3,040 | | 5.000%, 11/15/44 (AMT) | 11/24 at 100.00 | A | 3,257,421 |
| 4,500 | | Austin, Texas, Airport System Revenue Bonds, Series 2017B, 5.000%, 11/15/46 (AMT) | 11/26 at 100.00 | A | 4,859,190 |
| 4,000 | | Austin, Texas, Airport System Revenue Bonds, Series 2019A, 5.000%, 11/15/49 | 11/29 at 100.00 | A | 4,569,480 |
| 2,000 | | Austin, Texas, Electric Utility System Revenue Bonds, Refunding Series 2012A, 5.000%, 11/15/40 | 11/22 at 100.00 | Aa3 | 2,151,700 |
| | Austin, Texas, Electric Utility System Revenue Bonds, Refunding Series 2015A: | | | |
| 3,000 | | 5.000%, 11/15/38 | 11/25 at 100.00 | Aa3 | 3,443,670 |
| 13,705 | | 5.000%, 11/15/45 (UB) (5) | 11/25 at 100.00 | Aa3 | 15,578,611 |
| 5,000 | | Austin, Texas, Water and Wastewater System Revenue Bonds, Refunding Series 2013A, | 5/23 at 100.00 | AA– | 5,477,550 |
| | 5.000%, 11/15/43 | | | |
| 1,450 | | Austin, Texas, Water and Wastewater System Revenue Bonds, Refunding Series 2016A, | 11/26 at 100.00 | AA– | 1,707,752 |
| | 5.000%, 11/15/41 | | | |
| | Bell County Water Control Improvement District 1, Texas, Water Revenue Bonds, Series 2014: | | | |
| 1,000 | | 5.000%, 7/10/37 – BAM Insured | 7/23 at 100.00 | A1 | 1,104,220 |
| 1,575 | | 5.000%, 7/10/38 – BAM Insured | 7/23 at 100.00 | A1 | 1,737,083 |
| | Bexar County, Texas, Venue Project Revenue Bonds, Refunding Combined Venue Tax Series 2015: | | | |
| 1,060 | | 5.000%, 8/15/34 – AGM Insured | 8/24 at 100.00 | A– | 1,199,909 |
| 1,160 | | 5.000%, 8/15/35 – AGM Insured | 8/24 at 100.00 | A– | 1,312,088 |
| 1,500 | | Board of Regents of the University of Texas, Permanent University Fund Bonds, Refunding | 7/24 at 100.00 | AAA | 1,709,835 |
| | Series 2015A, 5.000%, 7/01/28 | | | |
| 2,000 | | Brownsville, Texas, Utility System Revenue Bonds, Refunding Series 2015, 5.000%, 9/01/31 | 9/25 at 100.00 | A2 | 2,329,500 |
| | Bryan, Brazos County, Texas, Electric System Revenue Bonds, Refunding Series 2012: | | | |
| 1,000 | | 5.000%, 7/01/28 | 7/22 at 100.00 | A+ | 1,078,210 |
| 1,000 | | 5.000%, 7/01/29 | 7/22 at 100.00 | A+ | 1,078,210 |
| 1,620 | | Cameron County, Texas, General Obligation Bonds, State Highway 550 Project, Series 2012, | 2/22 at 100.00 | Aa3 (4) | 1,743,930 |
| | 5.000%, 2/15/32 (Pre-refunded 2/15/22) – AGM Insured | | | |
| 2,500 | | Canadian River Municipal Water Authority, Texas, Contract Revenue Bonds, Conjunctive Use | 2/21 at 100.00 | Aa3 | 2,538,375 |
| | Groundwater Supply Project, Subordinate Lien Series 2011, 5.000%, 2/15/31 | | | |
| | Central Texas Regional Mobility Authority, Revenue Bonds, Refunding Senior Lien Series 2013A: | | | |
| 765 | | 5.000%, 1/01/43 | 1/23 at 100.00 | Baa1 | 791,913 |
| 1,100 | | 5.000%, 1/01/43 – AGM Insured | 1/23 at 100.00 | A2 | 1,144,286 |
| 665 | | Central Texas Regional Mobility Authority, Revenue Bonds, Refunding Subordinate Lien | 1/23 at 100.00 | Baa2 | 688,774 |
| | Series 2013, 5.000%, 1/01/42 | | | |
49
| | |
| NAD | Nuveen Quality Municipal Income Fund Portfolio of Investments (continued) April 30, 2020 (Unaudited) |
| | | | | | |
| Principal | | | Optional Call | | |
| Amount (000) | | Description (1) | Provisions (2) | Ratings (3) | Value |
| | Texas (continued) | | | |
| | Central Texas Regional Mobility Authority, Revenue Bonds, Senior Lien Series 2010: | | | |
| $ 2,945 | | 0.000%, 1/01/36 | No Opt. Call | Baa1 | $ 1,539,705 |
| 2,205 | | 0.000%, 1/01/37 | No Opt. Call | Baa1 | 1,096,282 |
| 2,160 | | 0.000%, 1/01/38 | No Opt. Call | Baa1 | 1,017,058 |
| 1,000 | | 0.000%, 1/01/40 | No Opt. Call | Baa1 | 428,950 |
| | Central Texas Regional Mobility Authority, Revenue Bonds, Senior Lien Series 2011: | | | |
| 1,000 | | 6.000%, 1/01/41 (Pre-refunded 1/01/21) | 1/21 at 100.00 | Baa1 (4) | 1,034,330 |
| 3,380 | | 6.250%, 1/01/46 (Pre-refunded 1/01/21) | 1/21 at 100.00 | Baa1 (4) | 3,501,579 |
| | Central Texas Regional Mobility Authority, Revenue Bonds, Senior Lien, Series 2015A: | | | |
| 2,600 | | 5.000%, 1/01/35 | 7/25 at 100.00 | Baa1 | 2,778,048 |
| 3,035 | | 5.000%, 1/01/45 | 7/25 at 100.00 | Baa1 | 3,212,730 |
| 1,000 | | Clifton Higher Education Finance Corporation, Texas, Education Revenue Bonds, Idea | 8/23 at 100.00 | A– | 1,088,080 |
| | Public Schools, Series 2013, 6.000%, 8/15/43 | | | |
| | Clifton Higher Education Finance Corporation, Texas, Education Revenue Bonds, Uplift | | | |
| | Education Charter School, Series 2013A: | | | |
| 1,000 | | 4.350%, 12/01/42 | 12/22 at 100.00 | BBB– | 928,070 |
| 1,000 | | 4.400%, 12/01/47 | 12/22 at 100.00 | BBB– | 916,570 |
| 1,500 | | College Station, Texas, Certificates of Obligation, Series 2012, 5.000%, 2/15/32 | 2/21 at 100.00 | AA+ | 1,545,555 |
| 2,500 | | Colorado River Municipal Water District, Texas, Water System Revenue Bonds, Series 2011, | 1/21 at 100.00 | AA– (4) | 2,571,800 |
| | 5.000%, 1/01/36 (Pre-refunded 1/01/21) | | | |
| 2,000 | | Corpus Christi, Texas, Utility System Revenue Bonds, Improvement Junior Lien Series | 7/23 at 100.00 | A1 | 2,193,520 |
| | 2013, 5.000%, 7/15/43 | | | |
| 1,175 | | Dallas Area Rapid Transit, Texas, Sales Tax Revenue Bonds, Refunding Senior Lien Series | 12/24 at 100.00 | Aa2 | 1,325,600 |
| | 2014A, 5.000%, 12/01/36 | | | |
| 1,680 | | Dallas Area Rapid Transit, Texas, Sales Tax Revenue Bonds, Refunding Series 2016A, | 12/25 at 100.00 | Aa2 | 1,894,284 |
| | 5.000%, 12/01/48 | | | |
| 8,100 | | Dallas-Fort Worth International Airport, Texas, Joint Revenue Bonds, Improvement Series | 11/22 at 100.00 | A+ | 8,498,115 |
| | 2013C, 5.125%, 11/01/43 (AMT) | | | |
| 16,980 | | Dallas-Fort Worth International Airport, Texas, Joint Revenue Bonds, Improvement Series | 11/22 at 100.00 | A+ | 17,541,189 |
| | 2014B, 4.500%, 11/01/45 (AMT) | | | |
| 4,500 | | Dallas-Fort Worth International Airport, Texas, Joint Revenue Bonds, Refunding Series | 11/20 at 100.00 | A+ (4) | 4,597,290 |
| | 2010A, 5.000%, 11/01/42 (Pre-refunded 11/01/20) | | | |
| 1,165 | | Dallas-Fort Worth International Airport, Texas, Joint Revenue Bonds, Refunding Series | 11/20 at 100.00 | A+ | 1,179,714 |
| | 2012B, 5.000%, 11/01/35 | | | |
| 10,000 | | Dallas-Fort Worth International Airport, Texas, Joint Revenue Bonds, Refunding Series | 11/21 at 100.00 | A+ | 10,303,100 |
| | 2012E, 5.000%, 11/01/42 (AMT) | | | |
| 9,500 | | Dallas-Fort Worth International Airport, Texas, Joint Revenue Bonds, Series 2012H, | 11/21 at 100.00 | A+ | 9,787,945 |
| | 5.000%, 11/01/42 (AMT) | | | |
| 1,230 | | Danbury Higher Education Authority, Texas, Charter School Revenue Bonds, John H Wood Jr | 8/23 at 100.00 | BBB– | 1,339,716 |
| | Public Charter District, Inspire Academies, Series 2013A, 6.000%, 8/15/28 | | | |
| 200 | | Decatur Hospital Authority, Texas, Revenue Bonds, Wise Regional Health System, Series | 9/24 at 100.00 | BBB– | 208,256 |
| | 2014A, 5.250%, 9/01/44 | | | |
| 1,000 | | El Paso County Hospital District, Texas, General Obligation Bonds, Refunding Series 2013, | 8/23 at 100.00 | BBB+ | 1,030,910 |
| | 5.000%, 8/15/33 | | | |
| | El Paso County, Texas, Certificates of Obligation, Series 2001: | | | |
| 185 | | 5.000%, 2/15/21 – AGM Insured (ETM) | No Opt. Call | AA (4) | 191,149 |
| 1,565 | | 5.000%, 2/15/21 – AGM Insured | No Opt. Call | AA | 1,615,393 |
| 500 | | Flower Mound, Texas, Special Assessment Revenue Bonds, River Walk Public Improvement | 9/20 at 102.00 | N/R | 484,805 |
| | District 1, Series 2014, 6.500%, 9/01/36 | | | |
| 7,760 | | Grand Parkway Transportation Corporation, Texas, System Toll Revenue Bonds, First Tier | 10/23 at 100.00 | BBB | 7,925,288 |
| | Series 2013A, 5.125%, 10/01/43 | | | |
| 5,210 | | Grand Parkway Transportation Corporation, Texas, System Toll Revenue Bonds, Refunding | 4/30 at 100.00 | A2 | 5,520,203 |
| | First Tier Series 2020C, 4.000%, 10/01/49 | | | |
| 10,760 | | Grand Parkway Transportation Corporation, Texas, System Toll Revenue Bonds, Subordinate | 10/23 at 100.00 | AA (4) | 12,264,678 |
| | Lien Series 2013B, 5.000%, 4/01/53 (Pre-refunded 10/01/23) | | | |
50
| | | | | | |
| Principal | | | Optional Call | | |
| Amount (000) | | Description (1) | Provisions (2) | Ratings (3) | Value |
| | Texas (continued) | | | |
| $ 5,295 | | Grand Parkway Transportation Corporation, Texas, System Toll Revenue Bonds, Subordinate | 4/28 at 100.00 | AA | $ 6,153,637 |
| | Lien Series 2018A Tela Supported, 5.000%, 10/01/48 | | | |
| 4,105 | | Grand Parkway Transportation Corporation, Texas, System Toll Revenue Bonds, Tender | 10/23 at 100.00 | AA | 6,401,871 |
| | Option Bond Trust 2015-XF0228, 17.628%, 11/01/44, (Pre-refunded 10/01/23) 144A (IF) (5) | | | |
| 4,960 | | Gulf Coast Industrial Development Authority, Texas, Solid Waste Disposal Revenue Bonds, | 10/22 at 100.00 | B3 | 4,659,226 |
| | Citgo Petroleum Corporation Project, Series 1995, 4.875%, 5/01/25 (AMT) | | | |
| 1,000 | | Hale Center Education Facilities Corporation, Texas, Revenue Bonds, Wayland Baptist | 3/21 at 100.00 | BBB | 1,030,160 |
| | University Project, Improvement and Refunding Series 2010, 5.000%, 3/01/35 | | | |
| 1,000 | | Harris County Cultural Education Facilities Finance Corporation, Texas, Hospital Revenue | 12/22 at 100.00 | A+ (4) | 1,107,640 |
| | Bonds, Memorial Hermann Healthcare System, Refunding Series 2013A, 5.000%, 12/01/35 | | | |
| | (Pre-refunded 12/01/22) | | | |
| 1,000 | | Harris County Cultural Education Facilities Finance Corporation, Texas, Medical | 11/22 at 100.00 | A | 1,069,690 |
| | Facilities Revenue Bonds, Baylor College of Medicine, Refunding Series 2012A, 5.000%, 11/15/26 | | | |
| | Harris County Cultural Education Facilities Finance Corporation, Texas, Revenue Bonds, | | | |
| | Houston Methodist Hospital System, Series 2015: | | | |
| 1,895 | | 4.000%, 12/01/45 | 6/25 at 100.00 | AA | 1,990,053 |
| 4,480 | | 5.000%, 12/01/45 | 6/25 at 100.00 | AA | 5,015,450 |
| | Harris County Cultural Education Facilities Finance Corporation, Texas, Revenue | | | |
| | Refunding Bonds, Young Men’s Christian Association of the Greater Houston Area, Series 2013A: | | | |
| 1,615 | | 5.000%, 6/01/28 | 6/23 at 100.00 | Baa2 | 1,651,386 |
| 3,000 | | 5.000%, 6/01/38 | 6/23 at 100.00 | Baa2 | 3,006,660 |
| 1,390 | | Harris County Metropolitan Transit Authority, Texas, Sales and Use Tax Revenue Bonds, | 11/21 at 100.00 | Aa2 (4) | 1,480,253 |
| | Series 2011A, 5.000%, 11/01/41 (Pre-refunded 11/01/21) | | | |
| 1,165 | | Harris County, Texas, Toll Road Revenue Bonds, Refunding Senior Lien Series 2012C, | 8/22 at 100.00 | AA– | 1,263,373 |
| | 5.000%, 8/15/31 | | | |
| 5,150 | | Harris County, Texas, Toll Road Revenue Bonds, Refunding Senior Lien Series 2016A, | 8/26 at 100.00 | Aa2 | 5,997,020 |
| | 5.000%, 8/15/41 | | | |
| | Harris County-Houston Sports Authority, Texas, Revenue Bonds, Capital Appreciation | | | |
| | Refunding Senior Lien Series 2014A: | | | |
| 510 | | 0.000%, 11/15/41 – AGM Insured | 11/31 at 62.66 | A2 | 207,290 |
| 1,020 | | 0.000%, 11/15/42 – AGM Insured | 11/31 at 59.73 | A2 | 393,934 |
| 1,255 | | 0.000%, 11/15/43 – AGM Insured | 11/31 at 56.93 | A2 | 460,284 |
| 3,305 | | 0.000%, 11/15/44 – AGM Insured | 11/31 at 54.25 | A2 | 1,151,198 |
| 4,460 | | 0.000%, 11/15/45 – AGM Insured | 11/31 at 51.48 | A2 | 1,469,347 |
| 6,500 | | 0.000%, 11/15/47 – AGM Insured | 11/31 at 46.45 | A2 | 1,917,240 |
| | Harris County-Houston Sports Authority, Texas, Revenue Bonds, Junior Lien Series 2001H: | | | |
| 105 | | 0.000%, 11/15/24 – NPFG Insured (ETM) | No Opt. Call | Baa2 (4) | 99,191 |
| 495 | | 0.000%, 11/15/24 – NPFG Insured | No Opt. Call | BB+ | 432,185 |
| 50 | | 0.000%, 11/15/29 – NPFG Insured (ETM) | No Opt. Call | Baa2 (4) | 42,190 |
| 4,390 | | 0.000%, 11/15/29 – NPFG Insured | No Opt. Call | BB+ | 3,110,491 |
| 105 | | 0.000%, 11/15/30 – NPFG Insured (ETM) | No Opt. Call | Baa2 (4) | 86,041 |
| 625 | | 0.000%, 11/15/30 – NPFG Insured | No Opt. Call | BB+ | 421,125 |
| 7,570 | | 0.000%, 11/15/31 – NPFG Insured | No Opt. Call | BB+ | 4,845,633 |
| 210 | | 0.000%, 11/15/32 – NPFG Insured | 11/31 at 94.05 | BB+ | 124,793 |
| 260 | | 0.000%, 11/15/33 | 11/31 at 88.44 | BB+ | 144,916 |
| 2,045 | | 0.000%, 11/15/34 – NPFG Insured | 11/31 at 83.17 | BB+ | 1,067,879 |
| 1,130 | | 0.000%, 11/15/36 – NPFG Insured | 11/31 at 73.51 | BB+ | 517,800 |
| 4,370 | | 0.000%, 11/15/38 – NPFG Insured | 11/31 at 64.91 | BB+ | 1,759,187 |
| 2,260 | | 0.000%, 11/15/39 – NPFG Insured | 11/31 at 60.98 | BB+ | 851,591 |
| | Harris County-Houston Sports Authority, Texas, Revenue Bonds, Refunding Second Lien | | | |
| | Series 2014C: | | | |
| 600 | | 5.000%, 11/15/33 | 11/24 at 100.00 | BBB+ | 597,426 |
| 400 | | 5.000%, 11/15/34 | 11/24 at 100.00 | BBB+ | 398,068 |
| | Harris County-Houston Sports Authority, Texas, Revenue Bonds, Refunding Senior Lien | | | |
| | Series 2014A: | | | |
| 1,000 | | 5.000%, 11/15/28 | 11/24 at 100.00 | A– | 1,006,940 |
| 1,000 | | 5.000%, 11/15/30 | 11/24 at 100.00 | A– | 1,000,190 |
51
| | |
| NAD | Nuveen Quality Municipal Income Fund Portfolio of Investments (continued) April 30, 2020 (Unaudited) |
| | | | | | |
| Principal | | | Optional Call | | |
| Amount (000) | | Description (1) | Provisions (2) | Ratings (3) | Value |
| | Texas (continued) | | | |
| $ 3,440 | | Harris County-Houston Sports Authority, Texas, Revenue Bonds, Senior Lien Series 2001G, | 11/31 at 53.78 | A– | $ 1,241,565 |
| | 0.000%, 11/15/41 – NPFG Insured | | | |
| 1,000 | | Harris County-Houston Sports Authority, Texas, Revenue Bonds, Third Lien Series 2004A-3, | 11/24 at 59.10 | BB | 501,720 |
| | 0.000%, 11/15/33 – NPFG Insured | | | |
| 2,305 | | Harris County-Houston Sports Authority, Texas, Special Revenue Bonds, Refunding Senior | No Opt. Call | A2 | 2,286,191 |
| | Lien Series 2001A, 0.000%, 11/15/20 – NPFG Insured | | | |
| 1,350 | | Harrison County Health Facilities Development Corporation, Texas, Hospital Revenue Bonds, Good | 7/20 at 100.00 | N/R (4) | 1,359,274 |
| | Shepherd Health System, Refunding Series 2010, 5.250%, 7/01/28 (Pre-refunded 7/01/20) | | | |
| 7,570 | | Houston, Texas, Airport System Revenue Bonds, Refunding & Subordinate Lien Series | 7/28 at 100.00 | A | 8,269,695 |
| | Series 2018A, 5.000%, 7/01/41 (AMT) | | | |
| 2,000 | | Houston, Texas, Airport System Revenue Bonds, Refunding Subordinate Lien Series Series | 7/22 at 100.00 | A | 2,101,240 |
| | 2012A, 5.000%, 7/01/31 (AMT) | | | |
| 5,000 | | Houston, Texas, Airport System Special Facilities Revenue Bonds, United Airlines, Inc | No Opt. Call | BB– | 4,978,300 |
| | Technical Operations Center Project, Series 2018, 5.000%, 7/15/28 (AMT) | | | |
| 380 | | Houston, Texas, Airport System Special Facilities Revenue Bonds, United Airlines, Inc | 7/24 at 100.00 | BB– | 377,222 |
| | Terminal E Project, Refunding Series 2014, 5.000%, 7/01/29 (AMT) | | | |
| 4,000 | | Houston, Texas, Combined Utility System Revenue Bonds, First Lien Series 2011D, 5.000%, | 11/21 at 100.00 | AA (4) | 4,260,120 |
| | 11/15/40 (Pre-refunded 11/15/21) | | | |
| 2,000 | | Houston, Texas, Combined Utility System Revenue Bonds, Refunding First Lien Series | 11/22 at 100.00 | AA (4) | 2,216,940 |
| | 2012D, 5.000%, 11/15/42 (Pre-refunded 11/15/22) | | | |
| 3,000 | | Houston, Texas, Combined Utility System Revenue Bonds, Refunding First Lien Series | 11/28 at 100.00 | Aa2 | 3,652,260 |
| | 2018D, 5.000%, 11/15/36 | | | |
| 2,000 | | Houston, Texas, General Obligation Bonds, Refunding Public Improvement Series 2017A, | 3/27 at 100.00 | Aa3 | 2,385,540 |
| | 5.000%, 3/01/31 | | | |
| 1,015 | | Houston, Texas, Hotel Occupancy Tax and Special Revenue Bonds, Convention and | 9/24 at 100.00 | A | 995,197 |
| | Entertainment Facilities Department, Refunding Series 2014, 5.000%, 9/01/34 | | | |
| | Houston, Texas, Hotel Occupancy Tax and Special Revenue Bonds, Convention and | | | |
| | Entertainment Project, Series 2001B: | | | |
| 3,250 | | 0.000%, 9/01/25 – AMBAC Insured | No Opt. Call | A2 | 2,903,842 |
| 4,130 | | 0.000%, 9/01/26 – AMBAC Insured | No Opt. Call | A2 | 3,581,660 |
| 3,130 | | 0.000%, 9/01/30 – AMBAC Insured | No Opt. Call | A | 2,315,981 |
| 12,030 | | 0.000%, 9/01/31 – AMBAC Insured | No Opt. Call | A | 8,533,841 |
| 1,470 | | 0.000%, 9/01/32 – AMBAC Insured | No Opt. Call | A | 997,219 |
| | Houston, Texas, Water and Sewerage System Revenue Bonds, Refunding Junior Lien Series 1998A: | | | |
| 4,680 | | 0.000%, 12/01/22 – AGM Insured | No Opt. Call | AA+ | 4,534,733 |
| 12,030 | | 0.000%, 12/01/22 – AGM Insured (ETM) | No Opt. Call | AA+ (4) | 11,776,167 |
| 3,255 | | Hutto Independent School District, Williamson County, Texas, General Obligation Bonds, | 8/21 at 24.48 | A+ | 784,227 |
| | Refunding Series 2012A, 0.000%, 8/01/45 | | | |
| 1,360 | | Jacksonville Independent School District, Cherokee County, Texas, General Obligation | 2/24 at 100.00 | Aaa | 1,527,715 |
| | Bonds, School Building Series 2014, 5.000%, 2/15/39 | | | |
| 2,000 | | Laredo Community College District, Webb County, Texas, Combined Fee Revenue Bonds, | 8/20 at 100.00 | A2 (4) | 2,021,960 |
| | Series 2010, 5.250%, 8/01/35 (Pre-refunded 8/01/20) – AGM Insured | | | |
| 2,675 | | Laredo Community College District, Webb County, Texas, General Obligation Bonds, Series | 8/24 at 100.00 | AA– | 3,048,778 |
| | 2014, 5.000%, 8/01/34 | | | |
| | Leander Independent School District, Williamson and Travis Counties, Texas, General | | | |
| | Obligation Bonds, Refunding Series 2015A: | | | |
| 8,000 | | 4.000%, 8/15/37 | 8/25 at 100.00 | AAA | 8,750,160 |
| 2,275 | | 5.000%, 8/15/40 | 8/25 at 100.00 | AAA | 2,632,220 |
| 2,000 | | Lone Star College System, Harris, Montgomery and San Jacinto Counties, Texas, Revenue | 2/21 at 100.00 | AA | 2,059,460 |
| | Financing System Bonds, Series 2013, 5.000%, 2/15/36 | | | |
| 1,750 | | Love Field Airport Modernization Corporation, Texas, General Airport Revenue Bonds | 11/25 at 100.00 | A | 1,826,142 |
| | Series 2015, 5.000%, 11/01/35 (AMT) | | | |
| 7,800 | | Love Field Airport Modernization Corporation, Texas, Special Facilities Revenue Bonds, | 11/20 at 100.00 | BBB | 7,801,014 |
| | Southwest Airlines Company, Series 2010, 5.250%, 11/01/40 | | | |
52
| | | | | | |
| Principal | | | Optional Call | | |
| Amount (000) | | Description (1) | Provisions (2) | Ratings (3) | Value |
| | Texas (continued) | | | |
| $ 1,150 | | Lower Colorado River Authority, Texas, Revenue Bonds, Refunding Series 2012A, | 5/22 at 100.00 | A | $ 1,226,119 |
| | 5.000%, 5/15/36 | | | |
| | Lower Colorado River Authority, Texas, Revenue Bonds, Refunding Series 2012B: | | | |
| 25 | | 5.000%, 5/15/29 (Pre-refunded 5/15/22) | 5/22 at 100.00 | N/R (4) | 27,100 |
| 1,975 | | 5.000%, 5/15/29 | 5/22 at 100.00 | A | 2,116,805 |
| 6,500 | | Lower Colorado River Authority, Texas, Transmission Contract Revenue Bonds, LCRA | 5/26 at 100.00 | A | 7,392,450 |
| | Transmission Services Corporation Project, Refunding Series 2016, 5.000%, 5/15/46 | | | |
| 1,350 | | Lubbock Independent School District, Lubbock County, Texas, General Obligation Bonds, | 2/23 at 100.00 | AAA | 1,506,384 |
| | School Building Series 2013A, 5.000%, 2/15/43 (Pre-refunded 2/15/23) | | | |
| 1,750 | | Martin County Hospital District, Texas, Combination Limited Tax and Revenue Bonds, | 4/21 at 100.00 | BBB | 1,798,072 |
| | Series 2011A, 7.250%, 4/01/36 | | | |
| 9,180 | | Matagorda County Navigation District 1, Texas, Collateralized Revenue Refunding Bonds, | No Opt. Call | A | 10,956,146 |
| | Houston Light and Power Company, Series 1997, 5.125%, 11/01/28 – AMBAC Insured (AMT) | | | |
| | McCamey County Hospital District, Texas, General Obligation Bonds, Series 2013: | | | |
| 1,000 | | 5.750%, 12/01/33 | 12/25 at 100.00 | B1 | 1,075,490 |
| 3,000 | | 6.125%, 12/01/38 | 12/25 at 100.00 | B1 | 3,228,990 |
| 2,835 | | Mission Economic Development Corporation, Texas, Revenue Bonds, Natgasoline Project, | 10/21 at 105.00 | BB– | 2,821,222 |
| | Senior Lien Series 2018, 4.625%, 10/01/31 (AMT), 144A | | | |
| 4,735 | | New Hope Cultural Education Facilities Finance Corporation, Texas, Student Housing | 4/24 at 100.00 | A2 | 5,012,944 |
| | Revenue Bonds, CHF-Collegiate Housing Foundation – College Station I LLC – Texas A&M | | | |
| | University Project, Series 2014A, 5.000%, 4/01/46 – AGM Insured | | | |
| 755 | | North Central Texas Health Facilities Development Corporation, Hospital Revenue Bonds, | No Opt. Call | Aaa | 856,608 |
| | Presbyterian Healthcare System, Series 1996A, 5.750%, 6/01/26 – NPFG Insured (ETM) | | | |
| 885 | | North Central Texas Health Facilities Development Corporation, Texas, Revenue Bonds, | 8/22 at 100.00 | Aa2 (4) | 970,518 |
| | Children’s Medical Center Dallas Project, Series 2012, 5.000%, 8/15/32 (Pre-refunded 8/15/22) | | | |
| 710 | | North Fort Bend Water Authority, Texas, Water System Revenue Bonds, Series 2011, 5.000%, | 12/21 at 100.00 | A2 | 752,770 |
| | 12/15/36 – AGM Insured | | | |
| 3,860 | | North Harris County Regional Water Authority, Texas, Water Revenue Bonds, Refunding | 12/22 at 100.00 | A1 | 4,221,450 |
| | Senior Lien Series 2013, 5.000%, 12/15/33 | | | |
| | North Texas Tollway Authority, Special Projects System Revenue Bonds, Convertible | | | |
| | Capital Appreciation Series 2011C: | | | |
| 4,030 | | 0.000%, 9/01/43 (Pre-refunded 9/01/31) (7) | 9/31 at 100.00 | N/R (4) | 5,180,081 |
| 8,470 | | 0.000%, 9/01/45 (Pre-refunded 9/01/31) (7) | 9/31 at 100.00 | N/R (4) | 11,828,355 |
| 3,000 | | North Texas Tollway Authority, Special Projects System Revenue Bonds, Current Interest | 9/21 at 100.00 | N/R (4) | 3,166,950 |
| | Series 2011D, 5.000%, 9/01/31 (Pre-refunded 9/01/21) | | | |
| 2,000 | | North Texas Tollway Authority, Special Projects System Revenue Bonds, Series 2011A, | 9/21 at 100.00 | N/R (4) | 2,124,440 |
| | 5.500%, 9/01/41 (Pre-refunded 9/01/21) | | | |
| 7,000 | | North Texas Tollway Authority, System Revenue Bonds, Refunding First Tier Capital | 1/25 at 100.00 | A+ | 8,155,000 |
| | Appreciation Series 2008I, 6.500%, 1/01/43 | | | |
| 2,500 | | North Texas Tollway Authority, System Revenue Bonds, Refunding First Tier, Series 2008D, | No Opt. Call | A1 | 1,611,000 |
| | 0.000%, 1/01/36 – AGC Insured | | | |
| 10,260 | | North Texas Tollway Authority, System Revenue Bonds, Refunding First Tier, Series 2015B, | 1/23 at 100.00 | A+ | 10,848,719 |
| | 5.000%, 1/01/40 | | | |
| 4,555 | | North Texas Tollway Authority, System Revenue Bonds, Refunding First Tier, Series 2019A, | 1/29 at 100.00 | A+ | 4,802,200 |
| | 4.000%, 1/01/44 | | | |
| | North Texas Tollway Authority, System Revenue Bonds, Refunding Second Tier, Series 2015A: | | | |
| 13,355 | | 5.000%, 1/01/33 | 1/25 at 100.00 | A | 14,841,946 |
| 1,000 | | 5.000%, 1/01/34 | 1/25 at 100.00 | A | 1,109,020 |
| 1,000 | | Nueces River Authority, Texas, Water Supply Revenue Bonds, Corpus Christi Lake Texana | 7/25 at 100.00 | AA– | 1,177,190 |
| | Project, Refunding Series 2015, 5.000%, 7/15/26 | | | |
| 1,425 | | Port of Houston Authority, Harris County, Texas, General Obligation Bonds, Series 2010E, | No Opt. Call | AA | 955,463 |
| | 0.000%, 10/01/35 | | | |
| 4,000 | | Prosper Independent School District, Collin County, Texas, General Obligation Bonds, | 2/25 at 100.00 | AAA | 4,579,200 |
| | Refunding Series 2015, 5.000%, 2/15/40 | | | |
53
| | |
| NAD | Nuveen Quality Municipal Income Fund Portfolio of Investments (continued) April 30, 2020 (Unaudited) |
| | | | | | |
| Principal | | | Optional Call | | |
| Amount (000) | | Description (1) | Provisions (2) | Ratings (3) | Value |
| | Texas (continued) | | | |
| $ 205 | | Reagan Hospital District of Reagan County, Texas, Limited Tax Revenue Bonds, Series | 2/24 at 100.00 | Ba1 | $ 211,097 |
| | 2014A, 5.125%, 2/01/39 | | | |
| 1,000 | | Sam Rayburn Municipal Power Agency, Texas, Power Supply System Revenue Bonds, Refunding | No Opt. Call | BBB+ | 1,014,800 |
| | Series 2012, 5.000%, 10/01/20 | | | |
| 4,060 | | San Antonio Convention Center Hotel Finance Corporation, Texas, Contract Revenue | 6/20 at 100.00 | A3 | 3,937,997 |
| | Empowerment Zone Bonds, Series 2005A, 5.000%, 7/15/39 – AMBAC Insured (AMT) | | | |
| 2,500 | | San Antonio, Texas, Airport System Revenue Bonds, Refunding Series 2012, 5.000%, | 7/22 at 100.00 | A+ | 2,655,300 |
| | 7/01/27 (AMT) | | | |
| 2,640 | | San Antonio, Texas, Water System Revenue Bonds, Refunding Junior Lien Series 2015B, | 5/25 at 100.00 | AA | 3,046,296 |
| | 5.000%, 5/15/34 | | | |
| 1,000 | | San Antonio, Texas, Water System Revenue Bonds, Refunding Junior Lien Series 2018A, | 5/28 at 100.00 | AA | 1,188,880 |
| | 5.000%, 5/15/48 | | | |
| 1,925 | | Stephen F Austin State University, Texas, Revenue Bonds, Refunding & Improvement Series | 10/28 at 100.00 | A1 | 2,220,391 |
| | 2016, 5.000%, 10/15/42 | | | |
| 515 | | Tarrant County Cultural Education Facilities Finance Corporation, Texas, Hospital | 9/23 at 100.00 | A | 549,443 |
| | Revenue Bonds, Hendrick Medical Center, Refunding Series 2013, 5.125%, 9/01/33 | | | |
| | Tarrant County Cultural Education Facilities Finance Corporation, Texas, Hospital | | | |
| | Revenue Bonds, Scott & White Healthcare Project, Series 2010: | | | |
| 95 | | 5.250%, 8/15/40 (Pre-refunded 8/15/20) | 8/20 at 100.00 | N/R (4) | 96,211 |
| 1,155 | | 5.250%, 8/15/40 (Pre-refunded 8/15/20) | 8/20 at 100.00 | N/R (4) | 1,169,726 |
| 355 | | 5.500%, 8/15/45 (Pre-refunded 8/15/20) | 8/20 at 100.00 | N/R (4) | 359,775 |
| 1,250 | | Tarrant County Cultural Education Facilities Finance Corporation, Texas, Hospital | 5/26 at 100.00 | AA– | 1,432,087 |
| | Revenue Bonds, Scott & White Healthcare Project, Series 2016A, 5.000%, 11/15/32 | | | |
| 2,000 | | Tarrant County Cultural Education Facilities Finance Corporation, Texas, Revenue Bonds, | 8/26 at 100.00 | AA | 2,266,020 |
| | Texas Health Resources System, Series 2016A, 5.000%, 2/15/41 | | | |
| 3,105 | | Texas Municipal Gas Acquisition and Supply Corporation I, Gas Supply Revenue Bonds, | No Opt. Call | A– | 3,494,181 |
| | Senior Lien Series 2008D, 6.250%, 12/15/26 | | | |
| 1,000 | | Texas Municipal Gas Acquisition and Supply Corporation I, Gas Supply Revenue Bonds, | No Opt. Call | A– | 1,019,340 |
| | Series 2006A, 5.250%, 12/15/20 | | | |
| | Texas Municipal Gas Acquisition and Supply Corporation III, Gas Supply Revenue Bonds, | | | |
| | Series 2012: | | | |
| 5,910 | | 5.000%, 12/15/23 | 12/22 at 100.00 | BBB+ | 6,215,074 |
| 2,050 | | 5.000%, 12/15/26 | 12/22 at 100.00 | BBB+ | 2,148,092 |
| 1,000 | | 5.000%, 12/15/27 | 12/22 at 100.00 | BBB+ | 1,046,250 |
| 12,745 | | 5.000%, 12/15/29 | 12/22 at 100.00 | BBB+ | 13,277,741 |
| 2,000 | | 5.000%, 12/15/31 | 12/22 at 100.00 | BBB+ | 2,076,000 |
| | Texas Municipal Power Agency, Revenue Bonds, Refunding Transmission Series 2010: | | | |
| 640 | | 5.000%, 9/01/34 | 9/20 at 100.00 | A+ | 647,008 |
| 1,000 | | 5.000%, 9/01/40 | 9/20 at 100.00 | A+ | 1,010,750 |
| | Texas Private Activity Bond Surface Transportation Corporation, Senior Lien Revenue | | | |
| | Bonds, Blueridge Transportation Group, LLC SH 288 Toll Lanes Project, Series 2016: | | | |
| 10,735 | | 5.000%, 12/31/50 (AMT) | 12/25 at 100.00 | Baa3 | 10,327,392 |
| 9,000 | | 5.000%, 12/31/55 (AMT) | 12/25 at 100.00 | Baa3 | 8,582,670 |
| | Texas Private Activity Bond Surface Transportation Corporation, Senior Lien Revenue | | | |
| | Bonds, NTE Mobility Partners Segments 3 LLC Segments 3A & 3B Facility, Series 2013: | | | |
| 1,335 | | 7.000%, 12/31/38 (AMT) | 9/23 at 100.00 | Baa3 | 1,483,919 |
| 4,040 | | 6.750%, 6/30/43 (AMT) | 9/23 at 100.00 | Baa3 | 4,452,484 |
| 22,000 | | Texas Private Activity Bond Surface Transportation Corporation, Senior Lien Revenue | 6/29 at 100.00 | Baa3 | 23,018,380 |
| | Bonds, NTE Mobility Partners Segments 3 LLC Segments 3C Project, Series 2019, 5.000%, | | | |
| | 6/30/58 (AMT) | | | |
| | Texas Private Activity Bond Surface Transportation Corporation, Senior Lien Revenue | | | |
| | Bonds, LBJ Infrastructure Group LLC IH-635 Managed Lanes Project, Series 2010: | | | |
| 1,000 | | 7.000%, 6/30/34 | 6/20 at 100.00 | Baa3 | 1,004,480 |
| 1,000 | | 7.000%, 6/30/40 | 6/20 at 100.00 | Baa3 | 1,004,220 |
54
| | | | | | |
| Principal | | | Optional Call | | |
| Amount (000) | | Description (1) | Provisions (2) | Ratings (3) | Value |
| | Texas (continued) | | | |
| | Texas State, General Obligation Bonds, Texas Transportation Commission, Highway | | | |
| | Improvement Series 2014: | | | |
| $ 800 | | 5.000%, 4/01/44 (Pre-refunded 4/01/24) | 4/24 at 100.00 | N/R (4) | $ 924,016 |
| 1,200 | | 5.000%, 4/01/44 | 4/24 at 100.00 | AAA | 1,335,120 |
| 2,000 | | Texas State, General Obligation Bonds, Transportation Commission Highway Improvement | 4/22 at 100.00 | AAA | 2,163,920 |
| | Series 2012A, 5.000%, 4/01/42 (Pre-refunded 4/01/22) | | | |
| 2,000 | | Texas State, General Obligation Bonds, Transportation Commission Mobility Fund, | 4/24 at 100.00 | AAA | 2,254,120 |
| | Refunding Series 2014, 5.000%, 10/01/34 | | | |
| 9,430 | | Texas Transportation Commission, Central Texas Turnpike System Revenue Bonds, Refunding | 8/22 at 100.00 | A3 (4) | 10,329,905 |
| | First Tier Series 2012A, 5.000%, 8/15/41 (Pre-refunded 8/15/22) | | | |
| | Texas Transportation Commission, Central Texas Turnpike System Revenue Bonds, Refunding | | | |
| | First Tier Series 2015B: | | | |
| 8,335 | | 0.000%, 8/15/36 | 8/24 at 59.60 | A3 | 4,162,416 |
| 10,960 | | 5.000%, 8/15/37 | 8/24 at 100.00 | A3 | 11,860,035 |
| | Texas Transportation Commission, Central Texas Turnpike System Revenue Bonds, Refunding | | | |
| | Second Tier Series 2015C: | | | |
| 2,100 | | 5.000%, 8/15/33 | 8/24 at 100.00 | Baa1 | 2,200,233 |
| 15,750 | | 5.000%, 8/15/42 | 8/24 at 100.00 | Baa1 | 16,331,647 |
| 10,000 | | Texas Transportation Commission, Highway Fund Revenue Bonds, First Tier Series 2016A, | 10/26 at 100.00 | AAA | 12,104,200 |
| | 5.000%, 10/01/30 (UB) (5) | | | |
| 1,875 | | Texas Transportation Commission, State Highway 249 System Revenue Bonds, First Tier Toll | 2/29 at 100.00 | Baa3 | 1,912,106 |
| | Series 2019A, 5.000%, 8/01/57 | | | |
| | Texas Turnpike Authority, Central Texas Turnpike System Revenue Bonds, First Tier Series 2002A: | | | |
| 2,285 | | 0.000%, 8/15/21 – AMBAC Insured (ETM) | No Opt. Call | A3 (4) | 2,262,630 |
| 7,715 | | 0.000%, 8/15/21 – AMBAC Insured | No Opt. Call | A3 | 7,562,706 |
| 2,020 | | 0.000%, 8/15/23 – AMBAC Insured (ETM) | No Opt. Call | A3 (4) | 1,956,249 |
| 9,980 | | 0.000%, 8/15/23 – AMBAC Insured | No Opt. Call | A3 | 9,372,817 |
| 3,830 | | 0.000%, 8/15/24 – AMBAC Insured (ETM) | No Opt. Call | A3 (4) | 3,660,522 |
| 21,170 | | 0.000%, 8/15/24 – AMBAC Insured | No Opt. Call | A3 | 19,373,090 |
| | Texas Water Development Board, State Water Implementation Revenue Fund Bonds, Master | | | |
| | Trust Series 2017A: | | | |
| 10,000 | | 4.000%, 10/15/42 (UB) (5) | 10/27 at 100.00 | AAA | 11,095,600 |
| 5,000 | | 5.000%, 10/15/42 | 10/27 at 100.00 | AAA | 5,943,400 |
| 16,600 | | 5.000%, 10/15/42 (UB) (5) | 10/27 at 100.00 | AAA | 19,732,088 |
| 5,000 | | Texas Water Development Board, State Water Implementation Revenue Fund Bonds, Master | 10/28 at 100.00 | AAA | 5,976,100 |
| | Trust Series 2018B, 5.000%, 4/15/49 | | | |
| | Travis County Health Facilities Development Corporation, Texas, Revenue Bonds, | | | |
| | Westminster Manor, Series 2010: | | | |
| 60 | | 7.000%, 11/01/30 | 11/20 at 100.00 | BBB+ | 60,988 |
| 905 | | 7.000%, 11/01/30 (Pre-refunded 11/01/20) | 11/20 at 100.00 | N/R (4) | 932,250 |
| 2,490 | | Uptown Development Authority, Houston, Texas, Tax Increment Contract Revenue Bonds, | 9/25 at 100.00 | Baa2 | 2,683,174 |
| | Infrastructure Improvement Facilities, Series 2018, 5.000%, 9/01/40 | | | |
| 1,735 | | Via Metropolitan Transit Advanced Transportation District, Texas, Sales Tax Revenue | 8/24 at 100.00 | AA | 1,972,070 |
| | Bonds, Refunding & Improvement Series 2014, 5.000%, 8/01/38 | | | |
| 1,550 | | West Harris County Regional Water Authority, Texas, Water System Revenue Bonds, | 12/29 at 100.00 | A1 | 1,733,628 |
| | Refunding Series 2019C, 4.000%, 12/15/45 | | | |
| | West Texas Independent School District, McLennan and Hill Counties, General Obligation | | | |
| | Refunding Bonds, Series 1998: | | | |
| 45 | | 0.000%, 8/15/22 | 6/20 at 88.66 | AAA | 39,859 |
| 45 | | 0.000%, 8/15/24 | 6/20 at 79.50 | AAA | 35,738 |
| 430 | | Winter Garden Housing Finance Corporation, Texas, GNMA/FNMA Mortgage-Backed Securities | 6/20 at 100.00 | CC | 431,518 |
| | Program Single Family Mortgage Revenue Bonds, Series 1994, 6.950%, 10/01/27 (AMT) | | | |
| 9,000 | | Wylie Independent School District, Collin County, Texas, General Obligation Bonds, | 8/25 at 44.15 | Aaa | 3,555,990 |
| | Capital Appreciation Series 2015, 0.000%, 8/15/45 | | | |
| 727,275 | | Total Texas | | | 726,925,618 |
55
| | |
| NAD | Nuveen Quality Municipal Income Fund Portfolio of Investments (continued) April 30, 2020 (Unaudited) |
| | | | | | |
| Principal | | | Optional Call | | |
| Amount (000) | | Description (1) | Provisions (2) | Ratings (3) | Value |
| | Utah – 1.5% (1.0% of Total Investments) | | | |
| $ 27,055 | | Salt Lake City, Utah, Airport Revenue Bonds, International Airport Series 2017A, 5.000%, | 7/27 at 100.00 | A2 | $ 29,430,159 |
| | 7/01/47 (AMT) | | | |
| 4,500 | | Salt Lake City, Utah, Airport Revenue Bonds, International Airport Series 2018A, 5.000%, | 7/28 at 100.00 | A2 | 4,930,875 |
| | 7/01/48 (AMT) | | | |
| 5,795 | | Utah Charter School Finance Authority, Charter School Revenue Bonds, Hawthorn Academy | 4/26 at 100.00 | AA | 6,623,279 |
| | Project, Series 2016, 5.000%, 10/15/46 | | | |
| 2,000 | | Utah County, Utah, Hospital Revenue Bonds, IHC Health Services Inc, Series 2012, | 5/21 at 100.00 | AA+ | 2,051,520 |
| | 5.000%, 5/15/43 | | | |
| | Utah Transit Authority, Sales Tax Revenue Bonds, Refunding Series 2012: | | | |
| 1,665 | | 5.000%, 6/15/42 (Pre-refunded 6/15/22) | 6/22 at 100.00 | N/R (4) | 1,812,386 |
| 2,445 | | 5.000%, 6/15/42 (Pre-refunded 6/15/22) | 6/22 at 100.00 | A+ (4) | 2,666,835 |
| 43,460 | | Total Utah | | | 47,515,054 |
| | Virginia – 3.1% (1.9% of Total Investments) | | | |
| 895 | | Amherst Industrial Development Authority, Virginia, Revenue Bonds, Sweet Briar College, | 6/20 at 100.00 | BB– | 865,733 |
| | Series 2006, 5.000%, 9/01/26 | | | |
| 515 | | Chesapeake, Virginia, Transportation System Senior Toll Road Revenue Bonds, Capital | 7/28 at 100.00 | BBB | 459,143 |
| | Appreciation Series 2012B, 0.000%, 7/15/40 (7) | | | |
| 1,000 | | Fairfax County Industrial Development Authority, Virginia, Healthcare Revenue Bonds, | 5/28 at 100.00 | Aa2 | 1,067,210 |
| | Inova Health System, Series 2018A, 4.000%, 5/15/48 (UB) (5) | | | |
| 1,000 | | Fairfax County Redevelopment and Housing Authority, Virginia, Multifamily Housing | 6/20 at 100.00 | AA+ | 1,004,130 |
| | Revenue Bonds, FHA-Insured Mortgage – Cedar Ridge Project, Series 2007, 4.850%, 10/01/48 (AMT) | | | |
| 12,000 | | Hampton Roads Transportation Accountability Commission, Virginia, Hampton Roads | 1/28 at 100.00 | AA | 14,168,040 |
| | Transportation Fund Revenue Bonds, Senior Lien Series 2018A, 5.000%, 7/01/52 | | | |
| 2,400 | | Henrico County Economic Development Authority, Virginia, Revenue Bonds, Bon Secours | 11/22 at 100.00 | N/R (4) | 2,646,936 |
| | Health System Obligated Group, Series 2013, 5.000%, 11/01/30 (Pre-refunded 11/01/22) | | | |
| 5,625 | | Metropolitan Washington Airports Authority, Virginia, Dulles Toll Road Revenue Bonds, | 4/22 at 100.00 | Baa1 | 5,751,619 |
| | Dulles Metrorail & Capital Improvement Projects, Refunding Second Senior Lien Series 2014A, | | | |
| | 5.000%, 10/01/53 | | | |
| 2,000 | | Metropolitan Washington Airports Authority, Virginia, Dulles Toll Road Revenue Bonds, | No Opt. Call | A3 | 1,231,800 |
| | Dulles Metrorail & Capital improvement Projects, Second Senior Lien Series 2009B, 0.000%, | | | |
| | 10/01/36 – AGC Insured | | | |
| 5,000 | | Metropolitan Washington Airports Authority, Virginia, Dulles Toll Road Revenue Bonds, | 10/26 at 100.00 | A3 | 6,154,350 |
| | Dulles Metrorail & Capital improvement Projects, Second Senior Lien Series 2009C, 6.500%, | | | |
| | 10/01/41 – AGC Insured | | | |
| 5,000 | | Metropolitan Washington DC Airports Authority, Airport System Revenue Bonds, Series | 10/20 at 100.00 | AA– | 5,088,750 |
| | 2010A, 5.000%, 10/01/39 | | | |
| 4,500 | | Metropolitan Washington DC Airports Authority, Airport System Revenue Bonds, Refunding | 10/23 at 100.00 | AA– | 4,919,175 |
| | Series 2013A, 5.000%, 10/01/30 (AMT) | | | |
| | Prince William County Industrial Development Authority, Virginia, Health Care Facilities | | | |
| | Revenue Bonds, Novant Health Obligated Group-Prince William Hospital, Refunding Series 2013B: | | | |
| 2,000 | | 4.000%, 11/01/33 | 11/22 at 100.00 | AA– | 2,062,140 |
| 3,000 | | 5.000%, 11/01/46 | 11/22 at 100.00 | AA– | 3,144,060 |
| 6,115 | | Tobacco Settlement Financing Corporation of Virginia, Tobacco Settlement Asset Backed | 5/20 at 100.00 | B– | 5,784,362 |
| | Bonds, Series 2007B1, 5.000%, 6/01/47 | | | |
| 15,605 | | Virginia Small Business Financing Authority, Private Activity Revenue Bonds, Transform | 6/27 at 100.00 | Baa3 | 15,669,137 |
| | 66 P3 Project, Senior Lien Series 2017, 5.000%, 12/31/56 (AMT) | | | |
| 8,135 | | Virginia Small Business Financing Authority, Senior Lien Revenue Bonds, 95 Express Lanes | 1/22 at 100.00 | BBB– | 7,972,300 |
| | LLC Project, Series 2019, 5.000%, 7/01/49 (AMT) | | | |
| | Virginia Small Business Financing Authority, Senior Lien Revenue Bonds, Elizabeth River | | | |
| | Crossing, Opco LLC Project, Series 2012: | | | |
| 3,670 | | 6.000%, 1/01/37 (AMT) | 7/22 at 100.00 | BBB– | 3,722,921 |
| 14,930 | | 5.500%, 1/01/42 (AMT) | 7/22 at 100.00 | BBB– | 14,823,997 |
| 93,390 | | Total Virginia | | | 96,535,803 |
56
| | | | | | |
| Principal | | | Optional Call | | |
| Amount (000) | | Description (1) | Provisions (2) | Ratings (3) | Value |
| | Washington – 3.4% (2.1% of Total Investments) | | | |
| $ 2,000 | | Energy Northwest, Washington, Electric Revenue Bonds, Columbia Generating Station, | 7/24 at 100.00 | AA– | $ 2,232,640 |
| | Refunding Series 2014A, 5.000%, 7/01/40 | | | |
| 2,375 | | Grant County Public Utility District 2, Washington, Revenue Bonds, Priest Rapids | 1/26 at 100.00 | Aa3 (4) | 2,890,470 |
| | Hydroelectric Project, Refunding Series 2015A, 5.000%, 1/01/41 (Pre-refunded 1/01/26) | | | |
| 3,750 | | King County Public Hospital District 2, Washington, General Obligation Bonds, | 12/29 at 100.00 | Aa3 | 3,989,700 |
| | EvergreenHealth, Limited Tax 2020A, 4.000%, 12/01/45 | | | |
| 2,270 | | Port Everett, Washington, Revenue Bonds, Refunding Series 2016, 5.000%, 12/01/46 | 6/26 at 100.00 | A2 | 2,622,191 |
| 14,955 | | Port of Seattle, Washington, Revenue Bonds, Intermediate Lien Series 2017C, 5.000%, | 5/27 at 100.00 | A+ | 16,362,116 |
| | 5/01/42 (AMT) | | | |
| | Port of Seattle, Washington, Revenue Bonds, Intermediate Lien Series 2018A: | | | |
| 6,000 | | 5.000%, 5/01/36 (AMT) | 5/27 at 100.00 | A+ | 6,633,660 |
| 4,515 | | 5.000%, 5/01/43 (AMT) | 5/27 at 100.00 | A+ | 4,917,016 |
| 1,145 | | Port of Seattle, Washington, Revenue Bonds, Intermediate Lien Series 2019, 5.000%, | 4/29 at 100.00 | A+ | 1,263,118 |
| | 4/01/44 (AMT) | | | |
| 10,000 | | Spokane Public Facilities District, Washington, Hotel, Motel, and Sales Use Tax Revenue | 6/23 at 100.00 | A | 10,213,800 |
| | Bonds, Series 2013A, 5.000%, 5/01/43 | | | |
| 5,195 | | Washington Health Care Facilities Authority, Revenue Bonds, Kadlec Regional Medical | 12/20 at 100.00 | N/R (4) | 5,338,122 |
| | Center, Series 2010, 5.500%, 12/01/39 (Pre-refunded 12/01/20) | | | |
| 1,590 | | Washington Health Care Facilities Authority, Revenue Bonds, Kadlec Regional Medical | 12/21 at 100.00 | N/R (4) | 1,696,371 |
| | Center, Series 2012, 5.000%, 12/01/42 (Pre-refunded 12/01/21) | | | |
| 4,000 | | Washington Health Care Facilities Authority, Revenue Bonds, Providence Health & | 10/22 at 100.00 | AA– | 4,225,440 |
| | Services, Refunding Series 2012A, 5.000%, 10/01/32 | | | |
| 1,000 | | Washington Health Care Facilities Authority, Revenue Bonds, Seattle Children’s Hospital, | 10/22 at 100.00 | Aa2 | 1,052,440 |
| | Series 2012A, 5.000%, 10/01/42 | | | |
| 11,500 | | Washington Health Care Facilities Authority, Revenue Bonds, Seattle Children’s Hospital, | 4/25 at 100.00 | Aa2 | 12,615,615 |
| | Series 2015A, 5.000%, 10/01/45 (UB) | | | |
| 5,000 | | Washington State Convention Center Public Facilities District, Lodging Tax Revenue | 7/28 at 100.00 | AA– | 5,808,650 |
| | Bonds, Series 2018, 5.000%, 7/01/58 | | | |
| 320 | | Washington State Housing Finance Commission, Revenue Bonds, Riverview Retirement | 1/23 at 100.00 | BBB– | 291,878 |
| | Community, Refunding Series 2012, 5.000%, 1/01/48 | | | |
| 6,480 | | Washington State, Motor Vehicle Fuel Tax General Obligation Bonds, Series 2002-03C, | No Opt. Call | AA+ | 6,111,807 |
| | 0.000%, 6/01/24 – NPFG Insured | | | |
| 18,470 | | Washington, General Obligation Compound Interest Bonds, Series 1999S-3, 0.000%, 1/01/21 | No Opt. Call | AA+ | 18,344,219 |
| 100,565 | | Total Washington | | | 106,609,253 |
| | West Virginia – 0.8% (0.5% of Total Investments) | | | |
| 1,000 | | West Virginia Hospital Finance Authority, Hospital Revenue Bonds, Thomas Health System, | 5/20 at 100.00 | N/R | 550,000 |
| | Inc, Series 2008, 6.500%, 10/01/38 (8) | | | |
| 7,000 | | West Virginia Hospital Finance Authority, Hospital Revenue Bonds, West Virginia United | 6/23 at 100.00 | A | 7,406,980 |
| | Health System Obligated Group, Refunding & Improvement Series 2013A, 5.500%, 6/01/44 | | | |
| 15,000 | | West Virginia Hospital Finance Authority, Hospital Revenue Bonds, West Virginia United | 6/28 at 100.00 | A | 16,195,950 |
| | Health System Obligated Group, Series 2018A, 5.000%, 6/01/52 | | | |
| 2,000 | | West Virginia Hospital Finance Authority, Revenue Bonds, West Virginia University Health | 6/27 at 100.00 | A | 2,196,380 |
| | System Obligated Group, Improvement Series 2017A, 5.000%, 6/01/42 | | | |
| 25,000 | | Total West Virginia | | | 26,349,310 |
57
| | |
| NAD | Nuveen Quality Municipal Income Fund Portfolio of Investments (continued) April 30, 2020 (Unaudited) |
| | | | | | |
| Principal | | | Optional Call | | |
| Amount (000) | | Description (1) | Provisions (2) | Ratings (3) | Value |
| | Wisconsin – 1.6% (1.0% of Total Investments) | | | |
| | Public Finance Authority of Wisconsin, Conference Center and Hotel Revenue Bonds, | | | |
| | Lombard Public Facilities Corporation, First Tier Series 2018A-1: | | | |
| $ 34 | | 0.000%, 1/01/47, 144A | No Opt. Call | N/R | $ 710 |
| 30 | | 0.000%, 1/01/48, 144A | No Opt. Call | N/R | 609 |
| 29 | | 0.000%, 1/01/49, 144A | No Opt. Call | N/R | 585 |
| 29 | | 0.000%, 1/01/50, 144A | No Opt. Call | N/R | 541 |
| 28 | | 0.000%, 1/01/51, 144A | No Opt. Call | N/R | 521 |
| 36 | | 0.000%, 1/01/52, 144A | No Opt. Call | N/R | 648 |
| 36 | | 0.000%, 1/01/53, 144A | No Opt. Call | N/R | 624 |
| 35 | | 0.000%, 1/01/54, 144A | No Opt. Call | N/R | 585 |
| 34 | | 0.000%, 1/01/55, 144A | No Opt. Call | N/R | 557 |
| 33 | | 0.000%, 1/01/56, 144A | No Opt. Call | N/R | 534 |
| 1,669 | | 5.500%, 7/01/56, 144A | 3/28 at 100.00 | N/R | 1,192,291 |
| 37 | | 0.000%, 1/01/57, 144A | No Opt. Call | N/R | 573 |
| 36 | | 0.000%, 1/01/58, 144A | No Opt. Call | N/R | 542 |
| 35 | | 0.000%, 1/01/59, 144A | No Opt. Call | N/R | 516 |
| 34 | | 0.000%, 1/01/60, 144A | No Opt. Call | N/R | 486 |
| 34 | | 0.000%, 1/01/61, 144A | No Opt. Call | N/R | 463 |
| 33 | | 0.000%, 1/01/62, 144A | No Opt. Call | N/R | 437 |
| 32 | | 0.000%, 1/01/63, 144A | No Opt. Call | N/R | 416 |
| 31 | | 0.000%, 1/01/64, 144A | No Opt. Call | N/R | 398 |
| 31 | | 0.000%, 1/01/65, 144A | No Opt. Call | N/R | 376 |
| 33 | | 0.000%, 1/01/66, 144A | No Opt. Call | N/R | 384 |
| 401 | | 0.000%, 1/01/67, 144A | No Opt. Call | N/R | 4,267 |
| | Public Finance Authority of Wisconsin, Conference Center and Hotel Revenue Bonds, | | | |
| | Lombard Public Facilities Corporation, Second Tier Series 2018B: | | | |
| 59 | | 0.000%, 1/01/46, 144A | No Opt. Call | N/R | 1,287 |
| 59 | | 0.000%, 1/01/47, 144A | No Opt. Call | N/R | 1,216 |
| 58 | | 0.000%, 1/01/48, 144A | No Opt. Call | N/R | 1,185 |
| 58 | | 0.000%, 1/01/49, 144A | No Opt. Call | N/R | 1,148 |
| 57 | | 0.000%, 1/01/50, 144A | No Opt. Call | N/R | 1,082 |
| 62 | | 0.000%, 1/01/51, 144A | No Opt. Call | N/R | 1,160 |
| 1,607 | | 3.750%, 7/01/51, 144A | 3/28 at 100.00 | N/R | 1,019,893 |
| 62 | | 0.000%, 1/01/52, 144A | No Opt. Call | N/R | 1,103 |
| 61 | | 0.000%, 1/01/53, 144A | No Opt. Call | N/R | 1,063 |
| 61 | | 0.000%, 1/01/54, 144A | No Opt. Call | N/R | 1,023 |
| 60 | | 0.000%, 1/01/55, 144A | No Opt. Call | N/R | 982 |
| 59 | | 0.000%, 1/01/56, 144A | No Opt. Call | N/R | 948 |
| 59 | | 0.000%, 1/01/57, 144A | No Opt. Call | N/R | 911 |
| 58 | | 0.000%, 1/01/58, 144A | No Opt. Call | N/R | 873 |
| 57 | | 0.000%, 1/01/59, 144A | No Opt. Call | N/R | 846 |
| 57 | | 0.000%, 1/01/60, 144A | No Opt. Call | N/R | 809 |
| 56 | | 0.000%, 1/01/61, 144A | No Opt. Call | N/R | 771 |
| 56 | | 0.000%, 1/01/62, 144A | No Opt. Call | N/R | 742 |
| 55 | | 0.000%, 1/01/63, 144A | No Opt. Call | N/R | 712 |
| 54 | | 0.000%, 1/01/64, 144A | No Opt. Call | N/R | 690 |
| 54 | | 0.000%, 1/01/65, 144A | No Opt. Call | N/R | 659 |
| 53 | | 0.000%, 1/01/66, 144A | No Opt. Call | N/R | 613 |
| 693 | | 0.000%, 1/01/67, 144A | No Opt. Call | N/R | 7,378 |
| 880 | | Public Finance Authority of Wisconsin, Exempt Facilities Revenue Bonds, National Gypsum | 11/24 at 100.00 | N/R | 882,086 |
| | Company Project, Refunding Series 2014, 5.250%, 4/01/30 (AMT) | | | |
| 5,000 | | Wisconsin Health and Educational Facilities Authority, Revenue Bonds, Agnesian | 7/23 at 100.00 | N/R (4) | 5,631,850 |
| | HealthCare, Inc, Series 2013B, 5.000%, 7/01/36 (Pre-refunded 7/01/23) | | | |
| 1,250 | | Wisconsin Health and Educational Facilities Authority, Revenue Bonds, Marshfield Clinic, | 2/22 at 100.00 | A– | 1,295,775 |
| | Series 2012B, 5.000%, 2/15/32 | | | |
| 2,750 | | Wisconsin Health and Educational Facilities Authority, Revenues Bonds, Gundersen | 10/21 at 100.00 | A1 | 2,786,355 |
| | Lutheran, Series 2011A, 5.250%, 10/15/39 | | | |
| 10,225 | | Wisconsin Health and Educational Facilities Authority, Wisconsin, Revenue Bonds, | 5/26 at 100.00 | Aa2 | 11,042,898 |
| | Ascension Health Alliance Senior Credit Group, Series 2016A, 4.500%, 11/15/39 | | | |
58
| | | | | | |
| Principal | | | Optional Call | | |
| Amount (000) | | Description (1) | Provisions (2) | Ratings (3) | Value |
| | Wisconsin (continued) | | | |
| $ 1,685 | | Wisconsin Health and Educational Facilities Authority, Wisconsin, Revenue Bonds, Beloit | 7/26 at 100.00 | A | $ 1,704,394 |
| | Health System, Inc, Series 2016, 4.000%, 7/01/46 | | | |
| 4,220 | | Wisconsin Health and Educational Facilities Authority, Wisconsin, Revenue Bonds, | 8/27 at 100.00 | Aa3 | 4,513,754 |
| | Children’s Hospital of Wisconsin, Inc, Series 2017, 4.000%, 8/15/42 | | | |
| | Wisconsin Health and Educational Facilities Authority, Wisconsin, Revenue Bonds, | | | |
| | Marshfield Clinic, Series 2016A: | | | |
| 12,440 | | 5.000%, 2/15/42 | 2/26 at 100.00 | A– | 12,934,614 |
| 6,000 | | 5.000%, 2/15/46 | 2/26 at 100.00 | A– | 6,132,000 |
| 50,695 | | Total Wisconsin | | | 49,177,883 |
| $ 4,974,021 | | Total Municipal Bonds (cost $4,710,334,862) | | | 4,941,927,219 |
| Shares | | Description (1), (9) | | | Value |
| | INVESTMENT COMPANIES – 0.0% (0.0% of Total Investments) | | | |
| 8,812 | | BlackRock MuniHoldings Fund Inc | | | $ 122,575 |
| 32,524 | | Invesco Quality Municipal Income Trust | | | 369,472 |
| | Total Investment Companies (cost $530,611) | | | 492,047 |
| | Total Long-Term Investments (cost $4,710,865,473) | | | 4,942,419,266 |
|
| Principal | | | Optional Call | | |
| Amount (000) | | Description (1) | Provisions (2) | Ratings (3) | Value |
| | SHORT-TERM INVESTMENTS – 1.4% (0.9% of Total Investments) | | | |
| | MUNICIPAL BONDS – 1.4% (0.9% of Total Investments) | | | |
| | National – 0.9% (0.5% of Total Investments) | | | |
| $ 7,500 | | JPMorgan Chase Putters / Drivers Trust Various States, Variable Rate Demand Obligations, | No Opt. Call | F1+ | $ 7,500,000 |
| | Series 5028, 0.460%, 6/01/21 (AMT) 144A (10) | | | |
| 19,100 | | JPMorgan Chase Putters / Drivers Trust Various States, Variable Rate Demand Obligations, | No Opt. Call | F1+ | 19,100,000 |
| | Series 5029, 0.460%, 12/01/21 (AMT) 144A (10) | | | |
| 26,600 | | Total National | | | 26,600,000 |
| | California – 0.2% (0.2% of Total Investments) | | | |
| 7,500 | | Los Angeles Community Redevelopment Agency, California, Multifamily Housing Revenue Bonds, | 2/21 at 100.00 | VMIG1 | 7,500,000 |
| | Hollywood & Vine Apartments, Variable Rate Demand Obligations, Tender Option Bond Trust | | | |
| | 2020-MIZ9013, 0.760%, 10/15/37 (AMT) 144A (10) | | | |
| | Minnesota – 0.3% (0.2% of Total Investments) | | | |
| 10,000 | | Minneapolis, Minnesota, Health Care System Revenue Bonds, Fairview Health Services, Variable | 6/20 at 100.00 | A-1 | 10,000,000 |
| | Rate Demand Obligations, Series 2018A, 0.140%, 11/15/48 (10) | | | |
| $ 44,100 | | Total Short-Term Investments (cost $44,100,000) | | | 44,100,000 |
| | Total Investments (cost $4,754,965,473) – 160.8% | | | 4,986,519,266 |
| | Floating Rate Obligations – (3.1)% | | | (96,270,000) |
| | Adjustable Rate MuniFund Term Preferred Shares, net of deferred offering costs – (17.6)% (11) | | | (545,203,300) |
| | MuniFund Preferred Shares, net of deferred offering costs – (21.9)% (12) | | | (678,339,162) |
| | Variable Rate Demand Preferred Shares, net of deferred offering costs – (20.3)% (13) | | | (630,019,736) |
| | Other Assets Less Liabilities – 2.1% | | | 65,121,720 |
| | Net Assets Applicable to Common Shares – 100% | | | $ 3,101,808,788 |
59
| | |
| NAD | Nuveen Quality Municipal Income Fund Portfolio of Investments (continued) April 30, 2020 (Unaudited) |
| | |
(1) | All percentages shown in the Portfolio of Investments are based on net assets applicable to common shares unless otherwise noted. |
(2) | Optional Call Provisions: Dates (month and year) and prices of the earliest optional call or redemption. There may be other call provisions at varying prices at later dates. Certain mortgage-backed securities may be subject to periodic principal paydowns. |
(3) | The ratings disclosed are the lowest of Standard & Poor’s Group (“Standard & Poor’s”), Moody’s Investors Service, Inc. (“Moody’s”) or Fitch, Inc. (“Fitch”) rating. Ratings below BBB by Standard & Poor’s, Baa by Moody’s or BBB by Fitch are considered to be below investment grade. Holdings designated N/R are not rated by any of these national rating agencies. |
(4) | Backed by an escrow or trust containing sufficient U.S. Government or U.S. Government agency securities, which ensure the timely payment of principal and interest. |
(5) | Investment, or portion of investment, has been pledged to collateralize the net payment obligations for investments in inverse floating rate transactions. |
(6) | Investment valued at fair value using methods determined in good faith by, or at the discretion of, the Board. For fair value measurement disclosure purposes, investment classified as Level 3. See Notes to Financial Statements, Note 3 - Investment Valuation and Fair Value Measurements for more information. |
(7) | Step-up coupon bond, a bond with a coupon that increases ("steps up"), usually at regular intervals, while the bond is outstanding. The rate shown is the coupon as of the end of the reporting period. |
(8) | Defaulted security. A security whose issuer has failed to fully pay principal and/or interest when due, or is under the protection of bankruptcy. |
(9) | A copy of the most recent financial statements for these investment companies can be obtained directly from the Securities and Exchange Commission on its website at http://www.sec.gov. |
(10) | Investment has a maturity of greater than one year, but has variable rate and/or demand features which qualify it as a short-term investment. The rate disclosed, as well as the reference rate and spread, where applicable, is that in effect as of the end of the reporting period. This rate changes periodically based on market conditions or a specified market index. |
(11) | Adjustable Rate MuniFund Term Preferred Shares, net of deferred offering cost as a percentage of Total Investments is 10.9%. |
(12) | MuniFund Preferred Shares, net of deferred offering costs as a percentage of Total Investments is 13.6%. |
(13) | Variable Rate Demand Preferred Shares, net of deferred offering costs as a percentage of Total Investments is 12.6%. |
144A | Investment is exempt from registration under Rule 144A of the Securities Act of 1933, as amended. These investments may only be resold in transactions exempt from registration, which are normally those transactions with qualified institutional buyers. |
AMT | Alternative Minimum Tax. |
ETM | Escrowed to maturity. |
IF | Inverse floating rate security issued by a tender option bond (“TOB”) trust, the interest rate on which varies inversely with the Securities Industry Financial Markets Association (SIFMA) short-term rate, which resets weekly, or a similar short-term rate, and is reduced by the expenses related to the TOB trust. |
PIK | Payment-in-kind (“PIK”) security. Depending on the terms of the security, income may be received in the form of cash, securities, or a combination of both. The PIK rate shown, where applicable, represents the annualized rate of the last PIK payment made by the issuer as of the end of the reporting period. |
UB | Underlying bond of an inverse floating rate trust reflected as a financing transaction. See Notes to Financial Statements, Note 4 – Portfolio Securities and Investments in Derivatives, for more information. |
| See accompanying notes to financial statements. |
60
| | |
| NEA | Nuveen AMT-Free Quality Municipal Income Fund Portfolio of Investments April 30, 2020 (Unaudited) |
| | | | | | |
| Principal | | | Optional Call | | |
| Amount (000) | | Description (1) | Provisions (2) | Ratings (3) | Value |
| | LONG-TERM INVESTMENTS – 157.8% (99.4% of Total Investments) | | | |
| | MUNICIPAL BONDS – 157.8% (99.4% of Total Investments) | | | |
| | Alabama – 1.0% (0.6% of Total Investments) | | | |
| $ 4,250 | | Infirmary Health System Special Care Facilities Financing Authority of Mobile, Alabama, | 2/26 at 100.00 | BBB+ | $ 4,537,300 |
| | Revenue Bonds, Infirmary Health System, Inc, Series 2016A, 5.000%, 2/01/41 | | | |
| 20,675 | | Lower Alabama Gas District, Alabama, Gas Project Revenue Bonds, Series 2016A, | No Opt. Call | A3 | 25,808,396 |
| | 5.000%, 9/01/46 | | | |
| 4,900 | | Mobile Spring Hill College Educational Building Authority, Alabama, Revenue Bonds, | 4/25 at 100.00 | N/R | 4,802,441 |
| | Spring Hill College Project, Series 2015, 5.875%, 4/15/45 | | | |
| 5,310 | | Tuscaloosa County Industrial Development Authority, Florida, Gulf Opportunity Zone | 5/29 at 100.00 | N/R | 5,281,273 |
| | Bonds, Hunt Refining Project, Refunding Series 2019A, 5.250%, 5/01/44, 144A | | | |
| 35,135 | | Total Alabama | | | 40,429,410 |
| | Alaska – 0.6% (0.4% of Total Investments) | | | |
| | Northern Tobacco Securitization Corporation, Alaska, Tobacco Settlement Asset-Backed | | | |
| | Bonds, Series 2006A: | | | |
| 17,040 | | 5.000%, 6/01/32 | 5/20 at 100.00 | B3 | 17,075,955 |
| 5,070 | | 5.000%, 6/01/46 | 5/20 at 100.00 | B3 | 5,035,473 |
| 22,110 | | Total Alaska | | | 22,111,428 |
| | Arizona – 1.9% (1.2% of Total Investments) | | | |
| 1,460 | | Apache County Industrial Development Authority, Arizona, Pollution Control Revenue | 3/22 at 100.00 | A– | 1,493,419 |
| | Bonds, Tucson Electric Power Company, Series 20102A, 4.500%, 3/01/30 | | | |
| 3,815 | | Arizona Board of Regents, University of Arizona, SPEED Revenue Bonds, Stimulus Plan for | 8/30 at 100.00 | A+ | 4,151,674 |
| | Economic and Educational Development, Refunding Series 2020A, 4.000%, 8/01/44 | | | |
| 1,025 | | Arizona Industrial Development Authority, Arizona, Education Revenue Bonds, Academies of | 7/27 at 100.00 | AA– | 1,124,784 |
| | Math & Science Projects, Series 2017A, 5.000%, 7/01/51 | | | |
| 7,115 | | Lake Havasu City, Arizona, Wastewater System Revenue Bonds, Refunding Senior Lien Series | 7/25 at 100.00 | A2 | 8,090,395 |
| | 2015B, 5.000%, 7/01/43 – AGM Insured | | | |
| 1,315 | | Maricopa County Industrial Development Authority, Arizona, Hospital Revenue Bonds, | 9/28 at 100.00 | A2 | 1,463,161 |
| | HonorHealth, Series 2019A, 5.000%, 9/01/42 | | | |
| 5,135 | | Maricopa County Industrial Development Authority, Arizona, Revenue Bonds, Banner Health, | 1/27 at 100.00 | AA– | 5,333,725 |
| | Refunding Series 2016A, 4.000%, 1/01/36 | | | |
| 7,780 | | Phoenix Civic Improvement Corporation, Arizona, Airport Revenue Bonds, Junior Lien | 7/20 at 100.00 | A+ (4) | 7,832,904 |
| | Series 2010A, 5.000%, 7/01/40 (Pre-refunded 7/01/20) | | | |
| 5,500 | | Phoenix Civic Improvement Corporation, Arizona, Airport Revenue Bonds, Junior Lien | 7/29 at 100.00 | A+ | 5,775,000 |
| | Series 2019A, 4.000%, 7/01/44 | | | |
| | Phoenix Civic Improvement Corporation, Arizona, Revenue Bonds, Civic Plaza Expansion | | | |
| | Project, Series 2005B: | | | |
| 6,545 | | 5.500%, 7/01/37 – FGIC Insured | No Opt. Call | AA | 8,993,484 |
| 10,000 | | 5.500%, 7/01/40 – FGIC Insured | No Opt. Call | AA | 14,028,400 |
| 3,000 | | Queen Creek, Arizona, Excise Tax & State Shared Revenue Obligation Bonds, Series 2018A, | 8/28 at 100.00 | AA | 3,568,290 |
| | 5.000%, 8/01/47 | | | |
| 11,080 | | Salt Verde Financial Corporation, Arizona, Senior Gas Revenue Bonds, Citigroup Energy | No Opt. Call | BBB+ | 13,522,808 |
| | Inc Prepay Contract Obligations, Series 2007, 5.000%, 12/01/37 | | | |
| 63,770 | | Total Arizona | | | 75,378,044 |
| | Arkansas – 0.1% (0.1% of Total Investments) | | | |
| 5,080 | | Independence County, Arkansas, Hydroelectric Power Revenue Bonds, Series 2003, 5.350%, | 6/20 at 100.00 | N/R | 4,826,000 |
| | 5/01/28 – ACA Insured | | | |
61
| | |
| NEA | Nuveen AMT-Free Quality Municipal Income Fund Portfolio of Investments (continued) April 30, 2020 (Unaudited) |
| | | | | | |
| Principal | | | Optional Call | | |
| Amount (000) | | Description (1) | Provisions (2) | Ratings (3) | Value |
| | California – 11.6% (7.3% of Total Investments) | | | |
| $ 22,880 | | Alameda Corridor Transportation Authority, California, Revenue Bonds, Senior Lien Series | No Opt. Call | A– | $ 16,462,389 |
| | 1999A, 0.000%, 10/01/32 – NPFG Insured | | | |
| 4,225 | | Alameda Unified School District, Alameda County, California, General Obligation Bonds, | No Opt. Call | AA | 3,635,021 |
| | Series 2005B, 0.000%, 8/01/28 – AGM Insured | | | |
| 15,870 | | Anaheim Public Financing Authority, California, Lease Revenue Bonds, Public Improvement | No Opt. Call | A2 | 15,826,834 |
| | Project, Series 1997C, 0.000%, 9/01/20 – AGM Insured | | | |
| 3,450 | | Antelope Valley Joint Union High School District, Los Angeles and Kern Counties, | No Opt. Call | Aa3 | 2,854,806 |
| | California, General Obligation Bonds, Series 2004B, 0.000%, 8/01/29 – NPFG Insured | | | |
| | Bay Area Toll Authority, California, Revenue Bonds, San Francisco Bay Area Toll Bridge, | | | |
| | Series 2013S-4: | | | |
| 5,000 | | 5.000%, 4/01/38 (Pre-refunded 4/01/23) | 4/23 at 100.00 | A1 (4) | 5,611,700 |
| 6,500 | | 5.250%, 4/01/53 (Pre-refunded 4/01/23) | 4/23 at 100.00 | A1 (4) | 7,341,880 |
| 10,000 | | Bay Area Toll Authority, California, Revenue Bonds, San Francisco Bay Area Toll Bridge, | 4/24 at 100.00 | Aa3 (4) | 11,546,000 |
| | Series 2014F-1, 5.000%, 4/01/54 (Pre-refunded 4/01/24) | | | |
| 8,000 | | Beverly Hills Unified School District, Los Angeles County, California, General | No Opt. Call | AA+ | 5,986,320 |
| | Obligation Bonds, Series 2009, 0.000%, 8/01/33 | | | |
| | Burbank Unified School District, Los Angeles County, California, General Obligation | | | |
| | Bonds, Series 2015A: | | | |
| 2,250 | | 0.000%, 8/01/32 (5) | 2/25 at 100.00 | A+ | 2,193,682 |
| 1,350 | | 0.000%, 8/01/33 (5) | 2/25 at 100.00 | A+ | 1,310,350 |
| 7,845 | | California County Tobacco Securitization Agency, Tobacco Settlement Asset-Backed Bonds, | 5/20 at 100.00 | B2 | 7,845,863 |
| | Los Angeles County Securitization Corporation, Series 2006A, 5.600%, 6/01/36 | | | |
| | California Educational Facilities Authority, Revenue Refunding Bonds, Loyola Marymount | | | |
| | University, Series 2001A: | | | |
| 3,255 | | 0.000%, 10/01/23 – NPFG Insured | No Opt. Call | A2 | 3,108,037 |
| 5,890 | | 0.000%, 10/01/24 – NPFG Insured | No Opt. Call | A2 | 5,509,565 |
| 7,615 | | 0.000%, 10/01/25 – NPFG Insured | No Opt. Call | A2 | 6,951,962 |
| 1,350 | | 0.000%, 10/01/39 – NPFG Insured | No Opt. Call | A2 | 750,938 |
| 3,330 | | California Health Facilities Financing Authority, Refunding Revenue Bonds, Stanford | 11/21 at 100.00 | AA– (4) | 3,562,367 |
| | Hospital and Clinics, Series 2008A-2 RMKT, 5.250%, 11/15/40 (Pre-refunded 11/15/21) | | | |
| | California Health Facilities Financing Authority, Revenue Bonds, Lucile Salter Packard | | | |
| | Children’s Hospital, Series 2012A: | | | |
| 3,000 | | 5.000%, 8/15/51 (UB) (6) | 8/22 at 100.00 | A+ | 3,135,630 |
| 10,000 | | 5.000%, 8/15/51 | 8/22 at 100.00 | A+ | 10,452,100 |
| 530 | | California Health Facilities Financing Authority, Revenue Bonds, Saint Joseph Health | 7/23 at 100.00 | AA– | 572,162 |
| | System, Series 2013A, 5.000%, 7/01/37 | | | |
| 1,710 | | California Health Facilities Financing Authority, Revenue Bonds, Scripps Health, Series | 11/21 at 100.00 | Aa3 | 1,753,725 |
| | 2012A, 5.000%, 11/15/40 | | | |
| | California Health Facilities Financing Authority, Revenue Bonds, Stanford Hospitals and | | | |
| | Clinics, Tender Option Bond Trust 2016-XG0049: | | | |
| 485 | | 9.214%, 8/15/51, 144A (IF) (6) | 8/22 at 100.00 | AA– | 526,201 |
| 525 | | 9.222%, 8/15/51, 144A (IF) (6) | 8/22 at 100.00 | AA– | 569,641 |
| 1,285 | | 9.222%, 8/15/51, 144A (IF) (6) | 8/22 at 100.00 | AA– | 1,394,264 |
| 1,500 | | California Municipal Finance Authority, Revenue Bonds, Eisenhower Medical Center, | 7/27 at 100.00 | BBB– | 1,612,080 |
| | Refunding Series 2017A, 5.000%, 7/01/42 | | | |
| 2,330 | | California Municipal Finance Authority, Revenue Bonds, Eisenhower Medical Center, Series | 7/20 at 100.00 | Baa2 (4) | 2,349,269 |
| | 2010A, 5.750%, 7/01/40 (Pre-refunded 7/01/20) | | | |
| 965 | | California Public Finance Authority, Revenue Bonds, Henry Mayo Newhall Hospital, Series | 10/26 at 100.00 | BBB– | 997,289 |
| | 2017, 5.000%, 10/15/47 | | | |
| 2,930 | | California State Public Works Board, Lease Revenue Bonds, Various Capital Projects, | 11/23 at 100.00 | A+ | 3,203,750 |
| | Series 2013I, 5.000%, 11/01/38 | | | |
| 5,000 | | California State, General Obligation Bonds, Refunding Various Purpose Series 2017, | 8/26 at 100.00 | AA– | 5,458,600 |
| | 4.000%, 8/01/36 | | | |
| 5 | | California State, General Obligation Bonds, Series 2004, 5.000%, 4/01/31 – | 6/20 at 100.00 | AA– | 5,014 |
| | AMBAC Insured | | | |
62
| | | | | | |
| Principal | | | Optional Call | | |
| Amount (000) | | Description (1) | Provisions (2) | Ratings (3) | Value |
| | California (continued) | | | |
| | California State, General Obligation Bonds, Various Purpose Series 2010: | | | |
| $ 7,000 | | 5.250%, 3/01/30 | 6/20 at 100.00 | AA– | $ 7,021,420 |
| 4,250 | | 5.250%, 11/01/40 | 11/20 at 100.00 | AA– | 4,328,412 |
| 10,000 | | California State, General Obligation Bonds, Various Purpose Series 2011, 5.000%, 10/01/41 | 10/21 at 100.00 | AA– | 10,531,500 |
| 9,130 | | California Statewide Communities Development Authority, California, Revenue Bonds, Loma | 6/28 at 100.00 | BB– | 9,265,672 |
| | Linda University Medical Center, Series 2018A, 5.500%, 12/01/58, 144A | | | |
| 10,000 | | California Statewide Communities Development Authority, Revenue Bonds, Sutter Health, | 8/20 at 100.00 | A+ (4) | 10,152,500 |
| | Series 2011A, 6.000%, 8/15/42 (Pre-refunded 8/15/20) | | | |
| | California Statewide Community Development Authority, Revenue Bonds, Daughters of | | | |
| | Charity Health System, Series 2005A: | | | |
| 3,895 | | 5.750%, 7/01/30 (7) | 6/20 at 100.00 | N/R | 3,276,552 |
| 5,000 | | 5.750%, 7/01/35 (7) | 6/20 at 100.00 | N/R | 4,206,100 |
| 6,000 | | 5.500%, 7/01/39 (7) | 6/20 at 100.00 | N/R | 5,047,320 |
| 10,445 | | Castaic Lake Water Agency, California, Certificates of Participation, Water System | No Opt. Call | AA | 8,722,515 |
| | Improvement Project, Series 1999a, 0.000%, 8/01/29 – AMBAC Insured | | | |
| 4,775 | | Clovis Unified School District, Fresno County, California, General Obligation Bonds, | No Opt. Call | Baa2 (4) | 4,501,154 |
| | Series 2001A, 0.000%, 8/01/25 – FGIC Insured (ETM) | | | |
| 3,330 | | Contra Costa Community College District, Contra Costa County, California, General | 8/23 at 100.00 | AA+ (4) | 3,783,513 |
| | Obligation Bonds, Election of 2006, Series 2013, 5.000%, 8/01/38 (Pre-refunded 8/01/23) | | | |
| 7,775 | | Foothill/Eastern Transportation Corridor Agency, California, Toll Road Revenue Bonds, | No Opt. Call | BBB | 5,226,433 |
| | Refunding Senior Lien Series 2015A, 0.000%, 1/15/34 – AGM Insured | | | |
| | Foothill/Eastern Transportation Corridor Agency, California, Toll Road Revenue Bonds, | | | |
| | Refunding Series 2013A: | | | |
| 910 | | 0.000%, 1/15/42 (5) | 1/31 at 100.00 | Baa2 | 885,903 |
| 3,350 | | 5.750%, 1/15/46 | 1/24 at 100.00 | Baa2 | 3,606,777 |
| 8,350 | | 6.000%, 1/15/49 (Pre-refunded 1/15/24) | 1/24 at 100.00 | Baa2 (4) | 9,911,784 |
| 30,000 | | Foothill/Eastern Transportation Corridor Agency, California, Toll Road Revenue Bonds, | No Opt. Call | AA+ (4) | 29,850,600 |
| | Series 1995A, 0.000%, 1/01/21 (ETM) | | | |
| 3,120 | | Fullerton Public Financing Authority, California, Tax Allocation Revenue Bonds, Series | 9/20 at 100.00 | A | 3,148,548 |
| | 2005, 5.000%, 9/01/27 – AMBAC Insured | | | |
| 10,000 | | Golden State Tobacco Securitization Corporation, California, Tobacco Settlement | 6/22 at 100.00 | B– | 10,081,500 |
| | Asset-Backed Bonds, Senior Convertible Series 2007A-2, 5.300%, 6/01/37 | | | |
| 8,150 | | Golden State Tobacco Securitization Corporation, California, Tobacco Settlement | 6/22 at 100.00 | N/R | 7,944,294 |
| | Asset-Backed Bonds, Series 2018A-1, 5.000%, 6/01/47 | | | |
| 10,170 | | Golden State Tobacco Securitization Corporation, California, Tobacco Settlement | 6/22 at 100.00 | N/R | 9,913,309 |
| | Asset-Backed Bonds, Series 2018A-2, 5.000%, 6/01/47 | | | |
| 3,850 | | Grossmont Healthcare District, California, General Obligation Bonds, Series 2011B, | 7/21 at 100.00 | Aaa | 4,098,517 |
| | 6.125%, 7/15/40 (Pre-refunded 7/15/21) | | | |
| 5,000 | | Huntington Beach Union High School District, Orange County, California, General | No Opt. Call | AA– | 3,572,050 |
| | Obligation Bonds, Series 2007, 0.000%, 8/01/32 – FGIC Insured | | | |
| 3,040 | | Kern Community College District, California, General Obligation Bonds, Safety, Repair & | No Opt. Call | AA | 2,899,947 |
| | Improvement, Election 2002 Series 2006, 0.000%, 11/01/23 – AGM Insured | | | |
| 1,500 | | Lincoln Unified School District, Placer County, California, Community Facilities | No Opt. Call | N/R | 1,216,860 |
| | District 1, Special Tax Bonds, Series 2005, 0.000%, 9/01/26 – AMBAC Insured | | | |
| 95 | | Los Angeles Department of Water and Power, California, Electric Plant Revenue Bonds, | 7/20 at 100.00 | N/R (4) | 95,266 |
| | Second Series 1993, 4.750%, 10/15/20 (ETM) | | | |
| 995 | | Los Angeles Department of Water and Power, California, Electric Plant Revenue Bonds, | 7/20 at 100.00 | N/R (4) | 998,045 |
| | Series 1994, 5.375%, 2/15/34 (ETM) | | | |
| 10,000 | | Los Angeles Department of Water and Power, California, Waterworks Revenue Bonds, Series | 1/21 at 100.00 | Aa2 | 10,228,900 |
| | 2011A, 5.000%, 7/01/41 | | | |
| 2,490 | | Madera Unified School District, Madera County, California, General Obligation Bonds, | No Opt. Call | Baa2 | 2,189,905 |
| | Election 2002 Series 2005, 0.000%, 8/01/27 – NPFG Insured | | | |
| 10,335 | | Mount San Antonio Community College District, Los Angeles County, California, General | 8/35 at 100.00 | AA | 10,136,465 |
| | Obligation Bonds, Election of 2008, Series 2013A, 0.000%, 8/01/43 (5) | | | |
63
| | |
| NEA | Nuveen AMT-Free Quality Municipal Income Fund Portfolio of Investments (continued) April 30, 2020 (Unaudited) |
| | | | | | |
| Principal | | | Optional Call | | |
| Amount (000) | | Description (1) | Provisions (2) | Ratings (3) | Value |
| | California (continued) | | | |
| $ 5,500 | | M-S-R Energy Authority, California, Gas Revenue Bonds, Citigroup Prepay Contracts, | No Opt. Call | BBB+ | $ 7,888,540 |
| | Series 2009B, 6.500%, 11/01/39 | | | |
| 455 | | Mt Diablo Hospital District, California, Insured Hospital Revenue Bonds, Series 1993A, | No Opt. Call | N/R (4) | 490,181 |
| | 5.125%, 12/01/23 – AMBAC Insured (ETM) | | | |
| 14,100 | | New Haven Unified School District, California, General Obligation Bonds, Refunding | No Opt. Call | Aa3 | 9,788,925 |
| | Series 2009, 0.000%, 8/01/34 – AGC Insured | | | |
| 3,515 | | Newport Beach, California, Revenue Bonds, Hoag Memorial Hospital Presybterian, Series | 12/21 at 100.00 | N/R (4) | 3,804,636 |
| | 2011A, 5.875%, 12/01/30 (Pre-refunded 12/01/21) | | | |
| 2,500 | | Norwalk La Mirada Unified School District, Los Angeles County, California, General | No Opt. Call | Aa3 | 2,074,400 |
| | Obligation Bonds, Election 2002 Series 2005B, 0.000%, 8/01/29 | | | |
| 3,880 | | Ontario Redevelopment Financing Authority, San Bernardino County, California, Revenue | No Opt. Call | Baa2 | 4,324,376 |
| | Bonds, Redevelopment Project 1, Refunding Series 1995, 7.400%, 8/01/25 – NPFG Insured | | | |
| | Orange County Water District, California, Revenue Certificates of Participation, Series 2003B: | | | |
| 1,490 | | 5.000%, 8/15/34 – NPFG Insured (ETM) | No Opt. Call | Aa1 (4) | 1,915,499 |
| 1,745 | | 5.000%, 8/15/34 (Pre-refunded 8/15/32) – NPFG Insured | 8/32 at 100.00 | N/R (4) | 2,373,828 |
| 1,000 | | Pajaro Valley Unified School District, Santa Cruz County, California, General Obligation | No Opt. Call | AA | 829,760 |
| | Bonds, Series 2005B, 0.000%, 8/01/29 – AGM Insured | | | |
| 5,000 | | Palomar Pomerado Health Care District, California, Certificates of Participation, Series | 11/20 at 100.00 | Ba1 (4) | 5,126,050 |
| | 2010, 6.000%, 11/01/30 (Pre-refunded 11/01/20) | | | |
| 2,000 | | Palomar Pomerado Health, California, General Obligation Bonds, Capital Appreciation, | No Opt. Call | BBB– | 1,854,360 |
| | Election of 2004, Series 2007A, 0.000%, 8/01/24 – NPFG Insured | | | |
| 9,320 | | Palomar Pomerado Health, California, General Obligation Bonds, Series 2009A, 0.000%, | No Opt. Call | BBB– | 6,566,779 |
| | 8/01/33 – AGC Insured | | | |
| 3,270 | | Pomona, California, GNMA/FHLMC Collateralized Single Family Mortgage Revenue Refunding | No Opt. Call | AA+ (4) | 3,598,439 |
| | Bonds, Series 1990B, 7.500%, 8/01/23 (ETM) | | | |
| 1,800 | | Rialto Unified School District, San Bernardino County, California, General Obligation | No Opt. Call | Aa3 | 1,536,066 |
| | Bonds, Series 2011A, 0.000%, 8/01/28 | | | |
| 1,000 | | Rim of the World Unified School District, San Bernardino County, California, General | 8/21 at 100.00 | A2 (4) | 1,054,210 |
| | Obligation Bonds, Series 2011C, 5.000%, 8/01/38 (Pre-refunded 8/01/21) – AGM Insured | | | |
| 760 | | Riverside County Transportation Commission, California, Toll Revenue Senior Lien Bonds, | 6/23 at 100.00 | BBB+ | 803,510 |
| | Series 2013A, 5.750%, 6/01/44 | | | |
| 2,830 | | San Bernardino, California, GNMA Mortgage-Backed Securities Program Single Family | No Opt. Call | AA+ (4) | 3,088,209 |
| | Mortgage Revenue Refunding Bonds, Series 1990A, 7.500%, 5/01/23 (ETM) | | | |
| 2,250 | | San Buenaventura, California, Revenue Bonds, Community Memorial Health System, Series | 12/21 at 100.00 | BB | 2,400,592 |
| | 2011, 7.500%, 12/01/41 | | | |
| 4,000 | | San Francisco Airports Commission, California, Revenue Bonds, San Francisco | 5/23 at 100.00 | A+ | 4,308,720 |
| | International Airport, Governmental Purpose, Second Series 2013B, 5.000%, 5/01/43 | | | |
| | San Joaquin Hills Transportation Corridor Agency, Orange County, California, Toll Road | | | |
| | Revenue Bonds, Refunding Senior Lien Series 2014A: | | | |
| 10,595 | | 5.000%, 1/15/44 | 1/25 at 100.00 | BBB | 11,216,079 |
| 32,725 | | 5.000%, 1/15/50 | 1/25 at 100.00 | BBB | 34,527,820 |
| 7,210 | | San Joaquin Hills Transportation Corridor Agency, Orange County, California, Toll Road | No Opt. Call | Baa2 | 6,623,611 |
| | Revenue Bonds, Refunding Series 1997A, 0.000%, 1/15/23 – NPFG Insured | | | |
| 2,965 | | San Juan Unified School District, Sacramento County, California, General Obligation | No Opt. Call | A+ | 2,553,073 |
| | Bonds, Series 2004A, 0.000%, 8/01/28 – NPFG Insured | | | |
| 4,455 | | San Mateo County Community College District, California, General Obligation Bonds, | No Opt. Call | AAA | 4,394,412 |
| | Series 2006A, 0.000%, 9/01/21 – NPFG Insured | | | |
| 4,005 | | San Mateo Union High School District, San Mateo County, California, General Obligation | No Opt. Call | AA+ | 3,624,405 |
| | Bonds, Election of 2000, Series 2002B, 0.000%, 9/01/26 – FGIC Insured | | | |
| 15,750 | | San Ysidro School District, San Diego County, California, General Obligation Bonds, 1997 | No Opt. Call | AA | 8,679,667 |
| | Election Series 2012G, 0.000%, 8/01/39 – AGM Insured | | | |
| | San Ysidro School District, San Diego County, California, General Obligation Bonds, | | | |
| | Refunding Series 2015: | | | |
| 5,000 | | 0.000%, 8/01/46 | 8/25 at 32.80 | A2 | 1,446,950 |
| 6,570 | | 0.000%, 8/01/47 | 8/25 at 30.90 | A2 | 1,788,682 |
64
| | | | | | |
| Principal | | | Optional Call | | |
| Amount (000) | | Description (1) | Provisions (2) | Ratings (3) | Value |
| | California (continued) | | | |
| $ 1,530 | | Tobacco Securitization Authority of Northern California, Tobacco Settlement Asset-Backed | 5/20 at 100.00 | BBB | $ 1,530,015 |
| | Bonds, Series 2005A-1, 4.750%, 6/01/23 | | | |
| 2,630 | | Union Elementary School District, Santa Clara County, California, General Obligation | No Opt. Call | Baa2 | 2,425,465 |
| | Bonds, Series 2001B, 0.000%, 9/01/25 – FGIC Insured | | | |
| 3,900 | | West Hills Community College District, California, General Obligation Bonds, School | 8/21 at 100.00 | A2 (4) | 4,180,137 |
| | Facilities Improvement District 3, 2008 Election Series 2011, 6.500%, 8/01/41 (Pre-refunded | | | |
| | 8/01/21) – AGM Insured | | | |
| 495,780 | | Total California | | | 466,186,596 |
| | Colorado – 10.5% (6.6% of Total Investments) | | | |
| 1,365 | | Aerotropolis Regional Transportation Authority, Colorado, Special Revenue Bonds, Series | 12/24 at 102.00 | N/R | 1,205,827 |
| | 2019, 5.000%, 12/01/51 | | | |
| 500 | | Blue Lake Metropolitan District 2 , Lochbuie, Colorado, Limited Tax General Obligation | 12/21 at 103.00 | N/R | 464,715 |
| | Bonds, Series 2016A, 5.750%, 12/01/46 | | | |
| | Centerra Metropolitan District 1, Loveland, Colorado, Special Revenue Bonds, Refunding & | | | |
| | Improvement Series 2017: | | | |
| 1,575 | | 5.000%, 12/01/37, 144A | 12/22 at 103.00 | N/R | 1,443,677 |
| 3,620 | | 5.000%, 12/01/47, 144A | 12/22 at 103.00 | N/R | 3,113,019 |
| 1,060 | | Centerra Metropolitan District No 1, In the City of Loveland, Larimer County, Colorado, | 12/23 at 103.00 | N/R | 980,436 |
| | Special Revenue Improvement Bonds, Series 2018, 5.250%, 12/01/48 | | | |
| 1,250 | | Central Platte Valley Metropolitan District, Colorado, General Obligation Bonds, | 12/23 at 100.00 | BBB– | 1,301,800 |
| | Refunding Series 2013A, 5.375%, 12/01/33 | | | |
| 115 | | Central Platte Valley Metropolitan District, Colorado, General Obligation Bonds, | 12/23 at 100.00 | BB | 114,365 |
| | Refunding Series 2014, 5.000%, 12/01/43 | | | |
| 1,700 | | Colorado Educational and Cultural Facilities Authority, Charter School Revenue Bonds, | 7/24 at 100.00 | BB | 1,563,201 |
| | Skyview Academy Project, Series 2014, 5.375%, 7/01/44, 144A | | | |
| | Colorado Health Facilities Authority, Colorado, Health Facilities Revenue Bonds, The | | | |
| | Evangelical Lutheran Good Samaritan Society Project, Refunding Series 2017: | | | |
| 2,005 | | 5.000%, 6/01/34 (Pre-refunded 6/01/27) | 6/27 at 100.00 | N/R (4) | 2,521,849 |
| 4,615 | | 5.000%, 6/01/35 (Pre-refunded 6/01/27) | 6/27 at 100.00 | N/R (4) | 5,804,655 |
| 7,205 | | 5.000%, 6/01/36 (Pre-refunded 6/01/27) | 6/27 at 100.00 | N/R (4) | 9,062,305 |
| 8,715 | | 5.000%, 6/01/37 (Pre-refunded 6/01/27) | 6/27 at 100.00 | N/R (4) | 10,961,553 |
| 4,105 | | 5.000%, 6/01/42 (Pre-refunded 6/01/27) | 6/27 at 100.00 | N/R (4) | 5,163,187 |
| 8,545 | | 5.000%, 6/01/47 (Pre-refunded 6/01/27) | 6/27 at 100.00 | N/R (4) | 10,747,730 |
| 5,235 | | Colorado Health Facilities Authority, Colorado, Revenue Bonds, AdventHealth Obligated | 11/29 at 100.00 | AA | 5,415,398 |
| | Group, Series 2019A, 4.000%, 11/15/43 | | | |
| 2,295 | | Colorado Health Facilities Authority, Colorado, Revenue Bonds, Catholic Health | 2/21 at 100.00 | BBB+ (4) | 2,367,499 |
| | Initiatives, Series 2011A, 5.000%, 2/01/41 (Pre-refunded 2/01/21) | | | |
| 5,000 | | Colorado Health Facilities Authority, Colorado, Revenue Bonds, Catholic Health | 1/23 at 100.00 | BBB+ (4) | 5,551,850 |
| | Initiatives, Series 2013A, 5.250%, 1/01/45 (Pre-refunded 1/01/23) | | | |
| 5,000 | | Colorado Health Facilities Authority, Colorado, Revenue Bonds, Children’s Hospital | 12/23 at 100.00 | A+ | 5,349,900 |
| | Colorado Project, Series 2013A, 5.000%, 12/01/36 | | | |
| 3,050 | | Colorado Health Facilities Authority, Colorado, Revenue Bonds, Christian Living | 1/24 at 102.00 | N/R | 2,755,126 |
| | Neighborhoods Project, Refunding Series 2016, 5.000%, 1/01/37 | | | |
| 20,815 | | Colorado Health Facilities Authority, Colorado, Revenue Bonds, CommonSpirit Health, | 8/29 at 100.00 | BBB+ | 19,878,741 |
| | Series 2019A-2, 4.000%, 8/01/49 | | | |
| 2,375 | | Colorado Health Facilities Authority, Colorado, Revenue Bonds, Evangelical Lutheran Good | 6/22 at 100.00 | N/R (4) | 2,583,976 |
| | Samaritan Society Project, Refunding Series 2012, 5.000%, 12/01/42 (Pre-refunded 6/01/22) | | | |
| 1,000 | | Colorado Health Facilities Authority, Colorado, Revenue Bonds, Evangelical Lutheran Good | 6/23 at 100.00 | N/R (4) | 1,146,920 |
| | Samaritan Society Project, Series 2013, 5.625%, 6/01/43 (Pre-refunded 6/01/23) | | | |
| 750 | | Colorado Health Facilities Authority, Colorado, Revenue Bonds, Frasier Meadows Project, | 5/27 at 100.00 | BB+ | 708,045 |
| | Refunding & Improvement Series 2017A, 5.250%, 5/15/37 | | | |
| 1,500 | | Colorado Health Facilities Authority, Colorado, Revenue Bonds, Parkview Medical Center, | 9/25 at 100.00 | A3 | 1,566,195 |
| | Refunding Series 2015B, 4.000%, 9/01/34 | | | |
65
| | | | | |
| NEA | Nuveen AMT-Free Quality Municipal Income Fund | |
| Portfolio of Investments (continued) April 30, 2020 (Unaudited)
| | | |
| Principal | | | Optional Call | | |
| Amount (000) | | Description (1) | Provisions (2) | Ratings (3) | Value |
| | Colorado (continued) | | | |
| $ 1,000 | | Colorado Health Facilities Authority, Colorado, Revenue Bonds, Sanford Health, Series | 11/29 at 100.00 | A+ | $ 1,057,720 |
| | 2019A, 4.000%, 11/01/39 | | | |
| 3,300 | | Colorado Health Facilities Authority, Colorado, Revenue Bonds, SCL Health System, | 1/30 at 100.00 | AA– | 3,481,929 |
| | Refunding Series 2019A, 4.000%, 1/01/37 | | | |
| 4,880 | | Colorado Health Facilities Authority, Colorado, Revenue Bonds, SCL Health System, | 1/30 at 100.00 | AA– | 5,053,435 |
| | Refunding Series 2019B, 4.000%, 1/01/40 | | | |
| 4,150 | | Colorado High Performance Transportation Enterprise, C-470 Express Lanes Revenue Bonds, | 12/24 at 100.00 | BBB | 3,854,769 |
| | Senior Lien Series 2017, 5.000%, 12/31/56 | | | |
| | Colorado International Center Metropolitan District 14, Denver, Colorado, Limited Tax | | | |
| | General Obligation Bonds, Refunding & Improvement Series 2018: | | | |
| 1,895 | | 5.625%, 12/01/32 | 12/23 at 103.00 | N/R | 1,797,047 |
| 2,660 | | 5.875%, 12/01/46 | 12/23 at 103.00 | N/R | 2,387,536 |
| | Colorado School of Mines Board of Trustees, Golden, Colorado, Institutional Enterprise | | | |
| | Revenue Bonds, Series 2017B: | | | |
| 2,000 | | 5.000%, 12/01/42 | 12/27 at 100.00 | A+ | 2,278,060 |
| 1,225 | | 5.000%, 12/01/47 | 12/27 at 100.00 | A+ | 1,381,200 |
| 1,500 | | Colorado State Board of Governors, Colorado State University Auxiliary Enterprise System | 3/27 at 100.00 | A+ | 1,690,200 |
| | Revenue Bonds, Refunding Series 2016B, 5.000%, 3/01/41 | | | |
| 2,000 | | Colorado State Board of Governors, Colorado State University Auxiliary Enterprise System | 9/27 at 100.00 | AA | 2,208,680 |
| | Revenue Bonds, Refunding Series 2017A, 4.000%, 3/01/40 | | | |
| 6,500 | | Colorado State Board of Governors, Colorado State University Auxiliary Enterprise System | 3/28 at 100.00 | AA | 7,098,975 |
| | Revenue Bonds, Refunding Series 2017E, 4.000%, 3/01/43 | | | |
| 5,000 | | Colorado State, Certificates of Participation, Rural Series 2018A, 4.000%, 12/15/35 | 12/28 at 100.00 | AA– | 5,568,200 |
| | Commerce City, Colorado, Sales and Use Tax Revenue Bonds, Series 2016: | | | |
| 7,115 | | 5.000%, 8/01/41 | 8/26 at 100.00 | A1 | 8,333,657 |
| 1,000 | | 5.000%, 8/01/46 | 8/26 at 100.00 | A1 | 1,163,640 |
| 1,000 | | Copper Ridge Metropolitan District, Colorado Springs, Colorado, Tax Increment and Sales | 12/24 at 103.00 | N/R | 879,580 |
| | Tax Supported Revenue Bonds, Series 2019, 5.000%, 12/01/39 | | | |
| 11,140 | | Denver City and County, Colorado, Airport System Revenue Bonds, Series 2012B, | 11/22 at 100.00 | A+ | 11,828,675 |
| | 5.000%, 11/15/37 | | | |
| 12,900 | | Denver City and County, Colorado, Airport System Revenue Bonds, Subordinate Lien Series | 11/23 at 100.00 | A | 13,898,073 |
| | 2013B, 5.000%, 11/15/43 | | | |
| 2,500 | | Denver City and County, Colorado, Airport System Revenue Bonds, Subordinate Lien Series | 12/28 at 100.00 | A | 2,842,800 |
| | 2018B, 5.000%, 12/01/48 | | | |
| | Denver Convention Center Hotel Authority, Colorado, Revenue Bonds, Convention Center | | | |
| | Hotel, Refunding Senior Lien Series 2016: | | | |
| 1,620 | | 5.000%, 12/01/32 | 12/26 at 100.00 | BBB– | 1,635,730 |
| 3,680 | | 5.000%, 12/01/33 | 12/26 at 100.00 | BBB– | 3,699,173 |
| 2,400 | | 5.000%, 12/01/36 | 12/26 at 100.00 | BBB– | 2,412,792 |
| 1,800 | | 5.000%, 12/01/40 | 12/26 at 100.00 | BBB– | 1,809,450 |
| 365 | | Denver Urban Renewal Authority, Colorado, Tax Increment Revenue Bonds, 9th and Colorado | 12/23 at 103.00 | N/R | 338,052 |
| | Urban Redevelopement Area, Series 2018A, 5.250%, 12/01/39, 144A | | | |
| 13,920 | | E-470 Public Highway Authority, Colorado, Senior Revenue Bonds, Series 1997B, 0.000%, | No Opt. Call | A | 13,706,467 |
| | 9/01/21 – NPFG Insured | | | |
| | E-470 Public Highway Authority, Colorado, Senior Revenue Bonds, Series 2000B: | | | |
| 6,200 | | 0.000%, 9/01/22 – NPFG Insured | No Opt. Call | A | 5,866,006 |
| 45,540 | | 0.000%, 9/01/30 – NPFG Insured | No Opt. Call | A | 32,766,485 |
| 16,635 | | 0.000%, 9/01/32 – NPFG Insured | No Opt. Call | A | 10,970,450 |
| 49,250 | | 0.000%, 9/01/33 – NPFG Insured | No Opt. Call | A | 31,128,955 |
| | E-470 Public Highway Authority, Colorado, Toll Revenue Bonds, Series 2004A: | | | |
| 9,310 | | 0.000%, 9/01/28 – NPFG Insured | No Opt. Call | A | 7,248,021 |
| 2,900 | | 0.000%, 9/01/34 – NPFG Insured | No Opt. Call | A | 1,757,603 |
| 18,500 | | 0.000%, 3/01/36 – NPFG Insured | No Opt. Call | A | 10,474,885 |
66
| | | | | | |
| Principal | | | Optional Call | | |
| Amount (000) | | Description (1) | Provisions (2) | Ratings (3) | Value |
| | Colorado (continued) | | | |
| | E-470 Public Highway Authority, Colorado, Toll Revenue Bonds, Series 2004B: | | | |
| $ 3,800 | | 0.000%, 9/01/27 – NPFG Insured | 9/20 at 67.94 | A | $ 2,559,300 |
| 13,300 | | 0.000%, 9/01/31 – NPFG Insured | 9/20 at 53.77 | A | 7,081,851 |
| 6,250 | | 0.000%, 9/01/32 – NPFG Insured | 9/20 at 50.83 | A | 3,144,438 |
| 10,000 | | 0.000%, 3/01/36 – NPFG Insured | 9/20 at 41.72 | A | 4,127,000 |
| 1,000 | | Lorson Ranch Metropolitan District 2, El Paso County, Colorado, Limited Tax General | 12/26 at 100.00 | BBB+ | 1,111,990 |
| | Obligation Bonds, Series 2016, 5.000%, 12/01/36 | | | |
| 1,000 | | Louisville, Boulder County, Colorado, General Obligation Bonds, Limited Tax, Series | 12/26 at 100.00 | AA+ | 1,095,910 |
| | 2017, 4.000%, 12/01/36 | | | |
| 1,085 | | North Range Metropolitan District No 2 , In the City of Commerce City, Adams County, | 12/22 at 103.00 | N/R | 1,018,099 |
| | Colorado , Limited Tax General Obligation and Special Revenue and Improvement Bonds, | | | |
| | Refunding Series 2017A, 5.750%, 12/01/47 | | | |
| 1,224 | | Palisade Metropolitan District 2, Broomfield County, Colorado, General Obligation | 12/21 at 103.00 | N/R | 1,107,793 |
| | Limited Tax Bonds, Series 2016, 4.375%, 12/01/31 | | | |
| 17,735 | | Park Creek Metropolitan District, Colorado, Senior Limited Property Tax Supported | 12/25 at 100.00 | A | 19,997,099 |
| | Revenue Bonds, Refunding Series 2015A, 5.000%, 12/01/45 | | | |
| | Park Creek Metropolitan District, Colorado, Senior Limited Property Tax Supported | | | |
| | Revenue Bonds, Series 2019A: | | | |
| 3,040 | | 4.000%, 12/01/37 – AGM Insured | 12/29 at 100.00 | A | 3,421,216 |
| 3,255 | | 4.000%, 12/01/46 – AGM Insured | 12/29 at 100.00 | A | 3,584,634 |
| 2,640 | | Park Creek Metropolitan District, Colorado, Senior Limited Property Tax Supported | 12/20 at 100.00 | A2 (4) | 2,721,550 |
| | Revenue Refunding Bonds, Series 2011, 6.125%, 12/01/41 (Pre-refunded 12/01/20) – AGM Insured | | | |
| | Rampart Range Metropolitan District 1, Lone Tree, Colorado, Limited Tax Supported and | | | |
| | Special Revenue Bonds, Refunding & Improvement Series 2017: | | | |
| 8,765 | | 5.000%, 12/01/42 | 12/27 at 100.00 | A2 | 10,177,304 |
| 3,600 | | 5.000%, 12/01/47 | 12/27 at 100.00 | A2 | 4,150,908 |
| 630 | | Regional Transportation District, Colorado, Certificates of Participation, Series 2010A, | 6/20 at 100.00 | AA– (4) | 632,155 |
| | 5.375%, 6/01/31 (Pre-refunded 6/01/20) | | | |
| | Regional Transportation District, Colorado, Denver Transit Partners Eagle P3 Project | | | |
| | Private Activity Bonds, Series 2010: | | | |
| 15,000 | | 6.500%, 1/15/30 | 7/20 at 100.00 | Baa3 | 15,056,400 |
| 4,150 | | 6.000%, 1/15/41 | 7/20 at 100.00 | Baa3 | 4,161,579 |
| 3,250 | | Thompson Crossing Metropolitan District 2, Johnstown, Larimer County, Colorado, General | 12/26 at 100.00 | AA | 3,753,133 |
| | Obligation Bonds, Limited Tax Convertible to Unlimited Tax, Series 2016B, 5.000%, 12/01/46 – | | | |
| | AGM Insured | | | |
| 4,000 | | University of Colorado Hospital Authority, Colorado, Revenue Bonds, Series 2012A, | 11/22 at 100.00 | Aa3 | 4,209,720 |
| | 5.000%, 11/15/42 | | | |
| 14,500 | | University of Colorado, Enterprise System Revenue Bonds, Series 2014A, 5.000%, 6/01/46 | 6/24 at 100.00 | Aa1 (4) | 16,873,360 |
| | (Pre-refunded 6/01/24) | | | |
| 2,500 | | Vista Ridge Metropolitan District, In the Town of Erie, Weld County, Colorado, General | 12/26 at 100.00 | Baa1 | 2,708,125 |
| | Obligation Refunding Bonds, Series 2016A, 4.000%, 12/01/36 – BAM Insured | | | |
| 5,000 | | Weld County School District 6, Greeley, Colorado, General Obligation Bonds, Series 2020, | 12/29 at 100.00 | AA | 6,081,800 |
| | 5.000%, 12/01/44 | | | |
| 2,175 | | Weld County School District RE1, Colorado, General Obligation Bonds, Series 2017, | 12/26 at 100.00 | AA | 2,629,858 |
| | 5.000%, 12/15/30 | | | |
| 465,179 | | Total Colorado | | | 423,795,436 |
| | Connecticut – 0.3% (0.2% of Total Investments) | | | |
| 1,650 | | Connecticut Health and Educational Facilities Authority, Revenue Bonds, Fairfield | 7/26 at 100.00 | A– | 1,768,222 |
| | University, Series 2016Q-1, 5.000%, 7/01/46 | | | |
| 7,165 | | Connecticut Health and Educational Facilities Authority, Revenue Bonds, Quinnipiac | 7/25 at 100.00 | A– | 7,607,654 |
| | University, Refunding Series 2015L, 5.000%, 7/01/45 | | | |
67
| | | | | |
| NEA | Nuveen AMT-Free Quality Municipal Income Fund | |
| Portfolio of Investments (continued)
| | | |
| | April 30, 2020 (Unaudited)
| | | |
|
|
|
| Principal | | | Optional Call | | |
| Amount (000) | | Description (1) | Provisions (2) | Ratings (3) | Value |
| | Connecticut (continued) | | | |
| | Connecticut Health and Educational Facilities Authority, Revenue Bonds, Sacred Heart | | | |
| | University, Series 2017I-1: | | | |
| $ 500 | | 5.000%, 7/01/34 | 7/27 at 100.00 | A3 | $ 552,650 |
| 2,425 | | 5.000%, 7/01/42 | 7/27 at 100.00 | A3 | 2,625,135 |
| 11,740 | | Total Connecticut | | | 12,553,661 |
| | Delaware – 0.4% (0.3% of Total Investments) | | | |
| 1,000 | | Delaware Health Facilities Authority, Revenue Bonds, Christiana Care Health Services | 10/20 at 100.00 | Aa2 (4) | 1,017,750 |
| | Inc, Series 2010A, 5.000%, 10/01/40 (Pre-refunded 10/01/20) | | | |
| 3,350 | | Delaware Health Facilities Authority, Revenue Bonds, Nanticoke Memorial Hospital, Series | 7/23 at 100.00 | BBB+ | 3,544,233 |
| | 2013, 5.000%, 7/01/32 | | | |
| 1,000 | | Delaware Health Facilities Authority, Revenue Bonds, Beebe Medical Center Project, | 12/28 at 100.00 | BBB | 1,071,900 |
| | Series 2018, 5.000%, 6/01/48 | | | |
| 9,070 | | Delaware Transportation Authority, Revenue Bonds, US 301 Project, Series 2015, | 6/25 at 100.00 | AA– | 10,071,056 |
| | 5.000%, 6/01/55 | | | |
| 14,420 | | Total Delaware | | | 15,704,939 |
| | District of Columbia – 1.1% (0.7% of Total Investments) | | | |
| 1,250 | | District of Columbia Student Dormitory Revenue Bonds, Provident Group – Howard | 10/22 at 100.00 | BB+ | 1,089,450 |
| | Properties LLC Issue, Series 2013, 5.000%, 10/01/45 | | | |
| 107,000 | | District of Columbia Tobacco Settlement Corporation, Tobacco Settlement Asset-Backed | 6/20 at 20.14 | N/R | 17,959,950 |
| | Bonds, Series 2006A, 0.000%, 6/15/46 | | | |
| | District of Columbia, Revenue Bonds, Georgetown University, Refunding Series 2017: | | | |
| 3,500 | | 5.000%, 4/01/35 | 4/27 at 100.00 | A– | 3,832,920 |
| 60 | | 5.000%, 4/01/36 (Pre-refunded 4/01/27) | 4/27 at 100.00 | N/R (4) | 75,571 |
| 3,440 | | 5.000%, 4/01/36 | 4/27 at 100.00 | A– | 3,753,831 |
| 15,150 | | District of Columbia, Revenue Bonds, Georgetown University, Series 2007A, 5.000%, | 4/21 at 100.00 | A– (4) | 15,742,971 |
| | 4/01/40 (Pre-refunded 4/01/21) – AMBAC Insured | | | |
| 2,530 | | Metropolitan Washington Airports Authority, Virginia, Dulles Toll Road Revenue Bonds, | 10/29 at 100.00 | Baa2 | 2,450,760 |
| | Dulles Metrorail & Capital improvement Projects, Refunding & Subordinate Lien Series 2019B, | | | |
| | 4.000%, 10/01/49 | | | |
| 132,930 | | Total District of Columbia | | | 44,905,453 |
| | Florida – 7.8% (4.9% of Total Investments) | | | |
| 2,800 | | Bay County, Florida, Educational Facilities Revenue Refunding Bonds, Bay Haven Charter | 9/23 at 100.00 | BBB | 2,868,516 |
| | Academy, Inc Project, Series 2016, 5.000%, 9/01/46 | | | |
| 11,000 | | Cape Coral, Florida, Water and Sewer Revenue Bonds, Refunding Series 2011, 5.000%, | 10/21 at 100.00 | A1 (4) | 11,650,430 |
| | 10/01/41 (Pre-refunded 10/01/21) – AGM Insured | | | |
| 2,830 | | City of Miami Beach, Florida, Stormwater Revenue Bonds, Series 2015, 5.000%, 9/01/41 | 9/25 at 100.00 | AA– | 3,263,528 |
| 3,010 | | Cocoa, Florida, Water and Sewer System Revenue Bonds, Refunding Series 2003, 5.500%, | No Opt. Call | AA | 3,251,733 |
| | 10/01/23 – AMBAC Insured | | | |
| 3,570 | | Collier County Educational Facilities Authority, Florida, Revenue Bonds, Hodges | 11/23 at 100.00 | BB+ | 3,626,406 |
| | University, Refunding Series 2013, 6.125%, 11/01/43 | | | |
| 5,810 | | Collier County, Florida, Tourist Development Tax Revenue Bonds, Series 2018, | 10/28 at 100.00 | Aa3 | 5,949,324 |
| | 4.000%, 10/01/43 | | | |
| | Davie, Florida, Educational Facilities Revenue Bonds, Nova Southeastern University | | | |
| | Project, Series 2013A: | | | |
| 8,555 | | 6.000%, 4/01/42 | 4/23 at 100.00 | Baa1 | 9,073,091 |
| 4,280 | | 5.625%, 4/01/43 | 4/23 at 100.00 | Baa1 | 4,491,988 |
| | Florida Municipal Loan Council, Revenue Bonds, Series 2000B: | | | |
| 1,040 | | 0.000%, 11/01/25 – NPFG Insured | No Opt. Call | Baa2 | 915,429 |
| 1,590 | | 0.000%, 11/01/26 – NPFG Insured | No Opt. Call | Baa2 | 1,358,114 |
| 15,000 | | Hillsborough County Aviation Authority, Florida, Revenue Bonds, Tampa International | 10/28 at 100.00 | AA– | 16,468,200 |
| | Airport, Series 2018F, 5.000%, 10/01/48 (UB) (6) | | | |
68
| | | | | | |
| Principal | | | Optional Call | | |
| Amount (000) | | Description (1) | Provisions (2) | Ratings (3) | Value |
| | Florida (continued) | | | |
| | Hillsborough County Aviation Authority, Florida, Revenue Bonds, Tampa International | | | |
| | Airport, Subordinate Lien Series 2015B: | | | |
| $ 5,730 | | 5.000%, 10/01/40 | 10/24 at 100.00 | A+ | $ 6,153,103 |
| 12,885 | | 5.000%, 10/01/44 | 10/24 at 100.00 | A+ | 13,765,303 |
| 400 | | Jacksonville, Florida, Better Jacksonville Sales Tax Revenue Bonds, Refunding Series | 10/22 at 100.00 | A2 | 433,940 |
| | 2012, 5.000%, 10/01/30 | | | |
| 1,530 | | Lakeland, Florida, Hospital System Revenue Bonds, Lakeland Regional Health, Refunding | 11/21 at 100.00 | A2 | 1,596,769 |
| | Series 2011, 5.000%, 11/15/24 | | | |
| 2,500 | | Lakeland, Florida, Hospital System Revenue Bonds, Lakeland Regional Health, Series 2015, | 11/24 at 100.00 | A2 | 2,621,825 |
| | 5.000%, 11/15/45 | | | |
| | Miami Beach Redevelopment Agency, Florida, Tax Increment Revenue Bonds, City | | | |
| | Center/Historic Convention Village, Series 2015A: | | | |
| 3,810 | | 5.000%, 2/01/40 – AGM Insured | 2/24 at 100.00 | A1 | 4,279,964 |
| 19,145 | | 5.000%, 2/01/44 – AGM Insured | 2/24 at 100.00 | A1 | 21,380,753 |
| | Miami Health Facilities Authority, Florida, Health Facilities Revenue Bonds, Miami | | | |
| | Jewish Health System Inc Project, Series 2017: | | | |
| 205 | | 5.000%, 7/01/32 | 7/27 at 100.00 | BBB– | 170,015 |
| 2,000 | | 5.125%, 7/01/38 | 7/27 at 100.00 | BBB– | 1,560,960 |
| 5,035 | | 5.125%, 7/01/46 | 7/27 at 100.00 | BBB– | 3,672,428 |
| 1,200 | | Miami, Florida, Special Obligation Non-Ad Valorem Revenue Bonds, Refunding Series 2011A, | 2/21 at 100.00 | Aa3 (4) | 1,246,404 |
| | 6.000%, 2/01/30 (Pre-refunded 2/01/21) – AGM Insured | | | |
| 7,390 | | Miami-Dade County Educational Facilities Authority, Florida, Revenue Bonds, University | 4/25 at 100.00 | A– | 7,824,458 |
| | of Miami, Series 2015A, 5.000%, 4/01/45 | | | |
| 17,000 | | Miami-Dade County Educational Facilities Authority, Florida, Revenue Bonds, University | 4/28 at 100.00 | A– | 18,417,630 |
| | of Miami, Series 2018A, 5.000%, 4/01/53 | | | |
| 10,000 | | Miami-Dade County Expressway Authority, Florida, Toll System Revenue Bonds, Series | 7/20 at 100.00 | BBB+ | 10,040,700 |
| | 2010A, 5.000%, 7/01/35 | | | |
| 1,210 | | Miami-Dade County Industrial Development Authority, Florida, Revenue Bonds, Doral | 1/28 at 100.00 | BBB– | 1,241,847 |
| | Academy, Seres 2018, 5.000%, 1/15/37 | | | |
| 1,000 | | Miami-Dade County, Florida, Aviation Revenue Bonds, Miami International Airport, | 10/24 at 100.00 | A | 1,095,380 |
| | Refunding Series 2014B, 5.000%, 10/01/37 | | | |
| 7,500 | | Miami-Dade County, Florida, Aviation Revenue Bonds, Miami International Airport, Series | 10/20 at 100.00 | A2 (4) | 7,644,525 |
| | 2010A-1, 5.375%, 10/01/41 (Pre-refunded 10/01/20) | | | |
| | Miami-Dade County, Florida, Aviation Revenue Bonds, Miami International Airport, | | | |
| | Series 2010B: | | | |
| 3,000 | | 5.000%, 10/01/26 (Pre-refunded 10/01/20) | 10/20 at 100.00 | A (4) | 3,052,620 |
| 2,500 | | 5.000%, 10/01/27 (Pre-refunded 10/01/20) | 10/20 at 100.00 | A (4) | 2,543,850 |
| 4,000 | | 5.000%, 10/01/35 – AGM Insured | 10/20 at 100.00 | A2 | 4,052,400 |
| 1,500 | | Miami-Dade County, Florida, Aviation Revenue Bonds, Refunding Series 2016A, | 10/26 at 100.00 | A | 1,651,155 |
| | 5.000%, 10/01/41 | | | |
| 4,715 | | Miami-Dade County, Florida, Public Facilities Revenue Bonds, Jackson Health System, | 6/27 at 100.00 | Aa3 | 5,412,726 |
| | Series 2017, 5.000%, 6/01/38 | | | |
| 1,850 | | Miami-Dade County, Florida, Special Obligation Bonds, Refunding Subordinate Series | 10/22 at 100.00 | A2 | 2,006,510 |
| | 2012B, 5.000%, 10/01/37 | | | |
| | Miami-Dade County, Florida, Transit System Sales Surtax Revenue Bonds, Refunding | | | |
| | Series 2012: | | | |
| 5,500 | | 5.000%, 7/01/31 | 7/22 at 100.00 | A1 | 5,903,315 |
| 3,000 | | 5.000%, 7/01/42 | 7/22 at 100.00 | A1 | 3,188,310 |
| 7,000 | | Miami-Dade County, Florida, Transit System Sales Surtax Revenue Bonds, Series 2018, | 7/28 at 100.00 | AA | 7,607,320 |
| | 4.000%, 7/01/48 | | | |
| 5,770 | | Miami-Dade County, Florida, Water and Sewer System Revenue Bonds, Series 2013A, 5.000%, | 10/22 at 100.00 | A+ (4) | 6,365,868 |
| | 10/01/42 (Pre-refunded 10/01/22) | | | |
| 9,965 | | Miami-Dade County, Florida, Water and Sewer System Revenue Bonds, Series 2019B, | 10/29 at 100.00 | A+ | 10,861,152 |
| | 4.000%, 10/01/49 | | | |
69
| | | | | |
| NEA | Nuveen AMT-Free Quality Municipal Income Fund | |
| Portfolio of Investments (continued) | | | |
| | April 30, 2020 (Unaudited)
| | | |
|
|
|
|
| Principal | | | Optional Call | | |
| Amount (000) | | Description (1) | Provisions (2) | Ratings (3) | Value |
| | Florida (continued) | | | |
| $ 750 | | Orange County Health Facilities Authority, Florida, Hospital Revenue Bonds, Orlando | 4/22 at 100.00 | A2 | $ 777,113 |
| | Health, Inc, Series 2012A, 5.000%, 10/01/42 | | | |
| 1,095 | | Osceola County, Florida, Transportation Revenue Bonds, Osceola Parkway, Refunding & | 10/29 at 91.18 | BBB– | 755,309 |
| | Improvement Capital Appreciation Series 2019A-2, 0.000%, 10/01/32 | | | |
| 5,045 | | Osceola County, Florida, Transportation Revenue Bonds, Osceola Parkway, Refunding & | 10/29 at 100.00 | BBB– | 5,690,155 |
| | Improvement Series 2019A-1, 5.000%, 10/01/49 | | | |
| 20,120 | | Palm Beach County Health Facilities Authority, Florida, Hospital Revenue Bonds, Baptist | 8/29 at 100.00 | A1 | 20,636,480 |
| | Health Systems of South Florida Obligated Group, Series 2019, 4.000%, 8/15/49 | | | |
| 4,680 | | Palm Beach County Health Facilities Authority, Florida, Retirement Communities Revenue | 11/26 at 100.00 | A– | 4,902,721 |
| | Bonds, ACTS Retirement – Life Communities, Inc Obligated Group, Series 2016, 5.000%, 11/15/32 | | | |
| 255 | | Palm Beach County Health Facilities Authority, Florida, Revenue Bonds, Sinai Residences | 6/22 at 102.00 | N/R | 264,588 |
| | of Boca Raton Project, Series 2014A, 7.250%, 6/01/34 | | | |
| 1,385 | | Rivercrest Community Development District, Florida, Special Assessment Bonds, Series | 6/20 at 100.00 | A3 | 1,387,382 |
| | 2007, 5.000%, 5/01/30 – RAAI Insured | | | |
| 6,625 | | South Broward Hospital District, Florida, Hospital Revenue Bonds, Refunding Series 2015, | 5/25 at 100.00 | Aa3 | 7,094,580 |
| | 4.000%, 5/01/33 | | | |
| | South Miami Health Facilities Authority, Florida, Hospital Revenue Bonds, Baptist Health | | | |
| | Systems of South Florida Obligated Group, Series 2017: | | | |
| 4,595 | | 5.000%, 8/15/42 | 8/27 at 100.00 | A1 | 5,043,426 |
| 12,325 | | 5.000%, 8/15/47 | 8/27 at 100.00 | A1 | 13,431,169 |
| | Tampa Sports Authority, Hillsborough County, Florida, Sales Tax Payments Special Purpose | | | |
| | Bonds, Stadium Project, Series 1995: | | | |
| 145 | | 5.750%, 10/01/20 – NPFG Insured | No Opt. Call | Baa2 | 147,871 |
| 2,785 | | 5.750%, 10/01/25 – NPFG Insured | No Opt. Call | Baa2 | 3,135,019 |
| 3,300 | | Tampa, Florida, Health System Revenue Bonds, Baycare Health System, Series 2012A, | 5/22 at 100.00 | Aa2 | 3,472,128 |
| | 5.000%, 11/15/33 | | | |
| 4,000 | | Tampa, Florida, Health System Revenue Bonds, Baycare Health System, Series 2016A, | 5/26 at 100.00 | Aa2 | 4,210,880 |
| | 4.000%, 11/15/46 | | | |
| 9,720 | | Tampa-Hillsborough County Expressway Authority, Florida, Revenue Bonds, Refunding Series | 7/22 at 100.00 | A2 (4) | 10,598,299 |
| | 2012B, 5.000%, 7/01/42 (Pre-refunded 7/01/22) | | | |
| 1,500 | | Volusia County Educational Facilities Authority, Florida, Revenue Bonds, Embry-Riddle | 10/21 at 100.00 | A2 (4) | 1,592,265 |
| | Aeronautical University, Inc Project, Refunding Series 2011, 5.000%, 10/15/29 (Pre-refunded | | | |
| | 10/15/21) – AGM Insured | | | |
| 2,000 | | Volusia County Educational Facilities Authority, Florida, Revenue Bonds, Embry-Riddle | 4/25 at 100.00 | A3 (4) | 2,378,800 |
| | Aeronautical University, Series 2015B, 5.000%, 10/15/45 (Pre-refunded 4/15/25) | | | |
| 1,000 | | Volusia County Educational Facilities Authority, Florida, Revenue Bonds, Embry-Riddle | 10/29 at 100.00 | A3 | 1,022,430 |
| | Aeronautical University, Series 2020A, 4.000%, 10/15/39 | | | |
| 7,400 | | Volusia County Educational Facilities Authority, Florida, Revenue Bonds, Stetson | 6/25 at 100.00 | A– | 7,774,070 |
| | University Inc Project, Series 2015, 5.000%, 6/01/45 | | | |
| 295,550 | | Total Florida | | | 313,022,674 |
| | Georgia – 3.7% (2.3% of Total Investments) | | | |
| 7,230 | | Atlanta, Georgia, Airport General Revenue Bonds, Refunding Series 2012B, 5.000%, 1/01/42 | 1/22 at 100.00 | AA– | 7,545,445 |
| | Atlanta, Georgia, Water and Wastewater Revenue Bonds, Refunding Series 2015: | | | |
| 3,400 | | 5.000%, 11/01/33 | 5/25 at 100.00 | AA– | 3,906,294 |
| 2,040 | | 5.000%, 11/01/35 | 5/25 at 100.00 | AA– | 2,331,843 |
| 5,000 | | Atlanta, Georgia, Water and Wastewater Revenue Bonds, Series 1999A, 5.500%, 11/01/22 – | No Opt. Call | AA– | 5,336,250 |
| | FGIC Insured | | | |
| 1,535 | | Cherokee County Water and Sewerage Authority, Georgia, Revenue Bonds, Refunding Series | 8/20 at 100.00 | AA | 1,545,576 |
| | 2007, 4.000%, 8/01/26 | | | |
| 2,000 | | Cobb County Kennestone Hospital Authority, Georgia, Revenue Anticipation Certificates, | 4/27 at 100.00 | A | 2,192,880 |
| | Wellstar Health System, Series 2017A, 5.000%, 4/01/42 | | | |
| 2,000 | | DeKalb County Hospital Authority, Georgia, Anticipation Certificates Revenue Bonds, | 9/20 at 100.00 | N/R (4) | 2,034,800 |
| | DeKalb Medical Center, Inc Project, Series 2010, 6.000%, 9/01/30 (Pre-refunded 9/01/20) | | | |
70
| | | | | | |
| Principal | �� | | Optional Call | | |
| Amount (000) | | Description (1) | Provisions (2) | Ratings (3) | Value |
| | Georgia (continued) | | | |
| $ 5,725 | | Fayette County Hospital Authority, Georgia, Revenue Anticipation Certificates, Piedmont | 7/26 at 100.00 | A1 | $ 6,253,818 |
| | Healthcare, Inc Project, Series 2016A, 5.000%, 7/01/46 | | | |
| | Fulton County Development Authority, Georgia, Hospital Revenue Bonds, Wellstar Health | | | |
| | System, Inc Project, Series 2017A: | | | |
| 4,330 | | 5.000%, 4/01/42 | 4/27 at 100.00 | A | 4,747,585 |
| 13,620 | | 5.000%, 4/01/47 | 4/27 at 100.00 | A | 14,824,417 |
| 19,000 | | Fulton County Development Authority, Georgia, Revenue Bonds, Piedmont Healthcare, Inc | 7/29 at 100.00 | A1 | 19,187,530 |
| | Project, Series 2019A, 4.000%, 7/01/49 | | | |
| 12,590 | | Gainesville and Hall County Hospital Authority, Georgia, Revenue Anticipation | 2/25 at 100.00 | AA– | 14,444,129 |
| | Certificates, Northeast Georgia Health Services Inc, Series 2014A, 5.500%, 8/15/54 | | | |
| 7,500 | | Gainesville and Hall County Hospital Authority, Georgia, Revenue Anticipation | 2/27 at 100.00 | AA– | 8,806,350 |
| | Certificates, Northeast Georgia Health Services Inc, Series 2017B, 5.250%, 2/15/45 | | | |
| 3,565 | | Georgia Municipal Electric Authority, Plant Vogtle Units 3 & 4 Project M Bonds, Series | 7/28 at 100.00 | BBB+ | 3,752,305 |
| | 2019A, 5.000%, 1/01/63 | | | |
| 11,000 | | Griffin-Spalding County Hospital Authority, Georgia, Revenue Anticipation Certificates, | 4/27 at 100.00 | A | 11,253,110 |
| | Wellstar Health System Inc, Series 2017A, 4.000%, 4/01/42 | | | |
| 1,350 | | Henry County Water and Sewerage Authority, Georgia, Revenue Bonds, Series 2005, 5.250%, | No Opt. Call | AA+ | 1,691,577 |
| | 2/01/27 – BHAC Insured | | | |
| | Main Street Natural Gas Inc, Georgia, Gas Supply Revenue Bonds, Series 2019A: | | | |
| 1,860 | | 5.000%, 5/15/43 | 5/29 at 100.00 | A3 | 2,005,341 |
| 8,000 | | 5.000%, 5/15/49 | No Opt. Call | A3 | 9,332,640 |
| 7,905 | | Municipal Electric Authority of Georgia, Plant Vogtle Units 3 & 4 Project J Bonds, | 7/25 at 100.00 | Baa3 | 8,022,547 |
| | Series 2015A, 5.000%, 7/01/60 | | | |
| 8,230 | | Private Colleges and Universities Authority, Georgia, Revenue Bonds, Mercer University, | 10/25 at 100.00 | Baa1 | 8,386,617 |
| | Series 2015, 5.000%, 10/01/40 | | | |
| 7,000 | | Rockdale County Development Authority, Georgia, Revenue Bonds, Piedmont Healthcare, Inc | 7/29 at 100.00 | A1 | 7,101,360 |
| | Project, Series 2019A, 4.000%, 7/01/44 | | | |
| 2,615 | | Valdosta and Lowndes County Hospital Authority, Georgia, Revenue Certificates, South | 10/21 at 100.00 | AA– (4) | 2,771,534 |
| | Georgia Medical Center Project, Series 2011B, 5.000%, 10/01/41 (Pre-refunded 10/01/21) | | | |
| 137,495 | | Total Georgia | | | 147,473,948 |
| | Guam – 0.1% (0.1% of Total Investments) | | | |
| 4,060 | | Guam Government Waterworks Authority, Water and Wastewater System Revenue Bonds, Series | 7/23 at 100.00 | BBB– | 4,136,531 |
| | 2013, 5.500%, 7/01/43 | | | |
| | Hawaii – 0.0% (0.0% of Total Investments) | | | |
| 275 | | Hawaii Department of Budget and Finance, Special Purpose Revenue Bonds, Hawaii Pacific | 7/23 at 100.00 | BB | 279,433 |
| | University, Series 2013A, 6.875%, 7/01/43 | | | |
| | Idaho – 0.1% (0.1% of Total Investments) | | | |
| 2,110 | | Idaho Health Facilities Authority, Revenue Bonds, Saint Luke’s Health System Project, | 3/22 at 100.00 | A– | 2,163,763 |
| | Series 2012A, 5.000%, 3/01/47 | | | |
| 2,540 | | Idaho Housing and Finance Association, GNMA Housing Revenue Refunding Bonds, Wedgewood | 5/20 at 101.00 | Aaa | 2,575,077 |
| | Terrace Project, Series 2002A-1, 7.250%, 3/20/37 | | | |
| 4,650 | | Total Idaho | | | 4,738,840 |
| | Illinois – 20.2% (12.7% of Total Investments) | | | |
| | Board of Regents of Illinois State University, Auxiliary Facilities System Revenue | | | |
| | Bonds, Series 2018A: | | | |
| 1,000 | | 5.000%, 4/01/34 – AGM Insured | 4/28 at 100.00 | A2 | 1,101,390 |
| 285 | | 5.000%, 4/01/37 – AGM Insured | 4/28 at 100.00 | A2 | 310,416 |
| 1,370 | | 5.000%, 4/01/38 – AGM Insured | 4/28 at 100.00 | A2 | 1,487,971 |
| | Bolingbrook, Illinois, General Obligation Bonds, Refunding Series 2002B: | | | |
| 4,595 | | 0.000%, 1/01/32 – FGIC Insured | No Opt. Call | A2 | 3,353,615 |
| 4,000 | | 0.000%, 1/01/34 – FGIC Insured | No Opt. Call | A2 | 2,692,480 |
| 11,000 | | Chicago Board of Education, Illinois, Dedicated Capital Improvement Tax Revenue Bonds, | 4/27 at 100.00 | A | 11,390,720 |
| | Series 2016, 6.000%, 4/01/46 | | | |
71
| | | | | |
| NEA | Nuveen AMT-Free Quality Municipal Income Fund | |
| Portfolio of Investments (continued) | | | |
| April 30, 2020 (Unaudited) | | | |
|
| Principal | | | Optional Call | | |
| Amount (000) | | Description (1) | Provisions (2) | Ratings (3) | Value |
| | Illinois (continued) | | | |
| $ 2,940 | | Chicago Board of Education, Illinois, General Obligation Bonds, Dedicated Revenues | 12/21 at 100.00 | B1 | $ 2,772,655 |
| | Series 2011A, 5.000%, 12/01/41 | | | |
| 5,000 | | Chicago Board of Education, Illinois, General Obligation Bonds, Dedicated Revenues, | 12/27 at 100.00 | BB– | 4,906,300 |
| | Refunding Series 2017G, 5.000%, 12/01/34 | | | |
| 6,920 | | Chicago Board of Education, Illinois, General Obligation Bonds, Dedicated Revenues, | 12/28 at 100.00 | BB– | 6,371,521 |
| | Refunding Series 2018D, 5.000%, 12/01/46 | | | |
| 11,450 | | Chicago Board of Education, Illinois, General Obligation Bonds, Dedicated Revenues, | 12/25 at 100.00 | BB– | 12,341,726 |
| | Series 2016A, 7.000%, 12/01/44 | | | |
| 1,785 | | Chicago Board of Education, Illinois, General Obligation Bonds, Dedicated Revenues, | 12/26 at 100.00 | BB– | 1,893,064 |
| | Series 2016B, 6.500%, 12/01/46 | | | |
| 23,535 | | Chicago Board of Education, Illinois, General Obligation Bonds, Dedicated Revenues, | 12/27 at 100.00 | BB– | 25,860,023 |
| | Series 2017A, 7.000%, 12/01/46, 144A | | | |
| | Chicago Board of Education, Illinois, Unlimited Tax General Obligation Bonds, Dedicated | | | |
| | Tax Revenues, Series 1999A: | | | |
| 19,600 | | 0.000%, 12/01/20 – FGIC Insured | No Opt. Call | BB– | 19,278,168 |
| 1,000 | | 5.500%, 12/01/26 – NPFG Insured | No Opt. Call | BB– | 1,079,520 |
| 3,500 | | Chicago Transit Authority, Illinois, Capital Grant Receipts Revenue Bonds, Federal | 6/21 at 100.00 | A2 | 3,608,325 |
| | Transit Administration Section 5307 Urbanized Area Formula Funds, Refunding Series 2011, | | | |
| | 5.250%, 6/01/26 – AGM Insured | | | |
| 5,785 | | Chicago Transit Authority, Illinois, Sales Tax Receipts Revenue Bonds, Series 2011, | 12/21 at 100.00 | A3 | 6,071,705 |
| | 5.250%, 12/01/40 | | | |
| 9,285 | | Chicago Transit Authority, Illinois, Sales Tax Receipts Revenue Bonds, Series 2014, | 12/24 at 100.00 | AA | 10,035,414 |
| | 5.250%, 12/01/49 | | | |
| 13,100 | | Chicago, Illinois, General Airport Revenue Bonds, O’Hare International Airport, Third | 6/20 at 100.00 | A2 | 13,140,610 |
| | Lien Refunding Series 2010C, 5.250%, 1/01/35 – AGC Insured | | | |
| | Chicago, Illinois, General Obligation Bonds, City Colleges, Series 1999: | | | |
| 32,170 | | 0.000%, 1/01/21 – FGIC Insured | No Opt. Call | BBB– | 31,370,254 |
| 32,670 | | 0.000%, 1/01/22 – FGIC Insured | No Opt. Call | BBB– | 30,592,515 |
| 22,670 | | 0.000%, 1/01/25 – FGIC Insured | No Opt. Call | BBB– | 18,623,858 |
| 10,565 | | Chicago, Illinois, General Obligation Bonds, Project & Refunding Series 2017A, 6.000%, 1/01/38 | 1/27 at 100.00 | BBB– | 10,998,482 |
| | Chicago, Illinois, General Obligation Bonds, Series 2019A: | | | |
| 4,000 | | 5.000%, 1/01/40 | 1/29 at 100.00 | BBB– | 3,830,320 |
| 3,630 | | 5.500%, 1/01/49 | 1/29 at 100.00 | BBB– | 3,601,904 |
| 5,000 | | Chicago, Illinois, Sales Tax Revenue Bonds, Series 2011A, 5.000%, 1/01/41 | 1/22 at 100.00 | N/R (4) | 5,356,400 |
| | (Pre-refunded 1/01/22) | | | |
| 5,000 | | Cook County Community College District 508, Illinois, General Obligation Bonds, Chicago | 12/23 at 100.00 | BBB | 4,994,000 |
| | City Colleges, Series 2013, 5.250%, 12/01/43 | | | |
| 4,500 | | Cook County Community College District 508, Illinois, General Obligation Bonds, Chicago | 12/27 at 100.00 | A+ | 5,044,770 |
| | City Colleges, Series 2017, 5.000%, 12/01/47 | | | |
| 4,865 | | Cook County Community Consolidated School District 15, Palatine, Illinois, General | No Opt. Call | Aa2 | 4,835,226 |
| | Obligation Bonds, Series 2001, 0.000%, 12/01/20 – FGIC Insured | | | |
| | Cook County Community High School District 219, Niles Township, Illinois, General | | | |
| | Obligation Capital Appreciation Bonds, Series 2001: | | | |
| 2,575 | | 0.000%, 12/01/20 – NPFG Insured | No Opt. Call | Baa2 | 2,548,168 |
| 3,615 | | 0.000%, 12/01/20 – NPFG Insured (ETM) | No Opt. Call | N/R (4) | 3,598,046 |
| | Cook County, Illinois, General Obligation Bonds, Refunding Series 2010A: | | | |
| 3,500 | | 5.250%, 11/15/22 | 11/20 at 100.00 | A2 | 3,527,370 |
| 12,425 | | 5.250%, 11/15/33 | 11/20 at 100.00 | A2 | 12,465,754 |
| 3,500 | | Evanston, Illinois, General Obligation Bonds, Corporate Purpose Series 2016A, 4.000%, 12/01/43 | 6/28 at 100.00 | Aa2 | 3,767,085 |
| | Illinois Educational Facilities Authority, Revenue Bonds, Field Museum of Natural | | | |
| | History, Series 2002RMKT: | | | |
| 2,750 | | 3.900%, 11/01/36 | 11/27 at 102.00 | A | 2,997,885 |
| 5,265 | | 5.500%, 11/01/36 | 11/23 at 100.00 | A | 5,880,584 |
| 5,020 | | Illinois Finance Authority, Revenue Bonds, Advocate Health Care Network, Series 2012, | 6/22 at 100.00 | Aa3 (4) | 5,456,238 |
| | 5.000%, 6/01/42 (Pre-refunded 6/01/22) | | | |
72
| | | | | | |
| Principal | | | Optional Call | | |
| Amount (000) | | Description (1) | Provisions (2) | Ratings (3) | Value |
| | Illinois (continued) | | | |
| | Illinois Finance Authority, Revenue Bonds, Ascension Health/fkaPresence Health Network, | | | |
| | Series 2016C: | | | |
| $ 3,500 | | 5.000%, 2/15/32 | 2/27 at 100.00 | Aa2 | $ 4,037,110 |
| 55 | | 4.000%, 2/15/41 (Pre-refunded 2/15/27) | 2/27 at 100.00 | N/R (4) | 65,038 |
| 1,200 | | 4.000%, 2/15/41 (Pre-refunded 2/15/27) | 2/27 at 100.00 | N/R (4) | 1,419,012 |
| 25,880 | | 4.000%, 2/15/41 | 2/27 at 100.00 | Aa2 | 26,837,819 |
| 1,000 | | 5.000%, 2/15/41 | 2/27 at 100.00 | Aa2 | 1,128,780 |
| 4,200 | | Illinois Finance Authority, Revenue Bonds, Centegra Health System, Series 2012, | 9/22 at 100.00 | AA+ | 4,475,016 |
| | 5.000%, 9/01/38 | | | |
| | Illinois Finance Authority, Revenue Bonds, Centegra Health System, Series 2014A: | | | |
| 8,750 | | 5.000%, 9/01/39 | 9/24 at 100.00 | AA+ | 9,535,050 |
| 11,030 | | 5.000%, 9/01/42 | 9/24 at 100.00 | AA+ | 11,973,175 |
| 2,910 | | Illinois Finance Authority, Revenue Bonds, Ingalls Health System, Series 2013, 5.000%, | 5/22 at 100.00 | A1 (4) | 3,132,993 |
| | 5/15/43 (Pre-refunded 5/15/22) | | | |
| 16,165 | | Illinois Finance Authority, Revenue Bonds, Mercy Health Corporation, Series 2016, | 6/26 at 100.00 | A3 | 17,643,128 |
| | 5.000%, 12/01/40 | | | |
| 1,100 | | Illinois Finance Authority, Revenue Bonds, Northwestern Memorial Healthcare, Tender | 8/22 at 100.00 | Aa2 | 1,311,134 |
| | Option Bond Trust 2015-XF0076, 17.457%, 8/15/37, 144A (IF) | | | |
| | Illinois Finance Authority, Revenue Bonds, OSF Healthcare System, Refunding Series 2010A: | | | |
| 13,540 | | Illinois Finance Authority, Revenue Bonds, OSF Healthcare System, Series 2015A, | 11/25 at 100.00 | A3 | 13,956,084 |
| | 5.000%, 11/15/45 | | | |
| 2,215 | | Illinois Finance Authority, Revenue Bonds, Rehabilitation Institute of Chicago, Series | 7/23 at 100.00 | A– | 2,413,951 |
| | 2013A, 6.000%, 7/01/43 | | | |
| 4,135 | | Illinois Finance Authority, Revenue Bonds, Silver Cross Hospital and Medical Centers, | 8/25 at 100.00 | Baa1 | 4,341,130 |
| | Refunding Series 2015C, 5.000%, 8/15/44 | | | |
| 5,410 | | Illinois Finance Authority, Revenue Bonds, Southern Illinois Healthcare Enterprises, | 3/27 at 100.00 | A+ | 5,849,779 |
| | Inc, Series 2017A, 5.000%, 3/01/47 | | | |
| 8,040 | | Illinois Finance Authority, Revenue Bonds, The Carle Foundation, Series 2011A, 6.000%, | 8/21 at 100.00 | A2 | 8,414,905 |
| | 8/15/41 – AGM Insured | | | |
| | Illinois Finance Authority, Revenue Bonds, The University of Chicago Medical Center, | | | |
| | Series 2011C: | | | |
| 1,000 | | 5.500%, 8/15/41 (Pre-refunded 2/15/21) | 2/21 at 100.00 | AA– (4) | 1,037,130 |
| 2,500 | | 5.500%, 8/15/41 (Pre-refunded 2/15/21) (UB) (6) | 2/21 at 100.00 | AA– (4) | 2,592,825 |
| 15,510 | | Illinois Finance Authority, Revenue Bonds, University of Chicago, Series 2012A, | 10/21 at 100.00 | AA– | 16,189,648 |
| | 5.000%, 10/01/51 | | | |
| | Illinois State, General Obligation Bonds, April Series 2014: | | | |
| 2,500 | | 5.000%, 4/01/31 | 4/24 at 100.00 | BBB– | 2,398,350 |
| 3,000 | | 5.000%, 4/01/38 | 4/24 at 100.00 | BBB– | 2,797,950 |
| | Illinois State, General Obligation Bonds, December Series 2017A: | | | |
| 5,000 | | 5.000%, 12/01/34 | 12/27 at 100.00 | BBB– | 4,727,400 |
| 1,175 | | 5.000%, 12/01/35 | 12/27 at 100.00 | BBB– | 1,102,315 |
| 1,600 | | Illinois State, General Obligation Bonds, February Series 2014, 5.250%, 2/01/32 | 2/24 at 100.00 | BBB– | 1,538,832 |
| 1,750 | | Illinois State, General Obligation Bonds, January Series 2016, 5.000%, 1/01/32 | 1/26 at 100.00 | BBB– | 1,675,292 |
| 5,420 | | Illinois State, General Obligation Bonds, May Series 2014, 5.000%, 5/01/39 | 5/24 at 100.00 | BBB– | 5,042,714 |
| 15,000 | | Illinois State, General Obligation Bonds, November Series 2017C, 5.000%, 11/01/29 | 11/27 at 100.00 | BBB– | 14,451,000 |
| 3,500 | | Illinois State, General Obligation Bonds, November Series 2017D, 5.000%, 11/01/25 | No Opt. Call | BBB– | 3,442,985 |
| | Illinois State, General Obligation Bonds, October Series 2016: | | | |
| 3,510 | | 5.000%, 2/01/28 | 2/27 at 100.00 | BBB– | 3,400,277 |
| 6,100 | | 5.000%, 2/01/29 | 2/27 at 100.00 | BBB– | 5,890,038 |
| 10,000 | | Illinois State, General Obligation Bonds, Refunding Series 2010, 5.000%, 1/01/21 – | 6/20 at 100.00 | BBB– | 10,014,300 |
| | AGM Insured | | | |
| 2,515 | | Illinois State, General Obligation Bonds, Refunding Series 2012, 5.000%, 8/01/24 | 8/22 at 100.00 | BBB– | 2,494,050 |
73
| | | | | |
| NEA | Nuveen AMT-Free Quality Municipal Income Fund | |
| Portfolio of Investments (continued) | | | |
|
| April 30, 2020 (Unaudited) | | | |
|
|
|
|
| Principal | | | Optional Call | | |
| Amount (000) | | Description (1) | Provisions (2) | Ratings (3) | Value |
| | Illinois (continued) | | | |
| | Illinois State, General Obligation Bonds, Series 2012A: | | | |
| $ 2,500 | | 5.000%, 3/01/25 | 3/22 at 100.00 | BBB– | $ 2,467,850 |
| 4,500 | | 5.000%, 3/01/27 | 3/22 at 100.00 | BBB– | 4,383,180 |
| 2,035 | | Illinois State, General Obligation Bonds, Series 2013, 5.500%, 7/01/38 | 7/23 at 100.00 | BBB– | 1,966,848 |
| 5,030 | | Illinois Toll Highway Authority, Toll Highway Revenue Bonds, Senior Lien Series 2013A, | 1/23 at 100.00 | A1 | 5,377,372 |
| | 5.000%, 1/01/38 | | | |
| | Illinois Toll Highway Authority, Toll Highway Revenue Bonds, Senior Lien Series 2014B: | | | |
| 8,000 | | 5.000%, 1/01/38 | 1/24 at 100.00 | A1 | 8,731,280 |
| 6,500 | | 5.000%, 1/01/39 | 1/24 at 100.00 | A1 | 7,084,610 |
| 10,040 | | Illinois Toll Highway Authority, Toll Highway Revenue Bonds, Senior Lien Series 2015A, | 7/25 at 100.00 | A1 | 11,234,158 |
| | 5.000%, 1/01/40 | | | |
| 8,890 | | Illinois Toll Highway Authority, Toll Highway Revenue Bonds, Senior Lien Series 2015B, | 1/26 at 100.00 | A1 | 9,922,662 |
| | 5.000%, 1/01/40 | | | |
| 10,000 | | Illinois Toll Highway Authority, Toll Highway Revenue Bonds, Senior Lien Series 2017A, | 1/28 at 100.00 | A1 | 11,489,800 |
| | 5.000%, 1/01/42 | | | |
| 1,115 | | Illinois Toll Highway Authority, Toll Highway Revenue Bonds, Tender Option Bond Trust | 1/23 at 100.00 | A1 | 1,423,297 |
| | 2015-XF0051, 17.176%, 1/01/38, 144A (IF) | | | |
| 11,050 | | Illinois, General Obligation Bonds, Illinois FIRST Program, Series 2001, 6.000%, | No Opt. Call | BBB– | 11,313,984 |
| | 11/01/26 – FGIC Insured | | | |
| 1,740 | | Lake County Community Unit School District 60, Waukegan, Illinois, General Obligation | No Opt. Call | A2 | 1,701,929 |
| | Refunding Bonds, Series 2001B, 0.000%, 11/01/21 – AGM Insured | | | |
| 4,020 | | Lake, Cook, Kane and McHenry Counties Community Unit School District 220, Barrington, | No Opt. Call | A2 | 4,120,500 |
| | Illinois, General Obligation Bonds, Refunding Series 2002, 5.250%, 12/01/20 – AGM Insured (UB) | | | |
| 5,000 | | Macon County School District 61 Decatur, Illinois, General Obligation Bonds, Alternate | 1/21 at 100.00 | A2 | 5,128,300 |
| | Revenue Source Series 2011A, 5.250%, 1/01/39 – AGM Insured | | | |
| 17,945 | | McHenry and Kane Counties Community Consolidated School District 158, Huntley, Illinois, | No Opt. Call | Baa2 | 17,444,873 |
| | General Obligation Bonds, Series 2003, 0.000%, 1/01/22 – FGIC Insured | | | |
| 2,910 | | McHenry County Community High School District 154, Marengo, Illinois, Capital | No Opt. Call | Aa2 | 2,884,916 |
| | Appreciation School Bonds, Series 2001, 0.000%, 1/01/21 – FGIC Insured | | | |
| 5,000 | | Metropolitan Pier and Exposition Authority, Illinois, McCormick Place Expansion Project | 6/22 at 100.00 | BB+ | 4,545,900 |
| | Bonds, Refunding Series 2012B, 5.000%, 6/15/52 (UB) (6) | | | |
| 5,000 | | Metropolitan Pier and Exposition Authority, Illinois, McCormick Place Expansion Project | 12/25 at 100.00 | BB+ | 4,907,650 |
| | Bonds, Series 2015A, 5.500%, 6/15/53 | | | |
| 6,780 | | Metropolitan Pier and Exposition Authority, Illinois, McCormick Place Expansion Project | 12/27 at 100.00 | BB+ | 6,106,271 |
| | Bonds, Series 2017A, 5.000%, 6/15/57 | | | |
| | Metropolitan Pier and Exposition Authority, Illinois, McCormick Place Expansion Project | | | |
| | Refunding Bonds, Series 2010A: | | | |
| 3,790 | | 5.500%, 6/15/50 (Pre-refunded 6/15/20) | 6/20 at 100.00 | BB+ (4) | 3,809,367 |
| 11,795 | | 5.500%, 6/15/50 | 6/20 at 100.00 | Ba1 | 11,850,436 |
| | Metropolitan Pier and Exposition Authority, Illinois, Revenue Bonds, McCormick Place | | | |
| | Expansion Project, Capital Appreciation Refunding Series 2010B-1: | | | |
| 33,000 | | 0.000%, 6/15/45 – AGM Insured | No Opt. Call | BB+ | 10,583,100 |
| 5,355 | | 0.000%, 6/15/46 – AGM Insured | No Opt. Call | BB+ | 1,632,954 |
| | Metropolitan Pier and Exposition Authority, Illinois, Revenue Bonds, McCormick Place | | | |
| | Expansion Project, Refunding Series 1996A: | | | |
| 16,570 | | 0.000%, 12/15/20 – NPFG Insured | No Opt. Call | BB+ | 16,323,107 |
| 5,010 | | 0.000%, 12/15/21 – NPFG Insured | No Opt. Call | BB+ | 4,805,542 |
| 23,920 | | 0.000%, 12/15/22 – NPFG Insured | No Opt. Call | BB+ | 22,259,234 |
| 13,350 | | 0.000%, 12/15/24 – NPFG Insured | No Opt. Call | BB+ | 11,597,946 |
| | Metropolitan Pier and Exposition Authority, Illinois, Revenue Bonds, McCormick Place | | | |
| | Expansion Project, Refunding Series 1998A: | | | |
| 3,455 | | 5.500%, 12/15/23 – FGIC Insured (ETM) | No Opt. Call | BB+ (4) | 3,683,030 |
| 3,725 | | 5.500%, 12/15/23 – FGIC Insured | No Opt. Call | BB+ | 3,928,348 |
74
| | | | | | |
| Principal | | | Optional Call | | |
| Amount (000) | | Description (1) | Provisions (2) | Ratings (3) | Value |
| | Illinois (continued) | | | |
| | Metropolitan Pier and Exposition Authority, Illinois, Revenue Bonds, McCormick Place | | | |
| | Expansion Project, Refunding Series 2010B-2: | | | |
| $ 2,330 | | 5.000%, 6/15/50 | 6/20 at 100.00 | BB+ | $ 2,339,623 |
| 8,000 | | 5.250%, 6/15/50 | 6/20 at 100.00 | Ba1 | 8,035,360 |
| | Metropolitan Pier and Exposition Authority, Illinois, Revenue Bonds, McCormick Place | | | |
| | Expansion Project, Series 2002A: | | | |
| 1,420 | | 5.700%, 6/15/25 (Pre-refunded 6/15/22) | 6/22 at 101.00 | N/R (4) | 1,577,279 |
| 5,080 | | 5.700%, 6/15/25 | 6/22 at 101.00 | BB+ | 5,420,157 |
| 8,000 | | 5.750%, 6/15/26 – NPFG Insured | 6/22 at 101.00 | BB+ | 8,533,280 |
| 1,115 | | 5.750%, 6/15/27 | 6/22 at 101.00 | BB+ | 1,188,144 |
| 4,610 | | 5.750%, 6/15/27 (Pre-refunded 6/15/22) | 6/22 at 101.00 | N/R (4) | 5,125,398 |
| 195 | | 0.000%, 6/15/30 (ETM) | No Opt. Call | N/R (4) | 161,054 |
| 3,505 | | 0.000%, 6/15/30 | No Opt. Call | BBB | 2,394,651 |
| 28,000 | | 0.000%, 12/15/35 – AGM Insured | No Opt. Call | BB+ | 14,971,600 |
| 3,280 | | 0.000%, 6/15/37 – NPFG Insured | No Opt. Call | BB+ | 1,539,665 |
| 11,715 | | 0.000%, 12/15/38 – NPFG Insured | No Opt. Call | BB+ | 5,052,211 |
| 8,810 | | Metropolitan Pier and Exposition Authority, Illinois, Revenue Bonds, McCormick Place | No Opt. Call | AA+ (4) | 10,417,737 |
| | Hospitality Facility, Series 1996A, 7.000%, 7/01/26 (ETM) | | | |
| 17,865 | | Regional Transportation Authority, Cook, DuPage, Kane, Lake, McHenry and Will Counties, | No Opt. Call | A2 | 19,446,410 |
| | Illinois, General Obligation Bonds, Series 1999, 5.750%, 6/01/23 – AGM Insured | | | |
| 2,300 | | Regional Transportation Authority, Cook, DuPage, Kane, Lake, McHenry and Will Counties, | No Opt. Call | A2 | 3,023,051 |
| | Illinois, General Obligation Bonds, Series 2000A, 6.500%, 7/01/30 – NPFG Insured | | | |
| 4,125 | | Southwestern Illinois Development Authority, Health Facility Revenue Bonds, Memorial | 11/23 at 100.00 | N/R (4) | 5,054,074 |
| | Group, Inc, Series 2013, 7.625%, 11/01/48 (Pre-refunded 11/01/23) | | | |
| | Springfield, Illinois, Electric Revenue Bonds, Senior Lien Series 2015: | | | |
| 2,250 | | 5.000%, 3/01/29 | 3/25 at 100.00 | A3 | 2,589,682 |
| 7,000 | | 5.000%, 3/01/31 | 3/25 at 100.00 | A3 | 8,018,360 |
| 2,000 | | University of Illinois, Health Services Facilities System Revenue Bonds, Series 2013, | 10/23 at 100.00 | Baa1 | 2,161,700 |
| | 6.250%, 10/01/38 | | | |
| 4,810 | | Will County Community High School District 210 Lincoln-Way, Illinois, General Obligation | No Opt. Call | A2 | 4,427,028 |
| | Bonds, Series 2006, 0.000%, 1/01/23 – AGM Insured | | | |
| | Will County Community Unit School District 201U, Crete-Monee, Illinois, General | | | |
| | Obligation Bonds, Capital Appreciation Series 2004: | | | |
| 780 | | 0.000%, 11/01/22 – NPFG Insured (ETM) | No Opt. Call | Baa2 (4) | 760,289 |
| 2,550 | | 0.000%, 11/01/22 – NPFG Insured | No Opt. Call | Baa2 | 2,456,109 |
| 1,895 | | Williamson & Johnson Counties Community Unit School District 2, Marion, Illinois, | 12/20 at 100.00 | A2 (4) | 1,965,532 |
| | General Obligation Bonds, Series 2011, 7.250%, 12/01/28 (Pre-refunded 12/01/20) – AGM Insured | | | |
| 848,740 | | Total Illinois | | | 811,880,530 |
| | Indiana – 3.2% (2.0% of Total Investments) | | | |
| 6,000 | | Indiana Finance Authority, Educational Facilities Revenue Bonds, Valparaiso University | 10/24 at 100.00 | Baa1 | 6,157,860 |
| | Project, Series 2014, 5.000%, 10/01/44 | | | |
| | Indiana Finance Authority, Hospital Revenue Bonds, Community Health Network Project, | | | |
| | Series 2012A: | | | |
| 5,000 | | 4.000%, 5/01/35 | 5/23 at 100.00 | A | 5,122,450 |
| 5,420 | | 5.000%, 5/01/42 | 5/23 at 100.00 | A | 5,661,136 |
| 10,000 | | Indiana Finance Authority, Hospital Revenue Bonds, Indiana University Health Obligation | 12/29 at 100.00 | AA | 10,765,700 |
| | Group, Fixed Rate Series 2019A, 4.000%, 12/01/49 | | | |
| | Indiana Finance Authority, Hospital Revenue Bonds, Indiana University Health Obligation | | | |
| | Group, Refunding 2015A: | | | |
| 1,875 | | 4.000%, 12/01/40 | 6/25 at 100.00 | AA | 1,933,631 |
| 3,400 | | 5.000%, 12/01/40 | 6/25 at 100.00 | AA | 3,687,028 |
| 8,630 | | Indiana Finance Authority, Revenue Bonds, Community Foundation of Northwest Indiana | 3/22 at 100.00 | AA– (4) | 9,298,394 |
| | Obligated Group, Series 2012, 5.000%, 3/01/41 (Pre-refunded 3/01/22) | | | |
| 2,500 | | Indiana Finance Authority, Revenue Bonds, Trinity Health Care Group, Refunding Series | 12/20 at 100.00 | AA- (4) | 2,562,450 |
| | 2010B, 5.000%, 12/01/37 (Pre-refunded 12/01/20) | | | |
75
| | | | | |
| NEA | Nuveen AMT-Free Quality Municipal Income Fund | |
| Portfolio of Investments (continued) | | | |
| April 30, 2020 (Unaudited) | | | |
|
|
|
| Principal | | | Optional Call | | |
| Amount (000) | | Description (1) | Provisions (2) | Ratings (3) | Value |
| | Indiana (continued) | | | |
| $ 11,000 | | Indiana Finance Authority, Wastewater Utility Revenue Bonds, CWA Authority Project, | 10/26 at 100.00 | A+ | $ 12,525,480 |
| | First Lien Green Series 2016A, 5.000%, 10/01/46 | | | |
| 5,000 | | Indiana Finance Authority, Wastewater Utility Revenue Bonds, CWA Authority Project, | 10/21 at 100.00 | A1 | 5,221,050 |
| | Series 2011B, 5.000%, 10/01/41 | | | |
| 5,000 | | Indiana Finance Authority, Wastewater Utility Revenue Bonds, CWA Authority Project, | 10/22 at 100.00 | Aa3 | 5,387,600 |
| | Series 2012A, 5.000%, 10/01/37 | | | |
| 13,215 | | Indiana Finance Authority, Wastewater Utility Revenue Bonds, CWA Authority Project, | 10/24 at 100.00 | A+ | 14,828,155 |
| | Series 2014A, 5.000%, 10/01/44 | | | |
| 5,130 | | Indiana Finance Authority, Water Utility Revenue Bonds, Citizens Energy Group Project, | 10/26 at 100.00 | A+ | 5,841,428 |
| | First Lien Series 2016A, 5.000%, 10/01/46 | | | |
| 3,175 | | Indiana Health Facility Financing Authority, Revenue Bonds, Ancilla Systems Inc | 7/20 at 100.00 | N/R (4) | 3,183,731 |
| | Obligated Group, Series 1997, 5.250%, 7/01/22 – NPFG Insured (ETM) | | | |
| 14,100 | | Indiana Municipal Power Agency Power Supply System Revenue Bonds, Refunding Series | 7/26 at 100.00 | A+ | 16,063,143 |
| | 2016A, 5.000%, 1/01/42 | | | |
| 3,000 | | Indiana Municipal Power Agency, Power Supply System Revenue Bonds, Series 2011A, 5.000%, | 7/21 at 100.00 | A+ (4) | 3,147,810 |
| | 1/01/31 (Pre-refunded 7/01/21) | | | |
| | Indianapolis Local Public Improvement Bond Bank, Indiana, Series 1999E: | | | |
| 9,255 | | 0.000%, 2/01/25 – AMBAC Insured | No Opt. Call | AA– | 8,581,421 |
| 9,560 | | 0.000%, 2/01/26 – AMBAC Insured | No Opt. Call | AA– | 8,663,272 |
| 1,580 | | Zionsville Community Schools Building Corporation, Indiana, First Mortgage Bonds, Series | No Opt. Call | A2 | 1,373,668 |
| | 2005Z, 0.000%, 1/15/28 – AGM Insured | | | |
| 122,840 | | Total Indiana | | | 130,005,407 |
| | Iowa – 2.2% (1.4% of Total Investments) | | | |
| 4,000 | | Ames, Iowa, Hospital Revenue Bonds, Mary Greeley Medical Center, Series 2011, 5.250%, | 6/20 at 100.00 | A2 (4) | 4,018,840 |
| | 6/15/36 (Pre-refunded 6/15/20) | | | |
| 16,130 | | Iowa Finance Authority, Iowa, Midwestern Disaster Area Revenue Bonds, Iowa Fertilizer | 12/23 at 100.00 | B | 16,176,132 |
| | Company Project, Series 2013, 5.250%, 12/01/25 | | | |
| 2,310 | | Iowa Finance Authority, Iowa, Midwestern Disaster Area Revenue Bonds, Iowa Fertilizer | 6/20 at 104.00 | B | 2,351,118 |
| | Company Project, Series 2016, 5.875%, 12/01/26, 144A | | | |
| 2,690 | | Iowa Finance Authority, Iowa, Midwestern Disaster Area Revenue Bonds, Iowa Fertilizer | 12/22 at 105.00 | BB– | 2,635,474 |
| | Company Project, Series 2018B, 5.250%, 12/01/50 (Mandatory Put 12/01/37) | | | |
| 3,085 | | Iowa Finance Authority, Senior Housing Revenue Bonds, Northcrest Inc Project, Series | 3/24 at 103.00 | BB+ | 2,669,821 |
| | 2018A, 5.000%, 3/01/48 | | | |
| | Iowa Tobacco Settlement Authority, Asset Backed Settlement Revenue Bonds, Series 2005C: | | | |
| 13,950 | | 5.375%, 6/01/38 | 6/20 at 100.00 | B– | 14,079,595 |
| 12,830 | | 5.500%, 6/01/42 | 6/20 at 100.00 | B– | 12,949,190 |
| 5,675 | | 5.625%, 6/01/46 | 6/20 at 100.00 | B– | 5,727,721 |
| 16,100 | | Iowa Tobacco Settlement Authority, Tobacco Asset-Backed Revenue Bonds, Series 2005B, | 6/20 at 100.00 | B– | 16,249,569 |
| | 5.600%, 6/01/34 | | | |
| | Xenia Rural Water District, Iowa, Water Revenue Bonds, Refunding Capital Loan Note | | | |
| | Series 2016: | | | |
| 4,700 | | 5.000%, 12/01/36 | 12/26 at 100.00 | BBB+ | 5,258,971 |
| 5,990 | | 5.000%, 12/01/41 | 12/26 at 100.00 | BBB+ | 6,632,068 |
| 87,460 | | Total Iowa | | | 88,748,499 |
| | Kansas – 0.4% (0.2% of Total Investments) | | | |
| 2,000 | | Kansas Development Finance Authority, Health Facilities Revenue Bonds, Stormont-Vail | 11/22 at 100.00 | A2 | 2,084,020 |
| | Health Care Inc, Series 2013J, 5.000%, 11/15/38 | | | |
| 3,000 | | Kansas Development Finance Authority, Hospital Revenue Bonds, Adventist Health | 5/22 at 100.00 | AA | 3,179,580 |
| | System/Sunbelt Obligated Group, Series 2012A, 5.000%, 11/15/28 | | | |
| 3,700 | | Kansas Municipal Energy Agency, Power Project Revenue Bonds, Dogwood Project, Series | 4/26 at 100.00 | AA | 4,261,697 |
| | 2018A, 5.000%, 4/01/38 – BAM Insured | | | |
| 5,270 | | Lawrence, Kansas, Hospital Revenue Bonds, Lawrence Memorial Hospital, Series 2018A, | 7/28 at 100.00 | A | 5,843,692 |
| | 5.000%, 7/01/43 | | | |
| 13,970 | | Total Kansas | | | 15,368,989 |
76
| | | | | | |
| Principal | | | Optional Call | | |
| Amount (000) | | Description (1) | Provisions (2) | Ratings (3) | Value |
| | Kentucky – 1.1% (0.7% of Total Investments) | | | |
| $ 6,010 | | Kentucky Economic Development Finance Authority, Health System Revenue Bonds, Norton | No Opt. Call | Baa2 | $ 4,637,557 |
| | Healthcare Inc, Series 2000B, 0.000%, 10/01/28 – NPFG Insured | | | |
| 2,000 | | Kentucky Economic Development Finance Authority, Hospital Revenue Bonds, Baptist | 8/21 at 100.00 | Baa1 | 2,033,860 |
| | Healthcare System Obligated Group, Series 2011, 5.000%, 8/15/42 | | | |
| 1,300 | | Kentucky Economic Development Finance Authority, Hospital Revenue Bonds, Owensboro | 6/27 at 100.00 | BB+ | 1,396,239 |
| | Health, Refunding Series 2017A, 5.000%, 6/01/37 | | | |
| 4,525 | | Kentucky Economic Development Finance Authority, Hospital Revenue Bonds, Owensboro | 6/20 at 100.00 | BB+ (4) | 4,544,231 |
| | Medical Health System, Series 2010A, 6.500%, 3/01/45 (Pre-refunded 6/01/20) | | | |
| 4,000 | | Kentucky Economic Development Finance Authority, Revenue Bonds, CommonSpirit Health, | 8/29 at 100.00 | BBB+ | 4,252,040 |
| | Series 2019A-2, 5.000%, 8/01/49 | | | |
| | Kentucky Public Transportation Infrastructure Authority, First Tier Toll Revenue Bonds, | | | |
| | Downtown Crossing Project, Convertible Capital Appreciation Series 2013C: | | | |
| 5,000 | | 0.000%, 7/01/43 (5) | 7/31 at 100.00 | Baa3 | 4,680,900 |
| 8,610 | | 0.000%, 7/01/46 (5) | 7/31 at 100.00 | Baa3 | 8,073,511 |
| | Kentucky Public Transportation Infrastructure Authority, First Tier Toll Revenue Bonds, | | | |
| | Downtown Crossing Project, Series 2013A: | | | |
| 2,655 | | 5.750%, 7/01/49 | 7/23 at 100.00 | Baa3 | 2,701,463 |
| 430 | | 6.000%, 7/01/53 | 7/23 at 100.00 | Baa3 | 440,118 |
| 4,630 | | Lexington-Fayette Urban County Government Public Facilities Corporation, Kentucky State | 6/21 at 100.00 | A– | 4,761,677 |
| | Lease Revenue Bonds, Eastern State Hospital Project, Series 2011A, 5.250%, 6/01/31 | | | |
| | Louisville/Jefferson County Metro Government, Kentucky, Revenue Bonds, Catholic Health | | | |
| | Initiatives, Series 2012A: | | | |
| 2,980 | | 5.000%, 12/01/35 (Pre-refunded 6/01/22) | 6/22 at 100.00 | BBB+ (4) | 3,226,088 |
| 3,000 | | 5.000%, 12/01/35 | 6/22 at 100.00 | N/R | 3,247,740 |
| 45,140 | | Total Kentucky | | | 43,995,424 |
| | Louisiana – 2.9% (1.8% of Total Investments) | | | |
| 7,445 | | Ascension Parish Industrial development Board, Louisiana, Revenue Bonds, Impala | 7/23 at 100.00 | N/R | 7,550,942 |
| | Warehousing (US) LLC Project, Series 2013, 6.000%, 7/01/36 | | | |
| 4,000 | | Board of Commissioners of the Port of New Orleans Port Facility Revenue Bonds, Refunding | 4/28 at 100.00 | A2 | 4,651,480 |
| | Series 2018A, 5.000%, 4/01/48 – AGM Insured | | | |
| 5,500 | | East Baton Rouge Sewerage Commission, Louisiana, Revenue Bonds, Refunding Series 2019A, | 2/29 at 100.00 | AA– | 5,975,090 |
| | 4.000%, 2/01/45 | | | |
| 670 | | Jefferson Parish Hospital District1, Louisiana, Hospital Revenue Bonds, West Jefferson | 1/21 at 100.00 | A2 (4) | 693,001 |
| | Medical Center, Refunding Series 2011A, 6.000%, 1/01/39 (Pre-refunded 1/01/21) – AGM Insured | | | |
| 1,870 | | Jefferson Sales Tax District, Jefferson Parish, Louisiana, Special Sales Tax Revenue | 12/27 at 100.00 | A1 | 2,202,205 |
| | Bonds, Series 2017B, 5.000%, 12/01/42 – AGM Insured | | | |
| 5,000 | | Lafayette Public Trust Financing Authority, Louisiana, Revenue Bonds, Ragin’ Cajun | 10/20 at 100.00 | AA (4) | 5,098,900 |
| | Facilities Inc Housing & Parking Project, Series 2010, 5.500%, 10/01/41 (Pre-refunded | | | |
| | 10/01/20) – AGM Insured | | | |
| | Louisiana Public Facilities Authority, Louisiana, Revenue Bonds, Ochsner Clinic Foundation | | | |
| | Project, Refunding Series 2017: | | | |
| 4,000 | | 5.000%, 5/15/42 | 5/27 at 100.00 | A3 | 4,359,640 |
| 22,625 | | 5.000%, 5/15/46 | 5/27 at 100.00 | A3 | 24,394,501 |
| 1,695 | | Louisiana Public Facilities Authority, Lease Revenue Bonds, Provident Group-Flagship | 7/26 at 100.00 | A3 | 1,909,841 |
| | Properties LLC – Louisiana State University Nicolson Gateway Project, Series 2016A, | | | |
| | 5.000%, 7/01/46 | | | |
| | Louisiana Public Facilities Authority, Revenue Bonds, Ochsner Clinic Foundation Project, | | | |
| | Refunding Series 2016: | | | |
| 20 | | 4.000%, 5/15/35 (Pre-refunded 5/15/26) | 5/26 at 100.00 | N/R (4) | 23,261 |
| 2,345 | | 4.000%, 5/15/36 | 5/26 at 100.00 | A3 | 2,395,652 |
| 20 | | 5.000%, 5/15/47 (Pre-refunded 5/15/26) | 5/26 at 100.00 | N/R (4) | 24,422 |
| 5,750 | | Louisiana Public Facilities Authority, Revenue Bonds, Ochsner Clinic Foundation Project, | 5/21 at 100.00 | A3 (4) | 6,104,085 |
| | Series 2011, 6.750%, 5/15/41 (Pre-refunded 5/15/21) | | | |
| 1,975 | | Louisiana Public Facilities Authority, Revenue Bonds, Ochsner Clinic Foundation Project, | 5/25 at 100.00 | A3 | 2,096,779 |
| | Series 2015, 5.000%, 5/15/47 | | | |
77
| | | | | |
| NEA | Nuveen AMT-Free Quality Municipal Income Fund | |
| Portfolio of Investments (continued) | | | |
| April 30, 2020 (Unaudited) | | | |
|
|
|
| Principal | | | Optional Call | | |
| Amount (000) | | Description (1) | Provisions (2) | Ratings (3) | Value |
| | Louisiana (continued) | | | |
| $ 13,590 | | Louisiana Stadium and Exposition District, Revenue Refunding Bonds, Senior Lien Series | 7/23 at 100.00 | A2 | $ 14,233,622 |
| | 2013A, 5.000%, 7/01/36 | | | |
| 1,015 | | Louisiana State, Gasoline and Fuels Tax Revenue Bonds, Refunding Second Lien Series | 11/27 at 100.00 | AA– | 1,161,201 |
| | 2017C, 5.000%, 5/01/45 | | | |
| 12,000 | | New Orleans Aviation Board, Louisiana, General Airport Revenue Bonds, North Terminal | 1/25 at 100.00 | A | 13,158,720 |
| | Project, Series 2015A, 5.000%, 1/01/45 | | | |
| 5,000 | | New Orleans Aviation Board, Louisiana, General Airport Revenue Bonds, North Terminal | 1/27 at 100.00 | A | 5,552,050 |
| | Project, Series 2017A, 5.000%, 1/01/48 | | | |
| 6,280 | | New Orleans, Louisiana, Sewerage Service Revenue Bonds, Refunding Series 2014, | 6/24 at 100.00 | BBB+ | 6,949,134 |
| | 5.000%, 6/01/44 | | | |
| 1,355 | | Shreveport, Louisiana, Water and Sewer Revenue Bonds, Refunding Series 2015, | 12/25 at 100.00 | A– | 1,532,126 |
| | 5.000%, 12/01/40 | | | |
| 5,000 | | St Tammany Parish Hospital District No 1, Louisiana, Hospital Revenue and Revenue | 7/28 at 100.00 | A+ | 5,583,450 |
| | Refunding Bonds, St Tammany Parish Hospital Project, Series 2018, 5.000%, 7/01/48 | | | |
| 107,155 | | Total Louisiana | | | 115,650,102 |
| | Maine – 0.5% (0.3% of Total Investments) | | | |
| 7,000 | | Maine Health and Higher Educational Facilities Authority Revenue Bonds, Eastern Maine | 7/23 at 100.00 | Ba1 | 7,172,690 |
| | Medical Center Obligated Group Issue, Series 2013, 5.000%, 7/01/43 | | | |
| 6,300 | | Maine Health and Higher Educational Facilities Authority Revenue Bonds, Eastern Maine | 7/26 at 100.00 | Ba1 | 6,623,820 |
| | Medical Center Obligated Group Issue, Series 2016A, 5.000%, 7/01/41 | | | |
| | Maine Health and Higher Educational Facilities Authority Revenue Bonds, MaineHealth | | | |
| | Issue, Series 2018A: | | | |
| 3,440 | | 5.000%, 7/01/43 | 7/28 at 100.00 | A+ | 3,840,382 |
| 2,935 | | 5.000%, 7/01/48 | 7/28 at 100.00 | A+ | 3,255,385 |
| 1,050 | | Maine Health and Higher Educational Facilities Authority, Revenue Bonds, Maine General | 7/21 at 100.00 | Ba3 | 1,081,720 |
| | Medical Center, Series 2011, 6.750%, 7/01/41 | | | |
| 20,725 | | Total Maine | | | 21,973,997 |
| | Maryland – 1.2% (0.8% of Total Investments) | | | |
| | Baltimore, Maryland, Convention Center Hotel Revenue Bonds, Refunding Series 2017: | | | |
| 3,260 | | 5.000%, 9/01/35 | 9/27 at 100.00 | BB | 2,819,281 |
| 1,000 | | 5.000%, 9/01/39 | 9/27 at 100.00 | BB | 865,550 |
| 1,645 | | 5.000%, 9/01/46 | 9/27 at 100.00 | BB | 1,424,290 |
| 8,610 | | Baltimore, Maryland, Revenue Bonds, Water Projects, Subordinate Series 2017A, | 1/27 at 100.00 | A+ | 9,810,492 |
| | 5.000%, 7/01/41 | | | |
| 1,000 | | Maryland Health and Higher Educational Facilities Authority, Revenue Bonds, Mercy | 7/21 at 100.00 | BBB+ | 1,037,170 |
| | Medical Cente, Series 2011, 6.250%, 7/01/31 | | | |
| 3,500 | | Maryland Health and Higher Educational Facilities Authority, Revenue Bonds, University | 7/22 at 100.00 | A– | 3,611,265 |
| | of Maryland Medical System Issue, Series 2013A, 5.000%, 7/01/43 | | | |
| 4,000 | | Maryland Health and Higher Educational Facilities Authority, Revenue Bonds, University | 1/28 at 100.00 | A– | 4,089,280 |
| | of Maryland Medical System Issue, Taxable Series 2017D, 4.000%, 7/01/48 | | | |
| 17,000 | | Maryland Stadium Authority, Lease Revenue Bonds, Baltimore City Public Schools | 5/28 at 100.00 | AA– | 19,829,990 |
| | Construction & Revitalization Program, Series 2018A, 5.000%, 5/01/42 | | | |
| 2,000 | | Montgomery County, Maryland, Revenue Bonds, Trinity Health Credit Group, Series 2015, | 6/25 at 100.00 | AA– | 2,191,800 |
| | 5.000%, 12/01/44 | | | |
| 1,150 | | Rockville Mayor and Council, Maryland, Economic Development Revenue Bonds, Ingleside | 11/24 at 103.00 | BB– | 1,085,922 |
| | King Farm Project, Series 2017A-1, 5.000%, 11/01/37 | | | |
| 2,100 | | Rockville Mayor and Council, Maryland, Economic Development Revenue Bonds, Series 2017B, | 11/24 at 103.00 | BB– | 1,914,948 |
| | 5.000%, 11/01/42 | | | |
| 45,265 | | Total Maryland | | | 48,679,988 |
78
| | | | | | |
| Principal | | | Optional Call | | |
| Amount (000) | | Description (1) | Provisions (2) | Ratings (3) | Value |
| | Massachusetts – 1.9% (1.2% of Total Investments) | | | |
| $ 1,250 | | Massachusetts Development Finance Agency, Hospital Revenue Bonds, Cape Cod Healthcare | 11/23 at 100.00 | A+ | $ 1,336,662 |
| | Obligated Group, Series 2013, 5.250%, 11/15/41 | | | |
| 435 | | Massachusetts Development Finance Agency, Revenue Bonds, Atrius Health Issue, Series | 6/29 at 100.00 | BBB | 484,399 |
| | 2019A, 5.000%, 6/01/39 | | | |
| 930 | | Massachusetts Development Finance Agency, Revenue Bonds, Boston Medical Center Issue, | 7/25 at 100.00 | BBB | 971,115 |
| | Green Bonds, Series 2015D, 5.000%, 7/01/44 | | | |
| 11,370 | | Massachusetts Development Finance Agency, Revenue Bonds, Boston University, Series | 10/26 at 100.00 | AA– | 12,875,047 |
| | 2016BB-1, 5.000%, 10/01/46 | | | |
| 3,630 | | Massachusetts Development Finance Agency, Revenue Bonds, CareGroup Issue, Series | 7/28 at 100.00 | A3 | 3,929,584 |
| | 2018J-2, 5.000%, 7/01/53 | | | |
| 1,100 | | Massachusetts Development Finance Agency, Revenue Bonds, Dana-Farber Cancer Institute | 12/26 at 100.00 | A | 1,193,610 |
| | Issue, Series 2016N, 5.000%, 12/01/46 | | | |
| | Massachusetts Development Finance Agency, Revenue Bonds, Emerson College, Series 2015: | | | |
| 2,070 | | 4.500%, 1/01/45 | 1/25 at 100.00 | Baa2 | 2,073,954 |
| 8,800 | | 5.000%, 1/01/45 | 1/25 at 100.00 | Baa2 | 9,093,480 |
| 2,700 | | Massachusetts Development Finance Agency, Revenue Bonds, Olin College, Series 2013E, | 11/23 at 100.00 | A2 | 2,862,216 |
| | 5.000%, 11/01/43 | | | |
| 4,000 | | Massachusetts Development Finance Agency, Revenue Bonds, Partners HealthCare System | 1/28 at 100.00 | AA– | 4,387,640 |
| | Issue, Series 2017S-1, 4.000%, 7/01/35 | | | |
| 1,725 | | Massachusetts Development Finance Agency, Revenue Bonds, Wellforce Issue, Series 2019A, | 1/29 at 100.00 | BBB+ | 1,857,859 |
| | 5.000%, 7/01/44 | | | |
| | Massachusetts Development Finance Agency, Revenue Bonds, Western New England University, | | | |
| | Series 2015: | | | |
| 1,380 | | 5.000%, 9/01/40 | 9/25 at 100.00 | BBB | 1,451,995 |
| 1,545 | | 5.000%, 9/01/45 | 9/25 at 100.00 | BBB | 1,614,185 |
| 3,000 | | Massachusetts Development Finance Authority, Revenue Bonds, WGBH Educational Foundation, | No Opt. Call | AA– | 4,357,110 |
| | Series 2002A, 5.750%, 1/01/42 – AMBAC Insured | | | |
| 1,800 | | Massachusetts Health and Educational Facilities Authority, Revenue Bonds, Massachusetts | 7/20 at 100.00 | N/R (4) | 1,813,302 |
| | Eye and Ear Infirmary, Series 2010C, 5.375%, 7/01/35 (Pre-refunded 7/01/20) | | | |
| 900 | | Massachusetts Port Authority, Special Facilities Revenue Bonds, ConRac Project, Series | 7/21 at 100.00 | A3 | 927,324 |
| | 2011A, 5.125%, 7/01/41 | | | |
| 6,840 | | Massachusetts School Building Authority, Dedicated Sales Tax Revenue Bonds, Senior | 5/23 at 100.00 | Aa2 | 7,468,459 |
| | Series 2013A, 5.000%, 5/15/43 | | | |
| 7,500 | | Massachusetts School Building Authority, Dedicated Sales Tax Revenue Bonds, Tender | 8/22 at 100.00 | Aa2 | 8,821,875 |
| | Option Bond Trust 2016-XF2223, 9.276%, 8/15/24, 144A (IF) | | | |
| 8,050 | | Metropolitan Boston Transit Parking Corporation, Systemwide Parking Revenue Bonds, | 7/21 at 100.00 | A+ | 8,349,138 |
| | Massachusetts, Senior Lien Series 2011, 5.000%, 7/01/41 | | | |
| 500 | | Springfield Water and Sewer Commission, Massachusetts, General Revenue Bonds, Refunding | 11/20 at 100.00 | A3 (4) | 511,660 |
| | Series 2010B, 5.000%, 11/15/30 (Pre-refunded 11/15/20) – AGC Insured | | | |
| 69,525 | | Total Massachusetts | | | 76,380,614 |
| | Michigan – 5.4% (3.4% of Total Investments) | | | |
| 5,335 | | Detroit Water and Sewerage Department, Michigan, Sewage Disposal System Revenue Bonds, | 7/22 at 100.00 | A1 | 5,665,290 |
| | Refunding Senior Lien Series 2012A, 5.250%, 7/01/39 | | | |
| 2,830 | | Detroit, Michigan, Senior Lien Sewerage Disposal System Revenue Bonds, Series 2001B, | No Opt. Call | A2 | 3,611,137 |
| | 5.500%, 7/01/29 – NPFG Insured | | | |
| 10,000 | | Detroit, Michigan, Water Supply System Revenue Bonds, Senior Lien Series 2011A, | 7/21 at 100.00 | A1 | 10,413,100 |
| | 5.250%, 7/01/41 | | | |
| 3,500 | | Eastern Michigan University, General Revenue Bonds, Series 2018A, 4.000%, 3/01/44 – | 3/28 at 100.00 | A2 | 3,596,845 |
| | AGM Insured | | | |
79
| | | | | |
| NEA | Nuveen AMT-Free Quality Municipal Income Fund | |
| Portfolio of Investments (continued) | | | |
| April 30, 2020 (Unaudited) | | | |
|
|
|
|
| Principal | | | Optional Call | | |
| Amount (000) | | Description (1) | Provisions (2) | Ratings (3) | Value |
| | Michigan (continued) | | | |
| | Grand Rapids and Kent County Joint Building Authority, Michigan, Limited Tax General | | | |
| | Obligation Bonds, Devos Place Project, Series 2001: | | | |
| $ 7,660 | | 0.000%, 12/01/21 | No Opt. Call | AAA | $ 7,542,342 |
| 7,955 | | 0.000%, 12/01/22 | No Opt. Call | AAA | 7,729,794 |
| 8,260 | | 0.000%, 12/01/23 | No Opt. Call | AAA | 7,905,646 |
| 8,575 | | 0.000%, 12/01/24 | No Opt. Call | AAA | 8,062,987 |
| 10,000 | | Great Lakes Water Authority, Michigan, Water Supply Revenue Bonds, Refunding Senior Lien | 7/26 at 100.00 | A1 | 11,833,700 |
| | Series 2016C, 5.000%, 7/01/35 | | | |
| 27,960 | | Great Lakes Water Authority, Michigan, Water Supply Revenue Bonds, Senior Lien Series | 7/26 at 100.00 | A1 | 32,468,271 |
| | 2016A, 5.000%, 7/01/46 | | | |
| | Hudsonville Public Schools, Ottawa and Allegan Counties, Michigan, General Obligation | | | |
| | Bonds, School Building & Site Series 2020-I: | | | |
| 2,040 | | 4.000%, 5/01/45 | 5/30 at 100.00 | AA | 2,255,628 |
| 7,615 | | 4.000%, 5/01/49 | 5/30 at 100.00 | AA | 8,329,896 |
| 10,405 | | Michigan Finance Authority, Hospital Revenue Bonds, Henry Ford Health System, Series | 11/29 at 100.00 | A | 10,506,345 |
| | 2019A, 4.000%, 11/15/50 | | | |
| 405 | | Michigan Finance Authority, Local Government Loan Program Revenue Bonds, Detroit Water & | 7/24 at 100.00 | A1 | 443,807 |
| | Sewerage Department Water Supply System Local Project, Refunding Senior Loan Series 2014D-1, | | | |
| | 5.000%, 7/01/37 – AGM Insured | | | |
| 1,300 | | Michigan Finance Authority, Local Government Loan Program Revenue Bonds, Detroit Water & | 7/22 at 100.00 | A1 | 1,340,625 |
| | Sewerage Department Water Supply System Local Project, Series 2014C-1, 5.000%, 7/01/44 | | | |
| | Michigan Finance Authority, Michigan, Revenue Bonds, Trinity Health Credit Group, | | | |
| | Refunding Series 2016MI: | | | |
| 100 | | 5.000%, 12/01/45 (Pre-refunded 6/01/26) | 6/26 at 100.00 | N/R (4) | 122,593 |
| 6,900 | | 5.000%, 12/01/45 | 6/26 at 100.00 | AA– | 7,613,184 |
| 12,520 | | Michigan Finance Authority, Michigan, Revenue Bonds, Trinity Health Credit Group, | 12/27 at 100.00 | AA– | 13,125,592 |
| | Refunding Series 2017A-MI, 4.000%, 12/01/36 | | | |
| | Michigan Finance Authority, Revenue Bonds, Trinity Health Credit Group, Refunding | | | |
| | Series 2011MI: | | | |
| 35 | | 5.000%, 12/01/39 (Pre-refunded 12/01/21) | 12/21 at 100.00 | N/R (4) | 37,370 |
| 9,965 | | 5.000%, 12/01/39 (Pre-refunded 12/01/21) | 12/21 at 100.00 | AA– (4) | 10,639,830 |
| 3,000 | | Michigan Finance Authority, Revenue Bonds, Trinity Health Credit Group, Refunding Series | 6/22 at 100.00 | AA– (4) | 3,250,980 |
| | 2015MI, 5.000%, 12/01/31 (Pre-refunded 6/01/22) | | | |
| 10,330 | | Michigan Hospital Finance Authority, Revenue Bonds, Ascension Health Senior Credit | 11/26 at 100.00 | Aa2 | 10,697,438 |
| | Group, Refunding & Project Series 2010F-6, 4.000%, 11/15/47 | | | |
| 1,315 | | Michigan Public Power Agency, AFEC Project Revenue Bonds, Series 2012A, 5.000%, 1/01/43 | 1/22 at 100.00 | BBB+ | 1,373,241 |
| | Michigan State Building Authority, Revenue Bonds, Facilities Program, Refunding Series 2015-I: | | | |
| 17,000 | | 5.000%, 4/15/31 | 10/25 at 100.00 | AA– | 19,980,270 |
| 1,615 | | 5.000%, 4/15/38 | 10/25 at 100.00 | AA– | 1,869,815 |
| 2,000 | | Michigan State Hospital Finance Authority, Revenue Bonds, Trinity Health Care Group, | 6/22 at 100.00 | AA– (4) | 2,173,800 |
| | Series 2009C, 5.000%, 12/01/48 (Pre-refunded 6/01/22) | | | |
| 4,575 | | Michigan Tobacco Settlement Finance Authority, Tobacco Settlement Asset-Backed Revenue | 5/20 at 100.00 | B2 | 4,594,901 |
| | Bonds, Series 2008A, 6.875%, 6/01/42 | | | |
| 4,790 | | Mona Shores Public Schools, Muskegon County, Michigan, General Obligation Bonds, School | 5/29 at 100.00 | Aa1 | 5,685,730 |
| | Building & Site Series 2019I, 5.000%, 5/01/48 | | | |
| 5,780 | | Oakland University, Michigan, General Revenue Bonds, Series 2012, 5.000%, 3/01/42 | 3/22 at 100.00 | A1 | 6,128,245 |
| 2,200 | | Wayne County Airport Authority, Michigan, Revenue Bonds, Detroit Metropolitan Wayne | 12/25 at 100.00 | A | 2,411,024 |
| | County Airport, Series 2015D, 5.000%, 12/01/45 | | | |
| 5,000 | | Wayne State University, Michigan, General Revenue Bonds, Series 2018A, 5.000%, 11/15/43 | 11/28 at 100.00 | A+ | 5,679,150 |
| 200,965 | | Total Michigan | | | 217,088,576 |
| | Minnesota – 2.3% (1.4% of Total Investments) | | | |
| 285 | | Baytown Township, Minnesota Charter School Lease Revenue Bonds, Saint Croix Preparatory | 8/26 at 100.00 | BB+ | 259,168 |
| | Academy, Refunding Series 2016A, 4.000%, 8/01/36 | | | |
| 350 | | Chatfield, Minnesota, Healthcare and Housing Facilities Revenue Bonds, Chosen Valley | 9/26 at 102.00 | N/R | 256,014 |
| | Care Center Project, Refunding Series 2019, 4.000%, 9/01/39 | | | |
80
| | | | | | |
| Principal | | | Optional Call | | |
| Amount (000) | | Description (1) | Provisions (2) | Ratings (3) | Value |
| | Minnesota (continued) | | | |
| $ 4,005 | | City of Milaca, Minnesota Refunding Revenue Bonds, Grandview Christian Home Project, | 10/24 at 102.00 | N/R | $ 3,389,071 |
| | Series 2016, 5.000%, 10/01/41 | | | |
| | Dakota County Community Development Agency, Minnesota, Senior Housing Revenue Bonds, | | | |
| | Walker Highview Hills LLC Project, Refunding Series 2016A: | | | |
| 2,130 | | 3.500%, 8/01/25, 144A | 8/22 at 100.00 | N/R | 2,017,110 |
| 1,000 | | 5.000%, 8/01/46, 144A | 8/22 at 100.00 | N/R | 950,870 |
| | Duluth Economic Development Authority, Minnesota, Health Care Facilities Revenue Bonds, | | | |
| | Essentia Health Obligated Group, Series 2018A: | | | |
| 3,000 | | 5.000%, 2/15/48 | 2/28 at 100.00 | A– | 3,231,990 |
| 9,000 | | 5.000%, 2/15/53 | 2/28 at 100.00 | A– | 9,664,650 |
| 5,240 | | 5.250%, 2/15/53 | 2/28 at 100.00 | A– | 5,714,168 |
| 5,000 | | 5.000%, 2/15/58 | 2/28 at 100.00 | A– | 5,351,900 |
| 9,840 | | Independent School District 621, Mounds View, Minnesota, General Obligation Bonds, | 2/27 at 100.00 | AAA | 10,729,831 |
| | School Building Series 2018A, 4.000%, 2/01/41 | | | |
| 2,800 | | Itasca County Independent School District 318, Minnesota, General Obligation Bonds, | 2/27 at 100.00 | AAA | 3,108,308 |
| | Series 2018A, 4.000%, 2/01/37 | | | |
| | Minneapolis, Minnesota, Health Care System Revenue Bonds, Fairview Health Services, | | | |
| | Series 2018A: | | | |
| 2,530 | | 4.000%, 11/15/48 | 11/28 at 100.00 | A3 | 2,516,920 |
| 3,395 | | 5.000%, 11/15/49 | 11/28 at 100.00 | A3 | 3,600,330 |
| | Minneapolis-St Paul Metropolitan Airports Commission, Minnesota, Airport Revenue Bonds, | �� | | |
| | Senior Lien Series 2016C: | | | |
| 3,500 | | 5.000%, 1/01/41 | 1/27 at 100.00 | AA– | 3,913,140 |
| 5,000 | | 5.000%, 1/01/46 | 1/27 at 100.00 | AA– | 5,545,250 |
| 2,855 | | Rochester, Minnesota, Electric Utility Revenue Bonds, Refunding Series 2017A, | 12/26 at 100.00 | Aa3 | 3,338,551 |
| | 5.000%, 12/01/47 | | | |
| 4,000 | | Saint Cloud, Minnesota, Health Care Revenue Bonds, CentraCare Health System, Series | 5/29 at 100.00 | A2 | 4,100,200 |
| | 2019, 4.000%, 5/01/49 | | | |
| 4,170 | | Saint Paul Housing & Redevelopment Authority, Minnesota, Charter School Lease Revenue | 9/24 at 102.00 | BBB– | 3,871,053 |
| | Bonds, Nova Classical Academy, Series 2016A, 4.125%, 9/01/47 | | | |
| 3,000 | | Saint Paul Housing and Redevelopment Authority, Minnesota, Health Care Facility Revenue | 7/25 at 100.00 | A | 3,326,160 |
| | Bonds, HealthPartners Obligated Group, Refunding Series 2015A, 5.000%, 7/01/30 | | | |
| | Saint Paul Housing and Redevelopment Authority, Minnesota, Health Care Revenue Bonds, | | | |
| | Fairview Health Services, Series 2017A: | | | |
| 595 | | 4.000%, 11/15/35 | 11/27 at 100.00 | A3 | 609,833 |
| 1,470 | | 4.000%, 11/15/43 | 11/27 at 100.00 | A3 | 1,477,570 |
| 850 | | Sartell, Minnesota, Health Care Facilities Revenue Bonds, Country Manor Campus LLC | 9/27 at 100.00 | N/R | 760,512 |
| | Project, Refunding Series 2017, 5.000%, 9/01/42 | | | |
| | St Paul Housing and Redevelopment Authority, Minnesota, Hospital Revenue Bonds, | | | |
| | HealthEast Inc, Series 2015A: | | | |
| 550 | | 5.250%, 11/15/35 (Pre-refunded 11/15/20) | 11/20 at 100.00 | N/R (4) | 562,809 |
| 3,595 | | 5.000%, 11/15/40 (Pre-refunded 11/15/25) | 11/25 at 100.00 | N/R (4) | 4,364,654 |
| 5,315 | | 5.000%, 11/15/44 (Pre-refunded 11/15/25) | 11/25 at 100.00 | N/R (4) | 6,452,888 |
| | Wayzata, Minnesota Senior Housing Revenue Bonds, Folkestone Senior Living Community, | | | |
| | Refunding Series 2019: | | | |
| 300 | | 5.000%, 8/01/32 | 8/24 at 102.00 | N/R | 303,180 |
| 150 | | 5.000%, 8/01/33 | 8/24 at 102.00 | N/R | 151,269 |
| 250 | | 5.000%, 8/01/35 | 8/24 at 102.00 | N/R | 251,713 |
| 600 | | 4.000%, 8/01/39 | 8/24 at 102.00 | N/R | 522,996 |
| 1,000 | | 5.000%, 8/01/49 | 8/24 at 102.00 | N/R | 975,900 |
| 1,000 | | 5.000%, 8/01/54 | 8/24 at 102.00 | N/R | 969,640 |
| 86,775 | | Total Minnesota | | | 92,287,648 |
| | Mississippi – 0.3% (0.2% of Total Investments) | | | |
| 11,465 | | Medical Center Educational Building Corporation, Mississippi, Revenue Bonds, University | 6/27 at 100.00 | Aa2 | 12,155,422 |
| | of Mississippi Medical Center New Facilities & Refinancing Project, Series 2017A, 4.000%, 6/01/47 | | | |
81
| | | | | |
| NEA | Nuveen AMT-Free Quality Municipal Income Fund | |
| Portfolio of Investments (continued) | | | |
| April 30, 2020 (Unaudited) | | | |
|
|
|
|
| Principal | | | Optional Call | | |
| Amount (000) | | Description (1) | Provisions (2) | Ratings (3) | Value |
| | Missouri – 3.6% (2.3% of Total Investments) | | | |
| $ 2,585 | | Bi-State Development Agency of the Missouri-Illinois Metropolitan District, Mass Transit | 10/22 at 100.00 | Aa2 | $ 2,804,984 |
| | Sales Tax Appropriation Bonds, Refunding Combined Lien Series 2013A, 5.000%, 10/01/44 | | | |
| | Boone County, Missouri, Hospital Revenue Bonds, Boone Hospital Center, Refunding Series 2016: | | | |
| 2,470 | | 4.000%, 8/01/33 | 8/26 at 100.00 | Ba1 | 2,429,517 |
| 4,590 | | 5.000%, 8/01/35 | 8/26 at 100.00 | Ba1 | 4,789,206 |
| 640 | | 4.000%, 8/01/38 | 8/26 at 100.00 | Ba1 | 600,704 |
| | Hannibal Industrial Development Authority, Missouri, Health Facilities Revenue Bonds, | | | |
| | Hannibal Regional Healthcare System, Series 2017: | | | |
| 2,860 | | 5.000%, 10/01/42 | 10/27 at 100.00 | BBB+ | 3,082,708 |
| 1,000 | | 5.000%, 10/01/47 | 10/27 at 100.00 | BBB+ | 1,063,680 |
| | Kansas City Municipal Assistance Corporation, Missouri, Leasehold Revenue Bonds, | | | |
| | Series 2004B-1: | | | |
| 8,150 | | 0.000%, 4/15/27 – AMBAC Insured | No Opt. Call | A1 | 7,085,202 |
| 5,000 | | 0.000%, 4/15/31 – AMBAC Insured | No Opt. Call | A1 | 3,810,500 |
| | Kansas City, Missouri, Sanitary Sewer System Revenue Bonds, Improvement Series 2018A: | | | |
| 2,475 | | 4.000%, 1/01/38 | 1/28 at 100.00 | AA | 2,768,585 |
| 4,470 | | 4.000%, 1/01/42 | 1/28 at 100.00 | AA | 4,953,430 |
| 170 | | Missouri Development Finance Board, Infrastructure Facilities Revenue Bonds, Branson | No Opt. Call | A3 | 170,624 |
| | Landing Project, Series 2005A, 6.000%, 6/01/20 | | | |
| 1,350 | | Missouri Health and Education Facilities Authority, Health Facilities Revenue Bonds, | 5/26 at 100.00 | A+ | 1,473,120 |
| | Saint Luke’s Health System, Inc, Series 2016, 5.000%, 11/15/35 | | | |
| 1,400 | | Missouri Health and Educational Facilities Authority, Educational Facilities Revenue | 6/27 at 100.00 | A1 | 1,623,188 |
| | Bonds, Kansas City University of Medicine and Biosciences, Series 2017A, 5.000%, 6/01/42 | | | |
| 11,985 | | Missouri Health and Educational Facilities Authority, Educational Facilities Revenue | 5/23 at 100.00 | BBB | 12,394,647 |
| | Bonds, Saint Louis College of Pharmacy, Series 2013, 5.500%, 5/01/43 | | | |
| 3,665 | | Missouri Health and Educational Facilities Authority, Health Facilities Revenue Bonds, | 1/25 at 100.00 | AA | 3,822,632 |
| | BJC Health System, Series 2015A, 4.000%, 1/01/45 | | | |
| 1,500 | | Missouri Health and Educational Facilities Authority, Health Facilities Revenue Bonds, | 7/26 at 100.00 | AA | 1,601,400 |
| | BJC Health System, Variable Rate Demand Obligation Series 2013C, 4.000%, 1/01/50 | | | |
| | (Mandatory Put 1/01/46) | | | |
| 14,000 | | Missouri Health and Educational Facilities Authority, Health Facilities Revenue Bonds, | 1/28 at 100.00 | AA | 14,832,160 |
| | BJC Health System, Variable Rate Demand Obligation Series 2017D, 4.000%, 1/01/58 | | | |
| | (Mandatory Put 1/01/48) (UB) (6) | | | |
| 17,300 | | Missouri Health and Educational Facilities Authority, Health Facilities Revenue Bonds, | 11/23 at 100.00 | A2 | 18,119,155 |
| | CoxHealth, Series 2013A, 5.000%, 11/15/48 | | | |
| | Missouri Health and Educational Facilities Authority, Health Facilities Revenue Bonds, | | | |
| | CoxHealth, Series 2019A: | | | |
| 4,165 | | 4.000%, 11/15/44 | 5/29 at 100.00 | A2 | 4,292,491 |
| 4,220 | | 4.000%, 11/15/49 | 5/29 at 100.00 | A2 | 4,325,964 |
| | Missouri Health and Educational Facilities Authority, Health Facilities Revenue Bonds, | | | |
| | Mercy Health, Series 2017C: | | | |
| 2,220 | | 5.000%, 11/15/42 | 11/27 at 100.00 | AA– | 2,543,387 |
| 3,000 | | 5.000%, 11/15/47 | 11/27 at 100.00 | AA– | 3,402,150 |
| 3,000 | | Missouri Health and Educational Facilities Authority, Health Facilities Revenue Bonds, | 6/24 at 100.00 | A+ | 3,145,380 |
| | SSM Health Care, Series 2014A, 4.000%, 6/01/33 | | | |
| 10,000 | | Missouri Health and Educational Facilities Authority, Revenue Bonds, Children’s Mercy | 5/25 at 102.00 | A+ | 10,452,700 |
| | Hospital, Series 2017A, 4.000%, 5/15/42 | | | |
| | Missouri Health and Educational Facilities Authority, Revenue Bonds, Lutheran Senior | | | |
| | Services Projects, Series 2014A: | | | |
| 2,155 | | 5.000%, 2/01/35 | 2/24 at 100.00 | BBB | 2,130,498 |
| 2,000 | | 5.000%, 2/01/44 | 2/24 at 100.00 | BBB | 1,878,240 |
| | Missouri Health and Educational Facilities Authority, Revenue Bonds, Lutheran Senior | | | |
| | Services Projects, Series 2016A: | | | |
| 1,900 | | 5.000%, 2/01/36 | 2/26 at 100.00 | BBB | 1,867,358 |
| 2,550 | | 5.000%, 2/01/46 | 2/26 at 100.00 | BBB | 2,375,325 |
82
| | | | | | |
| Principal | | | Optional Call | | |
| Amount (000) | | Description (1) | Provisions (2) | Ratings (3) | Value |
| | Missouri (continued) | | | |
| $ 1,000 | | Missouri Health and Educational Facilities Authority, Revenue Bonds, Lutheran Senior | 2/29 at 100.00 | BBB | $ 750,890 |
| | Services Projects, Series 2019C, 4.000%, 2/01/48 | | | |
| 500 | | Missouri Health and Educational Facilities Authority, Revenue Bonds, Saint Louis | 4/29 at 100.00 | A1 | 536,480 |
| | University, Series 2019A, 4.000%, 10/01/48 | | | |
| 7,085 | | Missouri Joint Municipal Electric Utility Commission, Power Project Revenue Bonds, | 6/26 at 100.00 | A2 | 8,264,298 |
| | Pairie State Power Project, Refunding Series 2016A, 5.000%, 12/01/34 | | | |
| | Saint Charles County Public Water Supply District 2, Missouri, Certificates of | | | |
| | Participation, Refunding Series 2016C: | | | |
| 1,675 | | 4.000%, 12/01/31 | 12/25 at 100.00 | AA+ | 1,864,811 |
| 2,535 | | 5.000%, 12/01/32 | 12/25 at 100.00 | AA+ | 2,962,680 |
| 220 | | Saint Louis County Industrial Development Authority, Missouri, Revenue Bonds, Friendship | 9/23 at 100.00 | BB+ | 220,933 |
| | Village of Sunset Hills, Series 2013A, 5.875%, 9/01/43 | | | |
| 7,250 | | Saint Louis County Industrial Development Authority, Missouri, Revenue Bonds, Friendship | 9/25 at 103.00 | BB+ | 6,167,357 |
| | Village Saint Louis Obligated Group, Series 2018A, 5.250%, 9/01/53 | | | |
| 141,085 | | Total Missouri | | | 144,606,384 |
| | Montana – 0.4% (0.2% of Total Investments) | | | |
| 1,475 | | Kalispell, Montana, Housing and Healthcare Facilities Revenue Bonds, Immanuel Lutheran | 5/25 at 102.00 | N/R | 1,292,351 |
| | Corporation, Series 2017A, 5.250%, 5/15/47 | | | |
| 3,310 | | Montana Facilities Finance Authority, Montana, Health Facilities Reveue Bonds, Bozeman | 6/28 at 100.00 | A | 3,644,111 |
| | Deaconess Health Services Obligated Group, Series 2018, 5.000%, 6/01/48 | | | |
| 4,965 | | Montana Facility Finance Authority, Healthcare Facility Revenue Bonds, Kalispell | 7/28 at 100.00 | BBB | 5,306,542 |
| | Regional Medical Center, Series 2018B, 5.000%, 7/01/48 | | | |
| 2,580 | | Montana Facility Finance Authority, Hospital Revenue Bonds, Benefis Health System | 2/27 at 100.00 | A+ | 2,871,927 |
| | Obligated Group, Refunding Series 2016, 5.000%, 2/15/41 | | | |
| 1,825 | | Montana Facility Finance Authority, Revenue Bonds, Billings Clinic Obligated Group, | 8/28 at 100.00 | AA– | 2,150,051 |
| | Series 2018A, 5.000%, 8/15/48 | | | |
| 14,155 | | Total Montana | | | 15,264,982 |
| | Nebraska – 0.8% (0.5% of Total Investments) | | | |
| 2,620 | | Central Plains Energy Project, Nebraska, Gas Project 3 Revenue Bonds, Series 2012, | 9/22 at 100.00 | BBB+ | 2,779,794 |
| | 5.000%, 9/01/42 | | | |
| 3,000 | | Douglas County Hospital Authority 2, Nebraska, Health Facilities Revenue Bonds, | 5/27 at 100.00 | A1 | 3,308,130 |
| | Children’s Hospital Obligated Group, Series 2017, 5.000%, 11/15/47 | | | |
| | Douglas County Hospital Authority 3, Nebraska, Health Facilities Revenue Bonds, Nebraska | | | |
| | Methodist Health System, Refunding Series 2015: | | | |
| 3,500 | | 5.000%, 11/01/45 | 11/25 at 100.00 | A | 3,757,040 |
| 1,400 | | 5.000%, 11/01/48 | 11/25 at 100.00 | A | 1,499,778 |
| 2,280 | | Lincoln County Hospital Authority 1, Nebraska, Hospital Revenue and Refunding Bonds, | 11/21 at 100.00 | A (4) | 2,421,018 |
| | Great Plains Regional Medical Center Project, Series 2012, 5.000%, 11/01/42 | | | |
| | (Pre-refunded 11/01/21) | | | |
| 4,000 | | Lincoln, Nebraska, Electric System Revenue Bonds, Refunding Series 2012, 5.000%, 9/01/37 | 9/22 at 100.00 | AA (4) | 4,398,880 |
| | (Pre-refunded 9/01/22) | | | |
| | Madison County Hospital Authority 1, Nebraska, Hospital Revenue Bonds, Faith Regional | | | |
| | Health Services Project, Refunding Series 2017A: | | | |
| 2,150 | | 5.000%, 7/01/29 | 7/27 at 100.00 | BBB | 2,487,808 |
| 2,000 | | 5.000%, 7/01/30 | 7/27 at 100.00 | BBB | 2,286,960 |
| | Madison County Hospital Authority 1, Nebraska, Hospital Revenue Bonds, Faith Regional | | | |
| | Health Services Project, Series 2018: | | | |
| 1,000 | | 5.000%, 7/01/32 | 7/25 at 100.00 | BBB | 1,091,940 |
| 820 | | 5.000%, 7/01/33 | 7/25 at 100.00 | BBB | 888,486 |
| 2,000 | | 5.000%, 7/01/34 | 7/25 at 100.00 | BBB | 2,162,580 |
| 5,110 | | Municipal Energy Agency of Nebraska, Power Supply System Revenue Bonds, Refunding Series | 10/26 at 100.00 | A | 5,933,579 |
| | 2016A, 5.000%, 4/01/38 | | | |
| 29,880 | | Total Nebraska | | | 33,015,993 |
83
| | | | | |
| NEA | Nuveen AMT-Free Quality Municipal Income Fund | |
| Portfolio of Investments (continued) | | | |
| April 30, 2020 (Unaudited) | | | |
|
|
|
|
| Principal | | | Optional Call | | |
| Amount (000) | | Description (1) | Provisions (2) | Ratings (3) | Value |
| | Nevada – 2.6% (1.7% of Total Investments) | | | |
| $ 6,030 | | Carson City, Nevada, Hospital Revenue Bonds, Carson Tahoe Regional Healthcare Project, | 9/27 at 100.00 | BBB+ | $ 6,213,131 |
| | Series 2017A, 5.000%, 9/01/47 | | | |
| 4,000 | | Clark County School District, Nevada, General Obligation Bonds, Limited Tax Building | 6/28 at 100.00 | A+ | 4,242,160 |
| | Series 2018A, 4.000%, 6/15/37 | | | |
| 7,525 | | Clark County, Nevada, General Obligation Bonds, Stadium Improvement, Limited Tax | 6/28 at 100.00 | AA+ | 8,714,477 |
| | Additionally Secured by Pledged Revenues, Series 2018A, 5.000%, 5/01/48 | | | |
| 365 | | Director of the State of Nevada Department of Business and Industry, Charter School | 12/25 at 100.00 | BB | 341,461 |
| | Lease Revenue Bonds, Somerset Academy, Series 2018A, 5.000%, 12/15/38, 144A | | | |
| | Henderson, Nevada, Limited Obligation Bonds, Local Improvement District T-18 Inspirada, | | | |
| | Refunding Series 2016: | | | |
| 2,300 | | 4.000%, 9/01/26 | No Opt. Call | N/R | 2,270,744 |
| 1,525 | | 4.000%, 9/01/27 | 9/26 at 100.00 | N/R | 1,495,247 |
| 2,660 | | 4.000%, 9/01/29 | 9/26 at 100.00 | N/R | 2,553,706 |
| 2,920 | | 4.000%, 9/01/30 | 9/26 at 100.00 | N/R | 2,769,766 |
| 10,000 | | Las Vegas Valley Water District, Nevada, General Obligation Bonds, Refunding Series | 6/21 at 100.00 | AA+ | 10,347,000 |
| | 2011C, 5.000%, 6/01/38 | | | |
| | Las Vegas Valley Water District, Nevada, General Obligation Bonds, Refunding Series 2015: | | | |
| 5,000 | | 5.000%, 6/01/32 | 12/24 at 100.00 | AA+ | 5,720,800 |
| 10,000 | | 5.000%, 6/01/33 | 12/24 at 100.00 | AA+ | 11,413,200 |
| 6,620 | | 5.000%, 6/01/39 | 12/24 at 100.00 | AA+ | 7,434,657 |
| 11,915 | | 5.000%, 6/01/39 (UB) (6) | 12/24 at 100.00 | AA+ | 13,381,260 |
| | Las Vegas Valley Water District, Nevada, General Obligation Bonds, Tender Option Bond | | | |
| | Trust 2015-XF0233: | | | |
| 1,000 | | 17.688%, 12/01/22, 144A (IF) (6) | 12/24 at 100.00 | AA+ | 1,492,230 |
| 3,995 | | 17.779%, 12/01/22, 144A (IF) (6) | 12/24 at 100.00 | AA+ | 5,960,220 |
| 1,250 | | 17.789%, 6/01/39, 144A (IF) (6) | 12/24 at 100.00 | AA+ | 1,865,288 |
| 3,750 | | 17.789%, 6/01/39, 144A (IF) (6) | 12/24 at 100.00 | AA+ | 5,595,863 |
| 4,100 | | Las Vegas Valley Water District, Nevada, General Obligation Bonds, Water Series 2012B, | 6/22 at 100.00 | AA+ | 4,353,462 |
| | 5.000%, 6/01/42 | | | |
| | Washoe County, Nevada, General Obligation Bonds, Reno-Sparks Convention & Visitors | | | |
| | Authority, Refunding Series 2011: | | | |
| 395 | | 5.000%, 7/01/32 (Pre-refunded 7/01/21) | 7/21 at 100.00 | N/R (4) | 414,462 |
| 530 | | 5.000%, 7/01/32 (Pre-refunded 7/01/21) | 7/21 at 100.00 | N/R (4) | 556,113 |
| 7,615 | | 5.000%, 7/01/32 (Pre-refunded 7/01/21) | 7/21 at 100.00 | AA (4) | 7,994,760 |
| 93,495 | | Total Nevada | | | 105,130,007 |
| | New Hampshire – 0.3% (0.2% of Total Investments) | | | |
| 1,500 | | New Hampshire Health and Education Facilities Authority, Revenue Bonds, Concord | 10/27 at 100.00 | A2 | 1,640,775 |
| | Hospital, Series 2017, 5.000%, 10/01/47 | | | |
| | New Hampshire Health and Education Facilities Authority, Revenue Bonds, | | | |
| | Dartmouth-Hitchcock Obligated Group, Series 2018A: | | | |
| 1,115 | | 5.000%, 8/01/36 | 2/28 at 100.00 | A | 1,234,037 |
| 2,935 | | 5.000%, 8/01/37 | 2/28 at 100.00 | A | 3,238,773 |
| 3,665 | | New Hampshire Health and Education Facilities Authority, Revenue Bonds, | No Opt. Call | A | 4,470,640 |
| | Dartmouth-Hitchcock Obligated Group, Series 2020A, 5.000%, 8/01/59 | | | |
| 9,215 | | Total New Hampshire | | | 10,584,225 |
| | New Jersey – 5.9% (3.7% of Total Investments) | | | |
| 20,890 | | New Jersey Economic Development Authority, School Facilities Construction Bonds, | 12/26 at 100.00 | BBB+ | 21,862,847 |
| | Refunding Series 2016BBB, 5.500%, 6/15/30 | | | |
| | New Jersey Economic Development Authority, School Facilities Construction Bonds, Series | | | |
| | 2014UU: | | | |
| 5,515 | | 5.000%, 6/15/30 | 6/24 at 100.00 | BBB+ | 5,581,621 |
| 935 | | 5.000%, 6/15/40 (Pre-refunded 6/15/24) | 6/24 at 100.00 | N/R (4) | 1,089,471 |
| 4,065 | | 5.000%, 6/15/40 | 6/24 at 100.00 | BBB+ | 4,071,463 |
| 1,005 | | New Jersey Economic Development Authority, School Facilities Construction Bonds, Series | 6/27 at 100.00 | BBB+ | 1,001,462 |
| | 2017DDD, 5.000%, 6/15/42 | | | |
84
| | | | | | |
| Principal | | | Optional Call | | |
| Amount (000) | | Description (1) | Provisions (2) | Ratings (3) | Value |
| | New Jersey (continued) | | | |
| $ 6,975 | | New Jersey Economic Development Authority, School Facilities Construction Financing | 3/21 at 100.00 | BBB+ | $ 7,183,064 |
| | Program Bonds, Refunding Series 2011GG, 5.000%, 9/01/24 | | | |
| 10,600 | | New Jersey Economic Development Authority, Sublease Revenue Bonds, New Jersey Transit | No Opt. Call | BBB+ | 10,992,624 |
| | Corporation Projects, Refunding Series 2017B, 5.000%, 11/01/25 | | | |
| 6,000 | | New Jersey Educational Facilities Authority, Revenue Bonds, Montclair State University, | 6/27 at 100.00 | A2 | 6,790,320 |
| | Refunding Series 2017, 5.000%, 6/01/42 – AGM Insured | | | |
| 2,020 | | New Jersey Health Care Facilities Financing Authority, New Jersey, Revenue Bonds, Saint | 6/20 at 100.00 | BB+ | 2,019,798 |
| | Peters University Hospital, Series 2007, 5.750%, 7/01/37 | | | |
| 2,500 | | New Jersey Health Care Facilities Financing Authority, Revenue Bonds, Hackensack | 7/27 at 100.00 | AA– | 2,880,700 |
| | Meridian Health Obligated Group, Refunding Series 2017A, 5.000%, 7/01/37 | | | |
| 720 | | New Jersey Health Care Facilities Financing Authority, Revenue Bonds, Robert Wood | 7/23 at 100.00 | A1 | 764,294 |
| | Johnson University Hospital, Series 2013A, 5.500%, 7/01/43 | | | |
| 10,970 | | New Jersey Health Care Facilities Financing Authority, Revenue Bonds, RWJ Barnabas | 7/26 at 100.00 | A1 | 11,977,704 |
| | Health Obligated Group, Refunding Series 2016A, 5.000%, 7/01/43 | | | |
| 695 | | New Jersey Health Care Facilities Financing Authority, Revenue Bonds, University | 7/25 at 100.00 | BB– | 705,112 |
| | Hospital Issue, Refunding Series 2015A, 5.000%, 7/01/46 – AGM Insured | | | |
| | New Jersey Transportation Trust Fund Authority, Federal Highway Reimbursement Revenue | | | |
| | Notes, Series 2016A-1: | | | |
| 3,050 | | 5.000%, 6/15/28 | 6/26 at 100.00 | Baa1 | 3,292,262 |
| 7,795 | | 5.000%, 6/15/29 | 6/26 at 100.00 | Baa1 | 8,376,663 |
| | New Jersey Transportation Trust Fund Authority, Transportation System Bonds, Capital | | | |
| | Appreciation Series 2010A: | | | |
| 5,000 | | 0.000%, 12/15/26 | No Opt. Call | BBB+ | 3,977,500 |
| 16,495 | | 0.000%, 12/15/33 | No Opt. Call | BBB+ | 9,382,851 |
| | New Jersey Transportation Trust Fund Authority, Transportation System Bonds, Refunding | | | |
| | Series 2006C: | | | |
| 1,815 | | 0.000%, 12/15/26 – BHAC Insured | No Opt. Call | AA+ | 1,554,203 |
| 10,000 | | 0.000%, 12/15/30 – FGIC Insured | No Opt. Call | BBB+ | 6,983,800 |
| 38,000 | | 0.000%, 12/15/33 – AGM Insured | No Opt. Call | BBB+ | 24,706,840 |
| 45,000 | | 0.000%, 12/15/35 – AMBAC Insured | No Opt. Call | BBB+ | 23,502,600 |
| 10,000 | | 0.000%, 12/15/36 – AMBAC Insured | No Opt. Call | BBB+ | 4,976,100 |
| 5,000 | | New Jersey Transportation Trust Fund Authority, Transportation System Bonds, Series | No Opt. Call | BBB+ | 5,152,400 |
| | 2010D, 5.000%, 12/15/23 | | | |
| 2,310 | | New Jersey Transportation Trust Fund Authority, Transportation System Bonds, Series | 6/21 at 100.00 | BBB+ | 2,328,111 |
| | 2011B, 5.500%, 6/15/31 | | | |
| 1,000 | | New Jersey Transportation Trust Fund Authority, Transportation System Bonds, Series | 6/22 at 100.00 | BBB+ | 996,480 |
| | 2012A, 5.000%, 6/15/42 | | | |
| | New Jersey Transportation Trust Fund Authority, Transportation System Bonds, Series 2013AA: | | | |
| 5,500 | | 5.000%, 6/15/29 | 6/23 at 100.00 | BBB+ | 5,566,495 |
| 7,500 | | 5.500%, 6/15/39 | 6/23 at 100.00 | BBB+ | 7,622,100 |
| 5,000 | | New Jersey Transportation Trust Fund Authority, Transportation System Bonds, Series | 12/28 at 100.00 | BBB+ | 4,504,950 |
| | 2019BB, 4.000%, 6/15/44 | | | |
| 14,000 | | New Jersey Turnpike Authority, Revenue Bonds, Refunding Series 2005D-1, 5.250%, | No Opt. Call | A2 | 16,670,080 |
| | 1/01/26 – AGM Insured | | | |
| 1,160 | | New Jersey Turnpike Authority, Revenue Bonds, Series 2017B, 4.000%, 1/01/34 | 1/28 at 100.00 | A2 | 1,227,466 |
| | New Jersey Turnpike Authority, Revenue Bonds, Tender Option Bond Trust 2016-XF1057: | | | |
| 810 | | 16.958%, 1/01/43, 144A (Pre-refunded 7/01/22) (IF) (6) | 7/22 at 100.00 | N/R (4) | 1,045,775 |
| 505 | | 16.958%, 1/01/43, 144A (IF) (6) | 7/22 at 100.00 | AA+ | 651,995 |
| 1,500 | | New Jersey Turnpike Authority, Turnpike Revenue Bonds, Series 2017G, 4.000%, 1/01/33 | 1/28 at 100.00 | A2 | 1,591,095 |
| 3,000 | | Rahway Valley Sewerage Authority, New Jersey, Sewer Revenue Bonds, Series 2005A, 0.000%, | No Opt. Call | Aa2 | 2,749,200 |
| | 9/01/25 – NPFG Insured | | | |
| | Rutgers State University, New Jersey, Revenue Bonds, Refunding Series 2013L: | | | |
| 2,000 | | 5.000%, 5/01/38 (Pre-refunded 5/01/23) | 5/23 at 100.00 | A+ (4) | 2,249,100 |
| 910 | | 5.000%, 5/01/43 (Pre-refunded 5/01/23) | 5/23 at 100.00 | A+ (4) | 1,023,341 |
85
| | | | | |
| NEA | Nuveen AMT-Free Quality Municipal Income Fund | |
| Portfolio of Investments (continued) | | | |
| April 30, 2020 (Unaudited) | | | |
|
|
|
|
| Principal | | | Optional Call | | |
| Amount (000) | | Description (1) | Provisions (2) | Ratings (3) | Value |
| | New Jersey (continued) | | | |
| | Tobacco Settlement Financing Corporation, New Jersey, Tobacco Settlement Asset-Backed | | | |
| | Bonds, Series 2018A: | | | |
| $ 10,355 | | 5.000%, 6/01/46 | 6/28 at 100.00 | BBB+ | $ 10,816,005 |
| 4,710 | | 5.250%, 6/01/46 | 6/28 at 100.00 | BBB+ | 5,032,258 |
| 2,615 | | Tobacco Settlement Financing Corporation, New Jersey, Tobacco Settlement Asset-Backed | 6/28 at 100.00 | BB+ | 2,632,416 |
| | Bonds, Series 2018B, 5.000%, 6/01/46 | | | |
| 277,920 | | Total New Jersey | | | 235,532,566 |
| | New Mexico – 0.1% (0.1% of Total Investments) | | | |
| 3,500 | | New Mexico Hospital Equipment Loan Council, Hospital Revenue Bonds, Presbyterian | 8/29 at 100.00 | Aa3 | 3,744,230 |
| | Healthcare Services, Series 2019A, 4.000%, 8/01/48 | | | |
| | New York – 8.0% (5.0% of Total Investments) | | | |
| 7,000 | | Brooklyn Arena Local Development Corporation, New York, Payment in Lieu of Taxes Revenue | No Opt. Call | B+ | 1,837,150 |
| | Bonds, Barclays Center Project, Series 2009, 0.000%, 7/15/45 | | | |
| 3,000 | | Dormitory Authority of the State of New York, Revenue Bonds, Columbia University, Series | 4/21 at 100.00 | AAA | 3,101,250 |
| | 2011A, 5.000%, 10/01/41 | | | |
| 7,435 | | Dormitory Authority of the State of New York, Revenue Bonds, New School University, | 7/20 at 100.00 | A2 (4) | 7,492,398 |
| | Series 2010, 5.500%, 7/01/43 (Pre-refunded 7/01/20) – AGM Insured | | | |
| 12,830 | | Dormitory Authority of the State of New York, Revenue Bonds, New School University, | 7/25 at 100.00 | A– | 13,873,464 |
| | Series 2015A, 5.000%, 7/01/50 | | | |
| 3,200 | | Dormitory Authority of the State of New York, Revenue Bonds, New York University, Series | 7/22 at 100.00 | AA– (4) | 3,494,944 |
| | 2012A, 5.000%, 7/01/42 (Pre-refunded 7/01/22) | | | |
| 4,000 | | Dormitory Authority of the State of New York, Revenue Bonds, New York University, Series | 7/23 at 100.00 | AA– (4) | 4,522,880 |
| | 2013A, 5.000%, 7/01/43 (Pre-refunded 7/01/23) | | | |
| 1,000 | | Dormitory Authority of the State of New York, Revenue Bonds, Orange Regional Medical | 6/27 at 100.00 | BBB– | 1,102,770 |
| | Center Obligated Group, Series 2017, 5.000%, 12/01/33, 144A | | | |
| 14,075 | | Dormitory Authority of the State of New York, State Personal Income Tax Revenue Bonds, | 2/25 at 100.00 | AA+ | 15,988,637 |
| | General Purpose Series 2015B Group C, 5.000%, 2/15/36 | | | |
| 12,500 | | Dormitory Authority of the State of New York, State Personal Income Tax Revenue Bonds, | 3/29 at 100.00 | Aa1 | 14,657,875 |
| | General Purpose, Series 2019A Bidding Group 2,3,4, 5.000%, 3/15/45 | | | |
| | Dormitory Authority of the State of New York, State Personal Income Tax Revenue Bonds, | | | |
| | General Purpose, Series 2019D: | | | |
| 9,000 | | 4.000%, 2/15/47 | 2/30 at 100.00 | Aa1 | 9,653,220 |
| 10,915 | | 5.000%, 2/15/48 | 2/30 at 100.00 | Aa1 | 12,927,289 |
| 15,000 | | 4.000%, 2/15/49 | 2/30 at 100.00 | Aa1 | 16,057,650 |
| | Hudson Yards Infrastructure Corporation, New York, Revenue Bonds, Senior Fiscal 2012 | | | |
| | Series 2011A: | | | |
| 445 | | 5.250%, 2/15/47 (Pre-refunded 2/15/21) | 2/21 at 100.00 | Aa2 (4) | 460,944 |
| 9,670 | | 5.250%, 2/15/47 | 2/21 at 100.00 | AA– | 9,951,687 |
| 1,295 | | 5.750%, 2/15/47 | 2/21 at 100.00 | AA– | 1,337,515 |
| 2,105 | | 5.750%, 2/15/47 (Pre-refunded 2/15/21) | 2/21 at 100.00 | Aa2 (4) | 2,188,590 |
| 10,000 | | Liberty Development Corporation, New York, Goldman Sachs Headquarter Revenue Bonds, | No Opt. Call | BBB+ | 12,490,300 |
| | Series 2005, 5.250%, 10/01/35 | | | |
| | Long Island Power Authority, New York, Electric System General Revenue Bonds, Series 2014A: | | | |
| 1,045 | | 4.000%, 9/01/39 – AGM Insured | 9/24 at 100.00 | A2 | 1,104,325 |
| 780 | | 5.000%, 9/01/44 | 9/24 at 100.00 | A | 867,040 |
| 5,000 | | Long Island Power Authority, New York, Electric System General Revenue Bonds, Series | 9/28 at 100.00 | A | 5,833,000 |
| | 2018, 5.000%, 9/01/37 | | | |
| 7,240 | | Long Island Power Authority, New York, Electric System Revenue Bonds, Series 2011A, | 5/21 at 100.00 | A (4) | 7,547,845 |
| | 5.000%, 5/01/38 (Pre-refunded 5/01/21) | | | |
| 15,100 | | Long Island Power Authority, New York, Electric System Revenue Bonds, Series 2012A, | 9/22 at 100.00 | A | 16,124,837 |
| | 5.000%, 9/01/42 | | | |
| 3,500 | | Monroe County Industrial Development Corporation, New York, FHA Insured Mortgage Revenue | 2/21 at 100.00 | AA | 3,606,995 |
| | Bonds, Unity Hospital of Rochestor Project, Series 2010, 5.750%, 8/15/30 | | | |
86
| | | | | | |
| Principal | | | Optional Call | | |
| Amount (000) | | Description (1) | Provisions (2) | Ratings (3) | Value |
| | New York (continued) | | | |
| $ 1,000 | | Monroe County Industrial Development Corporation, New York, Revenue Bonds, University | 7/23 at 100.00 | AA– (4) | $ 1,130,720 |
| | of Rochester Project, Series 2013A, 5.000%, 7/01/43 (Pre-refunded 7/01/23) | | | |
| | New York City Municipal Water Finance Authority, New York, Water and Sewer System | | | |
| | Revenue Bonds, Second Generation Resolution, Fiscal 2011 Series EE: | | | |
| 710 | | 5.375%, 6/15/43 | 12/20 at 100.00 | AA+ | 726,074 |
| 1,390 | | 5.375%, 6/15/43 (Pre-refunded 12/15/20) | 12/20 at 100.00 | N/R (4) | 1,430,074 |
| 7,225 | | New York City Municipal Water Finance Authority, New York, Water and Sewer System Second | 6/23 at 100.00 | AA+ | 7,843,532 |
| | General Resolution Revenue Bonds, Fiscal 2014 Series BB, 5.000%, 6/15/46 | | | |
| 5,000 | | New York City Municipal Water Finance Authority, New York, Water and Sewer System Second | 6/27 at 100.00 | AA+ | 5,849,600 |
| | General Resolution Revenue Bonds, Fiscal 2017 Series EE, 5.000%, 6/15/37 | | | |
| 3,500 | | New York City Transitional Finance Authority, New York, Building Aid Revenue Bonds, | 7/27 at 100.00 | AA | 3,827,810 |
| | Fiscal 2018, Series 2017S-1, 4.000%, 7/15/36 | | | |
| 5,000 | | New York City Transitional Finance Authority, New York, Future Tax Secured Bonds, | 5/23 at 100.00 | Aa1 | 5,454,050 |
| | Subordinate Fiscal 2013 Series I, 5.000%, 5/01/38 | | | |
| 5,000 | | New York City Transitional Finance Authority, New York, Future Tax Secured Bonds, | 5/28 at 100.00 | Aa1 | 5,812,850 |
| | Subordinate Fiscal 2018 Series C-3, 5.000%, 5/01/41 | | | |
| 10,000 | | New York City Transitional Finance Authority, New York, Future Tax Secured Bonds, | 8/28 at 100.00 | Aa1 | 11,696,400 |
| | Subordinate Fiscal 2019 Series A-1, 5.000%, 8/01/40 | | | |
| 2,060 | | New York City, New York, General Obligation Bonds, Fiscal 2017 Series B-1, 5.000%, 12/01/41 | 12/26 at 100.00 | AA | 2,378,909 |
| 10,370 | | New York City, New York, General Obligation Bonds, Fiscal 2020 Series A-1, 4.000%, 8/01/40 | 8/29 at 100.00 | AA | 11,174,608 |
| 3,500 | | New York City, New York, General Obligation Bonds, Fiscal 2020 SeriesD-1, 4.000%, 3/01/44 | 3/30 at 100.00 | AA | 3,749,410 |
| 10 | | New York City, New York, General Obligation Bonds, Fiscal Series 1996J, 5.500%, 2/15/26 | 6/20 at 100.00 | AA | 10,035 |
| 5 | | New York City, New York, General Obligation Bonds, Fiscal Series 1997H, 6.125%, 8/01/25 | 6/20 at 100.00 | AA | 5,021 |
| 23,920 | | New York Liberty Development Corporation, New York, Liberty Revenue Bonds, 3 World Trade | 11/24 at 100.00 | N/R | 22,940,954 |
| | Center Project, Class 1 Series 2014, 5.000%, 11/15/44, 144A | | | |
| 6,385 | | New York Liberty Development Corporation, New York, Liberty Revenue Bonds, 4 World Trade | 11/21 at 100.00 | A | 6,671,878 |
| | Center Project, Series 2011, 5.750%, 11/15/51 | | | |
| 4,045 | | New York State Environmental Facilities Corporation, State Clean Water and Drinking | 6/22 at 100.00 | AAA | 5,048,281 |
| | Water Revolving Funds Revenue Bonds, New York City Municipal Water Finance Authority | | | |
| | Projects, Tender Option Bond Trust 2016-XL0002, 13.338%, 6/15/26, 144A (IF) (6) | | | |
| 10,000 | | New York State Thruway Authority, General Revenue Junior Indebtedness Obligations, | 1/26 at 100.00 | A– | 11,019,700 |
| | Series 2016A, 5.250%, 1/01/56 | | | |
| 2,105 | | Onondaga Civic Development Corporation, New York, Revenue Bonds, Saint Joseph’s Hospital | 7/22 at 100.00 | N/R (4) | 2,291,882 |
| | Health Center Project, Series 2012, 5.000%, 7/01/42 (Pre-refunded 7/01/22) | | | |
| 3,925 | | Port Authority of New York and New Jersey, Consolidated Revenue Bonds, One Hundred | 12/23 at 100.00 | AA– | 4,276,719 |
| | Seventy Ninth Series 2013, 5.000%, 12/01/38 | | | |
| | Port Authority of New York and New Jersey, Special Project Bonds, JFK International Air | | | |
| | Terminal LLC Project, Eighth Series 2010: | | | |
| 8,550 | | 5.500%, 12/01/31 | 12/20 at 100.00 | BBB+ | 8,601,471 |
| 3,710 | | 6.000%, 12/01/42 | 12/20 at 100.00 | BBB+ | 3,740,051 |
| 9,950 | | Triborough Bridge and Tunnel Authority, New York, General Purpose Revenue Bonds, | No Opt. Call | AA– | 10,860,724 |
| | Refunding Bonds, Tender Option Bond Trust 2016-XL0003, 7.114%, 11/15/21, 144A (IF) (6) | | | |
| 5,000 | | Triborough Bridge and Tunnel Authority, New York, General Purpose Revenue Bonds, | 5/25 at 100.00 | AA– | 5,623,300 |
| | Refunding Series 2015A, 5.000%, 11/15/50 | | | |
| | Triborough Bridge and Tunnel Authority, New York, General Purpose Revenue Bonds, | | | |
| | Refunding Subordinate Lien Series 2013A: | | | |
| 10,725 | | 0.000%, 11/15/31 | No Opt. Call | A+ | 7,911,082 |
| 1,105 | | 0.000%, 11/15/32 | No Opt. Call | A+ | 781,688 |
| 5,000 | | TSASC Inc, New York, Tobacco Asset-Backed Bonds, Series 2006, 5.000%, 6/01/45 | 6/27 at 100.00 | CCC+ | 4,617,150 |
| 305,325 | | Total New York | | | 321,696,578 |
87
| | | | | |
| NEA | Nuveen AMT-Free Quality Municipal Income Fund | |
| Portfolio of Investments (continued) | | | |
| April 30, 2020 (Unaudited) | | | |
|
|
|
|
| Principal | | | Optional Call | | |
| Amount (000) | | Description (1) | Provisions (2) | Ratings (3) | Value |
| | North Carolina – 9.3% (5.9% of Total Investments) | | | |
| | Board of Governors of the University of North Carolina, Winston-Salem State University | | | |
| | General Revenue Bonds, Series 2013: | | | |
| $ 2,950 | | 5.000%, 4/01/33 | 4/22 at 100.00 | BBB+ | $ 3,053,869 |
| 1,000 | | 5.125%, 4/01/43 | 4/22 at 100.00 | BBB+ | 1,027,700 |
| 1,145 | | Brunswick County, North Carolina, Enterprise System Revenue Bonds, Refunding Series | 4/22 at 100.00 | AA– (4) | 1,237,711 |
| | 2012A, 5.000%, 4/01/25 (Pre-refunded 4/01/22) | | | |
| | Buncombe County, North Carolina, Limited Obligation Bonds, Refunding Series 2014A: | | | |
| 1,085 | | 5.000%, 6/01/33 | 6/24 at 100.00 | AA+ | 1,232,224 |
| 1,600 | | 5.000%, 6/01/34 | 6/24 at 100.00 | AA+ | 1,813,712 |
| 4,645 | | Cape Fear Public Utility Authority, North Carolina, Water and Sewer System Revenue | 8/29 at 100.00 | AA+ | 5,118,744 |
| | Bonds, Refunding Series 2019A, 4.000%, 8/01/44 | | | |
| 2,135 | | Cape Fear Public Utility Authority, North Carolina, Water & Sewer System Revenue Bonds, | 8/21 at 100.00 | AA+ (4) | 2,247,728 |
| | Refunding Series 2011, 5.000%, 8/01/31 (Pre-refunded 8/01/21) | | | |
| | Catawba County, North Carolina, General Obligation Bonds, Limited Obligation Series 2014A: | | | |
| 1,000 | | 5.000%, 6/01/30 | 6/24 at 100.00 | AA | 1,143,780 |
| 730 | | 5.000%, 6/01/31 | 6/24 at 100.00 | AA | 834,025 |
| 5,000 | | Charlotte, North Carolina, Airport Revenue Bonds, Charlotte Douglas International | 7/20 at 100.00 | AA– | 5,021,950 |
| | Refunding Series 2010A, 5.000%, 7/01/39 | | | |
| 1,425 | | Charlotte, North Carolina, Airport Revenue Bonds, Charlotte Douglas International, | 7/21 at 100.00 | AA– | 1,466,325 |
| | Refunding Series 2011A, 5.000%, 7/01/41 | | | |
| | Charlotte, North Carolina, Airport Revenue Bonds, Charlotte Douglas International, | | | |
| | Refunding Series 2014A: | | | |
| 2,865 | | 5.000%, 7/01/27 | 7/24 at 100.00 | AA– | 3,216,507 |
| 3,000 | | 5.000%, 7/01/28 | 7/24 at 100.00 | AA– | 3,355,320 |
| | Charlotte, North Carolina, Airport Revenue Bonds, Charlotte Douglas International, | | | |
| | Refunding Series 2017A: | | | |
| 1,365 | | 5.000%, 7/01/42 (UB) (6) | 7/27 at 100.00 | Aa3 | 1,543,638 |
| 5,390 | | 5.000%, 7/01/47 (UB) (6) | 7/27 at 100.00 | Aa3 | 6,051,084 |
| 2,405 | | Charlotte, North Carolina, Certificates of Participation, Transit Projects Phase 2, | 6/20 at 100.00 | AA+ | 2,411,566 |
| | Refunding Series 2008A, 5.000%, 6/01/33 | | | |
| 2,045 | | Charlotte, North Carolina, Storm Water Fee Revenue Bonds, Refunding Series 2014, | 12/24 at 100.00 | AAA | 2,345,635 |
| | 5.000%, 12/01/39 | | | |
| 3,555 | | Charlotte, North Carolina, Water and Sewer System Refunding Bonds, Tender Option Bond | 7/20 at 100.00 | AAA | 3,613,338 |
| | Trust 2016-XL0012, 13.228%, 7/01/38, 144A (IF) (6) | | | |
| | Charlotte, North Carolina, Water and Sewer System Revenue Bonds, Refunding Series 2015: | | | |
| 940 | | 5.000%, 7/01/32 | 7/25 at 100.00 | AAA | 1,094,639 |
| 2,325 | | 5.000%, 7/01/40 | 7/25 at 100.00 | AAA | 2,658,172 |
| | Charlotte, North Carolina, Water and Sewer System Revenue Bonds, Refunding Series 2018: | | | |
| 2,055 | | 5.000%, 7/01/44 | 7/28 at 100.00 | AAA | 2,484,105 |
| 16,865 | | 5.000%, 7/01/44 (UB) (6) | 7/28 at 100.00 | AAA | 20,386,581 |
| 3,000 | | Charlotte-Mecklenberg Hospital Authority, North Carolina, Health Care Revenue Bonds, DBA | 1/21 at 100.00 | AA– | 3,056,250 |
| | Carolinas HealthCare System, Series 2011A, 5.250%, 1/15/42 | | | |
| 5,250 | | Charlotte-Mecklenburg Hospital Authority, North Carolina, Health Care Revenue Bonds, DBA | 1/22 at 100.00 | AA– | 5,431,755 |
| | Carolinas HealthCare System, Refunding Series 2012A, 5.000%, 1/15/43 | | | |
| 4,000 | | Charlotte-Mecklenburg Hospital Authority, North Carolina, Health Care Revenue Bonds, | 1/29 at 100.00 | AA– | 4,733,040 |
| | Doing Business as Atrium Health, Refunding Series 2018A, 5.000%, 1/15/36 | | | |
| 2,085 | | Dare County, North Carolina, Installment Purchase Contract, Limited Obligation Series | 6/22 at 100.00 | Aa3 | 2,248,902 |
| | 2012B, 5.000%, 6/01/28 | | | |
| | Dare County, North Carolina, Utilities System Revenue Bonds, Series 2011: | | | |
| 3,860 | | 5.000%, 2/01/36 (Pre-refunded 2/01/21) | 2/21 at 100.00 | AA (4) | 3,970,242 |
| 1,250 | | 5.000%, 2/01/41 (Pre-refunded 2/01/21) | 2/21 at 100.00 | AA (4) | 1,285,700 |
| 835 | | Durham, North Carolina, General Obligation Bonds, Refunding Series 2015, 5.000%, 10/01/26 | No Opt. Call | AAA | 1,030,782 |
| 8,600 | | Durham, North Carolina, Utility System Revenue Bonds, Refunding Series 2011, 5.000%, | 6/21 at 100.00 | Aa1 (4) | 9,002,910 |
| | 6/01/41 (Pre-refunded 6/01/21) | | | |
88
| | | | | | |
| Principal | | | Optional Call | | |
| Amount (000) | | Description (1) | Provisions (2) | Ratings (3) | Value |
| | North Carolina (continued) | | | |
| $ 5,000 | | East Carolina University, North Carolina, General Revenue Bonds, Series 2014A, | 10/23 at 100.00 | AA– | $ 5,528,300 |
| | 5.000%, 10/01/41 | | | |
| 2,310 | | East Carolina University, North Carolina, General Revenue Bonds, Series 2016A, | 4/26 at 100.00 | AA– | 2,775,118 |
| | 5.000%, 10/01/29 | | | |
| 1,500 | | Fayetteville State University, North Carolina, Limited Obligation Revenue Bonds, Student | 4/21 at 100.00 | A2 | 1,543,995 |
| | Housing Project, Series 2011, 5.000%, 4/01/43 – AGM Insured | | | |
| 1,050 | | Forsyth County, North Carolina, General Obligation Bonds, Limited Obligation Series | 6/20 at 100.00 | AA+ | 1,052,982 |
| | 2009, 5.000%, 4/01/30 | | | |
| 4,750 | | Greensboro, North Carolina, Combined Enterprise System Revenue Bonds, Series 2017A, | 6/27 at 100.00 | Aa1 | 5,171,657 |
| | 4.000%, 6/01/47 | | | |
| 2,000 | | Greensboro, North Carolina, Limited Obligation Bonds, Coliseum Complex Project, Series | 4/28 at 100.00 | AA+ | 2,389,960 |
| | 2018A, 5.000%, 4/01/42 | | | |
| 500 | | Henderson County, North Carolina, Limited Obligation Bonds, Series 2015, | 10/25 at 100.00 | AA | 582,550 |
| | 5.000%, 10/01/31 | | | |
| 485 | | Hillsborough, North Carolina, Special Assessment Revenue Bonds, Series 2013, | 2/23 at 100.00 | N/R | 487,619 |
| | 7.750%, 2/01/24 | | | |
| | Jacksonville Public Facilities Corporation, North Carolina, Limited Obligation Bonds, | | | |
| | Series 2012: | | | |
| 1,065 | | 5.000%, 4/01/29 (Pre-refunded 4/01/22) | 4/22 at 100.00 | A+ (4) | 1,151,233 |
| 1,165 | | 5.000%, 4/01/30 (Pre-refunded 4/01/22) | 4/22 at 100.00 | A+ (4) | 1,259,330 |
| 1,000 | | 5.000%, 4/01/31 (Pre-refunded 4/01/22) | 4/22 at 100.00 | A+ (4) | 1,080,970 |
| 200 | | 5.000%, 4/01/32 (Pre-refunded 4/01/22) | 4/22 at 100.00 | A+ (4) | 216,194 |
| 1,535 | | Mooresville, North Carolina, Enterprise System Revenue Bonds, Refunding Series 2012, | 5/22 at 100.00 | Aa2 | 1,653,318 |
| | 5.000%, 5/01/28 | | | |
| 4,295 | | Nash Health Care Systems, North Carolina, Health Care Facilities Revenue Bonds, Series | 5/22 at 100.00 | BBB | 4,400,614 |
| | 2012, 5.000%, 11/01/41 | | | |
| 500 | | New Hanover County, North Carolina, Hospital Revenue Bonds, New Hanover Regional Medical | 10/23 at 100.00 | A+ | 546,600 |
| | Center, Refunding Series 2013, 5.000%, 10/01/26 | | | |
| 6,140 | | New Hanover County, North Carolina, Hospital Revenue Bonds, New Hanover Regional Medical | 10/27 at 100.00 | A+ | 6,800,541 |
| | Center, Series 2017, 5.000%, 10/01/47 | | | |
| 1,800 | | North Carolina Agricultural and Technical State University, General Revenue Bonds, | 10/25 at 100.00 | A1 | 1,972,062 |
| | Refunding Series 2015A, 5.000%, 10/01/40 | | | |
| | North Carolina Capital Facilities Finance Agency, Revenue Bonds, Davidson College, | | | |
| | Series 2014: | | | |
| 500 | | 5.000%, 3/01/26 | 3/22 at 100.00 | AA+ | 536,315 |
| 250 | | 5.000%, 3/01/28 | 3/22 at 100.00 | AA+ | 267,873 |
| 500 | | 5.000%, 3/01/29 | 3/22 at 100.00 | AA+ | 535,180 |
| 500 | | 5.000%, 3/01/32 | 3/22 at 100.00 | AA+ | 533,955 |
| 1,230 | | 5.000%, 3/01/45 | 3/22 at 100.00 | AA+ | 1,304,108 |
| 3,900 | | North Carolina Capital Facilities Finance Agency, Revenue Bonds, Duke University | 10/26 at 100.00 | AA+ | 4,636,749 |
| | Project, Refunding Series 2016B, 5.000%, 7/01/42 | | | |
| | North Carolina Capital Facilities Finance Agency, Revenue Bonds, Duke University | | | |
| | Project, Series 2015 A: | | | |
| 1,605 | | 5.000%, 10/01/55 | 10/25 at 100.00 | AA+ | 1,852,282 |
| 9,485 | | 5.000%, 10/01/55 (Pre-refunded 10/01/25) (UB) (6) | 10/25 at 100.00 | AA+ (4) | 10,946,354 |
| | North Carolina Capital Facilities Finance Agency, Revenue Bonds, Johnson & Wales | | | |
| | University, Series 2013A: | | | |
| 1,560 | | 5.000%, 4/01/32 | 4/23 at 100.00 | Baa2 | 1,628,702 |
| 1,000 | | 5.000%, 4/01/33 | 4/23 at 100.00 | Baa2 | 1,041,550 |
| 5,000 | | North Carolina Capital Facilities Financing Agency, Educational Facility Revenue Bonds, | 7/26 at 100.00 | Aa3 | 5,423,300 |
| | Wake Forest University, Refunding Series 2016, 4.000%, 1/01/37 | | | |
| 2,500 | | North Carolina Capital Facilities Financing Agency, Educational Facility Revenue Bonds, | 1/28 at 100.00 | Aa3 | 2,937,225 |
| | Wake Forest University, Refunding Series 2018, 5.000%, 1/01/48 | | | |
89
| | | | | |
| NEA | Nuveen AMT-Free Quality Municipal Income Fund | |
| Portfolio of Investments (continued) | | | |
| April 30, 2020 (Unaudited) | | | |
|
|
|
|
| Principal | | | Optional Call | | |
| Amount (000) | | Description (1) | Provisions (2) | Ratings (3) | Value |
| | North Carolina (continued) | | | |
| $ 5,000 | | North Carolina Capital Facilities Financing Agency, Solid Waste Disposal Revenue Bond, | 11/20 at 100.00 | A | $ 5,072,300 |
| | Duke Energy Carolinas Project, Refunding Series 2008B, 4.625%, 11/01/40 | | | |
| 4,440 | | North Carolina Capital Facilities Finance Agency, Revenue Bonds, The Methodist | 3/22 at 100.00 | BB+ | 4,177,463 |
| | University, Series 2012, 5.000%, 3/01/34 | | | |
| | North Carolina Eastern Municipal Power Agency, Power System Revenue Bonds, Refunding | | | |
| | Series 1993B: | | | |
| 100 | | 6.000%, 1/01/22 (ETM) | No Opt. Call | AAA | 108,705 |
| 180 | | 6.000%, 1/01/22 – FGIC Insured (ETM) | No Opt. Call | Baa2 (4) | 195,356 |
| 3,500 | | North Carolina Eastern Municipal Power Agency, Power System Revenue Bonds, Series 2012A, | 7/22 at 100.00 | N/R (4) | 3,816,260 |
| | 5.000%, 1/01/25 (Pre-refunded 7/01/22) | | | |
| 1,430 | | North Carolina Housing Finance Agency, Home Ownership Revenue Bonds, Series 2011-1, | 1/21 at 100.00 | AA | 1,450,406 |
| | 4.500%, 1/01/28 | | | |
| 2,720 | | North Carolina Medical Care Commission, Retirement Facilities First Mortgage Revenue | 10/24 at 102.00 | N/R | 2,583,347 |
| | Bonds, Southminster Project, Refunding Series 2016, 5.000%, 10/01/37 | | | |
| 2,680 | | North Carolina Medical Care Commission, Health Care Facilities Revenue Bonds, Appalachian | 7/21 at 100.00 | N/R (4) | 2,854,441 |
| | Regional HealthCare System, Series 2011A, 6.500%, 7/01/31 (Pre-refunded 7/01/21) | | | |
| 2,750 | | North Carolina Medical Care Commission, Health Care Facilities Revenue Bonds, Blue Ridge | 6/20 at 100.00 | A3 | 2,753,712 |
| | HealthCare, Refunding Series 2010A, 5.000%, 1/01/36 | | | |
| 2,375 | | North Carolina Medical Care Commission, Health Care Facilities Revenue Bonds, Cape Fear | 10/22 at 100.00 | A– | 2,515,719 |
| | Valley Health System, Refunding Series 2012A, 5.000%, 10/01/27 | | | |
| 1,680 | | North Carolina Medical Care Commission, Health Care Facilities Revenue Bonds, Cleveland | 1/21 at 100.00 | N/R (4) | 1,734,818 |
| | County Healthcare System, Refunding Series 2011A, 5.750%, 1/01/35 (Pre-refunded 1/01/21) | | | |
| 2,690 | | North Carolina Medical Care Commission, Health Care Facilities Revenue Bonds, Deerfield | 11/26 at 100.00 | A | 2,907,890 |
| | Episcopal Retirement Community, Refunding First Mortgage Series 2016, 5.000%, 11/01/37 | | | |
| 1,250 | | North Carolina Medical Care Commission, Health Care Facilities Revenue Bonds, Duke | 6/26 at 100.00 | AA | 1,469,487 |
| | University Health System, Refunding Series 2016D, 5.000%, 6/01/29 | | | |
| 7,000 | | North Carolina Medical Care Commission, Health Care Facilities Revenue Bonds, Duke | 6/22 at 100.00 | AA (4) | 7,608,300 |
| | University Health System, Series 2012A, 5.000%, 6/01/42 (Pre-refunded 6/01/22) | | | |
| | North Carolina Medical Care Commission, Health Care Facilities Revenue Bonds, Novant | | | |
| | Health Inc, Series 2010A: | | | |
| 4,750 | | 5.250%, 11/01/40 | 11/20 at 100.00 | AA– | 4,807,095 |
| 2,500 | | 4.750%, 11/01/43 | 11/20 at 100.00 | AA– | 2,520,950 |
| 5,000 | | 5.000%, 11/01/43 | 11/20 at 100.00 | AA– | 5,050,400 |
| 8,275 | | North Carolina Medical Care Commission, Health Care Facilities Revenue Bonds, Novant | 11/29 at 100.00 | AA– | 8,619,819 |
| | Health Obligated Group, Series 2019A, 4.000%, 11/01/49 | | | |
| 2,000 | | North Carolina Medical Care Commission, Health Care Facilities Revenue Bonds, Rex | 7/25 at 100.00 | A2 | 2,141,280 |
| | Healthcare, Series 2015A, 5.000%, 7/01/44 | | | |
| 3,000 | | North Carolina Medical Care Commission, Health Care Facilities Revenue Bonds, Wake | 12/22 at 100.00 | A | 3,108,420 |
| | Forest Baptist Obligated Group, Series 2012A, 5.000%, 12/01/45 | | | |
| | North Carolina Medical Care Commission, Health Care Facilities Revenue Bonds, WakeMed, | | | |
| | Refunding Series 2012A: | | | |
| 2,000 | | 5.000%, 10/01/27 | 10/22 at 100.00 | A2 | 2,118,500 |
| 6,800 | | 5.000%, 10/01/31 | 10/22 at 100.00 | A2 | 7,140,408 |
| 1,500 | | 5.000%, 10/01/38 | 10/22 at 100.00 | A2 | 1,560,225 |
| 2,930 | | North Carolina Medical Care Commission, Hospital Revenue Bonds, Southeastern Regional | 6/22 at 100.00 | BBB+ | 3,043,889 |
| | Medical Center, Refunding Series 2012, 5.000%, 6/01/32 | | | |
| 450 | | North Carolina Medical Care Commission, Retirement Facilities First Mortgage Revenue | 10/23 at 100.00 | N/R | 450,680 |
| | Bonds, United Methodist Retirement Homes, Refunding Series 2013A, 5.000%, 10/01/33 | | | |
| 500 | | North Carolina Medical Care Commission, Revenue Bonds, First Mortgage Galloway Ridge | 1/27 at 103.00 | N/R | 481,755 |
| | Project, Refunding Series 2019A, 5.000%, 1/01/39 | | | |
| | North Carolina Municipal Power Agency 1, Catawba Electric Revenue Bonds, Refunding | | | |
| | Series 2015A: | | | |
| 1,545 | | 5.000%, 1/01/28 | 1/26 at 100.00 | A | 1,794,981 |
| 1,500 | | 5.000%, 1/01/32 | 1/26 at 100.00 | A | 1,712,850 |
90
| | | | | | |
| Principal | | | Optional Call | | |
| Amount (000) | | Description (1) | Provisions (2) | Ratings (3) | Value |
| | North Carolina (continued) | | | |
| $ 760 | | North Carolina Municipal Power Agency 1, Catawba Electric Revenue Bonds, Refunding | 7/26 at 100.00 | A | $ 885,233 |
| | Series 2016A, 5.000%, 1/01/30 | | | |
| 2,020 | | North Carolina State University at Raleigh, General Revenue Bonds, Series 2013A, | 10/23 at 100.00 | AA | 2,239,089 |
| | 5.000%, 10/01/42 | | | |
| 5,000 | | North Carolina State, Limited Obligation Bonds, Refunding Series 2014C, 5.000%, 5/01/25 | 5/24 at 100.00 | AA+ | 5,714,250 |
| | North Carolina State, Limited Obligation Bonds, Refunding Series 2017B: | | | |
| 2,000 | | 5.000%, 5/01/29 (UB) (6) | 5/27 at 100.00 | AA+ | 2,453,280 |
| 4,000 | | 5.000%, 5/01/30 (UB) (6) | 5/27 at 100.00 | AA+ | 4,883,600 |
| 8,065 | | North Carolina Turnpike Authority, Monroe Connector System State Appropriation Bonds, | 7/21 at 100.00 | AA+ | 8,355,259 |
| | Series 2011, 5.000%, 7/01/41 | | | |
| | North Carolina Turnpike Authority, Monroe Expressway Toll Revenue Bonds, Capital | | | |
| | Appreciation Series 2017C: | | | |
| 835 | | 0.000%, 7/01/28 | 7/26 at 91.99 | Baa3 | 600,950 |
| 800 | | 0.000%, 7/01/30 | 7/26 at 83.69 | Baa3 | 518,048 |
| 850 | | 0.000%, 7/01/31 | 7/26 at 79.58 | Baa3 | 522,215 |
| 2,400 | | 0.000%, 7/01/33 | 7/26 at 71.99 | Baa3 | 1,321,344 |
| 3,160 | | 0.000%, 7/01/36 | 7/26 at 61.63 | Baa3 | 1,469,274 |
| 3,100 | | 0.000%, 7/01/37 | 7/26 at 58.52 | Baa3 | 1,363,225 |
| 1,900 | | 0.000%, 7/01/40 | 7/26 at 50.36 | Baa3 | 710,163 |
| 400 | | North Carolina Turnpike Authority, Monroe Expressway Toll Revenue Bonds, Series 2017A, | 7/26 at 100.00 | Baa3 | 411,204 |
| | 5.000%, 7/01/47 | | | |
| 2,200 | | North Carolina Turnpike Authority, Triangle Expressway System Revenue Bonds, Refunding | 1/27 at 100.00 | BBB | 2,456,454 |
| | Senior Lien Series 2017, 5.000%, 1/01/39 – AGM Insured | | | |
| | North Carolina Turnpike Authority, Triangle Expressway System Revenue Bonds, Senior Lien | | | |
| | Series 2009B: | | | |
| 150 | | 0.000%, 1/01/31 – AGC Insured | No Opt. Call | BBB | 113,249 |
| 4,375 | | 0.000%, 1/01/33 – AGC Insured | No Opt. Call | BBB | 3,037,825 |
| 2,300 | | 0.000%, 1/01/34 – AGC Insured | No Opt. Call | BBB | 1,529,546 |
| 2,380 | | 0.000%, 1/01/35 – AGC Insured | No Opt. Call | BBB | 1,515,060 |
| 7,575 | | 0.000%, 1/01/37 – AGC Insured | No Opt. Call | BBB | 4,422,058 |
| 1,470 | | 0.000%, 1/01/38 – AGC Insured | No Opt. Call | BBB | 821,671 |
| 1,775 | | North Carolina Turnpike Authority, Triangle Expressway System Revenue Bonds, Senior Lien | 1/30 at 100.00 | BBB | 1,855,123 |
| | Series 2019, 5.000%, 1/01/49 | | | |
| 3,040 | | Oak Island, North Carolina, Enterprise System Revenue Bonds, Refunding Series 2015, | 6/25 at 100.00 | A2 | 3,472,501 |
| | 5.000%, 6/01/33 | | | |
| | Oak Island, North Carolina, Enterprise System Revenue Bonds, Series 2011: | | | |
| 600 | | 5.625%, 6/01/30 (Pre-refunded 6/01/20) – AGC Insured | 6/20 at 100.00 | A2 (4) | 602,256 |
| 2,100 | | 5.750%, 6/01/36 (Pre-refunded 6/01/20) – AGC Insured | 6/20 at 100.00 | A2 (4) | 2,108,106 |
| | Orange County Public Facilities Company, North Carolina, Limited Obligation Bonds, | | | |
| | Refunding Series 2017: | | | |
| 200 | | 5.000%, 10/01/27 | No Opt. Call | AA+ | 250,490 |
| 150 | | 5.000%, 10/01/28 | 10/27 at 100.00 | AA+ | 187,073 |
| 400 | | 5.000%, 10/01/30 | 10/27 at 100.00 | AA+ | 491,980 |
| | Raleigh, North Carolina, Combined Enterprise System Revenue Bonds, Refunding Series | | | |
| | 2012A: | | | |
| 550 | | 5.000%, 3/01/30 (Pre-refunded 3/01/22) | 3/22 at 100.00 | AAA | 593,120 |
| 1,600 | | 5.000%, 3/01/31 (Pre-refunded 3/01/22) | 3/22 at 100.00 | AAA | 1,725,440 |
| | Raleigh, North Carolina, Combined Enterprise System Revenue Bonds, Refunding Series 2013A: | | | |
| 5,000 | | 5.000%, 3/01/28 (Pre-refunded 3/01/23) | 3/23 at 100.00 | AAA | 5,580,900 |
| 3,785 | | 5.000%, 3/01/43 (Pre-refunded 3/01/23) | 3/23 at 100.00 | AAA | 4,224,741 |
| 5,000 | | Raleigh, North Carolina, Combined Enterprise System Revenue Bonds, Refunding Series | 3/27 at 100.00 | AAA | 5,437,650 |
| | 2016A, 4.000%, 3/01/46 | | | |
| 1,000 | | Raleigh, North Carolina, General Obligation Bonds, Refunding Series 2016A, 5.000%, 9/01/26 | No Opt. Call | AAA | 1,231,800 |
| 1,000 | | Raleigh, North Carolina, Limited Obligation Bonds, Series 2013, 5.000%, 10/01/33 | 10/23 at 100.00 | AA+ | 1,120,460 |
| | Raleigh, North Carolina, Limited Obligation Bonds, Series 2014A: | | | |
| 1,195 | | 5.000%, 10/01/25 | 10/24 at 100.00 | AA+ | 1,388,757 |
| 1,305 | | 5.000%, 10/01/26 | 10/24 at 100.00 | AA+ | 1,508,228 |
91
| | | | | |
| NEA | Nuveen AMT-Free Quality Municipal Income Fund | |
| Portfolio of Investments (continued) | | | |
| April 30, 2020 (Unaudited) | | | |
|
|
|
|
| Principal | | | Optional Call | | |
| Amount (000) | | Description (1) | Provisions (2) | Ratings (3) | Value |
| | North Carolina (continued) | | | |
| $ 650 | | Rocky Mount, North Carolina, Special Obligation Bonds, Series 2016, 5.000%, 5/01/30 | 5/26 at 100.00 | AA– | $ 773,227 |
| | Sampson County, North Carolina, Limited Obligation Bonds, Refunding Series 2017: | | | |
| 300 | | 5.000%, 9/01/32 | 9/27 at 100.00 | A | 360,504 |
| 1,250 | | 4.000%, 9/01/35 | 9/27 at 100.00 | A | 1,391,925 |
| 1,265 | | 4.000%, 9/01/36 | 9/27 at 100.00 | A | 1,403,606 |
| 1,000 | | 4.000%, 9/01/37 | 9/27 at 100.00 | A | 1,106,360 |
| 1,100 | | Union County, North Carolina, Enterprise System Revenue Bonds, Series 2019A, | 6/29 at 100.00 | AA | 1,210,803 |
| | 4.000%, 6/01/44 | | | |
| | University of North Carolina, Chapel Hill, Revenue Bonds, Hospital System, Series 2019: | | | |
| 1,360 | | 5.000%, 2/01/45 | No Opt. Call | Aa3 | 1,895,976 |
| 840 | | 5.000%, 2/01/49 | No Opt. Call | Aa3 | 1,193,724 |
| 800 | | University of North Carolina, Charlotte, General Revenue Bonds, Refunding Series 2015, | 4/25 at 100.00 | A+ | 895,392 |
| | 5.000%, 4/01/45 | | | |
| 170 | | University of North Carolina, Charlotte, General Revenue Bonds, Refunding Series 2017A, | 10/27 at 100.00 | A+ | 202,582 |
| | 5.000%, 10/01/31 | | | |
| | University of North Carolina, Charlotte, General Revenue Bonds, Series 2014: | | | |
| 2,070 | | 5.000%, 4/01/32 | 4/24 at 100.00 | A+ | 2,287,060 |
| 1,175 | | 5.000%, 4/01/33 | 4/24 at 100.00 | A+ | 1,291,795 |
| 1,385 | | 5.000%, 4/01/35 | 4/24 at 100.00 | A+ | 1,514,179 |
| 4,735 | | University of North Carolina, Charlotte, General Revenue Bonds, Series 2017, 5.000%, 10/01/42 | 10/27 at 100.00 | A+ | 5,484,314 |
| 1,415 | | University of North Carolina, Greensboro, General Revenue Bonds, Refunding Series 2017, | 4/28 at 100.00 | A+ | 1,708,669 |
| | 5.000%, 4/01/31 | | | |
| | University of North Carolina, Greensboro, General Revenue Bonds, Series 2014: | | | |
| 1,000 | | 5.000%, 4/01/32 | 4/24 at 100.00 | A+ | 1,118,800 |
| 3,065 | | 5.000%, 4/01/39 | 4/24 at 100.00 | A+ | 3,382,074 |
| 4,765 | | University of North Carolina, Greensboro, General Revenue Bonds, Series 2018, | 4/28 at 100.00 | A+ | 5,559,707 |
| | 5.000%, 4/01/43 | | | |
| | University of North Carolina, Wilmington, General Revenue Bonds, Refunding Series 2019B: | | | |
| 1,000 | | 4.000%, 10/01/39 | 10/29 at 100.00 | Aa3 | 1,117,480 |
| 1,500 | | 4.000%, 10/01/44 | 10/29 at 100.00 | Aa3 | 1,653,585 |
| 1,845 | | 4.000%, 10/01/49 | 10/29 at 100.00 | Aa3 | 2,022,083 |
| 1,250 | | Western Carolina University, North Carolina, General Revenue Bonds, Refunding Series | 10/25 at 100.00 | Aa3 | 1,412,775 |
| | 2015A, 5.000%, 10/01/45 | | | |
| 356,655 | | Total North Carolina | | | 374,282,268 |
| | North Dakota – 1.1% (0.7% of Total Investments) | | | |
| 5,080 | | Burleigh County, North Dakota, Health Care Revenue Bonds, Saint Alexius Medical Center | 7/22 at 100.00 | N/R (4) | 5,473,395 |
| | Project, Refunding Series 2012A, 4.500%, 7/01/32 (Pre-refunded 7/01/22) | | | |
| | Fargo, North Dakota, Health System Revenue Bonds, Sanford Health, Refunding Series 2011: | | | |
| 1,500 | | 6.000%, 11/01/28 | 11/21 at 100.00 | A2 | 1,575,855 |
| 3,910 | | 6.250%, 11/01/31 | 11/21 at 100.00 | A2 | 4,103,232 |
| 1,015 | | Grand Forks, North Dakota, Health Care System Revenue Bonds, Altru Health System | 12/21 at 100.00 | Baa2 | 1,029,210 |
| | Obligated Group, Series 2012, 5.000%, 12/01/35 | | | |
| | Grand Forks, North Dakota, Health Care System Revenue Bonds, Altru Health System | | | |
| | Obligated Group, Series 2017A: | | | |
| 1,000 | | 5.000%, 12/01/37 | 12/27 at 100.00 | Baa2 | 1,053,550 |
| 8,525 | | 5.000%, 12/01/42 | 12/27 at 100.00 | Baa2 | 8,885,267 |
| 7,070 | | 4.000%, 12/01/47 | 12/27 at 100.00 | Baa2 | 6,842,275 |
| 900 | | Grand Forks, North Dakota, Senior Housing & Nursing Facilities Revenue Bonds, Valley | 12/26 at 100.00 | N/R | 812,394 |
| | Homes and Services Obligated Group, Series 2017, 5.000%, 12/01/36 | | | |
| 500 | | Grand Forks, North Dakota, Senior Housing and Nursing Facilities Revenue Bonds, Valley | No Opt. Call | N/R | 499,475 |
| | Homes Obligated Group, Series 2016A, 5.125%, 12/01/24 | | | |
92
| | | | | | |
| Principal | | | Optional Call | | |
| Amount (000) | | Description (1) | Provisions (2) | Ratings (3) | Value |
| | North Dakota (continued) | | | |
| | Ward County Health Care, North Dakota, Revenue Bonds, Trinity Obligated Group, Series 2017C: | | | |
| $ 11,065 | | 5.000%, 6/01/43 | 6/28 at 100.00 | BBB– | $ 11,076,508 |
| 2,610 | | 5.000%, 6/01/48 | 6/28 at 100.00 | BBB– | 2,594,001 |
| 1,420 | | Williston, North Dakota, Multifamily Housing Revenue Bonds, Eagle Crest Apartments LLC | 9/23 at 100.00 | N/R | 624,800 |
| | Project, Series 2013, 7.750%, 9/01/38 (8) | | | |
| 44,595 | | Total North Dakota | | | 44,569,962 |
| | Ohio – 7.1% (4.5% of Total Investments) | | | |
| | Akron, Bath and Copley Joint Township Hospital District, Ohio, Hospital Facilities | | | |
| | Revenue Bonds, Summa Health System, Refunding & Improvement Series 2016: | | | |
| 3,020 | | 5.250%, 11/15/41 | 11/26 at 100.00 | Baa2 | 3,352,381 |
| 8,255 | | 5.250%, 11/15/46 | 11/26 at 100.00 | Baa2 | 9,073,318 |
| 320 | | Akron, Bath and Copley Joint Township Hospital District, Ohio, Hospital Revenue Bonds, | 5/22 at 100.00 | A1 | 329,088 |
| | Children’s Hospital Medical Center, Improvement & Refunding Series 2012, 5.000%, 11/15/42 | | | |
| | Allen County, Ohio, Hospital Facilities Revenue Bonds, Catholic Health Partners, | | | |
| | Refunding and Improvement Series 2012A: | | | |
| 860 | | 4.000%, 5/01/33 | 5/22 at 100.00 | A+ | 881,010 |
| 650 | | 5.000%, 5/01/33 | 5/22 at 100.00 | A+ | 678,392 |
| 800 | | 5.000%, 5/01/42 | 5/22 at 100.00 | A+ | 828,000 |
| 10,990 | | Allen County, Ohio, Hospital Facilities Revenue Bonds, Mercy Health, Refunding & | 11/24 at 100.00 | A+ | 11,802,601 |
| | Improvement Series 2015A, 5.000%, 11/01/43 | | | |
| 8,655 | | Allen County, Ohio, Hospital Facilities Revenue Bonds, Mercy Health, Series 2017A, | 2/28 at 100.00 | A+ | 9,020,328 |
| | 4.000%, 8/01/38 | | | |
| 2,750 | | Bowling Green State University, Ohio, General Receipts Bonds, Series 2017B, | 6/27 at 100.00 | A+ | 3,084,235 |
| | 5.000%, 6/01/42 | | | |
| 25,315 | | Buckeye Tobacco Settlement Financing Authority, Ohio, Tobacco Settlement Asset-Backed | 6/30 at 22.36 | N/R | 2,679,593 |
| | Revenue Bonds, Refunding Senior Lien Capital Appreciation Series 2020B-3 Class 2, | | | |
| | 0.000%, 6/01/57 | | | |
| 990 | | Buckeye Tobacco Settlement Financing Authority, Ohio, Tobacco Settlement Asset-Backed | 6/30 at 100.00 | BBB+ | 993,237 |
| | Revenue Bonds, Refunding Senior Lien Series 2020A-2 Class 1, 4.000%, 6/01/48 | | | |
| 39,115 | | Buckeye Tobacco Settlement Financing Authority, Ohio, Tobacco Settlement Asset-Backed | 6/30 at 100.00 | N/R | 34,920,307 |
| | Revenue Bonds, Refunding Senior Lien Series 2020B-2 Class 2, 5.000%, 6/01/55 | | | |
| 14,570 | | Buckeye Tobacco Settlement Financing Authority, Ohio, Tobacco Settlement Asset-Backed | 6/22 at 100.00 | Caa3 (4) | 16,213,496 |
| | Revenue Bonds, Senior Lien Series 2007A-3, 6.250%, 6/01/37 (Pre-refunded 6/01/22) | | | |
| 6,000 | | Butler County, Ohio, Hospital Facilities Revenue Bonds, UC Health, Series 2010, 5.250%, | 11/20 at 100.00 | A3 (4) | 6,134,040 |
| | 11/01/29 (Pre-refunded 11/01/20) | | | |
| 5,000 | | Cleveland Clinic Health System Obligated Group, Martin County Health Facilities | 1/29 at 100.00 | AA | 5,315,900 |
| | Authority, Hospital Revenue Bonds, Series 2019B, 4.000%, 1/01/46 | | | |
| | Cleveland Heights-University Heights City School District, Ohio, General Obligation | | | |
| | Bonds, School Improvement Series 2014: | | | |
| 7,060 | | 5.000%, 12/01/51 | 6/23 at 100.00 | A1 | 7,688,552 |
| 10,480 | | 5.000%, 12/01/51 (Pre-refunded 6/01/23) | 6/23 at 100.00 | N/R (4) | 11,821,126 |
| 5,165 | | Cuyahoga Community College District, Ohio, General Obligation Bonds, Facilities | 6/26 at 100.00 | AA | 5,626,958 |
| | Construction & Improvement Series 2018, 4.000%, 12/01/38 | | | |
| 5,975 | | Fairfield County, Ohio, Hospital Facilities Revenue Bonds, Fairfield Medical Center | 6/23 at 100.00 | Ba2 | 6,131,306 |
| | Project, Series 2013, 5.000%, 6/15/43 | | | |
| 1,465 | | Franklin County, Ohio, Hospital Revenue Bonds, Nationwide Children’s Hospital Project, | 5/22 at 100.00 | Aa2 | 1,527,101 |
| | Improvement Series 2012A, 5.000%, 11/01/42 | | | |
| 6,345 | | Franklin County, Ohio, Hospital Revenue Bonds, OhioHealth Corporation, Series 2011A, | 11/21 at 100.00 | Aa2 | 6,571,136 |
| | 5.000%, 11/15/41 | | | |
| | Hamilton County, Ohio, Healthcare Revenue Bonds, Life Enriching Communities Project, | | | |
| | Series 2017A: | | | |
| 1,500 | | 5.000%, 1/01/47 | 1/27 at 100.00 | BBB– | 1,364,475 |
| 1,120 | | 5.000%, 1/01/52 | 1/27 at 100.00 | BBB– | 996,621 |
93
| | | | | |
| NEA | Nuveen AMT-Free Quality Municipal Income Fund | |
| Portfolio of Investments (continued) | | | |
| April 30, 2020 (Unaudited) | | | |
|
|
|
|
| Principal | | | Optional Call | | |
| Amount (000) | | Description (1) | Provisions (2) | Ratings (3) | Value |
| | Ohio (continued) | | | |
| | Hamilton County, Ohio, Healthcare Revenue Bonds, Life Enriching Communities, Refunding & | | | |
| | Improvement Series 2016: | | | |
| $ 3,425 | | 5.000%, 1/01/46 | 1/26 at 100.00 | BBB– | $ 3,125,038 |
| 6,000 | | 5.000%, 1/01/51 | 1/26 at 100.00 | BBB– | 5,354,580 |
| | JobsOhio Beverage System, Ohio, Statewide Liquor Profits Revenue Bonds, Senior Lien | | | |
| | Series 2013A: | | | |
| 6,920 | | 5.000%, 1/01/38 (Pre-refunded 1/01/23) | 1/23 at 100.00 | Aa3 (4) | 7,686,736 |
| 14,850 | | 5.000%, 1/01/38 (Pre-refunded 1/01/23) (UB) (6) | 1/23 at 100.00 | Aa3 (4) | 16,495,380 |
| | JobsOhio Beverage System, Ohio, Statewide Senior Lien Liquor Profits Revenue Bonds, | | | |
| | Tender Option Bond Trust 2016-XG0052: | | | |
| 875 | | 17.415%, 1/01/38, 144A (IF) (6) | 1/23 at 100.00 | Aa3 | 1,262,809 |
| 1,050 | | 17.415%, 1/01/38, 144A (IF) (6) | 1/23 at 100.00 | Aa3 | 1,515,370 |
| 2,305 | | Lucas County, Ohio, Hospital Revenue Bonds, ProMedica Healthcare Obligated Group, Series | 11/21 at 100.00 | Baa3 (4) | 2,486,588 |
| | 2011A, 6.000%, 11/15/41 (Pre-refunded 11/15/21) | | | |
| 5,000 | | Miami County, Ohio, Hospital Facilities Revenue Bonds, Kettering Health Network | 8/28 at 100.00 | A2 | 5,430,350 |
| | Obligated Group Project, Refunding Improvement Series 2019, 5.000%, 8/01/45 | | | |
| 6,000 | | Middletown City School District, Butler County, Ohio, General Obligation Bonds, | No Opt. Call | A2 | 7,825,620 |
| | Refunding Series 2007, 5.250%, 12/01/31 – AGM Insured | | | |
| 21,000 | | Northeast Ohio Regional Sewer District, Wastewater Improvement Revenue Bonds, Refunding | 11/24 at 100.00 | AA+ (4) | 24,865,260 |
| | & Improvement Series 2014, 5.000%, 11/15/49 (Pre-refunded 11/15/24) | | | |
| 9,365 | | Ohio Higher Educational Facility Commission, Revenue Bonds, University of Dayton, Series | 6/28 at 100.00 | A2 | 10,091,630 |
| | 2018A, 5.000%, 12/01/48 | | | |
| 4,165 | | Ohio State, Hospital Revenue Bonds, University Hospitals Health System, Inc, Series | 1/30 at 100.00 | A | 4,641,851 |
| | 2020A, 5.000%, 1/15/50 | | | |
| 19,515 | | Ohio Turnpike Commission, Turnpike Revenue Bonds, Infrastructure Project, Junior Lien | 2/23 at 100.00 | A+ (4) | 21,746,930 |
| | Series 2013A-1, 5.000%, 2/15/48 (Pre-refunded 2/15/23) | | | |
| 7,550 | | Ohio Turnpike Commission, Turnpike Revenue Bonds, Infrastructure Projects, Junior Lien | 2/31 at 100.00 | A+ | 8,534,067 |
| | Convertible Series 2013A-3, 0.000%, 2/15/36 (5) | | | |
| 9,000 | | Ohio Turnpike Commission, Turnpike Revenue Bonds, Infrastructure Projects, Junior Lien | 2/28 at 100.00 | A+ | 9,703,440 |
| | Series 2018A, 4.000%, 2/15/46 | | | |
| | Southeastern Ohio Port Authority, Hospital Facilities Revenue Bonds, Memorial Health | | | |
| | System Obligated Group Project, Refunding and Improvement Series 2012: | | | |
| 135 | | 5.750%, 12/01/32 | 12/22 at 100.00 | BB– | 142,430 |
| 130 | | 6.000%, 12/01/42 | 12/22 at 100.00 | BB– | 136,009 |
| 4,190 | | Springboro Community City School District, Warren County, Ohio, General Obligation | No Opt. Call | Aa3 | 5,153,365 |
| | Bonds, Refunding Series 2007, 5.250%, 12/01/26 – AGM Insured | | | |
| 3,670 | | Tuscarawas County Economic Development and Finance Alliance, Ohio, Higher Education | 3/25 at 100.00 | N/R | 3,641,557 |
| | Facilities Revenue Bonds, Ashland University, Refunding & Improvement Series 2015, | | | |
| | 6.000%, 3/01/45 | | | |
| 291,545 | | Total Ohio | | | 286,872,211 |
| | Oklahoma – 0.3% (0.2% of Total Investments) | | | |
| 1,165 | | Norman Regional Hospital Authority, Oklahoma, Hospital Revenue Bonds, Series 2019, | 9/29 at 100.00 | Baa1 | 1,258,130 |
| | 5.000%, 9/01/45 | | | |
| | Oklahoma Development Finance Authority, Health System Revenue Bonds, OU Medicine | | | |
| | Project, Series 2018B: | | | |
| 2,205 | | 5.250%, 8/15/48 | 8/28 at 100.00 | BB+ | 2,278,802 |
| 4,080 | | 5.500%, 8/15/52 | 8/28 at 100.00 | BB+ | 4,274,698 |
| 3,190 | | 5.500%, 8/15/57 | 8/28 at 100.00 | BB+ | 3,320,726 |
| 1,125 | | Tulsa County Industrial Authority, Oklahoma, Senior Living Community Revenue Bonds, | 11/25 at 102.00 | BBB– | 1,124,921 |
| | Montereau, Inc Project, Refunding Series 2017, 5.250%, 11/15/37 | | | |
| 11,765 | | Total Oklahoma | | | 12,257,277 |
94
| | | | | | |
| Principal | | | Optional Call | | |
| Amount (000) | | Description (1) | Provisions (2) | Ratings (3) | Value |
| | Oregon – 1.8% (1.1% of Total Investments) | | | |
| | Clackamas Community College District, Oregon, General Obligation Bonds, Deferred | | | |
| | Interest Series 2017A: | | | |
| $ 760 | | 0.000%, 6/15/38 (5) | 6/27 at 100.00 | Aa1 | $ 890,165 |
| 2,750 | | 0.000%, 6/15/39 (5) | 6/27 at 100.00 | Aa1 | 3,213,678 |
| | Columbia County School District 502 Saint Helens, Oregon, General Obligation Bonds, | | | |
| | Series 2017: | | | |
| 1,310 | | 5.000%, 6/15/38 | 6/27 at 100.00 | Aa1 | 1,555,953 |
| 1,705 | | 5.000%, 6/15/39 | 6/27 at 100.00 | Aa1 | 2,020,510 |
| 7,420 | | Oregon Facilities Authority, Revenue Bonds, Legacy Health Project, Series 2016A, | 6/26 at 100.00 | A+ | 8,097,965 |
| | 5.000%, 6/01/46 | | | |
| | Oregon Facilities Authority, Revenue Bonds, Samaritan Health Services, Refunding | | | |
| | Series 2016A: | | | |
| 6,240 | | 5.000%, 10/01/35 | 10/26 at 100.00 | BBB+ | 6,806,218 |
| 2,260 | | 5.000%, 10/01/46 | 10/26 at 100.00 | BBB+ | 2,388,707 |
| 8,890 | | Oregon State Department of Transportation, Highway User Tax Revenue Bonds, Senior Lien | 11/23 at 100.00 | Aa1 (4) | 10,143,757 |
| | Series 2013A, 5.000%, 11/15/38 (Pre-refunded 11/15/23) | | | |
| 30,870 | | Salem Hospital Facility Authority, Oregon, Revenue Bonds, Salem Health Projects, Series | 5/29 at 100.00 | A+ | 32,127,952 |
| | 2019A, 4.000%, 5/15/49 | | | |
| 5,265 | | Salem Hospital Facility Authority, Oregon, Revenue Bonds, Salem Hospital Project, | 5/26 at 100.00 | A+ | 5,743,220 |
| | Refunding Series 2016A, 5.000%, 5/15/46 | | | |
| 67,470 | | Total Oregon | | | 72,988,125 |
| | Pennsylvania – 5.1% (3.2% of Total Investments) | | | |
| 15,000 | | Allegheny County Hospital Development Authority, Pennsylvania, Revenue Bonds, Allegheny | 4/28 at 100.00 | A | 16,224,300 |
| | Health Network Obligated Group Issue, Series 2018A, 5.000%, 4/01/47 | | | |
| | Bethlehem Authority, Northampton and Lehigh Counties, Pennsylvania, Guaranteed Water | | | |
| | Revenue Bonds, Series 1998: | | | |
| 3,125 | | 0.000%, 5/15/22 – AGM Insured | No Opt. Call | A2 | 3,038,875 |
| 3,125 | | 0.000%, 5/15/23 – AGM Insured | No Opt. Call | A2 | 2,985,969 |
| 3,135 | | 0.000%, 5/15/24 – AGM Insured | No Opt. Call | A2 | 2,937,840 |
| 3,155 | | 0.000%, 5/15/26 – AGM Insured | No Opt. Call | A2 | 2,823,283 |
| 4,145 | | 0.000%, 11/15/26 – AGM Insured | No Opt. Call | A2 | 3,664,594 |
| 2,800 | | 0.000%, 5/15/28 – AGM Insured | No Opt. Call | A2 | 2,375,856 |
| 3,000 | | 0.000%, 11/15/28 – AGM Insured | No Opt. Call | A2 | 2,506,650 |
| 1,200 | | Centre County Hospital Authority, Pennsylvania, Hospital Revenue Bonds, Mount Nittany | 11/27 at 100.00 | A+ | 1,344,564 |
| | Medical Center Project, Series 2018A, 5.000%, 11/15/42 | | | |
| | Chester County Health and Education Facilities Authority, Pennsylvania, Health System | | | |
| | Revenue Bonds, Jefferson Health System, Series 2010A: | | | |
| 895 | | Commonwealth Financing Authority, Pennsylvania, State Appropriation Lease Bonds, Master | 6/28 at 100.00 | A | 1,013,015 |
| | Settlement, Series 2018, 5.000%, 6/01/34 | | | |
| 2,150 | | Dauphin County General Authority, Pennsylvania, Health System Revenue Bonds, Pinnacle | 6/22 at 100.00 | A | 2,217,209 |
| | Health System Project, Series 2012A, 5.000%, 6/01/42 | | | |
| 26,595 | | Delaware River Joint Toll Bridge Commission, New Jersey and Pennsylvania, Bridge System | 7/27 at 100.00 | A | 31,352,314 |
| | Revenue Bonds, Series 2017, 5.000%, 7/01/42 | | | |
| 1,050 | | Delaware Valley Regional Finance Authority, Pennsylvania, Local Government Revenue | No Opt. Call | A1 | 1,302,599 |
| | Bonds, Series 1997B, 5.700%, 7/01/27 – AMBAC Insured | | | |
| | Erie Water Authority, Erie County, Pennsylvania, Water Revenue Bonds, Series 2011A: | | | |
| 1,315 | | 4.625%, 12/01/44 (Pre-refunded 12/01/21) | 12/21 at 100.00 | A2 (4) | 1,395,268 |
| 2,685 | | 4.625%, 12/01/44 (Pre-refunded 12/01/21) | 12/21 at 100.00 | A2 (4) | 2,848,892 |
| 4,915 | | Lancaster County Hospital Authority, Pennsylvania, Revenue Bonds, United Zion Retirement | 6/27 at 100.00 | N/R | 4,321,956 |
| | Community, Series 2017A, 5.000%, 12/01/47 | | | |
| | Lehigh County Authority, Pennsylvania, Water and Sewer Revenue Bonds, Allentown | | | |
| | Concession, Capital Appreciation Series 2013B: | | | |
| 4,480 | | 0.000%, 12/01/31 | No Opt. Call | A | 3,299,072 |
| 5,180 | | 0.000%, 12/01/32 | No Opt. Call | A | 3,658,271 |
95
| | | | | |
| NEA | Nuveen AMT-Free Quality Municipal Income Fund | |
| Portfolio of Investments (continued) | | | |
| April 30, 2020 (Unaudited) | | | |
|
|
|
|
| Principal | | | Optional Call | | |
| Amount (000) | | Description (1) | Provisions (2) | Ratings (3) | Value |
| | Pennsylvania (continued) | | | |
| $ 9,270 | | Lehigh County Authority, Pennsylvania, Water and Sewer Revenue Bonds, Allentown | 12/23 at 100.00 | A | $ 10,301,658 |
| | Concession, Series 2013A, 5.125%, 12/01/47 | | | |
| 5,410 | | Montgomery County Higher Education and Health Authority, Pennsylvania, Revenue Bonds, | 9/28 at 100.00 | A | 5,810,935 |
| | Thomas Jefferson University, Series 2018A, 5.000%, 9/01/48 | | | |
| 1,000 | | Montgomery County Higher Education and Health Authority, Pennsylvania, Revenue Bonds, | 9/29 at 100.00 | A | 1,007,340 |
| | Thomas Jefferson University, Series 2019, 4.000%, 9/01/44 | | | |
| 5,000 | | Montgomery County Industrial Development Authority, Pennsylvania, Health System Revenue | 1/25 at 100.00 | Ba1 | 5,141,100 |
| | Bonds, Albert Einstein Healthcare Network Issue, Series 2015A, 5.250%, 1/15/45 | | | |
| 630 | | Northampton County Industrial Development Authority, Pennsylvania, Recovery Revenue | 6/20 at 100.00 | N/R | 157,552 |
| | Bonds, Northampton Generating Project, Senior Lien Series 2013A0 & AE2, 1.250%, 12/31/23 | | | |
| 172 | | Northampton County Industrial Development Authority, Pennsylvania, Recovery Revenue | No Opt. Call | N/R | 42,986 |
| | Bonds, Northampton Generating Project, Senior Lien Taxable Series 2013B, 1.250%, 12/31/23 | | | |
| | (cash 5.000%, PIK 5.000%) | | | |
| 1,700 | | Pennsylvania Higher Educational Facilities Authority, Revenue Bonds, AICUP Financing | 11/22 at 100.00 | Ba1 | 1,436,092 |
| | Program-Delaware Valley College of Science and Agriculture Project, Series 2012 LL1, | | | |
| | 4.000%, 11/01/32 | | | |
| 5,910 | | Pennsylvania Higher Educational Facilities Authority, Revenue Bonds, University of | 8/29 at 100.00 | Aa3 | 6,265,486 |
| | Pennsylvania Health System, Series 2019, 4.000%, 8/15/44 | | | |
| | Pennsylvania Turnpike Commission, Motor License Fund-Enhanced Turnpike Special Revenue | | | |
| | Bonds, Subordinate Series 2010A1&2: | | | |
| 1,250 | | 5.500%, 12/01/34 (Pre-refunded 12/01/20) | 12/20 at 100.00 | N/R (4) | 1,280,763 |
| 5,725 | | 5.500%, 12/01/34 (Pre-refunded 12/01/20) | 12/20 at 100.00 | A2 (4) | 5,865,892 |
| | Pennsylvania Turnpike Commission, Motor License Fund-Enhanced Turnpike Special Revenue | | | |
| | Bonds, Subordinate Series 2011B: | | | |
| 965 | | 5.000%, 12/01/41 (Pre-refunded 12/01/21) | 12/21 at 100.00 | A2 (4) | 1,027,986 |
| 1,035 | | 5.000%, 12/01/41 (Pre-refunded 12/01/21) | 12/21 at 100.00 | N/R (4) | 1,105,939 |
| | Pennsylvania Turnpike Commission, Motor License Fund-Enhanced Turnpike Special Revenue | | | |
| | Bonds, Subordinate Series 2013A: | | | |
| 1,105 | | 5.000%, 12/01/36 (Pre-refunded 12/01/22) | 12/22 at 100.00 | N/R (4) | 1,225,434 |
| 2,010 | | 5.000%, 12/01/36 (Pre-refunded 12/01/22) | 12/22 at 100.00 | A2 (4) | 2,229,070 |
| 16,805 | | Pennsylvania Turnpike Commission, Turnpike Revenue Bonds, Capital Appreciation Series | 12/27 at 100.00 | A3 | 20,459,079 |
| | 2009E, 6.375%, 12/01/38 | | | |
| 5,575 | | Pennsylvania Turnpike Commission, Turnpike Revenue Bonds, Series 2015B, 5.000%, 12/01/45 | 12/25 at 100.00 | A1 | 6,091,858 |
| 6,340 | | Pennsylvania Turnpike Commission, Turnpike Revenue Bonds, Series 2016A-1, | 6/26 at 100.00 | A1 | 7,012,294 |
| | 5.000%, 12/01/41 | | | |
| 19,250 | | Pennsylvania Turnpike Commission, Turnpike Revenue Bonds, Subordinate Series 2009C, | 6/26 at 100.00 | A2 | 24,041,710 |
| | 6.250%, 6/01/33 – AGM Insured | | | |
| 1,445 | | Philadelphia Authority for Industrial Development Senior Living Facilities, | 7/27 at 100.00 | BB | 1,295,674 |
| | Philadelphia, Revenue Bonds, Wesley Enhanced Living Obligated Group, Series 2017A, | | | |
| | 5.000%, 7/01/37 | | | |
| 505 | | Philadelphia Hospitals and Higher Education Facilities Authority, Pennsylvania, Hospital | 7/22 at 100.00 | Ba1 | 520,963 |
| | Revenue Bonds, Temple University Health System Obligated Group, Series 2012A, 5.625%, 7/01/42 | | | |
| 1,425 | | Philadelphia, Pennsylvania, General Obligation Bonds, Refunding Series 2011, 6.500%, | 8/20 at 100.00 | A– (4) | 1,444,864 |
| | 8/01/41 (Pre-refunded 8/01/20) | | | |
| 3,410 | | Philadelphia, Pennsylvania, Water and Wastewater Revenue Bonds, Series 1997A, 5.125%, | No Opt. Call | A1 (4) | 4,338,304 |
| | 8/01/27 – AMBAC Insured (ETM) | | | |
| 3,415 | | Pittsburgh and Allegheny County Sports and Exhibition Authority, Pennsylvania, Sales Tax | 8/20 at 100.00 | A1 | 3,445,974 |
| | Revenue Bonds, Refunding Series 2010, 5.000%, 2/01/31 – AGM Insured | | | |
| 1,125 | | Scranton, Pennsylvania, Sewer Authority Revenue Bonds, Series 2011A, 5.250%, 12/01/31 | 12/21 at 100.00 | AA (4) | 1,206,506 |
| | (Pre-refunded 12/01/21) – AGM Insured | | | |
| 1,930 | | Susquehanna Area Regional Airport Authority, Pennsylvania, Airport System Revenue Bonds, | 1/23 at 100.00 | BB+ | 1,826,398 |
| | Series 2012B, 4.000%, 1/01/33 | | | |
| 190,357 | | Total Pennsylvania | | | 203,892,384 |
96
| | | | | | |
| Principal | | | Optional Call | | |
| Amount (000) | | Description (1) | Provisions (2) | Ratings (3) | Value |
| | Puerto Rico – 0.7% (0.4% of Total Investments) | | | |
| $ 3,997 | | Puerto Rico Urgent Interest Fund Corp (COFINA), National Custodial Taxable Trust Unit, | | | |
| | Series 2007 Sr. Bond, 0.000%, 8/01/54 | No Opt. Call | N/R | $ 749,031 |
| 625 | | Puerto Rico Electric Power Authority, Power Revenue Bonds, Refunding Series 2005SS, | 6/20 at 100.00 | D | 626,819 |
| | 5.000%, 7/01/25 – NPFG Insured | | | |
| 1,000 | | Puerto Rico Electric Power Authority, Power Revenue Bonds, Series 2007VV, 5.250%, | No Opt. Call | D | 1,028,090 |
| | 7/01/24 – NPFG Insured | | | |
| 1,305 | | Puerto Rico Highway and Transportation Authority, Highway Revenue Bonds, Series 2005L, | No Opt. Call | Baa2 | 1,338,852 |
| | 5.250%, 7/01/23 – NPFG Insured | | | |
| 1,000 | | Puerto Rico Highway and Transportation Authority, Highway Revenue Bonds, Series 2007N, | No Opt. Call | C | 1,075,780 |
| | 5.250%, 7/01/31 – AMBAC Insured | | | |
| 4,300 | | Puerto Rico Housing Finance Authority, Capital Fund Program Revenue Bonds, Series 2003, | 6/20 at 100.00 | A2 | 4,399,158 |
| | 4.500%, 12/01/23 | | | |
| | Puerto Rico Sales Tax Financing Corporation, Sales Tax Revenue Bonds, Restructured 2018A-1: | | | |
| 5,220 | | 4.550%, 7/01/40 | 7/28 at 100.00 | N/R | 4,818,164 |
| 9,192 | | 5.000%, 7/01/58 | 7/28 at 100.00 | N/R | 8,636,528 |
| | Puerto Rico Sales Tax Financing Corporation, Sales Tax Revenue Bonds, Taxable | | | |
| | Restructured Cofina Project Series 2019A-2: | | | |
| 621 | | 4.329%, 7/01/40 | 7/28 at 100.00 | N/R | 556,118 |
| 5,272 | | 4.329%, 7/01/40 | 7/28 at 100.00 | N/R | 4,721,181 |
| 32,532 | | Total Puerto Rico | | | 27,949,721 |
| | Rhode Island – 0.6% (0.4% of Total Investments) | | | |
| 1,315 | | Rhode Island Health and Educational Building Corporation, Hospital Financing Revenue | 5/26 at 100.00 | BBB+ | 1,366,574 |
| | Bonds, Lifespan Obligated Group, Refunding Series 2016, 5.000%, 5/15/39 | | | |
| 174,390 | | Rhode Island Tobacco Settlement Financing Corporation, Tobacco Settlement Asset-Backed�� | 5/20 at 15.05 | CCC– | 21,737,713 |
| | Bonds, Series 2007A, 0.000%, 6/01/52 | | | |
| 2,235 | | Rhode Island Turnpike and Bridge Authority, Motor Fuel Tax Revenue Bonds, Series 2016A, | 4/26 at 100.00 | A | 2,568,753 |
| | 5.000%, 10/01/40 | | | |
| 177,940 | | Total Rhode Island | | | 25,673,040 |
| | South Carolina – 3.9% (2.4% of Total Investments) | | | |
| 3,050 | | Charleston County Airport District, South Carolina, Airport Revenue Bonds, Series 2019, | 7/29 at 100.00 | A+ | 3,536,109 |
| | 5.000%, 7/01/43 | | | |
| | Lexington County Health Services District, Inc, South Carolina, Hospital Revenue Bonds, | | | |
| | Lexington Medical Center, Series 2016: | | | |
| 1,290 | | 5.000%, 11/01/41 | 5/26 at 100.00 | A | 1,404,126 |
| 6,820 | | 5.000%, 11/01/46 | 5/26 at 100.00 | A | 7,355,029 |
| | Piedmont Municipal Power Agency, South Carolina, Electric Revenue Bonds, Series 2004A-2: | | | |
| 26,955 | | 0.000%, 1/01/31 – AMBAC Insured | No Opt. Call | A– | 20,696,049 |
| 15,420 | | 0.000%, 1/01/32 – AMBAC Insured | No Opt. Call | A– | 11,384,278 |
| 1,370 | | South Carolina Jobs-Economic Development Authority, Economic Development Revenue Bonds, | 4/26 at 103.00 | BBB– | 1,381,700 |
| | Bishop Gadsden Episcopal Retirement Community, Series 2019A, 5.000%, 4/01/54 | | | |
| | South Carolina Jobs-Economic Development Authority, Hospital Revenue Bonds, McLeod | | | |
| | Health Projects, Refunding & Improvement Series 2018: | | | |
| 19,130 | | 5.000%, 11/01/43 | 5/28 at 100.00 | AA– | 21,586,292 |
| 6,000 | | 5.000%, 11/01/48 | 5/28 at 100.00 | AA– | 6,720,480 |
| 375 | | South Carolina Jobs-Economic Development Authority, Hospital Revenue Bonds, Palmetto | 8/21 at 100.00 | AA (4) | 400,912 |
| | Health, Refunding Series 2011A, 6.500%, 8/01/39 (Pre-refunded 8/01/21) – AGM Insured | | | |
| 10,000 | | South Carolina Public Service Authority Santee Cooper Revenue Obligations, Refunding | 12/26 at 100.00 | A– | 10,560,400 |
| | Series 2016B, 5.000%, 12/01/56 | | | |
| 20,035 | | South Carolina Public Service Authority, Santee Cooper Revenue Obligations, Refunding & | 6/25 at 100.00 | A– | 20,968,030 |
| | Improvement Series 2015A, 5.000%, 12/01/50 | | | |
| | South Carolina Public Service Authority, Santee Cooper Revenue Obligations, Refunding | | | |
| | Series 2014C: | | | |
| 3,850 | | 5.000%, 12/01/39 | 12/24 at 100.00 | A– | 4,052,240 |
| 4,000 | | 5.000%, 12/01/46 | 12/24 at 100.00 | A– | 4,176,240 |
97
| | | | | |
| NEA | Nuveen AMT-Free Quality Municipal Income Fund | |
| Portfolio of Investments (continued) | | | |
| April 30, 2020 (Unaudited) | | | |
|
|
|
|
| Principal | | | Optional Call | | |
| Amount (000) | | Description (1) | Provisions (2) | Ratings (3) | Value |
| | South Carolina (continued) | | | |
| $ 6,790 | | South Carolina Public Service Authority, Santee Cooper Revenue Obligations, Series | 12/23 at 100.00 | A– | $ 7,071,378 |
| | 2013A, 5.125%, 12/01/43 | | | |
| | South Carolina Public Service Authority, Santee Cooper Revenue Obligations, Series 2014A: | | | |
| 2,000 | | 5.000%, 12/01/49 | 6/24 at 100.00 | A– | 2,076,700 |
| 17,240 | | 5.500%, 12/01/54 | 6/24 at 100.00 | A– | 18,291,640 |
| 7,500 | | South Carolina State Ports Authority, Revenue Bonds, Series 2019A, 5.000%, 7/01/54 | 7/29 at 100.00 | A+ | 8,460,750 |
| 4,500 | | Spartanburg Regional Health Services District, Inc, Hospital Revenue Bonds, Refunding | 4/22 at 100.00 | A3 | 4,678,470 |
| | Series 2012A, 5.000%, 4/15/32 | | | |
| 156,325 | | Total South Carolina | | | 154,800,823 |
| | South Dakota – 0.8% (0.5% of Total Investments) | | | |
| | Sioux Falls, South Dakota, Health Facilities Revenue Bonds, Dow Rummel Village Project, | | | |
| | Series 2017: | | | |
| 3,000 | | 5.000%, 11/01/42 | 11/26 at 100.00 | BB | 2,789,460 |
| 3,150 | | 5.125%, 11/01/47 | 11/26 at 100.00 | BB | 2,920,554 |
| 8,800 | | South Dakota Health and Educational Facilities Authority, Revenue Bonds, Avera Health | 7/24 at 100.00 | A1 | 9,379,744 |
| | System, Series 2014, 5.000%, 7/01/44 | | | |
| 4,930 | | South Dakota Health and Educational Facilities Authority, Revenue Bonds, Avera Health, | 7/27 at 100.00 | A1 | 5,451,002 |
| | Refunding Series 2017, 5.000%, 7/01/46 | | | |
| 3,565 | | South Dakota Health and Educational Facilities Authority, Revenue Bonds, Sanford Health, | 11/24 at 100.00 | A2 | 3,785,638 |
| | Series 2014B, 5.000%, 11/01/44 | | | |
| 8,260 | | South Dakota Health and Educational Facilities Authority, Revenue Bonds, Sanford Health, | 11/25 at 100.00 | A2 | 8,866,615 |
| | Series 2015, 5.000%, 11/01/45 | | | |
| 31,705 | | Total South Dakota | | | 33,193,013 |
| | Tennessee – 1.0% (0.6% of Total Investments) | | | |
| 10,670 | | Chattanooga Health, Educational and Housing Facility Board, Tennessee, Revenue Bonds, | 1/23 at 100.00 | BBB+ (4) | 11,862,479 |
| | Catholic Health Initiatives, Series 2013A, 5.250%, 1/01/45 (Pre-refunded 1/01/23) | | | |
| 2,180 | | Greeneville Health and Educational Facilities Board, Tennessee, Hospital Revenue Bonds, | 7/28 at 100.00 | Baa1 | 2,477,134 |
| | Ballad Health, Series 2018A, 5.000%, 7/01/35 | | | |
| 2,065 | | Johnson City Health and Educational Facilities Board, Tennessee, Hospital Revenue Bonds, | 8/22 at 100.00 | Baa1 | 2,135,396 |
| | Mountain States Health Alliance, Series 2012A, 5.000%, 8/15/42 | | | |
| 75 | | Johnson City Health and Educational Facilities Board, Tennessee, Hospital Revenue | 7/23 at 100.00 | N/R (4) | 76,285 |
| | Refunding and Improvement Bonds, Johnson City Medical Center, Series 1998C, 5.125%, 7/01/25 | | | |
| | (Pre-refunded 7/01/23) – NPFG Insured | | | |
| | Knox County Health, Educational and Housing Facilities Board, Tennessee, Revenue Bonds, | | | |
| | University Health System, Inc, Series 2016: | | | |
| 5,000 | | 5.000%, 9/01/36 | 9/26 at 100.00 | BBB | 5,433,300 |
| 1,000 | | 5.000%, 9/01/47 | 9/26 at 100.00 | BBB | 1,055,480 |
| | Knox County Health, Educational and Housing Facilities Board, Tennessee, Revenue Bonds, | | | |
| | University Health System, Inc, Series 2017: | | | |
| 445 | | 5.000%, 4/01/31 | 4/27 at 100.00 | BBB | 502,107 |
| 1,745 | | 5.000%, 4/01/36 | 4/27 at 100.00 | BBB | 1,910,915 |
| | Metropolitan Government of Nashville-Davidson County Health and Educational Facilities | | | |
| | Board, Tennessee, Revenue Bonds, Lipscomb University, Refunding & Improvement Series 2016A: | | | |
| 2,225 | | 5.000%, 10/01/41 | 10/26 at 100.00 | BBB | 2,318,294 |
| 1,000 | | 5.000%, 10/01/45 | 10/26 at 100.00 | BBB | 1,035,610 |
| 11,000 | | Metropolitan Government of Nashville-Davidson County Health and Educational Facilities | 7/26 at 100.00 | Aa1 | 11,863,500 |
| | Board, Tennessee, Revenue Bonds, Vanderbilt University Medical Center, Series 2016A, | | | |
| | 5.000%, 7/01/46 | | | |
| 37,405 | | Total Tennessee | | | 40,670,500 |
| | Texas – 12.4% (7.8% of Total Investments) | | | |
| 18,000 | | Arlington, Texas, Special Tax Revenue Bonds, Senior Lien Series 2018A, 5.000%, 2/15/48 – | 2/28 at 100.00 | A1 | 20,007,360 |
| | AGM Insured | | | |
| 14,615 | | Austin, Texas, Electric Utility System Revenue Bonds, Refunding Series 2015A, 5.000%, | 11/25 at 100.00 | Aa3 | 16,613,017 |
| | 11/15/45 (UB) (6) | | | |
98
| | | | | | |
| Principal | | | Optional Call | | |
| Amount (000) | | Description (1) | Provisions (2) | Ratings (3) | Value |
| | Texas (continued) | | | |
| $ 1,000 | | Cedar Hill Independent School District, Dallas County, Texas, General Obligation Bonds, | No Opt. Call | Baa2 | $ 739,760 |
| | Refunding Series 2002, 0.000%, 8/15/32 – FGIC Insured | | | |
| 1,330 | | Central Texas Regional Mobility Authority, Revenue Bonds, Refunding Senior Lien Series | 1/23 at 100.00 | Baa1 | 1,376,789 |
| | 2013A, 5.000%, 1/01/43 | | | |
| | Central Texas Regional Mobility Authority, Revenue Bonds, Senior Lien Series 2011: | | | |
| 2,080 | | 5.750%, 1/01/31 (Pre-refunded 1/01/21) | 1/21 at 100.00 | Baa1 (4) | 2,148,578 |
| 1,000 | | 6.000%, 1/01/41 (Pre-refunded 1/01/21) | 1/21 at 100.00 | Baa1 (4) | 1,034,330 |
| 6,940 | | 6.250%, 1/01/46 (Pre-refunded 1/01/21) | 1/21 at 100.00 | Baa1 (4) | 7,189,632 |
| 7,750 | | Central Texas Regional Mobility Authority, Revenue Bonds, Senior Lien, Series 2015A, | 7/25 at 100.00 | Baa1 | 8,203,840 |
| | 5.000%, 1/01/45 | | | |
| | Clifton Higher Education Finance Corporation, Texas, Education Revenue Bonds, Uplift | | | |
| | Education Charter School, Series 2013A: | | | |
| 1,925 | | 4.350%, 12/01/42 | 12/22 at 100.00 | BBB– | 1,786,535 |
| 1,000 | | 4.400%, 12/01/47 | 12/22 at 100.00 | BBB– | 916,570 |
| 2,500 | | Comal Independent School District, Comal, Bexar, Guadalupe, Hays, and Kendall Counties, | No Opt. Call | Aaa | 2,422,425 |
| | Texas, General Obligation Bonds, Series 2005A, 0.000%, 2/01/23 | | | |
| 6,340 | | Dallas-Fort Worth International Airport, Texas, Joint Revenue Bonds, Refunding & | 11/21 at 100.00 | A+ | 6,548,142 |
| | Improvement Series 2012C, 5.000%, 11/01/45 | | | |
| 160 | | Decatur Hospital Authority, Texas, Revenue Bonds, Wise Regional Health System, Series | 9/24 at 100.00 | BBB– | 166,605 |
| | 2014A, 5.250%, 9/01/44 | | | |
| 3,700 | | El Paso Independent School District, El Paso County, Texas, General Obligation Bonds, | 8/26 at 100.00 | Aaa | 4,336,992 |
| | School Building Series 2017, 5.000%, 8/15/42 | | | |
| 1,500 | | El Paso, Texas, Airport Revenue Bonds, El Paso International Airport Series 2011, | 8/20 at 100.00 | A | 1,518,900 |
| | 5.250%, 8/15/33 | | | |
| 11,875 | | Grand Parkway Transportation Corporation, Texas, System Toll Revenue Bonds, Refunding | 4/30 at 100.00 | A2 | 12,582,037 |
| | First Tier Series 2020C, 4.000%, 10/01/49 | | | |
| | Grand Parkway Transportation Corporation, Texas, System Toll Revenue Bonds, Subordinate | | | |
| | Lien Series 2013B: | | | |
| 15,000 | | 5.000%, 4/01/53 (Pre-refunded 10/01/23) (UB) (6) | 10/23 at 100.00 | AA (4) | 17,097,600 |
| 16,920 | | 5.000%, 4/01/53 (Pre-refunded 10/01/23) | 10/23 at 100.00 | AA (4) | 19,286,093 |
| 5,295 | | Grand Parkway Transportation Corporation, Texas, System Toll Revenue Bonds, Subordinate | 4/28 at 100.00 | AA | 6,153,637 |
| | Lien Series 2018A Tela Supported, 5.000%, 10/01/48 | | | |
| 6,610 | | Grand Parkway Transportation Corporation, Texas, System Toll Revenue Bonds, Tender | 10/23 at 100.00 | AA | 10,308,493 |
| | Option Bond Trust 2015-XF0228, 17.628%, 11/01/44, 144A (Pre-refunded 10/01/23) (IF) (6) | | | |
| | Harris County Cultural Education Facilities Finance Corporation, Texas, Revenue Bonds, | | | |
| | Houston Methodist Hospital System, Series 2015: | | | |
| 2,845 | | 4.000%, 12/01/45 | 6/25 at 100.00 | AA | 2,987,705 |
| 2,320 | | 5.000%, 12/01/45 | 6/25 at 100.00 | AA | 2,597,286 |
| | Harris County, Texas, Toll Road Revenue Bonds, Refunding Senior Lien Series 2018A: | | | |
| 13,890 | | 5.000%, 8/15/43 | 2/28 at 100.00 | Aa2 | 16,372,837 |
| 2,000 | | 4.000%, 8/15/48 | 2/28 at 100.00 | Aa2 | 2,179,060 |
| 4,040 | | Harris County, Texas, Toll Road Revenue Bonds, Subordinate Lien Unlimited Tax Tender | No Opt. Call | AAA | 7,632,934 |
| | Options Bond Trust 2015-XF2184 13.995%, 8/15/28 – AGM Insured, 144A (IF) (6) | | | |
| | Harris County-Houston Sports Authority, Texas, Revenue Bonds, Capital Appreciation | | | |
| | Refunding Senior Lien Series 2014A: | | | |
| 1,195 | | 0.000%, 11/15/41 – AGM Insured | 11/31 at 62.66 | A2 | 485,708 |
| 2,390 | | 0.000%, 11/15/42 – AGM Insured | 11/31 at 59.73 | A2 | 923,042 |
| 2,660 | | 0.000%, 11/15/43 – AGM Insured | 11/31 at 56.93 | A2 | 975,582 |
| 7,260 | | 0.000%, 11/15/44 – AGM Insured | 11/31 at 54.25 | A2 | 2,528,803 |
| 10,440 | | 0.000%, 11/15/45 – AGM Insured | 11/31 at 51.48 | A2 | 3,439,458 |
| 7,165 | | 0.000%, 11/15/49 – AGM Insured | 11/31 at 41.91 | A2 | 1,895,429 |
| 3,000 | | 0.000%, 11/15/52 – AGM Insured | 11/31 at 35.81 | A2 | 671,610 |
| | Houston, Texas, Airport System Revenue Bonds, Refunding & Subordinate Lien Series 2018B: | | | |
| 2,000 | | 5.000%, 7/01/43 | 7/28 at 100.00 | A | 2,261,740 |
| 2,710 | | 5.000%, 7/01/48 | 7/28 at 100.00 | A | 3,046,826 |
99
| | | | | |
| NEA | Nuveen AMT-Free Quality Municipal Income Fund | |
| Portfolio of Investments (continued) | | | |
| April 30, 2020 (Unaudited) | | | |
|
|
|
|
| Principal | | | Optional Call | | |
| Amount (000) | | Description (1) | Provisions (2) | Ratings (3) | Value |
| | Texas (continued) | | | |
| $ 4,550 | | Houston, Texas, Airport System Revenue Bonds, Refunding Subordinate Lien Series 2012B, | 7/22 at 100.00 | A | $ 4,809,850 |
| | 5.000%, 7/01/31 | | | |
| 990 | | Houston, Texas, Airport System Revenue Bonds, Subordinate Lien Series 2000B, 5.450%, | No Opt. Call | A | 1,096,197 |
| | 7/01/24 – AGM Insured | | | |
| 6,000 | | Houston, Texas, Combined Utility System Revenue Bonds, First Lien Series 2011D, 5.000%, | 11/21 at 100.00 | AA (4) | 6,390,180 |
| | 11/15/40 (Pre-refunded 11/15/21) | | | |
| | Houston, Texas, Hotel Occupancy Tax and Special Revenue Bonds, Convention and | | | |
| | Entertainment Project, Series 2001B: | | | |
| 1,495 | | 0.000%, 9/01/23 – AGM Insured | No Opt. Call | A2 | 1,405,046 |
| 10,850 | | 0.000%, 9/01/25 – AMBAC Insured | No Opt. Call | A | 9,592,810 |
| 1,715 | | 0.000%, 9/01/32 – AMBAC Insured | No Opt. Call | A | 1,163,422 |
| 2,870 | | Hutto Independent School District, Williamson County, Texas, General Obligation Bonds, | 8/21 at 100.00 | A+ | 2,997,055 |
| | Refunding Series 2012A, 5.000%, 8/01/46 | | | |
| 2,340 | | Laredo, Webb County, Texas, Waterworks and Sewer System Revenue Bonds, Series 2011, | 3/21 at 100.00 | Aa3 (4) | 2,423,210 |
| | 5.000%, 3/01/41 (Pre-refunded 3/01/21) – AGM Insured | | | |
| | Leander Independent School District, Williamson and Travis Counties, Texas, General | | | |
| | Obligation Bonds, Refunding Series 2015A: | | | |
| 2,725 | | 5.000%, 8/15/40 | 8/25 at 100.00 | AAA | 3,152,879 |
| 4,000 | | 4.000%, 8/15/41 | 8/25 at 100.00 | AAA | 4,275,880 |
| 3,000 | | Love Field Airport Modernization Corporation, Texas, Special Facilities Revenue Bonds, | 11/20 at 100.00 | BBB | 3,000,390 |
| | Southwest Airlines Company, Series 2010, 5.250%, 11/01/40 | | | |
| 8,305 | | Lower Colorado River Authority, Texas, Transmission Contract Revenue Bonds, LCRA | 5/25 at 100.00 | A | 9,298,444 |
| | Transmission Services Corporation Project, Refunding Series 2015, 5.000%, 5/15/45 | | | |
| | McCamey County Hospital District, Texas, General Obligation Bonds, Series 2013: | | | |
| 1,780 | | 5.750%, 12/01/33 | 12/25 at 100.00 | B1 | 1,914,372 |
| 1,800 | | 6.125%, 12/01/38 | 12/25 at 100.00 | B1 | 1,937,394 |
| | Midtown Redevelopment Authority, Texas, Tax Increment Contract Revenue, Refunding | | | |
| | Series 2017: | | | |
| 16,285 | | 5.000%, 1/01/36 | 1/27 at 100.00 | A3 | 18,739,149 |
| 10,040 | | 5.000%, 1/01/38 – AGM Insured | 1/27 at 100.00 | A2 | 11,556,241 |
| | Montgomery County Toll Road Authority, Texas, Toll Road Revenue Bonds, Senior Lien | | | |
| | Series 2018: | | | |
| 2,100 | | 5.000%, 9/15/43 | 9/25 at 100.00 | BBB– | 2,143,176 |
| 1,815 | | 5.000%, 9/15/48 | 9/25 at 100.00 | BBB– | 1,841,318 |
| 850 | | New Hope Cultural Education Facilities Finance Corporation, Texas, Retirement Facility | 11/24 at 102.00 | BB+ | 813,348 |
| | Revenue Bonds, Methodist Retirement Communities Crestview Project, Series 2016, | | | |
| | 5.000%, 11/15/31 | | | |
| 4,290 | | North Fort Bend Water Authority, Texas, Water System Revenue Bonds, Series 2011, 5.000%, | 12/21 at 100.00 | A2 | 4,548,430 |
| | 12/15/36 – AGM Insured | | | |
| | North Texas Tollway Authority, Special Projects System Revenue Bonds, Convertible | | | |
| | Capital Appreciation Series 2011C: | | | |
| 1,880 | | 0.000%, 9/01/43 (Pre-refunded 9/01/31) (5) | 9/31 at 100.00 | N/R (4) | 2,416,514 |
| 7,990 | | 0.000%, 9/01/45 (Pre-refunded 9/01/31) (5) | 9/31 at 100.00 | N/R (4) | 11,158,035 |
| 4,000 | | North Texas Tollway Authority, System Revenue Bonds, Refunding First Tier Capital | 1/25 at 100.00 | A+ | 4,660,000 |
| | Appreciation Series 2008I, 6.500%, 1/01/43 | | | |
| 2,125 | | North Texas Tollway Authority, System Revenue Bonds, Refunding First Tier, Series 2008D, | No Opt. Call | A1 | 1,832,345 |
| | 0.000%, 1/01/28 – AGC Insured | | | |
| | North Texas Tollway Authority, System Revenue Bonds, Refunding First Tier, Series 2015B: | | | |
| 10,260 | | 5.000%, 1/01/40 | 1/23 at 100.00 | A+ | 10,848,719 |
| 12,205 | | 5.000%, 1/01/45 | 1/25 at 100.00 | A+ | 13,283,190 |
| 5,000 | | North Texas Tollway Authority, System Revenue Bonds, Refunding Second Tier Series 2018, | 1/28 at 100.00 | A | 5,535,800 |
| | 5.000%, 1/01/48 | | | |
| | North Texas Tollway Authority, System Revenue Bonds, Refunding Second Tier, Series 2015A: | | | |
| 6,285 | | 5.000%, 1/01/33 | 1/25 at 100.00 | A | 6,984,772 |
| 4,000 | | 5.000%, 1/01/34 | 1/25 at 100.00 | A | 4,436,080 |
| 4,000 | | 5.000%, 1/01/35 | 1/25 at 100.00 | A | 4,424,920 |
100
| | | | | | |
| Principal | | | Optional Call | | |
| Amount (000) | | Description (1) | Provisions (2) | Ratings (3) | Value |
| | Texas (continued) | | | |
| $ 2,250 | | Red River Education Finance Corporation, Texas, Higher Education Revenue Bonds, Saint | 6/26 at 100.00 | BBB | $ 2,092,838 |
| | Edward?s University Project, Series 2016, 4.000%, 6/01/36 | | | |
| 3,170 | | Southwest Higher Education Authority Inc, Texas, Revenue Bonds, Southern Methodist | 10/20 at 100.00 | AA– (4) | 3,226,901 |
| | University, Series 2010, 5.000%, 10/01/41 (Pre-refunded 10/01/20) | | | |
| 2,410 | | Tarrant County Cultural Education Facilities Finance Corporation, Texas, Hospital | 11/21 at 100.00 | AA– (4) | 2,560,987 |
| | Revenue Bonds, Baylor Health Care System, Series 2011A, 5.000%, 11/15/30 | | | |
| | (Pre-refunded 11/15/21) | | | |
| 3,480 | | Tarrant County Cultural Education Facilities Finance Corporation, Texas, Hospital | 9/23 at 100.00 | A | 3,700,702 |
| | Revenue Bonds, Hendrick Medical Center, Refunding Series 2013, 5.500%, 9/01/43 | | | |
| 430 | | Tarrant County Cultural Education Facilities Finance Corporation, Texas, Hospital | 8/20 at 100.00 | N/R (4) | 435,784 |
| | Revenue Bonds, Scott & White Healthcare Project, Series 2010, 5.500%, 8/15/45 | | | |
| | (Pre-refunded 8/15/20) | | | |
| 4,000 | | Tarrant County Cultural Education Facilities Finance Corporation, Texas, Hospital | 8/23 at 100.00 | AA– | 4,259,440 |
| | Revenue Bonds, Scott & White Healthcare Project, Series 2013A, 5.000%, 8/15/43 | | | |
| 2,500 | | Tarrant County Cultural Education Facilities Finance Corporation, Texas, Revenue Bonds, | 8/26 at 100.00 | AA | 2,832,525 |
| | Texas Health Resources System, Series 2016A, 5.000%, 2/15/41 | | | |
| | Texas Municipal Gas Acquisition and Supply Corporation III, Gas Supply Revenue Bonds, | | | |
| | Series 2012: | | | |
| 14,815 | | 5.000%, 12/15/27 | 12/22 at 100.00 | BBB+ | 15,500,194 |
| 7,925 | | 5.000%, 12/15/28 | 12/22 at 100.00 | BBB+ | 8,272,828 |
| 6,550 | | 5.000%, 12/15/30 | 12/22 at 100.00 | BBB+ | 6,814,554 |
| 2,340 | | 5.000%, 12/15/32 | 12/22 at 100.00 | BBB+ | 2,420,426 |
| 2,500 | | Texas State, General Obligation Bonds, Transportation Commission Highway Improvement | 4/22 at 100.00 | AAA | 2,704,900 |
| | Series 2012A, 5.000%, 4/01/31 (Pre-refunded 4/01/22) | | | |
| 17,760 | | Texas Transportation Commission, Central Texas Turnpike System Revenue Bonds, Refunding | 8/22 at 100.00 | A3 (4) | 19,454,837 |
| | First Tier Series 2012A, 5.000%, 8/15/41 (Pre-refunded 8/15/22) | | | |
| 7,345 | | Texas Transportation Commission, Central Texas Turnpike System Revenue Bonds, Refunding | 8/24 at 100.00 | A3 | 7,948,171 |
| | First Tier Series 2015B, 5.000%, 8/15/37 | | | |
| | Texas Transportation Commission, Central Texas Turnpike System Revenue Bonds, Refunding | | | |
| | Second Tier Series 2015C: | | | |
| 3,650 | | 5.000%, 8/15/33 | 8/24 at 100.00 | Baa1 | 3,824,214 |
| 6,385 | | 5.000%, 8/15/37 | 8/24 at 100.00 | Baa1 | 6,628,460 |
| 44,120 | | 5.000%, 8/15/42 | 8/24 at 100.00 | Baa1 | 45,749,352 |
| 4,000 | | Texas Turnpike Authority, Central Texas Turnpike System Revenue Bonds, First Tier Series | No Opt. Call | A3 | 3,555,480 |
| | 2002A, 0.000%, 8/15/25 – AMBAC Insured | | | |
| 8,000 | | Texas Water Development Board, State Water Implementation Revenue Fund Bonds, Master | 10/29 at 100.00 | AAA | 8,879,280 |
| | Trust Series 2019A, 4.000%, 10/15/54 | | | |
| 1,550 | | West Harris County Regional Water Authority, Texas, Water System Revenue Bonds, | 12/29 at 100.00 | A1 | 1,733,629 |
| | Refunding Series 2019C, 4.000%, 12/15/45 | | | |
| 480,180 | | Total Texas | | | 499,710,023 |
| | Utah – 0.4% (0.3% of Total Investments) | | | |
| | Salt Lake City, Utah, Airport Revenue Bonds, International Airport Series 2017B: | | | |
| 3,560 | | 5.000%, 7/01/42 | 7/27 at 100.00 | A2 | 3,965,163 |
| 1,975 | | 5.000%, 7/01/47 | 7/27 at 100.00 | A2 | 2,183,817 |
| 4,000 | | Salt Lake City, Utah, Airport Revenue Bonds, International Airport Series 2018B, | 7/28 at 100.00 | A2 | 4,472,840 |
| | 5.000%, 7/01/48 | | | |
| | Utah Charter School Finance Authority, Charter School Revenue Bonds, Utah Charter | | | |
| | Academies Project, Series 2018: | | | |
| 1,000 | | 5.000%, 10/15/38 | 10/27 at 100.00 | AA | 1,176,080 |
| 2,320 | | 5.000%, 10/15/43 | 10/27 at 100.00 | AA | 2,700,364 |
| 2,040 | | 5.000%, 10/15/48 | 10/27 at 100.00 | AA | 2,360,729 |
| 14,895 | | Total Utah | | | 16,858,993 |
101
| | | | | |
| NEA | Nuveen AMT-Free Quality Municipal Income Fund | |
| Portfolio of Investments (continued) | | | |
| April 30, 2020 (Unaudited) | | | |
|
|
|
|
| Principal | | | Optional Call | | |
| Amount (000) | | Description (1) | Provisions (2) | Ratings (3) | Value |
| | Vermont – 0.3% (0.2% of Total Investments) | | | |
| | University of Vermont and State Agricultural College, Revenue Bonds, Refunding Series 2015: | | | |
| $ 1,000 | | 4.000%, 10/01/40 | 10/25 at 100.00 | A+ | $ 1,048,660 |
| 10,000 | | 5.000%, 10/01/45 | 10/25 at 100.00 | A+ | 11,518,500 |
| 11,000 | | Total Vermont | | | 12,567,160 |
| | Virginia – 2.9% (1.8% of Total Investments) | | | |
| 430 | | Chesapeake, Virginia, Transportation System Senior Toll Road Revenue Bonds, Capital | 7/28 at 100.00 | BBB | 383,362 |
| | Appreciation Series 2012B, 0.000%, 7/15/40 (5) | | | |
| 4,000 | | Fairfax County Industrial Development Authority, Virginia, Healthcare Revenue Bonds, | 5/28 at 100.00 | Aa2 | 4,268,840 |
| | Inova Health System, Series 2018A, 4.000%, 5/15/48 (UB) (6) | | | |
| 1,800 | | Henrico County Economic Development Authority, Virginia, Revenue Bonds, Bon Secours | 11/22 at 100.00 | N/R (4) | 1,985,202 |
| | Health System Obligated Group, Series 2013, 5.000%, 11/01/30 (Pre-refunded 11/01/22) | | | |
| | Metropolitan Washington Airports Authority, Virginia, Dulles Toll Road Revenue Bonds, | | | |
| | Dulles Metrorail & Capital improvement Projects, Refunding & Subordinate Lien Series 2019B: | | | |
| 17,455 | | 4.000%, 10/01/44 | 10/29 at 100.00 | Baa2 | 17,081,288 |
| 9,750 | | 5.000%, 10/01/47 | 10/29 at 100.00 | Baa2 | 10,466,527 |
| 1,180 | | 4.000%, 10/01/53 | 10/29 at 100.00 | Baa2 | 1,125,555 |
| 11,960 | | Metropolitan Washington Airports Authority, Virginia, Dulles Toll Road Revenue Bonds, | 4/22 at 100.00 | Baa1 | 12,229,220 |
| | Dulles Metrorail & Capital Improvement Projects, Refunding Second Senior Lien Series 2014A, | | | |
| | 5.000%, 10/01/53 | | | |
| 7,000 | | Metropolitan Washington Airports Authority, Virginia, Dulles Toll Road Revenue Bonds, | No Opt. Call | A3 | 4,311,300 |
| | Dulles Metrorail & Capital improvement Projects, Second Senior Lien Series 2009B, 0.000%, | | | |
| | 10/01/36 – AGC Insured | | | |
| 32,000 | | Metropolitan Washington Airports Authority, Virginia, Dulles Toll Road Revenue Bonds, | 10/26 at 100.00 | A3 | 39,387,840 |
| | Dulles Metrorail & Capital improvement Projects, Second Senior Lien Series 2009C, 6.500%, | | | |
| | 10/01/41 – AGC Insured | | | |
| 18,000 | | Metropolitan Washington Airports Authority, Virginia, Dulles Toll Road Revenue Bonds, | 10/28 at 100.00 | Baa1 | 21,801,060 |
| | Dulles Metrorail Capital Appreciation, Second Senior Lien Series 2010B, 6.500%, 10/01/44 | | | |
| 2,000 | | Prince William County Industrial Development Authority, Virginia, Health Care Facilities | 11/22 at 100.00 | AA– | 2,062,140 |
| | Revenue Bonds, Novant Health Obligated Group-Prince William Hospital, Refunding Series 2013B, | | | |
| | 4.000%, 11/01/33 | | | |
| | Roanoke Industrial Development Authority, Virginia, Hospital Revenue Bonds, Carilion | | | |
| | Health System Obligated Group, Series 2005B: | | | |
| 5 | | 5.000%, 7/01/38 (Pre-refunded 7/01/20) | 7/20 at 100.00 | Aa3 (4) | 5,034 |
| 245 | | 5.000%, 7/01/38 | 7/20 at 100.00 | Aa3 | 246,666 |
| 105,825 | | Total Virginia | | | 115,354,034 |
| | Washington – 3.2% (2.0% of Total Investments) | | | |
| 7,000 | | Central Puget Sound Regional Transit Authority, Washington, Sales Tax and Motor Vehicle | 11/26 at 100.00 | Aa1 | 8,054,830 |
| | Excise Tax Bonds, Green Series 2016S-1, 5.000%, 11/01/41 | | | |
| 12,235 | | Chelan County Public Utility District 1, Washington, Columbia River-Rock Island | No Opt. Call | Aa3 | 10,951,426 |
| | Hydro-Electric System Revenue Refunding Bonds, Series 1997A, 0.000%, 6/01/26 – NPFG Insured | | | |
| 8,075 | | King County Public Hospital District 1, Washington, Limited Tax General Obligation | 12/28 at 100.00 | A2 | 9,273,653 |
| | Bonds, Refunding Series 2018, 5.000%, 12/01/43 | | | |
| 4,200 | | King County Public Hospital District 1, Washington, Limited Tax General Obligation | 12/26 at 100.00 | A– | 4,725,210 |
| | Bonds, Valley Medical Center, Refunding Series 2016, 5.000%, 12/01/36 | | | |
| 8,405 | | King County Public Hospital District 2, Washington, General Obligation Bonds, | 12/29 at 100.00 | Aa3 | 8,942,248 |
| | EvergreenHealth, Limited Tax 2020A, 4.000%, 12/01/45 | | | |
| 15,000 | | King County, Washington, Sewer Revenue Bonds, Refunding Series 2012, 5.000%, 1/01/52 | 1/22 at 100.00 | AA+ | 15,790,050 |
| 3,000 | | Port of Seattle, Washington, Revenue Bonds, Intermediate Lien Series 2015A, | 10/24 at 100.00 | A+ | 3,235,620 |
| | 5.000%, 4/01/40 | | | |
| 1,250 | | Seattle Housing Authority, Washington, Pooled Housing Revenue Bonds, Refunding Series | 12/23 at 100.00 | AA (4) | 1,430,850 |
| | 2014, 5.000%, 12/01/44 (Pre-refunded 12/01/23) | | | |
| 12,515 | | Spokane Public Facilities District, Washington, Hotel, Motel, and Sales Use Tax Revenue | 6/23 at 100.00 | A | 12,815,110 |
| | Bonds, Series 2013A, 5.000%, 12/01/38 | | | |
102
| | | | | | |
| Principal | | | Optional Call | | |
| Amount (000) | | Description (1) | Provisions (2) | Ratings (3) | Value |
| | Washington (continued) | | | |
| $ 5,250 | | Tacoma, Washington, Sewer Revenue Bonds, Series 2018, 4.000%, 12/01/48 | 12/28 at 100.00 | Aa2 | $ 5,785,500 |
| 8,310 | | Washington Health Care Facilities Authority, Revenue Bonds, Fred Hutchinson Cancer | 1/21 at 100.00 | A2 | 8,447,198 |
| | Research Center, Series 2011A, 5.625%, 1/01/35 | | | |
| 4,415 | | Washington Health Care Facilities Authority, Revenue Bonds, Kadlec Regional Medical | 12/20 at 100.00 | N/R (4) | 4,536,633 |
| | Center, Series 2010, 5.500%, 12/01/39 (Pre-refunded 12/01/20) | | | |
| | Washington Health Care Facilities Authority, Revenue Bonds, Providence Health & | | | |
| | Services, Refunding Series 2012A: | | | |
| 4,000 | | 5.000%, 10/01/32 | 10/22 at 100.00 | AA– | 4,225,440 |
| 10,000 | | 4.250%, 10/01/40 | 10/22 at 100.00 | AA– | 10,192,900 |
| 3,135 | | Washington Health Care Facilities Authority, Revenue Bonds, Seattle Children’s Hospital, | 10/22 at 100.00 | Aa2 | 3,347,741 |
| | Refunding Series 2012B, 5.000%, 10/01/30 | | | |
| 8,230 | | Washington Health Care Facilities Authority, Revenue Bonds, Seattle Children’s Hospital, | 10/22 at 100.00 | Aa2 | 8,661,581 |
| | Series 2012A, 5.000%, 10/01/42 | | | |
| 2,325 | | Washington State Convention Center Public Facilities District, Lodging Tax Revenue | 7/28 at 100.00 | A– | 1,957,650 |
| | Bonds, Series 2018, 4.000%, 7/01/58 | | | |
| 500 | | Washington State Housing Finance Commission, Non-profit Housing Revenue Bonds, | 1/25 at 102.00 | BB | 427,940 |
| | Presbyterian Retirement Communities Northwest Project, Refunding Series 2016A, 5.000%, | | | |
| | 1/01/46, 144A | | | |
| 9,000 | | Washington State, Motor Vehicle Fuel Tax General Obligation Bonds, Series 2003C, 0.000%, | No Opt. Call | AA+ | 7,756,740 |
| | 6/01/28 – FGIC Insured | | | |
| 126,845 | | Total Washington | | | 130,558,320 |
| | West Virginia – 1.1% (0.7% of Total Investments) | | | |
| | West Virginia Hospital Finance Authority, Hospital Revenue Bonds, West Virginia United | | | |
| | Health System Obligated Group, Refunding & Improvement Series 2013A: | | | |
| 3,000 | | 5.375%, 6/01/38 | 6/23 at 100.00 | A | 3,186,060 |
| 16,845 | | 5.500%, 6/01/44 | 6/23 at 100.00 | A | 17,824,368 |
| 9,000 | | West Virginia Hospital Finance Authority, Hospital Revenue Bonds, West Virginia United | 6/28 at 100.00 | A | 9,717,570 |
| | Health System Obligated Group, Series 2018A, 5.000%, 6/01/52 | | | |
| 3,500 | | West Virginia Hospital Finance Authority, Revenue Bonds, West Virginia University Health | 6/27 at 100.00 | A | 3,843,665 |
| | System Obligated Group, Improvement Series 2017A, 5.000%, 6/01/42 | | | |
| 2,050 | | West Virginia State Building Commission, Lease Revenue Refunding Bonds, Regional Jail | No Opt. Call | N/R | 2,077,757 |
| | and Corrections Facility, Series 1998A, 5.375%, 7/01/21 – AMBAC Insured | | | |
| 5,750 | | West Virginia State, General Obligation Bonds, State Road Competitive Series 2018B, | 6/28 at 100.00 | AA– | 6,226,043 |
| | 4.000%, 6/01/42 | | | |
| 40,145 | | Total West Virginia | | | 42,875,463 |
103
| | | | | |
| NEA | Nuveen AMT-Free Quality Municipal Income Fund | |
| Portfolio of Investments (continued) | | | |
| April 30, 2020 (Unaudited) | | | |
|
|
|
|
| Principal | | | Optional Call | | |
| Amount (000) | | Description (1) | Provisions (2) | Ratings (3) | Value |
| | Wisconsin – 3.0% (1.9% of Total Investments) | | | |
| | Public Finance Authority of Wisconsin, Conference Center and Hotel Revenue Bonds, | | | |
| | Lombard Public Facilities Corporation, Second Tier Series 2018B: | | | |
| $ 43 | | 0.000%, 1/01/46, 144A | No Opt. Call | N/R | $ 931 |
| 42 | | 0.000%, 1/01/47, 144A | No Opt. Call | N/R | 880 |
| 42 | | 0.000%, 1/01/48, 144A | No Opt. Call | N/R | 858 |
| 42 | | 0.000%, 1/01/49, 144A | No Opt. Call | N/R | 831 |
| 41 | | 0.000%, 1/01/50, 144A | No Opt. Call | N/R | 783 |
| 45 | | 0.000%, 1/01/51, 144A | No Opt. Call | N/R | 839 |
| 1,163 | | 3.750%, 7/01/51, 144A | 3/28 at 100.00 | N/R | 738,006 |
| 45 | | 0.000%, 1/01/52, 144A | No Opt. Call | N/R | 798 |
| 44 | | 0.000%, 1/01/53, 144A | No Opt. Call | N/R | 769 |
| 44 | | 0.000%, 1/01/54, 144A | No Opt. Call | N/R | 740 |
| 43 | | 0.000%, 1/01/55, 144A | No Opt. Call | N/R | 711 |
| 43 | | 0.000%, 1/01/56, 144A | No Opt. Call | N/R | 686 |
| 42 | | 0.000%, 1/01/57, 144A | No Opt. Call | N/R | 659 |
| 42 | | 0.000%, 1/01/58, 144A | No Opt. Call | N/R | 631 |
| 42 | | 0.000%, 1/01/59, 144A | No Opt. Call | N/R | 612 |
| 41 | | 0.000%, 1/01/60, 144A | No Opt. Call | N/R | 586 |
| 41 | | 0.000%, 1/01/61, 144A | No Opt. Call | N/R | 558 |
| 40 | | 0.000%, 1/01/62, 144A | No Opt. Call | N/R | 537 |
| 40 | | 0.000%, 1/01/63, 144A | No Opt. Call | N/R | 515 |
| 39 | | 0.000%, 1/01/64, 144A | No Opt. Call | N/R | 500 |
| 39 | | 0.000%, 1/01/65, 144A | No Opt. Call | N/R | 477 |
| 39 | | 0.000%, 1/01/66, 144A | No Opt. Call | N/R | 444 |
| 501 | | 0.000%, 1/01/67, 144A | No Opt. Call | N/R | 5,339 |
| | Public Finance Authority, Wisconsin, Educational Revenue Bonds, Lake Norman Charter | | | |
| | School, Series 2018A: | | | |
| 6,000 | | 5.000%, 6/15/38, 144A | 6/26 at 100.00 | BBB– | 6,272,520 |
| 2,335 | | 5.000%, 6/15/48, 144A | 6/26 at 100.00 | BBB– | 2,409,066 |
| 4,100 | | University of Wisconsin Hospitals and Clinics Authority, Revenue Bonds, Refunding Series | 4/23 at 100.00 | AA– | 4,290,281 |
| | 2013A, 5.000%, 4/01/38 | | | |
| 1,015 | | Wisconsin Health and Educational Facilities Authority, Revenue Bonds, Froedtert Health | 10/22 at 100.00 | AA | 1,061,071 |
| | Inc Obligated Group, Series 2012A, 5.000%, 4/01/42 | | | |
| 18,410 | | Wisconsin Health and Educational Facilities Authority, Revenue Bonds, Marshfield Clinic | 2/27 at 100.00 | A– | 18,745,246 |
| | Health System, Inc, Series 2017C, 5.000%, 2/15/47 | | | |
| | Wisconsin Health and Educational Facilities Authority, Revenue Bonds, Marshfield Clinic, | | | |
| | Series 2012B: | | | |
| 1,000 | | 5.000%, 2/15/27 | 2/22 at 100.00 | A– | 1,044,710 |
| 1,000 | | 5.000%, 2/15/28 | 2/22 at 100.00 | A– | 1,043,750 |
| 4,735 | | 5.000%, 2/15/40 | 2/22 at 100.00 | A– | 4,873,309 |
| 2,000 | | Wisconsin Health and Educational Facilities Authority, Revenue Bonds, Marshfield Clinic, | 2/26 at 100.00 | A– | 2,147,760 |
| | Series 2016B, 5.000%, 2/15/35 | | | |
| 7,625 | | Wisconsin Health and Educational Facilities Authority, Revenue Bonds, Mercy Alliance, | 6/22 at 100.00 | A3 | 7,886,385 |
| | Inc, Series 2012, 5.000%, 6/01/39 | | | |
| 900 | | Wisconsin Health and Educational Facilities Authority, Revenue Bonds, Meriter Hospital | No Opt. Call | A1 | 950,103 |
| | Inc, Series 1992A, 6.000%, 12/01/22 – FGIC Insured | | | |
| 2,650 | | Wisconsin Health and Educational Facilities Authority, Revenue Bonds, Ministry Health | 8/22 at 100.00 | N/R (4) | 2,893,402 |
| | Care, Inc, Refunding 2012C, 5.000%, 8/15/32 (Pre-refunded 8/15/22) | | | |
| 1,000 | | Wisconsin Health and Educational Facilities Authority, Revenue Bonds, Gundersen | 10/21 at 100.00 | A1 | 1,013,220 |
| | Lutheran, Series 2011A, 5.250%, 10/15/39 | | | |
| 5,140 | | Wisconsin Health and Educational Facilities Authority, Wisconsin, Revenue Bonds, | 5/26 at 100.00 | Aa2 | 5,477,955 |
| | Ascension Health Alliance Senior Credit Group, Series 2016A, 4.000%, 11/15/34 | | | |
| 2,500 | | Wisconsin Health and Educational Facilities Authority, Wisconsin, Revenue Bonds, Aurora | 4/23 at 100.00 | Aa3 (4) | 2,800,300 |
| | Health Care, Inc, Series 2013A, 5.125%, 4/15/31 (Pre-refunded 4/15/23) | | | |
104
| | | | | | |
| Principal | | | Optional Call | | |
| Amount (000) | | Description (1) | Provisions (2) | Ratings (3) | Value |
| | Wisconsin (continued) | | | |
| | Wisconsin Health and Educational Facilities Authority, Wisconsin, Revenue Bonds, | | | |
| | Benevolent Corporation Cedar Community, Series 2017: | | | |
| $ 1,110 | | 5.000%, 6/01/37 | 6/25 at 103.00 | N/R | $ 974,036 |
| 955 | | 5.000%, 6/01/41 | 6/25 at 103.00 | N/R | 814,176 |
| | Wisconsin Health and Educational Facilities Authority, Wisconsin, Revenue Bonds, | | | |
| | Franciscan Sisters of Christian Charity Sponsored Ministry, Series 2017A: | | | |
| 1,000 | | 5.000%, 9/01/30 | 9/27 at 100.00 | BBB– | 1,114,000 |
| 1,110 | | 5.000%, 9/01/31 | 9/27 at 100.00 | BBB– | 1,229,935 |
| 1,100 | | 5.000%, 9/01/32 | 9/27 at 100.00 | BBB– | 1,207,734 |
| 1,725 | | 5.000%, 9/01/33 | 9/27 at 100.00 | BBB– | 1,885,563 |
| 1,775 | | 5.000%, 9/01/34 | 9/27 at 100.00 | BBB– | 1,934,377 |
| 1,910 | | 5.000%, 9/01/35 | 9/27 at 100.00 | BBB– | 2,067,174 |
| 2,065 | | 5.000%, 9/01/36 | 9/27 at 100.00 | BBB– | 2,227,268 |
| 8,500 | | Wisconsin Health and Educational Facilities Authority, Wisconsin, Revenue Bonds, | 2/26 at 100.00 | A– | 8,687,000 |
| | Marshfield Clinic, Series 2016A, 5.000%, 2/15/46 | | | |
| 5,000 | | Wisconsin Health and Educational Facilities Authority, Wisconsin, Revenue Bonds, Medical | 11/26 at 100.00 | AA– | 5,838,300 |
| | College of Wisconsin, Inc, Series 2016, 5.000%, 12/01/41 | | | |
| | Wisconsin Health and Educational Facilities Authority, Wisconsin, Revenue Bonds, Saint | | | |
| | John’s Communities Inc, Series 2018A: | | | |
| 2,500 | | 5.000%, 9/15/45 | 9/23 at 100.00 | BBB– | 2,263,500 |
| 5,455 | | 5.000%, 9/15/50 | 9/23 at 100.00 | BBB– | 4,856,096 |
| 10,230 | | Wisconsin Health and Educational Facilities Authority, Wisconsin, Revenue Bonds, | 12/24 at 100.00 | A1 | 10,967,481 |
| | ThedaCare Inc, Series 2015, 5.000%, 12/15/44 | | | |
| 10,770 | | Wisconsin Health and Educational Facilities Authority, Wisconsin, Revenue Bonds, | 12/29 at 100.00 | A1 | 11,143,073 |
| | ThedaCare Inc, Series 2019, 4.000%, 12/15/49 | | | |
| 118,158 | | Total Wisconsin | | | 120,876,481 |
| | Wyoming – 0.3% (0.2% of Total Investments) | | | |
| 9,625 | | Sweetwater County, Wyoming, Hospital Revenue Bonds, Memorial Hospital Project, Refunding | 9/23 at 100.00 | BB+ | 10,081,033 |
| | Series 2013A, 5.000%, 9/01/37 | | | |
| | Teton County Hospital District, Wyoming, Hospital Revenue Bonds, St John’s Medical | | | |
| | Center Project, Series 2011B: | | | |
| 2,000 | | 5.500%, 12/01/27 | 12/21 at 100.00 | A– | 2,099,680 |
| 1,000 | | 6.000%, 12/01/36 | 12/21 at 100.00 | A– | 1,046,990 |
| 12,625 | | Total Wyoming | | | 13,227,703 |
| $ 6,530,741 | | Total Long-Term Investments (cost $6,007,673,233) | | | 6,348,510,055 |
|
| Principal | | | Optional Call | | |
| Amount (000) | | Description (1) | Provisions (2) | Ratings (3) | Value |
| | SHORT-TERM INVESTMENTS – 0.9% (0.6% of Total Investments) | | | |
| | MUNICIPAL BONDS – 0.9% (0.6% of Total Investments) | | | |
| | Minnesota – 0.4% (0.2% of Total Investments) | | | |
| $ 10,000 | | Minneapolis, Minnesota, Health Care System Revenue Bonds, Fairview Health Services, Variable | 6/20 at 100.00 | A-1 | $ 10,000,000 |
| | Rate Demand Obligation, Series 2018A, 0.140%, 11/15/48 (9) | | | |
| 6,000 | | Rochester, Minnesota, Health Care Facilities Revenue Bonds, Mayo Clinic Variable Rate Demand | 6/20 at 100.00 | A-1+ | 6,000,000 |
| | Obligation, Series 2008A, 0.180%, 11/15/38 (9) | | | |
| 16,000 | | Total Minnesota | | | 16,000,000 |
| | Mississippi – 0.2% (0.2% of Total Investments) | | | |
| 9,850 | | Mississippi Business Finance Corporation, Gulf Opportunity Zone Industrial Development Revenue | 7/20 at 100.00 | A-1+ | 9,850,000 |
| | Bonds, Chevron USA Inc Project, Variable Rate Demand Obligation, Series 2011D, | | | |
| | 0.140%, 11/01/35 (9) | | | |
105
| | | | | |
| NEA | Nuveen AMT-Free Quality Municipal Income Fund | |
| Portfolio of Investments (continued) | | | |
| April 30, 2020 (Unaudited) | | | |
|
|
|
| Principal | | | Optional Call | | |
| Amount (000) | | Description (1) | Provisions (2) | Ratings (3) | Value |
| | North Carolina – 0.0% (0.0% of Total Investments) | | | |
| $ 1,450 | | University of North Carolina Chapel Hill, Revenue Bonds, University of North Carolina Hospitals at | 7/20 at 100.00 | VMIG1 | $ 1,450,000 |
| | Chapel Hill, Variable Rate Demand Obligations, Series 2003B, 0.200%, 2/01/29 (9) | | | |
| | Texas – 0.3% (0.2% of Total Investments) | | | |
| 10,645 | | Lower Neches Valley Authority Industrial Development Corporation, Texas, Revenue Bonds, | 6/20 at 100.00 | A-1+ | 10,645,000 |
| | Exxon Mobil Project, Variable Rate Demand Obligation, Series 2010, 0.150%, 11/01/38 (9) | | | |
| $ 37,945 | | Total Short-Term Investments (cost $37,945,000) | | | 37,945,000 |
| | Total Investments (cost $6,045,618,233) – 158.7% | | | 6,386,455,055 |
| | Floating Rate Obligations – (2.6)% | | | (105,790,000) |
| | Adjustable Rate MuniFund Term Preferred Shares, net of deferred offering costs – (3.6)% (10) | | | (143,404,239) |
| | MuniFund Preferred Shares, net of deferred offering costs – (23.8)% (11) | | | (955,983,883) |
| | Variable Rate Demand Preferred Shares, net of deferred offering costs – (31.9)% (12) | | | (1,283,550,927) |
| | Other Assets Less Liabilities – 3.2% | | | 126,587,778 |
| | Net Assets Applicable to Common Shares – 100% | | | $ 4,024,313,784 |
| | |
(1) | All percentages shown in the Portfolio of Investments are based on net assets applicable to common shares unless otherwise noted. |
(2) | Optional Call Provisions: Dates (month and year) and prices of the earliest optional call or redemption. There may be other call provisions at varying prices at later dates. Certain mortgage-backed securities may be subject to periodic principal paydowns. |
(3) | The ratings disclosed are the lowest of Standard & Poor’s Group (“Standard & Poor’s”), Moody’s Investors Service, Inc. (“Moody’s”) or Fitch, Inc. (“Fitch”) rating. Ratings below BBB by Standard & Poor’s, Baa by Moody’s or BBB by Fitch are considered to be below investment grade. Holdings designated N/R are not rated by any of these national rating agencies. |
(4) | Backed by an escrow or trust containing sufficient U.S. Government or U.S. Government agency securities, which ensure the timely payment of principal and interest. |
(5) | Step-up coupon bond, a bond with a coupon that increases ("steps up"), usually at regular intervals, while the bond is outstanding. The rate shown is the coupon as of the end of the reporting period. |
(6) | Investment, or portion of investment, has been pledged to collateralize the net payment obligations for investments in inverse floating rate transactions. |
(7) | Investment valued at fair value using methods determined in good faith by, or at the discretion of, the Board. For fair value measurement disclosure purposes, investment classified as Level 3. See Notes to Financial Statements, Note 3 - Investment Valuation and Fair Value Measurements for more information. |
(8) | Defaulted security. A security whose issuer has failed to fully pay principal and/or interest when due, or is under the protection of bankruptcy. |
(9) | Investment has a maturity of greater than one year, but has variable rate and/or demand features which qualify it as a short-term investment. The rate disclosed, as well as the reference rate and spread, where applicable, is that in effect as of the end of the reporting period. This rate changes periodically based on market conditions or a specified market index. |
(10) | Adjustable Rate MuniFund Term Preferred Shares, net of deferred offering cost as a percentage of Total Investments is 2.2%. |
(11) | MuniFund Preferred Shares, net of deferred offering costs as a percentage of Total Investments is 15.0%. |
(12) | Variable Rate Demand Preferred Shares, net of deferred offering costs as a percentage of Total Investments is 20.1%. |
144A | Investment is exempt from registration under Rule 144A of the Securities Act of 1933, as amended. These investments may only be resold in transactions exempt from registration, which are normally those transactions with qualified institutional buyers. |
ETM | Escrowed to maturity. |
IF | Inverse floating rate security issued by a tender option bond (“TOB”) trust, the interest rate on which varies inversely with the Securities Industry Financial Markets Association (SIFMA) short-term rate, which resets weekly, or a similar short-term rate, and is reduced by the expenses related to the TOB trust. |
PIK | Payment-in-kind (“PIK”) security. Depending on the terms of the security, income may be received in the form of cash, securities, or a combination of both. The PIK rate shown, where applicable, represents the annualized rate of the last PIK payment made by the issuer as of the end of the reporting period. |
UB | Underlying bond of an inverse floating rate trust reflected as a financing transaction. See Notes to Financial Statements, Note 4 – Portfolio Securities and Investments in Derivatives, for more information. |
| See accompanying notes to financial statements. |
106
Statement of Assets and Liabilities
April 30, 2020 (Unaudited)
| | | | | | | |
| | NAD | | | NEA | |
| Assets | | | | | | |
Long-term investments, at value (cost $4,710,865,473 and $6,007,673,233, respectively) | | $ | 4,942,419,266 | | | $ | 6,348,510,055 | |
Short-term investments, at value (cost approximates value) | | | 44,100,000 | | | | 37,945,000 | |
Cash | | | — | | | | 8,602,426 | |
Receivable for: | | | | | | | | |
| Dividends | | | 533 | | | | — | |
| Interest | | | 65,933,000 | | | | 81,839,153 | |
| Investments sold | | | 38,677,493 | | | | 63,372,615 | |
Other assets | | | 1,269,434 | | | | 2,009,500 | |
| Total assets | | | 5,092,399,726 | | | | 6,542,278,749 | |
| Liabilities | | | | | | | | |
Cash overdraft | | | 175,777 | | | | — | |
Floating rate obligations | | | 96,270,000 | | | | 105,790,000 | |
Payable for: | | | | | | | | |
| Dividends | | | 10,713,194 | | | | 14,205,667 | |
| Interest | | | 791,860 | | | | 1,152,416 | |
| Investments purchased – regular settlement | | | 25,273,265 | | | | 8,898,252 | |
| Offering costs | | | — | | | | 95,411 | |
Adjustable Rate MuniFund Term Preferred (“AMTP”) Shares, net of deferred offering | | | | | | | | |
| costs (liquidation preference $545,500,000 and $143,500,000, respectively) | | | 545,203,300 | | | | 143,404,239 | |
MuniFund Preferred (“MFP”) Shares, net of deferred offering | | | | | | | | |
| costs (liquidation preference $679,000,000 and $958,000,000, respectively) | | | 678,339,162 | | | | 955,983,883 | |
Variable Rate Demand Preferred (“VRDP”) Shares, net of deferred offering costs | | | | | | | | |
| (liquidation preference $632,000,000 and $1,290,300,000, respectively) | | | 630,019,736 | | | | 1,283,550,927 | |
Accrued expenses: | | | | | | | | |
| Management fees | | | 2,317,174 | | | | 2,977,159 | |
| Trustees fees | | | 903,278 | | | | 1,207,417 | |
| Other | | | 584,192 | | | | 699,594 | |
| Total liabilities | | | 1,990,590,938 | | | | 2,517,964,965 | |
Net assets applicable to common shares | | $ | 3,101,808,788 | | | $ | 4,024,313,784 | |
Common shares outstanding | | | 211,649,043 | | | | 278,590,267 | |
Net asset value (“NAV”) per common share outstanding | | $ | 14.66 | | | $ | 14.45 | |
| Net assets applicable to common shares consist of: | | | | | | | | |
Common shares, $0.01 par value per share | | $ | 2,116,490 | | | $ | 2,785,903 | |
Paid-in-surplus | | | 2,913,361,902 | | | | 3,727,965,928 | |
Total distributable earnings | | | 186,330,396 | | | | 293,561,953 | |
Net assets applicable to common shares | | $ | 3,101,808,788 | | | $ | 4,024,313,784 | |
Authorized shares: | | | | | | | | |
| Common | | Unlimited | | | Unlimited | |
| Preferred | | Unlimited | | | Unlimited | |
See accompanying notes to financial statements.
107
| | | |
| | |
|
| Six Months Ended April 30, 2020 (Unaudited) | | |
|
|
|
| | |
| | NAD | | | NEA | |
| Investment Income | | $ | 103,129,287 | | | $ | 135,655,177 | |
| Expenses | | | | | | | | |
Management fees | | | 13,850,414 | | | | 17,947,273 | |
Interest expense and amortization of offering costs | | | 18,335,359 | | | | 21,864,347 | |
Liquidity fees | | | 2,277,954 | | | | 4,700,135 | |
Remarketing fees | | | 319,511 | | | | 713,092 | |
Custodian fees | | | 260,466 | | | | 319,686 | |
Trustees fees | | | 57,806 | | | | 76,529 | |
Professional fees | | | 80,188 | | | | 137,704 | |
Shareholder reporting expenses | | | 109,750 | | | | 153,722 | |
Shareholder servicing agent fees | | | 56,592 | | | | 57,981 | |
Stock exchange listing fees | | | 28,319 | | | | 36,857 | |
Investor relations expenses | | | 134,257 | | | | 177,091 | |
Other | | | 162,743 | | | | 560,460 | |
Total expenses | | | 35,673,359 | | | | 46,744,877 | |
Net investment income (loss) | | | 67,455,928 | | | | 88,910,300 | |
| Realized and Unrealized Gain (Loss) | | | | | | | | |
Net realized gain (loss) from investments | | | (8,098,541 | ) | | | 1,500,930 | |
Change in net unrealized appreciation (depreciation) of investments | | | (261,856,531 | ) | | | (316,243,607 | ) |
Net realized and unrealized gain (loss) | | | (269,955,072 | ) | | | (314,742,677 | ) |
Net increase (decrease) in net assets applicable to common shares from operations | | $ | (202,499,144 | ) | | $ | (225,832,377 | ) |
See accompanying notes to financial statements.
108
Statement of Changes in Net Assets
(Unaudited)
| | | | | | | | | | | | | |
| | NAD | | | NEA | |
| | Six Months Ended | | | Year Ended | | | Six Months Ended | | | Year Ended | |
| | 4/30/20 | | | 10/31/19 | | | 4/30/20 | | | 10/31/19 | |
| Operations | | | | | | | | | | | | |
Net investment income (loss) | | $ | 67,455,928 | | | $ | 134,446,471 | | | $ | 88,910,300 | | | $ | 173,706,452 | |
Net realized gain (loss) from investments | | | (8,098,541 | ) | | | 1,593,015 | | | | 1,500,930 | | | | 1,849,467 | |
Change in net unrealized appreciation (depreciation) of investments | | | (261,856,531 | ) | | | 294,095,381 | | | | (316,243,607 | ) | | | 366,724,900 | |
Net increase (decrease) in net assets applicable to common shares | | | | | | | | | | | | | | | | |
| from operations | | | (202,499,144 | ) | | | 430,134,867 | | | | (225,832,377 | ) | | | 542,280,819 | |
| Distributions to Common Shareholders | | | | | | | | | | | | | | | | |
Dividends | | | (66,067,535 | ) | | | (129,596,923 | ) | | | (88,764,124 | ) | | | (168,666,655 | ) |
Decrease in net assets applicable to common shares from distributions | | | | | | | | | | | | | | | | |
| to common shareholders | | | (66,067,535 | ) | | | (129,596,923 | ) | | | (88,764,124 | ) | | | (168,666,655 | ) |
| Capital Share Transactions | | | | | | | | | | | | | | | | |
Common Shares: | | | | | | | | | | | | | | | | |
| Issued in the Merger | | | 159,102,613 | | | | — | | | | 245,521,737 | | | | — | |
Net increase (decrease) in net assets applicable to common shares from | | | | | | | | | | | | | | | | |
| capital share transactions | | | 159,102,613 | | | | — | | | | 245,521,737 | | | | — | |
Net increase (decrease) in net assets applicable to common shares | | | (109,464,066 | ) | | | 300,537,944 | | | | (69,074,764 | ) | | | 373,614,164 | |
Net assets applicable to common shares at the beginning of period | | $ | 3,211,272,854 | | | $ | 2,910,734,910 | | | $ | 4,093,388,548 | | | $ | 3,719,774,384 | |
Net assets applicable to common shares at the end of period | | $ | 3,101,808,788 | | | $ | 3,211,272,854 | | | $ | 4,024,313,784 | | | $ | 4,093,388,548 | |
See accompanying notes to financial statements.
109
| | | |
| | |
|
| Six Months Ended April 30, 2020 (Unaudited) | | |
|
|
|
| | |
| | NAD | | | NEA | |
| Cash Flows from Operating Activities: | | | | | | |
| Net Increase (Decrease) in Net Assets Applicable to Common Shares from Operations | | $ | (202,499,144 | ) | | $ | (225,832,377 | ) |
Adjustments to reconcile the net increase (decrease) in net assets applicable to | | | | | | | | |
| common shares from operations to net cash provided by (used in) operating activities: | | | | | | | | |
Purchases of investments | | | (476,443,912 | ) | | | (617,972,457 | ) |
Proceeds from sales and maturities of investments | | | 512,631,277 | | | | 703,033,556 | |
Proceeds from (Purchase of) short-term investments, net | | | (40,100,000 | ) | | | (9,745,000 | ) |
Payment-in-kind distributions | | | (20,827 | ) | | | (4,891 | ) |
Taxes paid | | | (151,388 | ) | | | (19,269 | ) |
Amortization (Accretion) of premiums and discounts, net | | | (1,468,992 | ) | | | (5,010,502 | ) |
Amortization of deferred offering costs | | | 69,176 | | | | 243,542 | |
(Increase) Decrease in: | | | | | | | | |
| Receivable for dividends | | | 27 | | | | — | |
| Receivable for interest | | | 2,743,862 | | | | 2,943,192 | |
| Receivable for investments sold | | | (14,967,236 | ) | | | (5,424,105 | ) |
| Other assets | | | 287,087 | | | | 56,416 | |
Increase (Decrease) in: | | | | | | | | |
| Payable for interest | | | (656,445 | ) | | | 625,263 | |
| Investments purchased - regular settlement | | | 18,976,548 | | | | (56,897,262 | ) |
| Payable for offering costs | | | (109,385 | ) | | | — | |
| Accrued management fees | | | (63,094 | ) | | | (30,552 | ) |
| Accrued Trustees fees | | | 52,502 | | | | 92,006 | |
| Accrued other expenses | | | (338,535 | ) | | | (360,498 | ) |
Net realized (gain) loss from: | | | | | | | | |
| Investments | | | 8,098,541 | | | | (1,500,930 | ) |
| Paydowns | | | 54 | | | | 39 | |
Change in net unrealized appreciation (depreciation) of investments | | | 261,856,531 | | | | 316,243,607 | |
Net cash provided by (used in) operating activities | | | 67,896,647 | | | | 100,439,778 | |
| Cash Flow from Financing Activities: | | | | | | | | |
Proceeds from borrowings | | | 9,619,672 | | | | 17,695,323 | |
(Repayments of) borrowings | | | (9,619,672 | ) | | | (17,695,323 | ) |
(Payments for) deferred offering costs | | | (109,385 | ) | | | — | |
Increase (Decrease) in cash overdraft | | | (2,192,542 | ) | | | (4,061,760 | ) |
(Repayments of) floating rate obligations | | | — | | | | (7,500,000 | ) |
Cash distributions paid to common shareholders | | | (65,645,972 | ) | | | (87,927,464 | ) |
Net cash provided by (used in) financing activities | | | (67,947,899 | ) | | | (99,489,224 | ) |
| Net Increase (Decrease) in Cash | | | (51,252 | ) | | | 950,554 | |
Cash at the beginning of period | | | — | | | | — | |
Cash acquired in connection with the Merger | | | 51,252 | | | | 7,651,872 | |
Cash at the end of period | | | — | | | | 8,602,426 | |
| | |
| Supplemental Disclosure of Cash Flow Information | | NAD | | | NEA | |
Cash paid for interest (excluding amortization of offering costs) | | $ | 18,791,666 | | | $ | 20,892,097 | |
See accompanying notes to financial statements.
110
THIS PAGE INTENTIONALLY LEFT BLANK
111
Financial Highlights (Unaudited)
| |
Selected data for a common share outstanding throughout each period: |
|
|
| | |
| | | | | Investment Operations | | | Less Distributions
to Common Shareholders | | | Common Share
| |
| | | Beginning Common Share NAV | | | Net Investment Income (Loss) | | | Net Realized/ Unrealized Gain (Loss) | | | Total | | | From Net Investment Income | | | From Accumu- lated Net Realized Gains | | | Total | | | Discount per Share Repurchased and Retired | | | Ending NAV | | | Ending Share Price | |
| NAD | | | | | | | | | | | | | | | | | | | | | | | | | | | | | | |
Year Ended 10/31:
| | | | | | | | | | | | | | | | | | | |
2020(d) | | $ | 15.91 | | | $ | 0.33 | | | $ | (1.26 | ) | | $ | (0.93 | ) | | $ | (0.32 | ) | | $ | — | | | $ | (0.32 | ) | | $ | — | | | $ | 14.66 | | | $ | 13.05 | |
2019 | | | 14.42 | | | | 0.67 | | | | 1.46 | | | | 2.13 | | | | (0.64 | ) | | | — | | | | (0.64 | ) | | | — | | | | 15.91 | | | | 14.42 | |
2018 | | | 15.41 | | | | 0.69 | | | | (0.99 | ) | | | (0.30 | ) | | | (0.69 | ) | | | — | | | | (0.69 | ) | | | — | * | | | 14.42 | | | | 12.41 | |
2017 | | | 15.75 | | | | 0.73 | | | | (0.29 | ) | | | 0.44 | | | | (0.78 | ) | | | — | | | | (0.78 | ) | | | — | | | | 15.41 | | | | 13.86 | |
2016 | | | 15.44 | | | | 0.71 | | | | 0.45 | | | | 1.16 | | | | (0.85 | ) | | | — | | | | (0.85 | ) | | | — | | | | 15.75 | | | | 14.19 | |
2015 | | | 15.64 | | | | 0.84 | | | | (0.17 | ) | | | 0.67 | | | | (0.87 | ) | | | — | | | | (0.87 | ) | | | — | | | | 15.44 | | | | 14.05 | |
| | |
| NEA | | | | | | | | | | | | | | | | | | | | | | | | | | | | | | | | | | | | | | | | |
Year Ended 10/31:
| | | | | | | | | | | | | | | | | | | | | | | | | |
2020(d) | | | 15.58 | | | | 0.32 | | | | (1.13 | ) | | | (0.81 | ) | | | (0.32 | ) | | | — | | | | (0.32 | ) | | | — | | | | 14.45 | | | | 12.91 | |
2019 | | | 14.16 | | | | 0.66 | | | | 1.40 | | | | 2.06 | | | | (0.64 | ) | | | — | | | | (0.64 | ) | | | — | | | | 15.58 | | | | 14.20 | |
2018 | | | 15.07 | | | | 0.68 | | | | (0.91 | ) | | | (0.23 | ) | | | (0.68 | ) | | | — | | | | (0.68 | ) | | | — | * | | | 14.16 | | | | 12.13 | |
2017 | | | 15.36 | | | | 0.71 | | | | (0.26 | ) | | | 0.45 | | | | (0.74 | ) | | | — | | | | (0.74 | ) | | | — | | | | 15.07 | | | | 13.57 | |
2016 | | | 14.82 | | | | 0.72 | | | | 0.58 | | | | 1.30 | | | | (0.76 | ) | | | — | | | | (0.76 | ) | | | — | | | | 15.36 | | | | 13.75 | |
2015 | | | 15.13 | | | | 0.77 | | | | (0.28 | ) | | | 0.49 | | | | (0.80 | ) | | | — | | | | (0.80 | ) | | | — | | | | 14.82 | | | | 13.26 | |
(a) | Total Return Based on Common Share NAV is the combination of changes in common share NAV, reinvested dividend income at NAV and reinvested capital gains distributions at NAV, if any. The last dividend declared in the period, which is typically paid on the first business day of the following month, is assumed to be reinvested at the ending NAV. The actual reinvest price for the last dividend declared in the period may often be based on the Fund’s market price (and not its NAV), and therefore may be different from the price used in the calculation. Total returns are not annualized. |
| Total Return Based on Common Share Price is the combination of changes in the market price per share and the effect of reinvested dividend income and reinvested capital gains distributions, if any, at the average price paid per share at the time of reinvestment. The last dividend declared in the period, which is typically paid on the first business day of the following month, is assumed to be reinvested at the ending market price. The actual reinvestment for the last dividend declared in the period may take place over several days, and in some instances may not be based on the market price, so the actual reinvestment price may be different from the price used in the calculation. Total returns are not annualized. |
112
| | | | | | | | | | | | | | | | | |
| | | | | | | Common Share Supplemental Data/ Ratios Applicable to Common Shares
| |
Common Share Total Returns | | | | | | Ratios to Average Net Assets(b) | | | | |
| | |
Based on NAV(a) | | | Based on Share Price(a) | | | Ending Net Assets (000) | | | Expenses | | | Net Investment Income (Loss) | | | Portfolio Turnover Rate(c) | |
| | |
| | |
| | (5.95 | )% | | | (7.45 | )% | | $ | 3,101,809 | | | | 2.22 | %** | | | 4.19 | %** | | | 9 | % |
| | 15.03 | | | | 21.78 | | | | 3,211,273 | | | | 2.45 | | | | 4.35 | | | | 8 | |
| | (2.03 | ) | | | (5.69 | ) | | | 2,910,735 | | | | 2.34 | | | | 4.57 | | | | 20 | |
| | 3.01 | | | | 3.26 | | | | 3,110,034 | | | | 1.95 | | | | 4.84 | | | | 18 | |
| | 7.54 | | | | 6.88 | | | | 3,179,168 | | | | 1.90 | | | | 4.64 | | | | 11 | |
| | 4.43 | | | | 5.57 | | | | 606,607 | | | | 1.41 | | | | 5.41 | | | | 15 | |
| | |
| | |
| | |
| | (5.29 | ) | | | (6.99 | ) | | | 4,024,314 | | | | 2.20 | ** | | | 4.18 | ** | | | 9 | |
| | 14.81 | | | | 22.78 | | | | 4,093,389 | | | | 2.40 | | | | 4.41 | | | | 8 | |
| | (1.62 | ) | | | (5.84 | ) | | | 3,719,774 | | | | 2.29 | | | | 4.63 | | | | 11 | |
| | 3.16 | | | | 4.21 | | | | 3,959,861 | | | | 1.94 | | | | 4.80 | | | | 15 | |
| | 8.84 | | | | 9.33 | | | | 4,037,193 | | | | 1.77 | | | | 4.59 | | | | 12 | |
| | 3.38 | | | | 2.30 | | | | 1,168,847 | | | | 1.46 | | | | 5.16 | | | | 18 | |
(b) | • Net Investment Income (Loss) ratios reflect income earned and expenses incurred on assets attributable to preferred shares issued by the Fund. |
| • The expense ratios reflect, among other things, all interest expense and other costs related to preferred shares (as described in Note 5 – Fund Shares) and/or the interest expense deemed to have been paid by the Fund on the floating rate certificates issued by the special purpose trusts for the self-deposited inverse floaters held by the Fund (as described in Note 4 – Portfolio Securities and Investments in Derivatives), where applicable, as follows: |
| | | | | |
| NAD | | | NEA | |
Year Ended 10/31: | | | Year Ended 10/31: | |
2020(d) | 1.30%** | | 2020(d) | 1.28%** |
2019 | 1.50 | | 2019 | 1.47 |
2018 | 1.39 | | 2018 | 1.35 |
2017 | 1.00 | | 2017 | 1.00 |
2016 | 0.90 | | 2016 | 0.78 |
2015 | 0.47 | | 2015 | 0.50 |
(c) | Portfolio Turnover Rate is calculated based on the lesser of long-term purchases or sales (as disclosed in Note 4 – Portfolio Securities and Investments in Derivatives,) divided by the average long-term market value during the period. |
(d) | For the six months ended April 30, 2020. |
* | Rounds to less than $0.01 per share. |
** | Annualized. |
See accompanying notes to financial statements.
113
Financial Highlights (Unaudited) (continued)
| | | | | | | | | | | | | | | | | | | | | | | | | | | | |
| | AMTP Shares at the End of Period | | | MFP Shares at the End of Period | | | VMTP Shares at the End of Period | | | VRDP Shares at the End of Period | | | AMTP, MFP, VMTP and/or VRDP Shares at the End of Period | |
| | | Aggregate Amount Outstanding (000) | | | Asset Coverage Per $100,000 Share | | | Aggregate Amount Outstanding (000) | | | Asset Coverage Per $100,000 Share(a) | | | Aggregate Amount Outstanding (000) | | | Asset Coverage Per $100,000 Share | | | Aggregate Amount Outstanding (000) | | | Asset Coverage Per $100,000 Share | | | Asset Coverage Per $1 Liquidation Preference | |
| NAD | | | | | | | | | | | | | | | | | | | | | | | | | | | |
Year Ended 10/31:
| | | | | | | | | | | | | | | | | | | | | | |
2020(b) | | $ | 545,500 | | | $ | 267,078 | | | $ | 679,000 | | | $ | 267,078 | | | $ | — | | | $ | — | | | $ | 632,000 | | | $ | 267,078 | | | $ | 2.67 | |
2019 | | | 545,500 | | | | 279,954 | | | | 607,000 | | | | 279,954 | | | | — | | | | — | | | | 632,000 | | | | 279,954 | | | | 2.80 | |
2018 | | | — | | | | — | | | | 607,000 | | | | 263,112 | | | | 545,500 | | | | 263,112 | | | | 632,000 | | | | 263,112 | | | | 2.63 | |
2017 | | | — | | | | — | | | | — | | | | — | | | | 952,500 | | | | 296,279 | | | | 632,000 | | | | 296,279 | | | | 2.96 | |
2016 | | | — | | | | — | | | | — | | | | — | | | | 952,500 | | | | 300,642 | | | | 632,000 | | | | 300,642 | | | | 3.01 | |
2015 | | | — | | | | — | | | | — | | | | — | | | | 265,000 | | | | 328,908 | | | | — | | | | — | | | | — | |
| | |
| NEA | | | | | | | | | | | | | | | | | | | | | | | | | | | | | | | | | | | | |
Year Ended 10/31:
| | | | | | | | | | | | | | | | | | | | | | | | | | | | | |
2020(b) | | | 143,000 | | | | 268,255 | | | | 958,000 | | | | 268,255 | | | | — | | | | — | | | | 1,290,300 | | | | 268,255 | | | | 2.68 | |
2019 | | | — | | | | — | | | | 958,000 | | | | 282,066 | | | | — | | | | — | | | | 1,290,300 | | | | 282,066 | | | | 2.82 | |
2018 | | | — | | | | — | | | | 958,000 | | | | 265,448 | | | | — | | | | — | | | | 1,290,300 | | | | 265,448 | | | | 2.65 | |
2017 | | | — | | | | — | | | | — | | | | — | | | | 773,000 | | | | 291,919 | | | | 1,290,300 | | | | 291,919 | | | | 2.92 | |
2016 | | | — | | | | — | | | | — | | | | — | | | | 773,000 | | | | 295,667 | | | | 1,290,300 | | | | 295,667 | | | | 2.96 | |
2015 | | | — | | | | — | | | | — | | | | — | | | | 151,000 | | | | 333,349 | | | | 349,900 | | | | 333,349 | | | | 3.33 | |
(a) | NEA’s Series D MFP Shares have a $1,000 liquidation preference per share, while all other MFP Shares have a $100,000 liquidation preference per share. The asset coverage per $1,000 share for NEA’s Series D MFP Shares were as follows: |
| | | |
| Asset | |
| Coverage | |
| Per | |
| $1,000 | |
| NEA | Share | |
| Series D | |
Year Ended 10/31:
| |
2020(b) | $2,683 | |
2019 | 2,800 | |
2018 | — | |
2017 | — | |
2016 | — | |
2015 | — | |
(b) | For the six months ended April 30, 2020. |
See accompanying notes to financial statements.
114
Financial Statements (Unaudited)
1. General Information
Fund Information
The funds covered in this report and their corresponding New York Stock Exchange (“NYSE”) symbols are as follows (each a “Fund” and collectively, the “Funds”):
| • | Nuveen Quality Municipal Income Fund (NAD) |
| • | Nuveen AMT-Free Quality Municipal Income Fund (NEA) |
The Funds are registered under the Investment Company Act of 1940 (the “1940 Act”), as amended, as diversified closed-end management investment companies. NAD and NEA were organized as Massachusetts business trusts on January 15, 1999 and July 29, 2002, respectively.
The end of the reporting period for the Funds is April 30, 2020, and the period covered by these Notes to Financial Statements is the six months ended April 30, 2020 (the ”current fiscal period”).
Investment Adviser and Sub-Adviser
The Funds’ investment adviser is Nuveen Fund Advisors, LLC (the “Adviser”), a subsidiary of Nuveen, LLC (“Nuveen”). Nuveen is the investment management arm of Teachers Insurance and Annuity Association of America (TIAA). The Adviser has overall responsibility for management of the Funds, oversees the management of the Funds’ portfolios, manages the Funds’ business affairs and provides certain clerical, bookkeeping and other administrative services, and, if necessary, asset allocation decisions. The Adviser has entered into sub-advisory agreements with Nuveen Asset Management, LLC (the “Sub-Adviser”), a subsidiary of the Adviser, under which the Sub-Adviser manages the investment portfolios of the Funds.
Fund Merger
Effective prior to the opening of business on February 18, 2020, Nuveen Texas Quality Municipal Income Fund (NTX) (a “Target Fund”) was merged into NAD (an “Acquiring Fund”) and effective prior to the opening of business on November 18, 2019, Nuveen North Carolina Quality Municipal Income Fund (NNC) (a “Target Fund”) was merged into NEA (an “Acquiring Fund”) (each a “Merger” and collectively the “Mergers”).
Upon the closing of each Merger, each Target Fund transferred its assets to its respective Acquiring Fund in exchange for common and preferred shares of the Acquiring Funds and the assumption by the Acquiring Funds of the liabilities of each Target Fund. Each Target Fund was then liquidated, dissolved and terminated in accordance with its Declaration of Trust. Shareholders of each Target Fund became shareholders of their respective Acquiring Fund. Holders of common shares of each Target Fund received newly issued common shares of their respective Acquiring Fund, the aggregate net asset value (“NAV”) of which is equal to the aggregate NAV of the common shares of each Target Fund held immediately prior to each Merger (including for this purpose fractional Acquiring Fund shares to which shareholders were entitled). Holders of preferred shares of each Target Fund receive on a one-for-one basis newly issued preferred shares of their respective Acquiring Fund, in exchange for preferred shares of each Target Fund held immediately prior to each Merger. Details of each Merger are further described in Note 9 – Fund Mergers.
Other Matters
The outbreak of the novel coronavirus (“COVID-19”) and subsequent global pandemic began significantly impacting the U.S. and global financial markets and economies during the calendar quarter ended March 31, 2020. The worldwide spread of COVID-19 has created significant uncertainty in the global economy. The duration and extent of COVID-19 over the long-term cannot be reasonably estimated at this time. There have been no comparable recent events that provide guidance as to the effect the spread of COVID-19 as a global pandemic may have on the Funds’ financial performance. The ultimate impact of COVID-19 and the extent to which COVID-19 impacts the Funds’ normal course of business, results of operations, investments, and cash flows will depend on future developments, which are highly uncertain and difficult to predict. Management continues to monitor and evaluate this situation.
2. Significant Accounting Policies
The accompanying financial statements were prepared in accordance with accounting principles generally accepted in the United States of America (“U.S. GAAP”), which may require the use of estimates made by management and the evaluation of subsequent events. Actual results may differ from those estimates. Each Fund is an investment company and follows the accounting guidance in the Financial Accounting Standards Board (“FASB”) Accounting Standards Codification 946, Financial Services—Investment Companies. The NAV for financial reporting purposes may differ from the NAV for processing security and common share transactions. The NAV for financial reporting purposes includes security and common share transactions through the date of the report. Total return is computed based on the NAV used for processing security and common share transactions. The following is a summary of the significant accounting policies consistently followed by the Funds.
115
Notes to Financial Statements (Unaudited) (continued)
Compensation
The Funds pay no compensation directly to those of its trustees who are affiliated with the Adviser or to its officers, all of whom receive remuneration for their services to the Funds from the Adviser or its affiliates. The Funds’ Board of Trustees (the “Board”) has adopted a deferred compensation plan for independent trustees that enables trustees to elect to defer receipt of all or a portion of the annual compensation they are entitled to receive from certain Nuveen-advised funds. Under the plan, deferred amounts are treated as though equal dollar amounts had been invested in shares of select Nuveen-advised funds.
Distributions to Common Shareholders
Distributions to common shareholders are recorded on the ex-dividend date. The amount, character and timing of distributions are determined in accordance with federal income tax regulations, which may differ from U.S. GAAP.
Indemnifications
Under the Funds’ organizational documents, their officers and trustees are indemnified against certain liabilities arising out of the performance of their duties to the Funds. In addition, in the normal course of business, the Funds enter into contracts that provide general indemnifications to other parties. The Funds’ maximum exposure under these arrangements is unknown as this would involve future claims that may be made against the Funds that have not yet occurred. However, the Funds have not had prior claims or losses pursuant to these contracts and expect the risk of loss to be remote.
Investments and Investment Income
Securities transactions are accounted for as of the trade date for financial reporting purposes. Realized gains and losses on securities transactions are based upon the specific identification method. Investment income is comprised of interest income, which is recorded on an accrual basis and includes accretion of discounts and amortization of premiums for financial reporting purposes. Investment income also reflects payment-in-kind (“PIK”) interest and paydown gains and losses, if any. PIK interest represents income received in the form of securities in lieu of cash. Investment income also reflects dividend income, which is recorded on the ex-dividend date.
Netting Agreements
In the ordinary course of business, the Funds may enter into transactions subject to enforceable International Swaps and Derivatives Association, Inc. (ISDA) master agreements or other similar arrangements (“netting agreements”). Generally, the right to offset in netting agreements allows each Fund to offset certain securities and derivatives with a specific counterparty, when applicable, as well as any collateral received or delivered to that counterparty based on the terms of the agreements. Generally, each Fund manages its cash collateral and securities collateral on a counterparty basis.
The Funds’ investments subject to netting agreements as of the end of the reporting period, if any, are further described in Note 4 – Portfolio Securities and Investments in Derivatives.
New Accounting Pronouncements and Rule Issuances
FASB Accounting Standards Update (“ASU”) 2017-08 (“ASU 2017-08”) Premium Amortization on Purchased Callable Debt Securities
The FASB has issued ASU 2017-08, which shortens the premium amortization period for purchased non-contingently callable debt securities. ASU 2017-08 specifies that the premium amortization period ends at the earliest call date, for purchased non-contingently callable debt securities. ASU 2017-08 is effective for fiscal years, and interim periods within those fiscal years, beginning after December 15, 2018. During the current fiscal period, ASU 2017-08 became effective for the Funds and it did not have a material impact on the Funds’ financial statements.
Fair Value Measurement Disclosure Framework
During August 2018, the FASB issued ASU 2018-13 (“ASU 2018-13”), Fair Value Measurement: Disclosure Framework – Changes to the Disclosure Requirements for Fair Value Measurements. ASU 2018-13 modifies the disclosures required by Topic 820, Fair Value Measurements. The amendments in ASU 2018-13 are effective for all entities for fiscal years, and interim periods within those fiscal years, beginning after December 15, 2019. Management has early implemented this guidance and it did not have a material impact on the Funds’ financial statements.
Reference Rate Reform
In March 2020, FASB issued ASU 2020-04, Reference Rate Reform: Facilitation of the Effects of Reference Rate Reform on Financial Reporting. The main objective of the new guidance is to provide relief to companies that will be impacted by the expected change in benchmark interest rates at the end of 2021, when participating banks will no longer be required to submit London Interbank Offered Rate (LIBOR) quotes by the UK Financial Conduct Authority (FCA). The new guidance allows companies to, provided the only change to existing contracts are a change to an approved benchmark interest rate, account for modifications as a continuance of the existing contract without additional analysis. For new and existing contracts, the Funds may elect to apply the amendments as of March 12, 2020 through December 31, 2022. Management has not yet elected to apply the amendments, but is currently assessing the impact of the ASU’s adoption to the Funds’ financial statements and various filings.
116
3. Investment Valuation and Fair Value Measurements
The fair valuation input levels as described below are for fair value measurement purposes.
The Funds’ investments in securities are recorded at their estimated value. Fair value is defined as the price that would be received upon selling an investment or transferring a liability in an orderly transaction to an independent buyer in the principal or most advantageous market for the investment. A three-tier hierarchy is used to maximize the use of observable market data and minimize the use of unobservable inputs and to establish classification of fair value measurements for disclosure purposes. Observable inputs reflect the assumptions market participants would use in pricing the asset or liability. Observable inputs are based on market data obtained from sources independent of the reporting entity. Unobservable inputs reflect the reporting entity’s own assumptions about the assumptions market participants would use in pricing the asset or liability. Unobservable inputs are based on the best information available in the circumstances. The following is a summary of the three-tiered hierarchy of valuation input levels.
Level 1 – Inputs are unadjusted and prices are determined using quoted prices in active markets for identical securities.
Level 2 – Prices are determined using other significant observable inputs (including quoted prices for similar securities, interest rates, credit spreads, etc.).
Level 3 – Prices are determined using significant unobservable inputs (including management’s assumptions in determining the fair value of investments).
Prices of fixed income securities are provided by an independent pricing service (“pricing service”) approved by the Board. The pricing service establishes a security’s fair value using methods that may include consideration of the following: yields or prices of investments of comparable quality, type of issue, coupon, maturity and rating, market quotes or indications of value from security dealers, evaluations of anticipated cash flows or collateral, general market conditions and other information and analysis, including the obligor’s credit characteristics considered relevant. These securities are generally classified as Level 2. In pricing certain securities, particularly less liquid and lower quality securities, the pricing service may consider information about a security, its issuer or market activity, provided by the Adviser. These securities are generally classified as Level 2 or Level 3 depending on the observability of the significant inputs.
Investments in investment companies are valued at their respective NAV’s on valuation date and are generally classified as Level 1.
Certain securities may not be able to be priced by the pre-established pricing methods as described above. Such securities may be valued by the Board and/or its appointee at fair value. These securities generally include, but are not limited to, restricted securities (securities which may not be publicly sold without registration under the Securities Act of 1933, as amended) for which a pricing service is unable to provide a market price; securities whose trading has been formally suspended; debt securities that have gone into default and for which there is no current market quotation; a security whose market price is not available from a pre-established pricing source; a security with respect to which an event has occurred that is likely to materially affect the value of the security after the market has closed but before the calculation of a Fund’s NAV (as may be the case in non-U.S. markets on which the security is primarily traded) or make it difficult or impossible to obtain a reliable market quotation; and a security whose price, as provided by the pricing service, is not deemed to reflect the security’s fair value. As a general principle, the fair value of a security would appear to be the amount that the owner might reasonably expect to receive for it in a current sale. A variety of factors may be considered in determining the fair value of such securities, which may include consideration of the following: yields or prices of investments of comparable quality, type of issue, coupon, maturity and rating, market quotes or indications of value from security dealers, evaluations of anticipated cash flows or collateral, general market conditions and other information and analysis, including the obligor’s credit characteristics considered relevant. These securities are generally classified as Level 2 or Level 3 depending on the observability of the significant inputs. Regardless of the method employed to value a particular security, all valuations are subject to review by the Board and/or its appointee.
The inputs or methodologies used for valuing securities are not an indication of the risks associated with investing in those securities. The following is a summary of each Fund’s fair value measurements as of the end of the reporting period:
| | | | | | | | | | | | | |
| NAD | | Level 1 | | | Level 2 | | | Level 3 | | | Total | |
| | |
Long-Term Investments: | | | | | | | | | | | | |
| Municipal Bonds* | | $ | — | | | $ | 4,933,624,377 | | | $ | 8,302,842 | ** | | $ | 4,941,927,219 | |
| Investment Companies | | | 492,047 | | | | — | | | | — | | | | 492,047 | |
Short-Term Investments: | | | | | | | | | | | | | | | | |
| Municipal Bonds* | | | — | | | | 44,100,000 | | | | — | | | | 44,100,000 | |
Total | | $ | 492,047 | | | $ | 4,977,724,377 | | | $ | 8,302,842 | | | $ | 4,986,519,266 | |
| | |
| NEA | | | | | | | | | | | | | | | | |
| | |
Long-Term Investments: | | | | | | | | | | | | | | | | |
| Municipal Bonds* | | $ | — | | | $ | 6,335,980,083 | | | $ | 12,529,972 | ** | | $ | 6,348,510,055 | |
Short-Term Investments: | | | | | | | | | | | | | | | | |
| Municipal Bonds* | | | — | | | | 37,945,000 | | | | — | | | | 37,945,000 | |
Total | | $ | — | | | $ | 6,373,925,083 | | | $ | 12,529,972 | | | $ | 6,386,455,055 | |
* | Refer to the Fund’s Portfolio of Investments for state classifications. |
** | Refer to the Fund’s Portfolio of Investments for securities classified as Level 3. |
117
Notes to Financial Statements (Unaudited) (continued)
4. Portfolio Securities and Investments in Derivatives
Portfolio Securities
Inverse Floating Rate Securities
Each Fund is authorized to invest in inverse floating rate securities. An inverse floating rate security is created by depositing a municipal bond (referred to as an “Underlying Bond”), typically with a fixed interest rate, into a special purpose tender option bond (“TOB”) trust (referred to as the “TOB Trust”) created by or at the direction of one or more Funds. In turn, the TOB Trust issues (a) floating rate certificates (referred to as “Floaters”), in face amounts equal to some fraction of the Underlying Bond’s par amount or market value, and (b) an inverse floating rate certificate (referred to as an “Inverse Floater”) that represents all remaining or residual interest in the TOB Trust. Floaters typically pay short-term tax-exempt interest rates to third parties who are also provided a right to tender their certificate and receive its par value, which may be paid from the proceeds of a remarketing of the Floaters, by a loan to the TOB Trust from a third party liquidity provider (“Liquidity Provider”), or by the sale of assets from the TOB Trust. The Inverse Floater is issued to a long term investor, such as one or more of the Funds. The income received by the Inverse Floater holder varies inversely with the short-term rate paid to holders of the Floaters, and in most circumstances the Inverse Floater holder bears substantially all of the Underlying Bond’s downside investment risk and also benefits disproportionately from any potential appreciation of the Underlying Bond’s value. The value of an Inverse Floater will be more volatile than that of the Underlying Bond because the interest rate is dependent on not only the fixed coupon rate of the Underlying Bond but also on the short-term interest paid on the Floaters, and because the Inverse Floater essentially bears the risk of loss (and possible gain) of the greater face value of the Underlying Bond.
The Inverse Floater held by a Fund gives the Fund the right to (a) cause the holders of the Floaters to tender their certificates at par (or slightly more than par in certain circumstances), and (b) have the trustee of the TOB Trust (the “Trustee”) transfer the Underlying Bond held by the TOB Trust to the Fund, thereby collapsing the TOB Trust.
The Fund may acquire an Inverse Floater in a transaction where it (a) transfers an Underlying Bond that it owns to a TOB Trust created by a third party or (b) transfers an Underlying Bond that it owns, or that it has purchased in a secondary market transaction for the purpose of creating an Inverse Floater, to a TOB Trust created at its direction, and in return receives the Inverse Floater of the TOB Trust (referred to as a “self-deposited Inverse Floater”). A Fund may also purchase an Inverse Floater in a secondary market transaction from a third party creator of the TOB Trust without first owning the Underlying Bond (referred to as an “externally-deposited Inverse Floater”).
An investment in a self-deposited Inverse Floater is accounted for as a “financing” transaction (i.e., a secured borrowing). For a self-deposited Inverse Floater, the Underlying Bond deposited into the TOB Trust is identified in the Fund’s Portfolio of Investments as “(UB) – Underlying bond of an inverse floating rate trust reflected as a financing transaction,” with the Fund recognizing as liabilities, labeled “Floating rate obligations” on the Statement of Assets and Liabilities, (a) the liquidation value of Floaters issued by the TOB Trust, and (b) the amount of any borrowings by the TOB Trust from a Liquidity Provider to enable the TOB Trust to purchase outstanding Floaters in lieu of a remarketing. In addition, the Fund recognizes in “Investment Income” the entire earnings of the Underlying Bond, and recognizes (a) the interest paid to the holders of the Floaters or on the TOB Trust’s borrowings, and (b) other expenses related to remarketing, administration, trustee, liquidity and other services to a TOB Trust, as a component of “Interest expense and amortization of offering costs” on the Statement of Operations. Earnings due from the Underlying Bond and interest due to the holders of the Floaters as of the end of the reporting period are recognized as components of “Receivable for interest” and “Payable for interest” on the Statement of Assets and Liabilities, respectively.
In contrast, an investment in an externally-deposited Inverse Floater is accounted for as a purchase of the Inverse Floater and is identified in the Fund’s Portfolio of Investments as “(IF) – Inverse floating rate investment.” For an externally-deposited Inverse Floater, a Fund’s Statement of Assets and Liabilities recognizes the Inverse Floater and not the Underlying Bond as an asset, and the Fund does not recognize the Floaters, or any related borrowings from a Liquidity Provider, as a liability. Additionally, the Fund reflects in “Investment Income” only the net amount of earnings on the Inverse Floater (net of the interest paid to the holders of the Floaters or the Liquidity Provider as lender, and the expenses of the Trust), and does not show the amount of that interest paid or the expenses of the TOB Trust as described above as interest expense on the Statement of Operations.
Fees paid upon the creation of a TOB Trust for self-deposited Inverse Floaters and externally-deposited Inverse Floaters are recognized as part of the cost basis of the Inverse Floater and are capitalized over the term of the TOB Trust.
As of the end of the reporting period, the aggregate value of Floaters issued by each Fund’s TOB Trust for self-deposited Inverse Floaters and externally-deposited Inverse Floaters was as follows:
| | | | | | | |
| Floating Rate Obligations Outstanding | | NAD | | | NEA | |
Floating rate obligations: self-deposited Inverse Floaters | | $ | 96,270,000 | | | $ | 105,790,000 | |
Floating rate obligations: externally-deposited Inverse Floaters | | | 49,340,000 | | | | 109,195,000 | |
Total | | $ | 145,610,000 | | | $ | 214,985,000 | |
118
During the current fiscal period, the average amount of Floaters (including any borrowings from a Liquidity Provider) outstanding, and the average annual interest rate and fees related to self-deposited Inverse Floaters, were as follows:
| | | | | | | |
| Self-Deposited Inverse Floaters | | NAD | | | NEA | |
Average floating rate obligations outstanding | | $ | 96,270,000 | | | $ | 107,067,473 | |
Average annual interest rate and fees | | | 1.88 | % | | | 1.83 | % |
TOB Trusts are supported by a liquidity facility provided by a Liquidity Provider pursuant to which the Liquidity Provider agrees, in the event that Floaters are (a) tendered to the Trustee for remarketing and the remarketing does not occur, or (b) subject to mandatory tender pursuant to the terms of the TOB Trust agreement, to either purchase Floaters or to provide the Trustee with an advance from a loan facility to fund the purchase of Floaters by the TOB Trust. In certain circumstances, the Liquidity Provider may otherwise elect to have the Trustee sell the Underlying Bond to retire the Floaters that were tendered and not remarketed prior to providing such a loan. In these circumstances, the Liquidity Provider remains obligated to provide a loan to the extent that the proceeds of the sale of the Underlying Bond is not sufficient to pay the purchase price of the Floaters.
The size of the commitment under the loan facility for a given TOB Trust is at least equal to the balance of that TOB Trust’s outstanding Floaters plus any accrued interest. In consideration of the loan facility, fee schedules are in place and are charged by the Liquidity Provider(s). Any loans made by the Liquidity Provider will be secured by the purchased Floaters held by the TOB Trust. Interest paid on any outstanding loan balances will be effectively borne by the Fund that owns the Inverse Floaters of the TOB Trust that has incurred the borrowing and may be at a rate that is greater than the rate that would have been paid had the Floaters been successfully remarketed.
As described above, any amounts outstanding under a liquidity facility are recognized as a component of “Floating rate obligations” on the Statement of Assets and Liabilities by the Fund holding the corresponding Inverse Floaters issued by the borrowing TOB Trust. As of the end of the reporting period, there were no loans outstanding under such facility.
Each Fund may also enter into shortfall and forbearance agreements (sometimes referred to as a “recourse arrangement”) (TOB Trusts involving such agreements are referred to herein as “Recourse Trusts”), under which a Fund agrees to reimburse the Liquidity Provider for the Trust’s Floaters, in certain circumstances, for the amount (if any) by which the liquidation value of the Underlying Bond held by the TOB Trust may fall short of the sum of the liquidation value of the Floaters issued by the TOB Trust plus any amounts borrowed by the TOB Trust from the Liquidity Provider, plus any shortfalls in interest cash flows. Under these agreements, a Fund’s potential exposure to losses related to or on an Inverse Floater may increase beyond the value of the Inverse Floater as a Fund may potentially be liable to fulfill all amounts owed to holders of the Floaters or the Liquidity Provider. Any such shortfall amount in the aggregate is recognized as “Unrealized depreciation on Recourse Trusts” on the Statement of Assets and Liabilities.
As of the end of the reporting period, each Fund’s maximum exposure to the Floaters issued by Recourse Trusts for self-deposited Inverse Floaters and externally-deposited Inverse Floaters was as follows:
| | | | | | | |
| Floating Rate Obligations — Recourse Trusts | | NAD | | | NEA | |
Maximum exposure to Recourse Trusts: self-deposited Inverse Floaters | | $ | 69,840,000 | | | $ | 102,775,000 | |
Maximum exposure to Recourse Trusts: externally-deposited Inverse Floaters | | | 38,265,000 | | | | 102,540,000 | |
Total | | $ | 108,105,000 | | | $ | 205,315,000 | |
Zero Coupon Securities
A zero coupon security does not pay a regular interest coupon to its holders during the life of the security. Income to the holder of the security comes from accretion of the difference between the original purchase price of the security at issuance and the par value of the security at maturity and is effectively paid at maturity. The market prices of zero coupon securities generally are more volatile than the market prices of securities that pay interest periodically.
Investment Transactions
Long-term purchases and sales (including maturities) during the current fiscal period were as follows:
| | | | | | | |
| | NAD | | | NEA | |
Purchases | | $ | 476,443,912 | | | $ | 617,972,457 | |
Sales and maturities | | | 512,631,277 | | | | 703,033,556 | |
The Funds may purchase securities on a when-issued or delayed-delivery basis. Securities purchased on a when-issued or delayed-delivery basis may have extended settlement periods; interest income is not accrued until settlement date. Any securities so purchased are subject to market fluctuation during this period. The Funds have earmarked securities in their portfolios with a current value at least equal to the amount of the when-issued/delayed
119
Notes to Financial Statements (Unaudited) (continued)
delivery purchase commitments. If a Fund has outstanding when-issued/delayed-delivery purchases commitments as of the end of the reporting period, such amounts are recognized on the Statement of Assets and Liabilities.
Investments in Derivatives
In addition to the inverse floating rate securities in which each Fund may invest, which are considered portfolio securities for financial reporting purposes, each Fund is authorized to invest in certain other derivative instruments such as futures, options and swap contracts. Each Fund limits its investments in futures, options on futures and swap contracts to the extent necessary for the Adviser to claim the exclusion from registration by the Commodity Futures Trading Commission as a commodity pool operator with respect to the Fund. The Funds record derivative instruments at fair value, with changes in fair value recognized on the Statement of Operations, when applicable. Even though the Funds’ investments in derivatives may represent economic hedges, they are not considered to be hedge transactions for financial reporting purposes.
Although the Funds are authorized to invest in derivative instruments, and may do so in the future, they did not make any such investments during the current fiscal period.
Market and Counterparty Credit Risk
In the normal course of business each Fund may invest in financial instruments and enter into financial transactions where risk of potential loss exists due to changes in the market (market risk) or failure of the other party to the transaction to perform (counterparty credit risk). The potential loss could exceed the value of the financial assets recorded on the financial statements. Financial assets, which potentially expose each Fund to counterparty credit risk, consist principally of cash due from counterparties on forward, option and swap transactions, when applicable. The extent of each Fund’s exposure to counterparty credit risk in respect to these financial assets approximates their carrying value as recorded on the Statement of Assets and Liabilities.
Each Fund helps manage counterparty credit risk by entering into agreements only with counterparties the Adviser believes have the financial resources to honor their obligations and by having the Adviser monitor the financial stability of the counterparties. Additionally, counterparties may be required to pledge collateral daily (based on the daily valuation of the financial asset) on behalf of each Fund with a value approximately equal to the amount of any unrealized gain above a pre-determined threshold. Reciprocally, when each Fund has an unrealized loss, the Funds have instructed the custodian to pledge assets of the Funds as collateral with a value approximately equal to the amount of the unrealized loss above a pre-determined threshold. Collateral pledges are monitored and subsequently adjusted if and when the valuations fluctuate, either up or down, by at least the pre-determined threshold amount.
5. Fund Shares
Common Share Transactions
Transactions in common shares for the Funds during the Funds’ current and prior fiscal period, where applicable, were as follows:
| | | | | | | | | | | | | |
| | NAD | | | NEA | |
| | Six Months | | | Year | | | Six Months | | | Year | |
| | Ended | | | Ended | | | Ended | | | Ended | |
| | 4/30/20 | | | 10/31/19 | | | 4/30/20 | | | 10/31/19 | |
| | |
Common shares: | | | | | | | | | | | | |
| Issued in the Merger | | | 9,784,676 | | | | — | | | | 15,869,620 | | | | — | |
| | |
Preferred Shares
Adjustable Rate MuniFund Term Preferred Shares
The Funds have issued and have outstanding Adjustable Rate MuniFund Term Preferred (“AMTP”) Shares, with a $100,000 liquidation preference per share. AMTP Shares are issued via private placement and are not publically available.
As of the end of the reporting period, NAD and NEA had $545,203,300 and $143,404,239 of AMTP Shares at liquidation preference, net of deferred offering costs, respectively. Further details of each Fund’s AMTP Shares outstanding as of the end of the reporting period, were as follows:
| | | | |
| | Shares | Liquidation |
| Fund | Series | Outstanding | Preference |
| NAD | 2028 | 3,370 | $337,000,000 |
| 2028-1 | 2,085 | $208,500,000 |
| NEA | 2028* | 1,435 | 143,500,000 |
* AMTP Shares issued in connection with the Merger.
Each Fund is obligated to redeem its AMTP Shares by the date as specified in its offering document (“Term Redemption Date”), unless earlier redeemed by the Fund. AMTP Shares are subject to optional and mandatory redemption in certain circumstances. The AMTP Shares may be redeemed
120
at the option of the Fund, subject to payment of premium for approximately six months following the date of issuance (“Premium Expiration Date”), and at the redemption price per share thereafter. The redemption price per share is equal to the sum of the liquidation preference per share plus any accumulated but unpaid dividends.
AMTP Shares are short-term or short/intermediate-term instruments that pay a variable dividend rate tied to a short-term index, plus an additional fixed “spread” amount which is initially established at the time of issuance and may be adjusted in the future based upon a mutual agreement between the majority owner and the Fund. From time-to-time the majority owner may propose to the Fund an adjustment to the dividend rate. Should the majority owner and the Fund fail to agree upon an adjusted dividend rate, and such proposed dividend rate adjustment is not withdrawn, the Fund will be required to redeem all outstanding shares upon the end of a notice period.
In addition, the Funds may be obligated to redeem a certain amount of the AMTP Shares if the Funds fails to maintain certain asset coverage and leverage ratio requirements and such failures are not cured by the applicable cure date. The Term Redemption Date and Premium Expiration Date for each Fund’s AMTP Shares are as follows:
| | | | | |
| Notice | | Term | Premium |
| Fund | Period | Series | Redemption Date | Expiration Date |
| NAD | 360-day | 2028 | December 1, 2028** | November 30, 2019 |
| 360-day | 2028-1 | December 1, 2028** | November 30, 2019 |
| NEA | 360-day | 2028 | December 1, 2028** | November 30, 2019 |
** Subject to early termination by either the Fund or the holder. |
The average liquidation preference of AMTP Shares outstanding and annualized dividend rate for the Fund during the current fiscal period were as follows:
| | | |
| NAD | NEA*** |
Average liquidation preference of AMTP Shares outstanding | 545,500,000 | 143,500,000 |
Annualized dividend rate | 2.24% | 1.98% |
*** For the period November 18, 2019 (Merger date) through April 30, 2020. |
AMTP Shares are subject to restrictions on transfer, generally do not trade, and market quotations are generally not available. The fair value of AMTP Shares is expected to be approximately their liquidation preference so long as the fixed “spread” on the AMTP Shares remains roughly in line with the “spread” being demanded by investors on instruments having similar terms in the current market environment. In present market conditions, the Funds’ Adviser has determined that the fair value of AMTP Shares is approximately their liquidation preference, but their fair value could vary if market conditions change materially. For financial reporting purposes, the liquidation preference of AMTP Shares is a liability and is recognized as a component of “Adjustable Rate MuniFund Term Preferred (“AMTP”) Shares, net of deferred offering costs” on the Statement of Assets and Liabilities.
AMTP Share dividends are treated as interest payments for financial reporting purposes. Unpaid dividends on AMTP Shares are recognized as a component of “Interest payable” on the Statement of Assets and Liabilities. Dividends accrued on AMTP Shares are recognized as a component of “Interest expense and amortization of offering costs” on the Statement of Operations.
Costs incurred in connection with each Fund’s offering of AMTP Shares were recorded as deferred charges, which are amortized over the life of the shares and are recognized as components of “Adjustable Rate MuniFund Term Preferred (“AMTP”) Shares, net of deferred offering costs” on the Statement of Assets and Liabilities and “Interest expense and amortization of offering costs” on the Statement of Operations.
MuniFund Preferred Shares
The Funds have issued and have outstanding MuniFund Preferred (“MFP”) Shares, with a $100,000 ($1,000 for NEA’s Series D) liquidation preference per share. These MFP Shares were issued via private placement and are not publically available.
The Funds are obligated to redeem their MFP Shares by the date as specified in its offering documents (“Term Redemption Date”), unless earlier redeemed by the Funds. MFP Shares are initially issued in a pre-specified mode, however, MFP Shares can be subsequently designated as an alternative mode at a later date at the discretion of the Funds. The modes within MFP Shares detail the dividend mechanics and are described as follows. At a subsequent date, the Funds may establish additional mode structures with the MFP Share.
• Variable Rate Remarketed Mode (“VRRM”) – Dividends for MFP Shares within this mode will be established by a remarketing agent; therefore, market value of the MFP Shares is expected to approximate its liquidation preference. Shareholders have the ability to request a best-efforts tender of its shares upon seven days notice. If the remarketing agent is unable to identify an alternative purchaser, the shares will be retained by the shareholder requesting tender and the subsequent dividend rate will increase to its step-up dividend rate. If after one consecutive year of unsuccessful remarketing attempts, the Fund will be required to designate an alternative mode or redeem the shares.
Each Fund will pay a remarketing fee on the aggregate principal amount of all MFP Shares while designated in VRRM. Payments made by the Fund to the remarketing agent are recognized as “Remarketing fees” on the Statement of Operations.
121
Notes to Financial Statements (Unaudited) (continued)
• Variable Rate Mode (“VRM”) – Dividends for MFP Shares designated in this mode are based upon a short-term index plus an additional fixed “spread” amount established at the time of issuance or renewal / conversion of its mode. At the end of the period of the mode, the Fund will be required to either extend the term of the mode, designate an alternative mode or redeem the MFP Shares.
The fair value of MFP Shares while in VRM are expected to approximate their liquidation preference so long as the fixed “spread” on the shares remains roughly in line with the “spread” being demanded by investors on instruments having similar terms in the current market. In current market conditions, the Adviser has determined that the fair value of the shares are approximately their liquidation preference, but their fair value could vary if market conditions change materially.
• Variable Rate Demand Mode (“VRDM”) – Dividends for MFP Shares designated in this mode will be established by a remarketing agent; therefore, the market value of the MFP Shares is expected to approximate its liquidation preference. While in this mode, Shares will have an unconditional liquidity feature that enable its shareholders to require a liquidity provider, which the Fund has entered into a contractual agreement, to purchase shares in the event that the shares are not able to be successfully remarketed. In the event that shares within this mode are unable to be successfully remarketed and are purchased by the liquidity provider, the dividend rate will be the maximum rate which is designed to escalate according to a specified schedule in order to enhance the remarketing agent’s ability to successfully remarket the shares. Each Fund is required redeem any shares that are still owned by a liquidity provider after six months of continuous, unsuccessful remarketing.
The Fund will pay a liquidity and remarketing fee on the aggregate principal amount of all MFP shares while within VRDM. Payments made by the Fund to the liquidity provider and remarketing agent are recognized as “Liquidity fees” and “Remarketing fees”, respectively, on the Statement Operations.
For financial reporting purposes, the liquidation preference of MFP Shares is recorded as a liability and is recognized as a component of “MuniFund Preferred (“MFP”) Shares, net of deferred offering costs” on the Statement of Assets and Liabilities. Dividends on the MFP shares are treated as interest payments for financial reporting purposes. Unpaid dividends on MFP shares are recognized as a component on “Interest payable” on the Statement of Assets and Liabilities. Dividends accrued on MFP Shares are recognized as a component of “Interest expense and amortization of offering costs” on the Statement of Operations.
Subject to certain conditions, MFP Shares may be redeemed, in whole or in part, at any time at the option of the Fund. The Fund may also be required to redeem certain MFP shares if the Fund fails to maintain certain asset coverage requirements and such failures are not cured by the applicable cure date. The redemption price per share in all circumstances is equal to the liquidation preference per share plus any accumulated but unpaid dividends.
Costs incurred in connection with each Fund’s offering of MFP Shares were recorded as a deferred charges, which are amortized over the life of the shares and are recognized as a component of “MuniFund Preferred (“MFP”) Shares, net of deferred offering costs” on the Statement of Assets and Liabilities and “Interest expense and amortization of offering costs” on the Statement of Operations.
In conjunction with NEA’s redemption of MFP shares, deferred costs of $122,524 were expensed during the current fiscal period, as the redemption was deemed an extinguishment of debt.
| | | | | | | |
| | Shares | Liquidation | Term | | Mode |
| Fund | Series | Outstanding | Preference | Redemption Date | Mode | Termination Date |
| NAD | A | 6,070 | $607,000,000 | January 3, 2028 | VRM | January 3, 2028** |
| B* | 720 | 72,000,000 | September 1, 2047 | VRM | September 28, 2022 |
| NEA | A | 1,850 | $185,000,000 | February 3, 2048 | VRM | February 3, 2048** |
| B | 3,350 | 335,000,000 | March 2, 2028 | VRM | March 2, 2028** |
| C | 2,380 | 238,000,000 | March 2, 2028 | VRM | March 2, 2028** |
| D | 200,000 | 200,000,000 | March 1, 2029 | VRRM | N/A |
* MFP Shares issued in connection with the Merger.
** Subject to earlier termination by either the Fund or the shareholder.
The average liquidation preference of MFP Shares outstanding and annualized dividend rate for the Funds during the current fiscal period were as follows:
| | | | | | | |
| | NAD | | | NEA | |
Average liquidation preference of MFP Shares outstanding | | $ | 635,879,121 | | | $ | 958,000,000 | |
Annualized dividend rate | | | 1.91 | % | | | 1.95 | % |
Variable Rate Demand Preferred Shares
The Funds have issued and have outstanding Variable Rate Demand Preferred (“VRDP”) Shares, with a $100,000 liquidation preference per share. VRDP Shares are issued via private placement and are not publicly available.
122
As of the end of the reporting period, NAD and NEA had $630,019,736 and $1,283,550,927 of VRDP Shares at liquidation preference, net of deferred offering costs, respectively. Further details of the Funds’ VRDP Shares outstanding as of the end of the reporting period, were as follows:
| | | | | | |
| | Shares | Remarketing | Liquidation | |
| Fund | Series | Outstanding | Fee* | Preference | Maturity |
| NAD | 1 | 2,368 | 0.10% | $236,800,000 | September 11, 2026 |
| 2 | 2,675 | 0.10 | 267,500,000 | September 11, 2026 |
| 3 | 1,277 | 0.10 | 127,700,000 | September 11, 2026 |
| NEA | 1 | 2,190 | 0.10% | $219,000,000 | June 1, 2040 |
| 2 | 1,309 | 0.08 | 130,900,000 | December 1, 2040 |
| 3 | 3,509 | 0.05 | 350,900,000 | March 1, 2040 |
| 4 | 4,895 | 0.10 | 489,500,000 | September 11, 2026 |
| 5 | 1,000 | 0.10 | 100,000,000 | October 1, 2046 |
* Remarketing fees as a percentage of aggregate principal amount of all VRDP Shares outstanding of each series.
VRDP Shares include a liquidity feature that allows VRDP shareholders to have their shares purchased by a liquidity provider with whom each Fund has contracted in the event that VRDP Shares are not able to be successfully remarketed. Each Fund is required to redeem any VRDP Shares that are still owned by the liquidity provider after six months of continuous, unsuccessful remarketing. Each Fund pays an annual remarketing fee on the aggregate principal amount of all VRDP Shares outstanding. Each Fund’s VRDP Shares have successfully remarketed since issuance.
Dividends on the VRDP Shares (which are treated as interest payments for financial reporting purposes) are set at a rate established by a remarketing agent; therefore, the market value of the VRDP Shares is expected to approximate its liquidation preference. In the event that VRDP shares are unable to be successfully remarketed, the dividend rate will be the maximum rate which is designed to escalate according to a specified schedule in order to enhance the remarketing agent’s ability to successfully remarket the VRDP Shares.
Subject to certain conditions, VRDP Shares may be redeemed, in whole or in part, at any time at the option of each Fund. Each Fund may also redeem certain of the VRDP Shares if the Fund fails to maintain certain asset coverage requirements and such failures are not cured by the applicable cure date. The redemption price per share is equal to the sum of the liquidation preference per share plus any accumulated but unpaid dividends.
The average liquidation preference of VRDP Shares outstanding and annualized dividend rate for each Fund during the current fiscal period were as follows:
| | | | | | | |
| | NAD | | | NEA | |
Average liquidation preference of VRDP Shares outstanding | | $ | 632,000,000 | | | $ | 1,290,300,000 | |
Annualized dividend rate | | | 1.56 | % | | | 1.46 | % |
For financial reporting purposes, the liquidation preference of VRDP Shares is a liability and is recognized as a component of “Variable Rate Demand Preferred (“VRDP”) Shares, net of deferred offering costs” on the Statement of Assets and Liabilities. Unpaid dividends on VRDP Shares are recognized as a component of “Interest payable” on the Statement of Assets and Liabilities, when applicable. Dividends accrued on VRDP Shares are recognized as a component of “Interest expense and amortization of offering costs” on the Statement of Operations. Costs incurred by the Funds in connection with their offerings of VRDP Shares were recorded as a deferred charge, which are amortized over the life of the shares and are recognized as a component of “Variable Rate Demand Preferred (“VRDP”) Shares, net of deferred offering costs” on the Statement of Assets and Liabilities and “Interest expense and amortization of offerings costs” on the Statement of Operations. In addition to interest expense, each Fund also pays a per annum liquidity fee to the liquidity provider, as well as a remarketing fee, which are recognized as “Liquidity fees” and “Remarketing fees,” respectively, on the Statement of Operations.
Preferred Share Transactions
Transactions in preferred shares for the Funds during the Funds’ current and prior fiscal period, where applicable, are noted in the following tables.
| |
Transactions in AMTP Shares for the Funds, where applicable, were as follows: |
| | Six Months Ended | |
| | April 30, 2020 | |
| NEA | | Series | | | Shares | | | Amount | |
AMTP Shares issued in connection with the Merger | | 2028 | | | | 1,435 | | | | 143,500,000 | |
| | | | |
| | Year Ended | |
| | October 31, 2019 | |
| NAD | | Series | | | Shares | | | Amount | |
AMTP Shares issued | | 2028 | | | | 3,370 | | | $ | 337,000,000 | |
| | | 2028-1 | | | | 2,085 | | | | 208,500,000 | |
Net increase (decrease) | | | | | | | 5,455 | | | $ | 545,500,000 | |
123
| |
| Notes to Financial Statements (Unaudited) (continued) |
|
|
Transactions in MFP Shares for the Funds, where applicable, were as follows: |
| | | | | | | |
| | Six Months Ended April 30, 2020 | |
| NAD | | Series | | | Shares | | | Amount | |
MFP Shares issued in connection with the Merger | | | B |
| | | 720 | | | $ | 72,000,000 | |
| | | | |
| | Year Ended October 31, 2019 | |
| NEA | | Series | | | Shares | | | Amount | |
MFP Shares issued | | | D |
| | | 200,000 | | | $ | 200,000,000 | |
MFP Shares redeemed | | | B |
| | | (2,000 | ) | | | (200,000,000 | ) |
Net increase (decrease) | | | | | | | 198,000 | | | $ | — | |
| | | | | | | | | | | | | |
Transactions VMTP Shares for the Funds, where applicable, were as follows: | |
| | | | |
| | Year Ended October 31, 2019 | |
| NAD | | Series | | | Shares | | | Amount | |
VMTP Shares redeemed | | | 2019 | | | | (3,370 | ) | | $ | (337,000,000 | ) |
| | | 2019-1 | | | | (2,085 | ) | | | (208,500,000 | ) |
Net increase (decrease) | | | | | | | (5,455 | ) | | $ | (545,500,000 | ) |
6. Income Tax Information
Each Fund is a separate taxpayer for federal income tax purposes. Each Fund intends to distribute substantially all of its net investment income and net capital gains to shareholders and to otherwise comply with the requirements of Subchapter M of the Internal Revenue Code applicable to regulated investment companies. Therefore, no federal income tax provision is required. Furthermore, each Fund intends to satisfy conditions that will enable interest from municipal securities, which is exempt from regular federal income tax, and in the case of NEA the alternative minimum tax applicable to individuals, to retain such tax-exempt status when distributed to shareholders of the Funds. Net realized capital gains and ordinary income distributions paid by the Funds are subject to federal taxation.
For all open tax years and all major taxing jurisdictions, management of the Funds has concluded that there are no significant uncertain tax positions that would require recognition in the financial statements. Open tax years are those that are open for examination by taxing authorities (i.e., generally the last four tax year ends and the interim tax period since then). Furthermore, management of the Funds is also not aware of any tax positions for which it is reasonably possible that the total amounts of unrecognized tax benefits will significantly change in the next twelve months.
The following information is presented on an income tax basis. Differences between amounts for financial statement and federal income tax purposes are primarily due to timing differences in recognizing taxable market discount, timing differences in recognizing certain gains and losses on investment transactions and the treatment of investments in inverse floating rate securities reflected as financing transactions, if any. To the extent that differences arise that are permanent in nature, such amounts are reclassified within the capital accounts as detailed below. Temporary differences do not require reclassification. Temporary and permanent differences do not impact the NAVs of the Funds.
The table below presents the cost and unrealized appreciation (depreciation) of each Fund’s investment portfolio, as determined on a federal income tax basis, as of April 30, 2020.
| | | | | | | |
| | NAD | | | NEA | |
Tax cost of investments | | $ | 4,654,618,420 | | | $ | 5,932,100,405 | |
Gross unrealized: | | | | | | | | |
| Appreciation | | $ | 289,887,405 | | | $ | 414,836,541 | |
| Depreciation | | | (54,256,048 | ) | | | (66,272,696 | ) |
Net unrealized appreciation (depreciation) of investments | | $ | 235,631,357 | | | $ | 348,563,845 | |
Permanent differences, primarily due to federal taxes paid, nondeductible offering costs, distribution reallocations and taxable market discount resulted in reclassifications among the Funds’ components of common share net assets as of October 31, 2019, the Funds’ last tax year end.
124
The tax components of undistributed net tax-exempt income, net ordinary income and net long-term capital gains as of October 31, 2019, the Funds’ last tax year end, were as follows:
| | | | | | | |
| | NAD | | | NEA | |
Undistributed net tax-exempt income1 | | $ | 5,990,349 | | | $ | 8,561,503 | |
Undistributed net ordinary income2 | | | 720,895 | | | | 91,755 | |
Undistributed net long-term capital gains | | | — | | | | — | |
1
| Undistributed net tax-exempt income (on a tax basis) has not been reduced for the dividend declared on October 1, 2019, and paid on November 1, 2019. |
2
| Net ordinary income consists of taxable market discount income and net short-term capital gains, if any. |
The tax character of distributions paid during the Funds’ last tax year ended October 31, 2019 was designated for purposes of the dividends paid deduction as follows:
| | | | | | | |
| | NAD | | | NEA | |
Distributions from net tax-exempt income | | $ | 167,683,147 | | | $ | 210,049,046 | |
Distributions from net ordinary income2 | | | 688,426 | | | | 2,274,731 | |
Distributions from net long-term capital gains | | | — | | | | — | |
2
| Net ordinary income consists of taxable market discount income and net short-term capital gains, if any.
|
As of October 31, 2019, the Funds’ last tax year end, the Funds had unused capital losses carrying forward available for federal income tax purposes to be applied against future capital gains, if any. The capital losses are not subject to expiration.
| | | | | | | |
| | NAD4 | | | NEA4 | |
Not subject to expiration: | | | | | | |
| Short-term | | $ | 28,637,706 | | | | 24,735,519 | |
| Long-term | | | 10,136,511 | | | | 28,357,683 | |
Total | | $ | 38,774,217 | | | $ | 53,093,202 | |
4
| A portion of NAD’s and NEA’s capital loss carryforwards are subject to an annual limitation under the Internal Revenue Code and related regulations. |
During the Funds’ last tax year ended October 31, 2019, the Funds utilized capital loss carryforwards as follows: | | |
| | | | | | | |
| | NAD | | | NEA | |
Utilized capital loss carryforwards | | $ | 1,025,793 | | | $ | 1,089,151 | |
7. Management Fees and Other Transactions with Affiliates
Management Fees
Each Fund’s management fee compensates the Adviser for overall investment advisory and administrative services and general office facilities. The Sub-Adviser is compensated for its services to the Funds from the management fees paid to the Adviser.
Each Fund’s management fee consists of two components – a fund-level fee, based only on the amount of assets within each individual Fund, and a complex-level fee, based on the aggregate amount of all eligible fund assets managed by the Adviser. This pricing structure enables Fund shareholders to benefit from growth in the assets within their respective Fund as well as from growth in the amount of complex-wide assets managed by the Adviser.
The annual fund-level fee, payable monthly, for each Fund is calculated according to the following schedule: |
| | | | |
| Averaged Daily Managed Assets* | | Fund-Level Fee Rate | |
For the first $125 million | | | 0.4500 | % |
For the next $125 million | | | 0.4375 | |
For the next $250 million | | | 0.4250 | |
For the next $500 million | | | 0.4125 | |
For the next $1 billion | | | 0.4000 | |
For the next $3 billion | | | 0.3750 | |
For managed assets over $5 billion | | | 0.3625 | |
125
Notes to Financial Statements (Unaudited) (continued)
The annual complex-level fee, payable monthly, for each Fund is calculated by multiplying the current complex-wide fee rate, determined according to the following schedule by the Fund’s daily managed assets:
| | | | |
| Complex-Level Eligible Asset Breakpoint Level* | | Effective Complex-Level Fee Rate at Breakpoint Level | |
$55 billion | | | 0.2000 | % |
$56 billion | | | 0.1996 | |
$57 billion | | | 0.1989 | |
$60 billion | | | 0.1961 | |
$63 billion | | | 0.1931 | |
$66 billion | | | 0.1900 | |
$71 billion | | | 0.1851 | |
$76 billion | | | 0.1806 | |
$80 billion | | | 0.1773 | |
$91 billion | | | 0.1691 | |
$125 billion | | | 0.1599 | |
$200 billion | | | 0.1505 | |
$250 billion | | | 0.1469 | |
$300 billion | | | 0.1445 | |
*
| For the complex-level fees, managed assets include closed-end fund assets managed by the Adviser that are attributable to certain types of leverage. For these purposes, leverage includes the funds’ use of preferred stock and borrowings and certain investments in the residual interest certificates (also called inverse floating rate securities) in tender option bond (TOB) trusts, including the portion of assets held by a TOB trust that has been effectively financed by the trust’s issuance of floating rate securities, subject to an agreement by the Adviser as to certain funds to limit the amount of such assets for determining managed assets in certain circumstances. The complex-level fee is calculated based upon the aggregate daily managed assets of all Nuveen open-end and closed-end funds that constitute “eligible assets.” Eligible assets do not include assets attributable to investments in other Nuveen funds or assets in excess of a determined amount (originally $2 billion) added to the Nuveen fund complex in connection with the Adviser’s assumption of the management of the former First American Funds effective January 1, 2011, but do not include certain Nuveen Funds that were reorganized into funds advised by an affiliate of the Adviser during the 2019 calendar year. As of April 30, 2020, the complex-level fee for each Fund was 0.1593%. |
Other Transactions with Affiliates
Each Fund is permitted to purchase or sell securities from or to certain other funds or accounts managed by the Sub-Adviser (“Affiliated Entity”) under specified conditions outlined in procedures adopted by the Board (“cross-trade”). These procedures have been designed to ensure that any cross-trade of securities by the Fund from or to an Affiliated Entity by virtue of having a common investment adviser (or affiliated investment adviser), common officer and/or common trustee complies with Rule 17a-7 under the 1940 Act. These transactions are effected at the current market price (as provided by an independent pricing service) without incurring broker commissions.
| |
During the current fiscal period, the Funds engaged in cross-trades pursuant to these procedures as follows: |
| | | | | | | |
| Cross-Trades | | NAD | | | NEA | |
Purchases | | $ | 55,220,021 | | | $ | 27,138,846 | |
Sales | | | 21,164,906 | | | | 27,307,746 | |
8. Borrowing Arrangements
Committed Line of Credit
The Funds, along with certain other funds managed by the Adviser (“Participating Funds”), have established a 364-day, $2.65 billion standby credit facility with a group of lenders, under which the Participating Funds may borrow for various purposes other than leveraging for investment purposes. Each Participating Fund is allocated a designated proportion of the facility’s capacity (and its associated costs, as described below) based upon a multi-factor assessment of the likelihood and frequency of its need to draw on the facility, the size of the Fund and its anticipated draws, and the potential importance of such draws to the operations and well-being of the Fund, relative to those of the other Funds. A Fund may effect draws on the facility in excess of its designated capacity if and to the extent that other Participating Funds have undrawn capacity. The credit facility expires in June 2020 unless extended or renewed.
The credit facility has the following terms: a fee of 0.15% per annum on unused commitment amounts, and interest at a rate equal to the higher of (a) one-month LIBOR (London Inter-Bank Offered Rate) plus 1.00% per annum or (b) the Fed Funds rate plus 1.00% per annum on amounts borrowed. Participating Funds paid administration, legal and arrangement fees, which are recognized as a component of “Other expenses” on the Statement of Operations, and along with commitment fees, have been allocated among such Participating Funds based upon the relative proportions of the facility’s aggregate capacity reserved for them and other factors deemed relevant by the Adviser and the Board of each Participating Fund.
126
During the current fiscal period, the Funds utilized this facility. The Funds’ maximum outstanding balance during the utilization period was as follows:
| | | | | | | |
| | NAD | | | NEA | |
Maximum outstanding balance | | $ | 9,619,672 | | | $ | 17,695,323 | |
During the Funds’ utilization period(s), during the current fiscal period, the average daily balance outstanding and average annual interest rate on the Borrowings were as follows:
| | | | | | | |
| | NAD | | | NEA | |
Utilization period (days outstanding) | | | 2 | | | | 2 | |
Average daily balance outstanding | | $ | 9,619,672 | | | $ | 17,695,323 | |
Average annual interest rate | | | 2.76 | % | | | 2.76 | % |
Borrowings outstanding as of the end of the reporting period are recognized as “Borrowings” on the Statement of Assets and Liabilities, where applicable.
Inter-Fund Borrowing and Lending
The Securities and Exchange Commission (“SEC”) has granted an exemptive order permitting registered open-end and closed-end Nuveen funds to participate in an inter-fund lending facility whereby the Nuveen funds may directly lend to and borrow money from each other for temporary purposes (e.g., to satisfy redemption requests or when a sale of securities “fails,” resulting in an unanticipated cash shortfall) (the “Inter-Fund Program”). The closed-end Nuveen funds, including the Funds covered by this shareholder report, will participate only as lenders, and not as borrowers, in the Inter-Fund Program because such closed-end funds rarely, if ever, need to borrow cash to meet redemptions. The Inter-Fund Program is subject to a number of conditions, including, among other things, the requirements that (1) no fund may borrow or lend money through the Inter-Fund Program unless it receives a more favorable interest rate than is typically available from a bank or other financial institution for a comparable transaction; (2) no fund may borrow on an unsecured basis through the Inter-Fund Program unless the fund’s outstanding borrowings from all sources immediately after the inter-fund borrowing total 10% or less of its total assets; provided that if the borrowing fund has a secured borrowing outstanding from any other lender, including but not limited to another fund, the inter-fund loan must be secured on at least an equal priority basis with at least an equivalent percentage of collateral to loan value; (3) if a fund’s total outstanding borrowings immediately after an inter-fund borrowing would be greater than 10% of its total assets, the fund may borrow through the inter-fund loan on a secured basis only; (4) no fund may lend money if the loan would cause its aggregate outstanding loans through the Inter-Fund Program to exceed 15% of its net assets at the time of the loan; (5) a fund’s inter-fund loans to any one fund shall not exceed 5% of the lending fund’s net assets; (6) the duration of inter-fund loans will be limited to the time required to receive payment for securities sold, but in no event more than seven days; and (7) each inter-fund loan may be called on one business day’s notice by a lending fund and may be repaid on any day by a borrowing fund. In addition, a Nuveen fund may participate in the Inter-Fund Program only if and to the extent that such participation is consistent with the fund’s investment objective and investment policies. The Board is responsible for overseeing the Inter-Fund Program.
The limitations detailed above and the other conditions of the SEC exemptive order permitting the Inter-Fund Program are designed to minimize the risks associated with Inter-Fund Program for both the lending fund and the borrowing fund. However, no borrowing or lending activity is without risk. When a fund borrows money from another fund, there is a risk that the loan could be called on one day’s notice or not renewed, in which case the fund may have to borrow from a bank at a higher rate or take other actions to payoff such loan if an inter-fund loan is not available from another fund. Any delay in repayment to a lending fund could result in a lost investment opportunity or additional borrowing costs.
During the current reporting period, none of the Funds covered by this shareholder report have entered into any inter-fund loan activity.
9. Fund Mergers
The Mergers as previously described in Note 1 — General Information was structured to qualify as tax-free mergers under the Internal Revenue Code for federal income tax purposes, and the Target Funds' shareholders recognized no gain or loss for federal income tax purposes as a result. Prior to the closing of the Mergers, the Target Funds distributed all of its net investment income and capital gains, if any. Such a distribution may be taxable to the Target Funds' shareholders for federal income tax purposes.
Investments
The cost, fair value and net unrealized appreciation (depreciation) of the investments (including investments in derivatives) of the Target Funds as of the date of the Mergers, were as follows:
| | | | |
| | NTX | |
Cost of investments | | $ | 200,225,096 | |
Fair value of investments | | | 224,050,174 | |
Net unrealized appreciation (depreciation) of investments | | | 23,825,078 | |
127
| | |
| Notes to Financial Statements (Unaudited) (continued) | |
|
|
| | |
| | NNC | |
Cost of investments | | $ | 350,894,498 | |
Fair value of investments | | | 377,247,850 | |
Net unrealized appreciation (depreciation) of investments | | | 26,353,352 | |
For financial reporting purposes, assets received and shares issued by the Acquiring Funds were recorded at fair value; however, the cost basis of the investments received from the Target Funds were carried forward to align ongoing reporting of the Acquiring Funds' realized and unrealized gains and losses with amounts distributable to shareholders for tax purposes.
Common Shares
The common shares outstanding, net assets applicable to common shares and NAV per common share outstanding immediately before and after the Mergers were as follows:
| | | | |
| Target Fund – Prior to Merger | | NTX | |
Common shares outstanding | | | 9,958,610 | |
Net assets applicable to common shares | | $ | 159,102,613 | |
NAV per common share outstanding | | $ | 15.98 | |
| Target Fund – Prior to Merger | | NNC | |
Common shares outstanding | | | 16,233,508 | |
Net assets applicable to common shares | | $ | 245,521,737 | |
NAV per common share outstanding | | $ | 15.12 | |
| Acquiring Fund – Prior to Merger | | NAD | |
Common shares outstanding | | | 201,864,367 | |
Net assets applicable to common shares | | $ | 3,282,394,250 | |
NAV per common share outstanding | | $ | 16.26 | |
| Acquiring Fund – Prior to Merger | | NEA | |
Common shares outstanding | | | 262,720,647 | |
Net assets applicable to common shares | | $ | 4,064,612,193 | |
NAV per common share outstanding | | $ | 15.47 | |
| Acquiring Fund – Post Merger | | NAD | |
Common shares outstanding | | | 211,649,043 | |
Net assets applicable to common shares | | $ | 3,441,496,863 | |
NAV per common share outstanding | | $ | 16.26 | |
| Acquiring Fund – Post Merger | | NEA | |
Common shares outstanding | | | 278,590,267 | |
Net assets applicable to common shares | | $ | 4,310,133,930 | |
NAV per common share outstanding | | $ | 15.47 | |
Pro Forma Results of Operations
The beginning of the Target Funds' current fiscal periods were March 1, 2019 for NTX, and June 1, 2019 for NNC. Assuming the Merger had been completed on November 1, 2019, the beginning of the Acquiring Fund’s current fiscal period, the pro forma results of operations for each Fund’s current fiscal period, are as follows:
| | | | |
| Acquiring Fund – Pro Forma Results from Operations | | NAD | |
Net investment income (loss) | | $ | 68,754,184 | |
Net realized and unrealized gains (losses) | | | (259,340,487 | ) |
Change in net assets resulting from operations | | | (190,586,303 | ) |
128
| | | | |
| Acquiring Fund – Pro Forma Results from Operations | | NEA | |
Net investment income (loss) | | $ | 89,265,142 | |
Net realized and unrealized gains (losses) | | | (314,053,669 | ) |
Change in net assets resulting from operations | | | (224,788,528 | ) |
Because the combined investment portfolios for each Merger have been managed as a single integrated portfolio since the Merger was completed, it is not practicable to separate the amounts of revenue and earnings of the Target Funds that have been included in the Statement of Operations for their respective Acquiring Fund since the Mergers were consummated.
Cost and Expenses
In connection with the Merger, the Acquiring Fund incurred certain associated costs and expenses. Such amounts were included as components of “Accrued other expenses” on the Statement of Assets and Liabilities and “Merger expenses” on the Statement of Operations.
10. Subsequent Events
Committed Line of Credit
During June 2020, the Participating Funds renewed the standby credit facility through June 2021. In conjunction with this renewal the commitment amount decreased from $2.65 billion to $2.405 billion and the interest rate increased from LIBOR plus 1.00% to LIBOR plus 1.25%. The Participating Funds also incurred a 0.10% upfront fee. All other terms remain unchanged.
129
Additional FundInformation | | | | | | | |
| Board of Trustees | | | | | | |
Jack B. Evans | William C. Hunter | Albin F. Moschner | John K. Nelson | Judith M. Stockdale | Carole E. Stone |
Terence J. Toth | Margaret L. Wolff | Robert L. Young | | | | |
|
| Investment Adviser | Custodian | Legal Counsel | | Independent Registered | Transfer Agent and |
Nuveen Fund Advisors, LLC | State Street Bank | Chapman and Cutler LLP | Public Accounting Firm | Shareholder Services |
333 West Wacker Drive | & Trust Company | Chicago, IL 60603 | | KPMG LLP | Computershare Trust |
Chicago, IL 60606 | One Lincoln Street | | | 200 East Randolph Street | Company, N.A. |
| Boston, MA 02111 | | | Chicago, IL 60601 | 150 Royall Street |
| | | | | | Canton, MA 02021 |
| | | | | | (800) 257-8787 |
|
Portfolio of Investments InformationEach Fund is required to file its complete schedule of portfolio holdings with the Securities and Exchange Commission (SEC) for the first and third quarters of each fiscal year as an exhibit to its report on Form N-PORT. You may obtain this information on the SEC’s website at http://www.sec.gov.
Nuveen Funds’ Proxy Voting InformationYou may obtain (i) information regarding how each fund voted proxies relating to portfolio securities held during the most recent twelve-month period ended June 30, without charge, upon request, by calling Nuveen toll-free at (800) 257-8787 or on Nuveen’s website at www.nuveen.com and (ii) a description of the policies and procedures that each fund used to determine how to vote proxies relating to portfolio securities without charge, upon request, by calling Nuveen toll free at (800) 257-8787. You may also obtain this information directly from the SEC. Visit the SEC on-line at http://www.sec.gov.
CEO Certification DisclosureEach Fund’s Chief Executive Officer (CEO) has submitted to the New York Stock Exchange (NYSE) the annual CEO certification as required by Section 303A.12(a) of the NYSE Listed Company Manual. Each Fund has filed with the SEC the certification of its CEO and Chief Financial Officer required by Section 302 of the Sarbanes-Oxley Act.
Common Share RepurchasesEach Fund intends to repurchase, through its open-market share repurchase program, shares of its own common stock at such times and in such amounts as is deemed advisable. During the period covered by this report, each Fund repurchased shares of its common stock as shown in the accompanying table. Any future repurchases will be reported to shareholders in the next annual or semi-annual report.
| | | |
| NAD | NEA |
Common shares repurchased | — | — |
FINRA BrokerCheck
The Financial Industry Regulatory Authority (FINRA) provides information regarding the disciplinary history of FINRA member firms and associated investment professionals. This information as well as an investor brochure describing FINRA BrokerCheck is available to the public by calling the FINRA BrokerCheck Hotline number at (800) 289-9999 or by visiting www.FINRA.org.
130Glossary of Terms Used in this Report
■ Average Annual Total Return: This is a commonly used method to express an investment’s performance over a particular, usually multi-year time period. It expresses the return that would have been necessary each year to equal the investment’s actual cumulative performance (including change in NAV or market price and reinvested dividends and capital gains distributions, if any) over the time period being considered.
■ Duration: Duration is a measure of the expected period over which a bond’s principal and interest will be paid, and consequently is a measure of the sensitivity of a bond’s or bond fund’s value to changes when market interest rates change. Generally, the longer a bond’s or fund’s duration, the more the price of the bond or fund will change as interest rates change.
■ Effective Leverage: Effective leverage is a fund’s effective economic leverage, and includes both regulatory leverage (see leverage) and the leverage effects of certain derivative investments in the fund’s portfolio. Currently, the leverage effects of Tender Option Bond (TOB) inverse floater holdings are included in effective leverage values, in addition to any regulatory leverage.
■ Inverse Floating Rate Securities: Inverse floating rate securities, also known as inverse floaters or tender option bonds (TOBs), are created by depositing a municipal bond, typically with a fixed interest rate, into a special purpose trust. This trust, in turn, (a) issues floating rate certificates typically paying short-term tax-exempt interest rates to third parties in amounts equal to some fraction of the deposited bond’s par amount or market value, and (b) issues an inverse floating rate certificate (sometimes referred to as an “inverse floater”) to an investor (such as a fund) interested in gaining investment exposure to a long-term municipal bond. The income received by the holder of the inverse floater varies inversely with the short-term rate paid to the floating rate certificates’ holders, and in most circumstances the holder of the inverse floater bears substantially all of the underlying bond’s downside investment risk. The holder of the inverse floater typically also benefits disproportionately from any potential appreciation of the underlying bond’s value. Hence, an inverse floater essentially represents an investment in the underlying bond on a leveraged basis.
■ Leverage: Leverage is created whenever a fund has investment exposure (both reward and/or risk) equivalent to more than 100% of the investment capital.
■ NAD and NEA Custom Blended Fund Performance Benchmark: The Fund Performance Benchmark is an unleveraged index consisting of the returns of the S&P Municipal Bond Index prior to 9/12/16 and thereafter the returns of an 80%/20% blend of the S&P Municipal Bond Investment Grade Index and the S&P Municipal Bond High Yield Index, respectively. The S&P Municipal Bond Index is an unmanaged, market value-weighted index designed to measure the performance of tax-exempt municipal bonds. The S&P Municipal Bond Investment Grade Index is an unmanaged, market value-weighted index designed to measure the performance of tax-exempt municipal bonds rated investment grade by Standard & Poor’s, Moody’s and/or Fitch. The S&P Municipal Bond High Yield Index is an unmanaged, market value-weighted index designed to measure the performance of the tax-exempt, high yield municipal bonds. Index returns assume compounding and do not include the effects of any fees or expenses.
■ Net Asset Value (NAV) Per Share: A fund’s Net Assets is equal to its total assets (securities, cash, accrued earnings and receivables) less its total liabilities. NAV per share is equal to the fund’s Net Assets divided by its number of shares outstanding.
■ Pre-Refunding: Pre-Refunding, also known as advanced refundings or refinancings, is a procedure used by state and local governments to refinance municipal bonds to lower interest expenses. The issuer sells new bonds with a lower yield and uses the proceeds to buy U.S. Treasury securities, the interest from which is used to make payments on the higher-yielding bonds. Because of this collateral, pre-refunding generally raises a bond’s credit rating and thus its value.
131
Glossary of Terms Used in this Report (continued)
■ Regulatory Leverage: Regulatory leverage consists of preferred shares issued by or borrowings of a fund. Both of these are part of a fund’s capital structure. Regulatory leverage is subject to asset coverage limits set in the Investment Company Act of 1940.
■ S&P Municipal Bond Index: An unleveraged, market value-weighted index designed to measure the performance of the tax-exempt, investment-grade U.S. municipal bond market. Index returns assume reinvestment of distributions, but do not reflect any applicable sales charges or management fees.
■ Total Investment Exposure: Total investment exposure is a fund’s assets managed by the Adviser that are attributable to financial leverage. For these purposes, financial leverage includes a fund’s use of preferred stock and borrowings and investments in the residual interest certificates (also called inverse floating rate securities) in tender option bond (TOB) trusts, including the portion of assets held by a TOB trust that has been effectively financed by the trust’s issuance of floating rate securities.
■ Zero Coupon Bond: A zero coupon bond does not pay a regular interest coupon to its holders during the life of the bond. Income to the holder of the bond comes from accretion of the difference between the original purchase price of the bond at issuance and the par value of the bond at maturity and is effectively paid at maturity. The market prices of zero coupon bonds generally are more volatile than the market prices of bonds that pay interest periodically.
132
Reinvest Automatically, Easily and Conveniently
Nuveen makes reinvesting easy. A phone call is all it takes to set up your reinvestment account.
Nuveen Closed-End Funds Automatic Reinvestment PlanNuveen Closed-End Fund allows you to conveniently reinvest distributions in additional Fund shares. By choosing to reinvest, you’ll be able to invest money regularly and automatically, and watch your investment grow through the power of compounding. Just like distributions in cash, there may be times when income or capital gains taxes may be payable on distributions that are reinvested. It is important to note that an automatic reinvestment plan does not ensure a profit, nor does it protect you against loss in a declining market.
Easy and convenient
To make recordkeeping easy and convenient, each month you’ll receive a statement showing your total distributions, the date of investment, the shares acquired and the price per share, and the total number of shares you own.
How shares are purchased
The shares you acquire by reinvesting will either be purchased on the open market or newly issued by the Fund. If the shares are trading at or above net asset value at the time of valuation, the Fund will issue new shares at the greater of the net asset value or 95% of the then-current market price. If the shares are trading at less than net asset value, shares for your account will be purchased on the open market. If the Plan Agent begins purchasing Fund shares on the open market while shares are trading below net asset value, but the Fund’s shares subsequently trade at or above their net asset value before the Plan Agent is able to complete its purchases, the Plan Agent may cease open-market purchases and may invest the uninvested portion of the distribution in newly-issued Fund shares at a price equal to the greater of the shares’ net asset value or 95% of the shares’ market value on the last business day immediately prior to the purchase date. Distributions received to purchase shares in the open market will normally be invested shortly after the distribution payment date. No interest will be paid on distributions awaiting reinvestment. Because the market price of the shares may increase before purchases are completed, the average purchase price per share may exceed the market price at the time of valuation, resulting in the acquisition of fewer shares than if the distribution had been paid in shares issued by the Fund. A pro rata portion of any applicable brokerage commissions on open market purchases will be paid by Plan participants. These commissions usually will be lower than those charged on individual transactions.
Flexible
You may change your distribution option or withdraw from the Plan at any time, should your needs or situation change. You can reinvest whether your shares are registered in your name, or in the name of a brokerage firm, bank, or other nominee. Ask your investment advisor if his or her firm will participate on your behalf. Participants whose shares are registered in the name of one firm may not be able to transfer the shares to another firm and continue to participate in the Plan. The Fund reserves the right to amend or terminate the Plan at any time. Although the Fund reserves the right to amend the Plan to include a service charge payable by the participants, there is no direct service charge to participants in the Plan at this time.
Call today to start reinvesting distributions
For more information on the Nuveen Automatic Reinvestment Plan or to enroll in or withdraw from the Plan, speak with your financial professional or call us at (800) 257-8787.
133
Notes
134
Notes
135
Nuveen:
Serving Investors for Generations
Since 1898, financial professionals and their clients have relied on Nuveen to provide dependable investment solutions through continued adherence to proven, long-term investing principles. Today, we offer a range of high quality solutions designed to be integral components of a well-diversified core portfolio.
Focused on meeting investor needs.
Nuveen is the investment manager of TIAA. We have grown into one of the world’s premier global asset managers, with specialist knowledge across all major asset classes and particular strength in solutions that provide income for investors and that draw on our expertise in alternatives and responsible investing. Nuveen is driven not only by the independent investment processes across the firm, but also the insights, risk management, analytics and other tools and resources that a truly world-class platform provides. As a global asset manager, our mission is to work in partnership with our clients to create solutions which help them secure their financial future.
Find out how we can help you.
To learn more about how the products and services of Nuveen may be able to help you meet your financial goals, talk to your financial professional, or call us at (800) 257-8787. Please read the information provided carefully before you invest. Investors should consider the investment objective and policies, risk considerations, charges and expenses of any investment carefully. Where applicable, be sure to obtain a prospectus, which contains this and other relevant information. To obtain a prospectus, please contact your securities representative or Nuveen, 333 W. Wacker Dr., Chicago, IL 60606. Please read the prospectus carefully before you invest or send money.
Learn more about Nuveen Funds at: www.nuveen.com/closed-end-funds
Nuveen Securities, LLC, member FINRA and SIPC | 333 West Wacker Drive Chicago, IL 60606 | www.nuveen.com |  |
ESA-B-0420D 1210954-INV-B-06/21