Investor Presentation
(Based upon Third Quarter 2007 results)
November 7, 2007
Future operating results
Subscriber growth, retention and usage levels
International, Corporate and Voice Service growth
New products, services and features
Corporate spending
Liquidity
Network capacity, coverage and security
Regulatory developments
Taxes
Certain statements in this presentation constitute “forward-looking statements” within the meaning of the
Private Securities Litigation Reform Act of 1995, particularly those contained in the slide entitled “Financial
Guidance.” These forward-looking statements are based on management’s current expectations or beliefs as
of November 7, 2007 and are subject to numerous assumptions, risks and uncertainties that could cause
actual results to differ materially from those described in the forward-looking statements. We undertake no
obligation to revise or publicly release the results of any revision to these forward-looking statements.
Readers should carefully review the risk factors described in this presentation. Such statements address the
following subjects:
Safe Harbor for Forward-Looking Statements
All information in this presentation speaks as of November 7, 2007 and any
distribution of this presentation after that date is not intended and will not be
construed as updating or confirming such information.
2
Risk Factors
Inability to sustain growth in our customer base, revenue or profitability
Competition in price, quality, features and geographic coverage
Higher than expected tax rates or exposure to additional tax liability
Inability to obtain telephone numbers in sufficient quantities on acceptable terms in desired locations
Enactment of burdensome telecommunications or Internet regulations including increased taxes or fees
Reduced use of fax services due to increased use of email, scanning or widespread adoption of digital signatures
Inadequate intellectual property protection or violations of third party intellectual property rights
System failures or breach of system or network security and resulting harm to our reputation
Inability to adapt to technological change, or third party development of new technologies superior to ours
Economic downturns in industries which rely heavily on fax transmissions
Loss of services of executive officers and other key employees
Inability to maintain existing or enter into new supplier and marketing relationships on acceptable terms
Other factors set forth in our Annual Report on Form 10-K filed on 03/12/07 and the other reports filed by us from
time to time with the Securities and Exchange Commission
The following factors, among others, could cause our business, prospects, financial condition, operating results and
cash flows to be materially adversely affected:
3
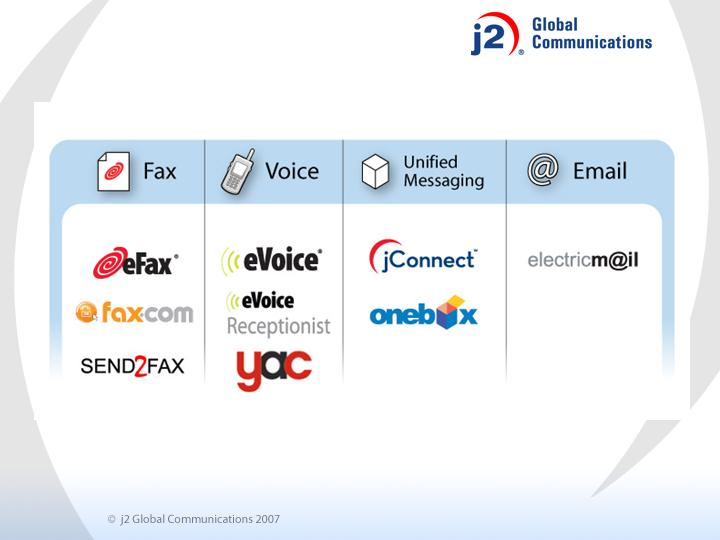
All brand names and logos are trademarks of j2 Global Communications, Inc. or its affiliates in the U.S. and/or internationally.
Messaging as a Service
4
Core j2 Global Assets
11.7 million Subscribed Telephone Numbers (DIDs)
1,017,985 Paid DIDs
Global Advanced Messaging Network
> 2,900 cities in 42 countries on 5 continents
17.1MM + unique DIDs worldwide in inventory
Patented Technology
A portfolio of 54 issued patents, and numerous pending U.S. and foreign
patent applications
Licensing programs designed to monetize the portfolio
Expertise
Effective customer acquisition strategies and Web marketing
Breadth, depth and management of a complex network & architecture
Strong Financial Position
11 consecutive years of Revenue growth
5 consecutive years of positive and growing Operating Earnings
$240 MM of cash & investments to fund growth (as of 09/30/07)
No debt
5
Individuals
Targeted marketing (search, online media and radio)
Sold through: eFax.com , j2.com, fax.com, onebox.com, evoice.com and other
brand websites
Use of proprietary Life Cycle Management
Advertising & Calling-Party-Pays revenue supports the Free base
Small to Mid-Sized Businesses (SMBs)
Sold through: eFaxCorporate.com and Onebox and eVoice Receptionist websites
Supported by Telesales
Self-service Web-based broadcast fax engine at jblast.com
Outsourced email, spam & virus protection and archiving
Use of proprietary Life Cycle Management (i.e. usage stimulation)
Enterprise (SMEs)/Large Enterprise/Government
Direct sales force
Marketed through Web and traditional direct selling methods
Designed for > 150 DID accounts
Subscriber Acquisition
6

Six Drivers for Paid DID Additions
Subscribers coming directly to the Company’s Websites/Telesales
Brand awareness driven by demand-generation programs and “word of mouth”
Search engine discovery
Accounts for over 40% monthly paid DID signups
Free-to-Paid subscriber upgrades
Life Cycle Management
eFax Corporate SMB sales
Hybrid Website and human interaction (i.e. Telesales)
Direct SME/Enterprise/Government
Through the outside Corporate Sales team
Direct domestic marketing spend for paid subscribers
Targeted marketing program across various media
International marketing programs
Paid Subscription Drivers
7

Operations Update
8

Voice Services Update
Voice Services Paid DIDs Represents ~ 7.5% of the Paid DID
Base at October 2007 vs. ~ 5% at Q2 2007
DID Growth Rate from Q2 - Q3 2007 > 32%, YoY > 128%
Receptionist ARPU is ~ $12.00 per DID per Month
Current Target Customer is SMB with 2-15 Persons
Marketing Consists Primarily of Internal Cross Selling, Paid
Search and Radio Advertising
Launching Localized Receptionist Services in EU Early Next Year
9
Q3 YoY DID growth > 21%
SMB growth > 23%
Fortune 100 Customers Increased 78% YoY to 41
3 Large Accounts Signed in Q3, Bringing Total to 35
50 Large Accounts in the Pipeline (8 in Europe)
Corporate Sales Update
10
Q3 YoY DID growth > 40%
Launching Localized Receptionist Service in Early 2008
Continuing Investment in International Business
Currently 7 languages available
Multi-byte capability expected in 2008
Localized services and physical presence in Asia in 2008 (Japan first)
Q3 YoY EU employee growth from 29 to 44 (52%)
SAC costs ~ $50 USD despite building brand awareness
International Web Update
11

Financial Highlights
12

GAAP Revenues
$55.7 MM
Gross Profit/Margin (1)
$44.7 MM
80.3%
Operating Profit/Margin (1)
$23.1 MM
41.5%
Non-GAAP EPS
$0.38 Per Share
Free Cash Flow (3)
$15.7 MM
Cash and Investments
$240 MM
Margin
(1) Excludes SFAS 123(R) non-cash compensation expense. See slide 19 for a reconciliation to the nearest GAAP financial measure.
(2) Excludes SFAS 123(R) non-cash compensation expense, net of tax benefit. Based on an estimated effective annual tax rate of
28% and 51.4 million fully diluted shares outstanding. Non-GAAP EPS also benefitted from the inclusion of $0.02 per share from
an approximate $1.1M required release of an income tax reserve. See slide 19 for a reconciliation to the nearest GAAP financial
measure.
(3) See slide 18 for a reconciliation to the nearest GAAP financial measure.
Q3 2007 Non-GAAP Financial Results
13

Operating margins for 2004 to 2006 are based on Modified earnings. Q1
2007 to Q3 2007 excludes SFAS 123(R) non-cash compensation, net of tax
benefit. See slides 19 and 20 for reconciliations to the nearest GAAP
financial measures.
Margin Trends by Year
14
Financial Guidance
(1) Excludes SFAS 123(R) non-cash compensation, net of tax benefit. Assumes an effective annual tax rate of approximately
30% and 51.4 million fully diluted shares outstanding.
$0.36 - $0.37
$56.1 - $57.6
Q4
2007
Non-GAAP EPS (1)
Revenues (MM)
2008 Outlook
Expect revenue to Grow ~ 17% over FY 2007
EPS Expected to Grow at Least as Fast as Revenues
15

Supplemental Information
16
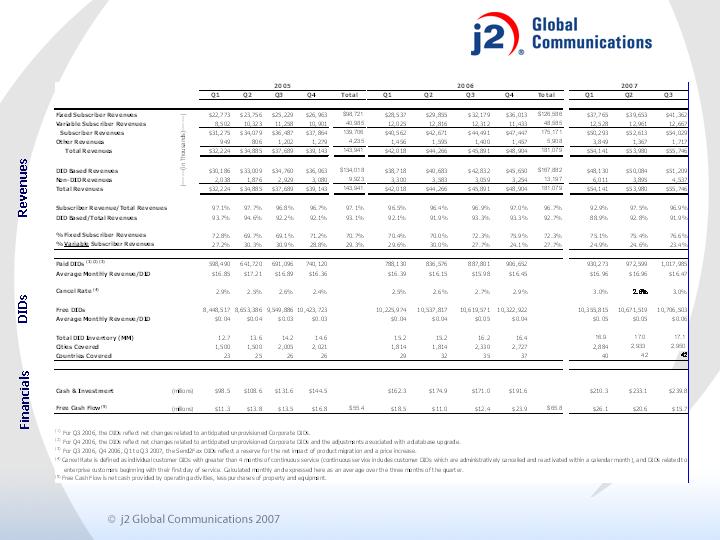
Metrics
17
(1) Net cash provided by operating activities, less purchases of property & equipment. Free Cash Flow amounts are not meant
as a substitute for GAAP, but are solely for informational purposes.
18
Computation of Free Cash Flow
($ in millions)
Q1 '06
Q2 '06
Q3 '06
Q4 '06
Q1 '07
Q2 '07
Q3 '07
Net cash provided by operating activities
$19.245
$14.250
$13.607
$25.903
$26.659
$23.113
$18.656
Purchases of property & equipment
(0.757)
(3.288)
(1.181)
(1.973)
(0.529)
(2.506)
(2.940)
Free Cash Flow
(1)
$18.488
$10.962
$12.426
$23.930
$26.130
$20.607
$15.716

GAAP Reconciliation
(1) Stock-based compensation is as follows: for Q3, Cost of revenues is $169K, Sales and Marketing is $304K, R&D is $186K, and G&A is $1,209K, for
Q2, Cost of revenues is $140K, Sales and Marketing is $264K, R&D is $184K, and G&A is $1,114K and for Q1, Cost of revenues is $182K, Sales and
Marketing is $278K, R&D is $173K, and G&A is $1,097K.
(2) Income tax expense is adjusted for the net impact of item 1 above.
19
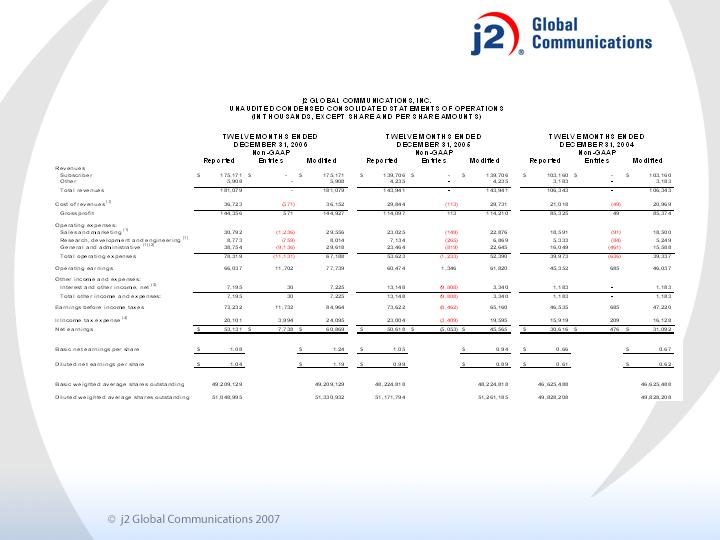
GAAP Reconciliation
(1) Stock-based compensation and charges for payroll tax and employee compensation liabilities associated with inadvertent measurement date errors in prior stock option grants are as follows: 2006
Adjustments - Cost of revenues is $571K, Sales and Marketing is $1,236K, R&D is $759K, and G&A is $4,998K, 2005 Adjustments - Cost of revenues is $113K, Sales and Marketing is $149K, R&D is $265K,
and G&A is $819K, 2004 Adjustments - Cost of revenues is $49K, Sales and Marketing is $91K, R&D is $84K and G&A is $461K.
(2) 2006 G&A also includes adjustments of $2.9M pre-tax ($1.7M after-tax) for stock option investigation and $1.3M pre-tax ($0.8M after-tax) for G&A costs related to enhancement of internal controls relating to
global tax structure.
(3) 2006 Other Income and Expense includes an adjustment for $30K related to payroll tax and employee compensation liabilities associated with stock option investigation. 2005 Other Income excludes gains
from sale of investment of $9,808K.
(4) Income tax expense is adjusted for the net impact of items 1, 2 and 3 above.
20
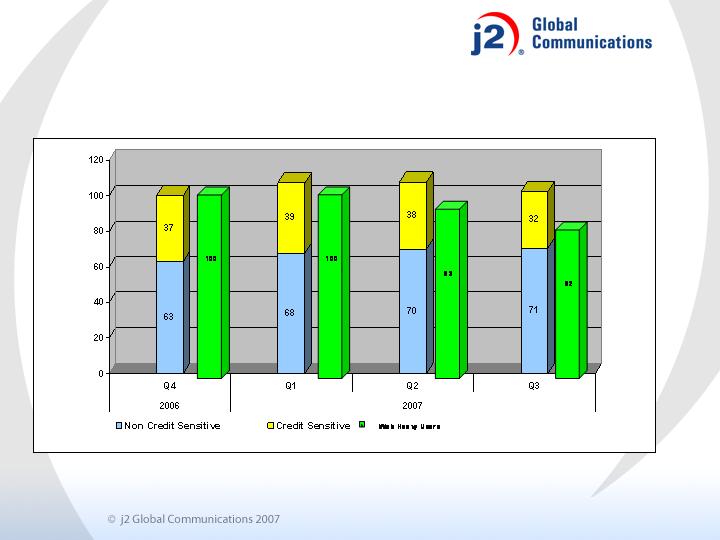
Usage Pattern of Corporate and Web High
Volume Users
21