EXHIBIT 99.2

Future operating results
Global economic conditions
Subscriber growth, retention and usage levels
Fax and voice service growth
New products, services and features
Corporate spending
Liquidity
Network capacity, coverage and security
Regulatory developments
Taxes
Certain statements in this presentation constitute “forward-looking statements” within the meaning of the Private
Securities Litigation Reform Act of 1995, particularly those contained in the slide “2009 Assumptions/Guidance.” These
forward-looking statements are based on management’s current expectations or beliefs as of February 19, 2009 and
are subject to numerous assumptions, risks and uncertainties that could cause actual results to differ materially from
those described in the forward-looking statements. We undertake no obligation to revise or publicly release the results
of any revision to these forward-looking statements. Readers should carefully review the risk factors described in this
presentation. Such statements address the following subjects:
Safe Harbor for Forward-Looking Statements
All information in this presentation speaks as of February 19, 2009 and any
distribution of this presentation after that date is not intended and will not be
construed as updating or confirming such information.

Risk Factors
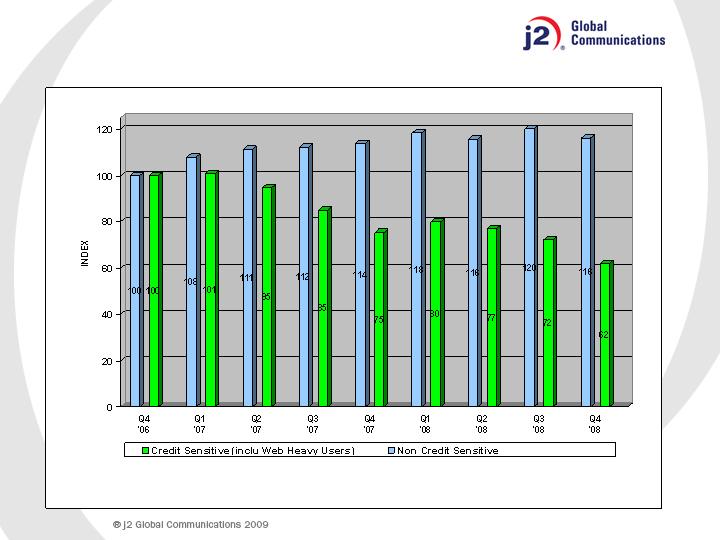
Inability to sustain growth in our customer base, revenue or profitability, particularly in light of the uncertain U.S. or
worldwide economy and the related impact on customer acquisitions, cancelations and credit card payment declines
Competition in price, quality, features and geographic coverage
Higher than expected tax rates or exposure to additional tax liability
Inability to obtain telephone numbers in sufficient quantities on acceptable terms in desired locations
Enactment of burdensome telecommunications or Internet regulations including increased taxes or fees
Reduced use of fax services due to increased use of email, scanning or widespread adoption of digital signatures
Inadequate intellectual property protection or violations of third party intellectual property rights
System failures or breach of system or network security and resulting harm to our reputation
Inability to adapt to technological change, or third party development of new technologies superior to ours
Loss of services of executive officers and other key employees
Inability to maintain existing or enter into new supplier and marketing relationships on acceptable terms
Other factors set forth in our Annual Report on Form 10-K filed on 02/25/2008 and the other reports filed by us from time to
time with the Securities and Exchange Commission
The following factors, among others, could cause our business, prospects, financial condition, operating results and cash flows to
be materially adversely affected:
All brand names and logos are trademarks of j2 Global Communications, Inc. or its affiliates in the U.S. and/or internationally.
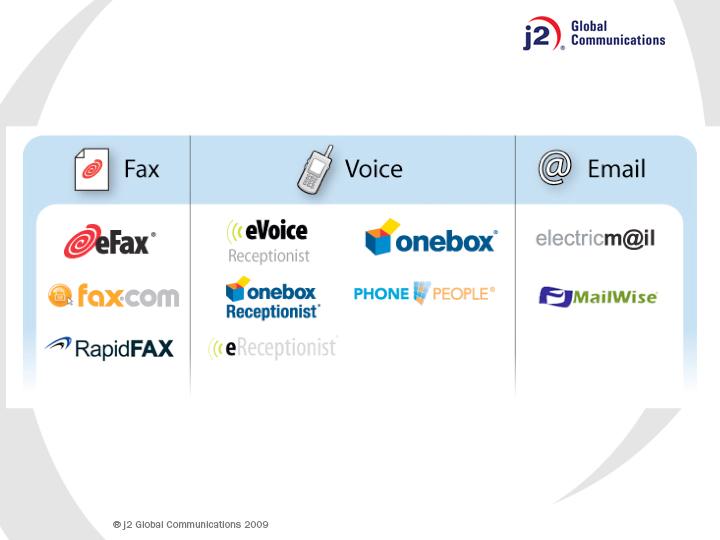
Messaging/Communications as a Service
Core j2 Global Assets
11.6+ M Subscribed Telephone Numbers (DIDs)
1.2+ M Paid DIDs
Global Advanced Messaging Network
3,100+ cities in 46 countries on 6 continents
19.8M+ unique DIDs worldwide in inventory
Intellectual Property
57 issued patents and licensing programs designed to monetize the portfolio
Protection of brands and marks
Programs designed to effectively collect evidence to prosecute junk faxers
Expertise
Effective customer acquisition strategies and Web marketing
Breadth, depth and management of a complex network & architecture
Successful acquisition and integration of 21 businesses in 7 countries
Strong Financial Position
13 consecutive years of Revenue growth
7 consecutive years of positive and growing Operating Earnings
$88M of Free Cash Flow (FY 2008)
$162M of cash & investments to fund growth/ Nominal debt related to holdback
( as of 12/31/08)
Individuals
Targeted marketing (search, online media and radio)
Sold through: eFax.com, eVoice.com, Onebox.com, PhonePeople.com, Fax.com, j2.com and
other brand Websites
Use of proprietary Life Cycle Management
Advertising, Up-selling, and Calling-Party-Pays revenue supports the Free base
Small to Mid-Sized Businesses (SMBs)
Sold through: eFax Corporate, Onebox Receptionist and eVoice Receptionist Websites
Supported by Chat and Telesales groups in U.S. and Europe (in multiple languages)
Self-service Web-based broadcast fax engine at jblast.com
Outsourced email, spam & virus protection and archiving
Use of proprietary Life Cycle Management (i.e. feature up-sell)
Enterprise (SMEs)/Large Enterprise/Government
Direct sales force in U.S. and Europe
Marketed through Web and traditional direct selling methods
Designed for > 150 DID accounts
Subscriber Acquisition

Eight Drivers for Paid DID Additions
Subscribers coming directly to the Company’s Websites/Telesales
Brand awareness driven by demand-generation programs and “word of mouth”
Search engine discovery
Accounts for over 40% of monthly paid DID signups
Free-to-Paid subscriber upgrades
Life Cycle Management
eFax Corporate SMB sales
Hybrid Website and human interaction (i.e. Telesales)
Direct SME/Enterprise/Government
Through the outside Corporate Sales team
Direct domestic marketing spend for paid subscribers
Targeted marketing program across various media
International marketing programs
Cross-sell
Offer additional services to existing customers
Acquisitions
Paid Subscription Drivers
(1) Includes SFAS 123(R) non-cash compensation expense.
(2) Includes SFAS 123(R) non-cash compensation expense, net of tax benefit. Tax rates for Q4 and full year are 24.6% and 29.0% respectively.
(3) See slide 19 for computation of free cash flow.
GAAP Results
GAAP Revenues
$60.6M
$241.5M
Gross Profit/Margin (1)
$49.4M 81.5%
$195.3M 80.9%
Operating Profit/Margin (1)
$26.2M 43.2%
$97.9M 40.6%
GAAP EPS (2)
$0.45 Per Share
$1.58 Per Share
Free Cash Flow (3)
$25.4M
$88.2M
Cash and Investments
$162M
$162M
$
Margin
Q4 2008
$
Margin
FY 2008

Fax Services
2008 Review
Fax DIDs increased to ~1,050,000
Multiple pricing programs working well
Expanded network to 46 countries and 3,100+ cities
Acquired Mijanda brands and customer base
Strong Corporate Sales 24 wins in 2008 of large customers
Aggressive ROI based management of advertising campaigns
Headwind on usage revenue and retention rates as economy weakened
Strength of USD hurt international revenues in Q3 and Q4
2009 Outlook
Leverage j2’s corporate advantages
Purchasers seeking established, profitable, trusted and well capitalized providers
Increased focus on Canada and top European countries
Continuing multiple pricing programs serving multiple segments
Leveraging analytics and experience to further optimize advertising spend
Fax indexing/other service enhancements to be fully rolled out
Continuing lighter than average usage and retention in a weak economy
Continuing focus on M&A
Voice Services
2008 Review
Voice DIDs grew 127% from ~80,000 to ~190,000; grew to ~10% of j2
revenue
Began international marketing efforts; introduced eReceptionist brand in
Europe
Speech-to-text deployed in the US
Increased Telesales staff and expanded CS support
Continued cross-selling to Fax customer base
Acquired Phone People (j2’s largest voice acquisition)
2009 Outlook
Extend market leadership position with organic and M&A growth
Continue to refine user experience and value proposition
One-click cross-sells between fax and voice customers
Testing additional enhanced features
Refine brand strategy to expand market size
Localize to support additional European languages and markets
Customer service efficiency and enhancements
Other Businesses
Successfully completed acquisition of Mailwise (hygiene provider)
Cross-sell of Electric Mail services to Mailwise customers
Integration of Mailwise nearing completion
Currently evaluating additional M&A opportunities
Patent Licensing
Patents out of reexamination in late 2008/early 2009
Opportunity to create new licensing programs and proceed with stayed
litigation
Advertising/Broadcast Fax
Impact of weakening economy
Expect softness to continue
Only 2% of j2’s revenue
j2 Operations
2008
Achieved revenues and above range EPS targets
Successfully managed cost structure for all departments
Revenues grew 9.4% while employee headcount was kept flat with 12/31/07
Increased operational efficiencies steadily throughout the year
Margins at an all time high in Q4
Improved gross margins by 1.9% from 79.6% to 81.5%
Improved operating margins by 5.9% from 37.3% to 43.2%
Effective deployment of cash through acquisitions and stock buyback
Acquired 4 companies across multiple services
2009
Continue to enhance and expand on 2008 operational excellence
Active pipeline of M&A opportunities – leverage j2’s acquisition and
integration expertise
Continue to leverage j2’s talent pool
Effective advertising programs with increased ROI focus
Prudent management of capital expenditures

Economy
2009 worse than 2008; 4 Quarters of GDP contraction; global recession; increasing
unemployment; bottom not yet reached
Stronger USD relative to GBP and Euro
Operational View
Continuing focus on optimizing margins and free cash flow
Decrease in usage revenue and retention rates
Shifting Mix to lower MARPU DIDs (Corporate, Voice and secondary Fax brands)
Increased Investment in IP
M&A/higher yielding investments for our cash
Other Items
Lower Other Income due to falling interest rates
Modestly higher share count/higher SFAS 123(R) expense
Tax rate assumed to be ~ 30.5%
2009 Assumptions/Guidance
Modest Increase in Revenues and Non-GAAP EPS

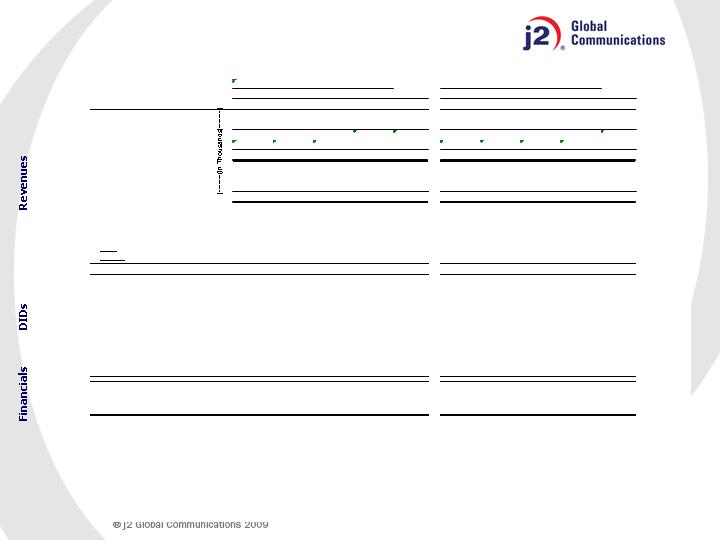
Metrics
18
Q1
Q2
Q3
Q4
Total
Q1
Q2
Q3
Q4
Total
Fixed Subscriber Revenues
$37,757
$39,643
$41,362
$43,336
$162,098
$44,260
$46,593
$47,481
$48,125
$186,459
Variable Subscriber Revenues
12,536
12,970
12,667
12,057
50,231
12,956
12,943
12,985
11,497
50,382
Subscriber Revenues
$50,293
$52,613
$54,029
$55,393
212,329
$57,216
$59,536
$60,466
$59,622
236,841
Other Revenues
3,848
1,367
1,717
1,437
8,368
1,433
1,140
1,086
1,014
4,673
Total Revenues
$54,141
$53,980
$55,746
$56,830
220,697
$58,649
$60,676
$61,552
$60,636
241,513
DID - Based Revenues
$48,684
$50,929
$52,204
$53,473
$205,290
$55,301
$57,551
$58,440
$57,691
$228,983
Non-DID Based Revenues
5,457
3,051
3,542
3,357
15,407
3,348
3,125
3,112
2,944
12,529
Total Revenues
$54,141
$53,980
$55,746
$56,830
220,697
$58,649
$60,676
$61,552
$60,636
241,512
Subscriber Revenues/Total Revenues
92.9%
97.5%
96.9%
97.5%
96.2%
97.6%
98.1%
98.2%
98.3%
98.1%
DID - Based/Total Revenues
89.9%
94.3%
93.6%
94.1%
93.0%
94.3%
94.8%
94.9%
95.1%
94.8%
%
Fixed
Subscriber Revenues
75.1%
75.3%
76.6%
78.2%
76.3%
77.4%
78.3%
78.5%
80.7%
78.7%
%
Variable
Subscriber Revenues
24.9%
24.7%
23.4%
21.8%
23.7%
22.6%
21.7%
21.5%
19.3%
21.3%
Paid DIDs
(1) (2)
930,273
972,599
1,017,985
1,063,698
1,098,650
1,162,872
1,198,950
1,236,079
Average Monthly Revenue/DID
$17.16
$17.26
$16.80
$16.44
$16.30
$16.29
$15.87
$15.05
Cancel Rate
(3)
3.0%
2.8%
3.0%
2.7%
2.8%
2.9%
3.0%
3.1%
Free DIDs
10,355,815
10,671,519
10,706,503
10,874,104
10,098,143
10,233,875
10,357,506
10,362,771
Average Monthly Revenue/DID
$0.05
$0.05
$0.06
$0.07
$0.08
$0.07
$0.07
$0.06
Total DID Inventory (MM)
16.9
17.0
17.1
17.2
17.4
17.5
17.3
19.8
Cities Covered
2,884
2,933
2,950
3,024
3,084
3,126
3,137
3,135
Countries Covered
40
42
42
42
44
45
46
46
Cash & Investment
(millions)
$210.3
$233.1
$239.8
$229.8
$181.3
$149.9
$151.8
$161.9
Free Cash Flow
(4)
(millions)
$26.1
$20.6
$15.7
$21.4
$83.9
$26.9
$23.0
$12.8
$25.4
$88.2
(1)
Paid DIDs reflect a reserve for the net impact of price increase, database upgrades and database clean up.
(2)
DIDs also reflect reserves taken in conjunction with asset acquisitions for anticipated product migration and/or price increase.
(3)
Cancel Rate is defined as individual customer DIDs with greater than 4 months of continuous service (continuous service includes customer DIDs which are administratively cancelled
and reactivated within the same calendar month), and DIDs related to enterprise customers beginning with their first day of service. Cancel rate is calculated monthly and expressed here as an average
over the three months of the quarter.
(4)
Free Cash Flow is net cash provided by operating activities, less purchases of property and equipment. See slide 19 for computation of free cash flow.
Quarterly revenues for 2007 and Q1 2008 have been reclassified between fixed, variable and other revenue and between DID based and non-DID based revenue.
This reclassification is related to revised revenue classification for a j2 subsidiary, it does not impact total revenues for the quarter.
2008
2007
(1) Net cash provided by operating activities, less purchases of property & equipment. Free Cash Flow amounts are not meant as a substitute
for GAAP, but are solely for informational purposes.
Computation of Free Cash Flow
($ in millions)
Q1 '07
Q2 '07
Q3 '07
Q4 '07
Q1 '08
Q2 '08
Q3 '08
Q4 '08
Net cash from operating activities
$26.659
$23.113
$18.656
$25.779
$27.411
$23.840
$13.738
$25.727
Purch. of property & equipment
(0.529)
(2.506)
(2.940)
(4.340)
(0.469)
(0.796)
(0.937)
(0.305)
Free Cash Flow
(1)
$26.130
$20.607
$15.716
$21.439
$26.942
$23.044
$12.801
$25.422