DAVIS VARIABLE ACCOUNT FUND, INC.
Ryan M. Charles
Davis Selected Advisers, L.P.
| DAVIS VALUE PORTFOLIO | Table of Contents |
| 2 |
| | |
| 4 |
| | |
| 6 |
| | |
| 7 |
| | |
| 11 |
| | |
| 12 |
| | |
| 13 |
| | |
| 14 |
| | |
| 18 |
| | |
| 19 |
| | |
| 20 |
| | |
| 21 |
This Annual Report is authorized for use by existing shareholders. Prospective shareholders must receive a current Davis Value Portfolio prospectus, which contains more information about investment strategies, risks, charges, and expenses. Please read the prospectus carefully before investing or sending money.
Shares of the Davis Value Portfolio are not deposits or obligations of any bank, are not guaranteed by any bank, are not insured by the FDIC or any other agency, and involve investment risks, including possible loss of the principal amount invested.
Portfolio Proxy Voting Policies and Procedures
The Fund has adopted Portfolio Proxy Voting Policies and Procedures under which the Fund votes proxies relating to securities held by the Fund. A description of the Fund's Portfolio Proxy Voting Policies and Procedures is available (i) without charge, upon request, by calling the Fund toll-free at 1-800-279-0279, (ii) on the Fund's website at www.davisfunds.com, and (iii) on the SEC's website at www.sec.gov.
In addition, the Fund is required to file Form N-PX, with its complete proxy voting record for the 12 months ended June 30th, no later than August 31st of each year. The Fund's Form N-PX filing is available (i) without charge, upon request, by calling the Fund toll-free at 1-800-279-0279, (ii) on the Fund's website at www.davisfunds.com, and (iii) on the SEC's website at www.sec.gov.
Form N-Q
The Fund files its complete schedule of portfolio holdings with the SEC for the first and third quarters of each fiscal year on Form N-Q. The Fund's Form N-Q is available without charge, upon request, by calling 1-800-279-0279, on the Fund's website at www.davisfunds.com, and on the SEC's website at www.sec.gov. The Fund's Form N-Q may be reviewed and copied at the SEC's Public Reference Room in Washington, DC, and information on the operation of the Public Reference Room may be obtained by calling 1-800-SEC-0330.
| DAVIS VALUE PORTFOLIO | Management's Discussion of Fund Performance |
Performance Overview
Davis Value Portfolio ("Fund") delivered a total return on net asset value of 6.06% for the year ended December 31, 2014 ("Period"). Over the same Period, the Standard & Poor's 500® Index ("Index") returned 13.69%. The Index turned in strong performance with every sector1 but one returning positive results. The sectors within the Index that turned in the strongest performance over the Period were Utilities, Health Care, and Information Technology. The sectors within the Index that turned in the weakest performance over the Period were Energy, Telecommunication Services, and Materials (although only the Energy sector realized negative performance).
The Fund's Absolute Performance
The Fund continued to hold a significant percentage of assets in Financial companies over the Period. Financial companies were the most important contributor2 to the Fund's absolute performance over the Period. Wells Fargo3, Bank of New York Mellon, and Berkshire Hathaway were among the most important contributors to performance. Loews was among the most important detractors from performance.
Health Care companies were the second most important contributor to the Fund's absolute performance. UnitedHealth Group and Express Scripts Holding were among the most important contributors to performance.
While not nearly as significant a contributor to absolute performance, as compared to the Financial and Health Care companies, Consumer Staple companies were another contributor to the Fund's absolute performance. Costco Wholesale was among the most important contributors to performance. Diageo was among the most important detractors from performance.
Energy companies were the most important detractor from the Fund's performance. Ultra Petroleum (which happened to be the most important detractor) and Encana were among the most important detractors from performance. EOG Resources was among the most important contributors to performance.
Other companies which were among the most important contributors to performance included: CarMax and Liberty Global (Consumer Discretionary companies). Other companies which were among the most important detractors from performance included: Bed Bath & Beyond and Las Vegas Sands (Consumer Discretionary companies). The Fund no longer owns Bed Bath & Beyond.
The Fund had approximately 16% of its net assets invested in foreign companies at December 31, 2014. As a whole, those companies under-performed the domestic companies held by the Fund by a significant amount.
The Fund's Relative Performance
Information Technology companies were the most important detractor from the Fund's performance relative to the Index over the Period. The Fund's Information Technology companies significantly under-performed the corresponding sector within the Index. The Fund also suffered (although to a much smaller degree) as a result of having a lower average weighting than the Index.
Consumer Discretionary companies were the second most important detractor from the Fund's relative performance. The Fund's Consumer Discretionary companies under-performed the corresponding sector within the Index.
Consumer Staple companies were also an important detractor from the Fund's relative performance. The Fund's Consumer Staple companies under-performed the corresponding sector within the Index.
Energy companies were the most important contributor to the Fund's relative performance. The Energy companies under-performed the corresponding sector within the Index, however the Fund's relative performance benefited from a lower average weighting than the Index.
Davis Value Portfolio's investment objective is long-term growth of capital. There can be no assurance that the Fund will achieve its objective. Davis Value Portfolio's principal risks are: stock market risk, manager risk, common stock risk, large-capitalization companies risk, mid- and small-capitalization companies risk, headline risk, financial services risk, foreign country risk, emerging market risk, foreign currency risk, depositary receipts risk, and fees and expenses risk. See the prospectus for a full description of each risk.1 The companies included in the Standard & Poor's 500® Index are divided into ten sectors. One or more industry groups make up a sector.
2 A company's or sector's contribution to or detraction from the Fund's performance is a product both of its appreciation or depreciation and its weighting within the Fund. For example, a 5% holding that rises 20% has twice as much impact as a 1% holding that rises 50%.
3 This Management Discussion of Fund Performance discusses a number of individual companies. The information provided in this report does not provide information reasonably sufficient upon which to base an investment decision and should not be considered a recommendation to purchase, sell, or hold any particular security. The Schedule of Investments lists the Fund's holdings of each company discussed.
| DAVIS VALUE PORTFOLIO | Management's Discussion of Fund Performance – (Continued) |
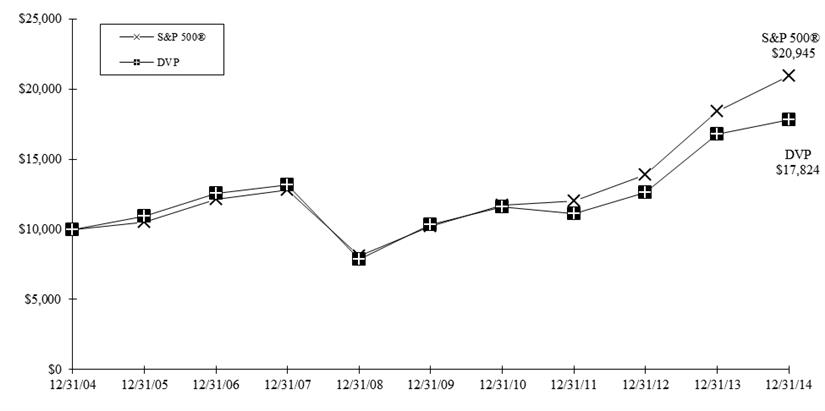
Comparison of a $10,000 investment in Davis Value Portfolio versus the Standard & Poor's 500® Index
over 10 years for an investment made on December 31, 2004
Average Annual Total Return for periods ended December 31, 2014
| FUND & BENCHMARK INDEX | 1-YEAR | 5-YEAR | 10-YEAR | SINCE FUND'S INCEPTION (07/01/99) | GROSS EXPENSE RATIO | NET EXPENSE RATIO |
| Davis Value Portfolio | 6.06% | 11.57% | 5.95% | 5.18% | 0.62% | 0.62% |
Standard & Poor's 500® Index | 13.69% | 15.45% | 7.67% | 4.56% | | |
The Standard & Poor's 500® Index is an unmanaged index of 500 selected common stocks, most of which are listed on the New York Stock Exchange. The Index is adjusted for dividends, weighted towards stocks with large market capitalizations, and represents approximately two-thirds of the total market value of all domestic common stocks. Investments cannot be made directly in the Index.
The performance data for Davis Value Portfolio contained in this report represents past performance, assumes that all distributions were reinvested, and should not be considered as an indication of future performance from an investment in the Fund today. The investment return and principal value will fluctuate so that shares may be worth more or less than their original cost when redeemed. Fund performance changes over time and current performance may be higher or lower than stated. The operating expense ratio may vary in future years. For more current information please call Davis Funds Investor Services at 1-800-279-0279.
Fund performance numbers are net of all Fund operating expenses, but do not include any insurance charges imposed by your insurance company's separate account. If performance included the effect of these additional charges, the return would be lower.
| DAVIS VALUE PORTFOLIO | |
| December 31, 2014 |
| Portfolio Composition | | Industry Weightings |
| (% of Fund's 12/31/14 Net Assets) | | (% of 12/31/14 Stock Holdings) |
| | | | | |
| | | | Fund | | S&P 500® |
| Common Stock (U.S.) | 79.78% | | Diversified Financials | 24.59% | | 5.31% |
| Common Stock (Foreign) | 16.17% | | Information Technology | 11.44% | | 19.66% |
| Short-Term Investments | 3.96% | | Health Care | 11.30% | | 14.21% |
| Investment of Cash Collateral | | | Banks | 10.26% | | 6.11% |
| for Securities Loaned | 0.23% | | Retailing | 9.08% | | 4.42% |
| Other Assets & Liabilities | (0.14)% | | Materials | 5.49% | | 3.17% |
| 100.00% | | Energy | 5.02% | | 8.44% |
| | | Media | 3.73% | | 3.56% |
| | | Food & Staples Retailing | 3.73% | | 2.50% |
| | | Insurance | 3.57% | | 2.79% |
| | | Food, Beverage & Tobacco | 3.27% | | 5.20% |
| | | Capital Goods | 2.72% | | 7.54% |
| | | Consumer Services | 2.38% | | 1.70% |
| | | Other | 1.97% | | 13.16% |
| | | Transportation | 1.45% | | 2.23% |
| | | | 100.00% | | 100.00% |
| Top 10 Long-Term Holdings |
| (% of Fund's 12/31/14 Net Assets) |
| | |
| American Express Co. | Consumer Finance | 7.61% |
| Wells Fargo & Co. | Banks | 7.43% |
| Bank of New York Mellon Corp. | Capital Markets | 6.16% |
| Google Inc.* | Software & Services | 5.65% |
| Amazon.com, Inc. | Retailing | 4.29% |
| Berkshire Hathaway Inc., Class A | Diversified Financial Services | 3.71% |
| Liberty Global PLC, Series C | Media | 3.58% |
| UnitedHealth Group Inc. | Health Care Equipment & Services | 3.11% |
| Express Scripts Holding Co. | Health Care Equipment & Services | 2.98% |
| Texas Instruments Inc. | Semiconductors & Semiconductor Equipment | 2.48% |
| | |
| | |
| *Google Inc. holding includes Class A and Class C. | | |
| DAVIS VALUE PORTFOLIO | Fund Overview – (Continued) |
| December 31, 2014 |
New Positions Added (01/01/14-12/31/14)
(Highlighted positions are those greater than 1.50% of the Fund's 12/31/14 net assets)
| Security | Industry | Date of 1st Purchase | % of Fund's 12/31/14 Net Assets |
| Amazon.com, Inc. | Retailing | 02/07/14 | 4.29% |
| Citizens Financial Group Inc. | Banks | 09/23/14 | 0.46% |
| Encana Corp. | Energy | 08/25/14 | 1.58% |
| Halliburton Co. | Energy | 12/11/14 | 0.82% |
| Holcim Ltd. | Materials | 04/15/14 | – |
| International Business Machines Corp. | Software & Services | 09/08/14 | – |
| Las Vegas Sands Corp. | Consumer Services | 01/08/14 | 2.28% |
| Moody's Corp. | Diversified Financial Services | 04/16/14 | 0.65% |
| Quest Diagnostics Inc. | Health Care Equipment & Services | 05/06/14 | 1.09% |
| Schneider Electric SE | Capital Goods | 02/27/14 | 0.44% |
| SouFun Holdings Ltd., Class A, ADR | Software & Services | 03/10/14 | 0.27% |
| Sysco Corp. | Food & Staples Retailing | 01/09/14 | 1.16% |
| Ultra Petroleum Corp. | Energy | 06/04/14 | 0.72% |
| Valeant Pharmaceuticals International, Inc. | Pharmaceuticals, Biotechnology & | | |
| Life Sciences | 03/07/14 | 1.30% |
Positions Closed (01/01/14-12/31/14)
(Gains and losses greater than $2,000,000 are highlighted)
| Security | Industry | Date of Final Sale | | | Realized Gain (Loss) |
| Activision Blizzard, Inc. | Software & Services | 11/20/14 | | $ | 1,900,991 |
| Air Products and Chemicals, Inc. | Materials | 09/16/14 | | | 3,519,998 |
| Alleghany Corp. | Reinsurance | 08/21/14 | | | 1,930,065 |
| Ameriprise Financial, Inc. | Capital Markets | 01/30/14 | | | 2,447,408 |
| Bed Bath & Beyond Inc. | Retailing | 06/18/14 | | | 4,689,976 |
| Brookfield Property Partners L.P. | Real Estate | 03/14/14 | | | (15,502) |
| Canadian Natural Resources Ltd. | Energy | 12/19/14 | | | 1,751,959 |
China Merchants Holdings International Co., Ltd. | Transportation | 07/02/14 | | | 1,160,576 |
| Coca-Cola Co. | Food, Beverage & Tobacco | 02/10/14 | | | 1,357,697 |
| VS Health Corp. | Food & Staples Retailing | 10/03/14 | | | 13,644,019 |
| Emerald Plantation Holdings Ltd. | Materials | 07/08/14 | | | (14,497) |
| Emerald Plantation Holdings Ltd., Sr. Notes, | | | | | |
| 6.00%/8.00%, 01/30/20 | Materials | 07/01/14 | | | 12,325 |
| Goldman Sachs Group, Inc. | Capital Markets | 04/16/14 | | | 332,337 |
| Harley-Davidson, Inc. | Automobiles & Components | 10/08/14 | | | 2,121,616 |
| Hewlett-Packard Co. | Technology Hardware & Equipment | 09/19/14 | | | 883,044 |
| Holcim Ltd. | Materials | 07/03/14 | | | 33,323 |
| International Business Machines Corp. | Software & Services | 10/28/14 | | | (738,709) |
| Iron Mountain Inc. | Commercial & Professional Services | 02/11/14 | | | 1,133,481 |
| Martin Marietta Materials, Inc. | Materials | 08/18/14 | | | 890,389 |
| Monsanto Co. | Materials | 11/17/14 | | | 2,092,899 |
| Nestle S.A. | Food, Beverage & Tobacco | 11/05/14 | | | 116,721 |
| Occidental Petroleum Corp. | Energy | 08/01/14 | | | 1,731,834 |
| Philip Morris International Inc. | Food, Beverage & Tobacco | 11/10/14 | | | 2,754,583 |
| Progressive Corp. | Property & Casualty Insurance | 05/21/14 | | | 5,009,353 |
| Schlumberger Ltd. | Energy | 09/10/14 | | | 1,122,862 |
| Twitter, Inc. | Software & Services | 08/13/14 | | | 456,057 |
| Walt Disney Co. | Media | 10/21/14 | | | 3,090,823 |
As a shareholder of the Fund, you incur ongoing costs only, including advisory and administrative fees and other Fund expenses. The Expense Example is intended to help you understand your ongoing costs (in dollars) of investing in the Fund and to compare these costs with the ongoing costs of investing in other mutual funds. The Expense Example is based on an investment of $1,000 invested at the beginning of the period and held for the entire period indicated, which for the Fund is for the six-month period ended December 31, 2014. Please note that the Expense Example is general and does not reflect charges imposed by your insurance company's separate account or account specific costs, which may increase your total costs of investing in the Fund. If these charges or account specific costs were included in the Expense Example, the expenses would have been higher.
Actual Expenses
The information represented in the row entitled "Actual" provides information about actual account values and actual expenses. You may use the information in this row, together with the amount you invested, to estimate the expenses that you paid over the period. Simply divide your account value by $1,000 (for example, an $8,600 account value divided by $1,000 = 8.6), then multiply the result by the number under the heading "Expenses Paid During Period" to estimate the expenses you paid on your account during this period.
Hypothetical Example for Comparison Purposes
The information represented in the row entitled "Hypothetical" provides information about hypothetical account values and hypothetical expenses based on the Fund's actual expense ratio and an assumed rate of return of 5% per year before expenses, which is not the Fund's actual return. The hypothetical account values and expenses may not be used to estimate the actual ending account balance or expenses you paid for the period. You may use this information to compare the ongoing costs of investing in the Fund and other funds. To do so, compare this 5% hypothetical example with the 5% hypothetical examples that appear in the shareholder reports of the other funds.
Please note that the expenses shown in the table are meant to highlight your ongoing costs only. Therefore, the information in the row entitled "Hypothetical" is useful in comparing ongoing costs only, and will not help you determine the relative total costs of owning different funds.
| Beginning Account Value (07/01/14) | | Ending Account Value (12/31/14) | | Expenses Paid During Period* (07/01/14-12/31/14) |
| | | | | |
| Actual | $1,000.00 | | $1,008.95 | | $3.14 |
| Hypothetical | $1,000.00 | | $1,022.08 | | $3.16 |
Hypothetical assumes 5% annual return before expenses.
* Expenses are equal to the Fund's annualized operating expense ratio (0.62%)**, multiplied by the average account value over the period, multiplied by 184/365 (to reflect the one-half year period).
** The expense ratio reflects the impact, if any, of certain reimbursements from the Adviser.
| DAVIS VALUE PORTFOLIO | |
| December 31, 2014 |
| Shares | | Value
(Note 1) |
| COMMON STOCK – (95.95%) |
| CONSUMER DISCRETIONARY – (15.82%) |
| | Consumer Durables & Apparel – (1.25%) |
| | | Compagnie Financiere Richemont S.A., Unit A (Switzerland) | | | 43,800 | | $ | 3,883,247 |
| Hunter Douglas N.V. (Netherlands) | | | 16,499 | | | 685,904 |
| | | 4,569,151 |
| Consumer Services – (2.28%) |
| Las Vegas Sands Corp. | | | 143,370 | | | 8,338,399 |
| Media – (3.58%) |
| Liberty Global PLC, Series C * | | | 270,300 | | | 13,058,193 |
| Retailing – (8.71%) |
| Amazon.com, Inc. * | | | 50,480 | | | 15,666,468 |
| CarMax, Inc. * | | | 104,780 | | | 6,976,253 |
| Liberty Interactive Corp., Series A * | | | 60,624 | | | 1,783,558 |
| Liberty TripAdvisor Holdings Inc., Class A * | | | 12,958 | | | 348,570 |
| Liberty Ventures, Series A * | | | 24,083 | | | 908,411 |
| Netflix Inc. * | | | 5,030 | | | 1,718,298 |
| Priceline Group Inc. * | | | 3,860 | | | 4,401,211 |
| | | 31,802,769 |
| | | TOTAL CONSUMER DISCRETIONARY | | | 57,768,512 |
| CONSUMER STAPLES – (6.71%) |
| Food & Staples Retailing – (3.57%) |
| Costco Wholesale Corp. | | | 62,260 | | | 8,825,355 |
| Sysco Corp. | | | 106,570 | | | 4,229,763 |
| | | 13,055,118 |
| Food, Beverage & Tobacco – (3.14%) |
| Diageo PLC, ADR (United Kingdom) | | | 63,733 | | | 7,271,298 |
| Heineken Holding N.V. (Netherlands) | | | 66,921 | | | 4,189,356 |
| | | 11,460,654 |
| TOTAL CONSUMER STAPLES | | | 24,515,772 |
| ENERGY – (4.82%) |
| Encana Corp. (Canada)(a) | | | 415,950 | | | 5,769,227 |
| EOG Resources, Inc. | | | 67,130 | | | 6,180,659 |
| Halliburton Co. | | | 76,240 | | | 2,998,519 |
| Ultra Petroleum Corp. * | | | 200,550 | | | 2,639,238 |
| TOTAL ENERGY | | | 17,587,643 |
| FINANCIALS – (37.29%) |
| Banks – (9.84%) |
| Citizens Financial Group Inc. | | | 68,250 | | | 1,696,695 |
| JPMorgan Chase & Co. | | | 113,528 | | | 7,104,582 |
| Wells Fargo & Co. | | | 494,944 | | | 27,132,830 |
| | | 35,934,107 |
| Diversified Financials – (23.60%) |
| Capital Markets – (10.32%) |
| Bank of New York Mellon Corp. | | | 554,120 | | | 22,480,649 |
| Brookfield Asset Management Inc., Class A (Canada) | | | 77,830 | | | 3,901,618 |
| Charles Schwab Corp. | | | 158,970 | | | 4,799,304 |
| Julius Baer Group Ltd. (Switzerland) | | | 142,171 | | | 6,491,242 |
| | 37,672,813 |
| DAVIS VALUE PORTFOLIO | Schedule of Investments - (Continued) |
| December 31, 2014 |
| Shares | | Value
(Note 1) |
| COMMON STOCK – (CONTINUED) |
| FINANCIALS – (CONTINUED) |
| | Diversified Financials – (Continued) |
| | Consumer Finance – (7.61%) |
| | American Express Co. | | | 298,359 | | $ | 27,759,322 |
| Diversified Financial Services – (5.67%) |
| Berkshire Hathaway Inc., Class A * | | | 60 | | | 13,560,000 |
| Moody's Corp. | | | 24,730 | | | 2,369,381 |
| Visa Inc., Class A | | | 18,240 | | | 4,782,528 |
| | 20,711,909 |
| | | 86,144,044 |
| Insurance – (3.43%) |
| Multi-line Insurance – (2.03%) |
| Fairfax Financial Holdings Ltd. (Canada) | | | 4,230 | | | 2,216,520 |
| Fairfax Financial Holdings Ltd., 144A (Canada)(b) | | | 1,220 | | | 639,277 |
| Loews Corp. | | | 108,160 | | | 4,544,883 |
| | 7,400,680 |
| Property & Casualty Insurance – (1.40%) |
| ACE Ltd. | | | 36,920 | | | 4,241,369 |
| Markel Corp. * | | | 1,290 | | | 880,864 |
| | 5,122,233 |
| | | 12,522,913 |
| Real Estate – (0.42%) |
| Hang Lung Group Ltd. (Hong Kong) | | | 338,130 | | | 1,533,284 |
| | | TOTAL FINANCIALS | | | 136,134,348 |
| HEALTH CARE – (10.85%) |
| Health Care Equipment & Services – (9.20%) |
| Express Scripts Holding Co. * | | | 128,590 | | | 10,887,716 |
| Laboratory Corp. of America Holdings * | | | 68,290 | | | 7,368,491 |
| Quest Diagnostics Inc. | | | 59,320 | | | 3,977,999 |
| UnitedHealth Group Inc. | | | 112,290 | | | 11,351,396 |
| | | 33,585,602 |
| Pharmaceuticals, Biotechnology & Life Sciences – (1.65%) |
| Agilent Technologies, Inc. | | | 30,970 | | | 1,267,912 |
| Valeant Pharmaceuticals International, Inc. (Canada)* | | | 33,170 | | | 4,746,958 |
| | | 6,014,870 |
| TOTAL HEALTH CARE | | | 39,600,472 |
| INDUSTRIALS – (4.22%) |
| Capital Goods – (2.61%) |
| OCI N.V. (Netherlands)* | | | 29,250 | | | 1,017,018 |
| PACCAR Inc. | | | 67,620 | | | 4,598,836 |
| Schneider Electric SE (France) | | | 22,180 | | | 1,615,352 |
| Textron Inc. | | | 54,500 | | | 2,294,995 |
| | | 9,526,201 |
| Commercial & Professional Services – (0.22%) |
| Experian PLC (United Kingdom) | | | 48,914 | | | 824,541 |
| Transportation – (1.39%) |
| Kuehne & Nagel International AG (Switzerland) | | | 34,733 | | | 4,717,970 |
| DAVIS VALUE PORTFOLIO | Schedule of Investments - (Continued) |
| December 31, 2014 |
| Shares/Principal | | Value
(Note 1) |
| COMMON STOCK – (CONTINUED) |
| INDUSTRIALS – (CONTINUED) |
| | Transportation – (Continued) |
| | Wesco Aircraft Holdings, Inc. * | | | 25,330 | | $ | 354,113 |
| | | 5,072,083 |
| | | | TOTAL INDUSTRIALS | | | 15,422,825 |
| Information Technology – (10.97%) |
| Semiconductors & Semiconductor Equipment – (2.48%) |
| Texas Instruments Inc. | | | 169,120 | | | 9,042,001 |
| Software & Services – (8.35%) |
| Google Inc., Class A * | | | 19,520 | | | 10,358,483 |
| Google Inc., Class C * | | | 19,520 | | | 10,275,328 |
| Microsoft Corp. | | | 88,210 | | | 4,097,355 |
| Oracle Corp. | | | 76,900 | | | 3,458,193 |
| Qihoo 360 Technology Co. Ltd., Class A, ADR (China)* | | | 23,090 | | | 1,322,133 |
| SouFun Holdings Ltd., Class A, ADR (China) | | | 133,840 | | | 989,078 |
| | | 30,500,570 |
| Technology Hardware & Equipment – (0.14%) |
| Keysight Technologies, Inc. * | | | 15,485 | | | 522,928 |
| TOTAL INFORMATION TECHNOLOGY | | | 40,065,499 |
| MATERIALS – (5.27%) |
| Ecolab Inc. | | | 42,700 | | | 4,463,004 |
| Lafarge S.A. (France) | | | 103,160 | | | 7,241,841 |
| Praxair, Inc. | | | 58,190 | | | 7,539,096 |
| TOTAL MATERIALS | | | 19,243,941 |
| TOTAL COMMON STOCK – (Identified Cost $207,040,086) | | | 350,339,012 |
| SHORT-TERM INVESTMENTS – (3.96%) |
| Mizuho Securities USA Inc. Joint Repurchase Agreement, 0.08%, 01/02/15, dated 12/31/14, repurchase value of $4,052,018 (collateralized by: U.S. Government agency mortgages in a pooled cash account, 2.50%-3.50%, 12/01/27-10/01/28, total market value $4,133,040) | | $ | 4,052,000 | | | 4,052,000 |
| Nomura Securities International, Inc. Joint Repurchase Agreement, 0.08%, 01/02/15, dated 12/31/14, repurchase value of $7,429,033 (collateralized by: U.S. Government agency mortgages in a pooled cash account, 3.00%-8.00%, 12/15/22-12/20/44, total market value $7,577,580) | | | 7,429,000 | | | 7,429,000 |
| SunTrust Robinson Humphrey, Inc. Joint Repurchase Agreement, 0.18%, 01/02/15, dated 12/31/14, repurchase value of $2,972,030 (collateralized by: U.S. Government agency mortgages in a pooled cash account, 0.00%-4.00%, 02/01/22-11/01/44, total market value $3,031,440) | | | 2,972,000 | | | 2,972,000 |
| TOTAL SHORT-TERM INVESTMENTS – (Identified cost $14,453,000) | | | 14,453,000 |
| INVESTMENT OF CASH COLLATERAL FOR SECURITIES LOANED – (0.23%) |
| MONEY MARKET FUNDS – (0.23%) |
| State Street Navigator Securities Lending Prime Portfolio | | | 837,772 | | | 837,772 |
| TOTAL INVESTMENT OF CASH COLLATERAL FOR SECURITIES LOANED – (Identified cost $837,772) | | | 837,772 |
| DAVIS VALUE PORTFOLIO | Schedule of Investments - (Continued) |
| December 31, 2014 |
| | | Total Investments – (100.14%) – (Identified cost $222,330,858) – (c) | | $ | 365,629,784 |
| Liabilities Less Other Assets – (0.14%) | | | (504,414) |
| | | Net Assets – (100.00%) | | $ | 365,125,370 |
|
| ADR: American Depositary Receipt |
|
| * | Non-Income producing security. |
|
| (a) | Security is partially on loan – See Note 6 of the Notes to Financial Statements. |
|
| (b) | This security is subject to Rule 144A. The Board of Directors of the Fund has determined that there is sufficient liquidity in this security to realize current valuations. This security amounted to $639,277 or 0.18% of the Fund's net assets as of December 31, 2014. |
|
| (c) | Aggregate cost for federal income tax purposes is $223,837,771. At December 31, 2014 unrealized appreciation (depreciation) of securities for federal income tax purposes is as follows: |
| |
| Unrealized appreciation | | $ | 151,754,721 |
| Unrealized depreciation | | | (9,962,708) |
| Net unrealized appreciation | | $ | 141,792,013 |
|
| See Notes to Financial Statements |
| DAVIS VALUE PORTFOLIO | Statement of Assets and Liabilities |
| At December 31, 2014 |
| ASSETS: | | | | | |
| Investments in* (see accompanying Schedule of Investments): | | | |
| | Securities at value | | $ | 364,792,012 |
| Collateral for securities loaned (Note 6) | | | 837,772 |
| Cash | | | 27,482 |
| Receivables: | | | |
| Capital stock sold | | | 8,949 |
| Dividends and interest | | | 248,555 |
| Investment securities sold | | | 1,034,822 |
| Prepaid expenses | | | 8,760 |
| | Total assets | | | 366,958,352 |
LIABILITIES: | | | |
| Return of collateral for securities loaned (Note 6) | | | 837,772 |
| Payables: | | | |
| Capital stock redeemed | | | 438,738 |
| Investment securities purchased | | | 326,422 |
| Accrued investment advisory fee | | | 186,942 |
| Other accrued expenses | | | 43,108 |
| Total liabilities | | | 1,832,982 |
NET ASSETS | | $ | 365,125,370 |
SHARES OUTSTANDING | | | 32,243,004 |
NET ASSET VALUE, offering, and redemption price per share (Net assets ÷ Shares outstanding) | | $ | 11.32 |
NET ASSETS CONSIST OF: | | | |
| Par value of shares of capital stock | | $ | 32,243 |
| Additional paid-in capital | | | 215,194,967 |
| Overdistributed net investment income | | | (69,415) |
| Accumulated net realized gains from investments | | | 6,676,143 |
| Net unrealized appreciation on investments and foreign currency transactions | | | 143,291,432 |
| Net Assets | | $ | 365,125,370 |
| | | | | |
| *Including: | | | |
| Cost of Investments | | $ | 221,493,086 |
| Cost of collateral for securities loaned | | | 837,772 |
| Market value of securities on loan | | | 815,431 |
| | | | |
| See Notes to Financial Statements |
| DAVIS VALUE PORTFOLIO | |
| For the year ended December 31, 2014 |
| INVESTMENT INCOME: | | | | | | |
| Income: | | | |
| Dividends* | | $ | 5,404,381 |
| Interest | | | 13,767 |
| Net securities lending fees | | | 21,451 |
| | Total income | | | | 5,439,599 |
| | | | | | | | | |
| Expenses: | | | |
| Investment advisory fees (Note 3) | | $ | 2,078,306 | | | |
| Custodian fees | | | 88,237 | | | |
| Transfer agent fees | | | 17,048 | | | |
| Audit fees | | | 21,840 | | | |
| Legal fees | | | 8,694 | | | |
| Accounting fees (Note 3) | | | 7,992 | | | |
| Reports to shareholders | | | 27,645 | | | |
| Directors' fees and expenses | | | 76,510 | | | |
| Registration and filing fees | | | 214 | | | |
| Miscellaneous | | | 18,468 | | | |
| Total expenses | | | | 2,344,954 |
| Net investment income | | | 3,094,645 |
| | | | | | | | | |
REALIZED & UNREALIZED GAIN (LOSS) ON INVESTMENTS AND FOREIGN CURRENCY TRANSACTIONS: | | | | | | |
| Net realized gain (loss) from: | | | |
| Investment transactions | | | 75,596,365 |
| Foreign currency transactions | | | (2,485) |
| Net realized gain | | | 75,593,880 |
| Net decrease in unrealized appreciation | | | (56,348,187) |
| Net realized and unrealized gain on investments and foreign currency transactions | | | | 19,245,693 |
| Net increase in net assets resulting from operations | | $ | 22,340,338 |
| | | | | | | | | |
| *Net of foreign taxes withheld as follows | | $ | 129,509 |
| | | | | | | | | |
| See Notes to Financial Statements |
| DAVIS VALUE PORTFOLIO | Statements of Changes in Net Assets |
| | Year ended December 31, |
| | 2014 | | 2013 |
| | | | | | | |
| OPERATIONS: | | | | | | |
| Net investment income | | $ | 3,094,645 | | $ | 3,129,870 |
| Net realized gain from investments and foreign currency transactions | | | 75,593,880 | | | 29,735,695 |
Net increase (decrease) in unrealized appreciation on investments and foreign currency transactions | | | (56,348,187) | | | 74,418,963 |
| Net increase in net assets resulting from operations | | | 22,340,338 | | | 107,284,528 |
| | | | | | | | |
| DIVIDENDS AND DISTRIBUTIONS TO SHAREHOLDERS FROM: | | | | | | |
| Net investment income | | | (3,407,176) | | | (3,160,869) |
| | | | | | |
| Realized gains from investment transactions | | | (73,745,408) | | | (26,731,139) |
| | | | | | | | |
| CAPITAL SHARE TRANSACTIONS: | | | | | | |
Net increase (decrease) in net assets resulting from capital share transactions (Note 4) | | | 23,686,496 | | | (26,697,277) |
| Total increase (decrease) in net assets | | | (31,125,750) | | | 50,695,243 |
| | | | | | | | |
| NET ASSETS: | | | | | | |
| Beginning of year | | | 396,251,120 | | | 345,555,877 |
End of year* | | $ | 365,125,370 | | $ | 396,251,120 |
| | | | | | | | |
| *Including undistributed (overdistributed) net investment income of | | $ | (69,415) | | $ | 247,985 |
| | | | | | | |
| See Notes to Financial Statements |
| DAVIS VALUE PORTFOLIO | Notes to Financial Statements |
| December 31, 2014 |
NOTE 1 - SUMMARY OF SIGNIFICANT ACCOUNTING POLICIES
The Fund is a separate series of Davis Variable Account Fund, Inc. (a Maryland corporation), which is registered under the Investment Company Act of 1940, as amended, as a diversified, open-end management investment company. Only insurance companies, for the purpose of funding variable annuity or variable life insurance contracts, may purchase shares of the Fund. The following is a summary of significant accounting policies followed by the Fund in the preparation of its financial statements.
Security Valuation - The Fund calculates the net asset value of its shares as of the close of the New York Stock Exchange ("Exchange"), normally 4:00 P.M. Eastern time, on each day the Exchange is open for business. Securities listed on the Exchange (and other national exchanges including NASDAQ) are valued at the last reported sales price on the day of valuation. Listed securities for which no sale was reported on that date are valued at the average of closing bid and asked prices. Securities traded on foreign exchanges are valued based upon the last sales price on the principal exchange on which the security is traded prior to the time when the Fund's assets are valued. Securities (including restricted securities) for which market quotations are not readily available or securities whose values have been materially affected by what Davis Selected Advisers, L.P. ("Davis Advisors" or "Adviser"), the Fund's investment adviser, identifies as a significant event occurring before the Fund's assets are valued, but after the close of their respective exchanges will be fair valued using a standardized fair valuation methodology applicable to the security type or the significant event as previously approved by the Fund's Pricing Committee and Board of Directors. The Pricing Committee considers all facts it deems relevant that are reasonably available, through either public information or information available to the Adviser's portfolio management team, when determining the fair value of a security. To assess the continuing appropriateness of security valuations, the Adviser may compare prior day prices, prices of comparable securities, and sale prices to the prior or current day prices and challenge those prices exceeding certain tolerance levels with the third-party pricing service or broker source. Fair value determinations are subject to review, approval, and ratification by the Fund's Board of Directors at its next regularly scheduled meeting covering the period in which the fair valuation was determined.
Short-term securities purchased within 60 days to maturity are valued at amortized cost, which approximates market value.
The Fund's valuation procedures are reviewed and subject to approval by the Board of Directors. There have been no significant changes to the fair valuation procedures during the period.
Value Measurements - Fair value is defined as the price that the Fund would receive upon selling an investment in an orderly transaction to an independent buyer in the principal market for the investment. Various inputs are used to determine the fair value of the Fund's investments. These inputs are summarized in the three broad levels listed below.
| Level 1 – | quoted prices in active markets for identical securities |
| Level 2 – | other significant observable inputs (including quoted prices for similar investments, interest rates, prepayment speeds, credit risk, etc.) |
| Level 3 – | significant unobservable inputs (including the Fund's own assumptions in determining the fair value of investments) |
The inputs or methodologies used for valuing securities are not necessarily an indication of the risks associated with investing in those securities nor can it be assured that the Fund can obtain the fair value assigned to a security if it were to sell the security.
| DAVIS VALUE PORTFOLIO | Notes to Financial Statements – (Continued) |
| December 31, 2014 |
NOTE 1 - SUMMARY OF SIGNIFICANT ACCOUNTING POLICIES – (CONTINUED)
Value Measurements - (Continued)
The following is a summary of the inputs used as of December 31, 2014 in valuing the Fund's investments carried at value:
| Investments in Securities at Value |
| Valuation Inputs |
| | | Level 2: | | Level 3: | | |
| | | Other Significant | | Significant | | |
| Level 1: | | Observable | | Unobservable | | |
| Quoted Prices | | Inputs* | | Inputs | | Total |
Equity securities: | | | | | | | | | | | |
| Consumer Discretionary | $ | 53,199,361 | | $ | 4,569,151 | | $ | – | | $ | 57,768,512 |
| Consumer Staples | | 20,326,416 | | | 4,189,356 | | | – | | | 24,515,772 |
| Energy | | 17,587,643 | | | – | | | – | | | 17,587,643 |
| Financials | | 128,109,822 | | | 8,024,526 | | | – | | | 136,134,348 |
| Health Care | | 39,600,472 | | | – | | | – | | | 39,600,472 |
| Industrials | | 7,247,944 | | | 8,174,881 | | | – | | | 15,422,825 |
| Information Technology | | 40,065,499 | | | – | | | – | | | 40,065,499 |
| Materials | | 12,002,100 | | | 7,241,841 | | | – | | | 19,243,941 |
| Short-term securities | | – | | | 14,453,000 | | | – | | | 14,453,000 |
| Investment of cash collateral for securities loaned | | – | | | 837,772 | | | – | | | 837,772 |
| Total Investments | $ | 318,139,257 | | $ | 47,490,527 | | $ | – | | $ | 365,629,784 |
| | | | | | | | | | |
Level 1 to Level 2 Transfers**: | | | | | | | | | |
| Consumer Discretionary | $ | 4,569,151 | | | | | | | |
| Consumer Staples | | 4,189,356 | | | | | | | |
| Financials | | 8,024,526 | | | | | | | |
| Industrials | | 6,559,529 | | | | | | | |
| Materials | | 7,241,841 | | | | | | | |
| Total | $ | 30,584,403 | | | | | | | |
*Includes certain securities trading primarily outside the U.S. whose value the Fund adjusted as a result of significant market movements following the close of local trading.
**Application of fair value procedures for securities traded on foreign exchanges triggered the transfers of investments between Level 1 and Level 2 of the fair value hierarchy during the year ended December 31, 2014.
Master Repurchase Agreements - The Fund, along with other affiliated funds, may transfer uninvested cash balances into one or more master repurchase agreement accounts. These balances are invested in one or more repurchase agreements, secured by U.S. Government securities. A custodian bank holds securities pledged as collateral for repurchase agreements until the agreements mature. Each agreement requires that the market value of the collateral be sufficient to cover payments of interest and principal; however, in the event of default by the other party to the agreement, retention of the collateral may be subject to legal proceedings.
Currency Translation - The market values of all assets and liabilities denominated in foreign currencies are recorded in the financial statements after translation to the U.S. Dollar based upon the mean between the bid and offered quotations of the currencies against U.S. Dollars on the date of valuation. The cost basis of such assets and liabilities is determined based upon historical exchange rates. Income and expenses are translated at average exchange rates in effect as accrued or incurred.
| DAVIS VALUE PORTFOLIO | Notes to Financial Statements – (Continued) |
| December 31, 2014 |
NOTE 1 - SUMMARY OF SIGNIFICANT ACCOUNTING POLICIES – (CONTINUED)
Foreign Currency - The Fund may enter into forward purchases or sales of foreign currencies to hedge certain foreign currency denominated assets and liabilities against declines in market value relative to the U.S. Dollar. Forward currency contracts are marked-to-market daily and the change in market value is recorded by the Fund as an unrealized gain or loss. When the forward currency contract is closed, the Fund records a realized gain or loss equal to the difference between the value of the forward currency contract at the time it was opened and value at the time it was closed. Investments in forward currency contracts may expose the Fund to risks resulting from unanticipated movements in foreign currency exchange rates or failure of the counter-party to the agreement to perform in accordance with the terms of the contract.
Reported net realized foreign exchange gains or losses arise from the sales of foreign currencies, currency gains or losses realized between the trade and settlement dates on security transactions, the difference between the amounts of dividends, interest, and foreign withholding taxes recorded on the Fund's books, and the U.S. Dollar equivalent of the amounts actually received or paid. Net unrealized foreign exchange gains or losses arise from changes in the value of assets and liabilities other than investments in securities at fiscal year end, resulting from changes in the exchange rate. The Fund includes foreign currency gains and losses realized on the sales of investments together with market gains and losses on such investments in the Statement of Operations.
Federal Income Taxes - It is the Fund's policy to comply with the requirements of the Internal Revenue Code applicable to regulated investment companies, and to distribute substantially all of its taxable income, including any net realized gains on investments not offset by loss carryovers, to shareholders. Therefore, no provision for federal income or excise tax is required. The Adviser has analyzed the Fund's tax positions taken on federal and state income tax returns for all open tax years and has concluded that as of December 31, 2014, no provision for income tax is required in the Fund's financial statements related to these tax positions. The Fund's federal and state (Arizona) income and federal excise tax returns for tax years for which the applicable statutes of limitations have not expired are subject to examination by the Internal Revenue Service and state department of revenue. The earliest tax year that remains subject to examination by these jurisdictions is 2011.
Securities Transactions and Related Investment Income - Securities transactions are accounted for on the trade date (date the order to buy or sell is executed) with realized gain or loss on the sale of securities being determined based upon identified cost. Dividend income is recorded on the ex-dividend date. Interest income, which includes accretion of discount and amortization of premium, is accrued as earned.
Dividends and Distributions to Shareholders - Dividends and distributions to shareholders are recorded on the ex-dividend date. Net investment income (loss), net realized gains (losses), and net unrealized appreciation (depreciation) on investments may differ for financial statement and tax purposes primarily due to differing treatments of wash sales and foreign currency transactions. The character of dividends and distributions made during the fiscal year from net investment income and net realized securities gains may differ from their ultimate characterization for federal income tax purposes. Also, due to the timing of dividends and distributions, the fiscal year in which amounts are distributed may differ from the fiscal year in which income or realized gain was recorded by the Fund. The Fund adjusts certain components of capital to reflect permanent differences between financial statement amounts and net income and realized gains/losses determined in accordance with income tax rules. Accordingly, during the year ended December 31, 2014, amounts have been reclassified to reflect an increase in overdistributed net investment income of $4,869 and a corresponding increase in accumulated net realized gains from investments and foreign currency transactions. The Fund's net assets have not been affected by this reclassification.
The tax character of distributions paid during the years ended December 31, 2014 and 2013 was as follows:
| 2014 | | 2013 |
| Ordinary income | $ | 3,407,176 | | $ | 4,823,050 |
| Long-term capital gain | | 73,745,408 | | | 25,068,958 |
| Total | $ | 77,152,584 | | $ | 29,892,008 |
| DAVIS VALUE PORTFOLIO | Notes to Financial Statements – (Continued) |
| December 31, 2014 |
NOTE 1 - SUMMARY OF SIGNIFICANT ACCOUNTING POLICIES – (CONTINUED)
Dividends and Distributions to Shareholders - (Continued)
As of December 31, 2014, the components of distributable earnings on a tax basis were as follows:
| Undistributed net investment income | $ | 5,693 |
| Undistributed long-term capital gains | | 8,183,046 |
| Net unrealized appreciation on investments | | 141,784,520 |
| Total | $ | 149,973,259 |
Indemnification - Under the Fund's organizational documents, its officers and directors are indemnified against certain liabilities arising out of the performance of their duties to the Fund. In addition, some of the Fund's contracts with its service providers contain general indemnification clauses. The Fund's maximum exposure under these arrangements is unknown since the amount of any future claims that may be made against the Fund cannot be determined and the Fund has no historical basis for predicting the likelihood of any such claims.
Use of Estimates in Financial Statements - In preparing financial statements in conformity with accounting principles generally accepted in the United States of America, management makes estimates and assumptions that affect the reported amounts of assets and liabilities and disclosure of contingent assets and liabilities at the date of the financial statements, as well as the reported amounts of income and expenses during the reporting period. Actual results may differ from these estimates.
Directors Fees and Expenses - The Fund set up a Rabbi Trust to provide for the deferred compensation plan for Independent Directors that enables them to elect to defer receipt of all or a portion of annual fees they are entitled to receive. The value of an eligible Director's account is based upon years of service and fees paid to each Director during the years of service. The amount paid to the Director by the Trust under the plan will be determined based upon the performance of the Davis Funds in which the amounts are invested.
NOTE 2 - PURCHASES AND SALES OF SECURITIES
The cost of purchases and proceeds from sales of investment securities (excluding short-term securities) during the year ended December 31, 2014 were $97,107,012 and $153,436,107, respectively.
NOTE 3 - FEES AND OTHER TRANSACTIONS WITH AFFILIATES
Davis Selected Advisers-NY, Inc. ("DSA-NY"), a wholly-owned subsidiary of the Adviser, acts as sub-adviser to the Fund. DSA-NY performs research and portfolio management services for the Fund under a Sub-Advisory Agreement with the Adviser. The Fund pays no fees directly to DSA-NY.
Certain directors and officers of the Fund are also directors and officers of the general partner of the Adviser.
Investment Advisory Fees - Advisory fees are paid monthly to the Adviser at an annual rate of 0.55% of the Fund's average net assets.
Accounting Fees - State Street Bank and Trust Company ("State Street Bank") is the Fund's primary accounting provider. Fees for accounting services are included in the custodian fees as State Street Bank also serves as the Fund's custodian. The Adviser is also paid for certain accounting services. The fee paid to the Adviser for these services during the year ended December 31, 2014 amounted to $7,992.
| DAVIS VALUE PORTFOLIO | Notes to Financial Statements – (Continued) |
| December 31, 2014 |
NOTE 4 - CAPITAL STOCK
At December 31, 2014, there were 500 million shares of capital stock ($0.001 par value per share) authorized. Transactions in capital stock were as follows:
| Year ended December 31, 2014 |
| | Sold | | | Reinvestment of Distributions | | | Redeemed | | | Net Increase |
| | | | | | | | | | | |
Shares: | | 573,457 | | | 6,726,467 | | | (4,462,207) | | | 2,837,717 |
Value: | $ | 7,836,605 | | $ | 77,152,584 | | $ | (61,302,693) | | $ | 23,686,496 |
| | | | | | | | | | | |
|
| Year ended December 31, 2013 |
| | Sold | | | Reinvestment of Distributions | | | Redeemed | | | Net Decrease |
| | | | | | | | | | | |
Shares: | | 977,891 | | | 2,230,747 | | | (5,424,748) | | | (2,216,110) |
Value: | $ | 12,415,959 | | $ | 29,892,008 | | $ | (69,005,244) | | $ | (26,697,277) |
| | | | | | | | | | | |
NOTE 5 - BANK BORROWINGS
The Fund may borrow up to 5% of its assets from a bank to purchase portfolio securities, or for temporary and emergency purposes. The purchase of securities with borrowed funds creates leverage in the Fund. The Fund has entered into an agreement, which enables it to participate with certain other funds managed by the Adviser in an unsecured line of credit with a bank, which permits borrowings up to $50 million, collectively. Interest is charged based on its borrowings, at a rate equal to the higher of the Federal Funds Rate or the Overnight Libor Rate, plus 1.25%. The Fund had no borrowings during the year ended December 31, 2014.
NOTE 6 - SECURITIES LOANED
The Fund has entered into a securities lending arrangement with State Street Bank. Under the terms of the agreement, the Fund receives fee income from lending transactions; in exchange for such fees, State Street Bank is authorized to loan securities on behalf of the Fund, against receipt of collateral at least equal to the value of the securities loaned. As of December 31, 2014, the Fund had on loan:
| Securities valued at | $ | 815,431 |
| Collateral for securities loaned | | 837,772 |
The Fund bears the risk of any deficiency in the amount of the collateral available for return to a borrower due to a loss in an approved investment.
FEDERAL INCOME TAX INFORMATION
(UNAUDITED)
During the calendar year ended December 31, 2014, the Fund declared and paid long-term capital gain distributions in the amount of $73,745,408.
During the calendar year ended December 31, 2014, $3,407,176 of dividends paid by the Fund constituted income dividends for federal income tax purposes. The Fund designates $3,355,110 or 98% as income qualifying for the corporate dividends-received deduction.
| The following financial information represents selected data for each share of capital stock outstanding throughout each period: |
| Year ended December 31, |
| | | 2014 | | 2013 | | 2012 | | 2011 | | 2010 |
| Net Asset Value, Beginning of Period | | $ | 13.48 | | $ | 10.93 | | $ | 10.47 | | $ | 11.97 | | $ | 10.75 |
| | | | | | | | | | |
| Income (Loss) from Investment Operations: | | | | | | | | | | |
| Net Investment Income | | 0.12 | | 0.12 | | 0.20 | | 0.13 | | 0.11 |
| Net Realized and Unrealized Gains (Losses) | | 0.73 | | 3.53 | | 1.16 | | (0.63) | | 1.26 |
| Total from Investment Operations | | 0.85 | | 3.65 | | 1.36 | | (0.50) | | 1.37 |
| | | | | | | | | | |
| Dividends and Distributions: | | | | | | | | | | |
| Dividends from Net Investment Income | | (0.13) | | (0.12) | | (0.19) | | (0.10) | | (0.15) |
| Distributions from Realized Gains | | (2.88) | | (0.98) | | (0.71) | | (0.90) | | – |
| Total Dividends and Distributions | | (3.01) | | (1.10) | | (0.90) | | (1.00) | | (0.15) |
| Net Asset Value, End of Period | | $ | 11.32 | | $ | 13.48 | | $ | 10.93 | | $ | 10.47 | | $ | 11.97 |
| | | | | | | | | | |
Total Returna | | 6.06% | | 33.43% | | 13.08% | | (4.18)% | | 12.76% |
| | | | | | | | | | | | | | | |
| Ratios/Supplemental Data: | | | | | | | | | | | | | | | |
| Net Assets, End of Period (in thousands) | | $ | 365,125 | | $ | 396,251 | | $ | 345,556 | | $ | 351,369 | | $ | 472,734 |
| Ratio of Expenses to Average Net Assets: | | | | | | | | | | | | | | | |
| Gross | | 0.62% | | 0.62% | | 0.64% | | 0.63% | | 0.63% |
| Netb | | 0.62% | | 0.62% | | 0.64% | | 0.63% | | 0.63% |
Ratio of Net Investment Income to Average Net Assets | | 0.82% | | 0.84% | | 1.63% | | 1.15% | | 1.03% |
Portfolio Turnover Ratec | | 26% | | 10% | | 10% | | 13% | | 21% |
| a | Assumes hypothetical initial investment on the business day before the first day of the fiscal period, with all dividends and distributions reinvested in additional shares on the reinvestment date, and redemption at the net asset value calculated on the last business day of the fiscal period. Total returns do not reflect charges attributable to your insurance company's separate account. Inclusion of these charges would reduce the total returns shown. |
| |
| b | The Net Ratio of Expenses to Average Net Assets reflects the impact, if any, of the reduction of expenses paid indirectly and of certain reimbursements from the Adviser. |
| |
| c | The lesser of purchases or sales of portfolio securities for a period, divided by the monthly average of the market value of portfolio securities owned during the period. Securities with a maturity or expiration date at the time of acquisition of one year or less are excluded from the calculation. |
|
| See Notes to Financial Statements |
| DAVIS VALUE PORTFOLIO | Report of Independent Registered Public Accounting Firm |
The Shareholders and Board of Directors
Davis Variable Account Fund, Inc.:
We have audited the accompanying statement of assets and liabilities of Davis Value Portfolio (a separate series of Davis Variable Account Fund, Inc.) including the schedule of investments, as of December 31, 2014, and the related statement of operations for the year then ended, the statement of changes in net assets for each of the years in the two-year period then ended, and the financial highlights for each of the years in the five-year period then ended. These financial statements and financial highlights are the responsibility of the Funds' management. Our responsibility is to express an opinion on these financial statements and financial highlights based on our audits.
We conducted our audits in accordance with the standards of the Public Company Accounting Oversight Board (United States). Those standards require that we plan and perform the audit to obtain reasonable assurance about whether the financial statements and financial highlights are free of material misstatement. An audit includes examining, on a test basis, evidence supporting the amounts and disclosures in the financial statements. Our procedures included confirmation of securities owned as of December 31, 2014, by correspondence with the custodian and brokers or by other appropriate auditing procedures. An audit also includes assessing the accounting principles used and significant estimates made by management, as well as evaluating the overall financial statement presentation. We believe that our audits provide a reasonable basis for our opinion.
In our opinion, the financial statements and financial highlights referred to above present fairly, in all material respects, the financial position of Davis Value Portfolio as of December 31, 2014, the results of its operations for the year then ended, the changes in its net assets for each of the years in the two-year period then ended, and the financial highlights for each of the years in the five-year period then ended, in conformity with U.S. generally accepted accounting principles.
KPMG LLP
Denver, Colorado
February 10, 2015
For the purposes of their service as directors to the Davis Funds, the business address for each of the directors is 2949 E. Elvira Road, Suite 101, Tucson, AZ 85756. Each Director serves until their retirement, resignation, death, or removal. Subject to exceptions and exemptions, which may be granted by the Independent Directors, Directors must retire at the close of business on the last day of the calendar year in which the Director attains age seventy-four (74).
Name (birthdate) | Position(s) Held With Fund | Term of Office and Length of Time Served | Principal Occupation(s) During Past Five Years | Number of Portfolios in Fund Complex Overseen by Director | Other Directorships Held by Director |
|
| Independent Directors |
|
Marc P. Blum (09/09/42) | Director | Director since 1986 | Chief Executive Officer, World Total Return Fund, LLLP; of Counsel to Gordon Feinblatt LLC (law firm). | 13 | Director, Rodney Trust Company (trust and asset management company). |
|
John S. Gates, Jr. (08/02/53) | Director | Director since 2007 | Chairman and Chief Executive Officer of PortaeCo LLC (private investment company). | 13 | Director, DCT Industrial Trust (REIT); Chairman, Regional Transportation Authority of Chicago (public transportation system). |
|
Thomas S. Gayner (12/16/61) | Director/ Chairman | Director since 2004 | President and Chief Investment Officer, Markel Corp. (diversified financial holding company). | 13 | Director, Graham Holdings Company (publishing company); Director, Colfax Corp. (engineering and manufacturer of pumps and fluid handling equipment). |
|
Samuel H. Iapalucci (07/19/52) | Director | Director since 2006 | Retired; Executive Vice President and Chief Financial Officer, CH2M- HILL Companies, Ltd. (engineering) until 2008. | 13 | Director, exp Global Inc. (engineering). |
|
Robert P. Morgenthau (03/22/57) | Director | Director since 2002 | Principal, Spears Abacus Advisors, LLC (investment management firm) since 2011; Chairman, NorthRoad Capital Management, LLC (investment management firm) 2002-2011. | 13 | none |
|
Marsha Williams (03/28/51) | Director | Director since 1999 | Retired; Senior Vice President and Chief Financial Officer, Orbitz Worldwide, Inc. (travel-services provider) 2007-2010. | 13 | Director, Modine Manufacturing Company (heat transfer technology); Director, Chicago Bridge & Iron Company, N.V. (industrial construction and engineering); Director, Fifth Third Bancorp (diversified financial services). |
| DAVIS VALUE PORTFOLIO | Directors and Officers – (Continued) |
Name (birthdate) | Position(s) Held With Fund | Term of Office and Length of Time Served | Principal Occupation(s) During Past Five Years | Number of Portfolios in Fund Complex Overseen by Director | Other Directorships Held by Director |
| | | | | |
Inside Directors* |
|
Andrew A. Davis (06/25/63) | Director | Director since 1997 | President or Vice President of each Davis Fund and Selected Fund; President, Davis Selected Advisers, L.P., and also serves as an executive officer of certain companies affiliated with the Adviser. | 16 | Director, Selected Funds (consisting of two portfolios) since 1998; Trustee of Clipper Funds Trust (consisting of one portfolio) since 2014. |
|
Christopher C. Davis (07/13/65) | Director | Director since 1997 | President or Vice President of each Davis Fund, Selected Fund, and Clipper Fund; Chairman, Davis Selected Advisers, L.P., and also serves as an executive officer of certain companies affiliated with the Adviser, including sole member of the Adviser's general partner, Davis Investments, LLC; Employee of Shelby Cullom Davis & Co. (registered broker/dealer). | 16 | Director, Selected Funds (consisting of two portfolios) since 1998; Trustee of Clipper Funds Trust (consisting of one portfolio) since 2014; Director, Graham Holdings Company (publishing company). |
*Andrew A. Davis and Christopher C. Davis own partnership units (directly, indirectly, or both) of the Adviser and are considered to be "interested persons" of the Funds as defined in the Investment Company Act of 1940. Andrew A. Davis and Christopher C. Davis are brothers.
Officers
Andrew A. Davis (born 06/25/63, Davis Funds officer since 1997). See description in the section on Inside Directors.
Christopher C. Davis (born 07/13/65, Davis Funds officer since 1997). See description in the section on Inside Directors.
Kenneth C. Eich (born 08/14/53, Davis Funds officer since 1997). Executive Vice President and Principal Executive Officer of each of the Davis Funds (consisting of 13 portfolios), Selected Funds (consisting of two portfolios), and Clipper Funds Trust (consisting of one portfolio); Chief Operating Officer, Davis Selected Advisers, L.P., and also serves as an executive officer of certain companies affiliated with the Adviser.
Douglas A. Haines (born 03/04/71, Davis Funds officer since 2004). Vice President, Treasurer, Chief Financial Officer, Principal Financial Officer, and Principal Accounting Officer of each of the Davis Funds (consisting of 13 portfolios), Selected Funds (consisting of two portfolios), and Clipper Funds Trust (consisting of one portfolio); Vice President and Director of Fund Accounting, Davis Selected Advisers, L.P.
Sharra L. Haynes (born 09/25/66, Davis Funds officer since 1997). Vice President and Chief Compliance Officer of each of the Davis Funds (consisting of 13 portfolios), Selected Funds (consisting of two portfolios), and Clipper Funds Trust (consisting of one portfolio); Vice President and Chief Compliance Officer, Davis Selected Advisers, L.P., and also serves as an executive officer of certain companies affiliated with the Adviser.
Ryan M. Charles (born 07/25/78, Davis Funds officer since 2014). Vice President and Secretary of each of the Davis Funds (consisting of 13 portfolios), Selected Funds (consisting of two portfolios), and Clipper Funds Trust (consisting of one portfolio); Vice President, Chief Legal Officer, and Secretary, Davis Selected Advisers, L.P., and also serves as an executive officer of certain companies affiliated with the Adviser.
Arthur Don (born 09/24/53, Davis Funds officer since 1991). Assistant Secretary (for clerical purposes only) of each of the Davis Funds and Selected Funds; Shareholder, Greenberg Traurig, LLP (law firm); counsel to the Independent Directors and the Davis Funds.
DAVIS VALUE PORTFOLIO
| Investment Adviser |
| Davis Selected Advisers, L.P. (Doing business as "Davis Advisors") |
| 2949 East Elvira Road, Suite 101 |
| Tucson, Arizona 85756 |
| (800) 279-0279 |
|
| Distributor |
| Davis Distributors, LLC |
| 2949 East Elvira Road, Suite 101 |
| Tucson, Arizona 85756 |
|
| Transfer Agent |
| Boston Financial Data Services, Inc. |
| c/o The Davis Funds |
| P.O. Box 8406 |
| Boston, Massachusetts 02266-8406 |
|
| Custodian |
| State Street Bank and Trust Co. |
| One Lincoln Street |
| Boston, Massachusetts 02111 |
|
| Counsel |
| Greenberg Traurig, LLP |
| 77 West Wacker Drive, Suite 3100 |
| Chicago, Illinois 60601 |
|
| Independent Registered Public Accounting Firm |
| KPMG LLP |
| 1225 Seventeenth Street, Suite 800 |
| Denver, Colorado 80202 |
For more information about Davis Value Portfolio, including management fee, charges, and expenses, see the current prospectus, which must precede or accompany this report. The Fund's Statement of Additional Information contains additional information about the Fund's Directors and is available without charge, upon request, by calling 1-800-279-0279 and on the Fund's website at www.davisfunds.com. Quarterly Fact Sheets are available on the Fund's website at www.davisfunds.com.
| DAVIS FINANCIAL PORTFOLIO | Table of Contents |
| 2 |
| | |
| 4 |
| | |
| 6 |
| | |
| 7 |
| | |
| 9 |
| | |
| 10 |
| | |
| 11 |
| | |
| 12 |
| | |
| 16 |
| | |
| 17 |
| | |
| 18 |
| | |
| 19 |
This Annual Report is authorized for use by existing shareholders. Prospective shareholders must receive a current Davis Financial Portfolio prospectus, which contains more information about investment strategies, risks, charges, and expenses. Please read the prospectus carefully before investing or sending money.
Shares of the Davis Financial Portfolio are not deposits or obligations of any bank, are not guaranteed by any bank, are not insured by the FDIC or any other agency, and involve investment risks, including possible loss of the principal amount invested.
Portfolio Proxy Voting Policies and Procedures
The Fund has adopted Portfolio Proxy Voting Policies and Procedures under which the Fund votes proxies relating to securities held by the Fund. A description of the Fund's Portfolio Proxy Voting Policies and Procedures is available (i) without charge, upon request, by calling the Fund toll-free at 1-800-279-0279, (ii) on the Fund's website at www.davisfunds.com, and (iii) on the SEC's website at www.sec.gov.
In addition, the Fund is required to file Form N-PX, with its complete proxy voting record for the 12 months ended June 30th, no later than August 31st of each year. The Fund's Form N-PX filing is available (i) without charge, upon request, by calling the Fund toll-free at 1-800-279-0279, (ii) on the Fund's website at www.davisfunds.com, and (iii) on the SEC's website at www.sec.gov.
Form N-Q
The Fund files its complete schedule of portfolio holdings with the SEC for the first and third quarters of each fiscal year on Form N-Q. The Fund's Form N-Q is available without charge, upon request, by calling 1-800-279-0279, on the Fund's website at www.davisfunds.com, and on the SEC's website at www.sec.gov. The Fund's Form N-Q may be reviewed and copied at the SEC's Public Reference Room in Washington, DC, and information on the operation of the Public Reference Room may be obtained by calling 1-800-SEC-0330.
| DAVIS FINANCIAL PORTFOLIO | Management's Discussion of Fund Performance |
Performance Overview
Davis Financial Portfolio ("Fund") delivered a total return on net asset value of 12.85% for the year ended December 31, 2014 ("Period"). Over the same Period, the Standard & Poor's 500® Index ("Index") returned 13.69%.
The Fund's Absolute Performance
Diversified Financial companies represented a significant percentage of the Fund and were the most important contributor1 to the Fund's absolute performance over the Period. Brookfield Asset Management2, Bank of New York Mellon, and Visa were among the most important contributors to performance. Julius Baer Group, First Marblehead, and Ameriprise were among the most important detractors from performance. The Fund no longer owns First Marblehead or Ameriprise.
Insurance companies were the second most important contributor to the Fund's absolute performance. Markel, ACE, Marsh & McLennan, and Everest Re Group were among the most important contributors to performance. Loews and Progressive were among the most important detractors from performance. The Fund no longer owns Progressive.
Banking companies also made positive contributions to the Fund's absolute performance. Wells Fargo was the most important contributor to performance over the Period. JPMorgan Chase was among the most important contributors to performance while State Bank of India was among the most important detractors from performance. The Fund no longer owns State Bank of India.
Two of the Fund's most important detractors from performance were non-financial holdings. Bed Bath & Beyond and Google were among the top detractors from performance. Canadian Natural Resources, another non-financial holding, was among the most important contributors to performance. The Fund no longer owns Bed Bath & Beyond or Canadian Natural Resources.
The Fund had approximately 10% of its net assets invested in foreign companies at December 31, 2014. As a whole, those companies out-performed the domestic companies held by the Fund.
The Fund's Relative Performance
The Fund slightly under-performed the Index over the Period as the Fund's Financial holdings under-performed the corresponding sector3 within the Index. The Fund held a limited amount of assets in non-financial sector holdings. With the exception of the Fund's Energy sector holdings, the Fund's holdings in these other non-financial sectors detracted from the Fund's underperformance relative to the Index.
The Fund's Banking and Insurance holdings out-performed the corresponding industry groups within the Index. The Fund's Real Estate and Diversified Financial holdings under-performed the corresponding industry groups within the Index.
Davis Financial Portfolio's investment objective is long-term growth of capital. There can be no assurance that the Fund will achieve its objective. Davis Financial Portfolio's principal risks are: stock market risk, manager risk, common stock risk, large-capitalization companies risk, mid- and small-capitalization companies risk, headline risk, financial services risk, foreign country risk, emerging market risk, foreign currency risk, depositary receipts risk, focused portfolio risk, interest rate sensitivity risk, credit risk, and fees and expenses risk. See the prospectus for a full description of each risk.
Davis Financial Portfolio concentrates its investments in the financial sector, and it may be subject to greater risks than a fund that does not concentrate its investments in a particular sector. The Fund's investment performance, both good and bad, is expected to reflect the economic performance of the financial sector more than a fund that does not concentrate its portfolio.
1 A company's or sector's contribution to or detraction from the Fund's performance is a product both of its appreciation or depreciation and its weighting within the Fund. For example, a 5% holding that rises 20% has twice as much impact as a 1% holding that rises 50%.
2 This Management Discussion of Fund Performance discusses a number of individual companies. The information provided in this report does not provide information reasonably sufficient upon which to base an investment decision and should not be considered a recommendation to purchase, sell, or hold any particular security. The Schedule of Investments lists the Fund's holdings of each company discussed.
3 The companies included in the Standard & Poor's 500® Index are divided into ten sectors. One or more industry groups make up a sector.
| DAVIS FINANCIAL PORTFOLIO | Management's Discussion of Fund Performance – (Continued) |
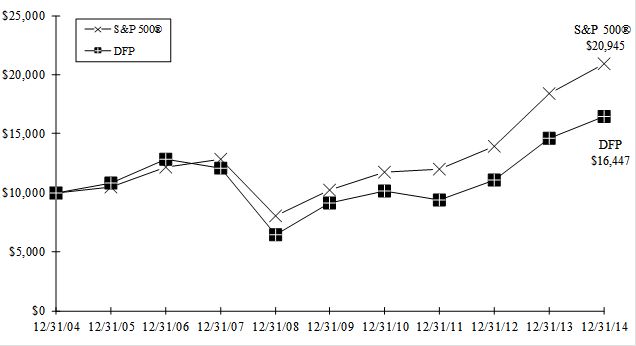
Comparison of a $10,000 investment in Davis Financial Portfolio versus the Standard & Poor's 500® Index
over 10 years for an investment made on December 31, 2004
Average Annual Total Return for periods ended December 31, 2014
| FUND & BENCHMARK INDEX | 1-YEAR | 5-YEAR | 10-YEAR | SINCE FUND'S INCEPTION (07/01/99) | GROSS EXPENSE RATIO | NET EXPENSE RATIO |
| Davis Financial Portfolio | 12.85% | 12.47% | 5.10% | 5.13% | 0.68% | 0.68% |
Standard & Poor's 500® Index | 13.69% | 15.45% | 7.67% | 4.56% | | |
The Standard & Poor's 500® Index is an unmanaged index of 500 selected common stocks, most of which are listed on the New York Stock Exchange. The Index is adjusted for dividends, weighted towards stocks with large market capitalizations, and represents approximately two-thirds of the total market value of all domestic common stocks. Investments cannot be made directly in the Index.
The performance data for Davis Financial Portfolio contained in this report represents past performance, assumes that all distributions were reinvested, and should not be considered as an indication of future performance from an investment in the Fund today. The investment return and principal value will fluctuate so that shares may be worth more or less than their original cost when redeemed. Fund performance changes over time and current performance may be higher or lower than stated. The operating expense ratio may vary in future years. For more current information please call Davis Funds Investor Services at 1-800-279-0279.
Fund performance numbers are net of all Fund operating expenses, but do not include any insurance charges imposed by your insurance company's separate account. If performance included the effect of these additional charges, the return would be lower.
| DAVIS FINANCIAL PORTFOLIO | |
| December 31, 2014 |
| Portfolio Composition | | Industry Weightings |
| (% of Fund's 12/31/14 Net Assets) | | (% of 12/31/14 Stock Holdings) |
| | | | | | |
| | | | Fund | | S&P 500® |
| Common Stock (U.S.) | 87.33% | | Diversified Financials | 46.94% | | 5.31% |
| Common Stock (Foreign) | 10.03% | | Insurance | 27.93% | | 2.79% |
| Short-Term Investments | 2.72% | | Banks | 22.52% | | 6.11% |
| Other Assets & Liabilities | (0.08)% | | Information Technology | 2.61% | | 19.66% |
| 100.00% | | Health Care | – | | 14.21% |
| | | Energy | – | | 8.44% |
| | | | Capital Goods | – | | 7.54% |
| | | Food, Beverage & Tobacco | – | | 5.20% |
| | | Retailing | – | | 4.42% |
| | | Media | – | | 3.56% |
| | | Other | – | | 22.76% |
| | | | 100.00% | | 100.00% |
| Top 10 Long-Term Holdings |
| (% of Fund's 12/31/14 Net Assets) |
| | |
| Wells Fargo & Co. | Banks | 9.77% |
| American Express Co. | Consumer Finance | 9.20% |
| Bank of New York Mellon Corp. | Capital Markets | 6.71% |
| Markel Corp. | Property & Casualty Insurance | 6.35% |
| Visa Inc., Class A | Diversified Financial Services | 5.57% |
| Everest Re Group, Ltd. | Reinsurance | 4.72% |
| ACE Ltd. | Property & Casualty Insurance | 4.72% |
| JPMorgan Chase & Co. | Banks | 4.59% |
| Julius Baer Group Ltd. | Capital Markets | 3.77% |
| Brookfield Asset Management Inc., Class A | Capital Markets | 3.74% |
| DAVIS FINANCIAL PORTFOLIO | Fund Overview – (Continued) |
| December 31, 2014 |
New Positions Added (01/01/14-12/31/14)
(Highlighted positions are those greater than 3.50% of the Fund's 12/31/14 net assets)
| Security | Industry | Date of 1st Purchase | % of Fund's 12/31/14 Net Assets |
| ACE Ltd. | Property & Casualty Insurance | 02/14/14 | 4.72% |
| Berkshire Hathaway Inc., Class A | Diversified Financial Services | 03/05/14 | 2.32% |
| Capital One Financial Corp. | Consumer Finance | 09/16/14 | 1.99% |
| Chubb Corp. | Property & Casualty Insurance | 10/17/14 | 2.05% |
| Citizens Financial Group Inc. | Banks | 09/23/14 | 3.56% |
| JPMorgan Chase & Co. | Banks | 03/04/14 | 4.59% |
| Marsh & McLennan Cos, Inc. | Insurance Brokers | 02/14/14 | 3.74% |
| McGraw Hill Financial Inc. | Diversified Financial Services | 10/20/14 | 2.03% |
| Moody's Corp. | Diversified Financial Services | 04/15/14 | 2.29% |
Positions Closed (01/01/14-12/31/14)
(Gains and losses greater than $1,000,000 are highlighted)
| Security | Industry | Date of Final Sale | | | Realized Gain (Loss) |
| Alleghany Corp. | Reinsurance | 10/03/14 | | $ | 764,565 |
| Ameriprise Financial, Inc. | Capital Markets | 01/30/14 | | | 1,264,142 |
| Bank of America Corp. | Banks | 01/09/14 | | | (137,833) |
| Bed Bath & Beyond Inc. | Retailing | 03/04/14 | | | 353,732 |
| Brookfield Property Partners L.P. | Real Estate | 02/14/14 | | | (11,403) |
| Canadian Natural Resources Ltd. | Energy | 10/28/14 | | | 507,072 |
| CVS Health Corp. | Food & Staples Retailing | 03/04/14 | | | 1,465,831 |
| First Marblehead Corp. | Consumer Finance | 02/06/14 | | | (2,539,847) |
| Oaktree Capital Group LLC, Class A | Capital Markets | 02/25/14 | | | 690,752 |
| Progressive Corp. | Property & Casualty Insurance | 09/08/14 | | | 1,364,763 |
| State Bank of India Ltd., GDR | Banks | 03/06/14 | | | (626,590) |
| DAVIS FINANCIAL PORTFOLIO | |
As a shareholder of the Fund, you incur ongoing costs only, including advisory and administrative fees and other Fund expenses. The Expense Example is intended to help you understand your ongoing costs (in dollars) of investing in the Fund and to compare these costs with the ongoing costs of investing in other mutual funds. The Expense Example is based on an investment of $1,000 invested at the beginning of the period and held for the entire period indicated, which for the Fund is for the six-month period ended December 31, 2014. Please note that the Expense Example is general and does not reflect charges imposed by your insurance company's separate account or account specific costs, which may increase your total costs of investing in the Fund. If these charges or account specific costs were included in the Expense Example, the expenses would have been higher.
Actual Expenses
The information represented in the row entitled "Actual" provides information about actual account values and actual expenses. You may use the information in this row, together with the amount you invested, to estimate the expenses that you paid over the period. Simply divide your account value by $1,000 (for example, an $8,600 account value divided by $1,000 = 8.6), then multiply the result by the number under the heading "Expenses Paid During Period" to estimate the expenses you paid on your account during this period.
Hypothetical Example for Comparison Purposes
The information represented in the row entitled "Hypothetical" provides information about hypothetical account values and hypothetical expenses based on the Fund's actual expense ratio and an assumed rate of return of 5% per year before expenses, which is not the Fund's actual return. The hypothetical account values and expenses may not be used to estimate the actual ending account balance or expenses you paid for the period. You may use this information to compare the ongoing costs of investing in the Fund and other funds. To do so, compare this 5% hypothetical example with the 5% hypothetical examples that appear in the shareholder reports of the other funds.
Please note that the expenses shown in the table are meant to highlight your ongoing costs only. Therefore, the information in the row entitled "Hypothetical" is useful in comparing ongoing costs only, and will not help you determine the relative total costs of owning different funds.
| Beginning Account Value (07/01/14) | | Ending Account Value (12/31/14) | | Expenses Paid During Period* (07/01/14-12/31/14) |
| | | | | |
| Actual | $1,000.00 | | $1,064.25 | | $3.49 |
| Hypothetical | $1,000.00 | | $1,021.83 | | $3.41 |
Hypothetical assumes 5% annual return before expenses.
* Expenses are equal to the Fund's annualized operating expense ratio (0.67%)**, multiplied by the average account value over the period, multiplied by 184/365 (to reflect the one-half year period).
** The expense ratio reflects the impact, if any, of certain reimbursements from the Adviser.
| DAVIS FINANCIAL PORTFOLIO | |
| December 31, 2014 |
| Shares | | Value
(Note 1) |
| COMMON STOCK – (97.36%) |
| FINANCIALS – (94.82%) |
| | Banks – (21.93%) |
| | Citizens Financial Group Inc. | | | 111,430 | | $ | 2,770,150 |
| ICICI Bank Ltd., ADR (India) | | | 70,300 | | | 811,965 |
| JPMorgan Chase & Co. | | | 57,120 | | | 3,574,570 |
| U.S. Bancorp | | | 51,430 | | | 2,311,778 |
| Wells Fargo & Co. | | | 138,780 | | | 7,607,919 |
| | | 17,076,382 |
| Diversified Financials – (45.70%) |
| | Capital Markets – (20.82%) |
| Bank of New York Mellon Corp. | | | 128,750 | | | 5,223,388 |
| Brookfield Asset Management Inc., Class A (Canada) | | | 58,090 | | | 2,912,052 |
| Charles Schwab Corp. | | | 81,470 | | | 2,459,579 |
| Goldman Sachs Group, Inc. | | | 13,840 | | | 2,682,607 |
| Julius Baer Group Ltd. (Switzerland) | | | 64,284 | | | 2,935,078 |
| | 16,212,704 |
| Consumer Finance – (11.19%) |
| American Express Co. | | | 77,010 | | | 7,165,010 |
| Capital One Financial Corp. | | | 18,750 | | | 1,547,813 |
| | 8,712,823 |
| Diversified Financial Services – (13.69%) |
| Berkshire Hathaway Inc., Class A * | | | 8 | | | 1,808,000 |
| Cielo S.A. (Brazil) | | | 73,440 | | | 1,149,157 |
| McGraw Hill Financial Inc. | | | 17,800 | | | 1,583,844 |
| Moody's Corp. | | | 18,570 | | | 1,779,192 |
| Visa Inc., Class A | | | 16,540 | | | 4,336,788 |
| | 10,656,981 |
| | | 35,582,508 |
| Insurance – (27.19%) |
| Insurance Brokers – (3.74%) |
| Marsh & McLennan Cos, Inc. | | | 50,850 | | | 2,910,654 |
| Multi-line Insurance – (5.61%) |
| American International Group, Inc. | | | 50,890 | | | 2,850,349 |
| Loews Corp. | | | 36,230 | | | 1,522,385 |
| | 4,372,734 |
| Property & Casualty Insurance – (13.12%) |
| ACE Ltd. | | | 31,980 | | | 3,673,862 |
| Chubb Corp. | | | 15,400 | | | 1,593,438 |
| Markel Corp. * | | | 7,245 | | | 4,947,176 |
| | 10,214,476 |
| Reinsurance – (4.72%) |
| Everest Re Group, Ltd. | | | 21,580 | | | 3,675,074 |
| | | 21,172,938 |
| | | TOTAL FINANCIALS | | | 73,831,828 |
| DAVIS FINANCIAL PORTFOLIO | Schedule of Investments – (Continued) |
| December 31, 2014 |
| Shares/Principal | | Value
(Note 1) |
| COMMON STOCK – (CONTINUED) |
| INFORMATION TECHNOLOGY – (2.54%) |
| | Software & Services – (2.54%) |
| | Google Inc., Class A * | | | 1,870 | | $ | 992,334 |
| Google Inc., Class C * | | | 1,870 | | | 984,368 |
| | | | | | | TOTAL INFORMATION TECHNOLOGY | | | 1,976,702 |
| TOTAL COMMON STOCK – (Identified cost $42,916,558) | | | 75,808,530 |
| SHORT-TERM INVESTMENTS – (2.72%) |
| Mizuho Securities USA Inc. Joint Repurchase Agreement, 0.08%, 01/02/15, dated 12/31/14, repurchase value of $593,003 (collateralized by: U.S. Government agency mortgages in a pooled cash account, 2.50%-3.50%, 12/01/27-10/01/28, total market value $604,860) | | $ | 593,000 | | | 593,000 |
| Nomura Securities International, Inc. Joint Repurchase Agreement, 0.08%, 01/02/15, dated 12/31/14, repurchase value of $1,087,005 (collateralized by: U.S. Government agency mortgages in a pooled cash account, 3.00%-6.50%, 12/20/29-12/20/44, total market value $1,108,740) | | | 1,087,000 | | | 1,087,000 |
| SunTrust Robinson Humphrey, Inc. Joint Repurchase Agreement, 0.18%, 01/02/15, dated 12/31/14, repurchase value of $435,004 (collateralized by: U.S. Government agency mortgages in a pooled cash account, 0.00%-7.00%, 03/01/21-11/01/44, total market value $443,700) | | | 435,000 | | | 435,000 |
| TOTAL SHORT-TERM INVESTMENTS – (Identified cost $2,115,000) | | | 2,115,000 |
| Total Investments – (100.08%) – (Identified cost $45,031,558) – (a) | | | 77,923,530 |
| Liabilities Less Other Assets – (0.08%) | | | (64,044) |
| Net Assets – (100.00%) | | $ | 77,859,486 |
|
| ADR: American Depositary Receipt |
|
| * | | Non-Income producing security. |
|
| (a) | | Aggregate cost for federal income tax purposes is $45,033,472. At December 31, 2014 unrealized appreciation (depreciation) of securities for federal income tax purposes is as follows: |
|
| Unrealized appreciation | | $ | 32,900,302 |
| Unrealized depreciation | | | (10,244) |
| Net unrealized appreciation | | $ | 32,890,058 |
|
| See Notes to Financial Statements |
| DAVIS FINANCIAL PORTFOLIO | Statement of Assets and Liabilities |
| At December 31, 2014 |
| ASSETS: | | | | | |
| Investments in securities at value* (see accompanying Schedule of Investments) | | $ | 77,923,530 |
| Cash | | | 1,628 |
| Receivables: | | | |
| Capital stock sold | | | 14,648 |
| Dividends and interest | | | 41,093 |
| Prepaid expenses | | | 1,727 |
| | Total assets | | | 77,982,626 |
LIABILITIES: | | | |
| Payables: | | | |
| Capital stock redeemed | | | 54,539 |
| Accrued audit fees | | | 13,090 |
| Accrued investment advisory fee | | | 39,967 |
| Other accrued expenses | | | 15,544 |
| Total liabilities | | | 123,140 |
NET ASSETS | | $ | 77,859,486 |
SHARES OUTSTANDING | | | 5,198,841 |
NET ASSET VALUE, offering, and redemption price per share (Net assets ÷ Shares outstanding) | | $ | 14.98 |
NET ASSETS CONSIST OF: | | | |
| Par value of shares of capital stock | | $ | 5,199 |
| Additional paid-in capital | | | 44,358,176 |
| Overdistributed net investment income | | | (11,934) |
| Accumulated net realized gains from investments | | | 616,073 |
| Net unrealized appreciation on investments and foreign currency transactions | | | 32,891,972 |
| Net Assets | | $ | 77,859,486 |
| | | | | |
| *Including: | | | |
| Cost of Investments | | $ | 45,031,558 |
| | | | |
| See Notes to Financial Statements |
| DAVIS FINANCIAL PORTFOLIO | |
| For the year ended December 31, 2014 |
| INVESTMENT INCOME: | | | | | | |
| Income: | | | |
| Dividends* | | $ | 1,256,161 |
| Interest | | | 1,284 |
| | Total income | | | | 1,257,445 |
| | | | | | | | | |
| Expenses: | | | |
| Investment advisory fees (Note 3) | | $ | 423,952 | | | |
| Custodian fees | | | 28,181 | | | |
| Transfer agent fees | | | 11,165 | | | |
| Audit fees | | | 19,320 | | | |
| Legal fees | | | 1,769 | | | |
| Accounting fees (Note 3) | | | 2,004 | | | |
| Reports to shareholders | | | 7,187 | | | |
| Directors' fees and expenses | | | 17,805 | | | |
| Registration and filing fees | | | 43 | | | |
| Miscellaneous | | | 9,641 | | | |
| Total expenses | | | | 521,067 |
| Net investment income | | | 736,378 |
| | | | | | | | | |
REALIZED & UNREALIZED GAIN (LOSS) ON INVESTMENTS AND FOREIGN CURRENCY TRANSACTIONS: | | | | | | |
| Net realized gain (loss) from: | | | |
| Investment transactions | | | 8,866,409 |
| Foreign currency transactions | | | (996) |
| Net realized gain | | | 8,865,413 |
| Net decrease in unrealized appreciation | | | (436,144) |
| Net realized and unrealized gain on investments and foreign currency transactions | | | | 8,429,269 |
| Net increase in net assets resulting from operations | | $ | 9,165,647 |
| | | | | | | | | |
| *Net of foreign taxes withheld as follows | | $ | 15,383 |
| | | | |
| See Notes to Financial Statements | | | |
| DAVIS FINANCIAL PORTFOLIO | Statements of Changes in Net Assets |
| | Year ended December 31, |
| | 2014 | | 2013 |
| | | | | | | |
| OPERATIONS: | | | | | | |
| Net investment income | | $ | 736,378 | | $ | 674,500 |
| Net realized gain from investments and foreign currency transactions | | | 8,865,413 | | | 2,727,465 |
Net increase (decrease) in unrealized appreciation on investments and foreign currency transactions | | | (436,144) | | | 16,821,040 |
| Net increase in net assets resulting from operations | | | 9,165,647 | | | 20,223,005 |
| | | | | | | | |
| DIVIDENDS AND DISTRIBUTIONS TO SHAREHOLDERS FROM: | | | | | | |
| Net investment income | | | (909,661) | | | (428,791) |
| | | | | | |
| Realized gains from investment transactions | | | (8,532,944) | | | – |
| | | | | | | | |
| CAPITAL SHARE TRANSACTIONS: | | | | | | |
| Net decrease in net assets resulting from capital share transactions (Note 4) | | | (2,744,465) | | | (6,167,879) |
| Total increase (decrease) in net assets | | | (3,021,423) | | | 13,626,335 |
| | | | | | | | |
| NET ASSETS: | | | | | | |
| Beginning of year | | | 80,880,909 | | | 67,254,574 |
End of year* | | $ | 77,859,486 | | $ | 80,880,909 |
| | | | | | | | |
| *Including undistributed (overdistributed) net investment income of | | $ | (11,934) | | $ | 157,259 |
| | | | | | | |
| See Notes to Financial Statements |
| DAVIS FINANCIAL PORTFOLIO | Notes to Financial Statements |
| December 31, 2014 |
NOTE 1 - SUMMARY OF SIGNIFICANT ACCOUNTING POLICIES
The Fund is a separate series of Davis Variable Account Fund, Inc. (a Maryland corporation), which is registered under the Investment Company Act of 1940, as amended, as a diversified, open-end management investment company. Only insurance companies, for the purpose of funding variable annuity or variable life insurance contracts, may purchase shares of the Fund. The following is a summary of significant accounting policies followed by the Fund in the preparation of its financial statements.
Security Valuation - The Fund calculates the net asset value of its shares as of the close of the New York Stock Exchange ("Exchange"), normally 4:00 P.M. Eastern time, on each day the Exchange is open for business. Securities listed on the Exchange (and other national exchanges including NASDAQ) are valued at the last reported sales price on the day of valuation. Listed securities for which no sale was reported on that date are valued at the average of closing bid and asked prices. Securities traded on foreign exchanges are valued based upon the last sales price on the principal exchange on which the security is traded prior to the time when the Fund's assets are valued. Securities (including restricted securities) for which market quotations are not readily available or securities whose values have been materially affected by what Davis Selected Advisers, L.P. ("Davis Advisors" or "Adviser"), the Fund's investment adviser, identifies as a significant event occurring before the Fund's assets are valued, but after the close of their respective exchanges will be fair valued using a standardized fair valuation methodology applicable to the security type or the significant event as previously approved by the Fund's Pricing Committee and Board of Directors. The Pricing Committee considers all facts it deems relevant that are reasonably available, through either public information or information available to the Adviser's portfolio management team, when determining the fair value of a security. To assess the continuing appropriateness of security valuations, the Adviser may compare prior day prices, prices of comparable securities, and sale prices to the prior or current day prices and challenge those prices exceeding certain tolerance levels with the third-party pricing service or broker source. Fair value determinations are subject to review, approval, and ratification by the Fund's Board of Directors at its next regularly scheduled meeting covering the period in which the fair valuation was determined.
Short-term securities purchased within 60 days to maturity are valued at amortized cost, which approximates market value.
The Fund's valuation procedures are reviewed and subject to approval by the Board of Directors. There have been no significant changes to the fair valuation procedures during the period.
Value Measurements - Fair value is defined as the price that the Fund would receive upon selling an investment in an orderly transaction to an independent buyer in the principal market for the investment. Various inputs are used to determine the fair value of the Fund's investments. These inputs are summarized in the three broad levels listed below.
| Level 1 – | quoted prices in active markets for identical securities |
| Level 2 – | other significant observable inputs (including quoted prices for similar investments, interest rates, prepayment speeds, credit risk, etc.) |
| Level 3 – | significant unobservable inputs (including the Fund's own assumptions in determining the fair value of investments) |
The inputs or methodologies used for valuing securities are not necessarily an indication of the risks associated with investing in those securities nor can it be assured that the Fund can obtain the fair value assigned to a security if it were to sell the security.
| DAVIS FINANCIAL PORTFOLIO | Notes to Financial Statements – (Continued) |
| December 31, 2014 |
NOTE 1 - SUMMARY OF SIGNIFICANT ACCOUNTING POLICIES – (CONTINUED)
Value Measurements - (Continued)
The following is a summary of the inputs used as of December 31, 2014 in valuing the Fund's investments carried at value:
| Investments in Securities at Value |
| Valuation Inputs |
| | | Level 2: | | Level 3: | | |
| | | Other Significant | | Significant | | |
| Level 1: | | Observable | | Unobservable | | |
| Quoted Prices | | Inputs* | | Inputs | | Total |
Equity securities: | | | | | | | | | | | |
| Financials | $ | 69,747,593 | | $ | 4,084,235 | | $ | – | | $ | 73,831,828 |
| Information Technology | | 1,976,702 | | | – | | | – | | | 1,976,702 |
| Short-term securities | | – | | | 2,115,000 | | | – | | | 2,115,000 |
| Total Investments | $ | 71,724,295 | | $ | 6,199,235 | | $ | – | | $ | 77,923,530 |
| | | | | | | | | | | |
Level 1 to Level 2 Transfers**: | | | | | | | | | | | |
| Financials | | | | $ | 4,084,235 | | | | | | |
*Includes certain securities trading primarily outside the U.S. whose value the Fund adjusted as a result of significant market movements following the close of local trading.
**Application of fair value procedures for securities traded on foreign exchanges triggered the transfers of investments between Level 1 and Level 2 of the fair value hierarchy during the year ended December 31, 2014.
Master Repurchase Agreements - The Fund, along with other affiliated funds, may transfer uninvested cash balances into one or more master repurchase agreement accounts. These balances are invested in one or more repurchase agreements, secured by U.S. Government securities. A custodian bank holds securities pledged as collateral for repurchase agreements until the agreements mature. Each agreement requires that the market value of the collateral be sufficient to cover payments of interest and principal; however, in the event of default by the other party to the agreement, retention of the collateral may be subject to legal proceedings.
Currency Translation - The market values of all assets and liabilities denominated in foreign currencies are recorded in the financial statements after translation to the U.S. Dollar based upon the mean between the bid and offered quotations of the currencies against U.S. Dollars on the date of valuation. The cost basis of such assets and liabilities is determined based upon historical exchange rates. Income and expenses are translated at average exchange rates in effect as accrued or incurred.
Foreign Currency - The Fund may enter into forward purchases or sales of foreign currencies to hedge certain foreign currency denominated assets and liabilities against declines in market value relative to the U.S. Dollar. Forward currency contracts are marked-to-market daily and the change in market value is recorded by the Fund as an unrealized gain or loss. When the forward currency contract is closed, the Fund records a realized gain or loss equal to the difference between the value of the forward currency contract at the time it was opened and value at the time it was closed. Investments in forward currency contracts may expose the Fund to risks resulting from unanticipated movements in foreign currency exchange rates or failure of the counter-party to the agreement to perform in accordance with the terms of the contract.
Reported net realized foreign exchange gains or losses arise from the sales of foreign currencies, currency gains or losses realized between the trade and settlement dates on security transactions, the difference between the amounts of dividends, interest, and foreign withholding taxes recorded on the Fund's books, and the U.S. Dollar equivalent of the amounts actually received or paid. Net unrealized foreign exchange gains or losses arise from changes in the value of assets and liabilities other than investments in securities at fiscal year end, resulting from changes in the exchange rate. The Fund includes foreign currency gains and losses realized on the sales of investments together with market gains and losses on such investments in the Statement of Operations.
| DAVIS FINANCIAL PORTFOLIO | Notes to Financial Statements – (Continued) |
| December 31, 2014 |
NOTE 1 - SUMMARY OF SIGNIFICANT ACCOUNTING POLICIES – (CONTINUED)
Federal Income Taxes - It is the Fund's policy to comply with the requirements of the Internal Revenue Code applicable to regulated investment companies, and to distribute substantially all of its taxable income, including any net realized gains on investments not offset by loss carryovers, to shareholders. Therefore, no provision for federal income or excise tax is required. The Adviser has analyzed the Fund's tax positions taken on federal and state income tax returns for all open tax years and has concluded that as of December 31, 2014, no provision for income tax is required in the Fund's financial statements related to these tax positions. The Fund's federal and state (Arizona) income and federal excise tax returns for tax years for which the applicable statutes of limitations have not expired are subject to examination by the Internal Revenue Service and state department of revenue. The earliest tax year that remains subject to examination by these jurisdictions is 2011.
Securities Transactions and Related Investment Income - Securities transactions are accounted for on the trade date (date the order to buy or sell is executed) with realized gain or loss on the sale of securities being determined based upon identified cost. Dividend income is recorded on the ex-dividend date. Interest income, which includes accretion of discount and amortization of premium, is accrued as earned.
Dividends and Distributions to Shareholders - Dividends and distributions to shareholders are recorded on the ex-dividend date. Net investment income (loss), net realized gains (losses), and net unrealized appreciation (depreciation) on investments may differ for financial statement and tax purposes primarily due to differing treatments of wash sales, foreign currency transactions, and partnership income. The character of dividends and distributions made during the fiscal year from net investment income and net realized securities gains may differ from their ultimate characterization for federal income tax purposes. Also, due to the timing of dividends and distributions, the fiscal year in which amounts are distributed may differ from the fiscal year in which income or realized gain was recorded by the Fund. The Fund adjusts certain components of capital to reflect permanent differences between financial statement amounts and net income and realized gains/losses determined in accordance with income tax rules. Accordingly, during the year ended December 31, 2014, amounts have been reclassified to reflect a decrease in overdistributed net investment income of $4,090 and a corresponding decrease in accumulated net realized gains from investments and foreign currency transactions. The Fund's net assets have not been affected by this reclassification.
The tax character of distributions paid during the years ended December 31, 2014 and 2013 was as follows:
| 2014 | | 2013 |
| Ordinary income | $ | 1,115,882 | | $ | 428,791 |
| Long-term capital gain | | 8,326,723 | | | – |
| Total | $ | 9,442,605 | | $ | 428,791 |
As of December 31, 2014, the components of distributable earnings on a tax basis were as follows:
| Undistributed net investment income | $ | 1,663 |
| Undistributed long-term capital gains | | 617,987 |
| Net unrealized appreciation on investments | | 32,890,058 |
| Total | $ | 33,509,708 |
| DAVIS FINANCIAL PORTFOLIO | Notes to Financial Statements – (Continued) |
| December 31, 2014 |
NOTE 1 - SUMMARY OF SIGNIFICANT ACCOUNTING POLICIES – (CONTINUED)
Indemnification - Under the Fund's organizational documents, its officers and directors are indemnified against certain liabilities arising out of the performance of their duties to the Fund. In addition, some of the Fund's contracts with its service providers contain general indemnification clauses. The Fund's maximum exposure under these arrangements is unknown since the amount of any future claims that may be made against the Fund cannot be determined and the Fund has no historical basis for predicting the likelihood of any such claims.
Use of Estimates in Financial Statements - In preparing financial statements in conformity with accounting principles generally accepted in the United States of America, management makes estimates and assumptions that affect the reported amounts of assets and liabilities and disclosure of contingent assets and liabilities at the date of the financial statements, as well as the reported amounts of income and expenses during the reporting period. Actual results may differ from these estimates.
Directors Fees and Expenses - The Fund set up a Rabbi Trust to provide for the deferred compensation plan for Independent Directors that enables them to elect to defer receipt of all or a portion of annual fees they are entitled to receive. The value of an eligible Director's account is based upon years of service and fees paid to each Director during the years of service. The amount paid to the Director by the Trust under the plan will be determined based upon the performance of the Davis Funds in which the amounts are invested.
NOTE 2 - PURCHASES AND SALES OF SECURITIES
The cost of purchases and proceeds from sales of investment securities (excluding short-term securities) during the year ended December 31, 2014 were $24,217,492 and $36,534,275, respectively.
NOTE 3 - FEES AND OTHER TRANSACTIONS WITH AFFILIATES
Davis Selected Advisers-NY, Inc. ("DSA-NY"), a wholly-owned subsidiary of the Adviser, acts as sub-adviser to the Fund. DSA-NY performs research and portfolio management services for the Fund under a Sub-Advisory Agreement with the Adviser. The Fund pays no fees directly to DSA-NY.
Certain directors and officers of the Fund are also directors and officers of the general partner of the Adviser.
Investment Advisory Fees - Advisory fees are paid monthly to the Adviser at an annual rate of 0.55% of the Fund's average net assets.
Accounting Fees - State Street Bank and Trust Company ("State Street Bank") is the Fund's primary accounting provider. Fees for accounting services are included in the custodian fees as State Street Bank also serves as the Fund's custodian. The Adviser is also paid for certain accounting services. The fee paid to the Adviser for these services during the year ended December 31, 2014 amounted to $2,004.
| DAVIS FINANCIAL PORTFOLIO | Notes to Financial Statements – (Continued) |
| December 31, 2014 |
NOTE 4 - CAPITAL STOCK
At December 31, 2014, there were 500 million shares of capital stock ($0.001 par value per share) authorized. Transactions in capital stock were as follows:
|
| Year ended December 31, 2014 |
| | Sold | | | Reinvestment of Distributions | | | Redeemed | | | Net Decrease |
| | | | | | | | | | | |
Shares: | | 157,075 | | | 623,274 | | | (944,834) | | | (164,485) |
Value: | $ | 2,531,609 | | $ | 9,442,605 | | $ | (14,718,679) | | $ | (2,744,465) |
| | | | | | | | | | | |
|
|
| Year ended December 31, 2013 |
| | Sold | | | Reinvestment of Distributions | | | Redeemed | | | Net Decrease |
| | | | | | | | | | | |
Shares: | | 459,945 | | | 28,682 | | | (948,654) | | | (460,027) |
Value: | $ | 6,097,514 | | $ | 428,791 | | $ | (12,694,184) | | $ | (6,167,879) |
| | | | | | | | | | | |
NOTE 5 - BANK BORROWINGS
The Fund may borrow up to 5% of its assets from a bank to purchase portfolio securities, or for temporary and emergency purposes. The purchase of securities with borrowed funds creates leverage in the Fund. The Fund has entered into an agreement, which enables it to participate with certain other funds managed by the Adviser in an unsecured line of credit with a bank, which permits borrowings up to $50 million, collectively. Interest is charged based on its borrowings, at a rate equal to the higher of the Federal Funds Rate or the Overnight Libor Rate, plus 1.25%. The Fund had no borrowings during the year ended December 31, 2014.
FEDERAL INCOME TAX INFORMATION
(UNAUDITED)
During the calendar year ended December 31, 2014, the Fund declared and paid long-term capital gain distributions in the amount of $8,326,723.
During the calendar year ended December 31, 2014, $1,115,882 of dividends paid by the Fund constituted income dividends for federal income tax purposes. The Fund designates $1,079,144 or 97% as income qualifying for the corporate dividends-received deduction.
| DAVIS FINANCIAL PORTFOLIO | |
| The following financial information represents selected data for each share of capital stock outstanding throughout each period: |
| Year ended December 31, |
| | | 2014 | | 2013 | | 2012 | | 2011 | | 2010 |
| Net Asset Value, Beginning of Period | | $ | 15.08 | | $ | 11.55 | | $ | 9.98 | | $ | 11.00 | | $ | 9.98 |
|
| Income (Loss) from Investment Operations: | | | | | | | | | | |
| Net Investment Income | | 0.17 | | 0.13 | | 0.12 | | 0.14 | | 0.12 |
| Net Realized and Unrealized Gains (Losses) | | 1.79 | | 3.48 | | 1.75 | | (1.01) | | 0.99 |
| Total from Investment Operations | | 1.96 | | 3.61 | | 1.87 | | (0.87) | | 1.11 |
|
| Dividends and Distributions: | | | | | | | | | | |
| Dividends from Net Investment Income | | (0.20) | | (0.08) | | (0.23) | | (0.15) | | (0.09) |
| Distributions from Realized Gains | | (1.86) | | – | | –a | | – | | – |
| Return of Capital | | – | | – | | (0.07) | | – | | – |
| Total Dividends and Distributions | | (2.06) | | (0.08) | | (0.30) | | (0.15) | | (0.09) |
| Net Asset Value, End of Period | | $ | 14.98 | | $ | 15.08 | | $ | 11.55 | | $ | 9.98 | | $ | 11.00 |
|
Total Returnb | | 12.85% | | 31.26% | | 18.83% | | (7.96)% | | 11.10% |
|
| Ratios/Supplemental Data: | | | | | | | | | | | | | | | | | | | | |
| Net Assets, End of Period (in thousands) | | $ | 77,859 | | $ | 80,881 | | $ | 67,255 | | $ | 60,834 | | $ | 82,403 |
| Ratio of Expenses to Average Net Assets: | | | | | | | | | | | | | | | | | | | | |
| Gross | | 0.68% | | 0.68% | | 0.69% | | 0.69% | | 0.69% |
| Netc | | 0.68% | | 0.68% | | 0.69% | | 0.69% | | 0.69% |
Ratio of Net Investment Income to Average Net Assets | | 0.96% | | 0.90% | | 0.98% | | 0.99% | | 0.99% |
Portfolio Turnover Rated | | 32% | | 2% | | 16% | | 11% | | 2% |
| a | Less than $0.005 per share. |
| |
| b | Assumes hypothetical initial investment on the business day before the first day of the fiscal period, with all dividends and distributions reinvested in additional shares on the reinvestment date, and redemption at the net asset value calculated on the last business day of the fiscal period. Total returns do not reflect charges attributable to your insurance company's separate account. Inclusion of these charges would reduce the total returns shown. |
| |
| c | The Net Ratio of Expenses to Average Net Assets reflects the impact, if any, of the reduction of expenses paid indirectly and of certain reimbursements from the Adviser. |
| |
| d | The lesser of purchases or sales of portfolio securities for a period, divided by the monthly average of the market value of portfolio securities owned during the period. Securities with a maturity or expiration date at the time of acquisition of one year or less are excluded from the calculation. |
|
| See Notes to Financial Statements |
DAVIS FINANCIAL PORTFOLIO | Report of Independent Registered Public Accounting Firm |
The Shareholders and Board of Directors
Davis Variable Account Fund, Inc.:
We have audited the accompanying statement of assets and liabilities of Davis Financial Portfolio (a separate series of Davis Variable Account Fund, Inc.) including the schedule of investments, as of December 31, 2014, and the related statement of operations for the year then ended, the statement of changes in net assets for each of the years in the two-year period then ended, and the financial highlights for each of the years in the five-year period then ended. These financial statements and financial highlights are the responsibility of the Funds' management. Our responsibility is to express an opinion on these financial statements and financial highlights based on our audits.
We conducted our audits in accordance with the standards of the Public Company Accounting Oversight Board (United States). Those standards require that we plan and perform the audit to obtain reasonable assurance about whether the financial statements and financial highlights are free of material misstatement. An audit includes examining, on a test basis, evidence supporting the amounts and disclosures in the financial statements. Our procedures included confirmation of securities owned as of December 31, 2014, by correspondence with the custodian and brokers or by other appropriate auditing procedures. An audit also includes assessing the accounting principles used and significant estimates made by management, as well as evaluating the overall financial statement presentation. We believe that our audits provide a reasonable basis for our opinion.
In our opinion, the financial statements and financial highlights referred to above present fairly, in all material respects, the financial position of Davis Financial Portfolio as of December 31, 2014, the results of its operations for the year then ended, the changes in its net assets for each of the years in the two-year period then ended, and the financial highlights for each of the years in the five-year period then ended, in conformity with U.S. generally accepted accounting principles.
KPMG LLP
Denver, Colorado
February 10, 2015
| DAVIS FINANCIAL PORTFOLIO | |
For the purposes of their service as directors to the Davis Funds, the business address for each of the directors is 2949 E. Elvira Road, Suite 101, Tucson, AZ 85756. Each Director serves until their retirement, resignation, death, or removal. Subject to exceptions and exemptions, which may be granted by the Independent Directors, Directors must retire at the close of business on the last day of the calendar year in which the Director attains age seventy-four (74).
Name (birthdate) | Position(s) Held With Fund | Term of Office and Length of Time Served | Principal Occupation(s) During Past Five Years | Number of Portfolios in Fund Complex Overseen by Director | Other Directorships Held by Director |
| | | | | |
Independent Directors
| | | | | |
Marc P. Blum (09/09/42) | Director | Director since 1986 | Chief Executive Officer, World Total Return Fund, LLLP; of Counsel to Gordon Feinblatt LLC (law firm). | 13 | Director, Rodney Trust Company (trust and asset management company). |
| | | | | |
John S. Gates, Jr. (08/02/53) | Director | Director since 2007 | Chairman and Chief Executive Officer of PortaeCo LLC (private investment company). | 13 | Director, DCT Industrial Trust (REIT); Chairman, Regional Transportation Authority of Chicago (public transportation system). |
| | | | | |
Thomas S. Gayner (12/16/61) | Director/ Chairman | Director since 2004 | President and Chief Investment Officer, Markel Corp. (diversified financial holding company). | 13 | Director, Graham Holdings Company (publishing company); Director, Colfax Corp. (engineering and manufacturer of pumps and fluid handling equipment). |
| | | | | |
Samuel H. Iapalucci (07/19/52) | Director | Director since 2006 | Retired; Executive Vice President and Chief Financial Officer, CH2M- HILL Companies, Ltd. (engineering) until 2008. | 13 | Director, exp Global Inc. (engineering). |
| | | | | |
Robert P. Morgenthau (03/22/57) | Director | Director since 2002 | Principal, Spears Abacus Advisors, LLC (investment management firm) since 2011; Chairman, NorthRoad Capital Management, LLC (investment management firm) 2002-2011. | 13 | none |
| | | | | |
Marsha Williams (03/28/51) | Director | Director since 1999 | Retired; Senior Vice President and Chief Financial Officer, Orbitz Worldwide, Inc. (travel-services provider) 2007-2010. | 13 | Director, Modine Manufacturing Company (heat transfer technology); Director, Chicago Bridge & Iron Company, N.V. (industrial construction and engineering); Director, Fifth Third Bancorp (diversified financial services). |
| DAVIS FINANCIAL PORTFOLIO | Directors and Officers – (Continued) |
Name (birthdate) | Position(s) Held With Fund | Term of Office and Length of Time Served | Principal Occupation(s) During Past Five Years | Number of Portfolios in Fund Complex Overseen by Director | Other Directorships Held by Director |
| | | | | |
Inside Directors*
| | | | | |
Andrew A. Davis (06/25/63) | Director | Director since 1997 | President or Vice President of each Davis Fund and Selected Fund; President, Davis Selected Advisers, L.P., and also serves as an executive officer of certain companies affiliated with the Adviser. | 16 | Director, Selected Funds (consisting of two portfolios) since 1998; Trustee of Clipper Funds Trust (consisting of one portfolio) since 2014. |
| | | | | |
Christopher C. Davis (07/13/65) | Director | Director since 1997 | President or Vice President of each Davis Fund, Selected Fund, and Clipper Fund; Chairman, Davis Selected Advisers, L.P., and also serves as an executive officer of certain companies affiliated with the Adviser, including sole member of the Adviser's general partner, Davis Investments, LLC; Employee of Shelby Cullom Davis & Co. (registered broker/dealer). | 16 | Director, Selected Funds (consisting of two portfolios) since 1998; Trustee of Clipper Funds Trust (consisting of one portfolio) since 2014; Director, Graham Holdings Company (publishing company). |
*Andrew A. Davis and Christopher C. Davis own partnership units (directly, indirectly, or both) of the Adviser and are considered to be "interested persons" of the Funds as defined in the Investment Company Act of 1940. Andrew A. Davis and Christopher C. Davis are brothers.
Officers
Andrew A. Davis (born 06/25/63, Davis Funds officer since 1997). See description in the section on Inside Directors.
Christopher C. Davis (born 07/13/65, Davis Funds officer since 1997). See description in the section on Inside Directors.
Kenneth C. Eich (born 08/14/53, Davis Funds officer since 1997). Executive Vice President and Principal Executive Officer of each of the Davis Funds (consisting of 13 portfolios), Selected Funds (consisting of two portfolios), and Clipper Funds Trust (consisting of one portfolio); Chief Operating Officer, Davis Selected Advisers, L.P., and also serves as an executive officer of certain companies affiliated with the Adviser.
Douglas A. Haines (born 03/04/71, Davis Funds officer since 2004). Vice President, Treasurer, Chief Financial Officer, Principal Financial Officer, and Principal Accounting Officer of each of the Davis Funds (consisting of 13 portfolios), Selected Funds (consisting of two portfolios), and Clipper Funds Trust (consisting of one portfolio); Vice President and Director of Fund Accounting, Davis Selected Advisers, L.P.
Sharra L. Haynes (born 09/25/66, Davis Funds officer since 1997). Vice President and Chief Compliance Officer of each of the Davis Funds (consisting of 13 portfolios), Selected Funds (consisting of two portfolios), and Clipper Funds Trust (consisting of one portfolio); Vice President and Chief Compliance Officer, Davis Selected Advisers, L.P., and also serves as an executive officer of certain companies affiliated with the Adviser.
Ryan M. Charles (born 07/25/78, Davis Funds officer since 2014). Vice President and Secretary of each of the Davis Funds (consisting of 13 portfolios), Selected Funds (consisting of two portfolios), and Clipper Funds Trust (consisting of one portfolio); Vice President, Chief Legal Officer, and Secretary, Davis Selected Advisers, L.P., and also serves as an executive officer of certain companies affiliated with the Adviser.
Arthur Don (born 09/24/53, Davis Funds officer since 1991). Assistant Secretary (for clerical purposes only) of each of the Davis Funds and Selected Funds; Shareholder, Greenberg Traurig, LLP (law firm); counsel to the Independent Directors and the Davis Funds.
| DAVIS FINANCIAL PORTFOLIO |
| Investment Adviser |
| Davis Selected Advisers, L.P. (Doing business as "Davis Advisors") |
| 2949 East Elvira Road, Suite 101 |
| Tucson, Arizona 85756 |
| (800) 279-0279 |
|
| Distributor |
| Davis Distributors, LLC |
| 2949 East Elvira Road, Suite 101 |
| Tucson, Arizona 85756 |
|
| Transfer Agent |
| Boston Financial Data Services, Inc. |
| c/o The Davis Funds |
| P.O. Box 8406 |
| Boston, Massachusetts 02266-8406 |
|
| Custodian |
| State Street Bank and Trust Co. |
| One Lincoln Street |
| Boston, Massachusetts 02111 |
|
| Counsel |
| Greenberg Traurig, LLP |
| 77 West Wacker Drive, Suite 3100 |
| Chicago, Illinois 60601 |
|
| Independent Registered Public Accounting Firm |
| KPMG LLP |
| 1225 Seventeenth Street, Suite 800 |
| Denver, Colorado 80202 |
For more information about Davis Financial Portfolio, including management fee, charges, and expenses, see the current prospectus, which must precede or accompany this report. The Fund's Statement of Additional Information contains additional information about the Fund's Directors and is available without charge, upon request, by calling 1-800-279-0279 and on the Fund's website at www.davisfunds.com. Quarterly Fact Sheets are available on the Fund's website at www.davisfunds.com.
| DAVIS REAL ESTATE PORTFOLIO | Table of Contents |
| 2 |
| | |
| 4 |
| | |
| 6 |
| | |
| 7 |
| | |
| 10 |
| | |
| 11 |
| | |
| 12 |
| | |
| 13 |
| | |
| 17 |
| | |
| 18 |
| | |
| 19 |
| | |
| 20 |
This Annual Report is authorized for use by existing shareholders. Prospective shareholders must receive a current Davis Real Estate Portfolio prospectus, which contains more information about investment strategies, risks, charges, and expenses. Please read the prospectus carefully before investing or sending money.
Shares of the Davis Real Estate Portfolio are not deposits or obligations of any bank, are not guaranteed by any bank, are not insured by the FDIC or any other agency, and involve investment risks, including possible loss of the principal amount invested.
Portfolio Proxy Voting Policies and Procedures
The Fund has adopted Portfolio Proxy Voting Policies and Procedures under which the Fund votes proxies relating to securities held by the Fund. A description of the Fund's Portfolio Proxy Voting Policies and Procedures is available (i) without charge, upon request, by calling the Fund toll-free at 1-800-279-0279, (ii) on the Fund's website at www.davisfunds.com, and (iii) on the SEC's website at www.sec.gov.
In addition, the Fund is required to file Form N-PX, with its complete proxy voting record for the 12 months ended June 30th, no later than August 31st of each year. The Fund's Form N-PX filing is available (i) without charge, upon request, by calling the Fund toll-free at 1-800-279-0279, (ii) on the Fund's website at www.davisfunds.com, and (iii) on the SEC's website at www.sec.gov.
Form N-Q
The Fund files its complete schedule of portfolio holdings with the SEC for the first and third quarters of each fiscal year on Form N-Q. The Fund's Form N-Q is available without charge, upon request, by calling 1-800-279-0279, on the Fund's website at www.davisfunds.com, and on the SEC's website at www.sec.gov. The Fund's Form N-Q may be reviewed and copied at the SEC's Public Reference Room in Washington, DC, and information on the operation of the Public Reference Room may be obtained by calling 1-800-SEC-0330.
| DAVIS REAL ESTATE PORTFOLIO | Management's Discussion of Fund Performance |
Performance Overview
Davis Real Estate Portfolio ("Fund") delivered a total return on net asset value of 27.54% for the year ended December 31, 2014 ("Period"). Over the same Period, the Wilshire U.S. Real Estate Securities Index ("Index") returned 31.53%. Every sub-industry1 within the Index delivered positive returns. Residential REITs, Retail REITs, Diversified REITs, Office REITs, and Hotel & Resort REITs turned in the strongest performance while Real Estate Operating Companies and Industrial REITs turned in the weakest (yet still positive) performance over the Period. Every sub-industry within the Index experienced positive double digit returns over the Period.
The Fund's Absolute Performance
Retail REITs were the most important contributor2 to the Fund's absolute performance over the Period. Simon Property Group3, General Growth Properties, and Acadia Realty Trust were among the most important contributors to performance. Washington Prime Group was among the most important detractors from performance.
Residential REITs were the second most important contributor to the Fund's absolute performance. AvalonBay Communities, Essex Property Trust, and American Campus Communities were among the most important contributors to performance. American Residential Properties, American Homes 4 Rent, and Campus Crest Communities were among the most important detractors from performance.
Office REITs were another important contributor to the Fund's absolute performance. Alexandria Real Estate Equities and Boston Properties were among the most important contributors to performance.
Consumer Discretionary companies were the most important detractor from the Fund's absolute performance. Wynn Resorts was the most important detractor from performance while Las Vegas Sands was also among the most important detractors from performance.
The Fund's Relative Performance
The Fund's high cash position in a rising market led to it being the biggest detractor from the relative performance compared to the Index over the Period. At the end of the Period the Fund held roughly 8% of assets in cash and cash equivalents.
Diversified Real Estate Activities companies were the second most important detractor from the Fund's relative performance. The Fund's holding in this sub-industry produced a negative return and also had a higher average weighting then the Index.
Real Estate Operating Companies were also an important detractor from the Fund's relative performance. The Fund's Real Estate Operating Companies underperformed the corresponding sub-industry within the Index and suffered from a higher average weighting.
Office REITs were a strong contributor to the Fund's relative performance. The Fund's Office REITs out-performed the corresponding sub-industry of the Index.
Davis Real Estate Portfolio's investment objective is total return through a combination of growth and income. There can be no assurance that the Fund will achieve its objective. Davis Real Estate Portfolio's principal risks are: stock market risk, manager risk, common stock risk, large-capitalization companies risk, mid- and small-capitalization companies risk, headline risk, real estate risk, focused portfolio risk, variable current income risk, and fees and expenses risk. See the prospectus for a full description of each risk.
Davis Real Estate Portfolio concentrates its investments in the real estate sector, and it may be subject to greater risks than a fund that does not concentrate its investments in a particular sector. The Fund's investment performance, both good and bad, is expected to reflect the economic performance of the real estate sector much more than a fund that does not concentrate its portfolio.
Davis Real Estate Portfolio is allowed to focus its investments in fewer companies, and it may be subject to greater risks than a more diversified portfolio that is not allowed to focus its investments in a few companies. Should the portfolio manager determine that it is prudent to focus the Fund's portfolio in a few companies, the Fund's investment performance, both good and bad, is expected to reflect the economic performance of its more focused portfolio.
1 The companies included in the Wilshire U.S. Real Estate Securities Index are divided into ten sub-industries.
2 A company's or sector's contribution to or detraction from the Fund's performance is a product both of its appreciation or depreciation and its weighting within the Fund. For example, a 5% holding that rises 20% has twice as much impact as a 1% holding that rises 50%.
3 This Management Discussion of Fund Performance discusses a number of individual companies. The information provided in this report does not provide information reasonably sufficient upon which to base an investment decision and should not be considered a recommendation to purchase, sell, or hold any particular security. The Schedule of Investments lists the Fund's holdings of each company discussed.
| DAVIS REAL ESTATE PORTFOLIO | Management's Discussion of Fund Performance – (Continued) |
Comparison of a $10,000 investment in Davis Real Estate Portfolio versus the
Standard & Poor's 500® Index and the Wilshire U.S. Real Estate Securities Index
over 10 years for an investment made on December 31, 2004
Average Annual Total Return for periods ended December 31, 2014
| Fund & Benchmark Indices | 1-Year | 5-Year | 10-Year | Since Fund's Inception (07/01/99) | Gross Expense Ratio | Net Expense Ratio |
| Davis Real Estate Portfolio | 27.54% | 13.96% | 5.61% | 9.12% | 0.81% | 0.81% |
Standard & Poor's 500® Index | 13.69% | 15.45% | 7.67% | 4.56% | | |
Wilshire U.S. Real Estate Securities Index | 31.53% | 17.23% | 8.15% | 11.54% | | |
The Standard & Poor's 500® Index is an unmanaged index of 500 selected common stocks, most of which are listed on the New York Stock Exchange. The Index is adjusted for dividends, weighted towards stocks with large market capitalizations, and represents approximately two-thirds of the total market value of all domestic common stocks. Investments cannot be made directly in the Index.
The Wilshire U.S. Real Estate Securities Index is a broad measure of the performance of publicly traded real estate securities. It reflects no deduction for fees or expenses. Investments cannot be made directly in the Index.
The performance data for Davis Real Estate Portfolio contained in this report represents past performance, assumes that all distributions were reinvested, and should not be considered as an indication of future performance from an investment in the Fund today. The investment return and principal value will fluctuate so that shares may be worth more or less than their original cost when redeemed. Fund performance changes over time and current performance may be higher or lower than stated. The operating expense ratio may vary in future years. For more current information please call Davis Funds Investor Services at 1-800-279-0279.
Fund's performance numbers are net of all Fund operating expenses, but do not include any insurance charges imposed by your insurance company's separate account. If performance included the effect of these additional charges, the return would be lower.
| DAVIS REAL ESTATE PORTFOLIO | |
| December 31, 2014 |
| Portfolio Composition | | Industry Weightings |
| (% of Fund's 12/31/14 Net Assets) | | (% of 12/31/14 Long-Term Portfolio) |
| | | | | |
| | | | | Wilshire U.S. |
| | | | | Real Estate |
| | | | Fund | | Securities Index |
| Common Stock | 90.56% | | Retail REITs | 26.65% | | 24.56% |
| Convertible Bonds | 0.51% | | Office REITs | 18.99% | | 15.38% |
| Short-Term Investments | 8.41% | | Residential REITs | 14.97% | | 18.38% |
| Other Assets & Liabilities | 0.52% | | Industrial REITs | 7.46% | | 4.95% |
| 100.00% | | Specialized REITs | 7.28% | | 6.54% |
| | | Diversified REITs | 5.83% | | 7.33% |
| | | Hotel & Resort REITs | 4.31% | | 8.88% |
| | | Health Care REITs | 4.25% | | 13.11% |
| | | Consumer Services | 3.24% | | – |
| | | Real Estate Operating Companies | 3.02% | | 0.59% |
| | | Diversified Real Estate Activities | 2.93% | | – |
| | | Telecommunication Services | 1.07% | | – |
| | | Hotels, Resorts & Cruise Lines | – | | 0.28% |
| | | | 100.00% | | 100.00% |
| Top 10 Long-Term Holdings |
| (% of Fund's 12/31/14 Net Assets) |
| | |
| Simon Property Group, Inc. | Retail REITs | 7.13% |
| Boston Properties, Inc. | Office REITs | 3.25% |
| AvalonBay Communities, Inc. | Residential REITs | 3.24% |
| Corporate Office Properties Trust | Office REITs | 3.20% |
| General Growth Properties, Inc. | Retail REITs | 3.16% |
| DCT Industrial Trust Inc. | Industrial REITs | 2.94% |
| Vornado Realty Trust | Diversified REITs | 2.86% |
| Ventas, Inc. | Health Care REITs | 2.85% |
| Alexander & Baldwin Inc. | Diversified Real Estate Activities | 2.67% |
| American Campus Communities, Inc. | Residential REITs | 2.59% |
| DAVIS REAL ESTATE PORTFOLIO | Fund Overview – (Continued) |
| December 31, 2014 |
New Positions Added (01/01/14-12/31/14)
(Highlighted positions are those greater than 1.50% of the Fund's 12/31/14 net assets)
| Security | Industry | Date of 1st Purchase | % of Fund's 12/31/14 Net Assets |
| 21Vianet Group, Inc., Class A, ADR | Software & Services | 09/10/14 | – |
| American Homes 4 Rent, Class A | Residential REITs | 08/04/14 | 0.96% |
| American Residential Properties, Inc. | Residential REITs | 09/11/14 | 0.89% |
| Brandywine Realty Trust | Office REITs | 05/09/14 | 1.91% |
| CatchMark Timber Trust Inc., Class A | Specialized REITs | 09/12/14 | 0.87% |
| Cedar Realty Trust Inc. | Retail REITs | 07/02/14 | 0.62% |
| CoreSite Realty Corp. | Office REITs | 05/09/14 | 1.69% |
| Digital Realty Trust Inc., 144A | Office REITs | 07/11/14 | – |
| Equity Residential | Residential REITs | 01/28/14 | – |
| Extended Stay America, Inc. | Consumer Services | 11/07/14 | 1.03% |
| First Industrial Realty Trust, Inc. | Industrial REITs | 06/10/14 | 0.54% |
| Highwoods Properties, Inc. | Office REITs | 05/09/14 | 1.15% |
| Kite Realty Group Trust | Retail REITs | 07/02/14 | 2.21% |
| Las Vegas Sands Corp. | Consumer Services | 08/08/14 | 1.38% |
| Macerich Co. | Retail REITs | 09/12/14 | 1.24% |
| National Health Investors, Inc. | Health Care REITs | 12/17/14 | 1.02% |
| Paramount Group, Inc. | Office REITs | 11/18/14 | 0.48% |
| Prologis, Inc. | Industrial REITs | 01/29/14 | 0.96% |
| Public Storage | Specialized REITs | 10/29/14 | 2.44% |
| Ramco-Gershenson Properties Trust | Retail REITs | 07/02/14 | 1.19% |
| Terreno Realty Corp. | Industrial REITs | 01/28/14 | 1.65% |
| Weyerhaeuser Co. | Specialized REITs | 04/04/14 | 1.71% |
| Wynn Resorts Ltd. | Consumer Services | 09/02/14 | 0.54% |
Positions Closed (01/01/14-12/31/14)
(Gains and losses greater than $30,000 are highlighted)
| Security | Industry | Date of Final Sale | | | Realized Gain (Loss) |
| 21Vianet Group, Inc., Class A, ADR | Software & Services | 09/10/14 | | $ | 5,072 |
| American Tower Corp. | Specialized REITs | 10/03/14 | | | 246,291 |
| British Land Co. PLC | Diversified REITs | 04/02/14 | | | 19,557 |
| Digital Realty Trust, Inc., 144A | Office REITs | 11/03/14 | | | 259,004 |
| DuPont Fabros Technology Inc., | | | | | |
| 7.625%, Series B, Pfd. | Office REITs | 03/14/14 | | | (2,277) |
| EPR Properties | Specialized REITs | 08/15/14 | | | 27,265 |
| Equity Lifestyle Properties, Inc. | Residential REITs | 09/22/14 | | | 32,475 |
| Equity Residential | Residential REITs | 06/11/14 | | | 27,719 |
| Hammerson PLC | Retail REITs | 04/02/14 | | | 13,467 |
| HCP, Inc. | Specialized REITs | 01/09/14 | | | (27,622) |
| Land Securities Group PLC | Diversified REITs | 04/02/14 | | | 29,590 |
| Tanger Factory Outlet Centers, Inc. | Retail REITs | 11/12/14 | | | 35,489 |
| DAVIS REAL ESTATE PORTFOLIO | |
As a shareholder of the Fund, you incur ongoing costs only, including advisory and administrative fees and other Fund expenses. The Expense Example is intended to help you understand your ongoing costs (in dollars) of investing in the Fund and to compare these costs with the ongoing costs of investing in other mutual funds. The Expense Example is based on an investment of $1,000 invested at the beginning of the period and held for the entire period indicated, which for the Fund is for the six-month period ended December 31, 2014. Please note that the Expense Example is general and does not reflect charges imposed by your insurance company's separate account or account specific costs, which may increase your total costs of investing in the Fund. If these charges or account specific costs were included in the Expense Example, the expenses would have been higher.
Actual Expenses
The information represented in the row entitled "Actual" provides information about actual account values and actual expenses. You may use the information in this row, together with the amount you invested, to estimate the expenses that you paid over the period. Simply divide your account value by $1,000 (for example, an $8,600 account value divided by $1,000 = 8.6), then multiply the result by the number under the heading "Expenses Paid During Period" to estimate the expenses you paid on your account during this period.
Hypothetical Example for Comparison Purposes
The information represented in the row entitled "Hypothetical" provides information about hypothetical account values and hypothetical expenses based on the Fund's actual expense ratio and an assumed rate of return of 5% per year before expenses, which is not the Fund's actual return. The hypothetical account values and expenses may not be used to estimate the actual ending account balance or expenses you paid for the period. You may use this information to compare the ongoing costs of investing in the Fund and other funds. To do so, compare this 5% hypothetical example with the 5% hypothetical examples that appear in the shareholder reports of the other funds.
Please note that the expenses shown in the table are meant to highlight your ongoing costs only. Therefore, the information in the row entitled "Hypothetical" is useful in comparing ongoing costs only, and will not help you determine the relative total costs of owning different funds.
| Beginning Account Value (07/01/14) | | Ending Account Value (12/31/14) | | Expenses Paid During Period* (07/01/14-12/31/14) |
| | | | | |
| Actual | $1,000.00 | | $1,106.05 | | $4.14 |
| Hypothetical | $1,000.00 | | $1,021.27 | | $3.97 |
Hypothetical assumes 5% annual return before expenses.
* Expenses are equal to the Fund's annualized operating expense ratio (0.78%)**, multiplied by the average account value over the period, multiplied by 184/365 (to reflect the one-half year period).
** The expense ratio reflects the impact, if any, of certain reimbursements from the Adviser.
| DAVIS REAL ESTATE PORTFOLIO | |
| | December 31, 2014 |
| Shares | | Value
(Note 1) |
| COMMON STOCK – (90.56%) |
| CONSUMER DISCRETIONARY – (2.95%) |
| | Consumer Services – (2.95%) |
| | Extended Stay America, Inc. | | | 13,910 | | $ | 268,602 |
| Las Vegas Sands Corp. | | | 6,210 | | | 361,174 |
| Wynn Resorts Ltd. | | | 950 | | | 141,322 |
| | TOTAL CONSUMER DISCRETIONARY | | | 771,098 |
| FINANCIALS – (86.63%) |
| Real Estate – (86.63%) |
| | Real Estate Investment Trusts (REITs) – (81.73%) |
| Diversified REITs – (5.32%) |
| Cousins Properties, Inc. | | | 20,480 | | | 233,882 |
| Liberty Property Trust | | | 10,860 | | | 408,662 |
| Vornado Realty Trust | | | 6,340 | | | 746,281 |
| | 1,388,825 |
| Health Care REITs – (3.87%) |
| National Health Investors, Inc. | | | 3,810 | | | 266,547 |
| Ventas, Inc. | | | 10,400 | | | 745,680 |
| | 1,012,227 |
| Hotel & Resort REITs – (3.92%) |
| Host Hotels & Resorts Inc. | | | 27,020 | | | 642,265 |
| LaSalle Hotel Properties | | | 9,450 | | | 382,442 |
| | 1,024,707 |
| Industrial REITs – (6.79%) |
| DCT Industrial Trust Inc. | | | 21,580 | | | 769,543 |
| EastGroup Properties, Inc. | | | 2,890 | | | 182,995 |
| First Industrial Realty Trust, Inc. | | | 6,820 | | | 140,219 |
| Prologis, Inc. | | | 5,850 | | | 251,725 |
| Terreno Realty Corp. | | | 20,860 | | | 430,342 |
| | 1,774,824 |
| Office REITs – (17.30%) |
| Alexandria Real Estate Equities, Inc. | | | 7,090 | | | 629,166 |
| BioMed Realty Trust, Inc. | | | 17,350 | | | 373,719 |
| Boston Properties, Inc. | | | 6,600 | | | 849,354 |
| Brandywine Realty Trust | | | 31,250 | | | 499,375 |
| CoreSite Realty Corp. | | | 11,340 | | | 442,827 |
| Corporate Office Properties Trust | | | 29,510 | | | 837,199 |
| DuPont Fabros Technology Inc. | | | 6,090 | | | 202,432 |
| Highwoods Properties, Inc. | | | 6,770 | | | 299,776 |
| Paramount Group, Inc. * | | | 6,700 | | | 124,553 |
| SL Green Realty Corp. | | | 2,210 | | | 263,034 |
| | 4,521,435 |
| Residential REITs – (13.63%) |
| American Campus Communities, Inc. | | | 16,380 | | | 677,477 |
| American Homes 4 Rent, Class A | | | 14,710 | | | 250,511 |
| American Residential Properties, Inc. * | | | 13,210 | | | 232,100 |
| AvalonBay Communities, Inc. | | | 5,190 | | | 847,994 |
| Campus Crest Communities, Inc. | | | 16,350 | | | 119,518 |
| Education Realty Trust, Inc. | | | 11,686 | | | 427,591 |
| DAVIS REAL ESTATE PORTFOLIO | Schedule of Investments - (Continued) |
| December 31, 2014 |
| Shares/Principal | | Value
(Note 1) |
| COMMON STOCK – (CONTINUED) |
| FINANCIALS – (CONTINUED) |
| Real Estate – (Continued) |
| Real Estate Investment Trusts (REITs) – (Continued) |
| Residential REITs – (Continued) |
| Essex Property Trust, Inc. | | | 2,380 | | $ | 491,708 |
| Post Properties, Inc. | | | 8,780 | | | 516,001 |
| | 3,562,900 |
| Retail REITs – (24.27%) |
| Acadia Realty Trust | | | 18,210 | | | 583,266 |
| CBL & Associates Properties, Inc. | | | 13,240 | | | 257,121 |
| Cedar Realty Trust Inc. | | | 22,040 | | | 161,774 |
| DDR Corp. | | | 25,890 | | | 475,340 |
| Federal Realty Investment Trust | | | 4,040 | | | 539,178 |
| General Growth Properties, Inc. | | | 29,370 | | | 826,178 |
| Kite Realty Group Trust | | | 20,079 | | | 577,071 |
| Macerich Co. | | | 3,880 | | | 323,631 |
| Ramco-Gershenson Properties Trust | | | 16,550 | | | 310,147 |
| Simon Property Group, Inc. | | | 10,232 | | | 1,863,350 |
| Taubman Centers, Inc. | | | 4,050 | | | 309,501 |
| Washington Prime Group Inc. | | | 6,820 | | | 117,440 |
| | 6,343,997 |
| Specialized REITs – (6.63%) |
| CatchMark Timber Trust Inc., Class A | | | 20,180 | | | 228,438 |
| CubeSmart | | | 19,010 | | | 419,551 |
| Public Storage | | | 3,450 | | | 637,732 |
| Weyerhaeuser Co. | | | 12,460 | | | 447,189 |
| | 1,732,910 |
| | 21,361,825 |
| Real Estate Management & Development – (4.90%) |
| Diversified Real Estate Activities – (2.67%) |
| Alexander & Baldwin Inc. | | | 17,760 | | | 697,257 |
| Real Estate Operating Companies – (2.23%) |
| Forest City Enterprises, Inc., Class A * | | | 27,390 | | | 583,407 |
| | 1,280,664 |
| | | | | | TOTAL FINANCIALS | | | 22,642,489 |
| TELECOMMUNICATION SERVICES – (0.98%) |
| SBA Communications Corp., Class A * | | | 2,310 | | | 255,856 |
| TOTAL TELECOMMUNICATION SERVICES | | | 255,856 |
| TOTAL COMMON STOCK – (Identified cost $20,845,324) | | | 23,669,443 |
| CONVERTIBLE BONDS – (0.51%) |
| FINANCIALS – (0.51%) |
| Real Estate – (0.51%) |
| Real Estate Management & Development – (0.51%) |
| Real Estate Operating Companies – (0.51%) |
| Forest City Enterprises, Inc., Conv. Sr. Notes, 5.00%, 10/15/16 | | $ | 80,000 | | | 134,650 |
| TOTAL CONVERTIBLE BONDS – (Identified cost $80,000) | | | 134,650 |
| DAVIS REAL ESTATE PORTFOLIO | Schedule of Investments - (Continued) |
| December 31, 2014 |
| Principal | | Value
(Note 1) |
| SHORT-TERM INVESTMENTS – (8.41%) |
| | Mizuho Securities USA Inc. Joint Repurchase Agreement, 0.08%, 01/02/15, dated 12/31/14, repurchase value of $616,003 (collateralized by: U.S. Government agency mortgages in a pooled cash account, 2.50%- 3.50%, 12/01/27-10/01/28, total market value $628,320) | | $ | 616,000 | | $ | 616,000 |
| Nomura Securities International, Inc. Joint Repurchase Agreement, 0.08%, 01/02/15, dated 12/31/14, repurchase value of $1,129,005 (collateralized by: U.S. Government agency mortgages in a pooled cash account, 2.50%-6.50%, 12/20/29-12/20/44, total market value $1,151,580) | | | 1,129,000 | | | 1,129,000 |
| SunTrust Robinson Humphrey, Inc. Joint Repurchase Agreement, 0.18%, 01/02/15, dated 12/31/14, repurchase value of $452,005 (collateralized by: U.S. Government agency mortgages in a pooled cash account, 0.00%-4.00%, 02/01/22-11/01/44, total market value $461,040) | | | 452,000 | | | 452,000 |
| TOTAL SHORT-TERM INVESTMENTS – (Identified cost $2,197,000) | | | 2,197,000 |
| Total Investments – (99.48%) – (Identified cost $23,122,324) – (a) | | | 26,001,093 |
| Other Assets Less Liabilities – (0.52%) | | | 135,708 |
| | | | Net Assets – (100.00%) | | $ | 26,136,801 |
|
| * | Non-Income producing security. |
|
| (a) | Aggregate cost for federal income tax purposes is $23,137,175. At December 31, 2014 unrealized appreciation (depreciation) of securities for federal income tax purposes is as follows: |
|
| Unrealized appreciation | | $ | 2,988,006 |
| Unrealized depreciation | | | (124,088) |
| Net unrealized appreciation | | $ | 2,863,918 |
| |
| See Notes to Financial Statements |
| DAVIS REAL ESTATE PORTFOLIO | Statement of Assets and Liabilities |
| At December 31, 2014 |
| ASSETS: | | | | | |
| Investments in securities at value* (see accompanying Schedule of Investments) | | $ | 26,001,093 |
| Cash | | | 1,110 |
| Receivables: | | | |
| Capital stock sold | | | 38,235 |
| Dividends and interest | | | 136,412 |
| Prepaid expenses | | | 628 |
| | Total assets | | | 26,177,478 |
LIABILITIES: | | | |
| Payables: | | | |
| Capital stock redeemed | | | 3,044 |
| Accrued audit fees | | | 13,090 |
| Accrued custodian fees | | | 2,575 |
| Accrued investment advisory fee | | | 15,139 |
| Other accrued expenses | | | 6,829 |
| Total liabilities | | | 40,677 |
NET ASSETS | | $ | 26,136,801 |
SHARES OUTSTANDING | | | 1,964,079 |
NET ASSET VALUE, offering, and redemption price per share (Net assets ÷ Shares outstanding) | | $ | 13.31 |
NET ASSETS CONSIST OF: | | | |
| Par value of shares of capital stock | | $ | 1,964 |
| Additional paid-in capital | | | 25,864,741 |
| Undistributed net investment income | | | 312,441 |
| Accumulated net realized losses from investments | | | (2,921,114) |
| Net unrealized appreciation on investments and foreign currency transactions | | | 2,878,769 |
| Net Assets | | $ | 26,136,801 |
| | | | | |
| *Including: | | | |
| Cost of Investments | | $ | 23,122,324 |
| | | | | |
| See Notes to Financial Statements | | | |
| DAVIS REAL ESTATE PORTFOLIO | |
| For the year ended December 31, 2014 |
| INVESTMENT INCOME: | | | | | | |
| Income: | | | |
| Dividends* | | $ | 515,808 |
| Interest | | | 10,723 |
| | Total income | | | | 526,531 |
| | | | | | | | | |
| Expenses: | | | |
| Investment advisory fees (Note 3) | | $ | 134,832 | | | |
| Custodian fees | | | 19,100 | | | |
| Transfer agent fees | | | 6,269 | | | |
| Audit fees | | | 19,320 | | | |
| Legal fees | | | 563 | | | |
| Accounting fees (Note 3) | | | 2,004 | | | |
| Reports to shareholders | | | 636 | | | |
| Directors' fees and expenses | | | 7,628 | | | |
| Registration and filing fees | | | 13 | | | |
| Miscellaneous | | | 7,690 | | | |
| Total expenses | | | | 198,055 |
| Net investment income | | | 328,476 |
| | | | | | | | | |
REALIZED & UNREALIZED GAIN ON INVESTMENTS AND FOREIGN CURRENCY TRANSACTIONS: | | | | | | |
| Net realized gain from: | | | |
| Investment transactions | | | 2,117,187 |
| Foreign currency transactions | | | 16 |
| Net realized gain | | | 2,117,203 |
| Net change in unrealized appreciation (depreciation) | | | 3,448,142 |
| Net realized and unrealized gain on investments and foreign currency transactions | | | | 5,565,345 |
| Net increase in net assets resulting from operations | | $ | 5,893,821 |
| | | | | | | | | |
| *Net of foreign taxes withheld as follows | | $ | 1,000 |
| | | | | | | | | |
| See Notes to Financial Statements |
| DAVIS REAL ESTATE PORTFOLIO | Statements of Changes in Net Assets |
| | Year ended December 31, |
| | 2014 | | 2013 |
| | | | | | | |
| OPERATIONS: | | | | | | |
| Net investment income | | $ | 328,476 | | $ | 397,004 |
| Net realized gain from investments and foreign currency transactions | | | 2,117,203 | | | 3,681,187 |
Net change in unrealized appreciation (depreciation) on investments and foreign currency transactions | | | 3,448,142 | | | (4,288,685) |
| Net increase (decrease) in net assets resulting from operations | | | 5,893,821 | | | (210,494) |
| | | | | | | | |
| DIVIDENDS AND DISTRIBUTIONS TO SHAREHOLDERS FROM: | | | | | | |
| Net investment income | | | (294,901) | | | (296,834) |
| | | | | | | | |
| CAPITAL SHARE TRANSACTIONS: | | | | | | |
| Net decrease in net assets resulting from capital share transactions (Note 4) | | | (1,473,137) | | | (5,549,967) |
| Total increase (decrease) in net assets | | | 4,125,783 | | | (6,057,295) |
| | | | | | | | |
| NET ASSETS: | | | | | | |
| Beginning of year | | | 22,011,018 | | | 28,068,313 |
End of year* | | $ | 26,136,801 | | $ | 22,011,018 |
| | | | | | | | |
| *Including undistributed net investment income of | | $ | 312,441 | | $ | 278,850 |
| | | | | | | |
| See Notes to Financial Statements |
| DAVIS REAL ESTATE PORTFOLIO | Notes to Financial Statements |
| December 31, 2014 |
NOTE 1 - SUMMARY OF SIGNIFICANT ACCOUNTING POLICIES
The Fund is a separate series of Davis Variable Account Fund, Inc. (a Maryland corporation), which is registered under the Investment Company Act of 1940, as amended, as a non-diversified, open-end management investment company. Only insurance companies, for the purpose of funding variable annuity or variable life insurance contracts, may purchase shares of the Fund. The following is a summary of significant accounting policies followed by the Fund in the preparation of its financial statements.
Security Valuation - The Fund calculates the net asset value of its shares as of the close of the New York Stock Exchange ("Exchange"), normally 4:00 P.M. Eastern time, on each day the Exchange is open for business. Securities listed on the Exchange (and other national exchanges including NASDAQ) are valued at the last reported sales price on the day of valuation. Listed securities for which no sale was reported on that date are valued at the average of closing bid and asked prices. Securities traded on foreign exchanges are valued based upon the last sales price on the principal exchange on which the security is traded prior to the time when the Fund's assets are valued. Fixed income securities with more than 60 days to maturity are generally valued using evaluated prices or matrix pricing methods determined by an independent pricing service which takes into consideration factors such as yield, maturity, liquidity, ratings, and traded prices in identical or similar securities. Securities (including restricted securities) for which market quotations are not readily available or securities whose values have been materially affected by what Davis Selected Advisers, L.P. ("Davis Advisors" or "Adviser"), the Fund's investment adviser, identifies as a significant event occurring before the Fund's assets are valued, but after the close of their respective exchanges will be fair valued using a standardized fair valuation methodology applicable to the security type or the significant event as previously approved by the Fund's Pricing Committee and Board of Directors. The Pricing Committee considers all facts it deems relevant that are reasonably available, through either public information or information available to the Adviser's portfolio management team, when determining the fair value of a security. To assess the continuing appropriateness of security valuations, the Adviser may compare prior day prices, prices of comparable securities, and sale prices to the prior or current day prices and challenge those prices exceeding certain tolerance levels with the third-party pricing service or broker source. Fair value determinations are subject to review, approval, and ratification by the Fund's Board of Directors at its next regularly scheduled meeting covering the period in which the fair valuation was determined.
Short-term securities purchased within 60 days to maturity are valued at amortized cost, which approximates market value.
The Fund's valuation procedures are reviewed and subject to approval by the Board of Directors. There have been no significant changes to the fair valuation procedures during the period.
Value Measurements - Fair value is defined as the price that the Fund would receive upon selling an investment in an orderly transaction to an independent buyer in the principal market for the investment. Various inputs are used to determine the fair value of the Fund's investments. These inputs are summarized in the three broad levels listed below.
| Level 1 – | quoted prices in active markets for identical securities |
| Level 2 – | other significant observable inputs (including quoted prices for similar investments, interest rates, prepayment speeds, credit risk, etc.) |
| Level 3 – | significant unobservable inputs (including the Fund's own assumptions in determining the fair value of investments) |
The inputs or methodologies used for valuing securities are not necessarily an indication of the risks associated with investing in those securities nor can it be assured that the Fund can obtain the fair value assigned to a security if it were to sell the security.
| DAVIS REAL ESTATE PORTFOLIO | Notes to Financial Statements – (Continued) |
| December 31, 2014 |
NOTE 1 - SUMMARY OF SIGNIFICANT ACCOUNTING POLICIES – (CONTINUED)
Value Measurements - (Continued)
The following is a summary of the inputs used as of December 31, 2014 in valuing the Fund's investments carried at value:
| Investments in Securities at Value |
| Valuation Inputs |
| | | Level 2: | | Level 3: | | |
| | | Other Significant | | Significant | | |
| Level 1: | | Observable | | Unobservable | | |
| Quoted Prices | | Inputs | | Inputs | | Total |
Equity securities: | | | | | | | | | | | |
| Consumer Discretionary | $ | 771,098 | | $ | – | | $ | – | | $ | 771,098 |
| Financials | | 22,642,489 | | | – | | | – | | | 22,642,489 |
| Telecommunication Services | | 255,856 | | | – | | | – | | | 255,856 |
| Convertible debt securities | | – | | | 134,650 | | | – | | | 134,650 |
| Short-term securities | | – | | | 2,197,000 | | | – | | | 2,197,000 |
| Total Investments | $ | 23,669,443 | | $ | 2,331,650 | | $ | – | | $ | 26,001,093 |
There were no transfers of investments between Level 1 and Level 2 of the fair value hierarchy during the year ended December 31, 2014.
Master Repurchase Agreements - The Fund, along with other affiliated funds, may transfer uninvested cash balances into one or more master repurchase agreement accounts. These balances are invested in one or more repurchase agreements, secured by U.S. Government securities. A custodian bank holds securities pledged as collateral for repurchase agreements until the agreements mature. Each agreement requires that the market value of the collateral be sufficient to cover payments of interest and principal; however, in the event of default by the other party to the agreement, retention of the collateral may be subject to legal proceedings.
Currency Translation - The market values of all assets and liabilities denominated in foreign currencies are recorded in the financial statements after translation to the U.S. Dollar based upon the mean between the bid and offered quotations of the currencies against U.S. Dollars on the date of valuation. The cost basis of such assets and liabilities is determined based upon historical exchange rates. Income and expenses are translated at average exchange rates in effect as accrued or incurred.
Foreign Currency - The Fund may enter into forward purchases or sales of foreign currencies to hedge certain foreign currency denominated assets and liabilities against declines in market value relative to the U.S. Dollar. Forward currency contracts are marked-to-market daily and the change in market value is recorded by the Fund as an unrealized gain or loss. When the forward currency contract is closed, the Fund records a realized gain or loss equal to the difference between the value of the forward currency contract at the time it was opened and value at the time it was closed. Investments in forward currency contracts may expose the Fund to risks resulting from unanticipated movements in foreign currency exchange rates or failure of the counter-party to the agreement to perform in accordance with the terms of the contract.
Reported net realized foreign exchange gains or losses arise from the sales of foreign currencies, currency gains or losses realized between the trade and settlement dates on security transactions, the difference between the amounts of dividends, interest, and foreign withholding taxes recorded on the Fund's books, and the U.S. Dollar equivalent of the amounts actually received or paid. Net unrealized foreign exchange gains or losses arise from changes in the value of assets and liabilities other than investments in securities at fiscal year end, resulting from changes in the exchange rate. The Fund includes foreign currency gains and losses realized on the sales of investments together with market gains and losses on such investments in the Statement of Operations.
| DAVIS REAL ESTATE PORTFOLIO | Notes to Financial Statements – (Continued) |
| December 31, 2014 |
NOTE 1 - SUMMARY OF SIGNIFICANT ACCOUNTING POLICIES – (CONTINUED)
Federal Income Taxes - It is the Fund's policy to comply with the requirements of the Internal Revenue Code applicable to regulated investment companies, and to distribute substantially all of its taxable income, including any net realized gains on investments not offset by loss carryovers, to shareholders. Therefore, no provision for federal income or excise tax is required. The Adviser has analyzed the Fund's tax positions taken on federal and state income tax returns for all open tax years and has concluded that as of December 31, 2014, no provision for income tax is required in the Fund's financial statements related to these tax positions. The Fund's federal and state (Arizona) income and federal excise tax returns for tax years for which the applicable statutes of limitations have not expired are subject to examination by the Internal Revenue Service and state department of revenue. The earliest tax year that remains subject to examination by these jurisdictions is 2011. At December 31, 2014, the Funds had available for federal income tax purposes unused capital loss carryforwards as follows:
| Capital Loss Carryforwards |
Expiring | | |
| 12/31/2017 | $ | 2,906,000 |
| | |
| Utilized in 2014 | $ | 2,115,000 |
Securities Transactions and Related Investment Income - Securities transactions are accounted for on the trade date (date the order to buy or sell is executed) with realized gain or loss on the sale of securities being determined based upon identified cost. Dividend income is recorded on the ex-dividend date. Dividend income from REIT securities may include return of capital. Upon notification from the issuer, the amount of the return of capital is reclassified to adjust dividend income, reduce the cost basis, and/or adjust realized gain/loss. Interest income, which includes accretion of discount and amortization of premium, is accrued as earned.
Dividends and Distributions to Shareholders - Dividends and distributions to shareholders are recorded on the ex-dividend date. Net investment income (loss), net realized gains (losses), and net unrealized appreciation (depreciation) on investments may differ for financial statement and tax purposes primarily due to differing treatments of wash sales and foreign currency transactions. The character of dividends and distributions made during the fiscal year from net investment income and net realized securities gains may differ from their ultimate characterization for federal income tax purposes. Also, due to the timing of dividends and distributions, the fiscal year in which amounts are distributed may differ from the fiscal year in which income or realized gain was recorded by the Fund. The Fund adjusts certain components of capital to reflect permanent differences between financial statement amounts and net income and realized gains/losses determined in accordance with income tax rules. Accordingly, during the year ended December 31, 2014, amounts have been reclassified to reflect an increase in undistributed net investment income of $16 and a corresponding increase in accumulated net realized losses from investments and foreign currency transactions. The Fund's net assets have not been affected by this reclassification.
The tax character of distributions paid during the years ended December 31, 2014 and 2013 was as follows:
| 2014 | | 2013 |
| Ordinary income | $ | 294,901 | | $ | 296,834 |
As of December 31, 2014, the components of distributable earnings (accumulated losses) on a tax basis were as follows:
| Undistributed net investment income | $ | 317,139 |
| Accumulated net realized losses from investments and | | |
| foreign currency transactions | | (2,906,265) |
| Net unrealized appreciation on investments | | 2,863,918 |
| Total | $ | 274,792 |
| DAVIS REAL ESTATE PORTFOLIO | Notes to Financial Statements – (Continued) |
| December 31, 2014 |
NOTE 1 - SUMMARY OF SIGNIFICANT ACCOUNTING POLICIES – (CONTINUED)
Indemnification - Under the Fund's organizational documents, its officers and directors are indemnified against certain liabilities arising out of the performance of their duties to the Fund. In addition, some of the Fund's contracts with its service providers contain general indemnification clauses. The Fund's maximum exposure under these arrangements is unknown since the amount of any future claims that may be made against the Fund cannot be determined and the Fund has no historical basis for predicting the likelihood of any such claims.
Use of Estimates in Financial Statements - In preparing financial statements in conformity with accounting principles generally accepted in the United States of America, management makes estimates and assumptions that affect the reported amounts of assets and liabilities and disclosure of contingent assets and liabilities at the date of the financial statements, as well as the reported amounts of income and expenses during the reporting period. Actual results may differ from these estimates.
Directors Fees and Expenses - The Fund set up a Rabbi Trust to provide for the deferred compensation plan for Independent Directors that enables them to elect to defer receipt of all or a portion of annual fees they are entitled to receive. The value of an eligible Director's account is based upon years of service and fees paid to each Director during the years of service. The amount paid to the Director by the Trust under the plan will be determined based upon the performance of the Davis Funds in which the amounts are invested.
NOTE 2 - PURCHASES AND SALES OF SECURITIES
The cost of purchases and proceeds from sales of investment securities (excluding short-term securities) during the year ended December 31, 2014 were $12,318,729 and $14,687,759, respectively.
NOTE 3 - FEES AND OTHER TRANSACTIONS WITH AFFILIATES
Davis Selected Advisers-NY, Inc. ("DSA-NY"), a wholly-owned subsidiary of the Adviser, acts as sub-adviser to the Fund. DSA-NY performs research and portfolio management services for the Fund under a Sub-Advisory Agreement with the Adviser. The Fund pays no fees directly to DSA-NY.
Certain directors and officers of the Fund are also directors and officers of the general partner of the Adviser.
Investment Advisory Fees - Advisory fees are paid monthly to the Adviser at an annual rate of 0.55% of the Fund's average net assets.
Accounting Fees - State Street Bank and Trust Company ("State Street Bank") is the Fund's primary accounting provider. Fees for accounting services are included in the custodian fees as State Street Bank also serves as the Fund's custodian. The Adviser is also paid for certain accounting services. The fee paid to the Adviser for these services during the year ended December 31, 2014 amounted to $2,004.
| DAVIS REAL ESTATE PORTFOLIO | Notes to Financial Statements – (Continued) |
| December 31, 2014 |
NOTE 4 - CAPITAL STOCK
At December 31, 2014, there were 500 million shares of capital stock ($0.001 par value per share) authorized. Transactions in capital stock were as follows:
| Year ended December 31, 2014 |
| | Sold | | | Reinvestment of Distributions | | | Redeemed | | | Net Decrease |
| | | | | | | | | | | |
Shares: | | 374,250 | | | 24,154 | | | (518,708) | | | (120,304) |
Value: | $ | 4,421,152 | | $ | 294,901 | | $ | (6,189,190) | | $ | (1,473,137) |
| | | | | | | | | | | |
|
| Year ended December 31, 2013 |
| | Sold | | | Reinvestment of Distributions | | | Redeemed | | | Net Decrease |
| | | | | | | | | | | |
Shares: | | 137,016 | | | 27,298 | | | (671,030) | | | (506,716) |
Value: | $ | 1,523,175 | | $ | 296,834 | | $ | (7,369,976) | | $ | (5,549,967) |
| | | | | | | | | | | |
NOTE 5 - BANK BORROWINGS
The Fund may borrow up to 5% of its assets from a bank to purchase portfolio securities, or for temporary and emergency purposes. The purchase of securities with borrowed funds creates leverage in the Fund. The Fund has entered into an agreement, which enables it to participate with certain other funds managed by the Adviser in an unsecured line of credit with a bank, which permits borrowings up to $50 million, collectively. Interest is charged based on its borrowings, at a rate equal to the higher of the Federal Funds Rate or the Overnight Libor Rate, plus 1.25%. The Fund had no borrowings during the year ended December 31, 2014.
FEDERAL INCOME TAX INFORMATION
(UNAUDITED)
During the calendar year ended December 31, 2014, $294,901 of dividends paid by the Fund constituted income dividends for federal income tax purposes. The Fund designates $399 or 0.14% as income qualifying for the corporate dividends-received deduction.
| DAVIS REAL ESTATE PORTFOLIO | |
| The following financial information represents selected data for each share of capital stock outstanding throughout each period: |
| Year ended December 31, |
| | | 2014 | | 2013 | | 2012 | | 2011 | | 2010 |
| Net Asset Value, Beginning of Period | | $ | 10.56 | | $ | 10.83 | | $ | 9.34 | | $ | 8.69 | | $ | 7.40 |
|
| Income (Loss) from Investment Operations: | | | | | | | | | | |
| Net Investment Income | | 0.17 | | 0.19 | | 0.16 | | 0.14 | | 0.13 |
| Net Realized and Unrealized Gains (Losses) | | 2.73 | | (0.33) | | 1.44 | | 0.63 | | 1.31 |
| Total from Investment Operations | | 2.90 | | (0.14) | | 1.60 | | 0.77 | | 1.44 |
|
| Dividends and Distributions: | | | | | | | | | | |
| Dividends from Net Investment Income | | (0.15) | | (0.13) | | (0.11) | | (0.12) | | (0.15) |
| Total Dividends and Distributions | | (0.15) | | (0.13) | | (0.11) | | (0.12) | | (0.15) |
| Net Asset Value, End of Period | | $ | 13.31 | | $ | 10.56 | | $ | 10.83 | | $ | 9.34 | | $ | 8.69 |
| | | | | | | | | | | | | | | |
Total Returna | | 27.54% | | (1.32)% | | 17.15% | | 8.89% | | 19.70% |
|
| Ratios/Supplemental Data: | | | | | | | | | | | | | | | | | | | | |
| Net Assets, End of Period (in thousands) | | $ | 26,137 | | $ | 22,011 | | $ | 28,068 | | $ | 24,226 | | $ | 25,269 |
| Ratio of Expenses to Average Net Assets: | |
| Gross | | 0.81% | | 0.81% | | 0.77% | | 0.81% | | 0.81% |
| Netb | | 0.81% | | 0.81% | | 0.77% | | 0.81% | | 0.81% |
Ratio of Net Investment Income to Average Net Assets | | 1.34% | | 1.52% | | 1.55% | | 1.50% | | 1.58% |
Portfolio Turnover Ratec | | 54% | | 73% | | 51% | | 75% | | 43% |
| a | Assumes hypothetical initial investment on the business day before the first day of the fiscal period, with all dividends and distributions reinvested in additional shares on the reinvestment date, and redemption at the net asset value calculated on the last business day of the fiscal period. Total returns do not reflect charges attributable to your insurance company's separate account. Inclusion of these charges would reduce the total returns shown. |
| |
| b | The Net Ratio of Expenses to Average Net Assets reflects the impact, if any, of the reduction of expenses paid indirectly and of certain reimbursements from the Adviser. |
| |
| c | The lesser of purchases or sales of portfolio securities for a period, divided by the monthly average of the market value of portfolio securities owned during the period. Securities with a maturity or expiration date at the time of acquisition of one year or less are excluded from the calculation. |
|
| See Notes to Financial Statements |
| DAVIS REAL ESTATE PORTFOLIO | Report of Independent Registered Public Accounting Firm |
The Shareholders and Board of Directors
Davis Variable Account Fund, Inc.:
We have audited the accompanying statement of assets and liabilities of Davis Real Estate Portfolio (a separate series of Davis Variable Account Fund, Inc.) including the schedule of investments, as of December 31, 2014, and the related statement of operations for the year then ended, the statement of changes in net assets for each of the years in the two-year period then ended, and the financial highlights for each of the years in the five-year period then ended. These financial statements and financial highlights are the responsibility of the Funds' management. Our responsibility is to express an opinion on these financial statements and financial highlights based on our audits.
We conducted our audits in accordance with the standards of the Public Company Accounting Oversight Board (United States). Those standards require that we plan and perform the audit to obtain reasonable assurance about whether the financial statements and financial highlights are free of material misstatement. An audit includes examining, on a test basis, evidence supporting the amounts and disclosures in the financial statements. Our procedures included confirmation of securities owned as of December 31, 2014, by correspondence with the custodian and brokers or by other appropriate auditing procedures. An audit also includes assessing the accounting principles used and significant estimates made by management, as well as evaluating the overall financial statement presentation. We believe that our audits provide a reasonable basis for our opinion.
In our opinion, the financial statements and financial highlights referred to above present fairly, in all material respects, the financial position of Davis Real Estate Portfolio as of December 31, 2014, the results of its operations for the year then ended, the changes in its net assets for each of the years in the two-year period then ended, and the financial highlights for each of the years in the five-year period then ended, in conformity with U.S. generally accepted accounting principles.
KPMG LLP
Denver, Colorado
February 10, 2015
| DAVIS REAL ESTATE PORTFOLIO | |
For the purposes of their service as directors to the Davis Funds, the business address for each of the directors is 2949 E. Elvira Road, Suite 101, Tucson, AZ 85756. Each Director serves until their retirement, resignation, death, or removal. Subject to exceptions and exemptions, which may be granted by the Independent Directors, Directors must retire at the close of business on the last day of the calendar year in which the Director attains age seventy-four (74).
Name (birthdate) | Position(s) Held With Fund | Term of Office and Length of Time Served | Principal Occupation(s) During Past Five Years | Number of Portfolios in Fund Complex Overseen by Director | Other Directorships Held by Director |
| | | | | |
Independent Directors
| | | | | |
Marc P. Blum (09/09/42) | Director | Director since 1986 | Chief Executive Officer, World Total Return Fund, LLLP; of Counsel to Gordon Feinblatt LLC (law firm). | 13 | Director, Rodney Trust Company (trust and asset management company). |
| | | | | |
John S. Gates, Jr. (08/02/53) | Director | Director since 2007 | Chairman and Chief Executive Officer of PortaeCo LLC (private investment company). | 13 | Director, DCT Industrial Trust (REIT); Chairman, Regional Transportation Authority of Chicago (public transportation system). |
| | | | | |
Thomas S. Gayner (12/16/61) | Director/ Chairman | Director since 2004 | President and Chief Investment Officer, Markel Corp. (diversified financial holding company). | 13 | Director, Graham Holdings Company (publishing company); Director, Colfax Corp. (engineering and manufacturer of pumps and fluid handling equipment). |
| | | | | |
Samuel H. Iapalucci (07/19/52) | Director | Director since 2006 | Retired; Executive Vice President and Chief Financial Officer, CH2M- HILL Companies, Ltd. (engineering) until 2008. | 13 | Director, exp Global Inc. (engineering). |
| | | | | |
Robert P. Morgenthau (03/22/57) | Director | Director since 2002 | Principal, Spears Abacus Advisors, LLC (investment management firm) since 2011; Chairman, NorthRoad Capital Management, LLC (investment management firm) 2002-2011. | 13 | none |
| | | | | |
Marsha Williams (03/28/51) | Director | Director since 1999 | Retired; Senior Vice President and Chief Financial Officer, Orbitz Worldwide, Inc. (travel-services provider) 2007-2010. | 13 | Director, Modine Manufacturing Company (heat transfer technology); Director, Chicago Bridge & Iron Company, N.V. (industrial construction and engineering); Director, Fifth Third Bancorp (diversified financial services). |
| DAVIS REAL ESTATE PORTFOLIO | Directors and Officers – (Continued) |
Name (birthdate) | Position(s) Held With Fund | Term of Office and Length of Time Served | Principal Occupation(s) During Past Five Years | Number of Portfolios in Fund Complex Overseen by Director | Other Directorships Held by Director |
| | | | | |
Inside Directors*
| | | | | |
Andrew A. Davis (06/25/63) | Director | Director since 1997 | President or Vice President of each Davis Fund and Selected Fund; President, Davis Selected Advisers, L.P., and also serves as an executive officer of certain companies affiliated with the Adviser. | 16 | Director, Selected Funds (consisting of two portfolios) since 1998; Trustee of Clipper Funds Trust (consisting of one portfolio) since 2014. |
| | | | | |
Christopher C. Davis (07/13/65) | Director | Director since 1997 | President or Vice President of each Davis Fund, Selected Fund, and Clipper Fund; Chairman, Davis Selected Advisers, L.P., and also serves as an executive officer of certain companies affiliated with the Adviser, including sole member of the Adviser's general partner, Davis Investments, LLC; Employee of Shelby Cullom Davis & Co. (registered broker/dealer). | 16 | Director, Selected Funds (consisting of two portfolios) since 1998; Trustee of Clipper Funds Trust (consisting of one portfolio) since 2014; Director, Graham Holdings Company (publishing company). |
*Andrew A. Davis and Christopher C. Davis own partnership units (directly, indirectly, or both) of the Adviser and are considered to be "interested persons" of the Funds as defined in the Investment Company Act of 1940. Andrew A. Davis and Christopher C. Davis are brothers.
Officers
Andrew A. Davis (born 06/25/63, Davis Funds officer since 1997). See description in the section on Inside Directors.
Christopher C. Davis (born 07/13/65, Davis Funds officer since 1997). See description in the section on Inside Directors.
Kenneth C. Eich (born 08/14/53, Davis Funds officer since 1997). Executive Vice President and Principal Executive Officer of each of the Davis Funds (consisting of 13 portfolios), Selected Funds (consisting of two portfolios), and Clipper Funds Trust (consisting of one portfolio); Chief Operating Officer, Davis Selected Advisers, L.P., and also serves as an executive officer of certain companies affiliated with the Adviser.
Douglas A. Haines (born 03/04/71, Davis Funds officer since 2004). Vice President, Treasurer, Chief Financial Officer, Principal Financial Officer, and Principal Accounting Officer of each of the Davis Funds (consisting of 13 portfolios), Selected Funds (consisting of two portfolios), and Clipper Funds Trust (consisting of one portfolio); Vice President and Director of Fund Accounting, Davis Selected Advisers, L.P.
Sharra L. Haynes (born 09/25/66, Davis Funds officer since 1997). Vice President and Chief Compliance Officer of each of the Davis Funds (consisting of 13 portfolios), Selected Funds (consisting of two portfolios), and Clipper Funds Trust (consisting of one portfolio); Vice President and Chief Compliance Officer, Davis Selected Advisers, L.P., and also serves as an executive officer of certain companies affiliated with the Adviser.
Ryan M. Charles (born 07/25/78, Davis Funds officer since 2014). Vice President and Secretary of each of the Davis Funds (consisting of 13 portfolios), Selected Funds (consisting of two portfolios), and Clipper Funds Trust (consisting of one portfolio); Vice President, Chief Legal Officer, and Secretary, Davis Selected Advisers, L.P., and also serves as an executive officer of certain companies affiliated with the Adviser.
Arthur Don (born 09/24/53, Davis Funds officer since 1991). Assistant Secretary (for clerical purposes only) of each of the Davis Funds and Selected Funds; Shareholder, Greenberg Traurig, LLP (law firm); counsel to the Independent Directors and the Davis Funds.
| DAVIS REAL ESTATE PORTFOLIO |
| Investment Adviser |
| Davis Selected Advisers, L.P. (Doing business as "Davis Advisors") |
| 2949 East Elvira Road, Suite 101 |
| Tucson, Arizona 85756 |
| (800) 279-0279 |
|
| Distributor |
| Davis Distributors, LLC |
| 2949 East Elvira Road, Suite 101 |
| Tucson, Arizona 85756 |
|
| Transfer Agent |
| Boston Financial Data Services, Inc. |
| c/o The Davis Funds |
| P.O. Box 8406 |
| Boston, Massachusetts 02266-8406 |
|
| Custodian |
| State Street Bank and Trust Co. |
| One Lincoln Street |
| Boston, Massachusetts 02111 |
|
| Counsel |
| Greenberg Traurig, LLP |
| 77 West Wacker Drive, Suite 3100 |
| Chicago, Illinois 60601 |
|
| Independent Registered Public Accounting Firm |
| KPMG LLP |
| 1225 Seventeenth Street, Suite 800 |
| Denver, Colorado 80202 |
For more information about Davis Real Estate Portfolio, including management fee, charges, and expenses, see the current prospectus, which must precede or accompany this report. The Fund's Statement of Additional Information contains additional information about the Fund's Directors and is available without charge, upon request, by calling 1-800-279-0279 and on the Fund's website at www.davisfunds.com. Quarterly Fact Sheets are available on the Fund's website at www.davisfunds.com.