Exhibit 99.10
Business of the Annual and Special Meeting
1. Receipt of the Consolidated Financial Statements
To receive the consolidated financial statements of Manulife Financial Corporation (the “Company”) for the year ended December 31, 2008, together with the reports of the auditor and the actuary on those statements.
2. Election of Directors
The 15 nominees for election to the Company’s Board of Directors and their biographies are listed in the section “Nominees for the Board of Directors”. All of the nominees, with the exception of Donald Guloien, are currently Directors of the Company.
Each successful nominee will be elected to the Board of Directors for a term of one year, which expires at the Company’s Annual Meeting in 2010.
Directors’ attendance at Board and committee meetings held in 2008 is shown in the chart for each Director nominee in the “Nominees for the Board of Directors” section.
3. Appointment of Auditors
The Board of Directors propose that the firm of Ernst & Young LLP be appointed as auditor for the 2009 fiscal year. Ernst & Young LLP has served as the Company’s auditor for more than five years. For 2008, fees charged by Ernst & Young LLP to the Company and its subsidiaries were $21.9 million, compared with $20.8 million in 2007.
| | | | | | | | | | |
| | | Year ended December 31, 2008 ($ in millions) | | | | Year ended December 31, 2007 ($ in millions) | | |
Audit fees1 | | $ | 21.1 | | | | $ | 19.8 | | |
Audit-related fees2 | | | 0.7 | | | | | 0.5 | | |
Tax fees3 | | | 0.1 | | | | | 0.5 | | |
All other fees | | | — | | | | | — | | |
Total | | $ | 21.9 | | | | $ | 20.8 | | |
| 1 | Includes the annual audit,Sarbanes-Oxley Act of 2002 (“SOX”) attestation, reviews of quarterly reports, statutory audits and regulatory filings. |
| 2 | Includes review of product filing registration statements and due diligence in connection with proposed or consummated acquisitions. |
| 3 | Includes tax compliance, tax planning and tax advice services. |
The Company has complied with applicable rules regulating the provision of non-audit services to the Company by its external auditor. All audit and non-audit services provided to the Company by Ernst & Young LLP have been pre-approved by the Audit and Risk Management Committee (the “Audit Committee”). The Audit Committee has reviewed the magnitude and nature of these services to ensure that they are compatible with maintaining the independence of the external auditor.
| 4. Confirmation | | of Amendments to By-Law No. 2 Creating Class 1 Shares |
On February 25, 2009, the Board of Directors approved amendments to By-Law No. 2 of the Company (referred to in By-Law No. 2 as the “Corporation”) to create a new class of shares designated as “Class 1 Shares”.The new Class 1 Shares would rankpari passu with the existing Class A Shares and senior to the existing Class B Shares. The Company has four
series of Class A Shares outstanding, and has authorized but not issued a fifth series of Class A Shares. The Company has not issued any Class B Shares. The new Class 1 Shares provide additional flexibility for the Company to create future series of preferred shares with different rights from those under the existing series.
The amendments approved by the Board of Directors are as follows:
| “1. | By-law No. 2 of the Corporation is hereby amended to create a new class of shares to be designated as “Class 1 Shares” (the “Class 1 Shares”), such shares to be unlimited in number and issuable in series and to have rights, privileges, restrictions and conditions in the form of the rights, privileges, restrictions and conditions presented to the board of directors of the Corporation, as contained in Schedule A attached to this resolution; |
| 2. | section 1.1 of By-law No. 2 of the Corporation is hereby amended by adding the following definition after the definition of “Cancellation Time”: |
“Class 1 Shares” means the Class 1 Shares of any series in the capital of the Corporation, without nominal or par value, now existing or hereafter created;”
| 3. | section 2.1 of By-law No. 2 of the Corporation is hereby deleted in its entirety and the following is substituted therefor: |
“2.1 Authorized Capital
The authorized capital of the Corporation shall consist of an unlimited number of Class A Shares issuable in series, an unlimited number of Class B Shares issuable in series, an unlimited number of Class 1 Shares issuable in series and an unlimited number of Common Shares.”
| 4. | By-law No. 2 of the Corporation is hereby amended to add a new section 7 setting forth the rights, privileges, restrictions and conditions of the Class 1 Shares; |
| 5. | the submission of the foregoing amendments to By-law No. 2 of the Corporation to the shareholders of the Corporation entitled to vote thereon for approval at the next meeting of shareholders of the Corporation is hereby authorized and approved; and |
| 6. | the proper officers of the Corporation are hereby authorized to sign and deliver for and on behalf of the Corporation all such documents and instruments and to do all such other acts and things as may be necessary or desirable to give effect to the foregoing resolutions. |
SCHEDULE A
CLASS 1 SHARES
The Class 1 Shares shall have attached thereto the following rights, privileges, restrictions and conditions:
1.1 Directors’ Right to Issue in One or More Series
The Class 1 Shares may be issued at any time or from time to time in one or more series. Before any shares of a series are issued, the Board of Directors of the Corporation shall fix the
| | | | | | |
| | | | Manulife Financial Corporation Proxy Circular | | 1 |
number of shares that will form such series, if any, and shall, subject to any limitations set out in the by-laws of the Corporation or in the Act, determine the designation, rights, privileges, restrictions and conditions to be attached to the Class 1 Shares of such series, the whole subject to the filing with the Office of the Superintendent of Financial Institutions (Canada) of the particulars of such series, including the rights, privileges, restrictions and conditions determined by the Board of Directors of the Corporation.
1.2 Ranking of Class 1 Shares
Each Series of Class 1 Shares shall rank on a parity with every other series of Class 1 Shares and every series of Class A Shares with respect to dividends and return of capital. The Class 1 Shares shall be entitled to a preference over the Class B Shares, the Common Shares and any other shares ranking junior to the Class 1 Shares with respect to priority in payment of dividends and in the distribution of assets in the event of the liquidation, dissolution or winding-up of the Corporation, whether voluntary or involuntary, or any other distribution of the assets of the Corporation among its shareholders for the specific purpose of winding-up its affairs. If any cumulative dividends, whether or not declared, or declared non-cumulative dividends or amounts payable on return of capital are not paid in full in respect of any series of Class 1 Shares, the Class 1 Shares and Class A Shares of all series shall participate rateably in respect of such dividends in accordance with the sums that would be payable on such shares if all such dividends were declared and paid in full, and in respect of such return of capital in accordance with the sums that would be payable on such return of capital if all sums so payable were paid in full; provided, however, that if there are insufficient assets to satisfy in full all such claims as aforesaid, the claims of the holders of the Class 1 Shares and Class A Shares with respect to return of capital shall be paid and satisfied first and any assets remaining thereafter shall be applied towards the payment and satisfaction of claims in respect of dividends. The Class 1 Shares of any series may also be given such other preferences not inconsistent with the rights, privileges, restrictions and conditions attached to the Class 1 Shares as a class over the Class B Shares, the Common Shares and any other shares ranking junior to the Class 1 Shares as may be determined in the case of such series of Class 1 Shares.
1.3 Voting Rights
Except as hereinafter referred to or as required by law, holders of Class 1 Shares will not be entitled as such to receive notice of or to attend or to vote at any meeting of shareholders of the Corporation unless and until the first time at which the Board of Directors has not declared the dividend in full on the shares of one or more series of Class 1 Shares in respect of a particular period specified for the payment of dividends in the rights, privileges, restrictions and conditions attached to such series. In that event, the holders of such series will be entitled to receive notice of and to attend only meetings of shareholders at which directors are to be elected and will be entitled to one vote for each share of such series held at such meetings, but only in respect of the election of directors voting together with all other shareholders of the Corporation who are entitled to vote at such meetings, and the holders of such series will not be entitled to vote in respect of any other business conducted at such meetings (the “Voting Rights”). The Voting Rights of the
holders of any such series will cease on payment by the Corporation of the first dividend on that series to which the holders thereof are entitled under the rights, privileges, restrictions and conditions attached to such series after the time the Voting Rights first arose in respect of such series, until such time as the Corporation may again fail to declare the dividend in full on such series in any period specified for the payment of dividends in the rights, privileges, restrictions and conditions attached to such series, in which event the Voting Rights will become effective again and so on from time to time.
1.4 Constrained Shares
| (a) | The Corporation shall not issue or allot any Class 1 Shares to any person, or any entity controlled by a person, the Corporation shall refuse to allow the entry in the securities register of the Corporation of an issue or transfer of any Class 1 Shares to any person, or any entity controlled by a person, and no person or any entity controlled by a person, shall purchase or otherwise acquire any Class 1 Shares, if such issue, transfer or purchase or other acquisition would cause the person to have a significant interest in the Class 1 Shares. No person who has a significant interest in any class of shares of the Corporation, or entity controlled by a person who has a significant interest in any class of shares of the Corporation, shall, in person or by proxy, exercise any voting rights attached to Class 1 Shares beneficially owned by, or that are subject to agreement pertaining to the exercise of voting rights entered into by, that person or entity. In accordance with the authority granted to the Corporation’s Directors under the Act and the Regulations, the Directors of the Corporation are hereby authorized to make such arrangements as the Directors deem necessary to carry out the intent of the purchase or other acquisition, issue, transfer and voting restrictions contained in the Act, the Regulations and the by-laws. |
| (b) | If the purchase or other acquisition, issue, transfer or voting of any Class 1 Shares would be permitted under the Act and the Regulations, notwithstanding the provisions of subsection 1.4(a), the Directors are hereby authorized, in their discretion, to permit by resolution of the Directors, any such purchase or other acquisition, issue, transfer or exercise of voting rights with respect to such Class 1 Shares. |
| (c) | Subject to subsection 1.4(d), if, after the date of incorporation of the Corporation, the Share Constraint Regime is amended, replaced or deleted, such that the provisions of the subsection 1.4(a) are inconsistent with the Share Constraint Regime resulting from such amendment, replacement or deletion, then the Directors are hereby authorized to amend, replace or delete subsection 1.4(a) such that it will be consistent with the Share Constraint Regime then in effect. The action of the Board of Directors to amend, replace or delete subsection 1.4(a) shall be by resolution of the Board of Directors and such amendment, replacement or deletion of subsection 1.4(a) shall be effective without the approval of the holders of any of the Class 1 Shares, the Class A Shares, the Class B Shares or the Common Shares. Promptly following any amendment, replacement or deletion of subsection 1.4(a) by the Directors, the Corporation shall give notice to the holders of the Class 1 Shares of the amendment, replacement or deletion thereto. |
| | | | | | |
| 2 | | Manulife Financial Corporation Proxy Circular | | | | |
| (d) | If, after the date of incorporation of the Corporation, the Share Constraint Regime is amended or replaced and the Share Constraint Regime then in effect allows the Corporation to determine the application to it and its shareholders of all or any part of such Share Constraint Regime then the provisions of subsection 1.4(a) may only be amended or replaced with approval of the holders of the Class 1 Shares, the Class A Shares, the Class B Shares and the Common Shares as provided in the Act. |
1.5 Amendment With Approval of Holders of Class 1 Shares
The rights, privileges, restrictions and conditions attached to the Class 1 Shares as a class may be added to, changed or removed but only with the approval of the holders of the Class 1 Shares given as hereinafter specified.
1.6 Approval of Holders of Class 1 Shares
The approval of the holders of the Class 1 Shares to add to, change or remove any rights, privilege, restriction or condition attaching to the Class 1 Shares as a class or in respect of any other matter requiring the consent of the holders of the Class 1 Shares may be given in such manner as may then be required by law, subject to a minimum requirement that such approval be given by resolution signed by all the holders of the Class 1 Shares or passed by the affirmative vote of at least two-thirds (2/3) of the votes cast at a meeting of the holders of the Class 1 Shares duly called for that purpose. Notwithstanding anything else in this Section 1, the approval of the holders of the Class 1 Shares, voting separately as a class or series, is not required on a proposal to amend the by-laws of the Corporation to:
| (a) | increase or decrease the maximum number of authorized Class 1 Shares, or increase the maximum number of authorized shares of a class of shares having rights or privileges equal or superior to the Class 1 Shares; |
| (b) | effect the exchange, reclassification or cancellation of all or any part of the Class 1 Shares; or |
| (c) | create a new class of shares equal to or superior to the Class 1 Shares. |
The formalities to be observed with respect to the giving of notice of any such meeting or any continuation of an adjourned meeting, the quorum required therefor and the conduct thereof shall be those from time to time required by the Act as in force at the time of the meeting and those, if any, prescribed by the by-laws or the administrative resolutions of the Corporation with respect to meetings of shareholders. On every poll taken at every meeting of the holders of the Class 1 Shares as a class, or at any joint meeting of the holders of two or more series of Class 1 Shares, each holder of Class 1 Shares entitled to vote thereat shall have one vote in respect of each Class 1 Share held.
1.7 Notice to holders of Class 1 Shares
Any notice, cheque, notice of redemption or other communication from the Corporation herein provided for shall be sent to the holders of the Class 1 Shares by first class mail, postage prepaid at their respective addresses appearing on the securities register of the Corporation or, in the event of the address of any such holder not so appearing, then at the last address of such holder known to the Corporation. Accidental failure to give any such notice, notice of redemption or other communication to one or more holders of Class 1 Shares shall not affect the validity thereof, but, upon such failure being discovered, a copy of the notice, notice of redemption or other communication, as the case may be, shall be sent or delivered forthwith to such holder or holders. Unless otherwise provided herein, any notice, request, certificate, or other communication from a holder of Class 1 Shares herein provided for shall be either sent to the Corporation by first class mail, postage prepaid, or delivered by hand to the Corporation at its registered office.”
To be effective, this amendment must be confirmed by special resolution of the shareholders. This special resolution requires the affirmative vote of not less than two-thirds of the votes cast by holders of common shares present in person or represented by proxy. The Board of Directors recommends that shareholders vote in favour of this special resolution.
Special Resolution of Holders of Common Shares Confirming Amendments to By-Law No. 2 Creating
Class 1 Shares
RESOLVED THAT:
| 1. | The amendments to By-Law No. 2 of the Company creating a new class of shares designated as “Class 1 Shares” approved by the Board of Directors on February 25, 2009 are hereby confirmed. |
| 2. | The proper officers of the Company are hereby authorized to sign and deliver for and on behalf of the Company all such documents and instruments and to do all such other acts and things as may be necessary or desirable to give effect to the foregoing resolution. |
5. Shareholder Proposals
The shareholder proposals submitted for consideration by the shareholders at the Meeting are included in Schedule “C”.
Note: All figures reported in this Proxy Circular are in Canadian currency, unless otherwise indicated.
| | | | | | |
| | | | Manulife Financial Corporation Proxy Circular | | 3 |
Board Renewal and Director Selection
The Board of Directors commenced a renewal process (as disclosed in last year’s proxy circular), to nominate candidates to replace several Directors who will retire over the next four years, having reached the mandatory retirement age of 72. The Corporate Governance and Nominating Committee (the “Governance Committee”), in actively managing the renewal process, considered this an opportune time to engage in a complete review of the Director selection criteria to identify the ideal size and competencies that should be represented on a board of directors of a major global financial services organization. To ensure the smooth transition from the retiring Directors, including maintaining critical competencies, the size of the Board may temporarily increase to allow new Directors to be elected to the Board prior to the retirements being effective.
Due to the forthcoming vacancies, the increased complexity of the Company’s business and the current market, the Board of Directors is developing new selection criteria for director nominees, which will allow the Board over the next four years to: (i) have the flexibility to move quickly if excellent individuals meeting any of the requirements become available; (ii) deliberately recruit against these specifications; and (iii) use these requirements to prioritize and select potential candidates who may come to the Company through merger and acquisition activity.
In addition to having the basic characteristics of integrity, good judgment, financial knowledge, and sufficient time available, the Governance Committee recommended that new nominees have experience in such areas as Risk Management, Investments and Pan-Asia operations or governance. (See the Board Policies in Schedule “B” for the Director Succession and Selection Criteria and the mandatory retirement age policy.) The Governance Committee will retain one or more executive search firms, to assist in identifying qualified candidates who meet the revised selection criteria.
Two Directors will not be seeking re-election to the Board. Arthur Sawchuk retired on October 1, 2008 and his successor, Gail Cook-Bennett, was appointed as Chair of the Board on October 2, 2008. Dominic D’Alessandro will be retiring from his position as President and Chief Executive Officer in May 2009. Following an extensive succession planning process, the Board has selected Donald Guloien, Senior Executive Vice President and Chief Investment Officer to succeed Dominic D’Alessandro as President and Chief Executive Officer.
The Directors’ Matrix below is a combination of the previous and the revised selection criteria and reflects the current strengths of the Board as a whole.
Board of Directors’ Matrix
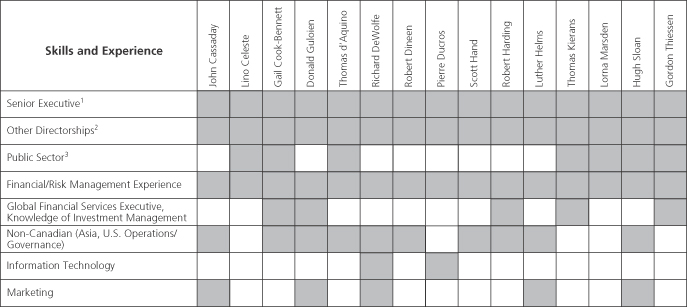
| 1 | Any senior officer or Chair of the Board of a major organization. |
| 2 | Director of a major organization (public, private, non-profit). |
| 3 | Including a Crown Corporation, educational institution, or any non-public, non-private organization. |
| | | | | | |
| 4 | | Manulife Financial Corporation Proxy Circular | | | | |
Nominees for the Board of Directors
The following individuals are the nominees for election to the Board. Important information regarding the nominees relating to committee memberships, meeting attendance, public board memberships and equity ownership is provided in the following charts. All successful nominees for the Board of Directors are elected for a term of one year, expiring at the next Annual Meeting.
Director Nominee Information
| | | | | | | | | | | | | | | |

Gail C.A. Cook-Bennett Age: 68 Toronto, ON Canada Director Since1: 1978 Independent2 | | Gail Cook-Bennett was appointed Chair of the Board on October 2, 2008. Gail Cook-Bennett is past Chair of the
Canada Pension Plan Investment Board, an investment management organization that invests the Canada Pension Plan
fund to help pay the benefits of 17 million Canadians who participate in the Plan, a position she held since 1998. Gail
Cook-Bennett holds a BA (Honours) from Carleton University and a PhD (Economics) from the University of Michigan.
She is a Member of the Order of Canada. She holds a Doctor of Laws Degree(honoris causa) from Carleton University
and is a Fellow of the Institute of Corporate Directors. |
| | Board/Committee Membership: | | Overall
Attendance3 :100% | | | Public Board Membership During Last Five Years: |
| | Board of Directors | | | | 13 of 13 | | 100% | | | Emera Inc. | | 2004 – Present |
| | Corporate Governance & Nominating (Chair)4 | | 6 of 64 | | 100% | | | Petro-Canada5 | | 1991 – Present |
| | Management Resources & Compensation | | 2 of 24 | | 100% | | | Transcontinental Inc. | | 1998 – 2004 |
| | Securities Held: |
| | Year | | Common
Shares6 | | DSUs7 | | Total Common
Shares and DSUs |
| | Total Market Value of Common Shares and DSUs8 | | Minimum Ownership Requirement9 |
| | 2009 | | 15,000 | | 8,831 | | 23,831 | | | $328,868 | | $300,000 |
| | 2008 | | 15,000 | | 8,546 | | 23,546 | | | $841,299 | |
| | Options Held (Director option grants discontinued in 2004): See chart “Outstanding Share-Based Awards” |
| | | | | | | | | | | | | | |

Donald A. Guloien Age: 51 Toronto, ON Canada Not Independent – Management | | Donald Guloien, a 28-year veteran of Manulife, will succeed Dominic D’Alessandro upon his election as President and
Chief Executive Officer on May 7, 2009. Mr. Guloien started his career at Manulife as a Senior Research Analyst,
Corporate Planning and is currently Senior Executive Vice President and Chief Investment Officer, a position he has held
since 2001. He is also Chairman and CEO of MFC Global Investment Management. Mr. Guloien holds a Bachelor of
Commerce from the University of Toronto. He is a former board member of Elliott & Page Limited, the Children’s Aid
Society Foundation, Think First Foundation of Canada, the Governing Council of the University of Toronto and LIMRA
International. Mr. Guloien is a member of the Young Presidents’ Organization and is actively involved with the Rotman
School of Management. He is a 1998 recipient of the Arbor Award for his contributions to the University of Toronto. |
| | Public Board Membership During Last Five Years: |
| | Seamark Asset Management Ltd. | | 2001 – 2006 |
| | Securities Held: |
| | Year | | Common
Shares6 | | DSUs7 | | Total Common
Shares and DSUs | | Total Market Value of Common Shares and DSUs8 | | Minimum Ownership Requirement9 |
| | 2009 | | 123,720 | | 160,686 | | 284,406 | | $3,924,803 | | See Executive Share Ownership Guidelines (page 27) |
| | Options Held: See “Statement of Executive Compensation” Section |
| | | | | | | | | | | | | | | |

John M. Cassaday Age: 55 Toronto, ON Canada Director Since1: 1993 Independent2 | | John Cassaday is President and Chief Executive Officer of Corus Entertainment Inc., a position he has held since 1999.
Corus is a Canadian leader in specialty television and radio and is a global leader in the production of children’s
animation. Mr. Cassaday has also been Executive Vice President of Shaw Communications, President and Chief
Executive Officer of Shaw Media, Star Choice Communications and of CTV Television Network. Mr. Cassaday has an
MBA (Dean’s List) from the Rotman School of Management at the University of Toronto. Mr. Cassaday is also active in
community affairs, principally with St. Michael’s Hospital. |
| | Board/Committee Membership: | | Overall
Attendance3 :100% | | | Public Board Membership During Last Five Years: |
| | Board of Directors | | | | 13 of 13 | | 100% | | | Corus Entertainment Inc. | | 1999 – Present |
| | Corporate Governance & Nominating | | 6 of 6 | | 100% | | | Sysco Corporation | | 2004 – Present |
| | Management Resources & Compensation | | 4 of 410 | | 100% | | | Loblaw Companies Limited | | 1997 – 2004 |
| | | | | | | | | Masonite International Corporation | | 1992 – 2005 |
| | Securities Held: |
| | Year | | Common
Shares6 | | DSUs7 | | Total Common
Shares and DSUs |
| | Total Market Value of Common Shares and DSUs8 | | Minimum Ownership Requirement9 |
| | 2009 | | 40,000 | | 34,751 | | 74,751 | | | $1,031,564 | | $300,000 |
| | 2008 | | 40,000 | | 28,368 | | 68,368 | | | $2,442,789 | |
| | | Options Held (Director option grants discontinued in 2004): See chart “Outstanding Share-Based Awards” |
| | | | | | |
| | | | Manulife Financial Corporation Proxy Circular | | 5 |
| | | | | | | | | | | | | | | |

Lino J. Celeste Age: 71 Saint John, NB Canada Director Since1: 1994 Independent2 | | Lino Celeste is past Chairman of Aliant Inc., the merged Atlantic provinces telephone companies. Prior to assuming the
Chairmanship, Mr. Celeste was President and Chief Executive Officer of New Brunswick Telephone Company Limited.
Mr. Celeste holds a P.Eng. (Electrical Engineering) from the University of New Brunswick. He also served as a director of
New Brunswick Electric Power Commission and as Chairman of the Greater Saint John Community Foundation, a
charitable organization. |
| | Board/Committee Membership: | | Overall
Attendance3: 100% | | | Public Board Membership During Last Five Years: |
| | Board of Directors | | | | 13 of 13 | | 100% | | | None | | |
| | Audit & Risk Management | | 6 of 6 | | 100% | | | | | |
| | Conduct Review & Ethics | | 3 of 3 | | 100% | | | | | |
| | Securities Held: |
| | Year | | Common
Shares6 | | DSUs7 | | Total Common
Shares and DSUs |
| | Total Market Value of Common Shares and DSUs8 | | Minimum Ownership Requirement9 |
| | 2009 | | 12,600 | | 19,022 | | 31,622 | | | $436,384 | | $300,000 |
| | 2008 | | 12,600 | | 15,655 | | 28,255 | | | $1,009,551 | |
| | Options Held (Director option grants discontinued in 2004): See chart “Outstanding Share-Based Awards” |
| | | | | | | | | | | | | | | |

Thomas P. d’Aquino Age: 68 Ottawa, ON Canada Director Since1: 2005 Independent2 | | Thomas d’Aquino is Chief Executive and President of the Canadian Council of Chief Executives (“CCCE”), a research
and advocacy group composed of 150 chief executives of Canada’s leading enterprises. Mr. d’Aquino holds a BA from
the University of British Columbia, an LLB from Queen’s University and the University of British Columbia, an LLM from
the University of London and Doctor of Laws honorary degree from Queen’s University and Wilfrid Laurier University.
Mr. d’Aquino has served as Special Assistant to the Prime Minister of Canada and a Professor Adjunct on the law of
international business transactions. As well as CEO, he is the CCCE’s chief policy officer and strategist responsible for
fiscal, taxation, competitiveness, international trade and environmental issues. He is currently Chair of Lawrence
National Centre for Policy and Management at the Richard Ivey School of Business and he also chairs The National
Gallery of Canada Foundation. |
| | Board/Committee Membership: | | Overall
Attendance3: 95% | | | Public Board Membership During Last Five Years: |
| | Board of Directors | | | | 12 of 13 | | 92% | | | CGI Inc. | | 2006 – Present |
| | Audit & Risk Management | | 4 of 410 | | 100% | | | | | |
| | Conduct Review & Ethics | | 2 of 210 | | 100% | | | | | |
| | Management Resources & Compensation | | 2 of 210 | | 100% | | | | | |
| | Securities Held: |
| | Year | | Common
Shares6 | | DSUs7 | | Total Common
Shares and DSUs |
| | Total Market Value of Common Shares and DSUs8 | | Minimum Ownership Requirement9 |
| | 2009 | | 6,190 | | 17,330 | | 23,520 | | | $324,576 | | $300,000 |
| | 2008 | | 6,190 | | 11,454 | | 17,644 | | | $630,420 | |
| | Options Held (Director option grants discontinued in 2004): Nil |
| | | | | | | | | | | | | | | |

Richard B. DeWolfe11 Age: 65 Westwood, MA U.S.A. Director Since1: 2004 Independent2 | | Richard DeWolfe is Managing Partner of DeWolfe & Company, LLC, a real estate management and investment
consulting firm. Mr. DeWolfe holds a BAS, Marketing and Finance from Boston University. He is also a director of The
Boston Foundation; Trustee of Boston University; Trustee of the 17136 Marine Biological Laboratory; and an honorary
director of The Boston Center for Community and Justice. He was formerly Chairman and CEO of The DeWolfe
Companies, Inc., the largest homeownership organization in New England, which was previously listed on the
American Stock Exchange and acquired by Cendant Corporation in 2002. Mr. DeWolfe was formerly Chairman and
Founder of Reliance Relocations Services, Inc. and was formerly Chairman of the Board of Trustees, Boston University. |
| | Board/Committee Membership: | | Overall Attendance3: 100% | | | Public Board Membership During Last Five Years: |
| | Board of Directors | | | | 13 of 13 | | 100% | | | Avantair, Inc. | | 2009 – Present |
| | Audit & Risk Management (Chair) | | 6 of 6 | | 100% | | | John Hancock Financial Services, Inc. | | 2002 – 2004 |
| | Conduct Review & Ethics | | 3 of 3 | | 100% | | | | | |
| | Corporate Governance & Nominating | | 1 of 112 | | 100% | | | | | |
| | Securities Held: |
| | Year | | Common
Shares6 | | DSUs7 | | Total Common
Shares and DSUs |
| | Total Market Value of Common Shares and DSUs8 | | Minimum Ownership Requirement9 |
| | 2009 | | 14,000 | | 29,992 | | 43,992 | | | $607,090 | | $300,000 |
| | 2008 | | 14,000 | | 21,424 | | 35,424 | | | $1,265,700 | |
| | | Options Held (Director option grants discontinued in 2004): Nil |
| | | | | | |
| 6 | | Manulife Financial Corporation Proxy Circular | | | | |
| | | | | | | | | | | | | | | |

Robert E. Dineen, Jr. Age: 68 New York, NY U.S.A. Director Since1: 1999 Independent2 | | Robert Dineen was Of Counsel to Shearman & Sterling LLP, a leading international law firm headquartered in New York
where he was a partner from 1974 until his retirement in December 2005. Mr. Dineen holds a BA from Brown
University and an LLB from Syracuse University. Mr. Dineen led several of the firm’s corporate groups, including groups
in Latin America and Asia and its project finance work worldwide. Mr. Dineen has extensive experience in public
finance transactions in the oil and gas pipeline business, and as a specialist in U.S. and international private banking
and financial transactions. |
| | Board/Committee Membership: | | Overall
Attendance3: 100% | | | Public Board Membership During Last Five Years: |
| | Board of Directors | | | | 13 of 13 | | 100% | | | Nova Chemicals Corporation | | 1998 – Present |
| | Audit & Risk Management | | 6 of 6 | | 100% | | | | | |
| | Conduct Review & Ethics | | 3 of 3 | | 100% | | | | | |
| | Securities Held: |
| | Year | | Common
Shares6 | | DSUs7 | | Total Common
Shares and DSUs |
| | Total Market Value of Common Shares and DSUs8 | | Minimum Ownership Requirement9 |
| | 2009 | | 29,000 | | 33,513 | | 62,513 | | | $862,679 | | $300,000 |
| | 2008 | | 29,000 | | 32,429 | | 61,429 | | | $2,194,858 | |
| | Options Held (Director option grants discontinued in 2004): See chart “Outstanding Share-Based Awards” |
| | | | | | | | | | | | | | | |

Pierre Y. Ducros Age: 69 Montreal, QC Canada Director Since1: 1999 Independent2 | | Pierre Ducros is President of P. Ducros & Associates Inc. in Montréal. Previously, he was Chairman, President and Chief
Executive Officer of DMR Group Inc. which he co-founded in 1973, and Vice-Chairman of the Task Force on The Future
of The Canadian Financial Services Sector (MacKay Task Force). Mr. Ducros holds a BA from the Université de Paris at
Collège Stanislas in Montréal and a B.Eng. (Communications) from McGill University. |
| | Board/Committee Membership: | | Overall
Attendance3: 86% | | | Public Board Membership During Last Five Years: |
| | Board of Directors | | | | 11 of 13 | | 85% | | | Rona Inc. | | 2005 – Present |
| | Corporate Governance & Nominating | | 4 of 512 | | 80% | | | Telus | | 2005 – Present |
| | Management Resources & Compensation | | 4 of 410 | | 100% | | | Cognos Incorporated13 | | 1986 – 2008 |
| | | | | | | | | | | Emergis Inc. | | 1998 – 2008 |
| | | | | | | | | | | eNGENUITY Technologies Inc. | | 2002 – 2005 |
| | | | | | | | | | | Nstein Technologies Inc. | | 2002 – 2006 |
| | Securities Held: |
| | Year | | Common
Shares6 | | DSUs7 | | Total Common
Shares and DSUs |
| | Total Market Value of Common Shares and DSUs8 | | Minimum Ownership Requirement9 |
| | 2009 | | 55,600 | | 31,920 | | 87,520 | | | $1,207,776 | | $300,000 |
| | 2008 | | 55,600 | | 28,310 | | 83,910 | | | $2,998,104 | |
| | Options Held (Director option grants discontinued in 2004): See chart “Outstanding Share-Based Awards” |
| | | | | | | | | | | | | | | |

Scott M. Hand Age: 66 Toronto, ON Canada Director Since1: 2007 Independent2 | | Scott Hand was the Chairman and Chief Executive Officer of Inco Limited (“Inco”) from April 2002 until he retired in
January 2007. Prior to that, Mr. Hand was the President of Inco and held positions in Strategic Planning, Business
Development and Law. Inco has been a major global Canadian-based resources enterprise and a leading producer and
marketer of nickel and other metals. Mr. Hand serves on the boards of Juno Special Situations Corporation (mining
resource investment) and Boyd Technologies LLC (paper non-woven materials). He is also a member of the board of
directors of the World Wildlife Fund Canada. Mr. Hand received a BA from Hamilton College and a JD from Cornell
University. |
| | Board/Committee Membership: | | Overall
Attendance3: 95% | | | Public Board Membership During Last Five Years: |
| | Board of Directors | | 12 of 13 | | 92% | | | Fronteer Development Group Inc. | | 2007 – Present |
| | Audit & Risk Management | | 2 of 210 | | 100% | | | Inco Limited | | 1991 – 2007 |
| | Conduct Review & Ethics | | 1 of 110 | | 100% | | | Independence Community Bank Corp. | | 1987 – 2006 |
| | Management Resources & Compensation | | 4 of 410 | | 100% | | | | |
| | Securities Held: |
| | Year | | Common
Shares6 | | DSUs7 | | Total Common
Shares and DSUs |
| | Total Market Value of Common Shares and DSUs8 | | Minimum Ownership Requirement by 20129 |
| | 2009 | | 30,000 | | 3,918 | | 33,918 | | | $468,068 | | $300,000 |
| | 2008 | | 20,000 | | 1,242 | | 21,242 | | | $758,977 | |
| | Options Held (Director option grants discontinued in 2004): Nil |
| | | | | | |
| | | | Manulife Financial Corporation Proxy Circular | | 7 |
| | | | | | | | | | | | | | | | |

Robert J. Harding Age: 51 Toronto, ON Canada Director Since1: 2008 Independent2 | | Robert Harding is Chairman of Brookfield Asset Management Inc., a position he has held since 1997. He has held
various executive positions with Brookfield (and its predecessor companies) since 1984, including Chief Financial Officer
and President and Chief Executive Officer. In his role as Chairman, Mr. Harding represents Brookfield’s interests on the
boards of its various affiliates as a director and Chairman of Norbord Inc. and as a director of Fraser Papers Inc. and
Western Forest Products Limited. Brookfield Asset Management is a specialist asset management company focused on
property, power and other infrastructure assets. Mr. Harding holds a B. Mathematics and a Doctor of Laws honorary
degree from the University of Waterloo and is a Fellow of the Institute of Chartered Accountants. He is Chair of the
Board of Governors of the University of Waterloo, Chair of the Board of Trustees for the United Way of Greater
Toronto, a member of the Board of Trustees for the Hospital for Sick Children and a trustee for the Art Gallery of
Ontario. |
| | Board/Committee Membership: | | Overall
Attendance3: 86% | | | Public Board Membership During Last Five Years: |
| | Board of Directors | | | | 2 of 3 | 14 | | 67% | | | Brookfield Asset Management Inc. | | 1992 – Present |
| | Audit & Risk Management | | | | 3 of 3 | 14 | | 100% | | | Fraser Papers Inc. | | 2004 – Present |
| | Conduct Review & Ethics | | 1 of 1 | 14 | | 100% | | | Norbord Inc. | | 1998 – Present |
| | | | | | | | | | | | | | Western Forest Products Inc. | | 2006 – Present |
| | | | | | | | | | | | | | BPO Properties Inc. | | 1999 – 2004 |
| | | | | | | | | | | | | | Burlington Resources Inc. | | 2002 – 2006 |
| | | | | | | | | | | | | | Falconbridge Ltd. | | 2000 – 2005 |
| | | | | | | | | | | | | | Noranda Inc. | | 1995 – 2005 |
| | Securities Held: |
| | Year | | Common
Shares6 | | DSUs7 | | Total Common
Shares and DSUs |
| | Total Market Value of Common Shares and DSUs8 | | Minimum Ownership Requirement by 20139 |
| | 2009 | | 16,000 | | 2,027 | | 18,027 | | | $248,773 | | $300,000 |
| | Options Held (Director option grants discontinued in 2004): Nil |
| | | | | | | | | | | | | | | |

Luther S. Helms Age: 65 Scottsdale, AZ U.S.A. Director Since1: 2007 Independent2 | | Luther Helms has been the Managing Director of Sonata Capital Group (“Sonata”) since 2000. Sonata is a
privately-owned registered investment advisory firm. Mr. Helms has extensive banking and financial services experience,
holding various positions at Bank of America Corporation, including Vice Chairman from 1993-1998 and was the Vice
Chairman of KeyBank from 1998-2000. Mr. Helms was a director of Lifelock, an identity theft protection company.
Mr. Helms has an MBA from the University of Santa Clara and a BA in History and Economics from the University of
Arizona. |
| | Board/Committee Membership: | | Overall
Attendance3: 100% | | | Public Board Membership During Last Five Years: |
| | Board of Directors | | | | 13 of 13 | | 100% | | | ABM Industries Incorporated | | 1995 – Present |
| | Audit & Risk Management | | 6 of 6 | | 100% | | | | | |
| | Conduct Review & Ethics | | 3 of 3 | | 100% | | | | | |
| | Securities Held: |
| | Year | | Common
Shares6 | | DSUs7 | | Total Common
Shares and DSUs |
| | Total Market Value of Common Shares and DSUs8 | | Minimum Ownership Requirement by 20129 |
| | 2009 | | 2,100 | | 9,086 | | 11,186 | | | $154,367 | | $300,000 |
| | 2008 | | 2,100 | | 2,610 | | 4,710 | | | $168,288 | |
| | Options Held (Director option grants discontinued in 2004): Nil |
| | | | | | | | | | | | | | | |

Thomas E. Kierans15 Age: 68 Toronto, ON Canada Director Since1: 1990 Independent2 | | Thomas Kierans is Chair of Council and Vice President of the Social Sciences and Humanities Research Council. Mr.
Kierans holds a BA (Honours) from McGill University and an MBA (Finance), Dean’s Honours List, from the University of
Chicago. Mr. Kierans has also been Chairman of The Canadian Journalism Foundation, Chairman of CSI-Global
Education Inc., Chairman of the Canadian Institute for Advanced Research, Chairman of the Board of the Toronto
International Leadership Centre for Financial Sector Supervisors, Chairman of Moore Corporation Limited, Chairman of
Petro-Canada, President and Chief Executive Officer of the C.D. Howe Institute and President of McLeod Young Weir
Limited (later ScotiaMcLeod Inc.). |
| | Board/Committee Membership: | | Overall
Attendance3: 96% | | | Public Board Membership During Last Five Years: |
| | Board of Directors | | | | 12 of 13 | | 92% | | | Petro-Canada5 | | 1991 – Present |
| | Audit & Risk Management | | 6 of 6 | | 100% | | | BCE Inc. | | 1999 – 2004 |
| | Conduct Review & Ethics (Chair) | | 3 of 3 | | 100% | | | Inmet Mining Corporation | | 1996 – 2004 |
| | Corporate Governance & Nominating | | 6 of 6 | | 100% | | | Telesat Canada | | 1999 – 2004 |
| | Securities Held: |
| | Year | | Common
Shares6 | | DSUs7 | | Total Common
Shares and DSUs |
| | Total Market Value of Common Shares and DSUs8 | | Minimum Ownership Requirement9 |
| | 2009 | | 61,376 | | 0 | | 61,376 | | | $846,989 | | $300,000 |
| | 2008 | | 61,376 | | 0 | | 61,376 | | | $2,192,964 | |
| | Options Held (Director option grants discontinued in 2004): See chart “Outstanding Share-Based Awards” |
| | | | | | |
| 8 | | Manulife Financial Corporation Proxy Circular | | | | |
| | | | | | | | | | | | | | | |

Lorna R. Marsden Age: 67 Toronto, ON Canada Director Since1: 1995 Independent2 | | Lorna Marsden is President Emerita and Professor of York University. Prior to her retirement in May 2007, she was
President and Vice-Chancellor and a member of the Board of Governors of York University. Dr. Marsden was President
and Vice-Chancellor of Wilfrid Laurier University and served as a member of the Senate of Canada. Dr. Marsden holds a
BA from the University of Toronto and a PhD from Princeton University. She is a recipient of honorary Doctor of Laws
degrees from the University of New Brunswick, the University of Winnipeg, Queen’s University and the University of
Toronto. Dr. Marsden serves as a director of several private and non-profit organizations. Dr. Marsden was appointed
to the Order of Ontario in 2009. |
| | Board/Committee Membership: | | Overall
Attendance3: 100% | | | Public Board Membership During Last Five Years: |
| | Board of Directors | | | | 13 of 13 | | 100% | | | SNC-Lavalin Group Inc. | | 2006 – Present |
| | Management Resources & Compensation | | 6 of 6 | | 100% | | | | | |
| | Securities Held: |
| | Year | | Common
Shares6 | | DSUs7 | | Total Common
Shares and DSUs |
| | Total Market Value of Common Shares and DSUs8 | | Minimum Ownership Requirement9 |
| | 2009 | | 38,664 | | 17,529 | | 56,193 | | | $775,463 | | $300,000 |
| | 2008 | | 38,664 | | 14,455 | | 53,119 | | | $1,897,942 | |
| | Options Held (Director option grants discontinued in 2004): See chart “Outstanding Share-Based Awards” |
| | | | | | | | | | | | | | | |

Hugh W. Sloan, Jr. Age: 68 Bloomfield Village, MI
U.S.A. Director Since1: 1985 Independent2 | | Hugh Sloan is Retired Deputy Chairman of Woodbridge Foam Corporation, a manufacturer of automobile parts, where
he held various management positions for more than 20 years. Mr. Sloan holds a BA (Honours) from Princeton
University. Mr. Sloan serves as a director of a number of Canadian and American corporate, community and charitable
organizations. He is a former Staff Assistant to President Richard Nixon and a former Trustee of Princeton University. |
| | Board/Committee Membership: | | Overall
Attendance3: 100% | | | Public Board Membership During Last Five Years: |
| | Board of Directors | | | | 13 of 13 | | 100% | | | Spartan Motors, Inc. | | 2007 – Present |
| | Corporate Governance & Nominating | | 6 of 6 | | 100% | | | Wescast Industries Inc. | | 1998 – Present |
| | Management Resources & Compensation10 | | 6 of 6 | | 100% | | | Virtek Vision International, Inc. | | 2000 – 2005 |
| | Securities Held: |
| | Year | | Common
Shares6 | | DSUs7 | | Total Common Shares and DSUs | | | Total Market Value of Common Shares and DSUs8 | | Minimum Ownership Requirement9 |
| | 2009 | | 14,420 | | 26,047 | | 40,467 | | | $558,445 | | $300,000 |
| | 2008 | | 14,420 | | 22,010 | | 36,430 | | | $1,301,644 | |
| | | | | | | | | | | | |
| | Options Held (Director option grants discontinued in 2004): See chart “Outstanding Share-Based Awards” |
| | | | | | | | | | | | | | | |

Gordon G. Thiessen Age: 70 Ottawa, ON Canada Director Since1: 2002 Independent2 | | Gordon Thiessen joined the Board following a distinguished career with the Bank of Canada that began in 1963 and
culminated in a seven-year term as the Bank’s Governor. He was Chairman of the Canadian Public Accountability
Board, the oversight body for the auditing profession in Canada from 2002 to 2008. Mr. Thiessen holds a BA (Honours)
and an MA from the University of Saskatchewan and a PhD from the London School of Economics. Mr. Thiessen also
serves as a director of the Institute for Research on Public Policy. |
| | Board/Committee Membership: | | Overall
Attendance3: 90% | | | Public Board Membership During Last Five Years: |
| | Board of Directors | | | | 11 of 13 | | 85% | | | IPSCO Inc. | | 2001 – 2007 |
| | Corporate Governance & Nominating | | 1 of 112 | | 100% | | | | | |
| | Management Resources & Compensation (Chair)10 | | 6 of 6 | | 100% | | | | | |
| | Securities Held: |
| | Year | | Common
Shares6 | | DSUs7 | | Total Common Shares and DSUs | | | Total Market Value of Common Shares and DSUs8 | | Minimum Ownership Requirement9 |
| | 2009 | | 1,000 | | 26,804 | | 27,804 | | | $383,695 | | $300,000 |
| | 2008 | | 1,000 | | 23,131 | | 24,131 | | | $862,201 | |
| | Options Held (Director option grants discontinued in 2004): See chart “Outstanding Share-Based Awards” |
1 | “Director Since” refers to the year the Director was first elected to either the Board of the Company or Manufacturers Life. When Manufacturers Life demutualized in 1999, it became a wholly-owned subsidiary of the Company. |
2 | “Independent” refers to the standards of independence established under Section 303A.02 of the New York Stock Exchange Listed Company Manual, Section 301 of SOX, Section 1.2 of Canadian Securities Administrators’ (“CSA”) National Instrument 58-101 – Disclosure of Corporate Governance Practices and Section 1.4 of the CSA National Instrument 52-110 – Audit Committees. The Board, in its annual review of Director independence, considers employment status of the Director (and his or her spouse and children, if applicable), other board memberships, Company shareholdings and business relationships, to determine whether there are any circumstances which might interfere with a Director’s ability to exercise independent judgment. |
3 | It is the policy of the Company that Directors attend the Annual Meeting and all meetings of the Board and its committees on which they sit, unless circumstances make it impossible to do so. |
| | | | | | |
| | | | Manulife Financial Corporation Proxy Circular | | 9 |
4 | At the Board meeting on May 8, 2008, Gail Cook-Bennett resigned from the Management Resources and Compensation Committee. On October 2, 2008, Gail Cook-Bennett was appointed Chair of the Board. The Chair of the Board is also Chair of the Corporate Governance and Nominating Committee. As Vice-Chair and then as Chair of the Board, Gail Cook-Bennett was invited to attend all other Committee meetings at the invitation of the Chair of each committee. |
5 | Gail Cook-Bennett and Thomas Kierans also serve together on the board (but not on any of the same committees) of Petro-Canada. No other Directors serve on the same board of directors other than the Board of Directors of the Company and the Board of Directors of Manufacturers Life. |
6 | “Common Shares” refers to the number of Common Shares beneficially owned, or over which control or direction is exercised by the Director, as of March 17, 2009 and March 18, 2008, respectively. |
7 | “DSUs” refers to the number of deferred share units held by the Director as of March 17, 2009 and March 18, 2008, respectively. |
8 | The “Total Market Value of Common Shares and DSUs” is determined by multiplying the closing price of the Common Shares on the Toronto Stock Exchange (“TSX”) on each of March 17, 2009 ($13.80) and March 18, 2008 ($35.73), respectively, times the number of Common Shares and DSUs outstanding as of March 17, 2009 and March 18, 2008. |
9 | All Directors are required to hold an equity position in the Company having a minimum value of $300,000 within five years of joining the Board. Common and preferred shares and DSUs are considered equity for this purpose, but stock options are not. Directors must take 50% of the Board Retainer in DSUs until the minimum threshold is met. Directors’ share ownership will be valued using the higher of grant price or current market price for the purposes of meeting the share ownership guidelines. This measure was introduced on an interim basis due to the extreme volatility of market conditions and the significant reduction in the Company’s Common Share price (see Schedule “A” Statement of Corporate Governance Practices – Director Share Ownership). The minimum required for Donald Guloien, as President and CEO, will be equal to seven times his base salary (see “Compensation Discussion and Analysis – Executive Share Ownership Guidelines”). Mr. Guloien currently meets this requirement. |
10 | At the Board meeting on May 8, 2008: John Cassaday, Pierre Ducros and Scott Hand were appointed to the Management Resources and Compensation Committee (Mr. Hand resigned from the Audit and Risk Management Committee and the Conduct Review and Ethics Committee); Gordon Thiessen was appointed Chair of the Management Resources and Compensation Committee (Hugh Sloan resigned as Chair of the Committee); and Thomas d’Aquino was appointed to the Audit and Risk Management Committee and the Conduct Review and Ethics Committee (Mr. d’Aquino resigned from the Management Resources and Compensation Committee). |
11 | Richard DeWolfe was a director of Response U.S.A., Inc. until October 2000. In May 2001, Response U.S.A., Inc. commenced proceedings under applicable bankruptcy statutes in the United States. |
12 | At the Board Meeting on November 6, 2008, Pierre Ducros resigned from the Corporate Governance and Nominating Committee. Richard DeWolfe and Gordon Thiessen were appointed to the Corporate Governance and Nominating Committee effective December 1, 2008. |
13 | Pierre Ducros was a director of Cognos Incorporated (“Cognos”) during the period from November 2005 to July 2006, during which time the United States Securities and Exchange Commission (“SEC”) conducted a review of the revenue recognition policy used by Cognos in its periodic reports. During the course of the SEC review, Cognos delayed filing its financial statements. As a result of this filing delay, the Ontario Securities Commission (“OSC”) imposed a management and insider cease trade order against Cognos on June 14, 2006. The SEC review was concluded in July 2006 without objection to Cognos’ revenue recognition policy. The management and cease trade order imposed by the OSC was lifted on August 4, 2006, two full business days after Cognos filed its delayed financial statements with the OSC. |
14 | Robert Harding was appointed to the Board of Directors at the Board Meeting on August 7, 2008 which appointment became effective October 2, 2008. While the Board requires 100% attendance except in unusual circumstances, it also recognizes that when a Director first joins a Board, there may be pre-existing commitments that cannot be re-arranged. The Board accepts these conditions, particularly in situations where a highly skilled candidate becomes available to join the Board as was the case with Mr. Harding. Mr. Harding advised the Board, prior to his appointment, of certain conflicts which would prevent him from attending certain Board and Committee meetings during his first two years as a Director. |
15 | Thomas Kierans was a director of Teleglobe Inc. during the period from December 2000 until April 23, 2002. On May 15, 2002, Teleglobe Inc. announced that it had obtained creditor protection under theCompanies Creditors Arrangement Act (Canada) and that it had initiated ancillary filings in the United States and the United Kingdom. |
| | | | | | |
| 10 | | Manulife Financial Corporation Proxy Circular | | | | |
Schedule “A” – Statement of Corporate Governance Practices
The corporate governance practices of Manulife Financial Corporation (the “Company”) meet or exceed the standards set out in the Insurance Companies Act (Canada) (“Insurance Companies Act”), Canadian Securities Administrators’ Multilateral Instrument 52-109 (the “Certification Instrument”), Canadian Securities Administrators’ National Instrument 52-110 – Audit Committees (the “Audit Committee Instrument”) and the corporate governance standards and disclosure requirements in Canadian Securities Administrators’ National Policy 58-201 – Corporate Governance Guidelines and National Instrument 58-101 – Disclosure of Corporate Governance Practices (the “Governance Instrument”). The Company’s corporate governance practices also comply with applicable requirements of the Sarbanes-Oxley Act of 2002 (“SOX”), including any U.S. Securities and Exchange Commission (“SEC”) rules under SOX, and in all material respects with the domestic issuer standards of the New York Stock Exchange Corporate Governance Rules (the “NYSE Rules”).
The following Statement of Corporate Governance Practices highlights various elements of the Company’s corporate governance program.
Mandate of the Board of Directors
The Board of Directors of the Company is responsible for the stewardship of the Company and for the supervision of the management of the business and affairs of the Company. The Board’s general responsibilities are set out in the Board Mandate and the Board Policies. The Mandate of the Board and the Board Policies are attached as Schedule “B”. The Mandate of the Board and the Board Policies are on the Corporate Governance page of the Company’s website and are available upon request from the Corporate Secretary.
Independence of the Board
The Board has established the policy that at least a majority of Directors must satisfy the applicable independence requirements of the laws governing the Company, the stock exchanges on which the Company’s securities are listed and applicable securities regulatory authorities. The Board annually reviews and makes a determination as to the independence of each Director. The Board reviews the Directors’ employment status (and the Director’s spouse and children, as applicable), other board memberships, Company shareholdings and business relationships to determine whether there are any circumstances which might interfere with a Director’s ability to exercise independent judgment.
The Board has determined that 14 of the 15 current members of the Board are independent under Section 303A.02 of the NYSE Rules, Section 301 of SOX, Section 1.2 of the Governance Instrument and Section 1.4 of the Audit Committee Instrument. Dominic D’Alessandro is not independent because he is the Company’s President and CEO. Upon successful election to the Board of Directors, Donald Guloien will not be independent as he will succeed Dominic D’Alessandro as the President and CEO.
Independence of the Chair of the Board
| n | | The positions of the Chair and the CEO are separate. |
| n | | The Chair is an independent Director. |
| n | | The Chair’s mandate provides that the Chair is accountable for ensuring that the Board carries out its responsibilities effectively and separately from management. |
| n | | The Chair’s principal accountabilities include managing the affairs of the Board, developing the composition, structure and renewal of the Board, guiding the Board’s deliberations on strategic and policy matters and ensuring proper oversight by the Board is exercised. |
Nomination of Directors
The Corporate Governance and Nominating Committee (the “Governance Committee”) is responsible for identifying qualified candidates for nomination to the Board. The Governance Committee:
| n | | Develops and recommends to the Board criteria for the selection of new Directors, periodically reviews the criteria adopted by the Board and recommends changes to such criteria, which includes professional experience and personal characteristics. |
| n | | Maintains a Directors’ Matrix identifying the desired competencies, expertise, skills, background and personal qualities of the Directors and potential candidates. |
| n | | Annually reviews the skills, areas of expertise, backgrounds, independence and qualifications of the members of the Board. |
| n | | Identifies and recommends to the Board individuals qualified and suitable to become Board members, taking into consideration any gaps identified in the Directors’ Matrix. |
| n | | Maintains an evergreen list of suitable candidates for the Board who the Governance Committee believes meet the identified criteria and whose skills and characteristics complement the existing mix. The Chair is responsible for approaching Board candidates. Candidates meet with the Chair and the CEO prior to nomination or appointment to review expected contributions and commitment requirements. |
| n | | Directors must retire at 72 and may not be nominated for re-election. |
The Board will consider a nomination of a candidate for the Company’s Board of Directors from a shareholder that is submitted in accordance with the Insurance Companies Act.A proper nomination must be submitted by shareholder proposal, signed by one or more registered or beneficial holders of shares representing in aggregate not less than five percent of the shares of the Company entitled to vote at the meeting to which the proposal is being submitted.
Majority Election of Directors Policy
The Governance Committee’s Majority Election of Directors Policy, provides that Director nominees who do not receive a majority of votes in favour in an uncontested election will be required to immediately submit their resignation to the Govern-
| | | | | | |
| | | | Manulife Financial Corporation Proxy Circular | | 11 |
ance Committee. The Board will, in the absence of extenuating circumstances, accept the resignation within 90 days of the Annual Meeting and issue a press release confirming the Director’s resignation or the reason for not accepting it. In filling the vacancy resulting from a Director resignation, the Directors may appoint a new Director whom the Board considers will have the confidence of the shareholders or call a special meeting of shareholders to elect a Director or wait until the next Annual Meeting.
Position Descriptions for Chair, Committee Chairs, CEO and Individual Directors
The Board has developed position descriptions outlining the accountabilities for the Chair, the Chairs of Board committees, the CEO and the individual Directors. The position descriptions can be found on the Corporate Governance page of the Company’s website or can be obtained by contacting the Corporate Secretary.
Director Education and Orientation
The Company provides an education program for all Directors, including a detailed orientation program for new Directors, which incorporates the following:
| n | | New Directors are provided with detailed information about the Company, including its business strategies, corporate information, structure and the roles and expectations of the Board and individual Directors. |
| n | | New Directors receive a manual which provides information about the Company, including the Annual Information Form, the Proxy Circular, Annual Report, Manufacturers Life’s Report to Policyholders, organizational information about the Board and its meetings and the Directors’ information requirements required pursuant to applicable insurance and securities regulations. |
| n | | New independent Directors are initially appointed to the Audit Committee as part of the Directors’ orientation to the Company’s business. As an Audit Committee member, the Director will be exposed to all aspects of the financial and risk management elements of the Company. This is intended to assist the new independent Directors in learning the business model more quickly. All Directors have a standing invitation to attend committee meetings and new Directors are encouraged to do so to assist in their orientation. |
| n | | New Directors meet with the Chair, the CEO and other members of management to discuss the Company’s strategies, operations and functions. |
| n | | The Directors’ Orientation materials include the positions descriptions, the Board Mandate, Board Policies, committee charters, the regulatory compliance program, by-laws, administrative resolutions, Directors’ policies, Company policies, the Code of Business Conduct and Ethics and organization charts. |
| n | | Directors’ seminars and divisional presentations to the Board to provide in-depth reviews of key businesses and functions. In 2008, seminars included: Alternative Asset Class Management; U.S. Regulation; Pay and Performance; and Update on the Current Financial Condition and Regulatory Capital Provisions. |
| n | | On-site visits to the Company’s operations scheduled in conjunction with a Board meeting. On-site meetings incorporate senior management presentations on the business divisions’ strategies and operations. In 2008 the Directors visited the Company’s United States operations in Boston, Massachusetts. |
| n | | In 2008, all Directors were members of the Institute of Corporate Directors, a recognized educational organization for directors to enhance their knowledge of directors’ responsibilities and current governance trends. |
| n | | Directors may seek additional professional development education at the expense of the Company. In 2008, certain Directors continued to be members of organizations relating to human resources and women on boards and attended a conference for directors on board compensation issues. |
Board Access to Management
The Company provides both formal and informal means for the Board to interact with management. Directors have access to management and are encouraged to raise any questions or concerns directly with management.
Board Committee Membership Standards
The Board relies on its committees to assist in fulfilling its mandate and meet its responsibilities. Committees of the Board allow Directors to share responsibility and devote the necessary resources to a particular area or issue. There are currently four standing committees of the Board: the Audit and Risk Management Committee (“Audit Committee”); the Conduct Review and Ethics Committee (“Ethics Committee”); the Governance Committee; and the Management Resources and Compensation Committee (“Compensation Committee”). All committees have the following common characteristics:
| n | | Comprised solely of independent Directors. |
| n | | Have a written charter setting out the responsibilities of each committee. Each committee tracks its compliance with its charter at each meeting throughout the year. The charters and the scorecards are available on the Company’s website or by writing to the Corporate Secretary. |
| n | | Report to and seek approvals as required from the Board after each of its meetings. Committees meet without any members of management present (“in camera”) at each meeting. |
| n | | Reviews its performance and its charter annually. |
| n | | Has its membership reviewed by the Board and rotated as requirements of the committees and the Directors dictate. |
Audit and Risk Management Committee
The Board has reviewed the membership of the Audit Committee and has determined that no member serves on more than two other audit committees of publicly traded companies and that no member’s ability to serve the Audit Committee is impaired in any way.
Financial statements are presented for review by the Audit Committee at meetings scheduled prior to Board meetings. The Audit Committee provides a report and recommendation to the Board with respect to financial disclosure of the Company.
| | | | | | |
| 12 | | Manulife Financial Corporation Proxy Circular | | | | |
The Audit Committee has established the Protocol for Approval of Audit and Permitted Non-Audit Services. Under this Protocol, the Audit Committee annually reviews and pre-approves recurring audit and non-audit services that are identifiable for the coming year. This Protocol also requires that any audit or non-audit services that are proposed during the year be approved by the Audit Committee or by a member appointed by the Audit Committee for this purpose.
The Board annually reviews the membership of the Audit Committee to confirm that all members are financially literate, as required by the Audit Committee Instrument and the NYSE Rules and that at least one member can be designated as a financial expert as required by SOX. The Board has determined that all members are financially literate and that Messrs. DeWolfe, Celeste, Dineen, Harding, Helms and Kierans possess the necessary qualifications to be designated as Audit Committee Financial Experts.
The Audit Committee has direct communication andin camera meetings with each of the internal auditor, the independent auditor, the Appointed Actuary, the General Counsel and the Company’s principal regulator, the Office of the Superintendent of Financial Institutions (Canada). The Audit Committee also meets with management.
The Board considers all principal risks facing the Company, as well as the measures either proposed or already implemented to manage these risks. The Audit Committee ensures that comprehensive risk management policies and processes, internal controls and management information systems are in place and updated regularly to mitigate the Company’s exposures.
Conduct Review and Ethics Committee
The Ethics Committee oversees the procedures relating to conflicts of interest, customer complaints, related party transactions and protection of confidential information.
The Ethics Committee annually reviews the Company’s Code of Business Conduct and Ethics, the Related Party Procedures, the Conflict of Interest Procedures, the Confidential Information Procedures and Complaint Handling Practices.
Management Resources and Compensation Committee
The Compensation Committee oversees the Company’s global human resources strategy and the effective utilization of human resources, focusing on management succession, development and compensation. The Compensation Committee is responsible for:
| n | | Approving the appointment of and providing proper development, compensation and review of senior management. |
| n | | Reviewing the objectives, performance and compensation of the President and CEO. Beginning in 2009, the Compensation Committee assumed this responsibility. |
| n | | Reviewing and approving annually the appointment, succession, remuneration and performance of the senior executives. |
| n | | Reviewing annually the Company’s compensation policies, including base pay, incentive, pension and benefit plans and making recommendations to the Board. |
Corporate Governance and Nominating Committee
The Governance Committee is responsible for:
| n | | Developing director selection criteria. |
| n | | Identifying and recommending to the Board qualified director nominees. |
| n | | Overseeing the Company’s corporate governance program. |
| n | | Developing governance policies, practices and procedures. |
| n | | Reviewing the structure, mandate and composition of the Board and Board committees. |
| n | | Reviewing and evaluating the effectiveness of the Board, the committees, the Chair and the Directors. |
Independent Directors’ Meetings
Each meeting of the Board and of its committees is followed by anin camera meeting. Non-independent Directors and management do not attend.
The Board also holds meetings at which non-independent Directors and members of management are not in attendance. In 2008, five meetings of the independent Directors were held.
Shareholders wishing to contact independent Directors of the Company may write to the Chair of the Board, in care of the Corporate Secretary, at the head office of the Company.
Retention of Outside Advisors by Directors
The Board and its committees may retain outside advisors at the Company’s expense, as they deem necessary.
The Governance, Compensation and Audit Committees retained outside advisors in 2008.
Individual Directors may also retain outside advisors, at the Company’s expense, to provide advice on any matter before the Board or a Board committee with the approval of the Governance Committee.
Director Compensation
The Board, with the assistance of the Governance Committee and independent external advisors, undertakes a biennial review of Director compensation to ensure that it meets the objective of properly aligning the interests of Directors with the long-term interests of the Company.
Director Share Ownership
To align Director’s compensation with the long-term interests of the Company, Directors are required to hold an equity position in the Company having a minimum value of $300,000 within five years of joining the Board. Common Shares, preferred shares of the Company and DSUs are considered equity for this purpose, while stock options are not. Directors are required to take 50% of their Board Retainer in shares or DSUs until the minimum value is met. Directors’ share ownership will be valued using the higher of grant price or current market price for the purposes of meeting the share ownership guidelines. This measure was introduced on an interim basis due to the extreme volatility of market conditions and the significant reduction in the Company’s Common Share price. All Directors who have been on the Board for five years have satisfied the minimum equity ownership amount.
No stock options have been granted after 2002 to non-employee Directors and in 2004 the Board of Directors resolved to permanently discontinue stock option grants to non-employee Directors.
| | | | | | |
| | | | Manulife Financial Corporation Proxy Circular | | 13 |
Board Evaluation
The Governance Committee conducts annual, formal evaluations of the Board, Board committees, the Chair and the individual Directors. The process includes:
| n | | Annual evaluation meetings between the Chair and each Director to discuss Board performance, including a peer review. |
| n | | Each Director completes biennial written Board Effectiveness and Director Self-Assessment Surveys. |
| n | | The Board and Board committees are assessed against their mandates and charters. |
| n | | Contributions of individual Directors are assessed against the applicable position descriptions and the Directors’ Matrix setting out the skills each individual Director is expected to bring to the Board. |
| n | | The assessments of the Board, the committees and the Directors, focus on identifying areas for improvement. |
| n | | The results of the assessments are presented to the Governance Committee and the Board. The Governance Committee identifies objectives for the coming year. |
| n | | Annualin camerameeting of the independent Directors to review the results of the evaluations and to approve the Governance Committee’s objectives for the coming year. |
| n | | Review of overall size and operation of the Board and its committees to ensure that they operate effectively. |
| n | | Annual determination of whether a Director’s ability to serve the Company is impaired by external obligations or by changes in his or her principal occupation or country of residence. |
CEO Evaluation
Beginning in 2009, the Compensation Committee and the CEO annually set financial and non-financial objectives for the CEO, which are approved by the Board. The CEO’s performance is evaluated annually by the Compensation Committee based on these objectives and on the Company’s performance. This was previously the responsibility of the Governance Committee.
Ethical Business Conduct
The Company has adopted the Code of Business Conduct and Ethics (“Code”), which applies to Directors, officers, employees and those who perform services for or on behalf of the Company.
The Code complies with the requirements of the NYSE Rules, the SEC rules and the Governance Instrument.
The Code is available on the Company’s website at www.manulife.com.
The Board annually reviews the Code and the compliance with the Code with the assistance of the Ethics Committee.
All employees of the Company and the Directors annually review the Code, complete an online training course, certify compliance with the Code and disclose any conflicts of interest.
The Board, through the Governance and Compensation Committees, annually reviews the integrity of the CEO and the Executive Officers, and their promotion of a culture of integrity.
CEO and CFO Certification of Financial Statements
The CEO and Chief Financial Officer certify the annual financial statements and quarterly financial statements as required by SOX and the Certification Instrument.
The CEO provides an annual certification to the NYSE stating the CEO is not aware of any violations of the governance requirements in the NYSE Rules.
The Company submits Written Affirmations as required by the NYSE Rules.
Communication Policies
Policies have been established relating to the treatment and disclosure of information about the Company on a timely, accurate, understandable and broadly disseminated basis. Information relating to the Company is reviewed by the Legal, Investor Relations and Corporate Communications departments, senior management and others as required, for a determination of materiality and, if appropriate, public disclosure.
The Company has reviewed its disclosure policies and practices to ensure full, fair and timely disclosure of information.
The Company communicates with individual shareholders, institutional investors and financial analysts through its Investor Relations department and to the media and employees through its Corporate Communications department.
The Investor Relations department provides an information report at each Board meeting on share performance, issues raised by shareholders and analysts, the Company’s institutional shareholder base and a summary of recent Investor Relations activities.
The Company’s website, www.manulife.com, features webcasts of the quarterly investor conference calls and presentations made by senior management to the investment community, as well as annual reports and other investor information.
Shareholders can access voting results of all shareholder votes at the Company’s website or at www.sedar.com.
| | | | | | |
| 14 | | Manulife Financial Corporation Proxy Circular | | | | |
Risk Management
Overview
Manulife Financial’s goal in managing risk is to strategically optimize risk taking and risk management to support long term revenue and earnings growth, and shareholder value growth. We achieve this by capitalizing on business opportunities that are aligned with the Company’s risk taking philosophy, risk appetite and return expectations, by identifying, monitoring and measuring all key risks taken, and by proactively executing effective risk control and mitigation programs.
We target to assume risks at levels prudent in relation to the Company’s capital strength and earnings capacity, that are aligned with our operational capabilities, meet our corporate ethical standards, allow us to remain diversified across risk categories, businesses and geographies, and for which we are appropriately compensated over the long term. We must manage risks effectively to safeguard our reputation and capital, and to meet the expectations of our shareholders, customers and regulators.
We employ an enterprise-wide approach to all risk taking and risk management activities globally. The enterprise risk management framework sets out policies and standards of practice related to risk governance, risk identification and monitoring, risk measurement, and risk control and mitigation. With an overall goal of effectively executing risk management activities, we continuously invest to attract and retain qualified risk professionals, and to build and maintain the necessary processes, tools and systems.
Individual risk management strategies are also in place for each specific key risk within our broad risk categories: strategic, market and liquidity, credit, insurance and operational. To ensure consistency, these strategies incorporate policies and standards of practice that are aligned with those within the enterprise risk management framework, covering:
| n | | Assignment of risk management accountabilities across the organization; |
| n | | Delegation of authorities related to risk taking activities; |
| n | | Philosophy related to assuming risks; |
| n | | Establishment of specific risk limits; |
| n | | Identification, measurement, monitoring, and reporting of risks; and |
| n | | Activities related to risk control and mitigation. |
2008 presented extraordinary challenges for the risk management function at Manulife Financial. The ongoing deterioration of the economy overall and severe dislocation of the financial markets continues to weigh heavily on the financial services industry. In this environment, Manulife Financial is not immune. While our disciplined investment risk management approach resulted in our asset portfolio performing comparatively well, the severe equity market declines had a material impact on the operations of our Company, in large part arising from our variable annuity and segregated fund guarantee exposures. While these potential obligations are long-term in nature and payable over a 30 year period beginning in several years, we must account for the increase in liabilities currently. In the face of continuing market instability, measures were taken to strengthen our capital base to provide us with a capital position that we expect will provide the flexibility to absorb further market declines.
With our significant balance sheet and earnings sensitivity to equity market performance, as well as exposures related to declining interest rates and heightened credit challenges, managing risk and capital will have even heightened priority. Plans are being implemented to stem the growth in equity exposure. Our investment portfolio has been, and will continue to be, managed conservatively. Product designs and prices are being reviewed and modified to achieve a reduced risk profile appropriate for the current market environment.
Risk Governance
Sound business decisions require a strong risk culture, and well-informed executive management and Board of Directors. The Audit and Risk Management Committee (“ARMC”) of the Board of Directors oversees our global risk taking activities and risk management practices. The ARMC periodically reviews and approves our enterprise risk management policy, risk taking philosophy, overall risk appetite, and monitors compliance with all key risk policies and limits. The ARMC regularly reviews with management trends in material risk exposures and major risk taking activities, and the ongoing effectiveness of our risk management practices. Recognizing the increasing risk environment, the Board of Directors and ARMC has, and will continue to, increase their focus on risk oversight. The Conduct Review and Ethics Committee of the Board oversees activities and risks specifically related to conflicts of interest, confidentiality of information, customer complaints and related third party transactions, and the Management Resources and Compensation Committee of the Board oversees global human resources strategy, policies, key programs, and all related risks.
The Chief Executive Officer (“CEO”) is directly accountable to the Board of Directors for all risk taking activities and risk management practices, and is supported by the Chief Financial Officer (“CFO”) and Chief Risk Officer (“CRO”) as well as by the Executive Risk Committee (“ERC”). Together, they shape and promote our risk culture throughout our global operations. The ERC, along with other executive-level risk oversight committees, establish risk policy, guide risk taking activity, monitor material risk exposures, and sponsor strategic risk management priorities throughout the organization.
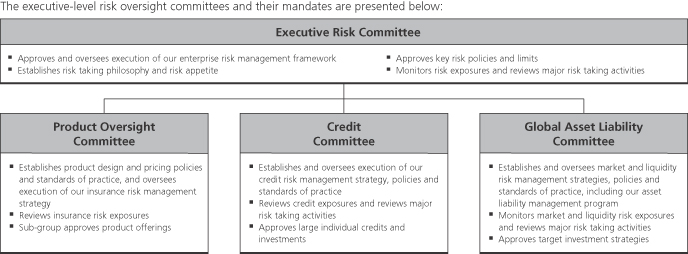
Business units across the organization are accountable for the risks they assume. Business unit general managers are responsible for ensuring their business strategies align with the Company’s risk taking philosophy and culture, for thoroughly evaluating and managing all risk exposures consistent with our enterprise risk policies and standards of practice, and for delivering returns commensurate with the level of risk assumed.
Corporate Risk Management (“CRM”), under the direction of the CRO, establishes and maintains our enterprise risk management framework as well as individual risk management strategies for each broad risk category, and oversees the execution of these strategies across the enterprise. CRM proactively partners with business units to ensure a consistent enterprise-wide assessment of risk, risk-based capital, and risk-adjusted returns.
Risk Identification and Monitoring
Manulife Financial evaluates all potential new business initiatives, acquisitions, product offerings, reinsurance arrangements, and investment and financing transactions on a directly comparable risk-adjusted basis. Our comprehensive processes identify, monitor, measure, and control the risks assumed using a common set of practices. Business units identify and assess risks arising from their activities on an ongoing basis, as an integral component of their business management processes. CRM oversees a formal process for monitoring and reporting on enterprise-wide risk exposures relating to specific risk
categories, discusses risk exposures with our various risk oversight committees, and submits requests for approval of any policy limit exceptions, as required.
On a quarterly basis, the ERC, ARMC and Board of Directors each review risk reports that present all key elements of our risk profile and exposures across all risk categories enterprise-wide, incorporating both quantitative risk measures and qualitative assessments. The reports also highlight key risk management activities and facilitate monitoring of compliance with all key risk policy limits. The reports present information gathered through a formal risk identification and assessment process involving business unit general managers and their executive teams, as well as corporate executives overseeing global risk management programs.
The Chief Actuary presents the results of the Dynamic Capital Adequacy Testing (“DCAT”) to the Board of Directors annually. Our Internal Auditor independently reports the results of internal audits of risk controls and risk management programs to the ARMC semi-annually. Management reviews the implementation of all global risk management programs, and their effectiveness, with the ARMC annually.
Risk Measurement
Risk exposures are evaluated using a variety of risk measures. Certain of these risk measures are used across a number of risk categories, while others apply only to a single risk type. Risk measures range from simple key risk indicators and scenario impact analyses, to deterministic stress testing of earnings and shareholders’ economic value, as well as sophisticated stochastic scenario modeling of economic capital and earnings at risk. Economic capital and earnings at risk, in particular, provide measures of enterprise-wide risk that can be aggregated, and compared, across all business activities and risk types. Qualitative assessments are performed for those risk types that cannot be reliably quantified.
We measure consolidated internal risk-based capital using a combination of economic capital and Canadian-based Minimum Continuing Capital and Surplus Requirements (“MCCSR”). Economic capital measures the amount of capital needed to meet all obligations with a very high and pre-defined confidence level. We evaluate our consolidated earnings volatility using an earnings at risk metric, which measures the potential variance from expected earnings over a pre-defined period, with a pre-defined confidence level. Both economic capital and earnings at risk are measured enterprise-wide and can be allocated by risk, product line, asset category, and market. We continue to expand the application of economic capital, in the evaluation of risk-adjusted returns for product pricing and investment decision support, throughout our organization.
We stress test our regulatory capital adequacy over a five year projected timeframe, incorporating both existing and projected new business activities, under a number of significantly adverse but “plausible” scenarios through our DCAT.
Risk Control and Mitigation
Risk control activities are in place throughout the Company to mitigate risks to within the approved risk limits for each specific risk. Controls, which include policies, procedures, systems and processes, are appropriate and commensurate with the key risks faced at all levels across the Company and are a normal part of day to day activity, business management and decision making.
CRM establishes and oversees formal review and approval processes, involving independent individuals, groups or risk oversight committees, for product offerings, reinsurance, investment activities and other material business activities, based on the nature, size and complexity of the risk taking activity involved. Authority for assuming risk at the transaction level is delegated based on the skill, knowledge and experience of the specific individuals.
Risk mitigation activities, such as product and investment portfolio management, hedging, reinsurance and insurance protection are used to ensure our aggregate risk remains within our risk appetite and limits. Internal controls within the business units and corporate functions are in place to limit our exposure to operational risks.
The Company manages risk taking activities against an overall group appetite for assuming risk that reflects the financial condition and the business strategies and risk tolerances approved by the Board of Directors. The risk appetite is set in relation to a variety of risk measures including economic capital and earnings at risk, as well as regulatory capital requirements. To ensure exposures to particular risks are appropriate and that the Company remains well-diversified across risk categories, we manage specific risk exposures against enterprise-wide limits established for each of these specific risks. These limits are set in relation to risk measures ranging from economic capital and earnings at risk to risk measures applied only to the particular risk.
The following charts show the composition of the Company’s internal risk-based capital by broad risk category and product line. Over 2008, the most significant change in the composition of our internal risk-based capital by category was an increase in capital associated with off-balance sheet guarantees in our variable annuity products, where the risk exposure is primarily related to the performance of equity markets.
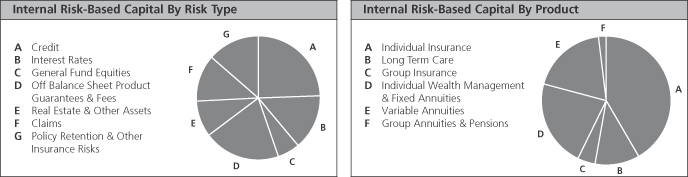
The following sections describe the key risks we face in each broad risk category and highlight the strategies in place to manage these risks.
Strategic Risk
Strategic risk is the risk of loss resulting from the inability to adequately plan or implement an appropriate business strategy, or to adapt to change in the external business, political or regulatory environment.
Key Risk Factors Manulife Financial operates in highly competitive markets and competes for customers with both insurance and non-insurance financial services companies. Customer loyalty and retention, and access to distributors, are important to the Company’s success and are influenced by many factors, including our product features, service levels, prices relative to our competitors, and our financial strength ratings and reputation. External business, economic, political, tax, legal and regulatory environments can significantly impact the products and services we can offer, and their price and attractiveness.
Risk Management Strategy The CEO and Executive Committee establish and oversee execution of business strategies, and have accountability to identify and manage the risks embedded in these strategies. They are supported by a number of important processes:
| n | | Strategic planning that is integrated with risk assessments and reviewed where appropriate with the Board of Directors; |
| n | | Detailed business planning executed by divisional management and reviewed by the CEO; |
| n | | Quarterly operational performance reviews of all businesses, along with business risks, with the CEO and annual reviews with the Board of Directors; |
| n | | Risk-based capital attribution and allocation that ensures a consistent decision making framework across the organization; |
| n | | Review and approval of acquisitions and divestitures by the CEO and where appropriate with the Board of Directors. |
Market and Liquidity Risk
Market risk is the risk of loss resulting from adverse investment returns caused by market price volatility, interest rate and credit spread changes, and from adverse foreign currency rate movements. Liquidity risk is the risk of loss from not having access to sufficient funds to meet both expected and unexpected cash demands.
Risk Management Strategy Overview Manulife Financial’s Global Asset Liability Committee, with the support of a network of business unit asset liability committees, establishes and oversees the execution of the Company’s market risk management strategy including our asset liability management program. The programs cover the management of a variety of risks that arise in generating investment returns to support product liabilities, as well as returns on assets in the shareholders’ equity account. These risks include performance of non-fixed income investments, such as equities, commercial real estate, timberlands and oil and gas properties, interest rate changes, and foreign exchange rate changes, as well as liquidity risk. These programs are designed to keep potential losses from these risks within acceptable limits. Global investment policies establish enterprise-wide and portfolio level targets and limits, as well as delegated transaction approval authorities. The targets and limits are designed to achieve wide diversification across asset classes and individual investment risks within our investment portfolios, and to ensure they are suitable for the liabilities they support.
General account product liabilities are segmented into groups with similar characteristics that are each supported by a unique portfolio of investments. Investment policies and goals are established for each asset segment, setting out target investment strategies and portfolio management philosophies that best match the premium and benefit pattern, guarantees, policyholder options, and crediting rate strategies for the products they support. These encompass asset mix, quality rating, term profile, liquidity, currency and industry concentration targets, as well as portfolio management styles. Similarly, we establish a target investment strategy and portfolio management philosophy for our shareholders’ equity account. Our target investment strategies are established using sophisticated portfolio analysis techniques to optimize returns, subject to considerations related to regulatory and economic capital requirements, and tolerances with respect to risk.
Market Price and Interest Rate Risk
Key Risk Factors Market price volatility and interest rate changes, including credit spreads, along with our product guarantees and policyholder withdrawal options, may lead to asset returns insufficient to support product liabilities, and may impact the value of assets held in our shareholders’ equity account. The level of our sales activity and asset retention may also be affected by the performance of markets, interest rates, inflation and general economic conditions as these will influence the performance of our general account investments, segregated funds and mutual funds.
Interest rate risk arises within our general fund primarily due to the uncertainty of future returns on investments made as recurring premiums are received, and to a lesser extent, due to tactical mismatch positions taken between the term profile of our assets and liabilities. Market price and interest rate risk also arises due to minimum rate guarantees and withdrawal options on products where investment returns are generally passed through to policyholders. If the term profile of our assets is shorter than our liabilities, interest rate declines may reduce the future return on invested assets supporting the liabilities. On the other hand, for products that pass through investment returns to policyholders, if rates increase significantly we may need to increase credited rates and reduce margins in order to remain competitive. Declines in market values of equity, commercial real estate, timberlands and oil and gas properties will also impact the return on assets supporting liabilities and in our shareholders’ equity account.
Market price and interest rate risk arising from our off-balance sheet products is due mainly to the death and living benefit guarantees provided on variable annuity and insurance products as well as the uncertainty of future levels of asset-based fees. Guarantees include death, maturity, income and withdrawal guarantees on variable products. A sustained decline in stock markets could increase the cost of guarantees associated with our variable products and reduce asset-based fee revenues. A sustained increase in equity market volatility or decline in interest rates could increase the costs of hedging the benefit guarantees provided.
Risk Management Strategy We manage assets supporting products that generally pass through investment returns to policyholders, to achieve a target return designed to maximize dividends or credited rates, subject to established risk tolerances. We design guaranteed benefit insurance and wealth management products and set premiums and credited rates to limit the risk of not achieving targeted profit margins. To support wealth management products with fixed credited rates, we invest in fixed income assets that have a term profile generally matching the term profile of the liabilities, to the extent assets are available in the market at those terms. Several insurance and wealth management products have guaranteed benefits extending well beyond the term for which fixed income assets are generally available in the market. We manage assets supporting these long-dated benefits to achieve a target return sufficient to support these guaranteed obligations over their lifetime, subject to established risk tolerances, by investing a portion in a diversified basket of non fixed income assets, with the balance invested in fixed income portfolios. In response to the changed market conditions, guaranteed benefit products, and their premiums, are being reviewed and modified to ensure risk tolerances are maintained and targeted profit margins will continue to be achieved.
We evaluate market price and interest rate risk exposures using a variety of techniques and measures that are primarily based on projecting asset and liability cash flows under a variety of future interest rate and market return scenarios. These measures include durations, key-rate durations, convexity, delta, rho, gamma, vega, cash flow gaps, shareholders’ economic value sensitivity to specific stress scenarios, earnings at risk and economic capital.
Interest rate and credit spread risk arising in our general account, is managed against enterprise-wide economic capital and earnings at risk-based limits and economic value sensitivity limits for specific segments. We delegate trading authorities to individuals as well as accountabilities for managing and monitoring interest rate risk. Asset duration, key-rate duration and cash flow targets are reviewed,
modified and communicated to portfolio managers with a frequency ranging from daily to annually, depending on the type of liabilities and the frequency and size of potential changes in the liability profiles. We monitor actual asset positions against targets and rebalance positions to within established interest rate risk exposure limits with a frequency ranging from daily to quarterly, depending on the potential exposure to changes in the profile of assets and liabilities.
We mitigate market price risk arising from our general account non fixed income investments by investing in a diversified basket of assets consisting of public and private equities, commercial real estate, timberland, agricultural land and oil and gas properties. We manage total non fixed income asset investments against an established aggregate limit and against aggregate limits for each asset category. To diversify risk, we manage our public and private equity investments against established targets and limits by industry type and corporate connection, commercial real estate investments to established limits by property type and geography, and timber and agricultural land investments to limits by geography and crop. We proactively manage allocations to non-fixed income assets, reflecting management’s risk preferences.
We mitigate both market price and interest rate risk arising from off-balance sheet products through benefit guarantee design, limitations on fund offerings, use of reinsurance and capital markets hedging. We have reinsured the investment return benefit guarantee risk on a portion of our in-force business and employ capital market hedging for a portion of our in-force and the majority of the new business we write. We design new product benefit guarantees and fund offerings to meet established extreme event risk exposure limits, based on economic capital and regulatory capital, and to achieve desired profit targets. Product guarantee features, fund offerings and fees are being reviewed and modified to ensure guarantees can be hedged effectively in the changed market conditions.
The Company’s aggregate exposure to equities is managed against enterprise-wide economic capital and earnings at risk-based limits. These limits cover the combined risk arising from off-balance sheet product death and living benefit guarantees, asset-based fees and general account investments.
Variable annuity guarantees generate the largest component of our exposure risk related to equity markets. We are implementing a comprehensive plan that will allow us to economically achieve a reduced level of exposure to equity market volatility. We have already begun to review our variable annuity guarantee offerings and modify product designs to better balance the features that have attracted customers to these products with the risk that they present to Manulife Financial. We will continue to provide variable annuity and segregated fund offerings, with potential obligations payable over a long time period, generally deferred several years. However, recognizing increasing volatility in equity markets, we will offer product designs and investment fund alternatives with reduced exposure to equity markets. We have also expanded our variable annuity hedging to encompass all new business written in the U.S and the majority of Canadian new business and will look for opportunities to economically hedge existing business. We intend to continue to monitor market conditions and manage product features, fee levels, and our hedging program throughout 2009 to ensure an appropriate balance between risk and long-term profitability for the variable annuity product line. We also intend to prudently limit growth in our guaranteed variable annuity businesses.
Market price and interest rate risk exposures are disclosed in note 8 to the consolidated financial statements.
Foreign Currency Risk
Key Risk Factors A substantial portion of the Company’s global business is denominated in currencies other than Canadian dollars, mainly U.S. dollars, Hong Kong dollars and Japanese yen. We also invest a substantial portion of our shareholders’ equity in non-Canadian denominated assets. If the Canadian dollar strengthened relative to non-Canadian currencies, the translated value of reported earnings from these non-Canadian denominated businesses would decrease and the translated value of our reported shareholders’ equity would decline.
Risk Management Strategy Manulife Financial has a policy of matching the currency of our assets with the currency of the liabilities they support, to mitigate economic exposure to currency exchange rate changes. To limit the impact of changes in foreign exchange rates on regulatory capital ratios, we have a policy of generally matching the currency of the assets in our shareholders’ equity account to the liabilities they support, up to target capital levels. This policy is designed to ensure that changes to our reported shareholders’ equity are proportionate to changes in our reported capital requirements, stabilizing capital ratios from the impact of foreign exchange rates. However, the policy results in variability in reported shareholders’ equity. Currency risk exposure is managed to an established value at risk limit measured relative to the policy position.
The following table shows the impact on shareholders’ equity and net income of a one per cent change in the Canadian dollar relative to our key operating currencies.
Impact of Changes in Foreign Exchange Rates(1),(2)
| | | | | | | | | | | | | | | | | | | |
| | | Shareholders’ Equity | | | | | Net Income | | | |
As at December 31 (Canadian $ in millions) | | 2008 | | | 2007 | | | | | 2008 | | 2007 | | | |
1% strengthening relative to U.S. dollar | | $ | (189 | ) | | $ | (159 | ) | | | | $ | 12 | | $ | (31 | ) | | |
1% strengthening relative to Japanese yen | | $ | (15 | ) | | $ | (14 | ) | | | | $ | 3 | | $ | (6 | ) | | |
(1) | A weakening in rates would have the exact opposite impact to that displayed above. |
(2) | A strengthening or weakening of the average Canadian dollar relative to our key operating currencies can have a significant impact to our net income. For example, in the fourth quarter of 2008, the average Canadian dollar exchange rate weakened considerably against the U.S. dollar, resulting in an increase in the translated value of our U.S. dollar net loss. Similarly, a strengthening of the Canadian dollar would decrease our U.S. dollar net loss, and thus positively impact our net income. |
Liquidity Risk
Key Risk Factors Manulife Financial is exposed to liquidity risk in each operating company and in the holding company. In the operating companies, expected cash demands arise day-to-day to fund anticipated policyholder benefits, deposit withdrawals, expenses and investment activities. Under stressed conditions, unexpected cash demands could arise primarily from an increase in the level of policyholders either terminating policies with material cash surrender values, or not renewing them when they mature, deposit withdrawals and from an increase in the level of borrowers renewing or extending their loans when they mature.
The ability of MFC, the holding company, to fund its cash requirements depends upon it receiving dividends, distributions and other payments from its operating subsidiaries. These subsidiaries are generally required to maintain solvency and capital standards imposed by their local regulators and, as a result, have restrictions on payments which they may make to MFC.
Risk Management Strategy Global liquidity management policies and procedures are designed to provide adequate liquidity to cover financial obligations as they come due, and to sustain and grow operations in both normal and stressed conditions. They take into account any legal, regulatory, tax, operational or economic impediments to inter-entity funding.
Liquidity risk is reduced by having policy liabilities that are well-diversified by product, market, geographical region and policyholder. We design insurance products to encourage policyholders to maintain their policies in-force, thereby generating a diversified and stable flow of recurring premium income. We design the policyholder termination features of our wealth management products and related investment strategies to mitigate the financial exposure and liquidity risk related to unexpected policyholder terminations. We establish and implement investment strategies that match the term profile of the assets to the liabilities they support, taking into account the potential for unexpected policyholder terminations and resulting liquidity needs. Liquid assets represent a large portion of our total assets. We manage our deposit funded businesses through a reliance on stable and diverse sources of funding with active management of the risk profile associated with the deposit mix. We forecast and monitor actual daily operating liquidity and cash movements in local operations as well as centrally, aiming to ensure liquidity is available and cash is employed optimally.
We also maintain centralized cash pools and access to other sources of liquidity such as repurchase funding agreements. Our centralized cash pool consists of cash or near-cash, high quality short term investments that are continually monitored for their credit quality and market liquidity. During the last two quarters of 2008, wholesale funding markets, primarily in the U.S., became disrupted. Consequently, seeking to reduce risk, Manulife has increased liquidity to historically high levels.
Cash and Government Securities
| | | | | | | | |
As at December 31 (Canadian $ in millions) | | 2008 | | 2007 | | |
Cash and cash equivalents | | $ | 17,269 | | $ | 12,354 | | |
Government bonds | | | 24,280 | | | 21,793 | | |
Total | | $ | 41,549 | | $ | 34,147 | | |
Cash and government securities as a % of total assets | | | 19.7% | | | 19.4% | | |
Through the normal course of business, pledging of assets is required to comply with jurisdictional regulatory and other requirements including collateral pledged to mitigate derivative counterparty credit risk and assets held as collateral for repurchase funding agreements. Total unencumbered assets as at December 31, 2008 were $206.5 billion.
Global operating and strategic liquidity levels are managed against established minimums. We set minimum operating liquidity as the level of one month’s operating cash outflows. Our operating liquidity remains well above minimum requirements. We measure strategic liquidity under both immediate (within one month) and ongoing (within one year) stress scenarios. Our policy is to maintain the ratio of adjusted liquid assets to adjusted policy liabilities at or above a pre-established target. Adjusted liquid assets include cash and short-term investments, and marketable bonds and stocks that are discounted to reflect convertibility to cash, net of maturing debt obligations. Policy liabilities are adjusted to reflect their potential for withdrawal. Our strategic liquidity remains above policy targets.
Strategic Liquidity
| | | | | | | | | | | | | | | | |
| | | 2008 | | | | 2007 | | |
As at December 31 (Canadian $ in millions) | | Immediate
scenario | | Ongoing
scenario | | | | Immediate
scenario | | Ongoing
scenario | | |
Adjusted liquid assets | | $ | 92,361 | | $ | 93,504 | | | | $ | 81,487 | | $ | 81,571 | | |
Adjusted policy liabilities | | $ | 23,047 | | $ | 30,090 | | | | $ | 20,597 | | $ | 26,750 | | |
Liquidity ratio | | | 401% | | | 311% | | | | | 396% | | | 305% | | |
A separate liquidity risk management policy and process is run for Manulife Bank which at the end of 2008 had liquidity in excess of policy requirements.
Credit Risk
Credit risk is the risk of loss due to the inability or unwillingness of a borrower or counterparty to fulfill its payment obligations.
Key Risk Factors A pronounced and sustained economic downturn could result in borrower or counterparty defaults or downgrades, and could lead to increased provisions or impairments related to our general fund invested assets and off-balance derivative financial instruments, and an increase in provisions for future credit impairments to be included in our actuarial liabilities. Counterparty risk arises primarily from derivatives and reinsurance activities. Any of our reinsurance providers being unable or unwilling to fulfill their contractual obligations related to the liabilities we cede to them could lead to an increase in actuarial reserves.
Risk Management Strategy The Credit Committee establishes and oversees execution of our credit risk management strategy. The committee sets out objectives related to the overall quality and diversification of our general account investment portfolio and establishes criteria for the selection of counterparties, including derivative counterparties as well as reinsurers and insurance providers. Our policies establish exposure limits by borrower, corporate connection, quality rating, industry, and geographic region, and govern the usage of credit derivatives. Corporate connection limits vary according to risk rating. We invest our general account assets primarily in investment grade bonds and commercial mortgages. We do not actively participate in the credit derivative market, and currently have a minimal exposure to credit default swaps.
All of our credit-granting units follow a defined evaluation process that provides an objective assessment of credit proposals. We assign each investment a risk rating based on a detailed examination of the borrower that includes a review of: business strategy, market competitiveness, industry trends, financial strength, access to funds, and other risks facing the organization. We assess and update risk ratings regularly, based on a standardized 22-point scale consistent with those of external rating agencies. For additional input to the process, we also assess credit risks using a variety of industry standard, market based tools and metrics. We map our risk ratings to pre-established probabilities of default and loss given defaults, based on historical industry and company experience, and resulting default costs, which form key inputs to our product pricing, actuarial liabilities and economic capital.
We establish delegated credit approval authorities and make credit decisions on a case-by-case basis at a management level appropriate to the size and risk level of the transaction, based on the delegated authorities that vary according to risk rating. We refer all major credit decisions to the Credit Committee and the largest credit decisions to the CEO for approval and, in certain cases, to the Board of Directors.
We have in place distinct derivative counterparty exposure limits, based on a minimum acceptable counterparty credit rating of A- from internationally recognized rating agencies. We measure derivative counterparty exposure as net potential credit exposure, which takes into consideration mark-to-market values of all transactions with each counterparty, net of any collateral held, and an allowance to reflect future potential exposure. We measure reinsurance counterparty exposure as both current exposure and potential future exposures reflecting the level of ceded actuarial liabilities. We require all reinsurance and insurance counterparties to meet minimum risk rating criteria.
Regular reviews of the credits within the various portfolios are undertaken to ensure that changes to credit quality are identified, and where appropriate, that corrective action is taken. Prompt identification of problem credits is a key objective. CRM provides independent credit risk oversight by reviewing assigned risk ratings, and monitoring problem and potential problem credits.
Our credit policies and procedures and investment strategies have remained fundamentally unchanged. Given the challenging credit environment experienced in 2008 and in response to the emerging environment, credit exposure in our investment portfolio is being actively managed to reduce risk and mitigate losses. Derivative counterparty exposure is being managed proactively and securities lending activities have been reduced.
An allowance for losses on loans is established when a loan becomes impaired as a result of deterioration in credit quality, to the extent there is no longer assurance of timely realization of the carrying value of the loan and related investment income. We reduce the carrying value of an impaired loan to its estimated net realizable value at the time of recognition of impairment. We establish an allowance for losses on reinsurance contracts when a reinsurance counterparty becomes unable or unwilling to fulfill their contractual obligations. We base the allowance for loss on current recoverables and ceded actuarial liabilities. There is no assurance that the allowance for losses will be adequate to cover future potential losses or that additional provisions or asset write-downs will not be required.
Actuarial liabilities also include general provisions for credit losses from future asset impairments. We set these conservatively, taking into account normal historical levels and future expectations, with an allowance for adverse deviations. Fluctuations in credit default rates and deterioration in credit ratings of borrowers may result in losses if actual rates exceed expected rates. As at December 31, 2008 and December 31, 2007, for every 25 per cent that credit loss rates over the next year exceeded the rates provided for in actuarial reserves, net income would be reduced by $34 million and $21 million, respectively.
Credit risk exposures are disclosed in note 8 to the consolidated financial statements.
Insurance Risk
Insurance risk is the risk of loss due to actual experience emerging differently than assumed when a product was designed and priced with respect to mortality and morbidity claims, policyholder behaviour and expenses.
Key Risk Factors A variety of assumptions are made related to the future level of claims, policyholder behaviour, expenses and sales levels when we design and price products, and when we establish actuarial liabilities. The development of assumptions for future claims are based on Company and industry experience; assumptions for future policyholder behavior are based on Company experience and predictive models. Such assumptions require significant professional judgment and therefore, actual experience may be materially different than the assumptions we make. Claims may be impacted by the unusual onset of disease or illness, natural disasters, large-scale manmade disasters and acts of terrorism. Policyholder premium payment patterns, policy renewal, withdrawal and surrender activity is influenced, by many factors including market and general economic conditions, and the availability and price of other products in the marketplace.
Risk Management Strategy The Product Oversight Committee oversees insurance risk management, together with all other elements of our product design and pricing practices, to ensure our product offerings align with our risk taking philosophy and risk limits, while promoting business opportunities. Within the broad framework set out by our Product Design and Pricing Policy, this committee establishes global product design and pricing standards and guidelines. These cover:
| | | | |
n product design features n use of reinsurance n pricing models and software n internal risk-based capital allocations | | n target profit objectives n pricing methods and assumption setting n stochastic and stress scenario testing n required documentation | | n review and approval processes n experience monitoring programs |
We designate individual pricing officers in each business unit who are accountable for all pricing activities. The general manager and chief financial officer of each business unit, and CRM, approve the design and pricing of each product, including key claims, policyholder behaviour, investment return and expense assumptions, as well as reinsurance treaties with third parties, ensuring corporate standards are met. Corporate Actuarial approves all actuarial valuation methods and assumptions and approves reinsurance treaties related to business in force, as well as all related party reinsurance treaties. We perform annual risk and compliance self-assessments of the product development and pricing activities of all businesses.
We utilize a global underwriting manual to ensure insurance underwriting practices for direct written life business are consistent across the organization while reflecting local conditions. Each business unit establishes underwriting policies and procedures, including criteria for approval of risks and claims adjudication policies and procedures.
We apply retention limits per insured life to reduce our exposure to individual large claims which are monitored in each business unit. These retention limits vary by market and jurisdiction. We reinsure exposure in excess of these limits with other companies. Our current global retention limit is US$20 million for a single life (US$25 million for survivorship life policies) and is shared across business units. We apply lower limits in some markets and jurisdictions. We further reduce exposure to claims concentrations by applying geographical aggregate retention limits for certain covers.
As noted above, fluctuations in claims experience may result in losses. As at December 31, 2008 and December 31, 2007 for every five per cent that actual mortality and morbidity rates over the next year exceeded the rates provided for in actuarial reserves, net income would be reduced by $147 million and $127 million, respectively. Enterprise-wide, this claims exposure is lessened as a result of operating internationally and insuring a wide range of unrelated risk events, reducing the likelihood of high aggregate claims rates.
Operational Risk
Operational risk is the risk of loss resulting from inadequate or failed internal processes, systems failures, human performance failures or from external events.
Key Risk Factors Operational risk is naturally present in all of the Company’s business activities and encompasses a broad range of risks, including reputation risk, regulatory compliance failures, legal disputes, technology failures, business interruption, information security and privacy, human resource management and employment practices, environmental concerns, processing errors, business integration, theft and fraud, and damage to physical assets. Exposures can take the form of financial losses, regulatory sanctions, loss of competitive positioning, or damage to reputation. Operational risk is also embedded in all the practices we use to manage other risks therefore, if not managed effectively, can impact our ability to manage other key risks such as credit risk, market and liquidity risk and insurance risk.
Risk Management Strategy Manulife Financial’s corporate governance practices, corporate values, and integrated, enterprise-wide approach to managing risk set the foundation for mitigating operational risks. We strengthen this base by ensuring appropriate internal controls and systems, together with trained and competent people, are in place throughout the organization. We establish and execute enterprise-wide risk management strategies for specific operational risks that could materially impact our ability to do business or impact our reputation. Within established corporate standards, business unit general managers are accountable for the day-to-day management of the operational risks inherent in their operations. Business units and functional areas perform risk control self-assessments to identify, document and assess inherent operational risks and effectiveness of internal controls. They monitor key risk indicators that provide early warnings of emerging control issues and proactively modify procedures.
Through our corporate insurance program, the Company transfers a portion of our operational risk exposure by purchasing global and local insurance coverage that provide protection against unexpected material losses resulting from events such as criminal activity, property loss or damage and liability exposures, or that satisfy legal requirements and contractual obligations. We determine the nature and amount of insurance coverage centrally, reflecting enterprise-wide exposures and risk tolerances.
The following is a further description of key operational risk factors with associated management strategies:
Reputation Risk Reputation risk is the risk that our corporate image may be eroded by adverse publicity, as a result of our business practices or those of our employees, representatives and business partners, potentially causing damage to our franchise value. Representatives include affiliated broker-dealers, agents, wholesalers and independent distributors, such as broker-dealers and banks, whose services and representations our customers rely on. Business partners, among others, include third parties to whom we have outsourced some of our administrative functions and that we rely on to fulfill various obligations. Manulife Financial’s reputation is one of its most valuable assets and must be safeguarded. A loss of reputation is often a consequence of some other risk control failure whether associated with complex financial transactions or relatively routine operational activities. As such, reputation risk cannot be managed in isolation from other risks. Our enterprise-wide Reputation Risk Policy specifies the oversight responsibilities of the Board and the responsibilities of executive management, in managing reputation risk. We apply a set of guiding principles in conducting all our business activities, to protect and enhance our reputation, and place a priority on communication to and education of all employees and representatives. We require reputation risk assessments to be considered as part of business strategy development and execution. While the CEO and executive management are ultimately responsible for our reputation, every one of our employees and representatives has the responsibility to conduct their business activities in a manner that upholds our reputation. This responsibility is communicated to every director, officer and employee through our Code of Business Conduct and Ethics.
Legal and Regulatory Risk The Company is subject to extensive regulatory oversight by insurance and/or financial services regulators in the jurisdictions in which it conducts business. While many of these laws, regulations and regulatory policies are intended to protect policyholders, beneficiaries and depositors and investors in our products and services, others also set standards and requirements for the governance of our operations. Failure to comply with applicable statutes or regulations could result in financial penalties or sanctions, and damage to reputation. We are also regularly involved in litigation, both as plaintiff and defendant, which could result in an unfavourable resolution. Global Compliance oversees our regulatory compliance program, supported by designated chief compliance officers in every division. The program is designed to promote compliance with regulatory obligations worldwide and to help ensure awareness of the laws and regulations that affect us, and the risks associated with failing to comply. Divisional compliance groups monitor emerging legal and regulatory issues as well as proposed regulatory changes and take an active role in attempting to influence these where appropriate. They also prepare us to address new requirements. Global Compliance also independently assesses and monitors the effectiveness of a broad range of regulatory compliance processes and business practices against potential legal, regulatory, fraud and reputation risks, and helps to ensure significant issues are escalated and proactively mitigated. Among these processes and practices are: product design, sales and marketing practices, sales compensation practices, asset management practices, fiduciary responsibilities, employment practices, underwriting and claims processing and regulatory filings. In addition, we have an anti-fraud policy to protect the Company, its customers and other related third parties from acts of fraud. Divisions ensure that existing processes and controls give adequate consideration to the risk of fraud and Audit Services and Global Compliance periodically assess the effectiveness of the control environment.
Technology, Information Security and Business Interruption Risks Technology is used in virtually all aspects of our business and operations including the creation and support of new products and services. Operational integrity, data integrity and security of information and our systems infrastructure are all relied upon for normal business operations. Disruption to operations due to system failure or information security breaches can have negative consequences for our businesses. Technology related risks are managed through a rigorous systems development protocol and global information security programs. Global Information Systems oversees risks associated with information security, information systems privacy and compliance, business continuity and disaster recovery planning. We have in place a global business continuity policy along with standards of practice to ensure key business functions can continue and normal operations can resume effectively and efficiently, in the event of a major disruption. Each business unit maintains its own business continuity plans and processes and the global program incorporates periodic scenario analysis to validate the assessment of both critical and non-critical units, as well as the establishment and testing of appropriate business continuity plans for all critical units. We establish and regularly test crisis management and communications protocols. We have off-site backup facilities available to minimize recovery time. We subject our outsourcing arrangements, whereby a service provider performs a service activity on behalf of the Company, to review procedures, prior to their approval. We have comprehensive policies and procedures in place to monitor the ongoing results and contractual compliance of such arrangements.
Human Resource Risks Attracting and retaining qualified resources is critical to the execution of our business strategies. We face tremendous competition for qualified executives, employees and agents from companies both within the financial services industry and in other industries. We have established and implemented a number of human resource policies, practices and programs in order to manage these risks and Corporate Human Resources manages our global human resource programs. Our executive management is committed to employee training and development, and our compensation program is designed to attract, motivate and retain high-performing employees. We have in place a number of recruiting programs to attract the best and the brightest for every level of the organization.
Environmental Risk An environmental issue on a property owned by us or any property with which we are affiliated could result in financial or reputational loss. Manulife Financial’s environmental policy reflects the Company’s commitment to conducting all business activities in a manner that recognizes the need to preserve the quality of the environment, as well as the requirement to be compliant
with all applicable environmental laws and regulations. In natural resource management operations, we have specific policies and procedures in place to mitigate environmental risks and operate in an environmentally responsible manner. We also have programs in place across the real estate holdings to conserve energy and reduce waste. In providing credit to borrowers, or making equity investments in private firms, we take reasonable steps to assess that counterparties are environmentally responsible.
Derivatives Risk Derivatives are used to manage market risks. We mitigate the unique operational risks associated with the use of derivatives by having in place specific risk management policies and processes including limits on the notional volume of derivative transactions, authorized types of derivatives and applications, delegated authorization and trading limits for specific personnel, as well as the pre-approval of all derivative application strategies and regular monitoring of the effectiveness of derivative strategies.
Additional Risk Factors That May Affect Future Results
The Accounting Standards Board of the CICA makes changes to the financial accounting and reporting standards that govern the preparation of our financial statements. These changes may be difficult to anticipate and may materially impact how we record and present our financial condition and results of operations. As discussed under “Critical Accounting and Actuarial Policies”, the preparation of financial statements requires management to make estimates and assumptions that affect the reported amounts and disclosures made in the financial statements and accompanying notes. These estimates and assumptions may require revision and actual results may differ materially from these estimates. As well, as noted under “Cautionary Statement Concerning Forward-Looking Statements”, forward-looking statements involve risks and uncertainties and actual results may differ materially from those expressed or implied in such statements. Key risk factors and their management have been described above, summarized by major risk category.
Other factors that may affect future results include changes in government trade policy; monetary policy; fiscal policy; political conditions and developments in or affecting the countries in which we operate; technological changes; public infrastructure disruptions; changes in consumer spending and saving habits; the possible impact on local, national or global economies from public health emergencies, such as an influenza pandemic, and international conflicts and other developments including those relating to terrorist activities. Although we take steps to anticipate and minimize risks in general, unforeseen future events may have a negative impact on our business, financial condition and results of operations.
We caution that the preceding discussion of risks that may affect future results is not exhaustive. When relying on our forward-looking statements to make decisions with respect to our Company, investors and others should carefully consider the foregoing risks, as well as other uncertainties and potential events, and other external and Company specific risks that may adversely affect the future business, financial condition or results of operations of our Company.
Capital Management
Overview
Manulife Financial manages its capital on a total company basis as well as for each regulated entity. Management seeks to optimize the Company’s capital structure under a variety of constraints as defined by regulatory rules, rating agency expectations, competitive considerations and our own business needs. During 2008, net capital issuances combined with proactive management of capital requirements and efficient deployment of capital across the Company has allowed us to maintain a solid capital position, notwithstanding the substantial deterioration in the global economic environment worldwide. Overall, the capital position of the Company and its subsidiaries remains in excess of regulatory requirements, with the capital levels of the key operating subsidiaries exceeding or within internal targets.
Capital Management Framework
The Company’s objectives with respect to capital management are: to remain in compliance with all regulatory requirements; to ensure safety and stability of our financial position; to ensure we have the flexibility to take advantage of attractive business and investment opportunities as they arise; and to optimize the return on shareholders’ equity.
In its assessments of capital adequacy, the Company typically adopts regulatory capital definitions and measures applicable to any given entity and jurisdiction in which an entity operates. These are supplemented by an internal capital measurement framework that reflects our own risk view. We establish internal targets for capital adequacy that meet or exceed regulatory requirements. This ensures ongoing compliance with regulatory constraints and enables us to properly take into account risk profiles, rating agency expectations and peer comparisons, among other considerations. Management regularly monitors capital against those internal targets and initiates action when appropriate.
Capital is generally allocated to business lines for planning and performance management purposes based on the higher of the internal risk-based capital and the regulatory capital levels.
The currency mix of assets supporting capital is consistent with the currency mix of the Company’s underlying liabilities. The impact of the currency movements on the capital ratios is thus mitigated as both available and required capital rise (fall) when the Canadian dollar weakens (strengthens).
As part of our annual DCAT, we assess the strength of our capital position under severe shock scenarios. The scenarios are determined each year to ensure their ongoing relevance to our business and risk profile. The 2008 results, updated in December 2008, indicated that the Company’s capital levels provided for sufficient assets to discharge liabilities and to retain positive surplus in the catastrophic scenarios tested. These scenarios included tests of equity market, credit, interest rate and mortality risk, amongst others.
Capital quality is maintained by limiting the amount of debt capital or non-permanent equity capital in the capital structure. The composition of capital between equity and other instruments remains well within regulatory constraints. The Company monitors and rebalances its capital mix through opportunistic capital issuances, capital repurchases and redemptions.
The following measure of available capital serves as the foundation of our capital management activities at the MFC level. For regulatory reporting purposes, the numbers are further adjusted for various additions or deductions to capital as mandated by the guidelines issued by the Office of the Superintendent of Financial Institutions (“OSFI”).
Consolidated Capital
| | | | | | | | | |
As at December 31, (Canadian $ in millions) | | 2008 | | | 2007 | | 2006 | | |
Equity | | $27,664 | | | $22,406 | | $25,018 | | |
Preferred shares | | 982 | | | 982 | | 982 | | |
Innovative instruments | | 1,000 | | | 1,000 | | 1,000 | | |
Subordinated debentures | | 1,195 | | | 1,196 | | 1,195 | | |
AOCI on AFS securities(1) | | (529 | ) | | 1,327 | | – | | |
Other capital instruments | | 582 | | | 470 | | 1,156 | | |
Non-controlling interest in subsidiaries | | 217 | | | 146 | | 202 | | |
Total capital | | $31,111 | | | $27,527 | | $29,553 | | |
(1) | The Company adopted CICA Handbook section 3855 on January 1, 2007 and therefore 2006 does not include AOCI on AFS securities. |
The Company’s capital increased by $3,584 million compared to prior year. The increase was primarily due to the common equity issuance of $2,275 million, net income of $497 million and other comprehensive income of $4,409 million from currency translation of net foreign operations. The impact of these items on the level of capital was partially offset by the $1,856 million decline in AFS securities due to the market turmoil, $1,524 million of dividends paid to shareholders and $403 million of share repurchases.
Designated committees of the Board of Directors review and approve Manulife Financial’s capital management policies. Each quarter the ARMC reviews the Company’s capital position. Annually, the Chief Actuary discusses with the Board key sensitivities of the Company’s capital position as assessed in the context of annual DCAT. Operational oversight of capital management is provided by the Finance Committee, consisting of senior finance, risk management and investment executives and chaired by the Chief Financial Officer. The committee oversees capital policies and reviews issues and initiatives that affect the capital position of MFC’s subsidiaries and the Company as a whole.
Common Shareholder Dividend and Target Dividend Payout Ratio
The target common shareholder dividend payout is a range of 25 per cent to 35 per cent of net income. On August 7, 2008, the Company announced an increase in the quarterly shareholders’ dividend from $0.24 to $0.26 per common share.
The dividends per common share paid in cash and the common share dividend payout ratio in the last three years were:
| | | | | | | | |
| For the years ended December 31, | | 2008 | | 2007 | | 2006 | | |
Dividends per common share paid in cash | | $1.00 | | $0.88 | | $0.73 | | |
Common share dividend payout ratio | | 307% | | 31% | | 29% | | |
| | Note: | On June 2, 2006, MFC paid a stock dividend of one common share on each of its issued and outstanding common shares. The effect is the same as a two-for-one split of MFC’s common shares. |
In 2008, the common share dividend payout ratio was 39 per cent for the first half of the year. It rose considerably in the later half of 2008 due to the earnings reduction caused by the unprecedented market turmoil.
Capital and Funding Activities
In analyzing capital at the MFC consolidated level, we primarily consider equity as well as subordinated long-term instruments, in alignment with OSFI’s regulatory capital definitions. While we also raise unsubordinated funding from MFC which may be deployed in our downstream entities as capital, at the MFC consolidated level such senior indebtedness is not considered capital.
In 2008, we issued $2,318 million and repurchased $403 million of common shares. We also raised a net amount of $2,338 million in other funding. Details of these activities are provided below.
On December 11, 2008, we issued $2,275 million of common shares including $1,125 million sold by way of private placement to eight existing institutional investors. The remaining $1,150 million, inclusive of a fully subscribed over-allotment of $150 million, was sold to a syndicate of underwriters in a “bought deal” public offering.
During 2008, 2.6 million common shares were issued pursuant to the exercise of stock options and the settlement of deferred share units for a total consideration of $43 million. MFC purchased and subsequently cancelled 11 million common shares pursuant to normal course issuer bids (“NCIB”) at a total cost of $403 million. The NCIB expired on November 8, 2008, and was not renewed.
In addition to the above capital activities, the following financing transactions took place during the year.
On June 26, 2008, the Company raised $950 million of medium term notes constituting senior indebtedness. The medium term notes were issued in two tranches of $550 million of 5.161% notes and $400 million of 5.505% notes, maturing in 2015 and 2018, respectively.
On November 6, 2008, the Company executed a binding credit agreement with leading Canadian banks to provide a loan of $3 billion. Subsequent to the common equity offering in December 2008, the credit facility was reduced to $2 billion. The five year term loan is repayable at the Company’s option at any time without penalty, and it is priced on a floating rate basis at one month Bankers Acceptance plus 3.80%.
On December 1, 2008, the Company repaid US$500 million of maturing 5.625% senior notes.
In 2007, MFC issued 9.5 million common shares for a total consideration of $251 million pursuant to the acquisition of a subsidiary as well as the exercise of stock options and the settlement of deferred share units. MFC purchased and subsequently cancelled 56.4 million common shares pursuant to NCIB at a total cost of $2,245 million. On February 1, 2007, the Company redeemed US$492.5 million 8.375% Capital Trust Pass-through Securities issued by MIC Financing Trust that qualified as regulatory capital. On December 31, 2007, The Manufacturers Life Insurance Company (“MLI”) redeemed its total outstanding 6.10% non-cumulative Class A, Series 6 preferred shares for $89 million, reducing the amount of the Company’s non-controlling interest in subsidiaries.
As a subsequent event, on March 4, 2009, MFC issued 18 million Non-Cumulative Five Year Rate Reset Class A Preferred Shares, Series 4 at a price of $25 per share, for an aggregate amount of $450 million.
Regulatory Capital Position
The Company monitors and manages consolidated capital for MFC in compliance with the OSFI Guideline A2 – Capital Regime for Regulated Insurance Holding Companies and Non-Operating Life Companies, issued July 5, 2005. Under this regime our consolidated available capital is measured against a required amount of risk capital determined in accordance with the guideline. The capital position of the consolidated MFC holding company remains in excess of our internal targets.
Manulife Financial has established capital targets in excess of regulatory targets for our primary operating subsidiaries. MFC has two principal operating insurance companies: MLI and John Hancock Life Insurance Company (“JHLICO”).
MLI, our principal Canadian operating company, is regulated by OSFI and is subject to MCCSR. MLI’s MCCSR ratio as at December 31, 2008 was 234 per cent (December 31, 2007 – 221 per cent), well in excess of OSFI’s target of 150 per cent. The key driver of the higher ratio in 2008 was the net increase in MLI’s available capital reflecting capital issuances partly offset by dividends paid to MFC and unrealized losses on AFS assets. During the year, the Company took actions to strengthen the regulatory capital position of MLI by internally redeploying excess financial resources, including changes to the terms of $550 million senior note payable to Manulife Finance (Delaware) LLC due December 15, 2016. Under the new terms, the senior note became a subordinated note qualified as MLI’s regulatory capital with the interest rate increased to 90-day Bankers Acceptance plus 0.552%.
The positive impact of MLI’s higher available capital on its capital ratios exceeded the impact of higher required capital. Capital for segregated fund guarantees was the key driver of the required capital increase, with the beneficial impact of changes in regulatory guidelines and other approved modeling refinements related to policyholder behaviour assumptions and interest rates being more than offset by the negative impact of the downturn in equity markets. The revised regulatory guideline for segregated fund guarantees requires higher capital for short-term obligations and reduces capital required to support longer-term payment obligations. Given the Company’s generally long-dated guarantees, the regulatory changes had a beneficial impact on our capital ratios. MLI’s non-consolidated operations and subsidiaries all maintained capital levels in excess of local requirements as at December 31, 2008.In particular Manulife Canada Ltd., an OSFI-regulated Canadian operating insurance company, had an MCCSR ratio of 173 per cent, above the regulatory target of 150 per cent.
JHLICO is domiciled in the State of Massachusetts and reports annually subject to the Risk-Based Capital (“RBC”) requirements of the National Association of Insurance Commissioners (“NAIC”). JHLICO’s RBC ratio changed from 439 per cent as at December 31, 2007 to 405 per cent as at December 31, 2008, as the decline in available capital outpaced lower capital requirements. This ratio is well above the regulatory target of 200 per cent. JHLICO’s operations and subsidiaries all maintained capital levels in excess of local requirements as at December 31, 2008.
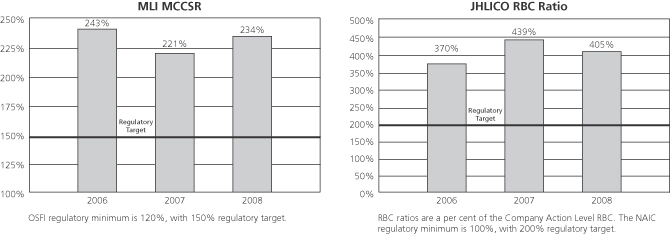
Credit Ratings
The Company’s credit ratings remain among the highest of global financial institutions. Given the global economic turmoil that has adversely impacted financial flexibility of many companies and consistent with the rating agencies’ overall concerns regarding current issues affecting the insurance industry, Manulife Financial, like many of its industry peers, has experienced recent rating downgrades. In the last two months, Standard and Poor’s lowered the AAA financial strength ratings of our operating companies to AA+ with a stable outlook, Moody’s lowered our ratings from Aa1 to Aa3 with a negative outlook, Fitch lowered our ratings from AA+ to AA with a negative outlook and A.M. Best changed its outlook of our A++ ratings from stable to negative. In November 2008, DBRS confirmed our ratings but lowered their outlook from positive to stable.
The following table summarizes our operating company ratings as at March 18, 2009.
Primary Insurance Company Financial Strength/Claims Paying Credit Ratings
| | | | | | | | | | |
| | | S&P | | Moody’s | | DBRS | | Fitch | | A.M. Best |
The Manufacturers Life Insurance Company | | AA+ | | Aa3 | | IC-1 | | AA | | A++ |
John Hancock Life Insurance Company | | AA+ | | Aa3 | | Not Rated | | AA | | A++ |
John Hancock Life Insurance Company (U.S.A.) | | AA+ | | Aa3 | | Not Rated | | AA | | A++ |
Manulife (International) Limited | | AA+ | | Not Rated | | Not Rated | | Not Rated | | Not Rated |
Manulife Life Insurance Company (Japan) | | AA+ | | Not Rated | | Not Rated | | Not Rated | | Not Rated |
Note 8 ^ Risk Management
The Company employs an enterprise-wide approach to all risk taking and risk management activities globally. The Company’s enterprise risk management framework sets out policies and standards of practice related to governance, identification and monitoring, measurement and control and mitigation of key risks. Individual risk management strategies are in place for each specific key risk within the Company’s broad risk categories: strategic, market and liquidity (includes market price, interest rate, foreign currency and liquidity risks), credit, insurance and operational.
Market price and interest rate risk
Due to the nature of the insurance business, invested assets and insurance liabilities as well as revenues and expenses are impacted by movements in capital markets, interest rates and credit spreads. Accordingly, the Company considers these risks together in managing its asset and liability positions and ensuring that risks are properly managed. These risks are referred to collectively as market price and interest rate risk – the risk of loss resulting from adverse movements in market price, interest rates and credit spreads.
In the general fund, market price and interest rate changes may lead to asset returns that are insufficient to support product liabilities and may impact the value of assets held in the Company’s shareholders’ equity account. This level of risk is impacted by the Company’s asset allocation and the nature of embedded product guarantees and policyholder options. Interest rate risk within the general fund arises mainly from the uncertainty of returns that can be achieved on investments to be made in the future as recurring premiums are received, and from any mismatch between the term profile of assets and liabilities. Market price and interest rate risk also arise from minimum rate guarantees and withdrawal options on products where investment returns are generally passed through to policyholders. The performance of capital markets, interest rates, inflation and general economic conditions all influence the performance of the Company’s general fund investments, including bonds, loans, publicly traded and private equities, commercial real estate, timber and agricultural lands and oil and gas investments.
Market price and interest rate risk in the general fund is managed through established policies and standards of practice that limit market price and interest rate risk exposure. Company-wide market price and interest rate risk exposure limits are established and actual positions are monitored against limits. Target asset mixes and term profiles, and risk limits are updated regularly and communicated to individual portfolio managers. Actual asset positions are periodically rebalanced to within established limits.
The market price and interest rate risk arising from the Company’s off-balance sheet products is due mainly to the guarantees provided on variable annuity and insurance products, as well as the uncertainty of future levels of asset-based fees. Guarantees include minimum levels of death, maturity, income and withdrawal benefits on variable products. The Company mitigates its market price and interest rate risk arising from off-balance sheet products through benefit guarantee design, limitations on fund offerings and the use of capital market hedging strategies and reinsurance.
In order to manage the exposure to market price and interest rate risk, the Company monitors invested assets and the liabilities which they support under three broad categories: liabilities supported with matching mandates, liabilities supported with target return mandates, and exposures arising from variable products and other managed assets. Liabilities supported with matching mandates generally include insurance and wealth guaranteed benefit obligations falling within the terms for which fixed income assets are generally available in the market, and are supported by fixed income assets with generally matching term profiles. Liabilities supported with target return mandates include guaranteed benefit obligations falling beyond the term for which fixed income assets are generally available in the market as well as obligations related to products that generally pass through investment returns to policyholders. Assets supporting the shareholders’ equity account are generally managed under a target return mandate.
The following table shows the potential impact on shareholders’ economic value of specific stress scenarios, each one reflecting a shock from December 31st market levels, that reflects a confidence level of approximately 87 per cent over a one-year horizon, according to the Company’s internal models. The stress scenarios are:
| n | | an immediate and permanent increase of one per cent in interest rates for all maturities across all markets, |
| n | | an immediate and permanent decrease of one per cent in interest rates for all maturities across all markets, and |
| n | | an immediate ten per cent decline in the market value of non-fixed income assets. |
Impact on shareholders’ economic value arising from general fund
Shareholders’ economic value for general fund assets is calculated as the net present value of future cash flows related to existing assets, recurring premiums to be received and product benefit and expenses to be paid, all discounted at market yields and adjusted for tax.
| | | | | | | | | | | | | | | | | | | | | | | | | | |
| | | 1% change in interest rates | | | 10% decline in market values(2) | | | |
| As at December 31, 2008 | | Increase | | | Decrease | | | Equities | | | Real estate | | | Timber | | | Other(1) | | | |
Matching mandates | | | | | | | | | | | | | | | | | | | | | | | | | | |
Insurance | | $ | 27 | | | $ | (86 | ) | | | | | | | | | | | | | | | | | | |
Wealth Management | | | (9 | ) | | | 12 | | | | | | | | | | | | | | | | | | | |
Total | | $ | 18 | | | $ | (74 | ) | | | | | | | | | | | | | | | | | | |
Target return mandates | | | | | | | | | | | | | | | | | | | | | | | | | | |
Insurance | | $ | 688 | | | $ | (1,133 | ) | | $ | (142 | ) | | $ | (288 | ) | | $ | (67 | ) | | $ | (61 | ) | | |
Wealth Management | | | 8 | | | | (110 | ) | | | (71 | ) | | | (58 | ) | | | (8 | ) | | | (10 | ) | | |
Shareholders’ equity account | | | (366 | ) | | | 470 | | | | (195 | ) | | | (1 | ) | | | (20 | ) | | | (30 | ) | | |
Total | | $ | 330 | | | $ | (773 | ) | | $ | (408 | ) | | $ | (347 | ) | | $ | (95 | ) | | $ | (101 | ) | | |
(1) | Other assets include agricultural lands and oil and gas holdings. |
(2) | A 10% increase in market values of equities, real estate, timber and other assets would have the exact opposite impact to that displayed above. |
Impact on shareholders’ economic value from variable products and other managed assets
Shareholders’ economic value arising from variable products, mutual funds and institutional asset management operations, is calculated as the net present value of expected after-tax cash flows related to managing these assets and/or providing guarantees discounted at market yields. The table below shows the potential impact on shareholders’ economic value of an immediate ten per cent decline and ten per cent increase in the market value of equity funds.
| | | | | | | | | |
| Change in market values as at December 31, 2008 | | 10% Increase | | 10% Decrease | | | |
Market-based fees | | $ | 346 | | $ | (380 | ) | | |
Variable product guarantees | | $ | 634 | | $ | (800 | ) | | |
Guarantees are also sensitive to changes in interest rates. A one per cent increase in interest rates would improve shareholders’ economic value related to variable product guarantees by $216, while a one per cent decrease in interest rates would diminish shareholders’ economic value related to variable product guarantees by $250. Additional information about guarantees on variable annuities and segregated funds is shown in the table below.
Variable annuity and segregated fund benefit guarantees
| | | | | | | | | | | | |
| As at December 31, 2008 | | Fund
value(2) | | Amount
at risk(2) | | Expected
guarantee
cost(3) | | | |
Maturity / income / withdrawal benefits | | $ | 65,457 | | $ | 20,971 | | | | | | |
Death benefits(1) | | | 8,965 | | | 5,838 | | | | | | |
Total | | $ | 74,422 | | $ | 26,809 | | $ | (135 | ) | | |
(1) | Death benefits include stand-alone guarantees and guarantees in excess of maturity or income guarantees where both are provided on a policy. |
(2) | Amount at risk is the excess of guaranteed values over fund values on all policies where the guaranteed value exceeds the fund value. Fund value and amount at risk are net of amounts reinsured. This amount is not currently payable. |
(3) | The expected guarantee cost is the average, across all investment return scenarios, of the present value of projected future guaranteed benefit payments, net of reinsurance and fee income allocated to support the guarantees. |
In the latter half of 2008, volatility in the global equity markets increased dramatically and market values decreased significantly changing the Company’s exposures arising from variable annuity and segregated fund benefit guarantees.
Guaranteed benefits are contingent and only payable upon death, maturity, withdrawal or annuitization, if fund values remain below guaranteed values. If markets do not recover, liabilities on current in-force business would be due primarily in the period from 2015 to 2038. The amount at risk at December 31, 2008 increased significantly from December 31, 2007 as a result of significant declines in fund values. Commensurate with the increase in the amount at risk, additional reserves were established in 2008 and at December 31, 2008, reserves for these liabilities amounted to $5,783 (2007 – $526).
Although these guaranteed benefits cannot be claimed currently, the accounting valuation of the guarantees is extremely sensitive to short-term changes in market levels. The potential impact on shareholders’ net income arising from variable products and general fund assets supporting policy liabilities, of an immediate ten per cent decline in equity market values was $1,554 at December 31, 2008 (2007 – $352).
Foreign currency risk
Currency risk for financial instruments arises when assets and the liabilities or target capital they support are denominated in different currencies. The Company has a policy of matching the currency of its assets with the currency of the liabilities they support, to mitigate economic exposure to currency exchange rate changes. To limit the impact of changes in foreign exchange rates on regulatory capital ratios, the Company has established a policy of generally matching the currency of the assets in shareholders’ equity to the liabilities they support, up to target capital levels. This policy ensures that changes to the Company’s reported shareholders’ equity are proportionate to changes in the Company’s reported capital requirements, stabilizing capital ratios from the impact of foreign exchange rates, but resulting in variability in reported shareholders’ equity. As at December 31, 2008, the Company did not have a material unmatched currency exposure related to financial instruments.
Liquidity risk
Liquidity risk is the risk of loss from not having access to sufficient funds to meet both expected and unexpected cash demands. Under stressed conditions, unexpected cash demands could arise primarily from an increase in the level of policyholders either systemically terminating policies with cash surrender values, or not renewing policies when they mature, deposit withdrawals and from an increase in the level of borrowers renewing or extending their loans when they mature.
The Company manages its exposure to liquidity risk by ensuring that its operating and strategic liquidity levels are well above minimum internal requirements. Minimum operating liquidity is set at a level of one month’s operating cash outflows. Strategic liquidity is established based on immediate and longer term liquidity requirements under stress conditions whereby policyholder liabilities and liquid assets are risk-adjusted for their potential for withdrawals and convertibility to cash respectively.
The following table outlines the expected maturity of the Company’s significant financial liabilities. The expected maturity dates are based on estimates made by management.
Maturity of financial liabilities(1),(2)
| | | | | | | | | | | | | | | | | |
| As at December 31, 2008 | | Less than
1 year | | 1 to 3
years | | 3 to 5
years | | Over 5
years | | Total | | |
Long-term debt | | $ | 5 | | $ | 408 | | $ | 2,322 | | $ | 954 | | $ | 3,689 | | |
Capital instruments | | | – | | | – | | | – | | | 3,330 | | | 3,330 | | |
Derivative liabilities | | | 374 | | | 657 | | | 628 | | | 4,730 | | | 6,389 | | |
Bank deposits | | | 11,041 | | | 772 | | | 299 | | | 98 | | | 12,210 | | |
Consumer notes | | | 459 | | | 476 | | | 185 | | | 756 | | | 1,876 | | |
Repurchase agreements | | | 1,001 | | | – | | | – | | | – | | | 1,001 | | |
(1) | The amounts shown above are net of the related unamortized deferred issue costs. |
(2) | Class A preferred shares, Series 1 are redeemable by the Company on or after June 19, 2010 by payment of cash or issuance of MFC common shares and are convertible at the option of the holder into MFC common shares on or after December 15, 2015. These shares have not been included in the above table. |
Credit risk
Credit risk is the risk of loss due to the inability or unwillingness of a borrower or counterparty to fulfill its payment obligation to the Company. A pronounced and sustained economic downturn could result in defaults or downgrades, and could lead to increased provisions or impairments related to the Company’s general fund invested assets and off-balance sheet derivative financial instruments, and an increase in provisions for future credit impairments to be included in actuarial liabilities. Counterparty credit exposure arises primarily from derivatives and reinsurance activities. Any of the Company’s reinsurance providers being unable or unwilling to fulfill their contractual obligations related to the liabilities the Company cedes to them could lead to an increase in actuarial liabilities.
The Company’s exposure to credit risk is managed through risk management policies and procedures which include a defined credit evaluation and adjudication process, delegated credit approval authorities and established exposure limits by borrower, corporate connection, quality rating, industry and geographic region. Reinsurance counterparty exposure is measured as both current exposure and potential future exposures reflecting the level of ceded liabilities. Reinsurance and insurance counterparties must also meet minimum risk rating criteria.
The Company also ensures where warranted that mortgages, private placement and bank loans are secured by collateral, the nature of which depends on the credit risk of the counterparty.
An allowance for losses on loans is established when a loan becomes impaired. Provisions for loan losses are calculated to reduce the carrying value of the loans to estimated net realizable value. The establishment of such provisions takes into consideration normal historical credit loss levels and future expectations, with an allowance for adverse deviations. In addition, actuarial liabilities include general provisions for credit losses from future asset impairments. Impairments are identified through regular monitoring of all credit related exposures, considering such information as general market conditions, industry and borrower specific credit events and any other relevant trends or conditions. Allowance for losses on reinsurance contracts is established when a reinsurance counterparty becomes unable or unwilling to fulfill their contractual obligations. The allowance for loss is based on current recoverables and ceded actuarial liabilities.
Credit risk associated with derivative counterparties is discussed under the heading Derivatives later in this note.
Credit exposure
The following table outlines the gross carrying amount of financial instruments subject to credit exposure, without taking into account any collateral held or other credit enhancements.
| | | | | |
| As at December 31, 2008 | | | | |
Bonds | | | | | |
Fair value option | | $ | 70,399 | | |
Available-for-sale | | | 12,749 | | |
Loans | | | | | |
Mortgages | | | 30,963 | | |
Private placements | | | 25,705 | | |
Policy loans | | | 7,533 | | |
Bank loans | | | 2,384 | | |
Derivative assets | | | 7,883 | | |
Accrued investment income | | | 1,760 | | |
Other financial assets | | | 2,152 | | |
Total | | $ | 161,528 | | |
Past due or impaired financial assets
The following table summarizes the Company’s financial assets that are considered past due or impaired.
| | | | | | | | | | | | | | | | |
| | | Past due but not impaired | | | | | | |
Carrying value of financial assets As at December 31, 2008 | | Less than
90 days | | 90 days
and
greater | | Total past
due but not
impaired | | | | Total
impaired | | |
Bonds | | | | | | | | | | | | | | | | |
Fair value option | | $ | 352 | | $ | 7 | | $ | 359 | | | | $ | 91 | | |
Available-for-sale | | | 57 | | | 19 | | | 76 | | | | | 8 | | |
Loans | | | | | | | | | | | | | | | | |
Private placements | | | 344 | | | 81 | | | 425 | | | | | 183 | | |
Mortgages and bank loans | | | 49 | | | 18 | | | 67 | | | | | 51 | | |
Equities and other investments | | | – | | | – | | | – | | | | | 603 | | |
Other financial assets | | | – | | | 37 | | | 37 | | | | | – | | |
Total | | $ | 802 | | $ | 162 | | $ | 964 | | | | $ | 936 | | |
Impairments
The Company provides for credit risk by establishing allowances against the carrying value of impaired loans, recognizing other than temporary impairments on AFS securities and reclassifying into income the other than temporary impairment portion of unrealized losses on bonds designated as fair value option. In addition, the Company provides for potential future impairments by reducing investment yields assumed in the calculation of policy liabilities.
| | | | | | | | | |
| For the years ended December 31, | | 2008 | | 2007 | | | |
Bonds | | | | | | | | | |
Fair value option | | $ | 476 | | $ | 8 | | | |
Available-for-sale | | | 46 | | | 4 | | | |
Equities (public and private) | | | 353 | | | 73 | | | |
Loans and other | | | 175 | | | (43 | ) | | |
Total impairments | | $ | 1,050 | | $ | 42 | | | |
Net impaired assets
| | | | | | | | | | |
| As at December 31, | | 2008 | | | 2007 | | | |
Net impaired assets | | $ | 936 | | | $ | 240 | | | |
Net impaired assets as a per cent of total invested assets | | | 0.50 | % | | | 0.15 | % | | |
Allowance for loan losses
| | | | | | | | | | | | | | | | | | | | | | | | | | | | |
| For the year ended December 31, | | 2008 | | | | | 2007 | | | |
| | Mortgages and
bank loans | | | Private
placements | | | Total | | | | | Mortgages and
bank loans | | | Private
placements | | | Total | | | |
Balance, January 1 | | $ | 23 | | | $ | 53 | | | $ | 76 | | | | | $ | 61 | | | $ | 73 | | | $ | 134 | | | |
Provisions | | | 23 | | | | 146 | | | | 169 | | | | | | 18 | | | | 37 | | | | 55 | | | |
Recoveries | | | (6 | ) | | | (1 | ) | | | (7 | ) | | | | | (39 | ) | | | (39 | ) | | | (78 | ) | | |
Write-offs(1) | | | 3 | | | | (33 | ) | | | (30 | ) | | | | | (17 | ) | | | (18 | ) | | | (35 | ) | | |
Balance, December 31 | | $ | 43 | | | $ | 165 | | | $ | 208 | | | | | $ | 23 | | | $ | 53 | | | $ | 76 | | | |
(1) | Includes disposals and impact of currency translation. |
Securities lending
The Company engages in securities lending to generate fee income. Collateral, which exceeds the market value of the loaned securities, is retained by the Company until the underlying security has been returned to the Company. The market value of the loaned securities is monitored on a daily basis with additional collateral obtained or refunded as the market value of the underlying loaned securities fluctuates. As at December 31, 2008, the Company had loaned securities (which are included in invested assets) with a market value of approximately $1,213 (2007 – $3,692). The Company holds collateral with a current market value that exceeds the value of securities lent in all cases.
Mortgage securitization
During 2008, the Company securitized and sold insured fixed- and variable-rate commercial and residential mortgages through the creation of mortgage backed securities under the Canada Mortgage Bond Program and the Government of Canada NHA MBS Auction program. The Company will continue to service these mortgages. The following table summarizes the securitization and sales activity.
| | | | | | | | | | | |
| For the year ended December 31, 2008 | | Residential
mortgages | | Commercial
mortgages | | Total | | |
Securitized and sold | | $ | 120 | | $ | 310 | | $ | 430 | | |
Net cash proceeds | | | 117 | | | 305 | | | 422 | | |
Retained interests | | | 6 | | | 27 | | | 33 | | |
Pre-tax gain on sale | | | 3 | | | 22 | | | 25 | | |
Derivatives
The Company’s exposure to loss on derivatives is limited to the amount of any net gains with a particular counterparty. Derivative counterparty exposure is measured as net potential credit exposure, which takes into consideration mark-to-market values of all derivatives transactions with each counterparty, net of any collateral held, and an allowance to reflect future potential exposure. The Company seeks to limit the risk of credit losses from derivative counterparties by: establishing a minimum acceptable counterparty credit rating of A- from external rating agencies; entering into master netting arrangements; and entering into Credit Support Annex (“CSA”) agreements, whereby collateral must be provided when the exposure exceeds a certain threshold.
As at December 31, 2008, the percentage of the Company’s derivative exposure which were with counterparties rated AA- or higher amounted to 62 per cent (2007 – 82 per cent). The largest single counterparty exposure as at December 31, 2008 was $100 (2007 – $170). The Company’s exposure to credit risk was mitigated by $3,521 fair value of collateral held as security as at December 31, 2008 (2007 – $881). In accordance with customary terms of CSA agreements, the Company is permitted to sell or repledge collateral held.
As at December 31, 2008, the maximum exposure to credit risk related to derivatives after taking into account netting agreements and without taking into account the fair value of any collateral held, was $4,520 (2007 – $1,385). Without master netting agreements, maximum exposure to credit risk would have been $7,883 (2007 – $2,129).
Risk concentrations
The Company establishes enterprise-wide investment portfolio level targets and limits to ensure that portfolios are widely diversified across asset classes and individual investment risks. The Company monitors actual investment positions and risk exposures for concentration risk and reports such findings to the Executive Risk Committee and the Audit and Risk Management Committee of the Board of Directors on a regular basis.
| | | | | | | | |
Market risk concentrations As at December 31, | | 2008 | | | | 2007 | | |
Bonds and private placements rated as investment grade BBB or higher(1) | | 95% | | | | 96% | | |
Government bonds as a per cent of total bonds | | 29% | | | | 30% | | |
Government private placements as a per cent of total private placements | | 18% | | | | 17% | | |
Highest exposure to a single non-government bond and private placement issuer | | $829 | | | | $524 | | |
Largest single issuer as a per cent of the total stock portfolio | | 6% | | | | 5% | | |
Publicly listed corporations as a per cent of total stock portfolio | | 99% | | | | 99% | | |
Income producing commercial office properties | | $5,057 | | | | $4,115 | | |
(2008 – 70% of total real estate, 2007 – 72%) | | | | | | | | |
Largest concentration of mortgages and real estate(2) – Ontario, Canada | | $8,803 | | | | $8,417 | | |
(2008 – 23%, 2007 – 26%) | | | | | | | | |
(1) | Investment grade bonds include 31% rated A, 20% rated AA and 20% rated AAA (2007 – 29%, 22% and 22%, respectively) based on external ratings where available. |
(2) | Mortgages and real estate are diversified geographically and by property type. |
The following table shows the distribution of the bond and private placement portfolio by sector and industry.
| | | | | | | | | | | | | | |
Bonds and private placements As at December 31, | | 2008 | | | | 2007 | | |
| | Fair value | | % of total | | | | Fair Value | | % of total | | |
Government & agency | | $ | 28,537 | | 27 | | | | $ | 25,383 | | 27 | | |
Financial | | | 22,348 | | 21 | | | | | 21,048 | | 22 | | |
Utilities | | | 15,951 | | 15 | | | | | 12,475 | | 13 | | |
Securitized (ABS/MBS) | | | 8,885 | | 8 | | | | | 9,218 | | 10 | | |
Energy | | | 7,468 | | 7 | | | | | 5,761 | | 6 | | |
Industrial | | | 6,119 | | 6 | | | | | 5,364 | | 6 | | |
Consumer (non-cyclical) | | | 5,197 | | 5 | | | | | 4,869 | | 5 | | |
Other | | | 12,913 | | 11 | | | | | 10,286 | | 11 | | |
Total | | $ | 107,418 | | 100 | | | | $ | 94,404 | | 100 | | |
Insurance risk
Insurance risk is the risk of loss due to actual experience differing from the experience assumed when a product was designed and priced with respect to claims, policyholder behaviour and expenses. A variety of assumptions are made related to the future level of claims, policyholder behaviour, expenses and sales levels when products are designed and priced as well as in the determination of actuarial liabilities. The development of assumptions for future claims are based on Company and industry experience; assumptions for policyholder behaviours are based on Company experience and predictive models. Such assumptions require a significant amount of professional judgment and therefore, actual experience may be materially different than the assumptions made by the Company. Claims may be impacted by the unusual onset of disease or illness, natural disasters, large-scale manmade disasters and acts of terrorism. Policyholder premium payment patterns, policy renewal, withdrawal and surrender activity is influenced by many factors including market and general economic conditions, and the availability and price of other products in the marketplace.
The Company manages insurance risk through global product design, pricing standards and guidelines and a global life underwriting manual. Each business unit establishes underwriting policies and procedures, including criteria for approval of risks and claims adjudication policies and procedures. The Company’s current global retention limit for a single life is US$20 (US$25 for survivorship life policies) and is shared across business units. Lower limits are applied in some markets and jurisdictions. The Company further reduces exposure to claims concentrations by applying geographical aggregate retention limits for certain covers.
Reinsurance risk
In the normal course of business, the Company limits the amount of loss on any one policy by reinsuring certain levels of risk with other insurers. In addition, the Company accepts reinsurance from other reinsurers. Reinsurance ceded does not discharge the Company’s liability as the primary insurer. Failure of reinsurers to honour their obligations could result in losses to the Company; consequently, allowances are established for amounts deemed uncollectible. In order to minimize losses from reinsurer insolvency, the Company monitors the concentration of credit risk both geographically and with any one reinsurer. In addition, the Company selects reinsurers with high credit ratings.
The effect of reinsurance on premium income was as follows:
| | | | | | | | | | |
| For the years ended December 31, | | 2008 | | | 2007 | | | |
Direct premium income | | $ | 23,891 | | | $ | 20,359 | | | |
Reinsurance assumed | | | 1,433 | | | | 1,400 | | | |
Reinsurance ceded | | | (2,072 | ) | | | (2,015 | ) | | |
Total premium income | | $ | 23,252 | | | $ | 19,744 | | | |
Critical Accounting and Actuarial Policies
The preparation of financial statements in accordance with Canadian GAAP requires management to make estimates and assumptions that affect the reported amounts and disclosures made in the consolidated financial statements and accompanying notes. These estimates and assumptions are based on historical experience, management’s assessment of current events and conditions and activities that the Company may undertake in the future as well as possible future economic events. Actual results could differ from these estimates. The estimates and assumptions described in this section depend upon subjective or complex judgments about matters that may be uncertain and changes in these estimates and assumptions could materially impact the consolidated financial statements.
Our significant accounting policies are described in note 1 to the consolidated financial statements. Significant estimation processes relate to the determination of policy liabilities, evaluation of invested asset impairment, assessment of variable interest entities, determination of pension and other post-employment benefit obligations and expenses, income taxes and valuation of goodwill and intangible assets as described below. In addition, in the determination of the fair values of financial instruments, where observable market data is not available, management applies judgment in the selection of valuation models.
Policy Liabilities
Policy liabilities for Canadian GAAP are valued under standards established by the Canadian Institute of Actuaries. These standards are designed to ensure we establish an appropriate liability on the balance sheet to cover future obligations to all our policyholders. Under Canadian GAAP, the assumptions underlying the valuation of policy liabilities are required to be reviewed and updated on an ongoing basis to reflect recent and emerging trends in experience and changes in risk profile of the business. In conjunction with prudent business practices to manage both product and asset related risks, the selection and monitoring of appropriate valuation assumptions are designed to minimize our exposure to measurement uncertainty related to policy liabilities.
Determination of Policy Liabilities
Policy liabilities have two major components: a best estimate amount and a provision for adverse deviation. The best estimate amount represents the estimated value of future policyholder benefits and settlement obligations to be paid over the term remaining on in-force policies, including the costs of servicing the policies. The best estimate amount is reduced by the future expected policy revenues and future expected investment income on assets supporting the policies, adjusted for the impact of any reinsurance ceded associated with the policies. Reinsurance is used to transfer part or all of a policy liability to another insurance company at terms negotiated with that insurance company. To determine the best estimate amount, assumptions must be made for a number of key factors, including future mortality and morbidity rates, investment returns, rates of policy termination, operating expenses, certain taxes and foreign currency.
To recognize the uncertainty involved in determining the best estimate actuarial liability assumptions, a provision for adverse deviation (“PfAD”) is established. The PfAD is determined by including a margin of conservatism for each assumption to allow for possible deterioration in experience and to provide greater comfort that the policy liabilities will be adequate to pay future benefits. The Canadian Institute of Actuaries establishes suggested ranges for the level of margins for adverse deviation based on the risk profile of the business. We use assumptions at the prudent end of the suggested ranges, taking into account the risk profile of our business. The effect of these margins is to increase policy liabilities over the best estimate assumptions. The margins for adverse deviation decrease the income that is recognized when a new policy is sold and increase the income recognized in later periods, with the margins releasing as the policy risks reduce.
Best Estimate Assumptions
We follow established processes to determine the assumptions used in the valuation of our policy liabilities. The nature of each risk factor and the process for setting the assumptions used in the valuation are discussed below.
Mortality: Mortality relates to the occurrence of death. Mortality assumptions are based on our internal as well as industry past and emerging experience and are differentiated by sex, underwriting class, policy type and geographic market. To offset some of this risk, we reinsure mortality risk on in-force policies to other insurers and the impact of the reinsurance is directly reflected in our policy valuation. Actual mortality experience is monitored against these assumptions separately for each business. Overall 2008 experience was favourable when compared with our assumptions.
Morbidity: Morbidity relates to the occurrence of accidents and sickness for the insured risks. Morbidity assumptions are based on our internal as well as industry past and emerging experience and are established for each type of morbidity risk and geographic market. Actual morbidity experience is monitored against these assumptions separately for each business. Overall 2008 experience was unfavourable when compared with our assumptions.
Policy Termination and Premium Persistency: Policy termination includes lapses and surrenders, where lapses represent the termination of policies due to non-payment of premiums and surrenders represent the voluntary termination of policies by policyholders. Premium persistency represents the level of ongoing deposits on contracts where there is policyholder discretion as to the amount and timing of deposits. Policy termination and premium persistency assumptions are primarily based on our recent experience
adjusted for expected future conditions. Assumptions reflect differences by type of contract within each geographic market and actual experience is monitored against these assumptions separately for each business. Overall 2008 experience was unfavourable when compared to our assumptions.
Expenses and Taxes: Operating expense assumptions reflect the projected costs of maintaining and servicing in-force policies, including associated overhead expenses. The expenses are derived from internal cost studies and are projected into the future with an allowance for inflation. For some developing businesses, there is an expectation that unit costs will decline as these businesses mature. Actual expenses are monitored against assumptions separately for each business. Overall maintenance expenses for 2008 were favourable when compared with our assumptions. Taxes reflect assumptions for future premium taxes and other non-income related taxes. For income taxes, policy liabilities are adjusted only for temporary tax timing and permanent tax rate differences on the cash flows available to satisfy policy obligations.
Investment Returns: We segment assets to support liabilities by business segment and geographic market and establish investment strategies appropriate to each liability segment. The projected cash flows from these assets are combined with projected cash flows from future asset purchases/sales to determine expected rates of return for all future years. The investment strategies for future asset purchases and sales are based on our target investment policies for each segment and the re-investment returns are derived from current and projected market rates for fixed interest investments and our projected outlook for non-fixed interest assets. In 2008, non-fixed income returns were unfavourable when compared to our assumptions, primarily as a result of poor public equity markets. Investment return assumptions include expected future credit losses on fixed income investments. Credit losses are projected based on our own and industry experience, as well as specific reviews of the current investment portfolio. In 2008, credit loss experience was unfavourable when compared to our assumptions. Investment return assumptions for each asset class also incorporate expected investment management expenses that are derived from internal cost studies.
Foreign Currency: Foreign currency risk results from a mismatch of the currency of the policy liabilities and the currency of the assets designated to support these obligations. Because we have a policy of matching the currency of our assets with the currency of the liabilities they support, there is little exposure related to unfavourable movements in foreign exchange rates in the valuation. Where a currency mismatch exists, the assumed rate of return on the assets supporting the liabilities is reduced to reflect the potential for adverse movements in exchange rates.
Experience Adjusted Products: Where policies have features that allow the impact of changes in experience to be passed on to policyholders through policy dividends, experience rating refunds, credited rates or other adjustable features, the projected policyholder benefits are adjusted to reflect the projected experience. Minimum contractual guarantees and other market considerations are taken into account in determining the policy adjustments.
Provision for Adverse Deviation
The provision for adverse deviation is the sum of the total margins for adverse deviation for each risk factor. Margins for adverse deviation are established by product type and geographic market for each assumption or factor used in the determination of the best estimate actuarial liability. The margins are established based on the risk characteristics of the business being valued.
In addition to the explicit margin for adverse deviation, the valuation basis for segregated fund liabilities explicitly limits the future revenue recognition in the valuation basis to the amount necessary to offset acquisition expenses, after allowing for the cost of any guarantee features. This limitation is reported as an additional margin and is shown in segregated fund non-capitalized margins.
The provision for adverse deviation and the future revenue deferred in the valuation due to the limitations on recognition of future revenue in the valuation of segregated fund liabilities are shown in the table below.
As at December 31,
| | | | | | | | |
| (Canadian $ in millions) | | 2008 | | 2007 | | |
Best estimate actuarial liability | | $ | 102,446 | | $ | 96,030 | | |
Provision for Adverse Deviation | | | | | | | | |
Insurance risks (mortality/morbidity) | | $ | 8,168 | | $ | 6,167 | | |
Policyholder behavior (lapse/surrender/premium persistency) | | | 3,249 | | | 2,544 | | |
Expenses | | | 1,165 | | | 918 | | |
Investment risks (non-credit) | | | 16,588 | | | 9,932 | | |
Investment risks (credit) | | | 1,398 | | | 1,161 | | |
Segregated fund guarantees | | | 4,747 | | | 457 | | |
Other | | | 362 | | | 443 | | |
Total Provision for Adverse Deviation (PfAD) | | $ | 35,677 | | $ | 21,622 | | |
Segregated funds – additional margins | | | 9,144 | | | 11,548 | | |
Total of PfAD and additional segregated fund margins | | $ | 44,821 | | $ | 33,170 | | |
Reported actuarial liabilities as at December 31, 2008 of $138,123 million (2007 – $117,652 million) are composed of $102,446 million (2007 – $96,030 million) of best estimate actuarial liability and $35,677 million (2007 – $21,622 million) of PfAD.
Significant increases in PfADs were as a result of currency movements, movements in market spreads on fixed income assets, revisions to investment strategies supporting policy liabilities that increase the use of non fixed income assets, and an increase in the margins for segregated fund guarantees due to the impact of the adverse 2008 equity markets on the potential future cost of these guarantees.
Currency movements increased the PfADs $5,887 million primarily due to the weakening of the Canadian dollar versus the U.S. dollar and Japanese yen. The increase in market spreads on fixed income assets increases the expected re-investment rates in the valuation but generates higher margins for spread compression in the valuation. The increase in margins as a result of the investment strategy changes was as a result of the greater projected use of non fixed income assets in the investment portfolios supporting policy liabilities, and is largely offset by a corresponding reduction in expected reserves due to higher expected returns. Both of these items are reflected in Investment Risks (non-credit). Virtually all the positive segregated fund guarantee reserves, including the new reserves established in 2008 as equity markets corrected, represent required margins, as the actual present value of the expected costs before margins for adverse deviations remains minimal.
The decrease in additional margins on segregated funds is the result of lower segregated fund balances due to the poor 2008 equity markets and consequent reduced future projected net revenues.
Sensitivity of Policy Liabilities to Changes in Assumptions
When our assumptions are updated to reflect recent and emerging experience or change in outlook, the result is a change in the value of policy liabilities which in turn affects income. The sensitivity of after tax income to changes in assumptions underlying policy liabilities is shown below, assuming that there is a simultaneous change in the assumption across all business units. For changes in asset related assumptions, the sensitivity is shown net of the corresponding impact on income of the change in the value of the assets supporting liabilities. In practice, experience for each assumption will frequently vary by geographic market and business and assumption updates are made on a business/geographic specific basis.
Sensitivity of Policy Liabilities to Changes in Assumptions
| | | | | | | | | | | | |
| As at December 31, | | | | | | | | | | | | |
| (Canadian $ in millions) | | Increase (Decrease) in After Tax Income | | | | | |
| | | 2008 | | | | | 2007 | | | | | |
Policy Related Assumptions | | | | | | | | | | | | |
2% adverse change in future mortality rates | | | | | | | | | | | | |
Products where an increase in rates increases policy liabilities | | $ (293 | ) | | | | $ (198 | ) | | | | |
Products where a decrease in rates increases policy liabilities | | (213 | ) | | | | (132 | ) | | | | |
5% increase in future morbidity rates | | (952 | ) | | | | (696 | ) | | | | |
10% adverse change in future termination rates | | (925 | ) | | | | (586 | ) | | | | |
5% increase in future expense levels | | (310 | ) | | | | (246 | ) | | | | |
Asset Related Assumptions | | | | | | | | | | | | |
100 basis point parallel decrease in market interest rates | | $(1,336 | ) | | | | $ (452 | ) | | | | |
100 basis point parallel increase in market interest rates | | 1,138 | | | | | 369 | | | | | |
10% reduction in non fixed income market values | | (2,079 | ) | | | | (572 | ) | | | | |
100 basis point reduction in future annual returns for non fixed income assets | | (3,447 | ) | | | | (1,481 | ) | | | | |
| n | | An increase in mortality rates will generally increase policy liabilities for life insurance contracts whereas a decrease in mortality rates will generally increase policy liabilities for policies with longevity risk such as payout annuities. |
| n | | No amounts related to morbidity risk are included for policies where the policy liability provides only for claims costs expected over a short period, generally less than one year, such as Group Life and Health. |
| n | | Changes in market interest rates reflect a change to the initial market interest rates, but assume that ultimate long-term fixed income re-investment rates (“URRs”) for new investments are unchanged. If the long-term URRs were to be changed by a similar amount to the initial market interest rates, so that the valuation reflected a permanent shift in market interest rates available for all future re-investments, the after tax income decreases by $2,668 million for a 100 basis point decrease in interest rates, and increases by $2,146 million for a 100 basis point increase in interest rates. |
| n | | The sensitivities for level of future market interest rates are calculated based on adjusting the interest rates in the current valuation interest scenario used to determine policy liabilities, and do not reflect potential additional costs from full prescribed scenario testing. |
| n | | Non fixed income assets include both common and private equities, all forms of real estate, and any other non fixed income instruments supporting policy liabilities. The $(2,079) million after tax income impact for a 10% reduction in non fixed income market values consists of $(1,660) million related to common and private equities, and $(419) million related to real estate and other non fixed income assets. The $(3,447) million after tax income impact for a 100 basis point reduction in future annual returns consists of $(2,232) million related to common and private equities and $(1,215) million related to real estate and other non fixed income assets. |
| n | | A large portion of the change in the level of the sensitivities from 2007 to 2008 is caused by changes in foreign exchange rates, particularly the appreciation of the U.S. dollar versus the Canadian dollar. |
| n | | The increase in the sensitivity to changes in market rates reflects a change in the current valuation interest scenario used to determine policy liabilities under which interest rates grade more slowly to the ultimate rates. |
| n | | The increase in sensitivity to changes in market interest rates reflects a change in the valuation interest scenario used to determine policy liabilities. The new scenario adopted in 2008 is based on a grading from current market interest rates to assumed ultimate re-investment rates over 20 years. Under Canadian GAAP, we must test a number of prescribed interest scenarios. The interest scenario we have adopted uses the structure of the prescribed scenario that currently produces the highest policy liability, with additional prudence introduced through use of lower ultimate re-investment rates than the maximum levels permitted. |
| n | | The increase in sensitivity to non fixed income market values reflects the increased sensitivity of segregated fund guarantee policy liabilities to changes in equity market levels. As a result of the severe 2008 global equity market corrections both the liability for existing guarantees and the sensitivity of this liability to changes in equity market levels have increased materially. |
Review of Actuarial Methods and Assumptions
The 2008 review of the actuarial methods and assumptions underlying policy liabilities produced a net reduction in the policy liabilities of $482 million. Net of the impacts on participating surplus and minority interests, this resulted in an increase in 2008 shareholders’ income of pre-tax $454 million.
Impact of 2008 Review by Category of Change
(Canadian $ in millions)
| | | | |
| Assumption | | Reserve Impact Increase (Decrease) | |
| Mortality / morbidity | | $ | (647 | ) |
| Lapses and other policyholder behaviour | | | 699 | |
| Expense | | | (570 | ) |
| Investment returns | | | 164 | |
| Other valuation model refinements and assumption updates | | | (128 | ) |
| Net release of policy liabilities | | $ | (482 | ) |
Note: For all segregated fund insurance and wealth management policies, as well as certain general account wealth management policies in North America, the policy liabilities are updated quarterly to reflect the impact of market interest rates and non-fixed income market values. The impact of the update is reflected directly in each reporting segment’s earnings.
Impact of 2008 Review by Category of Change
(Canadian $ in millions)
| | | | | | |
| Assumption | | | | | |
| Mortality / morbidity | | $ | (647 | ) | | Reduction is driven mainly by mortality releases for U.S. Insurance, with lesser increases in Reinsurance and Canadian Insurance and Long Term Care incidence and termination rates. Offsetting these decreases were increases in assumptions for Hong Kong hospital claims assumptions, reduced mortality assumptions for Long Term Care (which leads to higher reserves) and minor strengthening in other lines. |
| Lapses and other policyholder behaviour | | | 699 | | | Increases driven by updates to lapse assumptions and premium persistency assumptions for most insurance lines, as well as updates for rates of annuitization for certain U.S. annuity products. |
| Expense | | | (570 | ) | | Release in reserves is driven by decreases in expenses for U.S. Insurance, as well as refinements to the allocation of certain overhead expenses between maintenance and acquisition. A review of premium taxes in U.S. Life insurance also led to a reserve reduction. |
| Investment returns | | | 164 | | | Increases in reserves are attributed to updates to expected returns for real estate and other non fixed income assets. These increases were offset by the net impact of reflecting in the future investment returns the projected impact of the recently adopted long tail investment strategy and the related impact on the interest rate risk scenario used to determine the Company’s interest rate risk reserves. |
| Other valuation model refinements and assumption updates | | | (128 | ) | | There was a net release in reserves from the release of excess margins in interest rate risk reserves. This was offset by establishment of segregated fund guarantee reserves incremental to normal policy reserve accruals and a net increase in reserves due to refinements of existing reserve modeling for insurance and Long Term Care businesses. |
Total | | $ | (482 | ) | | |
Note: For all non-participating policies, excluding certain minor Asian lines of business, the policy liabilities are updated quarterly to reflect the impact of market interest rates and non-fixed income market values. The impact of the update is reflected directly in each reporting segment’s earnings.
The change in policy liabilities in respect of the review of assumptions was $(506) million for the fourth quarter of 2008, and $24 million in aggregate for the first three quarters of 2008.
Change in Policy Liabilities
The change in policy liabilities can be attributed to several sources: new business, acquisitions, in-force movement and currency impact. Changes in policy liabilities are substantially offset in the financial statements by premiums, investment income, policy benefits and other policy related cash flows. The changes in policy liabilities by business segment are shown below:
2008 Policy Liability Movement Analysis
| | | | | | | | | | | | | | | | | | | | | | | | | | | |
| (Canadian $ in millions) | | U.S.
Insurance | | U.S. Wealth
Management | | | Canadian
Division | | | Asia and
Japan
Division | | | Reinsurance
Division | | | Corporate
and
Other | | | Total | |
| Balance, January 1, 2008 | | $ | 41,096 | | $ | 30,648 | | | $ | 36,649 | | | $ | 13,913 | | | $ | 1,621 | | | $ | 495 | | | $ | 124,422 | |
| New business | | | 846 | | | 4,447 | | | | 289 | | | | (99 | ) | | | (26 | ) | | | – | | | | 5,457 | |
| In-force movement | | | 1,920 | | | (5,347 | ) | | | (1,773 | ) | | | 790 | | | | (10 | ) | | | (455 | ) | | | (4,875 | ) |
| Currency impact | | | 9,773 | | | 6,907 | | | | 6 | | | | 4,088 | | | | 269 | | | | 12 | | | | 21,055 | |
Total net changes | | $ | 12,539 | | $ | 6,007 | | | $ | (1,478 | ) | | $ | 4,779 | | | $ | 233 | | | $ | (443 | ) | | $ | 21,637 | |
Balance, December 31, 2008 | | $ | 53,635 | | $ | 36,655 | | | $ | 35,171 | | | $ | 18,692 | | | $ | 1,854 | | | $ | 52 | | | $ | 146,059 | |
For new business, the segments with large positive general account premium revenue at contract inception show increases in policy liabilities. For segments where new business deposits are primarily into segregated funds, the increase in policy liabilities related to new business is small since the increase measures only general account liabilities.
The increase in policy liabilities from currency reflects the appreciation of the U.S. dollar and Japanese yen versus the Canadian dollar. As assets are currency matched to liabilities, the increase in policy liabilities due to currency is offset by a corresponding reduction from currency in the value of assets supporting those liabilities.
The large reduction of $5,347 million for in-force movements on the U.S. Wealth Management block includes $2,985 million of net maturity benefits on institutional contracts, a product line that is intentionally being de-emphasized. The decrease in the Corporate and Other segment is related to an Accident and Health block for which the liabilities are held in the Corporate and Other segment.
Included in the total in-force reduction of $4,875 million is a decrease of $482 million from changes in methods and assumptions, as described earlier. This decrease results in an increase in pre-tax earnings.
Of the $582 million net increase in policy liabilities related to new business and in-force movement, $761 million is an increase in actuarial liabilities. The remaining is a decrease of $179 million in other policy liabilities.
2007 Policy Liability Movement Analysis
| | | | | | | | | | | | | | | | | | | | | | | | | | | | |
| (Canadian $ in millions) | | U.S.
Insurance | | | U.S. Wealth
Management | | | Canadian
Division | | | Asia and
Japan
Division | | | Reinsurance
Division | | | Corporate
and
Other | | | Total | |
| Balance, December 31, 2006 | | $ | 44,232 | | | $ | 38,222 | | | $ | 32,554 | | | $ | 13,673 | | | $ | 1,884 | | | $ | 254 | | | $ | 130,819 | |
| Impact of adopting new accounting policies for financial instruments | | | 1,566 | | | | 1,119 | | | | 3,769 | | | | 1,236 | | | | 59 | | | | – | | | | 7,749 | |
| Balance, January 1, 2007 | | $ | 45,798 | | | $ | 39,341 | | | $ | 36,323 | | | $ | 14,909 | | | $ | 1,943 | | | $ | 254 | | | $ | 138,568 | |
| New business | | | 387 | | | | 2,210 | | | | 76 | | | | (126 | ) | | | 11 | | | | – | | | | 2,558 | |
| In-force movement | | | 1,957 | | | | (5,263 | ) | | | 254 | | | | 973 | | | | (118 | ) | | | 243 | | | | (1,954 | ) |
| Currency impact | | | (7,046 | ) | | | (5,640 | ) | | | (4 | ) | | | (1,843 | ) | | | (215 | ) | | | (2 | ) | | | (14,750 | ) |
Total net changes, excluding new accounting policies for financial instruments | | $ | (4,702 | ) | | $ | (8,693 | ) | | $ | 326 | | | $ | (996 | ) | | $ | (322 | ) | | $ | 241 | | | $ | (14,146 | ) |
Balance, December 31, 2007 | | $ | 41,096 | | | $ | 30,648 | | | $ | 36,649 | | | $ | 13,913 | | | $ | 1,621 | | | $ | 495 | | | $ | 124,422 | |
New business and normal in-force movement for Canadian Division were restated.
For new business, the segments with large positive general account premium revenue at contract inception show increases in policy liabilities. For segments where new business deposits are primarily into segregated funds, the increase in policy liabilities related to new business is small since the increase measures only general account liabilities.
The increase in policy liabilities from adopting new accounting policies for financial instruments was offset by an increase in the statement value of the assets supporting policy liabilities.
The reduction in policy liabilities from currency reflects the appreciation of the Canadian dollar. As assets are currency matched to liabilities, the reduction in policy liabilities due to currency is offset by a corresponding reduction from currency in the value of assets supporting those liabilities.
The large reduction of $5,263 million for in-force movements on the U.S. Wealth Management block includes $2,235 million of net maturity benefits on institutional contracts, a product line that is intentionally being de-emphasized.
Included in the total in-force reduction of $1,954 million is an increase of $32 million from changes in methods and assumptions, as described earlier. This decrease results in a decrease in pre-tax earnings.
Of the $604 million net increase in policy liabilities related to new business and in-force movement, $376 million is an increase in actuarial liabilities. The remaining $228 million is an increase in other policy liabilities.
Evaluation of Invested Asset Impairment
AFS equity and fixed income securities are carried at fair market value, with changes in fair value recorded in Other Comprehensive Income (“OCI”). AFS securities are considered impaired when fair value falls below their original cost. Impaired securities are reviewed on a regular basis and any fair value decrement is transferred out of AOCI and recorded in income at such time as the impairment is determined to be other than temporary.
Provisions for impairments of mortgage loans and private placement loans are recorded with losses reported in earnings, when there is no longer reasonable assurance as to the timely collection of the full amount of the principal and interest.
Significant judgment is required in assessing whether an impairment is other than temporary and in assessing fair values and recoverable values. Key matters considered include economic factors, company and industry specific developments and specific issues with respect to single issuers and borrowers. For fixed income securities the Company’s ability and intent to hold a security may also be considered in the impairment assessment.
Changes in circumstances may cause future assessments of asset impairment to be materially different from current assessments, which could require additional provisions for impairment. Additional information on the process and methodology for determining the allowance for credit losses is included in the discussion of credit risk in note 8 to the consolidated financial statements.
Variable Interest Entities (“VIEs”)
When an entity is considered a VIE, the primary beneficiary is required to consolidate the assets, liabilities and results of operations of the VIE. The primary beneficiary is the entity that is exposed, through variable interests, to a majority of the VIE’s expected losses and/or is entitled to a majority of the VIE’s expected residual returns, as defined under GAAP. When the Company is the primary beneficiary of a VIE, it consolidates the VIE either into the general fund or the segregated funds based on which has the preponderance of the exposure to the VIE. As outlined in note 18 to the consolidated financial statements, certain VIEs have been consolidated into the general fund, and certain VIEs have been consolidated on the Segregated Funds Statements of Net Assets. The Company uses a variety of complex estimation processes involving both qualitative and quantitative factors to determine whether an entity is a VIE, and to analyze whether it is the primary beneficiary of any entities that are determined to be VIEs. These processes involve estimating the future cash flows and performance of the VIE, analyzing the variability in those cash flows, and allocating the losses and returns among the identified parties holding variable interests. For further details on the Company’s involvement with VIEs, see note 18 to the consolidated financial statements.
Pensions and Other Post-Employment Benefits
The Company has a number of defined benefit and defined contribution plans providing pension and other benefits to eligible employees and agents after employment. The traditional defined benefit pension plans provide benefits based on years of service and average earnings at retirement. Due to the long-term nature of these plans and of the post-employment benefit plans, the calculation of the benefit expense and accrued benefit obligations depends on various economic assumptions such as discount rates, expected rates of return on plan assets, health care cost trend rates, and compensation increase rates. These assumptions are determined by management and are reviewed annually. Differences between actual and assumed experience will affect the amount of the accrued benefit obligation and benefit expense. The key weighted average assumptions used, as well as the sensitivity of estimated liabilities to these assumptions, are presented in note 17 to the consolidated financial statements.
The funding of defined benefit plans is also subject to various projections and assumptions based on the demographic profile of the membership, expected rates of return on plan assets, and compensation increase rates. A valuation for funding purposes is being completed as at December 31, 2009 and January 1, 2009 for the Company’s largest registered Canadian and U.S. plans respectively. Once completed, these valuations will reflect current asset values and return assumptions as well as any changes to the demographic profile of the member group. For 2009, the minimum funding requirement for the Company’s largest registered Canadian and U.S. plans is expected to be in the range of $50 to $100 million. However, future Company contribution amounts may change upon the Company’s review of its contribution levels during the year and based on the results of the pending valuations.
The Company reviews the appropriateness of the plans’ investment policy on a regular basis and was in compliance with the investment policy throughout the year. The current asset mix and level of investment risk of the Company’s pension plans reflects their long-term nature.
Income Taxes
The Company is subject to income tax laws in various jurisdictions. Tax laws are complex and potentially subject to different interpretations by the taxpayer and the relevant tax authority. The provision for income taxes represents management’s interpretation of the relevant tax laws and its estimate of current and future income tax implications of the transactions and events during the period. A future income tax asset or liability is recognized whenever an amount is recorded for accounting purposes but not for tax purposes or vice versa. Future tax assets and liabilities are recorded based on expected future tax rates and management’s assumptions regarding the expected timing of the reversal of such temporary differences.
The Company is an investor in leveraged leases and previously established provisions in the amount of US$178 million after tax for possible disallowance of the tax treatment and for interest on past due taxes. During the year ended December 31, 2008, the Company increased this provision by US$185 million after tax. The Company continues to believe that deductions originally claimed in relation to these arrangements are appropriate. Although not expected to occur, should the tax attributes of the leveraged leases be fully denied, the maximum after tax exposure including interest would be an additional estimated US$280 million as at December 31, 2008.
Goodwill and Intangible Assets
Goodwill and intangible assets with indefinite lives are tested at least annually for impairment. The test is at the reporting unit level for goodwill and at the Company level for intangible assets with indefinite lives. Any potential impairment of goodwill is identified by comparing the estimated fair value of a reporting unit to its carrying value. Carrying value is determined as the amount of capital allocated to the reporting unit. Any potential impairment of intangible assets with indefinite lives is identified by comparing the estimated fair value of the asset to its carrying value on the balance sheet. An impairment loss would be recognized and the asset written down to the extent that the carrying value of the asset exceeds the fair value. Fair values are determined using internally developed valuation models that consider various factors such as normalized and projected earnings, market multiples and discounted cash flows. The process of determining these fair values requires management to make estimates and assumptions including, but not limited to, projected future sales, earnings and capital investment, discount rates and terminal growth rates. Projected future sales, earnings and capital investment are consistent with plans presented to the Board of Directors. These estimates and assumptions may change in the future due to uncertain competitive and economic market conditions or changes in business strategies. The tests performed in 2008 demonstrated that there was no impairment of goodwill or intangible assets with indefinite lives.
Change in Accounting Policies – Financial instruments – disclosure and presentation
Effective January 1, 2008, the Company adopted CICA Handbook Section 3862 “Financial Instruments – Disclosures” and 3863 “Financial Instruments – Presentation”. Sections 3862 and 3863 replace Handbook Section 3861 “Financial Instruments – Disclosure and Presentation”. Section 3863 carries forward unchanged the presentation requirements of Section 3861 while Section 3862 requires additional disclosures of the nature and extent of risks arising from financial instruments, including the objectives, policies, processes and methods used to measure and manage key risks.
Future Change in Accounting Policy – Goodwill and Intangible Assets
In February 2008, the CICA issued Section 3064 “Goodwill and Intangible Assets”, replacing Section 3062 “Goodwill and Other Intangible Assets” and Section 3450 “Research and Development Costs”. Section 3064 establishes standards for the recognition, measurement, presentation and disclosure of goodwill and intangible assets. Requirements concerning goodwill are unchanged from the previous Section 3062. Section 3064 will be effective on a prospective basis for the Company’s fiscal year beginning January 1, 2009. The new section is not expected to have a material impact on the Company’s consolidated financial statements.
Future Change in Accounting Policy – Transition to International Financial Reporting Standards (“IFRS”)
On February 13, 2008 the Canadian Accounting Standards Board confirmed that all publicly accountable enterprises in Canada will be required to adopt IFRS as a replacement of Canadian GAAP for periods beginning on or after January 1, 2011. The Company will adopt IFRS in its quarterly and annual reports starting with the first quarter of 2011 and will provide corresponding comparative financial information for 2010.
The Company is in the process of evaluating the financial statement impact of the differences between Canadian GAAP and IFRS, and assessing the first time adoption and transitional options, in order to select the most appropriate accounting policies under IFRS. Until this process is complete, the full impact of adopting IFRS on the Company’s future financial position and future results cannot be reasonably determined.
The international financial reporting standard that addresses the measurement of insurance contracts is currently being developed and is not expected to be in place by January 1, 2011. Therefore, upon initial adoption of IFRS the Company will continue to measure insurance liabilities using the Canadian Asset Liability Method (“CALM”). Under CALM, the measurement of actuarial liabilities is based on the carrying value of assets required to support those liabilities. Consistent with the results of the adoption of CICA Handbook Section 3855, when IFRS is adopted any change in the carrying value of the invested assets that support insurance liabilities will be offset by a corresponding change in reserves and therefore is not expected to have a material impact on net income.
Differences between Canadian and U.S. GAAP
The consolidated financial statements of Manulife Financial are presented in accordance with Canadian GAAP. Canadian GAAP differs in certain significant respects from U.S. GAAP.
The primary differences between Canadian GAAP and U.S. GAAP include accounting for premiums and deposits, invested assets, investment income and segregated funds. There are also differences in the calculation and accounting for policy liabilities and differences in reporting policyholder cash flows. These differences are described in more detail in note 22 to the consolidated financial statements.
For U.S. GAAP, asset impairment charges include other than temporary impairments due to interest rate movements where we do not have the intent to hold the asset until recovery. The intent to hold is based on the investment mandate of each of our investment portfolios. For those that we do not intend to hold, assets have been written down to the lower of cost or fair market value.
Differences between Canadian and Hong Kong GAAP
The consolidated financial statements of Manulife Financial are presented in accordance with Canadian GAAP. Canadian GAAP differs in certain respects from Hong Kong generally accepted accounting principles (“Hong Kong GAAP”).
Under Hong Kong GAAP, real estate classified as investment properties are carried at appraised value, with changes being reported as income, as compared to current Canadian GAAP where real estate is carried on a move to market value basis. In certain interest rate environments, actuarial liabilities determined in accordance with Hong Kong GAAP may be higher than actuarial liabilities computed in accordance with current Canadian GAAP.
Canadian GAAP and Hong Kong Regulatory Practices
The Hong Kong Insurance Authority requires that insurance companies have minimum “net assets” for solvency purposes and stipulates minimum criteria for the calculation of actuarial liabilities in arriving at regulatory basis “net assets”. Each year, the Company compares the amount of net assets prepared in accordance with Canadian GAAP, as reported in the Company’s annual return, with the minimum solvency margin required in Hong Kong as described above. As at December 31, 2008, the Company’s net assets determined in accordance with Canadian GAAP exceeded the minimum solvency margin required by Hong Kong insurance regulations.
Controls and Procedures
Disclosure Controls and Procedures
Our disclosure controls and procedures are designed to provide reasonable assurance that information required to be disclosed by us is recorded, processed, summarized and reported accurately and completely and within the time periods specified under Canadian and U.S. securities laws. Our process includes controls and procedures that are designated to ensure that information is accumulated and communicated to management, including the CEO and CFO, to allow timely decisions regarding required disclosure.
As of December 31, 2008, management evaluated the effectiveness of its disclosure controls and procedures as defined under the rules adopted by the U.S. Securities and Exchange Commission and the Canadian securities regulatory authorities. This evaluation was performed under the supervision of the ARMC, the CEO and CFO.
Based on that evaluation, the CEO and CFO concluded that our disclosure controls and procedures were effective as at December 31, 2008.
Management’s Report on Internal Control over Financial Reporting
Management is responsible for establishing and maintaining adequate internal control over financial reporting. The Company’s internal control system was designed to provide reasonable assurance to management and the Board of Directors regarding the preparation and fair presentation of published financial statements in accordance with generally accepted accounting principles. All internal control systems, no matter how well designed, have inherent limitations due to manual controls. Therefore, even those systems determined to be effective can provide only reasonable assurance with respect to financial statement preparation and presentation.
Management maintains a comprehensive system of controls intended to ensure that transactions are executed in accordance with management’s authorization, assets are safeguarded, and financial records are reliable. Management also takes steps to ensure that information and communication flows are effective and to monitor performance, including performance of internal control procedures.
Management assessed the effectiveness of the Company’s internal control over financial reporting as of December 31, 2008 based on the criteria set forth by the Committee of Sponsoring Organizations of the Treadway Commission (COSO) in Internal Control – Integrated Framework. Based on this assessment, management believes that, as of December 31, 2008, the Company’s internal control over financial reporting is effective.
The effectiveness of the Company’s internal control over financial reporting as of December 31, 2008 has been audited by Ernst & Young LLP, the Company’s independent registered public accounting firm that also audited the consolidated financial statements of the Company for the year ended December 31, 2008. Their report expressed an unqualified opinion on the effectiveness of the Company’s internal control over financial reporting as of December 31, 2008.
Changes in Internal Control over Financial Reporting
No changes were made in our internal control over financial reporting during the year ended December 31, 2008, that have materially affected, or are reasonably likely to materially affect, our internal control over financial reporting.
Additional Disclosures
Contractual Obligations
In the normal course of business, the Company enters into contracts that give rise to obligations fixed by agreement as to the timing and dollar amount of payment.
Principal Subsidiaries
The following is a list of the directly and indirectly held major operating subsidiaries of Manulife Financial Corporation.
| | | | | | | | | |
As at December 31, 2008 (Unaudited, Canadian $ in millions) | | Ownership
Percentage | | Equity
Interest | | Address | | Description |
MANULIFE FINANCIAL CORPORATION | | | | | | | Toronto, Canada | | Publicly traded stock life insurance company |
The Manufacturers Life Insurance Company | | 100 | | $ | 20,515 | | Toronto, Canada | | Leading Canadian-based financial services company that offers a diverse range of financial protection products and wealth management services |
Manulife Holdings (Alberta) Limited | | 100 | | | | | Calgary, Canada | | Holding company |
Manulife Holdings (Delaware) LLC | | 100 | | | | | Delaware, U.S.A. | | Holding company |
The Manufacturers Investment Corporation | | 100 | | | | | Michigan, U.S.A. | | Holding company |
John Hancock Life Insurance Company (U.S.A.) | | 100 | | | | | Michigan, U.S.A. | | U.S. based life insurance company that provides individual life insurance, annuities, and group pension products in all states in the U.S. except New York |
John Hancock Life Insurance Company of New York | | 100 | | | | | New York, U.S.A. | | Provides group pension, individual annuities and life insurance products in the State of New York |
John Hancock Investment Management Services, LLC | | 95 | | | | | Boston, Massachusetts, U.S.A. | | Investment advisor |
John Hancock Distributors LLC | | 100 | | | | | Delaware, U.S.A | | Wholesale distributor for variable products |
Manulife Reinsurance Limited | | 100 | | | | | Hamilton, Bermuda | | Provides life and financial reinsurance |
Manulife Holdings (Bermuda) Limited | | 100 | | | | | Hamilton, Bermuda | | Holding company |
Manufacturers P&C Limited | | 100 | | | | | St. Michael, Barbados | | Provides property and casualty and financial reinsurance |
Manufacturers Life Reinsurance Limited | | 100 | | | | | St. Michael, Barbados | | Provides life and financial reinsurance |
Manulife International Holdings Limited | | 100 | | | | | Hamilton, Bermuda | | Holding company |
Manulife (International) Limited | | 100 | | | | | Hong Kong, China | | Life insurance company serving Hong Kong and Taiwan |
Manulife-Sinochem Life Insurance Co. Ltd. | | 51 | | | | | Shanghai, China | | Chinese life insurance company |
Manulife Asset Management (Asia) Limited | | 100 | | | | | St. Michael, Barbados | | Investment advisor |
Manulife Asset Management (Hong Kong) Limited | | 100 | | | | | Hong Kong, China | | Hong Kong investment management and advisory company marketing mutual funds |
Manulife Asset Management (Taiwan) Co., Ltd. | | 100 | | | | | Taipei, Taiwan | | Asset management company |
Manulife Bank of Canada | | 100 | | | | | Waterloo, Canada | | Provides integrated banking products and service options not available from an insurance company |
Manulife Canada Ltd. | | 100 | | | | | Waterloo, Canada | | Canadian life insurance company |
FNA Financial Inc. | | 100 | | | | | Toronto, Canada | | Holding company |
Elliott & Page Limited | | 100 | | | | | Toronto, Canada | | Investment counseling, portfolio and mutual fund management in Canada |
First North American Insurance Company | | 100 | | | | | Toronto, Canada | | Canadian property and casualty insurance company |
NAL Resources Management Limited | | 100 | | | | | Calgary, Canada | | Management company for oil and gas properties |
Manulife Securities Investment Services Inc. | | 100 | | | | | Burlington, Canada | | Mutual fund dealer for Canadian operations |
MLI Resources Inc. | | 100 | | | | | Calgary, Canada | | Holding company for oil and gas assets and Japanese operations |
Manulife Life Insurance Company | | 99.9 | | | | | Tokyo, Japan | | Japanese life insurance company |
MFC Global Investment Management (Japan) Limited | | 100 | | | | | Tokyo, Japan | | Japanese investment management and advisory company |
PT Asuransi Jiwa Manulife Indonesia | | 100 | | | | | Jakarta, Indonesia | | Indonesian life insurance company |
PT Manulife Aset Manajemen Indonesia | | 100 | | | | | Jakarta, Indonesia | | Indonesian investment management and advisory company marketing mutual funds |
The Manufacturers Life Insurance Co. (Phils.), Inc. | | 100 | | | | | Manila, Philippines | | Filipino life insurance company |
Manulife (Singapore) Pte. Ltd. | | 100 | | | | | Singapore | | Singaporean life insurance company |
Manulife (Vietnam) Limited | | 100 | | | | | Ho Chi Minh City, Vietnam | | Vietnamese life insurance company |
Manulife Vietnam Fund Management Company Limited | | 100 | | | | | Ho Chi Minh City, Vietnam | | Vietnamese investment management and advisory company marketing mutual funds |
Manulife Insurance (Thailand) Public Company Limited | | 98.3 | | | | | Bangkok, Thailand | | Thai life insurance company |
Manulife Asset Management (Thailand) Company Limited | | 100 | | | | | Bangkok, Thailand | | Investment management |
MFC Global Fund Management (Europe) Limited | | 100 | | | | | London, England | | Holding company |
MFC Global Investment Management (Europe) Limited | | 100 | | | | | London, England | | Investment management company for Manulife Financial’s international funds |
EIS Services (Bermuda) Limited | | 100 | | | | | Hamilton, Bermuda | | Investment holding company |
Berkshire Insurance Services Inc. | | 100 | | | | | Burlington, Canada | | Insurance broker |
JH Investments (Delaware) LLC | | 100 | | | | | Boston, Massachusetts, U.S.A. | | Investment holding company |
Manulife Securities Incorporated | | 100 | | | | | Burlington, Canada | | Holding company |
MFC Global Investment Management (U.S.A.) Limited | | 100 | | | | | Toronto, Canada | | Investment advisor |
Manulife Asset Management (Singapore) Pte. Ltd. | | 100 | | | | | Singapore | | Asset management |
| | | | | | | | | |
As at December 31, 2008 (Unaudited, Canadian $ in millions) | | Ownership
Percentage | | Equity
Interest | | Address | | Description |
MANULIFE FINANCIAL CORPORATION | | | | | | | Toronto, Canada | | Publicly traded stock life insurance company |
John Hancock Holdings (Delaware) LLC | | 100 | | $ | 10,916 | | Wilmington,
Delaware, U.S.A. | | Holding company |
John Hancock Financial Services, Inc. | | 100 | | | | | Boston,
Massachusetts,
U.S.A. | | Holding company |
John Hancock Life Insurance Company | | 100 | | | | | Boston,
Massachusetts,
U.S.A. | | Leading U.S. based financial services company that offers a diverse range of financial protection products and wealth management services |
John Hancock Variable Life Insurance Company | | 100 | | | | | Boston,
Massachusetts,
U.S.A. | | U.S. based life insurance company that provides variable and universal life insurance policies, and annuity products in all states in the U.S. except New York |
John Hancock Subsidiaries LLC | | 100 | | | | | Wilmington,
Delaware, U.S.A. | | Holding company |
Declaration Management & Research LLC | | 100 | | | | | McLean, Virginia,
U.S.A. | | Provides institutional investment advisory services |
John Hancock Financial Network, Inc. | | 100 | | | | | Boston,
Massachusetts,
U.S.A. | | Financial services distribution organization |
The Berkeley Financial Group LLC | | 100 | | | | | Boston,
Massachusetts,
U.S.A. | | Holding company |
John Hancock Funds LLC | | 100 | | | | | Boston,
Massachusetts,
U.S.A. | | Mutual fund company |
Hancock Natural Resource Group, Inc. | | 100 | | | | | Boston,
Massachusetts,
U.S.A. | | Manager of globally diversified timberland and agricultural portfolios for public and corporate pension plans, high net-worth individuals, foundations and endowments |
John Hancock International Holdings, Inc. | | 100 | | | | | Boston,
Massachusetts,
U.S.A. | | Holding company |
Manulife Insurance Berhad | | 45.8 | | | | | Kuala Lumpur,
Malaysia | | Malaysian life insurance company |
Manulife Asset Management (Malaysia) Sdn Bhd | | 45.8 | | | | | Kuala Lumpur,
Malaysia | | Asset management company |
John Hancock International, Inc. | | 100 | | | | | Boston,
Massachusetts,
U.S.A. | | Holding company |
John Hancock Tianan Life Insurance Company | | 50 | | | | | Shanghai, China | | Chinese life insurance company |