Exhibit 99.2

Manulife Financial Corporation
Management’s Discussion & Analysis
For the year ended December 31, 2008
Caution Regarding Forward-Looking Statements
This document contains forward-looking statements within the meaning of the “safe harbour” provisions of Canadian provincial securities laws and the U.S.Private Securities Litigation Reform Act of 1995.These forward-looking statements relate to, among other things, our objectives, goals, strategies, intentions, plans, beliefs, expectations and estimates, and can generally be identified by the use of words such as “may”, “will”, “could”, “should”, “would”, “suspect”, “outlook”, “expect”, “intend”, “estimate”, “anticipate”, “believe”, “plan”, “forecast”, “objective” “continue” and “endeavor” (or the negative thereof) and words and expressions of similar import, and include statements concerning possible or assumed future results. Although we believe that the expectations reflected in such forward-looking statements are reasonable, such statements involve risks and uncertainties, and undue reliance should not be placed on such statements. Certain material factors or assumptions are applied in making forward-looking statements, and actual results may differ materially from those expressed or implied in such statements. Important factors that could cause actual results to differ materially from expectations include but are not limited to: general business and economic conditions (including but not limited to performance of equity markets, interest rate fluctuations, currency rates, investment losses and defaults, movements in credit spreads, market liquidity and creditworthiness of guarantors and counterparties); level of competition and consolidation, changes in laws and regulations Company liquidity, including the availability of financing to satisfy existing financial liabilities on their expected maturity dates when required; accuracy of information received from counterparties and the ability of counterparties to meet their obligations; accuracy of accounting policies and actuarial methods used by the Company; the ability to maintain the Company’s reputation; legal and regulatory proceedings; the ability to adapt products and services to the changing market; the ability to implement effective hedging strategies; the ability to attract and retain key executives; the ability complete acquisitions including the availability of equity and debt financing for this purpose; the ability to execute strategic plans; the disruption of or changes to key elements of the Company’s or public infrastructure systems; and environmental concerns. Additional information about material factors that could cause actual result to differ materially from expectations and about material factors or assumptions applied in making forward-looking statements may be found in the body of this document as well as under “Risk Factors” in our most recent Annual Information Form, under “Risk Management” and “Critical Accounting and Actuarial Policies” in the Management’s Discussion and Analysis, in the “Risk Management” note to consolidated financial statements in our most recent annual and interim reports and elsewhere in our filings with Canadian and U.S. securities regulators. We do not undertake to update any forward-looking statements except as required by law.
Management’s Discussion and Analysis
Financial Performance
Manulife Financial is a leading Canadian-based financial services group serving millions of customers in 19 countries and territories world-wide. We provide financial protection and wealth management products and services, to individual and group customers in Canada, the United States and Asia. These products and services include individual life insurance, group life and health insurance, long-term care services, pension products, annuities, mutual funds and banking products. We offer reinsurance services, specializing in life retrocession and property and casualty reinsurance and provide investment management services with respect to the Company’s general fund and segregated fund assets and to mutual funds and institutional customers.
The Company operates in Canada and Asia through the brand name “Manulife Financial” and in the United States primarily through the brand name “John Hancock“.
In this document, the terms “Company”, “Manulife Financial” and “we” mean Manulife Financial Corporation (“MFC”) and its subsidiaries.
Net Income
The Company’s shareholders’ net income for 2008 was $517 million, down from $4,302 million reported in 2007. Earnings in 2008 were negatively impacted by $3,748 million due to the unprecedented decline in worldwide equity market conditions, which, when compared to December 31, 2007, were down by 35 per cent in Canada, 39 per cent in the United States, 48 per cent in Hong Kong and 42 per cent in Japan. In addition, credit defaults and downgrades, primarily in the financial sector, resulted in net impairment charges of $486 million in 2008 compared to $28 million in 2007.
Our net income exposure to equity markets consists of segregated fund and variable annuity guarantees, future fees assumed in variable universal life and equity-linked policy liabilities, as well as equity investments that support our non pass through insurance products and our surplus segments. The Company is a provider of variable annuity and segregated funds in Canada, the United States and Asia. Typically, funds are deposited for investment in a basket of pre-approved funds where the investor receives annuity payments for a defined period. In exchange for a fee and provided the annuity is held for a specified period of time, Manulife Financial guarantees a minimum level of benefits. The bulk of the annuity payments on our in-force business are not due to be made until years ranging from 2015 to 2038. Because of the steep decline of equity markets, the Company recorded a non cash charge of $2,824 million related to these guarantees. Over the long term, should equity markets recover, portions of these reserves may reverse into net income. Of the remaining $924 million of the equity related charges, $282 million relates to reduced current year fee income and the capitalized impact of reduced future fees assumed in variable universal life and equity-linked products, $443 million relates to the decline in value of equity investments supporting non pass through insurance products and $199 million relates to impairment charges on equities classified as available-for-sale (“AFS”) in the surplus segment.
The diversity of our investment portfolio, which includes alternative assets such as real estate, private equity and oil and gas properties in addition to bonds, private placement, mortgage and public equity investments, resulted in strong investment gains in both 2008 and 2007 (excluding the items discussed above). Gains in 2008 arose due to the increase in corporate interest rates and trading activities, as well as from the impact on actuarial liabilities of supporting the long duration portion of long-term obligations with additional non fixed income investments. In 2007, gains were primarily from the increase in value of the alternative asset classes and gains on AFS equities in the surplus segment.
The assumptions underlying the valuation of policy liabilities are reviewed and updated on an ongoing basis to reflect recent and emerging trends in experience and changes in risk profile of the business. Details of the changes in actuarial methods and assumptions are outlined under “Critical Accounting and Actuarial Policies”. The changes resulted in income of $283 million in 2008 compared to $43 million in 2007.
In 2008 a number of tax items were recorded in income, netting to a gain of $21 million. During the year the Company increased its tax related provision on leveraged lease investments by $214 million, recognized $54 million of tax benefit as a result of a successful appeal in the United States, and recognized $181 million from changes in the insurance tax formulas in Canada.
Summary Statements of Operations
| | | | | | | | | | | | | | |
For the years ended December 31 | | | | | | | | | | | | | | |
| (Canadian $ in millions, unless otherwise stated) | | 2008 | | | 2007 | | | 2006 | | | |
Revenue | | | | | | | | | | | | | | |
Premium income | | $ | 23,252 | | | $ | 19,744 | | | $ | 19,104 | | | |
Investment income | | | | | | | | | | | | | | |
Investment income | | | 8,094 | | | | 9,523 | | | | 10,193 | | | |
Realized and unrealized (losses) gains on assets supporting policy liabilities and consumer notes | | | (3,796 | ) | | | 818 | | | | 240 | | | |
Other revenue | | | 5,453 | | | | 5,496 | | | | 4,702 | | | |
Total revenue | | $ | 33,003 | | | $ | 35,581 | | | $ | 34,239 | | | |
Policy benefits | | $ | 22,201 | | | $ | 20,211 | | | $ | 19,912 | | | |
General expenses | | | 3,546 | | | | 3,387 | | | | 3,352 | | | |
Investment expenses | | | 943 | | | | 983 | | | | 841 | | | |
Commissions | | | 4,235 | | | | 4,056 | | | | 3,591 | | | |
Interest expense | | | 1,187 | | | | 1,032 | | | | 932 | | | |
Premium taxes | | | 280 | | | | 248 | | | | 270 | | | |
Non-controlling interest in subsidiaries | | | 34 | | | | 58 | | | | 5 | | | |
Total policy benefits and expenses | | $ | 32,426 | | | $ | 29,975 | | | $ | 28,903 | | | |
Income before income taxes | | $ | 577 | | | $ | 5,606 | | | $ | 5,336 | | | |
Income taxes | | | (80 | ) | | | (1,377 | ) | | | (1,366 | ) | | |
Net income | | $ | 497 | | | $ | 4,229 | | | $ | 3,970 | | | |
Loss attributed to participating policyholders | | | 20 | | | | 73 | | | | 15 | | | |
Net income attributed to shareholders | | $ | 517 | | | $ | 4,302 | | | $ | 3,985 | | | |
Preferred share dividends | | | (30 | ) | | | (30 | ) | | | (30 | ) | | |
Net income available to common shareholders | | $ | 487 | | | $ | 4,272 | | | $ | 3,955 | | | |
Diluted earnings per share | | $ | 0.32 | | | $ | 2.78 | | | $ | 2.51 | | | |
Dividends per common share | | $ | 1.00 | | | $ | 0.88 | | | $ | 0.73 | | | |
Earnings per Common Share and Return on Common Shareholders’ Equity
Diluted earnings per common share for 2008 were $0.32, compared to $2.78 in 2007. The return on common shareholders’ equity for 2008 was two per cent, compared to 18.4 per cent for 2007. Return on common shareholders’ equity is calculated excluding Accumulated Other Comprehensive Income (Loss) (“AOCI”) on AFS securities and cash flow hedges (see page 45 for discussion of non-GAAP measures).
Premiums and Deposits
Total premiums and deposits for 2008 were $70.0 billion, up one per cent from 2007, as lower segregated fund deposits largely offset the growth in insurance, annuity and pension premiums (general funds). General fund premiums of $23.3 billion were up 18 per cent, driven by increases in all businesses including significant increases in U.S. Wealth Management’s dollar cost averaging program and fixed rate products. Due to the declines in the equity markets, segregated fund deposits of $34.2 billion were down eight per cent. However, mutual funds deposits were up one per cent as expanded distribution in John Hancock Mutual Funds offset the impact of the markets in all geographies. Administrative Services Only (“ASO”) premium equivalents in Canadian Group Benefits were $2.5 billion, up slightly from prior year, and other funds deposits of $0.5 billion, which includes various products in U.S. Wealth Management, were down from prior year.
Premiums and Deposits
For the years ended December 31
| | | | | | | | | | | |
| (Canadian $ in millions) | | 2008 | | 2007 | | 2006 | | |
General fund premiums | | $ | 23,252 | | $ | 19,744 | | $ | 19,104 | | |
Segregated fund deposits | | | 34,205 | | | 37,227 | | | 33,287 | | |
Mutual fund deposits | | | 9,473 | | | 9,368 | | | 9,270 | | |
ASO premium equivalents | | | 2,488 | | | 2,373 | | | 2,225 | | |
Other fund deposits | | | 534 | | | 726 | | | 1,053 | | |
Total premiums and deposits | | $ | 69,952 | | $ | 69,438 | | $ | 64,939 | | |
Investment Income
The Company classifies bond and stock securities that support policy liabilities under the fair value option, and those securities supporting the surplus segment as AFS. Loans are reported at amortized cost, real estate is reported on a move to market basis and other investments are generally held at amortized cost. Total investment income of $4.3 billion for 2008, was $6.0 billion lower than the $10.3 billion reported in 2007. The variance consists of changes in market values of $4.6 billion, credit impairments of $728 million, equity related impairments of $280 million, lower realized gains on assets backing surplus of $347 million and lower interest, dividend and other income of $74 million. Interest income was reduced by $201 million as a result of the increased provisions on leveraged lease investments.
Unrealized and realized gains and losses on assets supporting policy liabilities and consumer notes was a loss of $3.8 billion compared to a gain of $818 million in 2007. The 2008 amount includes $2.8 billion related to the decline in equity markets and $1.0 billion primarily relating to the net increase in interest rates. For fixed income assets supporting policy liabilities and for equities supporting pass through products, the impact of the unrealized and realized gains and losses are largely offset by the change in actuarial liabilities. The charge of $443 million discussed under net income is the after tax portion of the realized and unrealized gains and losses that are not offset by changes in actuarial liabilities.
Credit related impairments in 2008 were $697 million and include $438 million related to Lehman Brothers, AIG and Washington Mutual. Impairments in 2008 charged to the shareholders’ account were $517 million (2007 – recovery of $27 million) and to the participating policyholders’ account were $180 million (2007 – recovery of $4 million). The after tax credit charges outlined in the net income section also include charges for credit downgrades which are reported in the change in actuarial liabilities line of the income statement.
Investment Income
For the years ended December 31
| | | | | | | | | | | | | | |
| (Canadian $ in millions) | | 2008 | | | 2007 | | | 2006 | | | |
Interest income | | $ | 8,043 | | | $ | 8,202 | | | $ | 8,281 | | | |
Dividend, rental and other income | | | 985 | | | | 900 | | | | 809 | | | |
| | $ | 9,028 | | | $ | 9,102 | | | $ | 9,090 | | | |
Impairments and provisions for loan losses, net | | | (1,050 | ) | | | (42 | ) | | | (1 | ) | | |
Realized gains on assets backing surplus | | | 116 | | | | 463 | | | | – | | | |
Amortization of net realized gains and move to market(1) | | | – | | | | – | | | | 1,104 | | | |
Realized and unrealized gains (losses) on assets supporting policy liabilities and consumer notes | | | (3,796 | ) | | | 818 | | | | 240 | | | |
Total investment income | | $ | 4,298 | | | $ | 10,341 | | | $ | 10,433 | | | |
(1) | Amounts in 2006 include amortization of deferred net realized gains and move to market adjustments for stock securities. |
Other Revenue
Other revenue was $5.5 billion for 2008 consistent with the $5.5 billion earned in 2007. Declines in fee income in the wealth management businesses, which decreased due to lower average assets under management, were offset by increases from front end load fees and third party fees earned by our mutual fund dealer distribution company.
Policy Benefits
Policy benefits were $22.2 billion in 2008, up 10 per cent from $20.2 billion in 2007. Maturity and surrender benefits increased by eight per cent from 2007 due primarily to higher scheduled maturities in John Hancock Fixed Products. Policy benefits expense increased by $0.4 billion related to the change in actuarial liabilities.
Policy Benefits
| | | | | | | | | | | | |
| For the years ended December 31 | | | | | | | | | | | | |
| (Canadian $ in millions) | | 2008 | | 2007 | | 2006 | | | |
Death, disability and other claims | | $ | 6,539 | | $ | 6,104 | | $ | 5,949 | | | |
Maturity and surrender benefits | | | 8,767 | | | 8,111 | | | 9,814 | | | |
Annuity payments | | | 3,034 | | | 3,098 | | | 3,316 | | | |
Policyholder dividends and experience rating refunds | | | 1,518 | | | 1,556 | | | 1,528 | | | |
Net transfers to segregated funds | | | 1,563 | | | 952 | | | 432 | | | |
Change in actuarial liabilities | | | 780 | | | 390 | | | (1,127 | ) | | |
Total policy benefits | | $ | 22,201 | | $ | 20,211 | | $ | 19,912 | | | |
General Expenses
General expenses were $3.5 billion, up slightly from $3.4 billion in 2007. Personnel costs, which were half of the total expenses, were flat year over year, as increases in the fixed salary levels and in the number of staff were offset by lower variable compensation. Cost containment initiatives were put in place in order to control expense levels.
Investment Expenses
Investment expenses were $943 million, down four per cent from $983 million in 2007. The decrease is primarily due to lower sub advisor fees from reduced assets under management.
Investment Expenses
For the years ended December 31
| | | | | | | | | | | |
| (Canadian $ in millions) | | 2008 | | 2007 | | 2006 | | |
Related to invested assets | | $ | 388 | | $ | 376 | | $ | 336 | | |
Related to segregated, mutual and other funds(1) | | | 555 | | | 607 | | | 505 | | |
Total investment expenses | | $ | 943 | | $ | 983 | | $ | 841 | | |
(1) | Incurred by providing portfolio management services where the Company holds or has invested assets on behalf of individuals and financial institutions. |
Commissions
Commissions were $4,235 million in 2008, up slightly from $4,056 million in 2007. The increase was driven by record level life insurance sales. Despite the unprecedented market volatility, wealth sales were in line with the strong levels of the prior year.
Interest Expense
Interest expense was $1,187 million in 2008, up 15 per cent from $1,032 million in 2007. The increase was due to an increase in bank deposit volumes in the Canadian banking operations, the net increase in debt financing over the course of the year, and tax deficiency interest on the changes in leveraged lease deduction assumptions.
Income Taxes
Income taxes were $80 million in 2008, compared with $1,377 million in 2007. The effective tax rate in 2008 was 13.9 per cent and in 2007 was 24.6 per cent. Excluding the $54 million benefit as a result of a successful appeal in the United States, the rate in 2008 would have been 23.2 per cent. The effective tax rate is affected by the mix of jurisdictions where income was earned.
Funds Under Management
Funds under management were $404.5 billion as at December 31, 2008, up $8.1 billion or two per cent from 2007. On a constant currency basis, funds under management declined by 14 per cent from last year, as business growth was more than offset by the effects of declining equity markets and scheduled maturities of John Hancock Fixed Products institutional products.
Funds Under Management
As at December 31
| | | | | | | | | | | |
| (Canadian $ in millions) | | 2008 | | 2007 | | 2006 | | |
General fund | | $ | 187,501 | | $ | 161,300 | | $ | 171,320 | | |
Segregated funds held by policyholders(1) | | | 164,755 | | | 174,977 | | | 172,259 | | |
Mutual and other funds(1), (2) | | | 52,199 | | | 60,067 | | | 70,805 | | |
Total funds under management | | $ | 404,455 | | $ | 396,344 | | $ | 414,384 | | |
(1) | Segregated fund assets, mutual fund assets and other funds are not available to satisfy the liabilities of the Company’s general fund. |
(2) | Other funds represent pension funds, pooled funds, endowment funds and other institutional funds managed by the Company on behalf of others. |
Fourth Quarter Results
Net Income
The shareholders’ loss in the fourth quarter of 2008 amounted to $1,870 million or $1.24 per share on a fully diluted basis and differed by $370 million from the estimate of $1,500 million announced on December 2, 2008. A sharp drop in swap interest rates which are used to value segregated fund guarantee liabilities was the major reason for the higher reported loss. The fourth quarter results include a number of non cash items totaling $2,727 million after tax, including $2,407 million for segregated fund guarantees, other equity related losses of $513 million and accruals for credit related impairments and downgrades of $128 million, partially offset by changes in actuarial methods and assumptions.
Continued declines in global equity markets reduced fourth quarter earnings by $2,920 million, and also resulted in charges for credit related impairments and downgrades of $128 million. In addition to these two items, changes in actuarial methods and assumptions resulted in income of $321 million and the Company recorded two offsetting tax related items.
The $2,407 million increase in segregated fund guarantee liabilities is comprised of $1,805 million for the reduction in the market value of the funds being guaranteed and $602 million because the sharp drop in swap interest rates reduced the discount rates used in the measurement of the obligation. The $513 million of other equity related losses includes $196 million for equity investments supporting non-experience adjusted policy liabilities, $100 million for reduced capitalized future fee income on equity-linked and variable universal life products, $158 million for impairments on equity positions in the Corporate and Other segment and $59 million for lower fee income.
During the quarter, the Company increased tax related provisions on investments in leveraged leases by $181 million and recognized gains of $181 million in Canada due to the impact on actuarial liabilities of expected changes in Canadian tax law for insurance companies in connection with fair value accounting.
Premiums and Deposits
Premiums and deposits as reported in Canadian dollars for the quarter were $18.5 billion, an increase of six per cent from the $17.4 billion reported a year earlier. On a constant currency basis, premiums and deposits decreased by ten per cent due to lower deposits in the fee based and variable annuity businesses as customers shied away from products exposed to volatile equity markets. These declines were partially offset by in-force business growth in our insurance businesses, and sales growth in Canadian Individual Wealth Management and John Hancock Fixed Products.
Financial Highlights
For the quarter ended December 31
| | | | | | | | | | | | |
| (Canadian $ in millions) | | 2008 | | | 2007 | | 2006 | | |
Shareholders’ net income (loss) | | $ | (1,870 | ) | | $ | 1,144 | | $ | 1,100 | | |
Premiums and deposits | | $ | 18,468 | | | $ | 17,414 | | $ | 15,819 | | |
Moving Forward
In the past year, and in particular since the last quarter of 2008, there has been unprecedented disruption of credit and equity markets, which have had a material impact on the operations of our Company. Maintaining capital strength in this time of continued economic challenges is essential. Actions taken quickly to strengthen our capital base have provided us with a capital position that we expect will provide the flexibility to absorb further market declines, but we also understand that additional steps are required to manage our risk levels in this highly volatile and uncertain time. Accordingly, we are implementing a comprehensive plan that will allow us to economically achieve a reduced level of exposure to equity market volatility. We have already begun to review our variable annuity guarantee offerings and modify product designs to better balance the features that have attracted customers to these products with the risk that they present to Manulife Financial. With our customers facing continuing economic uncertainty, as a financially strong life insurance company, we believe we are well positioned to continue to offer an investment solution that provides predictable, sustainable income for life. We will continue to provide variable annuity and segregated fund offerings, with potential obligations payable over a long time period, generally deferred several years. However, recognizing increasing volatility in equity markets, we will offer product designs and investment fund alternatives with reduced exposure to equity markets. We believe in the current environment that this is a positive step for Manulife Financial and an appropriate change for our customers. We have also expanded our variable annuity hedging to encompass all new business written in the U.S. and the majority of Canadian new business and will look for opportunities to economically hedge existing business. We intend to continue to monitor market conditions and manage product features, fee levels, and our hedging program throughout 2009 to ensure an appropriate balance between risk and long-term profitability for this product line.
Diversification is a critical part of our strategy. Our large global footprint provides opportunities in markets where short and medium term growth rates are expected to be higher than those in North America. In addition, our wide range of product offerings including both variable and fixed return alternatives allows us to build our customer base despite difficult equity market conditions, and in conjunction with our intention to prudently limit growth in our guaranteed variable annuity businesses. The current economic environment may bring acquisition opportunities and we aim to use our relative financial strength to selectively take advantage of these opportunities, focusing on opportunities to further diversify our business.
Our prudent investment strategy will continue to serve us well as the fallout from the global economic slowdown affects credit ratings in the coming year. In addition, we are taking the opportunity to review our product features and pricing in a number of businesses to ensure that the risk we accept remains appropriate. Finally, we will maintain our disciplined approach to expense management, including close oversight of staffing levels, strict limits on discretionary spending, and prudent deferral of projects and programs that are not considered absolutely necessary in the short term.
Experience tells us that the global economies will recover and we expect Manulife Financial to benefit from that upturn in market conditions. We have the support of more than 23 thousand employees and thousands of distribution partners that serve over 19 million customers in 19 countries and territories around the world. Our diverse international operations allow us to leverage our people, products, technology and expertise quickly and effectively in new markets.
Performance by Division
The volatile markets affected the 2008 results of all our divisions. All operating divisions incurred losses related to segregated fund guarantees and/or reduced capitalized future fee income on equity-linked and variable universal life products, and reduced fees due to lower levels of assets under management. In addition, all divisions shared in the credit and general fund equity related losses. As a result of the sharp declines in equity markets, balance sheet reserves for segregated fund guarantees were increased to $5,783 million as at December 31, 2008 compared with $526 million at the prior year end. The Company’s obligations under its segregated fund guarantees are substantially payable over a thirty year period beginning in seven years. Over the long term should equity markets recover, portions of these reserves may reverse into net income. These non cash charges overshadow other business related results.
Effective January 1, 2008 we changed our approach for allocating investment gains and losses to be more aligned with how we manage the assets and related risk positions. Investment gains and losses are now accumulated in two pools – insurance and wealth management, and then allocated to the business units based on their respective policy liabilities. Prior to 2008, gains and losses were reported in the business units where the specific assets giving rise to the gains and losses were located, and credit gains and losses were reported in the Corporate and Other segment. Investment gains and losses related to product features, such as segregated fund guarantees and future fees assumed in variable universal life and equity-linked policy liabilities, as well as investment gains and losses on full pass through products, such as par insurance, are not included in the pools. Prior periods have been restated to conform to this new presentation.
U.S. Insurance
Our U.S. Insurance operation provides life and long-term care insurance products and services to select markets. John Hancock Life focuses on high net-worth and emerging affluent markets by providing estate and business planning and other solutions, with an array of protection and accumulation-oriented life insurance products. John Hancock Long Term Care provides to individuals and group members insurance to cover the costs of long-term care services including nursing homes, assisted living care facilities, adult day care and at home care to individuals and groups. We distribute our products through a multi-channel network, including John Hancock Financial Network (“JHFN”), a national network of independent career agencies offering innovative insurance and wealth management solutions to individuals, families and businesses.
In 2008, U.S. Insurance contributed 10 per cent of the Company’s total premiums and deposits and, as at December 31, 2008, accounted for 17 per cent of the Company’s funds under management.
Financial Performance
Earnings for 2008 were US$757 million, up three per cent from US$732 million reported a year earlier. The increase was due to solid in-force business growth, improved claims experience and favourable investment related experience, partially offset by equity related charges for lower capitalized future fee income on variable universal life products and by higher strain on new business.
Summary Statements of Operations
| | | | | | | | | | | | | | | | | | | | | | | | | | | | |
For the years ended December 31
(in $ millions) | | | | | | | | Canadian $ | | | | | | | | | | | US $ | | | |
| | 2008 | | | 2007 | | | 2006 | | | | | 2008 | | | 2007 | | | 2006 | | | |
Revenue | | | | | | | | | | | | | | | | | | | | | | | | | | | | |
Premium income | | $ | 5,751 | | | $ | 5,279 | | | $ | 5,488 | | | | | $ | 5,383 | | | $ | 4,942 | | | $ | 4,839 | | | |
Investment income | | | | | | | | | | | | | | | | | | | | | | | | | | | | |
Investment income | | | 2,886 | | | | 2,884 | | | | 2,982 | | | | | | 2,707 | | | | 2,691 | | | | 2,630 | | | |
Realized and unrealized gains on assets supporting policy liabilities | | | 933 | | | | 413 | | | | – | | | | | | 594 | | | | 462 | | | | – | | | |
Other revenue | | | 621 | | | | 627 | | | | 614 | | | | | | 583 | | | | 585 | | | | 542 | | | |
Total revenue | | $ | 10,191 | | | $ | 9,203 | | | $ | 9,084 | | | | | $ | 9,267 | | | $ | 8,680 | | | $ | 8,011 | | | |
Policyholder benefits | | $ | 6,829 | | | $ | 5,886 | | | $ | 5,967 | | | | | $ | 6,066 | | | $ | 5,565 | | | $ | 5,261 | | | |
General expenses | | | 592 | | | | 615 | | | | 610 | | | | | | 558 | | | | 575 | | | | 538 | | | |
Investment expenses | | | 136 | | | | 133 | | | | 124 | | | | | | 126 | | | | 125 | | | | 109 | | | |
Commissions | | | 1,288 | | | | 1,253 | | | | 1,196 | | | | | | 1,212 | | | | 1,183 | | | | 1,055 | | | |
Other | | | 160 | | | | 140 | | | | 168 | | | | | | 150 | | | | 131 | | | | 148 | | | |
Total policy benefits and expenses | | $ | 9,005 | | | $ | 8,027 | | | $ | 8,065 | | | | | $ | 8,112 | | | $ | 7,579 | | | $ | 7,111 | | | |
Income before income taxes | | $ | 1,186 | | | $ | 1,176 | | | $ | 1,019 | | | | | $ | 1,155 | | | $ | 1,101 | | | $ | 900 | | | |
Income taxes | | | (407 | ) | | | (395 | ) | | | (342 | ) | | | | | (398 | ) | | | (369 | ) | | | (302 | ) | | |
Net income attributed to shareholders | | $ | 779 | | | $ | 781 | | | $ | 677 | | | | | $ | 757 | | | $ | 732 | | | $ | 598 | | | |
Premiums and Deposits
Premiums and deposits of US$6.7 billion for the year ended December 31, 2008, were up nine per cent from US$6.1 billion reported in 2007. Higher sales during the year in John Hancock Life and growth in the in-force business in both units contributed to this increase.
Premiums and Deposits
| | | | | | | | | | | | | | | | | | | | | | |
For the years ended December 31
(in $ millions) | | | | | | Canadian $ | | | | | | | | US $ | | |
| | 2008 | | 2007 | | 2006 | | | | 2008 | | 2007 | | 2006 | | |
Premium income | | $ | 5,751 | | $ | 5,279 | | $ | 5,488 | | | | $ | 5,383 | | $ | 4,942 | | $ | 4,839 | | |
Segregated fund deposits | | | 1,398 | | | 1,259 | | | 1,225 | | | | | 1,303 | | | 1,177 | | | 1,080 | | |
Total premiums and deposits | | $ | 7,149 | | $ | 6,538 | | $ | 6,713 | | | | $ | 6,686 | | $ | 6,119 | | $ | 5,919 | | |
Funds Under Management
Funds under management as at December 31, 2008 were US$57.4 billion, consistent with a year ago, as business growth experienced in both Life and Long Term Care was offset by a decrease in the market value of the variable life segregated fund assets.
Funds Under Management
| | | | | | | | | | | | | | | | | | | | | | |
As at December 31
(in $ millions) | | | | | | Canadian $ | | | | | | | | US $ | | |
| | 2008 | | 2007 | | 2006 | | | | 2008 | | 2007 | | 2006 | | |
General fund | | $ | 59,967 | | $ | 45,064 | | $ | 48,675 | | | | $ | 48,969 | | $ | 45,605 | | $ | 41,770 | | |
Segregated funds | | | 10,342 | | | 11,387 | | | 12,583 | | | | | 8,445 | | | 11,525 | | | 10,798 | | |
Total funds under management | | $ | 70,309 | | $ | 56,451 | | $ | 61,258 | | | | $ | 57,414 | | $ | 57,130 | | $ | 52,568 | | |
Moving Forward
In 2009 U.S. Insurance will continue to strengthen our leadership positions in our Life, Long Term Care and Advisor businesses. Although the economic outlook has the potential to reduce the overall spending on insurance products, we expect to be a benefactor of the flight to quality that started in late 2008.
At John Hancock Life, our theme for 2009 is to focus on product innovation, sophisticated underwriting, and strong distribution through multiple channels. Life has a goal of providing customers the most broadly competitive product portfolio in the industry and is pursuing an aggressive schedule of new product introductions in 2009, including updates to our popular guaranteed universal life products. Four new products were readied for launch in January 2009 alone. From a distribution standpoint, Life is planning to further solidify its already industry-leading shelf space and to grow key relationships with agents and major third party organizations. In underwriting, our focus will be to maintain consistency in our prudent approach to risk assessment and risk management while continuing to reflect the latest medical advancements in our proprietary underwriting manual.
At John Hancock Long Term Care, our priority in 2009 is to bolster our position as the leading seller of long-term care insurance in the U.S. by growing our market share in the Individual and Group product lines, with particular focus on the affinity and small group markets. On the product development front, we are working on our next generation of products, which will focus on making products more affordable and easier to understand for consumers and advisors alike. Distribution expansion initiatives include a renewed commitment to the financial planning channel and improvements in process and technology to benefit all of our advisors. In addition, we will continue to invest in a new claims system, which will improve servicing capabilities for policyholders and their families at time of claim.
JHFN is the leading distributor of John Hancock wealth and protection products. JHFN’s goal in 2009 is to attract new financial representatives to the newly launched distribution model, the national network of Independent Career firms. The new model blends the best attributes of the traditional career system with those of the independent broker-dealer model. It offers financial representatives the power to build their business their way by providing three affiliation models, all of which provide access to the infrastructure of JHFN and the scale and stability of John Hancock.
U.S. Wealth Management
Our U.S. Wealth Management operation provides a variety of personal and family oriented wealth management products and services to select individual and business markets, as well as institutional oriented products for employee benefit plan funding solutions. U.S. Wealth Management has four core business lines.
| n | | John Hancock Retirement Plan Services provides 401(k) plans to small and medium-sized businesses. |
| n | | John Hancock Variable Annuities offers variable annuity products primarily to middle and upper-income individuals. |
| n | | John Hancock Mutual Funds offers a variety of mutual funds, privately managed accounts and 529 College Savings plans. |
| n | | John Hancock Fixed Products offers fixed deferred and immediate annuities to individuals, and offers payout annuities as well as a variety of fee and spread-based products to institutional clients. |
In 2008, U.S. Wealth Management contributed 51 per cent of the Company’s total premiums and deposits and, as at December 31, 2008, accounted for 41 per cent of the Company’s funds under management.
Financial Performance
U.S. Wealth Management reported a net loss of US$694 million for 2008 compared with earnings of US$1,054 million reported a year earlier. The loss in 2008 arose from the increase in segregated fund guarantee reserves, lower fee income and lower investment results.
Summary Statements of Operations
| | | | | | | | | | | | | | | | | | | | | | | | | | | | |
For the years ended December 31
(in $ millions) | | | | | | | | Canadian $ | | | | | | | | | | | US $ | | | |
| | 2008 | | | 2007 | | | 2006 | | | | | 2008 | | | 2007 | | | 2006 | | | |
Revenue | | | | | | | | | | | | | | | | | | | | | | | | | | | | |
Premium income | | $ | 6,264 | | | $ | 4,285 | | | $ | 3,741 | | | | | $ | 5,791 | | | $ | 4,046 | | | $ | 3,298 | | | |
Investment income | | | | | | | | | | | | | | | | | | | | | | | | | | | | |
Investment income | | | 2,089 | | | | 2,422 | | | | 2,858 | | | | | | 1,963 | | | | 2,258 | | | | 2,520 | | | |
Realized and unrealized gains (losses) on assets supporting policy liabilities and consumer notes | | | (851 | ) | | | 62 | | | | – | | | | | | (835 | ) | | | 71 | | | | – | | | |
Other revenue | | | 2,545 | | | | 2,733 | | | | 2,412 | | | | | | 2,405 | | | | 2,552 | | | | 2,127 | | | |
Total revenue | | $ | 10,047 | | | $ | 9,502 | | | $ | 9,011 | | | | | $ | 9,324 | | | $ | 8,927 | | | $ | 7,945 | | | |
Policyholder benefits | | $ | 9,256 | | | $ | 5,331 | | | $ | 5,042 | | | | | $ | 8,314 | | | $ | 5,037 | | | $ | 4,444 | | | |
General expenses | | | 781 | | | | 794 | | | | 784 | | | | | | 734 | | | | 740 | | | | 692 | | | |
Investment expenses | | | 453 | | | | 503 | | | | 455 | | | | | | 427 | | | | 471 | | | | 400 | | | |
Commissions | | | 1,110 | | | | 1,154 | | | | 1,003 | | | | | | 1,043 | | | | 1,080 | | | | 886 | | | |
Other | | | 99 | | | | 166 | | | | 158 | | | | | | 94 | | | | 157 | | | | 139 | | | |
Total policy benefits and expenses | | $ | 11,699 | | | $ | 7,948 | | | $ | 7,442 | | | | | $ | 10,612 | | | $ | 7,485 | | | $ | 6,561 | | | |
Income (loss) before income taxes | | $ | (1,652 | ) | | $ | 1,554 | | | $ | 1,569 | | | | | $ | (1,288 | ) | | $ | 1,442 | | | $ | 1,384 | | | |
Income taxes | | | 731 | | | | (422 | ) | | | (440 | ) | | | | | 594 | | | | (388 | ) | | | (389 | ) | | |
Net income (loss) attributed to shareholders | | $ | (921 | ) | | $ | 1,132 | | | $ | 1,129 | | | | | $ | (694 | ) | | $ | 1,054 | | | $ | 995 | | | |
Premiums and Deposits
Premiums and deposits were US$33.3 billion, up US$0.4 billion from US$32.9 billion reported in 2007. Growth in Fixed Products, Mutual Funds, and Retirement Plan Services was partially offset by declines in Variable Annuities.
General fund premiums primarily from annuity sales in Fixed Products and from fixed rate investment product options represented 17 per cent of total premiums and deposits in 2008 and were 43 per cent higher than last year. This growth was primarily due to the increased utilization of Variable Annuities dollar cost averaging program, and higher sales of fixed rate products.
Segregated fund deposits represented 57 per cent of total premiums and deposits in 2008. Variable Annuities segregated fund deposits of US$6.8 billion declined by 27 per cent due to the equity market volatility and strong product competition. Retirement Plan Services segregated fund deposits of US$12.0 billion increased by two per cent as the higher recurring deposits from the growing block of in-force business was partially offset by lower transfers on new sales because of market value declines.
Mutual fund deposits represented 24 per cent of total premiums and deposits in 2008. Mutual fund deposits of US$8.0 billion were 16 per cent higher than the prior year from record sales as a result of strong relative investment performance in certain funds and expanded distribution.
Other fund deposits of US$0.5 billion declined 25 per cent from the prior year driven by unfavorable equity markets and a general slowdown in the 529 College Savings market.
Premiums and Deposits
| | | | | | | | | | | | | | | | | | | | | | |
For the years ended December 31
(in $ millions) | | | | | | Canadian $ | | | | | | | | US $ | | |
| | 2008 | | 2007 | | 2006 | | | | 2008 | | 2007 | | 2006 | | |
Premium income | | $ | 6,264 | | $ | 4,285 | | $ | 3,741 | | | | $ | 5,791 | | $ | 4,046 | | $ | 3,298 | | |
Segregated fund deposits | | | 20,187 | | | 22,831 | | | 22,645 | | | | | 19,013 | | | 21,233 | | | 19,962 | | |
Mutual fund deposits | | | 8,427 | | | 7,472 | | | 7,828 | | | | | 8,040 | | | 6,958 | | | 6,903 | | |
Other fund deposits | | | 534 | | | 726 | | | 1,053 | | | | | 502 | | | 669 | | | 927 | | |
Total premiums and deposits | | $ | 35,412 | | $ | 35,314 | | $ | 35,267 | | | | $ | 33,346 | | $ | 32,906 | | $ | 31,090 | | |
Funds Under Management
Funds under management were US$133.9 billion, down 25 per cent from US$178.1 billion at December 31, 2007. The decline was due to the cumulative effect of unfavourable equity markets on segregated and mutual fund assets and also from US$3.4 billion of scheduled maturities in Fixed Products over the last twelve months, partially offset by net policyholder cash inflows of US$8.1 billion.
Funds Under Management
| | | | | | | | | | | | | | | | | | | | | | |
As at December 31
(in $ millions) | | | | | | Canadian $ | | | | | | | | US $ | | |
| | 2008 | | 2007 | | 2006 | | | | 2008 | | 2007 | | 2006 | | |
General fund | | $ | 39,581 | | $ | 35,823 | | $ | 44,947 | | | | $ | 32,322 | | $ | 36,254 | | $ | 38,570 | | |
Segregated funds | | | 99,133 | | | 108,878 | | | 112,269 | | | | | 80,952 | | | 110,189 | | | 96,344 | | |
Mutual funds | | | 21,943 | | | 27,585 | | | 35,499 | | | | | 17,919 | | | 27,917 | | | 30,464 | | |
Other funds | | | 3,279 | | | 3,713 | | | 3,957 | | | | | 2,677 | | | 3,759 | | | 3,396 | | |
Total funds under management | | $ | 163,936 | | $ | 175,999 | | $ | 196,672 | | | | $ | 133,870 | | $ | 178,119 | | $ | 168,774 | | |
Moving Forward
U.S. Wealth Management’s focus in 2009 is to preserve and grow market share during a period of unprecedented volatility and amid historic changes to the structure of the banks and brokerages that distribute our products.
John Hancock Variable Annuities will deliver competitively priced products, while modifying features and prices to reflect the heightened volatility prevalent throughout financial markets. Steep market declines and low interest rates have prompted an industry-wide re-pricing of variable annuity living benefits, while at the same time intensifying the demand for the safety and security offered by guaranteed products. With our growing distribution footprint across all major non-proprietary channels, including wirehouse and regional broker-dealers, independent financial planners, and bank programs, we believe that we will benefit from a general flight to quality, as Manulife and John Hancock remain among the highest-rated and financially strongest life insurance companies in the world. Edward Jones, a major new distribution arrangement in 2008, is maturing into a significant contributor. We are committed to continuing our enhancements to service capabilities and to simplify our point of sale and improve customer service interactions, in order to further develop the reputation of John Hancock Variable Annuities as Partner of Choice among end-consumers and financial advisors alike.
John Hancock Retirement Plan Services will continue its market expansion and grow its in-force block of more than 1.7 million participants and more than 42,000 plans. Distribution plans include capitalizing on the new relationships formed in 2008 with Morgan Stanley and Ameriprise, attracting additional partners and completing its 30 per cent wholesaling force expansion, a program that began in 2007. Expansion plans also include the newly opened Retirement Income and Rollover Services unit (RIRS) which enables John Hancock plan participants to seamlessly roll over 401(k) accounts into individual IRAs, and offers cross-selling opportunities among various wealth management business units, with the aim of helping advisors capture wealth assets for the lifetime of a client. Product features like the Guaranteed Income for Life (GIFL) rider continue to attract new business and the recently completed large record-keeping project provides a platform to further improve service and distribution capabilities.
John Hancock Fixed Products expects strong demand for fixed rate products to continue and will add new product offerings and expand distribution throughout 2009. With the launch of JH Spectrum in the fall of 2008 and the expansion of our Fixed Annuity wholesaling team, we are well-positioned to take full advantage of this market opportunity. Distribution initiatives focus on JHFN, the bank channel, and access to new distribution relationships. The Structured Settlements group (Payout Annuities) is expanding its sales and operations resources to drive incremental sales and capture more market share. In the service area, Fixed Products is continuing efficiency and customer service improvements.
John Hancock Mutual Funds is positioned to continue its sales momentum by managing its fund lineup and by continuing to adjust the distribution model in response to market developments. Our goal is to build multiple offerings with top performance, giving advisors and investors more choices to anchor portfolios. Funds with Four- or Five-Star Morningstar ratings and funds launched over the last few years that have posted strong performance including the Floating Rate Income, Strategic Income, High Yield Municipal Bond, Large Cap Equity, Rainier Growth, Global Shareholder Yield, Sovereign Investors, and our suite of GMO-managed funds position us well for growth. The Classic Value and US Global Leaders Growth funds are positioned to outperform going forward and there are plans for the launch of new mutual funds which leverage Manulife Financial’s investment management competencies. We continue to rationalize our product line through mergers and adoptions, including the adoption of the Robeco Boston Partners Large Cap Value Fund (rated Four-Stars by Morningstar) and subsequent re-launch as the John Hancock Disciplined Value Fund in early 2009. Following the market-driven decline in assets, we have restructured wholesaler territories and we will continue to adjust our distribution model in response to market developments.
Canadian Division
Our Canadian Division is one of the leading life insurance based financial services organizations in Canada. We offer a diverse portfolio of products, services and distribution channels to meet the needs of a broad marketplace. Our individual life and living benefit insurance products are aimed at middle and upper-income individuals and business owners. Group life, health, disability and retirement products and services are marketed to Canadian employers. We also market life, health and specialty products to members of affinity organizations, such as professional associations, and to the customers of financial institutions. Our individual wealth management product offerings include segregated funds, fixed annuities, guaranteed investment certificates (“GICs”) and mutual funds. In addition, a variety of banking products including mortgages, leverage loans, high interest accounts and GICs are offered through the Manulife Bank of Canada (“Manulife Bank”).
In 2008, Canadian Division contributed 23 per cent of the Company’s total premiums and deposits and, as at December 31, 2008, accounted for 20 per cent of the Company’s funds under management.
Financial Performance
Canadian Division’s shareholders’ net income for 2008 was $656 million, $454 million less than the $1,110 million reported in 2007, primarily reflecting the impact of equity market declines. These losses were partially offset by business growth in Manulife Bank and insurance, more favourable claims experience and focused expense management. Also included in 2008 earnings was a one-time $181 million gain from the recognition of the impact to policy liabilities of expected changes in Canadian tax law for insurance companies in connection with fair value accounting.
Summary Statements of Operations
For the years ended December 31
| | | | | | | | | | | | | | |
| (Canadian $ in millions) | | 2008 | | | 2007 | | | 2006 | | | |
Revenue | | | | | | | | | | | | | | |
Premium income | | $ | 6,765 | | | $ | 6,208 | | | $ | 5,932 | | | |
Investment income | | | | | | | | | | | | | | |
Investment income | | | 2,908 | | | | 2,803 | | | | 2,924 | | | |
Realized and unrealized (losses) gains on assets supporting policy liabilities | | | (2,364 | ) | | | (210 | ) | | | 240 | | | |
Other revenue | | | 1,116 | | | | 1,044 | | | | 843 | | | |
Total revenue | | $ | 8,425 | | | $ | 9,845 | | | $ | 9,939 | | | |
Policyholder benefits | | $ | 4,344 | | | $ | 5,645 | | | $ | 6,249 | | | |
General expenses | | | 1,030 | | | | 976 | | | | 926 | | | |
Investment expenses | | | 269 | | | | 268 | | | | 214 | | | |
Commissions | | | 1,127 | | | | 1,000 | | | | 816 | | | |
Other | | | 537 | | | | 513 | | | | 411 | | | |
Total policy benefits and expenses | | $ | 7,307 | | | $ | 8,402 | | | $ | 8,616 | | | |
Income before income taxes | | $ | 1,118 | | | $ | 1,443 | | | $ | 1,323 | | | |
Income taxes | | | (467 | ) | | | (330 | ) | | | (304 | ) | | |
Net income | | $ | 651 | | | $ | 1,113 | | | $ | 1,019 | | | |
Less net income (loss) attributed to participating policyholders | | | (5 | ) | | | 3 | | | | (61 | ) | | |
Net income attributed to shareholders | | $ | 656 | | | $ | 1,110 | | | $ | 1,080 | | | |
Premiums and Deposits
Premiums and deposits for the year ended December 31, 2008 were $16.4 billion, up two per cent from $16.1 billion reported in 2007. General fund premiums and Administration Services Only premium equivalents rose by eight per cent reflecting growth in our insurance businesses and higher sales of fixed rate wealth management products in response to equity market volatility. Segregated fund deposits in 2007 were buoyed by the sale of a $1 billion contract in Group Savings and Retirement Solutions. Excluding this sale, segregated fund deposits increased by 11 per cent in 2008.
Premiums and Deposits
For the years ended December 31
| | | | | | | | | | | |
| (Canadian $ in millions) | | 2008 | | 2007 | | 2006 | | |
Premiums | | $ | 6,765 | | $ | 6,208 | | $ | 5,932 | | |
Segregated fund deposits | | | 6,611 | | | 6,982 | | | 4,619 | | |
Mutual fund deposits | | | 515 | | | 558 | | | 761 | | |
ASO premium equivalents | | | 2,488 | | | 2,373 | | | 2,225 | | |
Total premiums and deposits | | $ | 16,379 | | $ | 16,121 | | $ | 13,537 | | |
Funds Under Management
Funds under management decreased by five per cent, or $3.9 billion, to $82.3 billion at December 31, 2008. The impact of equity market declines outweighed the increase from positive net sales and a 24 per cent rise in Manulife Bank’s invested assets as a result of continued strong growth in Manulife One mortgage lending assets.
Funds Under Management
As at December 31
| | | | | | | | | | | |
| (Canadian $ in millions) | | 2008 | | 2007 | | 2006 | | |
General fund | | $ | 52,314 | | $ | 51,474 | | $ | 46,509 | | |
Segregated funds | | | 27,628 | | | 31,391 | | | 27,448 | | |
Mutual and other funds | | | 2,320 | | | 3,286 | | | 3,441 | | |
Total funds under management | | $ | 82,262 | | $ | 86,151 | | $ | 77,398 | | |
Moving Forward
Our vision is to be the premier life insurance based financial services organization in Canada with a reputation for innovative products, excellent service and professional value-added advice. Our focus is on distribution excellence, product leadership, cross-business unit collaboration and providing service value to our customers. While it is expected that the current economic environment will impact growth rates in the short-term, we believe that with our focus on business fundamentals, supported by the strong Manulife Financial brand, we will maintain our leadership position in the Canadian insurance industry.
Continually enhancing our strong multi-channel distribution capabilities is critical to success in all of our businesses. The group businesses will continue to focus on expanding points of distribution, adding capacity in under-penetrated channels and markets. Our distribution success in individual products is built on a diversified, multi-channel independent distribution platform and we will continue to expand and enhance our distributor relationships.
Contributing to our strength in distribution is our commitment to provide advisors with competitive products and services to meet customers’ diverse needs. We will continue to invest in the industry-leading professional value-added services provided by our tax and estate planning teams as well as channel and product wholesalers who market our product and sales solutions to advisors, keeping them current on developments and innovative ways to meet a client’s needs. The recently launched Retirement Solutions Centre provides tools to help advisors learn more about using a combination of products to help clients better plan for and protect their retirement income. This innovative approach is one response to changing demographics and health care reform as aging baby boomers approach retirement and seek more comprehensive financial planning and health care solutions. We will continue to focus on this target market enhancing our life, living benefits, banking and savings products; and expanding the capabilities of the Retirement Solutions Centre to meet the evolving needs of an aging Canadian population.
Group Benefits maintains its strong presence in the mature Canadian marketplace, developing new products and services in response to the changing legislative and demographic landscape in Canada. Group Savings and Retirement Solutions will continue to expand its share in the mid to large case market creating innovative, value-added solutions to assist plan members in accumulating retirement assets and planning for their retirement income.
Service quality is key for all our businesses, underlying both sales growth and customer retention. Our technology and infrastructure initiatives are concentrated on improving customer satisfaction by supporting new product development and improving service, while driving productivity gains and expense efficiencies. We closely monitor customer and advisor perceptions of our service quality in order to proactively improve their service experience. Our Retail Service Program is a cooperative effort across all our business units to more closely align service across the Division and make us “easy to do business with” by leveraging technology and resources and developing common processes, forms and standards. Consistent with the theme of improving service and reducing expenses, we continue to rationalize multiple administration systems, a legacy from previous merger and acquisition activity, as well as implement new technology solutions across our businesses. Examples in progress include “Insight” which allows an advisor to view all of a client’s Manulife Financial products on a single platform and Distributor Relationship Services (“DRS”) which provides a single centralized source of advisor contract and contact information.
Asia and Japan Division
Manulife Financial has operated in Asia since 1897, beginning in Hong Kong and the Philippines, expanding into Singapore, Indonesia, Taiwan, China, Japan, Vietnam, Malaysia and Thailand. We provide protection and wealth management products in select markets throughout the region. Protection products include life insurance, group life and health, and hospital coverage. Wealth management products include mutual funds, pensions, variable annuities and segregated funds.
In 2008, Asia and Japan Division contributed 14 per cent of the Company’s total premiums and deposits and, as at December 31, 2008, accounted for 12 per cent of the Company’s funds under management.
Financial Performance
Earnings for 2008 were US$243 million compared to US$794 million reported in 2007. Strengthened segregated fund guarantee liabilities in Japan and lower fee income across all wealth management businesses were only partially offset by in-force business growth, new product launches and gains on pricing actions taken in Hong Kong.
Summary Statements of Operations
| | | | | | | | | | | | | | | | | | | | | | | | | | | | |
For the years ended December 31 (in $ millions) | | | | | | | | Canadian $ | | | | | | | | | | | US $ | | | |
| | 2008 | | | 2007 | | | 2006 | | | | | 2008 | | | 2007 | | | 2006 | | | |
Revenue | | | | | | | | | | | | | | | | | | | | | | | | | | | | |
Premium income | | $ | 3,381 | | | $ | 2,946 | | | $ | 2,933 | | | | | $ | 3,159 | | | $ | 2,753 | | | $ | 2,588 | | | |
Investment income | | | | | | | | | | | | | | | | | | | | | | | | | | | | |
Investment income | | | 838 | | | | 744 | | | | 863 | | | | | | 789 | | | | 689 | | | | 761 | | | |
Realized and unrealized (losses) gains on assets supporting policy liabilities | | | (1,458 | ) | | | 519 | | | | – | | | | | | (1,412 | ) | | | 497 | | | | – | | | |
Other revenue | | | 853 | | | | 767 | | | | 515 | | | | | | 805 | | | | 723 | | | | 454 | | | |
Total revenue | | $ | 3,614 | | | $ | 4,976 | | | $ | 4,311 | | | | | $ | 3,341 | | | $ | 4,662 | | | $ | 3,803 | | | |
Policyholder benefits | | $ | 1,857 | | | $ | 2,596 | | | $ | 2,152 | | | | | $ | 1,592 | | | $ | 2,436 | | | $ | 1,900 | | | |
General expenses | | | 671 | | | | 598 | | | | 564 | | | | | | 629 | | | | 560 | | | | 498 | | | |
Investment expenses | | | 48 | | | | 58 | | | | 44 | | | | | | 46 | | | | 54 | | | | 39 | | | |
Commissions | | | 708 | | | | 645 | | | | 566 | | | | | | 668 | | | | 604 | | | | 498 | | | |
Other | | | 107 | | | | 93 | | | | 84 | | | | | | 100 | | | | 87 | | | | 73 | | | |
Total policy benefits and expenses | | $ | 3,391 | | | $ | 3,990 | | | $ | 3,410 | | | | | $ | 3,035 | | | $ | 3,741 | | | $ | 3,008 | | | |
Income before income taxes | | $ | 223 | | | $ | 986 | | | $ | 901 | | | | | $ | 306 | | | $ | 921 | | | $ | 795 | | | |
Income taxes | | | (61 | ) | | | (166 | ) | | | (166 | ) | | | | | (78 | ) | | | (159 | ) | | | (147 | ) | | |
Net income | | $ | 162 | | | $ | 820 | | | $ | 735 | | | | | $ | 228 | | | $ | 762 | | | $ | 648 | | | |
Less net (loss) income attributed to participating policyholders | | | (15 | ) | | | (31 | ) | | | 46 | | | | | | (15 | ) | | | (32 | ) | | | 41 | | | |
Net income attributed to shareholders | | $ | 177 | | | $ | 851 | | | $ | 689 | | | | | $ | 243 | | | $ | 794 | | | $ | 607 | | | |
Premiums and Deposits
Premiums and deposits were US$9.2 billion, down six per cent from US$9.8 billion reported in 2007. Growth in insurance premiums generated by in-force business growth and new product launches was more than offset by the decline in wealth management deposits due to volatile equity markets.
Premium income grew 15 per cent over 2007 driven by in-force business growth and sales from most territories, particularly Japan where premiums from new product launches amounted to US$90 million. Growth in the territories was driven by the branch expansion in China, new product launches in Singapore and growth in Indonesia.
Segregated fund deposits declined four per cent because of lower unit-linked product sales in Hong Kong and Singapore. These declines were partially offset by a 10 per cent increase in variable annuity deposits, on a constant currency basis, and higher pension deposits in Hong Kong.
Mutual fund deposits were US$0.5 billion, down US$0.8 billion from US$1.3 billion reported in 2007. Lower mutual fund deposits due to volatile financial markets were partially offset by mutual fund sales through our newly acquired asset management company in Taiwan in the fourth quarter.
Premiums and Deposits
| | | | | | | | | | | | | | | | | | | | | | |
For the years ended December 31 (in $ millions) | | | | | | Canadian $ | | | | | | | | US $ | | |
| | 2008 | | 2007 | | 2006 | | | | 2008 | | 2007 | | 2006 | | |
Premium income | | $ | 3,381 | | $ | 2,946 | | $ | 2,933 | | | | $ | 3,159 | | $ | 2,753 | | $ | 2,588 | | |
Segregated fund deposits | | | 5,837 | | | 6,122 | | | 4,747 | | | | | 5,563 | | | 5,774 | | | 4,177 | | |
Mutual fund deposits | | | 531 | | | 1,338 | | | 681 | | | | | 498 | | | 1,270 | | | 598 | | |
Total premiums and deposits | | $ | 9,749 | | $ | 10,406 | | $ | 8,361 | | | | $ | 9,220 | | $ | 9,797 | | $ | 7,363 | | |
Funds Under Management
Funds under management decreased by seven per cent, or US$3.0 billion, to US$40.8 billion as at December 31, 2008. Net policyholder cash inflows of US$5.4 billion and the funds assumed through our newly acquired asset management company in Taiwan were more than offset by the negative impact of declining equity markets in the past twelve months.
Funds Under Management
| | | | | | | | | | | | | | | | | | | | | | |
As at December 31 (in $ millions) | | | | | | Canadian $ | | | | | | | | US $ | | |
| | 2008 | | 2007 | | 2006 | | | | 2008 | | 2007 | | 2006 | | |
General fund | | $ | 21,406 | | $ | 16,752 | | $ | 16,560 | | | | $ | 17,476 | | $ | 16,954 | | $ | 14,212 | | |
Segregated funds | | | 24,541 | | | 20,727 | | | 17,232 | | | | | 20,039 | | | 20,977 | | | 14,787 | | |
Mutual and other funds | | | 4,024 | | | 5,779 | | | 3,744 | | | | | 3,286 | | | 5,848 | | | 3,213 | | |
Total funds under management | | $ | 49,971 | | $ | 43,258 | | $ | 37,536 | | | | $ | 40,801 | | $ | 43,779 | | $ | 32,212 | | |
Moving Forward
Asia and Japan Division will leverage its core strengths of professional agency distribution and commitment to customer service excellence to expand distribution through banks, financial advisors and other alternative channels and to expand product offerings with a particular emphasis on wealth management across the region.
In Hong Kong, our brand recognition is supported by our 1.5 million customers, strong financial ratings and a professionally trained agency force of over 3,700. We will continue to diversify our distribution in the bancassurance and independent financial advisory channels by strengthening our wholesaling and account management capabilities and by building a service and compliance support platform that differentiates us from our competitors. By continuing our aggressive product development efforts we will maintain our leading range of investment, savings and protection products.
In Japan, we continue to grow our Insurance and Wealth Management businesses through channel expansion, additional distribution relationships and broader product offerings that appeal to the unique characteristics of each channel. Late in 2008, we added a second pillar to our Wealth Management business with the addition of Mutual Funds. Moving forward, we will continue to leverage our North American expertise in product development and distribution in order to capitalize on growth opportunities in our Wealth Management businesses. Our focus for Insurance remains on increasing the productivity of our career agents channel, expanding and diversifying our independent agent relationships, a channel that has seen significant growth this past year, and introducing new products, including those tailored for the corporate market through our independent agencies and insurance products for distribution through our bank relationships. In 2008, our development of corporate products for the Managed General Accounts channel helped fuel significant growth in that channel as well as in our career agent channel.
In China our focus continues to be on geographic expansion to solidify our position as a leading Sino-foreign insurance joint venture. We ended 2008 with operations in 34 cities, and were approved for an additional city, the most of any foreign insurance joint venture. We will continue to focus on growing our operations geographically and expanding distribution and product beyond our traditional agency and insurance product focus.
Our Other Asia Territories’ operations are becoming increasingly larger contributors to our overall results, a trend that we expect to continue. Distribution initiatives include expanding the agency channel through accelerated recruiting, improved retention and increased productivity and continuing to diversify by seeking new and alternative distribution that offers significant opportunities for growth. Many initiatives are in place or being planned across all territories, seizing opportunities as they arise or exploring and testing options with potential new distribution partners. In 2008, we established an asset management company in Malaysia and acquired an asset management company in Taiwan and we continue to expand our asset management footprint.
Reinsurance Division
Established in 1984, our Reinsurance Division has become one of North America’s leading providers of risk management solutions, specializing in retrocession. In simple terms, reinsurance is the transfer of all or part of certain risks related to policies issued by an insurance company to a reinsurer. Retrocession is reinsurance whereby a reinsurer assumes risk from other reinsurers.
Through offices in Canada, the United States, Belgium, Barbados, Germany, Singapore and Japan, we provide customer-focused solutions and innovative products in the following lines of business:
| n | | Life – offering retrocession of traditional life mortality risk and specialized non-traditional solutions; |
| n | | Property and Casualty – offering retrocession of traditional property catastrophe and aviation catastrophe risks for Property and Casualty reinsurers; and |
| n | | International Group Program (“IGP”) – offering international employee benefits management to multinational corporations and their affiliates through a global network of life insurance companies. |
In 2008, Reinsurance Division contributed two per cent of the Company’s premiums and deposits.
Financial Performance
Earnings for the year 2008 were US$154 million, down 30 per cent from US$221 million reported a year earlier. The decrease in earnings was attributable to the significantly higher reserves required for our closed block of segregated fund guarantee business partially offset by improved property and casualty claim experience and an update in premium accrual estimates.
Summary Statements of Operations
| | | | | | | | | | | | | | | | | | | | | | | | | | | | |
For the years ended December 31 (in $ millions) | | | | | | | | Canadian $ | | | | | | | | | | | US $ | | | |
| | 2008 | | | 2007 | | | 2006 | | | | | 2008 | | | 2007 | | | 2006 | | | |
Revenue | | | | | | | | | | | | | | | | | | | | | | | | | | | | |
Premium income | | $ | 1,091 | | | $ | 1,026 | | | $ | 1,010 | | | | | $ | 1,028 | | | $ | 956 | | | $ | 890 | | | |
Investment income | | | | | | | | | | | | | | | | | | | | | | | | | | | | |
Investment income | | | 175 | | | | 186 | | | | 208 | | | | | | 164 | | | | 172 | | | | 184 | | | |
Realized and unrealized (losses) gains on assets supporting policy liabilities | | | (43 | ) | | | 29 | | | | – | | | | | | (45 | ) | | | 31 | | | | – | | | |
Other revenue | | | 24 | | | | 20 | | | | 19 | | | | | | 23 | | | | 19 | | | | 17 | | | |
Total revenue | | $ | 1,247 | | | $ | 1,261 | | | $ | 1,237 | | | | | $ | 1,170 | | | $ | 1,178 | | | $ | 1,091 | | | |
Policyholder benefits | | $ | 1,002 | | | $ | 862 | | | $ | 745 | | | | | $ | 926 | | | $ | 811 | | | $ | 658 | | | |
General expenses | | | 51 | | | | 52 | | | | 52 | | | | | | 48 | | | | 49 | | | | 45 | | | |
Investment expenses | | | 4 | | | | 4 | | | | 3 | | | | | | 4 | | | | 3 | | | | 3 | | | |
Commissions | | | 2 | | | | 4 | | | | 5 | | | | | | 2 | | | | 3 | | | | 5 | | | |
Other | | | 10 | | | | 8 | | | | 10 | | | | | | 9 | | | | 7 | | | | 8 | | | |
Total policy benefits and expenses | | $ | 1,069 | | | $ | 930 | | | $ | 815 | | | | | $ | 989 | | | $ | 873 | | | $ | 719 | | | |
Income before income taxes | | $ | 178 | | | $ | 331 | | | $ | 422 | | | | | $ | 181 | | | $ | 305 | | | $ | 372 | | | |
Income taxes | | | (24 | ) | | | (93 | ) | | | (116 | ) | | | | | (27 | ) | | | (84 | ) | | | (102 | ) | | |
Net income attributed to shareholders | | $ | 154 | | | $ | 238 | | | $ | 306 | | | | | $ | 154 | | | $ | 221 | | | $ | 270 | | | |
Premiums
Premiums were US$1,028 million, up eight per cent from US$956 million reported in 2007. Life Reinsurance premium grew by 13 per cent due to strong new business volumes. Higher sales volume as well as the Euro currency appreciation contributed to an increase in IGP’s premium income.
Premiums
| | | | | | | | | | | | | | | | | | | | | | |
For the years ended December 31 (in $ millions) | | | | | | Canadian $ | | | | | | | | US $ | | |
| | 2008 | | 2007 | | 2006 | | | | 2008 | | 2007 | | 2006 | | |
Life Reinsurance | | $ | 584 | | $ | 523 | | $ | 476 | | | | $ | 548 | | $ | 487 | | $ | 419 | | |
Property and Casualty Reinsurance | | | 68 | | | 70 | | | 97 | | | | | 63 | | | 66 | | | 86 | | |
International Group Program | | | 439 | | | 433 | | | 437 | | | | | 417 | | | 403 | | | 385 | | |
Total premiums | | $ | 1,091 | | $ | 1,026 | | $ | 1,010 | | | | $ | 1,028 | | $ | 956 | | $ | 890 | | |
Moving Forward
With the volatile economic environment expected to continue in 2009, Reinsurance Division’s primary focus is to write profitable business while maintaining a leadership position in our three core markets. Although the market for life retrocession continues to feel the
impact of pricing pressures and increased retention by reinsurers and direct writers, the turbulence in the financial markets is expected to have a negative impact on insurers, as well as reinsurers, pushing them to seek solutions to address capital issues. Given our leadership position in the individual life retrocession market and our capital strength, we expect to work with our clients to find mutually attractive in-force opportunities as well as extend our excess-of-retention pool business. In addition, we will continue to work with clients to develop customized non-traditional reinsurance solutions that meet their requirements for risk and capital management.
The Property and Casualty catastrophe retro market show signs of stabilizing in 2009 with continued improvement in premium rates. Our Property and Casualty operations successfully filled its capacity limits taking advantage of the current market conditions to improve the quality of our portfolio.
The focus for IGP operations will be to maintain our dominant position in the North American market while growing in the European and Asian markets, despite the increased competition from leading providers.
Supplemental Information Regarding Non-Traditional Life Reinsurance
Reinsurance Division provides non-traditional reinsurance and retrocessional coverage to life and annuity insurers and reinsurers. This type of non-traditional life cover has been classified as financial reinsurance.
The non-traditional coverage is primarily coinsurance and modified coinsurance coverage of a share of specified blocks of life insurance or annuity contracts issued or reinsured by the cedant. It may also include the reinsurance of large blocks of life insurance on a yearly renewable term basis. All of the non-traditional coverage receives deposit accounting treatment for Canadian generally accepted accounting principles (“Canadian GAAP”) and United States generally accepted accounting principles (“U.S. GAAP”) purposes, but meets the requirements for reinsurance accounting under statutory rules. Under Canadian GAAP and U.S. GAAP deposit accounting, Reinsurance Division’s income related to these transactions is recorded as fee income, reported in other revenue on the income statement, and liabilities, if any, are recorded as deposit liabilities.
The main difference between traditional and non-traditional coinsurance and modified coinsurance for life and annuity reinsurance is that, in a non-traditional reinsurance agreement, the reinsurer pays a lower ceding commission for its share of a block of business than would otherwise be paid under a traditional reinsurance contract. Non-traditional transactions often involve the payment of experience refunds to the ceding insurer covering a substantial portion of the earnings accruing to the business reinsured during the early years of the contract. In addition, the contracts contain recapture rights (that is, rights of the ceding company to reassume future obligations for the reinsured contracts) that are often more flexible than those found in traditional coverage. These more flexible recapture rights are coupled with terms that create an incentive for the ceding insurer to recapture if the block is profitable on a statutory accounting basis.
All of the non-traditional life and annuity treaties written by the Company provide prospective coverage, covering liabilities extending out over the life of the underlying policyholder life and annuity contracts.
Corporate and Other
Corporate and Other is comprised of the Investment Division’s external asset management business, earnings on residual capital (assets backing capital, net of amount allocated to operating divisions), changes in actuarial methods and assumptions, the John Hancock Accident and Health operation, which primarily consists of contracts in dispute, and other non operating items.
As at December 31, 2008, Corporate and Other accounted for nine per cent of the Company’s funds under management.
Financial Performance
Corporate and Other reported a loss of $328 million in 2008, compared to income of $190 million reported in 2007. A significant contributor to the decrease in earnings was the impact of deteriorating equity markets, as this reduced realized gains from the sale of public equities and resulted in equity impairment charges. In addition, a change in assumptions on leveraged lease arrangements contributed to the decline. Partially offsetting these items was higher income from changes in actuarial methods and assumptions, higher oil and gas income reflecting higher average prices during the year and the non-recurrence of a charge for asset repositioning at the beginning of 2007 as a result of moving to the new Canadian Institute of Chartered Accountants (“CICA”) Handbook section 3855 “Financial Instruments – Recognition and Measurement”.
Summary Statements of Operations
| | | | | | | | | | | | | | |
For the years ended December 31 (Canadian $ in millions) | | 2008 | | | 2007 | | | 2006 | | | |
Revenue | | | | | | | | | | | | | | |
Investment income (loss) | | $ | (995 | ) | | $ | 33 | | | $ | 358 | | | |
Other revenue | | | 294 | | | | 305 | | | | 299 | | | |
Realized gains on invested assets | | | 180 | | | | 456 | | | | – | | | |
Total revenue | | $ | (521 | ) | | $ | 794 | | | $ | 657 | | | |
Policyholder benefits | | $ | (1,087 | ) | | $ | (109 | ) | | $ | (243 | ) | | |
General and investment expenses | | | 454 | | | | 369 | | | | 417 | | | |
Other | | | 588 | | | | 418 | | | | 381 | | | |
Total policy benefits and expenses | | $ | (45 | ) | | $ | 678 | | | $ | 555 | | | |
Income (loss) before income taxes | | $ | (476 | ) | | $ | 116 | | | $ | 102 | | | |
Income taxes | | | 148 | | | | 29 | | | | 2 | | | |
Net income (loss) | | $ | (328 | ) | | $ | 145 | | | $ | 104 | | | |
Loss attributed to participating policyholders(1) | | | – | | | | 45 | | | | – | | | |
Net income (loss) attributed to shareholders | | $ | (328 | ) | | $ | 190 | | | $ | 104 | | | |
(1) | Represents one-time charge to participating accounts in China reflecting the impact of moving to a methodology consistent with the other territories. |
Funds Under Management
Funds under management increased by ten per cent, or $3.1 billion, to $35.0 billion as at December 31, 2008. This increase is primarily driven by $2 billion of new deposits in Investment Division’s externally managed business, funds received from the five year term loan and share capital financing and the impact of the strengthening U.S. dollar. Partially offsetting these increases were the market value declines in both the equity and bond portfolios.
Funds Under Management
As at December 31
| | | | | | | | | | | |
| (Canadian $ in millions) | | 2008 | | 2007 | | 2006 | | |
General fund | | $ | 11,298 | | $ | 9,606 | | $ | 11,620 | | |
Segregated funds | | | 3,111 | | | 2,594 | | | 2,727 | | |
Third party funds managed by Investment Division | | | 20,633 | | | 19,704 | | | 24,164 | | |
Total funds under management | | $ | 35,042 | | $ | 31,904 | | $ | 38,511 | | |
Investment Division
Manulife Financial’s Investment Division, operating as MFC Global Investment Management (“MFC Global”), manages assets for the Company’s general fund and for third party retail and institutional clients through a variety of products and distribution channels.MFC Global manages a broad range of investments including equities, government and corporate bonds, debt private placements (“private placements”), real estate, mortgages, oil and gas, timber and agricultural land. Additionally, MFC Global has a physical presence in key financial centers around the world, including the United States, Canada, Hong Kong, Japan, the United Kingdom, Australia, and throughout South-East Asia.
General Fund Assets
The Company’s general fund invested assets increased to $187.5 billion as at December 31, 2008 from $161.3 billion as at December 31, 2007. The increase in assets was driven by $27.2 billion of positive currency impact due to the weakening Canadian dollar during the year, partially offset by $9.0 billion of negative mark to market of public securities. The following table shows the composition of the Company’s general fund invested assets.
General Fund Assets
| | | | | | | | | | | | | | |
As at December 31 (Canadian $ in millions) | | | | 2008 | | | | | | 2007 | | �� |
| | Carrying value | | % of total | | | | Carrying value | | % of total | | |
Cash and short-term investments | | $ | 17,269 | | 9 | | | | $ | 12,354 | | 8 | | |
Bonds | | | 83,148 | | 44 | | | | | 72,831 | | 45 | | |
Stocks | | | 8,354 | | 4 | | | | | 11,134 | | 7 | | |
Mortgages | | | 30,963 | | 17 | | | | | 26,061 | | 16 | | |
Private placements | | | 25,705 | | 14 | | | | | 21,591 | | 13 | | |
Policy loans | | | 7,533 | | 4 | | | | | 5,823 | | 4 | | |
Bank loans | | | 2,384 | | 1 | | | | | 2,182 | | 1 | | |
Real estate | | | 7,274 | | 4 | | | | | 5,727 | | 4 | | |
Other investments | | | 4,871 | | 3 | | | | | 3,597 | | 2 | | |
Total invested assets | | $ | 187,501 | | 100 | | | | $ | 161,300 | | 100 | | |
Bonds and Private Placements
The Company’s bond and private placement portfolio represented 58 per cent (2007 – 58 per cent) of invested assets as at December 31, 2008. This portfolio of public bonds and private placements is diversified by sector as well as by industry, duration and issuer. At the end of 2008, 95 per cent (2007 – 96 per cent) of the portfolio was invested in investment grade rated securities (BBB and higher).
The following table shows the distribution of the fair value of bond and private placement portfolio by sector and industry.
| | | | | | | | | | | | | | | | | | |
Bonds and Private Placements As at December 31 (Canadian $ in millions) | | | | | | 2008 | | | | | | | | 2007 | | |
| | Fair value | | % of total | | % Investment
Grade | | | | Fair value | | % of total | | % Investment
Grade | | |
Government and agency | | $ | 28,537 | | 27 | | 96 | | | | $ | 25,383 | | 27 | | 96 | | |
Financial | | | 22,348 | | 21 | | 98 | | | | | 21,048 | | 22 | | 99 | | |
Telecommunications | | | 2,699 | | 3 | | 90 | | | | | 2,421 | | 3 | | 90 | | |
Utilities | | | 15,951 | | 15 | | 95 | | | | | 12,475 | | 13 | | 94 | | |
Energy | | | 7,468 | | 7 | | 99 | | | | | 5,761 | | 6 | | 98 | | |
Industrial | | | 6,119 | | 6 | | 92 | | | | | 5,364 | | 6 | | 94 | | |
Securitized (ABS/MBS) | | | 8,885 | | 8 | | 98 | | | | | 9,218 | | 10 | | 99 | | |
Consumer (non-cyclical) | | | 5,197 | | 5 | | 91 | | | | | 4,869 | | 5 | | 94 | | |
Consumer (cyclical) | | | 3,661 | | 3 | | 86 | | | | | 2,789 | | 3 | | 88 | | |
Basic materials | | | 3,759 | | 3 | | 82 | | | | | 3,237 | | 4 | | 80 | | |
Technology | | | 809 | | 1 | | 100 | | | | | 263 | | – | | 100 | | |
Media and internet | | | 1,585 | | 1 | | 95 | | | | | 1,308 | | 1 | | 97 | | |
Diversified and miscellaneous | | | 400 | | – | | 94 | | | | | 268 | | – | | 98 | | |
Total bonds and private placements(1) | | $ | 107,418 | | 100 | | 95 | | | | $ | 94,404 | | 100 | | 96 | | |
(1) | Includes fair value of bonds of $83,148 million (2007 – $72,831 million) and private placements of $24,270 million (2007 – $21,573 million) with carrying value of $83,148 million (2007 – $72,831 million) and $25,705 million (2007 – $21,591 million) respectively. |
Mortgages and Real Estate
As at December 31, 2008 mortgages represented 17 per cent (2007 – 16 per cent) of invested assets with 51 per cent of the mortgage portfolio in Canada and 49 per cent in the United States. Commercial mortgages accounted for 71 per cent of total mortgages with the rest being agricultural and Canadian residential mortgages. Predominantly composed of first mortgages, the portfolio is diversified by geographic region, property type and mortgagor. Government-insured loans represented 25 per cent of the total mortgage portfolio, offering an excellent risk-adjusted return. The commercial mortgages book (Canada – 39 per cent, U.S. – 61 per cent) is extremely high quality with low loan to value ratios (Canada – 61.7 per cent, U.S. – 62.1 per cent) and high debt service ratios (Canada – 1.61 times, U.S. – 1.62 times).
As at December 31, 2008 four per cent (2007 – four per cent) of the Company’s invested assets were held in real estate, with a fair value of $9.2 billion (2007 – $7.6 billion). The portfolio is diversified by geographic region, with 63 per cent located in the United States, 29 per cent in Canada and eight per cent in Asia. The portfolio is also diversified by property type, with 87 per cent in commercial properties and 13 per cent in timber and agriculture. The commercial portfolio is focused on high quality office buildings located in superior downtown and large suburban markets across North America and Japan. The properties have very strong occupancy rates. Office properties represented 80 per cent of the commercial portfolio, with the remainder shared between industrial, retail, residential and other property types.
Stocks
As at December 31, 2008 stocks represented four per cent (2007 – seven per cent) of invested assets. The portfolio consists almost entirely of publicly traded common stocks and is diversified by industry sector and issuer. As at December 31, 2008 the stock portfolio was invested 31 per cent in U.S. issuers, 37 per cent in Canadian issuers, 26 per cent in Asian issuers and six per cent in other issuers.
Other Investments
Other investments include private equity and fixed income investments held primarily in power and infrastructure, oil and gas, and timber and agricultural sectors.
Third Party Assets
MFC Global manages a significant book of third party assets on behalf of clients of the Company’s operating divisions and institutional clients. Assets managed for third parties increased by $4.6 billion to $95.6 billion, driven by net sales of $13.6 billion and the positive impact of currency translation of $16.8 billion more than offsetting the $25.8 billion impact of declines in global equity and credit markets.
Third Party Assets
| | | | | | | | | | | | | | | |
As at December 31, (Canadian $ in millions) | | | | | | | | Change | | |
| | 2008 | | 2007 | | | | $ | | % | | |
Managed on behalf of: | | | | | | | | | | | | | | | |
Operating Division clients | | $ | 69,088 | | $ | 64,728 | | | | $ | 4,360 | | 7 | | |
Institutional clients | | | 26,484 | | | 26,247 | | | | | 237 | | 1 | | |
Total third party assets | | $ | 95,572 | | $ | 90,975 | | | | $ | 4,597 | | 5 | | |
Moving Forward
The Investment Division’s two primary goals are to consistently achieve superior investment returns and to grow its investment management services for the Company’s external clients. The Company’s disciplined investment philosophy, diversified holdings, global access and capabilities, portfolio of alternative assets and strong credit quality are expected to continue to provide enhanced risk adjusted returns.
To grow the investment business, we will continue to leverage our strong distribution network, expertise and scale to provide superior asset management for our clients. Despite the current market turmoil, we are optimistic that management’s continued focus on providing strong investment returns over the long-term and value-added investment strategies will continue to generate strong business growth.
Risk Management
Overview
Manulife Financial’s goal in managing risk is to strategically optimize risk taking and risk management to support long term revenue and earnings growth, and shareholder value growth. We achieve this by capitalizing on business opportunities that are aligned with the Company’s risk taking philosophy, risk appetite and return expectations, by identifying, monitoring and measuring all key risks taken, and by proactively executing effective risk control and mitigation programs.
We target to assume risks at levels prudent in relation to the Company’s capital strength and earnings capacity, that are aligned with our operational capabilities, meet our corporate ethical standards, allow us to remain diversified across risk categories, businesses and geographies, and for which we are appropriately compensated over the long term. We must manage risks effectively to safeguard our reputation and capital, and to meet the expectations of our shareholders, customers and regulators.
We employ an enterprise-wide approach to all risk taking and risk management activities globally. The enterprise risk management framework sets out policies and standards of practice related to risk governance, risk identification and monitoring, risk measurement, and risk control and mitigation. With an overall goal of effectively executing risk management activities, we continuously invest to attract and retain qualified risk professionals, and to build and maintain the necessary processes, tools and systems.
Individual risk management strategies are also in place for each specific key risk within our broad risk categories: strategic, market and liquidity, credit, insurance and operational. To ensure consistency, these strategies incorporate policies and standards of practice that are aligned with those within the enterprise risk management framework, covering:
| n | | Assignment of risk management accountabilities across the organization; |
| n | | Delegation of authorities related to risk taking activities; |
| n | | Philosophy related to assuming risks; |
| n | | Establishment of specific risk limits; |
| n | | Identification, measurement, monitoring, and reporting of risks; and |
| n | | Activities related to risk control and mitigation. |
2008 presented extraordinary challenges for the risk management function at Manulife Financial. The ongoing deterioration of the economy overall and severe dislocation of the financial markets continues to weigh heavily on the financial services industry. In this environment, Manulife Financial is not immune. While our disciplined investment risk management approach resulted in our asset portfolio performing comparatively well, the severe equity market declines had a material impact on the operations of our Company, in large part arising from our variable annuity and segregated fund guarantee exposures. While these potential obligations are long-term in nature and payable over a 30 year period beginning in several years, we must account for the increase in liabilities currently. In the face of continuing market instability, measures were taken to strengthen our capital base to provide us with a capital position that we expect will provide the flexibility to absorb further market declines.
With our significant balance sheet and earnings sensitivity to equity market performance, as well as exposures related to declining interest rates and heightened credit challenges, managing risk and capital will have even heightened priority. Plans are being implemented to stem the growth in equity exposure. Our investment portfolio has been, and will continue to be, managed conservatively. Product designs and prices are being reviewed and modified to achieve a reduced risk profile appropriate for the current market environment.
Risk Governance
Sound business decisions require a strong risk culture, and well-informed executive management and Board of Directors. The Audit and Risk Management Committee (“ARMC”) of the Board of Directors oversees our global risk taking activities and risk management practices. The ARMC periodically reviews and approves our enterprise risk management policy, risk taking philosophy, overall risk appetite, and monitors compliance with all key risk policies and limits. The ARMC regularly reviews with management trends in material risk exposures and major risk taking activities, and the ongoing effectiveness of our risk management practices. Recognizing the increasing risk environment, the Board of Directors and ARMC has, and will continue to, increase their focus on risk oversight. The Conduct Review and Ethics Committee of the Board oversees activities and risks specifically related to conflicts of interest, confidentiality of information, customer complaints and related third party transactions, and the Management Resources and Compensation Committee of the Board oversees global human resources strategy, policies, key programs, and all related risks.
The Chief Executive Officer (“CEO”) is directly accountable to the Board of Directors for all risk taking activities and risk management practices, and is supported by the Chief Financial Officer (“CFO”) and Chief Risk Officer (“CRO”) as well as by the Executive Risk Committee (“ERC”). Together, they shape and promote our risk culture throughout our global operations. The ERC, along with other executive-level risk oversight committees, establish risk policy, guide risk taking activity, monitor material risk exposures, and sponsor strategic risk management priorities throughout the organization.
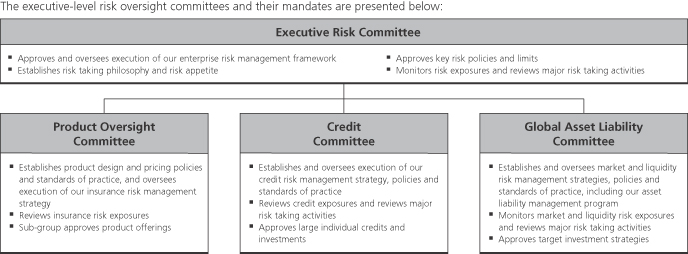
Business units across the organization are accountable for the risks they assume. Business unit general managers are responsible for ensuring their business strategies align with the Company’s risk taking philosophy and culture, for thoroughly evaluating and managing all risk exposures consistent with our enterprise risk policies and standards of practice, and for delivering returns commensurate with the level of risk assumed.
Corporate Risk Management (“CRM”), under the direction of the CRO, establishes and maintains our enterprise risk management framework as well as individual risk management strategies for each broad risk category, and oversees the execution of these strategies across the enterprise. CRM proactively partners with business units to ensure a consistent enterprise-wide assessment of risk, risk-based capital, and risk-adjusted returns.
Risk Identification and Monitoring
Manulife Financial evaluates all potential new business initiatives, acquisitions, product offerings, reinsurance arrangements, and investment and financing transactions on a directly comparable risk-adjusted basis. Our comprehensive processes identify, monitor, measure, and control the risks assumed using a common set of practices. Business units identify and assess risks arising from their activities on an ongoing basis, as an integral component of their business management processes. CRM oversees a formal process for monitoring and reporting on enterprise-wide risk exposures relating to specific risk
categories, discusses risk exposures with our various risk oversight committees, and submits requests for approval of any policy limit exceptions, as required.
On a quarterly basis, the ERC, ARMC and Board of Directors each review risk reports that present all key elements of our risk profile and exposures across all risk categories enterprise-wide, incorporating both quantitative risk measures and qualitative assessments. The reports also highlight key risk management activities and facilitate monitoring of compliance with all key risk policy limits. The reports present information gathered through a formal risk identification and assessment process involving business unit general managers and their executive teams, as well as corporate executives overseeing global risk management programs.
The Chief Actuary presents the results of the Dynamic Capital Adequacy Testing (“DCAT”) to the Board of Directors annually. Our Internal Auditor independently reports the results of internal audits of risk controls and risk management programs to the ARMC semi-annually. Management reviews the implementation of all global risk management programs, and their effectiveness, with the ARMC annually.
Risk Measurement
Risk exposures are evaluated using a variety of risk measures. Certain of these risk measures are used across a number of risk categories, while others apply only to a single risk type. Risk measures range from simple key risk indicators and scenario impact analyses, to deterministic stress testing of earnings and shareholders’ economic value, as well as sophisticated stochastic scenario modeling of economic capital and earnings at risk. Economic capital and earnings at risk, in particular, provide measures of enterprise-wide risk that can be aggregated, and compared, across all business activities and risk types. Qualitative assessments are performed for those risk types that cannot be reliably quantified.
We measure consolidated internal risk-based capital using a combination of economic capital and Canadian-based Minimum Continuing Capital and Surplus Requirements (“MCCSR”). Economic capital measures the amount of capital needed to meet all obligations with a very high and pre-defined confidence level. We evaluate our consolidated earnings volatility using an earnings at risk metric, which measures the potential variance from expected earnings over a pre-defined period, with a pre-defined confidence level. Both economic capital and earnings at risk are measured enterprise-wide and can be allocated by risk, product line, asset category, and market. We continue to expand the application of economic capital, in the evaluation of risk-adjusted returns for product pricing and investment decision support, throughout our organization.
We stress test our regulatory capital adequacy over a five year projected timeframe, incorporating both existing and projected new business activities, under a number of significantly adverse but “plausible” scenarios through our DCAT.
Risk Control and Mitigation
Risk control activities are in place throughout the Company to mitigate risks to within the approved risk limits for each specific risk. Controls, which include policies, procedures, systems and processes, are appropriate and commensurate with the key risks faced at all levels across the Company and are a normal part of day to day activity, business management and decision making.
CRM establishes and oversees formal review and approval processes, involving independent individuals, groups or risk oversight committees, for product offerings, reinsurance, investment activities and other material business activities, based on the nature, size and complexity of the risk taking activity involved. Authority for assuming risk at the transaction level is delegated based on the skill, knowledge and experience of the specific individuals.
Risk mitigation activities, such as product and investment portfolio management, hedging, reinsurance and insurance protection are used to ensure our aggregate risk remains within our risk appetite and limits. Internal controls within the business units and corporate functions are in place to limit our exposure to operational risks.
The Company manages risk taking activities against an overall group appetite for assuming risk that reflects the financial condition and the business strategies and risk tolerances approved by the Board of Directors. The risk appetite is set in relation to a variety of risk measures including economic capital and earnings at risk, as well as regulatory capital requirements. To ensure exposures to particular risks are appropriate and that the Company remains well-diversified across risk categories, we manage specific risk exposures against enterprise-wide limits established for each of these specific risks. These limits are set in relation to risk measures ranging from economic capital and earnings at risk to risk measures applied only to the particular risk.
The following charts show the composition of the Company’s internal risk-based capital by broad risk category and product line. Over 2008, the most significant change in the composition of our internal risk-based capital by category was an increase in capital associated with off-balance sheet guarantees in our variable annuity products, where the risk exposure is primarily related to the performance of equity markets.
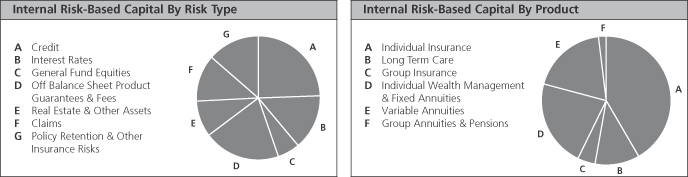
The following sections describe the key risks we face in each broad risk category and highlight the strategies in place to manage these risks.
Strategic Risk
Strategic risk is the risk of loss resulting from the inability to adequately plan or implement an appropriate business strategy, or to adapt to change in the external business, political or regulatory environment.
Key Risk Factors Manulife Financial operates in highly competitive markets and competes for customers with both insurance and non-insurance financial services companies. Customer loyalty and retention, and access to distributors, are important to the Company’s success and are influenced by many factors, including our product features, service levels, prices relative to our competitors, and our financial strength ratings and reputation. External business, economic, political, tax, legal and regulatory environments can significantly impact the products and services we can offer, and their price and attractiveness.
Risk Management Strategy The CEO and Executive Committee establish and oversee execution of business strategies, and have accountability to identify and manage the risks embedded in these strategies. They are supported by a number of important processes:
| n | | Strategic planning that is integrated with risk assessments and reviewed where appropriate with the Board of Directors; |
| n | | Detailed business planning executed by divisional management and reviewed by the CEO; |
| n | | Quarterly operational performance reviews of all businesses, along with business risks, with the CEO and annual reviews with the Board of Directors; |
| n | | Risk-based capital attribution and allocation that ensures a consistent decision making framework across the organization; |
| n | | Review and approval of acquisitions and divestitures by the CEO and where appropriate with the Board of Directors. |
Market and Liquidity Risk
Market risk is the risk of loss resulting from adverse investment returns caused by market price volatility, interest rate and credit spread changes, and from adverse foreign currency rate movements. Liquidity risk is the risk of loss from not having access to sufficient funds to meet both expected and unexpected cash demands.
Risk Management Strategy Overview Manulife Financial’s Global Asset Liability Committee, with the support of a network of business unit asset liability committees, establishes and oversees the execution of the Company’s market risk management strategy including our asset liability management program. The programs cover the management of a variety of risks that arise in generating investment returns to support product liabilities, as well as returns on assets in the shareholders’ equity account. These risks include performance of non-fixed income investments, such as equities, commercial real estate, timberlands and oil and gas properties, interest rate changes, and foreign exchange rate changes, as well as liquidity risk. These programs are designed to keep potential losses from these risks within acceptable limits. Global investment policies establish enterprise-wide and portfolio level targets and limits, as well as delegated transaction approval authorities. The targets and limits are designed to achieve wide diversification across asset classes and individual investment risks within our investment portfolios, and to ensure they are suitable for the liabilities they support.
General account product liabilities are segmented into groups with similar characteristics that are each supported by a unique portfolio of investments. Investment policies and goals are established for each asset segment, setting out target investment strategies and portfolio management philosophies that best match the premium and benefit pattern, guarantees, policyholder options, and crediting rate strategies for the products they support. These encompass asset mix, quality rating, term profile, liquidity, currency and industry concentration targets, as well as portfolio management styles. Similarly, we establish a target investment strategy and portfolio management philosophy for our shareholders’ equity account. Our target investment strategies are established using sophisticated portfolio analysis techniques to optimize returns, subject to considerations related to regulatory and economic capital requirements, and tolerances with respect to risk.
Market Price and Interest Rate Risk
Key Risk Factors Market price volatility and interest rate changes, including credit spreads, along with our product guarantees and policyholder withdrawal options, may lead to asset returns insufficient to support product liabilities, and may impact the value of assets held in our shareholders’ equity account. The level of our sales activity and asset retention may also be affected by the performance of markets, interest rates, inflation and general economic conditions as these will influence the performance of our general account investments, segregated funds and mutual funds.
Interest rate risk arises within our general fund primarily due to the uncertainty of future returns on investments made as recurring premiums are received, and to a lesser extent, due to tactical mismatch positions taken between the term profile of our assets and liabilities. Market price and interest rate risk also arises due to minimum rate guarantees and withdrawal options on products where investment returns are generally passed through to policyholders. If the term profile of our assets is shorter than our liabilities, interest rate declines may reduce the future return on invested assets supporting the liabilities. On the other hand, for products that pass through investment returns to policyholders, if rates increase significantly we may need to increase credited rates and reduce margins in order to remain competitive. Declines in market values of equity, commercial real estate, timberlands and oil and gas properties will also impact the return on assets supporting liabilities and in our shareholders’ equity account.
Market price and interest rate risk arising from our off-balance sheet products is due mainly to the death and living benefit guarantees provided on variable annuity and insurance products as well as the uncertainty of future levels of asset-based fees. Guarantees include death, maturity, income and withdrawal guarantees on variable products. A sustained decline in stock markets could increase the cost of guarantees associated with our variable products and reduce asset-based fee revenues. A sustained increase in equity market volatility or decline in interest rates could increase the costs of hedging the benefit guarantees provided.
Risk Management Strategy We manage assets supporting products that generally pass through investment returns to policyholders, to achieve a target return designed to maximize dividends or credited rates, subject to established risk tolerances. We design guaranteed benefit insurance and wealth management products and set premiums and credited rates to limit the risk of not achieving targeted profit margins. To support wealth management products with fixed credited rates, we invest in fixed income assets that have a term profile generally matching the term profile of the liabilities, to the extent assets are available in the market at those terms. Several insurance and wealth management products have guaranteed benefits extending well beyond the term for which fixed income assets are generally available in the market. We manage assets supporting these long-dated benefits to achieve a target return sufficient to support these guaranteed obligations over their lifetime, subject to established risk tolerances, by investing a portion in a diversified basket of non fixed income assets, with the balance invested in fixed income portfolios. In response to the changed market conditions, guaranteed benefit products, and their premiums, are being reviewed and modified to ensure risk tolerances are maintained and targeted profit margins will continue to be achieved.
We evaluate market price and interest rate risk exposures using a variety of techniques and measures that are primarily based on projecting asset and liability cash flows under a variety of future interest rate and market return scenarios. These measures include durations, key-rate durations, convexity, delta, rho, gamma, vega, cash flow gaps, shareholders’ economic value sensitivity to specific stress scenarios, earnings at risk and economic capital.
Interest rate and credit spread risk arising in our general account, is managed against enterprise-wide economic capital and earnings at risk-based limits and economic value sensitivity limits for specific segments. We delegate trading authorities to individuals as well as accountabilities for managing and monitoring interest rate risk. Asset duration, key-rate duration and cash flow targets are reviewed,
modified and communicated to portfolio managers with a frequency ranging from daily to annually, depending on the type of liabilities and the frequency and size of potential changes in the liability profiles. We monitor actual asset positions against targets and rebalance positions to within established interest rate risk exposure limits with a frequency ranging from daily to quarterly, depending on the potential exposure to changes in the profile of assets and liabilities.
We mitigate market price risk arising from our general account non fixed income investments by investing in a diversified basket of assets consisting of public and private equities, commercial real estate, timberland, agricultural land and oil and gas properties. We manage total non fixed income asset investments against an established aggregate limit and against aggregate limits for each asset category. To diversify risk, we manage our public and private equity investments against established targets and limits by industry type and corporate connection, commercial real estate investments to established limits by property type and geography, and timber and agricultural land investments to limits by geography and crop. We proactively manage allocations to non-fixed income assets, reflecting management’s risk preferences.
We mitigate both market price and interest rate risk arising from off-balance sheet products through benefit guarantee design, limitations on fund offerings, use of reinsurance and capital markets hedging. We have reinsured the investment return benefit guarantee risk on a portion of our in-force business and employ capital market hedging for a portion of our in-force and the majority of the new business we write. We design new product benefit guarantees and fund offerings to meet established extreme event risk exposure limits, based on economic capital and regulatory capital, and to achieve desired profit targets. Product guarantee features, fund offerings and fees are being reviewed and modified to ensure guarantees can be hedged effectively in the changed market conditions.
The Company’s aggregate exposure to equities is managed against enterprise-wide economic capital and earnings at risk-based limits. These limits cover the combined risk arising from off-balance sheet product death and living benefit guarantees, asset-based fees and general account investments.
Variable annuity guarantees generate the largest component of our exposure risk related to equity markets. We are implementing a comprehensive plan that will allow us to economically achieve a reduced level of exposure to equity market volatility. We have already begun to review our variable annuity guarantee offerings and modify product designs to better balance the features that have attracted customers to these products with the risk that they present to Manulife Financial. We will continue to provide variable annuity and segregated fund offerings, with potential obligations payable over a long time period, generally deferred several years. However, recognizing increasing volatility in equity markets, we will offer product designs and investment fund alternatives with reduced exposure to equity markets. We have also expanded our variable annuity hedging to encompass all new business written in the U.S and the majority of Canadian new business and will look for opportunities to economically hedge existing business. We intend to continue to monitor market conditions and manage product features, fee levels, and our hedging program throughout 2009 to ensure an appropriate balance between risk and long-term profitability for the variable annuity product line. We also intend to prudently limit growth in our guaranteed variable annuity businesses.
Market price and interest rate risk exposures are disclosed in note 8 to the consolidated financial statements.
Foreign Currency Risk
Key Risk Factors A substantial portion of the Company’s global business is denominated in currencies other than Canadian dollars, mainly U.S. dollars, Hong Kong dollars and Japanese yen. We also invest a substantial portion of our shareholders’ equity in non-Canadian denominated assets. If the Canadian dollar strengthened relative to non-Canadian currencies, the translated value of reported earnings from these non-Canadian denominated businesses would decrease and the translated value of our reported shareholders’ equity would decline.
Risk Management Strategy Manulife Financial has a policy of matching the currency of our assets with the currency of the liabilities they support, to mitigate economic exposure to currency exchange rate changes. To limit the impact of changes in foreign exchange rates on regulatory capital ratios, we have a policy of generally matching the currency of the assets in our shareholders’ equity account to the liabilities they support, up to target capital levels. This policy is designed to ensure that changes to our reported shareholders’ equity are proportionate to changes in our reported capital requirements, stabilizing capital ratios from the impact of foreign exchange rates. However, the policy results in variability in reported shareholders’ equity. Currency risk exposure is managed to an established value at risk limit measured relative to the policy position.
The following table shows the impact on shareholders’ equity and net income of a one per cent change in the Canadian dollar relative to our key operating currencies.
Impact of Changes in Foreign Exchange Rates(1),(2)
| | | | | | | | | | | | | | | | | | | |
| | | Shareholders’ Equity | | | | | Net Income | | | |
As at December 31 (Canadian $ in millions) | | 2008 | | | 2007 | | | | | 2008 | | 2007 | | | |
1% strengthening relative to U.S. dollar | | $ | (189 | ) | | $ | (159 | ) | | | | $ | 12 | | $ | (31 | ) | | |
1% strengthening relative to Japanese yen | | $ | (15 | ) | | $ | (14 | ) | | | | $ | 3 | | $ | (6 | ) | | |
(1) | A weakening in rates would have the exact opposite impact to that displayed above. |
(2) | A strengthening or weakening of the average Canadian dollar relative to our key operating currencies can have a significant impact to our net income. For example, in the fourth quarter of 2008, the average Canadian dollar exchange rate weakened considerably against the U.S. dollar, resulting in an increase in the translated value of our U.S. dollar net loss. Similarly, a strengthening of the Canadian dollar would decrease our U.S. dollar net loss, and thus positively impact our net income. |
Liquidity Risk
Key Risk Factors Manulife Financial is exposed to liquidity risk in each operating company and in the holding company. In the operating companies, expected cash demands arise day-to-day to fund anticipated policyholder benefits, deposit withdrawals, expenses and investment activities. Under stressed conditions, unexpected cash demands could arise primarily from an increase in the level of policyholders either terminating policies with material cash surrender values, or not renewing them when they mature, deposit withdrawals and from an increase in the level of borrowers renewing or extending their loans when they mature.
The ability of MFC, the holding company, to fund its cash requirements depends upon it receiving dividends, distributions and other payments from its operating subsidiaries. These subsidiaries are generally required to maintain solvency and capital standards imposed by their local regulators and, as a result, have restrictions on payments which they may make to MFC.
Risk Management Strategy Global liquidity management policies and procedures are designed to provide adequate liquidity to cover financial obligations as they come due, and to sustain and grow operations in both normal and stressed conditions. They take into account any legal, regulatory, tax, operational or economic impediments to inter-entity funding.
Liquidity risk is reduced by having policy liabilities that are well-diversified by product, market, geographical region and policyholder. We design insurance products to encourage policyholders to maintain their policies in-force, thereby generating a diversified and stable flow of recurring premium income. We design the policyholder termination features of our wealth management products and related investment strategies to mitigate the financial exposure and liquidity risk related to unexpected policyholder terminations. We establish and implement investment strategies that match the term profile of the assets to the liabilities they support, taking into account the potential for unexpected policyholder terminations and resulting liquidity needs. Liquid assets represent a large portion of our total assets. We manage our deposit funded businesses through a reliance on stable and diverse sources of funding with active management of the risk profile associated with the deposit mix. We forecast and monitor actual daily operating liquidity and cash movements in local operations as well as centrally, aiming to ensure liquidity is available and cash is employed optimally.
We also maintain centralized cash pools and access to other sources of liquidity such as repurchase funding agreements. Our centralized cash pool consists of cash or near-cash, high quality short term investments that are continually monitored for their credit quality and market liquidity. During the last two quarters of 2008, wholesale funding markets, primarily in the U.S., became disrupted. Consequently, seeking to reduce risk, Manulife has increased liquidity to historically high levels.
Cash and Government Securities
| | | | | | | | |
As at December 31 (Canadian $ in millions) | | 2008 | | 2007 | | |
Cash and cash equivalents | | $ | 17,269 | | $ | 12,354 | | |
Government bonds | | | 24,280 | | | 21,793 | | |
Total | | $ | 41,549 | | $ | 34,147 | | |
Cash and government securities as a % of total assets | | | 19.7% | | | 19.4% | | |
Through the normal course of business, pledging of assets is required to comply with jurisdictional regulatory and other requirements including collateral pledged to mitigate derivative counterparty credit risk and assets held as collateral for repurchase funding agreements. Total unencumbered assets as at December 31, 2008 were $206.5 billion.
Global operating and strategic liquidity levels are managed against established minimums. We set minimum operating liquidity as the level of one month’s operating cash outflows. Our operating liquidity remains well above minimum requirements. We measure strategic liquidity under both immediate (within one month) and ongoing (within one year) stress scenarios. Our policy is to maintain the ratio of adjusted liquid assets to adjusted policy liabilities at or above a pre-established target. Adjusted liquid assets include cash and short-term investments, and marketable bonds and stocks that are discounted to reflect convertibility to cash, net of maturing debt obligations. Policy liabilities are adjusted to reflect their potential for withdrawal. Our strategic liquidity remains above policy targets.
Strategic Liquidity
| | | | | | | | | | | | | | | | |
| | | 2008 | | | | 2007 | | |
As at December 31 (Canadian $ in millions) | | Immediate
scenario | | Ongoing
scenario | | | | Immediate
scenario | | Ongoing
scenario | | |
Adjusted liquid assets | | $ | 92,361 | | $ | 93,504 | | | | $ | 81,487 | | $ | 81,571 | | |
Adjusted policy liabilities | | $ | 23,047 | | $ | 30,090 | | | | $ | 20,597 | | $ | 26,750 | | |
Liquidity ratio | | | 401% | | | 311% | | | | | 396% | | | 305% | | |
A separate liquidity risk management policy and process is run for Manulife Bank which at the end of 2008 had liquidity in excess of policy requirements.
Credit Risk
Credit risk is the risk of loss due to the inability or unwillingness of a borrower or counterparty to fulfill its payment obligations.
Key Risk Factors A pronounced and sustained economic downturn could result in borrower or counterparty defaults or downgrades, and could lead to increased provisions or impairments related to our general fund invested assets and off-balance derivative financial instruments, and an increase in provisions for future credit impairments to be included in our actuarial liabilities. Counterparty risk arises primarily from derivatives and reinsurance activities. Any of our reinsurance providers being unable or unwilling to fulfill their contractual obligations related to the liabilities we cede to them could lead to an increase in actuarial reserves.
Risk Management Strategy The Credit Committee establishes and oversees execution of our credit risk management strategy. The committee sets out objectives related to the overall quality and diversification of our general account investment portfolio and establishes criteria for the selection of counterparties, including derivative counterparties as well as reinsurers and insurance providers. Our policies establish exposure limits by borrower, corporate connection, quality rating, industry, and geographic region, and govern the usage of credit derivatives. Corporate connection limits vary according to risk rating. We invest our general account assets primarily in investment grade bonds and commercial mortgages. We do not actively participate in the credit derivative market, and currently have a minimal exposure to credit default swaps.
All of our credit-granting units follow a defined evaluation process that provides an objective assessment of credit proposals. We assign each investment a risk rating based on a detailed examination of the borrower that includes a review of: business strategy, market competitiveness, industry trends, financial strength, access to funds, and other risks facing the organization. We assess and update risk ratings regularly, based on a standardized 22-point scale consistent with those of external rating agencies. For additional input to the process, we also assess credit risks using a variety of industry standard, market based tools and metrics. We map our risk ratings to pre-established probabilities of default and loss given defaults, based on historical industry and company experience, and resulting default costs, which form key inputs to our product pricing, actuarial liabilities and economic capital.
We establish delegated credit approval authorities and make credit decisions on a case-by-case basis at a management level appropriate to the size and risk level of the transaction, based on the delegated authorities that vary according to risk rating. We refer all major credit decisions to the Credit Committee and the largest credit decisions to the CEO for approval and, in certain cases, to the Board of Directors.
We have in place distinct derivative counterparty exposure limits, based on a minimum acceptable counterparty credit rating of A- from internationally recognized rating agencies. We measure derivative counterparty exposure as net potential credit exposure, which takes into consideration mark-to-market values of all transactions with each counterparty, net of any collateral held, and an allowance to reflect future potential exposure. We measure reinsurance counterparty exposure as both current exposure and potential future exposures reflecting the level of ceded actuarial liabilities. We require all reinsurance and insurance counterparties to meet minimum risk rating criteria.
Regular reviews of the credits within the various portfolios are undertaken to ensure that changes to credit quality are identified, and where appropriate, that corrective action is taken. Prompt identification of problem credits is a key objective. CRM provides independent credit risk oversight by reviewing assigned risk ratings, and monitoring problem and potential problem credits.
Our credit policies and procedures and investment strategies have remained fundamentally unchanged. Given the challenging credit environment experienced in 2008 and in response to the emerging environment, credit exposure in our investment portfolio is being actively managed to reduce risk and mitigate losses. Derivative counterparty exposure is being managed proactively and securities lending activities have been reduced.
An allowance for losses on loans is established when a loan becomes impaired as a result of deterioration in credit quality, to the extent there is no longer assurance of timely realization of the carrying value of the loan and related investment income. We reduce the carrying value of an impaired loan to its estimated net realizable value at the time of recognition of impairment. We establish an allowance for losses on reinsurance contracts when a reinsurance counterparty becomes unable or unwilling to fulfill their contractual obligations. We base the allowance for loss on current recoverables and ceded actuarial liabilities. There is no assurance that the allowance for losses will be adequate to cover future potential losses or that additional provisions or asset write-downs will not be required.
Actuarial liabilities also include general provisions for credit losses from future asset impairments. We set these conservatively, taking into account normal historical levels and future expectations, with an allowance for adverse deviations. Fluctuations in credit default rates and deterioration in credit ratings of borrowers may result in losses if actual rates exceed expected rates. As at December 31, 2008 and December 31, 2007, for every 25 per cent that credit loss rates over the next year exceeded the rates provided for in actuarial reserves, net income would be reduced by $34 million and $21 million, respectively.
Credit risk exposures are disclosed in note 8 to the consolidated financial statements.
Insurance Risk
Insurance risk is the risk of loss due to actual experience emerging differently than assumed when a product was designed and priced with respect to mortality and morbidity claims, policyholder behaviour and expenses.
Key Risk Factors A variety of assumptions are made related to the future level of claims, policyholder behaviour, expenses and sales levels when we design and price products, and when we establish actuarial liabilities. The development of assumptions for future claims are based on Company and industry experience; assumptions for future policyholder behavior are based on Company experience and predictive models. Such assumptions require significant professional judgment and therefore, actual experience may be materially different than the assumptions we make. Claims may be impacted by the unusual onset of disease or illness, natural disasters, large-scale manmade disasters and acts of terrorism. Policyholder premium payment patterns, policy renewal, withdrawal and surrender activity is influenced, by many factors including market and general economic conditions, and the availability and price of other products in the marketplace.
Risk Management Strategy The Product Oversight Committee oversees insurance risk management, together with all other elements of our product design and pricing practices, to ensure our product offerings align with our risk taking philosophy and risk limits, while promoting business opportunities. Within the broad framework set out by our Product Design and Pricing Policy, this committee establishes global product design and pricing standards and guidelines. These cover:
| | | | |
n product design features n use of reinsurance n pricing models and software n internal risk-based capital allocations | | n target profit objectives n pricing methods and assumption setting n stochastic and stress scenario testing n required documentation | | n review and approval processes n experience monitoring programs |
We designate individual pricing officers in each business unit who are accountable for all pricing activities. The general manager and chief financial officer of each business unit, and CRM, approve the design and pricing of each product, including key claims, policyholder behaviour, investment return and expense assumptions, as well as reinsurance treaties with third parties, ensuring corporate standards are met. Corporate Actuarial approves all actuarial valuation methods and assumptions and approves reinsurance treaties related to business in force, as well as all related party reinsurance treaties. We perform annual risk and compliance self-assessments of the product development and pricing activities of all businesses.
We utilize a global underwriting manual to ensure insurance underwriting practices for direct written life business are consistent across the organization while reflecting local conditions. Each business unit establishes underwriting policies and procedures, including criteria for approval of risks and claims adjudication policies and procedures.
We apply retention limits per insured life to reduce our exposure to individual large claims which are monitored in each business unit. These retention limits vary by market and jurisdiction. We reinsure exposure in excess of these limits with other companies. Our current global retention limit is US$20 million for a single life (US$25 million for survivorship life policies) and is shared across business units. We apply lower limits in some markets and jurisdictions. We further reduce exposure to claims concentrations by applying geographical aggregate retention limits for certain covers.
As noted above, fluctuations in claims experience may result in losses. As at December 31, 2008 and December 31, 2007 for every five per cent that actual mortality and morbidity rates over the next year exceeded the rates provided for in actuarial reserves, net income would be reduced by $147 million and $127 million, respectively. Enterprise-wide, this claims exposure is lessened as a result of operating internationally and insuring a wide range of unrelated risk events, reducing the likelihood of high aggregate claims rates.
Operational Risk
Operational risk is the risk of loss resulting from inadequate or failed internal processes, systems failures, human performance failures or from external events.
Key Risk Factors Operational risk is naturally present in all of the Company’s business activities and encompasses a broad range of risks, including reputation risk, regulatory compliance failures, legal disputes, technology failures, business interruption, information security and privacy, human resource management and employment practices, environmental concerns, processing errors, business integration, theft and fraud, and damage to physical assets. Exposures can take the form of financial losses, regulatory sanctions, loss of competitive positioning, or damage to reputation. Operational risk is also embedded in all the practices we use to manage other risks therefore, if not managed effectively, can impact our ability to manage other key risks such as credit risk, market and liquidity risk and insurance risk.
Risk Management Strategy Manulife Financial’s corporate governance practices, corporate values, and integrated, enterprise-wide approach to managing risk set the foundation for mitigating operational risks. We strengthen this base by ensuring appropriate internal controls and systems, together with trained and competent people, are in place throughout the organization. We establish and execute enterprise-wide risk management strategies for specific operational risks that could materially impact our ability to do business or impact our reputation. Within established corporate standards, business unit general managers are accountable for the day-to-day management of the operational risks inherent in their operations. Business units and functional areas perform risk control self-assessments to identify, document and assess inherent operational risks and effectiveness of internal controls. They monitor key risk indicators that provide early warnings of emerging control issues and proactively modify procedures.
Through our corporate insurance program, the Company transfers a portion of our operational risk exposure by purchasing global and local insurance coverage that provide protection against unexpected material losses resulting from events such as criminal activity, property loss or damage and liability exposures, or that satisfy legal requirements and contractual obligations. We determine the nature and amount of insurance coverage centrally, reflecting enterprise-wide exposures and risk tolerances.
The following is a further description of key operational risk factors with associated management strategies:
Reputation Risk Reputation risk is the risk that our corporate image may be eroded by adverse publicity, as a result of our business practices or those of our employees, representatives and business partners, potentially causing damage to our franchise value. Representatives include affiliated broker-dealers, agents, wholesalers and independent distributors, such as broker-dealers and banks, whose services and representations our customers rely on. Business partners, among others, include third parties to whom we have outsourced some of our administrative functions and that we rely on to fulfill various obligations. Manulife Financial’s reputation is one of its most valuable assets and must be safeguarded. A loss of reputation is often a consequence of some other risk control failure whether associated with complex financial transactions or relatively routine operational activities. As such, reputation risk cannot be managed in isolation from other risks. Our enterprise-wide Reputation Risk Policy specifies the oversight responsibilities of the Board and the responsibilities of executive management, in managing reputation risk. We apply a set of guiding principles in conducting all our business activities, to protect and enhance our reputation, and place a priority on communication to and education of all employees and representatives. We require reputation risk assessments to be considered as part of business strategy development and execution. While the CEO and executive management are ultimately responsible for our reputation, every one of our employees and representatives has the responsibility to conduct their business activities in a manner that upholds our reputation. This responsibility is communicated to every director, officer and employee through our Code of Business Conduct and Ethics.
Legal and Regulatory Risk The Company is subject to extensive regulatory oversight by insurance and/or financial services regulators in the jurisdictions in which it conducts business. While many of these laws, regulations and regulatory policies are intended to protect policyholders, beneficiaries and depositors and investors in our products and services, others also set standards and requirements for the governance of our operations. Failure to comply with applicable statutes or regulations could result in financial penalties or sanctions, and damage to reputation. We are also regularly involved in litigation, both as plaintiff and defendant, which could result in an unfavourable resolution. Global Compliance oversees our regulatory compliance program, supported by designated chief compliance officers in every division. The program is designed to promote compliance with regulatory obligations worldwide and to help ensure awareness of the laws and regulations that affect us, and the risks associated with failing to comply. Divisional compliance groups monitor emerging legal and regulatory issues as well as proposed regulatory changes and take an active role in attempting to influence these where appropriate. They also prepare us to address new requirements. Global Compliance also independently assesses and monitors the effectiveness of a broad range of regulatory compliance processes and business practices against potential legal, regulatory, fraud and reputation risks, and helps to ensure significant issues are escalated and proactively mitigated. Among these processes and practices are: product design, sales and marketing practices, sales compensation practices, asset management practices, fiduciary responsibilities, employment practices, underwriting and claims processing and regulatory filings. In addition, we have an anti-fraud policy to protect the Company, its customers and other related third parties from acts of fraud. Divisions ensure that existing processes and controls give adequate consideration to the risk of fraud and Audit Services and Global Compliance periodically assess the effectiveness of the control environment.
Technology, Information Security and Business Interruption Risks Technology is used in virtually all aspects of our business and operations including the creation and support of new products and services. Operational integrity, data integrity and security of information and our systems infrastructure are all relied upon for normal business operations. Disruption to operations due to system failure or information security breaches can have negative consequences for our businesses. Technology related risks are managed through a rigorous systems development protocol and global information security programs. Global Information Systems oversees risks associated with information security, information systems privacy and compliance, business continuity and disaster recovery planning. We have in place a global business continuity policy along with standards of practice to ensure key business functions can continue and normal operations can resume effectively and efficiently, in the event of a major disruption. Each business unit maintains its own business continuity plans and processes and the global program incorporates periodic scenario analysis to validate the assessment of both critical and non-critical units, as well as the establishment and testing of appropriate business continuity plans for all critical units. We establish and regularly test crisis management and communications protocols. We have off-site backup facilities available to minimize recovery time. We subject our outsourcing arrangements, whereby a service provider performs a service activity on behalf of the Company, to review procedures, prior to their approval. We have comprehensive policies and procedures in place to monitor the ongoing results and contractual compliance of such arrangements.
Human Resource Risks Attracting and retaining qualified resources is critical to the execution of our business strategies. We face tremendous competition for qualified executives, employees and agents from companies both within the financial services industry and in other industries. We have established and implemented a number of human resource policies, practices and programs in order to manage these risks and Corporate Human Resources manages our global human resource programs. Our executive management is committed to employee training and development, and our compensation program is designed to attract, motivate and retain high-performing employees. We have in place a number of recruiting programs to attract the best and the brightest for every level of the organization.
Environmental Risk An environmental issue on a property owned by us or any property with which we are affiliated could result in financial or reputational loss. Manulife Financial’s environmental policy reflects the Company’s commitment to conducting all business activities in a manner that recognizes the need to preserve the quality of the environment, as well as the requirement to be compliant
with all applicable environmental laws and regulations. In natural resource management operations, we have specific policies and procedures in place to mitigate environmental risks and operate in an environmentally responsible manner. We also have programs in place across the real estate holdings to conserve energy and reduce waste. In providing credit to borrowers, or making equity investments in private firms, we take reasonable steps to assess that counterparties are environmentally responsible.
Derivatives Risk Derivatives are used to manage market risks. We mitigate the unique operational risks associated with the use of derivatives by having in place specific risk management policies and processes including limits on the notional volume of derivative transactions, authorized types of derivatives and applications, delegated authorization and trading limits for specific personnel, as well as the pre-approval of all derivative application strategies and regular monitoring of the effectiveness of derivative strategies.
Additional Risk Factors That May Affect Future Results
The Accounting Standards Board of the CICA makes changes to the financial accounting and reporting standards that govern the preparation of our financial statements. These changes may be difficult to anticipate and may materially impact how we record and present our financial condition and results of operations. As discussed under “Critical Accounting and Actuarial Policies”, the preparation of financial statements requires management to make estimates and assumptions that affect the reported amounts and disclosures made in the financial statements and accompanying notes. These estimates and assumptions may require revision and actual results may differ materially from these estimates. As well, as noted under “Cautionary Statement Concerning Forward-Looking Statements”, forward-looking statements involve risks and uncertainties and actual results may differ materially from those expressed or implied in such statements. Key risk factors and their management have been described above, summarized by major risk category.
Other factors that may affect future results include changes in government trade policy; monetary policy; fiscal policy; political conditions and developments in or affecting the countries in which we operate; technological changes; public infrastructure disruptions; changes in consumer spending and saving habits; the possible impact on local, national or global economies from public health emergencies, such as an influenza pandemic, and international conflicts and other developments including those relating to terrorist activities. Although we take steps to anticipate and minimize risks in general, unforeseen future events may have a negative impact on our business, financial condition and results of operations.
We caution that the preceding discussion of risks that may affect future results is not exhaustive. When relying on our forward-looking statements to make decisions with respect to our Company, investors and others should carefully consider the foregoing risks, as well as other uncertainties and potential events, and other external and Company specific risks that may adversely affect the future business, financial condition or results of operations of our Company.
Capital Management
Overview
Manulife Financial manages its capital on a total company basis as well as for each regulated entity. Management seeks to optimize the Company’s capital structure under a variety of constraints as defined by regulatory rules, rating agency expectations, competitive considerations and our own business needs. During 2008, net capital issuances combined with proactive management of capital requirements and efficient deployment of capital across the Company has allowed us to maintain a solid capital position, notwithstanding the substantial deterioration in the global economic environment worldwide. Overall, the capital position of the Company and its subsidiaries remains in excess of regulatory requirements, with the capital levels of the key operating subsidiaries exceeding or within internal targets.
Capital Management Framework
The Company’s objectives with respect to capital management are: to remain in compliance with all regulatory requirements; to ensure safety and stability of our financial position; to ensure we have the flexibility to take advantage of attractive business and investment opportunities as they arise; and to optimize the return on shareholders’ equity.
In its assessments of capital adequacy, the Company typically adopts regulatory capital definitions and measures applicable to any given entity and jurisdiction in which an entity operates. These are supplemented by an internal capital measurement framework that reflects our own risk view. We establish internal targets for capital adequacy that meet or exceed regulatory requirements. This ensures ongoing compliance with regulatory constraints and enables us to properly take into account risk profiles, rating agency expectations and peer comparisons, among other considerations. Management regularly monitors capital against those internal targets and initiates action when appropriate.
Capital is generally allocated to business lines for planning and performance management purposes based on the higher of the internal risk-based capital and the regulatory capital levels.
The currency mix of assets supporting capital is consistent with the currency mix of the Company’s underlying liabilities. The impact of the currency movements on the capital ratios is thus mitigated as both available and required capital rise (fall) when the Canadian dollar weakens (strengthens).
As part of our annual DCAT, we assess the strength of our capital position under severe shock scenarios. The scenarios are determined each year to ensure their ongoing relevance to our business and risk profile. The 2008 results, updated in December 2008, indicated that the Company’s capital levels provided for sufficient assets to discharge liabilities and to retain positive surplus in the catastrophic scenarios tested. These scenarios included tests of equity market, credit, interest rate and mortality risk, amongst others.
Capital quality is maintained by limiting the amount of debt capital or non-permanent equity capital in the capital structure. The composition of capital between equity and other instruments remains well within regulatory constraints. The Company monitors and rebalances its capital mix through opportunistic capital issuances, capital repurchases and redemptions.
The following measure of available capital serves as the foundation of our capital management activities at the MFC level. For regulatory reporting purposes, the numbers are further adjusted for various additions or deductions to capital as mandated by the guidelines issued by the Office of the Superintendent of Financial Institutions (“OSFI”).
Consolidated Capital
| | | | | | | | | |
As at December 31, (Canadian $ in millions) | | 2008 | | | 2007 | | 2006 | | |
Equity | | $27,664 | | | $22,406 | | $25,018 | | |
Preferred shares | | 982 | | | 982 | | 982 | | |
Innovative instruments | | 1,000 | | | 1,000 | | 1,000 | | |
Subordinated debentures | | 1,195 | | | 1,196 | | 1,195 | | |
AOCI on AFS securities(1) | | (529 | ) | | 1,327 | | – | | |
Other capital instruments | | 582 | | | 470 | | 1,156 | | |
Non-controlling interest in subsidiaries | | 217 | | | 146 | | 202 | | |
Total capital | | $31,111 | | | $27,527 | | $29,553 | | |
(1) | The Company adopted CICA Handbook section 3855 on January 1, 2007 and therefore 2006 does not include AOCI on AFS securities. |
The Company’s capital increased by $3,584 million compared to prior year. The increase was primarily due to the common equity issuance of $2,275 million, net income of $497 million and other comprehensive income of $4,409 million from currency translation of net foreign operations. The impact of these items on the level of capital was partially offset by the $1,856 million decline in AFS securities due to the market turmoil, $1,524 million of dividends paid to shareholders and $403 million of share repurchases.
Designated committees of the Board of Directors review and approve Manulife Financial’s capital management policies. Each quarter the ARMC reviews the Company’s capital position. Annually, the Chief Actuary discusses with the Board key sensitivities of the Company’s capital position as assessed in the context of annual DCAT. Operational oversight of capital management is provided by the Finance Committee, consisting of senior finance, risk management and investment executives and chaired by the Chief Financial Officer. The committee oversees capital policies and reviews issues and initiatives that affect the capital position of MFC’s subsidiaries and the Company as a whole.
Common Shareholder Dividend and Target Dividend Payout Ratio
The target common shareholder dividend payout is a range of 25 per cent to 35 per cent of net income. On August 7, 2008, the Company announced an increase in the quarterly shareholders’ dividend from $0.24 to $0.26 per common share.
The dividends per common share paid in cash and the common share dividend payout ratio in the last three years were:
| | | | | | | | |
| For the years ended December 31, | | 2008 | | 2007 | | 2006 | | |
Dividends per common share paid in cash | | $1.00 | | $0.88 | | $0.73 | | |
Common share dividend payout ratio | | 307% | | 31% | | 29% | | |
| | Note: | On June 2, 2006, MFC paid a stock dividend of one common share on each of its issued and outstanding common shares. The effect is the same as a two-for-one split of MFC’s common shares. |
In 2008, the common share dividend payout ratio was 39 per cent for the first half of the year. It rose considerably in the later half of 2008 due to the earnings reduction caused by the unprecedented market turmoil.
Capital and Funding Activities
In analyzing capital at the MFC consolidated level, we primarily consider equity as well as subordinated long-term instruments, in alignment with OSFI’s regulatory capital definitions. While we also raise unsubordinated funding from MFC which may be deployed in our downstream entities as capital, at the MFC consolidated level such senior indebtedness is not considered capital.
In 2008, we issued $2,318 million and repurchased $403 million of common shares. We also raised a net amount of $2,338 million in other funding. Details of these activities are provided below.
On December 11, 2008, we issued $2,275 million of common shares including $1,125 million sold by way of private placement to eight existing institutional investors. The remaining $1,150 million, inclusive of a fully subscribed over-allotment of $150 million, was sold to a syndicate of underwriters in a “bought deal” public offering.
During 2008, 2.6 million common shares were issued pursuant to the exercise of stock options and the settlement of deferred share units for a total consideration of $43 million. MFC purchased and subsequently cancelled 11 million common shares pursuant to normal course issuer bids (“NCIB”) at a total cost of $403 million. The NCIB expired on November 8, 2008, and was not renewed.
In addition to the above capital activities, the following financing transactions took place during the year.
On June 26, 2008, the Company raised $950 million of medium term notes constituting senior indebtedness. The medium term notes were issued in two tranches of $550 million of 5.161% notes and $400 million of 5.505% notes, maturing in 2015 and 2018, respectively.
On November 6, 2008, the Company executed a binding credit agreement with leading Canadian banks to provide a loan of $3 billion. Subsequent to the common equity offering in December 2008, the credit facility was reduced to $2 billion. The five year term loan is repayable at the Company’s option at any time without penalty, and it is priced on a floating rate basis at one month Bankers Acceptance plus 3.80%.
On December 1, 2008, the Company repaid US$500 million of maturing 5.625% senior notes.
In 2007, MFC issued 9.5 million common shares for a total consideration of $251 million pursuant to the acquisition of a subsidiary as well as the exercise of stock options and the settlement of deferred share units. MFC purchased and subsequently cancelled 56.4 million common shares pursuant to NCIB at a total cost of $2,245 million. On February 1, 2007, the Company redeemed US$492.5 million 8.375% Capital Trust Pass-through Securities issued by MIC Financing Trust that qualified as regulatory capital. On December 31, 2007, The Manufacturers Life Insurance Company (“MLI”) redeemed its total outstanding 6.10% non-cumulative Class A, Series 6 preferred shares for $89 million, reducing the amount of the Company’s non-controlling interest in subsidiaries.
As a subsequent event, on March 4, 2009, MFC issued 18 million Non-Cumulative Five Year Rate Reset Class A Preferred Shares, Series 4 at a price of $25 per share, for an aggregate amount of $450 million.
Regulatory Capital Position
The Company monitors and manages consolidated capital for MFC in compliance with the OSFI Guideline A2 – Capital Regime for Regulated Insurance Holding Companies and Non-Operating Life Companies, issued July 5, 2005. Under this regime our consolidated available capital is measured against a required amount of risk capital determined in accordance with the guideline. The capital position of the consolidated MFC holding company remains in excess of our internal targets.
Manulife Financial has established capital targets in excess of regulatory targets for our primary operating subsidiaries. MFC has two principal operating insurance companies: MLI and John Hancock Life Insurance Company (“JHLICO”).
MLI, our principal Canadian operating company, is regulated by OSFI and is subject to MCCSR. MLI’s MCCSR ratio as at December 31, 2008 was 234 per cent (December 31, 2007 – 221 per cent), well in excess of OSFI’s target of 150 per cent. The key driver of the higher ratio in 2008 was the net increase in MLI’s available capital reflecting capital issuances partly offset by dividends paid to MFC and unrealized losses on AFS assets. During the year, the Company took actions to strengthen the regulatory capital position of MLI by internally redeploying excess financial resources, including changes to the terms of $550 million senior note payable to Manulife Finance (Delaware) LLC due December 15, 2016. Under the new terms, the senior note became a subordinated note qualified as MLI’s regulatory capital with the interest rate increased to 90-day Bankers Acceptance plus 0.552%.
The positive impact of MLI’s higher available capital on its capital ratios exceeded the impact of higher required capital. Capital for segregated fund guarantees was the key driver of the required capital increase, with the beneficial impact of changes in regulatory guidelines and other approved modeling refinements related to policyholder behaviour assumptions and interest rates being more than offset by the negative impact of the downturn in equity markets. The revised regulatory guideline for segregated fund guarantees requires higher capital for short-term obligations and reduces capital required to support longer-term payment obligations. Given the Company’s generally long-dated guarantees, the regulatory changes had a beneficial impact on our capital ratios. MLI’s non-consolidated operations and subsidiaries all maintained capital levels in excess of local requirements as at December 31, 2008.In particular Manulife Canada Ltd., an OSFI-regulated Canadian operating insurance company, had an MCCSR ratio of 173 per cent, above the regulatory target of 150 per cent.
JHLICO is domiciled in the State of Massachusetts and reports annually subject to the Risk-Based Capital (“RBC”) requirements of the National Association of Insurance Commissioners (“NAIC”). JHLICO’s RBC ratio changed from 439 per cent as at December 31, 2007 to 405 per cent as at December 31, 2008, as the decline in available capital outpaced lower capital requirements. This ratio is well above the regulatory target of 200 per cent. JHLICO’s operations and subsidiaries all maintained capital levels in excess of local requirements as at December 31, 2008.
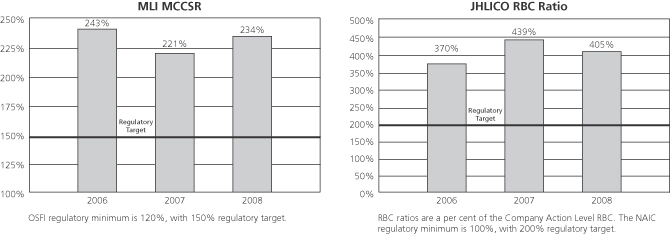
Credit Ratings
The Company’s credit ratings remain among the highest of global financial institutions. Given the global economic turmoil that has adversely impacted financial flexibility of many companies and consistent with the rating agencies’ overall concerns regarding current issues affecting the insurance industry, Manulife Financial, like many of its industry peers, has experienced recent rating downgrades. In the last two months, Standard and Poor’s lowered the AAA financial strength ratings of our operating companies to AA+ with a stable outlook, Moody’s lowered our ratings from Aa1 to Aa3 with a negative outlook, Fitch lowered our ratings from AA+ to AA with a negative outlook and A.M. Best changed its outlook of our A++ ratings from stable to negative. In November 2008, DBRS confirmed our ratings but lowered their outlook from positive to stable.
The following table summarizes our operating company ratings as at March 18, 2009.
Primary Insurance Company Financial Strength/Claims Paying Credit Ratings
| | | | | | | | | | |
| | | S&P | | Moody’s | | DBRS | | Fitch | | A.M. Best |
The Manufacturers Life Insurance Company | | AA+ | | Aa3 | | IC-1 | | AA | | A++ |
John Hancock Life Insurance Company | | AA+ | | Aa3 | | Not Rated | | AA | | A++ |
John Hancock Life Insurance Company (U.S.A.) | | AA+ | | Aa3 | | Not Rated | | AA | | A++ |
Manulife (International) Limited | | AA+ | | Not Rated | | Not Rated | | Not Rated | | Not Rated |
Manulife Life Insurance Company (Japan) | | AA+ | | Not Rated | | Not Rated | | Not Rated | | Not Rated |
Critical Accounting and Actuarial Policies
The preparation of financial statements in accordance with Canadian GAAP requires management to make estimates and assumptions that affect the reported amounts and disclosures made in the consolidated financial statements and accompanying notes. These estimates and assumptions are based on historical experience, management’s assessment of current events and conditions and activities that the Company may undertake in the future as well as possible future economic events. Actual results could differ from these estimates. The estimates and assumptions described in this section depend upon subjective or complex judgments about matters that may be uncertain and changes in these estimates and assumptions could materially impact the consolidated financial statements.
Our significant accounting policies are described in note 1 to the consolidated financial statements. Significant estimation processes relate to the determination of policy liabilities, evaluation of invested asset impairment, assessment of variable interest entities, determination of pension and other post-employment benefit obligations and expenses, income taxes and valuation of goodwill and intangible assets as described below. In addition, in the determination of the fair values of financial instruments, where observable market data is not available, management applies judgment in the selection of valuation models.
Policy Liabilities
Policy liabilities for Canadian GAAP are valued under standards established by the Canadian Institute of Actuaries. These standards are designed to ensure we establish an appropriate liability on the balance sheet to cover future obligations to all our policyholders. Under Canadian GAAP, the assumptions underlying the valuation of policy liabilities are required to be reviewed and updated on an ongoing basis to reflect recent and emerging trends in experience and changes in risk profile of the business. In conjunction with prudent business practices to manage both product and asset related risks, the selection and monitoring of appropriate valuation assumptions are designed to minimize our exposure to measurement uncertainty related to policy liabilities.
Determination of Policy Liabilities
Policy liabilities have two major components: a best estimate amount and a provision for adverse deviation. The best estimate amount represents the estimated value of future policyholder benefits and settlement obligations to be paid over the term remaining on in-force policies, including the costs of servicing the policies. The best estimate amount is reduced by the future expected policy revenues and future expected investment income on assets supporting the policies, adjusted for the impact of any reinsurance ceded associated with the policies. Reinsurance is used to transfer part or all of a policy liability to another insurance company at terms negotiated with that insurance company. To determine the best estimate amount, assumptions must be made for a number of key factors, including future mortality and morbidity rates, investment returns, rates of policy termination, operating expenses, certain taxes and foreign currency.
To recognize the uncertainty involved in determining the best estimate actuarial liability assumptions, a provision for adverse deviation (“PfAD”) is established. The PfAD is determined by including a margin of conservatism for each assumption to allow for possible deterioration in experience and to provide greater comfort that the policy liabilities will be adequate to pay future benefits. The Canadian Institute of Actuaries establishes suggested ranges for the level of margins for adverse deviation based on the risk profile of the business. We use assumptions at the prudent end of the suggested ranges, taking into account the risk profile of our business. The effect of these margins is to increase policy liabilities over the best estimate assumptions. The margins for adverse deviation decrease the income that is recognized when a new policy is sold and increase the income recognized in later periods, with the margins releasing as the policy risks reduce.
Best Estimate Assumptions
We follow established processes to determine the assumptions used in the valuation of our policy liabilities. The nature of each risk factor and the process for setting the assumptions used in the valuation are discussed below.
Mortality: Mortality relates to the occurrence of death. Mortality assumptions are based on our internal as well as industry past and emerging experience and are differentiated by sex, underwriting class, policy type and geographic market. To offset some of this risk, we reinsure mortality risk on in-force policies to other insurers and the impact of the reinsurance is directly reflected in our policy valuation. Actual mortality experience is monitored against these assumptions separately for each business. Overall 2008 experience was favourable when compared with our assumptions.
Morbidity: Morbidity relates to the occurrence of accidents and sickness for the insured risks. Morbidity assumptions are based on our internal as well as industry past and emerging experience and are established for each type of morbidity risk and geographic market. Actual morbidity experience is monitored against these assumptions separately for each business. Overall 2008 experience was unfavourable when compared with our assumptions.
Policy Termination and Premium Persistency: Policy termination includes lapses and surrenders, where lapses represent the termination of policies due to non-payment of premiums and surrenders represent the voluntary termination of policies by policyholders. Premium persistency represents the level of ongoing deposits on contracts where there is policyholder discretion as to the amount and timing of deposits. Policy termination and premium persistency assumptions are primarily based on our recent experience
adjusted for expected future conditions. Assumptions reflect differences by type of contract within each geographic market and actual experience is monitored against these assumptions separately for each business. Overall 2008 experience was unfavourable when compared to our assumptions.
Expenses and Taxes: Operating expense assumptions reflect the projected costs of maintaining and servicing in-force policies, including associated overhead expenses. The expenses are derived from internal cost studies and are projected into the future with an allowance for inflation. For some developing businesses, there is an expectation that unit costs will decline as these businesses mature. Actual expenses are monitored against assumptions separately for each business. Overall maintenance expenses for 2008 were favourable when compared with our assumptions. Taxes reflect assumptions for future premium taxes and other non-income related taxes. For income taxes, policy liabilities are adjusted only for temporary tax timing and permanent tax rate differences on the cash flows available to satisfy policy obligations.
Investment Returns: We segment assets to support liabilities by business segment and geographic market and establish investment strategies appropriate to each liability segment. The projected cash flows from these assets are combined with projected cash flows from future asset purchases/sales to determine expected rates of return for all future years. The investment strategies for future asset purchases and sales are based on our target investment policies for each segment and the re-investment returns are derived from current and projected market rates for fixed interest investments and our projected outlook for non-fixed interest assets. In 2008, non-fixed income returns were unfavourable when compared to our assumptions, primarily as a result of poor public equity markets. Investment return assumptions include expected future credit losses on fixed income investments. Credit losses are projected based on our own and industry experience, as well as specific reviews of the current investment portfolio. In 2008, credit loss experience was unfavourable when compared to our assumptions. Investment return assumptions for each asset class also incorporate expected investment management expenses that are derived from internal cost studies.
Foreign Currency: Foreign currency risk results from a mismatch of the currency of the policy liabilities and the currency of the assets designated to support these obligations. Because we have a policy of matching the currency of our assets with the currency of the liabilities they support, there is little exposure related to unfavourable movements in foreign exchange rates in the valuation. Where a currency mismatch exists, the assumed rate of return on the assets supporting the liabilities is reduced to reflect the potential for adverse movements in exchange rates.
Experience Adjusted Products: Where policies have features that allow the impact of changes in experience to be passed on to policyholders through policy dividends, experience rating refunds, credited rates or other adjustable features, the projected policyholder benefits are adjusted to reflect the projected experience. Minimum contractual guarantees and other market considerations are taken into account in determining the policy adjustments.
Provision for Adverse Deviation
The provision for adverse deviation is the sum of the total margins for adverse deviation for each risk factor. Margins for adverse deviation are established by product type and geographic market for each assumption or factor used in the determination of the best estimate actuarial liability. The margins are established based on the risk characteristics of the business being valued.
In addition to the explicit margin for adverse deviation, the valuation basis for segregated fund liabilities explicitly limits the future revenue recognition in the valuation basis to the amount necessary to offset acquisition expenses, after allowing for the cost of any guarantee features. This limitation is reported as an additional margin and is shown in segregated fund non-capitalized margins.
The provision for adverse deviation and the future revenue deferred in the valuation due to the limitations on recognition of future revenue in the valuation of segregated fund liabilities are shown in the table below.
As at December 31,
| | | | | | | | |
| (Canadian $ in millions) | | 2008 | | 2007 | | |
Best estimate actuarial liability | | $ | 102,446 | | $ | 96,030 | | |
Provision for Adverse Deviation | | | | | | | | |
Insurance risks (mortality/morbidity) | | $ | 8,168 | | $ | 6,167 | | |
Policyholder behavior (lapse/surrender/premium persistency) | | | 3,249 | | | 2,544 | | |
Expenses | | | 1,165 | | | 918 | | |
Investment risks (non-credit) | | | 16,588 | | | 9,932 | | |
Investment risks (credit) | | | 1,398 | | | 1,161 | | |
Segregated fund guarantees | | | 4,747 | | | 457 | | |
Other | | | 362 | | | 443 | | |
Total Provision for Adverse Deviation (PfAD) | | $ | 35,677 | | $ | 21,622 | | |
Segregated funds – additional margins | | | 9,144 | | | 11,548 | | |
Total of PfAD and additional segregated fund margins | | $ | 44,821 | | $ | 33,170 | | |
Reported actuarial liabilities as at December 31, 2008 of $138,123 million (2007 – $117,652 million) are composed of $102,446 million (2007 – $96,030 million) of best estimate actuarial liability and $35,677 million (2007 – $21,622 million) of PfAD.
Significant increases in PfADs were as a result of currency movements, movements in market spreads on fixed income assets, revisions to investment strategies supporting policy liabilities that increase the use of non fixed income assets, and an increase in the margins for segregated fund guarantees due to the impact of the adverse 2008 equity markets on the potential future cost of these guarantees.
Currency movements increased the PfADs $5,887 million primarily due to the weakening of the Canadian dollar versus the U.S. dollar and Japanese yen. The increase in market spreads on fixed income assets increases the expected re-investment rates in the valuation but generates higher margins for spread compression in the valuation. The increase in margins as a result of the investment strategy changes was as a result of the greater projected use of non fixed income assets in the investment portfolios supporting policy liabilities, and is largely offset by a corresponding reduction in expected reserves due to higher expected returns. Both of these items are reflected in Investment Risks (non-credit). Virtually all the positive segregated fund guarantee reserves, including the new reserves established in 2008 as equity markets corrected, represent required margins, as the actual present value of the expected costs before margins for adverse deviations remains minimal.
The decrease in additional margins on segregated funds is the result of lower segregated fund balances due to the poor 2008 equity markets and consequent reduced future projected net revenues.
Sensitivity of Policy Liabilities to Changes in Assumptions
When our assumptions are updated to reflect recent and emerging experience or change in outlook, the result is a change in the value of policy liabilities which in turn affects income. The sensitivity of after tax income to changes in assumptions underlying policy liabilities is shown below, assuming that there is a simultaneous change in the assumption across all business units. For changes in asset related assumptions, the sensitivity is shown net of the corresponding impact on income of the change in the value of the assets supporting liabilities. In practice, experience for each assumption will frequently vary by geographic market and business and assumption updates are made on a business/geographic specific basis.
Sensitivity of Policy Liabilities to Changes in Assumptions
| | | | | | | | | | | | |
| As at December 31, | | | | | | | | | | | | |
| (Canadian $ in millions) | | Increase (Decrease) in After Tax Income | | | | | |
| | | 2008 | | | | | 2007 | | | | | |
Policy Related Assumptions | | | | | | | | | | | | |
2% adverse change in future mortality rates | | | | | | | | | | | | |
Products where an increase in rates increases policy liabilities | | $ (293 | ) | | | | $ (198 | ) | | | | |
Products where a decrease in rates increases policy liabilities | | (213 | ) | | | | (132 | ) | | | | |
5% increase in future morbidity rates | | (952 | ) | | | | (696 | ) | | | | |
10% adverse change in future termination rates | | (925 | ) | | | | (586 | ) | | | | |
5% increase in future expense levels | | (310 | ) | | | | (246 | ) | | | | |
Asset Related Assumptions | | | | | | | | | | | | |
100 basis point parallel decrease in market interest rates | | $(1,336 | ) | | | | $ (452 | ) | | | | |
100 basis point parallel increase in market interest rates | | 1,138 | | | | | 369 | | | | | |
10% reduction in non fixed income market values | | (2,079 | ) | | | | (572 | ) | | | | |
100 basis point reduction in future annual returns for non fixed income assets | | (3,447 | ) | | | | (1,481 | ) | | | | |
| n | | An increase in mortality rates will generally increase policy liabilities for life insurance contracts whereas a decrease in mortality rates will generally increase policy liabilities for policies with longevity risk such as payout annuities. |
| n | | No amounts related to morbidity risk are included for policies where the policy liability provides only for claims costs expected over a short period, generally less than one year, such as Group Life and Health. |
| n | | Changes in market interest rates reflect a change to the initial market interest rates, but assume that ultimate long-term fixed income re-investment rates (“URRs”) for new investments are unchanged. If the long-term URRs were to be changed by a similar amount to the initial market interest rates, so that the valuation reflected a permanent shift in market interest rates available for all future re-investments, the after tax income decreases by $2,668 million for a 100 basis point decrease in interest rates, and increases by $2,146 million for a 100 basis point increase in interest rates. |
| n | | The sensitivities for level of future market interest rates are calculated based on adjusting the interest rates in the current valuation interest scenario used to determine policy liabilities, and do not reflect potential additional costs from full prescribed scenario testing. |
| n | | Non fixed income assets include both common and private equities, all forms of real estate, and any other non fixed income instruments supporting policy liabilities. The $(2,079) million after tax income impact for a 10% reduction in non fixed income market values consists of $(1,660) million related to common and private equities, and $(419) million related to real estate and other non fixed income assets. The $(3,447) million after tax income impact for a 100 basis point reduction in future annual returns consists of $(2,232) million related to common and private equities and $(1,215) million related to real estate and other non fixed income assets. |
| n | | A large portion of the change in the level of the sensitivities from 2007 to 2008 is caused by changes in foreign exchange rates, particularly the appreciation of the U.S. dollar versus the Canadian dollar. |
| n | | The increase in the sensitivity to changes in market rates reflects a change in the current valuation interest scenario used to determine policy liabilities under which interest rates grade more slowly to the ultimate rates. |
| n | | The increase in sensitivity to changes in market interest rates reflects a change in the valuation interest scenario used to determine policy liabilities. The new scenario adopted in 2008 is based on a grading from current market interest rates to assumed ultimate re-investment rates over 20 years. Under Canadian GAAP, we must test a number of prescribed interest scenarios. The interest scenario we have adopted uses the structure of the prescribed scenario that currently produces the highest policy liability, with additional prudence introduced through use of lower ultimate re-investment rates than the maximum levels permitted. |
| n | | The increase in sensitivity to non fixed income market values reflects the increased sensitivity of segregated fund guarantee policy liabilities to changes in equity market levels. As a result of the severe 2008 global equity market corrections both the liability for existing guarantees and the sensitivity of this liability to changes in equity market levels have increased materially. |
Review of Actuarial Methods and Assumptions
The 2008 review of the actuarial methods and assumptions underlying policy liabilities produced a net reduction in the policy liabilities of $482 million. Net of the impacts on participating surplus and minority interests, this resulted in an increase in 2008 shareholders’ income of pre-tax $454 million.
Impact of 2008 Review by Category of Change
(Canadian $ in millions)
| | | | |
| Assumption | | Reserve Impact Increase (Decrease) | |
| Mortality / morbidity | | $ | (647 | ) |
| Lapses and other policyholder behaviour | | | 699 | |
| Expense | | | (570 | ) |
| Investment returns | | | 164 | |
| Other valuation model refinements and assumption updates | | | (128 | ) |
| Net release of policy liabilities | | $ | (482 | ) |
Note: For all segregated fund insurance and wealth management policies, as well as certain general account wealth management policies in North America, the policy liabilities are updated quarterly to reflect the impact of market interest rates and non-fixed income market values. The impact of the update is reflected directly in each reporting segment’s earnings.
Impact of 2008 Review by Category of Change
(Canadian $ in millions)
| | | | | | |
| Assumption | | | | | |
| Mortality / morbidity | | $ | (647 | ) | | Reduction is driven mainly by mortality releases for U.S. Insurance, with lesser increases in Reinsurance and Canadian Insurance and Long Term Care incidence and termination rates. Offsetting these decreases were increases in assumptions for Hong Kong hospital claims assumptions, reduced mortality assumptions for Long Term Care (which leads to higher reserves) and minor strengthening in other lines. |
| Lapses and other policyholder behaviour | | | 699 | | | Increases driven by updates to lapse assumptions and premium persistency assumptions for most insurance lines, as well as updates for rates of annuitization for certain U.S. annuity products. |
| Expense | | | (570 | ) | | Release in reserves is driven by decreases in expenses for U.S. Insurance, as well as refinements to the allocation of certain overhead expenses between maintenance and acquisition. A review of premium taxes in U.S. Life insurance also led to a reserve reduction. |
| Investment returns | | | 164 | | | Increases in reserves are attributed to updates to expected returns for real estate and other non fixed income assets. These increases were offset by the net impact of reflecting in the future investment returns the projected impact of the recently adopted long tail investment strategy and the related impact on the interest rate risk scenario used to determine the Company’s interest rate risk reserves. |
| Other valuation model refinements and assumption updates | | | (128 | ) | | There was a net release in reserves from the release of excess margins in interest rate risk reserves. This was offset by establishment of segregated fund guarantee reserves incremental to normal policy reserve accruals and a net increase in reserves due to refinements of existing reserve modeling for insurance and Long Term Care businesses. |
Total | | $ | (482 | ) | | |
Note: For all non-participating policies, excluding certain minor Asian lines of business, the policy liabilities are updated quarterly to reflect the impact of market interest rates and non-fixed income market values. The impact of the update is reflected directly in each reporting segment’s earnings.
The change in policy liabilities in respect of the review of assumptions was $(506) million for the fourth quarter of 2008, and $24 million in aggregate for the first three quarters of 2008.
Change in Policy Liabilities
The change in policy liabilities can be attributed to several sources: new business, acquisitions, in-force movement and currency impact. Changes in policy liabilities are substantially offset in the financial statements by premiums, investment income, policy benefits and other policy related cash flows. The changes in policy liabilities by business segment are shown below:
2008 Policy Liability Movement Analysis
| | | | | | | | | | | | | | | | | | | | | | | | | | | |
| (Canadian $ in millions) | | U.S.
Insurance | | U.S. Wealth
Management | | | Canadian
Division | | | Asia and
Japan
Division | | | Reinsurance
Division | | | Corporate
and
Other | | | Total | |
| Balance, January 1, 2008 | | $ | 41,096 | | $ | 30,648 | | | $ | 36,649 | | | $ | 13,913 | | | $ | 1,621 | | | $ | 495 | | | $ | 124,422 | |
| New business | | | 846 | | | 4,447 | | | | 289 | | | | (99 | ) | | | (26 | ) | | | – | | | | 5,457 | |
| In-force movement | | | 1,920 | | | (5,347 | ) | | | (1,773 | ) | | | 790 | | | | (10 | ) | | | (455 | ) | | | (4,875 | ) |
| Currency impact | | | 9,773 | | | 6,907 | | | | 6 | | | | 4,088 | | | | 269 | | | | 12 | | | | 21,055 | |
Total net changes | | $ | 12,539 | | $ | 6,007 | | | $ | (1,478 | ) | | $ | 4,779 | | | $ | 233 | | | $ | (443 | ) | | $ | 21,637 | |
Balance, December 31, 2008 | | $ | 53,635 | | $ | 36,655 | | | $ | 35,171 | | | $ | 18,692 | | | $ | 1,854 | | | $ | 52 | | | $ | 146,059 | |
For new business, the segments with large positive general account premium revenue at contract inception show increases in policy liabilities. For segments where new business deposits are primarily into segregated funds, the increase in policy liabilities related to new business is small since the increase measures only general account liabilities.
The increase in policy liabilities from currency reflects the appreciation of the U.S. dollar and Japanese yen versus the Canadian dollar. As assets are currency matched to liabilities, the increase in policy liabilities due to currency is offset by a corresponding reduction from currency in the value of assets supporting those liabilities.
The large reduction of $5,347 million for in-force movements on the U.S. Wealth Management block includes $2,985 million of net maturity benefits on institutional contracts, a product line that is intentionally being de-emphasized. The decrease in the Corporate and Other segment is related to an Accident and Health block for which the liabilities are held in the Corporate and Other segment.
Included in the total in-force reduction of $4,875 million is a decrease of $482 million from changes in methods and assumptions, as described earlier. This decrease results in an increase in pre-tax earnings.
Of the $582 million net increase in policy liabilities related to new business and in-force movement, $761 million is an increase in actuarial liabilities. The remaining is a decrease of $179 million in other policy liabilities.
2007 Policy Liability Movement Analysis
| | | | | | | | | | | | | | | | | | | | | | | | | | | | |
| (Canadian $ in millions) | | U.S.
Insurance | | | U.S. Wealth
Management | | | Canadian
Division | | | Asia and
Japan
Division | | | Reinsurance
Division | | | Corporate
and
Other | | | Total | |
| Balance, December 31, 2006 | | $ | 44,232 | | | $ | 38,222 | | | $ | 32,554 | | | $ | 13,673 | | | $ | 1,884 | | | $ | 254 | | | $ | 130,819 | |
| Impact of adopting new accounting policies for financial instruments | | | 1,566 | | | | 1,119 | | | | 3,769 | | | | 1,236 | | | | 59 | | | | – | | | | 7,749 | |
| Balance, January 1, 2007 | | $ | 45,798 | | | $ | 39,341 | | | $ | 36,323 | | | $ | 14,909 | | | $ | 1,943 | | | $ | 254 | | | $ | 138,568 | |
| New business | | | 387 | | | | 2,210 | | | | 76 | | | | (126 | ) | | | 11 | | | | – | | | | 2,558 | |
| In-force movement | | | 1,957 | | | | (5,263 | ) | | | 254 | | | | 973 | | | | (118 | ) | | | 243 | | | | (1,954 | ) |
| Currency impact | | | (7,046 | ) | | | (5,640 | ) | | | (4 | ) | | | (1,843 | ) | | | (215 | ) | | | (2 | ) | | | (14,750 | ) |
Total net changes, excluding new accounting policies for financial instruments | | $ | (4,702 | ) | | $ | (8,693 | ) | | $ | 326 | | | $ | (996 | ) | | $ | (322 | ) | | $ | 241 | | | $ | (14,146 | ) |
Balance, December 31, 2007 | | $ | 41,096 | | | $ | 30,648 | | | $ | 36,649 | | | $ | 13,913 | | | $ | 1,621 | | | $ | 495 | | | $ | 124,422 | |
New business and normal in-force movement for Canadian Division were restated.
For new business, the segments with large positive general account premium revenue at contract inception show increases in policy liabilities. For segments where new business deposits are primarily into segregated funds, the increase in policy liabilities related to new business is small since the increase measures only general account liabilities.
The increase in policy liabilities from adopting new accounting policies for financial instruments was offset by an increase in the statement value of the assets supporting policy liabilities.
The reduction in policy liabilities from currency reflects the appreciation of the Canadian dollar. As assets are currency matched to liabilities, the reduction in policy liabilities due to currency is offset by a corresponding reduction from currency in the value of assets supporting those liabilities.
The large reduction of $5,263 million for in-force movements on the U.S. Wealth Management block includes $2,235 million of net maturity benefits on institutional contracts, a product line that is intentionally being de-emphasized.
Included in the total in-force reduction of $1,954 million is an increase of $32 million from changes in methods and assumptions, as described earlier. This decrease results in a decrease in pre-tax earnings.
Of the $604 million net increase in policy liabilities related to new business and in-force movement, $376 million is an increase in actuarial liabilities. The remaining $228 million is an increase in other policy liabilities.
Evaluation of Invested Asset Impairment
AFS equity and fixed income securities are carried at fair market value, with changes in fair value recorded in Other Comprehensive Income (“OCI”). AFS securities are considered impaired when fair value falls below their original cost. Impaired securities are reviewed on a regular basis and any fair value decrement is transferred out of AOCI and recorded in income at such time as the impairment is determined to be other than temporary.
Provisions for impairments of mortgage loans and private placement loans are recorded with losses reported in earnings, when there is no longer reasonable assurance as to the timely collection of the full amount of the principal and interest.
Significant judgment is required in assessing whether an impairment is other than temporary and in assessing fair values and recoverable values. Key matters considered include economic factors, company and industry specific developments and specific issues with respect to single issuers and borrowers. For fixed income securities the Company’s ability and intent to hold a security may also be considered in the impairment assessment.
Changes in circumstances may cause future assessments of asset impairment to be materially different from current assessments, which could require additional provisions for impairment. Additional information on the process and methodology for determining the allowance for credit losses is included in the discussion of credit risk in note 8 to the consolidated financial statements.
Variable Interest Entities (“VIEs”)
When an entity is considered a VIE, the primary beneficiary is required to consolidate the assets, liabilities and results of operations of the VIE. The primary beneficiary is the entity that is exposed, through variable interests, to a majority of the VIE’s expected losses and/or is entitled to a majority of the VIE’s expected residual returns, as defined under GAAP. When the Company is the primary beneficiary of a VIE, it consolidates the VIE either into the general fund or the segregated funds based on which has the preponderance of the exposure to the VIE. As outlined in note 18 to the consolidated financial statements, certain VIEs have been consolidated into the general fund, and certain VIEs have been consolidated on the Segregated Funds Statements of Net Assets. The Company uses a variety of complex estimation processes involving both qualitative and quantitative factors to determine whether an entity is a VIE, and to analyze whether it is the primary beneficiary of any entities that are determined to be VIEs. These processes involve estimating the future cash flows and performance of the VIE, analyzing the variability in those cash flows, and allocating the losses and returns among the identified parties holding variable interests. For further details on the Company’s involvement with VIEs, see note 18 to the consolidated financial statements.
Pensions and Other Post-Employment Benefits
The Company has a number of defined benefit and defined contribution plans providing pension and other benefits to eligible employees and agents after employment. The traditional defined benefit pension plans provide benefits based on years of service and average earnings at retirement. Due to the long-term nature of these plans and of the post-employment benefit plans, the calculation of the benefit expense and accrued benefit obligations depends on various economic assumptions such as discount rates, expected rates of return on plan assets, health care cost trend rates, and compensation increase rates. These assumptions are determined by management and are reviewed annually. Differences between actual and assumed experience will affect the amount of the accrued benefit obligation and benefit expense. The key weighted average assumptions used, as well as the sensitivity of estimated liabilities to these assumptions, are presented in note 17 to the consolidated financial statements.
The funding of defined benefit plans is also subject to various projections and assumptions based on the demographic profile of the membership, expected rates of return on plan assets, and compensation increase rates. A valuation for funding purposes is being completed as at December 31, 2009 and January 1, 2009 for the Company’s largest registered Canadian and U.S. plans respectively. Once completed, these valuations will reflect current asset values and return assumptions as well as any changes to the demographic profile of the member group. For 2009, the minimum funding requirement for the Company’s largest registered Canadian and U.S. plans is expected to be in the range of $50 to $100 million. However, future Company contribution amounts may change upon the Company’s review of its contribution levels during the year and based on the results of the pending valuations.
The Company reviews the appropriateness of the plans’ investment policy on a regular basis and was in compliance with the investment policy throughout the year. The current asset mix and level of investment risk of the Company’s pension plans reflects their long-term nature.
Income Taxes
The Company is subject to income tax laws in various jurisdictions. Tax laws are complex and potentially subject to different interpretations by the taxpayer and the relevant tax authority. The provision for income taxes represents management’s interpretation of the relevant tax laws and its estimate of current and future income tax implications of the transactions and events during the period. A future income tax asset or liability is recognized whenever an amount is recorded for accounting purposes but not for tax purposes or vice versa. Future tax assets and liabilities are recorded based on expected future tax rates and management’s assumptions regarding the expected timing of the reversal of such temporary differences.
The Company is an investor in leveraged leases and previously established provisions in the amount of US$178 million after tax for possible disallowance of the tax treatment and for interest on past due taxes. During the year ended December 31, 2008, the Company increased this provision by US$185 million after tax. The Company continues to believe that deductions originally claimed in relation to these arrangements are appropriate. Although not expected to occur, should the tax attributes of the leveraged leases be fully denied, the maximum after tax exposure including interest would be an additional estimated US$280 million as at December 31, 2008.
Goodwill and Intangible Assets
Goodwill and intangible assets with indefinite lives are tested at least annually for impairment. The test is at the reporting unit level for goodwill and at the Company level for intangible assets with indefinite lives. Any potential impairment of goodwill is identified by comparing the estimated fair value of a reporting unit to its carrying value. Carrying value is determined as the amount of capital allocated to the reporting unit. Any potential impairment of intangible assets with indefinite lives is identified by comparing the estimated fair value of the asset to its carrying value on the balance sheet. An impairment loss would be recognized and the asset written down to the extent that the carrying value of the asset exceeds the fair value. Fair values are determined using internally developed valuation models that consider various factors such as normalized and projected earnings, market multiples and discounted cash flows. The process of determining these fair values requires management to make estimates and assumptions including, but not limited to, projected future sales, earnings and capital investment, discount rates and terminal growth rates. Projected future sales, earnings and capital investment are consistent with plans presented to the Board of Directors. These estimates and assumptions may change in the future due to uncertain competitive and economic market conditions or changes in business strategies. The tests performed in 2008 demonstrated that there was no impairment of goodwill or intangible assets with indefinite lives.
Change in Accounting Policies – Financial instruments – disclosure and presentation
Effective January 1, 2008, the Company adopted CICA Handbook Section 3862 “Financial Instruments – Disclosures” and 3863 “Financial Instruments – Presentation”. Sections 3862 and 3863 replace Handbook Section 3861 “Financial Instruments – Disclosure and Presentation”. Section 3863 carries forward unchanged the presentation requirements of Section 3861 while Section 3862 requires additional disclosures of the nature and extent of risks arising from financial instruments, including the objectives, policies, processes and methods used to measure and manage key risks.
Future Change in Accounting Policy – Goodwill and Intangible Assets
In February 2008, the CICA issued Section 3064 “Goodwill and Intangible Assets”, replacing Section 3062 “Goodwill and Other Intangible Assets” and Section 3450 “Research and Development Costs”. Section 3064 establishes standards for the recognition, measurement, presentation and disclosure of goodwill and intangible assets. Requirements concerning goodwill are unchanged from the previous Section 3062. Section 3064 will be effective on a prospective basis for the Company’s fiscal year beginning January 1, 2009. The new section is not expected to have a material impact on the Company’s consolidated financial statements.
Future Change in Accounting Policy – Transition to International Financial Reporting Standards (“IFRS”)
On February 13, 2008 the Canadian Accounting Standards Board confirmed that all publicly accountable enterprises in Canada will be required to adopt IFRS as a replacement of Canadian GAAP for periods beginning on or after January 1, 2011. The Company will adopt IFRS in its quarterly and annual reports starting with the first quarter of 2011 and will provide corresponding comparative financial information for 2010.
The Company is in the process of evaluating the financial statement impact of the differences between Canadian GAAP and IFRS, and assessing the first time adoption and transitional options, in order to select the most appropriate accounting policies under IFRS. Until this process is complete, the full impact of adopting IFRS on the Company’s future financial position and future results cannot be reasonably determined.
The international financial reporting standard that addresses the measurement of insurance contracts is currently being developed and is not expected to be in place by January 1, 2011. Therefore, upon initial adoption of IFRS the Company will continue to measure insurance liabilities using the Canadian Asset Liability Method (“CALM”). Under CALM, the measurement of actuarial liabilities is based on the carrying value of assets required to support those liabilities. Consistent with the results of the adoption of CICA Handbook Section 3855, when IFRS is adopted any change in the carrying value of the invested assets that support insurance liabilities will be offset by a corresponding change in reserves and therefore is not expected to have a material impact on net income.
Differences between Canadian and U.S. GAAP
The consolidated financial statements of Manulife Financial are presented in accordance with Canadian GAAP. Canadian GAAP differs in certain significant respects from U.S. GAAP.
The primary differences between Canadian GAAP and U.S. GAAP include accounting for premiums and deposits, invested assets, investment income and segregated funds. There are also differences in the calculation and accounting for policy liabilities and differences in reporting policyholder cash flows. These differences are described in more detail in note 22 to the consolidated financial statements.
For U.S. GAAP, asset impairment charges include other than temporary impairments due to interest rate movements where we do not have the intent to hold the asset until recovery. The intent to hold is based on the investment mandate of each of our investment portfolios. For those that we do not intend to hold, assets have been written down to the lower of cost or fair market value.
Differences between Canadian and Hong Kong GAAP
The consolidated financial statements of Manulife Financial are presented in accordance with Canadian GAAP. Canadian GAAP differs in certain respects from Hong Kong generally accepted accounting principles (“Hong Kong GAAP”).
Under Hong Kong GAAP, real estate classified as investment properties are carried at appraised value, with changes being reported as income, as compared to current Canadian GAAP where real estate is carried on a move to market value basis. In certain interest rate environments, actuarial liabilities determined in accordance with Hong Kong GAAP may be higher than actuarial liabilities computed in accordance with current Canadian GAAP.
Canadian GAAP and Hong Kong Regulatory Practices
The Hong Kong Insurance Authority requires that insurance companies have minimum “net assets” for solvency purposes and stipulates minimum criteria for the calculation of actuarial liabilities in arriving at regulatory basis “net assets”. Each year, the Company compares the amount of net assets prepared in accordance with Canadian GAAP, as reported in the Company’s annual return, with the minimum solvency margin required in Hong Kong as described above. As at December 31, 2008, the Company’s net assets determined in accordance with Canadian GAAP exceeded the minimum solvency margin required by Hong Kong insurance regulations.
Controls and Procedures
Disclosure Controls and Procedures
Our disclosure controls and procedures are designed to provide reasonable assurance that information required to be disclosed by us is recorded, processed, summarized and reported accurately and completely and within the time periods specified under Canadian and U.S. securities laws. Our process includes controls and procedures that are designated to ensure that information is accumulated and communicated to management, including the CEO and CFO, to allow timely decisions regarding required disclosure.
As of December 31, 2008, management evaluated the effectiveness of its disclosure controls and procedures as defined under the rules adopted by the U.S. Securities and Exchange Commission and the Canadian securities regulatory authorities. This evaluation was performed under the supervision of the ARMC, the CEO and CFO.
Based on that evaluation, the CEO and CFO concluded that our disclosure controls and procedures were effective as at December 31, 2008.
Management’s Report on Internal Control over Financial Reporting
Management is responsible for establishing and maintaining adequate internal control over financial reporting. The Company’s internal control system was designed to provide reasonable assurance to management and the Board of Directors regarding the preparation and fair presentation of published financial statements in accordance with generally accepted accounting principles. All internal control systems, no matter how well designed, have inherent limitations due to manual controls. Therefore, even those systems determined to be effective can provide only reasonable assurance with respect to financial statement preparation and presentation.
Management maintains a comprehensive system of controls intended to ensure that transactions are executed in accordance with management’s authorization, assets are safeguarded, and financial records are reliable. Management also takes steps to ensure that information and communication flows are effective and to monitor performance, including performance of internal control procedures.
Management assessed the effectiveness of the Company’s internal control over financial reporting as of December 31, 2008 based on the criteria set forth by the Committee of Sponsoring Organizations of the Treadway Commission (COSO) in Internal Control – Integrated Framework. Based on this assessment, management believes that, as of December 31, 2008, the Company’s internal control over financial reporting is effective.
The effectiveness of the Company’s internal control over financial reporting as of December 31, 2008 has been audited by Ernst & Young LLP, the Company’s independent registered public accounting firm that also audited the consolidated financial statements of the Company for the year ended December 31, 2008. Their report expressed an unqualified opinion on the effectiveness of the Company’s internal control over financial reporting as of December 31, 2008.
Changes in Internal Control over Financial Reporting
No changes were made in our internal control over financial reporting during the year ended December 31, 2008, that have materially affected, or are reasonably likely to materially affect, our internal control over financial reporting.
Additional Disclosures
Contractual Obligations
In the normal course of business, the Company enters into contracts that give rise to obligations fixed by agreement as to the timing and dollar amount of payment.
As at December 31, 2008, the Company’s contractual obligations and commitments are as follows:
| | | | | | | | | | | | | | | | | |
Payments due by period (Canadian $ in millions) | | Total | | Less than
1 year | | 1 – 3
years | | 3 – 5
years | | After
5 years | | |
Long-term debt(1) | | $ | 4,785 | | $ | 207 | | $ | 793 | | $ | 2,684 | | $ | 1,101 | | |
Liabilities for capital instruments(1), (2) | | | 7,487 | | | 169 | | | 327 | | | 297 | | | 6,694 | | |
Purchase obligations | | | 646 | | | 325 | | | 218 | | | 80 | | | 23 | | |
Operating leases | | | 726 | | | 151 | | | 172 | | | 116 | | | 287 | | |
General fund policyholder liabilities(3) | | | 464,317 | | | 15,854 | | | 15,549 | | | 13,274 | | | 419,640 | | |
Bank deposits and consumer notes(1) | | | 14,544 | | | 11,654 | | | 1,368 | | | 564 | | | 958 | | |
Repurchase agreements | | | 1,001 | | | 1,001 | | | – | | | – | | | – | | |
Other | | | 692 | | | 231 | | | 285 | | | 82 | | | 94 | | |
Total contractual obligations | | $ | 494,198 | | $ | 29,592 | | $ | 18,712 | | $ | 17,097 | | $ | 428,797 | | |
(1) | The contractual payments include principal, interest and distributions. The contractual payments reflect the amounts payable from January 1, 2009 to and including the final contractual maturity date. In the case of floating rate obligations, the floating rate index is based on the interest rates as at December 31, 2008 and is assumed to remain constant to the final contractual maturity date. The Company may have the contractual right to redeem or repay obligations prior to maturity and if such right is exercised, total contractual obligations paid and the timing of payment could vary materially from the amounts and timing included in the table. |
(2) | Liabilities for preferred shares – Class A, Series 1 are not included in the contractual obligation table. These preferred shares are redeemable by the Company on or after June 19, 2010 by payment of cash or issuance of MFC common shares and are convertible at the option of the holder into MFC common shares on or after December 15, 2015. |
(3) | General fund policyholder liability cash flows include estimates related to the timing and payment of death and disability claims, policy surrenders, policy maturities, annuity payments, minimum guarantees on segregated fund products, policyholder dividends, commissions and premium taxes offset by contractual future premiums on in-force contracts. These estimated cash flows are based on the best estimate assumptions used in the determination of policy liabilities. These amounts are undiscounted and do not reflect recoveries from reinsurance agreements. Due to the use of assumptions, actual cash flows will differ from these estimates (see “Policy Liabilities”). |
In the normal course of business, the Company enters into investment commitments, which are not reflected in the consolidated financial statements. As at December 31, 2008, there were $2,722 million of investment commitments (2007 – $2,535 million), of which $1,659 million matures within one year (2007 – $1,727 million), $985 million within one to three years (2007 – $726 million), $56 million matures within three to five years (2007 – $70 million) and $22 million matures after five years (2007 – $12 million).
Transactions with Related Parties
In its capacities as an investor and as an investment manager, the Company has relationships with various types of entities, some of which are VIEs. Note 18 of the annual consolidated financial statements describes the entities with which the Company has significant relationships.
Legal and Regulatory Proceedings
The Company is regularly involved in litigation, both as a defendant and as a plaintiff. The litigation naming the Company as a defendant ordinarily involves its activities as a provider of insurance protection and wealth management products, as well as an investment adviser, employer and taxpayer. In addition, government and regulatory bodies in Canada, the United States and Asia, including provincial and state regulatory bodies, state attorneys general, the United States Securities and Exchange Commission, the Financial Industry Regulatory Authority and Canadian securities commissions regularly make inquiries and, from time to time, require the production of information or conduct examinations concerning the Company’s compliance with, among other things, insurance laws, securities laws, and laws governing the activities of broker-dealers. The Company intends to continue to cooperate fully with government and regulatory authorities in connection with their respective inquiries. The Company does not believe that the conclusion of any current legal or regulatory matters, either individually or in the aggregate, will have a material adverse effect on its consolidated financial condition or results of operations.
Performance and Non-GAAP Measures
We use a number of non-GAAP financial measures to measure overall performance and to assess each of our businesses. Non-GAAP measures include return on common shareholders’ equity, premiums and deposits, funds under management, constant currency and new business embedded value. Non-GAAP financial measures are not defined terms under GAAP and, therefore, are unlikely to be comparable to similar terms used by other issuers.
Return on equity is a profitability measure that presents the net income available to common shareholders as a percentage of the capital deployed to earn the income. The 2007 implementation of CICA Handbook Section 3855 resulted in certain unrealized gains and losses, which do not have an impact on reported income for the period, being reflected in a new component of shareholders’ equity, AOCI. Accordingly, the Company calculates return on equity using average common shareholders’ equity excluding AOCI on AFS securities and cash flow hedges.
Quarterly Financial Information
The following table provides summary information related to our eight most recently completed quarters:
| | | | | | | | | | | | | | | | | | | | | | | | | | | | | | | | | | |
As at and for the three months ended (Canadian $ in millions, except per share amounts) | | Dec. 31, 2008 | | | Sept. 30,
2008 | | | June 30,
2008 | | | Mar. 31,
2008 | | | Dec. 31,
2007 | | | Sept. 30,
2007 | | | June 30,
2007 | | | Mar. 31,
2007 | | | |
Revenue | | | | | | | | | | | | | | | | | | | | | | | | | | | | | | | | | | |
Premium income | | | | | | | | | | | | | | | | | | | | | | | | | | | | | | | | | | |
Life and health insurance | | $ | 4,460 | | | $ | 4,017 | | | $ | 3,865 | | | $ | 3,679 | | | $ | 3,795 | | | $ | 3,637 | | | $ | 3,692 | | | $ | 3,674 | | | |
Annuities and pensions | | | 2,562 | | | | 1,841 | | | | 1,507 | | | | 1,321 | | | | 1,504 | | | | 1,245 | | | | 1,140 | | | | 1,057 | | | |
Total premium income | | $ | 7,022 | | | $ | 5,858 | | | $ | 5,372 | | | $ | 5,000 | | | $ | 5,299 | | | $ | 4,882 | | | $ | 4,832 | | | $ | 4,731 | | | |
Investment income | | | 1,786 | | | | 1,750 | | | | 2,230 | | | | 2,328 | | | | 2,412 | | | | 2,283 | | | | 2,408 | | | | 2,420 | | | |
Realized and unrealized (losses) gains on assets supporting policy liabilities and consumer notes(1) | | | 1,519 | | | | (3,150 | ) | | | (1,462 | ) | | | (703 | ) | | | 1,163 | | | | 834 | | | | (1,308 | ) | | | 129 | | | |
Other revenue | | | 1,323 | | | | 1,369 | | | | 1,418 | | | | 1,343 | | | | 1,404 | | | | 1,371 | | | | 1,367 | | | | 1,354 | | | |
Total revenue | | $ | 11,650 | | | $ | 5,827 | | | $ | 7,558 | | | $ | 7,968 | | | $ | 10,278 | | | $ | 9,370 | | | $ | 7,299 | | | $ | 8,634 | | | |
Income (loss) before income taxes | | $ | (2,596 | ) | | $ | 677 | | | $ | 1,345 | | | $ | 1,151 | | | $ | 1,358 | | | $ | 1,466 | | | $ | 1,440 | | | $ | 1,342 | | | |
Income taxes | | | 727 | | | | (170 | ) | | | (347 | ) | | | (290 | ) | | | (284 | ) | | | (397 | ) | | | (341 | ) | | | (355 | ) | | |
Net income (loss) | | $ | (1,869 | ) | | $ | 507 | | | $ | 998 | | | $ | 861 | | | $ | 1,074 | | | $ | 1,069 | | | $ | 1,099 | | | $ | 987 | | | |
Net income (loss) available to shareholders | | $ | (1,870 | ) | | $ | 510 | | | $ | 1,008 | | | $ | 869 | | | $ | 1,144 | | | $ | 1,070 | | | $ | 1,102 | | | $ | 986 | | | |
Basic earnings (loss) per common share | | $ | (1.24 | ) | | $ | 0.34 | | | $ | 0.67 | | | $ | 0.57 | | | $ | 0.76 | | | $ | 0.70 | | | $ | 0.72 | | | $ | 0.63 | | | |
Diluted earnings (loss) per common share | | $ | (1.24 | ) | | $ | 0.33 | | | $ | 0.66 | | | $ | 0.57 | | | $ | 0.75 | | | $ | 0.70 | | | $ | 0.71 | | | $ | 0.63 | | | |
Segregated funds deposits | | $ | 8,847 | | | $ | 7,689 | | | $ | 8,472 | | | $ | 9,197 | | | $ | 9,043 | | | $ | 8,888 | | | $ | 8,545 | | | $ | 10,751 | | | |
Total assets–general fund | | $ | 211,025 | | | $ | 181,914 | | | $ | 180,071 | | | $ | 182,153 | | | $ | 176,458 | | | $ | 175,232 | | | $ | 179,307 | | | $ | 191,079 | | | |
Segregated funds net assets | | $ | 165,380 | | | $ | 166,098 | | | $ | 176,395 | | | $ | 175,248 | | | $ | 175,544 | | | $ | 175,094 | | | $ | 177,509 | | | $ | 179,441 | | | |
Weighted average common shares(in millions) | | | 1,519 | | | | 1,492 | | | | 1,497 | | | | 1,498 | | | | 1,502 | | | | 1,511 | | | | 1,532 | | | | 1,546 | | | |
Diluted weighted average common shares(in millions) | | | 1,519 | | | | 1,503 | | | | 1,508 | | | | 1,509 | | | | 1,515 | | | | 1,525 | | | | 1,546 | | | | 1,562 | | | |
Dividends per common share | | $ | 0.26 | | | $ | 0.26 | | | $ | 0.24 | | | $ | 0.24 | | | $ | 0.24 | | | $ | 0.22 | | | $ | 0.22 | | | $ | 0.20 | | | |
CDN$ to $1US – Balance Sheet | | | 1.2246 | | | | 1.0599 | | | | 1.0186 | | | | 1.0279 | | | | 0.9881 | | | | 0.9963 | | | | 1.0634 | | | | 1.1529 | | | |
CDN$ to $1US – Statement of Operations | | | 1.2118 | | | | 1.0411 | | | | 1.0101 | | | | 1.0042 | | | | 0.9810 | | | | 1.0455 | | | | 1.0975 | | | | 1.1716 | | | |
(1) | For fixed income assets supporting policy liabilities and for equities supporting pass through products, the impact of realized and unrealized (losses) gains on the assets is largely offset in the change in actuarial liabilities. |
Selected Annual Financial Information
| | | | | | | | | | | |
As at and for the years ended December 31 (Canadian $ in millions, except per share amounts) | | 2008 | | 2007 | | 2006 | | |
Total assets | | $ | 211,025 | | $ | 176,458 | | $ | 186,316 | | |
Long-term financial liabilities: | | | | | | | | | | | |
Long-term debt | | $ | 3,689 | | $ | 1,820 | | $ | 1,930 | | |
Non-controlling interest in subsidiaries | | | 217 | | | 146 | | | 202 | | |
Liabilities for preferred shares and capital instruments | | | 3,674 | | | 3,010 | | | 3,695 | | |
| | | $ | 7,580 | | $ | 4,976 | | $ | 5,827 | | |
Cash dividend per common share | | $ | 1.00 | | $ | 0.88 | | $ | 0.725 | | |
Cash dividend per Class A Share, Series 1 | | $ | 1.025 | | $ | 1.025 | | $ | 1.025 | | |
Cash dividend per Class A Share, Series 2 | | $ | 1.16252 | | $ | 1.16252 | | $ | 1.16252 | | |
Cash dividend per Class A Share, Series 3 | | $ | 1.125 | | $ | 1.125 | | $ | 1.07813 | | |
Additional Information Available
Additional information relating to Manulife Financial, including MFC’s Annual Information Form, is available on the Company’s web site at www.manulife.com and on SEDAR at www.sedar.com.
Outstanding Shares
As at March 17, 2009, MFC had 1,610,797,396 common shares outstanding.